annual performance plan 2015-2016 (11-03-2015) final.cdr
TRANSCRIPT

2015-2016
ANNUALPERFORMANCEPLAN

ANNUAL
PERFORMANCE
PLAN
2015-2016
1
Department of Public Works: 2015-2016 Annual Performance Plan

It is my pleasure to present the Annual
Performance Plan 2015 – 2016 (APP) for the
Department of Public Works (DPW). This APP is
aligned to the Strategic Plan 2015-2020 and
provides the key performance indicators that will
determine how the targeted work will be
undertaken by the Department within the context
of the allocated resources.
As the National Department is mandated to
provide accommodation to Government and to
regulate and transform the built environment, this
financial year will focus on implementing efficient
measures to meet our mandate, vision and
mission. In addition, the Department will invest in
improving its administrative systems, processes
and capacities so as to provide an efficient and
effective service to the citizens of this country.
In order to fulfil our commitment for this financial
year, Cabinet approved a budget of R6,4 billion
for the Department, including a R3.5 billion as a
transfer payment for the operationalisation of the
Property Management Trading Entity (PMTE)
and R50 million for the Non-State Sector for
Expanded Public Works Programme (EPWP).
In this regard, more than 30% of the Department's
budget, almost R2 billion, has been allocated to
the EPWP due to its national economic and
strategic importance.
Aligned to this approved funding, the APP 2015 –
2016 outlines the Department's commitments to
fulfil its mandated obligations.
The PMTE will assume the delivery of
infrastructure services to user departments which
were previously performed by the Department,
i.e. the planning, acquiring, managing and
disposing of immovable assets under the
custodianship of the Department. With the
operationalisation of the PMTE, the policy
formulation, oversight role of the public sector as
well as the construction and property regulation
and development take on a greater focus in the
Department.
Following numerous consecutive negative audit
outcomes over the past seven years, targeted
interventions have been put in place to
fundamenta l l y improve the f i nanc ia l
management of the Department. These
interventions have resulted in the achievement of
an unqualified audit outcome for the 2013/14
financial year. The Department is on track to
sustain and improve its performance by building
on the sound processes and controls put in place
for financial administration and supply chain
management. The intention over the medium-
term is to develop these functions into recognised
centres of excellence within the Public Works
sector. Given the unacceptable high levels of
irregular expenditure that has been detected in
the recent past, this will be a focus area of
corrective action that will involve all stakeholders
participating in the review of business processes.
The Department will inter alia also target the
investigation of all existing irregular transactions
and institute appropriate action based on the
recommendations in each particular case.
During this financial year, the EPWP will continue
to be the Department's flagship programme
which is targeted to create 1,127,186 work
opportunities by public bodies through the use of
labour intensive methodologies. Of these, a total
of 450 462 work opportunities will be Full Time
Equivalent (FTE) jobs. In partnership with the
Construction and Education and Training
Authority (CETA) and National Skills Fund (NSF),
the EPWP has ensured that the training
interventions offered are recognised by the South
African Qualifications Authority (SAQA) and
2
Director General’s Foreword
Department of Public Works: 2015-2016 Annual Performance Plan

cover both soft and technical skills; 700 000 of
these will be work opportunities which will be
created in rural municipalities. In addition,
eligible Provinces, 275 Municipalities and Non-
Governmental Organisations will be incentivised
to increase job creation efforts in EPWP. This will
be achieved by shifting towards more labour
intensive methodology of construction.
In order to reduce the fraud and corruption risk
levels, the Department will vigorously implement
its Fraud Prevention Strategy and the Anti-Fraud
and Corruption Policy, and, in so doing, we
commit ourselves to initiate investigations within
30 days of receipt of allegations to maximise
recourse for the Department.
During this financial year, the Department will
develop and gazette the DPW White Paper for
public comments. The Department will, in
addition, finalise the Independent Development
Trust (IDT) Business Case to establish it as an
institution of Government; and develop a Draft
Bill to amend the State Land Disposal Act, 1961.
Of critical importance is the finalisation of the
Human Resources Plan to incorporate the staff
complement of the PMTE. This Plan will be
submitted to Department of Public Service and
Administration (DPSA) to facilitate the immediate
operationalisation of the PMTE.
With the plan now firmly in place, the Department
is gearing itself to meet its commitments. Some
work has already commenced and very good
progress has been made. I am confident that
2015 – 2016 heralds the beginning of the upward
trajectory towards the realisation of an efficiently
managed Department which will meet its
required obligations and responsibilities.
3
Department of Public Works: 2015-2016 Annual Performance Plan
M DlabantuDirector-General DEPARTMENT OF PUBLIC WORKS

4
Department of Public Works: 2015-2016 Annual Performance Plan
Official sign-off
It is hereby certified that:
This Annual Performance Plan was developed by the management of the Department of Public Works under the guidance of Minister TW Nxesi prepared in line with the 2015-2020 Strategic Plan of the Department and accurately reflects the performance targets which the Department will endeavour to achieve given the resources made available in the budget for 2015/16.
Mr. I Fazel Signature: DDG: Governance, Risk and ComplianceDepartment of Public Works
Mr. C Mokgoro Signature: Chief Financial OfficerDepartment of Public Works
Mr. M Dlabantu Signature:Director-GeneralDepartment of Public Works
Mr. J P Cronin, MP Signature:Deputy Minister of Public Works
Approved by:
Mr. T W Nxesi, MP Signature:Minister of Public Works

5
Department of Public Works: 2015-2016 Annual Performance Plan
Official sign off
EXCO MEMBERS
C Mtshisa
Deputy Director-General: Corporate Services
S Henderson
Deputy Director -General: Expanded Public Works
Programme
M Fatyela-Lindie (Ms)
Act Deputy Director-General: Policy
M Sazona
National Coordinator: Prestige

6
Department of Public Works: 2015-2016 Annual Performance Plan
Contents
Director-General’s Foreword ...................................................................................2
-off ............................................................................................................4
Glossary .....................................................................................................................7
List of tables ............................................................................................................. 9
Part A: Strategic overview ........................................................................................11
1. Overview of the 2015/16 budget and MTEF estimates ......................................12
1.1
Expenditure estimates
.................................................................................12
1.2
Relating expenditure trends to strategic goals
.............................................17
Part B: Programme and sub-programme plans
........................................................19
2. Programme 1: Administration .............................................................................21
2.1
Sub Programme: Management
....................................................................22
2.2
Sub Programme: Finance and Supply Chain Management .........................23
2.3
Sub Programme: Corporate Services
..........................................................26
2.4
Reconciling performance targets with the Budget and MTEF
......................31
3.
Programme 2: Intergovernmental Coordination
.................................................36
3.1
Reconciling performance targets with the Budget and MTEF
......................39
4.
Programme 3: Expanded Public Works Programme
..........................................44
4.1
Reconciling performance targets with the Budget and MTEF
......................48
5.
Programme 4: Property and Construction Industry Policy Regulation
................52
5.1
Reconciling performance targets with the Budget and MTEF
......................57
6.
Programme 5: Prestige Policy............
................................................................62
6.1
Reconciling performance targets with the Budget and MTEF
......................67
Part C -
Long Term Infrastructure Plans
...................................................................
Part D –
Annexure A
to the Annual Performance Plan
.............................................73
7. Annexure A: Technical indicator descriptions .....................................................74
61

7
Department of Public Works: 2015-2016 Annual Performance Plan
Glossary ACRONYM FULL DESCRIPTION AGSA Auditor General South Africa APP Annual Performance Plan BBBEE Broad-Based Black Economic Empowerment BCP Business Continuity Plan BEE Black Economic Empowerment BEPs Built Environment Professions C-AMP Custodian Asset Management Plan CBE Council for the Built Environment CBOs Community Based Organisations CCC’s
Construction Contact Centres
CETA
Construction Education Training Authority
cidb
Construction Industry Development Board
CIP
Contractor Incubator Programme
CPD
Continuous Professional Development CSIR
Council of Scientific and Industrial Research
DMS
Document Management System DORA
Division of Revenue Act
DPME
Department of Performance Monitoring and Evaluation DPSA
Department of Public Service and Administration
DPW
Department of Public Works DPWNIF
Department of Public Works National Intergovernmental Forum
DTI
Department of Trade and Industry DWA
Department of Water Affairs
ECD
Early Childhood Development
EDMS
Employee Development and Management System
EEC
Economic and Employment Cluster
EHW
Employee Health and Wellness
ENE
Estimates of National Expenditure
EPWP
Expanded Public Works Programme
EXCO
Executive Management Committee
FETs
Further Education and Training
FTE
Full Time Equivalent
FY
Financial Year
GAAP
Generally Accepted Accounting Principles
G&A
Governance and Administration
GC
Government Component
GIAMA
Government Immovable Asset Management Act , 2007 (Act No. 19 of 2007)
GRAP
Generally Recognised Accounting Practice
HCBC
Home Community Based Care
HCI
Human Capital Investment
HO
Head Office
HOD
Head of Department
HQ
Head Quarters
HR Human Resource HRD Human Resource Development IA Implementing Agents ICT Information Communication & Technology IFMS Integrated Financial Management System IGP Integrated Growth Plan IRMF Integrated Risk Management Framework IT Information Technology

8
Department of Public Works: 2015-2016 Annual Performance Plan
ACRONYM FULL DESCRIPTION ITAC Information Technology Acquisition Centre
ITP Information Technology Procurement LOGIS Logistical Information System MoA Memorandum of Agreement M&E Monitoring and Evaluation MIG Municipal Infrastructure Grant MINTOP Minister and Top Management MIS Management Information System MTEF Medium-Term Expenditure Framework MTBPS Medium-Term Budget Policy Statement MTSF
Medium-Term Strategic Framework
MPAT
Management Performance Assessment Tool
NCDP
National Contractor Development Programme
NDP
National Development Plan
NPOs
Non-Profit Organisations
NSF
National Skills Fund NSS
Non State Sector
NT
National Treasury NYS
National Youth Service
OSD
Occupation Specific Dispensation PBB
Performance Based Building
PCC
Property Charter Council PCDF
Provincial Contractor Development Forum
PFMA
Public Management Finance Act, 1999 (Act No. 1 of 1999) as amended
PMDS
Performance Management and Development System PMTE
Property Management Trading Entity
RIA
Regulatory Impact Assessment
RMC
Risk Management Committee
SACAP
South African Council for the Architectural Profession
SACLAP
South African Council for the Landscape Architectural Profession
SACPCMP
South African Council for the Project and Construction Management Profession
SACPVP
South African Council for the Property Valuers Profession
SACQSP
South African Council for the Quantity Surveying Profession
SADC
Southern African Development Community
SAIA
South African Institute of Architects
SAIBPP
South African Institute for Black Property Practitioners
SAPOA
South African Property Owners Association
SCM
Supply Chain Management
SDIP
Service Delivery Improvement Programme
SIP’s
Strategic Integrated Projects
SIU
Special Investigations Unit
SLA
Service Level Agreement
SMS
Senior Management Services
SOE’s
State-Owned Entities
SONA
State of the Nation Address
SP
Strategic Plan
SPM
Strategic Performance Management
ToR
Terms of Reference
U-AMP
User Asset Management Plan
VPN
Virtual Private Network
WBS
Web Based Reporting System
WSP
Workplace Skills Plan

9
Department of Public Works: 2015-2016 Annual Performance Plan
List of tables
Table 1 Expenditure estimates for all Programmes 12
Table 2 Overall programme structure 20
Table 3 Programme 1: Strategic objective annual targets for 2015/16 – 2017/18
21
Table 4 Sub Programme Management: Performance indicators and annualtargets for 2015/16-2017/18
22
Table 5 Sub Programme: Management: Quarterly targets for 2015/16 22
Table 6
Sub-Programme: Finance and Supply Chain Management: Performance indicators and annual targets for 2015/16 –
2017/18
23
Table 7
Sub-Programme: Finance and Supply Chain Management: Quarterly targets for 2015/16
25
Table 8
Sub-Programme: Corporate Services: Performance indicators and annual targets for 2015/16 –
2017/18
26
Table 9
Sub-Programme: Corporate Services: Quarterly targets for 2015/16
29
Table 10
Expenditure estimates for Programme 1: Administration
31
Table 11
Programme 2: Strategic objective annual targets for 2015/16 to 2017/18
36
Table 12
Programme 2: Programme performance indicators and annual targets for 2015/16 to 2017/18
37
Table 13
Programme 2: Quarterly targets for 2015/16
38
Table 14
Expenditure estimates for Programme 2: Intergovernmental Coordination
39
Table 15
Programme 3: Strategic objective annual targets for 2015/16 –
2017/18
44
Table 16
Programme 3: Programme performance indicators and annual targets for 2015/16 –
2017/18
45
Table 17
Programme 3: Quarterly targets for 2015/16
47
Table 18
Expenditure estimates for Programme 3: EPWP
48
Table 19
Programme 4: Strategic objective annual targets for 2015/16 –
2017/18
52
Table 20
Programme 4: Programme performance indicators and annual targets for 2015/16 –
2017/18
53
Table 21
Programme 4: Quarterly targets for 2015/16
55
Table 22
Expenditure estimates for Programme 4: Property and Construction Industry Policy Regulations
57

10
Department of Public Works: 2015-2016 Annual Performance Plan
Table 23 Programme 5: Strategic objective annual targets for 2015/16 – 2017/18
62
Table 24 Programme 5: Programme performance indicators and annual targets for 2015/16 – 2017/18
63
Table 25 Programme 5: Quarterly targets for 2015/16 65
Table 26 Expenditure estimates for Programme 5: Prestige Policy 67

11
Part A: Strategic overview
(Refer to the Strategic Plan)

12
Department of Public Works: 2015-2016 Annual Performance Plan
1.
Overv
iew
of
the 2
015/1
6 b
ud
get
an
d M
TE
F e
sti
mate
s
1.1
E
xp
en
dit
ure
esti
mate
s
Table
1: E
xpen
ditu
re e
stim
ate
s fo
r all
Pro
gra
mm
es
Pro
gra
mm
es
Au
dit
ed
ou
tco
me
A
dju
ste
d
ap
pro
pri
ati
on
M
ed
ium
-term
exp
en
dit
ure
esti
mate
2011/1
2
2012/1
3
2013/1
4
2014/1
5
2015/1
6
2016/1
7
2017
/18
(R’0
00)
(R
’000)
(R
’000)
(R
’000)
(R
’000)
(R
’000)
(R
’000)
Adm
inis
trat
ion
433
081
46
2 38
9
626
683
47
4 25
3
475
996
50
2 18
3
519
825
Inte
rgov
ernm
enta
l Coo
rdin
atio
n
19
668
18 4
97
18 8
80
25 7
50
47 2
23
50 0
91
52 8
27
Exp
ande
d P
ublic
Wor
ks P
rogr
amm
e
1 16
3 01
5
1
704
051
1
931
690
1 95
1 29
5
1
992
234
2 32
4 77
3
2
470
050
Pro
pert
y an
d C
onst
ruct
ion
Indu
stry
Pol
icy
Reg
ulat
ion
5 35
9 02
2
4
939
972
3
323
744
3 54
3
989
3 80
2 96
2
3
960
662
4 22
0 22
7
Pre
stig
e
86
651
79 0
16
12
1 65
7
126
033
92 6
72
97 4
69
10
4 76
7
Tota
l
7 06
1 43
7
7 20
3 92
5
6
022
654
6 12
1 32
0
6 41
1 08
7
6 93
5 17
8
7 36
7 69
6

13
Department of Public Works: 2015-2016 Annual Performance Plan E
co
no
mic
cla
ss
ific
ati
on
A
ud
ite
d o
utc
om
e
Ad
jus
ted
a
pp
rop
ria
tio
n
Me
diu
m-t
erm
ex
pe
nd
itu
re e
sti
ma
te
20
11
/12
2
01
2/1
3
20
13
/14
2
01
4/1
5
20
15
/16
2
01
6/1
7
20
17
/18
(R’0
00
)
(R’0
00
)
(R’0
00
)
(R’0
00
)
(R’0
00
)
(R’0
00
)
(R’0
00
)
Cu
rren
t p
aym
ents
2
304
051
2 35
1 58
7
2
78
7 25
2
3
027
775
88
2 78
1
925
666
96
1 64
2
Com
pens
atio
n of
em
ploy
ees
1 26
9 57
9
1
374
552
1
471
497
1 66
7 79
7
474
995
49
9 63
9
516
136
Sal
arie
s an
d w
ages
1 09
7 90
3
1 18
7 49
8
1
277
037
1 43
9 77
1
409
990
431
366
445
618
Soc
ial c
ontr
ibut
ions
171
676
187
054
194
460
228
026
65 0
05
68 2
73
70 5
18
Goo
ds a
nd s
ervi
ces
1 03
2 90
5
977
014
1
315
755
1 35
9 97
8
407
786
426
027
445
506
Adm
inis
trat
ive
fees
440
643
692
517
1 29
6
1 26
5
1 33
3
Adv
ertis
ing
19 7
45
8 44
7
11 9
03
17 3
71
13 6
72
13 4
37
13
762
Ass
ets
less
than
the
capi
talis
atio
n th
resh
old
8 10
4
2 69
9
4 76
8
11 4
85
4 20
1
4 75
9
4 93
2
Aud
it co
sts:
Ext
erna
l
40 9
64
48 4
14
58 5
94
42 6
40
22 3
01
23 4
85
24 6
59
Bur
sarie
s: E
mpl
oyee
s
30
17
1 57
2
2 60
9
2 09
2
2 20
3
2 31
3
Cat
erin
g: D
epar
tmen
tal a
ctiv
ities
3 12
3
2 65
4
3 53
6
1 90
1
1 73
2
1 85
6
1 96
8
Com
mun
icat
ion
(G&
S)
29 2
36
31 6
28
25 5
93
33 7
38
15 3
75
15 7
86
16 3
46
Com
pute
r se
rvic
es
48 5
31
42 9
86
24 7
64
53 7
75
29 1
82
30 1
86
37 0
12
Con
sulta
nts
and
prof
essi
onal
ser
vice
s:
Bus
ines
s an
d ad
viso
ry s
ervi
ces
38 3
48
52 9
33
171
325
12 7
76
75 2
83
78 6
55
76 9
99
Con
sulta
nts
and
prof
essi
onal
ser
vice
s:
Infr
astr
uctu
re a
nd p
lann
ing
9 93
3
11 0
59
18 2
24
56 0
72
9 05
6
9 94
4
10 9
95
Con
sulta
nts
and
prof
essi
onal
ser
vice
s:
Lega
l cos
ts
6 06
3
13 8
22
18 3
78
8 76
8
9 17
2
9 65
9
10 1
42
Con
trac
tors
102
922
47 2
35
100
737
72 3
57
35 1
22
38 3
00
53 8
59

14
Department of Public Works: 2015-2016 Annual Performance Plan
Eco
no
mic
cla
ssifi
cati
on
A
ud
ited
ou
tco
me
Ad
juste
d
ap
pro
pri
ati
on
Med
ium
-term
exp
en
dit
ure
esti
mate
2011/1
2
2012/1
3 2013/1
4 2014/1
5 2015/1
6 2016/1
7 2017/1
8
(R’0
00)
(R’0
00)
(R’0
00)
(R’0
00)
(R’0
00)
(R’0
00)
(R’0
00)
A
genc
y an
d su
ppor
t / o
utso
urce
d se
rvic
es
76 5
53
13
7 29
8
19
9 19
2
278
603
78 3
62
80 0
14
67 0
01
Ent
erta
inm
ent
1
084
79
6
720
73
7
879
1 15
0
1
267
Fle
et s
ervi
ces
(incl
udin
g go
vern
men
t mot
or
tran
spor
t)
19
969
20 8
43
17
630
16 3
62
1 97
9
2
771
3 49
6
Inve
ntor
y: C
loth
ing
mat
eria
l and
ac
cess
orie
s
-
-
4 23
6
-
-
-
Inve
ntor
y: F
ood
and
food
sup
plie
s
8
-
-
15
-
-
-
Inve
ntor
y: F
uel,
oil a
nd g
as
7 62
0
9 10
5
7 57
1
9 00
4
439
466
489
Inve
ntor
y: L
earn
er a
nd te
ache
r su
ppor
t m
ater
ial
44
-
441
441
8
5
6
Inve
ntor
y: M
ater
ials
and
sup
plie
s
1 32
4
1 11
1
901
1 36
1
508
542
574
Inve
ntor
y: M
edic
al s
uppl
ies
-
5
11
Inve
ntor
y: O
ther
sup
plie
s
12 7
77
14 6
44
94
15 4
63
1 62
8
1 71
2
1 79
6
Con
sum
able
sup
plie
s
-
297
12 0
01
-
219
231
239
Con
sum
able
: Sta
tione
ry, p
rintin
g an
d of
fice
supp
lies
14 0
16
15 5
54
10 9
44
12 1
78
8 07
8
8 87
7
9 29
0
Ope
ratin
g le
ases
213
858
139
790
247
585
237
185
8 85
3
8 59
2
9 05
4
Pro
pert
y pa
ymen
ts
255
025
257
586
254
260
353
056
11 1
05
11 1
67
11 7
26
Tran
spor
t pro
vide
d: D
epar
tmen
tal a
ctiv
ity
-
-
-
119
120
111
117
Trav
el a
nd s
ubsi
sten
ce
86 5
85
86 3
75
95 0
21
86 9
87
48 8
91
51 3
10
54 6
07

15
Department of Public Works: 2015-2016 Annual Performance Plan
Eco
no
mic
cla
ssifi
cati
on
A
ud
ited
ou
tco
me
Ad
juste
d
ap
pro
pri
ati
on
Med
ium
-term
exp
en
dit
ure
esti
mate
2011/1
2
2012/1
3 2013/1
4 2014/1
5 2015/1
6 2016/1
7 2017/1
8
(R’0
00)
(R’0
00)
(R’0
00)
(R’0
00)
(R’0
00)
(R’0
00)
(R’0
00)
Tr
aini
ng a
nd d
evel
opm
ent
13
492
9
652
7
130
13
787
10
065
10
607
11
089
Ope
ratin
g pa
ymen
ts
13
174
10 8
22
9
091
10
829
11
056
11
730
12
549
Ven
ues
and
faci
litie
s
9 93
7
7
763
8 68
4
9
831
6 81
9
6
896
7 56
1
Ren
tal a
nd h
iring
-
2 83
6
-60
9
-
293
311
325
Inte
rest
and
ren
t on
land
1 56
7
21
-
-
-
-
-
Inte
rest
(In
cl. i
nter
est o
n un
itary
pay
men
ts
(PP
P))
1 56
7
21
-
-
-
-
-
Tran
sfer
s an
d s
ub
sid
ies
3 65
6 22
2
4 09
2 35
3
2
596
554
2 56
3 90
5
5 50
0 24
6
5 96
8 00
4
6 35
6 76
9
Pro
vinc
es a
nd m
unic
ipal
ities
2 59
2 96
5
2 96
9 95
5
1
221
445
1 20
1 52
0
1 17
8 86
6
1 42
5 66
8
1 52
5 81
8
Pro
vinc
es
2 22
9 04
9
2 30
8 41
4
610
167
606
919
591
175
761
671
809
385
Pro
vinc
ial R
even
ue F
unds
2 22
9 04
9
2 30
8 41
4
610
167
606
919
591
175
761
671
809
385
Mun
icip
aliti
es
363
916
661
541
611
278
594
601
587
691
663
997
716
433
Mun
icip
al b
ank
acco
unts
363
916
661
541
611
278
594
601
587
691
663
997
716
433
Dep
artm
enta
l age
ncie
s an
d ac
coun
ts
732
486
751
640
802
412
802
506
3 70
3 13
7
3 90
7 10
9
4 16
3 96
3
Dep
artm
enta
l age
ncie
s (n
on-b
usin
ess
entit
ies)
732
486
751
640
802
412
802
506
3 70
3 13
7
3 90
7 10
9
4 16
3 96
3
For
eign
gov
ernm
ents
and
inte
rnat
iona
l or
gani
satio
ns
12 9
56
15 4
36
17 5
55
22 5
48
23 2
73
24 5
06
25 7
31
Pub
lic c
orpo
ratio
ns a
nd p
rivat
e en
terp
rises
150
000
50 8
00
100
000
50 0
00
50 0
00
-
-

16
Department of Public Works: 2015-2016 Annual Performance Plan E
co
no
mic
cla
ssifi
cati
on
A
ud
ited
ou
tco
me
Ad
juste
d
ap
pro
pri
ati
on
Med
ium
-term
exp
en
dit
ure
esti
mate
2011/1
2 2012/1
3 2013/1
4 2014/1
5 2015/1
6 2016/1
7 2017/1
8
(R’0
00)
(R’0
00)
(R’0
00)
(R’0
00)
(R’0
00)
(R’0
00)
(R’0
00)
P
ublic
cor
pora
tions
150
000
50 8
00
100
000
50 0
00
50 0
00
-
-
Oth
er tr
ansf
ers
to p
ublic
co
rpor
atio
ns
150
000
50 8
00
100
000
50 0
00
50 0
00
-
-
Priv
ate
ente
rpris
es
-
-
-
-
-
-
-
Oth
er tr
ansf
ers
to p
rivat
e en
terp
rises
-
-
-
-
-
-
-
Non
-pro
fit in
stitu
tions
163
801
292
627
448
679
477
481
534
816
600
257
630
270
Hou
seho
lds
4 01
4
11 8
95
6 46
3
9 85
0
10 1
54
10 4
64
10 9
87
Soc
ial b
enefi
ts
3 99
3
11 8
75
6 46
3
5 85
0
6 05
4
6 36
4
6 68
2
Oth
er tr
ansf
ers
to h
ouse
hold
s
21
20
-
4 00
0
4 10
0
4 10
0
4 30
5
Pay
men
ts f
or
cap
ital
ass
ets
1 09
9 13
9
756
787
631
060
529
640
28 0
60
41 5
08
49 2
85
Bui
ldin
gs a
nd o
ther
fixe
d st
ruct
ures
1 01
1 40
8
713
003
567
365
416
065
Bui
ldin
gs
1 01
1 40
8
713
003
567
365
416
065
Mac
hine
ry a
nd e
quip
men
t
81 1
62
43 2
83
47 5
11
107
232
28 0
60
41 5
08
49 2
85
Tran
spor
t equ
ipm
ent
-
6 19
7
137
-
1 50
0
-
-
Oth
er m
achi
nery
and
equ
ipm
ent
81 1
62
37 0
86
47 3
74
107
232
26 5
60
41 5
08
49 2
85
Sof
twar
e an
d ot
her
inta
ngib
le a
sset
s
6 56
9
501
16 1
84
6 34
3
-
-
-
Pay
men
ts f
or
fin
anci
al a
sset
s
2 02
5
3 19
8
7 78
8
-
-
-
-
Tota
l
7 06
1 43
7
7 20
3 92
5
6
022
654
6 12
1 32
0
6 41
1 08
7
6 93
5 17
8
7 36
7 69
6

17
Department of Public Works: 2015-2016 Annual Performance Plan
1.2 Relating expenditure trends to strategic goals
The Cabinet approved budget for the Department of Public Works is R6,4 billion, including a R3.5
billion transfer payment for the operationalisation of the Property Management Trading Entity (PMTE)
and R50 million for the Non-State Sector for Expanded Public Works Programme (EPWP). The
Department's budget is aligned to the implementation of priorities within the National Development
Plan (NDP) in relation to job creation, infrastructure development, integrated rural economy and the
fight against corruption.
The overall strategic direction of the Department as informed by strategic perspective of the NDP
focuses on five key priority areas as set out in the Policy Statement of the Minister of Public Works
being: The creation of 6 million work opportunities over a period of five years, the operationalisation of
Property Management Entity (PMTE) and the transformation of the core property business of the
Department, the operationalisation of the Governance, Risk and Compliance Branch to spearhead
the anti-corruption drive and Phase II of the Turnaround, new legislation in the form of a Public Works
Act that aims to create seamless Government that delivers services to the nation through the three (3)
spheres of Government.
A lack of regulatory frameworks for concurrent function poses limitations on the Department's
oversight role over the Provincial counterparts. Through the new Public Works Act, the Department
aims to deliver integrated services where each sphere is directed towards developmental and service
delivery objectives of Government as a whole. The development of a new Public Works Act, will
further ensure the coordinated and integrated implementation of National policies and programmes
at Provincial level.
The lack of regulatory frameworks in Prestige has resulted in multi functions and responsibilities
which requires a proper mandate and scope for the Prestige property management function. The
Department will develop policies, norms and standards for all categories of Prestige clients, including
the signing of service level agreements with strategic institutions. The Department will create
capacity to ensure monitoring and compliance of the policies, norms and standards in the provision of
suitable accommodation for Prestige clients in ensuring an efficient and effective public service.
The spending focus includes the improved coordination of the Expanded Public Works Programme to
achieve the Department's target of 3 877 076 work opportunities (1 544 275 full time equivalents) by
the end of 2017/18. To achieve the target for work opportunities, Cabinet has approved an additional
allocation of R50 million in 2015/16 under transfers and subsidies for the Non-State Sector in the
Expanded Public Works Programme. Over the medium-term, bulk of the expenditure for the
Department will be on transfers and subsidies with more funds being transferred under the Property
and Construction Industry Policy and Research programme for operationalisation of the Property
Management Trading Entity.
Cabinet approved budget reductions of R541.1 million over the medium-term and will be affected as
follows: R252.2 million from transfers to the Property Management Trading Entity; R39.4 million from
the Construction Industry Development Board; R5.9 million from the Council for the Built
Environment; R98.2 million from the Expanded Public Works Programme integrated grant for
Municipalities; R49.8 million from the Social Sector Expanded Public Works Programme incentive
grant for Provinces; R24.3 million from the Expanded Public Works Programme integrated grant for
Provinces; R55.2 million from goods and services; R12.1 million from compensation of employees;
and R3.9 million from payments for capital assets. Approved budget reductions are largely as a result
of continual underspending in the Department capital budget for infrastructure, goods and services
for office accommodation and compensation of employees.

18
Department of Public Works: 2015-2016 Annual Performance Plan
Transfers and subsidies to Construction Industry Development Board and Council for the Built
Environment were also reduced due to significant amount of cash reserves in the Entities.
Over the medium-term, transfers and subsidies increase by R3.8 billion or 35.3 per cent, from R2.6
billion in 2014/15 to R6.4 billion in 2017/18 due to new transfers to the Property Management Trading
Entity under Property and Construction Industry Policy and Research programme. Accordingly,
other economic classification items decrease over the MTEF period, notably compensation of
employees by 32.4 per cent, goods and services by 31.1 per cent, as well as payments for capital
assets by 54.7 per cent. This trend follows the operationalisation of the Property Management
Trading Entity in 2015/16 in which the entity assumes the implementation functions of the Department
of Public Works, and the Department now transfers an additional R11.2 billion of its budget to the
entity over the MTEF.
When considering the new budget structure relative to the old structure, current payments
expenditure for compensation of employees and goods and services is projected to increase at an
average rate of 3.6 per cent over the medium-term in support of the Expanded Public Works
Programme and provision for policy formulation, coordination, regulation as well as for monitoring
and evaluation of the Public Works sector by the Department.

19
Part B: Programme and
sub-programme plans

20
Department of Public Works: 2015-2016 Annual Performance Plan
Table 2: Overall programme structure
Programme Sub-programme
1. Administration Ministry
Management
Finance and Supply Chain Management Corporate Services Office Accommodation
1. Intergovernmental Coordination Monitoring, Evaluations and Reporting Intergovernmental Relations and
Coordination
3. Expanded Public Works Programme
(EPWP)
EPWP Monitoring and Evaluation
EPWP Infrastructure
EPWP Operations
EPWP Partnership Support
Public Employment Coordinating
Commission
4. Property and Construction Industry Policy
Regulation
Construction Policy Development
Programme Property Policy Development Programme
Sector Research and Analysis Property Management Trading Entity
Construction Industry Development Board
Council for the Built Environment
Independent Development Trust
Construction Education Training Authority
Assistance to Organisations for Preservation
of National Memorials
5. Prestige Policy
Prestige Accommodation and State
Functions
Parliamentary Villages Management Board

21
Department of Public Works: 2015-2016 Annual Performance Plan
2. P
rog
ram
me 1
: A
dm
inis
tra
tio
nP
urp
ose o
f th
e p
rog
ram
me:
Pro
vide s
trate
gic
leaders
hip
managem
ent
and s
upport
serv
ices
to th
e D
ep
art
me
nt
Tab
le 3
: P
rogra
mm
e 1
: S
trate
gic
obje
ctiv
e a
nnual t
arg
ets
for
2015/1
6 –
2017/1
8
Str
ate
gic
O
bje
cti
ve
S
tra
teg
ic P
lan
Ta
rge
t (5
ye
ar
targ
et)
Au
dit
ed
/ A
ctu
al
Pe
rfo
rma
nc
e
Es
tim
ate
d
Pe
rfo
rma
nc
e
20
14
/15
Me
diu
m T
erm
Ta
rge
ts
20
11
/12
2
012
/13
2
01
3/1
4
20
15
/16
2
01
6/1
7
20
17
/18
1.
To p
rovi
de
stra
tegic
co
rpora
te
serv
ices to
PM
TE
and D
PW
th
rough the
imple
menta
tion
of co
rpora
te
serv
ice p
lans.
Corp
ora
te
Serv
ices (
Hum
an
Resourc
es,
IC
T,
Secu
rity
, Legal,
Gender,
In
tern
ational
Rela
tions
and
Com
munic
ations)
serv
ice p
lans
develo
ped to
resourc
e D
PW
and P
MT
E.
80%
Support
pro
vided to the
core
busi
ness
of
DP
W thro
ugh
HR
Pla
nnin
g,
HC
I pro
gra
mm
es,
Security
m
anagem
ent,
Le
gal advis
ory
and
Com
munic
ations
80%
Support
pro
vided to the
core
busi
ness
of
DP
W thro
ugh
HR
Pla
nnin
g,
HC
I pro
gra
mm
es,
S
ecu
rity
m
anagem
ent,
Legal advi
sory
and
Com
munic
atio
ns
90%
Support
pro
vided to the
core
busi
ness
of
DP
W thro
ugh
HR
Pla
nnin
g,
H
CI
pro
gra
mm
es,
S
ecu
rity
m
anagem
ent,
Legal a
dvi
sory
and
Com
munic
atio
ns
Corp
ora
te
Serv
ice p
lans
deve
loped
to
re
sourc
e
the c
ore
busi
ness
of D
PW
th
rough H
um
an
Reso
urc
e
pla
nnin
g, S
kills
D
eve
lopm
ent,
Secu
rity
M
anagem
ent,
Legal a
dvi
sory
se
rvic
es
and
Com
munic
atio
ns
Corp
ora
te s
erv
ice
(Hum
an
Reso
urc
es,
IC
T,
Secu
rity
, Legal,
Gender,
In
tern
atio
nal
Rela
tions
and
Com
munic
atio
ns)
pla
ns
deve
loped
to r
eso
urc
e
DP
W
and P
MT
E.
Corp
ora
te s
erv
ice
(Hum
an
Reso
urc
es,
IC
T,
Secu
rity
, Legal,
Gender,
In
tern
atio
nal
Rela
tions
and
Com
munic
atio
ns)
pla
ns
deve
loped
to r
eso
urc
e
DP
W
and P
MT
E.
Corp
ora
te S
erv
ice
(Hum
an
Reso
urc
es,
IC
T,
Secu
rity
, Legal,
Gender,
In
tern
atio
nal
Rela
tions
and
Com
munic
atio
ns)
pla
ns
deve
loped
to r
eso
urc
e
DP
W
and P
MT
E.
2.
To e
nsure
sound
financi
al
resourc
e
managem
ent
thro
ugh
com
plia
nt and
responsi
ve
financi
al
managem
ent
pra
ctic
es
to
main
tain
an
unqualifi
ed a
udit
outc
om
e.
Unqualifi
ed a
udit
outc
om
e
Negative
audit
outc
om
e for
2010/1
1
(Dis
cla
imer
)
Negativ
e a
udit
outc
om
e
for
2011
/12
(Dis
claim
er
)
Impro
ved a
udit
outc
om
e fo
r D
PW
for
2012/1
3
(Qualifi
catio
n)
Impro
ved a
udit
outc
om
e for
DP
W
for
2013/1
4
(Unqualifi
ed
outc
om
e w
ith 4
m
atters
of
em
phasi
s and 1
3
matters
of non
-co
mplia
nce
)
Unqualifi
ed a
udit
outc
om
e w
ith 2
negativ
e
Em
phasi
s of
Matter
(EO
M)
and
11 m
atters
of non
-co
mplia
nce
(2
014/1
5)
Unqualifi
ed a
udit
outc
om
e w
ith 2
negativ
e E
OM
and 9
matters
of
non
-com
plia
nce
(2
015/1
6)
Unqualifi
ed a
udit
outc
om
e w
ith 1
negativ
e E
OM
and 5
matters
of
non
-com
plia
nce
(2
016/1
7)

22
Department of Public Works: 2015-2016 Annual Performance Plan
2.1
Su
b P
rog
ram
me:
Man
ag
em
en
t
Pe
rfo
rma
nc
e
Ind
ica
tor
Au
dit
ed
/ A
ctu
al
Pe
rfo
rma
nc
e
Es
tim
ate
d
Pe
rfo
rma
nc
e
20
14
/15
Me
diu
m-T
erm
Ta
rge
ts
20
11
/12
2
01
2/1
3
20
13
/14
2
01
5/1
6
20
16
/17
2
01
7/1
8
1.
1P
erc
en
tag
e o
f in
ve
stig
atio
ns
initia
ted
with
in 3
0
da
ys
of
ad
mis
sib
le
alle
ga
tio
ns
0 in
vestig
atio
ns
initia
ted
with
in
30
da
ys
0 in
vest
iga
tio
ns
initia
ted
with
in
30
da
ys
0
inve
stig
atio
ns
initi
ate
d w
ithin
3
0 d
ays
35
in
vest
iga
tion
s in
itia
ted
with
in 3
0
da
ys
(as
at
13
/02
/20
15
)
10
0%
in
vest
iga
tio
ns
initia
ted
with
in
30
da
ys
10
0%
in
vest
iga
tio
ns
initia
ted
with
in
30
da
ys
10
0%
in
vest
iga
tio
ns
initia
ted
with
in
30
da
ys
2.
Pe
rce
nta
ge
ch
an
ge
o
f fr
au
d a
nd
co
rru
ptio
n r
isk
leve
ls
-
-
-
Ba
selin
e
pe
rce
nta
ge
of
risk
le
vels
on
fra
ud
an
d
corr
up
tio
n
de
velo
pe
d
50
% r
ed
uct
ion
in
fra
ud
an
d
corr
up
tio
n r
isk
leve
ls
75
% r
ed
uct
ion
in
fra
ud
an
d
corr
up
tio
n r
isk
leve
ls
75
% r
ed
uct
ion
in
fra
ud
an
d
corr
up
tio
n r
isk
leve
ls
Tab
le 4
: P
erf
orm
ance
indic
ato
rs a
nd a
nnual t
arg
ets
for
2015/1
6 -
2017/1
8
Ta
ble
5: S
ub P
rogra
mm
e: M
anagem
ent: Q
uart
erly
targ
ets
for
2015/1
6
Pe
rfo
rma
nc
e I
nd
ica
tor
Re
po
rtin
g
pe
rio
d A
nn
ua
l Ta
rge
t
20
15
/16
Q
ua
rte
rly
Ta
rge
ts
1s
t
2n
d
3rd
4
th
1.
Perc
enta
ge o
f in
vest
igatio
ns
initi
ate
d w
ithin
30 d
ays o
f adm
issib
le a
llegatio
ns
Quart
erly
100%
in
vest
igatio
ns
initi
ate
d w
ithin
30
days
100%
in
vest
igatio
ns
initi
ate
d w
ithin
30
days
100%
in
vest
igatio
ns
initi
ate
d w
ithin
30 d
ays
100%
in
vest
igatio
ns
initi
ate
d w
ithin
30 d
ays
100%
in
vest
igatio
ns
initi
ate
d w
ithin
30 d
ays
2.
Perc
enta
ge c
hange o
f fr
aud
and c
orr
uption r
isk le
vels
Bi-
annually
50
% r
educt
ion in
fr
aud a
nd
corr
uptio
n r
isk
levels
-
25%
reduct
ion
in fra
ud a
nd
corr
uptio
n r
isk
leve
ls
-
50
% r
educt
ion
in f
raud a
nd
corr
uptio
n r
isk
leve
ls
1 F
raud a
nd c
orr
uptio
n in
vest
igatio
ns
are
not co
nfin
ed to a
speci
fic p
eriod a
s th
e n
atu
re o
f each
case
varies.

23
Department of Public Works: 2015-2016 Annual Performance Plan
2.2
Su
b P
rog
ram
me:
Fin
an
ce a
nd
Su
pp
ly C
hain
Man
ag
em
en
t
Tab
le 6
: P
erf
orm
ance
indic
ato
rs a
nd a
nnua
l targ
ets
for
2015/1
6 –
2017/1
8
Perf
orm
an
ce In
dic
ato
r
Au
dit
ed
/ A
ctu
al P
erf
orm
an
ce
E
sti
mate
d
Perf
orm
an
ce
2014/1
5
Med
ium
-Term
Targ
ets
2011/1
2
2012/1
3
2013/1
4
2015/1
6
2016/1
7
2017/1
8
1.
2P
erc
en
tag
e c
ha
ng
e in
th
e
ran
d v
alu
e o
f irre
gu
lar
exp
en
ditu
re b
ase
line
R1
82
mill
ion
R
1,0
45
b
illio
n
(cu
mu
lative
si
nce
20
09
)
R5
83
mill
ion
(cu
mu
lative
si
nce
20
09
)
R4
00
m
illio
n
(cu
mu
lative
si
nce
20
09
)
30
% r
ed
uctio
n
of
the
irr
eg
ula
r e
xp
en
ditu
re
ba
se
line
50
%
red
uctio
n
of
the
irr
eg
ula
r e
xp
en
ditu
re
ba
se
line
80
%
red
uctio
n
of
the
irre
gu
lar
exp
en
ditu
re
ba
se
line
2.
Pe
rce
nta
ge
of
com
plia
nt
invo
ice
s se
ttle
d w
ithin
30
d
ays
of
rece
ipt
of
invo
ice
8
0%
(2
73
35
7)
com
plia
nt
invo
ice
s se
ttle
d w
ithin
1
4 w
ork
ing
d
ays
(g
oo
ds
&
serv
ice
s)
for
DP
W a
nd
P
MT
E
88
% (
25
0 4
80
) co
mp
lian
t in
voic
es
sett
led
with
in
21
wo
rkin
g
da
ys
for
DP
W
an
d P
MT
E
75
% (
80
38
4)
com
plia
nt
invo
ice
s se
ttle
d w
ith
in
21
wo
rkin
g
da
ys f
or
DP
W
89
% (
60
52
2)
com
plia
nt
invo
ice
s se
ttle
d
with
in 3
0
wo
rkin
g d
ays
fo
r D
PW
10
0%
co
mp
lian
t in
vo
ice
s
se
ttle
d w
ith
in
30
wo
rkin
g
da
ys
10
0%
co
mp
lian
t in
vo
ice
s s
ett
led
w
ith
in 3
0
wo
rkin
g d
ays
10
0%
co
mp
lian
t in
vo
ice
s s
ett
led
w
ith
in 3
0
wo
rkin
g d
ays
3.
3P
erc
en
tag
e o
f b
ids
aw
ard
ed
with
in t
he
le
gis
late
d t
ime
fra
me
s
(exc
lud
ing
bu
ilt
en
viro
nm
en
t)
14
9 b
ids
aw
ard
ed
in
20
11/1
2
for
DP
W a
nd
P
MT
E
84
bid
s
aw
ard
ed
in
2
01
2/1
3 f
or
PM
TE
an
d
DP
W
89
bid
s
aw
ard
ed
in
2
01
3/1
4
for
DP
W a
nd
P
MT
E
119
bid
s
aw
ard
ed
fo
r P
MT
E a
nd
D
PW
(as
at
24
/02
/20
15
)
50
% o
f b
ids
aw
ard
ed
with
in
56
wo
rkin
g
da
ys o
f clo
su
re
of
ten
de
r a
dve
rtis
em
en
t
60
% o
f b
ids
aw
ard
ed
with
in
56
wo
rkin
g
da
ys o
f clo
su
re
of
ten
de
r a
dve
rtis
em
en
t
70
% o
f b
ids
aw
ard
ed
with
in
56
wo
rkin
g
da
ys o
f clo
su
re
of
ten
de
r a
dve
rtis
em
en
t
4.
4P
erc
en
tag
e p
rocu
rem
en
t co
st
of
go
od
s a
nd
se
rvic
es
pu
rch
ase
d (
exc
lud
ing
bu
ilt
en
viro
nm
en
t) R
33
3,5
80
,84
3
pro
cure
me
nt
spe
nd
fo
r D
PW
an
d
PM
TE
R2
13
,62
6,8
00
pro
cure
me
nt
spe
nd
fo
r D
PW
an
d
PM
TE
R4
44
,98
2,2
78
p
rocu
rem
en
t sp
en
d f
or
DP
W a
nd
P
MT
E
R1
,38
3,0
10
,80
1 p
rocu
rem
en
t sp
en
d f
or
DP
W
an
d P
MT
E
1
40
%
pro
cu
rem
en
t co
st
(ma
rke
t p
rice
with
pre
fere
ntia
l p
rem
ium
) o
f g
oo
ds a
nd
se
rvic
es
pu
rch
ase
d
13
0%
p
rocu
rem
en
t co
st
(ma
rke
t p
rice
with
pre
fere
ntia
l p
rem
ium
) o
f g
oo
ds a
nd
se
rvic
es
pu
rch
ase
d
110
%
pro
cu
rem
en
t co
st
(ma
rke
t p
rice
with
pre
fere
ntia
l p
rem
ium
) o
f g
oo
ds a
nd
se
rvic
es
pu
rch
ase
d
2T
his
indic
ato
r is
measu
ring the r
educt
ion o
f th
e p
rior
year’
s irre
gula
r exp
enditu
re b
ase
line.
3 The b
ase
line c
onta
ins
info
rmatio
n that is
curr
ently
ava
ilable
whic
h in
cludes
built
envi
ronm
ent. T
he 5
6 –
day
timefr
am
e w
ill b
e m
easu
red fro
m the 2
015/1
6
financi
al y
ear
goin
g forw
ard
exc
ludin
g b
uilt
envi
ronm
ent.
4
The b
ase
line c
onta
ins
info
rmatio
n that is
curr
ently
ava
ilable
whic
h in
cludes
built
envi
ronm
ent. T
he p
rocu
rem
ent co
st a
s fr
om
2015/1
6 w
ill e
xclu
de b
uilt
envi
ronm
ent.

24
Department of Public Works: 2015-2016 Annual Performance Plan
Perf
orm
an
ce In
dic
ato
r
Au
dit
ed
/ A
ctu
al P
erf
orm
an
ce
E
sti
mate
d
Perf
orm
an
ce
2014/1
5
Med
ium
-Term
Targ
ets
2011/1
2
2012/1
3
2013/1
4
2015/1
6
2016/1
7
2017/1
8
5.
Pe
rce
nta
ge
of
con
tra
cts
with
va
ria
tion
s e
xe
cu
ted
w
ith
in t
he
allo
wa
ble
va
ria
tio
n
thre
sho
ld
as
leg
isla
ted
by
Na
tio
na
l T
rea
sury
(e
xcl
ud
ing
bu
ilt
en
viro
nm
en
t).
No
se
rvic
es
with
va
ria
tio
ns
ou
tsid
e
the
a
llow
ab
le
thre
sho
ld.
No
se
rvic
es
with
va
ria
tion
s o
uts
ide
th
e
allo
wa
ble
th
resh
old
.
No
se
rvic
es
with
va
ria
tion
s o
uts
ide
th
e
allo
wa
ble
th
resh
old
.
No
se
rvic
es
with
va
ria
tion
s o
uts
ide
th
e
allo
wa
ble
th
resh
old
.
10
0%
of
con
tra
cts
with
va
ria
tio
ns
exe
cute
d
with
in a
1
0%
ave
rag
e
varia
tio
n th
resh
old
10
0%
of
con
tra
cts
with
va
ria
tio
ns
exe
cute
d w
ith
in
a 7
.5%
ave
rag
e
varia
tio
n
thre
sho
ld
10
0%
of
con
tra
cts
with
va
ria
tio
ns
exe
cute
d
with
in a
5%
varia
tio
n
thre
sho
ld

25
Department of Public Works: 2015-2016 Annual Performance Plan
Tab
le 7
: F
inance
and S
upply
Chain
Managem
ent:
Quart
erly
targ
ets
for
2015/1
6
Pe
rfo
rma
nc
e I
nd
ica
tor
R
ep
ort
ing
pe
rio
d
An
nu
al
Ta
rge
t
20
15
/16
Q
ua
rte
rly
Ta
rge
ts
1s
t
2n
d
3rd
4
th
1.
Pe
rce
nta
ge
ch
an
ge
in
the
ra
nd
va
lue
of
irre
gu
lar
exp
en
ditu
re
ba
selin
e.
Qu
art
erly
3
0%
re
du
ctio
n o
f th
e ir
reg
ula
r e
xpe
nd
itu
re
ba
se
line
5%
re
du
ctio
n in
b
ase
line
of
irre
gu
lar
exp
en
ditu
re
5%
re
du
ctio
n in
b
ase
line
of
irre
gu
lar
exp
en
ditu
re
10
% r
ed
uct
ion
in
ba
selin
e o
f irre
gu
lar
exp
en
ditu
re
10
% r
ed
uct
ion
in
ba
selin
e o
f irre
gu
lar
exp
en
ditu
re
2.
Pe
rce
nta
ge
of
com
plia
nt
invo
ice
s
sett
led
with
in 3
0 d
ays
o
f re
ceip
t o
f in
voic
e
Qu
art
erly
1
00
%
co
mp
lian
t in
vo
ice
s se
ttle
d
with
in 3
0 w
ork
ing
d
ays
10
0%
co
mp
lian
t in
voic
es
sett
led
w
ithin
30
wo
rkin
g
da
ys
10
0%
co
mp
lian
t in
voic
es
sett
led
w
ithin
30
wo
rkin
g
da
ys
10
0%
co
mp
lian
t in
voic
es
sett
led
w
ithin
30
wo
rkin
g
da
ys
10
0%
co
mp
lian
t in
voic
es
sett
led
w
ithin
30
wo
rkin
g
da
ys
3.
Pe
rce
nta
ge
of
bid
s a
wa
rde
d w
ithin
le
gis
late
d t
ime
fra
me
s
(exc
lud
ing
bu
ilt
en
viro
nm
en
t)
Qu
art
erly
50
% o
f b
ids
aw
ard
ed
with
in 5
6
wo
rkin
g d
ays
of
clo
sure
of
ten
de
r a
dve
rtis
em
en
t
50
% o
f b
ids
aw
ard
ed
with
in 5
6
wo
rkin
g d
ays
of
clo
sure
of
ten
de
r a
dve
rtis
em
en
t
50
% o
f b
ids
aw
ard
ed
with
in 5
6
wo
rkin
g d
ays
of
clo
sure
of
ten
de
r a
dve
rtis
em
en
t
50
% o
f b
ids
aw
ard
ed
with
in 5
6
wo
rkin
g d
ays
of
clo
sure
of
ten
de
r a
dve
rtis
em
en
t
50
% o
f b
ids
aw
ard
ed
with
in 5
6
wo
rkin
g d
ays
of
clo
sure
of
ten
de
r a
dve
rtis
em
en
t
4.
Pe
rce
nta
ge
p
rocu
rem
en
t co
st o
f g
oo
ds a
nd
se
rvic
es
pu
rch
ase
d
(excl
ud
ing
b
uilt
en
viro
nm
en
t)
Qu
art
erly
14
0%
pro
cure
me
nt
co
st
(ma
rke
t p
rice
w
ith
pre
fere
ntia
l p
rem
ium
) o
f g
oo
ds
an
d s
erv
ice
s
pu
rch
ase
d
14
0%
pro
cure
me
nt
cost
(m
ark
et
price
w
ith p
refe
ren
tial
pre
miu
m)
of
go
od
s a
nd
se
rvic
es
pu
rch
ase
d
14
0%
pro
cure
me
nt
cost
(m
ark
et
price
w
ith p
refe
ren
tial
pre
miu
m)
of
go
od
s a
nd
se
rvic
es
pu
rch
ase
d
14
0%
pro
cure
me
nt
cost
(m
ark
et
pri
ce
with
pre
fere
ntia
l p
rem
ium
) o
f g
oo
ds
an
d s
erv
ice
s p
urc
ha
sed
14
0%
pro
cure
me
nt
cost
(m
ark
et
price
w
ith
pre
fere
ntia
l p
rem
ium
) o
f g
oo
ds
an
d s
erv
ice
s p
urc
ha
sed
5.
Pe
rce
nta
ge
of
con
tra
cts
with
va
ria
tion
s
exe
cute
d
with
in t
he
allo
wa
ble
va
ria
tion
th
resh
old
as
leg
isla
ted
by
Na
tion
al
Tre
asu
ry
(exc
lud
ing
b
uilt
en
viro
nm
en
t).
Qu
art
erly
10
0%
of
con
tra
cts
with
va
ria
tion
s
exe
cute
d w
ithin
a
10
% a
vera
ge
va
ria
tion
thre
sho
ld
10
0%
of
con
tra
cts
with
va
ria
tion
s e
xecu
ted
with
in a
10
% a
vera
ge
va
ria
tion
thre
sho
ld
10
0%
of
con
tra
cts
with
va
ria
tion
s e
xecu
ted
with
in a
10
% a
vera
ge
va
ria
tion
thre
sho
ld
10
0%
of
con
tra
cts
with
va
ria
tion
s e
xecu
ted
with
in a
10
% a
vera
ge
va
ria
tion
thre
sho
ld
10
0%
of
con
tra
cts
with
va
ria
tion
s e
xecu
ted
with
in a
10
% a
vera
ge
va
ria
tion
thre
sho
ld

26
Department of Public Works: 2015-2016 Annual Performance Plan
2.3
Su
b P
rog
ram
me:
Co
rpo
rate
Serv
ices
Table
8: P
erf
orm
ance
indic
ato
rs a
nd a
nnua
l targ
ets
for
2015/1
6 –
2017/1
8
Perf
orm
an
ce In
dic
ato
r
Au
dit
ed
/ A
ctu
al P
erf
orm
an
ce
E
sti
mate
d
Perf
orm
an
ce
2014/1
5
Med
ium
-Term
Targ
ets
2011/1
2
2012/1
3
2013/1
4
2015/1
6
2016/1
7
2017/1
8
1.
Imp
lem
en
tatio
n o
f
the
ap
pro
ved
Hu
ma
n
Re
sou
rce
(HR
) P
lan
for
DP
W a
nd
PM
TE
Dra
ft H
R p
lan
n
ot
ap
pro
ved
Co
nsu
ltatio
n
(HR
lin
e
fun
ctio
n
bu
sin
ess
un
its
an
d E
XC
O)
ba
sed
on
th
e
ne
w H
R P
lan
fo
r D
PW
DP
W H
R P
lan
(in
clu
din
g
wo
rkp
lace
sk
ills
pla
n,
art
isa
n
pro
gra
mm
e,
reso
urc
ing
of
core
bu
sin
ess
)
of
DP
W
ap
pro
ved
an
d
sub
mitte
d t
o
DP
SA
by
31
M
arc
h 2
01
4
Re
vise
d D
PW
HR
P
lan
(r
eso
urc
ing
o
f co
re b
usi
ne
ss,
op
era
tio
na
lisin
g
PM
TE
an
d
est
ab
lish
ing
G
ove
rna
nce
B
ran
ch,
Fin
an
ce
an
d S
CM
) su
bm
itte
d t
o
DP
SA
Org
an
isa
tio
na
l S
tru
ctu
re f
or
PM
TE
a
nd
DP
W a
pp
rove
d
Mig
ratio
n o
f sta
ff t
o P
MT
E
str
uctu
re
Tra
inin
g P
lan
im
ple
me
nte
d a
s
pe
r skill
s a
ud
it
for
PM
TE
Tra
inin
g P
lan
im
ple
me
nte
d a
s
pe
r skill
s a
ud
it
for
PM
TE
a
nd
DP
W
2.
Pe
rce
nta
ge
of
fun
de
d
prio
ritis
ed
va
can
cie
s fil
led
as
pe
r a
pp
rove
d
Re
cru
itme
nt
Pla
n
with
in t
he
Hu
ma
n
Re
sou
rce
pla
n
12
86
po
sitio
ns
fille
d
1
64
po
sitio
ns
fille
d
5
65
po
sitio
ns
fille
d
1
62
6 p
osi
tio
ns
fille
d
as
at
23
/02
/20
15
1
00
%
fun
de
d
prio
ritise
d
va
ca
ncie
s fi
lled
with
in 4
mo
nth
s
fro
m t
he
da
te o
f a
dve
rtis
em
en
t
as p
er
ap
pro
ve
d
Re
cru
itm
en
t P
lan
10
0%
fu
nd
ed
p
rio
ritise
d
va
ca
ncie
s fi
lled
with
in 4
mo
nth
s
fro
m t
he
da
te o
f a
dve
rtis
em
en
t
as p
er
ap
pro
ve
d
Re
cru
itm
en
t P
lan
10
0%
fu
nd
ed
p
rio
ritise
d
va
ca
ncie
s fi
lled
with
in 4
mo
nth
s
fro
m t
he
da
te o
f a
dve
rtis
em
en
t
as p
er
ap
pro
ve
d
Re
cru
itm
en
t P
lan

27
Department of Public Works: 2015-2016 Annual Performance Plan
3.
Num
ber
of
benefic
iaries
part
icip
atin
g in
DP
W
ski
lls d
evelo
pm
ent
pro
gra
mm
e
508
benefic
iaries
part
icip
ating in
the D
PW
ski
lls
impro
vem
ent
pro
gra
mm
es
377
beneficia
ries
part
icip
atin
g in
th
e D
PW
ski
lls
impro
vem
ent
pro
gra
mm
es
1027
benefic
iaries
part
icip
atin
g
in the D
PW
sk
ills
impro
vem
ent
pro
gra
mm
es
1114
benefic
iaries
part
icip
atin
g in
th
e D
PW
ski
lls
deve
lopm
ent
pro
gra
mm
es
1067
benefic
iaries
part
icip
atin
g in
th
e D
PW
ski
lls
deve
lopm
ent
pro
gra
mm
es
1067
benefic
iaries
part
icip
atin
g in
th
e D
PW
sk
ills
deve
lopm
ent
pro
gra
mm
es
1067
benefic
iaries
part
icip
atin
g in
th
e D
PW
ski
lls
deve
lopm
ent
pro
gra
mm
es
·
44 Y
oung
Pro
fess
ionals
·
74 Y
oung
Pro
fess
ionals
·
198 Y
oung
Pro
fess
ionals
·
179 Y
oung
Pro
fess
ionals
·
198 Y
oung
Pro
fess
ionals
·
179 Y
oung
Pro
fess
ionals
·
179 Y
oung
Pro
fess
ionals
·
228 Inte
rns
·
77 Inte
rns
·
539 Inte
rns
·
545 Inte
rns
·
463 Inte
rns
·
545 Inte
rns
·
545 Inte
rns
·
41
Learn
ers
hip
s
·
172
Learn
ers
hip
s
·
261
Learn
ers
hip
s
·
137
Learn
ers
hip
s
·
177
Learn
ers
hip
s
·
137
Learn
ers
hip
s
·
137
Learn
ers
hip
s
-
·
54
Managem
ent
Tra
inees
·
29
Managem
ent
Tra
inees
·
53
Managem
ent
train
ees.
·
29
Managem
ent
train
ees.
·
53
Managem
ent
train
ees.
·
53
Managem
ent
train
ees.
·
200 A
rtis
an
train
ees
·
200 A
rtis
an
train
ees
·
200 A
rtis
an
train
ees
·
200 A
rtis
an
train
ees
4.
Reengin
eere
d IC
T
infr
ast
ruct
ure
for
DP
W a
nd P
MT
E -
-
-
DP
W w
ide/P
MT
E
netw
ork
in
frast
ruct
ure
(o
ffice
auto
matio
n, lo
cal
are
a n
etw
ork
)
deve
loped
Multi
-tie
r
hard
ware
in
frast
ruct
ure
upgra
ded
M
ulti
-tie
r
hard
ware
in
frast
ruct
ure
upgra
ded for
rem
ain
ing s
ites.
-
Perf
orm
an
ce In
dic
ato
r
Au
dit
ed
/ A
ctu
al P
erf
orm
an
ce
E
sti
mate
d
Perf
orm
an
ce
2014/1
5
Med
ium
-Term
Targ
ets
2011/1
2
2012/1
3
2013/1
4
2015/1
6
2016/1
7
2017/1
8
--
-

29
Department of Public Works: 2015-2016 Annual Performance Plan
5.
Busi
ness
applic
ations
imple
mente
d w
ithin
D
PW
and P
MT
E
- -
-
C
ust
om
ised
Arc
hib
us’
Ass
et
Regis
ter
and
Lease
m
anagem
ent
module
s
Ele
ctro
nic
P
rocu
rem
ent
Managem
ent
Sys
tem
in
stalle
d
Worx
4u m
obile
applic
atio
n
inst
alle
d
Const
ruct
ion
pro
ject
s m
odule
upgra
ded t
o w
eb
base
d
Imple
menta
tion
on n
ew
ER
P
real e
state
(w
ith
the:
in
tegra
ted
ass
et
managem
ent,
ele
ctro
nic
pro
cure
ment
and b
uild
ing
info
rmatio
n
managem
ent
module
s)
6.
Perc
enta
ge o
f defa
ult
judgm
ents
again
st the
Depart
ment
pre
vente
d.
9
defa
ult
judgem
ents
13
defa
ult
judgem
ents
13
defa
ult
judgem
ents
2
defa
ult
judgem
ent
100%
of defa
ult
judgem
ents
again
st the
Depart
ment
pre
vente
d
100%
of defa
ult
judgem
ents
again
st the
Depart
ment
pre
vente
d
100%
of defa
ult
judgem
ents
again
st the
Depart
ment
pre
vente
d
7.
5P
erc
enta
ge o
f re
port
ed fra
ud a
nd
corr
uption m
isconduct
case
s subje
cte
d to
dis
cip
linary
pro
cess
es
98 m
isconduct
cases fi
nalis
ed
102
mis
conduct
cases fi
nalis
ed
128
mis
conduct
ca
ses
finalis
ed
75 m
isco
nduct
ca
ses
finalis
ed
as
at 12
/02/2
015
100%
of
report
ed fra
ud
and c
orr
uptio
n
mis
conduct
ca
ses
subje
cted to
dis
ciplin
ary
pro
cess
es
100%
of
report
ed fra
ud
and c
orr
uptio
n
mis
conduct
ca
ses
subje
cted
to d
isci
plin
ary
pro
cess
es
100%
of
report
ed fra
ud
and c
orr
uptio
n
mis
conduct
ca
ses
subje
cted
to d
isci
plin
ary
pro
cess
es
Pe
rfo
rma
nc
e I
nd
ica
tor
A
ud
ite
d/ A
ctu
al
Pe
rfo
rma
nc
e
Es
tim
ate
d
Pe
rfo
rma
nc
e
20
14
/15
Me
diu
m-T
erm
Ta
rge
ts
20
11
/12
2
01
2/1
3
20
13
/14
2
01
5/1
6
20
16
/17
2
01
7/1
8
5 D
isci
plin
ary
proce
sses
are
not
confi
ned t
o a
spec
ific
tim
e pe
riod
as
the
natu
re o
f ea
ch c
ase
vari
es.

29
Department of Public Works: 2015-2016 Annual Performance Plan Ta
ble
9: C
orp
ora
te S
erv
ices:
Quart
erly
targ
ets
for
2015/1
6
Pe
rfo
rma
nc
e I
nd
ica
tor
Re
po
rtin
g
pe
rio
d
An
nu
al
Ta
rge
t
20
15
/16
Qu
art
erl
y T
arg
ets
1st
2
nd
3
rd
4
th
1.
Im
ple
me
nta
tion
of
th
e
ap
pro
ved
Hu
ma
n R
eso
urc
e
Pla
n (
HR
) fo
r D
PW
an
d
PM
TE
Qu
art
erly
O
rga
nis
atio
na
l S
tru
ctu
re f
or
PM
TE
&
DP
W a
pp
rove
d
Mig
ratio
n o
f
sta
ff t
o
PM
TE
str
uct
ure
.
Org
an
isa
tion
al
Str
uct
ure
fo
r P
MT
E
an
d
DP
W
ap
pro
ved
Mig
ratio
n o
f st
aff
to t
he
PM
TE
st
ruct
ure
as
pe
r th
e m
igra
tio
n
fra
me
wo
rk
com
ple
ted
Ski
lls A
ud
it fo
r P
MT
E c
om
ple
ted
.
Tra
inin
g p
lan
fo
r P
MT
E d
eve
lop
ed
Ski
lls A
ud
it fo
r D
PW
co
mp
lete
d.
Tra
inin
g p
lan
fo
r D
PW
co
mp
lete
d
2.
P
erc
en
tag
e o
f fu
nd
ed
p
rio
ritise
d v
aca
nci
es
fille
d
as
pe
r a
pp
rove
d
Re
cru
itme
nt
Pla
n w
ith
in t
he
Hu
ma
n R
eso
urc
e p
lan
Qu
art
erly
(cu
mu
lativ
e)
1
00
%
fun
de
d
prio
ritis
ed
va
can
cie
s fil
led
w
ithin
4 m
on
ths
fro
m t
he
da
te o
f
ad
vert
ise
me
nt
as
pe
r a
pp
rove
d
Re
cru
itme
nt
Pla
n
10
0%
fu
nd
ed
an
d
prio
ritis
ed
va
can
cie
s a
dve
rtis
ed
as
pe
r
Re
cru
itme
nt
Pla
n
10
0%
fu
nd
ed
p
rioritise
d
vaca
nci
es
fille
d
with
in 4
mo
nth
s
fro
m t
he
da
te o
f a
dve
rtis
em
en
t
mo
nth
s
as
pe
r R
ecr
uitm
en
t P
lan
10
0%
fu
nd
ed
p
rio
ritis
ed
va
can
cie
s fil
led
w
ith
in 4
mo
nth
s
fro
m th
e d
ate
of
ad
vert
ise
me
nt
mo
nth
s
as
pe
r R
ecr
uitm
en
t P
lan
10
0%
fu
nd
ed
p
rio
ritis
ed
va
can
cie
s fil
led
w
ith
in 4
mo
nth
s
fro
m th
e d
ate
of
ad
vert
ise
me
nt
mo
nth
s
as
pe
r R
ecr
uitm
en
t P
lan
3.
Nu
mb
er
of
be
ne
ficia
rie
s p
art
icip
atin
g in
DP
W s
kills
d
eve
lop
me
nt
pro
gra
mm
e
Q
ua
rte
rly
(cu
mu
lativ
e)
10
67
be
ne
ficia
rie
s p
art
icip
atin
g in
th
e
DP
W s
kills
d
eve
lop
me
nt
pro
gra
mm
e
26
7 b
en
efic
iarie
s p
art
icip
atin
g in
th
e D
PW
ski
lls
de
velo
pm
en
t p
rog
ram
me
53
4 b
en
efic
iarie
s p
art
icip
atin
g in
th
e D
PW
ski
lls
de
velo
pm
en
t p
rog
ram
me
80
1 b
en
efic
iarie
s p
art
icip
atin
g in
th
e D
PW
ski
lls
de
velo
pm
en
t p
rog
ram
me
1 0
67
b
en
efic
iarie
s p
art
icip
atin
g in
th
e D
PW
ski
lls
de
velo
pm
en
t p
rog
ram
me
·
19
8 Y
ou
ng
P
rofe
ssio
na
ls
·
50
Yo
un
g
Pro
fess
ion
als
·
10
0 Y
ou
ng
P
rofe
ssio
na
ls
·
14
9 Y
ou
ng
P
rofe
ssio
na
ls
·
19
8 Y
ou
ng
P
rofe
ssio
na
ls
·
46
3 I
nte
rns
·
116
In
tern
s
·
23
2 I
nte
rns
·
38
4 I
nte
rns
·
46
3 In
tern
s
·
17
7 L
ea
rne
rsh
ips
·
45
L
ea
rne
rsh
ips
·
89
L
ea
rne
rsh
ips
·
13
3
Le
arn
ers
hip
s
·
17
7
Le
arn
ers
hip
s
·
29
Ma
na
ge
me
nt
tra
ine
es.
·
8 M
an
ag
em
en
t tr
ain
ee
s.
·
15
M
an
ag
em
en
t tr
ain
ee
s.
·
22
M
an
ag
em
en
t tr
ain
ee
s.
·
29
M
an
ag
em
en
t tr
ain
ee
s.
·
20
0 A
rtis
an
tr
ain
ee
s
·
50
Art
isa
n
tra
ine
es
·
10
0 A
rtis
an
tr
ain
ee
s
·
15
0 A
rtis
an
tr
ain
ee
s
·
20
0 A
rtis
an
tra
ine
es
4.
Re
en
gin
ee
red
IC
T
infr
ast
ruct
ure
fo
r D
PW
an
d
PM
TE
Qu
art
erly
Mu
lti-t
ier
ha
rdw
are
in
fra
stru
ctu
re
up
gra
de
d.
Ha
rdw
are
d
eliv
ere
d
Inst
alla
tio
n o
f m
ulti-
tier
ha
rdw
are
in
fra
stru
ctu
re a
t 4
si
tes
In
sta
llatio
n o
f m
ulti-
tie
r h
ard
wa
re
infr
ast
ruct
ure
at
4
site
s
In
sta
llatio
n o
f m
ulti-
tie
r h
ard
wa
re
infr
ast
ruct
ure
at
4
site
s

30
Department of Public Works: 2015-2016 Annual Performance Plan
Perf
orm
an
ce In
dic
ato
r R
ep
ort
ing
peri
od
An
nu
al Targ
et
2015/1
6
Qu
art
erl
y T
arg
ets
1st
2
nd
3
rd
4
th
5.
Bu
sin
ess
ap
plic
atio
ns
imp
lem
en
ted
with
in D
PW
an
d P
MT
E
Qu
art
erly
E
lectr
on
ic
Pro
cure
me
nt
Ma
na
ge
me
nt
Sys
tem
in
sta
lled
Use
r R
eq
uire
me
nts
S
pe
cific
atio
ns
do
cum
en
ted
Acq
uis
itio
n
pro
cess
in
itia
ted
P
rocu
rem
en
t p
roce
ss
fin
alis
ed
E
lect
ron
ic
pro
cure
me
nt
ma
na
ge
me
nt
syst
em
cu
sto
mis
ed
a
nd
inst
alle
d
Wo
rx4
u m
ob
ile
ap
plic
atio
n in
sta
lled
M
ob
ile a
pp
lica
tion
de
velo
pe
d
M
obile
ap
plic
atio
n
inst
alle
d a
t H
ea
d
Offi
ce
M
ob
ile a
pp
lica
tio
n
inst
alle
d a
t 11
R
eg
ion
al O
ffice
s a
nd
7 u
ser
de
pa
rtm
en
ts
Mo
bile
ap
plic
atio
n
inst
alle
d a
t 1
0
use
r d
ep
art
me
nts
6.
Pe
rce
nta
ge
of
De
fau
lt
Jud
gm
en
ts a
ga
inst
the
D
ep
art
me
nt
pre
ven
ted
Q
ua
rte
rly
10
0%
of
de
fau
lt ju
dg
em
en
ts a
ga
inst
th
e D
ep
art
me
nt
pre
ve
nte
d
10
0%
of
de
fau
lt ju
dg
em
en
ts
ag
ain
st t
he
D
ep
art
me
nt
pre
ven
ted
10
0%
of
de
fau
lt
jud
ge
me
nts
a
ga
inst
th
e
De
pa
rtm
en
t
pre
ven
ted
10
0%
of
de
fau
lt
jud
ge
me
nts
a
ga
inst
th
e
De
pa
rtm
en
t
pre
ven
ted
10
0%
of
de
fau
lt
jud
ge
me
nts
a
ga
inst
th
e
De
pa
rtm
en
t
pre
ven
ted
7.
Pe
rce
nta
ge
of
rep
ort
ed
fr
au
d a
nd
co
rru
ptio
n
mis
con
du
ct
case
s su
bje
cte
d t
o d
isci
plin
ary
p
roce
sse
s
Qu
art
erly
10
0%
of
rep
ort
ed
fr
au
d a
nd
co
rru
ptio
n
mis
con
du
ct c
ase
s su
bje
cte
d t
o
dis
cip
lina
ry
pro
ce
sse
s
10
0%
of
rep
ort
ed
fr
au
d a
nd
co
rru
ptio
n
mis
con
du
ct c
ase
s su
bje
cte
d t
o
dis
cip
lina
ry
pro
cess
es
10
0%
of
rep
ort
ed
fr
aud
an
d
corr
up
tion
m
isco
nd
uct
ca
ses
sub
ject
ed
to
d
iscip
lina
ry
pro
cess
es
10
0%
of re
po
rte
d
fra
ud
an
d
corr
up
tion
mis
con
du
ct
case
s su
bje
cte
d to
d
isci
plin
ary
p
roce
sse
s
10
0%
of re
po
rte
d
fra
ud
an
d
corr
up
tio
n
mis
con
du
ct c
ase
s su
bje
cte
d to
d
isci
plin
ary
p
roce
sse
s

31
Department of Public Works: 2015-2016 Annual Performance Plan
2.4
R
eco
ncilin
g p
erf
orm
an
ce t
arg
ets
wit
h t
he B
ud
get
an
d M
TE
F
Exp
enditu
re e
stim
ate
s
Ta
ble
10: E
xpend
iture
est
imate
s fo
r P
rogra
mm
e 1
: A
dm
inis
tratio
n
Pro
gra
mm
es
Au
dit
ed
ou
tco
me
A
dju
ste
d
ap
pro
pri
ati
on
M
ed
ium
-term
exp
en
dit
ure
esti
mate
2011/1
2
2012/1
3
2013/1
4
2014/1
5
2015/1
6
2016/1
7
2017/1
8
(R’0
00)
(R
’000)
(R
’000)
(R
’000)
(R
’000)
(R
’000)
(R
’000)
Min
istr
y
25
276
22 2
79
19
512
32 1
01
32 9
43
34 7
29
37 1
42
Man
agem
ent
32
380
74 3
59
88
812
97 7
19
10
9 00
3
109
769
11
0 39
1
Cor
pora
te S
ervi
ces
29
5
738
26
3 82
8
248
355
26
7 33
8
247
364
27
9 62
8
291
250
Fin
ance
and
Sup
ply
Cha
in
Man
agem
ent
79 6
87
101
923
270
004
77 0
95
86 6
86
78 0
57
81 0
42
Tota
l
433
081
462
389
626
683
474
253
475
996
502
183
519
825

32
Department of Public Works: 2015-2016 Annual Performance Plan
Eco
no
mic
cla
ssifi
cati
on
Au
dit
ed
ou
tco
me
A
dju
ste
d
ap
pro
pri
ati
on
M
ed
ium
-term
exp
en
dit
ure
esti
mate
2011/1
2
2012/1
3
2013/1
4
2014/1
5
2015/1
6
2016/1
7
2017/1
8
(R’0
00)
(R
’000)
(R
’000)
(R
’000)
(R
’000)
(R
’000)
(R
’000)
Cu
rren
t p
aym
ents
383
611
43
9 17
4
596
009
43
9 45
7
456
761
46
7 04
6
478
964
Com
pens
atio
n of
em
ploy
ees
18
4 52
1
203
740
21
7 67
3
231
822
26
3 08
4
268
212
27
2 78
8
Sal
arie
s an
d w
ages
163
403
17
8 56
7
192
742
20
1 34
1
228
314
23
2 91
5
236
981
Soc
ial c
ontr
ibut
ions
21 1
18
25 1
73
24 9
31
30 4
81
34 7
70
35 2
97
35 8
07
Goo
ds a
nd s
ervi
ces
198
880
235
418
378
336
207
635
193
677
198
834
206
176
Adm
inis
trat
ive
fees
433
635
632
495
1 22
8
1 19
2
1 25
6
Adv
ertis
ing
8 24
4
1 47
9
2 21
8
8 94
4
9 16
0
8 64
5
8 73
5
Ass
ets
less
than
the
capi
talis
atio
n th
resh
old
4 10
9
1 32
6
272
560
484
519
569
Aud
it co
sts:
Ext
erna
l
18 1
65
19 1
21
20 1
27
21 1
86
22 3
01
23 4
85
24 6
59
Bur
sarie
s: E
mpl
oyee
s
30
17
1 57
0
2 00
0
2 09
2
2 20
3
2 31
3
Cat
erin
g: D
epar
tmen
tal a
ctiv
ities
1 19
0
1 31
5
1 31
7
1 07
7
1 11
9
1 20
4
1 28
4
Com
mun
icat
ion
(G&
S)
14 2
78
16 6
07
8 69
5
12 2
95
13 4
85
13 7
48
14 1
89
Com
pute
r se
rvic
es
42 4
80
42 3
41
23 8
75
29 8
06
28 5
59
29 4
39
36 2
27
Con
sulta
nts
and
prof
essi
onal
ser
vice
s:
Bus
ines
s an
d ad
viso
ry s
ervi
ces
14 6
22
10 2
62
48 4
84
6 71
2
12 0
74
11 2
49
6 66
4
Con
sulta
nts
and
prof
essi
onal
ser
vice
s:
Lega
l cos
ts
6 06
3
13 8
22
18 2
97
8 76
8
9 17
2
9 65
9
10 1
42
Con
trac
tors
14 9
14
3 84
1
20 2
38
2 03
4
2 28
0
2 77
4
16 0
21
Age
ncy
and
supp
ort /
out
sour
ced
serv
ices
28 6
55
72 7
05
165
775
51 2
66
24 9
61
23 2
82
8 03
6

33
Department of Public Works: 2015-2016 Annual Performance Plan E
co
no
mic
cla
ssifi
cati
on
Au
dit
ed
ou
tco
me
A
dju
ste
d
ap
pro
pri
ati
on
M
ed
ium
-term
exp
en
dit
ure
esti
mate
2011/1
2
2012/1
3
2013/1
4
2014/1
5
2015/1
6
2016/1
7
2017/1
8
(R’0
00)
(R
’000)
(R
’000)
(R
’000)
(R
’000)
(R
’000)
(R
’000)
Ent
erta
inm
ent
57
0
438
39
7
576
60
0
641
68
9
Fle
et s
ervi
ces
(incl
udin
g go
vern
men
t mot
or
tran
spor
t)
1 92
0
1
583
1 75
8
2
132
1 22
1
1
918
2 55
7
Inve
ntor
y: F
ood
and
food
sup
plie
s
3
-
-
3
-
-
-
Inve
ntor
y: F
uel,
oil a
nd g
as
-
2
3
-
-
-
-
Inve
ntor
y: L
earn
er a
nd te
ache
r su
ppor
t m
ater
ial
32
-
-
8
8
5
6
Inve
ntor
y: M
ater
ials
and
sup
plie
s
124
103
5
131
137
145
152
Inve
ntor
y: O
ther
sup
plie
s
299
1 41
0
-
329
347
363
381
Con
sum
able
sup
plie
s
-
-
-
-
50
60
65
Con
sum
able
: Sta
tione
ry, p
rintin
g an
d of
fice
supp
lies
6 79
4
7 25
6
4 36
5
5 81
6
5 70
4
6 38
0
6 65
5
Ope
ratin
g le
ases
7 54
8
3 09
4
30 6
92
6 72
3
8 30
3
8 04
1
8 48
4
Pro
pert
y pa
ymen
ts
143
3 28
0
2 37
0
10 1
39
11 1
05
11 1
67
11 7
26
Trav
el a
nd s
ubsi
sten
ce
18 3
59
25 3
06
16 6
42
17 4
38
19 5
45
21 4
97
22 5
92
Trai
ning
and
dev
elop
men
t
2 97
2
3 91
5
3 94
8
8 02
9
8 44
4
8 94
5
9 39
3
Ope
ratin
g pa
ymen
ts
3 42
0
2 66
2
3 51
8
7 83
7
8 22
3
8 66
0
9 33
7
Ven
ues
and
faci
litie
s
3 51
3
2 87
5
3 03
4
3 33
1
3 07
5
3 61
3
4 04
4
Ren
tal a
nd h
iring
-
23
59
-
-
-
-
Inte
rest
and
ren
t on
land
210
16
-
-
-
-
-

34
Department of Public Works: 2015-2016 Annual Performance Plan
Ec
on
om
ic c
las
sifi
ca
tio
n A
ud
ite
d o
utc
om
e
Ad
jus
ted
a
pp
rop
ria
tio
n
Me
diu
m-t
erm
ex
pe
nd
itu
re e
sti
ma
te
20
11
/12
2
01
2/1
3
20
13
/14
2
01
4/1
5
20
15
/16
2
01
6/1
7
20
17
/18
(R’0
00
)
(R’0
00
)
(R’0
00
)
(R’0
00
)
(R’0
00
)
(R’0
00
)
(R’0
00
)
Inte
rest
(In
cl. i
nter
est o
n un
itary
pay
men
ts
(PP
P))
210
16
-
-
-
-
-
Tran
sfer
s an
d s
ub
sid
ies
56
7
5
988
856
9 51
1
9
508
9 81
0
10
315
Pro
vinc
es a
nd m
unic
ipal
ities
3
3
2
11
6
6
6
Mun
icip
aliti
es
3
3
2
11
6
6
6
Mun
icip
al b
ank
acco
unts
3
3
2
11
6
6
6
Hou
seho
lds
564
5 98
5
854
9 50
0
9 50
2
9 80
4
10 3
09
Soc
ial b
enefi
ts
563
5 98
5
854
5 50
0
5 40
2
5 70
4
6 00
4
Oth
er tr
ansf
ers
to h
ouse
hold
s
1
-
-
4 00
0
4 10
0
4 10
0
4 30
5
Pay
men
ts f
or
cap
ital
ass
ets
48 9
03
17 2
27
22 0
30
25 2
85
9 72
7
25 3
27
30 5
46
Mac
hine
ry a
nd e
quip
men
t
42 4
15
17 0
70
5 97
8
19 1
20
9 72
7
25 3
27
30 5
46
Tran
spor
t equ
ipm
ent
-
198
-
-
1 50
0
-
-
Oth
er m
achi
nery
and
equ
ipm
ent
42 4
15
16 8
72
5 97
8
19 1
20
8 22
7
25 3
27
30 5
46
Sof
twar
e an
d ot
her
inta
ngib
le a
sset
s
6 48
8
157
16 0
52
6 16
5
-
-
-
Pay
men
ts f
or
fin
anci
al a
sset
s
-
-
7 78
8
-
-
-
-
Tota
l
433
081
462
389
626
683
474
253
475
996
502
183
519
825

35
Department of Public Works: 2015-2016 Annual Performance Plan
Performance and expenditure trends for Programme 1
The spending focus over the medium-term will be on Management and Corporate Services, such as
Legal Services, Human Resources Management, and Finance and Supply Chain Management. The
bulk of this expenditure is on compensation of employees and goods and services for day to day
operation of the Department.
Between 2012/13 and 2013/14, spending in the Finance and Supply Chain Management sub
programme increased significantly due to the implementation of the Turnaround Programme in the
Department. The Department's Turnaround Programme was funded mostly from funds reprioritised
to this programme from the Property and Construction Industry Policy and Research programme.
The decrease in goods and services in this programme is linked to phasing out of the completed
Turnaround projects.
As part of the Cabinet approved budget reductions, the Department will reduce spending by R45
million over the medium-term period. The reductions were implemented mainly in spending on
compensation of employees and non-core goods and services items.
Personnel numbers are expected to remain at this level over the medium term.

36
Department of Public Works: 2015-2016 Annual Performance Plan
3.
Pro
gra
mm
e 2
: In
terg
overn
men
tal C
oo
rdin
ati
on
Pu
rpo
se o
f th
e p
rog
ram
me:
Pro
vide s
ound s
ect
ora
l inte
rgove
rnm
enta
l rela
tions
and s
trate
gic
pa
rtn
ers
hip
s. C
oo
rdin
ate
with
Pro
vin
ces
on
imm
ova
ble
ass
et re
gis
ter,
co
nst
ruct
ion a
nd p
ropert
y m
anagem
ent,
the im
ple
menta
tion o
f G
ove
rnm
ent
Imm
ova
ble
Ass
et M
an
ag
em
en
t A
ct (
20
07
) a
nd
th
e r
ep
ort
ing
on
perf
orm
ance
info
rmatio
n w
ithin
the p
ublic
work
s se
ctor
Ta
ble
11: In
terg
ove
rnm
enta
l Coord
inatio
n: S
trate
gic
obje
ctiv
e a
nnual t
arg
ets
for
2015/1
6 –
2017
/18
Str
ate
gic
Ob
jecti
ve
Str
ate
gic
Pla
n T
arg
et
(5 y
ear
targ
et)
Au
dit
ed
/ A
ctu
al P
erf
orm
an
ce
E
sti
mate
d
Perf
orm
an
ce
2014/1
5
Med
ium
Term
Targ
ets
2011/1
2
2012/1
3
2013/1
4
2015/1
6
2016/1
7
2017/1
8
1.
To p
urs
ue
com
mon
serv
ice d
eliv
ery
obje
ctiv
es
with
in the
public
work
s se
ctor
thro
ugh the
coord
inate
d
imple
menta
tion o
f pro
gra
mm
es
at
Natio
nal a
nd
Pro
vinci
al l
eve
l
Public
Work
s se
ctor
support
ed in
are
as
of
concu
rrence
-
-
-
Public
Work
s se
ctor
support
ed in
are
as
of
concu
rrence
Public
Work
s
sect
or
support
ed in
are
as o
f co
ncurr
ence
Public
Work
s
secto
r support
ed in
are
as o
f concurr
ence
Public
Work
s
secto
r support
ed in
are
as o
f concurr
ence
2.
To e
nsu
re c
om
plia
nce
to
managem
ent
pra
ctic
es
thro
ugh the
MP
AT
impro
vem
ent
pla
n
100%
co
mplia
nce
of
managem
ent
pra
ctic
es
as
per
MP
AT
-
48%
(1.9
ave
rage
score
) co
mplia
nce
of
managem
ent
pra
ctic
es
as
per
MP
AT
50%
(2.0
ave
rage
score
)
com
plia
nce
of
managem
ent
pra
ctic
es
as
per
MP
AT
46%
(1.8
ave
rage s
core
) co
mplia
nce
of
managem
ent
pra
ctic
es
as
per
MP
AT
67.5
%
com
plia
nce
of
managem
ent
pra
ctic
es a
s
per
MP
AT
80%
com
plia
nce
of
managem
ent
pra
ctic
es a
s
per
MP
AT
95%
com
plia
nce
of
managem
ent
pra
ctic
es a
s
per
MP
AT

37
Department of Public Works: 2015-2016 Annual Performance Plan
Tab
le 1
2: In
terg
ove
rnm
enta
l Coord
inatio
n: P
rogra
mm
e p
erf
orm
ance
indic
ato
rs a
nd a
nnual t
arg
ets
fo
r 2
01
5/1
6 –
20
17
/18
Pe
rfo
rma
nc
e
Ind
ica
tor
A
ud
ite
d/ A
ctu
al
Pe
rfo
rma
nc
e
Es
tim
ate
d
Pe
rfo
rma
nc
e
20
14
/15
Me
diu
m-T
erm
Ta
rge
ts
20
11
/12
2
01
2/1
3
20
13
/14
2
01
5/1
6
20
16
/17
2
01
7/1
8
1.
Num
ber
of IG
R
foru
ms
conve
ned
for
ove
rsig
ht of th
e
Public
Work
s S
ect
or
12
inte
rgove
rnm
enta
l fo
rum
s co
nve
ned
12
inte
rgove
rnm
enta
l fo
rum
s co
nve
ned
12
inte
rgove
rnm
enta
l
foru
ms
conve
ned
12
inte
rgove
rnm
enta
l fo
rum
s co
nve
ned
12 inte
rgovern
menta
l fo
rum
s c
onvened
12 inte
rgovern
menta
l fo
rum
s c
onvened
12 inte
rgovern
menta
l fo
rum
s c
onvened
2.
Deve
lop
ment of
Public
Work
s se
ctor
dia
gnost
ic
report
-
-
-
-
Dia
gnostic r
eport
deve
loped o
n the
2014
/15
secto
r perf
orm
ance
Dia
gnostic r
eport
develo
ped o
n the
2015
/16
secto
r perf
orm
ance
Dia
gnostic r
eport
develo
ped o
n the
201
6/1
7
secto
r perf
orm
ance
3
. C
om
ple
ted s
erv
ice
deliv
ery
fr
am
ew
ork
for
identifi
ed s
erv
ices
-
-
-
Macr
o S
erv
ice
Deliv
ery
Model
com
ple
ted
Serv
ice d
eliv
ery
fr
am
ew
ork
com
ple
ted
for
1 id
entified s
erv
ice
(Constr
uction)
Serv
ice d
eliv
ery
fr
am
ew
ork
com
ple
ted
for
1 identified s
erv
ice
(R
eal E
sta
te)
Serv
ice d
eliv
ery
fr
am
ew
ork
com
ple
ted
for
2
identified
serv
ice
s (
EP
WP
and
Polic
y)
4
. C
hange in
ave
rage s
core
of
managem
ent
pra
ctic
es
thro
ugh
the M
PA
T
impro
vem
ent pla
n
-
Ave
rage s
core
of
1.9
for
managem
ent
pra
ctic
es
Ave
rage s
core
of
2 for
managem
ent
pra
ctic
es
Ave
rage s
core
of
1.8
for
managem
ent
pra
ctic
es
Ave
rage s
core
of 2.7
fo
r m
anagem
ent
pra
ctic
es
Avera
ge s
core
of 3.2
fo
r m
anagem
ent
pra
ctices
Avera
ge s
core
of 4
for
managem
ent
pra
ctices

38
Department of Public Works: 2015-2016 Annual Performance Plan
Ta
ble
13: In
terg
ove
rnm
enta
l Coord
inatio
n:
Quart
erly
targ
ets
for
2015/1
6
Perf
orm
an
ce In
dic
ato
r R
ep
ort
ing
p
eri
od
An
nu
al Targ
et
2015/1
6 Q
uart
erl
y T
arg
ets
1s
t
2n
d
3rd
4
th
1.
Num
ber
of IG
R foru
ms
conve
ned for
ove
rsig
ht
of th
e P
ublic
Work
s S
ect
or
Quart
erly
12 in
terg
ove
rnm
enta
l fo
rum
s co
nve
ned
3 in
terg
ove
rnm
enta
l fo
rum
s co
nve
ned
3 in
terg
overn
menta
l fo
rum
s c
onvened
3
inte
rgovern
menta
l fo
rum
s c
onvened
3
inte
rgovern
menta
l fo
rum
s c
onvened
2.
Deve
lop
ment of
public
w
ork
s se
ctor
dia
gnost
ic r
eport
Quart
erly
- -
D
iagnostic r
eport
develo
ped o
n the
2014/1
5 s
ecto
r perf
orm
ance
Pre
senta
tion o
f th
e s
ecto
r dia
gnostic r
eport
at Te
chnic
al
Min
Mec
3.
Com
ple
ted s
erv
ice
deliv
ery
fra
mew
ork
for
identifi
ed s
erv
ices
Quart
erly
Serv
ice d
eliv
ery
fr
am
ew
ork
com
ple
ted
for
1 id
entifi
ed s
erv
ice
(Const
ruct
ion)
Busi
ness
case
for
DP
W a
nd P
MT
E
serv
ice d
eliv
ery
fr
am
ew
ork
co
mple
ted
Serv
ice d
eliv
ery
m
odel and B
usin
ess
pro
cesses
com
ple
ted
Unit c
osting
com
ple
ted a
nd
Sta
ndard
O
pera
ting
Pro
cedure
s
com
ple
ted
Serv
ice d
eliv
ery
sta
ndard
s a
nd
serv
ice d
eliv
ery
chart
ers
com
ple
ted
4.
Change in
ave
rage
score
of m
anagem
ent
pra
ctic
es
thro
ugh the
MP
AT
impro
vem
ent
pla
n
Quart
erly
Ave
rage s
core
of 2.7
fo
r m
anagem
ent
pra
ctic
es
- -
A
vera
ge s
core
of
2.7
for
managem
ent
pra
ctices
(deta
iled M
PA
T
report
)
-
Dia
gnost
ic r
eport
deve
loped o
n the
2014/1
5 s
ect
or
perf
orm
ance

39
Department of Public Works: 2015-2016 Annual Performance Plan
3.1
Reco
ncilin
g p
erf
orm
an
ce t
arg
ets
wit
h t
he B
ud
get
an
d M
TE
F
Exp
enditu
re e
stim
ate
s
Ta
ble
14: E
xpend
iture
est
imate
s fo
r P
rogra
mm
e 2
: In
terg
ove
rnm
enta
l Coord
inatio
n
Pro
gra
mm
es
Au
dit
ed
ou
tco
me
A
dju
ste
d a
pp
rop
ria
tio
n
Me
diu
m-t
erm
ex
pe
nd
itu
re e
sti
ma
te
20
11
/12
2
01
2/1
3
20
13
/14
2
01
4/1
5
20
15
/16
2
01
6/1
7
20
17
/18
(R’0
00
)
(R’0
00
)
(R’0
00
)
(R’0
00
)
(R’0
00
)
(R’0
00
)
(R’0
00
)
Mon
itorin
g, E
valu
atio
n an
d R
epor
ting
11 2
58
11
326
11 2
74
16
750
32 8
95
35
231
37 4
56
Inte
rgov
ernm
enta
l Rel
atio
ns a
nd C
oord
inat
ion
8
410
7 17
1
7
606
9 00
0
14 3
28
14
860
15 3
71
Tota
l
19
668
18 4
97
18
880
25 7
50
47
223
50 0
91
52
827

40
Department of Public Works: 2015-2016 Annual Performance Plan
Ec
on
om
ic c
las
sifi
ca
tio
n
Au
dit
ed
ou
tco
me
A
dju
ste
d
ap
pro
pri
ati
on
M
ed
ium
-te
rm e
xp
en
dit
ure
es
tim
ate
20
11
/12
2
01
2/1
3
20
13
/14
2
01
4/1
5
20
15
/16
2
01
6/1
7
20
17
/18
(R’0
00
)
(R’0
00
)
(R’0
00
)
(R’0
00
)
(R’0
00
)
(R’0
00
)
(R’0
00
)
Cu
rren
t p
aym
ents
19 5
81
18
452
18 7
87
25
750
43 9
23
46
791
49 5
27
Com
pens
atio
n of
em
ploy
ees
14
884
15 2
40
14
836
20 8
00
31
531
33 2
64
34
927
Sal
arie
s an
d w
ages
12 8
00
13 1
07
12 7
59
17 8
88
27 1
17
28 6
07
30 0
37
Soc
ial c
ontr
ibut
ions
2 08
4
2 13
3
2 07
7
2 91
2
4 41
4
4 65
7
4 89
0
Goo
ds a
nd s
ervi
ces
4 69
2
3 20
7
3 95
1
4 95
0
12 3
92
13 5
27
14 6
00
Adm
inis
trat
ive
fees
Adv
ertis
ing
33
2
36
395
85
90
95
Ass
ets
less
than
the
capi
talis
atio
n th
resh
old
8
2
1
5
35
45
50
Cat
erin
g: D
epar
tmen
tal a
ctiv
ities
146
56
49
204
135
145
150
Com
mun
icat
ion
(G&
S)
184
220
200
254
450
500
505
Com
pute
r se
rvic
es
72
100
240
245
250
350
370
Con
sulta
nts
and
prof
essi
onal
ser
vice
s: B
usin
ess
and
advi
sory
ser
vice
s
197
-
141
281
550
365
470
Con
trac
tors
93
194
-
194
3 52
6
4 65
0
5 42
0
Age
ncy
and
supp
ort /
out
sour
ced
serv
ices
246
-
-
325
1 91
0
1 97
0
1 97
5
Ent
erta
inm
ent
44
31
28
28
60
60
60
Fle
et s
ervi
ces
(incl
udin
g go
vern
men
t mot
or
tran
spor
t)
1
-
4
7
Inve
ntor
y: L
earn
er a
nd te
ache
r su
ppor
t mat
eria
l
12
-
-
-

41
Department of Public Works: 2015-2016 Annual Performance Plan
Eco
no
mic
cla
ssifi
cati
on
Au
dit
ed
ou
tco
me
A
dju
ste
d
ap
pro
pri
ati
on
M
ed
ium
-term
exp
en
dit
ure
esti
mate
2011/1
2
2012/1
3
2013/1
4
2014/1
5
2015/1
6
2016/1
7
2017/1
8
(R’0
00)
(R
’000)
(R
’000)
(R
’000)
(R
’000)
(R
’000)
(R
’000)
Inve
ntor
y: M
ater
ials
and
sup
plie
s
1
-
-
5
6
7
7
Inve
ntor
y: O
ther
sup
plie
s
7
-
-
10
20
20
20
Con
sum
able
sup
plie
s
-
-
-
-
12
5
125
12
5
Con
sum
able
: Sta
tione
ry, p
rintin
g an
d of
fice
supp
lies
394
525
296
506
600
600
600
Ope
ratin
g le
ases
71
11
2
25
300
300
300
Tran
spor
t pro
vide
d: D
epar
tmen
tal a
ctiv
ity
-
-
-
-
-
Trav
el a
nd s
ubsi
sten
ce
2 19
8
933
1 07
1
1 44
4
3 02
5
3 02
5
3 16
3
Trai
ning
and
dev
elop
men
t
74
13
-
12
15
20
25
Ope
ratin
g pa
ymen
ts
438
697
1 21
2
719
740
690
695
Ven
ues
and
faci
litie
s
473
400
656
291
560
565
570
Ren
tal a
nd h
iring
-
23
15 -
-

42
Department of Public Works: 2015-2016 Annual Performance Plan
Ec
on
om
ic c
las
sifi
ca
tio
n A
ud
ite
d o
utc
om
e
Ad
jus
ted
ap
pro
pri
ati
on
M
ed
ium
-te
rm e
xp
en
dit
ure
es
tim
ate
20
11
/12
2
01
2/1
3
20
13
/14
2
01
4/1
5
20
15
/16
2
01
6/1
7
20
17
/18
(R’0
00
)
(R’0
00
)
(R’0
00
)
(R’0
00
)
(R’0
00
)
(R’0
00
)
(R’0
00
)
Inte
rest
and
ren
t on
land
5
5
Inte
rest
(In
cl. i
nter
est o
n un
itary
pay
men
ts (
PP
P))
5
5
Tran
sfer
s an
d s
ub
sid
ies
-
-
-
-
300
30
0
300
Hou
seho
lds
300
30
0
300
Soc
ial b
enefi
ts
300
300
300
Pay
men
ts f
or
cap
ital
ass
ets
87
45
93
-
3 00
0
3 00
0
3 00
0
Mac
hine
ry a
nd e
quip
men
t
87
45
93
-
3 00
0
3 00
0
3 00
0
Oth
er m
achi
nery
and
equ
ipm
ent
87
45
93
-
3 00
0
3 00
0
3 00
0
Pay
men
ts f
or
fin
anci
al a
sset
s
-
-
-
-
-
-
-
Tota
l
19 6
68
18 4
97
18 8
80
25 7
50
47 2
23
50 0
91
52 8
27

43
Department of Public Works: 2015-2016 Annual Performance Plan
Performance and expenditure trends for Programme 2
The spending focus over the medium-term will be on promoting sound sectoral intergovernmental
relations and strategic partnership monitoring. The bulk of this expenditure is on compensation of
employees including goods and services.
The programme aims at ensuring consistent, sound and integrated corporate governance within the
Department through the implementation of the service delivery improvement framework and
coordination of intergovernmental forums.
Personnel numbers are expected to increase over the medium-term with the filling of the critical
vacant positions to ensure promotion of sound sectoral intergovernmental relations and strategic
monitoring.

44
Department of Public Works: 2015-2016 Annual Performance Plan
4.
Pro
gra
mm
e 3
: Exp
an
de
d P
ub
lic W
ork
s P
rog
ram
me
Pu
rpo
se o
f th
e p
rog
ram
me:
Coord
inate
the im
ple
menta
tion o
f th
e e
xpanded p
ublic
work
s pro
gra
mm
e w
hic
h a
ims
to c
rea
te w
ork
op
po
rtu
niti
es
an
d
pro
vide tra
inin
g for
unsk
illed, m
arg
inalis
ed a
nd u
nem
plo
yed p
eople
in S
outh
Afr
ica.
Tab
le 1
5: E
xpanded P
ublic
Work
s P
rogra
mm
e:
Str
ate
gic
obje
ctiv
e a
nnual t
arg
ets
for
2015/1
6 t
o 2
01
7/1
8
Str
ate
gic
Ob
jec
tiv
e S
tra
teg
ic P
lan
Ta
rge
t (5
ye
ar
targ
et)
Actu
al
Pe
rfo
rma
nc
e
Es
tim
ate
d
Pe
rfo
rma
nc
e
20
14
/15
Me
diu
m T
erm
Ta
rge
ts
20
11
/12
2
01
2/1
3
20
13
/14
2
01
5/1
6
20
16
/17
2
01
7/1
8
1.
To c
o-o
rdin
ate
, m
onito
r and
eva
luate
the
imple
menta
tion
of E
PW
P
Phase
III that
aim
s to
cre
ate
6 m
illio
n w
ork
opport
uniti
es
and p
rovi
de
inco
me s
upport
to
the p
oor,
low
ly s
kille
d
and
unem
plo
yed
betw
een 2
014 -
2019
6 m
illio
n w
ork
opport
uniti
es
create
d b
y public
bodie
s in
the
EP
WP
alig
ned to
the P
hase
III
Busi
ness
Pla
n
843 4
59 w
ork
opport
uniti
es
create
d b
y public
bodie
s
in
the E
PW
P
alig
ned t
o the
Phase I
I B
usi
ness
P
lan
941 5
93
w
ork
opport
uniti
es
create
d b
y public
bodie
s
in the E
PW
P
alig
ned to the
Phase
II
Busi
ness
P
lan
1 2
10 0
00
work
opport
uniti
es
create
d b
y
public
bodie
s in
the E
PW
P
alig
ned to the
Phase
II
Busi
ness
P
lan
1 0
45 0
00 w
ork
opport
uniti
es
create
d b
y public
bodie
s in
the
EP
WP
alig
ned to
the P
hase
III
Busi
ness
Pla
n
1 1
27 1
86
work
opport
uniti
es
cr
eate
d b
y public
bodie
s in
the E
PW
P
alig
ned to
the P
hase
III
Busi
ness
P
lan
1 3
43 1
54
work
opport
uniti
es
cr
eate
d b
y public
bodie
s in
the E
PW
P
alig
ned to
the P
hase
III
Busi
ness
P
lan
1 4
06 7
36
work
opport
uniti
es
cr
eate
d b
y public
bodie
s in
the E
PW
P
alig
ned to
the P
hase
III
Busi
ness
P
lan

45
Department of Public Works: 2015-2016 Annual Performance Plan
Table
16: E
xpanded P
ublic
Work
s P
rogra
mm
e:
Pro
gra
mm
e p
erf
orm
ance
indic
ato
rs a
nd a
nnual t
arg
ets
fo
r 2
01
5/1
6 to
20
17
/18
Pe
rfo
rma
nc
e I
nd
ica
tor
A
ud
ite
d/ A
ctu
al
Pe
rfo
rma
nc
e
Es
tim
ate
d
Pe
rfo
rma
nc
e
20
14
/15
Me
diu
m-T
erm
Ta
rge
ts
20
11
/12
2
01
2/1
3
20
13
/14
2
01
5/1
6
20
16
/17
2
01
7/1
8
1.
Num
ber
of w
ork
opport
uniti
es
create
d b
y public
bodie
s in
the
EP
WP
alig
ned to the
Phase
III
Busi
ness
Pla
n
843 4
59 w
ork
opport
uniti
es
create
d b
y public
bodie
s
in the E
PW
P
alig
ned to the
Phase
II
Busi
ness
Pla
n
941 5
93 w
ork
opport
uniti
es
create
d b
y public
bodie
s
in the E
PW
P
alig
ned to the
Phase
II
Busi
ness
Pla
n
1 2
10 0
00
work
opport
uniti
es
create
d b
y
public
bodie
s in
the E
PW
P
alig
ned to the
Phase
II
Busi
ness
Pla
n
1 0
45 5
19
w
ork
opport
uniti
es
create
d b
y public
bodie
s in
the
EP
WP
alig
ned to
the P
hase
III
Busi
ness
Pla
n
1 1
27 1
86
w
ork
opport
uniti
es
cre
ate
d b
y
public
bodie
s in
th
e E
PW
P
alig
ned to the
Phase III
Busin
ess P
lan
1 3
43
154
w
ork
opport
uniti
es
cre
ate
d b
y
public
bodie
s in
th
e E
PW
P
alig
ned to the
Phase III
Busin
ess P
lan
1 4
06 7
36
w
ork
opport
uniti
es
cre
ate
d b
y
public
bodie
s in
th
e E
PW
P
alig
ned to the
Phase III
Busin
ess P
lan
2.
Num
ber
of w
ork
oppo
rtuniti
es
create
d in
rura
l munic
ipalit
ies
in the
EP
WP
alig
ned to the
Phase
III B
usi
ness
Pla
n
626
161
work
opport
uniti
es
create
d b
y ru
ral
munic
ipalit
ies
in the E
PW
P
alig
ned to the
Phase
II
Busi
ness
Pla
n
707
973
work
opport
uniti
es
create
d b
y ru
ral
munic
ipalit
ies
in the E
PW
P
alig
ned to the
Phase
II
Busi
ness
Pla
n
700
000 w
ork
opport
uniti
es
create
d b
y ru
ral
munic
ipalit
ies
in the E
PW
P
alig
ned to the
Phase
II
Busi
ness
Pla
n
600
000 w
ork
opport
uniti
es
create
d b
y ru
ral
munic
ipalit
ies
in
the E
PW
P
alig
ned to the
Phase
III
Busi
ness
Pla
n
700
000 w
ork
opport
uniti
es
cre
ate
d b
y r
ura
l m
unic
ipalit
ies in
th
e E
PW
P
alig
ned to the
Phase III
Busin
ess P
lan
730
000 w
ork
opport
uniti
es
cre
ate
d b
y r
ura
l m
unic
ipalit
ies in
th
e E
PW
P
alig
ned to the
Phase III
Busin
ess P
lan
750
000 w
ork
oppo
rtuniti
es
cre
ate
d b
y r
ura
l m
unic
ipalit
ies in
th
e E
PW
P
alig
ned to the
Phase III
Busin
ess P
lan
3.
Perc
enta
ge o
f E
PW
P
part
icip
atio
n a
mong
desi
gnate
d g
roups
(wom
en, yo
uth
and
pers
ons
with
dis
abili
ties)
alig
ned to the E
PW
P
Phase
III
Busi
ness
Pla
n.
50%
(422 1
07)
Youth
60%
(502 0
57)
Wom
en
0.2
% (
1
582)
Pers
ons
with
dis
abili
ties
part
icip
ate
d in
E
PW
P
60%
(560 5
69)
Youth
51%
(479 5
50)
Wom
en
0.6
% (
5
254)
Pers
ons
with
dis
abili
ties
part
icip
ate
d in
E
PW
P
49%
(494 2
38)
Youth
61%
(618 1
34)
Wom
en
1.0
% (
10 0
08)
Pers
ons
with
dis
abili
ties
part
icip
ate
d in
E
PW
P
48%
Youth
65%
Wom
en
0.6
% P
ers
ons
with
dis
abili
ties
part
icip
ate
d in
E
PW
P
55%
Wom
en
55%
Youth
2%
Pers
ons
with
dis
abili
ties
part
icip
ate
d in
E
PW
P
55%
Wom
en
55%
Youth
2%
Pers
ons
with
dis
abili
ties
part
icip
ate
d in
E
PW
P
55%
Wom
en
55%
Youth
2%
Pers
ons
with
dis
abili
ties
part
icip
ate
d in
E
PW
P

46
Department of Public Works: 2015-2016 Annual Performance Plan
Perf
orm
an
ce In
dic
ato
r
Au
dit
ed
/ A
ctu
al P
erf
orm
an
ce
E
sti
mate
d
Perf
orm
an
ce
2014/1
5
Med
ium
-Term
Targ
ets
2011
/12
2012/1
3
2013/1
4
2015/1
6
2016/1
7
2017/1
8
4.
Pe
rce
nta
ge
of
dis
bu
rse
d
pe
rfo
rma
nce
-ba
se
d
ince
ntiv
e a
lloca
tion
s t
o
elig
ible
pu
blic
bo
die
s a
cro
ss
all
sect
ors
.
69
% (
R9
44
m
il) o
f p
erf
orm
an
ce
b
ase
d
ince
ntiv
e
allo
catio
ns
dis
bu
rse
d t
o
elig
ible
Pu
blic
b
od
ies
acr
oss
all
sect
ors
10
0%
(R
1.4
b
n)
of
pe
rfo
rma
nce
b
ase
d
ince
ntive
a
lloca
tio
ns
dis
bu
rse
d t
o
elig
ible
Pu
blic
b
od
ies
acr
oss
a
ll se
cto
rs
90
% (
R1
.5b
n)
of
pe
rfo
rma
nce
b
ase
d
ince
ntiv
e
allo
catio
ns
dis
bu
rse
d t
o
elig
ible
Pu
blic
b
od
ies
acr
oss
a
ll se
cto
rs
90
% (
R1
.5 b
n)
of
pe
rfo
rma
nce
b
ase
d in
cen
tive
a
lloca
tion
s d
isb
urs
ed
to
e
ligib
le P
ub
lic
Bo
die
s a
cro
ss a
ll se
cto
rs
95
% (
R1
.6 b
n)
of
pe
rfo
rma
nce
b
ase
d in
cen
tive
a
lloca
tio
ns
dis
bu
rse
d t
o
elig
ible
Pu
blic
B
od
ies
acr
oss
a
ll se
cto
rs
97
% (
R2
.0
bn
) o
f p
erf
orm
an
ce
ba
sed
in
cen
tive
a
lloca
tio
ns
dis
bu
rse
d t
o
elig
ible
Pu
blic
B
od
ies
acr
oss
a
ll se
cto
rs
98
% (
R2
.1 b
n)
of
pe
rfo
rma
nce
b
ase
d in
cen
tive
a
lloca
tio
ns
dis
bu
rse
d t
o
elig
ible
Pu
blic
B
od
ies
acr
oss
a
ll se
cto
rs
5.
Nu
mb
er
of
Mu
nic
ipa
litie
s
rep
ort
ing
on
EP
WP
ta
rge
ts p
rovid
ed
with
te
ch
nic
al s
up
po
rt
-
24
7
Mu
nic
ipa
litie
s p
rovi
de
d w
ith
tech
nic
al
sup
po
rt
27
1
Mu
nic
ipa
litie
s p
rovi
de
d w
ith
tech
nic
al
sup
po
rt
27
4
Mu
nic
ipa
litie
s p
rovi
de
d w
ith
tech
nic
al s
up
po
rt
27
8
Mu
nic
ipa
litie
s p
rovi
de
d w
ith
te
chn
ica
l su
pp
ort
27
8
Mu
nic
ipa
litie
s p
rovi
de
d w
ith
te
chn
ica
l su
pp
ort
27
8
Mu
nic
ipa
litie
s p
rovi
de
d w
ith
te
chn
ica
l su
pp
ort
6.
Nu
mb
er
of
pu
blic
bo
die
s
su
bm
ittin
g s
ign
ed
off
da
ta r
ep
ort
s -
-
-
-
13
pu
blic
b
od
ies
sub
mitte
d
sig
ne
d o
ff d
ata
re
po
rts
13
pu
blic
b
od
ies
sub
mitte
d
sig
ne
d o
ff d
ata
re
po
rts
13
pu
blic
b
od
ies
sub
mitte
d
sig
ne
d o
ff d
ata
re
po
rts

47
Department of Public Works: 2015-2016 Annual Performance Plan
Table
17: E
xpanded P
ublic
Work
s P
rogra
mm
e:
Quart
erly
targ
ets
for
2015/1
6P
erf
orm
an
ce In
dic
ato
r R
ep
ort
ing
peri
od
A
nn
ual Targ
et
2015
/16
Q
uart
erl
y T
arg
ets
1s
t
2n
d
3rd
4
th
1.
N
um
ber
of w
ork
opport
uniti
es
create
d b
y public
bodie
s in
the E
PW
P
alig
ned to the P
hase
III
Busi
ness
Pla
n
Quart
erly
(Cum
ula
tive)
1 1
27 1
86
w
ork
opport
uniti
es
create
d b
y public
bodie
s in
the
EP
WP
alig
ned to
the P
hase
III
Busi
ness
Pla
n
300
000
w
ork
opport
uniti
es
report
ed in
the
EP
WP
report
ing
syst
em
620 0
00 w
ork
opport
unitie
s
report
ed in the
EP
WP
report
ing
syste
m
970 0
00 w
ork
opport
unitie
s
report
ed in the
EP
WP
report
ing
syste
m
1 1
27 1
86
w
ork
opport
unitie
s
report
ed in the
EP
WP
report
ing
syste
m
2.
Num
ber
of w
ork
op
port
uniti
es
create
d in
rura
l m
unic
ipalit
ies
in the E
PW
P
alig
ned to the P
hase
III
Busi
ness
Pla
n
Quart
erly
(Cum
ula
tive)
700
000 w
ork
opport
uniti
es
create
d b
y ru
ral
munic
ipalit
ies
in
the E
PW
P a
ligned
to the P
hase
III
Busi
ness
Pla
n
300
000 w
ork
opport
uniti
es
cre
ate
d b
y ru
ral
munic
ipalit
ies
in
the E
PW
P
alig
ned to the
Phase
III
Busi
ness
Pla
n
400
000
opport
unitie
s
work
opport
unitie
s
create
d b
y r
ura
l m
unic
ipalit
ies in
the E
PW
P
alig
ned to the
Phase III
Busin
ess P
lan
500
000 w
ork
opport
unitie
s
cre
ate
d b
y r
ura
l m
unic
ipalit
ies in
the E
PW
P
alig
ned to the
Phase III
Busin
ess P
lan
700
000 w
ork
opport
unitie
s
cre
ate
d b
y r
ura
l m
unic
ipalit
ies in
the E
PW
P
alig
ned to the
Phase III
Busin
ess P
lan
3
Perc
enta
ge o
f E
PW
P
part
icip
atio
n a
mong
desi
gnate
d g
roups
(perc
enta
ge o
f w
om
en,
youth
and p
ers
ons
with
dis
abili
ties)
alig
ned to the
EP
WP
Phase
III B
usi
ness
P
lan.
Quart
erly
55%
Wom
en
55%
Youth
2%
Pers
ons
with
dis
abili
ties
part
icip
ate
d in
E
PW
P
55%
Wom
en
55%
Youth
2%
Pers
ons
with
dis
abili
ties
part
icip
ate
d in
E
PW
P
55%
Wom
en
55%
Youth
2%
Pers
ons w
ith
dis
abili
ties
part
icip
ate
d in
EP
WP
55%
Wom
en
55%
Youth
2%
Pers
ons w
ith
dis
abili
ties
part
icip
ate
d in
EP
WP
55%
Wom
en
55%
Youth
2%
Pers
ons w
ith
dis
abili
ties
part
icip
ate
d in
EP
WP
4.
Perc
enta
ge o
f dis
burs
ed
perf
orm
ance
-base
d
ince
ntiv
e a
lloca
tions
to
elig
ible
public
bodie
s acr
oss
all
sect
ors
. Q
uart
erly
(Cum
ula
tive)
95%
of
perf
orm
ance
base
d
ince
ntiv
e
allo
catio
ns
dis
burs
ed to
elig
ible
public
bodie
s acr
oss
all
sect
ors
.
40%
of in
centiv
e
allo
catio
ns
dis
burs
ed to
elig
ible
public
bodie
s acr
oss
all
sect
ors
.
60%
of in
centive
allo
cations
dis
burs
ed to
elig
ible
public
bodie
s a
cro
ss a
ll se
cto
rs.
80%
of in
centive
allo
cations
dis
burs
ed to
elig
ible
public
bodie
s a
cro
ss a
ll secto
rs.
95%
of in
centive
allo
cations
dis
burs
ed to
elig
ible
public
bodie
s a
cro
ss a
ll secto
rs.
5.
Num
ber
of
Munic
ipalit
ies
report
ing o
n E
PW
P targ
ets
pro
vided w
ith tech
nic
al
support
Quart
erly
(Cum
ula
tive)
278 M
unic
ipalit
ies
pro
vided w
ith
tech
nic
al s
upport
200 M
unic
ipalit
ies
pro
vided w
ith
tech
nic
al s
upport
240 M
unic
ipalit
ies
pro
vid
ed w
ith
tech
nic
al supp
ort
260 M
unic
ipalit
ies
pro
vid
ed w
ith
technic
al support
278 M
unic
ipalit
ies
pro
vid
ed w
ith
technic
al support
6
Nu
mb
er
of
pu
blic
bo
die
s su
bm
itte
d s
ign
ed
off d
ata
re
po
rts
Qu
art
erly
13
pu
blic
bo
die
s su
bm
itte
d s
ign
ed
o
ff d
ata
re
po
rts
13
pu
blic
bo
die
s su
bm
itte
d s
ign
ed
o
ff d
ata
re
po
rts
13
pu
blic
bo
die
s su
bm
itte
d s
ign
ed
o
ff d
ata
re
po
rts
13
pu
blic
bo
die
s su
bm
itte
d s
ign
ed
o
ff d
ata
re
po
rts
13
pu
blic
bo
die
s
sub
mitte
d s
ign
ed
o
ff d
ata
re
po
rts

48
Department of Public Works: 2015-2016 Annual Performance Plan
4.1
R
eco
ncilin
g p
erf
orm
an
ce t
arg
ets
wit
h t
he B
ud
get
an
d M
TE
F
Exp
enditu
re e
stim
ate
s
Ta
ble
18: E
xpenditu
re e
stim
ate
s fo
r P
rogra
mm
e 3
: E
xpanded P
ublic
Work
s P
rogra
mm
e
Pro
gra
mm
es
Au
dit
ed
ou
tco
me
A
dju
ste
d
ap
pro
pri
ati
on
M
ed
ium
-term
exp
en
dit
ure
esti
mate
2011/1
2
2012/1
3
2013/1
4
2014
/15
2015/1
6
2016/1
7
2017/1
8
(R’0
00
)
(R’0
00)
(R
’000)
(R
’000)
(R
’000)
(R
’000)
(R
’000)
Exp
ande
d P
ublic
Wor
ks P
rogr
amm
e M
onito
ring
and
Eva
luat
ion
20 5
22
21
463
63 8
08
61
023
53
738
56
557
59
282
Exp
ande
d P
ublic
Wor
ks P
rogr
amm
e In
fras
truc
ture
64
4 40
0
1
028
024
1
039
386
1 03
6 74
3
1
012
749
1 14
4 83
2
1
222
839
Exp
ande
d P
ublic
Wor
ks P
rogr
amm
e O
pera
tions
37
7 63
7
529
191
72
7 65
7
746
143
81
0 16
0
996
759
1 05
4 44
9
Exp
ande
d P
ublic
Wor
ks P
rogr
amm
e P
artn
ersh
ip
Sup
port
120
456
12
5 37
3
100
839
10
7 38
6
108
542
11
9 19
5
125
698
Exp
ande
d P
ublic
Wor
ks P
rogr
amm
e P
ublic
E
mpl
oym
ent C
oord
inat
ing
Com
mis
sion
-
-
-
-
7 04
5
7 43
0
7 78
2
Tota
l
1 16
3 01
5
1 70
4 05
1
1
931
690
1 95
1 29
5
1 99
2 23
4
2 32
4 77
3
2 47
0 05
0

49
Department of Public Works: 2015-2016 Annual Performance Plan
Eco
no
mic
cla
ssifi
cati
on
Au
dit
ed
ou
tco
me
A
dju
ste
d
ap
pro
pri
ati
on
M
ed
ium
-term
exp
en
dit
ure
esti
mate
201
1/1
2
2012/1
3
2013/1
4
2014/1
5
2015/1
6
2016/1
7
2017/1
8
(R’0
00)
(R
’000)
(R
’000)
(R
’000)
(R
’000)
(R
’000)
(R
’000)
Cu
rren
t p
aym
ents
216
285
24
4 35
4
270
257
26
9 39
1
276
046
29
6 20
6
311
188
Com
pens
atio
n of
em
ploy
ees
91
905
100
901
10
8 31
0
133
233
14
4 07
7
156
297
16
4 51
7
Sal
arie
s an
d w
ages
80 5
20
89
309
96 0
18
11
4 38
0
123
769
13
4 27
2
141
332
Soc
ial c
ontr
ibut
ions
11 3
85
11
592
12 2
92
18
853
20
308
22
025
23
185
Goo
ds a
nd s
ervi
ces
124
287
14
3 45
3
161
947
13
6 15
8
131
969
13
9 90
9
146
671
Adm
inis
trat
ive
fees
-
8
60
5
57
60
63
Adv
ertis
ing
4 47
1
4 23
2
7 09
0
4 23
8
3 96
1
4 20
9
4 41
2
Ass
ets
less
than
the
capi
talis
atio
n th
resh
old
223
268
271
54
150
161
169
Aud
it co
sts:
Ext
erna
l
2 28
0
62
-
-
-
-
-
Cat
erin
g: D
epar
tmen
tal a
ctiv
ities
626
329
515
138
311
329
345
Com
mun
icat
ion
(G&
S)
1 13
4
1 20
4
1 26
1
1 06
3
1 05
9
1 12
5
1 17
8
Com
pute
r se
rvic
es
374
473
499
342
344
366
383
Con
sulta
nts
and
prof
essi
onal
ser
vice
s: B
usin
ess
and
advi
sory
ser
vice
s
19 3
38
28 1
91
75
709
-
60 2
72
63 7
19
66 7
99
Con
sulta
nts
and
prof
essi
onal
ser
vice
s:
Infr
astr
uctu
re a
nd p
lann
ing
3 06
6
7 61
4
9 42
7
48 9
17
8 88
6
9 44
2
9 89
9
Con
trac
tors
421
255
1 24
8
-
707
751
787
Age
ncy
and
supp
ort /
out
sour
ced
serv
ices
45 7
06
64 2
52
32 9
98
52 0
26
31 1
72
33 1
24
34 7
25
Ent
erta
inm
ent
300
137
118
-
143
152
161
Fle
et s
ervi
ces
(incl
udin
g go
vern
men
t mot
or
tran
spor
t)
135
527
1 14
7
-
708
753
789
Inve
ntor
y: C
loth
ing
mat
eria
l and
acce
ssor
ies
-
-
Inve
ntor
y: F
ood
and
food
sup
plie
s
-
-
-
Inve
ntor
y: F
uel,
oil a
nd g
as
439
466
489
Inve
ntor
y: L
earn
er a
nd te
ache
r su
ppor
t mat
eria
l
-
-
-
Inve
ntor
y: M
ater
ials
and
sup
plie
s
-
-
-
Inve
ntor
y: O
ther
sup
plie
s
192
204
214

50
Department of Public Works: 2015-2016 Annual Performance Plan
Ec
on
om
ic c
las
sifi
ca
tio
n A
ud
ite
d o
utc
om
e
Ad
jus
ted
a
pp
rop
ria
tio
n
Me
diu
m-t
erm
ex
pe
nd
itu
re e
sti
ma
te
20
11
/12
2
01
2/1
3
20
13
/14
2
01
4/1
5
20
15
/16
2
01
6/1
7
20
17
/18
(R’0
00
)
(R’0
00
)
(R’0
00
)
(R’0
00
)
(R’0
00
)
(R’0
00
)
(R’0
00
)
Con
sum
able
sup
plie
s
-
297
791
-
44
46
49
Con
sum
able
: Sta
tione
ry, p
rintin
g an
d of
fice
supp
lies
2 08
2
3 28
6
1 31
3
856
1 17
2
1 24
2
1 31
7
Ope
ratin
g le
ases
874
267
100
530
27
29
30
Trav
el a
nd s
ubsi
sten
ce
27 6
73
21 8
95
24 8
87
23 0
83
18 8
49
20 0
04
20 9
54
Trai
ning
and
dev
elop
men
t
7 74
7
2 77
9
355
-
328
349
363
Ope
ratin
g pa
ymen
ts
2 96
4
3 20
9
853
79
1 03
0
1 12
6
1 18
5
Ven
ues
and
faci
litie
s
4 87
3
4 16
8
2 78
1
4 82
7
1 82
5
1 94
1
2 03
5
Ren
tal a
nd h
iring
-
-
524
-
293
311
325
Inte
rest
and
ren
t on
land
93
-
-
-
-
-
-
Inte
rest
(In
cl. i
nter
est o
n un
itary
pay
men
ts (
PP
P))
93
-
-
-
-
-
-
Tran
sfer
s an
d s
ub
sid
ies
944
137
1 45
4 58
6
1
659
895
1 67
9 12
5
1 71
3 82
8
2 02
6 07
9
2 15
6 25
0
Pro
vinc
es a
nd m
unic
ipal
ities
789
732
1 17
1 77
9
1
221
441
1 20
1 49
4
1 17
8 86
0
1 42
5 66
2
1 52
5 81
2
Pro
vinc
es
425
819
510
244
610
167
606
919
591
175
761
671
809
385
Pro
vinc
ial R
even
ue F
unds
425
819
510
244
610
167
606
919
591
175
761
671
809
385
Mun
icip
aliti
es
363
913
661
535
611
274
594
575
587
685
663
991
716
427
Mun
icip
al b
ank
acco
unts
363
913
661
535
611
274
594
575
587
685
663
991
716
427
Pub
lic c
orpo
ratio
ns a
nd p
rivat
e en
terp
rises
-
-
-
-
-
-
-
Priv
ate
ente
rpris
es
-
-
-
-
-
-
-
Oth
er tr
ansf
ers
to p
rivat
e en
terp
rises
-
-
-
-
-
-
-
Non
-pro
fit in
stitu
tions
154
370
282
724
438
281
477
481
534
816
600
257
630
270
Hou
seho
lds
35
83
173
150
152
160
168
Soc
ial b
enefi
ts
35
83
173
150
152
160
168
Pay
men
ts f
or
cap
ital
ass
ets
2 59
3
1 91
3
1 53
8
2 77
9
2 36
0
2 48
8
2 61
2
Mac
hine
ry a
nd e
quip
men
t
2 59
3
1 91
3
1 53
8
2 77
9
2 36
0
2 48
8
2 61
2
Tran
spor
t equ
ipm
ent
-
86
5
-
-
-
-
Oth
er m
achi
nery
and
equ
ipm
ent
2 59
3
1 82
7
1 53
3
2 77
9
2 36
0
2 48
8
2 61
2
Pay
men
ts f
or
fin
anci
al a
sset
s
-
3 19
8
-
-
-
-
-
Tota
l
1 16
3 01
5
1 70
4 05
1
1
931
690
1 95
1 29
5
1 99
2 23
4
2 32
4 77
3
2 47
0 05
0

51
Department of Public Works: 2015-2016 Annual Performance Plan
Performance and expenditure trends for Programme 3
The spending focus over the medium-term will be on coordinating the implementation of the
Expanded Public Works Programme which aims to create work opportunities and provide income
support to poor and unemployed through the use of labour intensive methods. The bulk of the
programme's budget goes towards the payment of performance based incentives to eligible
Provinces, municipalities and non-profit organisations to incentivise them to increase job creation
efforts in Expanded Public Works Programmes by shifting towards more labour intensive methods of
construction.
The increase in spending between 2011/12 and 2013/14 was due to the allocation of additional
funding in the form of performance incentives to eligible Provinces, Municipalities and Non-Profit
Organisations for job creation efforts in support of the introduction of Phase II of the programme. Over
4 million work opportunities were created in this period in line with the business plan for Phase II of the
programme. Spending increases in this programme expected over the MTEF period are due to
increased funding for the Non-State Sector to subsidise the sector for additional work opportunities to
be created. The programme aims to create 1 127 186 work opportunities (450 462 full time
equivalents) through the expanded Public Works Programme by up scaling the programme and
improving coordination and performance in all four (4) participating sectors in 2015/16.
Cabinet approved budget reductions of R195 million over the medium-term and will be affected in the
following areas: R98 million on transfers and subsidies for integrated grant to Municipalities, R50
million on transfers and subsidies for social sector incentive grant to Provinces, R24 million on
transfers and subsidies for integrated grant to Provinces and R23 million on goods and services.
The Department received additional funding of R50 million in 2015/16 on transfers and subsidies to the Non-State Sector for the Expanded Public Works Programme.
Personnel numbers are expected to remain at this level over the medium-term.

52
Department of Public Works: 2015-2016 Annual Performance Plan
5. P
rog
ram
me 4
: P
rop
ert
y a
nd
Co
nstr
ucti
on
In
du
str
y P
olicy R
eg
ula
tio
nP
urp
ose o
f th
e p
rog
ram
me:
Pro
mote
the g
row
th a
nd t
ransf
orm
atio
n o
f th
e c
onst
ruct
ion a
nd p
rop
ert
y in
du
strie
s. P
rom
ote
a
sta
ndard
ised a
ppro
ach
and b
est
pra
ctic
e in
const
ruct
ion a
nd im
mova
ble
ass
et
managem
ent
in th
e p
ub
lic s
ect
or.
Ta
ble
19: P
ropert
y and C
onst
ruct
ion Indust
ry P
olic
y R
egula
tion:
Str
ate
gic
obje
ctiv
e a
nnual t
arg
ets
fo
r 2
01
5/1
6 –
20
17
/18
Str
ate
gic
Ob
jec
tiv
e
Str
ate
gic
Pla
n
Ta
rge
t
(5 y
ea
r ta
rge
t)
Ac
tua
l P
erf
orm
an
ce
E
sti
ma
ted
P
erf
orm
an
ce
2
01
4/1
5
Me
diu
m T
erm
Ta
rge
ts
20
11
/12
2
01
2/1
3
20
13
/14
2
01
5/1
6
20
16
/17
2
01
7/1
8
1.
To r
eg
ula
te a
nd
tr
an
sfo
rm t
he
C
on
str
uct
ion
a
nd
Pro
pe
rty
ind
ustr
ies
Pu
blic
Wo
rks
Act
pro
mu
lga
ted
-
-
-
D
raft
si
tua
tion
al
an
aly
sis
on
D
PW
Wh
ite
Pa
pe
rs
com
me
nce
d
Dra
ft P
ub
lic W
ork
s W
hite
P
ap
er
ga
zett
ed
fo
r p
ub
lic
com
me
nts
Dra
ft P
ub
lic W
ork
s B
ill s
ub
mitt
ed
to
C
ab
ine
t fo
r a
pp
rova
l to
pu
blis
h f
or
pu
blic
co
mm
en
t
Pu
blic
Wo
rks
Act
p
rom
ulg
ate
d
2.
Pro
mo
te s
ou
nd
im
mo
vab
le
ass
et
ma
na
ge
me
nt
in
the
pu
blic
se
cto
r
Ne
w le
gis
lativ
e
an
d p
olic
y fr
am
ew
ork
s to
g
ove
rn t
he
im
mo
vab
le
ass
ets
un
de
r th
e
cust
od
ian
sh
ip o
f th
e D
ep
art
me
nt
-
-
-
-
Dra
ft 1
of
Bill
to
a
me
nd
th
e S
tate
L
an
d D
isp
osa
l Act
, 1
96
1 s
ub
mitt
ed
to
M
inis
ter
for
ap
pro
val
to
su
bm
it to
Offi
ce o
f th
e C
hie
f S
tate
La
w
Ad
viso
r (O
CS
LA
) fo
r in
itia
l
scru
tiny
Dra
ft B
ill t
o a
me
nd
th
e S
tate
La
nd
D
isp
osa
l Act
, 1
96
1
sub
mitt
ed
to
P
arlia
me
nt
Am
en
de
d S
tate
La
nd
D
isp
osa
l Act
, 1
96
1
pro
mu
lga
ted
-
-
-
-
Pu
blic
Wo
rks
Ge
ne
ral L
aw
s A
me
nd
me
nt
an
d
Re
pe
al B
ill s
ub
mitt
ed
to
Pa
rlia
me
nt
Pu
blic
Wo
rks
Ge
ne
ral L
aw
s A
me
nd
me
nt
an
d
Re
pe
al A
ct
pro
mu
lga
ted
-

53
Department of Public Works: 2015-2016 Annual Performance Plan
Table
20: P
ropert
y and C
onst
ruct
ion Indust
ry P
olic
y R
egula
tion:
Pro
gra
mm
e p
erf
orm
ance
indic
ato
rs a
nd
an
nu
al t
arg
ets
fo
r 2
01
5/1
6 –
20
17
/18
Pe
rfo
rma
nc
e I
nd
ica
tor
A
ud
ite
d/ A
ctu
al
Pe
rfo
rma
nc
e
Es
tim
ate
d
Pe
rfo
rma
nc
e
20
14
/15
Me
diu
m T
erm
Ta
rge
ts
20
11
/12
2
01
2/1
3
20
13
/14
2
01
5/1
6
20
16
/17
2
01
7/1
8
1.
Pro
mu
lga
tion
of
the
Pu
blic
W
ork
s A
ct
-
-
-
Dra
ft s
itua
tion
al
an
aly
sis
on
DP
W
Wh
ite P
ap
ers
co
mm
en
ced
.
Dra
ft P
ub
lic
Wo
rks
Wh
ite
Pa
pe
r g
aze
tte
d f
or
pu
blic
co
mm
en
t
Dra
ft P
ub
lic W
ork
s B
ill s
ub
mitt
ed
to
C
ab
ine
t fo
r a
pp
rova
l to
pu
blis
h
for
pu
blic
co
mm
en
t Pu
blic
Wo
rks
Act
p
rom
ulg
ate
d
2.
Esta
blis
hm
en
t o
f In
de
pe
nd
en
t D
eve
lop
me
nt
Tru
st (
IDT
) a
s a
n
instit
utio
n o
f G
ove
rnm
en
t
-
-
Dra
ft I
DT
B
usi
ne
ss C
ase
d
eve
lop
ed
in J
un
e
20
13
fo
r co
nsu
ltatio
n w
ith
key
sta
keh
old
ers
.
F
ollo
win
g t
he
co
nsu
ltatio
n,
the
ID
T B
usi
ne
ss
Ca
se (
ma
nd
ate
) w
as
revi
sed
an
d a
H
R M
od
el (
Dra
ft
1)
alig
ne
d t
o t
he
re
vise
d B
usi
ne
ss
Ca
se w
as
de
velo
pe
d.
IDT
Bu
sin
ess
Ca
se
sub
mitt
ed
to
DP
SA
fo
r a
pp
rova
l
IDT
Bu
sin
ess
Ca
se
to e
sta
blis
h I
DT
as
an
inst
itutio
n o
f G
ove
rnm
en
t su
bm
itte
d t
o C
ab
ine
t
for
en
do
rse
me
nt
IDT
est
ab
lish
ed
as
an
inst
itutio
n o
f
Go
vern
me
nt
-
3.
Asse
ssm
en
t o
f co
ntr
act
or
de
velo
pm
en
t p
rog
ram
me
-
-
-
-
Bi-
an
nu
al c
on
tra
cto
r d
eve
lop
me
nt
imp
lem
en
tatio
n
rep
ort
s
sub
mitt
ed
to
M
inis
ter
for
con
sid
era
tion
Bi-
an
nu
al
co
ntr
act
or
de
velo
pm
en
t im
ple
me
nta
tion
re
po
rts
sub
mitt
ed
to
Min
iste
r fo
r co
nsi
de
ratio
n
Bi-
an
nu
al
co
ntr
act
or
de
velo
pm
en
t im
ple
me
nta
tion
re
po
rts
sub
mitt
ed
to
Min
iste
r fo
r co
nsi
de
ratio
n
4
. A
pp
rove
d D
PW
Pro
pe
rty
Ma
na
ge
me
nt
Em
po
we
rme
nt
Po
licy
-
-
-
-
Fin
al d
raft
DP
W
Pro
pe
rty
Ma
na
ge
me
nt
Em
po
we
rme
nt
Po
licy
sub
mitt
ed
to
M
inis
ter
for
ap
pro
val
-
-

54
Department of Public Works: 2015-2016 Annual Performance Plan
Pe
rfo
rma
nc
e I
nd
ica
tor
A
ud
ite
d/ A
ctu
al
Pe
rfo
rma
nc
e
Es
tim
ate
d
Pe
rfo
rma
nc
e
20
14
/15
Me
diu
m T
erm
Ta
rge
ts
20
11
/12
2
01
2/1
3
20
13
/14
2
01
5/1
6
20
16
/17
2
01
7/1
8
5.
Revi
ew
of
legis
latio
n a
nd
guid
elin
es
to m
anage t
he
imm
ova
ble
ass
ets
under
the c
ust
odia
nsh
ip o
f th
e
Depart
ment appro
ved.
-
-
-
-
Dra
ft 1
of
Bill
to
am
end the S
tate
Land D
isposa
l Act
, 1961 s
ubm
itted to
Min
iste
r fo
r appro
val
to
subm
it to
OC
SLA
fo
r in
itial s
crutin
y.
Dra
ft B
ill to a
mend
the S
tate
Land
Dis
posa
l Act
, 1961
su
bm
itted to
Parlia
ment.
Am
ended S
tate
Land D
isposa
l Act
, 1961 p
rom
ulg
ate
d.
-
-
-
-
Public
Work
s G
enera
l Law
s A
mendm
ent and
Repeal B
ill
subm
itted to
Parlia
ment
Public
Work
s G
enera
l Law
s A
mendm
ent and
Repeal A
ct
pro
mulg
ate
d
-
-
-
-
-
Revi
sed G
uid
elin
es
on U
ser
and
Cust
odia
n A
sset
Managem
ent P
lans
subm
itted to M
inis
ter
for
appro
val.
Best
pra
ctic
e
guid
elin
es
and
standard
s (P
art
I)
deve
loped to g
ive
effect
to
imple
menta
tion o
f G
IAM
A.
Best
pra
ctic
e
guid
elin
es
and
standard
s (P
art
II)
deve
loped to g
ive
effect
to
imple
menta
tion o
f G
IAM
A.

55
Department of Public Works: 2015-2016 Annual Performance Plan
Ta
ble
21: P
ropert
y and C
onst
ruct
ion Indust
ry P
olic
y R
egula
tions:
Quart
erly
targ
ets
for
2015/1
6
Pe
rfo
rma
nc
e I
nd
ica
tor
Re
po
rtin
g
pe
rio
d
An
nu
al
Ta
rge
t
20
15
/16
Qu
art
erl
y T
arg
ets
1s
t
2n
d
3rd
4
th
1.
Dra
ft P
ub
lic W
ork
s W
hite
P
ap
er
de
velo
pe
d Q
ua
rte
rly
D
raft
Pu
blic
Wo
rks
Wh
ite P
ap
er
ga
zett
ed
fo
r p
ub
lic
com
me
nts
.
Re
sea
rch
on
id
en
tifie
d t
he
me
s u
nd
ert
ake
n.
Dra
ft 1
of
Pu
blic
W
ork
s W
hite
Pa
pe
r co
nsu
lted
with
st
ake
ho
lde
rs
Dra
ft 2
of
P
ub
lic
Wo
rks
W
hite
Pa
pe
r d
eve
lop
ed
.
Dra
ft P
ub
lic W
ork
s
Wh
ite P
ap
er
ga
ze
tte
d f
or
pu
blic
co
mm
en
ts.
2.
De
velo
pe
d B
usi
ne
ss ca
se t
o
est
ab
lish
In
de
pe
nd
en
t D
eve
lop
me
nt T
rust
(ID
T)
as
an
inst
itutio
n o
f G
ove
rnm
en
t
Qu
art
erly
ID
T B
usi
ne
ss C
ase
to
est
ab
lish
ID
T a
s a
n in
stitu
tion
of
Go
vern
me
nt
sub
mitt
ed
to
Ca
bin
et
for
en
do
rse
me
nt
-
Bu
sin
ess C
ase
su
bm
itte
d t
o D
PS
A
for
ap
pro
va
l to
wa
rds
est
ab
lish
ing
ID
T a
s
an
inst
itutio
n o
f G
ove
rnm
en
t
-
Bu
sin
ess c
ase
e
sta
blis
hin
g I
DT
as
an
instit
utio
n o
f G
ove
rnm
en
t su
bm
itte
d t
o
Ca
bin
et
for
en
do
rse
me
nt
3.
Ass
ess
me
nt
of
con
tra
cto
r d
eve
lop
me
nt
pro
gra
mm
e
B
i-a
nn
ua
lly B
i-a
nn
ua
l co
ntr
act
or
de
velo
pm
en
t im
ple
me
nta
tion
re
po
rts
sub
mitt
ed
to
M
inis
ter
for
con
sid
era
tion
.
-
Co
nso
lida
ted
co
ntr
acto
r d
eve
lop
me
nt
imp
lem
en
tatio
n
rep
ort
(2
01
4/1
5 F
Y)
sub
mitt
ed
to
M
inis
ter
for
con
sid
era
tion
.
-
Co
ntr
acto
r im
ple
me
nta
tion
re
port
(A
pril –
Septe
mber
2015)
subm
itte
d to
Min
iste
r
for
co
nsid
era
tion
.
4.
Ap
pro
ved
DP
W P
rop
ert
y M
an
ag
em
en
t E
mp
ow
erm
en
t P
olic
y Q
ua
rte
rly
Fin
al d
raft
DP
W
Pro
pe
rty
Ma
na
ge
me
nt
Em
po
we
rme
nt
Po
licy
sub
mitt
ed
to
Min
iste
r
for
ap
pro
val.
-
Dra
ft 1
of D
PW
P
rop
ert
y
Ma
na
ge
me
nt
Em
po
we
rme
nt
Po
licy
de
ve
lop
ed
.
Dra
ft
2
of D
PW
P
rop
ert
y
Ma
na
ge
me
nt
Em
po
we
rme
nt
Po
licy
de
ve
lop
ed
Fin
al d
raft
DP
W
Pro
pe
rty
Ma
na
ge
me
nt
Em
po
we
rme
nt
Po
licy s
ub
mitt
ed
to
M
inis
ter
for
ap
pro
va
l.
5.
De
velo
pe
d D
raft
Bill
to
ma
na
ge
the
dis
po
sal o
f im
mo
vab
le a
sse
ts u
nd
er
the
cu
sto
dia
nsh
ip o
f th
e
De
pa
rtm
en
t
Qu
art
erly
Dra
ft
1 o
f B
ill t
o
am
en
d t
he
Sta
te
La
nd
Dis
po
sal A
ct,
19
61
su
bm
itte
d t
o
Min
iste
r fo
r a
pp
rova
l
to s
ub
mit
to O
CS
LA
fo
r in
itia
l scr
utin
y
Dra
ft 1
of
dis
cuss
ion
d
ocu
me
nt
on
th
e
am
en
dm
en
t o
f th
e
Sta
te L
an
d
Dis
po
sal A
ct,
19
61
d
eve
lop
ed
Dra
ft 2
of
dis
cuss
ion
do
cum
en
t o
n t
he
a
me
nd
me
nt
of
the
S
tate
La
nd
D
isp
osa
l Act,
19
61
d
eve
lop
ed
Re
gu
lato
ry I
mp
act
Asse
ssm
en
t su
bm
itte
d t
o
Min
iste
r fo
r a
pp
rova
l of
the
p
refe
rre
d o
ptio
n.
Dra
ft 1
of
Bill
to
a
me
nd
th
e S
tate
L
an
d D
isp
osa
l Act,
1
96
1 s
ub
mitt
ed
to
M
inis
ter
for
ap
pro
va
l to
su
bm
it to
OC
SL
A f
or
initi
al
scru
tiny

56
Department of Public Works: 2015-2016 Annual Performance Plan
Perf
orm
an
ce In
dic
ato
r
Rep
ort
ing
peri
od
An
nu
al Targ
et
2015/1
6
Qu
art
erl
y T
arg
ets
1st
2
nd
3
rd
4th
6.
De
velo
pe
d D
raft
Bill
to
re
pe
al o
r a
me
nd
leg
isla
tion
a
dm
inis
tere
d b
y th
e
De
pa
rtm
en
t th
at
is
inco
nsis
ten
t w
ith
th
e
Co
nst
itu
tion
or
ob
so
lete
Qu
art
erly
P
ub
lic W
ork
s G
en
era
l La
ws
Am
en
dm
en
t a
nd
R
ep
ea
l B
ill s
ub
mitt
ed
to
Pa
rlia
me
nt
Dra
ft P
ub
lic W
ork
s G
en
era
l La
ws
Am
en
dm
en
t a
nd
R
ep
ea
l Bill
g
aze
tte
d
for
pu
blic
co
mm
en
t
Pu
blic
Wo
rks
Ge
ne
ral L
aw
s A
me
nd
me
nt
an
d
Re
pe
al B
ill
ap
pro
ved
by
Min
iste
r fo
r su
bm
issi
on
to
C
ab
ine
t
Min
iste
r’s
inte
ntio
n
to s
ub
mit
the
Pu
blic
W
ork
s G
en
era
l L
aw
s A
me
nd
me
nt
an
d R
ep
ea
l Bill
to
P
arlia
me
nt
ga
zett
ed
Pa
rtic
ipa
tion
in
Pa
rlia
me
nta
ry
pro
cess
7.
Re
vie
we
d G
IAM
A B
est
p
ract
ice
gu
ide
line
s a
nd
st
an
da
rds
to m
an
ag
e
imm
ova
ble
asse
ts.
Qu
art
erly
R
evi
se
d G
uid
elin
es
on
Use
r a
nd
C
ust
od
ian
Ass
et
Ma
na
ge
me
nt
Pla
ns
su
bm
itte
d t
o M
inis
ter
for
ap
pro
val.
Re
vise
d G
uid
elin
es
on
Use
r a
nd
C
ust
od
ian
Ass
et
Ma
na
ge
me
nt
Pla
ns
de
velo
pe
d f
or
con
sulta
tion
with
ke
y st
ake
ho
lde
rs
(Na
tion
al a
nd
Pro
vin
cia
l)
Co
nsu
ltatio
n w
ith
key
sta
keh
old
ers
co
ncl
ud
ed
Re
vise
d G
uid
elin
es
sub
mitt
ed
to
Te
chn
ica
l M
inM
ec
for
en
do
rse
me
nt
Re
vise
d G
uid
elin
es
on
Use
r a
nd
C
ust
od
ian
Ass
et
Ma
na
ge
me
nt
Pla
ns
sub
mitt
ed
to
M
inis
ter
for
ap
pro
val

57
Department of Public Works: 2015-2016 Annual Performance Plan
5.1
Reco
ncilin
g p
erf
orm
an
ce t
arg
ets
wit
h t
he B
ud
get
an
d M
TE
F
Exp
enditu
re e
stim
ate
s
Ta
ble
22: E
xpenditu
re e
stim
ate
s fo
r P
rogra
mm
e 4
: P
ropert
y and C
onst
ruct
ion I
ndust
ry P
olic
y R
eg
ula
tion
s
Pro
gra
mm
es
Au
dit
ed
ou
tco
me
A
dju
ste
d
ap
pro
pri
ati
on
M
ed
ium
-te
rm e
xp
en
dit
ure
es
tim
ate
20
11
/12
2
01
2/1
3
20
13
/14
2
01
4/1
5
20
15
/16
2
01
6/1
7
20
17
/18
(R’0
00
)
(R’0
00
)
(R’0
00
)
(R’0
00
)
(R’0
00
)
(R’0
00
)
(R’0
00
)
Con
stru
ctio
n P
olic
y D
evel
opm
ent P
rogr
amm
e
21 4
88
17
953
19 0
83
22
766
24
292
26
163
27
050
Pro
pert
y P
olic
y D
evel
opm
ent P
rogr
amm
e
12 8
65
8 90
5
13 6
75
10
821
11
350
12
456
13
534
Sec
tor
Res
earc
h an
d A
naly
sis
-
-
-
-
-
-
-
Con
stru
ctio
n In
dust
ry D
evel
opm
ent B
oard
65 9
59
67 6
14
72 3
61
77 2
12
65 6
26
62 0
59
89 9
84
Cou
ncil
for
the
Bui
lt E
nviro
nmen
t
28 6
59
28 1
46
37 9
59
41 5
72
41 9
94
43 4
13
48 5
68
Inde
pend
ent D
evel
opm
ent T
rust
150
000
50 8
00
100
000
50 0
00
50 0
00
-
-
Con
stru
ctio
n E
duca
tion
and
Trai
ning
Aut
horit
y
278
1 26
0
1 46
8
1 91
5
1 77
5
1 89
3
2 01
3
Pro
pert
y M
anag
emen
t Tra
ding
Ent
ity
5 06
6 81
7
4 74
9 85
8
3
061
643
3 31
7 15
5
3 58
4 65
2
3 79
0 17
2
4 01
3 34
7
Ass
ista
nce
to O
rgan
isat
ions
for
the
Pre
serv
atio
n of
N
atio
nal M
emor
ials
12 9
56
15 4
36
17 5
55
22 5
48
23 2
73
24 5
06
25 7
31
Tota
l
5 35
9 02
2
4 93
9 97
2
3
323
744
3 54
3 98
9
3 80
2 96
2
3 96
0 66
2
4 22
0 22
7

58
Department of Public Works: 2015-2016 Annual Performance Plan
Eco
no
mic
cla
ssifi
cati
on
Au
dit
ed
ou
tco
me
A
dju
ste
d
ap
pro
pri
ati
on
M
ed
ium
-term
exp
en
dit
ure
esti
mate
2011/1
2
2012/1
3
2013/1
4
2014/1
5
2015/1
6
2016/1
7
2017/1
8
(R’0
00)
(R
’000)
(R
’000)
(R
’000)
(R
’000)
(R
’000)
(R
’000)
Cu
rren
t p
aym
ents
1 61
6 60
2
1 58
0 47
5
1
79
8 39
7
2
196
305
35 3
30
38 3
00
40 2
50
Com
pens
atio
n of
em
ploy
ees
957
145
1
031
562
1
109
856
1 26
0 07
9
14
248
15
338
16
096
Sal
arie
s an
d w
ages
82
2 59
4
88
6 14
1
957
241
1 08
7 71
8
12
204
13
162
13
783
Soc
ial c
ontr
ibut
ions
13
4 55
1
14
5 42
1
152
615
17
2 36
1
2
044
2 17
6
2
313
Goo
ds a
nd s
ervi
ces
658
286
548
913
68
8 54
1
936
226
21 0
82
22 9
62
24 1
54
Adm
inis
trat
ive
fees
7
-
-
13
6
7
7
Adv
ertis
ing
6
880
2
734
2
502
3 78
6
456
48
1
505
Ass
ets
less
than
the
capi
talis
atio
n th
resh
old
6
550
3 03
9
8
566
32
34
35
Aud
it co
sts:
Ext
erna
l
20
519
29 2
31
38
467
21 4
54
-
-
-
Bur
sarie
s: E
mpl
oyee
s
-
-
2
609
-
-
-
Cat
erin
g: D
epar
tmen
tal a
ctiv
ities
1
111
942
1
647
47
4
157
16
6
174
Com
mun
icat
ion
(G&
S)
13 3
41
13
282
15 2
87
19
966
201
21
3
224
Com
pute
r se
rvic
es
5
605
72
150
23
382
29
31
32
Con
sulta
nts
and
prof
essi
onal
ser
vice
s: B
usin
ess
and
advi
sory
ser
vice
s
4 19
1
14
480
46
955
5
743
2 33
7
3
262
3 06
6
Con
sulta
nts
and
prof
essi
onal
ser
vice
s: In
fras
truc
ture
and
pl
anni
ng
6
867
3
445
8 79
7
7
155
17
0
502
1 09
6
Con
sulta
nts
and
prof
essi
onal
ser
vice
s: L
egal
cos
ts
-
-
81
-
-
-
-
Con
trac
tors
48 5
75
9
-
2
388
14
3
150
15
7
Age
ncy
and
supp
ort /
out
sour
ced
serv
ices
1
596
-
-
174
486
12 5
69
13 3
17
13 7
65
Ent
erta
inm
ent
148
163
15
1
103
26
19
7
207
Fle
et s
ervi
ces
(incl
udin
g go
vern
men
t mot
or tr
ansp
ort)
17 9
13
18 7
33
14 6
96
14 1
93
-
-
-
Inve
ntor
y: C
loth
ing
mat
eria
l and
acc
esso
ries
-
-
4 23
6
-
-
-
-
Inve
ntor
y: F
ood
and
food
sup
plie
s
4
-
-
12
-
-
-
Inve
ntor
y: F
uel,
oil a
nd g
as
7 62
0
9 10
3
7 56
8
9 00
4
-
-
-
Inve
ntor
y: L
earn
er a
nd te
ache
r
supp
ort m
ater
ial
-
-
-
433
-
-
-
Inve
ntor
y: M
ater
ials
and
sup
plie
s
1 19
4
1 00
8
840
1 15
9
285
300
315

59
Department of Public Works: 2015-2016 Annual Performance Plan
Ec
on
om
ic c
las
sifi
ca
tio
n A
ud
ite
d o
utc
om
e
Ad
jus
ted
a
pp
rop
ria
tio
n
Me
diu
m-t
erm
ex
pe
nd
itu
re e
sti
ma
te
20
11
/12
2
01
2/1
3
20
13
/14
2
01
4/1
5
20
15
/16
2
01
6/1
7
20
17
/18
(R’0
00
)
(R’0
00
)
(R’0
00
)
(R’0
00
)
(R’0
00
)
(R’0
00
)
(R’0
00
)
Inve
ntor
y: M
edic
al s
uppl
ies
-
5
-
11
-
-
-
Inve
ntor
y: O
ther
sup
plie
s
11
996
13 2
28
94
14
974
5
6
6
Con
sum
able
sup
plie
s
-
-
11
16
4
-
-
-
-
Con
sum
able
: Sta
tione
ry, p
rintin
g an
d of
fice
supp
lies
4
622
4
245
4 78
0
4
750
25
2
255
26
8
Ope
ratin
g le
ases
20
4 94
0
13
6 30
6
216
766
22
9 86
7
178
17
2
180
Tran
spor
t pro
vide
d: D
epar
tmen
tal a
ctiv
ity
25
4 88
2
25
4 30
5
251
890
34
2 91
7
-
-
-
Trav
el a
nd s
ubsi
sten
ce
-
-
-
119
12
0
111
11
7
Trai
ning
and
dev
elop
men
t
36
883
37 5
36
51
339
42 7
22
2 16
6
2
284
2 39
8
Ope
ratin
g pa
ymen
ts
2 69
3
2 94
5
2
827
5 00
4
278
29
3
308
Pro
pert
y pa
ymen
ts
5 67
5
3 48
1
3
039
1 63
4
413
55
4
582
Ven
ues
and
faci
litie
s
1 01
8
32
0
2
213
1 30
2
1
259
62
7
712
Ren
tal a
nd h
iring
-
2 79
0
11
-
-
-
-
Inte
rest
and
ren
t on
land
1 17
1
-
-
-
-
-
-
Inte
rest
(In
cl. i
nter
est o
n un
itary
pay
men
ts (
PP
P))
1
171
-
-
-
-
-
-
Tran
sfer
s an
d s
ub
sid
ies
2
704
108
2
623
998
92
7 55
0
866
579
3 76
7 52
0
3
92
2 24
3
4
179
853
Pro
vinc
es a
nd m
unic
ipal
ities
1
803
230
1
798
173
2
15
Pro
vinc
es
1
803
230
1
798
170
-
-
Pro
vinc
ial R
even
ue F
unds
1
803
230
1
798
170
-
-
Mun
icip
aliti
es
-
3
2
15
Mun
icip
al b
ank
acco
unts
-
3
2
15
Dep
artm
enta
l age
ncie
s an
d ac
coun
ts
725
085
743
869
794
214
793
816
3 69
4 04
7
3 89
7 53
7
4 15
3 91
2
Dep
artm
enta
l age
ncie
s (n
on-b
usin
ess
entit
ies)
725
085
743
869
794
214
793
816
3 69
4 04
7
3 89
7 53
7
4 15
3 91
2
For
eign
gov
ernm
ents
and
inte
rnat
iona
l org
anis
atio
ns
12 9
56
15 4
36
17 5
55
22 5
48
23 2
73
24 5
06
25 7
31
Pub
lic c
orpo
ratio
ns a
nd p
rivat
e en
terp
rises
150
000
50 8
00
100
000
50 0
00
50 0
00
-
-
Pub
lic c
orpo
ratio
ns
150
000
50 8
00
100
000
50 0
00
50 0
00
-
-
Oth
er tr
ansf
ers
to p
ublic
cor
pora
tions
150
000
50 8
00
100
000
50 0
00
50 0
00
-
-

60
Department of Public Works: 2015-2016 Annual Performance Plan
Ec
on
om
ic c
las
sifi
ca
tio
n A
ud
ite
d o
utc
om
e
Ad
jus
ted
a
pp
rop
ria
tio
n
Me
diu
m-t
erm
ex
pe
nd
itu
re e
sti
ma
te
20
11
/12
2
01
2/1
3
20
13
/14
2
01
4/1
5
20
15
/16
2
01
6/1
7
20
17
/18
(R’0
00
)
(R’0
00
)
(R’0
00
)
(R’0
00
)
(R’0
00
)
(R’0
00
)
(R’0
00
)
Non
-pro
fit in
stitu
tions
9 43
1
9 90
3
10
398
-
-
-
-
Hou
seho
lds
3
406
5
817
5 38
1
200
20
0
200
21
0
Soc
ial b
enefi
ts
3 38
6
5 79
7
5
381
20
0
200
20
0
210
Oth
er tr
ansf
ers
to h
ouse
hold
s
20
20
-
-
Pay
men
ts f
or
cap
ital
ass
ets
1
036
287
735
499
59
7 79
7
481
105
11
2
119
12
4
Bui
ldin
gs a
nd o
ther
fixe
d st
ruct
ures
1
011
408
713
003
56
7 36
5
41
6 06
5
Bui
ldin
gs
1
011
408
713
003
567
365
416
065
Mac
hine
ry a
nd e
quip
men
t
24
798
22 1
52
30
300
64 8
62
11
2
119
12
4
Tran
spor
t equ
ipm
ent
-
5
913
132
Oth
er m
achi
nery
and
equ
ipm
ent
24 7
98
16
239
30 1
68
64
862
112
11
9
124
Sof
twar
e an
d ot
her
inta
ngib
le a
sset
s
81
34
4
132
17
8
Pay
men
ts f
or
fin
anci
al a
sset
s
2 02
5
-
-
-
-
-
-
Tota
l
5 35
9 02
2
4 93
9 97
2
3
32
3 74
4
3
543
989
3 80
2 96
2
3
960
662
4 22
0 22
7

61
Department of Public Works: 2015-2016 Annual Performance Plan
Performance and expenditure trends for Programme 4
The spending focus over the medium-term will be on promoting the growth and transformation of the
property and construction industries.
Expenditure decreased from R5.4 billion in 2011/12 to R3.5 billion in 2014/15 at an average annual
rate of negative 12.9 per cent. Expenditure decrease was mainly due to phasing out of the devolution
of property rates fund grant to Provinces as it has formed part of the Provincial equitable share from
the beginning of 2013/14 as well as under spending on infrastructure budget between 2012/13 and
2013/4 period.
Between 2015/16 and 2017/18, expenditure on transfers and subsidies is projected to increase at an
average rate of 69 per cent in line with the operationalisation of Property Management Trading Entity.
Current payments are projected to decrease at an average of 73.6 per cent al in line with the
operationalisation of Property Management Trading Entity.
Personnel numbers are expected to increase over the medium-term in line with the filling of the critical positions in this programme.

62
Department of Public Works: 2015-2016 Annual Performance Plan
6. P
rog
ram
me 5
: P
resti
ge P
olicy
Pu
rpo
se o
f th
e p
rog
ram
me:
Pro
vide n
orm
s and s
tandard
s fo
r th
e p
rest
ige a
ccom
modatio
n p
ort
folio
an
d m
ee
t th
e p
roto
col
responsi
bili
ties
for
Sta
te funct
ions.
Table
23: P
rest
ige: S
trate
gic
obje
ctiv
e a
nnual t
arg
ets
for
2015/1
6 –
2017/1
8
Str
ate
gic
Ob
jec
tiv
e
Str
ate
gic
Pla
n
Ta
rge
t
(5 y
ea
r ta
rge
t)
Au
dit
ed
/ A
ctu
al
Pe
rfo
rma
nc
e
Es
tim
ate
d
Pe
rfo
rma
nc
e
20
14
/15
Me
diu
m T
erm
Ta
rge
ts
20
11
/12
2
01
2/1
3
20
13
/14
2
01
5/1
6
20
16
/17
2
01
7/1
8
1.
To d
eve
lop
, m
on
ito
r a
nd
imp
rove
p
rest
ige
po
licy
fra
me
wo
rks
an
nu
ally
7 A
pp
rove
d P
olic
y F
ram
ew
ork
s f
or
Pre
stig
e
-
-
-
3 A
pp
rove
d P
olic
y F
ram
ew
ork
s fo
r P
rest
ige
2 Ap
pro
ved
P
olic
y F
ram
ew
ork
s fo
r P
rest
ige
2 Ap
pro
ved
Po
licy
Fra
me
wo
rks
for
Pre
stig
e
3 A
pp
rove
d P
olic
y F
ram
ew
ork
s fo
r P
rest
ige
2
To p
rovi
de
mo
vab
le
ass
ets
(o
ffice
an
d
resi
de
ntia
l) a
nd
st
ruct
ure
s t
o
Pre
stig
e c
lien
ts
Mo
vab
le a
sse
ts
(offi
ce a
nd
re
sid
en
tial)
pro
vid
ed
to
P
rest
ige
clie
nts
w
ithin
60
da
ys o
f re
ceip
t o
f re
qu
est
M
ova
ble
ass
ets
p
rovi
de
d w
ith 1
10
w
ork
ing
da
ys o
f re
ceip
t o
f re
qu
est
.
Mo
vab
le
ass
ets
(o
ffice
a
nd
re
sid
en
tial)
pro
vid
ed
to
P
rest
ige
cl
ien
ts w
ithin
6
0 d
ays
of
rece
ipt
of
req
ue
st
Mo
vab
le a
sse
ts
(offi
ce a
nd
re
sid
en
tial)
pro
vid
ed
to
P
rest
ige
cl
ien
ts
with
in 6
0 d
ays
of
rece
ipt
of
req
ue
st
Mo
vab
le a
sse
ts
(offi
ce a
nd
re
sid
en
tial)
pro
vid
ed
to
P
rest
ige
cl
ien
ts
with
in 6
0 d
ays
of
rece
ipt
of
req
ue
st
--
-

63
Department of Public Works: 2015-2016 Annual Performance Plan
Ta
ble
24: P
rest
ige P
olic
y: P
rogra
mm
e p
erf
orm
ance
indic
ato
rs a
nd a
nnual t
arg
ets
for
2015/1
6 –
20
17
/18
Pe
rfo
rma
nc
e
Ind
ica
tor
Au
dit
ed
/ A
ctu
al
Pe
rfo
rma
nc
e
Es
tim
ate
d
Pe
rfo
rma
nc
e
20
14
/15
Me
diu
m-T
erm
Ta
rge
ts
20
11
/12
2
01
2/1
3
20
13
/14
2
01
5/1
6
20
16
/17
2
01
7/1
8
1.
De
velo
pe
d
Pre
stig
e n
orm
s a
nd
sta
nd
ard
s
-
-
-
No
rms
an
d
sta
nd
ard
s fo
r p
rovi
sio
n o
f a
cco
mm
od
atio
n
for
Pre
sid
en
t,
De
pu
ty P
resi
de
nt
an
d M
em
be
rs o
f th
e E
xecu
tive
d
eve
lop
ed
·
No
rms
an
d
sta
nd
ard
s fo
r ca
teg
ory
III
clie
nts
a
pp
rove
d
by
Pa
rlia
me
nt
·
Pre
stig
e n
orm
s a
nd
sta
nd
ard
s a
da
pte
d f
or
Pro
vin
cia
l Pu
blic
W
ork
s
No
rms
an
d
sta
nd
ard
s d
eve
lop
ed
fo
r P
arlia
me
nta
ry
Pre
cin
ct a
nd
U
nio
n B
uild
ing
s
Re
vie
w o
f th
e
imp
lem
en
tatio
n o
f th
e P
rest
ige
no
rms
an
d s
tan
da
rds
(c
ate
gory
i – iv
)
2.
De
velo
pe
d
Pre
stig
e p
olic
ies
-
-
-
·
Po
licy
on
th
e
allo
catio
n a
nd
o
ccu
pa
tion
of
Sta
te-o
wn
ed
h
ou
ses
de
velo
pe
d
·
Po
licy
on
th
e
imp
lem
en
tatio
n
of
secu
rity
m
ea
sure
s d
eve
lop
ed
·
Po
licy
gu
ide
line
s o
n
the
insta
llatio
n,
ma
na
ge
me
nt
an
d
ma
inte
na
nce
of
secu
rity
in
fra
stru
ctu
re a
t N
atio
na
l Ke
y P
oin
ts
de
velo
pe
d
·
Po
licy
Gu
ide
line
s o
n t
he
im
ple
me
nta
tion
of
Se
curity
M
ea
sure
s fo
r M
em
be
rs o
f th
e
Jud
icia
ry
de
ve
lop
ed
Po
licy
on
use
of
Pre
stig
e f
aci
litie
s b
y G
en
era
l Pu
blic
(U
nio
n B
uild
ing
g
rou
nd
s)
de
velo
pe
d
·
Po
licy
on
a
lloca
tion
an
d
occ
up
atio
n o
f S
tate
-ow
ne
d
ho
use
s
revi
ew
ed
·
Po
licy
on
im
ple
me
nta
tion
o
f se
curity
m
ea
sure
s
revi
ew
ed
3.
Sig
ne
d S
erv
ice
L
eve
l Ag
ree
me
nt
-
-
-
-
SL
A w
ith
Pa
rlia
me
nt
an
d
Pre
sid
en
cy s
ign
ed
SL
A
with
P
arlia
me
nt
an
d
Pre
sid
en
cy
revi
ew
ed
S
LA
with
P
resi
de
ncy
an
d
Pa
rlia
me
nt
revi
ew
ed
4.
Nu
mb
er
of
pre
stig
e e
ven
ts
su
pp
ort
ed
with
m
ova
ble
str
uct
ure
s 1
0 P
rest
ige
e
ven
ts
sup
po
rte
d w
ith
mo
va
ble
st
ruct
ure
s
1
7 P
rest
ige
e
ve
nts
su
pp
ort
ed
with
m
ova
ble
str
uct
ure
s
1
2 P
rest
ige
e
ven
ts
sup
po
rte
d w
ith
mo
vab
le
stru
ctu
res
1
3 P
rest
ige
eve
nts
su
pp
ort
ed
with
m
ova
ble
st
ruct
ure
s
1
5 P
rest
ige
eve
nts
su
pp
ort
ed
with
m
ova
ble
str
uct
ure
s
15
Pre
stig
e e
ven
ts
sup
po
rte
d w
ith
mo
vab
le
stru
ctu
res
1
5 P
rest
ige
eve
nts
su
pp
ort
ed
with
m
ova
ble
str
uct
ure
s

64
Department of Public Works: 2015-2016 Annual Performance Plan
Perf
orm
an
ce
Ind
icato
r A
ud
ited
/ A
ctu
al P
erf
orm
an
ce
E
sti
mate
d
Perf
orm
an
ce
2014/1
5
Med
ium
-Term
Targ
ets
2011/1
2
2012/1
3
2013/1
4
2015/1
6
2016/1
7
2017/1
8
5.
Tu
rna
rou
nd
tim
e
for
the
pro
visi
on
o
f m
ova
ble
ass
ets
to P
rest
ige
clie
nts
-
-
-
Mo
vab
le a
sse
ts
(offic
e a
nd
re
sid
en
tial)
pro
vid
ed
to
P
rest
ige
clie
nts
w
ithin
11
0 d
ays
of
rece
ipt
of
req
ue
st
Mo
vab
le a
sse
ts
(offic
e a
nd
re
sid
en
tial)
pro
vid
ed
to
P
rest
ige
clie
nts
w
ithin
60
da
ys
of
rece
ipt
of
req
ue
st
Mo
vab
le a
sse
ts
(offic
e a
nd
re
sid
en
tial)
pro
vid
ed
to
P
rest
ige
clie
nts
w
ithin
60
da
ys
Mo
vab
le a
sse
ts
(offic
e a
nd
re
sid
en
tial)
mo
vab
le a
sse
ts
pro
vid
ed
to
P
rest
ige
clie
nts
w
ithin
60
da
ys
6.
Mo
nito
rin
g o
f P
restig
e
infr
astr
uct
ure
b
ud
ge
t e
xpe
nd
itu
re
R3
65
87
6 0
00
P
restig
e
infr
astr
uct
ure
e
xpe
nd
itu
re
rep
ort
ed
R11
8 8
20
00
0
Pre
stig
e
infr
astr
uct
ure
e
xpe
nd
iture
re
po
rte
d
R5
7 6
26
00
0
Pre
stig
e
infr
ast
ruct
ure
e
xpe
nd
iture
re
po
rte
d
R7
0
00
0
00
0
Pre
stig
e
infr
ast
ruct
ure
e
xpe
nd
iture
re
po
rte
d
4 q
ua
rte
rly
infr
ast
ruct
ure
e
xpe
nd
iture
re
po
rts
on
Pre
stig
e
com
ple
ted
4 q
ua
rte
rly
infr
ast
ruct
ure
e
xpe
nd
iture
re
po
rts
on
P
rest
ige
co
mp
lete
d
4 q
ua
rte
rly
infr
ast
ruct
ure
e
xpe
nd
iture
re
po
rts
on
Pre
stig
e
com
ple
ted

65
Department of Public Works: 2015-2016 Annual Performance Plan
Ta
ble
25: P
rest
ige P
olic
y: Q
uart
erly
targ
ets
for
2015/1
6
Perf
orm
an
ce
Ind
icato
r R
ep
ort
ing
p
eri
od
A
nn
ual Targ
et
2015/1
6
Qu
art
erl
y T
arg
ets
1s
t
2n
d
3rd
4
th
1.
De
velo
pe
d
Pre
stig
e n
orm
s a
nd
sta
nd
ard
s
Qu
art
erly
N
orm
s a
nd
sta
nd
ard
s fo
r ca
teg
ory
III
cl
ien
ts
ap
pro
ved
by
Pa
rlia
me
nt
Re
sea
rch
re
po
rt o
n
Pre
stig
e n
orm
s a
nd
st
an
da
rds
for
cate
go
ry I
II
clie
nts
co
mp
lete
d
1st
D
raft
no
rms
an
d
sta
nd
ard
s fo
r ca
teg
ory
III
clie
nts
co
mp
lete
d
Fin
al D
raft
no
rms a
nd
sta
nd
ard
s f
or
ca
teg
ory
III
clie
nts
co
mp
lete
d
No
rms a
nd
sta
nd
ard
s
for
ca
teg
ory
III
clie
nts
a
pp
rove
d b
y
Pa
rlia
me
nt
Pre
stig
e n
orm
s a
nd
st
an
da
rds
ad
ap
ted
fo
r P
rovi
nci
al P
ub
lic
Wo
rks
Re
sea
rch
re
po
rt o
n
Pre
stig
e n
orm
s a
nd
st
an
da
rds
for
Pro
vin
cia
l Pu
blic
W
ork
s co
mp
lete
d
Dra
ft n
orm
s a
nd
st
an
da
rds
for
Pro
vin
cia
l Pu
blic
W
ork
s co
mp
lete
d
Fin
al D
raft
no
rms a
nd
sta
nd
ard
s f
or
Pro
vin
cia
l P
ub
lic
Wo
rks c
om
ple
ted
Pre
stig
e n
orm
s a
nd
sta
nd
ard
s a
da
pte
d f
or
Pro
vin
cia
l P
ub
lic
Wo
rks
2
De
velo
pe
d
Pre
stig
e p
olic
y g
uid
elin
es
Qu
art
erly
·
Po
licy
gu
ide
line
s
on
inst
alla
tion
, m
an
ag
em
en
t a
nd
m
ain
ten
an
ce o
f se
curity
in
fra
stru
ctu
re a
t N
atio
na
l Ke
y P
oin
ts d
eve
lop
ed
·
Po
licy
Gu
ide
line
s o
n
imp
lem
en
tatio
n
of
Se
curity
Me
asu
res
for
Me
mb
ers
of
the
Ju
dic
iary
.
de
velo
pe
d
Po
licy
Gu
ide
line
s o
n im
ple
me
nta
tion
o
f S
ecu
rity
M
ea
sure
s fo
r M
em
be
rs o
f th
e
Jud
icia
ry
de
velo
pe
d
Po
licy
Gu
ide
line
s
on
imp
lem
en
tatio
n
of
Se
curity
M
ea
sure
s fo
r M
em
be
rs o
f th
e
Jud
icia
ry
ap
pro
ve
d
Po
licy g
uid
elin
es o
n
insta
llatio
n,
ma
na
ge
me
nt
an
d
ma
inte
na
nce
of
se
cu
rity
in
fra
str
uctu
re
at
Na
tio
na
l K
ey
Po
ints
de
ve
lop
ed
Po
licy g
uid
elin
es o
n
insta
llatio
n,
ma
na
ge
me
nt
an
d
ma
inte
na
nce
of
se
cu
rity
in
fra
str
uctu
re
at
Na
tio
na
l K
ey P
oin
ts
ap
pro
ve
d
3
Sig
ne
d S
erv
ice
L
eve
l Ag
ree
me
nt
Qu
art
erly
SL
A w
ith P
arlia
me
nt
an
d P
resi
de
ncy
si
gn
ed
Dra
ft S
LA
(P
arlia
me
nt)
co
mp
lete
d
SL
A w
ith P
arlia
me
nt
sig
ne
d
Dra
ft S
LA
(P
resid
en
cy)
co
mp
lete
d
SL
A w
ith
Pre
sid
en
cy
sig
ne
d
4
Nu
mb
er
of
pre
stig
e e
ven
ts
sup
po
rte
d w
ith
mo
vab
le
stru
ctu
res
Qu
art
erly
15
Pre
stig
e e
ven
ts
sup
po
rte
d w
ith
mo
vab
le s
tru
ctu
res
6 P
rest
ige
eve
nts
su
pp
ort
ed
with
m
ova
ble
str
uct
ure
s
4 P
rest
ige
eve
nts
su
pp
ort
ed
with
m
ova
ble
str
uct
ure
s
3 P
restig
e e
ve
nts
su
pp
ort
ed
with
m
ova
ble
str
uctu
res
2 P
restig
e e
ve
nts
su
pp
ort
ed
with
m
ova
ble
str
uctu
res
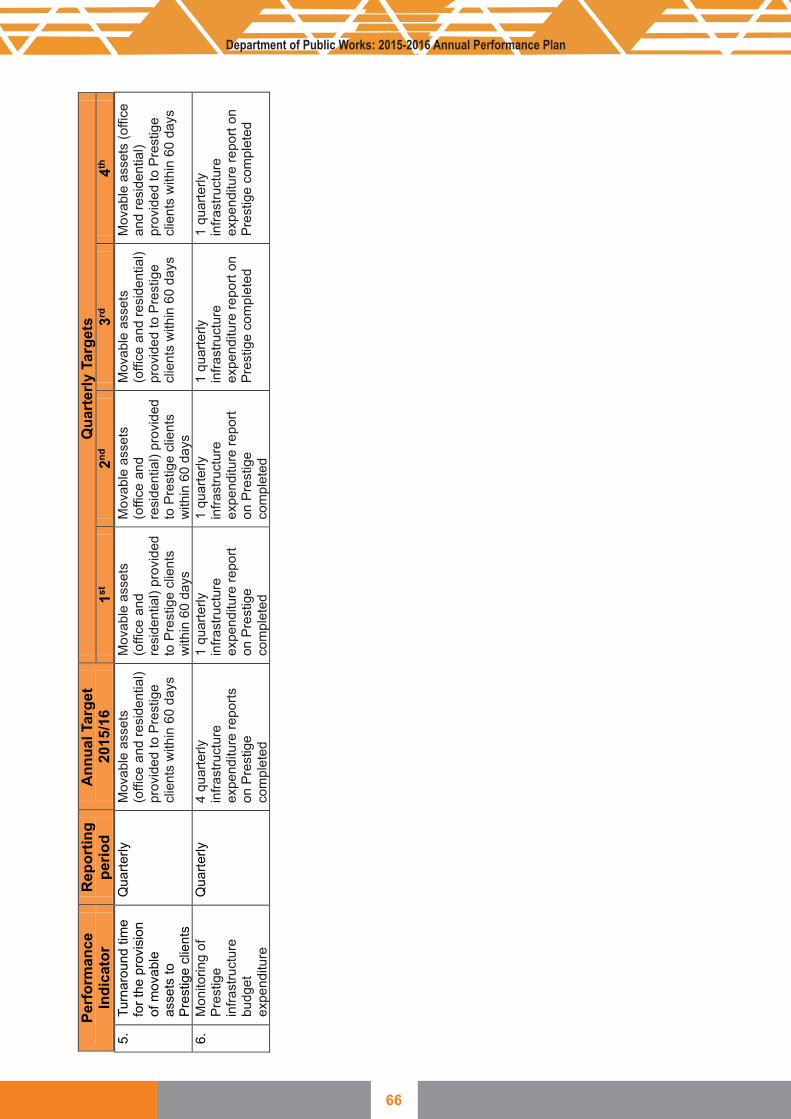
66
Department of Public Works: 2015-2016 Annual Performance Plan
Pe
rfo
rma
nc
e
Ind
ica
tor
Re
po
rtin
g
pe
rio
d
An
nu
al
Ta
rge
t 2
01
5/1
6
Qu
art
erl
y T
arg
ets
1st
2
nd
3
rd
4th
5.
Tu
rna
rou
nd
tim
e
for
the
pro
visi
on
o
f m
ova
ble
a
sse
ts to
P
rest
ige
clie
nts
Qu
art
erly
M
ova
ble
ass
ets
(o
ffice
an
d r
esi
de
ntia
l)
pro
vid
ed
to
Pre
stig
e
clie
nts
with
in 6
0 d
ays
Mo
vab
le a
sse
ts
(offi
ce a
nd
resi
de
ntia
l)
pro
vid
ed
to
Pre
stig
e c
lien
ts
with
in 6
0 d
ays
Mo
vab
le a
sse
ts
(offi
ce a
nd
resi
de
ntia
l)
pro
vid
ed
to
Pre
stig
e c
lien
ts
with
in 6
0 d
ays
Mo
vab
le a
sse
ts
(offi
ce a
nd
re
sid
en
tial)
pro
vid
ed
to
Pre
stig
e
clie
nts
with
in 6
0 d
ays
Mo
vab
le a
sse
ts (
offi
ce
an
d
resi
de
ntia
l) p
rovi
de
d t
o P
rest
ige
cl
ien
ts w
ithin
60
da
ys
6.
Mo
nito
rin
g o
f P
rest
ige
in
fra
stru
ctu
re
bu
dg
et
exp
en
ditu
re
Qu
art
erly
4
qu
art
erly
infr
ast
ruct
ure
e
xpe
nd
iture
re
po
rts
on
Pre
stig
e
com
ple
ted
1
qu
art
erly
infr
ast
ruct
ure
e
xpe
nd
iture
re
po
rt
on
Pre
stig
e
com
ple
ted
1
qu
art
erly
infr
ast
ruct
ure
e
xpe
nd
iture
re
po
rt
on
Pre
stig
e
com
ple
ted
1
qu
art
erly
infr
ast
ruct
ure
e
xpe
nd
iture
re
po
rt
on
P
rest
ige
com
ple
ted
1
qu
art
erly
infr
ast
ruct
ure
e
xpe
nd
iture
re
po
rt
on
P
rest
ige
com
ple
ted

67
Department of Public Works: 2015-2016 Annual Performance Plan
6.1
Reco
ncilin
g p
erf
orm
an
ce t
arg
ets
wit
h t
he B
ud
get
an
d M
TE
F
Exp
enditu
re e
stim
ate
s
Table
26: E
xpenditu
re e
stim
ate
s fo
r P
rogra
mm
e 5
: P
rest
ige P
olic
y
Pro
gra
mm
es
Au
dit
ed
ou
tco
me
A
dju
ste
d
ap
pro
pri
ati
on
M
ed
ium
-te
rm e
xp
en
dit
ure
es
tim
ate
20
11
/12
2
01
2/1
3
20
13
/14
2
01
4/1
5
20
15
/16
2
01
6/1
7
20
17
/18
(R’0
00
)
(R’0
00
)
(R’0
00
)
(R’0
00
)
(R’0
00
)
(R’0
00
)
(R’0
00
)
Pre
stig
e A
ccom
mod
atio
n an
d S
tate
Fun
ctio
ns
79 2
50
71
245
113
459
11
7 34
3
83 5
82
87
897
94
716
Par
liam
enta
ry V
illag
es M
anag
emen
t Boa
rd
7
401
7 77
1
8
198
8 69
0
9
090
9 57
2
10
051
Tota
l
86
651
79 0
16
12
1 65
7
126
033
92
672
97 4
69
10
4 76
7

68
Department of Public Works: 2015-2016 Annual Performance Plan
Eco
no
mic
cla
ssif
icati
on
Au
dit
ed
ou
tco
me
Ad
juste
d
ap
pro
pri
ati
on
Med
ium
-term
exp
en
dit
ure
esti
mate
2011/1
2
2012/1
3
2013/1
4
2014/1
5
2015/1
6
2016/1
7
2017/1
8
(R
’000)
(R’0
00)
(R’0
00)
(R’0
00)
(R’0
00)
(R’0
00)
(R’0
00)
C
urr
ent
pay
men
ts
67 9
72
69 1
32
103
802
96 8
72
70 7
21
77 3
23
81 7
13
C
ompe
nsat
ion
of e
mpl
oyee
s
21 1
24
23 1
09
20 8
22
21 8
63
22 0
55
26 5
28
27 8
08
S
alar
ies
and
wag
es
18 5
86
20
374
18
277
18 4
44
18 5
86
22
410
23
485
Soc
ial c
ontr
ibut
ions
2 53
8
2
735
2 54
5
3
419
3
469
4
118
4 32
3
Goo
ds a
nd s
ervi
ces
46
760
46 0
23
82 9
80
75
009
48
666
50 7
95
53 9
05
A
dmin
istr
ativ
e fe
es
-
-
-
4
5
6
7
A
dver
tisin
g
117
-
57
8
10
12
15
Ass
ets
less
than
the
capi
talis
atio
n th
resh
old
3 75
8
553
1 18
5
2
300
3
500
4
000
4 10
9
Cat
erin
g: D
epar
tmen
tal a
ctiv
ities
50
12
8
8
10
12
15
Com
mun
icat
ion
(G&
S)
29
9
315
15
0
16
0
18
0
20
0
250
C
onsu
ltant
s an
d pr
ofes
sion
al s
ervi
ces:
B
usin
ess
and
advi
sory
ser
vice
s
-
-
36
40
50
60
-
Con
trac
tors
38
919
42 9
36
79 2
51
67
741
28
466
29 9
75
31 4
74
Age
ncy
and
supp
ort /
out
sour
ced
serv
ices
35
0
341
41
9
50
0
7 75
0
8 32
1
8
500
Ent
erta
inm
ent
22
27
26
30
50
10
0
150
Fle
et s
ervi
ces
(incl
udin
g go
vern
men
t mot
or
tran
spor
t)
-
-
25
30
50
100
15
0
Inve
ntor
y: F
ood
and
food
sup
plie
s
1
-
-
-
-
-
-
Inve
ntor
y: M
ater
ials
and
sup
plie
s
5
-
56
66
80
90
10
0

69
Department of Public Works: 2015-2016 Annual Performance Plan
Inve
ntor
y: O
ther
sup
plie
s
475
6
-
150
1 06
4
1
119
1 17
5
Con
sum
able
sup
plie
s
-
-
1
-
-
-
-
Con
sum
able
: Sta
tione
ry, p
rintin
g an
d of
fice
supp
lies
124
24
2
190
25
0
350
40
0
450
Ope
ratin
g le
ases
425
11
2
25
40
45
50
60
Pro
pert
y pa
ymen
ts
-
1
-
-
-
-
-
Trav
el a
nd s
ubsi
sten
ce
1 47
2
705
1 08
2
2 30
0
5 30
6
4 50
0
5 50
0
Trai
ning
and
dev
elop
men
t
6
-
-
742
1 00
0
1 00
0
1 00
0
Ope
ratin
g pa
ymen
ts
677
773
469
560
650
700
750
Ven
ues
and
faci
litie
s
60
-
-
80
100
150
200
Inte
rest
and
ren
t on
land
88
-
-
-
-
-
-
Inte
rest
(In
cl. i
nter
est o
n un
itary
pay
men
ts
(PP
P))
88
-
-
-
-
-
-
Tran
sfer
s an
d s
ub
sid
ies
7 41
0
7 78
1
8 25
3
8 69
0
9 09
0
9 57
2
10 0
51
Ec
on
om
ic c
las
sif
ica
tio
n A
ud
ite
d o
utc
om
e
Ad
jus
ted
a
pp
rop
ria
tio
n
Me
diu
m-t
erm
ex
pe
nd
itu
re e
sti
ma
te
20
11
/12
2
01
2/1
3
20
13
/14
2
01
4/1
5
20
15
/16
2
01
6/1
7
20
17
/18
(R’0
00)
(R’0
00
)
(R’0
00
)
(R’0
00
)
(R’0
00
)
(R’0
00
)
(R’0
00
)

70
Department of Public Works: 2015-2016 Annual Performance Plan
Dep
artm
enta
l age
ncie
s an
d ac
coun
ts
7
401
7 77
1
8
198
8 69
0
9
090
9 57
2
10 0
51
Dep
artm
enta
l age
ncie
s (n
on-b
usin
ess
entit
ies)
7 40
1
7
771
8 19
8
8
690
9 09
0
9 57
2
10 0
51
Hou
seho
lds
9
10
55
-
-
-
-
Soc
ial b
enef
its
9
10
55
-
-
-
-
Pay
men
ts f
or
cap
ital
ass
ets
11 2
69
2 10
3
9 60
2
20 4
71
12 8
61
10 5
74
13
003
Mac
hine
ry a
nd e
quip
men
t
11 2
69
2 10
3
9 60
2
20 4
71
12 8
61
10 5
74
13
003
Oth
er m
achi
nery
and
equ
ipm
ent
11 2
69
2 10
3
9 60
2
20 4
71
12 8
61
10 5
74
13
003
Pay
men
ts f
or
fin
anci
al a
sset
s
-
-
-
-
-
-
-
Tota
l
86 6
51
79 0
16
121
657
126
033
92 6
72
97 4
69
104
767
Ec
on
om
ic c
las
sif
ica
tio
n
Au
dit
ed
ou
tco
me
A
dju
ste
d
ap
pro
pri
ati
on
M
ed
ium
-te
rm e
xp
en
dit
ure
es
tim
ate
20
11
/12
2
01
2/1
3 20
13
/14
2
01
4/1
5
20
15
/16
2
01
6/1
7
20
17
/18
(R’0
00)
(R’0
00
) (R
’00
0)
(R
’00
0)
(R
’00
0)
(R
’00
0)
(R
’00
0)

71
Department of Public Works: 2015-2016 Annual Performance Plan
Performance and expenditure trends for Programme 5
The spending focus over the medium-term will be on provision for norms and standards for prestige
accommodation and meet the protocol responsibilities for the State functions.
The programme aims at providing 45 logistical services for State functions over the MTEF, providing
movable assets (office and residential), setting monitoring and reviewing of policies, as well as
developing norms and standards for prestige accommodation.
Personnel numbers are expected to increase over the medium term in line with the filling of the
critical positions in this programme.

72
Part C: Long Term
Infrastructure Plans (Refer to the Strategic Plan)
73
Part D:Annexure A to the
Annual Performance Plan

74
Department of Public Works: 2015-2016 Annual Performance Plan
7. Annexure A: Technical indicator descriptions7.1 Management
Indicator title Percentage of investigations initiated within 30 days of admissible
allegations Short definition The indicator is measuring investigations initiated within 30 days of receipt of
fraud and corruption allegations reported. This indicator is linked to Phase II of
the Turnaround Strategy. Purpose/importance To ensure that all reported fraud and corruption allegations are attended to
timeously and corrective actions are implemented within a reasonable time
frame. The process cannot be confined to a specific time period as the nature
of each case varies Source/collection of
data
Register of allegations, National Corruption Hotline reports, requests from
Management, anonymous reporting DPW officials and stakeholde rs. Method of calculation The number of investigations initiated within 30 days of an allegation being
reported divided by the total number of investigations reported. Data limitations
Lack of allegations reports; unavailability and or non -cooperation from officials
and Management
to provide information.
Type of indicator
Output
Calculation type
Cumulative
Reporting cycle
Quarterly
New indicator
No
Desired performance
100% of all investigations instituted within 30 days of receipt of admissible
allegations.
Indicator responsibility
Director: Fraud awareness and investigations
Indicator title Percentage change of fraud and corruption risk levels
Short definition The indicator is measuring the increase or decrease of fraud and corruption
levels in the Department by evaluating the probability and impact of the fraud
risk register for the Department and PMTE. This indicator is linked to Phase II
of the Turnaround Strategy. Purpose/importance The Department conducted an assessment of Fraud Risks to mitigate the
prevalence and vulnerability of the Department to fraud and corruption and to
identify its roots causes. The outcome of Fraud Risk Assessment informs the
Fraud Prevention Plan of the Department. Source/collection of
data
Fraud Risk Register
Method of calculation Risk rating (probability x impact rating) of the current fraud risk register The previous year’s (probability x impact rating) fraud and corruption risk rating
Data limitations Lack of allegations reports, unavailability and or non -cooperation from officials
and Management
to provide information.
Type of indicator
Output
Calculation type
Non- cumulative
Reporting cycle
Quarterly
New indicator
Yes
Desired performance
Reduction in the
fraud and corruption risk levels
across the Department
Indicator responsibility
Director: Fraud awareness and investigations

75
Department of Public Works: 2015-2016 Annual Performance Plan
7.2 Finance and Supply Chain Management
Indicator title Percentage change in the rand value of irregular expenditure baseline.
Short definition The indicator is measuring the reduction in irregular expenditure baseline as a result of non-compliance with prescripts and internal controls in prior years.
Purpose/importance To reduce the irregular expenditure baseline as a result of proper consequence management implemented by the Department.
Source/collection of data
Irregular expenditure register indicating reduced amounts including, but not limited to, amounts condoned and written off.
Method of calculation Current financial year’s rand value of irregular expenditure Previous financial year’s rand value of irregular expenditure
Data limitations None Type of indicator
Output
Calculation type
Non-cumulative
Reporting cycle
Quarterly
New indicator
No
Desired performance
Actual performance that is higher than targeted performance is desirable.
Indicator responsibility
Chief Director: Finance
Indicator title
Percentage of compliant invoices settled within 30 days from receipt of invoice.
Short definition
The indicator is measuring the percentage of compliant invoices received from service providers for services rendered which are required to be paid within 30 days in accordance with the Treasury Regulations 8.3.1.
Purpose/importance
Tracks the turnaround time of payments to ensure compliance with regulatory prescripts and to ensure that service providers are not disadvantaged with regard to late payment
Source/collection of data
BAS report indicating when the invoice was received and when it was paid.
Method of calculation
The number of compliant invoices that are paid within 30 days
The total number of compliant invoices received
Data limitations
Late and non-submission of invoices to registry.
Type of indicator
Output
Calculation type
Non-cumulative
Reporting cycle
Quarterly
New indicator
No
Desired performance
100 % compliance
to 30 day payment regulations
Indicator responsibility
Director: Inspectorate and Compliance
Indicator title Percentage of bids awarded within legislated 56 working days of closure of tender advertisement
Short definition The indicator is measuring the percentage of relevant bids awarded for services procured for the Department within validity period. This indicator is linked to Phase II of the Turnaround Strategy.
Purpose/importance To demonstrate that the end to end business process for processing bids is able to be executed within the prescribed validity period thereby enhancing service delivery to clients and ensuring compliance to regulations.
Source/collection of data
Statistics related to all bids awarded by the respective approval authorities will be collected from the SCM tender section that is responsible to collate and manage this information.
Method of calculation
Number of bids awarded within the 56 days validity The
total number of bids awarded in the reporting quarter.
Data limitations
Dependent on the decisions taken by the BAC.
Type of indicator
output
Calculation type
Cumulative.
Reporting cycle
Quarterly.

76
Department of Public Works: 2015-2016 Annual Performance Plan
New indicator Yes
Desired performance To award all bids within the prescribed 56 day validity to prevent extending tender validity periods beyond this period. SCM will strive to achieve for actual performance that exceeds the targeted performance as this will indeed contribute to service delivery improvements
Indicator responsibility Chief Director: Supply Chain Management
Indicator title Percentage procurement cost of goods and services purchased (excluding built environment)
Short definition The indicator is measuring the cost of a tender to establish whether the Department is paying prevailing market related costs and not paying for a tender wherein the price is inflated and includes excessive profit margins. This indicator is linked to Phase II of the Turnaround Stra tegy.
Purpose/importance The Department procures goods and services to support its service delivery objectives. In most cases the cost of the services are higher than market related. In order to ensure cost effectiveness, the Department will be reducing these costs.
Source/collection of data
The tender section will provide the tender price of every tender that is awarded by the relevant approval authorities.
Method of calculation
Actual tender price of goods and service procured The benchmarked price for goods and services
This will be translated into a percentage to determine the total percentage
variation. Data limitations
None
Type of indicator
Output
Calculation type
Cumulative.
Reporting cycle
Quarterly.
New indicator
Yes
Desired performance
The Department will scrutinise all tenders received and compare the tendered price to the estimate and the variance between all bidders’
tendered prices. The Department will also evaluate the prices of past tenders awarded for a similar scope of work to establish a benchmark price. The intent is to pay a price that is market related but inclusive of the premium of 10% as provided for in the BBBEE preference system. This will possibly include a process of negotiation with tenderers to get best value for the State.
The
tender section will provide the tender price of every tender that is awarded by the relevant approval authorities.
Indicator responsibility
Chief
Director: Supply Chain Management
Indicator title Percentage of contracts with variations executed within the allowable variation threshold as legislated by National Treasury (excluding built environment).
Short definition The Department procures goods and services to support its service delivery objectives. These contracts need to be managed in accordance with the agreed scope and cost. The indicator is measuring the variations to the contracts which should be done within the relevant prescribed threshold. The allowable variation is 15% for goods and services This indicator is linked to Phase II of the Turnaround Strategy.
Purpose/importance
To ensure that the Department manages its contracts in such a way that they are concluded in accordance with the tendered price. In instances where variations are necessary, then contracts must be varied only within the allowable National Treasury limitations.
Source/collection of data
The Variation Order Committee
will provide statistics on all variations approved that fall within and outside the allowable National Treasury rates.
Method of calculation
The total number of all contracts with variations approved that are within the allowable range The
total number of all contracts that were varied.
Number is then converted to a percentage.
Data limitations
Incomplete Variation Order documentation
Type of indicator
Output
Calculation type
Cumulative.
Reporting cycle
Quarterly.

77
Department of Public Works: 2015-2016 Annual Performance Plan
New indicator Yes
Desired performance The Department will scrutinise all tenders received and compare the prices to the estimate and the variance between all received tender prices. The Department will also evaluate the prices of similar in nature tenders to establish a benchmark. The intent is to pay a price that is market related but inclusive of the premium of 10% as provided for in the BBBEE preference system.
Indicator responsibility Chief Director: Supply Chain Management
7.3 Corporate Services
Indicator title Implementation of the approved HR Plan for DPW and PMTE
Short definition
The indicator is measuring the implementation of the Human Resource (HR) plan (inclusive of the organisational structure, workplace skills plan, artisan and graduate programmes and resourcing of the core business) which is completed for DPW and be submitted to DPSA as required . The implementation of the approved plan focuses on the activities relating to the organizational structure and training of staff. This indicator is linked to Phase II of the Turnaround Strategy.
Purpose/ importance It is to ensure that the Department is capacitated in terms of the core business with the appropriate structure and the relevant skills
Source / collection of data
Staff establishment, approved structure and training requirement of all Business Units in DPW and PMTE
Method of calculation
None
Data limitations
None
Type of indicator
Output
Calculation type
Non-cumulative
Reporting cycle
Quarterly
New indicator
No
Desired performance
Completion, approval,
submission and implementation of HR Plan
Indicator responsibility
Chief Director: Human Resources
Indicator title Percentage of funded and prioritised vacancies filled as per approved Recruitment Plan with the HR Plan.
Short definition
The indicator is measuring how the Department will be filling vacant and funded posts which have been prioritised as critical and funded positions. These posts are to be filled within 4 months of the date of the post advertisement. This indicator is linked to Phase II of the Turnaround Strategy.
Purpose/ importance To capacitate the Department with skills required by various units to deliver on the mandate of the Department
Source / collection of data
All Business Units in DPW and PMTE.
Method of calculation Number of vacancies filled within 4 months of advertisement The total number of vacancies filled
Data limitations
None
Type of indicator
Output
Calculation type
Cumulative
Reporting cycle
Quarterly
New indicator
No
Desired performance
Vacant and funded positions advertised and filled within the required timeframe
Indicator responsibility
Chief Director: Human Resources Management
Indicator title Number of beneficiaries participating in DPW skills development programme
Short definition
The indicator is measuring the beneficiaries participating in the skills development programme (Young Professionals, Candidates, Interns, Learners, Management Trainees, Schools programme beneficiaries, and Artisans Trainees) which contributes to the capacitation of the Department which is part of the HR Plan. This indicator is linked to Phase II of the Turnaround Strategy.

78
Department of Public Works: 2015-2016 Annual Performance Plan
Purpose/ importance The Departmental skills development programme which is part of the HR Plan contributes to skills development is a legislative requirement and contributes to the Sector Skills Plan.
Source / collection of data
All Business Units in DPW and PMTE.
Method of calculation A count of the number of beneficiaries participating in the skills training programme
Data limitations None
Type of indicator Output Calculation type Non- cumulative Reporting cycle
Quarterly
New indicator
No
Desired performance
To provide valuable on the job training to beneficiaries whilst capacitating the Department
Indicator responsibility
Chief Director: Human Resources & Organisational Development Management
Indicator title Reengineered ICT infrastructure within DPW and PMTE
Short definition
The indicator is measuring the upgrading and redesigning of network infrastructure (VoIP and LAN) to meet the business requirements on ICT. This indicator is linked to Phase II of the Turnaround Strategy.
Purpose/ importance To ensure that DPW and PMTE users are provided with reliable and relevant ICT infrastructure
Source / collection of data
All Business Units in DPW and PMTE
Method of calculation None
Data limitations User requirements and specifications not available Type of indicator
Output
Calculation type
Non-cumulative
Reporting cycle
Quarterly
New indicator
Yes
Desired performance
Upgrade to LAN infrastructure
Indicator responsibility
Chief Director: Information Communication Technology
Indicator title Business applications implemented within DPW and PMTE
Short definition The indicator is measuring the implementation of business applications i.e. Procurement systems, Worx4u mobile APP and other ERP modules
Purpose/ importance
Business applications are important to automate business processes with the view of improving productivity. This indicator is linked to Phase II of the Turnaround Strategy.
Source / collection of data
All Business Units in DPW.
Method of calculation None
Data limitations User requirements and specifications not available Type of indicator
Output
Calculation type
Non-cumulative
Reporting cycle
Quarterly
New indicator
Yes
Desired performance
Implementation of Electronic procurement system and Worx4u mobile application
Indicator responsibility
Chief Director: Information Communication Technology

79
Department of Public Works: 2015-2016 Annual Performance Plan
Indicator title Percentage of default judgments against the Department prevented
Short definition
The Department faces litigation cases on an on-going basis. The indicator is measuring how effective litigations cases are managed thereby preventing default judgements from being granted, in other words, the Department should not face fruitless or wasteful expenditure
Purpose/ importance To ensure that the Department proactively manages litigation and prevents default judgements from taking place
Source / collection of data
Court orders
Method of calculation Number of default judgements prevented Total number of default judgements
Data limitations
Incorrect or incomplete records on legal matters
Type of indicator
Output
Calculation type
Cumulative
Reporting cycle
Quarterly
New indicator
Yes
Desired performance
To ensure that there are no default judgements against the Department
Indicator responsibility
Chief Director: Legal Services
Indicator title Percentage of reported fraud and corruption misconduct cases subjected to disciplinary processes.
Short definition
The indicator is measuring the percentage of reported fraud and corruption misconduct cases subjected to disciplinary processes to ensure that all reported fraud and corruption misconduct cases subjected to disciplinary processes and officials are held accountable. There can be no time period specified for the completion of the disciplinary process since each case is different in nature.
Purpose/ importance To root out fraud and corruption in the Department of Public Works by employees.
Source / collection of data
All Business Units in DPW
Method of calculation
The number of
reported fraud and corruption misconduct cases subjected to disciplinary processes
The total number of fraud and corruption cases reported
How many have been initiated, how many are in process and how many are completed
Data limitations
Non availability of information to investigate allegations of misconduct .
Type of indicator
Output
Calculation type
Non-Cumulative
Reporting cycle
Quarterly
New indicator
Yes
Desired performance
All reported fraud and corruption misconduct
cases finalised within reasonable period.
Indicator responsibility
Chief Director: Legal Services

80
Department of Public Works: 2015-2016 Annual Performance Plan
7.4 Intergovernmental Coordination
Indicator title Number of intergovernmental forums convened for oversight of the Public Works Sector
Short definition
This indicator is measuring the various intergovernmental forums that are coordinated by Intergovernmental Relations and Parliamentary Services with stakeholders from within the Public Works Sector which is used as a mechanism to manage the concurrent functions.
Purpose/importance To ensure effective coordination of interaction and engagement within the Public Works Sector on concurrent functions
Source/collection of data MinMecs, Technical MinMecs Forums and CFO’s Forums (minutes, agenda, implementation reports)
Method of calculation A count of the number of MinMecs, Technical MinMecs and CFO’s Forums per annum
Data limitations
None
Type of indicator
Output
Calculation type
Non-
cumulative
Reporting cycle
Quarterly
New indicator
No
Desired performance
All intergovernmental forums
coordinated and executed efficiently
to deal with issues within the Public Works Sector.
Indicator responsibility
Chief Director: Intergovernmental Relations and Parliamentary Services.
Indicator title Development of public works sector diagnostic report
Short definition This indicator is measuring the compilation of diagnostic reports for the public
works sector based on an evaluation of performance of the previous financial
year as well as other relevant matters relating to concurrent functions Purpose/importance The plays Oversight an d Coordination role within the three Spheres of
Government as part of the concurrent function (Schedule 4 of the Constitution).
The Intergovernmental Coordination Programme seeks to ensure that there is
coordination and integration within the sector. However, the Department has
not fully played this role in the past hence this indicator seeks to establish a
baseline in terms of the level of performance within the sector. Source/collection of data
Auditor-General reports, Quarterly Reports of customised indicators
Method of calculation
1 Report will be developed annually
Data limitations
Inaccurate or incomplete quarterly reports from Provinces
Type of indicator
Output
Calculation type
Non-cumulative
Reporting cycle
Quarterly
New indicator
Yes
Desired performance
1 Diagnostic report developed annually analysing performance of the public
works sector and providing strategies for service delivery for the sector. Indicator responsibility
Deputy Director-General: Governance, Risk and Compliance
Indicator title Completed service delivery framework for identified services Short definition The indicator is measuring the compilation of a Service Delivery Framework
(consisting of business processes, standard operating procedures, unit costing,
service standards, service charters) informed by the service delivery planning
framework and methodology of DPSA. The identified services for DPW and
PMTE include: Construction and Property Sector Regulation Services,
Construction Management Services, Property Management Services, EPWP
Management Services and Intergovernmental Coordination. Additional services
or sub services may be identified over the MTEF. This indicator is linked to
Phase II of the Turnaround Strategy.

81
Department of Public Works: 2015-2016 Annual Performance Plan
Purpose/importance The development and implementation of Service Delivery Framework is a
statutory requirement and is necessary to ensure continuous incremental
service delivery improvement and the quality of services over a three-year
horizon. Source/collection of data DPSA guideline, SDIP Document, Strategic Plan and Annual Performance Plan
Method of calculation None
Data limitations Lack of existing business process and no unit costings available
Type of indicator Output
Calculation type Non- cumulative Reporting cycle
Quarterly
New indicator
Yes
Desired performance
Detailed service delivery model/ framework completed
Indicator responsibility
DDG: Governance, Risk and Compliance
Indicator title Change in average score of management practices through the MPAT
improvement plan Short definition MPAT assesses the quality of management practices across a comprehensive
range of management areas. Improved management practices are the key to
an improved service delivery through providing a holistic picture of the quality
of management practices within a Department against common standards. The indicator is measuring the improvement in the effectiveness of
management practices within the Department and PMTE through the
implementation of the MPAT improvement plan . This indicator is linked to
Phase II of the Turnaround Strategy. Purpose/importance
To assess the extent of compliance within DPW and PMTE and develop action
plans to incrementally improve management practices and overall
performance of DPW and PMTE.
Source/collection of data
Management Performance Assessment Tool, DPSA Service Delivery Planning
Framework and Methodology
Method of calculation
Average MPAT score from the previous financial year –
the average MPAT
score from the current financial year
Data limitations
Lack of business process
and detailed service delivery model
Type of indicator
Output
Calculation type
Non -
cumulative
Reporting cycle
Quarterly
New indicator
Yes
Desired performance
To ensure that the management practices of the Department are fully effective
through the MPAT improvement Plan resulting in an average score of 4 on all
Key Performance Areas
Indicator responsibility
DDG: Governance, Risk and Compliance

82
Department of Public Works: 2015-2016 Annual Performance Plan
7.5 Expanded Public Works Programme
Indicator title Number of work opportunities created by public bodies in the EPWP
aligned to the Phase III Business Plan
Short definition The indicator is measuring the creation of work opportunities by public bodies in
all spheres of Government as well as Non -Profit Organisations through labour
intensive approaches which are coordinated by the EPWP Branch. The 5 year
target of 6 million work opportunities is based on baseline funding received from
National Treasury over the MTEF. Purpose/importance To ensure effective and efficient coordination of the EPWP for the creation of
work opportunities by implementing bodies. Source/collection of
data
The EPWP reporting systems.
Method of calculation A count of the aggregate work opportunities created/reported. Work opportunity is paid work created for an individual on an EPWP project for
any period of time. The same person can be employed on different projects and
each period of employment will be counted as work opportunity. Data limitations
Dependence on reporting bodies to accurately record, report and very the
reported data.
Type of indicator
Output
Calculation type
Cumulative
Reporting cycle
Quarterly
New indicator
No
Desired performance
Actual performance exceeding targeted performance is desirable.
Indicator responsibility
Chief Director: Expanded Public Works Programme: Monitoring and Evaluation
Indicator title Number of EPWP work opportunities created in rural municipalities
aligned to the Phase III EPWP Business Plan. Short definition The indicator is measuring the effective and efficient coordination of the EPWP
for the creation of work opportunities through the implementation of projects in
rural municipalities. The projects are implemented by public bodies. The target for this indicator is based on baseline funding over the MTEF.
Purpose/importance To ensure effective and efficient coordination of the EPWP toward the creation
of work opportunities in rural municipalities. The targets for this indicato r forms part of the overall EPWP work opportunity
target. It aims to highlight the contributions of EPWP in rural municipalities. Source/collection of
data
The data comes from all implementing bodies implementing EPWP projects in rural municipalities, i.e. National and Provincial Government Departments as well as Municipalities. It also includes projects implemented in the Non - State Sector.
Method of calculation
A count of the aggregate work opportunities created in rural municipalities
Data limitations
Dependence on Implementing public bodies to accurately record, report and
verify the reported data.
Type of indicator
Output
Calculation type
Cumulative
Reporting cycle
Quarterly
New indicator
No
Desired performance
Actual performance exceeding the targeted performance is desirable.
Indicator responsibility
Chief Director: Expanded Public Works Programme:
Infrastructure

83
Department of Public Works: 2015-2016 Annual Performance Plan
Indicator title Percentage of EPWP participation among designated groups (percentage of women, youth and persons with disabilities) aligned to the EPWP Business Plan.
Short definition The indicator measures the contribution of the EPWP toward the creation of work opportunities in for designated groups (youth, women and people with disabilities) in the country. The targets for this indicator forms part of the overall EPWP work opportunity target. It aims to highlight the contributions of EPWP in vulnerable groups of our society.
Purpose/importance To ensure effective and efficient coordination of the EPWP toward the creation of work opportunities among designated groups by implementing bodies.
Source/collection of data The EPWP reporting systems.
Method of calculation
A count of the a ggregate work opportunities created/reported
among designated groups.
Work opportunity is paid work created for an individual on an EPWP project for any period of time. The same person can be employed on different projects and each period of employment will be counted as work opportunity.
Data limitations
Dependence on reporting
bodies to accurately record, report and very the reported data.
Type of indicator
Output
Calculation type
Non-Cumulative
Reporting cycle
Quarterly
New indicator
No
Desired performance
Actual performance that is higher than the targeted performance is
desirable since this implies more beneficiaries received training.
Indicator responsibility
Chief Director: Expanded Public Works Programme: Monitoring and Evaluation
Indicator title Percentage of disbursed performance-based incentive allocations to eligible
public bodies across all sectors. Short definition The indicator is measuring the total incentive amount disbursed by Department of
Public Works as a percentage of the allocated incentive amount to eligible Public
Bodies. Purpose/importance To ensure effective and efficient coordination of the EPWP through the
disbursement of the incentive amounts to eligible public bodies.
The Department of Public Works provides amongst others technical support to
public bodies to become eligible for the incentive and to improve performance
since greater performance implies more work opportunities created. This in turn
leads to an increase in the incentive amounts disbursed. Source/collection of
data
Disbursement reports.
Method of calculation
Disbursed amount expressed of performance-based incentive allocations The allocated amount
of performance-based incentive allocations.
Data limitations
Dependence on reporting bodies reporting EPWP projects, signing incentive
agreements, submitting business plans and expenditure reports.
Type of indicator
Activity
Calculation type
Cumulative
Reporting cycle
Quarterly
New indicator
No
Desired performance
100% disbursement of the allocated incentive indicates comprehensive
implementation of the EPWP.
Indicator responsibility
Chief Director: Expanded Public Works Programme: Infrastructure
Chief Director: Expanded Public Works Programme: Operations

84
Department of Public Works: 2015-2016 Annual Performance Plan
Indicator title Number of municipalities provided with technical support
Short definition The indicator is measuring the technical support provided by National Department of Public Works to municipalities to implement projects according to EPWP guidelines. This involves assisting municipalities in designing and implementing projects in line with the EPWP guidelines
Purpose/importance Technical support is provided to municipalities to ensure the correctness in the
reporting of the number of work opportunities created through the EPWP
Source/collection of data
EPWP Annexure Reports.
Method of calculation
A count of the number of municipalities provided with technical support .
Data limitations
Misalignment of reporting timelines between Treasury and EPWP Reporting. Lack of capacity to report by municipalities.
Type of indicator
Output
Calculation type
Cumulative
Reporting cycle
Quarterly
New indicator
No
Desired performance
An increase in number of municipalities reporting on the number of work opportunities created through the EPWP.
Indicator responsibility
Deputy Director-General: Expanded Public Works Programme
Indicator title Number of Public bodies submitted signed off data reports
Short definition The indicator is measuring the n umber of sign off reports that have been received
from Public bodies indicating a true reflection of projects reported into the EPWP
reporting systems. This report will contain the number of projects, work o pportunities
created by every public body per province or sector. Purpose/importance The indicator intends to ensure that the data reported is reliable and accurate as
reported by public bodies.
Source/collection of
data
EPWP Sign off Reports
Method of calculation
A count of the number of Public Bodies submitting signed off EPWP data reports
Data limitations
Dependence on reporting bodies to accurately record, report and verify the reported
data. Type of indicator
Input
Calculation type
Non –
cumulative
Reporting cycle
Quarterly
New indicator
Yes
Desired performance
All data used for reporting should be data that is signed off by Public bodies
Indicator responsibility
Chief Director: Expanded Public Works Programme: Monitoring and Evaluation

85
Department of Public Works: 2015-2016 Annual Performance Plan
7.6 Property and Construction Industry Policy Regulations
Indicator title Draft Public Works White Paper developed.
Short definition The indicator is measuring the development and gazetting of the draft Public Works White Paper for public comments.
Purpose/importance To inform the development of a Public Works Act.
Source/collection of data
White Papers: (1) Public Works towards the 21st Century (1997); and (2) Creating an Enabling Environment for Reconstruction, Growth and Development in the Construction Industry (1999) , relevant legislation and Government policies.
Method of calculation None
Data limitations None Type of indicator
Output
Calculation type
Non-cumulative
Reporting cycle
Quarterly
New indicator
No
Desired performance
Draft Public Works White Paper gazetted for public comments.
Indicator responsibility
Chief Director: Construction Policy Development; and Chief Director: Property Policy Development
Indicator title Business case to establish Independent Development Trust (IDT) as an
institution of Government developed
Short definition The indicator is measuring the establishment of the IDT as an institution of
Government reporting to the Minister of Public Works. Purpose/importance To define the IDT’s mandate and to improve its governance and accountability
to the Executive Authority. Source/collection of
data
Relevant delegations
Method of calculation None
Data limitations None Type of indicator
Output
Calculation type
Non-cumulative
Reporting cycle
Quarterly
New indicator
No, this is continuation without change from the previous year.
Desired performance
IDT established as an institution of Government
Indicator responsibility
Chief Director: Construction Policy Development
Indicator title Assessment of contractor development programme.
Short definition The indicator is measuring the monitoring of the implementation of contractor
development. Purpose/importance To monitor implementation of contractor development initiatives and ensure
alignment to the National Contractor Development Programme. Source/collection of data Quarterly reports
Method of calculation A simple count of the contractor development reports drafted
Data limitations None
Type of indicator Output Calculation type
Non-cumulative
Reporting cycle
Bi-annually
New indicator
Yes
Desired performance
Bi-annual contractor development implementation reports submitted to
Minister for consideration.
Indicator responsibility
Chief Director: Construction Policy Development.

86
Department of Public Works: 2015-2016 Annual Performance Plan
Indicator title Developed DPW Property Management Empowerment Policy
Short definition The indicator is measuring the development of the Property Management
Empowerment Policy aligned to the BBBEE Act, 2003 (as amended). Purpose/importance To ensure compliance by the Department to the BBBEE Act , 2003 (as
amended) and to promote growth and transformation in the Property sector. Source/collection of data BBBEE Act, 2003 (as amended).
Method of calculation None
Data limitations None Type of indicator
Output
Calculation type
Non-cumulative
Reporting cycle
Quarterly
New indicator
Yes
Desired performance
Property Management Empowerment Policy approved by the Minister.
Indicator responsibility
Chief Director: Property Policy Development
Indicator title Developed Draft Bill to manage the disposal of immovable assets under
the custodianship of the Department Short definition The indicator is measuring the amendment of the State Land Disposal Act,
1961 to be aligned to the Constitution, other relevant legislation and
recognised best practices in the disposal of state immovable assets. Purpose/importance To contribute to orderly development and the acceleration of Government ’s
socio-economic objectives. Source/collection of data Constitution, 1996; State Land Disposal Act, 1961; Public Finance
Management Act, 1999; Provincial Land Administration Laws; DPW
Immovable Asset Disposal Policy, 2013.
Method of calculation
None
Data limitations
None
Type of indicator
Output
Calculation type
Non-cumulative
Reporting cycle
Quarterly
New indicator
Yes
Desired performance
Draft Bill to amend the State Land Disposal Act, 1961 to govern the disposal
of immovable assets under the custodianship of the Department developed. Indicator responsibility Chief Director: Property Policy Development
Indicator title Developed draft Bill to repeal or amend legislation administered by the
Department that is inconsistent with the Constitution or obsolete. Short definition The indicator is measuring the submission to Parliament of a draft Bill to repeal or
amend legislation or provisions in legislation administered by the Department, that
are (a) inconsistent with the Constitution, particularly the equality clause thereof, or
(b) obsolete. Purpose/importance To act on the recommendations of the South African Law Reform Commission in
terms of the programme to (a) align the statute book with the Constitution, 1996;
and (b) free the statute book from obsolete and unnecessary legislation. Source/collection of
data
Constitution, 1996; all legislation administered by the Department; Report of the
South African Law Reform Commission on Statutory Law Revision (Project 25).
Method of
calculation
n/a
Data limitations
None
Type of indicator
Output
Calculation type
n/a
Reporting cycle
Quarterly

87
Department of Public Works: 2015-2016 Annual Performance Plan
New indicator Yes Desired
performance
Public Works General Laws Amendment and Repeal Bill submitted to Parliament.
Indicator
responsibility
Chief Director: Property Policy Development.
Indicator title Reviewed GIAMA Best practice guidelines and standards to manage
immovable assets. Short definition The indicator is measuring the development of best practice guidelines and
standards to give effect to implementation of GIAMA. Purpose/importance To ensure uniformity and compliance to GIAMA. Source/collection of data GIAMA, Land Administration Acts and relevant immovable asset
management policies. Method of calculation None
Data limitations None Type of indicator
Output
Calculation type
Non-cumulative
Reporting cycle
Quarterly
New indicator
Yes
Desired performance
Revised Guidelines on User and Custodian Asset Management Plans
developed and aligned to GIAMA. Indicator responsibility
Chief Director: Property Policy Development
7.7 Prestige Policy
Indicator title : Developed Prestige norms and standards
Short definition: The indicator is measuring the development of norms and standards for the
provision of Prestige movable and immovable assets. This indicator is linked
to Phase II of the Turnaround Strategy. Purpose/importance: Historically there has been lack of a guidelines/framework for Prestige. The
development of norms and standards will create consistency in the
management of Prestige Accommodation Source/collection of
data:
Ministerial Handbook, Departmental policies and relevant legislation
Method of calculation: None
Data limitations: Inadequate information available form external stakeholders Type of indicator:
Output
Calculation type:
Non-cumulative
Reporting cycle:
Quarterly
New indicator:
Yes
Desired performance:
A complete set of norms and standards in place for all types of Prestige
accommodation
Indicator responsibility:
National Coordinator: Prestige
Indicator title : Developed Prestige policy guidelines
Short definition: The indicator is measuring the development of policy guidelines for Prestige
accommodation to ensure compliance to Prestige policy frameworks Purpose/importance To ensure consistency in the provision and management of Prestige
accommodation Source/collection of
data
Ministerial Handbook, Prestige policy and relevant legislation
Method of calculation None Data limitations Inadequate information available form external stakeholders

88
Department of Public Works: 2015-2016 Annual Performance Plan
Type of indicator Output
Calculation type Non-cumulative Reporting cycle Quarterly New indicator Yes Desired performance A complete set of policies and guidelines for Prestige Indicator responsibility National Coordinator: Prestige
Indicator title : Signed service level agreements
Short definition: The indicator is measuring the Service Level Agreement for Presidency and
Parliament that needs to be in place. This indicator is linked to Phase II of the
Turnaround Strategy. Purpose/importance That there was lack of expected levels of service with Prestige clients. The
Service Level Agreement will ensure consistency in the provision and
management of Prestige Accommodation Source/collection of data Ministerial Handbook, Prestige policy, other relevant Departmental policies
and relevant legislation Method of calculation A simple count of the SLA’s signed for Prestige clients
Data limitations Lack of business processes and service delivery standards
Type of indicator Output Calculation type
Non-cumulative
Reporting cycle
Quarterly
New indicator
Yes
Desired performance
Signed SLA’s in place for Parliament and Presidency
Indicator responsibility
National Coordinator: Prestige
Indicator title Number of Prestige events supported with movable structures.
Short definition The indicator is measuring the provision of items such as marquees and decor for national events such as Cabinet Lekgotla, National Awards, SONA, Mandela Day etc.
Purpose/ importance To support the success of the Prestige events by providing the required infrastructure.
Source / collection of data
Based on the formal request/specifications of Prestige clients.
Method of calculation Simple count of Prestige events support with required infrastructure.
Data limitations Specifications of infrastructure required not available upfront / changes to specifications impacting service delivery.
Type of indicator Output
Calculation type Non-cumulative Reporting cycle
Quarterly
New indicator
No
Desired performance
The aim is to ensure that all Prestige events have the required infrastructure in the correct quantity and the correct time.
Indicator responsibility
National Coordinator: Prestige

Indicator title : Turnaround time for the provision of movable assets (office and
residential) to Prestige clients Short definition: The indicator is measuring the provision of movable assets (furniture) to
Prestige clients within 60 working days of receipt of request Purpose/importance To ensure that Prestige clients receive the correct immovable assets in the
correct quantities at the right time Source/collection of data Needs assessments from user departments, condition assessments
Method of calculation None
Data limitations Incomplete needs assessment from user departments
Type of indicator Output
Calculation type Cumulative
Reporting cycle Quarterly New indicator
No
Desired performance
Provision of the correct movable assets at the required times in the required
quantities
Indicator responsibility National Coordinator: Prestige
Indicator title : Monitoring of Prestige infrastructure budget expenditure
Short definition: The indicator measures the tracking of expenditure of the infrastructure budget for Prestige in the delivery of accommodation for Prestige clients
Purpose/importance To ensure development of accommodation for Prestige clients in the correct amounts, within the correct timeframes and within the required budgets
Source/collection of data Estimates of National Expenditure; User Asset Management Plan
Method of calculation Percentage of expenditure is based on time lapse of the financial year
Data limitations None
Type of indicator Output
Calculation type Non-cumulative
Reporting cycle Quarterly
New indicator Yes Desired performance
100% expenditure of prestige infrastructure budget
Indicator responsibility National Coordinator: Prestige
89
Department of Public Works: 2015-2016 Annual Performance Plan

Switchboard: 012 406 2000/3000Communications Unit: 012 406 1830/1
Fax: 086 276 8958Website: www.publicworks.gov.za
Department of Public WorksTshwane Central 0001
CGO Building264 Madiba Street (Cnr Bosman & Madiba Streets)
ISBN: 978-1-920399-15-3