annual report · pension closeouts. the high structured settlement sales we have generated over the...
TRANSCRIPT

ANNUAL REPORTMetLife, Inc. 2010

Chairman’s LetterTo my fellow shareholders:
Most certainly, 2010 will be a year that people will look back upon as a time of significanttransformation and accomplishment for MetLife. This is no small statement given thetremendous milestones of growth and innovation that define MetLife’s 143-year history.But it is also fitting in that we truly demonstrated the power of this great company and ourfocus on ensuring that we deliver on the promises we have made to our customers, whonow total 90 million around the globe.
Without a doubt, our acquisition of American Life Insurance Company (Alico) was a tremendous accomplishment in 2010 asit transformed MetLife into a global life insurance and employee benefits powerhouse. At its core, this acquisition benefits us inmany ways, giving MetLife leadership positions in key markets, including Japan, Europe and the Middle East. Furthermore, it willbe accretive to both our earnings and return on equity in 2011 and provides opportunities to expand the strong relationships wehave built with FORTUNE 500» clients in the U.S. But even more noteworthy is that we were able to pursue and complete this$16.4 billion acquisition because of the high priority we placed on our financial strength before and during the financial crisis. Theforesight, experience and risk management expertise that define the culture of MetLife have truly served us, our customers andour shareholders very well.
Strong, Diverse BusinessesIn 2010, we continued our focus on growth, even as we completed the largest acquisition in MetLife’s history. Total revenues
grew 28% over 2009 to $52.7 billion as premiums grew 4%, fees increased 16% and net investment income recoveredsignificantly, growing 19%. We have demonstrated industry-leading strength in growing our top line over the past two years — atime during which there has clearly been considerable economic uncertainty. We are pleased to be a top provider in our chosenmarkets, but we will only pursue revenue growth where we know we can generate bottom line growth as well.
To that end, bottom line improvements were very impressive in 2010, with earnings increasing significantly over2009. Book value per common share rose 16% over year-end 2009 to $44.18 as our investment portfolio movedfrom being in a net unrealized loss position to having net unrealized gains at year-end 2010.
Briefly, I would like to share some highlights of our businesses’ performance this year.
Our U.S. Business is an industry leader that meets consumers’ protection and savings needs wherever it isconvenient for them — at the workplace, through a MetLife or third-party representative and, more recently, byoffering term life insurance online as well. In 2010, U.S. Business premiums, fees and other revenues increasedslightly over 2009 to $28.9 billion while earnings grew considerably. Results within U.S. Business included:
• Premiums, fees and other revenues in Insurance Products were $20.2 billion, which is consistent with2009’s performance. Top line results in this business benefited from growth in our group life and dentalbusinesses — two product lines in which MetLife is a leader. We also made further progress on our efforts tohelp consumers address their life insurance protection needs by making it easier for the underserved middlemarket to purchase term life insurance through metlife.com. Also, in early 2011, we launched MetLife PromiseWhole Life, a new permanent insurance product that offers long-term protection and the advantages ofguaranteed cash value that grows each year, tax-deferred, along with dividend participation.
• Retirement Products premiums, fees and other revenues were $3.3 billion, up 19% due to strong growth infee income as profits in the segment more than doubled. Annuity deposits also were strong at $20.1 billionand assets grew 14% over 2009 to reach a record $162.7 billion. We continue to be a leader in the annuitybusiness, with clients valuing the guaranteed income these products generate in retirement.
• In Corporate Benefit Funding — which specializes in structured risk solutions — premiums, fees andother revenues were $2.4 billion. At the same time, the business experienced strong growth in profitability anda higher return on equity over 2009. During the year, we had solid sales of both structured settlements and

pension closeouts. The high structured settlement sales we have generated over the past two years are anideal example of how MetLife has benefited from the flight to quality in the industry that I have spoken ofbefore. Recently, pension closeout sales have been smaller due to the low interest rate environment, but weremain well positioned to assist businesses in need of expertise with managing their pension liabilities.
• MetLife’s Auto & Home business, which is one of the largest providers of group auto and home insurance,continued to deliver strong performance in 2010. Sales of new policies increased 11% for our homeownersbusiness and 4% for our auto business compared to 2009 — notable increases given the highly competitiveproperty and casualty insurance market. In addition, the combined ratio, excluding catastrophes, improved to88.1% from 88.9% in 2009.
Our International business experienced a tremendous expansion this year, growing from operating in 16countries to more than 60 with the completion of our Alico acquisition on November 1. Due to Alico having a fiscalyear end of November 30, only one month of its results are reflected in International’s year-end performance.Nevertheless, premiums, fees and other revenues grew 36% to $5.8 billion in 2010 and we are well positioned toexpand this growth in 2011. Our International business now has expanded diversity in products, distribution andgeography, and is expected to contribute approximately 30% of MetLife’s total premiums, fees and other revenuesin 2011, up from 16% in 2010.
Finally, MetLife Bank, which has grown to become a leading originator and servicer of residential mortgages,generated total operating revenues of $1.4 billion, down 9% from 2009 as mortgage refinancing activity returned tomore moderate levels compared to the unusually high activity experienced across the industry in 2009. At the sametime, total assets for MetLife Bank grew to $16.3 billion, up from $14.1 billion at December 31, 2009.
All together, these results truly demonstrated the value that our company can deliver for both customers andshareholders. They also illustrate our ability to successfully complete a significant undertaking like the acquisition ofAlico while maintaining attention on our day-to-day business operations. I am proud of all that we accomplished in2010 as our achievements will help drive further growth and value in the future. Looking ahead, we are focused onleveraging the many strengths of our new, global organization to ensure we can build upon MetLife’s impressivehistory with new milestones of success.
I thank you for your continued support.
Sincerely,
C. Robert HenriksonChairman of the Board, President andChief Executive OfficerMetLife, Inc.
March 1, 2011

TABLE OF CONTENTS
PageNumber
Note Regarding Forward-Looking Statements . . . . . . . . . . . . . . . . . . . . . . . . . . . . . . . . . . . . . . . . . . . . . . . . . . . . . 2Selected Financial Data . . . . . . . . . . . . . . . . . . . . . . . . . . . . . . . . . . . . . . . . . . . . . . . . . . . . . . . . . . . . . . . . . . . 3Business . . . . . . . . . . . . . . . . . . . . . . . . . . . . . . . . . . . . . . . . . . . . . . . . . . . . . . . . . . . . . . . . . . . . . . . . . . . . 5Management’s Discussion and Analysis of Financial Condition and Results of Operations . . . . . . . . . . . . . . . . . . . . . . . . 5Quantitative and Qualitative Disclosures About Market Risk . . . . . . . . . . . . . . . . . . . . . . . . . . . . . . . . . . . . . . . . . . . . 76Changes in and Disagreements With Accountants on Accounting and Financial Disclosure . . . . . . . . . . . . . . . . . . . . . . . 83Management’s Annual Report on Internal Control Over Financial Reporting . . . . . . . . . . . . . . . . . . . . . . . . . . . . . . . . . . 83Attestation Report of the Company’s Registered Public Accounting Firm . . . . . . . . . . . . . . . . . . . . . . . . . . . . . . . . . . . 83Financial Statements . . . . . . . . . . . . . . . . . . . . . . . . . . . . . . . . . . . . . . . . . . . . . . . . . . . . . . . . . . . . . . . . . . . . 85Board of Directors . . . . . . . . . . . . . . . . . . . . . . . . . . . . . . . . . . . . . . . . . . . . . . . . . . . . . . . . . . . . . . . . . . . . . . 86Executive Officers . . . . . . . . . . . . . . . . . . . . . . . . . . . . . . . . . . . . . . . . . . . . . . . . . . . . . . . . . . . . . . . . . . . . . . 86Contact Information . . . . . . . . . . . . . . . . . . . . . . . . . . . . . . . . . . . . . . . . . . . . . . . . . . . . . . . . . . . . . . . . . . . . . 87Corporate Information . . . . . . . . . . . . . . . . . . . . . . . . . . . . . . . . . . . . . . . . . . . . . . . . . . . . . . . . . . . . . . . . . . . . 87
1MetLife, Inc.

As used in this Annual Report, “MetLife,” the “Company,” “we,” “our” and “us” refer to MetLife, Inc., a Delaware corporation incorporated in1999 (the “Holding Company”), its subsidiaries and affiliates.
Note Regarding Forward-Looking StatementsThis Annual Report, including the Management’s Discussion and Analysis of Financial Condition and Results of Operations, may contain or
incorporate by reference information that includes or is based upon forward-looking statements within the meaning of the Private SecuritiesLitigation Reform Act of 1995. Forward-looking statements give expectations or forecasts of future events. These statements can beidentified by the fact that they do not relate strictly to historical or current facts. They use words such as “anticipate,” “estimate,” “expect,”“project,” “intend,” “plan,” “believe” and other words and terms of similar meaning in connection with a discussion of future operating orfinancial performance. In particular, these include statements relating to future actions, prospective services or products, future performanceor results of current and anticipated services or products, sales efforts, expenses, the outcome of contingencies such as legal proceedings,trends in operations and financial results.
Any or all forward-looking statements may turn out to be wrong. They can be affected by inaccurate assumptions or by known or unknownrisks and uncertainties. Many such factors will be important in determining the actual future results of MetLife, Inc., its subsidiaries andaffiliates. These statements are based on current expectations and the current economic environment. They involve a number of risks anduncertainties that are difficult to predict. These statements are not guarantees of future performance. Actual results could differ materially fromthose expressed or implied in the forward-looking statements. Risks, uncertainties, and other factors that might cause such differencesinclude the risks, uncertainties and other factors identified in MetLife, Inc.’s filings with the U.S. Securities and Exchange Commission (the“SEC”). These factors include: (1) difficult conditions in the global capital markets; (2) increased volatility and disruption of the capital andcredit markets, which may affect our ability to seek financing or access our credit facilities; (3) uncertainty about the effectiveness of theU.S. government’s programs to stabilize the financial system, the imposition of fees relating thereto, or the promulgation of additionalregulations; (4) impact of comprehensive financial services regulation reform on us; (5) exposure to financial and capital market risk;(6) changes in general economic conditions, including the performance of financial markets and interest rates, which may affect our ability toraise capital, generate fee income and market-related revenue and finance statutory reserve requirements and may require us to pledgecollateral or make payments related to declines in value of specified assets; (7) potential liquidity and other risks resulting from ourparticipation in a securities lending program and other transactions; (8) investment losses and defaults, and changes to investmentvaluations; (9) impairments of goodwill and realized losses or market value impairments to illiquid assets; (10) defaults on our mortgageloans; (11) the impairment of other financial institutions that could adversely affect our investments or business; (12) our ability to addressunforeseen liabilities, asset impairments, loss of key contractual relationships, or rating actions arising from acquisitions or dispositions,including our acquisition of American Life Insurance Company (“American Life”), a subsidiary of ALICO Holdings LLC (“ALICO Holdings”), andDelaware American Life Insurance Company (“DelAm,” together with American Life, collectively, “ALICO”) (the “Acquisition”) and tosuccessfully integrate and manage the growth of acquired businesses with minimal disruption; (13) uncertainty with respect to the outcomeof the closing agreement entered into between American Life and the United States Internal Revenue Service in connection with theAcquisition; (14) uncertainty with respect to any incremental tax benefits resulting from the planned elections for ALICO and certain of itssubsidiaries under Section 338 of the U.S. Internal Revenue Code of 1986, as amended; (15) the dilutive impact on our stockholders resultingfrom the issuance of equity securities in connection with the acquisition of ALICO or otherwise; (16) economic, political, currency and otherrisks relating to our international operations, including with respect to fluctuations of exchange rates; (17) our primary reliance, as a holdingcompany, on dividends from our subsidiaries to meet debt payment obligations and the applicable regulatory restrictions on the ability of thesubsidiaries to pay such dividends; (18) downgrades in our claims paying ability, financial strength or credit ratings; (19) ineffectiveness of riskmanagement policies and procedures; (20) availability and effectiveness of reinsurance or indemnification arrangements, as well as default orfailure of counterparties to perform; (21) discrepancies between actual claims experience and assumptions used in setting prices for ourproducts and establishing the liabilities for our obligations for future policy benefits and claims; (22) catastrophe losses; (23) heightenedcompetition, including with respect to pricing, entry of new competitors, consolidation of distributors, the development of new products bynew and existing competitors, distribution of amounts available under U.S. government programs, and for personnel; (24) unanticipatedchanges in industry trends; (25) changes in accounting standards, practices and/or policies; (26) changes in assumptions related to deferredpolicy acquisition costs, deferred sales inducements, value of business acquired or goodwill; (27) increased expenses relating to pensionand postretirement benefit plans, as well as health care and other employee benefits; (28) exposure to losses related to variable annuityguarantee benefits, including from significant and sustained downturns or extreme volatility in equity markets, reduced interest rates,unanticipated policyholder behavior, mortality or longevity, and the adjustment for nonperformance risk; (29) deterioration in the experience ofthe “closed block” established in connection with the reorganization of Metropolitan Life Insurance Company (“MLIC”); (30) adverse results orother consequences from litigation, arbitration or regulatory investigations; (31) inability to protect our intellectual property rights or claims ofinfringement of the intellectual property rights of others, (32) discrepancies between actual experience and assumptions used in establishingliabilities related to other contingencies or obligations; (33) regulatory, legislative or tax changes relating to our insurance, banking,international, or other operations that may affect the cost of, or demand for, our products or services, impair our ability to attract and retaintalented and experienced management and other employees, or increase the cost or administrative burdens of providing benefits toemployees; (34) the effects of business disruption or economic contraction due to terrorism, other hostilities, or natural catastrophes,including any related impact on our disaster recovery systems and management continuity planning which could impair our ability to conductbusiness effectively; (35) the effectiveness of our programs and practices in avoiding giving our associates incentives to take excessive risks;and (36) other risks and uncertainties described from time to time in MetLife, Inc.’s filings with the SEC.
MetLife, Inc. does not undertake any obligation to publicly correct or update any forward-looking statement if we later become aware thatsuch statement is not likely to be achieved. Please consult any further disclosures MetLife, Inc. makes on related subjects in reports to theSEC.
2 MetLife, Inc.

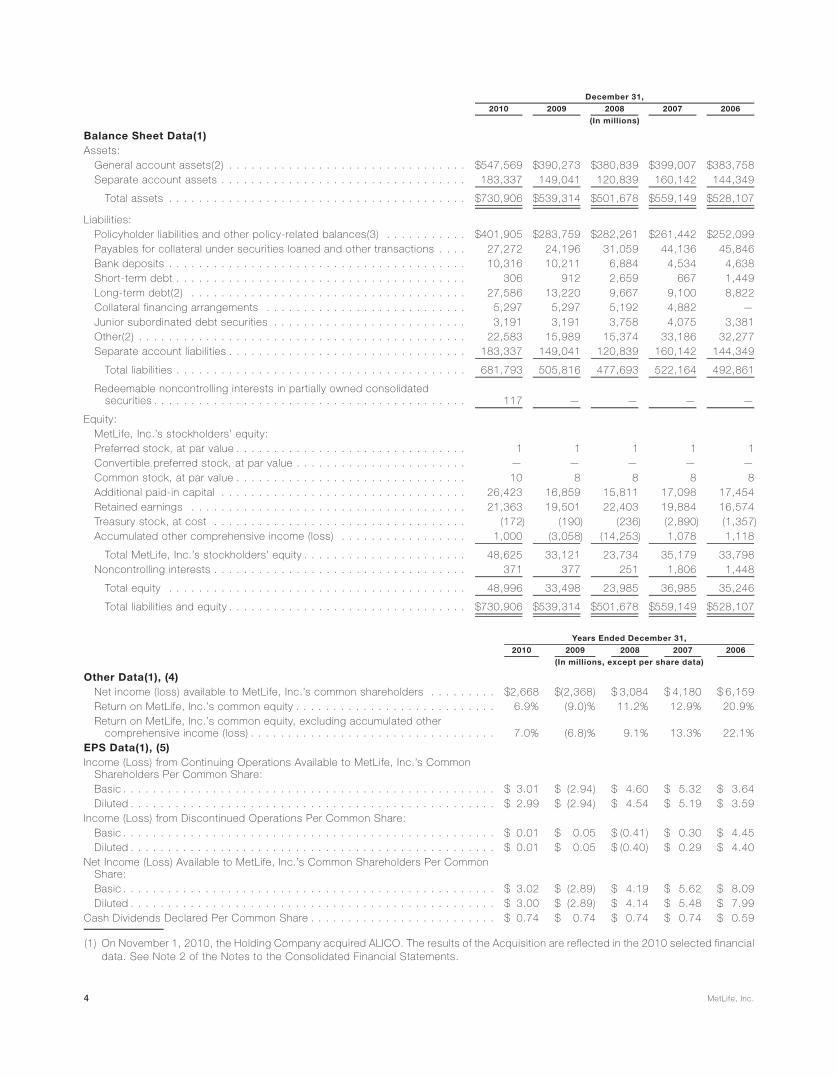
Selected Financial DataThe following selected financial data has been derived from the Company’s audited consolidated financial statements. The statement of
operations data for the years ended December 31, 2010, 2009 and 2008, and the balance sheet data at December 31, 2010 and 2009 havebeen derived from the Company’s audited financial statements included elsewhere herein. The statement of operations data for the yearsended December 31, 2007 and 2006, and the balance sheet data at December 31, 2008, 2007 and 2006 have been derived from theCompany’s audited financial statements not included herein. The selected financial data set forth below should be read in conjunction with“Management’s Discussion and Analysis of Financial Condition and Results of Operations” and the consolidated financial statements andrelated notes included elsewhere herein.
2010 2009 2008 2007 2006
Years Ended December 31,
(In millions)
Statement of Operations Data(1)
Revenues:
Premiums . . . . . . . . . . . . . . . . . . . . . . . . . . . . . . . . . . . . . . . . . . . . . . . . $27,394 $26,460 $25,914 $22,970 $22,052
Universal life and investment-type product policy fees . . . . . . . . . . . . . . . . . . . . 6,037 5,203 5,381 5,238 4,711
Net investment income . . . . . . . . . . . . . . . . . . . . . . . . . . . . . . . . . . . . . . . . 17,615 14,837 16,289 18,055 16,239
Other revenues . . . . . . . . . . . . . . . . . . . . . . . . . . . . . . . . . . . . . . . . . . . . . 2,328 2,329 1,586 1,465 1,301
Net investment gains (losses) . . . . . . . . . . . . . . . . . . . . . . . . . . . . . . . . . . . . (392) (2,906) (2,098) (318) (1,174)
Net derivative gains (losses) . . . . . . . . . . . . . . . . . . . . . . . . . . . . . . . . . . . . . (265) (4,866) 3,910 (260) (208)
Total revenues . . . . . . . . . . . . . . . . . . . . . . . . . . . . . . . . . . . . . . . . . . . . 52,717 41,057 50,982 47,150 42,921
Expenses:
Policyholder benefits and claims . . . . . . . . . . . . . . . . . . . . . . . . . . . . . . . . . . 29,545 28,336 27,437 23,783 22,869
Interest credited to policyholder account balances . . . . . . . . . . . . . . . . . . . . . . 4,925 4,849 4,788 5,461 4,899
Policyholder dividends . . . . . . . . . . . . . . . . . . . . . . . . . . . . . . . . . . . . . . . . 1,486 1,650 1,751 1,723 1,698
Other expenses . . . . . . . . . . . . . . . . . . . . . . . . . . . . . . . . . . . . . . . . . . . . . 12,803 10,556 11,947 10,405 9,514
Total expenses . . . . . . . . . . . . . . . . . . . . . . . . . . . . . . . . . . . . . . . . . . . . 48,759 45,391 45,923 41,372 38,980
Income (loss) from continuing operations before provision for income tax . . . . . . . . 3,958 (4,334) 5,059 5,778 3,941
Provision for income tax expense (benefit) . . . . . . . . . . . . . . . . . . . . . . . . . . . . 1,181 (2,015) 1,580 1,675 1,027
Income (loss) from continuing operations, net of income tax . . . . . . . . . . . . . . . . 2,777 (2,319) 3,479 4,103 2,914
Income (loss) from discontinued operations, net of income tax . . . . . . . . . . . . . . 9 41 (201) 362 3,526
Net income (loss) . . . . . . . . . . . . . . . . . . . . . . . . . . . . . . . . . . . . . . . . . . . . 2,786 (2,278) 3,278 4,465 6,440
Less: Net income (loss) attributable to noncontrolling interests . . . . . . . . . . . . . . (4) (32) 69 148 147
Net income (loss) attributable to MetLife, Inc. . . . . . . . . . . . . . . . . . . . . . . . . . 2,790 (2,246) 3,209 4,317 6,293
Less: Preferred stock dividends . . . . . . . . . . . . . . . . . . . . . . . . . . . . . . . . . . 122 122 125 137 134
Net income (loss) available to MetLife, Inc.’s common shareholders . . . . . . . . . . . $ 2,668 $ (2,368) $ 3,084 $ 4,180 $ 6,159
3MetLife, Inc.
2010 2009 2008 2007 2006
December 31,
(In millions)
Balance Sheet Data(1)Assets:
General account assets(2) . . . . . . . . . . . . . . . . . . . . . . . . . . . . . . . . $547,569 $390,273 $380,839 $399,007 $383,758Separate account assets . . . . . . . . . . . . . . . . . . . . . . . . . . . . . . . . . 183,337 149,041 120,839 160,142 144,349
Total assets . . . . . . . . . . . . . . . . . . . . . . . . . . . . . . . . . . . . . . . . $730,906 $539,314 $501,678 $559,149 $528,107
Liabilities:Policyholder liabilities and other policy-related balances(3) . . . . . . . . . . . $401,905 $283,759 $282,261 $261,442 $252,099Payables for collateral under securities loaned and other transactions . . . . 27,272 24,196 31,059 44,136 45,846Bank deposits . . . . . . . . . . . . . . . . . . . . . . . . . . . . . . . . . . . . . . . . 10,316 10,211 6,884 4,534 4,638Short-term debt . . . . . . . . . . . . . . . . . . . . . . . . . . . . . . . . . . . . . . . 306 912 2,659 667 1,449Long-term debt(2) . . . . . . . . . . . . . . . . . . . . . . . . . . . . . . . . . . . . . 27,586 13,220 9,667 9,100 8,822Collateral financing arrangements . . . . . . . . . . . . . . . . . . . . . . . . . . . 5,297 5,297 5,192 4,882 —Junior subordinated debt securities . . . . . . . . . . . . . . . . . . . . . . . . . . 3,191 3,191 3,758 4,075 3,381Other(2) . . . . . . . . . . . . . . . . . . . . . . . . . . . . . . . . . . . . . . . . . . . . 22,583 15,989 15,374 33,186 32,277Separate account liabilities . . . . . . . . . . . . . . . . . . . . . . . . . . . . . . . . 183,337 149,041 120,839 160,142 144,349
Total liabilities . . . . . . . . . . . . . . . . . . . . . . . . . . . . . . . . . . . . . . . 681,793 505,816 477,693 522,164 492,861
Redeemable noncontrolling interests in partially owned consolidatedsecurities . . . . . . . . . . . . . . . . . . . . . . . . . . . . . . . . . . . . . . . . . . 117 — — — —
Equity:MetLife, Inc.’s stockholders’ equity:Preferred stock, at par value . . . . . . . . . . . . . . . . . . . . . . . . . . . . . . . 1 1 1 1 1Convertible preferred stock, at par value . . . . . . . . . . . . . . . . . . . . . . . — — — — —Common stock, at par value . . . . . . . . . . . . . . . . . . . . . . . . . . . . . . . 10 8 8 8 8Additional paid-in capital . . . . . . . . . . . . . . . . . . . . . . . . . . . . . . . . . 26,423 16,859 15,811 17,098 17,454Retained earnings . . . . . . . . . . . . . . . . . . . . . . . . . . . . . . . . . . . . . 21,363 19,501 22,403 19,884 16,574Treasury stock, at cost . . . . . . . . . . . . . . . . . . . . . . . . . . . . . . . . . . (172) (190) (236) (2,890) (1,357)Accumulated other comprehensive income (loss) . . . . . . . . . . . . . . . . . 1,000 (3,058) (14,253) 1,078 1,118
Total MetLife, Inc.’s stockholders’ equity . . . . . . . . . . . . . . . . . . . . . . 48,625 33,121 23,734 35,179 33,798Noncontrolling interests . . . . . . . . . . . . . . . . . . . . . . . . . . . . . . . . . . 371 377 251 1,806 1,448
Total equity . . . . . . . . . . . . . . . . . . . . . . . . . . . . . . . . . . . . . . . . 48,996 33,498 23,985 36,985 35,246
Total liabilities and equity . . . . . . . . . . . . . . . . . . . . . . . . . . . . . . . . $730,906 $539,314 $501,678 $559,149 $528,107
2010 2009 2008 2007 2006
Years Ended December 31,
(In millions, except per share data)
Other Data(1), (4)Net income (loss) available to MetLife, Inc.’s common shareholders . . . . . . . . . $2,668 $(2,368) $ 3,084 $ 4,180 $ 6,159Return on MetLife, Inc.’s common equity . . . . . . . . . . . . . . . . . . . . . . . . . . . 6.9% (9.0)% 11.2% 12.9% 20.9%Return on MetLife, Inc.’s common equity, excluding accumulated other
comprehensive income (loss) . . . . . . . . . . . . . . . . . . . . . . . . . . . . . . . . . 7.0% (6.8)% 9.1% 13.3% 22.1%EPS Data(1), (5)Income (Loss) from Continuing Operations Available to MetLife, Inc.’s Common
Shareholders Per Common Share:Basic . . . . . . . . . . . . . . . . . . . . . . . . . . . . . . . . . . . . . . . . . . . . . . . . . . $ 3.01 $ (2.94) $ 4.60 $ 5.32 $ 3.64Diluted . . . . . . . . . . . . . . . . . . . . . . . . . . . . . . . . . . . . . . . . . . . . . . . . . $ 2.99 $ (2.94) $ 4.54 $ 5.19 $ 3.59
Income (Loss) from Discontinued Operations Per Common Share:Basic . . . . . . . . . . . . . . . . . . . . . . . . . . . . . . . . . . . . . . . . . . . . . . . . . . $ 0.01 $ 0.05 $ (0.41) $ 0.30 $ 4.45Diluted . . . . . . . . . . . . . . . . . . . . . . . . . . . . . . . . . . . . . . . . . . . . . . . . . $ 0.01 $ 0.05 $ (0.40) $ 0.29 $ 4.40
Net Income (Loss) Available to MetLife, Inc.’s Common Shareholders Per CommonShare:Basic . . . . . . . . . . . . . . . . . . . . . . . . . . . . . . . . . . . . . . . . . . . . . . . . . . $ 3.02 $ (2.89) $ 4.19 $ 5.62 $ 8.09Diluted . . . . . . . . . . . . . . . . . . . . . . . . . . . . . . . . . . . . . . . . . . . . . . . . . $ 3.00 $ (2.89) $ 4.14 $ 5.48 $ 7.99
Cash Dividends Declared Per Common Share . . . . . . . . . . . . . . . . . . . . . . . . . $ 0.74 $ 0.74 $ 0.74 $ 0.74 $ 0.59
(1) On November 1, 2010, the Holding Company acquired ALICO. The results of the Acquisition are reflected in the 2010 selected financialdata. See Note 2 of the Notes to the Consolidated Financial Statements.
4 MetLife, Inc.

(2) At December 31, 2010, general account assets, long-term debt and other liabilities include amounts relating to variable interest entities of$11,080 million, $6,902 million and $93 million, respectively.
(3) Policyholder liabilities and other policy-related balances include future policy benefits, policyholder account balances, other policy-related balances, policyholder dividends payable and the policyholder dividend obligation.
(4) Return on MetLife, Inc.’s common equity is defined as net income (loss) available to MetLife, Inc.’s common shareholders divided byMetLife, Inc.’s average common stockholders’ equity.
(5) For the year ended December 31, 2009, shares related to the assumed exercise or issuance of stock-based awards have been excludedfrom the calculation of diluted earnings per common share as these assumed shares are anti-dilutive.
BusinessWith a more than 140-year history, we have grown to become a leading global provider of insurance, annuities and employee benefit
programs, serving 90 million customers in over 60 countries. Through our subsidiaries and affiliates, MetLife holds leading market positions inthe United States (“U.S.”), Japan, Latin America, Asia Pacific, Europe and the Middle East. Over the past several years, we have grown ourcore businesses, as well as successfully executed on our growth strategy. This has included completing a number of transactions that haveresulted in the acquisition and, in some cases, divestiture of certain businesses while also further strengthening our balance sheet to positionMetLife for continued growth.
On November 1, 2010 (the “Acquisition Date”), MetLife, Inc. completed the acquisition of American Life Insurance Company (“AmericanLife”), from ALICO Holdings LLC (“ALICO Holdings”), a subsidiary of American International Group, Inc. (“AIG”), and Delaware American LifeInsurance Company (“DelAm,”) from AIG, (American Life, together with DelAm, collectively, “ALICO”) (the “Acquisition”) for a total purchaseprice of $16.4 billion. The business acquired in the Acquisition provides consumers and businesses with products and services, lifeinsurance, accident and health insurance, retirement and wealth management solutions. This transaction delivers on our global growthstrategies, adding significant scale and reach to MetLife’s international footprint, furthering our diversification in geographic mix and productofferings, as well as increasing our distribution strength. See Note 2 of the Notes to the Consolidated Financial Statements.
MetLife is organized into five segments: Insurance Products, Retirement Products, Corporate Benefit Funding and Auto & Home(collectively, “U.S. Business”) and International. The assets and liabilities of ALICO as of November 30, 2010 and the operating resultsof ALICO from the Acquisition Date through November 30, 2010 are included in the International segment. In addition, the Company reportscertain of its results of operations in Banking, Corporate & Other, which includes MetLife Bank, National Association (“MetLife Bank”) andother business activities. For reporting periods beginning in 2011, our non-U.S. Business results will be presented within two separatesegments: Japan and Other International Regions. MetLife’s management continues to evaluate the Company’s segment performance andallocated resources and may adjust such measurements in the future to better reflect segment profitability.
U.S. Business provides a variety of insurance and financial services products — including life, dental, disability, auto and homeownerinsurance, guaranteed interest and stable value products, and annuities — through both proprietary and independent retail distributionchannels, as well as at the workplace. This business serves over 60,000 group customers, including over 90 of the top one hundredFORTUNE 500» companies, and provides protection and retirement solutions to millions of individuals.
International operates in Japan and 64 countries within Latin America, Asia Pacific, Europe and the Middle East. MetLife is the largest lifeinsurer in Mexico and also holds leading market positions in Japan, Poland, Chile and South Korea. This business provides life insurance,accident and health insurance, credit insurance, annuities, endowment and retirement & savings products to both individuals and groups.International is the fastest-growing of MetLife’s businesses, and we believe it will be one of the largest future growth areas.
Within the U.S., we also provide a variety of mortgage and deposit products through MetLife Bank. Results of our banking operation arereported in Banking, Corporate & Other.
U.S. Business markets our products and services through various distribution groups. Our life insurance and retirement products targetedto individuals are sold via sales forces, comprised of MetLife employees, in addition to third-party organizations. Our group life, non-medicalhealth and corporate benefit funding products are sold via sales forces primarily comprised of MetLife employees. Personal lines property andcasualty insurance products are directly marketed to employees at their employer’s worksite. Auto & Home products are also marketed andsold to individuals by independent agents and property and casualty specialists through a direct response channel and the individualdistribution sales group. MetLife sales employees work with all distribution groups to better reach and service customers, brokers,consultants and other intermediaries.
International markets its products and services through a multi-distribution strategy which varies by geographic region. The variousdistribution channels include: agency, bancassurance, direct marketing (“DM”), brokerage and e-commerce. In developing countries, agencycovers the needs of the emerging middle class with primarily traditional products (e.g., endowment and accident and health). In moredeveloped and mature markets, agents, while continuing to serve their existing customers to keep pace with their developing financial needs,also target upper middle class and high net worth customer bases with a more sophisticated product set including more investment-sensitiveproducts, such as universal life, mutual fund and single premium deposits. In the bancassurance channel, International leverages partner-ships that span all regions. In addition, DM has extensive and far reaching capabilities in all regions. The DM operations deploy both broadcastmarketing approaches (e.g. direct response TV, web-based lead generation) and traditional DM techniques such as telemarketing. Japanrepresents the largest DM market.
Operating revenues derived from any customer did not exceed 10% of consolidated operating revenues in any of the last three years.Financial information, including revenues, expenses, operating earnings, and total assets by segment, is provided in Note 22 of the Notes tothe Consolidated Financial Statements. Operating revenues and operating earnings are performance measures that are not based onaccounting principles generally accepted in the United States of America (“GAAP”). See “Management’s Discussion and Analysis of FinancialCondition and Results of Operations” for definitions of such measures.
Management’s Discussion and Analysis of Financial Condition and Results of OperationsFor purposes of this discussion, “MetLife,” the “Company,” “we,” “our” and “us” refer to MetLife, Inc., a Delaware corporation incorporated
in 1999 (the “Holding Company”), its subsidiaries and affiliates. Following this summary is a discussion addressing the consolidated results ofoperations and financial condition of the Company for the periods indicated. This discussion should be read in conjunction with “Note
5MetLife, Inc.

Regarding Forward Looking Statements,” “Selected Financial Data” and the Company’s consolidated financial statements included else-where herein and “Risk Factors” included in MetLife’s Annual Report on Form 10-K for the Year Ended December 31, 2010, as amended onForm 10-K/A filed with the SEC on March 1, 2011, and as updated by MetLife’s report on Form 8-K filed with the SEC on March 1, 2011.
This Management’s Discussion and Analysis of Financial Condition and Results of Operations may contain or incorporate by referenceinformation that includes or is based upon forward-looking statements within the meaning of the Private Securities Litigation Reform Act of1995. Forward-looking statements give expectations or forecasts of future events. These statements can be identified by the fact that they donot relate strictly to historical or current facts. They use words such as “anticipate,” “estimate,” “expect,” “project,” “intend,” “plan,” “believe”and other words and terms of similar meaning in connection with a discussion of future operating or financial performance. In particular, theseinclude statements relating to future actions, prospective services or products, future performance or results of current and anticipatedservices or products, sales efforts, expenses, the outcome of contingencies such as legal proceedings, trends in operations and financialresults. Any or all forward-looking statements may turn out to be wrong. Actual results could differ materially from those expressed or impliedin the forward-looking statements. See “Note Regarding Forward-Looking Statements.”
The following discussion includes references to our performance measures operating earnings and operating earnings available tocommon shareholders, that are not based on accounting principles generally accepted in the United States of America (“GAAP”). Operatingearnings is the measure of segment profit or loss we use to evaluate segment performance and allocate resources and, consistent with GAAPaccounting guidance for segment reporting, is our measure of segment performance. Operating earnings is also a measure by which oursenior management’s and many other employees’ performance is evaluated for the purposes of determining their compensation underapplicable compensation plans. Operating earnings is defined as operating revenues less operating expenses, net of income tax. Operatingearnings available to common shareholders, which is used to evaluate the performance of Banking, Corporate & Other, as well as MetLife, isdefined as operating earnings less preferred stock dividends.
Operating revenues is defined as GAAP revenues (i) less net investment gains (losses) and net derivative gains (losses); (ii) lessamortization of unearned revenue related to net investment gains (losses) and net derivative gains (losses); (iii) plus scheduled periodicsettlement payments on derivatives that are hedges of investments but do not qualify for hedge accounting treatment; (iv) plus income fromdiscontinued real estate operations; (v) less net investment income related to contractholder-directed unit-linked investments; and (vi) plus,for operating joint ventures reported under the equity method of accounting, the aforementioned adjustments, those identified in the definitionof operating expenses and changes in the fair value of hedges of operating joint venture liabilities, all net of income tax.
Operating expenses is defined as GAAP expenses (i) less changes in policyholder benefits associated with asset value fluctuations relatedto experience-rated contractholder liabilities and certain inflation-indexed liabilities; (ii) less costs related to business combinations (sinceJanuary 1, 2009) and noncontrolling interests; (iii) less amortization of deferred policy acquisition costs (“DAC”) and value of businessacquired (“VOBA”) and changes in the policyholder dividend obligation related to net investment gains (losses) and net derivative gains(losses); (iv) less interest credited to policyholder account balances (“PABs”) related to contractholder-directed unit-linked investments; and(v) plus scheduled periodic settlement payments on derivatives that are hedges of PABs but do not qualify for hedge accounting treatment.
In addition, operating revenues and operating expenses do not reflect the consolidation of certain securitization entities that are variableinterest entities (“VIEs”) as required under GAAP.
We believe the presentation of operating earnings and operating earnings available to common shareholders as we measure it formanagement purposes enhances the understanding of our performance by highlighting the results of operations and the underlyingprofitability drivers of our businesses. Operating earnings and operating earnings available to common shareholders should not be viewed assubstitutes for GAAP income (loss) from continuing operations, net of income tax. Reconciliations of operating earnings and operatingearnings available to common shareholders to GAAP income (loss) from continuing operations, net of income tax, the most directlycomparable GAAP measure, are included in “— Results of Operations.”
In this discussion, we sometimes refer to sales activity for various products. These sales statistics do not correspond to revenues underGAAP, but are used as relevant measures of business activity.
Executive SummaryMetLife is a leading global provider of insurance, annuities and employee benefit programs throughout the United States (“U.S.”), Japan,
Latin America, Asia Pacific, Europe and the Middle East. Through its subsidiaries and affiliates, MetLife offers life insurance, annuities, autoand homeowners insurance, retail banking and other financial services to individuals, as well as group insurance and retirement & savingsproducts and services to corporations and other institutions. MetLife is organized into five segments: Insurance Products, RetirementProducts, Corporate Benefit Funding and Auto & Home (collectively, “U.S. Business”) and International. The assets and liabilities of AmericanLife Insurance Company (“American Life”) and Delaware American Life Insurance Company (“DelAm,” together with American Life, collectively,“ALICO”) as of November 30, 2010 and the operating results of ALICO from November 1, 2010 (the “Acquisition Date”) through November 30,2010 are included in the International segment. In addition, the Company reports certain of its results of operations in Banking, Corporate &Other, which is comprised of MetLife Bank, National Association (“MetLife Bank”) and other business activities. For reporting periodsbeginning in 2011, our non-U.S. Business results will be presented within two separate segments: Japan and Other International Regions.
On the Acquisition Date, the Holding Company completed the acquisition of American Life from ALICO Holdings LLC (“ALICO Holdings”), asubsidiary of American International Group, Inc. (“AIG”), and DelAm from AIG, (the “Acquisition”) for a total purchase price of $16.4 billion. Thebusiness acquired in the Acquisition provides consumers and businesses with life insurance, accident and health insurance, retirement andwealth management solutions. This transaction delivers on our global growth strategies, adding significant scale and reach to MetLife’sinternational footprint, furthering our diversification in geographic mix and product offerings, as well as increasing our distribution strength.See Note 2 of the Notes to the Consolidated Financial Statements.
As the U.S. and global financial markets continue to recover, we have experienced a significant improvement in net investment income andfavorable changes in net investment and net derivative gains (losses). We also continue to experience an increase in market share and sales insome of our businesses, in part, from a flight to quality in the industry. These positive factors were somewhat dampened by the negativeimpact of general economic conditions, including high levels of unemployment, on the demand for certain of our products.
6 MetLife, Inc.
2010 2009 2008
Years Ended December 31,
(In millions)
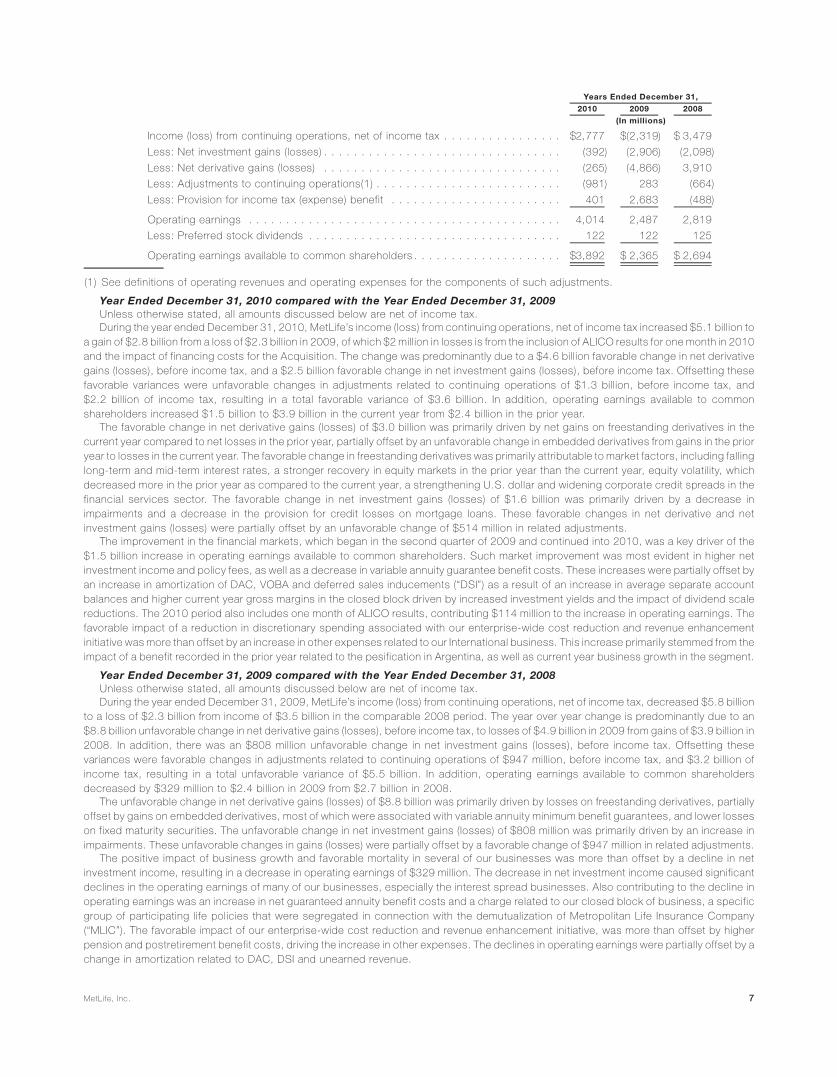
Income (loss) from continuing operations, net of income tax . . . . . . . . . . . . . . . . $2,777 $(2,319) $ 3,479
Less: Net investment gains (losses) . . . . . . . . . . . . . . . . . . . . . . . . . . . . . . . . (392) (2,906) (2,098)
Less: Net derivative gains (losses) . . . . . . . . . . . . . . . . . . . . . . . . . . . . . . . . (265) (4,866) 3,910
Less: Adjustments to continuing operations(1) . . . . . . . . . . . . . . . . . . . . . . . . . (981) 283 (664)
Less: Provision for income tax (expense) benefit . . . . . . . . . . . . . . . . . . . . . . . 401 2,683 (488)
Operating earnings . . . . . . . . . . . . . . . . . . . . . . . . . . . . . . . . . . . . . . . . . . 4,014 2,487 2,819
Less: Preferred stock dividends . . . . . . . . . . . . . . . . . . . . . . . . . . . . . . . . . . 122 122 125
Operating earnings available to common shareholders . . . . . . . . . . . . . . . . . . . . $3,892 $ 2,365 $ 2,694
(1) See definitions of operating revenues and operating expenses for the components of such adjustments.
Year Ended December 31, 2010 compared with the Year Ended December 31, 2009Unless otherwise stated, all amounts discussed below are net of income tax.During the year ended December 31, 2010, MetLife’s income (loss) from continuing operations, net of income tax increased $5.1 billion to
a gain of $2.8 billion from a loss of $2.3 billion in 2009, of which $2 million in losses is from the inclusion of ALICO results for one month in 2010and the impact of financing costs for the Acquisition. The change was predominantly due to a $4.6 billion favorable change in net derivativegains (losses), before income tax, and a $2.5 billion favorable change in net investment gains (losses), before income tax. Offsetting thesefavorable variances were unfavorable changes in adjustments related to continuing operations of $1.3 billion, before income tax, and$2.2 billion of income tax, resulting in a total favorable variance of $3.6 billion. In addition, operating earnings available to commonshareholders increased $1.5 billion to $3.9 billion in the current year from $2.4 billion in the prior year.
The favorable change in net derivative gains (losses) of $3.0 billion was primarily driven by net gains on freestanding derivatives in thecurrent year compared to net losses in the prior year, partially offset by an unfavorable change in embedded derivatives from gains in the prioryear to losses in the current year. The favorable change in freestanding derivatives was primarily attributable to market factors, including fallinglong-term and mid-term interest rates, a stronger recovery in equity markets in the prior year than the current year, equity volatility, whichdecreased more in the prior year as compared to the current year, a strengthening U.S. dollar and widening corporate credit spreads in thefinancial services sector. The favorable change in net investment gains (losses) of $1.6 billion was primarily driven by a decrease inimpairments and a decrease in the provision for credit losses on mortgage loans. These favorable changes in net derivative and netinvestment gains (losses) were partially offset by an unfavorable change of $514 million in related adjustments.
The improvement in the financial markets, which began in the second quarter of 2009 and continued into 2010, was a key driver of the$1.5 billion increase in operating earnings available to common shareholders. Such market improvement was most evident in higher netinvestment income and policy fees, as well as a decrease in variable annuity guarantee benefit costs. These increases were partially offset byan increase in amortization of DAC, VOBA and deferred sales inducements (“DSI”) as a result of an increase in average separate accountbalances and higher current year gross margins in the closed block driven by increased investment yields and the impact of dividend scalereductions. The 2010 period also includes one month of ALICO results, contributing $114 million to the increase in operating earnings. Thefavorable impact of a reduction in discretionary spending associated with our enterprise-wide cost reduction and revenue enhancementinitiative was more than offset by an increase in other expenses related to our International business. This increase primarily stemmed from theimpact of a benefit recorded in the prior year related to the pesification in Argentina, as well as current year business growth in the segment.
Year Ended December 31, 2009 compared with the Year Ended December 31, 2008Unless otherwise stated, all amounts discussed below are net of income tax.During the year ended December 31, 2009, MetLife’s income (loss) from continuing operations, net of income tax, decreased $5.8 billion
to a loss of $2.3 billion from income of $3.5 billion in the comparable 2008 period. The year over year change is predominantly due to an$8.8 billion unfavorable change in net derivative gains (losses), before income tax, to losses of $4.9 billion in 2009 from gains of $3.9 billion in2008. In addition, there was an $808 million unfavorable change in net investment gains (losses), before income tax. Offsetting thesevariances were favorable changes in adjustments related to continuing operations of $947 million, before income tax, and $3.2 billion ofincome tax, resulting in a total unfavorable variance of $5.5 billion. In addition, operating earnings available to common shareholdersdecreased by $329 million to $2.4 billion in 2009 from $2.7 billion in 2008.
The unfavorable change in net derivative gains (losses) of $8.8 billion was primarily driven by losses on freestanding derivatives, partiallyoffset by gains on embedded derivatives, most of which were associated with variable annuity minimum benefit guarantees, and lower losseson fixed maturity securities. The unfavorable change in net investment gains (losses) of $808 million was primarily driven by an increase inimpairments. These unfavorable changes in gains (losses) were partially offset by a favorable change of $947 million in related adjustments.
The positive impact of business growth and favorable mortality in several of our businesses was more than offset by a decline in netinvestment income, resulting in a decrease in operating earnings of $329 million. The decrease in net investment income caused significantdeclines in the operating earnings of many of our businesses, especially the interest spread businesses. Also contributing to the decline inoperating earnings was an increase in net guaranteed annuity benefit costs and a charge related to our closed block of business, a specificgroup of participating life policies that were segregated in connection with the demutualization of Metropolitan Life Insurance Company(“MLIC”). The favorable impact of our enterprise-wide cost reduction and revenue enhancement initiative, was more than offset by higherpension and postretirement benefit costs, driving the increase in other expenses. The declines in operating earnings were partially offset by achange in amortization related to DAC, DSI and unearned revenue.
7MetLife, Inc.

Consolidated Company OutlookAs a result of the Acquisition, operations outside the U.S. are expected to contribute approximately 30% of the premiums, fees and other
revenues and approximately 40% of MetLife’s operating earnings in 2011.In 2010, general economic conditions improved and interest rates remained low throughout the year. In 2011, we expect a significant
improvement in the operating earnings of the Company, driven primarily by the following:• Premiums, fees and other revenues growth in 2011 of approximately 30%, of which 27% is directly attributable to the Acquisition. The
remaining 3% increase is driven by:• Increases in our non-U.S. businesses from continuing organic growth throughout our various geographic regions;• Higher fees earned on separate accounts, as the equity markets continue to improve, thereby increasing the value of those separate
accounts. In addition, net flows of variable annuities are expected to continue to be strong in 2011, which also increases the accountvalues upon which these fees are earned;
• Increased sales in the pension closeout business, both in the U.S. and the United Kingdom (“U.K.”), as we expect the demand forthese products to return to a more normal level in 2011.
• Focus on disciplined underwriting. We see no significant changes to the underlying trends that drive underwriting results and anticipatesolid results in 2011.
• Focus on expense management. We continue to focus on expense control throughout the Company, specifically managing the costsassociated with the integration of ALICO. We also expect to begin realizing cost synergies later in 2011.
• Returns on investment portfolio. Although the market environment remains challenging, we expect the returns on our investmentportfolio in 2011, with respect to both income and realized gains and losses, will be in line with the results achieved in 2010.
More difficult to predict is the impact of potential changes in fair value of freestanding and embedded derivatives as even relatively smallmovements in market variables, including interest rates, equity levels and volatility, can have a large impact on the fair value of derivatives andnet derivative gains (losses). Additionally, changes in fair value of embedded derivatives within certain insurance liabilities may have a materialimpact on net derivative gains (losses) related to the inclusion of an adjustment for nonperformance risk.
Industry TrendsDespite improvement in general economic conditions in 2010, we continue to be impacted by the unstable global financial and economic
environment that has been affecting the industry.
Financial and Economic Environment. Our business and results of operations are materially affected by conditions in the global capitalmarkets and the economy, generally, both in the U.S. and elsewhere around the world. The global economy and markets are now recoveringfrom a period of significant stress that began in the second half of 2007 and substantially increased through the first quarter of 2009. Thisdisruption adversely affected the financial services industry, in particular. The U.S. economy entered a recession in late 2007. This recessionended in mid-2009, but the recovery from the recession has been below historic averages and the unemployment rate is expected to remainhigh for some time. In addition, inflation has fallen over the last several years and is expected to remain at low levels for some time. Someeconomists believe that some level of disinflation and deflation risk remains in the economy.
Throughout 2008 and continuing in 2009, Congress, the Federal Reserve Bank of New York, the Federal Deposit Insurance Corporation(“FDIC”), the U.S. Treasury and other agencies of the Federal government took a number of increasingly aggressive actions (in addition tocontinuing a series of interest rate reductions that began in the second half of 2007) intended to provide liquidity to financial institutions andmarkets, to avert a loss of investor confidence in particular troubled institutions, to prevent or contain the spread of the financial crisis and tospur economic growth. Most of these programs have run their course or have been discontinued. The monetary policy by the Federal ReserveBoard and the Dodd-Frank Wall Street Reform and Consumer Protection Act (“Dodd-Frank”), which was signed by President Obama in July2010, are more likely to be relevant to MetLife, Inc. and will significantly change financial regulation in the U.S. See “— Regulatory Changes.”In addition, the oversight body of the Basel Committee on Banking Supervision announced in December 2010 increased capital and liquidityrequirements (commonly referred to as “Basel III”) for bank holding companies, such as MetLife, Inc. Assuming these requirements areendorsed and adopted by the U.S., they are to be phased in beginning January 1, 2013. It is possible that even more stringent capital andliquidity requirements could be imposed under Dodd-Frank and Basel III.
It is not certain what effect the enactment of Dodd-Frank or Basel III will have on the financial markets, the availability of credit, asset pricesand MetLife’s operations. We cannot predict whether the funds made available by the U.S. Federal government and its agencies will beenough to continue stabilizing or to further revive the financial markets or, if additional amounts are necessary, whether Congress will be willingto make the necessary appropriations, what the public’s sentiment would be towards any such appropriations, or what additional require-ments or conditions might be imposed on the use of any such additional funds.
The imposition of additional regulation on large financial institutions may have, over time, the effect of supporting some aspects of thefinancial services industry more than others. This could adversely affect our competitive position.
Although the disruption in the global financial markets has moderated, not all such markets are functioning normally, and some remainreliant upon government intervention and liquidity. The global recession and disruption of the financial markets has also led to concerns overcapital markets access and the solvency of certain European Union member states, including Portugal, Ireland, Italy, Greece and Spain. Inresponse, on May 10, 2010, the European Union, the European Central Bank and the International Monetary Fund announced a rescuepackage of up to a750 billion, or approximately $1 trill ion, for European nations in the Eurozone. This rescue package is intended to stabilizethese economies. The Japanese economy, to which we face increased exposure as a result of the Acquisition, continues to experience lownominal growth, a deflationary environment, and weak consumer spending.
Recent global economic conditions have had and could continue to have an adverse effect on the financial results of companies in thefinancial services industry, including MetLife. Such global economic conditions, as well as the global financial markets, continue to impact ournet investment income, our net investment and net derivative gains (losses), and the demand for and the cost and profitability of certain of ourproducts, including variable annuities and guarantee benefits. See “— Results of Operations” and “— Liquidity and Capital Resources.”
Competitive Pressures. The life insurance industry remains highly competitive. The product development and product life-cycles haveshortened in many product segments, leading to more intense competition with respect to product features. Larger companies have theability to invest in brand equity, product development, technology and risk management, which are among the fundamentals for sustained
8 MetLife, Inc.
profitable growth in the life insurance industry. In addition, several of the industry’s products can be quite homogeneous and subject tointense price competition. Sufficient scale, financial strength and financial flexibility are becoming prerequisites for sustainable growth in thelife insurance industry. Larger market participants tend to have the capacity to invest in additional distribution capability and the informationtechnology needed to offer the superior customer service demanded by an increasingly sophisticated industry client base. We believe thatthe turbulence in financial markets that began in the second half of 2007, its impact on the capital position of many competitors, andsubsequent actions by regulators and rating agencies have highlighted financial strength as a significant differentiator from the perspective ofcustomers and certain distributors. In addition, the financial market turbulence and the economic recession have led many companies in ourindustry to re-examine the pricing and features of the products they offer and may lead to consolidation in the life insurance industry.
Regulatory Changes. The U.S. life insurance industry is regulated at the state level, with some products and services also subject toFederal regulation. As life insurers introduce new and often more complex products, regulators refine capital requirements and introduce newreserving standards for the life insurance industry. Regulations recently adopted or currently under review can potentially impact the statutoryreserve and capital requirements of the industry. In addition, regulators have undertaken market and sales practices reviews of severalmarkets or products, including equity-indexed annuities, variable annuities and group products. The regulation of the financial servicesindustry in the U.S. and internationally has received renewed scrutiny as a result of the disruptions in the financial markets in 2008 and 2009.Significant regulatory reforms have been proposed and these or other reforms could be implemented. See “Business — U.S. Regulation” and“Business — International Regulation.” We cannot predict whether any such reforms will be adopted, the form they will take or their effectupon us. We also cannot predict how the various government responses to the recent financial and economic difficulties will affect thefinancial services and insurance industries or the standing of particular companies, including us, within those industries. See “Business —Governmental Responses to Extraordinary Market Conditions,” “Risk Factors — Our Insurance, Brokerage and Banking Businesses AreHeavily Regulated, and Changes in Regulation May Reduce Our Profitability and Limit Our Growth” and “Risk Factors — Changes inU.S. Federal and State Securities Laws and Regulations, and State Insurance Regulations Regarding Suitability of Annuity Product Sales, MayAffect Our Operations and Our Profitability.” Until various studies are completed and final regulations are promulgated pursuant to Dodd-Frank, the full impact of Dodd-Frank on the investments, investment activities and insurance and annuity products of the Company remainunclear. See “Risk Factors — Various Aspects of Dodd-Frank Could Impact Our Business Operations, Capital Requirements and Profitabilityand Limit Our Growth.” Under Dodd-Frank, as a large, interconnected bank holding company with assets of $50 billion or more, or possibly asan otherwise systemically important financial company, MetLife, Inc. will be subject to enhanced prudential standards imposed onsystemically significant financial companies. Enhanced standards will be applied to Tier 1 and total risk-based capital (“RBC”), liquidity,leverage (unless another, similar standard is appropriate for the Company), resolution plan and credit exposure reporting, concentrationlimits, and risk management. The so-called “Volcker Rule” provisions of Dodd-Frank restrict the ability of affiliates of insured depositoryinstitutions (such as MetLife Bank) to engage in proprietary trading or sponsor or invest in hedge funds or private equity funds. See “RiskFactors — Various Aspects of Dodd-Frank Could Impact Our Business Operations, Capital Requirements and Profitability and Limit OurGrowth.”
Mortgage and Foreclosure-Related Exposures. In 2008 MetLife Bank acquired certain assets to enter the forward and reverse residentialmortgage origination and servicing business, including rights to service residential mortgage loans. At various times since then, includingmost recently in the third quarter of 2010, MetLife Bank has acquired additional residential mortgage loan servicing rights. As an originator andservicer of mortgage loans, which are usually sold to an investor shortly after origination, MetLife Bank has obligations to repurchase loansupon demand by the investor due to (i) a determination that material representations made in connection with the sale of the loans (relating, forexample, to the underwriting and origination of the loans) are incorrect or (ii) defects in servicing of the loan. MetLife Bank is indemnified by thesellers of the acquired assets, for various periods depending on the transaction and the nature of the claim, for origination and servicingdeficiencies that occurred prior to MetLife Bank’s acquisition, including indemnification for any repurchase claims made from investors whopurchased mortgage loans from the sellers. Substantially all mortgage servicing rights (“MSRs”) that were acquired by MetLife Bank relate toloans sold to Federal National Mortgage Association (“FNMA”) or Federal Home Loan Mortgage Corporation (“FHLMC”). Since the 2008acquisitions, MetLife Bank has originated and sold mortgages primarily to FNMA, FHLMC and Government National Mortgage Association(“GNMA”) (collectively, the “Agency Investors”) and, to a limited extent, a small number of private investors. Currently 99% of MetLife Bank’s$83 billion servicing portfolio is comprised of products sold to Agency Investors. Other than repurchase obligations which are subject toindemnification by sellers of acquired assets as described above, MetLife Bank’s exposure to repurchase obligations and losses related toorigination deficiencies is limited to the approximately $52 billion of loans originated by MetLife Bank (all of which have been originated sinceAugust 2008) and to servicing deficiencies after the date of acquisition, and management is satisfied that adequate provision has been madein the Company’s consolidated financial statements for all probable and reasonably estimable repurchase obligations and losses.
In light of recent events concerning foreclosure proceedings within the industry, MetLife Bank has undertaken a close review of itsprocedures. MetLife Bank verifies the accuracy of borrower information included in affidavits filed in foreclosure proceedings. We do notbelieve that MetLife Bank has material exposure to potential losses arising from challenges to its foreclosure procedures. Like other mortgageservicers, MetLife Bank has been the subject of recent inquiries and investigations from state attorneys general and banking regulators. SeeNote 16 of the Notes to the Consolidated Financial Statements.
Summary of Critical Accounting EstimatesThe preparation of financial statements in conformity with GAAP requires management to adopt accounting policies and make estimates
and assumptions that affect amounts reported in the consolidated financial statements. The most critical estimates include those used indetermining:
(i) the estimated fair value of investments in the absence of quoted market values;(ii) investment impairments;(iii) the recognition of income on certain investment entities and the application of the consolidation rules to certain investments;(iv) the estimated fair value of and accounting for freestanding derivatives and the existence and estimated fair value of embedded
derivatives requiring bifurcation;(v) the capitalization and amortization of DAC and the establishment and amortization of VOBA;(vi) the measurement of goodwill and related impairment, if any;(vii) the liability for future policyholder benefits and the accounting for reinsurance contracts;
9MetLife, Inc.

(viii) accounting for income taxes and the valuation of deferred tax assets;(ix) accounting for employee benefit plans; and(x) the liability for litigation and regulatory matters.
The application of purchase accounting requires the use of estimation techniques in determining the estimated fair values of assetsacquired and liabilities assumed — the most significant of which relate to aforementioned critical accounting estimates. In applying theCompany’s accounting policies, we make subjective and complex judgments that frequently require estimates about matters that areinherently uncertain. Many of these policies, estimates and related judgments are common in the insurance and financial services industries;others are specific to the Company’s businesses and operations. Actual results could differ from these estimates.
Fair ValueThe Company defines fair value as the price that would be received to sell an asset or paid to transfer a liability (an exit price) in the principal
or most advantageous market for the asset or liability in an orderly transaction between market participants on the measurement date. In manycases, the exit price and the transaction (or entry) price will be the same at initial recognition. However, in certain cases, the transaction pricemay not represent fair value. The fair value of a liability is based on the amount that would be paid to transfer a liability to a third party with thesame credit standing. It requires that fair value be a market-based measurement in which the fair value is determined based on a hypotheticaltransaction at the measurement date, considered from the perspective of a market participant. When quoted prices are not used to determinefair value of an asset, the Company considers three broad valuation techniques: (i) the market approach, (ii) the income approach, and (iii) thecost approach. The Company determines the most appropriate valuation technique to use, given what is being measured and the availabilityof sufficient inputs. The Company prioritizes the inputs to fair valuation techniques and allows for the use of unobservable inputs to the extentthat observable inputs are not available. The Company categorizes its assets and liabilities measured at estimated fair value into a three-levelhierarchy, based on the priority of the inputs to the respective valuation technique. The fair value hierarchy gives the highest priority to quotedprices in active markets for identical assets or liabilities (Level 1) and the lowest priority to unobservable inputs (Level 3). An asset or liability’sclassification within the fair value hierarchy is based on the lowest level of input to its valuation. The input levels are as follows:
Level 1 Unadjusted quoted prices in active markets for identical assets or liabilities. The Company defines active markets based onaverage trading volume for equity securities. The size of the bid/ask spread is used as an indicator of market activity for fixedmaturity securities.
Level 2 Quoted prices in markets that are not active or inputs that are observable either directly or indirectly. Level 2 inputs includequoted prices for similar assets or liabilities other than quoted prices in Level 1; quoted prices in markets that are not active; orother significant inputs that are observable or can be derived principally from or corroborated by observable market data forsubstantially the full term of the assets or liabilities.
Level 3 Unobservable inputs that are supported by little or no market activity and are significant to the estimated fair value of the assets orliabilities. Unobservable inputs reflect the reporting entity’s own assumptions about the assumptions that market participantswould use in pricing the asset or liability. Level 3 assets and liabilities include financial instruments whose values are determinedusing pricing models, discounted cash flow methodologies, or similar techniques, as well as instruments for which thedetermination of estimated fair value requires significant management judgment or estimation.
Prior to January 1, 2009, the measurement and disclosures of fair value based on exit price excluded certain items such as nonfinancialassets and nonfinancial liabilities initially measured at estimated fair value in a business combination, reporting units measured at estimatedfair value in the first step of a goodwill impairment test and indefinite-lived intangible assets measured at estimated fair value for impairmentassessment.
In addition, the Company elected the fair value option (“FVO”) for certain of its financial instruments to better match measurement of assetsand liabilities in the consolidated statements of operations.
Estimated Fair Value of InvestmentsThe Company’s investments in fixed maturity and equity securities, investments in trading and other securities, certain short-term
investments, most mortgage loans held-for-sale, and MSRs are reported at their estimated fair value. In determining the estimated fair value ofthese investments, various methodologies, assumptions and inputs are utilized, as described further below.
When available, the estimated fair value of securities is based on quoted prices in active markets that are readily and regularly obtainable.Generally, these are the most liquid of the Company’s securities holdings and valuation of these securities does not involve managementjudgment.
When quoted prices in active markets are not available, the determination of estimated fair value is based on market standard valuationmethodologies. The market standard valuation methodologies utilized include: discounted cash flow methodologies, matrix pricing or othersimilar techniques. The inputs to these market standard valuation methodologies include, but are not limited to: interest rates, credit standingof the issuer or counterparty, industry sector of the issuer, coupon rate, call provisions, sinking fund requirements, maturity, estimatedduration and management’s assumptions regarding liquidity and estimated future cash flows. Accordingly, the estimated fair values are basedon available market information and management’s judgments about financial instruments.
The significant inputs to the market standard valuation methodologies for certain types of securities with reasonable levels of pricetransparency are inputs that are observable in the market or can be derived principally from or corroborated by observable market data. Suchobservable inputs include benchmarking prices for similar assets in active, liquid markets, quoted prices in markets that are not active andobservable yields and spreads in the market.
When observable inputs are not available, the market standard valuation methodologies for determining the estimated fair value of certaintypes of securities that trade infrequently, and therefore have little or no price transparency, rely on inputs that are significant to the estimatedfair value that are not observable in the market or cannot be derived principally from or corroborated by observable market data. Theseunobservable inputs can be based in large part on management judgment or estimation, and cannot be supported by reference to marketactivity. Even though unobservable, these inputs are based on assumptions deemed appropriate given the circumstances and consistentwith what other market participants would use when pricing such securities.
The estimated fair value of residential mortgage loans held-for-sale is determined based on observable pricing of residential mortgageloans held-for-sale with similar characteristics, or observable pricing for securities backed by similar types of loans, adjusted to convert thesecurities prices to loan prices. Generally, quoted market prices are not available. When observable pricing for similar loans or securities that
10 MetLife, Inc.

are backed by similar loans are not available, the estimated fair values of residential mortgage loans held-for-sale are determined usingindependent broker quotations, which is intended to approximate the amounts that would be received from third parties. Certain othermortgage loans have also been designated as held-for-sale which are recorded at the lower of amortized cost or estimated fair value lessexpected disposition costs determined on an individual loan basis. For these loans, estimated fair value is determined using independentbroker quotations or, when the loan is in foreclosure or otherwise determined to be collateral dependent, the estimated fair value of theunderlying collateral estimated using internal models.
MSRs, which are recorded in other invested assets, are measured at estimated fair value and are either acquired or are generated from thesale of originated residential mortgage loans where the servicing rights are retained by the Company. The estimated fair value of MSRs isprincipally determined through the use of internal discounted cash flow models which utilize various assumptions. Valuation inputs andassumptions include generally observable items such as type and age of loan, loan interest rates, current market interest rates, and certainunobservable inputs, including assumptions regarding estimates of discount rates, loan prepayments and servicing costs, all of which aresensitive to changing markets conditions. The use of different valuation assumptions and inputs, as well as assumptions relating to thecollection of expected cash flows, may have a material effect on the estimated fair values of MSRs.
Financial markets are susceptible to severe events evidenced by rapid depreciation in asset values accompanied by a reduction in assetliquidity. The Company’s ability to sell securities, or the price ultimately realized for these securities, depends upon the demand and liquidity inthe market and increases the use of judgment in determining the estimated fair value of certain securities.
Investment ImpairmentsOne of the significant estimates related to available-for-sale securities is the evaluation of investments for impairments. The assessment of
whether impairments have occurred is based on our case-by-case evaluation of the underlying reasons for the decline in estimated fair value.The Company’s review of its fixed maturity and equity securities for impairments includes an analysis of the total gross unrealized losses bythree categories of severity and/or age of the gross unrealized loss, as described more fully in Note 3 of the Notes to the ConsolidatedFinancial Statements. An extended and severe unrealized loss position on a fixed maturity security may not have any impact on the ability ofthe issuer to service all scheduled interest and principal payments and the Company’s evaluation of recoverability of all contractual cash flowsor the ability to recover an amount at least equal to its amortized cost based on the present value of the expected future cash flows to becollected. In contrast, for certain equity securities, greater weight and consideration are given by the Company to a decline in estimated fairvalue and the likelihood such estimated fair value decline will recover.
Additionally, we consider a wide range of factors about the security issuer and use our best judgment in evaluating the cause of the declinein the estimated fair value of the security and in assessing the prospects for near-term recovery. Inherent in our evaluation of the security areassumptions and estimates about the operations of the issuer and its future earnings potential. Considerations used by the Company in theimpairment evaluation process include, but are not limited to:
(i) the length of time and the extent to which the estimated fair value has been below cost or amortized cost;(ii) the potential for impairments of securities when the issuer is experiencing significant financial difficulties;(iii) the potential for impairments in an entire industry sector or sub-sector;(iv) the potential for impairments in certain economically depressed geographic locations;(v) the potential for impairments of securities where the issuer, series of issuers or industry has suffered a catastrophic type of loss
or has exhausted natural resources;(vi) with respect to fixed maturity securities, whether the Company has the intent to sell or will more likely than not be required to sell
a particular security before recovery of the decline in estimated fair value below cost or amortized cost;(vii) with respect to equity securities, whether the Company’s ability and intent to hold the security for a period of time sufficient to
allow for the recovery of its value to an amount equal to or greater than cost;(viii) unfavorable changes in projected cash flows on mortgage-backed and asset-backed securities (“ABS”); and(ix) other subjective factors, including concentrations and information obtained from regulators and rating agencies.
The cost of fixed maturity and equity securities is adjusted for the credit loss component of Other-Than-Temporary Impairment (“OTTI”) inthe period in which the determination is made. When an OTTI of a fixed maturity security has occurred, the amount of the OTTI recognized inearnings depends on whether the Company intends to sell the security or more likely than not will be required to sell the security beforerecovery of the decline in estimated fair value below amortized cost. If the fixed maturity security meets either of these two criteria, the OTTIrecognized in earnings is equal to the entire difference between the security’s amortized cost and its estimated fair value at the impairmentmeasurement date. For OTTI of fixed maturity securities that do not meet either of these two criteria, the net amount recognized in earnings isequal to the difference between the amortized cost of the fixed maturity security and the present value of projected future cash flows expectedto be collected from this security (“credit loss”). If the estimated fair value is less than the present value of projected future cash flows expectedto be collected, this portion of OTTI related to other than credit factors (“noncredit loss”) is recorded as other comprehensive income (loss).For equity securities, the carrying value of the equity security is impaired to its estimated fair value, with a corresponding charge to earnings.The Company does not make any adjustments for subsequent recoveries in value.
The determination of the amount of allowances and impairments on other invested asset classes is highly subjective and is based upon theCompany’s periodic evaluation and assessment of known and inherent risks associated with the respective asset class. Such evaluations andassessments are revised as conditions change and new information becomes available.
Recognition of Income on Certain Investment EntitiesThe recognition of income on certain investments (e.g. loan-backed securities, including mortgage-backed and ABS, certain structured
investment transactions, trading and other securities) is dependent upon market conditions, which could result in prepayments and changesin amounts to be earned.
Application of the Consolidation Rules to Certain InvestmentsThe Company has invested in certain structured transactions that are VIEs. These structured transactions include reinsurance trusts,
asset-backed securitizations, hybrid securities, real estate joint ventures, other limited partnership interests and limited liability companies.The Company is required to consolidate those VIEs for which it is deemed to be the primary beneficiary. The accounting rules for thedetermination of when an entity is a VIE and when to consolidate a VIE are complex. The determination of the VIE’s primary beneficiary requires
11MetLife, Inc.

an evaluation of the contractual and implied rights and obligations associated with each party’s relationship with or involvement in the entity,an estimate of the entity’s expected losses and expected residual returns and the allocation of such estimates to each party involved in theentity. The Company generally uses a qualitative approach to determine whether it is the primary beneficiary.
For most VIEs, the entity that has both the ability to direct the most significant activities of the VIE and the obligation to absorb losses orreceive benefits that could be significant to the VIE is considered the primary beneficiary. However, for VIEs that are investment companies orapply measurement principles consistent with those utilized by investment companies, the primary beneficiary is based on a risks andrewards model and is defined as the entity that will absorb a majority of a VIE’s expected losses, receive a majority of a VIE’s expected residualreturns if no single entity absorbs a majority of expected losses, or both. The Company reassesses its involvement with VIEs on a quarterlybasis. The use of different methodologies, assumptions and inputs in the determination of the primary beneficiary could have a material effecton the amounts presented within the consolidated financial statements.
Derivative Financial InstrumentsThe Company enters into freestanding derivative transactions including swaps, forwards, futures and option contracts to manage various
risks relating to its ongoing business operations. To a lesser extent, the Company uses credit derivatives, such as credit default swaps, tosynthetically replicate investment risks and returns which are not readily available in the cash market.
The estimated fair value of derivatives is determined through the use of quoted market prices for exchange-traded derivatives and interestforwards to sell certain to-be-announced securities or through the use of pricing models for over-the-counter (“OTC”) derivatives. Thedetermination of estimated fair value, when quoted market values are not available, is based on market standard valuation methodologies andinputs that are assumed to be consistent with what other market participants would use when pricing the instruments. Derivative valuationscan be affected by changes in interest rates, foreign currency exchange rates, financial indices, credit spreads, default risk (including thecounterparties to the contract), volatility, liquidity and changes in estimates and assumptions used in the pricing models. See Note 5 of theNotes to the Consolidated Financial Statements for additional details on significant inputs into the OTC derivative pricing models and creditrisk adjustment.
The accounting for derivatives is complex and interpretations of the primary accounting guidance continue to evolve in practice. Judgmentis applied in determining the availability and application of hedge accounting designations and the appropriate accounting treatment undersuch accounting guidance. If it was determined that hedge accounting designations were not appropriately applied, reported net incomecould be materially affected. Differences in judgment as to the availability and application of hedge accounting designations and theappropriate accounting treatment may result in a differing impact on the consolidated financial statements of the Company from thatpreviously reported. Assessments of hedge effectiveness and measurements of ineffectiveness of hedging relationships are also subject tointerpretations and estimations and different interpretations or estimates may have a material effect on the amount reported in net income.
Embedded DerivativesThe Company issues certain variable annuity products with guaranteed minimum benefits. These include guaranteed minimum withdrawal
benefits (“GMWB”), guaranteed minimum accumulation benefits (“GMAB”), and certain guaranteed minimum income benefits (“GMIB”).GMWB, GMAB and certain GMIB are embedded derivatives, which are measured at estimated fair value separately from the host variableannuity product, with changes in estimated fair value reported in net derivative gains (losses).
The estimated fair values of these embedded derivatives are determined based on the present value of projected future benefits minus thepresent value of projected future fees. The projections of future benefits and future fees require capital market and actuarial assumptionsincluding expectations concerning policyholder behavior. A risk neutral valuation methodology is used under which the cash flows from theguarantees are projected under multiple capital market scenarios using observable risk free rates. The valuation of these embeddedderivatives also includes an adjustment for the Company’s nonperformance risk and risk margins for non-capital market inputs. Thenonperformance risk adjustment is determined by taking into consideration publicly available information relating to spreads in the secondarymarket for the Holding Company’s debt, including related credit default swaps. These observable spreads are then adjusted, as necessary, toreflect the priority of these liabilities and the claims paying ability of the issuing insurance subsidiaries compared to the Holding Company. Riskmargins are established to capture the non-capital market risks of the instrument which represent the additional compensation a marketparticipant would require to assume the risks related to the uncertainties of such actuarial assumptions as annuitization, premium persistency,partial withdrawal and surrenders. The establishment of risk margins requires the use of significant management judgment.
The accounting for embedded derivatives is complex and interpretations of the primary accounting standards continue to evolve inpractice. If interpretations change, there is a risk that features previously not bifurcated may require bifurcation and reporting at estimated fairvalue in the consolidated financial statements and respective changes in estimated fair value could materially affect net income.
These guaranteed minimum benefits may be more costly than expected in volatile or declining equity markets. Market conditionsincluding, but not limited to, changes in interest rates, equity indices, market volatility and foreign currency exchange rates, changes in theCompany’s nonperformance risk, variations in actuarial assumptions regarding policyholder behavior, mortality and risk margins related tonon-capital market inputs may result in significant fluctuations in the estimated fair value of the guarantees that could materially affect netincome.
The Company ceded the risk associated with certain of the GMIB and GMAB described in the preceding paragraphs. The value of theembedded derivatives on the ceded risk is determined using a methodology consistent with that described previously for the guaranteesdirectly written by the Company.
As part of its regular review of critical accounting estimates, the Company periodically assesses inputs for estimating nonperformance riskin fair value measurements. During the second quarter of 2010, the Company completed a study that aggregated and evaluated data,including historical recovery rates of insurance companies as well as policyholder behavior observed over the past two years as the recentfinancial crisis evolved. As a result, at the end of the second quarter of 2010, the Company refined the manner in which its insurancesubsidiaries incorporate expected recovery rates into the nonperformance risk adjustment for purposes of estimating the fair value ofinvestment-type contracts and embedded derivatives within insurance contracts. The refinement impacted the Company’s income fromcontinuing operations, net of income tax, with no effect on operating earnings.
As described above, the valuation of variable annuity guarantees accounted for as embedded derivatives includes an adjustment for theCompany’s nonperformance risk, which is subject to variability. The table below illustrates the impact that a range of reasonably likelyvariances in credit spreads would have on the Company’s consolidated balance sheet, excluding the effect of income tax. Changes in the
12 MetLife, Inc.

carrying values of PABs would be reported in net investment gains (losses) and changes in the carrying value of DAC and VOBA would bereported in other expenses. However, these estimated effects do not take into account potential changes in other variables, such as equityprice levels and market volatility, that can also contribute significantly to changes in carrying values. Therefore, the table does not necessarilyreflect the ultimate impact on the consolidated financial statements under the credit spread variance scenarios presented below.
In determining the ranges, the Company has considered current market conditions as well as the market level of spreads that canreasonably be anticipated over the near term. The ranges do not reflect extreme market conditions experienced during the 2008 and 2009economic crisis as the Company does not consider those to be reasonably likely events in the near future.
PABsDAC and
VOBA
Carrying ValueAt December 31, 2010
(In millions)
100% increase in the Company’s credit spread . . . . . . . . . . . . . . . . . . . . . . . . . . . . . . . . . . . $1,551 $ 79
As reported . . . . . . . . . . . . . . . . . . . . . . . . . . . . . . . . . . . . . . . . . . . . . . . . . . . . . . . . . . $2,357 $110
50% decrease in the Company’s credit spread . . . . . . . . . . . . . . . . . . . . . . . . . . . . . . . . . . . $2,852 $130The estimated fair value of the embedded equity and bond indexed derivatives contained in certain funding agreements is determined
using market standard swap valuation models and observable market inputs, including an adjustment for the Company’s nonperformance riskthat takes into consideration publicly available information relating to the Company’s debt, as well as its claims paying ability. Changes inequity and bond indices, interest rates and the Company’s credit standing may result in significant fluctuations in estimated the fair value ofthese embedded derivatives that could materially affect net income.
Deferred Policy Acquisition Costs and Value of Business AcquiredThe Company incurs significant costs in connection with acquiring new and renewal insurance business. Costs that vary with and relate to
the production of new business are deferred as DAC. Such costs consist principally of commissions and agency and policy issuanceexpenses. VOBA is an intangible asset that represents the excess of book value over the estimated fair value of acquired insurance, annuity,and investment-type contracts in-force at the acquisition date. The estimated fair value of the acquired liabilities is based on actuariallydetermined projections, by each block of business, of future policy and contract charges, premiums, mortality and morbidity, separateaccount performance, surrenders, operating expenses, investment returns, nonperformance risk adjustment and other factors. Actualexperience on the purchased business may vary from these projections. The recovery of DAC and VOBA is dependent upon the futureprofitability of the related business. DAC and VOBA are aggregated in the consolidated financial statements for reporting purposes.
Note 1 of the Notes to the Consolidated Financial Statements describes the Company’s accounting policy relating to DAC and VOBAamortization for various types of contracts.
Separate account rates of return on variable universal life contracts and variable deferred annuity contracts affect in-force accountbalances on such contracts each reporting period which can result in significant fluctuations in amortization of DAC and VOBA. TheCompany’s practice to determine the impact of gross profits resulting from returns on separate accounts assumes that long-term appre-ciation in equity markets is not changed by short-term market fluctuations, but is only changed when sustained interim deviations areexpected. The Company monitors these events and only changes the assumption when its long-term expectation changes. The effect of anincrease/(decrease) by 100 basis points in the assumed future rate of return is reasonably likely to result in a decrease/(increase) in the DACand VOBA amortization of approximately $128 million with an offset to the Company’s unearned revenue liability of approximately $19 millionfor this factor.
The Company also periodically reviews other long-term assumptions underlying the projections of estimated gross margins and profits.These include investment returns, policyholder dividend scales, interest crediting rates, mortality, persistency, and expenses to administerbusiness. We annually update assumptions used in the calculation of estimated gross margins and profits which may have significantlychanged. If the update of assumptions causes expected future gross margins and profits to increase, DAC and VOBA amortization willdecrease, resulting in a current period increase to earnings. The opposite result occurs when the assumption update causes expected futuregross margins and profits to decrease.
The Company’s most significant assumption updates resulting in a change to expected future gross margins and profits and theamortization of DAC and VOBA were due to revisions to expected future investment returns, expenses, in-force or persistency assumptionsand policyholder dividends on contracts included within the Insurance Products and Retirement Products segments. The Company expectsthese assumptions to be the ones most reasonably likely to cause significant changes in the future. Changes in these assumptions can beoffsetting and the Company is unable to predict their movement or offsetting impact over time.
Note 6 of the Notes to the Consolidated Financial Statements provides a rollforward of DAC and VOBA for the Company for each of theyears ended December 31, 2010, 2009 and 2008, as well as a breakdown of DAC and VOBA by segment and reporting unit at December 31,2010 and 2009.
At December 31, 2010, 2009 and 2008, DAC and VOBA for the Company was $27.3 billion, $19.3 billion and $20.1 million, respectively.The DAC and VOBA balance increased significantly as a result of the Acquisition, which contributed $8.9 billion to the balance atDecember 31, 2010. Approximately 55%, of the Company’s DAC and VOBA was associated with the Insurance Products and RetirementProducts segments at December 31, 2010. At December 31, 2010, 2009 and 2008, DAC and VOBA for these segments was $14.9 billion,$16.1 billion and $17.4 billion, respectively. Amortization of DAC and VOBA associated with the variable and universal life and the annuitiescontracts within the Insurance Products and Retirement Products segments is significantly impacted by movements in equity markets. Thefollowing chart illustrates the effect on DAC and VOBA within the Company’s U.S. Business of changing each of the respective assumptions,as well as updating estimated gross margins or profits with actual gross margins or profits during the years ended December 31, 2010, 2009and 2008. Increases (decreases) in DAC and VOBA balances, as presented below, resulted in a corresponding decrease (increase) inamortization.
13MetLife, Inc.

2010 2009 2008
Years Ended December 31,
(In millions)
Investment return . . . . . . . . . . . . . . . . . . . . . . . . . . . . . . . . . . . . . . . . . . . . . . . . . . $ 3 $141 $ 70
Separate account balances . . . . . . . . . . . . . . . . . . . . . . . . . . . . . . . . . . . . . . . . . . . 21 (32) (708)
Net investment gain (loss) . . . . . . . . . . . . . . . . . . . . . . . . . . . . . . . . . . . . . . . . . . . . (124) 712 (521)
Expense . . . . . . . . . . . . . . . . . . . . . . . . . . . . . . . . . . . . . . . . . . . . . . . . . . . . . . . 89 60 61
In-force/Persistency . . . . . . . . . . . . . . . . . . . . . . . . . . . . . . . . . . . . . . . . . . . . . . . . 17 (87) (159)
Policyholder dividends and other . . . . . . . . . . . . . . . . . . . . . . . . . . . . . . . . . . . . . . . (192) 174 (30)
Total . . . . . . . . . . . . . . . . . . . . . . . . . . . . . . . . . . . . . . . . . . . . . . . . . . . . . . . . . . $(186) $968 $(1,287)
The following represents significant items contributing to the changes to DAC and VOBA amortization in 2010:• Changes in net investment gains (losses) resulted in the following changes in DAC and VOBA amortization:
– Actual gross profits increased as a result of a decrease in liabilities associated with guarantee obligations on variable annuities,resulting in an increase of DAC and VOBA amortization of $197 million, excluding the impact from the Company’s nonperformancerisk and risk margins, which are described below. This increase in actual gross profits was partially offset by freestanding derivativelosses associated with the hedging of such guarantee obligations, which resulted in a decrease in DAC and VOBA amortization of$88 million.
– The narrowing of the Company’s nonperformance risk adjustment increased the valuation of guarantee liabilities, decreased actualgross profits and decreased DAC and VOBA amortization by $96 million. In addition, higher risk margins which increased theguarantee liability valuations, decreased actual gross profits and decreased DAC and VOBA amortization by $18 million.
– The remainder of the impact of net investment gains (losses), which increased DAC amortization by $129 million, was primarilyattributable to current period investment activities.
• Included in policyholder dividends and other was an increase in DAC and VOBA amortization of $42 million as a result of changes tolong-term assumptions. In addition, amortization increased by $39 million as a result of favorable gross margin variances. The remainderof the increase was due to various immaterial items.
The following represents significant items contributing to the changes to DAC and VOBA amortization in 2009:• Actual gross profits decreased as a result of increased investment losses from the portfolios associated with the hedging of guaranteed
insurance obligations on variable annuities, resulting in a decrease of DAC and VOBA amortization of $141 million.• Changes in net investment gains (losses) resulted in the following changes in DAC and VOBA amortization:
– Actual gross profits increased as a result of a decrease in liabilities associated with guarantee obligations on variable annuities,resulting in an increase of DAC and VOBA amortization of $995 million, excluding the impact from the Company’s nonperformancerisk and risk margins, which are described below. This increase in actual gross profits was partially offset by freestanding derivativelosses associated with the hedging of such guarantee obligations, which resulted in a decrease in DAC and VOBA amortization of$636 million.
– The narrowing of the Company’s nonperformance risk adjustment increased the valuation of guarantee liabilities, decreased actualgross profits and decreased DAC and VOBA amortization by $607 million. This was partially offset by lower risk margins whichdecreased the guarantee liability valuations, increased actual gross profits and increased DAC and VOBA amortization by $20 million.
– The remainder of the impact of net investment gains (losses), which decreased DAC amortization by $484 million, was primarilyattributable to current period investment activities.
• Included in policyholder dividends and other was a decrease in DAC and VOBA amortization of $90 million as a result of changes to long-term assumptions. The remainder of the decrease was due to various immaterial items.
The following represents significant items contributing to the changes in DAC and VOBA amortization in 2008:• The decrease in equity markets during the year significantly lowered separate account balances which led to a significant reduction in
expected future gross profits on variable universal life contracts and variable deferred annuity contracts resulting in an increase of$708 million in DAC and VOBA amortization.
• Changes in net investment gains (losses) resulted in the following changes in DAC and VOBA amortization:– Actual gross profits decreased as a result of an increase in liabilities associated with guarantee obligations on variable annuities
resulting in a reduction of DAC and VOBA amortization of $1,047 million. This decrease in actual gross profits was mitigated byfreestanding derivative gains associated with the hedging of such guarantee obligations which resulted in an increase in actual grossprofits and an increase in DAC and VOBA amortization of $625 million.
– The widening of the Company’s nonperformance risk adjustment decreased the valuation of guarantee liabilities, increased actualgross profits and increased DAC and VOBA amortization by $739 million. This was partially offset by higher risk margins whichincreased the guarantee liability valuations, decreased actual gross profits and decreased DAC and VOBA amortization by$100 million.
– Reductions in both actual and expected cumulative earnings of the closed block resulting from recent experience in the closed blockcombined with changes in expected dividend scales resulted in an increase in closed block DAC amortization of $195 million,$175 million of which was related to net investment gains (losses).
– The remainder of the impact of net investment gains (losses) on DAC amortization of $129 million was attributable to numerousimmaterial items.
• Increases in DAC and VOBA amortization in 2008 resulting from changes in assumptions related to in-force/persistency of $159 millionwere driven by higher than anticipated mortality and lower than anticipated premium persistency during 2008.
The Company’s DAC and VOBA balance is also impacted by unrealized investment gains (losses) and the amount of amortization whichwould have been recognized if such gains and losses had been recognized. The increase in unrealized investment gains decreased the DACand VOBA balance by $1.4 billion in 2010. The decrease in unrealized investment losses decreased the DAC and VOBA balance by
14 MetLife, Inc.

$2.8 billion in 2009, whereas the increase in unrealized investment losses increased the DAC and VOBA balance by $3.4 billion in 2008.Notes 3 and 6 of the Notes to the Consolidated Financial Statements include the DAC and VOBA offset to unrealized investment losses.
GoodwillGoodwill is the excess of cost over the estimated fair value of net assets acquired. Goodwill is not amortized but is tested for impairment at
least annually or more frequently if events or circumstances, such as adverse changes in the business climate, indicate that there may bejustification for conducting an interim test.
Impairment testing is performed using the fair value approach, which requires the use of estimates and judgment, at the “reporting unit”level. A reporting unit is the operating segment or a business one level below the operating segment, if discrete financial information isprepared and regularly reviewed by management at that level.
For purposes of goodwill impairment testing, if the carrying value of a reporting unit exceeds its estimated fair value, there might be anindication of impairment. In such instances, the implied fair value of the goodwill is determined in the same manner as the amount of goodwillthat would be determined in a business acquisition. The excess of the carrying value of goodwill over the implied fair value of goodwill wouldbe recognized as an impairment and recorded as a charge against net income.
The key inputs, judgments and assumptions necessary in determining estimated fair value of the reporting units include projectedoperating earnings, current book value (with and without accumulated other comprehensive income), the level of economic capital required tosupport the mix of business, long-term growth rates, comparative market multiples, the account value of in-force business, projections of newand renewal business, as well as margins on such business, the level of interest rates, credit spreads, equity market levels, and the discountrate that we believe is appropriate for the respective reporting unit. The estimated fair values of the retirement products and individual lifereporting units are particularly sensitive to the equity market levels.
We apply significant judgment when determining the estimated fair value of our reporting units and when assessing the relationship ofmarket capitalization to the aggregate estimated fair value of our reporting units. The valuation methodologies utilized are subject to keyjudgments and assumptions that are sensitive to change. Estimates of fair value are inherently uncertain and represent only management’sreasonable expectation regarding future developments. These estimates and the judgments and assumptions upon which the estimates arebased will, in all likelihood, differ in some respects from actual future results. Declines in the estimated fair value of our reporting units couldresult in goodwill impairments in future periods which could materially adversely affect our results of operations or financial position.
On an ongoing basis, we evaluate potential triggering events that may affect the estimated fair value of our reporting units to assesswhether any goodwill impairment exists. Deteriorating or adverse market conditions for certain reporting units may have a significant impacton the estimated fair value of these reporting units and could result in future impairments of goodwill.
Liability for Future Policy BenefitsThe Company establishes liabilities for amounts payable under insurance policies, including traditional life insurance, traditional annuities,
certain accident and health, and non-medical health insurance. Generally, amounts are payable over an extended period of time and relatedliabilities are calculated as the present value of future expected benefits to be paid reduced by the present value of future expected premiums.Such liabilities are established based on methods and underlying assumptions in accordance with GAAP and applicable actuarial standards.Principal assumptions used in the establishment of liabilities for future policy benefits are mortality, morbidity, policy lapse, renewal,retirement, disability incidence, disability terminations, investment returns, inflation, expenses and other contingent events as appropriate tothe respective product type and geographical area. These assumptions are established at the time the policy is issued and are intended toestimate the experience for the period the policy benefits are payable. Utilizing these assumptions, liabilities are established on a block ofbusiness basis. If experience is less favorable than assumptions, additional liabilities may be required, resulting in a charge to policyholderbenefits and claims.
Future policy benefit liabilities for disabled lives are estimated using the present value of benefits method and experience assumptions asto claim terminations, expenses and interest.
Liabilities for unpaid claims and claim expenses for property and casualty insurance are included in future policyholder benefits andrepresent the amount estimated for claims that have been reported but not settled and claims incurred but not reported. Other policy-relatedbalances include claims that have been reported but not settled and claims incurred but not reported on life and non-medical healthinsurance. Liabilities for unpaid claims are estimated based upon the Company’s historical experience and other actuarial assumptions thatconsider the effects of current developments, anticipated trends and risk management programs, reduced for anticipated salvage andsubrogation.
Future policy benefit liabilities for minimum death and income benefit guarantees relating to certain annuity contracts and secondary andpaid-up guarantees relating to certain life policies are based on estimates of the expected value of benefits in excess of the projected accountbalance and recognizing the excess ratably over the accumulation period based on total expected assessments. Liabilities for universal andvariable life secondary guarantees and paid-up guarantees are determined by estimating the expected value of death benefits payable whenthe account balance is projected to be zero and recognizing those benefits ratably over the accumulation period based on total expectedassessments. The assumptions used in estimating these liabilities are consistent with those used for amortizing DAC, and are thus subject tothe same variability and risk. The assumptions of investment performance and volatility for variable products are consistent with historicalexperience of the appropriate underlying equity index, such as the Standard & Poor’s Ratings Services (“S&P”) 500 Index.
The Company periodically reviews its estimates of actuarial liabilities for future policy benefits and compares them with its actualexperience. Differences between actual experience and the assumptions used in pricing of these policies and guarantees and in theestablishment of the related liabilities result in variances in profit and could result in losses.
ReinsuranceThe Company enters into reinsurance agreements primarily as a purchaser of reinsurance for its various insurance products and also as a
provider of reinsurance for some insurance products issued by third parties. Accounting for reinsurance requires extensive use ofassumptions and estimates, particularly related to the future performance of the underlying business and the potential impact of counterpartycredit risks. The Company periodically reviews actual and anticipated experience compared to the aforementioned assumptions used toestablish assets and liabilities relating to ceded and assumed reinsurance and evaluates the financial strength of counterparties to itsreinsurance agreements using criteria similar to that evaluated in the security impairment process discussed previously. Additionally, for each
15MetLife, Inc.

of its reinsurance agreements, the Company determines whether the agreement provides indemnification against loss or liability relating toinsurance risk, in accordance with applicable accounting standards. The Company reviews all contractual features, particularly those thatmay limit the amount of insurance risk to which the reinsurer is subject or features that delay the timely reimbursement of claims. If theCompany determines that a reinsurance agreement does not expose the reinsurer to a reasonable possibility of a significant loss frominsurance risk, the Company records the agreement using the deposit method of accounting.
Income TaxesIncome taxes represent the net amount of income taxes that the Company expects to pay to or receive from various taxing jurisdictions in
connection with its operations. The Company provides for federal, state and foreign income taxes currently payable, as well as those deferreddue to temporary differences between the financial reporting and tax bases of assets and liabilities. The Company’s accounting for incometaxes represents management’s best estimate of various events and transactions.
Deferred tax assets and liabilities resulting from temporary differences between the financial reporting and tax bases of assets andliabilities are measured at the balance sheet date using enacted tax rates expected to apply to taxable income in the years the temporarydifferences are expected to reverse.
For U.S. federal income tax purposes, the Company anticipates making an election under the Internal Revenue Code Section 338 as itrelates to the Acquisition. As such, the tax basis in the acquired assets and liabilities is adjusted as of the Acquisition Date resulting in achange to the related deferred income taxes.
The realization of deferred tax assets depends upon the existence of sufficient taxable income within the carryback or carryforward periodsunder the tax law in the applicable tax jurisdiction. Valuation allowances are established when management determines, based on availableinformation, that it is more likely than not that deferred income tax assets will not be realized. Factors in management’s determination considerthe performance of the business including the ability to generate capital gains. Significant judgment is required in determining whethervaluation allowances should be established, as well as the amount of such allowances. When making such determination, consideration isgiven to, among other things, the following:
(i) future taxable income exclusive of reversing temporary differences and carryforwards;(ii) future reversals of existing taxable temporary differences;(iii) taxable income in prior carryback years; and(iv) tax planning strategies.
The Company determines whether it is more likely than not that a tax position will be sustained upon examination by the appropriate taxingauthorities before any part of the benefit is recorded in the financial statements. A tax position is measured at the largest amount of benefit thatis greater than 50 percent likely of being realized upon settlement. The Company may be required to change its provision for income taxeswhen the ultimate deductibility of certain items is challenged by taxing authorities or when estimates used in determining valuation allowanceson deferred tax assets significantly change, or when receipt of new information indicates the need for adjustment in valuation allowances.Additionally, future events, such as changes in tax laws, tax regulations, or interpretations of such laws or regulations, could have an impacton the provision for income tax and the effective tax rate. Any such changes could significantly affect the amounts reported in theconsolidated financial statements in the year these changes occur.
Employee Benefit PlansCertain subsidiaries of the Holding Company sponsor and/or administer pension and other postretirement benefit plans covering
employees who meet specified eligibility requirements. The obligations and expenses associated with these plans require an extensiveuse of assumptions such as the discount rate, expected rate of return on plan assets, rate of future compensation increases, healthcare costtrend rates, as well as assumptions regarding participant demographics such as rate and age of retirements, withdrawal rates and mortality. Inconsultation with our external consulting actuarial firms, we determine these assumptions based upon a variety of factors such as historicalperformance of the plan and its assets, currently available market and industry data, and expected benefit payout streams. The assumptionsused may differ materially from actual results due to, among other factors, changing market and economic conditions and changes inparticipant demographics. These differences may have a significant effect on the Company’s consolidated financial statements and liquidity.
Litigation ContingenciesThe Company is a party to a number of legal actions and is involved in a number of regulatory investigations. Given the inherent
unpredictability of these matters, it is difficult to estimate the impact on the Company’s financial position. Liabilities are established when it isprobable that a loss has been incurred and the amount of the loss can be reasonably estimated. Liabilities related to certain lawsuits, includingthe Company’s asbestos-related liability, are especially difficult to estimate due to the limitation of available data and uncertainty regardingnumerous variables that can affect liability estimates. The data and variables that impact the assumptions used to estimate the Company’sasbestos-related liability include the number of future claims, the cost to resolve claims, the disease mix and severity of disease in pendingand future claims, the impact of the number of new claims filed in a particular jurisdiction and variations in the law in the jurisdictions in whichclaims are filed, the possible impact of tort reform efforts, the willingness of courts to allow plaintiffs to pursue claims against the Companywhen exposure to asbestos took place after the dangers of asbestos exposure were well known, and the impact of any possible futureadverse verdicts and their amounts. On a quarterly and annual basis, the Company reviews relevant information with respect to liabilities forlitigation, regulatory investigations and litigation-related contingencies to be reflected in the Company’s consolidated financial statements. Itis possible that an adverse outcome in certain of the Company’s litigation and regulatory investigations, including asbestos-related cases, orthe use of different assumptions in the determination of amounts recorded could have a material effect upon the Company’s consolidated netincome or cash flows in particular quarterly or annual periods.
Economic CapitalEconomic capital is an internally developed risk capital model, the purpose of which is to measure the risk in the business and to provide a
basis upon which capital is deployed. The economic capital model accounts for the unique and specific nature of the risks inherent in ourbusinesses. As a part of the economic capital process, a portion of net investment income is credited to the segments based on the level ofallocated equity. This is in contrast to the standardized regulatory RBC formula, which is not as refined in its risk calculations with respect tothe nuances of our businesses.
16 MetLife, Inc.

Acquisitions and DispositionsSee Note 2 of the Notes to the Consolidated Financial Statements.
Risks Related to International OperationsInternational operations such as ours face various political, legal, operational, economic, foreign exchange and other risks. We face the
risk of discriminatory regulation, nationalization or expropriation of assets, price controls and exchange controls or other restrictions thatprevent us from transferring funds among countries in which we operate or converting funds from one currency to another, and fluctuatingexchange rates. We may also encounter labor problems resulting from workers’ associations and trade unions. In several countries, includingJapan, China and India, we must manage our relationship with local business partners in order to achieve our business objectives. Because ofour considerable presence in Japan, we face the risks (as well as benefits) from events and conditions, such as economic, demographic,political, or environmental factors, that may uniquely affect that country.
Recent DevelopmentsOn March 8, 2011, MetLife, Inc. issued and sold 68,570,000 shares of its common stock in a public offering and ALICO Holdings, a
subsidiary of AIG, sold in a public offering 78,239,712 shares of MetLife, Inc.’s common stock, which it received as consideration fromMetLife in connection with the Acquisition. The gross proceeds for the sale of 146,809,712 common shares at $43.25 per share was$6.4 billion, of which MetLife received $3.0 billion. Concurrent with the common stock offerings, ALICO Holdings sold 40,000,000 commonequity units of MetLife, Inc., which it received from MetLife in connection with the Acquisition. The Company used all of the proceeds from theissuance of its 68,570,000 shares of common stock to repurchase and cancel 6,857,000 shares of MetLife convertible preferred stockreceived by ALICO Holdings from MetLife in connection with the Acquisition. The Company did not receive any of the proceeds from the saleof the 78,239,712 shares of common stock or 40,000,000 common equity units owned by ALICO Holdings.
The transactions allowed for an orderly disposition of the MetLife, Inc. securities owned by AIG. As a result of the transactions, AIG has soldall of its holdings of MetLife, Inc. securities it received in the Acquisition. In connection with these transactions, the Company waived certainprovisions of the Investor Rights Agreement that the Company and ALICO Holdings entered into at the time of the Acquisition. Among otherthings, the Investor Rights Agreement required ALICO Holdings to hold specified amounts of MetLife, Inc. securities for certain designatedperiods of time.
As the scope and scale of the disaster in Japan continue to unfold after the March 11, 2011 earthquake off the coast of Honshu, MetLifemaintains a focus on the safety of its associates and their families and helping its business in Japan deliver on its promises to its customersand business partners. Our business in Japan is open, operating and meeting the needs of our customers there. Although it is premature todraw any conclusions about the effect of the earthquake and ensuing events on MetLife’s business in Japan, if any, MetLife continues tomonitor the situation in the region for its employees, customers and operations.
17MetLife, Inc.

Results of Operations
Year Ended December 31, 2010 compared with the Year Ended December 31, 2009We have experienced growth and an increase in market share in several of our businesses, which, together with improved overall market
conditions compared to conditions a year ago, positively impacted our results most significantly through increased net cash flows, improvedyields on our investment portfolio and increased policy fee income. Sales of our domestic annuity products were up 14%, driven by anincrease in variable annuity sales compared with the prior year. We benefited in 2010 from strong sales of structured settlement products.Market penetration continues in our pension closeout business in the U.K.; however, although improving, our domestic pension closeoutbusiness has been adversely impacted by a combination of poor equity returns and lower interest rates. High levels of unemploymentcontinue to depress growth across our group insurance businesses due to lower covered payrolls. While we experienced growth in our grouplife business, sales of non-medical health and individual life products declined. Sales of new homeowner and auto policies increased 11% and4%, respectively, as the housing and automobile markets have improved. We experienced a 30% increase in sales of retirement and savingsproducts abroad. During 2010, mortgage refinancing activity continued to return to more moderate levels compared to the unusually highlevels experienced in 2009.
2010 2009 Change % Change
Years EndedDecember 31,
(In millions)
Revenues
Premiums . . . . . . . . . . . . . . . . . . . . . . . . . . . . . . . . . . . . . . . . . . . $27,394 $26,460 $ 934 3.5%
Universal life and investment-type product policy fees . . . . . . . . . . . . . . 6,037 5,203 834 16.0%
Net investment income . . . . . . . . . . . . . . . . . . . . . . . . . . . . . . . . . . 17,615 14,837 2,778 18.7%
Other revenues . . . . . . . . . . . . . . . . . . . . . . . . . . . . . . . . . . . . . . . 2,328 2,329 (1) —%
Net investment gains (losses) . . . . . . . . . . . . . . . . . . . . . . . . . . . . . . (392) (2,906) 2,514 86.5%
Net derivative gains (losses) . . . . . . . . . . . . . . . . . . . . . . . . . . . . . . . (265) (4,866) 4,601 94.6%
Total revenues . . . . . . . . . . . . . . . . . . . . . . . . . . . . . . . . . . . . . . 52,717 41,057 11,660 28.4%
Expenses
Policyholder benefits and claims and policyholder dividends . . . . . . . . . . 31,031 29,986 1,045 3.5%
Interest credited to policyholder account balances . . . . . . . . . . . . . . . . 4,925 4,849 76 1.6%
Interest credited to bank deposits . . . . . . . . . . . . . . . . . . . . . . . . . . . 137 163 (26) (16.0)%
Capitalization of DAC . . . . . . . . . . . . . . . . . . . . . . . . . . . . . . . . . . . (3,343) (3,019) (324) (10.7)%
Amortization of DAC and VOBA . . . . . . . . . . . . . . . . . . . . . . . . . . . . . 2,801 1,307 1,494 114.3%
Interest expense on debt . . . . . . . . . . . . . . . . . . . . . . . . . . . . . . . . . 1,550 1,044 506 48.5%
Other expenses . . . . . . . . . . . . . . . . . . . . . . . . . . . . . . . . . . . . . . . 11,658 11,061 597 5.4%
Total expenses . . . . . . . . . . . . . . . . . . . . . . . . . . . . . . . . . . . . . . 48,759 45,391 3,368 7.4%
Income (loss) from continuing operations before provision for income tax . . 3,958 (4,334) 8,292 191.3%
Provision for income tax expense (benefit) . . . . . . . . . . . . . . . . . . . . . . 1,181 (2,015) 3,196 158.6%
Income (loss) from continuing operations, net of income tax . . . . . . . . . . 2,777 (2,319) 5,096 219.7%
Income (loss) from discontinued operations, net of income tax . . . . . . . . . 9 41 (32) (78.0)%
Net income (loss) . . . . . . . . . . . . . . . . . . . . . . . . . . . . . . . . . . . . . . 2,786 (2,278) 5,064 222.3%
Less: Net income (loss) attributable to noncontrolling interests . . . . . . . . . (4) (32) 28 87.5%
Net income (loss) attributable to MetLife, Inc. . . . . . . . . . . . . . . . . . . . 2,790 (2,246) 5,036 224.2%
Less: Preferred stock dividends . . . . . . . . . . . . . . . . . . . . . . . . . . . . 122 122 — —%
Net income (loss) available to MetLife, Inc.’s common shareholders . . . . . $ 2,668 $ (2,368) $ 5,036 212.7%
Unless otherwise stated, all amounts discussed below are net of income tax.During the year ended December 31, 2010, income (loss) from continuing operations, net of income tax increased $5.1 billion to a gain of
$2.8 billion from a loss of $2.3 billion in 2009, of which $2 million in losses was from the inclusion of one month of ALICO results in 2010. Thechange was predominantly due to a $3.0 billion favorable change in net derivative gains (losses) and a $1.6 billion favorable change in netinvestment gains (losses). Offsetting these favorable variances totaling $4.6 billion were unfavorable changes in adjustments related to netderivative and net investment gains (losses) of $514 million, net of income tax, principally associated with DAC and VOBA amortization,resulting in a total favorable variance related to net derivative and net investment gains (losses), net of related adjustments and income tax, of$4.1 billion.
We manage our investment portfolio using disciplined Asset/Liability Management (“ALM”) principles, focusing on cash flow and durationto support our current and future liabilities. Our intent is to match the timing and amount of liability cash outflows with invested assets that havecash inflows of comparable timing and amount, while optimizing, net of income tax, risk-adjusted net investment income and risk-adjustedtotal return. Our investment portfolio is heavily weighted toward fixed income investments, with over 80% of our portfolio invested in fixedmaturity securities and mortgage loans. These securities and loans have varying maturities and other characteristics which cause them to begenerally well suited for matching the cash flow and duration of insurance liabilities. Other invested asset classes including, but not limited to,equity securities, other limited partnership interests and real estate and real estate joint ventures, provide additional diversification and
18 MetLife, Inc.

opportunity for long-term yield enhancement in addition to supporting the cash flow and duration objectives of our investment portfolio. Wealso use derivatives as an integral part of our management of the investment portfolio to hedge certain risks, including changes in interestrates, foreign currencies, credit spreads and equity market levels. Additional considerations for our investment portfolio include current andexpected market conditions and expectations for changes within our specific mix of products and business segments. In addition, the generalaccount investment portfolio includes within trading and other securities, contractholder-directed investments supporting unit-linked variableannuity type liabilities, which do not qualify for reporting and presentation as separate account assets. The returns on these investments,which can vary significantly period to period include changes in estimated fair value subsequent to purchase, inure to contractholders and areoffset in earnings by a corresponding change in policyholder account balances through interest credited to policyholder account balances.
The composition of the investment portfolio of each business segment is tailored to the specific characteristics of its insurance liabilities,causing certain portfolios to be shorter in duration and others to be longer in duration. Accordingly, certain portfolios are more heavilyweighted in longer duration, higher yielding fixed maturity securities, or certain sub-sectors of fixed maturity securities, than other portfolios.
Investments are purchased to support our insurance liabilities and not to generate net investment gains and losses. However, netinvestment gains and losses are generated and can change significantly from period to period, due to changes in external influences,including movements in interest rates, foreign currencies, credit spreads and equity markets, counterparty specific factors such as financialperformance, credit rating and collateral valuation, and internal factors such as portfolio rebalancing, that can generate gains and losses. Asan investor in the fixed income, equity security, mortgage loan and certain other invested asset classes, we are exposed to the above statedrisks, which can lead to both impairments and credit-related losses.
Freestanding derivatives are used to hedge certain investments and liabilities. For those hedges not designated as accounting hedges,changes in these market risks can lead to the recognition of fair value changes in net derivative gains (losses) without an offsetting gain or lossrecognized in earnings for the item being hedged even though these are effective economic hedges. Additionally, we issue liabilities andpurchase assets that contain embedded derivatives whose changes in estimated fair value are sensitive to changes in market risks and arealso recognized in net derivative gains (losses).
The favorable variance in net derivative gains (losses) of $3.0 billion, from losses of $3.2 billion in 2009 to losses of $172 million in 2010was primarily driven by a favorable change in freestanding derivatives of $4.4 billion, comprised of a $4.5 billion favorable change from lossesin the prior year of $4.3 billion to gains in the current year of $203 million and $123 million in ALICO freestanding derivative losses. Thisfavorable variance was partially offset by an unfavorable change in embedded derivatives primarily associated with variable annuity minimumbenefit guarantees of $1.4 billion from gains in the prior year of $1.1 billion to losses in the current year of $257 million, net of $5 million inALICO embedded derivative gains.
We use freestanding interest rate, currency, credit and equity derivatives to provide economic hedges of certain invested assets andinsurance liabilities, including embedded derivatives, within certain of our variable annuity minimum benefit guarantees. The $4.5 billionfavorable variance in freestanding derivatives was primarily attributable to market factors, including falling long-term and mid-term interestrates, a stronger recovery in equity markets in the prior year than the current year, a greater decrease in equity volatility in the prior year ascompared to the current year, a strengthening U.S. dollar and widening corporate credit spreads in the financial services sector. Falling long-term and mid-term interest rates in the current year compared to rising long-term and mid-term interest rates in the prior year had a positiveimpact of $2.6 billion on our interest rate derivatives, $931 million of which is attributable to hedges of variable annuity minimum benefitguarantee liabilities, which are accounted for as embedded derivatives. In addition, stronger equity market recovery and lower equity marketvolatility in the prior year as compared to the current year had a positive impact of $1.1 billion on our equity derivatives, which we use to hedgevariable annuity minimum benefit guarantees. U.S. dollar strengthening had a positive impact of $554 million on certain of our foreign currencyderivatives, which are used to hedge foreign-denominated asset and liability exposures. Finally, widening corporate credit spreads in thefinancial services sector had a positive impact of $221 million on our purchased protection credit derivatives.
Certain variable annuity products with minimum benefit guarantees contain embedded derivatives that are measured at estimated fairvalue separately from the host variable annuity contract, with changes in estimated fair value reported in net derivative gains (losses). Theseembedded derivatives also include an adjustment for nonperformance risk of the related liabilities carried at estimated fair value. The$1.4 billion unfavorable change in embedded derivatives was primarily attributable to the impact of market factors, including falling long-termand mid-term interest rates, changes in foreign currency exchange rates, equity volatility and equity market movements. Falling long-term andmid-term interest rates in the current year compared to rising long-term and mid-term interest rates in the prior year had a negative impact of$1.4 billion. Changes in foreign currency exchange rates had a negative impact of $468 million. Equity volatility decreased more in the prioryear than in the current year causing a negative impact of $284 million, and a stronger recovery in the equity markets in the prior year than inthe current year had a negative impact of $228 million. The unfavorable impact from these hedged risks was partially offset by a favorablechange related to the adjustment for nonperformance risk of $1.2 billion, from losses of $1.3 billion in 2009 to losses of $62 million in 2010.This $62 million loss was net of a $621 million loss related to a refinement in estimating the spreads used in the adjustment fornonperformance risk made in the second quarter of 2010. Gains on the freestanding derivatives that hedged these embedded derivativerisks largely offset the change in liabilities attributable to market factors, excluding the adjustment for nonperformance risk, which does nothave an economic impact on the Company.
Improved or stabilizing market conditions across several invested asset classes and sectors as compared to the prior year resulted indecreases in impairments and in net realized losses from sales and disposals of investments in most components of our investment portfolio.These decreases, coupled with a decrease in the provision for credit losses on mortgage loans due to improved market conditions, resulted ina $1.6 billion improvement in net investment gains (losses).
Income from continuing operations, net of income tax for 2010 includes $138 million of expenses related to the acquisition and integrationof ALICO. These expenses, which primarily consisted of investment banking and legal fees, are recorded in Banking, Corporate & Other andare not a component of operating earnings.
As more fully described in the discussion of performance measures above, we use operating earnings, which does not equate to income(loss) from continuing operations as determined in accordance with GAAP, to analyze our performance, evaluate segment performance, andallocate resources. Operating earnings is also a measure by which senior management’s and many other employees’ performance isevaluated for the purpose of determining their compensation under applicable compensation plans. We believe that the presentation ofoperating earnings, as we measure it for management purposes, enhances the understanding of our performance by highlighting the resultsof operations and the underlying profitability drivers of the business. Operating earnings should not be viewed as a substitute for GAAP
19MetLife, Inc.

income (loss) from continuing operations, net of income tax. Operating earnings available to common shareholders increased by $1.5 billionto $3.9 billion in 2010 from $2.4 billion in 2009.
Reconciliation of income (loss) from continuing operations, net of income tax, to operating earnings available to com-mon shareholders
Year Ended December 31, 2010
InsuranceProducts
RetirementProducts
CorporateBenefitFunding
Auto &Home International
Banking,Corporate
& Other Total
(In millions)
Income (loss) from continuing operations, net ofincome tax . . . . . . . . . . . . . . . . . . . . . . . . . . . . $1,371 $ 813 $1,002 $295 $(131) $(573) $2,777
Less: Net investment gains (losses) . . . . . . . . . . . . . 103 139 176 (7) (273) (530) (392)
Less: Net derivative gains (losses) . . . . . . . . . . . . . . 215 266 (193) (1) (491) (61) (265)
Less: Adjustments to continuing operations(1) . . . . . . (237) (282) 143 — (427) (178) (981)
Less: Provision for income tax (expense) benefit . . . . . (31) (49) (44) 3 268 254 401
Operating earnings . . . . . . . . . . . . . . . . . . . . . . . . $1,321 $ 739 $ 920 $300 $ 792 (58) 4,014
Less: Preferred stock dividends . . . . . . . . . . . . . . . 122 122
Operating earnings available to commonshareholders . . . . . . . . . . . . . . . . . . . . . . . . . . $(180) $3,892
Year Ended December 31, 2009
InsuranceProducts
RetirementProducts
CorporateBenefitFunding
Auto &Home International
Banking,Corporate
& Other Total
(In millions)
Income (loss) from continuing operations, net ofincome tax . . . . . . . . . . . . . . . . . . . . . . . . . . . $ (418) $ (628) $ (581) $321 $(280) $(733) $(2,319)
Less: Net investment gains (losses) . . . . . . . . . . . . . (472) (533) (1,486) (41) (105) (269) (2,906)
Less: Net derivative gains (losses) . . . . . . . . . . . . . (1,786) (1,426) (421) 39 (798) (474) (4,866)
Less: Adjustments to continuing operations(1) . . . . . . (139) 519 125 — (206) (16) 283
Less: Provision for income tax (expense) benefit . . . . 837 504 621 1 366 354 2,683
Operating earnings . . . . . . . . . . . . . . . . . . . . . . . $ 1,142 $ 308 $ 580 $322 $ 463 (328) 2,487
Less: Preferred stock dividends . . . . . . . . . . . . . . . 122 122
Operating earnings available to commonshareholders . . . . . . . . . . . . . . . . . . . . . . . . . . $(450) $ 2,365
(1) See definitions of operating revenues and operating expenses for the components of such adjustments.
Reconciliation of GAAP revenues to operating revenues and GAAP expenses to operating expenses
Year Ended December 31, 2010
InsuranceProducts
RetirementProducts
CorporateBenefitFunding
Auto &Home International
Banking,Corporate
& Other Total
(In millions)
Total revenues . . . . . . . . . . . . . . . . . . . . . . . . . $26,451 $6,881 $7,540 $3,146 $6,794 $1,905 $52,717
Less: Net investment gains (losses) . . . . . . . . . . . 103 139 176 (7) (273) (530) (392)
Less: Net derivative gains (losses) . . . . . . . . . . . . 215 266 (193) (1) (491) (61) (265)
Less: Adjustments related to net investment gains(losses) and net derivative gains (losses) . . . . . . . 1 — — — — — 1
Less: Other adjustments to revenues(1) . . . . . . . . . (144) (248) 193 — 44 449 294
Total operating revenues . . . . . . . . . . . . . . . . . . $26,276 $6,724 $7,364 $3,154 $7,514 $2,047 $53,079
Total expenses . . . . . . . . . . . . . . . . . . . . . . . . . $24,338 $5,622 $5,999 $2,781 $6,987 $3,032 $48,759
Less: Adjustments related to net investment gains(losses) and net derivative gains (losses) . . . . . . . 90 35 — — (7) — 118
Less: Other adjustments to expenses(1) . . . . . . . . 4 (1) 50 — 478 627 1,158
Total operating expenses . . . . . . . . . . . . . . . . . . $24,244 $5,588 $5,949 $2,781 $6,516 $2,405 $47,483
20 MetLife, Inc.

Year Ended December 31, 2009
InsuranceProducts
RetirementProducts
CorporateBenefitFunding
Auto &Home International
Banking,Corporate
& Other Total
(In millions)
Total revenues . . . . . . . . . . . . . . . . . . . . . . . . . $23,483 $ 3,725 $ 5,486 $3,113 $4,383 $ 867 $41,057
Less: Net investment gains (losses) . . . . . . . . . . . (472) (533) (1,486) (41) (105) (269) (2,906)
Less: Net derivative gains (losses) . . . . . . . . . . . . (1,786) (1,426) (421) 39 (798) (474) (4,866)
Less: Adjustments related to net investment gains(losses) and net derivative gains (losses) . . . . . . . (27) — — — — — (27)
Less: Other adjustments to revenues(1) . . . . . . . . . (74) (219) 188 — (169) 22 (252)
Total operating revenues . . . . . . . . . . . . . . . . . . $25,842 $ 5,903 $ 7,205 $3,115 $5,455 $1,588 $49,108
Total expenses . . . . . . . . . . . . . . . . . . . . . . . . . $24,165 $ 4,690 $ 6,400 $2,697 $4,868 $2,571 $45,391
Less: Adjustments related to net investment gains(losses) and net derivative gains (losses) . . . . . . . 39 (739) — — — — (700)
Less: Other adjustments to expenses(1) . . . . . . . . (1) 1 63 — 37 38 138
Total operating expenses . . . . . . . . . . . . . . . . . . $24,127 $ 5,428 $ 6,337 $2,697 $4,831 $2,533 $45,953
(1) See definitions of operating revenues and operating expenses for the components of such adjustments.Unless otherwise stated, all amounts discussed below are net of income tax and are on a constant currency basis. The constant currency
basis amounts for both periods are calculated using the average foreign currency exchange rates of 2010.The improvement in the financial markets was the primary driver of the increase in operating earnings as evidenced by higher net
investment income and an increase in average separate account balances, which resulted in an increase in policy fee income. Interest rateand equity market changes resulted in a decrease in variable annuity guarantee benefit costs. Partially offsetting this improvement was anincrease in amortization of DAC, VOBA and DSI. The increase in operating earnings also includes the positive impact of changes in foreigncurrency exchange rates in 2010. This improved reported operating earnings by $38 million for 2010 compared to 2009. Excluding the impactof changes in foreign currency exchange rates, operating earnings increased $1.5 billion from the prior period. Furthermore, the 2010 periodalso includes one month of ALICO results, contributing $114 million to the increase in operating earnings. The current period also benefitedfrom the dividend scale reduction in the fourth quarter of 2009. The improvement in 2010 results compared to 2009 was partially offset by adecline in residential mortgage loan production and the prior period impact of pesification in Argentina.
In addition to a $133 million increase due to the inclusion of ALICO results, net investment income increased by $792 million from higheryields and $515 million from growth in average invested assets. Yields were positively impacted by the effects of stabilizing real estate marketsand recovering private equity markets year over year on real estate joint ventures and other limited partnership interests, and by the effects ofcontinued repositioning of the accumulated liquidity in our portfolio to longer duration and higher yielding investments, including investmentgrade corporate fixed maturity securities. Growth in our investment portfolio was primarily due to positive net cash flows from growth in ourdomestic individual and group life businesses, as well as certain international businesses; increased bank deposits, higher cash collateralbalances received from our derivative counterparties, as well as the temporary investment of proceeds from the debt and common stockissuances in anticipation of the Acquisition. With the exception of the cash flows from such securities issuances, which were temporarilyinvested in lower yielding liquid investments, we continued to reposition the accumulated liquidity in our portfolio to longer duration and higheryielding investments.
Since many of our products are interest spread-based, higher net investment income is typically offset by higher interest creditedexpense. However, interest credited expense, including amounts reflected in policyholder benefits and claims, decreased $147 million,primarily in our domestic funding agreement business, which experienced lower average crediting rates combined with lower averageaccount balances. Our fixed annuities business also experienced lower crediting rates. Certain crediting rates can move consistently with theunderlying market indices, primarily the London Inter-Bank Offer Rate (“LIBOR”), which were lower than the prior year. The impact from thegrowth in our structured settlement, long-term care and disability businesses partially offset those decreases in interest credited expense.
A significant increase in average separate account balances is largely attributable to favorable market performance resulting fromimproved market conditions since the second quarter of 2009 and positive net cash flows from the annuity business. This resulted in higherpolicy fees and other revenues of $471 million, most notably in our Retirement Products segment. The improvement in fees is partially offsetby greater DAC, VOBA and DSI amortization of $377 million. Policy fees are typically calculated as a percentage of the average assets in theseparate accounts. DAC, VOBA and DSI amortization is based on the earnings of the business, which in the retirement business are derived,in part, from fees earned on separate account balances. A portion of the increase in amortization was due to the impact of higher current yeargross margins, a primary component in the determination of the amount of amortization for our Insurance Products segment, mostly in theclosed block resulting from increased investment yields and the impact of dividend scale reductions.
There was a $59 million decrease in variable annuity guaranteed benefit costs. Costs associated with our annuity guaranteed benefitliabilities, hedge programs and reinsurance programs are impacted by equity markets and interest rate levels to varying degrees. While 2010and 2009 both experienced equity market improvements, the improvement in 2009 was greater. Interest rate levels declined in the currentyear and increased in the prior year. Annuity guaranteed benefit liabilities, net of a decrease in paid claims, increased benefits by $93 millionprimarily from our annual unlocking of assumptions related to these liabilities. The hedge and reinsurance programs which are used to mitigatethe risk associated with these guarantees produced losses in both periods, but the losses in the prior period were more significant due to the2009 equity market recovery. The change in hedge and reinsurance program costs decreased by $152 million. These hedge and reinsuranceprograms, which are a key part of our risk management strategy, performed as anticipated.
The reduction in the dividend scale in the fourth quarter of 2009 resulted in a $109 million decrease in policyholder dividends in thetraditional life business in the current period.
21MetLife, Inc.

Claims experience varied amongst our businesses with a net unfavorable impact of $153 million to operating earnings compared to theprior year. We had unfavorable claims experience in our Auto & Home segment, primarily due to increased catastrophes. Our InsuranceProducts segment experienced mixed claims experience with a net unfavorable impact. We experienced less favorable mortality experiencein our Corporate Benefit Funding segment despite favorable experience in our structured settlements business.
A $15.2 billion decline in residential mortgage loan production resulted in a $131 million decrease in operating earnings, $32 million ofwhich is reflected in net investment income from lower investment levels with the remainder largely attributable to a reduction in fee income.The increase in the serviced residential mortgage loan portfolio improved operating earnings by $41 million, including $23 million of costsassociated with investment and growth in our banking business as discussed below.
Interest expense increased $64 million primarily as a result of the full year impact of debt issuances in 2009 and of senior notes and debtsecurities issued in anticipation of the Acquisition, partially offset by the impact of lower interest rates on variable rate collateral financingarrangements.
In addition to a $269 million increase associated with the Acquisition, operating expenses increased due to the impact of a $95 millionbenefit recorded in the prior period related to the pesification in Argentina, as well as an $83 million increase related to the investment andgrowth in our international and banking businesses. In addition, the current period includes a $14 million increase in charitable contributionsand $13 million of costs associated with the integration of ALICO. Offsetting these increases was a $76 million reduction in discretionaryspending, such as consulting, rent and postemployment related costs. In addition, we experienced a $47 million decline in market drivenexpenses, primarily pension and post retirement benefit costs. Also contributing to the decrease was a $35 million reduction in real estate-related charges and $15 million of lower legal costs.
Income tax expense for the year ended December 31, 2010 was $1,181 million, or 30% of income from continuing operations beforeprovision for income tax, compared with income tax benefit of $2,015 million, or 47% of the loss from continuing operations before benefit forincome tax, for the comparable 2009 period. The Company’s 2010 and 2009 effective tax rates differ from the U.S. statutory rate of 35%primarily due to the impact of certain permanent tax differences, including non-taxable investment income and tax credits for investments inlow income housing, in relation to income (loss) from continuing operations before income tax, as well as certain foreign permanent taxdifferences.
The 2010 period includes $75 million of charges related to the Patient Protection and Affordable Care Act and the Health Care andEducation Reconciliation Act of 2010 (together, the “Health Care Act”). The Federal government currently provides a Medicare Part D subsidy.The Health Care Act reduced the tax deductibility of retiree health care costs to the extent of any Medicare Part D subsidy received beginningin 2013. Because the deductibility of future retiree health care costs is reflected in our financial statements, the entire future impact of thischange in law was required to be recorded as a charge in the period in which the legislation was enacted. Changes to the provision for incometaxes in both periods contributed to an increase in operating earnings of $86 million for our International segment, resulting from a $34 millionunfavorable impact in 2009 due to a change in assumption regarding the repatriation of earnings and a benefit of $52 million in the current yearfrom additional permanent reinvestment of earnings, the reversal of tax provisions and favorable changes in liabilities for tax uncertainties. Inaddition, in 2009 we had a larger benefit of $71 million as compared to 2010 related to the utilization of tax preferenced investments whichprovide tax credits and deductions.
Insurance Products
2010 2009 Change % Change
Years Ended December 31,
(In millions)
Operating Revenues
Premiums . . . . . . . . . . . . . . . . . . . . . . . . . . . . . . . . . . . . . . . . . . . . . . . . . . . . $17,200 $17,168 $ 32 0.2%
Universal life and investment-type product policy fees . . . . . . . . . . . . . . . . . . . . . . . 2,247 2,281 (34) (1.5)%
Net investment income . . . . . . . . . . . . . . . . . . . . . . . . . . . . . . . . . . . . . . . . . . . 6,068 5,614 454 8.1%
Other revenues . . . . . . . . . . . . . . . . . . . . . . . . . . . . . . . . . . . . . . . . . . . . . . . . 761 779 (18) (2.3)%
Total operating revenues . . . . . . . . . . . . . . . . . . . . . . . . . . . . . . . . . . . . . . . . . 26,276 25,842 434 1.7%
Operating Expenses
Policyholder benefits and dividends . . . . . . . . . . . . . . . . . . . . . . . . . . . . . . . . . . . 19,075 19,111 (36) (0.2)%
Interest credited to policyholder account balances . . . . . . . . . . . . . . . . . . . . . . . . . . 963 952 11 1.2%
Capitalization of DAC . . . . . . . . . . . . . . . . . . . . . . . . . . . . . . . . . . . . . . . . . . . . . (841) (873) 32 3.7%
Amortization of DAC and VOBA . . . . . . . . . . . . . . . . . . . . . . . . . . . . . . . . . . . . . . 966 725 241 33.2%
Interest expense on debt . . . . . . . . . . . . . . . . . . . . . . . . . . . . . . . . . . . . . . . . . . 1 6 (5) (83.3)%
Other expenses . . . . . . . . . . . . . . . . . . . . . . . . . . . . . . . . . . . . . . . . . . . . . . . . 4,080 4,206 (126) (3.0)%
Total operating expenses . . . . . . . . . . . . . . . . . . . . . . . . . . . . . . . . . . . . . . . . . 24,244 24,127 117 0.5%
Provision for income tax expense (benefit) . . . . . . . . . . . . . . . . . . . . . . . . . . . . . . . 711 573 138 24.1%
Operating earnings . . . . . . . . . . . . . . . . . . . . . . . . . . . . . . . . . . . . . . . . . . . . . . $ 1,321 $ 1,142 $ 179 15.7%
Unless otherwise stated, all amounts discussed below are net of income tax.The improvement in the global financial markets had a positive impact on net investment income, which contributed to the increase in
Insurance Products’ operating earnings. In addition, we experienced overall modest revenue growth in several of our businesses despite thischallenging environment. High levels of unemployment continue to depress growth across most of our group insurance businesses due tolower covered payrolls. Growth in our group life business was dampened by a decline in our non-medical health and individual life businesses.However, our dental business benefited from higher enrollment and pricing actions, partially offset by lower persistency and the loss ofexisting subscribers, driven by high unemployment. This business also experienced more stable utilization and benefits costs in the current
22 MetLife, Inc.
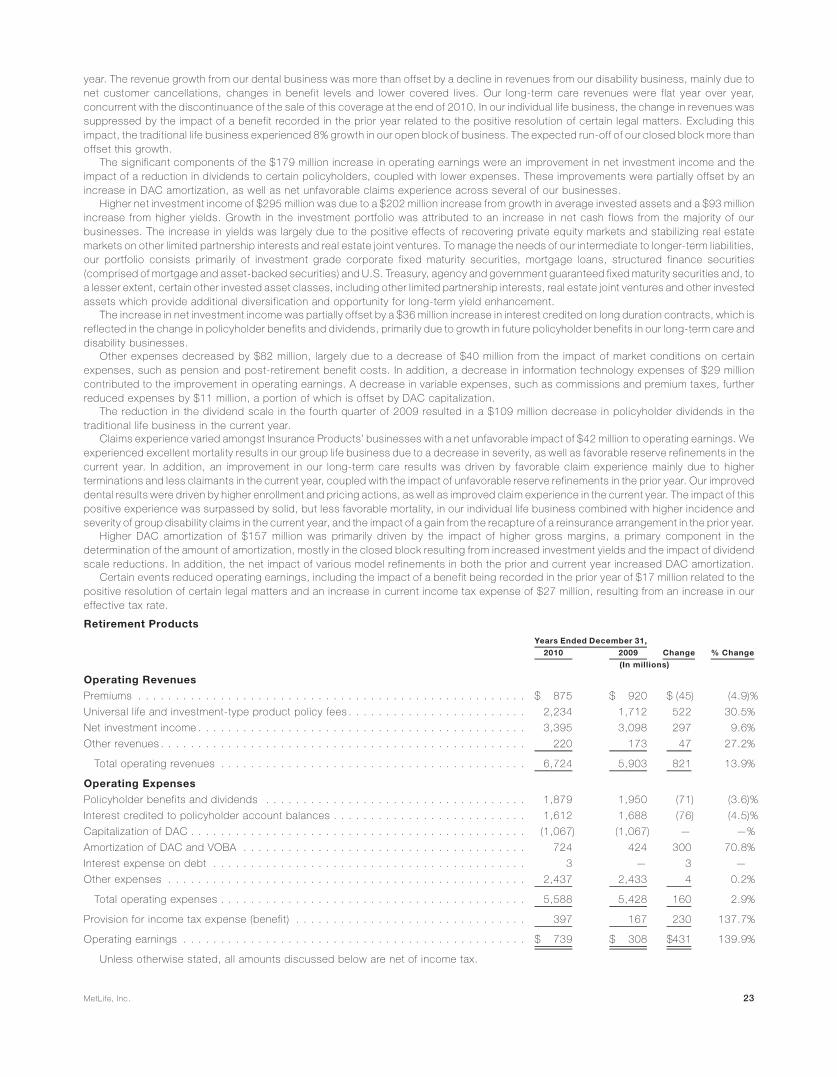
year. The revenue growth from our dental business was more than offset by a decline in revenues from our disability business, mainly due tonet customer cancellations, changes in benefit levels and lower covered lives. Our long-term care revenues were flat year over year,concurrent with the discontinuance of the sale of this coverage at the end of 2010. In our individual life business, the change in revenues wassuppressed by the impact of a benefit recorded in the prior year related to the positive resolution of certain legal matters. Excluding thisimpact, the traditional life business experienced 8% growth in our open block of business. The expected run-off of our closed block more thanoffset this growth.
The significant components of the $179 million increase in operating earnings were an improvement in net investment income and theimpact of a reduction in dividends to certain policyholders, coupled with lower expenses. These improvements were partially offset by anincrease in DAC amortization, as well as net unfavorable claims experience across several of our businesses.
Higher net investment income of $295 million was due to a $202 million increase from growth in average invested assets and a $93 millionincrease from higher yields. Growth in the investment portfolio was attributed to an increase in net cash flows from the majority of ourbusinesses. The increase in yields was largely due to the positive effects of recovering private equity markets and stabilizing real estatemarkets on other limited partnership interests and real estate joint ventures. To manage the needs of our intermediate to longer-term liabilities,our portfolio consists primarily of investment grade corporate fixed maturity securities, mortgage loans, structured finance securities(comprised of mortgage and asset-backed securities) and U.S. Treasury, agency and government guaranteed fixed maturity securities and, toa lesser extent, certain other invested asset classes, including other limited partnership interests, real estate joint ventures and other investedassets which provide additional diversification and opportunity for long-term yield enhancement.
The increase in net investment income was partially offset by a $36 million increase in interest credited on long duration contracts, which isreflected in the change in policyholder benefits and dividends, primarily due to growth in future policyholder benefits in our long-term care anddisability businesses.
Other expenses decreased by $82 million, largely due to a decrease of $40 million from the impact of market conditions on certainexpenses, such as pension and post-retirement benefit costs. In addition, a decrease in information technology expenses of $29 millioncontributed to the improvement in operating earnings. A decrease in variable expenses, such as commissions and premium taxes, furtherreduced expenses by $11 million, a portion of which is offset by DAC capitalization.
The reduction in the dividend scale in the fourth quarter of 2009 resulted in a $109 million decrease in policyholder dividends in thetraditional life business in the current year.
Claims experience varied amongst Insurance Products’ businesses with a net unfavorable impact of $42 million to operating earnings. Weexperienced excellent mortality results in our group life business due to a decrease in severity, as well as favorable reserve refinements in thecurrent year. In addition, an improvement in our long-term care results was driven by favorable claim experience mainly due to higherterminations and less claimants in the current year, coupled with the impact of unfavorable reserve refinements in the prior year. Our improveddental results were driven by higher enrollment and pricing actions, as well as improved claim experience in the current year. The impact of thispositive experience was surpassed by solid, but less favorable mortality, in our individual life business combined with higher incidence andseverity of group disability claims in the current year, and the impact of a gain from the recapture of a reinsurance arrangement in the prior year.
Higher DAC amortization of $157 million was primarily driven by the impact of higher gross margins, a primary component in thedetermination of the amount of amortization, mostly in the closed block resulting from increased investment yields and the impact of dividendscale reductions. In addition, the net impact of various model refinements in both the prior and current year increased DAC amortization.
Certain events reduced operating earnings, including the impact of a benefit being recorded in the prior year of $17 million related to thepositive resolution of certain legal matters and an increase in current income tax expense of $27 million, resulting from an increase in oureffective tax rate.
Retirement Products
2010 2009 Change % Change
Years Ended December 31,
(In millions)
Operating Revenues
Premiums . . . . . . . . . . . . . . . . . . . . . . . . . . . . . . . . . . . . . . . . . . . . . . . . . . . . $ 875 $ 920 $ (45) (4.9)%
Universal life and investment-type product policy fees . . . . . . . . . . . . . . . . . . . . . . . . 2,234 1,712 522 30.5%
Net investment income . . . . . . . . . . . . . . . . . . . . . . . . . . . . . . . . . . . . . . . . . . . . 3,395 3,098 297 9.6%
Other revenues . . . . . . . . . . . . . . . . . . . . . . . . . . . . . . . . . . . . . . . . . . . . . . . . . 220 173 47 27.2%
Total operating revenues . . . . . . . . . . . . . . . . . . . . . . . . . . . . . . . . . . . . . . . . . 6,724 5,903 821 13.9%
Operating Expenses
Policyholder benefits and dividends . . . . . . . . . . . . . . . . . . . . . . . . . . . . . . . . . . . 1,879 1,950 (71) (3.6)%
Interest credited to policyholder account balances . . . . . . . . . . . . . . . . . . . . . . . . . . 1,612 1,688 (76) (4.5)%
Capitalization of DAC . . . . . . . . . . . . . . . . . . . . . . . . . . . . . . . . . . . . . . . . . . . . . (1,067) (1,067) — —%
Amortization of DAC and VOBA . . . . . . . . . . . . . . . . . . . . . . . . . . . . . . . . . . . . . . 724 424 300 70.8%
Interest expense on debt . . . . . . . . . . . . . . . . . . . . . . . . . . . . . . . . . . . . . . . . . . 3 — 3 —
Other expenses . . . . . . . . . . . . . . . . . . . . . . . . . . . . . . . . . . . . . . . . . . . . . . . . 2,437 2,433 4 0.2%
Total operating expenses . . . . . . . . . . . . . . . . . . . . . . . . . . . . . . . . . . . . . . . . . 5,588 5,428 160 2.9%
Provision for income tax expense (benefit) . . . . . . . . . . . . . . . . . . . . . . . . . . . . . . . 397 167 230 137.7%
Operating earnings . . . . . . . . . . . . . . . . . . . . . . . . . . . . . . . . . . . . . . . . . . . . . . $ 739 $ 308 $431 139.9%
Unless otherwise stated, all amounts discussed below are net of income tax.
23MetLife, Inc.

During 2010, overall annuity sales decreased 5% compared to 2009 as declines in fixed annuity sales were partially offset by increasedsales of our variable annuity products. The financial market turmoil in early 2009 resulted in extraordinarily high sales of fixed annuity productsin 2009. The high sales level was not expected to continue after the financial markets returned to more stable levels. Variable annuity productsales increased primarily due to the expansion of alternative distribution channels and fewer competitors in the market place. Surrender ratesfor both our variable and fixed annuities remained low during the current period as we believe our customers continue to value our productscompared to other alternatives in the marketplace.
Interest rate and equity market changes were the primary driver of the $431 million increase in operating earnings, with the largest impactresulting from a $370 million increase in policy fees and other revenues, a $193 million increase in net investment income, and a $59 milliondecrease in variable annuity guarantee benefit costs, offset by a $204 million increase in DAC, VOBA and DSI amortization and a $39 millionincrease in commission expense resulting from growth in annuity contract balances.
A significant increase in average separate account balances was largely attributable to favorable market performance resulting fromimproved market conditions since the second quarter of 2009 and positive net cash flows from the annuity business. This resulted in higherpolicy fees and other revenues of $370 million, partially offset by greater DAC, VOBA and DSI amortization. Policy fees are typically calculatedas a percentage of the average assets in the separate account. DAC, VOBA and DSI amortization is based on the earnings of the business,which in the retirement business are derived, in part, from fees earned on separate account balances.
Financial market improvements also resulted in the increase in net investment income of $193 million as a $291 million increase fromhigher yields was partially offset by a $98 million decrease from a decline in average invested assets. Yields were positively impacted by theeffects of the continued repositioning of the accumulated liquidity in our investment portfolio to longer duration and higher yielding assets,including investment grade corporate fixed maturity securities. Yields were also positively impacted by the effects of recovering private equitymarkets and stabilizing real estate markets on other limited partnership interests and real estate joint ventures. Despite positive net cashflows, a reduction in the general account investment portfolio was due to the impact of more customers gaining confidence in the equitymarkets and, as a result, electing to transfer funds into our separate account investment options as market conditions improved. To managethe needs of our intermediate to longer-term liabilities, our investment portfolio consists primarily of investment grade corporate fixed maturitysecurities, structured finance securities, mortgage loans and U.S. Treasury, agency and government guaranteed fixed maturity securitiesand, to a lesser extent, certain other invested asset classes, including other limited partnership interests, real estate joint ventures and otherinvested assets, in order to provide additional diversification and opportunity for long-term yield enhancement.
There was a $59 million decrease in variable annuity guaranteed benefit costs in 2010 compared to 2009. Costs associated with ourannuity guaranteed benefit liabilities, hedge programs and reinsurance programs are impacted by equity markets and interest rate levels tovarying degrees. While the equity market improved in both 2010 and 2009, the improvement in 2009 was greater. Interest rate levels declinedin the current year and increased in the prior year. Annuity guaranteed benefit liabilities, net of a decrease in paid claims, increased benefits by$93 million primarily from our annual unlocking of assumptions related to these liabilities. The hedge and reinsurance programs which areused to mitigate the risk associated with these guarantees produced losses in both periods, but the losses in the prior period were moresignificant due to the 2009 equity market recovery. The costs related to our hedge and reinsurance programs decreased by $152 million in2010 compared to 2009. These hedge and reinsurance programs, which are a key part of our risk management strategy, performed asanticipated.
Interest credited expense decreased $49 million driven by lower average crediting rates on fixed annuities and higher amortization ofexcess interest reserve due to one large case surrender in 2010, partially offset by growth in our fixed annuity policyholder account balances.
Corporate Benefit Funding
2010 2009 Change % Change
Years Ended December 31,
(In millions)
Operating Revenues
Premiums . . . . . . . . . . . . . . . . . . . . . . . . . . . . . . . . . . . . . . . . . . . . . . . . . . $ 1,938 $ 2,264 $ (326) (14.4)%
Universal life and investment-type product policy fees . . . . . . . . . . . . . . . . . . . . . 226 176 50 28.4%
Net investment income . . . . . . . . . . . . . . . . . . . . . . . . . . . . . . . . . . . . . . . . . 4,954 4,527 427 9.4%
Other revenues . . . . . . . . . . . . . . . . . . . . . . . . . . . . . . . . . . . . . . . . . . . . . . 246 238 8 3.4%
Total operating revenues . . . . . . . . . . . . . . . . . . . . . . . . . . . . . . . . . . . . . . . 7,364 7,205 159 2.2%
Operating Expenses
Policyholder benefits and dividends . . . . . . . . . . . . . . . . . . . . . . . . . . . . . . . . . 4,041 4,245 (204) (4.8)%
Interest credited to policyholder account balances . . . . . . . . . . . . . . . . . . . . . . . 1,445 1,632 (187) (11.5)%
Capitalization of DAC . . . . . . . . . . . . . . . . . . . . . . . . . . . . . . . . . . . . . . . . . . (19) (14) (5) (35.7)%
Amortization of DAC and VOBA . . . . . . . . . . . . . . . . . . . . . . . . . . . . . . . . . . . . 16 15 1 6.7%
Interest expense on debt . . . . . . . . . . . . . . . . . . . . . . . . . . . . . . . . . . . . . . . . 6 3 3 100.0%
Other expenses . . . . . . . . . . . . . . . . . . . . . . . . . . . . . . . . . . . . . . . . . . . . . . 460 456 4 0.9%
Total operating expenses . . . . . . . . . . . . . . . . . . . . . . . . . . . . . . . . . . . . . . 5,949 6,337 (388) (6.1)%
Provision for income tax expense (benefit) . . . . . . . . . . . . . . . . . . . . . . . . . . . . . 495 288 207 71.9%
Operating earnings . . . . . . . . . . . . . . . . . . . . . . . . . . . . . . . . . . . . . . . . . . . . $ 920 $ 580 $ 340 58.6%
Unless otherwise stated, all amounts discussed below are net of income tax.Corporate Benefit Funding benefited in 2010 from strong sales of structured settlement products and continued market penetration of our
pension closeout business in the United Kingdom (“U.K.”) However, structured settlement premiums have declined $174 million, beforeincome tax, from 2009 reflecting extraordinary sales in the fourth quarter of 2009. While market penetration continued in our pension closeout
24 MetLife, Inc.

business in the U.K. as the number of sold cases increased, the average premium has declined, resulting in a decrease in premiums of$216 million, before income tax. Although improving, a combination of poor equity returns and lower interest rates have contributed topension plans remaining underfunded, both in the U.S. and in the U.K., which reduces our customers’ flexibility to engage in transactionssuch as pension closeouts. For each of these businesses, the movement in premiums is almost entirely offset by the related change inpolicyholder benefits. The insurance liability that is established at the time we assume the risk under these contracts is typically equivalent tothe premium recognized.
The $340 million increase in operating earnings was primarily driven by an improvement in net investment income and the impact of lowercrediting rates, partially offset by the impact of prior period favorable liability refinements and less favorable mortality.
The primary driver of the $340 million increase in operating earnings was higher net investment income of $278 million, reflecting a$187 million increase from higher yields and a $91 million increase in average invested assets. Yields were positively impacted by the effectsof stabilizing real estate markets and recovering private equity markets on real estate joint ventures and other limited partnership interests.These improvements in yields were partially offset by decreased yields on fixed maturity securities due to the reinvestment of proceeds frommaturities and sales during this lower interest rate environment. Growth in the investment portfolio is due to an increase in averagepolicyholder account balances and growth in the securities lending program. To manage the needs of our longer-term liabilities, our portfolioconsists primarily of investment grade corporate fixed maturity securities, structured finance securities, mortgage loans and U.S. Treasury,agency and government guaranteed securities, and, to a lesser extent, certain other invested asset classes including other limitedpartnership interests, real estate joint ventures and other invested assets in order to provide additional diversification and opportunity forlong-term yield enhancement. For our short-term obligations, we invest primarily in structured finance securities, mortgage loans andinvestment grade corporate fixed maturity securities. The yields on these short-term investments have moved consistently with the underlyingmarket indices, primarily LIBOR and U.S. Treasury, on which they are based.
As many of our products are interest spread-based, changes in net investment income are typically offset by a corresponding change ininterest credited expense. However, interest credited expense decreased $122 million, primarily related to our funding agreement businessas a result of lower average crediting rates combined with lower average account balances. Certain crediting rates can move consistently withthe underlying market indices, primarily LIBOR, which were lower than the prior year. Interest credited expense related to the structuredsettlement businesses increased $40 million as a result of the increase in the average policyholder liabilities.
Mortality experience was mixed and reduced operating earnings in 2010 by $26 million. Less favorable mortality in our pension closeoutsand corporate owned life insurance businesses compared to 2009 was only slightly offset by favorable mortality experience in our structuredsettlements business.
Liability refinements in both the current and prior year resulted in a $28 million decrease to operating earnings. These were largely offset bythe impact of a charge in the 2009 period related to a refinement of a reinsurance recoverable in the small business recordkeeping businesswhich increased operating earnings by $20 million.
Auto & Home
2010 2009 Change % Change
Years Ended December 31,
(In millions)
Operating Revenues
Premiums . . . . . . . . . . . . . . . . . . . . . . . . . . . . . . . . . . . . . . . . . . . . . . . . . . . . $2,923 $2,902 $ 21 0.7%
Net investment income . . . . . . . . . . . . . . . . . . . . . . . . . . . . . . . . . . . . . . . . . . . . 209 180 29 16.1%
Other revenues . . . . . . . . . . . . . . . . . . . . . . . . . . . . . . . . . . . . . . . . . . . . . . . . . 22 33 (11) (33.3)%
Total operating revenues . . . . . . . . . . . . . . . . . . . . . . . . . . . . . . . . . . . . . . . . . 3,154 3,115 39 1.3%
Operating Expenses
Policyholder benefits and dividends . . . . . . . . . . . . . . . . . . . . . . . . . . . . . . . . . . . . 2,021 1,932 89 4.6%
Capitalization of DAC . . . . . . . . . . . . . . . . . . . . . . . . . . . . . . . . . . . . . . . . . . . . . (448) (435) (13) (3.0)%
Amortization of DAC and VOBA . . . . . . . . . . . . . . . . . . . . . . . . . . . . . . . . . . . . . . 439 436 3 0.7%
Other expenses . . . . . . . . . . . . . . . . . . . . . . . . . . . . . . . . . . . . . . . . . . . . . . . . 769 764 5 0.7%
Total operating expenses . . . . . . . . . . . . . . . . . . . . . . . . . . . . . . . . . . . . . . . . . 2,781 2,697 84 3.1%
Provision for income tax expense (benefit) . . . . . . . . . . . . . . . . . . . . . . . . . . . . . . . 73 96 (23) (24.0)%
Operating earnings . . . . . . . . . . . . . . . . . . . . . . . . . . . . . . . . . . . . . . . . . . . . . . $ 300 $ 322 $(22) (6.8)%
Unless otherwise stated, all amounts discussed below are net of income tax.The improving housing and automobile markets have provided opportunities that led to increased new business sales for both
homeowners and auto policies in 2010. Sales of new policies increased 11% for our homeowners business and 4% for our auto businessin 2010 compared to 2009. Average premium per policy also improved in 2010 over 2009 in our homeowners businesses but remained flat inour auto business.
The primary driver of the $22 million decrease in operating earnings was unfavorable claims experience, partially offset by higher netinvestment income and increased premiums.
Catastrophe-related losses increased by $58 million compared to 2009 due to increases in both the number and severity of storms.Current period claim costs decreased $19 million as a result of lower frequencies in both our auto and homeowners businesses; however, thiswas partially offset by a $13 million increase in claims due to higher severity in our homeowners business. Also contributing to the decline inoperating earnings was an increase of $7 million in loss adjusting expenses, primarily related to a decrease in our unallocated loss adjustingexpense liabilities at the end of 2009.
25MetLife, Inc.

The impact of the items discussed above can be seen in the unfavorable change in the combined ratio, including catastrophes, increasingto 94.6% in 2010 from 92.3% in 2009 and the favorable change in the combined ratio, excluding catastrophes, decreasing to 88.1% in 2010from 88.9% in 2009.
A $19 million increase in net investment income partially offset the declines in operating earnings discussed above. Net investment incomewas higher primarily as a result of an increase in average invested assets, including changes in allocated equity, partially offset by a decreasein yields. This portfolio is comprised primarily of high quality municipal bonds.
The increase in average premium per policy in our homeowners businesses improved operating earnings by $10 million as did an increasein exposures which improved operating earnings by $1 million. Exposures are primarily each automobile for the auto line of business and eachresidence for the property line of business. Also improving operating earnings, through an increase in premiums, was a $5 million reduction inreinsurance costs.
The slight increase in other expenses was more than offset by an $8 million increase in DAC capitalization, resulting primarily fromincreased premiums written.
In addition, a first quarter 2010 write-off of an equity interest in a mandatory state underwriting pool required by a change in legislation anda decrease in income from a retroactive reinsurance contract in run-off, both of which were recorded in other revenues, drove a $7 milliondecrease in operating earnings. Auto & Home also benefited from a lower effective tax rate which improved operating earnings by $8 millionprimarily as a result of tax free interest income representing a larger portion of pre-tax income.
International
2010 2009 Change % Change
Years Ended December 31,
(In millions)
Operating Revenues
Premiums . . . . . . . . . . . . . . . . . . . . . . . . . . . . . . . . . . . . . . . . . . . . . . . . . . . . $4,447 $3,187 $1,260 39.5%
Universal life and investment-type product policy fees . . . . . . . . . . . . . . . . . . . . . . . 1,329 1,061 268 25.3%
Net investment income . . . . . . . . . . . . . . . . . . . . . . . . . . . . . . . . . . . . . . . . . . . 1,703 1,193 510 42.7%
Other revenues . . . . . . . . . . . . . . . . . . . . . . . . . . . . . . . . . . . . . . . . . . . . . . . . 35 14 21 150.0%
Total operating revenues . . . . . . . . . . . . . . . . . . . . . . . . . . . . . . . . . . . . . . . . . 7,514 5,455 2,059 37.7%
Operating Expenses
Policyholder benefits and dividends . . . . . . . . . . . . . . . . . . . . . . . . . . . . . . . . . . . 3,723 2,660 1,063 40.0%
Interest credited to policyholder account balances . . . . . . . . . . . . . . . . . . . . . . . . . . 683 581 102 17.6%
Capitalization of DAC . . . . . . . . . . . . . . . . . . . . . . . . . . . . . . . . . . . . . . . . . . . . . (968) (630) (338) (53.7)%
Amortization of DAC and VOBA . . . . . . . . . . . . . . . . . . . . . . . . . . . . . . . . . . . . . . 537 415 122 29.4%
Interest expense on debt . . . . . . . . . . . . . . . . . . . . . . . . . . . . . . . . . . . . . . . . . . 3 8 (5) (62.5)%
Other expenses . . . . . . . . . . . . . . . . . . . . . . . . . . . . . . . . . . . . . . . . . . . . . . . . 2,538 1,797 741 41.2%
Total operating expenses . . . . . . . . . . . . . . . . . . . . . . . . . . . . . . . . . . . . . . . . . 6,516 4,831 1,685 34.9%
Provision for income tax expense (benefit) . . . . . . . . . . . . . . . . . . . . . . . . . . . . . . . 206 161 45 28.0%
Operating earnings . . . . . . . . . . . . . . . . . . . . . . . . . . . . . . . . . . . . . . . . . . . . . . $ 792 $ 463 $ 329 71.1%
Unless otherwise stated, all amounts discussed below are net of income tax and are on a constant currency basis. The constant currencybasis amounts for both periods are calculated using the average foreign currency exchange rates for 2010.
The improvement in the global financial markets has resulted in continued growth, with a 24% increase in sales in the current periodcompared to the prior period excluding the results of our Japan joint venture. Retirement and savings sales increased 30% driven by strongannuity, universal life and pension sales in Europe, Mexico, Chile, South Korea and China. In our Europe and the Middle East operations, salesof annuities and universal life products remained strong, more than doubling from the prior year, partially offset by lower pension and variableuniversal life sales in India due to the loss of a major distributor, as well as lower credit life sales. Our Latin America operation experienced anoverall increase in sales resulting from solid growth in pension and universal life sales in Mexico and an increase in fixed annuity sales in Chiledue to market recovery, slightly offset by lower bank sales in Brazil resulting from incentives offered in the prior year. Sales in our Asia Pacificoperation, excluding the results of our Japan joint venture, increased primarily due to higher variable universal life sales in South Korea, slightlyoffset by the decline in annuity sales and strong bank channel sales in China. We have experienced lower sales in Taiwan following theannouncement of the planned sale of this business. While the third party’s application for approval of the sale of our Taiwan affiliate wasrejected by the Taiwan Financial Supervising Commission, the Company continues to explore strategic options with respect to this affiliate.
Reported operating earnings increased by $329 million over the prior year. The positive impact of changes in foreign currency exchangerates improved reported earnings by $38 million for 2010 compared to 2009. Excluding the impact of changes in foreign currency exchangerates, operating earnings increased $291 million, or 58%. Reported operating earnings reflect the operating results of ALICO from theAcquisition Date through November 30, 2010, which contributed $114 million to our 2010 operating earnings. As previously noted, ALICO’saccounting year-end is November 30; therefore, International’s results for the year include one month of ALICO results.
Changes in assumptions for measuring the impact of inflation on certain inflation-indexed fixed maturity securities increased operatingearnings by $124 million. Changes to the provision for income taxes in both periods contributed to an increase in operating earnings of$86 million, resulting from a $34 million unfavorable impact in 2009 from a change in assumption regarding the repatriation of earnings and abenefit $52 million in the current year from additional permanent reinvestment of earnings, the reversal of tax provisions and favorablechanges in liabilities for tax uncertainties. Business growth in our Latin America operation contributed to an increase in operating earnings.Operating earnings in Mexico increased $56 million from growth in our institutional and individual businesses, partially offset by the impact ofunfavorable claims experience of $26 million. Higher investment yields resulting from portfolio restructuring was the primary driver in Argentina
26 MetLife, Inc.
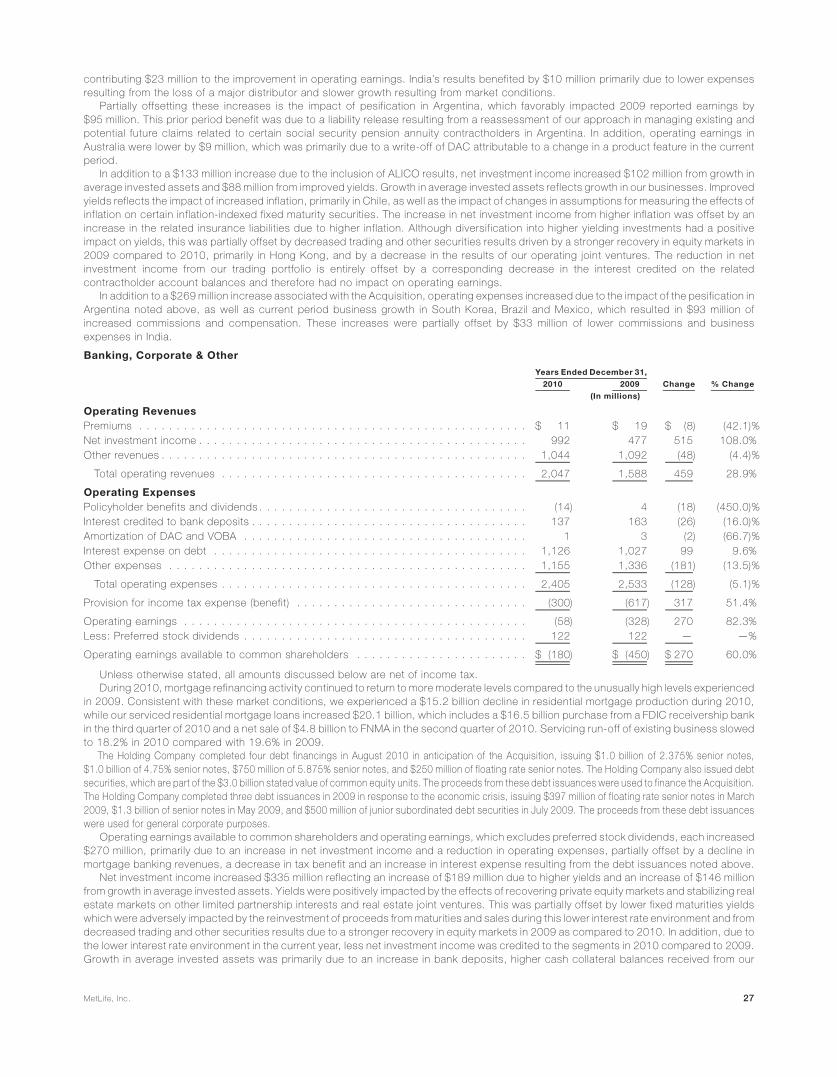
contributing $23 million to the improvement in operating earnings. India’s results benefited by $10 million primarily due to lower expensesresulting from the loss of a major distributor and slower growth resulting from market conditions.
Partially offsetting these increases is the impact of pesification in Argentina, which favorably impacted 2009 reported earnings by$95 million. This prior period benefit was due to a liability release resulting from a reassessment of our approach in managing existing andpotential future claims related to certain social security pension annuity contractholders in Argentina. In addition, operating earnings inAustralia were lower by $9 million, which was primarily due to a write-off of DAC attributable to a change in a product feature in the currentperiod.
In addition to a $133 million increase due to the inclusion of ALICO results, net investment income increased $102 million from growth inaverage invested assets and $88 million from improved yields. Growth in average invested assets reflects growth in our businesses. Improvedyields reflects the impact of increased inflation, primarily in Chile, as well as the impact of changes in assumptions for measuring the effects ofinflation on certain inflation-indexed fixed maturity securities. The increase in net investment income from higher inflation was offset by anincrease in the related insurance liabilities due to higher inflation. Although diversification into higher yielding investments had a positiveimpact on yields, this was partially offset by decreased trading and other securities results driven by a stronger recovery in equity markets in2009 compared to 2010, primarily in Hong Kong, and by a decrease in the results of our operating joint ventures. The reduction in netinvestment income from our trading portfolio is entirely offset by a corresponding decrease in the interest credited on the relatedcontractholder account balances and therefore had no impact on operating earnings.
In addition to a $269 million increase associated with the Acquisition, operating expenses increased due to the impact of the pesification inArgentina noted above, as well as current period business growth in South Korea, Brazil and Mexico, which resulted in $93 million ofincreased commissions and compensation. These increases were partially offset by $33 million of lower commissions and businessexpenses in India.
Banking, Corporate & Other
2010 2009 Change % Change
Years Ended December 31,
(In millions)
Operating RevenuesPremiums . . . . . . . . . . . . . . . . . . . . . . . . . . . . . . . . . . . . . . . . . . . . . . . . . . . . $ 11 $ 19 $ (8) (42.1)%Net investment income . . . . . . . . . . . . . . . . . . . . . . . . . . . . . . . . . . . . . . . . . . . . 992 477 515 108.0%Other revenues . . . . . . . . . . . . . . . . . . . . . . . . . . . . . . . . . . . . . . . . . . . . . . . . . 1,044 1,092 (48) (4.4)%
Total operating revenues . . . . . . . . . . . . . . . . . . . . . . . . . . . . . . . . . . . . . . . . . 2,047 1,588 459 28.9%
Operating ExpensesPolicyholder benefits and dividends . . . . . . . . . . . . . . . . . . . . . . . . . . . . . . . . . . . . (14) 4 (18) (450.0)%Interest credited to bank deposits . . . . . . . . . . . . . . . . . . . . . . . . . . . . . . . . . . . . . 137 163 (26) (16.0)%Amortization of DAC and VOBA . . . . . . . . . . . . . . . . . . . . . . . . . . . . . . . . . . . . . . 1 3 (2) (66.7)%Interest expense on debt . . . . . . . . . . . . . . . . . . . . . . . . . . . . . . . . . . . . . . . . . . 1,126 1,027 99 9.6%Other expenses . . . . . . . . . . . . . . . . . . . . . . . . . . . . . . . . . . . . . . . . . . . . . . . . 1,155 1,336 (181) (13.5)%
Total operating expenses . . . . . . . . . . . . . . . . . . . . . . . . . . . . . . . . . . . . . . . . . 2,405 2,533 (128) (5.1)%
Provision for income tax expense (benefit) . . . . . . . . . . . . . . . . . . . . . . . . . . . . . . . (300) (617) 317 51.4%
Operating earnings . . . . . . . . . . . . . . . . . . . . . . . . . . . . . . . . . . . . . . . . . . . . . . (58) (328) 270 82.3%Less: Preferred stock dividends . . . . . . . . . . . . . . . . . . . . . . . . . . . . . . . . . . . . . . 122 122 — —%
Operating earnings available to common shareholders . . . . . . . . . . . . . . . . . . . . . . . $ (180) $ (450) $ 270 60.0%
Unless otherwise stated, all amounts discussed below are net of income tax.During 2010, mortgage refinancing activity continued to return to more moderate levels compared to the unusually high levels experienced
in 2009. Consistent with these market conditions, we experienced a $15.2 billion decline in residential mortgage production during 2010,while our serviced residential mortgage loans increased $20.1 billion, which includes a $16.5 billion purchase from a FDIC receivership bankin the third quarter of 2010 and a net sale of $4.8 billion to FNMA in the second quarter of 2010. Servicing run-off of existing business slowedto 18.2% in 2010 compared with 19.6% in 2009.
The Holding Company completed four debt financings in August 2010 in anticipation of the Acquisition, issuing $1.0 bill ion of 2.375% senior notes,$1.0 billion of 4.75% senior notes, $750 million of 5.875% senior notes, and $250 million of floating rate senior notes. The Holding Company also issued debtsecurities, which are part of the $3.0 billion stated value of common equity units. The proceeds from these debt issuances were used to finance the Acquisition.The Holding Company completed three debt issuances in 2009 in response to the economic crisis, issuing $397 million of floating rate senior notes in March2009, $1.3 bill ion of senior notes in May 2009, and $500 million of junior subordinated debt securities in July 2009. The proceeds from these debt issuanceswere used for general corporate purposes.
Operating earnings available to common shareholders and operating earnings, which excludes preferred stock dividends, each increased$270 million, primarily due to an increase in net investment income and a reduction in operating expenses, partially offset by a decline inmortgage banking revenues, a decrease in tax benefit and an increase in interest expense resulting from the debt issuances noted above.
Net investment income increased $335 million reflecting an increase of $189 million due to higher yields and an increase of $146 millionfrom growth in average invested assets. Yields were positively impacted by the effects of recovering private equity markets and stabilizing realestate markets on other limited partnership interests and real estate joint ventures. This was partially offset by lower fixed maturities yieldswhich were adversely impacted by the reinvestment of proceeds from maturities and sales during this lower interest rate environment and fromdecreased trading and other securities results due to a stronger recovery in equity markets in 2009 as compared to 2010. In addition, due tothe lower interest rate environment in the current year, less net investment income was credited to the segments in 2010 compared to 2009.Growth in average invested assets was primarily due to an increase in bank deposits, higher cash collateral balances received from our
27MetLife, Inc.

derivative counterparties and the temporary investment of the proceeds from the debt and common stock issuances in anticipation of theAcquisition. Our investments primarily include structured finance securities, investment grade corporate fixed maturities, mortgage loans andU.S. Treasury, agency and government guaranteed fixed maturity securities. In addition, our investment portfolio includes the excess capitalnot allocated to the segments. Accordingly, it includes a higher allocation of certain other invested asset classes to provide additionaldiversification and opportunity for long-term yield enhancement, including leveraged leases, other limited partnership interests, real estate,real estate joint ventures, trading securities and equity securities.
Banking, Corporate & Other benefited in 2010 from a $76 million reduction in discretionary spending, such as consulting and postemploymentrelated costs, a $35 million decrease in real estate-related charges and $15 million of lower legal costs. Other expenses also include a $48 milliondecrease in commissions as a result of the decline in residential mortgage loan production discussed below. These savings were partially offset by a$14 million increase in charitable contributions. The current year also included $44 million of internal resource costs for associates committed to theAcquisition and a $23 million increase in expenses associated with expanding the infrastructure of our banking business. Additionally, the positiveresolution of certain legal matters increased operating earnings by $27 million.
The $15.2 billion decline in residential mortgage loan production resulted in a $131 million decrease in operating earnings, $32 million ofwhich is reflected in net investment income with the remainder largely attributable to a reduction in fee income. The increase in the servicedresidential mortgage loan portfolio improved operating earnings by $41 million despite the increased infrastructure expenses discussedabove.
Maturing time deposits and the need for liquidity in the lower interest rate environment of 2010 resulted in a $17 million decrease in interestcredited to bank deposits, despite growth of $1.7 billion in deposits.
Interest expense increased $64 million primarily as a result of the debt issuances in 2009 and the senior notes and debt securities issued inanticipation of the Acquisition, partially offset by the impact of lower interest rates on variable rate collateral financing arrangements.
The 2010 period includes $75 million of charges related to the Health Care Act. The Federal government currently provides a MedicarePart D subsidy. The Health Care Act reduced the tax deductibility of retiree health care costs to the extent of any Medicare Part D subsidyreceived beginning in 2013. Because the deductibility of future retiree health care costs is reflected in our financial statements, the entirefuture impact of this change in law was required to be recorded as a charge in the period in which the legislation was enacted. As a result, weincurred a $75 million charge in the first quarter of 2010. The Health Care Act also amended Internal Revenue Code Section 162(m) as a resultof which MetLife was initially considered a healthcare provider, as defined, and would be subject to limits on tax deductibility of certain types ofcompensation. In December 2010, the Internal Revenue Service issued Notice 2011-2 which clarified that the executive compensationdeduction limitation included in the Health Care Act did not apply to insurers like MetLife selling de minimis amounts of health care coverage.As a result, in the fourth quarter of 2010, we reversed $18 million of previously recorded taxes for 2010. In 2009, Banking, Corporate & Otherreceived a larger benefit of $36 million as compared to 2010 related to the utilization of tax preferenced investments which provide tax creditsand deductions.
Results of Operations
Year Ended December 31, 2009 compared with the Year Ended December 31, 2008Unfavorable market conditions continued through 2009, providing a challenging business environment. The largest and most significant
impact continued to be on our investment portfolio as declining yields resulted in lower net investment income. Market sensitive expenseswere also negatively impacted by the market conditions as evidenced by an increase in pension and postretirement benefit costs. Higherlevels of unemployment continued to impact certain group businesses as a decrease in covered payrolls reduced growth. Our auto andhomeowners business was impacted by a declining housing market, the deterioration of the new auto sales market and the continuation ofcredit availability issues, all of which contributed to a decrease in insured exposures. Despite the challenging business environment, revenuegrowth remained solid in the majority of our businesses. A flight to quality during the year contributed to an improvement in sales in both ourdomestic fixed and variable annuity products. We also saw an increase in market share, especially in the structured settlement business,where we experienced an increase of 53% in premiums. An improvement in the global financial markets contributed to a recovery of sales inmost of our international regions and resulted in improved investment performance in some regions during the second half of 2009. We alsobenefited domestically from a strong residential mortgage refinance market and healthy growth in the reverse mortgage arena.
2009 2008 Change % Change
Years Ended December 31,
(In millions)
RevenuesPremiums . . . . . . . . . . . . . . . . . . . . . . . . . . . . . . . . . . . . . . . . . . . . . . . . . . . $26,460 $25,914 $ 546 2.1%Universal life and investment-type product policy fees . . . . . . . . . . . . . . . . . . . . . . . 5,203 5,381 (178) (3.3)%Net investment income . . . . . . . . . . . . . . . . . . . . . . . . . . . . . . . . . . . . . . . . . . . 14,837 16,289 (1,452) (8.9)%Other revenues . . . . . . . . . . . . . . . . . . . . . . . . . . . . . . . . . . . . . . . . . . . . . . . . 2,329 1,586 743 46.8%Net investment gains (losses) . . . . . . . . . . . . . . . . . . . . . . . . . . . . . . . . . . . . . . (2,906) (2,098) (808) (38.5)%Net derivative gains (losses) . . . . . . . . . . . . . . . . . . . . . . . . . . . . . . . . . . . . . . . (4,866) 3,910 (8,776) (224.5)%
Total revenues . . . . . . . . . . . . . . . . . . . . . . . . . . . . . . . . . . . . . . . . . . . . . . . 41,057 50,982 (9,925) (19.5)%
ExpensesPolicyholder benefits and claims and policyholder dividends . . . . . . . . . . . . . . . . . . . 29,986 29,188 798 2.7%Interest credited to policyholder account balances . . . . . . . . . . . . . . . . . . . . . . . . . 4,849 4,788 61 1.3%Interest credited to bank deposits . . . . . . . . . . . . . . . . . . . . . . . . . . . . . . . . . . . . 163 166 (3) (1.8)%Capitalization of DAC . . . . . . . . . . . . . . . . . . . . . . . . . . . . . . . . . . . . . . . . . . . . (3,019) (3,092) 73 2.4%Amortization of DAC and VOBA . . . . . . . . . . . . . . . . . . . . . . . . . . . . . . . . . . . . . 1,307 3,489 (2,182) (62.5)%Interest expense on debt . . . . . . . . . . . . . . . . . . . . . . . . . . . . . . . . . . . . . . . . . 1,044 1,051 (7) (0.7)%Other expenses . . . . . . . . . . . . . . . . . . . . . . . . . . . . . . . . . . . . . . . . . . . . . . . 11,061 10,333 728 7.0%
Total expenses . . . . . . . . . . . . . . . . . . . . . . . . . . . . . . . . . . . . . . . . . . . . . . 45,391 45,923 (532) (1.2)%
28 MetLife, Inc.

2009 2008 Change % Change
Years Ended December 31,
(In millions)
Income (loss) from continuing operations before provision for income tax . . . . . . . . . . (4,334) 5,059 (9,393) (185.7)%Provision for income tax expense (benefit) . . . . . . . . . . . . . . . . . . . . . . . . . . . . . . (2,015) 1,580 (3,595) (227.5)%
Income (loss) from continuing operations, net of income tax . . . . . . . . . . . . . . . . . . . (2,319) 3,479 (5,798) (166.7)%Income (loss) from discontinued operations, net of income tax . . . . . . . . . . . . . . . . . 41 (201) 242 120.4%
Net income (loss) . . . . . . . . . . . . . . . . . . . . . . . . . . . . . . . . . . . . . . . . . . . . . . (2,278) 3,278 (5,556) (169.5)%Less: Net income (loss) attributable to noncontrolling interests . . . . . . . . . . . . . . . . . (32) 69 (101) (146.4)%
Net income (loss) attributable to MetLife, Inc. . . . . . . . . . . . . . . . . . . . . . . . . . . . . (2,246) 3,209 (5,455) (170.0)%Less: Preferred stock dividends . . . . . . . . . . . . . . . . . . . . . . . . . . . . . . . . . . . . . 122 125 (3) (2.4)%
Net income (loss) available to MetLife, Inc.’s common shareholders . . . . . . . . . . . . . . $ (2,368) $ 3,084 $(5,452) (176.8)%
Unless otherwise stated, all amounts are net of income tax.During the year ended December 31, 2009, MetLife’s income (loss) from continuing operations, net of income tax decreased $5.8 billion to
a loss of $2.3 billion from income of $3.5 billion in the comparable 2008 period. The year over year change was predominantly due to a$5.7 billion unfavorable change in net derivative gains (losses) to losses of $3.2 billion in 2009 from gains of $2.5 billion in 2008, and a$525 million unfavorable change in net investment gains (losses). Offsetting these unfavorable variances totaling $6.2 billion were favorablechanges in adjustments related to net derivative and net investment gains (losses) of $972 million, net of income tax, principally associatedwith DAC and VOBA amortization, resulting in a total unfavorable variance related to net derivative and net investment gains (losses), net ofrelated adjustments and income tax, of $5.2 billion.
We manage our investment portfolio using disciplined ALM principles, focusing on cash flow and duration to support our current and futureliabilities. Our intent is to match the timing and amount of liability cash outflows with invested assets that have cash inflows of comparabletiming and amount, while optimizing, net of income tax, risk-adjusted net investment income and risk-adjusted total return. Our investmentportfolio is heavily weighted toward fixed income investments, with over 80% of our portfolio invested in fixed maturity securities and mortgageloans. These securities and loans have varying maturities and other characteristics which cause them to be generally well suited for matchingthe cash flow and duration of insurance liabilities. Other invested asset classes including, but not limited to equity securities, other limitedpartnership interests and real estate and real estate joint ventures provide additional diversification and opportunity for long-term yieldenhancement in addition to supporting the cash flow and duration objectives of our investment portfolio. We also use derivatives as an integralpart of our management of the investment portfolio to hedge certain risks, including changes in interest rates, foreign currencies, creditspreads and equity market levels. Additional considerations for our investment portfolio include current and expected market conditions andexpectations for changes within our unique mix of products and business segments.
The composition of the investment portfolio of each business segment is tailored to the unique characteristics of its insurance liabilities,causing certain portfolios to be shorter in duration and others to be longer in duration. Accordingly, certain portfolios are more heavilyweighted in fixed maturity securities, or certain sub-sectors of fixed maturity securities, than other portfolios.
Investments are purchased to support our insurance liabilities and not to generate net investment gains and losses. However, netinvestment gains and losses are generated and can change significantly from period to period, due to changes in external influences includingmovements in interest rates, foreign currencies and credit spreads, counterparty specific factors such as financial performance, credit ratingand collateral valuation, and internal factors such as portfolio rebalancing that can generate gains and losses. As an investor in the fixedincome, equity security, mortgage loan and certain other invested asset classes, we are exposed to the above stated risks, which can lead toboth impairments and credit-related losses.
In addition to the above risk management strategies, as an integral part of our management of the investment portfolio, we usefreestanding derivatives to hedge market risks including changes in interest rates, foreign currencies, credit spreads and the equity market.We also use freestanding derivatives to hedge these same risks in certain of our liabilities, including variable annuity minimum benefitguarantees. For those hedges not designated as an accounting hedge, changes in these market risks can lead to the recognition of fair valuechanges in net derivative gains (losses) without an offsetting gain or loss recognized in earnings for the item being hedged even though theseare effective economic hedges. Additionally, we issue liabilities and purchase assets that contain embedded derivatives whose changes inestimated fair value are sensitive to changes in market risks and are also recognized in net derivative gains (losses).
The unfavorable variance in net derivative gains (losses) of $5.7 billion, from gains of $2.5 billion in 2008 to losses of $3.2 billion in 2009was primarily driven by an unfavorable change in freestanding derivatives of $8.6 billion from gains in the prior period of $4.3 billion to losses inthe current period of $4.3 billion. This unfavorable variance was partially offset by a favorable change in embedded derivatives primarilyassociated with variable annuity minimum benefit guarantees of $2.9 billion from losses in the prior period of $1.7 billion to gains in the currentperiod of $1.2 billion.
The $8.6 billion unfavorable variance in freestanding derivatives was primarily attributable to market factors, including rising interest rates,improving equity markets on equity options and futures, decreased equity volatility, weakening U.S. dollar, and narrowing credit spreads.Long-term and mid-term interest rates increased in the current period which caused a negative impact of $4.4 billion on our interest ratederivatives, $1.2 billion of which is attributable to hedges of variable annuity minimum benefit guarantees. Equity markets improved whileequity volatility decreased in the current period, which had a net negative impact of $3.1 billion on our equity derivatives, which we use tohedge variable annuity minimum benefit guarantees. Weakening of the U.S. dollar in the current period had a negative impact of $646 millionon certain foreign currency derivatives that are used to hedge foreign-denominated asset and liability exposures. Narrowing corporate creditspreads had a negative impact of $453 million on our purchased protection credit derivatives.
The variable annuity products with minimum benefit guarantees containing embedded derivatives are measured at fair value separatelyfrom the host variable annuity contract, with changes in estimated fair value reported in net derivative gains (losses). The estimated fair valueof these embedded derivatives also includes an adjustment for nonperformance risk of the related liabilities carried at estimated fair value. The$2.9 billion favorable change in embedded derivatives was primarily attributable to rising interest rates, improving equity market performance,a decrease in equity volatility, and weakening of the U.S. dollar, which was offset by the unfavorable change in the adjustment for
29MetLife, Inc.
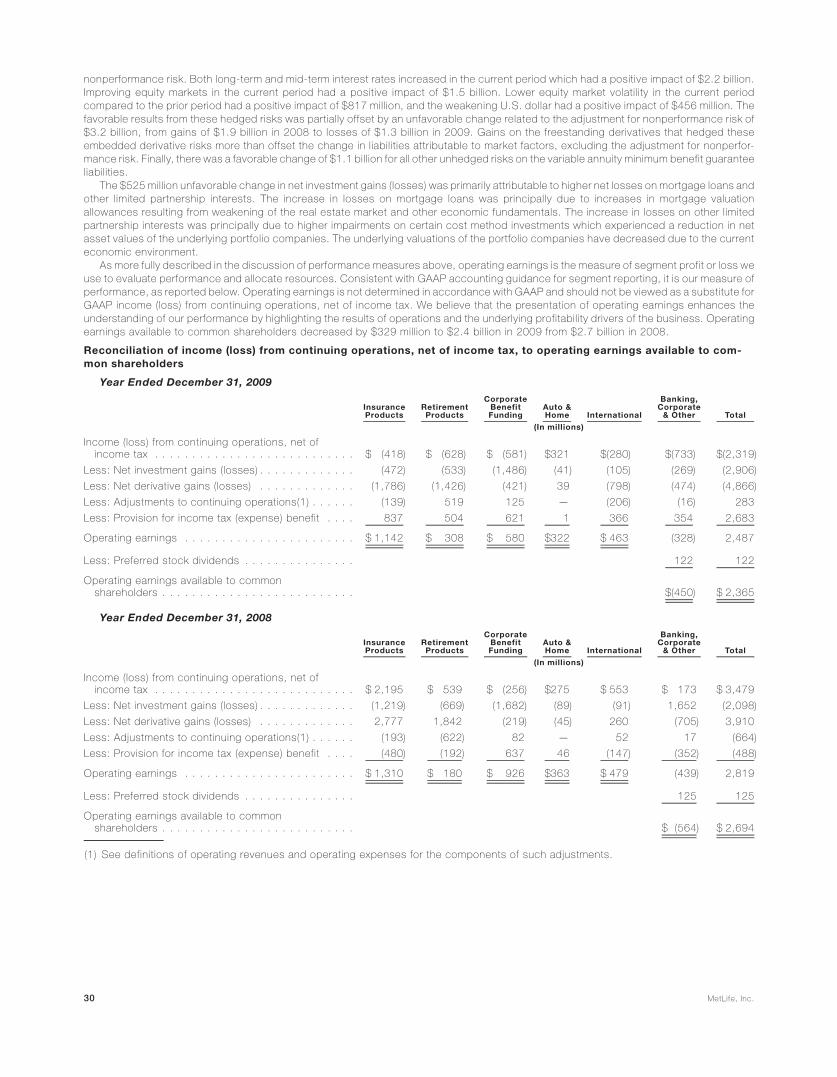
nonperformance risk. Both long-term and mid-term interest rates increased in the current period which had a positive impact of $2.2 billion.Improving equity markets in the current period had a positive impact of $1.5 billion. Lower equity market volatility in the current periodcompared to the prior period had a positive impact of $817 million, and the weakening U.S. dollar had a positive impact of $456 million. Thefavorable results from these hedged risks was partially offset by an unfavorable change related to the adjustment for nonperformance risk of$3.2 billion, from gains of $1.9 billion in 2008 to losses of $1.3 billion in 2009. Gains on the freestanding derivatives that hedged theseembedded derivative risks more than offset the change in liabilities attributable to market factors, excluding the adjustment for nonperfor-mance risk. Finally, there was a favorable change of $1.1 billion for all other unhedged risks on the variable annuity minimum benefit guaranteeliabilities.
The $525 million unfavorable change in net investment gains (losses) was primarily attributable to higher net losses on mortgage loans andother limited partnership interests. The increase in losses on mortgage loans was principally due to increases in mortgage valuationallowances resulting from weakening of the real estate market and other economic fundamentals. The increase in losses on other limitedpartnership interests was principally due to higher impairments on certain cost method investments which experienced a reduction in netasset values of the underlying portfolio companies. The underlying valuations of the portfolio companies have decreased due to the currenteconomic environment.
As more fully described in the discussion of performance measures above, operating earnings is the measure of segment profit or loss weuse to evaluate performance and allocate resources. Consistent with GAAP accounting guidance for segment reporting, it is our measure ofperformance, as reported below. Operating earnings is not determined in accordance with GAAP and should not be viewed as a substitute forGAAP income (loss) from continuing operations, net of income tax. We believe that the presentation of operating earnings enhances theunderstanding of our performance by highlighting the results of operations and the underlying profitability drivers of the business. Operatingearnings available to common shareholders decreased by $329 million to $2.4 billion in 2009 from $2.7 billion in 2008.
Reconciliation of income (loss) from continuing operations, net of income tax, to operating earnings available to com-mon shareholders
Year Ended December 31, 2009
InsuranceProducts
RetirementProducts
CorporateBenefitFunding
Auto &Home International
Banking,Corporate
& Other Total
(In millions)
Income (loss) from continuing operations, net ofincome tax . . . . . . . . . . . . . . . . . . . . . . . . . . . $ (418) $ (628) $ (581) $321 $(280) $(733) $(2,319)
Less: Net investment gains (losses) . . . . . . . . . . . . . (472) (533) (1,486) (41) (105) (269) (2,906)
Less: Net derivative gains (losses) . . . . . . . . . . . . . (1,786) (1,426) (421) 39 (798) (474) (4,866)
Less: Adjustments to continuing operations(1) . . . . . . (139) 519 125 — (206) (16) 283
Less: Provision for income tax (expense) benefit . . . . 837 504 621 1 366 354 2,683
Operating earnings . . . . . . . . . . . . . . . . . . . . . . . $ 1,142 $ 308 $ 580 $322 $ 463 (328) 2,487
Less: Preferred stock dividends . . . . . . . . . . . . . . . 122 122
Operating earnings available to commonshareholders . . . . . . . . . . . . . . . . . . . . . . . . . . $(450) $ 2,365
Year Ended December 31, 2008
InsuranceProducts
RetirementProducts
CorporateBenefitFunding
Auto &Home International
Banking,Corporate
& Other Total
(In millions)
Income (loss) from continuing operations, net ofincome tax . . . . . . . . . . . . . . . . . . . . . . . . . . . $ 2,195 $ 539 $ (256) $275 $ 553 $ 173 $ 3,479
Less: Net investment gains (losses) . . . . . . . . . . . . . (1,219) (669) (1,682) (89) (91) 1,652 (2,098)
Less: Net derivative gains (losses) . . . . . . . . . . . . . 2,777 1,842 (219) (45) 260 (705) 3,910
Less: Adjustments to continuing operations(1) . . . . . . (193) (622) 82 — 52 17 (664)
Less: Provision for income tax (expense) benefit . . . . (480) (192) 637 46 (147) (352) (488)
Operating earnings . . . . . . . . . . . . . . . . . . . . . . . $ 1,310 $ 180 $ 926 $363 $ 479 (439) 2,819
Less: Preferred stock dividends . . . . . . . . . . . . . . . 125 125
Operating earnings available to commonshareholders . . . . . . . . . . . . . . . . . . . . . . . . . . $ (564) $ 2,694
(1) See definitions of operating revenues and operating expenses for the components of such adjustments.
30 MetLife, Inc.

Reconciliation of GAAP revenues to operating revenues and GAAP expenses to operating expenses
Year Ended December 31, 2009
InsuranceProducts
RetirementProducts
CorporateBenefitFunding
Auto &Home International
Banking,Corporate
& Other Total
(In millions)
Total revenues . . . . . . . . . . . . . . . . . . . . . . . . . $23,483 $ 3,725 $ 5,486 $3,113 $4,383 $ 867 $41,057
Less: Net investment gains (losses) . . . . . . . . . . . (472) (533) (1,486) (41) (105) (269) (2,906)
Less: Net derivative gains (losses) . . . . . . . . . . . . (1,786) (1,426) (421) 39 (798) (474) (4,866)
Less: Adjustments related to net investment gains(losses) and net derivative gains (losses) . . . . . . . (27) — — — — — (27)
Less: Other adjustments to revenues(1) . . . . . . . . . (74) (219) 188 — (169) 22 (252)
Total operating revenues . . . . . . . . . . . . . . . . . . $25,842 $ 5,903 $ 7,205 $3,115 $5,455 $1,588 $49,108
Total expenses . . . . . . . . . . . . . . . . . . . . . . . . . $24,165 $ 4,690 $ 6,400 $2,697 $4,868 $2,571 $45,391
Less: Adjustments related to net investment gains(losses) and net derivative gains (losses) . . . . . . . 39 (739) — — — — (700)
Less: Other adjustments to expenses(1) . . . . . . . . (1) 1 63 — 37 38 138
Total operating expenses . . . . . . . . . . . . . . . . . . $24,127 $ 5,428 $ 6,337 $2,697 $4,831 $2,533 $45,953
Year Ended December 31, 2008
InsuranceProducts
RetirementProducts
CorporateBenefitFunding
Auto &Home International
Banking,Corporate
& Other Total
(In millions)
Total revenues . . . . . . . . . . . . . . . . . . . . . . . . . $26,754 $6,487 $ 6,700 $3,061 $6,001 $1,979 $50,982
Less: Net investment gains (losses) . . . . . . . . . . . (1,219) (669) (1,682) (89) (91) 1,652 (2,098)
Less: Net derivative gains (losses) . . . . . . . . . . . . 2,777 1,842 (219) (45) 260 (705) 3,910
Less: Adjustments related to net investment gains(losses) and net derivative gains (losses) . . . . . . . 18 — — — — — 18
Less: Other adjustments to revenues(1) . . . . . . . . . (1) (45) 53 — 69 13 89
Total operating revenues . . . . . . . . . . . . . . . . . . $25,179 $5,359 $ 8,548 $3,195 $5,763 $1,019 $49,063
Total expenses . . . . . . . . . . . . . . . . . . . . . . . . . $23,418 $5,665 $ 7,119 $2,728 $5,044 $1,949 $45,923
Less: Adjustments related to net investment gains(losses) and net derivative gains (losses) . . . . . . . 262 577 — — — — 839
Less: Other adjustments to expenses(1) . . . . . . . . (52) — (29) — 17 (4) (68)
Total operating expenses . . . . . . . . . . . . . . . . . . $23,208 $5,088 $ 7,148 $2,728 $5,027 $1,953 $45,152
(1) See definitions of operating revenues and operating expenses for the components of such adjustments.The volatile market conditions that began in 2008 and continued into 2009 impacted several key components of our operating earnings
available to common shareholders including net investment income, hedging costs, and certain market sensitive expenses. The markets alsopositively impacted our operating earnings available to common shareholders as conditions began to improve during 2009, resulting in lowerDAC and DSI amortization.
A $722 million decline in net investment income was the result of decreasing yields, including the effects of our higher quality, more liquid,but lower yielding investment position in response to the extraordinary market conditions. The impact of declining yields caused a $1.6 billiondecrease in net investment income, which was partially offset by an increase of $846 million due to growth in average invested assetscalculated excluding unrealized gains and losses. The decrease in yields resulted from the disruption and dislocation in the global financialmarkets experienced in 2008, which continued, but moderated, in 2009. The adverse yield impact was concentrated in the following fourinvested asset classes:
• Fixed maturity securities — primarily due to lower yields on floating rate securities from declines in short-term interest rates and anincreased allocation to lower yielding, higher quality, U.S. Treasury, agency and government guaranteed securities, to increase liquidityin response to the extraordinary market conditions, as well as decreased income on our securities lending program, primarily due to thesmaller size of the program in the current year. These adverse impacts were offset slightly as conditions improved late in 2009 and webegan to reallocate our portfolio to higher-yielding assets;
• Real estate joint ventures — primarily due to declining property valuations on certain investment funds that carry their real estate atestimated fair value and operating losses incurred on properties that were developed for sale by development joint ventures;
• Cash, cash equivalents and short-term investments — primarily due to declines in short-term interest rates; and• Mortgage loans — primarily due to lower prepayments on commercial mortgage loans and lower yields on variable rate loans reflecting
declines in short-term interest rates.Equity markets experienced some recovery in 2009, which led to improved yields on other limited partnership interests. As many of our
products are interest spread-based, the lower net investment income was significantly offset by lower interest credited expense on ourinvestment and insurance products.
31MetLife, Inc.

The financial market conditions also resulted in a $348 million increase in net guaranteed annuity benefit costs in our Retirement Productssegment, as increased hedging losses were only partially offset by lower guaranteed benefit costs.
The key driver of the increase in other expenses stemmed from the impact of market conditions on certain expenses, primarily pension andpostretirement benefit costs, reinsurance expenses and letter of credit fees. These increases coupled with higher variable costs, such ascommissions and premium taxes, some of which have been capitalized, more than offset the favorable impact of lower informationtechnology, travel, professional services and advertising expenses, which include the impact of our enterprise-wide cost reduction andrevenue enhancement initiative.
The market improvement which began in the second quarter of 2009 was a key factor in the determination of our expected future grossprofits, the increase of which triggered a decrease in DAC and DSI amortization, most significantly in the Retirement Products segment. Theincrease in our expected future gross profits stemmed primarily from an increase in the market value of our separate account balances, whichis attributable, in part, to the improving financial markets. Our Insurance Products segment benefited, in the current year, from an increase inamortization of unearned revenue, primarily as a result of our annual review of assumptions that are used in the determination of the amount ofamortization recognized. These collective changes in amortization resulted in a $720 million benefit, partially offsetting the declines inoperating earnings available to common shareholders discussed above.
A portion of the decline in operating earnings available to common shareholders was caused by a $200 million reduction in the results ofour closed block of business, a specific group of participating life policies that were segregated in connection with the demutualization ofMLIC. Until early 2009, the operating earnings of the closed block did not have a full impact on operating earnings as the operating earnings orloss was partially offset by a change in the policyholder dividend obligation, a liability established at the time of demutualization. However, inearly 2009 the policyholder dividend obligation was depleted and, as a result, the total operating earnings or loss related to the closed blockfor the year ended December 31, 2009 was, and in the future may be a component of operating earnings.
Business growth, from the majority of our businesses, along with net favorable mortality experience, had a positive impact on operatingearnings available to common shareholders. These impacts were somewhat dampened by higher benefit utilization in our dental business andmixed claim activity in our Auto & Home segment. In addition, our forward and reverse residential mortgage platform acquisitions in late 2008benefited Banking, Corporate & Other’s 2009 results.
Insurance Products
2009 2008 Change % Change
Years Ended December 31,
(In millions)
Operating Revenues
Premiums . . . . . . . . . . . . . . . . . . . . . . . . . . . . . . . . . . . . . . . . . . . . . . . . . . $ 17,168 $ 16,402 $ 766 4.7%
Universal life and investment-type product policy fees . . . . . . . . . . . . . . . . . . . . . . 2,281 2,171 110 5.1%
Net investment income . . . . . . . . . . . . . . . . . . . . . . . . . . . . . . . . . . . . . . . . . . 5,614 5,787 (173) (3.0)%
Other revenues . . . . . . . . . . . . . . . . . . . . . . . . . . . . . . . . . . . . . . . . . . . . . . . 779 819 (40) (4.9)%
Total operating revenues . . . . . . . . . . . . . . . . . . . . . . . . . . . . . . . . . . . . . . . 25,842 25,179 663 2.6%
Operating Expenses
Policyholder benefits and dividends . . . . . . . . . . . . . . . . . . . . . . . . . . . . . . . . . . 19,111 18,183 928 5.1%
Interest credited to policyholder account balances . . . . . . . . . . . . . . . . . . . . . . . . 952 930 22 2.4%
Capitalization of DAC . . . . . . . . . . . . . . . . . . . . . . . . . . . . . . . . . . . . . . . . . . . (873) (849) (24) (2.8)%
Amortization of DAC and VOBA . . . . . . . . . . . . . . . . . . . . . . . . . . . . . . . . . . . . . 725 743 (18) (2.4)%
Interest expense on debt . . . . . . . . . . . . . . . . . . . . . . . . . . . . . . . . . . . . . . . . . 6 5 1 20.0%
Other expenses . . . . . . . . . . . . . . . . . . . . . . . . . . . . . . . . . . . . . . . . . . . . . . 4,206 4,196 10 0.2%
Total operating expenses . . . . . . . . . . . . . . . . . . . . . . . . . . . . . . . . . . . . . . . 24,127 23,208 919 4.0%
Provision for income tax expense (benefit) . . . . . . . . . . . . . . . . . . . . . . . . . . . . . 573 661 (88) (13.3)%
Operating earnings . . . . . . . . . . . . . . . . . . . . . . . . . . . . . . . . . . . . . . . . . . . . $ 1,142 $ 1,310 $ (168) (12.8)%
Unfavorable market conditions, which continued through 2009, provided a challenging business environment for our Insurance Productssegment. This resulted in lower net investment income and an increase in market sensitive expenses, primarily pension and postretirementbenefit costs. We also experienced higher utilization of dental benefits along with a lower number of recoveries in our disability business.Higher levels of unemployment continued to impact certain group businesses as a decrease in covered payrolls reduced growth. However,revenue growth remained solid in all of our businesses. Revenue growth in our dental and individual life businesses reflected strong sales andrenewals.
The significant components of the $168 million decline in operating earnings were the aforementioned decline in net investment income,especially in the closed block business, partially offset by an increase in the amortization of unearned revenue, the impact of a reduction individends to certain policyholders and favorable mortality in the individual life business.
Until early 2009, the earnings of the closed block did not have a full impact on operating earnings as the earnings or loss was partially offsetby a change in the policyholder dividend obligation. However, in early 2009 the policyholder dividend obligation was depleted and, as a result,the total operating earnings or loss related to the closed block for the year ended December 31, 2009 was, and in the future may be, acomponent of operating earnings. This resulted in a $200 million decline in operating earnings in 2009.
The decrease in net investment income of $112 million was primarily due to a $317 million decrease from lower yields, partially offset by a$205 million increase from growth in average invested assets. Yields were adversely impacted by the severe downturn in the global financialmarkets, which primarily impacted other invested assets, real estate joint ventures and fixed maturity securities. In addition, income from oursecurities lending program decreased primarily due to the smaller size of the program in 2009. The growth in the average invested asset basewas primarily from an increase in net flows from our individual life, non-medical health, and group life businesses. The moderate recovery in
32 MetLife, Inc.

equity markets in 2009 led to improved yields on other limited partnership interests, which partially offset the overall reduction in yields. Tomanage the needs of our intermediate to longer-term liabilities, our portfolio consists primarily of investment grade corporate fixed maturitysecurities, structured finance securities (comprised of mortgage and asset-backed securities), mortgage loans, and U.S. Treasury, agencyand government guaranteed fixed maturity securities and, to a lesser extent, certain other invested asset classes including real estate jointventures and other invested assets to provide additional diversification and opportunity for long-term yield enhancement.
Other expenses were essentially flat despite an increase of $137 million from the impact of market conditions on certain expenses,primarily pension and postretirement benefit costs. This increase was partially offset by a decrease of $85 million, predominantly fromdeclines in information technology, travel, and professional services, including the positive impact of our enterprise-wide cost reduction andrevenue enhancement initiative. A further reduction of expenses was achieved through a decrease in variable expenses, such as com-missions and premium taxes of $46 million, a portion of which is offset by DAC capitalization.
The aforementioned declines in operating earnings were partially offset by the favorable impact of a $63 million decrease in policyholderdividends in the traditional life business, the result of a dividend scale reduction in the fourth quarter of 2009. In addition, favorable mortality inthe individual life business was partially offset by higher benefit utilization in the dental business during 2009, reflecting the negativeemployment trends in the marketplace. The net impact of these two items benefited operating earnings by $36 million. The 2009 results werealso favorably impacted by our review of assumptions used to determine estimated gross profits and margins, which in turn are factors indetermining the amortization for DAC and unearned revenue. This review resulted in an unlocking event related to unearned revenue and,coupled with the impact from the prior year’s review, generated an increase in operating earnings of $82 million. This increase was recorded inuniversal life and investment-type product policy fees. Partially offsetting these increases was the impact of lower separate account balances,which resulted in lower fee income of $25 million.
DAC amortization reflects lower current year amortization of $108 million, stemming from the impact of the improvement in the financialmarkets in 2009, which increased our expected future gross profits, as well as lower current year gross margins in the closed block. Thisdecrease was partially offset by the net impact of refinements in both the prior and current years of $98 million, the majority of which wasrecorded in the prior year as a result of the 2008 review of certain DAC related assumptions.
Retirement Products
2009 2008 Change % Change
Years Ended December 31,
(In millions)
Operating Revenues
Premiums . . . . . . . . . . . . . . . . . . . . . . . . . . . . . . . . . . . . . . . . . . . . . . . . . . $ 920 $ 696 $ 224 32.2%
Universal life and investment-type product policy fees . . . . . . . . . . . . . . . . . . . . . 1,712 1,870 (158) (8.4)%
Net investment income . . . . . . . . . . . . . . . . . . . . . . . . . . . . . . . . . . . . . . . . . 3,098 2,624 474 18.1%
Other revenues . . . . . . . . . . . . . . . . . . . . . . . . . . . . . . . . . . . . . . . . . . . . . . 173 169 4 2.4%
Total operating revenues . . . . . . . . . . . . . . . . . . . . . . . . . . . . . . . . . . . . . . . 5,903 5,359 544 10.2%
Operating Expenses
Policyholder benefits and dividends . . . . . . . . . . . . . . . . . . . . . . . . . . . . . . . . . 1,950 1,271 679 53.4%
Interest credited to policyholder account balances . . . . . . . . . . . . . . . . . . . . . . . 1,688 1,338 350 26.2%
Capitalization of DAC . . . . . . . . . . . . . . . . . . . . . . . . . . . . . . . . . . . . . . . . . . (1,067) (980) (87) (8.9)%
Amortization of DAC and VOBA . . . . . . . . . . . . . . . . . . . . . . . . . . . . . . . . . . . . 424 1,356 (932) (68.7)%
Interest expense on debt . . . . . . . . . . . . . . . . . . . . . . . . . . . . . . . . . . . . . . . . — 2 (2) (100.0)%
Other expenses . . . . . . . . . . . . . . . . . . . . . . . . . . . . . . . . . . . . . . . . . . . . . . 2,433 2,101 332 15.8%
Total operating expenses . . . . . . . . . . . . . . . . . . . . . . . . . . . . . . . . . . . . . . 5,428 5,088 340 6.7%
Provision for income tax expense (benefit) . . . . . . . . . . . . . . . . . . . . . . . . . . . . . 167 91 76 83.5%
Operating earnings . . . . . . . . . . . . . . . . . . . . . . . . . . . . . . . . . . . . . . . . . . . . $ 308 $ 180 $ 128 71.1%
In 2009, Retirement Products benefited from a flight to quality, which contributed to a 10% improvement in combined sales of our fixed andvariable products and a 28% reduction in surrenders and withdrawals. Our variable annuity sales have outpaced the industry, increasing ourmarket share. Fixed annuity sales benefited from enhanced marketing on our income annuity with life contingency products, which increasedour premium revenues by $224 million, or 32%, before income taxes. In the annuity business, the movement in premiums is almost entirelyoffset by the related change in policyholder benefits, as the insurance liability that we establish at the time we assume the risk under thesecontracts is typically equivalent to the premium earned less the amount of acquisition expenses. Our average PAB grew by $7.2 billion in2009, primarily due to an increase in sales of fixed annuity products and more customers electing the fixed option on variable annuity sales.This has a favorable impact on earnings by increasing net investment income, which is somewhat offset by higher interest credited expense.Unfavorable market conditions resulted in poor investment performance, which outweighed the impact of higher variable annuity sales on ourseparate account balances causing the average separate account balance to remain lower than the previous year. This resulted in lowerpolicy fees and other revenues which are based on daily asset balances in the policyholder separate accounts.
The improvement in the financial markets was the primary driver of the $128 million increase in operating earnings, with the largest impactresulting in a decrease in DAC, VOBA and DSI amortization of $655 million. The 2008 results reflected increased, or accelerated, amortizationprimarily stemming from a decline in the market value of our separate account balances. A factor that determines the amount of amortization isexpected future earnings, which in the annuity business are derived, in part, from fees earned on separate account balances. The marketvalue of our separate account balances declined significantly in 2008, resulting in a decrease in the expected future gross profits, triggeringan acceleration of amortization in 2008. Beginning in the second quarter of 2009, the market conditions began to improve and the marketvalue of our separate account balances began to increase, resulting in an increase in the expected future gross profits and a correspondinglower level of amortization in 2009.
33MetLife, Inc.

Also contributing to the increase in operating earnings was an increase in net investment income of $308 million, which was primarily dueto a $286 million increase from growth in average invested assets and a $22 million increase in yields. The increase in average invested assetswas due to increased cash flows from the sales of fixed annuity products and more customers electing the fixed option on variable annuitysales, which were reinvested primarily in fixed maturity securities, other invested assets and mortgage loans. The increase in yields was due tomoderate improvement in the equity markets in 2009 which led to an increase in yields principally for other limited partnership interests andcertain other invested assets, which was partially offset by a decrease in yields on real estate joint ventures, reflecting the severe downturn inthe global financial markets. To manage the needs of our intermediate to longer-term liabilities, our portfolio consists primarily of investmentgrade corporate fixed maturity securities, structured finance securities, mortgage loans and U.S. Treasury, agency and governmentguaranteed fixed maturity securities and, to a lesser extent, certain other invested asset classes, including real estate joint ventures inorder to provide additional diversification and opportunity for long-term yield enhancement. As is typically the case with fixed annuityproducts, higher net investment income was somewhat offset by higher interest credited expense. Growth in our fixed annuity policyholderaccount balances increased interest credited expense by $186 million in 2009 and higher average crediting rates on fixed annuities increasedinterest credited expense by $27 million.
Operating earnings were negatively impacted by $348 million of operating losses related to the hedging programs for variable annuityminimum death and income benefit guarantees, which are not embedded derivatives, partially offset by a decrease in the liability establishedfor these variable annuity guarantees. The various hedging strategies in place to offset the risk associated with these variable annuityguarantee benefits were more sensitive to market movements than the liability for the guaranteed benefit. Market volatility, improvements inthe equity markets, and higher interest rates produced operating losses on these hedging strategies in the current year. Our hedgingstrategies, which are a key part of our risk management, performed as anticipated. The decrease in annuity guarantee benefit liabilities wasdue to the improvement in the equity markets, higher interest rates and the annual unlocking of future market expectations.
Other expenses increased by $216 million primarily due to an increase of $123 million from the impact of market conditions on certainexpenses. These expenses are largely comprised of reinsurance costs, pension and postretirement benefit expenses, and letter of creditfees. In addition, variable expenses, such as commissions and premium taxes, increased $77 million, the majority of which have been offsetby DAC capitalization. The positive impact of our enterprise-wide cost reduction and revenue enhancement initiative was reflected in lowertravel, professional services and advertising expenses, but was more than offset by increases largely due to business growth.
Finally, policy fees and other revenues decreased by $100 million, mainly due to lower average separate account balances in the currentyear versus prior year.
Corporate Benefit Funding
2009 2008 Change % Change
Years Ended December 31,
(In millions)
Operating Revenues
Premiums . . . . . . . . . . . . . . . . . . . . . . . . . . . . . . . . . . . . . . . . . . . . . . . . . . . $2,264 $2,348 $ (84) (3.6)%
Universal life and investment-type product policy fees . . . . . . . . . . . . . . . . . . . . . . 176 227 (51) (22.5)%
Net investment income . . . . . . . . . . . . . . . . . . . . . . . . . . . . . . . . . . . . . . . . . . 4,527 5,615 (1,088) (19.4)%
Other revenues . . . . . . . . . . . . . . . . . . . . . . . . . . . . . . . . . . . . . . . . . . . . . . . 238 358 (120) (33.5)%
Total operating revenues . . . . . . . . . . . . . . . . . . . . . . . . . . . . . . . . . . . . . . . . 7,205 8,548 (1,343) (15.7)%
Operating Expenses
Policyholder benefits and dividends . . . . . . . . . . . . . . . . . . . . . . . . . . . . . . . . . . 4,245 4,398 (153) (3.5)%
Interest credited to policyholder account balances . . . . . . . . . . . . . . . . . . . . . . . . 1,632 2,297 (665) (29.0)%
Capitalization of DAC . . . . . . . . . . . . . . . . . . . . . . . . . . . . . . . . . . . . . . . . . . . (14) (18) 4 22.2%
Amortization of DAC and VOBA . . . . . . . . . . . . . . . . . . . . . . . . . . . . . . . . . . . . . 15 29 (14) (48.3)%
Interest expense on debt . . . . . . . . . . . . . . . . . . . . . . . . . . . . . . . . . . . . . . . . . 3 2 1 50.0%
Other expenses . . . . . . . . . . . . . . . . . . . . . . . . . . . . . . . . . . . . . . . . . . . . . . . 456 440 16 3.6%
Total operating expenses . . . . . . . . . . . . . . . . . . . . . . . . . . . . . . . . . . . . . . . 6,337 7,148 (811) (11.3)%
Provision for income tax expense (benefit) . . . . . . . . . . . . . . . . . . . . . . . . . . . . . . 288 474 (186) (39.2)%
Operating earnings . . . . . . . . . . . . . . . . . . . . . . . . . . . . . . . . . . . . . . . . . . . . . $ 580 $ 926 $ (346) (37.4)%
Corporate Benefit Funding benefited in certain markets in 2009 as a flight to quality helped drive our increase in market share, especially inthe structured settlement business, where we experienced a 53% increase in premiums. Our pension closeout business in the U.K .continuesto expand and experienced premium growth during 2009 of almost $400 million, or 105% before income taxes. However, this growth wasmore than offset by a decline in our domestic pension closeout business driven by unfavorable market conditions and regulatory changes. Acombination of poor equity returns and lower interest rates have contributed to pension plans being under funded, which reduces ourcustomers’ flexibility to engage in transactions such as pension closeouts. Our customers’ plans funded status may be affected by a variety offactors, including the ongoing phased implementation of the Pension Protection Act of 2006, a comprehensive reform of defined benefit anddefined contribution plan rules. For each of these businesses, the movement in premiums is almost entirely offset by the related change inpolicyholder benefits. The insurance liability that is established at the time we assume the risk under these contracts is typically equivalent tothe premium earned.
Market conditions also contributed to a lower demand for several of our investment-type products. The decrease in sales of theseinvestment-type products is not necessarily evident in our results of operations as the transactions related to these products are recordedthrough the balance sheet. Our funding agreement products, primarily the LIBOR based contracts, experienced the most significant impactfrom the volatile market conditions. As companies seek greater liquidity, investment managers are refraining from repurchasing the contracts
34 MetLife, Inc.

when they mature and are opting for more liquid investments. In addition, unfavorable market conditions continued to impact the demand forglobal guaranteed interest contracts, a type of funding agreement.
Policyholder account balances for our investment-type products were down by approximately $10 billion during 2009, as issuances weremore than offset by scheduled maturities. However, due to the timing of issuances and maturities, the average policyholder account balancesand liabilities increased from 2008 to 2009. The impact of the decrease in policyholder account balances resulted in lower net investmentincome, which was somewhat offset by lower interest credited expense.
The primary driver of the $346 million decrease in operating earnings was lower net investment income of $707 million reflecting a$682 million decrease from lower yields and a $25 million increase due to growth in average invested assets. Yields were adversely impactedby the severe downturn in the global financial markets which impacted real estate joint ventures, fixed maturity securities, other investedassets and mortgage loans. In addition, income from our securities lending program decreased, primarily due to the smaller size of theprogram during the year. To manage the needs of our longer-term liabilities, our portfolio consists primarily of investment grade corporate fixedmaturity securities, mortgage loans, U.S. Treasury, agency and government guaranteed securities and, to a lesser extent, certain otherinvested asset classes including real estate joint ventures in order to provide additional diversification and opportunity for long-term yieldenhancement. For our shorter-term obligations, we invest primarily in structured finance securities, mortgage loans and investment gradecorporate fixed maturity securities. The yields on these investments have moved consistent with the underlying market indices, primarilyLIBOR and Treasury, on which they are based. The growth in the average invested asset base is consistent with the increase in the averagepolicyholder account balances and liabilities.
As many of our products are interest spread-based, the lower net investment income was somewhat offset by lower net interest creditedexpense of $380 million. The decrease in interest credited expense is attributed to $431 million from lower crediting rates. Crediting rateshave moved consistent with the underlying market indices, primarily LIBOR, on which they are based. The increase in the average policyholderaccount balances resulted in a $51 million increase in interest credited expense.
The year over year decline in operating earnings was also due in part to lower other revenues as the prior year benefited by $44 million infees for the cancellation of a bank owned life insurance stable value wrap policy combined with the surrender of a global guaranteed interestcontract. In addition, a refinement to a reinsurance recoverable in the small business record keeping line of business in the latter part of 2009also contributed $20 million to the decrease in operating earnings.
Current year results benefited from favorable liability refinements as compared to unfavorable liability refinements in 2008, as well asimproved mortality experience in the current year, all in the pension closeouts business. These items improved 2009 operating earnings byapproximately $90 million. Other products generated mortality gains or losses; however, the net change did not have a material impact on ouryear over year results.
Although our other expenses only increased marginally and are not a significant driver of the decrease in operating earnings, the generalthemes associated with the increase are consistent with those factors discussed above in the discussion of our consolidated results ofoperations. Market conditions triggered an increase in our pension and postretirement benefit expenses of $26 million. In addition, variableexpenses, such as commissions and premium taxes, have increased $20 million. These increases were partially offset by a decrease of$36 million, primarily in information technology, travel and professional services expenses, all of which were largely due to our enterprise-widecost reduction and revenue enhancement initiative.
Auto & Home
2009 2008 Change % Change
Years Ended December 31,
(In millions)
Operating Revenues
Premiums . . . . . . . . . . . . . . . . . . . . . . . . . . . . . . . . . . . . . . . . . . . . . . . . . . . . $2,902 $2,971 $(69) (2.3)%
Net investment income . . . . . . . . . . . . . . . . . . . . . . . . . . . . . . . . . . . . . . . . . . . 180 186 (6) (3.2)%
Other revenues . . . . . . . . . . . . . . . . . . . . . . . . . . . . . . . . . . . . . . . . . . . . . . . . 33 38 (5) (13.2)%
Total operating revenues . . . . . . . . . . . . . . . . . . . . . . . . . . . . . . . . . . . . . . . . . 3,115 3,195 (80) (2.5)%
Operating Expenses
Policyholder benefits and dividends . . . . . . . . . . . . . . . . . . . . . . . . . . . . . . . . . . . 1,932 1,924 8 0.4%
Capitalization of DAC . . . . . . . . . . . . . . . . . . . . . . . . . . . . . . . . . . . . . . . . . . . . (435) (444) 9 2.0%
Amortization of DAC and VOBA . . . . . . . . . . . . . . . . . . . . . . . . . . . . . . . . . . . . . . 436 454 (18) (4.0)%
Other expenses . . . . . . . . . . . . . . . . . . . . . . . . . . . . . . . . . . . . . . . . . . . . . . . . 764 794 (30) (3.8)%
Total operating expenses . . . . . . . . . . . . . . . . . . . . . . . . . . . . . . . . . . . . . . . . 2,697 2,728 (31) (1.1)%
Provision for income tax expense (benefit) . . . . . . . . . . . . . . . . . . . . . . . . . . . . . . . 96 104 (8) (7.7)%
Operating earnings . . . . . . . . . . . . . . . . . . . . . . . . . . . . . . . . . . . . . . . . . . . . . . $ 322 $ 363 $(41) (11.3)%
Auto & Home was negatively impacted in 2009 by a declining housing market, the deterioration of the new auto sales market and thecontinuation of credit availability issues, all of which contributed to a decrease in insured exposures in 2009. Average premiums per policyincreased slightly for our homeowners’ policies but decreased for auto policies, primarily as a result of a business shift in insured exposures bystate. In particular, we experienced a large decrease in earned exposures in Massachusetts, whose market was impacted by a regulatorychange, which resulted in a marked increase in competition.
A return to more normal weather conditions in 2009 resulted in fewer, and less severe, catastrophe events than in 2008. This was morethan offset by an increase in both non-catastrophe claim frequencies and non-catastrophe claim severities in 2009.
Mixed claim experience and the impact of lower exposures were the primary drivers of the $41 million decrease in operating earnings.While we had a $90 million decrease in catastrophe-related losses compared to the prior year, we also recorded $68 million less of a benefit in2009 from favorable development of prior year non-catastrophe losses. Current year claim costs rose primarily as a result of a $29 million
35MetLife, Inc.

increase in claim frequency from both our auto and homeowners products. In addition, we had a $15 million net increase in claim severity,stemming from higher severity in our auto line of business that was partially offset by lower severity in our homeowners line of business. In2009, we experienced a decline in insured exposures, which contributed approximately $16 million to the decrease in operating earnings.While this decrease in exposures had a positive impact on the amount of claims, it was more than offset by the negative impact on premiums.The decrease in exposures is largely attributable to slightly higher non-renewal rates, partially offset by greater sales of new policies. Alsocontributing to the decline in earnings was a decrease of $9 million in the average premium per policy, which is primarily due to a shift in earnedexposures to lower average premium states and an increase of $10 million in loss adjustment expenses, primarily related to a decrease inunallocated loss adjusting expense liabilities at the end of 2008.
The impact of the items discussed above can be seen in the unfavorable change in the combined ratio, excluding catastrophes, to 88.9%in 2009 from 83.1% in 2008 and the unfavorable change in the combined ratio, including catastrophes, to 92.3% in 2009 from 91.2% in 2008.
A $25 million decrease in other expenses, including the net change in DAC, partially offset the declines in operating earnings discussedabove. This improvement resulted from decreases in sales-related expenses and from minor fluctuations in a number of expense categories,a portion of which is due to our enterprise-wide cost reduction and revenue enhancement initiative.
Also contributing to the decrease in operating earnings was a decline in net investment income of $4 million which was primarily due to a$9 million decrease from a decline in average invested assets, partially offset by an increase of $5 million due to improved yields.
International
2009 2008 Change % Change
Years Ended December 31,
(In millions)
Operating Revenues
Premiums . . . . . . . . . . . . . . . . . . . . . . . . . . . . . . . . . . . . . . . . . . . . . . . . . . . . $3,187 $3,470 $(283) (8.2)%
Universal life and investment-type product policy fees . . . . . . . . . . . . . . . . . . . . . . . 1,061 1,095 (34) (3.1)%
Net investment income . . . . . . . . . . . . . . . . . . . . . . . . . . . . . . . . . . . . . . . . . . . 1,193 1,180 13 1.1%
Other revenues . . . . . . . . . . . . . . . . . . . . . . . . . . . . . . . . . . . . . . . . . . . . . . . . 14 18 (4) (22.2)%
Total operating revenues . . . . . . . . . . . . . . . . . . . . . . . . . . . . . . . . . . . . . . . . . 5,455 5,763 (308) (5.3)%
Operating Expenses
Policyholder benefits and dividends . . . . . . . . . . . . . . . . . . . . . . . . . . . . . . . . . . . 2,660 3,185 (525) (16.5)%
Interest credited to policyholder account balances . . . . . . . . . . . . . . . . . . . . . . . . . 581 171 410 239.8%
Capitalization of DAC . . . . . . . . . . . . . . . . . . . . . . . . . . . . . . . . . . . . . . . . . . . . (630) (798) 168 21.1%
Amortization of DAC and VOBA . . . . . . . . . . . . . . . . . . . . . . . . . . . . . . . . . . . . . . 415 381 34 8.9%
Interest expense on debt . . . . . . . . . . . . . . . . . . . . . . . . . . . . . . . . . . . . . . . . . . 8 9 (1) (11.1)%
Other expenses . . . . . . . . . . . . . . . . . . . . . . . . . . . . . . . . . . . . . . . . . . . . . . . . 1,797 2,079 (282) (13.6)%
Total operating expenses . . . . . . . . . . . . . . . . . . . . . . . . . . . . . . . . . . . . . . . . 4,831 5,027 (196) (3.9)%
Provision for income tax expense (benefit) . . . . . . . . . . . . . . . . . . . . . . . . . . . . . . . 161 257 (96) (37.4)%
Operating earnings . . . . . . . . . . . . . . . . . . . . . . . . . . . . . . . . . . . . . . . . . . . . . . $ 463 $ 479 $ (16) (3.3)%
An improvement in the global financial markets contributed to a recovery of sales in the majority of our International regions and resulted inimproved investment performance in some regions during the second half of 2009. Sales in Asia Pacific were down primarily from a decreasein variable annuity sales in Japan, primarily as a result of pricing actions we took during the latter half of 2009. This decline was somewhatoffset by growth in South Korea’s fixed annuities product and an increase of variable universal life sales, which are indications that markets arebeginning to recover. We experienced growth in the pension, group life, and medical businesses of our Latin America region, specifically inMexico. Our operations in Europe and the Middle East continue to have strong growth in the European variable annuity business.
The reduction in operating earnings includes the adverse impact of changes in foreign currency exchange rates in 2009 as the U.S. dollarstrengthened against the various foreign currencies. This decreased operating earnings by $99 million in 2009 relative to 2008. Excluding theimpact of changes in foreign currency exchange rates, operating earnings increased $83 million, or 22%, from the prior year. This increasewas primarily driven by higher operating earnings of $184 million in our Asia Pacific region, while operating earnings from our Latin Americaand Europe and Middle East decreased by $83 million and $18 million, respectively.
Asia Pacific. Improving financial market conditions was the primary driver of the increase in operating earnings. net investment income inthe region increased by $422 million due to an increase of $278 million from improved yields on our investment portfolio, $111 million from thechange in results of operating joint ventures, and $33 million from an increase in average invested assets. The increase in yields was primarilydue to higher income of $277 million on the trading and other securities portfolio, stemming from equity markets experiencing some recoveryin 2009. As our trading and other securities portfolio backs unit-linked policyholder liabilities, this increase in income was entirely offset by acorresponding increase in interest credited expense. The income of the Japan joint venture improved by $103 million due to favorableinvestment results and lower amortization of DAC and VOBA. The decrease in DAC and VOBA amortization was primarily due to an increase inthe market value of the joint venture’s separate account balances, which is directly tied to the improving financial markets. A factor thatdetermines the amount of DAC and VOBA amortization is expected future fees earned on separate account balances. Since the market valueof separate account balances have increased, it is expected that future earnings on this block of business will be higher than previouslyanticipated. As a result, the amortization of DAC and VOBA was less in the current year.
Operating earnings in this region also benefited from higher surrender charges of $16 million. Difficult economic conditions in South Koreaduring the first half of the year resulted in a higher level of surrenders. Growth in our Japan reinsurance business and an increase inreinsurance rates contributed $21 million to the increase in operating earnings. In addition, the favorable impact of a reduction in the liability forour variable annuity guarantees contributed $22 million to operating earnings. The change in the liability was primarily due to an increase inseparate account balances in the Japan joint venture. These liabilities are accrued over the life of the contract in proportion to actual and
36 MetLife, Inc.

future expected policy assessments based on the level of guaranteed minimum benefits generated using multiple scenarios of separateaccount returns. The scenarios use best estimate assumptions consistent with those used to amortize DAC. Because separate accountbalances have had positive returns relative to the prior year, current estimates of future benefits are lower than that previously projected whichresulted in a decrease in this liability in the current period. Partially offsetting these increases, higher DAC amortization of $49 million resultedfrom business growth and favorable investment results.
Latin America. The decrease in operating earnings was primarily driven by lower net investment income. Net investment incomedecreased by $297 million due to a decrease of $383 million from lower yields, partially offset by an increase of $86 million due to an increasein average invested assets. The decrease in yields was due, in part, to the impact of changes in assumptions for measuring the effects ofinflation on certain inflation-indexed fixed maturity securities. This decrease was partially offset by a reduction of $221 million in the relatedinsurance liability primarily due to lower inflation. The increase in net investment income attributable to an increase in average invested assetswas primarily due to business growth and, as such, was largely offset by increases in policyholder benefits and interest credited expense.
Higher claims experience in Mexico resulted in a $45 million decline in operating earnings. The nationalization and reform of the pensionbusiness in Argentina impacted both years earnings, resulting in a net $36 million decline in operating earnings. In addition, operatingearnings decreased due to a net income tax increase of $8 million in Mexico, resulting from a change in assumption regarding the repatriationof earnings, partially offset by the favorable impact of a lower effective tax rate in 2009.
Partially offsetting these decreases in operating earnings was the combination of growth in Mexico’s individual and institutional businessesand higher premium rates in its institutional business, which increased operating earnings by $51 million. Pesification in Argentina impactedboth the current year and prior year earnings, resulting in a net $73 million increase in operating earnings. This benefit was largely due to areassessment of our approach in managing existing and potential future claims related to certain social security pension annuity contractholders in Argentina resulting in a liability release. Lower expenses of $8 million resulted primarily from the impact of operational efficienciesachieved through our enterprise-wide cost reduction and revenue enhancement initiative.
Europe and Middle East. The impact of foreign currency transaction gains and a tax benefit, both of which occurred in the prior year,contributed $12 million to the decline in operating earnings. Our investment of $9 million in our distribution capability and growth initiatives in2009 also reduced operating earnings. There was an increase in net investment income of $76 million, which was due to an increase of$65 million from an improvement in yields and $11 million from an increase in average invested assets. The increase in yields was primarily dueto favorable results on the trading and other securities portfolio, stemming from the equity markets experiencing some recovery in 2009. Asour trading and other securities portfolio backs unit-linked policyholder liabilities, the trading and other securities portfolio results were entirelyoffset by a corresponding increase in interest credited expense. The increase in net investment income attributable to an increase in averageinvested assets was primarily due to business growth and was largely offset by increases in policyholder benefits and interest creditedexpense, also due to business growth.
Banking, Corporate & Other
2009 2008 Change % Change
Years Ended December 31,
(In millions)
Operating RevenuesPremiums . . . . . . . . . . . . . . . . . . . . . . . . . . . . . . . . . . . . . . . . . . . . . . . . . . . . $ 19 $ 27 $ (8) (29.6)%Net investment income . . . . . . . . . . . . . . . . . . . . . . . . . . . . . . . . . . . . . . . . . . . . 477 808 (331) (41.0)%Other revenues . . . . . . . . . . . . . . . . . . . . . . . . . . . . . . . . . . . . . . . . . . . . . . . . . 1,092 184 908 493.5%
Total operating revenues . . . . . . . . . . . . . . . . . . . . . . . . . . . . . . . . . . . . . . . . . 1,588 1,019 569 55.8%
Operating ExpensesPolicyholder benefits and dividends . . . . . . . . . . . . . . . . . . . . . . . . . . . . . . . . . . . . 4 46 (42) (91.3)%Interest credited to policyholder account balances . . . . . . . . . . . . . . . . . . . . . . . . . . — 7 (7) (100.0)%Interest credited to bank deposits . . . . . . . . . . . . . . . . . . . . . . . . . . . . . . . . . . . . . 163 166 (3) (1.8)%Capitalization of DAC . . . . . . . . . . . . . . . . . . . . . . . . . . . . . . . . . . . . . . . . . . . . . — (3) 3 100.0%Amortization of DAC and VOBA . . . . . . . . . . . . . . . . . . . . . . . . . . . . . . . . . . . . . . 3 5 (2) (40.0)%Interest expense on debt . . . . . . . . . . . . . . . . . . . . . . . . . . . . . . . . . . . . . . . . . . 1,027 1,033 (6) (0.6)%Other expenses . . . . . . . . . . . . . . . . . . . . . . . . . . . . . . . . . . . . . . . . . . . . . . . . 1,336 699 637 91.1%
Total operating expenses . . . . . . . . . . . . . . . . . . . . . . . . . . . . . . . . . . . . . . . . . 2,533 1,953 580 29.7%
Provision for income tax expense (benefit) . . . . . . . . . . . . . . . . . . . . . . . . . . . . . . . (617) (495) (122) (24.6)%
Operating earnings . . . . . . . . . . . . . . . . . . . . . . . . . . . . . . . . . . . . . . . . . . . . . . (328) (439) 111 25.3%Less: Preferred stock dividends . . . . . . . . . . . . . . . . . . . . . . . . . . . . . . . . . . . . . . 122 125 (3) (2.4)%
Operating earnings available to common shareholders . . . . . . . . . . . . . . . . . . . . . . . $ (450) $ (564) $ 114 20.2%
Banking, Corporate & Other recognized the full year impact of our forward and reverse residential mortgage platform acquisitions, a strongresidential mortgage refinance market, healthy growth in the reverse mortgage arena, and a favorable interest spread environment. Ourforward and reverse residential mortgage production of $37.4 billion in 2009 was up 484% compared to 2008 production. The increase inmortgage production drove higher investments in residential mortgage loans held-for-sale and MSRs. At December 31, 2009, our residentialmortgage loans servicing portfolio was $64.1 billion comprised of agency (FNMA, FHLMC, and GNMA) portfolios. Transaction and timedeposits, which provide a relatively stable source of funding and liquidity and are used to fund loans and fixed income securities purchases,grew 48% in 2009 to $10.2 billion. Borrowings decreased 10% in 2009 to $2.4 billion. During 2009, we participated in the Federal ReserveBank of New York Term Auction Facility, which provided short term liquidity with low funding costs.
In response to the economic crisis and unusual financial market events that occurred in 2008 and continued into 2009, we decided to util ize excessdebt capacity. The Holding Company completed three debt issuances in 2009. The Holding Company issued $397 million of floating rate senior notesin March 2009, $1.3 billion of senior notes in May 2009, and $500 million of junior subordinated debt securities in July 2009. In February 2009, inconnection with the initial settlement of the stock purchase contracts issued as part of the common equity units sold in June 2005, the Holding
37MetLife, Inc.
Company issued common stock for $1.0 billion. The proceeds from these equity and debt issuances were used for general corporate purposes andhave resulted in increased investments and cash and cash equivalents held within Banking, Corporate & Other.
Operating earnings available to common shareholders improved by $114 million, of which $254 million was due to MetLife Bank and itsacquisitions of a residential mortgage origination and servicing business and a reverse mortgage business, both during 2008. Excluding theimpact of MetLife Bank, our operating earnings available to common shareholders decreased $140 million, primarily due to lower netinvestment income, partially offset by the impact of a lower effective tax rate. The lower effective tax rate provided an increased benefit of$139 million from the prior year. This benefit was the result of a partial settlement of certain prior year tax audit issues and increased utilizationof tax preferenced investments, which provide tax credits and deductions.
Excluding a $68 million increase from MetLife Bank, net investment income decreased $283 million, which was primarily due a decrease of$287 million due to lower yields, partially offset by an increase of $4 million due to an increase in average invested assets. Consistent with theconsolidated results of operations discussion above, yields were adversely impacted by the severe downturn in the global financial markets,which primarily impacted fixed maturity securities and real estate joint ventures. The increased average invested asset base was due to cashflows from debt issuances during 2009. Our investments primarily include structured finance securities, investment grade corporate fixedmaturity securities, U.S. Treasury, agency and government guaranteed fixed maturity securities and mortgage loans. In addition, ourinvestment portfolio includes the excess capital not allocated to the segments. Accordingly, it includes a higher allocation of certain otherinvested asset classes to provide additional diversification and opportunity for long-term yield enhancement including leveraged leases, otherlimited partnership interests, real estate, real estate joint ventures and equity securities.
After excluding the impact of a $394 million increase from MetLife Bank, other expenses increased by $20 million. Deferred compensationcosts, which are tied to equity market performance, were higher due to a significant market rebound. We also had an increase in costsassociated with the implementation of our enterprise-wide cost reduction and revenue enhancement initiative. These increases were partiallyoffset by lower postemployment related costs and corporate-related expenses, specifically legal costs. Legal costs were lower largely due tothe prior year commutation of asbestos policies. In addition, interest expense declined slightly as a result of rate reductions on variable ratecollateral financing arrangements offset by debt issuances in 2009 and 2008.
Effects of InflationThe Company does not believe that inflation has had a material effect on its consolidated results of operations, except insofar as inflation
may affect interest rates.Inflation in the U.S. has remained contained and been in a general downward trend for an extended period. However, in light of recent and ongoing
aggressive fiscal and monetary stimulus measures by the U.S. federal government and foreign governments, it is possible that inflation could increasein the future. Globally, inflation trends can vary by region and between developed and emerging markets. The Japanese economy, to which we faceincreased exposure as a result of the Acquisition, continues to experience low nominal growth and a deflationary environment. As the global economyimproves, inflation trends are increasing in other regions, particularly in emerging markets like China and India. In the more developed Eurozonecountries, inflation rates, while not as high, have trended upward at a greater pace than in the U.S.
An increase in inflation could affect our business in several ways. During inflationary periods, the value of fixed income investments fallswhich could increase realized and unrealized losses. Inflation also increases expenses for labor and other materials, potentially puttingpressure on profitability if such costs can not be passed through in our product prices. Inflation could also lead to increased costs for lossesand loss adjustment expenses in certain of our businesses, which could require us to adjust our pricing to reflect our expectations for futureinflation. Prolonged and elevated inflation could adversely affect the financial markets and the economy generally, and dispelling it may requiregovernments to pursue a restrictive fiscal and monetary policy, which could constrain overall economic activity, inhibit revenue growth andreduce the number of attractive investment opportunities.
InvestmentsInvestment Risks. The Company’s primary investment objective is to optimize, net of income tax, risk-adjusted investment income and
risk-adjusted total return while ensuring that assets and liabilities are managed on a cash flow and duration basis. The Company is exposed tofour primary sources of investment risk:
• credit risk, relating to the uncertainty associated with the continued ability of a given obligor to make timely payments of principal andinterest;
• interest rate risk, relating to the market price and cash flow variability associated with changes in market interest rates;• liquidity risk, relating to the diminished ability to sell certain investments in times of strained market conditions; and• market valuation risk, relating to the variability in the estimated fair value of investments associated with changes in market factors such
as credit spreads.The Company manages risk through in-house fundamental analysis of the underlying obligors, issuers, transaction structures and real
estate properties. The Company also manages credit risk, market valuation risk and liquidity risk through industry and issuer diversificationand asset allocation. For real estate and agricultural assets, the Company manages credit risk and market valuation risk through geographic,property type and product type diversification and asset allocation. The Company manages interest rate risk as part of its asset and liabilitymanagement strategies; product design, such as the use of market value adjustment features and surrender charges; and proactivemonitoring and management of certain non-guaranteed elements of its products, such as the resetting of credited interest and dividend ratesfor policies that permit such adjustments. The Company also uses certain derivative instruments in the management of credit, interest rate,currency and equity market risks.
Current Environment. The global economy and markets are now recovering from a period of significant stress that began in the secondhalf of 2007 and substantially increased through the first quarter of 2009. This disruption adversely affected the financial services industry, inparticular. The U.S. economy entered a recession in late 2007. This recession ended in mid-2009, but the recovery from the recession hasbeen below historic averages and the unemployment rate is expected to remain high for some time. In addition, inflation has fallen over the lastseveral years and is expected to remain at low levels for some time. Some economists believe that some level of disinflation and deflation riskremains in the U.S. economy.
Although the disruption in the global financial markets has moderated, not all such markets are functioning normally, and some remainreliant upon government intervention and liquidity. The global recession and disruption of the financial markets has also led to concerns overcapital markets access and the solvency of certain European Union member states, including Portugal, Ireland, Italy, Greece and Spain. The
38 MetLife, Inc.

Japanese economy, to which we face increased exposure to as a result of the Acquisition, continues to experience low nominal growth, adeflationary environment, and weak consumer spending. See “— Industry Trends.” See also “Investments — Fixed Maturity and EquitySecurities Available-for-Sale — Concentrations of Credit Risk (Fixed Maturity Securities) — Summary” in Note 3 of the Notes to ConsolidatedFinancial Statements for information about exposure to sovereign fixed maturity securities of Portugal, Ireland, Italy, Greece and Spain.
During the year ended December 31, 2010, the net unrealized loss position on fixed maturity and equity securities improved from a netunrealized loss of $2.2 billion at December 31, 2009 to a net unrealized gain of $7.3 billion at December 31, 2010, as a result of a decrease ininterest rates, and to a lesser extent, a decrease in credit spreads.
Investment Outlook. Recovering private equity markets and stabilizing credit and real estate markets during 2010 had a positive impacton returns and net investment income on private equity funds, hedge funds and real estate funds, which are included within other limitedpartnership interests and real estate and real estate joint venture portfolios. Although the disruption in the global financial markets hasmoderated, if there is a resumption of significant disruption, it could adversely impact returns and net investment income on these alternativeinvestment classes. Net cash flows arising from our business and our investment portfolio will be reinvested in a prudent manner andaccording to our ALM discipline in appropriate assets over time. We will maintain a sufficient level of liquidity to meet business needs. Netinvestment income may be adversely affected if excess liquidity is required over an extended period of time to meet changing business needs.
Composition of Investment Portfolio and Investment Portfolio ResultsThe following yield table presents the investment income, investment portfolio gains (losses), annualized yields on average ending assets
and ending carrying value for each of the asset classes within the Company’s investment portfolio, as well as investment income andinvestment portfolio gains (losses) for the investment portfolio as a whole. The yield table also presents gains (losses) on derivativeinstruments which are used to manage risk for certain invested assets and certain insurance liabilities:
2010 2009 2008
At and for the Years Ended December 31,
(In millions)
Fixed Maturity Securities:Yield(1) . . . . . . . . . . . . . . . . . . . . . . . . . . . . . . . . . . . . . . . . . . . . . . . . . . 5.53% 5.77% 6.40%Investment income(2), (3), (4) . . . . . . . . . . . . . . . . . . . . . . . . . . . . . . . . . . . $ 12,650 $ 11,899 $ 12,403Investment gains (losses) (3) . . . . . . . . . . . . . . . . . . . . . . . . . . . . . . . . . . . . $ (255) $ (1,663) $ (1,953)Ending carrying value(2), (3) . . . . . . . . . . . . . . . . . . . . . . . . . . . . . . . . . . . . $327,878 $230,026 $189,197Mortgage Loans:Yield (1) . . . . . . . . . . . . . . . . . . . . . . . . . . . . . . . . . . . . . . . . . . . . . . . . . 5.51% 5.38% 6.08%Investment income(3), (4) . . . . . . . . . . . . . . . . . . . . . . . . . . . . . . . . . . . . . . $ 2,823 $ 2,735 $ 2,774Investment gains (losses)(3) . . . . . . . . . . . . . . . . . . . . . . . . . . . . . . . . . . . . $ 22 $ (442) $ (136)Ending carrying value(3) . . . . . . . . . . . . . . . . . . . . . . . . . . . . . . . . . . . . . . . $ 55,536 $ 50,909 $ 51,364Real Estate and Real Estate Joint Ventures:Yield(1) . . . . . . . . . . . . . . . . . . . . . . . . . . . . . . . . . . . . . . . . . . . . . . . . . . 1.10% (7.47)% 2.98%Investment income . . . . . . . . . . . . . . . . . . . . . . . . . . . . . . . . . . . . . . . . . . $ 77 $ (541) $ 217Investment gains (losses) . . . . . . . . . . . . . . . . . . . . . . . . . . . . . . . . . . . . . . $ (40) $ (156) $ (9)Ending carrying value . . . . . . . . . . . . . . . . . . . . . . . . . . . . . . . . . . . . . . . . $ 8,030 $ 6,896 $ 7,586Policy Loans:Yield(1) . . . . . . . . . . . . . . . . . . . . . . . . . . . . . . . . . . . . . . . . . . . . . . . . . . 6.37% 6.54% 6.22%Investment income . . . . . . . . . . . . . . . . . . . . . . . . . . . . . . . . . . . . . . . . . . $ 657 $ 648 $ 601Ending carrying value . . . . . . . . . . . . . . . . . . . . . . . . . . . . . . . . . . . . . . . . $ 11,914 $ 10,061 $ 9,802Equity Securities:Yield(1) . . . . . . . . . . . . . . . . . . . . . . . . . . . . . . . . . . . . . . . . . . . . . . . . . . 4.39% 5.12% 5.25%Investment income . . . . . . . . . . . . . . . . . . . . . . . . . . . . . . . . . . . . . . . . . . $ 128 $ 175 $ 249Investment gains (losses) . . . . . . . . . . . . . . . . . . . . . . . . . . . . . . . . . . . . . . $ 104 $ (399) $ (253)Ending carrying value . . . . . . . . . . . . . . . . . . . . . . . . . . . . . . . . . . . . . . . . $ 3,606 $ 3,084 $ 3,197Other Limited Partnership Interests:Yield(1) . . . . . . . . . . . . . . . . . . . . . . . . . . . . . . . . . . . . . . . . . . . . . . . . . . 14.99% 3.22% (2.77)%Investment income . . . . . . . . . . . . . . . . . . . . . . . . . . . . . . . . . . . . . . . . . . $ 879 $ 173 $ (170)Investment gains (losses) . . . . . . . . . . . . . . . . . . . . . . . . . . . . . . . . . . . . . . $ (18) $ (356) $ (140)Ending carrying value . . . . . . . . . . . . . . . . . . . . . . . . . . . . . . . . . . . . . . . . $ 6,416 $ 5,508 $ 6,039Cash and Short-Term Investments:Yield(1) . . . . . . . . . . . . . . . . . . . . . . . . . . . . . . . . . . . . . . . . . . . . . . . . . . 0.46% 0.44% 1.62%Investment income . . . . . . . . . . . . . . . . . . . . . . . . . . . . . . . . . . . . . . . . . . $ 81 $ 94 $ 307Investment gains (losses) . . . . . . . . . . . . . . . . . . . . . . . . . . . . . . . . . . . . . . $ 2 $ 6 $ 3Ending carrying value(3) . . . . . . . . . . . . . . . . . . . . . . . . . . . . . . . . . . . . . . . $ 22,394 $ 18,486 $ 38,085Other Invested Assets:(5)Investment income . . . . . . . . . . . . . . . . . . . . . . . . . . . . . . . . . . . . . . . . . . $ 491 $ 339 $ 279Investment gains (losses) . . . . . . . . . . . . . . . . . . . . . . . . . . . . . . . . . . . . . . $ (8) $ (32) $ 313Ending carrying value . . . . . . . . . . . . . . . . . . . . . . . . . . . . . . . . . . . . . . . . $ 15,430 $ 12,709 $ 17,248
39MetLife, Inc.

2010 2009 2008
At and for the Years Ended December 31,
(In millions)
Total Investments:Gross investment income yield(1) . . . . . . . . . . . . . . . . . . . . . . . . . . . . . . . . . 5.29% 4.90% 5.68%Investment fees and expenses yield . . . . . . . . . . . . . . . . . . . . . . . . . . . . . . . (0.14) (0.14) (0.16)
Investment Income Yield(3) . . . . . . . . . . . . . . . . . . . . . . . . . . . . . . . . . . 5.15% 4.76% 5.52%
Gross investment income . . . . . . . . . . . . . . . . . . . . . . . . . . . . . . . . . . . . . . $ 17,786 $ 15,522 $ 16,660Investment fees and expenses . . . . . . . . . . . . . . . . . . . . . . . . . . . . . . . . . . (465) (433) (460)
Investment Income(3), (6) . . . . . . . . . . . . . . . . . . . . . . . . . . . . . . . . . . . . $ 17,321 $ 15,089 $ 16,200
Ending Carrying Value(3) . . . . . . . . . . . . . . . . . . . . . . . . . . . . . . . . . . . . $451,204 $337,679 $322,518
Gross investment gains(3) . . . . . . . . . . . . . . . . . . . . . . . . . . . . . . . . . . . . . $ 1,200 $ 1,232 $ 1,802Gross investment losses(3) . . . . . . . . . . . . . . . . . . . . . . . . . . . . . . . . . . . . . (848) (1,429) (1,935)Writedowns . . . . . . . . . . . . . . . . . . . . . . . . . . . . . . . . . . . . . . . . . . . . . . . (545) (2,845) (2,042)
Investment Portfolio Gains (Losses)(3), (6) . . . . . . . . . . . . . . . . . . . . . . . $ (193) $ (3,042) $ (2,175)Investment portfolio gains (losses) income tax (expense) benefit . . . . . . . . . . . . . 53 1,121 795
Investment Portfolio Gains (Losses), Net of Income Tax . . . . . . . . . . . . . . $ (140) $ (1,921) $ (1,380)
Derivative Gains (Losses)(6) . . . . . . . . . . . . . . . . . . . . . . . . . . . . . . . . . . $ (614) $ (5,106) $ 3,782Derivative gains (losses) income tax (expense) benefit . . . . . . . . . . . . . . . . . . . $ 160 $ 1,803 $ (1,438)
Derivative Gains (Losses), Net of Income Tax . . . . . . . . . . . . . . . . . . . . . $ (454) $ (3,303) $ 2,344
As described in the footnotes below, the yield table reflects certain differences from the presentation of invested assets, net investmentincome, net investment gains (losses) and net derivative gains (losses) as presented in the consolidated balance sheets and consolidatedstatements of operations, including the exclusion of contractholder-directed unit-linked investments classified within trading and othersecurities, as the contractholder, not the Company, directs the investment of the funds; and the exclusion of the effects of consolidatingunder GAAP certain VIEs that are consolidated securitization entities (“CSEs”). We believe this yield table presentation is consistent withhow we measure our investment performance for management purposes enhances understanding.
(1) Yields are based on average of quarterly average asset carrying values, excluding recognized and unrealized investment gains (losses),collateral received from counterparties associated with our securities lending program, the effects of consolidating under GAAP certainVIEs that are treated as CSEs and, effective October 1, 2010, contractholder-directed unit-linked investments. Yields also excludeinvestment income recognized on mortgage loans and securities held by CSEs and, effective October 1, 2010, contractholder-directedunit-linked investments.
(2) Fixed maturity securities include $594 million, $2,384 million and $946 million at estimated fair value of trading and other securities atDecember 31, 2010, 2009 and 2008, respectively. Fixed maturity securities include $234 million, $400 million and ($193) million ofinvestment income related to trading and other securities for the years ended December 31, 2010, 2009 and 2008, respectively.
(3) (a) Fixed maturity securities ending carrying values as presented herein, exclude (i) contractholder-directed unit-linked investments —reported within trading and other securities of $17,794 million, and (ii) securities held by CSEs that are consolidated under GAAP —reported within trading and other securities of $201 million at December 31, 2010. Net investment income as presented herein, excludesinvestment income on contractholder-directed unit-linked investments — reported within trading and other securities effective October 1,2010 as shown in footnote (6) to this yield table.
(b) Ending carrying values, investment income and investment gains (losses) as presented herein, exclude the effects of consolidatingunder GAAP certain VIEs that are treated as CSEs. The adjustment to investment income and investment gains (losses) in the aggregateare as shown in footnote (6) to this yield table. The adjustments to ending carrying value, investment income and investment gains (losses)by invested asset class are presented below. Both the invested assets and long-term debt of the CSEs are accounted for under the FVO.The adjustment to investment gains (losses) presented below and in footnote (6) to this yield table includes the effects of remeasuring boththe invested assets and long-term debt in accordance with the FVO.
40 MetLife, Inc.

As Reported in theYield Table
Impact of ExcludingTrading and Other
Securities and CSEs
Total — With allTrading and Other
Securities and CSEs
At or for the Year Ended December 31, 2010
(In millions)
Trading and Other Securities (included within FixedMaturity Securities):
Ending carrying value . . . . . . . . . . . . . . . . . . . . . . . . . . . $ 594 $17,995 $ 18,589
Investment income . . . . . . . . . . . . . . . . . . . . . . . . . . . . . $ 234 $ 226 $ 460
Investment gains (losses) . . . . . . . . . . . . . . . . . . . . . . . . . $ — $ (30) $ (30)
Mortgage Loans:
Ending carrying value . . . . . . . . . . . . . . . . . . . . . . . . . . . $ 55,536 $ 6,840 $ 62,376
Investment income . . . . . . . . . . . . . . . . . . . . . . . . . . . . . $ 2,823 $ 396 $ 3,219
Investment gains (losses) . . . . . . . . . . . . . . . . . . . . . . . . . $ 22 $ 36 $ 58
Cash and Short-Term Investments:
Ending carrying value . . . . . . . . . . . . . . . . . . . . . . . . . . . $ 22,394 $ 39 $ 22,433
Total Investments:
Ending carrying value . . . . . . . . . . . . . . . . . . . . . . . . . . . $451,204 $24,874 $476,078
(4) Investment income from fixed maturity securities and mortgage loans includes prepayment fees.
(5) Other invested assets are principally comprised of freestanding derivatives with positive estimated fair values and leveraged leases.Freestanding derivatives with negative estimated fair values are included within other liabilities. However, the accruals of settlementpayments in other liabilities are included in net investment income as shown in Note 4 of the Notes to the Consolidated FinancialStatements. As yield is not considered a meaningful measure of performance for other invested assets, it has been excluded from the yieldtable.
(6) Investment income, investment portfolio gains (losses) and derivative gains (losses) presented in this yield table vary from the most directlycomparable measures presented in the GAAP consolidated statements of operations due to certain reclassifications affecting netinvestment income, net investment gains (losses), net derivative gains (losses), and interest credited to PABs and to exclude the effects ofconsolidating under GAAP certain VIEs that are treated as CSEs. Such reclassifications are presented in the tables below.
2010 2009 2008
Years Ended December 31,
(In millions)
Investment income — in the above yield table . . . . . . . . . . . . . . . . . . . . . . . . . . . . . $17,321 $15,089 $16,200
Real estate discontinued operations — deduct from net investment income . . . . . . . . 10 (8) (11)
Scheduled periodic settlement payments on derivatives not qualifying for hedgeaccounting — deduct from net investment income, add to net derivative gains(losses) . . . . . . . . . . . . . . . . . . . . . . . . . . . . . . . . . . . . . . . . . . . . . . . . . . . (208) (88) (5)
Equity method operating joint ventures — add to net investment income, deduct fromnet derivative gains (losses) . . . . . . . . . . . . . . . . . . . . . . . . . . . . . . . . . . . . . (130) (156) 105
Net investment income on contractholder-directed unit-linked investments — reportedwithin trading and other securities — add to net investment income . . . . . . . . . . . . 211 — —
Incremental net investment income from CSEs— add to net investment income . . . . . 411 — —
Net investment income — GAAP consolidated statements of operations . . . . . . . . . . . . $17,615 $14,837 $16,289
41MetLife, Inc.

2010 2009 2008
Years Ended December 31,
(In millions)
Investment portfolio gains (losses) — in the above yield table . . . . . . . . . . . . . . . . . . . $ (193) $ (3,042) $ (2,175)
Real estate discontinued operations — deduct from net investment gains (losses) . . . . (14) (8) (8)
Investment gains (losses) related to CSEs — add to net investment gains (losses) . . . . 6 — —
Purchased credit default swaps that offset losses incurred on certain fixed maturitysecurities — deduct from net investment gains (losses) . . . . . . . . . . . . . . . . . . . . — — (183)
Other gains (losses) — add to net investment gains (losses) . . . . . . . . . . . . . . . . . . (191) 144 268
Net investment gains (losses) — GAAP consolidated statements of operations . . . . . . . $ (392) $ (2,906) $ (2,098)
Derivative gains (losses) — in the above yield table . . . . . . . . . . . . . . . . . . . . . . . . . $ (614) $ (5,106) $ 3,782
Scheduled periodic settlement payments on derivatives not qualifying for hedgeaccounting — add to net derivative gains (losses), deduct from net investmentincome . . . . . . . . . . . . . . . . . . . . . . . . . . . . . . . . . . . . . . . . . . . . . . . . . . . 208 88 5
Scheduled periodic settlement payments on derivatives not qualifying for hedgeaccounting — add to net derivative gains (losses), deduct from interest credited toPABs . . . . . . . . . . . . . . . . . . . . . . . . . . . . . . . . . . . . . . . . . . . . . . . . . . . . 11 (4) 45
Purchased credit default swaps that offset losses incurred on certain fixed maturitysecurities — add to net derivative gains (losses) . . . . . . . . . . . . . . . . . . . . . . . . — — 183
Equity method operating joint ventures — add to net investment income, deduct fromnet derivative gains (losses) . . . . . . . . . . . . . . . . . . . . . . . . . . . . . . . . . . . . . 130 156 (105)
Net derivative gains (losses) — GAAP consolidated statements of operations . . . . . . . . $ (265) $ (4,866) $ 3,910
See “— Results of Operations — Year Ended December 31, 2010 compared with the Year Ended December 31, 2009 and Year EndedDecember 31, 2009 compared with the Year Ended December 31, 2008,” for an analysis of the year over year changes in net investmentincome and net investment gains (losses) and net derivative gains (losses).
Fixed Maturity and Equity Securities Available-for-SaleFixed maturity securities, which consisted principally of publicly-traded and privately placed fixed maturity securities, were $327.3 billion
and $227.6 billion, or 69% and 67% of total cash and invested assets at estimated fair value, at December 31, 2010 and 2009, respectively.Publicly-traded fixed maturity securities represented $286.5 billion and $191.4 billion, or 88% and 84% of total fixed maturity securities atestimated fair value, at December 31, 2010 and 2009, respectively. Privately placed fixed maturity securities represented $40.8 billion and$36.2 billion, or 12% and 16% of total fixed maturity securities at estimated fair value, at December 31, 2010 and 2009, respectively.
Equity securities, which consisted principally of publicly-traded and privately-held common and preferred stocks, including certainperpetual hybrid securities and mutual fund interests, were $3.6 billion and $3.1 billion, or 0.8% and 0.9% of total cash and invested assets atestimated fair value, at December 31, 2010 and 2009, respectively. Publicly-traded equity securities represented $2.3 billion and $2.1 billion,or 64% and 68% of total equity securities at estimated fair value, at December 31, 2010 and 2009, respectively. Privately-held equitysecurities represented $1.3 billion and $1.0 billion, or 36% and 32% of total equity securities at estimated fair value, at December 31, 2010and 2009, respectively.
Valuation of Securities. We are responsible for the determination of estimated fair value. The estimated fair value of publicly-traded fixedmaturity, equity and trading and other securities, as well as short-term securities is determined by management after considering one of threeprimary sources of information: quoted market prices in active markets, independent pricing services, or independent broker quotations. Thenumber of quotes obtained varies by instrument and depends on the liquidity of the particular instrument. Generally, we obtain prices frommultiple pricing services to cover all asset classes and obtain multiple prices for certain securities, but ultimately utilize the price with thehighest placement in the fair value hierarchy. Independent pricing services that value these instruments use market standard valuationmethodologies based on inputs that are market observable or can be derived principally from or corroborated by observable market data.Such observable inputs include benchmarking prices for similar assets in active, liquid markets, quoted prices in markets that are not activeand observable yields and spreads in the market. The market standard valuation methodologies utilized include: discounted cash flowmethodologies, matrix pricing or similar techniques. The assumptions and inputs in applying these market standard valuation methodologiesinclude, but are not limited to, interest rates, credit standing of the issuer or counterparty, industry sector of the issuer, coupon rate, callprovisions, sinking fund requirements, maturity, estimated duration, and management’s assumptions regarding liquidity and estimated futurecash flows. When a price is not available in the active market or through an independent pricing service, management will value the securityprimarily using independent non-binding broker quotations. Independent non-binding broker quotations utilize inputs that are not marketobservable or cannot be derived principally from or corroborated by observable market data.
Senior management, independent of the trading and investing functions, is responsible for the oversight of control systems and valuationpolicies, including reviewing and approving new transaction types and markets, for ensuring that observable market prices and market-basedparameters are used for valuation, wherever possible, and for determining that judgmental valuation adjustments, if any, are based uponestablished policies and are applied consistently over time. We review our valuation methodologies on an ongoing basis and ensure that anychanges to valuation methodologies are justified. We gain assurance on the overall reasonableness and consistent application of inputassumptions, valuation methodologies and compliance with accounting standards for fair value determination through various controlsdesigned to ensure that the financial assets and financial liabilities are appropriately valued and represent an exit price. The control systemsand procedures include, but are not limited to, analysis of portfolio returns to corresponding benchmark returns, comparing a sample ofexecuted prices of securities sold to the fair value estimates, comparing fair value estimates to management’s knowledge of the currentmarket, reviewing the bid/ask spreads to assess activity and ongoing confirmation that independent pricing services use, wherever possible,
42 MetLife, Inc.

market-based parameters for valuation. We determine the observability of inputs used in estimated fair values received from independentpricing services or brokers by assessing whether these inputs can be corroborated by observable market data. The Company also follows aformal process to challenge any prices received from independent pricing services that are not considered representative of estimated fairvalue. If we conclude that prices received from independent pricing services are not reflective of market activity or representative of estimatedfair value, we will seek independent non-binding broker quotes or use an internally developed valuation to override these prices. Suchoverrides are classified as Level 3. Despite the credit events prevalent since the second half of 2007 described above, including marketdislocation, volatility in valuation of certain investments, and reduced levels of liquidity, which has since moderated but is still present in certainportions of the global financial markets and in certain asset sectors, our internally developed valuations of current estimated fair value, whichreflect our estimates of liquidity and non-performance risks, compared with pricing received from the independent pricing services, did notproduce material differences for the vast majority of our fixed maturity securities portfolio. Our estimates of liquidity and non-performance risksare generally based on available market evidence and on what other market participants would use. In the absence of such evidence,management’s best estimate is used. As a result, we generally continued to use the price provided by the independent pricing service underour normal pricing protocol and pricing overrides were not material. The Company uses the results of this analysis for classifying the estimatedfair value of these instruments in Level 1, 2 or 3. For example, we will review the estimated fair values received to determine whethercorroborating evidence (i.e., similar observable positions and actual trades) will support a Level 2 classification in the fair value hierarchy.Security prices which cannot be corroborated due to relatively less pricing transparency and diminished liquidity will be classified as Level 3.Even some of our very high quality invested assets have been more illiquid for periods of time as a result of the market conditions describedabove.
For privately placed fixed maturity securities, the Company determines the estimated fair value generally through matrix pricing,discounted cash flow techniques or from independent pricing services after assessing that the observability of inputs used can becorroborated with observable market data. The discounted cash flow valuations rely upon the estimated future cash flows of the security,credit spreads of comparable public securities and secondary transactions, as well as taking into account, among other factors, the creditquality of the issuer and the reduced liquidity associated with privately placed debt securities.
The Company has reviewed the significance and observability of inputs used in the valuation methodologies to determine the appropriatefair value hierarchy level for each of its securities. Based on the results of this review and investment class analyses, each instrument iscategorized as Level 1, 2 or 3 based on the priority of the inputs to the respective valuation methodologies. Certain U.S. Treasury, agency andgovernment guaranteed fixed maturity securities, certain foreign government fixed maturity securities, residential mortgage-backed secu-rities (“RMBS”), principally to-be-announced securities, exchange-traded common stock and mutual fund interests, registered mutual fundinterests priced using daily net asset value provided by fund managers included within trading and other securities, certain other securitiesclassified as trading and other securities which are similar to the above described fixed maturity and equity securities and certain short-termmoney market securities, including U.S. Treasury bills, have been classified into Level 1 because of high volumes of trading activity andnarrow bid/ask spreads. Most securities valued by independent pricing services have been classified into Level 2 because the significantinputs used in pricing these securities are market observable or can be corroborated using market observable information. Most investmentgrade privately placed fixed maturity securities and certain below investment grade privately placed fixed maturity securities priced byindependent pricing services that use observable inputs have been classified within Level 2. Distressed privately placed fixed maturitysecurities have been classified within Level 3. Below investment grade privately placed fixed maturity securities and less liquid securities withvery limited trading activity where estimated fair values are determined by independent pricing services or by independent non-binding brokerquotations that use unobservable inputs or cannot be derived principally from or corroborated by observable market data, are classified asLevel 3. Use of independent non-binding broker quotations generally indicates there is a lack of liquidity or the general lack of transparency inthe process to develop these price estimates causing them to be considered Level 3.
Effective April 1, 2009, the Company adopted accounting guidance that clarified existing guidance regarding (1) estimating the estimatedfair value of an asset or liability if there was a significant decrease in the volume and level of trading activity for these assets or liabilities and(2) identifying transactions that are not orderly. The Company’s valuation policies as described above and in “— Summary of CriticalAccounting Estimates — Estimated Fair Values of Investments” already incorporated the key concepts from this additional guidance,accordingly, this guidance results in no material changes in our valuation policies. At April 1, 2009 and at each subsequent quarterly period in2009 and 2010, we evaluated the markets that our fixed maturity and equity securities trade in and in our judgment, despite the increasedilliquidity discussed above, believe none of these fixed maturity and equity securities trading markets should be characterized as distressedand disorderly. We will continue to re-evaluate and monitor such fixed maturity and equity securities trading markets on an ongoing basis.
43MetLife, Inc.

Fair Value Hierarchy. Fixed maturity securities and equity securities available-for-sale measured at estimated fair value on a recurringbasis and their corresponding fair value pricing sources and fair value hierarchy are as follows:
Fixed MaturitySecurities
EquitySecurities
December 31, 2010
(In millions)
Level 1:
Quoted prices in active markets for identical assets . . . . . . . . . . . . . . . . . . . . . . . . . . . . $ 15,025 4.6% $ 832 23.1%
Level 2:
Independent pricing source . . . . . . . . . . . . . . . . . . . . . . . . . . . . . . . . . . . . . . . . . . . . 257,625 78.7 616 17.1
Internal matrix pricing or discounted cash flow techniques . . . . . . . . . . . . . . . . . . . . . . . . 31,839 9.8 985 27.3
Significant other observable inputs . . . . . . . . . . . . . . . . . . . . . . . . . . . . . . . . . . . . . 289,464 88.5 1,601 44.4
Level 3:
Independent pricing source . . . . . . . . . . . . . . . . . . . . . . . . . . . . . . . . . . . . . . . . . . . . 10,481 3.2 1,011 28.0
Internal matrix pricing or discounted cash flow techniques . . . . . . . . . . . . . . . . . . . . . . . . 9,872 3.0 149 4.1
Independent broker quotations . . . . . . . . . . . . . . . . . . . . . . . . . . . . . . . . . . . . . . . . . 2,442 0.7 13 0.4
Significant unobservable inputs . . . . . . . . . . . . . . . . . . . . . . . . . . . . . . . . . . . . . . . . 22,795 6.9 1,173 32.5
Total estimated fair value . . . . . . . . . . . . . . . . . . . . . . . . . . . . . . . . . . . . . . . . . . . $327,284 100.0% $3,606 100.0%
Quoted Pricesin Active
Markets forIdentical Assets
(Level 1)
SignificantOther
ObservableInputs
(Level 2)
SignificantUnobservable
Inputs(Level 3)
TotalEstimatedFair Value
Fair Value Measurements Using
December 31, 2010
(In millions)
Fixed Maturity Securities:U.S. corporate securities . . . . . . . . . . . . . . . . . . . . . . . . . . . . . . . . . . . . . . $ — $ 85,419 $ 7,149 $ 92,568Foreign corporate securities . . . . . . . . . . . . . . . . . . . . . . . . . . . . . . . . . . . . — 62,401 5,777 68,178Residential mortgage-backed securities . . . . . . . . . . . . . . . . . . . . . . . . . . . . . 274 43,037 1,422 44,733Foreign government securities . . . . . . . . . . . . . . . . . . . . . . . . . . . . . . . . . . . 149 40,092 3,159 43,400U.S. Treasury, agency and government guaranteed securities . . . . . . . . . . . . . . . 14,602 18,623 79 33,304Commercial mortgage-backed securities (“CMBS”) . . . . . . . . . . . . . . . . . . . . . . — 19,664 1,011 20,675Asset-backed securities . . . . . . . . . . . . . . . . . . . . . . . . . . . . . . . . . . . . . . . — 10,142 4,148 14,290State and political subdivision securities . . . . . . . . . . . . . . . . . . . . . . . . . . . . — 10,083 46 10,129Other fixed maturity securities . . . . . . . . . . . . . . . . . . . . . . . . . . . . . . . . . . . — 3 4 7
Total fixed maturity securities . . . . . . . . . . . . . . . . . . . . . . . . . . . . . . . . . . $15,025 $289,464 $22,795 $327,284
Equity Securities:Common stock . . . . . . . . . . . . . . . . . . . . . . . . . . . . . . . . . . . . . . . . . . . . . $ 832 $ 1,094 $ 268 $ 2,194Non-redeemable preferred stock . . . . . . . . . . . . . . . . . . . . . . . . . . . . . . . . . — 507 905 1,412
Total equity securities . . . . . . . . . . . . . . . . . . . . . . . . . . . . . . . . . . . . . . . $ 832 $ 1,601 $ 1,173 $ 3,606
The composition of fair value pricing sources for and significant changes in Level 3 securities at December 31, 2010 are as follows:• The majority of the Level 3 fixed maturity and equity securities (84%, as presented above) were concentrated in four sectors: U.S. and
foreign corporate securities, ABS and foreign government securities.• Level 3 fixed maturity securities are priced principally through market standard valuation methodologies, independent pricing services
and independent non-binding broker quotations using inputs that are not market observable or cannot be derived principally from orcorroborated by observable market data. Level 3 fixed maturity securities consists of less liquid fixed maturity securities with very limitedtrading activity or where less price transparency exists around the inputs to the valuation methodologies including alternative residentialmortgage loan RMBS and less liquid prime RMBS, certain below investment grade private placements and less liquid investment gradecorporate securities (included in U.S. and foreign corporate securities) and less liquid ABS including securities supported by sub-primemortgage loans (included in ABS).
• During the year ended December 31, 2010, Level 3 fixed maturity securities increased by $371 million, or 2%, excluding the impact ofthe Acquisition, and $5,605 million, or 33%, including the impact of the Acquisition. The Level 3 fixed maturity securities acquired fromALICO of $5,435 million have been included in purchases, sales, issuances and settlements in the table below. The increase was drivenby net purchases in excess of sales and increases in estimated fair value recognized in other comprehensive income (loss). Netpurchases in excess of sales of fixed maturity securities were concentrated in foreign government and ABS. The increase in estimatedfair value in fixed maturity securities was concentrated in U.S. and foreign corporate securities and ABS (including RMBS backed bysub-prime mortgage loans) due to improving or stabilizing market conditions including an improvement in liquidity coupled with theeffect of decreased interest rates on such securities.
44 MetLife, Inc.
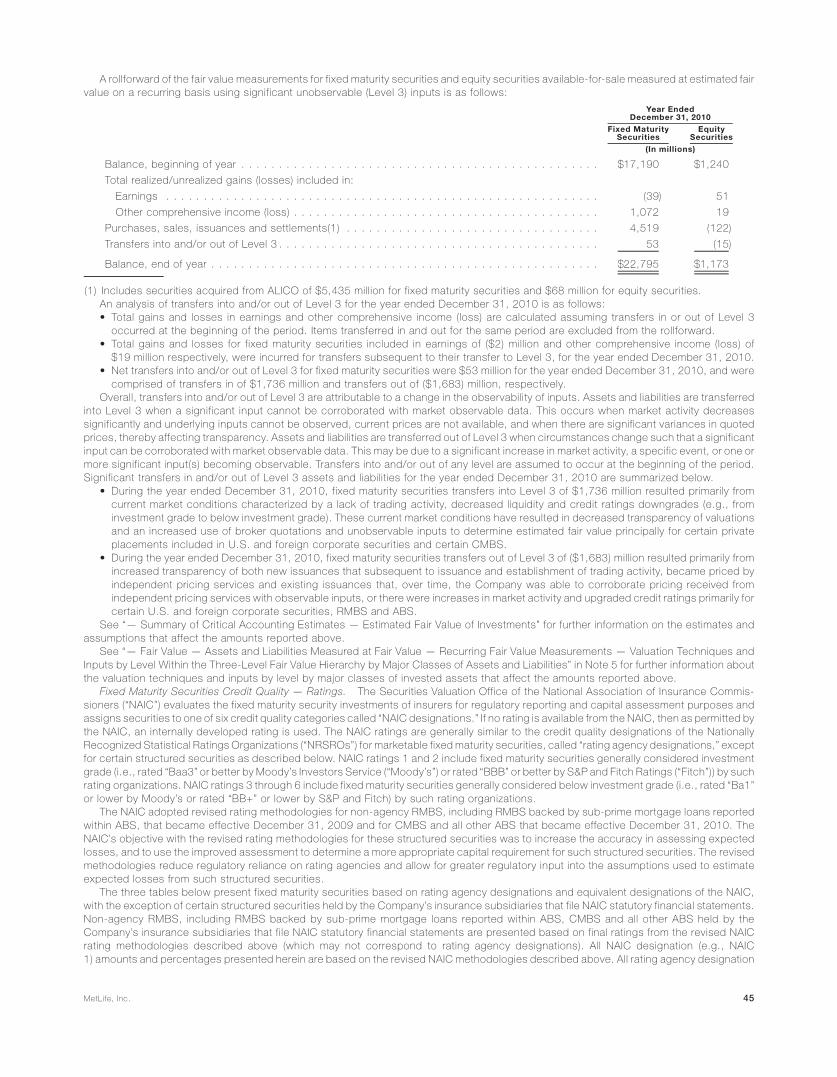
A rollforward of the fair value measurements for fixed maturity securities and equity securities available-for-sale measured at estimated fairvalue on a recurring basis using significant unobservable (Level 3) inputs is as follows:
Fixed MaturitySecurities
EquitySecurities
Year EndedDecember 31, 2010
(In millions)
Balance, beginning of year . . . . . . . . . . . . . . . . . . . . . . . . . . . . . . . . . . . . . . . . . . . . . . . . $17,190 $1,240
Total realized/unrealized gains (losses) included in:
Earnings . . . . . . . . . . . . . . . . . . . . . . . . . . . . . . . . . . . . . . . . . . . . . . . . . . . . . . . . . . (39) 51
Other comprehensive income (loss) . . . . . . . . . . . . . . . . . . . . . . . . . . . . . . . . . . . . . . . . . 1,072 19
Purchases, sales, issuances and settlements(1) . . . . . . . . . . . . . . . . . . . . . . . . . . . . . . . . . . 4,519 (122)
Transfers into and/or out of Level 3 . . . . . . . . . . . . . . . . . . . . . . . . . . . . . . . . . . . . . . . . . . . 53 (15)
Balance, end of year . . . . . . . . . . . . . . . . . . . . . . . . . . . . . . . . . . . . . . . . . . . . . . . . . . . . $22,795 $1,173
(1) Includes securities acquired from ALICO of $5,435 million for fixed maturity securities and $68 million for equity securities.An analysis of transfers into and/or out of Level 3 for the year ended December 31, 2010 is as follows:• Total gains and losses in earnings and other comprehensive income (loss) are calculated assuming transfers in or out of Level 3
occurred at the beginning of the period. Items transferred in and out for the same period are excluded from the rollforward.• Total gains and losses for fixed maturity securities included in earnings of ($2) million and other comprehensive income (loss) of
$19 million respectively, were incurred for transfers subsequent to their transfer to Level 3, for the year ended December 31, 2010.• Net transfers into and/or out of Level 3 for fixed maturity securities were $53 million for the year ended December 31, 2010, and were
comprised of transfers in of $1,736 million and transfers out of ($1,683) million, respectively.Overall, transfers into and/or out of Level 3 are attributable to a change in the observability of inputs. Assets and liabilities are transferred
into Level 3 when a significant input cannot be corroborated with market observable data. This occurs when market activity decreasessignificantly and underlying inputs cannot be observed, current prices are not available, and when there are significant variances in quotedprices, thereby affecting transparency. Assets and liabilities are transferred out of Level 3 when circumstances change such that a significantinput can be corroborated with market observable data. This may be due to a significant increase in market activity, a specific event, or one ormore significant input(s) becoming observable. Transfers into and/or out of any level are assumed to occur at the beginning of the period.Significant transfers in and/or out of Level 3 assets and liabilities for the year ended December 31, 2010 are summarized below.
• During the year ended December 31, 2010, fixed maturity securities transfers into Level 3 of $1,736 million resulted primarily fromcurrent market conditions characterized by a lack of trading activity, decreased liquidity and credit ratings downgrades (e.g., frominvestment grade to below investment grade). These current market conditions have resulted in decreased transparency of valuationsand an increased use of broker quotations and unobservable inputs to determine estimated fair value principally for certain privateplacements included in U.S. and foreign corporate securities and certain CMBS.
• During the year ended December 31, 2010, fixed maturity securities transfers out of Level 3 of ($1,683) million resulted primarily fromincreased transparency of both new issuances that subsequent to issuance and establishment of trading activity, became priced byindependent pricing services and existing issuances that, over time, the Company was able to corroborate pricing received fromindependent pricing services with observable inputs, or there were increases in market activity and upgraded credit ratings primarily forcertain U.S. and foreign corporate securities, RMBS and ABS.
See “— Summary of Critical Accounting Estimates — Estimated Fair Value of Investments” for further information on the estimates andassumptions that affect the amounts reported above.
See “— Fair Value — Assets and Liabilities Measured at Fair Value — Recurring Fair Value Measurements — Valuation Techniques andInputs by Level Within the Three-Level Fair Value Hierarchy by Major Classes of Assets and Liabilities” in Note 5 for further information aboutthe valuation techniques and inputs by level by major classes of invested assets that affect the amounts reported above.
Fixed Maturity Securities Credit Quality — Ratings. The Securities Valuation Office of the National Association of Insurance Commis-sioners (“NAIC”) evaluates the fixed maturity security investments of insurers for regulatory reporting and capital assessment purposes andassigns securities to one of six credit quality categories called “NAIC designations.” If no rating is available from the NAIC, then as permitted bythe NAIC, an internally developed rating is used. The NAIC ratings are generally similar to the credit quality designations of the NationallyRecognized Statistical Ratings Organizations (“NRSROs”) for marketable fixed maturity securities, called “rating agency designations,” exceptfor certain structured securities as described below. NAIC ratings 1 and 2 include fixed maturity securities generally considered investmentgrade (i.e., rated “Baa3” or better by Moody’s Investors Service (“Moody’s”) or rated “BBB” or better by S&P and Fitch Ratings (“Fitch”)) by suchrating organizations. NAIC ratings 3 through 6 include fixed maturity securities generally considered below investment grade (i.e., rated “Ba1”or lower by Moody’s or rated “BB+” or lower by S&P and Fitch) by such rating organizations.
The NAIC adopted revised rating methodologies for non-agency RMBS, including RMBS backed by sub-prime mortgage loans reportedwithin ABS, that became effective December 31, 2009 and for CMBS and all other ABS that became effective December 31, 2010. TheNAIC’s objective with the revised rating methodologies for these structured securities was to increase the accuracy in assessing expectedlosses, and to use the improved assessment to determine a more appropriate capital requirement for such structured securities. The revisedmethodologies reduce regulatory reliance on rating agencies and allow for greater regulatory input into the assumptions used to estimateexpected losses from such structured securities.
The three tables below present fixed maturity securities based on rating agency designations and equivalent designations of the NAIC,with the exception of certain structured securities held by the Company’s insurance subsidiaries that file NAIC statutory financial statements.Non-agency RMBS, including RMBS backed by sub-prime mortgage loans reported within ABS, CMBS and all other ABS held by theCompany’s insurance subsidiaries that file NAIC statutory financial statements are presented based on final ratings from the revised NAICrating methodologies described above (which may not correspond to rating agency designations). All NAIC designation (e.g., NAIC1) amounts and percentages presented herein are based on the revised NAIC methodologies described above. All rating agency designation
45MetLife, Inc.

(e.g., Aaa/AAA) amounts and percentages presented herein are based on rating agency designations without adjustment for the revised NAICmethodologies described above.
The following three tables present information about the Company’s fixed maturity securities holdings by NAIC credit quality ratings.Comparisons between NAIC ratings and rating agency designations are published by the NAIC. Rating agency designations are based onavailability of applicable ratings from rating agencies on the NAIC acceptable rating organizations list, including Moody’s, S&P, Fitch andRealpoint, LLC. If no rating is available from a rating agency, then an internally developed rating is used.
The following table presents the Company’s total fixed maturity securities by NRSRO designation and the equivalent designations of theNAIC, except for certain structured securities, which are presented using final ratings from the revised NAIC rating methodologies asdescribed above, as well as the percentage, based on estimated fair value, that each designation is comprised of at:
NAICRating Rating Agency Designation:
AmortizedCost
EstimatedFair
Value% ofTotal
AmortizedCost
EstimatedFair
Value% ofTotal
2010 2009
December 31,
(In millions)
1 Aaa/Aa/A . . . . . . . . . . . . . . . . . . . . . . $228,875 $233,540 71.4% $151,391 $151,136 66.4%
2 Baa . . . . . . . . . . . . . . . . . . . . . . . . . . 65,550 68,858 21.0 55,508 56,305 24.7
3 Ba . . . . . . . . . . . . . . . . . . . . . . . . . . . 15,335 15,294 4.7 13,184 12,003 5.3
4 B . . . . . . . . . . . . . . . . . . . . . . . . . . . 8,752 8,316 2.5 7,474 6,461 2.9
5 Caa and lower . . . . . . . . . . . . . . . . . . . 1,343 1,146 0.4 1,809 1,425 0.6
6 In or near default . . . . . . . . . . . . . . . . . 153 130 — 343 312 0.1
Total fixed maturity securities . . . . . . . . . $320,008 $327,284 100.0% $229,709 $227,642 100.0%
The following tables present the Company’s total fixed maturity securities, based on estimated fair value, by sector classification and byNRSRO designation and the equivalent designations of the NAIC, except for certain structured securities, which are presented as describedabove, that each designation is comprised of at December 31, 2010 and 2009:
Rating Agency Designation: Aaa/Aa/A Baa Ba BCaa andLower
In or NearDefault
TotalEstimatedFair Value
NAIC Rating 1 2 3 4 5 6
Fixed Maturity Securities — by Sector & Credit Quality Rating at December 31, 2010
(In millions)
U.S. corporate securities . . . . . . . . . . . . . . $ 46,754 $34,326 $ 7,635 $3,460 $ 353 $ 40 $ 92,568
Foreign corporate securities . . . . . . . . . . . . 39,652 24,414 2,476 1,454 173 9 68,178
RMBS(1) . . . . . . . . . . . . . . . . . . . . . . . . . 38,984 1,109 2,271 1,993 331 45 44,733
Foreign government securities . . . . . . . . . . . 32,957 7,184 2,179 1,080 — — 43,400
U.S. Treasury, agency and governmentguaranteed securities . . . . . . . . . . . . . . . 33,304 — — — — — 33,304
CMBS(1) . . . . . . . . . . . . . . . . . . . . . . . . . 19,385 665 363 205 56 1 20,675
ABS(1) . . . . . . . . . . . . . . . . . . . . . . . . . . 13,136 435 338 120 226 35 14,290
State and political subdivision securities . . . . . 9,368 722 32 — 7 — 10,129
Other fixed maturity securities . . . . . . . . . . . — 3 — 4 — — 7
Total fixed maturity securities . . . . . . . . . . $233,540 $68,858 $15,294 $8,316 $1,146 $130 $327,284
Percentage of total . . . . . . . . . . . . . . . . . 71.4% 21.0% 4.7% 2.5% 0.4% —% 100.0%
Rating Agency Designation: Aaa/Aa/A Baa Ba BCaa andLower
In or NearDefault
TotalEstimatedFair Value
NAIC Rating 1 2 3 4 5 6
Fixed Maturity Securities — by Sector & Credit Quality Rating at December 31, 2009
(In millions)
U.S. corporate securities . . . . . . . . . . . . . . $ 31,848 $30,266 $ 6,319 $2,965 $ 616 $173 $ 72,187
Foreign corporate securities . . . . . . . . . . . . 16,678 17,393 2,067 1,530 281 81 38,030
RMBS(1) . . . . . . . . . . . . . . . . . . . . . . . . . 38,464 1,563 2,260 1,391 339 3 44,020
Foreign government securities . . . . . . . . . . . 5,786 4,841 890 415 — 15 11,947
U.S. Treasury, agency and governmentguaranteed securities . . . . . . . . . . . . . . . 25,447 — — — — — 25,447
CMBS . . . . . . . . . . . . . . . . . . . . . . . . . . . 15,000 434 152 22 14 — 15,622
ABS . . . . . . . . . . . . . . . . . . . . . . . . . . . . 11,573 1,033 275 124 117 40 13,162
State and political subdivision securities . . . . . 6,337 765 40 8 58 — 7,208
Other fixed maturity securities . . . . . . . . . . . 3 10 — 6 — — 19
Total fixed maturity securities . . . . . . . . . . $151,136 $56,305 $12,003 $6,461 $1,425 $312 $227,642
Percentage of total . . . . . . . . . . . . . . . . . 66.4% 24.7% 5.3% 2.9% 0.6% 0.1% 100.0%
46 MetLife, Inc.
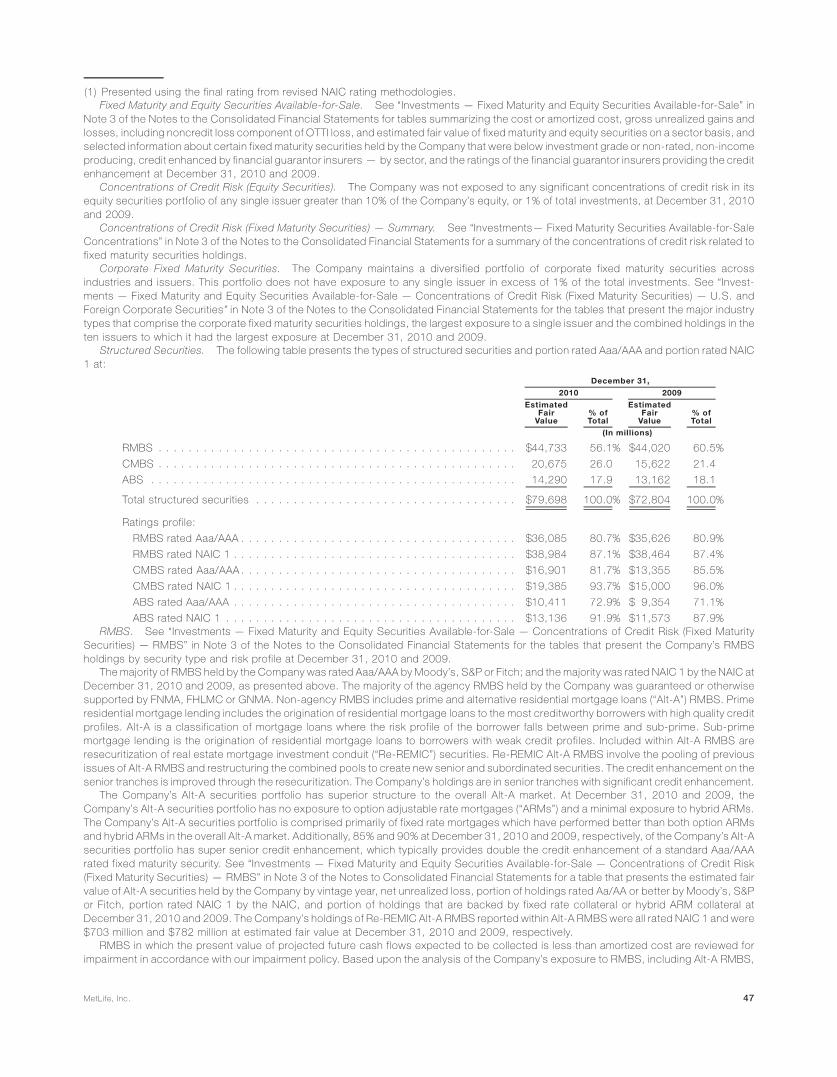
(1) Presented using the final rating from revised NAIC rating methodologies.Fixed Maturity and Equity Securities Available-for-Sale. See “Investments — Fixed Maturity and Equity Securities Available-for-Sale” in
Note 3 of the Notes to the Consolidated Financial Statements for tables summarizing the cost or amortized cost, gross unrealized gains andlosses, including noncredit loss component of OTTI loss, and estimated fair value of fixed maturity and equity securities on a sector basis, andselected information about certain fixed maturity securities held by the Company that were below investment grade or non-rated, non-incomeproducing, credit enhanced by financial guarantor insurers — by sector, and the ratings of the financial guarantor insurers providing the creditenhancement at December 31, 2010 and 2009.
Concentrations of Credit Risk (Equity Securities). The Company was not exposed to any significant concentrations of credit risk in itsequity securities portfolio of any single issuer greater than 10% of the Company’s equity, or 1% of total investments, at December 31, 2010and 2009.
Concentrations of Credit Risk (Fixed Maturity Securities) — Summary. See “Investments— Fixed Maturity Securities Available-for-SaleConcentrations” in Note 3 of the Notes to the Consolidated Financial Statements for a summary of the concentrations of credit risk related tofixed maturity securities holdings.
Corporate Fixed Maturity Securities. The Company maintains a diversified portfolio of corporate fixed maturity securities acrossindustries and issuers. This portfolio does not have exposure to any single issuer in excess of 1% of the total investments. See “Invest-ments — Fixed Maturity and Equity Securities Available-for-Sale — Concentrations of Credit Risk (Fixed Maturity Securities) — U.S. andForeign Corporate Securities” in Note 3 of the Notes to the Consolidated Financial Statements for the tables that present the major industrytypes that comprise the corporate fixed maturity securities holdings, the largest exposure to a single issuer and the combined holdings in theten issuers to which it had the largest exposure at December 31, 2010 and 2009.
Structured Securities. The following table presents the types of structured securities and portion rated Aaa/AAA and portion rated NAIC1 at:
EstimatedFair
Value% ofTotal
EstimatedFair
Value% ofTotal
2010 2009
December 31,
(In millions)
RMBS . . . . . . . . . . . . . . . . . . . . . . . . . . . . . . . . . . . . . . . . . . . . . . . . $44,733 56.1% $44,020 60.5%
CMBS . . . . . . . . . . . . . . . . . . . . . . . . . . . . . . . . . . . . . . . . . . . . . . . . 20,675 26.0 15,622 21.4
ABS . . . . . . . . . . . . . . . . . . . . . . . . . . . . . . . . . . . . . . . . . . . . . . . . . 14,290 17.9 13,162 18.1
Total structured securities . . . . . . . . . . . . . . . . . . . . . . . . . . . . . . . . . . . $79,698 100.0% $72,804 100.0%
Ratings profile:
RMBS rated Aaa/AAA . . . . . . . . . . . . . . . . . . . . . . . . . . . . . . . . . . . . . $36,085 80.7% $35,626 80.9%
RMBS rated NAIC 1 . . . . . . . . . . . . . . . . . . . . . . . . . . . . . . . . . . . . . . $38,984 87.1% $38,464 87.4%
CMBS rated Aaa/AAA . . . . . . . . . . . . . . . . . . . . . . . . . . . . . . . . . . . . . $16,901 81.7% $13,355 85.5%
CMBS rated NAIC 1 . . . . . . . . . . . . . . . . . . . . . . . . . . . . . . . . . . . . . . $19,385 93.7% $15,000 96.0%
ABS rated Aaa/AAA . . . . . . . . . . . . . . . . . . . . . . . . . . . . . . . . . . . . . . $10,411 72.9% $ 9,354 71.1%
ABS rated NAIC 1 . . . . . . . . . . . . . . . . . . . . . . . . . . . . . . . . . . . . . . . $13,136 91.9% $11,573 87.9%RMBS. See “Investments — Fixed Maturity and Equity Securities Available-for-Sale — Concentrations of Credit Risk (Fixed Maturity
Securities) — RMBS” in Note 3 of the Notes to the Consolidated Financial Statements for the tables that present the Company’s RMBSholdings by security type and risk profile at December 31, 2010 and 2009.
The majority of RMBS held by the Company was rated Aaa/AAA by Moody’s, S&P or Fitch; and the majority was rated NAIC 1 by the NAIC atDecember 31, 2010 and 2009, as presented above. The majority of the agency RMBS held by the Company was guaranteed or otherwisesupported by FNMA, FHLMC or GNMA. Non-agency RMBS includes prime and alternative residential mortgage loans (“Alt-A”) RMBS. Primeresidential mortgage lending includes the origination of residential mortgage loans to the most creditworthy borrowers with high quality creditprofiles. Alt-A is a classification of mortgage loans where the risk profile of the borrower falls between prime and sub-prime. Sub-primemortgage lending is the origination of residential mortgage loans to borrowers with weak credit profiles. Included within Alt-A RMBS areresecuritization of real estate mortgage investment conduit (“Re-REMIC”) securities. Re-REMIC Alt-A RMBS involve the pooling of previousissues of Alt-A RMBS and restructuring the combined pools to create new senior and subordinated securities. The credit enhancement on thesenior tranches is improved through the resecuritization. The Company’s holdings are in senior tranches with significant credit enhancement.
The Company’s Alt-A securities portfolio has superior structure to the overall Alt-A market. At December 31, 2010 and 2009, theCompany’s Alt-A securities portfolio has no exposure to option adjustable rate mortgages (“ARMs”) and a minimal exposure to hybrid ARMs.The Company’s Alt-A securities portfolio is comprised primarily of fixed rate mortgages which have performed better than both option ARMsand hybrid ARMs in the overall Alt-A market. Additionally, 85% and 90% at December 31, 2010 and 2009, respectively, of the Company’s Alt-Asecurities portfolio has super senior credit enhancement, which typically provides double the credit enhancement of a standard Aaa/AAArated fixed maturity security. See “Investments — Fixed Maturity and Equity Securities Available-for-Sale — Concentrations of Credit Risk(Fixed Maturity Securities) — RMBS” in Note 3 of the Notes to Consolidated Financial Statements for a table that presents the estimated fairvalue of Alt-A securities held by the Company by vintage year, net unrealized loss, portion of holdings rated Aa/AA or better by Moody’s, S&Por Fitch, portion rated NAIC 1 by the NAIC, and portion of holdings that are backed by fixed rate collateral or hybrid ARM collateral atDecember 31, 2010 and 2009. The Company’s holdings of Re-REMIC Alt-A RMBS reported within Alt-A RMBS were all rated NAIC 1 and were$703 million and $782 million at estimated fair value at December 31, 2010 and 2009, respectively.
RMBS in which the present value of projected future cash flows expected to be collected is less than amortized cost are reviewed forimpairment in accordance with our impairment policy. Based upon the analysis of the Company’s exposure to RMBS, including Alt-A RMBS,
47MetLife, Inc.
the Company expects to receive payments in accordance with the contractual terms of the securities that are considered temporarilyimpaired.
CMBS. There have been disruptions in the CMBS market due to market perceptions that default rates will increase in part as a result ofweakness in commercial real estate market fundamentals and in part to relaxed underwriting standards by some originators of commercialmortgage loans within the more recent vintage years (i.e., 2006 and later). These factors caused a pull-back in market liquidity, increasedcredit spreads and repricing of risk, which has led to higher levels of unrealized losses as compared to historical levels through the first quarterof 2010. However, in the second quarter of 2010, market conditions continued to improve and interest rates continue to decrease, causingour portfolio to be in a net unrealized gain position of 2% of amortized cost at December 31, 2010.
CMBS in which the present value of projected future cash flows expected to be collected is less than amortized cost are reviewed forimpairment in accordance with our impairment policy. Based upon the analysis of the Company’s exposure to CMBS, the Company expects toreceive payments in accordance with the contractual terms of the securities that are considered temporarily impaired.
The Company’s holdings in CMBS were $20.7 billion and $15.6 billion, at estimated fair value at December 31, 2010 and 2009,respectively. See “Investments — Fixed Maturity and Equity Securities Available-for-Sale — Concentrations of Credit Risk (Fixed MaturitySecurities) — CMBS” in Note 3 of the Notes to the Consolidated Financial Statements for tables that present the amortized cost andestimated fair value, rating agency designation by Moody’s, S&P, Fitch or Realpoint, LLC and holdings by vintage year of such securities heldby the Company at December 31, 2010 and 2009. The Company had no exposure to CMBS index securities at December 31, 2010 or 2009.The Company’s holdings of commercial real estate collateralized debt obligations securities were $138 million and $111 million at estimatedfair value at December 31, 2010 and 2009, respectively. The weighted average credit enhancement of the Company’s CMBS holdings was26% and 28% at December 31, 2010 and 2009, respectively. This credit enhancement percentage represents the current weighted averageestimated percentage of outstanding capital structure subordinated to the Company’s investment holding that is available to absorb lossesbefore the security incurs the first dollar of loss of principal. The credit protection does not include any equity interest or property value inexcess of outstanding debt.
ABS. The Company’s ABS are diversified both by collateral type and by issuer. See “Investments — Fixed Maturity and Equity SecuritiesAvailable-for-Sale — Concentrations of Credit Risk (Fixed Maturity Securities) — ABS” in Note 3 of the Notes to the Consolidated FinancialStatements for a table that presents the Company’s ABS by collateral type, portion rated Aaa/AAA, portion rated NAIC 1, and portion creditenhanced held by the Company at December 31, 2010 and 2009.
The slowing U.S. housing market, greater use of affordable mortgage products and relaxed underwriting standards for some originators ofsub-prime mortgage loans have recently led to higher delinquency and loss rates, especially within the 2006 and 2007 vintage years. Thesefactors have caused a pull-back in market liquidity and repricing of risk, which has led to higher levels of unrealized losses on securitiesbacked by sub-prime mortgage loans as compared to historical levels. However, in 2010, market conditions improved, credit spreadsnarrowed on mortgage-backed and asset-backed securities and net unrealized losses on ABS backed by sub-prime mortgage loansdecreased from 36% to 22% of amortized cost from December 31, 2009 to December 31, 2010.
ABS in which the present value of projected future cash flows expected to be collected is less than amortized cost are reviewed forimpairment in accordance with our impairment policy. Based upon the analysis of the Company’s ABS, including sub-prime mortgage loansthrough its exposure to ABS, the Company expects to receive payments in accordance with the contractual terms of the securities that areconsidered temporarily impaired.
See “Investments— Fixed Maturity and Equity Securities Available-for-Sale — Concentrations of Credit Risk (Fixed Maturity Securities) —ABS” in Note 3 of the Notes to the Consolidated Financial Statements for tables that present the Company’s holdings of ABS supported bysub-prime mortgage loans by rating agency designation and by vintage year and by NAIC rating at December 31, 2010 and 2009.
The Company had ABS supported by sub-prime mortgage loans with estimated fair values of $1,119 million and $1,044 million andunrealized losses of $317 million and $593 million at December 31, 2010 and 2009, respectively. Approximately 54% of this portfolio wasrated Aa or better, of which 88% was in vintage year 2005 and prior at December 31, 2010. Approximately 61% of this portfolio was rated Aa orbetter, of which 91% was in vintage year 2005 and prior at December 31, 2009. These older vintages from 2005 and prior benefit from betterunderwriting, improved enhancement levels and higher residential property price appreciation. All of the $1,119 million and $1,044 million ofABS supported by sub-prime mortgage loans were classified as Level 3 fixed maturity securities in the fair value hierarchy at December 31,2010 and 2009, respectively.
ABS also include collateralized debt obligations backed by sub-prime mortgage loans at an aggregate cost of $18 million with anestimated fair value of $17 million at December 31, 2010 and an aggregate cost of $22 million with an estimated fair value of $8 million atDecember 31, 2009.
Evaluating Available-for-Sale Securities for Other-Than-Temporary ImpairmentSee “Investments — Evaluating Available-for-Sale Securities for Other-Than-Temporary Impairment” in Note 3 of the Notes to the
Consolidated Financial Statements for a discussion of the regular evaluation of available-for-sale securities holdings in accordance withour impairment policy, whereby we evaluate whether such investments are other-than-temporarily impaired, new OTTI guidance adopted in2009 and factors considered by security classification in the regular OTTI evaluation.
See “— Summary of Critical Accounting Estimates.”
Net Unrealized Investment Gains (Losses)See “Investments — Net Unrealized Investment Gains (Losses)” in Note 3 of the Notes to the Consolidated Financial Statements for the
components of net unrealized investment gains (losses), included in accumulated other comprehensive income (loss) and the changes in netunrealized investment gains (losses) at December 31, 2010 and 2009 and for the years ended December 31, 2010, 2009 and 2008,respectively.
Fixed maturity securities with noncredit OTTI losses in accumulated other comprehensive income (loss) of ($601) million at December 31,2010, includes ($859) million recognized prior to January 1, 2010, ($212) million (($202) million, net of DAC) of noncredit OTTI lossesrecognized in the year ended December 31, 2010, $16 million transferred to retained earnings in connection with the adoption of guidancerelated to the consolidation of VIEs (see Note 1 of the Notes to the Consolidated Financial Statements) for the year ended December 31, 2010,$137 million related to securities sold for the year ended December 31, 2010, for which a noncredit OTTI loss was previously recognized inaccumulated other comprehensive income (loss) and $317 million of subsequent increases in estimated fair value during the year ended
48 MetLife, Inc.

December 31, 2010, on such securities for which a noncredit OTTI loss was previously recognized in accumulated other comprehensiveincome (loss).
Fixed maturity securities with noncredit OTTI losses in accumulated other comprehensive income (loss) of ($859) million at December 31,2009, includes ($126) million related to the transition adjustment recorded in 2009 upon the adoption of guidance on the recognition andpresentation of OTTI, ($939) million (($857) million, net of DAC) of noncredit OTTI losses recognized in the year ended December 31, 2009 (asmore fully described in Note 1 of the Notes to the Consolidated Financial Statements), $20 million related to securities sold during the yearended December 31, 2009 for which a noncredit loss was previously recognized in accumulated other comprehensive income (loss) and$186 million of subsequent increases in estimated fair value during the year ended December 31, 2009 on such securities for which anoncredit OTTI loss was previously recognized in accumulated other comprehensive income (loss).
Aging of Gross Unrealized Loss and OTTI Loss for Fixed Maturity and Equity Securities Available-for-SaleSee “Investments— Aging of Gross Unrealized Loss and OTTI Loss for Fixed Maturity and Equity Securities Available-for-Sale” in Note 3 of
the Notes to the Consolidated Financial Statements for the tables that present the cost or amortized cost, gross unrealized loss, including theportion of OTTI loss on fixed maturity securities recognized in accumulated other comprehensive income (loss) at December 31, 2010, grossunrealized loss as a percentage of cost or amortized cost and number of securities for fixed maturity and equity securities where the estimatedfair value had declined and remained below cost or amortized cost by less than 20%, or 20% or more at December 31, 2010 and 2009.
Concentration of Gross Unrealized Loss and OTTI Loss for Fixed Maturity and Equity Securities Available-for-SaleSee “Investments — Concentration of Gross Unrealized Loss and OTTI Loss for Fixed Maturity and Equity Securities Available-for-Sale” in
Note 3 of the Notes to the Consolidated Financial Statements for the tables that present the concentration by sector and industry of theCompany’s gross unrealized losses related to its fixed maturity and equity securities, including the portion of OTTI loss on fixed maturitysecurities recognized in accumulated other comprehensive loss of $6.9 billion and $10.8 billion at December 31, 2010 and 2009,respectively.
Evaluating Temporarily Impaired Available-for-Sale SecuritiesSee “Investments— Fixed Maturity and Equity Securities Available-for-Sale — Evaluating Temporarily Impaired Available-for-Sale Secu-
rities” in Note 3 of the Notes to the Consolidated Financial Statements for a table that presents the Company’s fixed maturity and equitysecurities each with a gross unrealized loss of greater than $10 million, the number of securities, total gross unrealized loss and percentage oftotal gross unrealized loss at December 31, 2010 and 2009.
Fixed maturity and equity securities, each with a gross unrealized loss greater than $10 million, decreased $2.5 billion during the yearended December 31, 2010. The cause of the decline in, or improvement in, gross unrealized losses for the year ended December 31, 2010was primarily attributable to a decrease in interest rates and narrowing of credit spreads. These securities were included in the Company’sOTTI review process. Based upon the Company’s current evaluation of these securities in accordance with its impairment policy and theCompany’s current intentions and assessments (as applicable to the type of security) about holding, selling, and any requirements to sellthese securities, the Company has concluded that these securities are not other-than-temporarily impaired.
In the Company’s impairment review process, the duration and severity of an unrealized loss position for equity securities is given greaterweight and consideration than for fixed maturity securities. An extended and severe unrealized loss position on a fixed maturity security maynot have any impact on the ability of the issuer to service all scheduled interest and principal payments and the Company’s evaluation ofrecoverability of all contractual cash flows or the ability to recover an amount at least equal to its amortized cost based on the present value ofthe expected future cash flows to be collected. In contrast, for an equity security, greater weight and consideration is given by the Company toa decline in market value and the likelihood such market value decline will recover.
See “Investments — Fixed Maturity and Equity Securities Available-for-Sale — Evaluating Temporarily Impaired Available-for-Sale Secu-rities” in Note 3 of the Notes to the Consolidated Financial Statements for a table that presents certain information about the Company’s equitysecurities available-for-sale with a gross unrealized loss of 20% or more at December 31, 2010.
In connection with the equity securities impairment review process at December 31, 2010, the Company evaluated its holdings in non-redeemable preferred stock, particularly those of financial services companies. The Company considered several factors including whetherthere has been any deterioration in credit of the issuer and the likelihood of recovery in value of non-redeemable preferred stock with a severeor an extended unrealized loss. The Company also considered whether any non-redeemable preferred stock with an unrealized loss held bythe Company, regardless of credit rating, have deferred any dividend payments. No such dividend payments had been deferred.
With respect to common stock holdings, the Company considered the duration and severity of the unrealized losses for securities in anunrealized loss position of 20% or more and the duration of unrealized losses for securities in an unrealized loss position of less than 20% in anextended unrealized loss position (i.e., for 12 months or greater).
Future OTTI will depend primarily on economic fundamentals, issuer performance (including changes in the present value of future cashflows expected to be collected), changes in credit rating, changes in collateral valuation, changes in interest rates and changes in creditspreads. If economic fundamentals and any of the above factors deteriorate, additional OTTI may be incurred in upcoming quarters.
Net Investment Gains (Losses) Including OTTI Losses Recognized in EarningsEffective April 1, 2009, the Company adopted guidance on the recognition and presentation of OTTI that amends the methodology to
determine for fixed maturity securities whether an OTTI exists, and for certain fixed maturity securities, changes how OTTI losses that arecharged to earnings are measured. There was no change in the methodology for identification and measurement of OTTI losses charged toearnings for impaired equity securities.
See “Investments — Fixed Maturity and Equity Securities Available-for-Sale — Net Investment Gains (Losses)” in Note 3 of the Notes tothe Consolidated Financial Statements for a table that presents proceeds from sales or disposals of fixed maturity and equity securities andthe components of fixed maturity and equity securities net investment gains (losses) for the years ended December 31, 2010, 2009 and 2008,respectively.
Overview of Fixed Maturity and Equity Security OTTI Losses Recognized in Earnings. Impairments of fixed maturity and equity securitieswere $484 million, $1.9 billion and $1.7 billion for the years ended December 31, 2010, 2009 and 2008, respectively. Impairments of fixedmaturity securities were $470 million, $1.5 billion and $1.3 billion for the years ended December 31, 2010, 2009 and 2008, respectively.
49MetLife, Inc.
Impairments of equity securities were $14 million, $400 million and $430 million for the years ended December 31, 2010, 2009 and 2008,respectively.
The Company’s credit-related impairments of fixed maturity securities were $423 million, $1.1 billion and $1.1 billion for the years endedDecember 31, 2010, 2009 and 2008, respectively.
The Company’s three largest impairments totaled $105 million, $508 million and $528 million for the years ended December 31, 2010,2009 and 2008, respectively.
The Company records OTTI losses charged to earnings within net investment gains (losses) and adjusts the cost basis of the fixed maturityand equity securities accordingly. The Company does not change the revised cost basis for subsequent recoveries in value.
The Company sold or disposed of fixed maturity and equity securities at a loss that had an estimated fair value of $18.2 billion, $10.2 billionand $29.9 billion for the years ended December 31, 2010, 2009 and 2008, respectively. Gross losses excluding impairments for fixedmaturity and equity securities were $628 million, $1.2 billion and $1.8 billion for the years ended December 31, 2010, 2009 and 2008,respectively.
Explanations of changes in fixed maturity and equity securities impairments are as follows:• Year Ended December 31, 2010 compared to the Year Ended December 31, 2009 — Overall OTTI losses recognized in earnings on
fixed maturity and equity securities were $484 million for the current year as compared to $1.9 billion in the prior year. Improving orstabilizing market conditions across all sectors and industries, particularly the financial services industry, as compared to the prior yearwhen there was significant stress in the global financial markets, resulted in a higher level of impairments in fixed maturity and equitysecurities in the prior year. The most significant decrease in the current year, as compared to the prior year, was in the Company’sfinancial services industry holdings which comprised $799 million in fixed maturity and equity security impairments in the prior year, ascompared to $129 million in impairments in the current year. Of the $799 million in financial services industry impairments in the year,$340 million were in equity securities, of which $310 million were in financial services industry perpetual hybrid securities which wereimpaired as a result of deterioration in the credit rating of the issuer to below investment grade and due to a severe and extendedunrealized loss position on these securities. Impairments in the current year were concentrated in the RMBS, ABS and CMBS sectorsreflecting current economic conditions including higher unemployment levels and continued weakness within the real estate markets.Of the fixed maturity and equity securities impairments of $484 million and $1,900 million in the years ended December 31, 2010 and2009, respectively, $287 million and $449 million, or 59% and 24% respectively, were in the Company’s RMBS, ABS and CMBSholdings.
• Year Ended December 31, 2009 compared to the Year Ended December 31, 2008 — Overall OTTI losses recognized in earnings onfixed maturity and equity securities were $1.9 billion for the year ended December 31, 2009 as compared to $1.7 billion in the prior year.The stress in the global financial markets that caused a significant increase in impairments in 2008 as compared to 2007, continued into2009. Significant impairments were incurred in several industry sectors in 2009, including the financial services industry, but to a lesserdegree in the financial services industry sector than in 2008. In 2008 certain financial institutions entered bankruptcy, entered FDICreceivership or received significant government capital infusions causing 2008 financial services industry impairments to be higher thanin 2009. Of the fixed maturity and equity securities impairments of $1,900 million in 2009, $799 million were concentrated in theCompany’s financial services industry holdings and were comprised of $459 million in impairments on fixed maturity securities and$340 million in impairments on equity securities, and the $799 million included $623 million of perpetual hybrid securities, which werecomprised of $313 million on securities classified as fixed maturity securities and $310 million on securities classified as non-redeemable preferred stock. Overall impairments in 2009 were higher due to increased fixed maturity security impairments acrossseveral industry sectors, which more than offset a reduction in impairments in the financial services industry sector. Impairments acrossthese several industry sectors increased in 2009 due to increased financial restructurings, bankruptcy filings, ratings downgrades,collateral deterioration or difficult operating environments of the issuers as a result of the challenging economic environment.Impairments on perpetual hybrid securities in 2009 were a result of deterioration in the credit rating of the issuer to below investmentgrade and due to a severe and extended unrealized loss position.
See “Investments — Fixed Maturity and Equity Securities Available-for-Sale — Net Investment Gains (Losses)” in Note 3 of the Notes tothe Consolidated Financial Statements for tables that present fixed maturity security OTTI losses recognized in earnings by sector and byindustry within the U.S. and foreign corporate securities sector for the years ended December 31, 2010, 2009 and 2008, respectively; andequity security OTTI losses recognized in earnings by sector and industry for the years ended December 31, 2010, 2009 and 2008,respectively.
Future Impairments. Future OTTI will depend primarily on economic fundamentals, issuer performance, changes in credit ratings,changes in collateral valuation, changes in interest rates and changes in credit spreads. If economic fundamentals and other of the abovefactors deteriorate, additional OTTI may be incurred in upcoming periods. See also “— Investments — Fixed Maturity and Equity SecuritiesAvailable-for-Sale — Net Unrealized Investment Gains (Losses).”
Credit Loss Rollforward — Rollforward of the Cumulative Credit Loss Component of OTTI Loss Recognized in Earn-ings on Fixed Maturity Securities Still Held for Which a Portion of the OTTI Loss was Recognized in Other Compre-hensive Income (Loss)See “Investments — Credit Loss Rollforward — Rollforward of the Cumulative Credit Loss Component of OTTI Loss Recognized in
Earnings on Fixed Maturity Securities Still Held for Which a Portion of the OTTI Loss was Recognized in Other Comprehensive Income (Loss)”in Note 3 of the Notes to the Consolidated Financial Statements for the table that presents a rollforward of the cumulative credit losscomponent of OTTI loss recognized in earnings on fixed maturity securities still held by the Company at December 31, 2010 and 2009 forwhich a portion of the OTTI loss was recognized in other comprehensive income (loss) for the years ended December 31, 2010 and 2009.
Securities LendingThe Company participates in securities lending programs whereby blocks of securities, which are included in fixed maturity securities and
short-term investments, are loaned to third parties, primarily brokerage firms and commercial banks. The Company generally obtainscollateral, generally cash, in an amount equal to 102% of the estimated fair value of the loaned securities, which is obtained at the inception ofa loan and maintained at a level greater than or equal to 100% for the duration of the loan. Securities loaned under such transactions may be
50 MetLife, Inc.

sold or repledged by the transferee. The Company is liable to return to its counterparties the cash collateral under its control. Thesetransactions are treated as financing arrangements and the associated liability recorded at the amount of the cash received.
See “Investments — Securities Lending” in Note 3 of the Notes to the Consolidated Financial Statements for information regarding theCompany’s securities lending program.
The estimated fair value of the securities on loan related to the cash collateral on open at December 31, 2010 was $2,699 million, of which$2,317 million were U.S. Treasury, agency and government guaranteed securities which, if put to the Company, can be immediately sold tosatisfy the cash requirements. The remainder of the securities on loan were primarily U.S. Treasury, agency and government guaranteedsecurities, and very liquid RMBS. The U.S. Treasury securities on loan are primarily holdings of on-the-run U.S. Treasury securities, the mostliquid U.S. Treasury securities available. If these high quality securities that are on loan are put back to the Company, the proceeds fromimmediately selling these securities can be used to satisfy the related cash requirements. The reinvestment portfolio acquired with the cashcollateral consisted principally of fixed maturity securities (including RMBS, U.S. corporate, U.S. Treasury, agency and governmentguaranteed, and ABS). If the on loan securities or the reinvestment portfolio become less liquid, the Company has the liquidity resourcesof most of its general account available to meet any potential cash demands when securities are put back to the Company.
Security collateral on deposit from counterparties in connection with the securities lending transactions may not be sold or repledged,unless the counterparty is in default, and is not reflected in the consolidated financial statements. Separately, the Company had $49 millionand $46 million, at estimated fair value, of cash and security collateral on deposit from a counterparty to secure its interest in a pooledinvestment that is held by a third-party trustee, as custodian, at December 31, 2010 and 2009, respectively. This pooled investment isincluded within fixed maturity securities and had an estimated fair value of $49 million and $51 million at December 31, 2010 and 2009,respectively.
Invested Assets on Deposit, Held in Trust and Pledged as CollateralSee “Investments — Invested Assets on Deposit, Held in Trust and Pledged as Collateral” in Note 3 of the Notes to the Consolidated
Financial Statements for a table of the invested assets on deposit, invested assets held in trust and invested assets pledged as collateral atDecember 31, 2010 and 2009.
See also “— Investments — Securities Lending” for the amount of the Company’s cash and invested assets received from and due backto counterparties pursuant to its securities lending program.
Trading and Other SecuritiesThe Company has a trading securities portfolio, principally invested in fixed maturity securities, to support investment strategies that
involve the active and frequent purchase and sale of securities (“Actively Traded Securities”) and the execution of short sale agreements.Trading and other securities also include securities for which the FVO has been elected (“FVO Securities”). FVO Securities include certainfixed maturity and equity securities held for investment by the general account to support asset and liability matching strategies for certaininsurance products. FVO Securities also include contractholder-directed investments supporting unit-linked variable annuity type liabilitieswhich do not qualify for presentation as separate account summary total assets and liabilities. These investments are primarily mutual funds,and to a lesser extent, fixed maturity and equity securities, short-term investments and cash and cash equivalents. The investment returns onthese investments inure to contractholders and are offset by a corresponding change in PABs through interest credited to PABs. Changes inestimated fair value of such trading and other securities subsequent to purchase are included in net investment income. FVO Securities alsoinclude securities held by CSEs (former qualifying special purpose entities) with changes in estimated fair value subsequent to consolidationincluded in net investment gains (losses). Trading and other securities were $18.6 billion and $2.4 billion, or 3.9% and 0.7% of total cash andinvested assets at estimated fair value, at December 31, 2010 and 2009, respectively. The significant increase in trading and other securitiesin 2010 was driven primarily by inclusion of ALICO’s contractholder-directed unit-linked investments, and to a lesser extent, growth in thisbook of business that occurred during the ten month period ended October 31, 2010 prior to the Acquisition. See “Investments — Tradingand Other Securities” in Note 3 of the Notes to the Consolidated Financial Statements for tables which present information about the ActivelyTraded Securities and FVO Securities, related short sale agreement liabilities, investments pledged to secure short sale agreement liabilities,net investment income, changes in estimated fair value included in net investment income for trading and other securities and changes inestimated fair value included in net investment gains (losses) for FVO Securities held by CSEs at December 31, 2010 and 2009 and for theyears ended December 31, 2010, 2009 and 2008.
Trading and other securities and trading (short sale agreement) liabilities, measured at estimated fair value on a recurring basis and theircorresponding fair value hierarchy, are presented as follows:
Trading and OtherSecurities
TradingLiabilities
December 31, 2010
(In millions)
Quoted prices in active markets for identical assets and liabilities (Level 1) . . . . . . . $ 6,270 33.7% $46 100.0%
Significant other observable inputs (Level 2)(1) . . . . . . . . . . . . . . . . . . . . . . . . . 11,497 61.9 — —
Significant unobservable inputs (Level 3) . . . . . . . . . . . . . . . . . . . . . . . . . . . . . 822 4.4 — —
Total estimated fair value . . . . . . . . . . . . . . . . . . . . . . . . . . . . . . . . . . . . . . $18,589 100.0% $46 100.0%
(1) All FVO Securities held by CSEs are classified as Level 2.
51MetLife, Inc.

A rollforward of the fair value measurements for trading and other securities measured at estimated fair value on a recurring basis usingsignificant unobservable (Level 3) inputs for the year ended December 31, 2010, is as follows:
Year EndedDecember 31, 2010
(In millions)
Balance, at January 1, . . . . . . . . . . . . . . . . . . . . . . . . . . . . . . . . . . . . . . . . . . . . . . . . . . . . $ 83
Total realized/unrealized gains (losses) included in:
Earnings . . . . . . . . . . . . . . . . . . . . . . . . . . . . . . . . . . . . . . . . . . . . . . . . . . . . . . . . . . (7)
Purchases, sales, issuances and settlements(1) . . . . . . . . . . . . . . . . . . . . . . . . . . . . . . . . . . 727
Transfer in and/or out of Level 3 . . . . . . . . . . . . . . . . . . . . . . . . . . . . . . . . . . . . . . . . . . . . 19
Balance, at December 31, . . . . . . . . . . . . . . . . . . . . . . . . . . . . . . . . . . . . . . . . . . . . . . . . $822
(1) Includes securities acquired from ALICO of $582 million.See “— Summary of Critical Accounting Estimates” for further information on the estimates and assumptions that affect the amounts
reported above.
Mortgage LoansThe Company’s mortgage loans are principally collateralized by commercial real estate, agricultural real estate and residential properties.
The carrying value of mortgage loans was $62.4 billion and $50.9 billion, or 13.1% and 15.1% of total cash and invested assets atDecember 31, 2010 and 2009, respectively. See “Investments — Mortgage Loans” in Note 3 of the Notes to the Consolidated FinancialStatements for a table that presents the Company’s mortgage loans held-for-investment of $59.1 billion and $48.2 billion by portfolio segmentat December 31, 2010 and 2009, respectively, as well as the components of the mortgage loans held-for-sale of $3.3 billion and $2.7 billion atDecember 31, 2010 and 2009, respectively. The information presented on Mortgage Loans herein excludes the effects of consolidatingunder GAAP certain VIEs that are treated as CSEs. Such amounts are presented in the aforementioned table. See “Investments — MortgageLoans” in Note 3 of the Notes to the Consolidated Financial Statements.
Commercial Mortgage Loans by Geographic Region and Property Type. Commercial mortgage loans are the most significant componentof the mortgage loan invested asset class as it represents 72% of total mortgage loans held-for-investment (excluding the effects ofconsolidating under GAAP certain VIEs that are treated as CSEs) at both December 31, 2010 and 2009. The Company diversifies itscommercial mortgage loan portfolio by both geographic region and property type to reduce the risk of concentration. Additionally, theCompany manages risk, when originating commercial and agricultural mortgage loans, by generally lending only up to 75% of the estimatedfair value of the underlying real estate. The tables below present the diversification across geographic regions and property types forcommercial mortgage loans at:
Amount% ofTotal Amount
% ofTotal
2010 2009
December 31,
(In millions)
Region:
Pacific . . . . . . . . . . . . . . . . . . . . . . . . . . . . . . . . . . . . . . . . . . . . . . . . $ 8,974 23.7% $ 8,822 25.1%
South Atlantic . . . . . . . . . . . . . . . . . . . . . . . . . . . . . . . . . . . . . . . . . . . . 8,016 21.2 7,460 21.2
Middle Atlantic . . . . . . . . . . . . . . . . . . . . . . . . . . . . . . . . . . . . . . . . . . . 6,484 17.1 6,042 17.2
International . . . . . . . . . . . . . . . . . . . . . . . . . . . . . . . . . . . . . . . . . . . . . 4,216 11.2 3,620 10.3
West South Central . . . . . . . . . . . . . . . . . . . . . . . . . . . . . . . . . . . . . . . . 3,266 8.6 2,916 8.3
East North Central . . . . . . . . . . . . . . . . . . . . . . . . . . . . . . . . . . . . . . . . . 3,066 8.1 2,531 7.2
New England . . . . . . . . . . . . . . . . . . . . . . . . . . . . . . . . . . . . . . . . . . . . 1,531 4.1 1,448 4.1
Mountain . . . . . . . . . . . . . . . . . . . . . . . . . . . . . . . . . . . . . . . . . . . . . . . 884 2.3 959 2.7
West North Central . . . . . . . . . . . . . . . . . . . . . . . . . . . . . . . . . . . . . . . . 666 1.8 675 1.9
East South Central . . . . . . . . . . . . . . . . . . . . . . . . . . . . . . . . . . . . . . . . 461 1.2 449 1.3
Other . . . . . . . . . . . . . . . . . . . . . . . . . . . . . . . . . . . . . . . . . . . . . . . . . 256 0.7 254 0.7
Total recorded investment . . . . . . . . . . . . . . . . . . . . . . . . . . . . . . . . . . 37,820 100.0% 35,176 100.0%
Less valuation allowances . . . . . . . . . . . . . . . . . . . . . . . . . . . . . . . . . 562 589
Carrying value, net of valuation allowances . . . . . . . . . . . . . . . . . . . . . . $37,258 $34,587
52 MetLife, Inc.
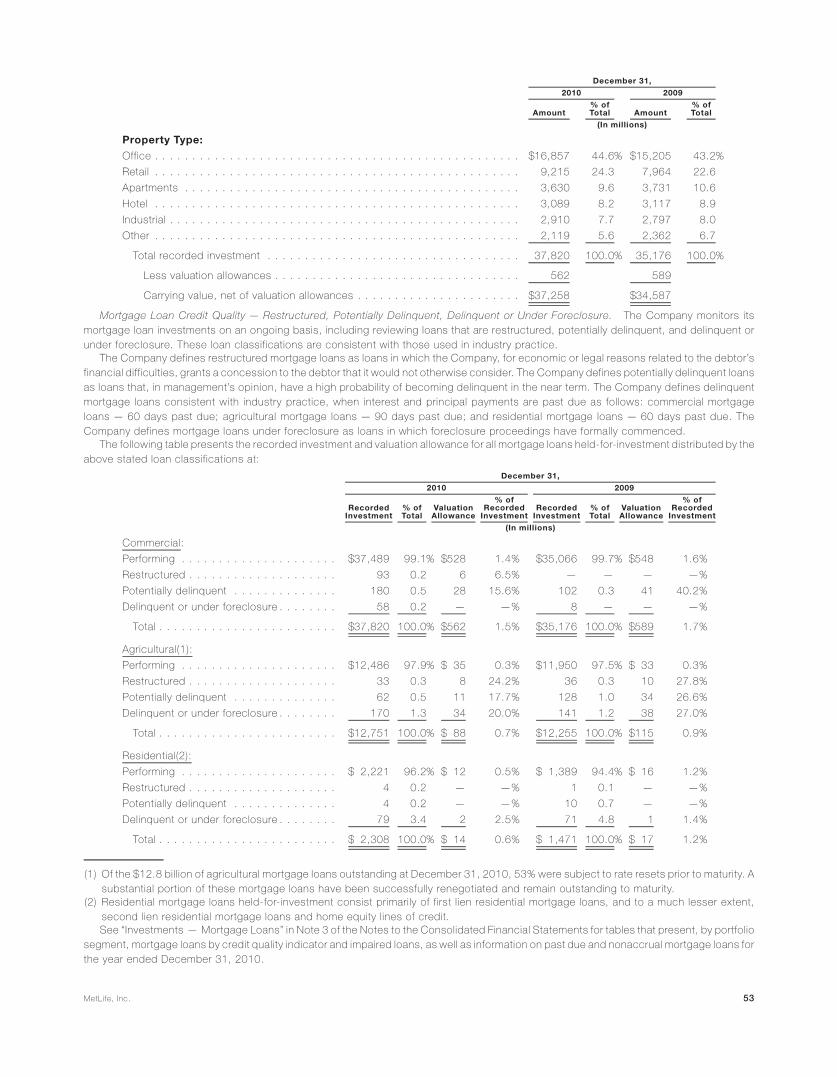
Amount% ofTotal Amount
% ofTotal
2010 2009
December 31,
(In millions)
Property Type:
Office . . . . . . . . . . . . . . . . . . . . . . . . . . . . . . . . . . . . . . . . . . . . . . . . . $16,857 44.6% $15,205 43.2%
Retail . . . . . . . . . . . . . . . . . . . . . . . . . . . . . . . . . . . . . . . . . . . . . . . . . 9,215 24.3 7,964 22.6
Apartments . . . . . . . . . . . . . . . . . . . . . . . . . . . . . . . . . . . . . . . . . . . . . 3,630 9.6 3,731 10.6
Hotel . . . . . . . . . . . . . . . . . . . . . . . . . . . . . . . . . . . . . . . . . . . . . . . . . 3,089 8.2 3,117 8.9
Industrial . . . . . . . . . . . . . . . . . . . . . . . . . . . . . . . . . . . . . . . . . . . . . . . 2,910 7.7 2,797 8.0
Other . . . . . . . . . . . . . . . . . . . . . . . . . . . . . . . . . . . . . . . . . . . . . . . . . 2,119 5.6 2,362 6.7
Total recorded investment . . . . . . . . . . . . . . . . . . . . . . . . . . . . . . . . . . 37,820 100.0% 35,176 100.0%
Less valuation allowances . . . . . . . . . . . . . . . . . . . . . . . . . . . . . . . . . 562 589
Carrying value, net of valuation allowances . . . . . . . . . . . . . . . . . . . . . . $37,258 $34,587
Mortgage Loan Credit Quality — Restructured, Potentially Delinquent, Delinquent or Under Foreclosure. The Company monitors itsmortgage loan investments on an ongoing basis, including reviewing loans that are restructured, potentially delinquent, and delinquent orunder foreclosure. These loan classifications are consistent with those used in industry practice.
The Company defines restructured mortgage loans as loans in which the Company, for economic or legal reasons related to the debtor’sfinancial difficulties, grants a concession to the debtor that it would not otherwise consider. The Company defines potentially delinquent loansas loans that, in management’s opinion, have a high probability of becoming delinquent in the near term. The Company defines delinquentmortgage loans consistent with industry practice, when interest and principal payments are past due as follows: commercial mortgageloans — 60 days past due; agricultural mortgage loans — 90 days past due; and residential mortgage loans — 60 days past due. TheCompany defines mortgage loans under foreclosure as loans in which foreclosure proceedings have formally commenced.
The following table presents the recorded investment and valuation allowance for all mortgage loans held-for-investment distributed by theabove stated loan classifications at:
RecordedInvestment
% ofTotal
ValuationAllowance
% ofRecorded
InvestmentRecorded
Investment% ofTotal
ValuationAllowance
% ofRecorded
Investment
2010 2009
December 31,
(In millions)
Commercial:
Performing . . . . . . . . . . . . . . . . . . . . . $37,489 99.1% $528 1.4% $35,066 99.7% $548 1.6%
Restructured . . . . . . . . . . . . . . . . . . . . 93 0.2 6 6.5% — — — —%
Potentially delinquent . . . . . . . . . . . . . . 180 0.5 28 15.6% 102 0.3 41 40.2%
Delinquent or under foreclosure . . . . . . . . 58 0.2 — —% 8 — — —%
Total . . . . . . . . . . . . . . . . . . . . . . . . $37,820 100.0% $562 1.5% $35,176 100.0% $589 1.7%
Agricultural(1):
Performing . . . . . . . . . . . . . . . . . . . . . $12,486 97.9% $ 35 0.3% $11,950 97.5% $ 33 0.3%
Restructured . . . . . . . . . . . . . . . . . . . . 33 0.3 8 24.2% 36 0.3 10 27.8%
Potentially delinquent . . . . . . . . . . . . . . 62 0.5 11 17.7% 128 1.0 34 26.6%
Delinquent or under foreclosure . . . . . . . . 170 1.3 34 20.0% 141 1.2 38 27.0%
Total . . . . . . . . . . . . . . . . . . . . . . . . $12,751 100.0% $ 88 0.7% $12,255 100.0% $115 0.9%
Residential(2):
Performing . . . . . . . . . . . . . . . . . . . . . $ 2,221 96.2% $ 12 0.5% $ 1,389 94.4% $ 16 1.2%
Restructured . . . . . . . . . . . . . . . . . . . . 4 0.2 — —% 1 0.1 — —%
Potentially delinquent . . . . . . . . . . . . . . 4 0.2 — —% 10 0.7 — —%
Delinquent or under foreclosure . . . . . . . . 79 3.4 2 2.5% 71 4.8 1 1.4%
Total . . . . . . . . . . . . . . . . . . . . . . . . $ 2,308 100.0% $ 14 0.6% $ 1,471 100.0% $ 17 1.2%
(1) Of the $12.8 billion of agricultural mortgage loans outstanding at December 31, 2010, 53% were subject to rate resets prior to maturity. Asubstantial portion of these mortgage loans have been successfully renegotiated and remain outstanding to maturity.
(2) Residential mortgage loans held-for-investment consist primarily of first lien residential mortgage loans, and to a much lesser extent,second lien residential mortgage loans and home equity lines of credit.See “Investments — Mortgage Loans” in Note 3 of the Notes to the Consolidated Financial Statements for tables that present, by portfolio
segment, mortgage loans by credit quality indicator and impaired loans, as well as information on past due and nonaccrual mortgage loans forthe year ended December 31, 2010.
53MetLife, Inc.

Mortgage Loan Credit Quality — Monitoring Process — Commercial and Agricultural Mortgage Loans. The Company reviews allcommercial mortgage loans on an ongoing basis. These reviews may include an analysis of the property financial statements and rentroll, lease rollover analysis, property inspections, market analysis, estimated valuations of the underlying collateral, loan-to-value ratios, debtservice coverage ratios, and tenant creditworthiness. The monitoring process focuses on higher risk loans, which include those that areclassified as restructured, potentially delinquent, delinquent or in foreclosure, as well as loans with higher loan-to-value ratios and lower debtservice coverage ratios. The monitoring process for agricultural mortgage loans is generally similar, with a focus on higher risk loans, such asloans with higher loan-to-value ratios, including reviews on a geographic and property type basis.
Loan-to-value ratios and debt service coverage ratios are common measures in the assessment of the quality of commercial mortgageloans. Loan-to-value ratios are a common measure in the assessment of the quality of agricultural mortgage loans. Loan-to-value ratioscompare the amount of the loan to the estimated fair value of the underlying collateral. A loan-to-value ratio greater than 100% indicates thatthe loan amount is greater than the collateral value. A loan-to-value ratio of less than 100% indicates an excess of collateral value over the loanamount. The debt service coverage ratio compares a property’s net operating income to amounts needed to service the principal and interestdue under the loan. For commercial mortgage loans, the average loan-to-value ratio was 66% and 68% at December 31, 2010 and 2009,respectively, and the average debt service coverage ratio was 2.4x, as compared to 2.2x at December 31, 2009. For agricultural mortgageloans, the average loan-to-value ratio was 49% at both December 31, 2010 and 2009, respectively. The values utilized in calculating theseratios are developed in connection with our review of the commercial and agricultural mortgage loans, and are updated routinely, including aperiodic quality rating process and an evaluation of the estimated fair value of the underlying collateral.
Mortgage Loan Credit Quality — Monitoring Process — Residential Mortgage Loans. The Company has a conservative residentialmortgage loan portfolio and does not hold any option ARMs, sub-prime or low teaser rate. Higher risk loans include those that are classified asrestructured, potentially delinquent, delinquent or in foreclosure, as well as loans with higher loan-to-value ratios and interest-only loans. TheCompany’s investment in residential junior lien loans and residential mortgage loans with a loan-to-value ratio of 80% or more was $95 millionand $76 million at December 31, 2010 and 2009, respectively, and the majority of the higher loan-to-value residential mortgage loans havemortgage insurance coverage which reduces the loan-to-value ratio to less than 80%. Additionally, the Company’s investment in traditionalresidential interest-only mortgage loans was $389 million and $323 million at December 31, 2010 and 2009, respectively.
Mortgage Loan Valuation Allowances. The Company’s valuation allowances are established both on a loan specific basis for those loansconsidered impaired where a property specific or market specific risk has been identified that could likely result in a future loss, as well as forpools of loans with similar risk characteristics where a property specific or market specific risk has not been identified, but for which theCompany expects to incur a loss. Accordingly, a valuation allowance is provided to absorb these estimated probable credit losses. TheCompany records additions to and decreases in its valuation allowances and gains and losses from the sale of loans in net investment gains(losses).
The Company records valuation allowances for loans considered to be impaired when it is probable that, based upon current informationand events, the Company will be unable to collect all amounts due under the contractual terms of the loan agreement. Based on the facts andcircumstances of the individual loans being impaired, loan specific valuation allowances are established for the excess carrying value of theloan over either: (i) the present value of expected future cash flows discounted at the loan’s original effective interest rate; (ii) the estimated fairvalue of the loan’s underlying collateral if the loan is in the process of foreclosure or otherwise collateral dependent; or (iii) the loan’sobservable market price.
The Company also establishes valuation allowances for loan losses for pools of loans with similar risk characteristics, such as propertytypes, loan-to-value ratios and debt service coverage ratios when, based on past experience, it is probable that a credit event has occurredand the amount of loss can be reasonably estimated. These valuation allowances are based on loan risk characteristics, historical defaultrates and loss severities, real estate market fundamentals and outlook, as well as, other relevant factors.
The determination of the amount of, and additions or decreases to, valuation allowances is based upon the Company’s periodic evaluationand assessment of known and inherent risks associated with its loan portfolios. Such evaluations and assessments are based upon severalfactors, including the Company’s experience for loan losses, defaults and loss severity, and loss expectations for loans with similar riskcharacteristics. These evaluations and assessments are revised as conditions change and new information becomes available. We updateour evaluations regularly, which can cause the valuation allowances to increase or decrease over time as such evaluations are revised.Negative credit migration including an actual or expected increase in the level of problem loans will result in an increase in the valuationallowance. Positive credit migration including an actual or expected decrease in the level of problem loans will result in a decrease in thevaluation allowance. Such changes in the valuation allowance are recorded in net investment gains (losses).
See “Investments — Mortgage Loans” in Note 3 of the Notes to the Consolidated Financial Statements for a table that presents the activityin the Company’s valuation allowances, by portfolio segment, for the years ended December 31, 2010, 2009 and 2008, respectively; and fortables that present the Company’s valuation allowances, by type of credit loss, by portfolio segment, at December 31, 2010 and 2009,respectively.
The Company held $197 million and $210 million in mortgage loans which are carried at estimated fair value based on the value of theunderlying collateral or independent broker quotations, if lower, of which $164 million and $202 million relate to impaired mortgage loansheld-for-investment and $33 million and $8 million to certain mortgage loans held-for-sale, at December 31, 2010 and 2009, respectively.These impaired mortgage loans were recorded at estimated fair value and represent a nonrecurring fair value measurement. The estimated fairvalue is categorized as Level 3. Included within net investment gains (losses) for such impaired mortgage loans were net impairments of$17 million and $93 million for the years ended December 31, 2010 and 2009, respectively. Subsequent improvements in estimated fair valueon previously impaired loans recorded through a reduction in the previously established provision to the valuation allowance are reported as a(release) above.
Real Estate and Real Estate Joint VenturesThe Company diversifies its real estate investments by both geographic region and property type to reduce risk of concentration. Of the
Company’s real estate investments, 88% are located in the U.S. with the remaining 12% located outside the U.S., at December 31, 2010. Thecarrying value of the Company’s real estate investments was $8.0 billion, or 1.7%, and $6.9 billion, or 2.0%, of total cash and invested assetsat December 31, 2010 and 2009, respectively. See “Investments — Real Estate” in Note 3 of the Notes to the Consolidated Financial
54 MetLife, Inc.

Statements for tables that present the Company’s real estate investments by investment strategy and by property type at December 31, 2010and 2009.
Properties acquired through foreclosure were $165 million, $127 million and less than $1 million for the years ended December 31, 2010,2009 and 2008, respectively, and includes commercial, agricultural and residential properties. After the Company acquires propertiesthrough foreclosure, it evaluates whether the property is appropriate for retention in its traditional real estate portfolio. Foreclosed real estateheld at December 31, 2010 and 2009 includes those properties the Company has not selected for retention in its traditional real estateportfolio and which do not meet the criteria to be classified as held-for-sale.
Impairments recognized on real estate held-for-investment were $48 million, $160 million and $20 million for the years ended Decem-ber 31, 2010, 2009 and 2008, respectively. Impairments recognized on real estate held-for-sale were $1 million for the year endedDecember 31, 2010. There were no impairments recognized on real estate held-for-sale for each of the years ended December 31, 2009 and2008. The Company’s carrying value of real estate held-for-sale has been reduced by impairments recorded prior to 2009 of $1 million at bothDecember 31, 2010 and 2009. The carrying value of non-income producing real estate was $137 million, $76 million and $28 million atDecember 31, 2010, 2009 and 2008, respectively.
The impaired cost method basis real estate joint ventures were recorded at estimated fair value and represent a non-recurring fair valuemeasurement. The estimated fair value was categorized as Level 3. Impairments to estimated fair value for such cost method basis real estatejoint ventures of $25 million, $82 million, and $0 for the years ended December 31, 2010, 2009 and 2008, respectively, were recognizedwithin net investment gains (losses) and are included in the $48 million, $160 million and $20 million of impairments on real estate investmentsheld-for-investment for the years ended December 31, 2010, 2009 and 2008, respectively. The estimated fair value of the impaired costmethod real estate joint ventures after these impairments was $8 million and $93 million at December 31, 2010 and 2009, respectively.
Other Limited Partnership InterestsThe carrying value of other limited partnership interests (which primarily represent ownership interests in pooled investment funds that
principally make private equity investments in companies in the U.S. and overseas) was $6.4 billion and $5.5 billion, or 1.3% and 1.6% of totalcash and invested assets at December 31, 2010 and 2009, respectively. Included within other limited partnership interests were $1.0 billion,at both December 31, 2010 and 2009, of investments in hedge funds.
Impairments on cost basis limited partnership interests are recognized at estimated fair value determined from information provided in thefinancial statements of the underlying other limited partnership interests in the period in which the impairment is recognized. Consistent withequity securities, greater weight and consideration is given in the other limited partnership interests impairment review process to the severityand duration of unrealized losses on such other limited partnership interests holdings. Impairments to estimated fair value for such otherlimited partnership interests of $12 million, $354 million and $105 million for the years ended December 31, 2010, 2009 and 2008,respectively, were recognized within net investment gains (losses). The estimated fair value of the impaired other limited partnership interestsafter these impairments was $23 million, $561 million and $137 million at December 31, 2010, 2009 and 2008, respectively. Theseimpairments to estimated fair value represent non-recurring fair value measurements that have been classified as Level 3 due to the limitedactivity and price transparency inherent in the market for such investments.
Other Invested AssetsSee “Investments — Other Invested Assets” in Note 3 of the Notes to the Consolidated Financial Statements for a table that presents the
Company’s other invested assets by type at December 31, 2010 and 2009 and related information.
Short-term InvestmentsThe carrying value of short-term investments, which include investments with remaining maturities of one year or less, but greater than
three months, at the time of purchase was $9.4 billion and $8.4 billion, or 2.0% and 2.5% of total cash and invested assets at December 31,2010 and 2009, respectively. The Company is exposed to concentrations of credit risk related to securities of the U.S. government andcertain U.S. government agencies included within short-term investments, which were $4.0 billion and $7.5 billion at December 31, 2010 and2009, respectively.
Cash EquivalentsThe carrying value of cash equivalents, which includes investments with an original or remaining maturity of three months or less, at the
time of purchase was $9.6 billion and $8.4 billion at December 31, 2010 and 2009, respectively. The Company is exposed to concentrationsof credit risk related to securities of the U.S. government and certain U.S. government agencies included within cash equivalents, which were$5.8 billion and $6.0 billion at December 31, 2010 and 2009, respectively.
Derivative Financial InstrumentsDerivatives. The Company is exposed to various risks relating to its ongoing business operations, including interest rate risk, foreign
currency risk, credit risk, and equity market risk. The Company uses a variety of strategies to manage these risks, including the use ofderivative instruments. See Note 4 of the Notes to Consolidated Financial Statements for:
• A comprehensive description of the nature of the Company’s derivative instruments, including the strategies for which derivatives areused in managing various risks.
• Information about the notional amount, estimated fair value, and primary underlying risk exposure of the Company’s derivative financialinstruments, excluding embedded derivatives held at December 31, 2010 and 2009.
Hedging. See Note 4 of the Notes to Consolidated Financial Statements for information about:• The notional amount and estimated fair value of derivatives and non-derivative instruments designated as hedging instruments by type
of hedge designation at December 31, 2010 and 2009.• The notional amount and estimated fair value of derivatives that are not designated or do not qualify as hedging instruments by derivative
type at December 31, 2010 and 2009.• The statement of operations effects of derivatives in cash flow, fair value, or non-qualifying hedge relationships for the years ended
December 31, 2010, 2009, and 2008.See “Quantitative and Qualitative Disclosures About Market Risk — Management of Market Risk Exposures — Hedging Activities” for
more information about the Company’s use of derivatives by major hedge program.
55MetLife, Inc.

Fair Value Hierarchy. Derivatives measured at estimated fair value on a recurring basis and their corresponding fair value hierarchy, arepresented as follows:
DerivativeAssets
DerivativeLiabilities
December 31, 2010
(In millions)
Quoted prices in active markets for identical assets and liabilities (Level 1) . . . . . . . . . $ 156 2% $ 45 1%
Significant other observable inputs (Level 2) . . . . . . . . . . . . . . . . . . . . . . . . . . . . 7,176 92 4,245 93
Significant unobservable inputs (Level 3) . . . . . . . . . . . . . . . . . . . . . . . . . . . . . . . 445 6 272 6
Total estimated fair value . . . . . . . . . . . . . . . . . . . . . . . . . . . . . . . . . . . . . . . $7,777 100% $4,562 100%
The valuation of Level 3 derivatives involves the use of significant unobservable inputs and generally requires a higher degree ofmanagement judgment or estimation than the valuations of Level 1 and Level 2 derivatives. Although Level 3 inputs are based on assumptionsdeemed appropriate given the circumstances and are assumed to be consistent with what other market participants would use when pricingsuch instruments, the use of different inputs or methodologies could have a material effect on the estimated fair value of Level 3 derivativesand could materially affect net income.
Derivatives categorized as Level 3 at December 31, 2010 include: interest rate forwards with maturities which extend beyond theobservable portion of the yield curve; interest rate lock commitments with certain unobservable inputs, including pull-through rates; equityvariance swaps with unobservable volatility inputs or that are priced via independent broker quotations; foreign currency swaps which arecancelable and priced through independent broker quotations; interest rate swaps with maturities which extend beyond the observableportion of the yield curve; credit default swaps based upon baskets of credits having unobservable credit correlations, as well as credit defaultswaps with maturities which extend beyond the observable portion of the credit curves and credit default swaps priced through independentbroker quotes; foreign currency forwards priced via independent broker quotations or with liquidity adjustments; implied volatility swaps withunobservable volatility inputs or that are priced via independent broker quotations; equity options with unobservable volatility inputs or that arepriced via independent broker quotations; currency options based upon baskets of currencies having unobservable currency correlations;and credit forwards having unobservable repurchase rates.
At December 31, 2010 and 2009, 2.0% and 5.5%, respectively, of the net derivative estimated fair value was priced via independentbroker quotations.
A rollforward of the fair value measurements for derivatives measured at estimated fair value on a recurring basis using significantunobservable (Level 3) inputs for the year ended December 31, 2010 is as follows:
Year EndedDecember 31, 2010
(In millions)
Balance, at January 1, . . . . . . . . . . . . . . . . . . . . . . . . . . . . . . . . . . . . . . . . . . . . . . . . . . . . $356
Total realized/unrealized gains (losses) included in:
Earnings . . . . . . . . . . . . . . . . . . . . . . . . . . . . . . . . . . . . . . . . . . . . . . . . . . . . . . . . . . (5)
Other comprehensive income (loss) . . . . . . . . . . . . . . . . . . . . . . . . . . . . . . . . . . . . . . . . . (81)
Purchases, sales, issuances and settlements . . . . . . . . . . . . . . . . . . . . . . . . . . . . . . . . . . . . (75)
Transfer in and/or out of Level 3 . . . . . . . . . . . . . . . . . . . . . . . . . . . . . . . . . . . . . . . . . . . . (22)
Balance, at December 31, . . . . . . . . . . . . . . . . . . . . . . . . . . . . . . . . . . . . . . . . . . . . . . . . . . $173
See “— Summary of Critical Accounting Estimates — Derivative Financial Instruments” for further information on the estimates andassumptions that affect the amounts reported above.
Credit Risk. See Note 4 of the Notes to Consolidated Financial Statements for information about how the Company manages credit riskrelated to its freestanding derivatives, including the use of master netting agreements and collateral arrangements.
Credit Derivatives. See Note 4 of the Notes to Consolidated Financial Statements for information about the estimated fair value andmaximum amount at risk related to the Company’s written credit default swaps.
Embedded Derivatives. The embedded derivatives measured at estimated fair value on a recurring basis and their corresponding fairvalue hierarchy, are presented as follows:
Asset HostContracts
Liability HostContracts
Net Embedded Derivatives Within
December 31, 2010
(In millions)
Quoted prices in active markets for identical assets and liabilities (Level 1) . . . . . . . . $ — —% $ — —%
Significant other observable inputs (Level 2) . . . . . . . . . . . . . . . . . . . . . . . . . . . . — — 11 —
Significant unobservable inputs (Level 3) . . . . . . . . . . . . . . . . . . . . . . . . . . . . . . 185 100 2,623 100
Total estimated fair value . . . . . . . . . . . . . . . . . . . . . . . . . . . . . . . . . . . . . . . . $185 100% $2,634 100%
56 MetLife, Inc.

A rollforward of the fair value measurements for net embedded derivatives measured at estimated fair value on a recurring basis usingsignificant unobservable (Level 3) inputs is as follows:
Year EndedDecember 31, 2010
(In millions)
Balance, at January 1, . . . . . . . . . . . . . . . . . . . . . . . . . . . . . . . . . . . . . . . . . . . . . . . . . . . . $(1,455)
Total realized/unrealized gains (losses) included in:
Earnings . . . . . . . . . . . . . . . . . . . . . . . . . . . . . . . . . . . . . . . . . . . . . . . . . . . . . . . . . . (335)
Other comprehensive income (loss) . . . . . . . . . . . . . . . . . . . . . . . . . . . . . . . . . . . . . . . . . (226)
Purchases, sales, issuances and settlements . . . . . . . . . . . . . . . . . . . . . . . . . . . . . . . . . . . . (422)
Transfer in and/or out of Level 3 . . . . . . . . . . . . . . . . . . . . . . . . . . . . . . . . . . . . . . . . . . . . —
Balance, at December 31, . . . . . . . . . . . . . . . . . . . . . . . . . . . . . . . . . . . . . . . . . . . . . . . . . . $(2,438)
The valuation of guaranteed minimum benefits includes an adjustment for nonperformance risk. Included in net derivative gains (losses) forthe years ended December 31, 2010 and 2009 were gains (losses) of ($96) million and ($1,932) million, respectively, in connection with thisadjustment. These amounts are net of a loss of $955 million relating to a refinement for estimating nonperformance risk in fair valuemeasurements implemented at June 30, 2010. See “— Summary of Critical Accounting Estimates.”
See “— Summary of Critical Accounting Estimates — Embedded Derivatives” for further information on the estimates and assumptionsthat affect the amounts reported above.
Off-Balance Sheet Arrangements
Commitments to Fund Partnership InvestmentsThe Company makes commitments to fund partnership investments in the normal course of business for the purpose of enhancing the
Company’s total return on its investment portfolio. The amounts of these unfunded commitments were $3.8 billion and $4.1 billion atDecember 31, 2010 and 2009, respectively. The Company anticipates that these amounts will be invested in partnerships over the next fiveyears.
Mortgage Loan CommitmentsThe Company has issued interest rate lock commitments on certain residential mortgage loan applications totaling $2.5 billion and
$2.7 billion at December 31, 2010 and 2009, respectively. The Company intends to sell the majority of these originated residential mortgageloans. Interest rate lock commitments to fund mortgage loans that will be held-for-sale are considered derivatives pursuant to the guidance onderivatives and hedging, and their estimated fair value and notional amounts are included within interest rate forwards.
The Company also commits to lend funds under certain other mortgage loan commitments that will be held-for-investment in the normalcourse of business for the purpose of enhancing the Company’s total return on its investment portfolio. The amounts of these mortgage loancommitments were $3.8 billion and $2.2 billion at December 31, 2010 and 2009, respectively.
Commitments to Fund Bank Credit Facilities, Bridge Loans and Private Corporate Bond InvestmentsThe Company commits to lend funds under bank credit facilities, bridge loans and private corporate bond investments in the normal
course of business for the purpose of enhancing the Company’s total return on its investment portfolio. The amounts of these unfundedcommitments were $2.4 billion and $1.3 billion at December 31, 2010 and 2009, respectively.
There are no other material obligations or liabilities arising from the commitments to fund partnership investments, mortgage loans, bankcredit facilities, and bridge loans and private corporate bond investment arrangements.
Lease CommitmentsThe Company, as lessee, has entered into various lease and sublease agreements for office space, information technology and other
equipment. The Company’s commitments under such lease agreements are included within the contractual obligations table. See “—Liquidity and Capital Resources — The Company — Liquidity and Capital Uses — Contractual Obligations.”
Credit Facilities, Committed Facilities and Letters of CreditThe Company maintains committed and unsecured credit facilities and letters of credit with various financial institutions. See “— Liquidity
and Capital Resources — The Company — Liquidity and Capital Sources — Credit and Committed Facilities,” for further descriptions ofsuch arrangements.
GuaranteesSee “Guarantees” in Note 16 of the Notes to the Consolidated Financial Statements.
Collateral for Securities LendingThe Company has no non-cash collateral for securities lending on deposit from customers, which cannot be sold or repledged, and which
has not been recorded on its consolidated balance sheets.
Insolvency AssessmentsSee Note 16 of the Notes to the Consolidated Financial Statements.
Policyholder LiabilitiesThe Company establishes, and carries as liabilities, actuarially determined amounts that are calculated to meet policy obligations when a
policy matures or is surrendered, an insured dies or becomes disabled or upon the occurrence of other covered events, or to provide forfuture annuity payments. Amounts for actuarial liabilities are computed and reported in the consolidated financial statements in conformitywith GAAP. For more details on Policyholder Liabilities, see “— Summary of Critical Accounting Estimates.” Also see Notes 1 and 8 of theNotes to the Consolidated Financial Statements for an analysis of certain policyholder liabilities at December 31, 2010 and 2009.
57MetLife, Inc.

Due to the nature of the underlying risks and the high degree of uncertainty associated with the determination of actuarial liabilities, theCompany cannot precisely determine the amounts that will ultimately be paid with respect to these actuarial liabilities, and the ultimateamounts may vary from the estimated amounts, particularly when payments may not occur until well into the future.
However, we believe our actuarial liabilities for future benefits are adequate to cover the ultimate benefits required to be paid topolicyholders. We periodically review our estimates of actuarial liabilities for future benefits and compare them with our actual experience. Werevise estimates, to the extent permitted or required under GAAP, if we determine that future expected experience differs from assumptionsused in the development of actuarial liabilities.
The Company has experienced, and will likely in the future experience, catastrophe losses and possibly acts of terrorism, and turbulentfinancial markets that may have an adverse impact on our business, results of operations, and financial condition. Catastrophes can becaused by various events, including pandemics, hurricanes, windstorms, earthquakes, hail, tornadoes, explosions, severe winter weather(including snow, freezing water, ice storms and blizzards), fires and man-made events such as terrorist attacks. Due to their nature, we cannotpredict the incidence, timing, severity or amount of losses from catastrophes and acts of terrorism, but we make broad use of catastrophicand non-catastrophic reinsurance to manage risk from these perils.
Future Policy BenefitsThe Company establishes liabilities for amounts payable under insurance policies. Generally, amounts are payable over an extended
period of time and related liabilities are calculated as the present value of expected future benefits to be paid, reduced by the present value ofexpected future net premiums. Such liabilities are established based on methods and underlying assumptions in accordance with GAAP andapplicable actuarial standards. Principal assumptions used in the establishment of liabilities for future policy benefits include mortality,morbidity, policy lapse, renewal, retirement, investment returns, inflation, expenses and other contingent events as appropriate to therespective product type. These assumptions are established at the time the policy is issued and are intended to estimate the experience forthe period the policy benefits are payable. Utilizing these assumptions, liabilities are established on a block of business basis. If experience isless favorable than assumed and future losses are projected under loss recognition testing, then additional liabilities may be required,resulting in a charge to policyholder benefits and claims.
Insurance Products. Future policy benefits are comprised mainly of liabilities for disabled lives under disability waiver of premium policyprovisions, liabilities for survivor income benefit insurance, long-term care (“LTC”) policies, active life policies and premium stabilization andother contingency liabilities held under participating life insurance contracts. In order to manage risk, the Company has often reinsured aportion of the mortality risk on new individual life insurance policies. The reinsurance programs are routinely evaluated and this may result inincreases or decreases to existing coverage. The Company entered into various derivative positions, primarily interest rate swaps andswaptions, to mitigate the risk that investment of premiums received and reinvestment of maturing assets over the life of the policy will be atrates below those assumed in the original pricing of these contracts.
Retirement Products. Future policy benefits are comprised mainly of liabilities for life-contingent income annuities, supplementalcontracts with and without life contingencies, liabilities for Guaranteed Minimum Death Benefits (“GMDBs”) included in certain annuitycontracts, and a certain portion of guaranteed living benefits. See “— Variable Annuity Guarantees.”
Corporate Benefit Funding. Liabilities are primarily related to structured settlement annuities. There is no interest rate crediting flexibilityon these liabilities. A sustained low interest rate environment could negatively impact earnings as a result. The Company has variousderivative positions, primarily interest rate floors and interest rate swaps, to mitigate the risks associated with such a scenario.
Auto & Home. Future policy benefits include liabilities for unpaid claims and claim expenses for property and casualty insurance andrepresent the amount estimated for claims that have been reported but not settled and claims incurred but not reported. Liabilities for unpaidclaims are estimated based upon assumptions such as rates of claim frequencies, levels of severities, inflation, judicial trends, legislativechanges or regulatory decisions. Assumptions are based upon the Company’s historical experience and analyses of historical developmentpatterns of the relationship of loss adjustment expenses to losses for each line of business, and consider the effects of current developments,anticipated trends and risk management programs, reduced for anticipated salvage and subrogation.
International. Future policy benefits are held primarily for traditional life and accident and health contracts in Japan, Asia Pacific andimmediate annuities in Latin America. They are also held for total return pass-thru provisions included in certain universal life and savingsproducts mainly in Japan and Latin America, and traditional life, endowment and annuity contracts sold in various countries in Asia Pacific.They also include certain liabilities for variable annuity guarantees of minimum death benefits, and longevity guarantees sold in Japan and AsiaPacific. Finally, in Europe and the Middle East, they also include unearned premium liabilities established for credit insurance contractscovering death, disability and involuntary loss of employment, as well as traditional life, accident and health and endowment contracts.Factors impacting these liabilities include sustained periods of lower yields than rates established at issue, lower than expected assetreinvestment rates, higher than expected lapse rates, asset default and more rapid improvement of mortality levels than anticipated for lifecontingent immediate annuities. The Company mitigates its risks by implementing an asset/liability matching policy and through thedevelopment of periodic experience studies. See “— Variable Annuity Guarantees.”
Estimates for the liabilities for unpaid claims and claim expenses are reset as actuarial indications change and these changes in the liabilityare reflected in the current results of operation as either favorable or unfavorable development of prior year losses.
Banking, Corporate & Other. Future policy benefits primarily include liabilities for quota-share reinsurance agreements for certain LTCand workers’ compensation business written by MetLife Insurance Company of Connecticut (“MICC”), prior to its acquisition by MetLife, Inc.These are run-off businesses that have been included within Banking, Corporate & Other since the acquisition of MICC.
Policyholder Account BalancesPolicyholder account balances are generally equal to the account value, which includes accrued interest credited, but exclude the impact
of any applicable surrender charge that may be incurred upon surrender.Insurance Products. Policyholder account balances are held for death benefit disbursement retained asset accounts, universal life
policies, the fixed account of variable life insurance policies, specialized life insurance products for benefit programs and general accountuniversal life policies. Policyholder account balances are credited interest at a rate set by the Company, which are influenced by currentmarket rates. The majority of the policyholder account balances have a guaranteed minimum credited rate between 0.5% and 6.0%. Asustained low interest rate environment could negatively impact earnings as a result of the minimum credited rate guarantees. The Companyhas various derivative positions, primarily interest rate floors, to partially mitigate the risks associated with such a scenario.
58 MetLife, Inc.

Retirement Products. Policyholder account balances are held for fixed deferred annuities and the fixed account portion of variableannuities, for certain income annuities, and for certain portions of guaranteed benefits. Policyholder account balances are credited interest ata rate set by the Company. Credited rates for deferred annuities are influenced by current market rates, and most of these contracts have aminimum guaranteed rate between 1.0% and 4.0%. See “— Variable Annuity Guarantees.”
Corporate Benefit Funding. Policyholder account balances are comprised of funding agreements. Interest crediting rates vary by type ofcontract, and can be fixed or variable. Variable interest crediting rates are generally tied to an external index, most commonly 1-month or3-month LIBOR. MetLife is exposed to interest rate risks, and foreign exchange risk when guaranteeing payment of interest and return ofprincipal at the contractual maturity date. The Company may invest in floating rate assets, or enter into floating rate swaps, also tied to externalindices, as well as caps to mitigate the impact of changes in market interest rates. The Company also mitigates its risks by implementing anasset/liability matching policy and seeks to hedge all foreign currency risk through the use of foreign currency hedges, including crosscurrency swaps.
International. Policyholder account balances are held largely for fixed income retirement and savings plans in Japan and Latin Americaand to a lesser degree, amounts for unit-linked-type funds in certain countries across all regions that do not meet the GAAP definition ofseparate accounts. Also included are certain liabilities for retirement and savings products sold in certain countries in Japan and Asia Pacificthat generally are sold with minimum credited rate guarantees. Liabilities for guarantees on certain variable annuities in Japan and Asia Pacificare established in accordance with derivatives and hedging guidance and are also included within policyholder account balances. Theseliabilities are generally impacted by sustained periods of low interest rates, where there are interest rate guarantees. The Company mitigatesits risks by implementing an asset/liability matching policy and by hedging its variable annuity guarantees. Liabilities for unit-linked-type fundsare impacted by changes in the fair value of the associated underlying investments, as the return on assets is generally passed directly to thepolicyholder. See “— Variable Annuity Guarantees.”
Variable Annuity GuaranteesThe Company issues certain variable annuity products with guaranteed minimum benefits that provide the policyholder a minimum return
based on their initial deposit (i.e., the benefit base) less withdrawals. In some cases the benefit base may be increased by additional deposits,bonus amounts, accruals or market value resets. These guarantees are accounted for as insurance liabilities or as embedded derivativesdepending on how and when the benefit is paid. Specifically, a guarantee is accounted for as an embedded derivative if a guarantee is paidwithout requiring (i) the occurrence of specific insurable event, or (ii) the policyholder to annuitize. Alternatively, a guarantee is accounted foras an insurance liability if the guarantee is paid only upon either (i) the occurrence of a specific insurable event, or (ii) upon annuitization. Incertain cases, a guarantee may have elements of both an insurance liability and an embedded derivative and in such cases the guarantee isaccounted for under a split of the two models.
The net amount at risk (“NAR”) for guarantees can change significantly during periods of sizable and sustained shifts in equity marketperformance, increased equity volatility, or changes in interest rates. The NAR disclosed in Note 8 of the Notes to the Consolidated FinancialStatements represents management’s estimate of the current value of the benefits under these guarantees if they were all exercisedsimultaneously at December 31, 2010 and 2009, respectively. However, there are features, such as deferral periods and benefits requiringannuitization or death, that limit the amount of benefits that will be payable in the near future.
Guarantees, including portions thereof, accounted for as embedded derivatives, are recorded at estimated fair value and included inpolicyholder account balances. Guarantees accounted for as embedded derivatives include GMAB, the non life-contingent portion of GMWBand the portion of certain GMIB that do not require annuitization. For more detail on the determination of estimated fair value, see Note 5 of theNotes to the Consolidated Financial Statements.
The table below contains the carrying value for guarantees included in policyholder account balances at:
2010 2009
December 31,
(In millions)
U.S. Business:
Guaranteed minimum accumulation benefit . . . . . . . . . . . . . . . . . . . . . . . . . . . . . . . . . . . . . . $ 44 $ 60
Guaranteed minimum withdrawal benefit . . . . . . . . . . . . . . . . . . . . . . . . . . . . . . . . . . . . . . . . 173 154
Guaranteed minimum income benefit . . . . . . . . . . . . . . . . . . . . . . . . . . . . . . . . . . . . . . . . . . (51) 66
International:
Guaranteed minimum accumulation benefit . . . . . . . . . . . . . . . . . . . . . . . . . . . . . . . . . . . . . . 454 195
Guaranteed minimum withdrawal benefit . . . . . . . . . . . . . . . . . . . . . . . . . . . . . . . . . . . . . . . . 1,936 1,025
Total . . . . . . . . . . . . . . . . . . . . . . . . . . . . . . . . . . . . . . . . . . . . . . . . . . . . . . . . . . . . . . . $2,556 $1,500
Included in net derivative gains (losses) for the years ended December 31, 2010 and 2009 were gains (losses) of ($269) million and$1,806 million, respectively, in embedded derivatives related to the change in estimated fair value of the guarantees. The carrying amount ofguarantees accounted for at estimated fair value includes an adjustment for nonperformance risk. In connection with this adjustment, gains(losses) of ($96) million and ($1,932) million are included in the gains (losses) of ($269) million and $1,806 million in net derivative gains(losses) for the year ended December 31, 2010 and 2009, respectively.
The estimated fair value of guarantees accounted for as embedded derivatives can change significantly during periods of sizable andsustained shifts in equity market performance, equity volatility, interest rates or foreign exchange rates. Additionally, because the estimatedfair value for guarantees accounted for at estimated fair value includes an adjustment for nonperformance risk, a decrease in the Company’scredit spreads could cause the value of these liabilities to increase. Conversely, a widening of the Company’s credit spreads could cause thevalue of these liabilities to decrease. The Company uses derivative instruments and reinsurance to mitigate the liability exposure, risk of lossand the volatility of net income associated with these liabilities. The derivative instruments used are primarily equity and treasury futures,equity options and variance swaps, and interest rate swaps. The change in valuation arising from the nonperformance risk is not hedged.
59MetLife, Inc.

The table below presents the estimated fair value of the derivatives hedging guarantees accounted for as embedded derivatives:
Primary UnderlyingRisk Exposure Derivative Type
NotionalAmount Assets Liabilities
NotionalAmount Assets Liabilities
Estimated Fair Value Estimated Fair Value
2010 2009
December 31,
(In millions)
Interest rate Interest rate swaps . . . . . . . . . . . . . $13,762 $ 401 $ 193 $ 8,847 $ 194 $ 275
Interest rate futures . . . . . . . . . . . . . 5,822 32 10 4,997 5 4
Interest rate options . . . . . . . . . . . . . 614 15 — — — —
Foreign currency Foreign currency forwards . . . . . . . . . 2,320 46 1 2,016 4 30
Currency options . . . . . . . . . . . . . . . — — — 327 14 —
Equity market Equity futures . . . . . . . . . . . . . . . . . 6,959 17 9 6,033 31 20
Equity options . . . . . . . . . . . . . . . . . 32,942 1,720 1,196 26,661 1,596 1,018
Variance swaps . . . . . . . . . . . . . . . . 17,635 190 118 13,267 174 58
Total rate of return swaps . . . . . . . . . 1,547 — — 126 — —
Total . . . . . . . . . . . . . . . . . . . . . . . $81,601 $2,421 $ 1527 $62,274 $2,018 $1,405
Included in net derivative gains (losses) for the years ended December 31, 2010 and 2009 were gains (losses) of $113 million and($3,654) million related to the change in estimated fair value of the above derivatives. Additionally, included in net derivative gains (losses) forthe years ended December 31, 2010 and 2009 were gains (losses) of ($35) million and $0, respectively, related to ceded reinsurance.
Guarantees, including portions thereof, have liabilities established that are included in future policy benefits. Guarantees accounted for inthis manner include GMDBs, the life-contingent portion of certain GMWB, and the portion of GMIB that require annuitization. These liabilitiesare accrued over the life of the contract in proportion to actual and future expected policy assessments based on the level of guaranteedminimum benefits generated using multiple scenarios of separate account returns. The scenarios use best estimate assumptions consistentwith those used to amortize deferred acquisition costs. When current estimates of future benefits exceed those previously projected or whencurrent estimates of future assessments are lower than those previously projected, liabilities will increase, resulting in a current period chargeto net income. The opposite result occurs when the current estimates of future benefits are lower than that previously projected or whencurrent estimates of future assessments exceed those previously projected. At each reporting period, the Company updates the actualamount of business remaining in-force, which impacts expected future assessments and the projection of estimated future benefits resultingin a current period charge or increase to earnings.
The table below contains the carrying value for guarantees included in future policy benefits at:
2010 2009
December 31,
(In millions)
U.S. Business:
Guaranteed minimum death benefit . . . . . . . . . . . . . . . . . . . . . . . . . . . . . . . . . . . . . . . . . . . . . . $167 $137
Guaranteed minimum income benefit . . . . . . . . . . . . . . . . . . . . . . . . . . . . . . . . . . . . . . . . . . . . . 507 394
International:
Guaranteed minimum death benefit . . . . . . . . . . . . . . . . . . . . . . . . . . . . . . . . . . . . . . . . . . . . . . 66 23
Guaranteed minimum income benefit . . . . . . . . . . . . . . . . . . . . . . . . . . . . . . . . . . . . . . . . . . . . . 116 —
Total . . . . . . . . . . . . . . . . . . . . . . . . . . . . . . . . . . . . . . . . . . . . . . . . . . . . . . . . . . . . . . . . . . $856 $554
Included in policyholder benefits and claims for the year ended December 31, 2010 is a charge of $302 million and for the year endedDecember 31, 2009 is a credit of $92 million, related to the respective change in liabilities for the above guarantees.
The carrying amount of guarantees accounted for as insurance liabilities can change significantly during periods of sizable and sustainedshifts in equity market performance, increased equity volatility, or changes in interest rates. The Company uses reinsurance in combinationwith derivative instruments to mitigate the liability exposure, risk of loss and the volatility of net income associated with these liabilities.Derivative instruments used are primarily equity futures, treasury futures and interest rate swaps.
Included in policyholder benefits and claims associated with the hedging of the guarantees in future policy benefits for the year endedDecember 31, 2010 and 2009 were gains (losses) of $8 million and ($114) million, respectively, related to reinsurance treaties containingembedded derivatives carried at estimated fair value and gains (losses) of ($275) million and ($376) million, respectively, related tofreestanding derivatives.
While the Company believes that the hedging strategies employed for guarantees included in both policyholder account balances and infuture policy benefits, as well as other management actions, have mitigated the risks related to these benefits, the Company remains liable forthe guaranteed benefits in the event that reinsurers or derivative counterparties are unable or unwilling to pay. Certain of the Company’sreinsurance agreements and most derivative positions are collateralized and derivatives positions are subject to master netting agreements,both of which, significantly reduces the exposure to counterparty risk. In addition, the Company is subject to the risk that hedging and othermanagement procedures prove ineffective or that unanticipated policyholder behavior or mortality, combined with adverse market events,produces economic losses beyond the scope of the risk management techniques employed. Lastly, because the valuation of the guaranteesaccounted for as embedded derivatives includes an adjustment for nonperformance risk that is not hedged, changes in the nonperformancerisk may result in significant volatility in net income.
60 MetLife, Inc.

Other Policy-related BalancesOther policy-related balances include policy and contract claims, unearned revenue liabilities, premiums received in advance, policy-
holder dividends due and unpaid, and policyholder dividends left on deposit.The liability for policy and contract claims generally relates to incurred but not reported death, disability, LTC and dental claims, as well as
claims that have been reported but not yet settled. The liability for these claims is based on the Company’s estimated ultimate cost of settlingall claims. The Company derives estimates for the development of incurred but not reported claims principally from actuarial analyses ofhistorical patterns of claims and claims development for each line of business. The methods used to determine these estimates arecontinually reviewed. Adjustments resulting from this continuous review process and differences between estimates and payments for claimsare recognized in policyholder benefits and claims expense in the period in which the estimates are changed or payments are made.
The unearned revenue liability relates to universal life-type and investment-type products and represents policy charges for services to beprovided in future periods. The charges are deferred as unearned revenue and amortized using the product’s estimated gross profits andmargins, similar to deferred acquisition costs. Such amortization is recorded in universal life and investment-type product policy fees.
Also included in other policy-related balances are policyholder dividends due and unpaid on participating policies and policyholderdividends left on deposit. Such liabilities are presented at amounts contractually due to policyholders.
Policyholder Dividends PayablePolicyholder dividends payable consists of liabilities related to dividends payable in the following calendar year on participating policies.
Liquidity and Capital Resources
OverviewOur business and results of operations are materially affected by conditions in the global capital markets and the economy, generally, both
in the U.S. and elsewhere around the world. The global economy and markets are now recovering from a period of significant stress thatbegan in the second half of 2007 and substantially increased through the first quarter of 2009. This disruption adversely affected the financialservices industry, in particular. Consequently, financial institutions paid higher spreads over benchmark U.S. Treasury securities than beforethe market disruption began. The U.S. economy entered a recession in late 2007. This recession ended in mid-2009, but the recovery fromthe recession has been below historic averages and the unemployment rate is expected to remain high for some time. Although conditions inthe financial markets continued to materially improve in 2010, there is still some uncertainty as to whether the stressed conditions thatprevailed during the market disruption could recur, which could affect the Company’s ability to meet liquidity needs and obtain capital.
Liquidity ManagementBased upon the strength of its franchise, diversification of its businesses and strong financial fundamentals, we continue to believe the
Company has ample liquidity to meet business requirements under current market conditions and unlikely but reasonably possible stressscenarios. The Company’s short-term liquidity position (cash and cash equivalents, short-term investments, excluding cash collateralreceived under the Company’s securities lending program that has been reinvested in cash, cash equivalents, short-term investments andpublicly-traded securities, and cash collateral received from counterparties in connection with derivative instruments) was $17.6 billion and$11.7 billion at December 31, 2010 and 2009, respectively. We continuously monitor and adjust our liquidity and capital plans for the HoldingCompany and its subsidiaries in light of changing needs and opportunities.
The Company
LiquidityLiquidity refers to a company’s ability to generate adequate amounts of cash to meet its needs. Liquidity needs are determined from a
rolling 6-month forecast by portfolio of investment assets and are monitored daily. Asset mix and maturities are adjusted based on theforecast. Cash flow testing and stress testing provide additional perspectives on liquidity, which include various scenarios of the potential riskof early contractholder and policyholder withdrawal. The Company includes provisions limiting withdrawal rights on many of its products,including general account institutional pension products (generally group annuities, including funding agreements, and certain deposit fundliabilities) sold to employee benefit plan sponsors. Certain of these provisions prevent the customer from making withdrawals prior to thematurity date of the product.
In the event of significant cash requirements beyond anticipated liquidity needs, the Company has various alternatives availabledepending on market conditions and the amount and timing of the liquidity need. These options include cash flows from operations, thesale of liquid assets, global funding sources and various credit facilities.
Under certain stressful market and economic conditions, the Company’s access to, or cost of, liquidity may deteriorate. If the Companyrequires significant amounts of cash on short notice in excess of anticipated cash requirements, the Company may have difficulty sellinginvestment assets in a timely manner, be forced to sell them for less than the Company otherwise would have been able to realize, or both. Inaddition, in the event of such forced sale, accounting rules require the recognition of a loss for certain securities in an unrealized loss positionand may require the impairment of other securities based upon the Company’s ability to hold such securities, which may negatively impact theCompany’s financial condition.
In extreme circumstances, all general account assets — other than those which may have been pledged to a specific purpose — within astatutory legal entity are available to fund obligations of the general account within that legal entity.
CapitalThe Company’s capital position is managed to maintain its financial strength and credit ratings and is supported by its ability to generate
strong cash flows at the operating companies, borrow funds at competitive rates and raise additional capital to meet its operating and growthneeds.
The Company raised new capital from its debt issuances during the difficult market conditions prevailing since the second half of 2008, aswell as during the rebound and recovery periods beginning in the second quarter of 2009 (see “— The Company — Liquidity and CapitalSources — Debt Issuances and Other Borrowings”). The increase in credit spreads experienced since then has resulted in an increase in thecost of such new capital, as well as increases in facility fees. Conversely, as a result of reductions in interest rates, the Company’s interestexpense and dividends on floating rate securities have been lower.
61MetLife, Inc.
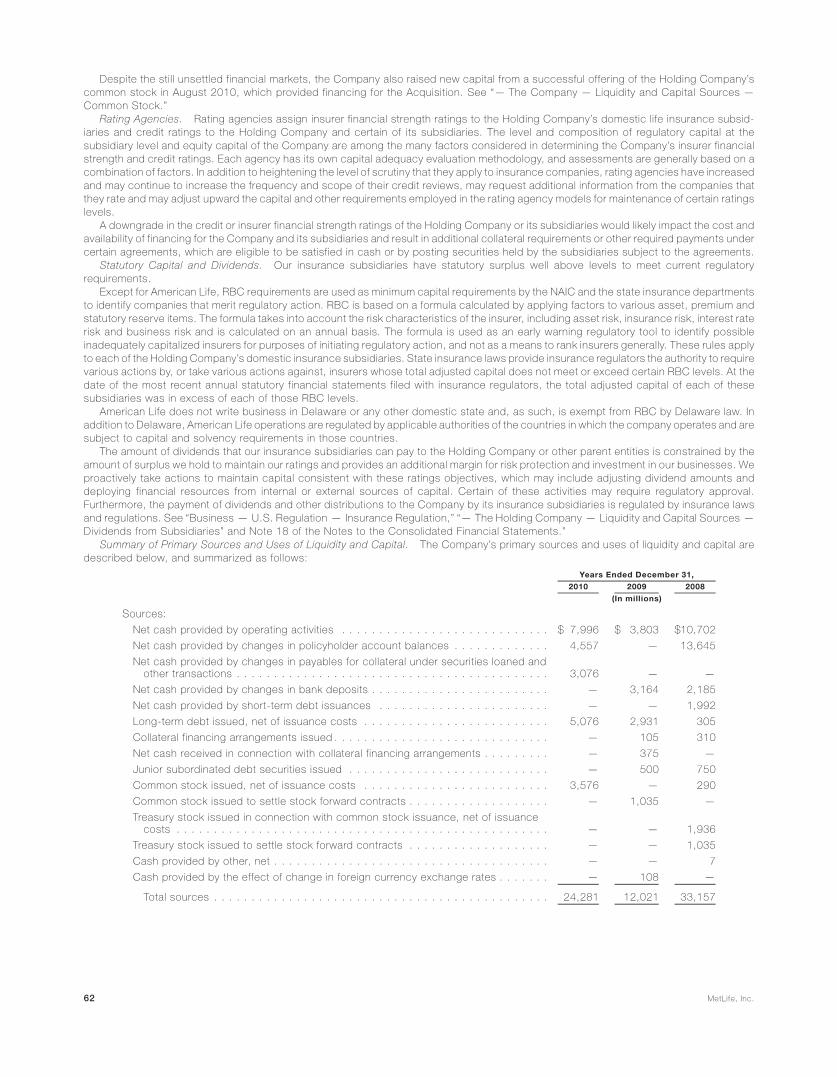
Despite the still unsettled financial markets, the Company also raised new capital from a successful offering of the Holding Company’scommon stock in August 2010, which provided financing for the Acquisition. See “— The Company — Liquidity and Capital Sources —Common Stock.”
Rating Agencies. Rating agencies assign insurer financial strength ratings to the Holding Company’s domestic life insurance subsid-iaries and credit ratings to the Holding Company and certain of its subsidiaries. The level and composition of regulatory capital at thesubsidiary level and equity capital of the Company are among the many factors considered in determining the Company’s insurer financialstrength and credit ratings. Each agency has its own capital adequacy evaluation methodology, and assessments are generally based on acombination of factors. In addition to heightening the level of scrutiny that they apply to insurance companies, rating agencies have increasedand may continue to increase the frequency and scope of their credit reviews, may request additional information from the companies thatthey rate and may adjust upward the capital and other requirements employed in the rating agency models for maintenance of certain ratingslevels.
A downgrade in the credit or insurer financial strength ratings of the Holding Company or its subsidiaries would likely impact the cost andavailability of financing for the Company and its subsidiaries and result in additional collateral requirements or other required payments undercertain agreements, which are eligible to be satisfied in cash or by posting securities held by the subsidiaries subject to the agreements.
Statutory Capital and Dividends. Our insurance subsidiaries have statutory surplus well above levels to meet current regulatoryrequirements.
Except for American Life, RBC requirements are used as minimum capital requirements by the NAIC and the state insurance departmentsto identify companies that merit regulatory action. RBC is based on a formula calculated by applying factors to various asset, premium andstatutory reserve items. The formula takes into account the risk characteristics of the insurer, including asset risk, insurance risk, interest raterisk and business risk and is calculated on an annual basis. The formula is used as an early warning regulatory tool to identify possibleinadequately capitalized insurers for purposes of initiating regulatory action, and not as a means to rank insurers generally. These rules applyto each of the Holding Company’s domestic insurance subsidiaries. State insurance laws provide insurance regulators the authority to requirevarious actions by, or take various actions against, insurers whose total adjusted capital does not meet or exceed certain RBC levels. At thedate of the most recent annual statutory financial statements filed with insurance regulators, the total adjusted capital of each of thesesubsidiaries was in excess of each of those RBC levels.
American Life does not write business in Delaware or any other domestic state and, as such, is exempt from RBC by Delaware law. Inaddition to Delaware, American Life operations are regulated by applicable authorities of the countries in which the company operates and aresubject to capital and solvency requirements in those countries.
The amount of dividends that our insurance subsidiaries can pay to the Holding Company or other parent entities is constrained by theamount of surplus we hold to maintain our ratings and provides an additional margin for risk protection and investment in our businesses. Weproactively take actions to maintain capital consistent with these ratings objectives, which may include adjusting dividend amounts anddeploying financial resources from internal or external sources of capital. Certain of these activities may require regulatory approval.Furthermore, the payment of dividends and other distributions to the Company by its insurance subsidiaries is regulated by insurance lawsand regulations. See “Business — U.S. Regulation — Insurance Regulation,” “— The Holding Company — Liquidity and Capital Sources —Dividends from Subsidiaries” and Note 18 of the Notes to the Consolidated Financial Statements.”
Summary of Primary Sources and Uses of Liquidity and Capital. The Company’s primary sources and uses of liquidity and capital aredescribed below, and summarized as follows:
2010 2009 2008
Years Ended December 31,
(In millions)
Sources:
Net cash provided by operating activities . . . . . . . . . . . . . . . . . . . . . . . . . . . . $ 7,996 $ 3,803 $10,702
Net cash provided by changes in policyholder account balances . . . . . . . . . . . . . 4,557 — 13,645
Net cash provided by changes in payables for collateral under securities loaned andother transactions . . . . . . . . . . . . . . . . . . . . . . . . . . . . . . . . . . . . . . . . . . 3,076 — —
Net cash provided by changes in bank deposits . . . . . . . . . . . . . . . . . . . . . . . . — 3,164 2,185
Net cash provided by short-term debt issuances . . . . . . . . . . . . . . . . . . . . . . . — — 1,992
Long-term debt issued, net of issuance costs . . . . . . . . . . . . . . . . . . . . . . . . . 5,076 2,931 305
Collateral financing arrangements issued . . . . . . . . . . . . . . . . . . . . . . . . . . . . . — 105 310
Net cash received in connection with collateral financing arrangements . . . . . . . . . — 375 —
Junior subordinated debt securities issued . . . . . . . . . . . . . . . . . . . . . . . . . . . — 500 750
Common stock issued, net of issuance costs . . . . . . . . . . . . . . . . . . . . . . . . . 3,576 — 290
Common stock issued to settle stock forward contracts . . . . . . . . . . . . . . . . . . . — 1,035 —
Treasury stock issued in connection with common stock issuance, net of issuancecosts . . . . . . . . . . . . . . . . . . . . . . . . . . . . . . . . . . . . . . . . . . . . . . . . . . — — 1,936
Treasury stock issued to settle stock forward contracts . . . . . . . . . . . . . . . . . . . — — 1,035
Cash provided by other, net . . . . . . . . . . . . . . . . . . . . . . . . . . . . . . . . . . . . . — — 7
Cash provided by the effect of change in foreign currency exchange rates . . . . . . . — 108 —
Total sources . . . . . . . . . . . . . . . . . . . . . . . . . . . . . . . . . . . . . . . . . . . . . 24,281 12,021 33,157
62 MetLife, Inc.
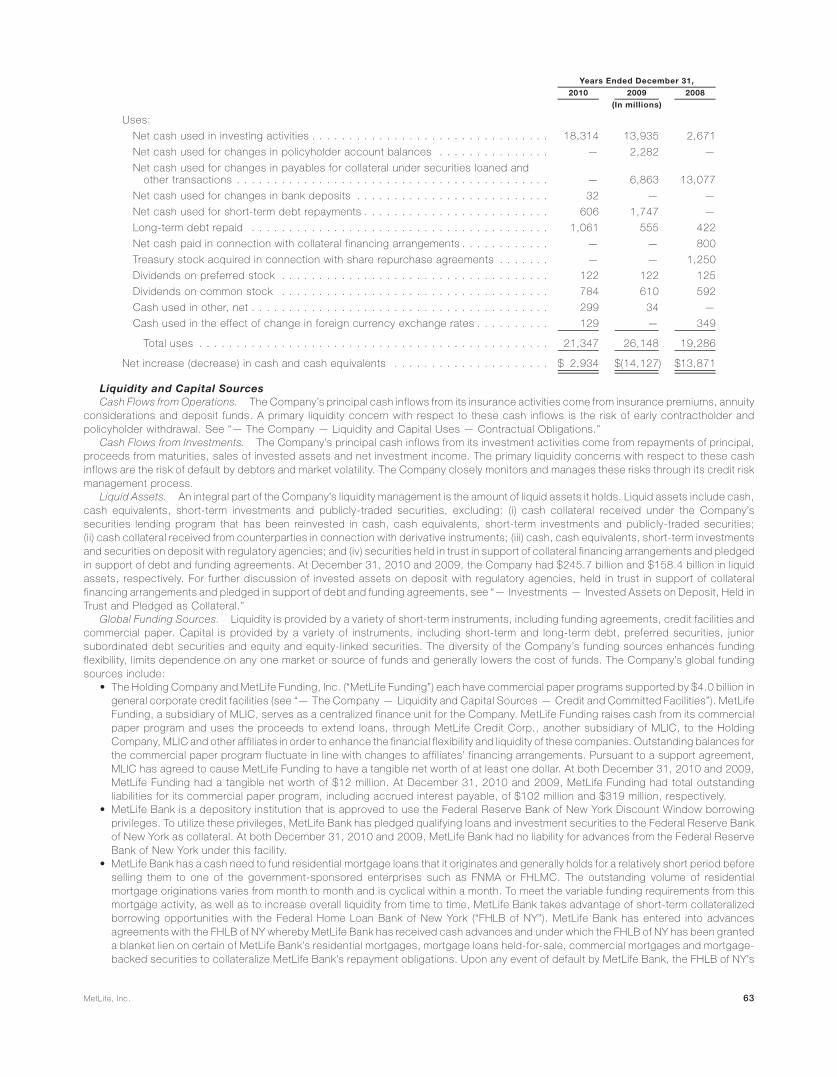
2010 2009 2008
Years Ended December 31,
(In millions)
Uses:
Net cash used in investing activities . . . . . . . . . . . . . . . . . . . . . . . . . . . . . . . . 18,314 13,935 2,671
Net cash used for changes in policyholder account balances . . . . . . . . . . . . . . . — 2,282 —
Net cash used for changes in payables for collateral under securities loaned andother transactions . . . . . . . . . . . . . . . . . . . . . . . . . . . . . . . . . . . . . . . . . . — 6,863 13,077
Net cash used for changes in bank deposits . . . . . . . . . . . . . . . . . . . . . . . . . . 32 — —
Net cash used for short-term debt repayments . . . . . . . . . . . . . . . . . . . . . . . . . 606 1,747 —
Long-term debt repaid . . . . . . . . . . . . . . . . . . . . . . . . . . . . . . . . . . . . . . . . 1,061 555 422
Net cash paid in connection with collateral financing arrangements . . . . . . . . . . . . — — 800
Treasury stock acquired in connection with share repurchase agreements . . . . . . . — — 1,250
Dividends on preferred stock . . . . . . . . . . . . . . . . . . . . . . . . . . . . . . . . . . . . 122 122 125
Dividends on common stock . . . . . . . . . . . . . . . . . . . . . . . . . . . . . . . . . . . . 784 610 592
Cash used in other, net . . . . . . . . . . . . . . . . . . . . . . . . . . . . . . . . . . . . . . . . 299 34 —
Cash used in the effect of change in foreign currency exchange rates . . . . . . . . . . 129 — 349
Total uses . . . . . . . . . . . . . . . . . . . . . . . . . . . . . . . . . . . . . . . . . . . . . . . 21,347 26,148 19,286
Net increase (decrease) in cash and cash equivalents . . . . . . . . . . . . . . . . . . . . . $ 2,934 $(14,127) $13,871
Liquidity and Capital SourcesCash Flows from Operations. The Company’s principal cash inflows from its insurance activities come from insurance premiums, annuity
considerations and deposit funds. A primary liquidity concern with respect to these cash inflows is the risk of early contractholder andpolicyholder withdrawal. See “— The Company — Liquidity and Capital Uses — Contractual Obligations.”
Cash Flows from Investments. The Company’s principal cash inflows from its investment activities come from repayments of principal,proceeds from maturities, sales of invested assets and net investment income. The primary liquidity concerns with respect to these cashinflows are the risk of default by debtors and market volatility. The Company closely monitors and manages these risks through its credit riskmanagement process.
Liquid Assets. An integral part of the Company’s liquidity management is the amount of liquid assets it holds. Liquid assets include cash,cash equivalents, short-term investments and publicly-traded securities, excluding: (i) cash collateral received under the Company’ssecurities lending program that has been reinvested in cash, cash equivalents, short-term investments and publicly-traded securities;(ii) cash collateral received from counterparties in connection with derivative instruments; (iii) cash, cash equivalents, short-term investmentsand securities on deposit with regulatory agencies; and (iv) securities held in trust in support of collateral financing arrangements and pledgedin support of debt and funding agreements. At December 31, 2010 and 2009, the Company had $245.7 billion and $158.4 billion in liquidassets, respectively. For further discussion of invested assets on deposit with regulatory agencies, held in trust in support of collateralfinancing arrangements and pledged in support of debt and funding agreements, see “— Investments — Invested Assets on Deposit, Held inTrust and Pledged as Collateral.”
Global Funding Sources. Liquidity is provided by a variety of short-term instruments, including funding agreements, credit facilities andcommercial paper. Capital is provided by a variety of instruments, including short-term and long-term debt, preferred securities, juniorsubordinated debt securities and equity and equity-linked securities. The diversity of the Company’s funding sources enhances fundingflexibility, limits dependence on any one market or source of funds and generally lowers the cost of funds. The Company’s global fundingsources include:
• The Holding Company and MetLife Funding, Inc. (“MetLife Funding”) each have commercial paper programs supported by $4.0 billion ingeneral corporate credit facilities (see “— The Company — Liquidity and Capital Sources — Credit and Committed Facilities”). MetLifeFunding, a subsidiary of MLIC, serves as a centralized finance unit for the Company. MetLife Funding raises cash from its commercialpaper program and uses the proceeds to extend loans, through MetLife Credit Corp., another subsidiary of MLIC, to the HoldingCompany, MLIC and other affiliates in order to enhance the financial flexibility and liquidity of these companies. Outstanding balances forthe commercial paper program fluctuate in line with changes to affiliates’ financing arrangements. Pursuant to a support agreement,MLIC has agreed to cause MetLife Funding to have a tangible net worth of at least one dollar. At both December 31, 2010 and 2009,MetLife Funding had a tangible net worth of $12 million. At December 31, 2010 and 2009, MetLife Funding had total outstandingliabilities for its commercial paper program, including accrued interest payable, of $102 million and $319 million, respectively.
• MetLife Bank is a depository institution that is approved to use the Federal Reserve Bank of New York Discount Window borrowingprivileges. To utilize these privileges, MetLife Bank has pledged qualifying loans and investment securities to the Federal Reserve Bankof New York as collateral. At both December 31, 2010 and 2009, MetLife Bank had no liability for advances from the Federal ReserveBank of New York under this facility.
• MetLife Bank has a cash need to fund residential mortgage loans that it originates and generally holds for a relatively short period beforeselling them to one of the government-sponsored enterprises such as FNMA or FHLMC. The outstanding volume of residentialmortgage originations varies from month to month and is cyclical within a month. To meet the variable funding requirements from thismortgage activity, as well as to increase overall liquidity from time to time, MetLife Bank takes advantage of short-term collateralizedborrowing opportunities with the Federal Home Loan Bank of New York (“FHLB of NY”). MetLife Bank has entered into advancesagreements with the FHLB of NY whereby MetLife Bank has received cash advances and under which the FHLB of NY has been granteda blanket lien on certain of MetLife Bank’s residential mortgages, mortgage loans held-for-sale, commercial mortgages and mortgage-backed securities to collateralize MetLife Bank’s repayment obligations. Upon any event of default by MetLife Bank, the FHLB of NY’s
63MetLife, Inc.

recovery is limited to the amount of MetLife Bank’s liability under the advances agreement. MetLife Bank has received advances from theFHLB of NY on both short- and long-term bases, with a total liability of $3.8 billion and $2.4 billion at December 31, 2010 and 2009,respectively.
• The Company also had obligations under funding agreements with the FHLB of NY of $12.6 billion and $13.7 billion at December 31,2010 and 2009, respectively, for MLIC, and with the Federal Home Loan Bank of Boston (“FHLB of Boston”) of $100 million and$326 million at December 31, 2010 and 2009, respectively, for MICC. See Note 8 of the Notes to the Consolidated FinancialStatements. In September 2010, MetLife Investors Insurance Company and General American Life Insurance Company, subsidiaries ofMetLife, Inc., each became a member of the Federal Home Loan Bank of Des Moines (“FHLB of Des Moines”), and each purchased$10 million of FHLB of Des Moines common stock. Membership in the FHLB of Des Moines provides an additional source of contingentliquidity for the Company. There were no funding agreements with the FHLB of Des Moines at December 31, 2010.
• The Company issues fixed and floating rate funding agreements, which are denominated in either U.S. dollars or foreign currencies, tocertain special purpose entities (“SPEs”) that have issued either debt securities or commercial paper for which payment of interest andprincipal is secured by such funding agreements. During the years ended December 31, 2010, 2009 and 2008, the Company issued$34.1 billion, $28.6 billion and $20.9 billion, respectively, and repaid $30.9 billion, $32.0 billion and $19.8 billion, respectively, of suchfunding agreements. At December 31, 2010 and 2009, funding agreements outstanding, which are included in policyholder accountbalances, were $27.2 billion and $23.3 billion, respectively.
• MLIC and MICC have each issued funding agreements to certain SPEs that have issued debt securities for which payment of interestand principal is secured by such funding agreements, and such debt securities are also guaranteed as to payment of interest andprincipal by the Federal Agricultural Mortgage Corporation, a federally chartered instrumentality of the U.S. The obligations under thesefunding agreements are secured by a pledge of certain eligible agricultural real estate mortgage loans and may, under certaincircumstances, be secured by other qualified collateral. The amount of the Company’s liability for funding agreements issued to suchSPEs was $2.8 billion and $2.5 billion at December 31, 2010 and 2009, respectively, which is included in policyholder accountbalances. The obligations under these funding agreements are collateralized by designated agricultural real estate mortgage loans withestimated fair values of $3.2 billion and $2.9 billion at December 31, 2010 and 2009, respectively.Outstanding Debt. The following table summarizes the outstanding debt of the Company at:
2010 2009
December 31,
(In millions)
Short-term debt . . . . . . . . . . . . . . . . . . . . . . . . . . . . . . . . . . . . . . . . . . . . . . . . . . . . . . $ 306 $ 912
Long-term debt(1) . . . . . . . . . . . . . . . . . . . . . . . . . . . . . . . . . . . . . . . . . . . . . . . . . . . . . $20,766 $13,156
Collateral financing arrangements . . . . . . . . . . . . . . . . . . . . . . . . . . . . . . . . . . . . . . . . . . . $ 5,297 $ 5,297
Junior subordinated debt securities . . . . . . . . . . . . . . . . . . . . . . . . . . . . . . . . . . . . . . . . . $ 3,191 $ 3,191
(1) Excludes $6,820 million at December 31, 2010 of long-term debt relating to CSEs.Debt Issuances and Other Borrowings. In connection with the financing of the Acquisition (see Note 2 of the Notes to the Consolidated
Financial Statements), in November 2010, MetLife, Inc. issued to ALICO Holdings $3,000 million in three series of debt securities (the“Series C Debt Securities,” the “Series D Debt Securities” and the “Series E Debt Securities,” and, together, the “Debt Securities”), whichconstitute a part of the MetLife, Inc. common equity units (the “Equity Units”) more fully described in Note 14 of the Notes to the ConsolidatedFinancial Statements. The Debt Securities are subject to remarketing, initially bear interest at 1.56%, 1.92% and 2.46%, respectively (anaverage rate of 1.98%), and carry initial maturity dates of June 15, 2023, June 15, 2024 and June 15, 2045, respectively. The interest rateswill be reset in connection with the successful remarketings of the Debt Securities. Prior to the first scheduled attempted remarketing of theSeries C Debt Securities, such Debt Securities will be divided into two tranches equal in principal amount with maturity dates of June 15, 2018and June 15, 2023. Prior to the first scheduled attempted remarketing of the Series E Debt Securities, such Debt Securities will be divided intotwo tranches equal in principal amount with maturity dates of June 15, 2018 and June 15, 2045.
In August 2010, in anticipation of the Acquisition, the Holding Company issued senior notes as follows:• $1,000 million senior notes due February 6, 2014, which bear interest at a fixed rate of 2.375%, payable semi-annually;• $1,000 million senior notes due February 8, 2021, which bear interest at a fixed rate of 4.75%, payable semi-annually;• $750 million senior notes due February 6, 2041, which bear interest at a fixed rate of 5.875%, payable semi-annually; and• $250 million floating rate senior notes due August 6, 2013, which bear interest at a rate equal to three-month LIBOR, reset quarterly, plus
1.25%, payable quarterly.In connection with these offerings, the Holding Company incurred $15 million of issuance costs which have been capitalized and included
in other assets. These costs are being amortized over the terms of the senior notes.In July 2009, the Holding Company issued $500 million of junior subordinated debt securities with a final maturity of August 2069. Interest
is payable semi-annually at a fixed rate of 10.75% up to, but not including, August 1, 2039, the scheduled redemption date. In the event thedebt securities are not redeemed on or before the scheduled redemption date, interest will accrue at an annual rate of 3-month LIBOR plus amargin equal to 7.548%, payable quarterly in arrears. In connection with the offering, the Holding Company incurred $5 million of issuancecosts which have been capitalized and included in other assets. These costs are being amortized over the term of the securities. See Note 13of the Notes to the Consolidated Financial Statements for a description of the terms of the junior subordinated debt securities.
In May 2009, the Holding Company issued $1.3 billion of senior notes due June 1, 2016. The notes bear interest at a fixed rate of 6.75%,payable semi-annually. In connection with the offering, the Holding Company incurred $6 million of issuance costs which have beencapitalized and included in other assets. These costs are being amortized over the term of the notes.
In March 2009, the Holding Company issued $397 million of floating rate senior notes due June 2012 under the FDIC’s Temporary LiquidityGuarantee Program. The notes bear interest at a rate equal to three-month LIBOR, reset quarterly, plus 0.32%. The notes are not redeemableprior to their maturity. In connection with the offering, the Holding Company incurred $15 million of issuance costs which have beencapitalized and included in other assets. These costs are being amortized over the term of the notes.
64 MetLife, Inc.

In February 2009, the Holding Company remarketed its existing $1.0 billion 4.91% Series B junior subordinated debt securities as7.717% senior debt securities, Series B, due 2019. In August 2008, the Holding Company remarketed its existing $1.0 billion 4.82% Series Ajunior subordinated debt securities as 6.817% senior debt securities, Series A, due 2018. Interest on both series of debt securities is payablesemi-annually. The Series A and Series B junior subordinated debt securities were originally issued in 2005 in connection with the commonequity units. See “— The Company — Liquidity and Capital Sources — Remarketing of Junior Subordinated Debt Securities and Settlementof Stock Purchase Contracts.”
In April 2008, MetLife Capital Trust X, a VIE consolidated by the Company, issued exchangeable surplus trust securities (the “2008Trust Securities”) with a face amount of $750 million. Interest on the 2008 Trust Securities or debt securities is payable semi-annually at a fixedrate of 9.25% up to, but not including, April 8, 2038, the scheduled redemption date. In the event the 2008 Trust Securities or debt securitiesare not redeemed on or before the scheduled redemption date, interest will accrue at an annual rate of 3-month LIBOR plus a margin equal to5.540%, payable quarterly in arrears. See Note 13 of the Notes to the Consolidated Financial Statements for a description of the terms ofthese debt securities.
Collateral Financing Arrangements. As described more fully in Note 12 of the Notes to the Consolidated Financial Statements:• In December 2007, the Holding Company, in connection with the collateral financing arrangement associated with MetLife Reinsurance
Company of Charleston’s (“MRC”) reinsurance of the closed block liabilities, entered into an agreement with the unaffiliated financialinstitution that referenced the $2.5 billion aggregate principal amount of 35-year surplus notes issued by MRC. Under the agreement,the Holding Company is entitled to the interest paid by MRC on the surplus notes of 3-month LIBOR plus 0.55% in exchange for thepayment of 3-month LIBOR plus 1.12%, payable quarterly on such amount as adjusted, as described below.Under this agreement, the Holding Company may also be required to pledge collateral or make payments to the unaffiliated financialinstitution related to any decline in the estimated fair value of the surplus notes. Any such payments would be accounted for as areceivable and included in other assets on the Company’s consolidated balance sheets and would not reduce the principal amountoutstanding of the surplus notes. Such payments would, however, reduce the amount of interest payments due from the HoldingCompany under the agreement. Any payment received from the unaffiliated financial institution would reduce the receivable by anamount equal to such payment and would also increase the amount of interest payments due from the Holding Company under theagreement. In addition, the unaffiliated financial institution may be required to pledge collateral to the Holding Company related to anyincrease in the estimated fair value of the surplus notes. During 2008, the Holding Company paid an aggregate of $800 million to theunaffiliated financial institution relating to declines in the estimated fair value of the surplus notes. The Holding Company did not receiveany payments from the unaffiliated financial institution during 2008. During 2009, on a net basis, the Holding Company received$375 million from the unaffiliated financial institution related to changes in the estimated fair value of the surplus notes. No paymentswere made or received by the Holding Company during 2010. Since the closing of the collateral financing arrangement in December2007, on a net basis, the Holding Company has paid $425 million to the unaffiliated financial institution related to changes in theestimated fair value of the surplus notes. In addition, at December 31, 2010, the Holding Company had pledged collateral with anestimated fair value of $49 million to the unaffiliated financial institution. At December 31, 2009, the Holding Company had no collateralpledged to the unaffiliated financial institution in connection with this agreement. The Holding Company may also be required to make apayment to the unaffiliated financial institution in connection with any early termination of this agreement.
• In May 2007, the Holding Company, in connection with the collateral financing arrangement associated with MetLife ReinsuranceCompany of South Carolina’s (“MRSC”) reinsurance of universal life secondary guarantees, entered into an agreement with anunaffiliated financial institution under which the Holding Company is entitled to the return on the investment portfolio held by trustsestablished in connection with this collateral financing arrangement in exchange for the payment of a stated rate of return to theunaffiliated financial institution of 3-month LIBOR plus 0.70%, payable quarterly. The collateral financing agreement may be extended byagreement of the Holding Company and the unaffiliated financial institution on each anniversary of the closing. The Holding Companymay also be required to make payments to the unaffiliated financial institution, for deposit into the trusts, related to any decline in theestimated fair value of the assets held by the trusts, as well as amounts outstanding upon maturity or early termination of the collateralfinancing arrangement. During 2010, no payments were made or received by the Holding Company. During 2009 and 2008, the HoldingCompany contributed $360 million and $320 million, respectively, as a result of declines in the estimated fair value of the assets in thetrusts. Cumulatively, since May 2007, the Holding Company has contributed a total of $680 million as a result of declines in theestimated fair value of the assets in the trusts, all of which was deposited into the trusts.In addition, the Holding Company may be required to pledge collateral to the unaffiliated financial institution under this agreement. AtDecember 31, 2010 and 2009, the Holding Company had pledged $63 million and $80 million under the agreement, respectively.
Remarketing of Junior Subordinated Debt Securities and Settlement of Stock Purchase Contracts. In February 2009, the HoldingCompany closed the successful remarketing of the Series B portion of the junior subordinated debt securities underlying the common equityunits. The Series B junior subordinated debt securities were modified as permitted by their terms to be 7.717% senior debt securities,Series B, due February 15, 2019. The Holding Company did not receive any proceeds from the remarketing. Most common equity unit holderschose to have their junior subordinated debt securities remarketed and used the remarketing proceeds to settle their payment obligationsunder the applicable stock purchase contract. For those common equity unit holders that elected not to participate in the remarketing andelected to use their own cash to satisfy the payment obligations under the stock purchase contract, the terms of the debt are the same as theremarketed debt. The subsequent settlement of the stock purchase contracts occurred on February 17, 2009, providing proceeds to theHolding Company of $1,035 million in exchange for shares of the Holding Company’s common stock. The Holding Company delivered24,343,154 shares of its newly issued common stock to settle the stock purchase contracts.
In August 2008, the Holding Company closed the successful remarketing of the Series A portion of the junior subordinated debt securitiesunderlying the common equity units. The Series A junior subordinated debt securities were modified as permitted by their terms to be6.817% senior debt securities, Series A, due August 15, 2018. The Holding Company did not receive any proceeds from the remarketing.Most common equity unit holders chose to have their junior subordinated debt securities remarketed and used the remarketing proceeds tosettle their payment obligations under the applicable stock purchase contract. For those common equity unit holders that elected not toparticipate in the remarketing and elected to use their own cash to satisfy the payment obligations under the stock purchase contract, theterms of the debt are the same as the remarketed debt. The initial settlement of the stock purchase contracts occurred on August 15, 2008,providing proceeds to the Holding Company of $1,035 million in exchange for shares of the Holding Company’s common stock. The Holding
65MetLife, Inc.

Company delivered 20,244,549 shares of its common stock held in treasury at a value of $1,064 million to settle the stock purchasecontracts.
Other. In March 2009, the Company sold Cova Corporation, the parent company of Texas Life Insurance Company, for $130 million incash consideration, excluding $1 million of transaction costs. The proceeds of the transaction were paid to the Holding Company.
Credit and Committed Facilities. The Company maintains unsecured credit facilities and committed facilities, which aggregated$4.0 billion and $12.4 billion, respectively, at December 31, 2010. When drawn upon, these facilities bear interest at varying rates inaccordance with the respective agreements.
The unsecured credit facilities are used for general corporate purposes, to support the borrowers’ commercial paper programs and for theissuance of letters of credit. At December 31, 2010, the Company had outstanding $1.5 billion in letters of credit and no drawdowns againstthese facilities. Remaining unused commitments were $2.5 billion at December 31, 2010.
The committed facilities are used for collateral for certain of the Company’s affiliated reinsurance liabilities. At December 31, 2010, theCompany had outstanding $5.4 billion in letters of credit and $2.8 billion in aggregate drawdowns against these facilities. Remaining unusedcommitments were $4.2 billion at December 31, 2010.
See Note 11 of the Notes to the Consolidated Financial Statements for further discussion of these facilities.We have no reason to believe that our lending counterparties will be unable to fulfill their respective contractual obligations under these
facilities. As commitments associated with letters of credit and financing arrangements may expire unused, these amounts do not necessarilyreflect the Company’s actual future cash funding requirements.
As a result of the successful offerings of certain senior notes and common stock in August 2010, the commitment letter for a $5.0 billionsenior credit facility, which the Holding Company signed to partially finance the Acquisition, was terminated. During March 2010, the HoldingCompany paid $28 million in fees related to this senior credit facility, all of which were expensed during the year ended December 31, 2010.
Covenants. Certain of the Company’s debt instruments, credit facilities and committed facilities contain various administrative,reporting, legal and financial covenants. The Company believes it was in compliance with all covenants at December 31, 2010 and 2009.
Preferred Stock. During the year ended December 31, 2010, the Holding Company did not issue any non-convertible preferred stock. InDecember 2008, the Holding Company entered into a replacement capital covenant (the “Replacement Capital Covenant”) whereby theCompany agreed for the benefit of holders of one or more series of the Company’s unsecured long-term indebtedness designated from timeto time by the Company in accordance with the terms of the Replacement Capital Covenant (“Covered Debt”), that the Company will not repay,redeem or purchase and will cause its subsidiaries not to repay, redeem or purchase, on or before the termination of the Replacement CapitalCovenant on December 31, 2018 (or earlier termination by agreement of the holders of Covered Debt or when there is no longer anyoutstanding series of unsecured long-term indebtedness which qualifies for designation as “Covered Debt”), the Floating Rate Non-Cumulative Preferred Stock, Series A, of the Holding Company or the 6.500% Non-Cumulative Preferred Stock, Series B, of the HoldingCompany, unless such repayment, redemption or purchase is made from the proceeds of the issuance of certain replacement capitalsecurities and pursuant to the other terms and conditions set forth in the Replacement Capital Covenant.
Convertible Preferred Stock. In November 2010, the Holding Company issued to ALICO Holdings in connection with the financing of theAcquisition 6,857,000 shares of Series B contingent convertible junior participating non-cumulative perpetual preferred stock (the “Con-vertible Preferred Stock”) convertible into approximately 68,570,000 shares (valued at $40.90 per share at the time of the Acquisition) of theHolding Company’s common stock (subject to anti-dilution adjustments) upon a favorable vote of the Holding Company’s commonstockholders. If a favorable vote of its common stockholders is not obtained by the first anniversary of the Acquisition Date, then theHolding Company must pay ALICO Holdings $300 million and use reasonable efforts to list the preferred stock on the New York StockExchange. Management considers the likelihood that the Holding Company will fail to obtain a vote of its common stockholders to be remote.
Common Stock. In November 2010, the Holding Company issued to ALICO Holdings in connection with the financing of the Acquisition78,239,712 new shares of its common stock at $40.90 per share. The aggregate amount of MetLife, Inc.’s common stock to be issued toALICO Holdings in connection with the transaction is expected to be 214.6 million to 231.5 million shares, consisting of the 78.2 millionshares issued at closing, 68.6 million shares to be issued upon conversion of the Convertible Preferred Stock (with the stockholder vote onsuch conversion to be held within one year after the closing) (together with $3.0 billion aggregate stated amount of Equity Units of MetLife,Inc., the “Securities”) and between 67.8 million and 84.7 million shares of common stock, in total, issuable upon settlement of the purchasecontracts forming part of the Equity Units (in three tranches approximately two, three and four years after the closing). The ownership of theSecurities is subject to an investor rights agreement, which grants to ALICO Holdings certain rights and sets forth certain agreements withrespect to ALICO Holdings’ ownership, voting and transfer of the Securities, including minimum holding periods, restrictions on the number ofshares ALICO Holdings can sell at one time, its agreement to vote the common stock in the same proportion as the common stock voted by allother stockholders, and its agreement not to seek control or influence the Company’s management or Board of Directors. ALICO Holdings hasindicated that it intends to monetize the Securities over time, subject to market conditions, following the lapse of agreed-upon minimumholding periods. See “— The Company — Liquidity and Capital Sources — Equity Units.”
In August 2010, the Holding Company issued 86,250,000 new shares of its common stock at a price of $42.00 per share for grossproceeds of $3,623 million. In connection with the offering of common stock, the Holding Company incurred $94 million of issuance costswhich have been recorded as a reduction of additional paid-in-capital.
In connection with the remarketing of the junior subordinated debt securities, in February 2009, the Holding Company delivered24,343,154 shares of its newly issued common stock, and in August 2008, the Holding Company delivered 20,244,549 shares of itscommon stock from treasury stock, to settle the stock purchase contracts. See “— The Company — Liquidity and Capital Sources —Remarketing of Junior Subordinated Debt Securities and Settlement of Stock Purchase Contracts.”
In October 2008, the Holding Company issued 86,250,000 shares of its common stock at a price of $26.50 per share for gross proceedsof $2.3 billion. Of these shares issued, 75,000,000 shares were issued from treasury stock, and 11,250,000 were newly issued shares.
During the years ended December 31, 2010, 2009 and 2008, 332,121 shares, 861,586 shares and 2,271,188 shares of common stockwere issued from treasury stock for $18 million, $46 million and $118 million, respectively, to satisfy various stock option exercises. During theyear ended December 31, 2010, 2,182,174 new shares of common stock were issued for $74 million to satisfy various stock optionexercises. During both the years ended December 31, 2009 and 2008, no new shares of common stock were issued to satisfy stock optionexercises.
66 MetLife, Inc.

Equity Units. In November 2010, the Holding Company issued to ALICO Holdings in connection with the financing of the Acquisition$3.0 billion aggregate stated amount of Equity Units. The Equity Units, which are mandatorily convertible securities, will initially consist of(i) purchase contracts obligating the holder to purchase a variable number of shares of MetLife, Inc.’s common stock on each of threespecified future settlement dates (expected to be approximately two, three and four years after closing of the Acquisition), for a fixed amountper purchase contract, (an aggregate of $1.0 billion on each settlement date) and (ii) an interest in each of three series of Debt Securities ofMetLife, Inc. The value of the purchase contracts at issuance of $247 million was calculated as the present value of the future contractpayments and was recorded in other liabilities. At future dates, the Series C, D and E Debt Securities will be subject to remarketing and sold toinvestors. Holders of the Equity Units who elect to include their Debt Securities in a remarketing can use the proceeds thereof to meet theirobligations under the purchase contracts.
See Note 14 of the Notes to the Consolidated Financial Statements for further discussion of the Equity Units.
Liquidity and Capital UsesAcquisitions. The computation of the purchase price of the Acquisition is presented below:
November 1, 2010
(In millions)
Cash (includes $396 million of contractual purchase price adjustments) . . . . . . . . . . . . . . . . . . . . . $ 7,196
MetLife, Inc.’s common stock (78,239,712 shares at $40.90 per share) . . . . . . . . . . . . . . . . . . . . . 3,200
MetLife, Inc.’s Convertible Preferred Stock . . . . . . . . . . . . . . . . . . . . . . . . . . . . . . . . . . . . . . . . 2,805
MetLife, Inc.’s Equity Units ($3.0 billion aggregate stated amount) . . . . . . . . . . . . . . . . . . . . . . . . . 3,189
Total purchase price . . . . . . . . . . . . . . . . . . . . . . . . . . . . . . . . . . . . . . . . . . . . . . . . . . . . . $16,390
Debt Repayments. During the years ended December 31, 2010, 2009 and 2008, MetLife Bank made repayments of $349 million,$497 million and $371 million, respectively, to the FHLB of NY related to long-term borrowings. During the years ended December 31, 2010,2009 and 2008, MetLife Bank made repayments to the FHLB of NY related to short-term borrowings of $12.9 billion, $26.4 billion and$4.6 billion, respectively. During the years ended December 31, 2009 and 2008, MetLife Bank made repayments related to short-termborrowings to the Federal Reserve Bank of New York of $21.2 billion and 650 million, respectively. No repayments were made to the FederalReserve Bank of New York during the year ended December 31, 2010. During the year ended December 31, 2009, MICC made repayments of$300 million to the FHLB of Boston related to short-term borrowings. No repayments were made to the FHLB of Boston during the years endedDecember 31, 2010 and 2008.
Debt Repurchases. We may from time to time seek to retire or purchase our outstanding debt through cash purchases and/or exchangesfor other securities, in open market purchases, privately negotiated transactions or otherwise. Any such repurchases or exchanges will bedependent upon several factors, including our liquidity requirements, contractual restrictions, general market conditions, and applicableregulatory, legal and accounting factors. Whether or not to repurchase any debt and the size and timing of any such repurchases will bedetermined in the Company’s discretion.
Insurance Liabilities. The Company’s principal cash outflows primarily relate to the liabilities associated with its various life insurance,property and casualty, annuity and group pension products, operating expenses and income tax, as well as principal and interest on itsoutstanding debt obligations. Liabilities arising from its insurance activities primarily relate to benefit payments under the aforementionedproducts, as well as payments for policy surrenders, withdrawals and loans. For annuity or deposit type products, surrender or lapse productbehavior differs somewhat by segment. In the Retirement Products segment, which includes individual annuities, lapses and surrenders tendto occur in the normal course of business. During the years ended December 31, 2010 and 2009, general account surrenders andwithdrawals from annuity products were $3.8 billion and $4.3 billion, respectively. In the Corporate Benefit Funding segment, which includespension closeouts, bank owned life insurance and other fixed annuity contracts, as well as funding agreements (including fundingagreements with the FHLB of NY and the FHLB of Boston) and other capital market products, most of the products offered have fixedmaturities or fairly predictable surrenders or withdrawals. With regard to Corporate Benefit Funding liabilities that provide customers withlimited liquidity rights, at December 31, 2010 there were $1,615 million of funding agreements and other capital market products that could beput back to the Company after a period of notice. Of these liabilities, $1,565 million were subject to notice periods between 15 and 90 days.The remainder of the balance was subject to a notice period of 9 months or greater. An additional $375 million of Corporate Benefit Fundingliabilities were subject to credit ratings downgrade triggers that permit early termination subject to a notice period of 90 days. See “— TheCompany — Liquidity and Capital Uses — Contractual Obligations.”
Dividends. The table below presents declaration, record and payment dates, as well as per share and aggregate dividend amounts, forthe common stock:
Declaration Date Record Date Payment Date Per Share Aggregate
Dividend
(In millions, except pershare data)
October 26, 2010 . . . . . . . . . . . . . . . . . . . . . . November 9, 2010 December 14, 2010 $0.74 $784(1)
October 29, 2009 . . . . . . . . . . . . . . . . . . . . . . November 9, 2009 December 14, 2009 $0.74 $610
October 28, 2008 . . . . . . . . . . . . . . . . . . . . . . November 10, 2008 December 15, 2008 $0.74 $592
(1) Includes dividends on Convertible Preferred Stock issued in November 2010. See “— The Company — Liquidity and Capital Sources —Convertible Preferred Stock.”Future common stock dividend decisions will be determined by the Holding Company’s Board of Directors after taking into consideration
factors such as the Company’s current earnings, expected medium- and long-term earnings, financial condition, regulatory capital position,and applicable governmental regulations and policies. Furthermore, the payment of dividends and other distributions to the Holding Companyby its insurance subsidiaries is regulated by insurance laws and regulations.
67MetLife, Inc.

Information on the declaration, record and payment dates, as well as per share and aggregate dividend amounts, for the HoldingCompany’s Floating Rate Non-Cumulative Preferred Stock, Series A and 6.500% Non-Cumulative Preferred Stock, Series B is as follows forthe years ended December 31, 2010, 2009 and 2008:
Declaration Date Record Date Payment DateSeries A
Per ShareSeries A
AggregateSeries B
per ShareSeries B
Aggregate
Dividend
(In millions, except per share data)
November 15, 2010 . . . . . . . . . . November 30, 2010 December 15, 2010 $0.2527777 $ 7 $0.4062500 $24
August 16, 2010 . . . . . . . . . . . . August 31, 2010 September 15, 2010 $0.2555555 6 $0.4062500 24
May 17, 2010 . . . . . . . . . . . . . . May 31, 2010 June 15, 2010 $0.2555555 7 $0.4062500 24
March 5, 2010 . . . . . . . . . . . . . February 28, 2010 March 15, 2010 $0.2500000 6 $0.4062500 24
$26 $96
November 16, 2009 . . . . . . . . . . November 30, 2009 December 15, 2009 $0.2527777 $ 7 $0.4062500 $24
August 17, 2009 . . . . . . . . . . . . August 31, 2009 September 15, 2009 $0.2555555 6 $0.4062500 24
May 15, 2009 . . . . . . . . . . . . . . May 31, 2009 June 15, 2009 $0.2555555 7 $0.4062500 24
March 5, 2009 . . . . . . . . . . . . . February 28, 2009 March 16, 2009 $0.2500000 6 $0.4062500 24
$26 $96
November 17, 2008 . . . . . . . . . . November 30, 2008 December 15, 2008 $0.2527777 $ 7 $0.4062500 $24
August 15, 2008 . . . . . . . . . . . . August 31, 2008 September 15, 2008 $0.2555555 6 $0.4062500 24
May 15, 2008 . . . . . . . . . . . . . . May 31, 2008 June 16, 2008 $0.2555555 7 $0.4062500 24
March 5, 2008 . . . . . . . . . . . . . February 29, 2008 March 17, 2008 $0.3785745 9 $0.4062500 24
$29 $96
Share Repurchases. At January 1, 2008, the Company had $511 million remaining under its common stock repurchase programauthorizations. In both January and April 2008, the Company’s Board of Directors authorized $1.0 billion common stock repurchaseprograms. During the year ended December 31, 2008, the Company repurchased 19,716,418 shares for $1.2 billion under acceleratedshare repurchases and 1,550,000 shares for $88 million in open market repurchases. At December 31, 2008, the Company had $1.3 billionremaining under its common stock repurchase program authorizations. During the years ended December 31, 2010 and 2009, the Companydid not repurchase any shares.
Under these common stock repurchase program authorizations, the Holding Company may purchase its common stock from the MetLifePolicyholder Trust, in the open market (including pursuant to the terms of a pre-set trading plan meeting the requirements of Rule 10b5-1under the Securities Exchange Act of 1934, as amended (the “Exchange Act”) and in privately negotiated transactions. Any future commonstock repurchases will be dependent upon several factors, including the Company’s capital position, its liquidity, its financial strength andcredit ratings, general market conditions and the price of MetLife, Inc.’s common stock compared to management’s assessment of thestock’s underlying value and applicable regulatory, legal and accounting factors. Whether or not to purchase any common stock and the sizeand timing of any such purchases will be determined in the Company’s complete discretion.
Residential Mortgage Loans Held-for-Sale. At December 31, 2010, the Company held $3,321 million in residential mortgage loansheld-for-sale, compared with $2,728 million at December 31, 2009, an increase of $593 million. From time to time, MetLife Bank has anincreased cash need to fund mortgage loans that it generally holds for a relatively short period before selling them to one of the government-sponsored enterprises such as FNMA or FHLMC. To meet these increased funding requirements, as well as to increase overall liquidity,MetLife Bank takes advantage of collateralized borrowing opportunities with the Federal Reserve Bank of New York and the FHLB of NY. Forfurther detail on MetLife Bank’s use of these funding sources, see “— The Company — Liquidity and Capital Sources — Global FundingSources.”
Investment and Other. Additional cash outflows include those related to obligations of securities lending activities, investments in realestate, limited partnerships and joint ventures, as well as litigation-related liabilities. Also, the Company pledges collateral to, and hascollateral pledged to it by, counterparties under the Company’s current derivative transactions. With respect to derivative transactions withcredit ratings downgrade triggers, a two-notch downgrade would have increased the Company’s derivative collateral requirements by$159 million at December 31, 2010. In addition, the Company has pledged collateral and has had collateral pledged to it, and may be requiredfrom time to time to pledge additional collateral or be entitled to have additional collateral pledged to it, in connection with collateral financingarrangements related to the reinsurance of closed block liabilities and universal life secondary guarantee liabilities. See “— The Company —Liquidity and Capital Sources — Collateral Financing Arrangements.”
Securities Lending. The Company participates in a securities lending program whereby blocks of securities, which are included in fixedmaturity securities and short-term investments, are loaned to third parties, primarily brokerage firms and commercial banks, and the Companyreceives cash collateral from the borrower, which must be returned to the borrower when the loaned securities are returned to the Company.Under the Company’s securities lending program, the Company was liable for cash collateral under its control of $24.6 billion and $21.5 billionat December 31, 2010 and 2009, respectively. Of these amounts, $2.8 billion and $3.3 billion at December 31, 2010 and 2009, respectively,were on open terms, meaning that the related loaned security could be returned to the Company on the next business day upon return of cashcollateral. Of the $2.7 billion of estimated fair value of the securities related to the cash collateral on open terms at December 31, 2010,$2.3 billion were U.S. Treasury, agency and government guaranteed securities which, if put to the Company, can be immediately sold tosatisfy the cash requirements. See “— Investments — Securities Lending” for further information.
Other. In September 2008, in connection with the split-off of Reinsurance Group of America (“RGA”) as described in Note 2 of the Notesto the Consolidated Financial Statements, the Company received from MetLife stockholders 23,093,689 shares of MetLife, Inc.’s common
68 MetLife, Inc.

stock with a market value of $1.3 billion and, in exchange, delivered 29,243,539 shares of RGA Class B common stock with a net book valueof $1.7 billion resulting in a loss on disposition, including transaction costs, of $458 million.
Contractual Obligations. The following table summarizes the Company’s major contractual obligations at December 31, 2010:
Contractual Obligations TotalOne Yearor Less
More ThanOne Year toThree Years
More ThanThree Years
to Five YearsMore ThanFive Years
(In millions)
Future policy benefits . . . . . . . . . . . . . . . . . . . . . . $319,565 $ 6,271 $10,295 $12,205 $290,794
Policyholder account balances . . . . . . . . . . . . . . . . 289,823 35,981 46,274 35,280 172,288
Other policyholder liabilities . . . . . . . . . . . . . . . . . . 9,983 7,995 485 124 1,379
Payables for collateral under securities loaned andother transactions . . . . . . . . . . . . . . . . . . . . . . . 27,272 27,272 — — —
Bank deposits . . . . . . . . . . . . . . . . . . . . . . . . . . . 10,406 8,879 1,499 28 —
Short-term debt . . . . . . . . . . . . . . . . . . . . . . . . . . 306 306 — — —
Long-term debt . . . . . . . . . . . . . . . . . . . . . . . . . . 31,184 2,340 4,773 5,932 18,139
Collateral financing arrangements . . . . . . . . . . . . . . 6,696 64 127 127 6,378
Junior subordinated debt securities . . . . . . . . . . . . . 10,191 258 517 516 8,900
Commitments to lend funds . . . . . . . . . . . . . . . . . . 12,537 11,215 710 55 557
Operating leases . . . . . . . . . . . . . . . . . . . . . . . . . 2,151 366 517 303 965
Other . . . . . . . . . . . . . . . . . . . . . . . . . . . . . . . . . 15,356 14,873 52 3 428
Total . . . . . . . . . . . . . . . . . . . . . . . . . . . . . . . . $735,470 $115,820 $65,249 $54,573 $499,828
Future policy benefits — Future policy benefits include liabilities related to traditional whole life policies, term life policies, pensioncloseout and other group annuity contracts, structured settlements, master terminal funding agreements, single premium immediateannuities, long-term disability policies, individual disability income policies, LTC policies and property and casualty contracts. Includedwithin future policy benefits are contracts where the Company is currently making payments and will continue to do so until the occurrence of aspecific event such as death, as well as those where the timing of a portion of the payments has been determined by the contract. Alsoincluded are contracts where the Company is not currently making payments and will not make payments until the occurrence of an insurableevent, such as death or illness, or where the occurrence of the payment triggering event, such as a surrender of a policy or contract, is outsidethe control of the Company. The Company has estimated the timing of the cash flows related to these contracts based on historicalexperience, as well as its expectation of future payment patterns.
Liabilities related to accounting conventions, or which are not contractually due, such as shadow liabilities, excess interest reserves andproperty and casualty loss adjustment expenses, of $1.4 billion have been excluded from amounts presented in the table above.
Amounts presented in the table above, excluding those related to property and casualty contracts, represent the estimated cashpayments for benefits under such contracts including assumptions related to the receipt of future premiums and assumptions related tomortality, morbidity, policy lapse, renewal, retirement, inflation, disability incidence, disability terminations, policy loans and other contingentevents as appropriate to the respective product type. Payments for case reserve liabilities and incurred but not reported liabilities associatedwith property and casualty contracts of $1.5 billion have been included using an estimate of the ultimate amount to be settled under thepolicies based upon historical payment patterns. The ultimate amount to be paid under property and casualty contracts is not determined untilthe Company reaches a settlement with the claimant, which may vary significantly from the liability or contractual obligation presented aboveespecially as it relates to incurred but not reported liabilities. All estimated cash payments presented in the table above are undiscounted as tointerest, net of estimated future premiums on policies currently in-force and gross of any reinsurance recoverable. The more than five yearscategory includes estimated payments due for periods extending for more than 100 years from the present date.
The sum of the estimated cash flows shown for all years in the table of $319.6 billion exceeds the liability amount of $173.4 billion includedon the consolidated balance sheet principally due to the time value of money, which accounts for at least 80% of the difference, as well asdifferences in assumptions, most significantly mortality, between the date the liabilities were initially established and the current date.
For the majority of the Company’s insurance operations, estimated contractual obligations for future policy benefits and policyholderaccount balance liabilities as presented in the table above are derived from the annual asset adequacy analysis used to develop actuarialopinions of statutory reserve adequacy for state regulatory purposes. These cash flows are materially representative of the cash flows underGAAP. (See “— Policyholder account balances” below.)
Actual cash payments to policyholders may differ significantly from the liabilities as presented in the consolidated balance sheet and theestimated cash payments as presented in the table above due to differences between actual experience and the assumptions used in theestablishment of these liabilities and the estimation of these cash payments.
Policyholder account balances — Policyholder account balances include liabilities related to conventional guaranteed interest contracts,guaranteed interest contracts associated with formal offering programs, funding agreements, individual and group annuities, total controlaccounts, individual and group universal life, variable universal life and company-owned life insurance.
Included within policyholder account balances are contracts where the amount and timing of the payment is essentially fixed anddeterminable. These amounts relate to policies where the Company is currently making payments and will continue to do so, as well as thosewhere the timing of the payments has been determined by the contract. Other contracts involve payment obligations where the timing of futurepayments is uncertain and where the Company is not currently making payments and will not make payments until the occurrence of aninsurable event, such as death, or where the occurrence of the payment triggering event, such as a surrender of or partial withdrawal on apolicy or deposit contract, is outside the control of the Company. The Company has estimated the timing of the cash flows related to thesecontracts based on historical experience, as well as its expectation of future payment patterns.
69MetLife, Inc.

Excess interest reserves representing purchase accounting adjustments of $539 million, as well as $2.4 billion relating to embeddedderivatives, have been excluded from amounts presented in the table above as they represent accounting conventions and not contractualobligations.
Amounts presented in the table above represent the estimated cash payments to be made to policyholders undiscounted as to interestand including assumptions related to the receipt of future premiums and deposits; withdrawals, including unscheduled or partial withdrawals;policy lapses; surrender charges; annuitization; mortality; future interest credited; policy loans and other contingent events as appropriate tothe respective product type. Such estimated cash payments are also presented net of estimated future premiums on policies currently in-force and gross of any reinsurance recoverable. For obligations denominated in foreign currencies, cash payments have been estimatedusing current spot rates.
The sum of the estimated cash flows shown for all years in the table of $289.8 billion exceeds the liability amount of $211.0 billion includedon the consolidated balance sheet principally due to the time value of money, which accounts for at least 80% of the difference, as well asdifferences in assumptions between the date the liabilities were initially established and the current date. See the comments under “— Futurepolicy benefits” above regarding the source and uncertainties associated with the estimation of the contractual obligations related to futurepolicyholder benefits and policyholder account balances.
Other policyholder liabilities — Other policyholder liabilities are comprised of other policy-related balances, policyholder dividendspayable and the policyholder dividend obligation. Amounts included in the table above related to these balances are as follows:
a. Other policy-related balances includes liabilities for incurred but not reported claims and claims payable on group term life, long-termdisability, long-term care and dental; policyholder dividends left on deposit and policyholder dividends due and unpaid related primarilyto traditional life and group life and health; and premiums received in advance. Liabilities related to unearned revenue and negativeVOBA of $2.2 billion and $4.3 billion, respectively, have been excluded from the cash payments presented in the table above becausethey reflect accounting conventions and not contractual obligations. With the exception of policyholder dividends left on deposit, andthose items excluded as noted in the preceding sentence, the contractual obligation presented in the table above related to otherpolicy-related balances is equal to the liability reflected in the consolidated balance sheet. Such amounts are reported in the one yearor less category due to the short-term nature of the liabilities. Contractual obligations on policyholder dividends left on deposit areprojected based on assumptions of policyholder withdrawal activity.
b. Policyholder dividends payable consists of liabilities related to dividends payable in the following calendar year on participatingpolicies. As such, the contractual obligation related to policyholder dividends payable is presented in the table above in the one year orless category at the amount of the liability presented in the consolidated balance sheet.
c. The nature of the policyholder dividend obligation is described in Note 18 of the Notes to the Consolidated Financial Statements.Because the exact timing and amount of the ultimate policyholder dividend obligation is subject to significant uncertainty and theamount of the policyholder dividend obligation is based upon a long-term projection of the performance of the closed block, we havereflected the obligation at the amount of the liability, if any, presented in the consolidated balance sheet in the more than five yearscategory. This was presented to reflect the long-duration of the liability and the uncertainty of the ultimate cash payment.
Payables for collateral under securities loaned and other transactions — The Company has accepted cash collateral in connection withsecurities lending and derivative transactions. As the securities lending transactions expire within the next year or the timing of the return of thecollateral is uncertain, the return of the collateral has been included in the one year or less category in the table above. The Company alsoholds non-cash collateral, which is not reflected as a liability in the consolidated balance sheet, of $984 million at December 31, 2010.
Bank deposits — Bank deposits of $10.4 billion exceed the amount on the balance sheet of $10.3 billion due to the inclusion of estimatedinterest payments. Liquid deposits, including demand deposit accounts, money market accounts and savings accounts, are assumed tomature at carrying value within one year. Certificates of deposit are assumed to pay all interest and principal at maturity.
Short-term debt, long-term debt, collateral financing arrangements and junior subordinated debt securities — Amounts presented in thetable above for short-term debt, long-term debt, collateral financing arrangements and junior subordinated debt securities differ from thebalances presented on the consolidated balance sheet as the amounts presented in the table above do not include premiums or discountsupon issuance or purchase accounting fair value adjustments. The amounts presented above also include interest on such obligations asdescribed below.
Short-term debt consists of borrowings with original maturities of one year or less carrying fixed interest rates. The contractual obligationfor short-term debt presented in the table above represents the principal amounts due upon maturity plus the related interest for the periodfrom January 1, 2011 through maturity.
Long-term debt bears interest at fixed and variable interest rates through their respective maturity dates. Interest on fixed rate debt wascomputed using the stated rate on the obligations for the period from January 1, 2011 through maturity. Interest on variable rate debt wascomputed using prevailing rates at December 31, 2010 and, as such, does not consider the impact of future rate movements. Long-term debtalso includes payments under capital lease obligations of $3 million, $2 million, $0 and $27 million, in the one year or less, more than one yearto three years, more than three years to five years and more than five years categories, respectively. Long-term debt presented in the tableabove excludes $6,820 million at December 31, 2010 of long-term debt relating to CSEs.
Collateral financing arrangements bear interest at fixed and variable interest rates through their respective maturity dates. Interest on fixedrate debt was computed using the stated rate on the obligations for the period from January 1, 2011 through maturity. Interest on variable ratedebt was computed using prevailing rates at December 31, 2010 and, as such, does not consider the impact of future rate movements.Pursuant to these collateral financing arrangements, the Holding Company may be required to deliver cash or pledge collateral to therespective unaffiliated financial institutions. See “— The Company — Liquidity and Capital Sources — Collateral Financing Arrangements.”
Junior subordinated debt securities bear interest at fixed interest rates through their respective redemption dates. Interest was computedusing the stated rates on the obligations for the period from January 1, 2011 through the scheduled redemption dates as it is the Company’sexpectation that the debt will be redeemed at that time. Inclusion of interest payments on junior subordinated debt through the final maturitydates would increase the contractual obligation by $7.7 billion.
Commitments to lend funds — The Company commits to lend funds under mortgage loans, partnerships, bank credit facilities, bridgeloans and private corporate bond investments. In the table above, the timing of the funding of mortgage loans and private corporate bondinvestments is based on the expiration date of the commitment. As it relates to commitments to lend funds to partnerships and under bankcredit facilities, the Company anticipates that these amounts could be invested any time over the next five years; however, as the timing of the
70 MetLife, Inc.
fulfillment of the obligation cannot be predicted, such obligations are presented in the one year or less category in the table above.Commitments to fund bridge loans are short-term obligations and, as a result, are presented in the one year or less category in the tableabove. See “— Off-Balance Sheet Arrangements.”
Operating leases — As a lessee, the Company has various operating leases, primarily for office space. Contractual provisions exist thatcould increase or accelerate those lease obligations presented, including various leases with early buyouts and/or escalation clauses.However, the impact of any such transactions would not be material to the Company’s financial position or results of operations. See “— Off-Balance Sheet Arrangements.”
Other — Includes other miscellaneous contractual obligations of $32 million not included elsewhere in the table above. Other liabilitiespresented in the table above are principally comprised of amounts due under reinsurance arrangements, payables related to securitiespurchased but not yet settled, securities sold short, accrued interest on debt obligations, estimated fair value of derivative obligations,deferred compensation arrangements, guaranty liabilities, the estimated fair value of forward stock purchase contracts, as well as generalaccruals and accounts payable due under contractual obligations. If the timing of any of the other liabilities is sufficiently uncertain, theamounts are included within the one year or less category.
The other liabilities presented in the table above differ from the amount presented in the consolidated balance sheet by $5.0 billion dueprimarily to the exclusion of items such as legal liabilities, pension and postretirement benefit obligations, taxes due other than income tax,unrecognized tax benefits and related accrued interest, accrued severance and employee incentive compensation and other liabilities suchas deferred gains and losses. Such items have been excluded from the table above as they represent accounting conventions or are notliabilities due under contractual obligations.
The net funded status of the Company’s pension and other postretirement liabilities included within other liabilities has been excluded fromthe amounts presented in the table above. Rather, the amounts presented represent the discretionary contributions of $175 million to bemade by the Company to our pension plan in 2011 and the discretionary contributions of $120 million, based on the current year’s expectedgross benefit payments to participants, to be made by the Company to the postretirement benefit plans during 2011. Virtually all contributionsto the pension and postretirement benefit plans are made by the insurance subsidiaries of the Holding Company with little impact on theHolding Company’s cash flows.
Excluded from the table above are unrecognized tax benefits and related accrued interest of $810 million and $221 million, respectively,for which the Company cannot reliably determine the timing of payment. Current income tax payable is also excluded from the table.
See also “— Off-Balance Sheet Arrangements.”Separate account liabilities are excluded from the table above. Generally, the separate account owner, rather than the Company, bears the
investment risk of these funds. The separate account assets are legally segregated and are not subject to the claims that arise out of any otherbusiness of the Company. Net deposits, net investment income and realized and unrealized capital gains and losses on the separateaccounts are fully offset by corresponding amounts credited to contractholders whose liability is reflected with the separate accountliabilities. Separate account liabilities are fully funded by cash flows from the separate account assets and are set equal to the estimated fairvalue of separate account assets.
The Company also enters into agreements to purchase goods and services in the normal course of business; however, these purchaseobligations were not material to its consolidated results of operations or financial position at December 31, 2010.
Additionally, the Company has agreements in place for services it conducts, generally at cost, between subsidiaries relating to insurance,reinsurance, loans and capitalization. Intercompany transactions have appropriately been eliminated in consolidation. Intercompany trans-actions among insurance subsidiaries and affiliates have been approved by the appropriate departments of insurance as required.
Support Agreements. The Holding Company and several of its subsidiaries (each, an “Obligor”) are parties to various capital supportcommitments, guarantees and contingent reinsurance agreements with certain subsidiaries of the Holding Company and a corporation inwhich the Holding Company owns 50% of the equity. Under these arrangements, each Obligor, with respect to the applicable entity, hasagreed to cause such entity to meet specified capital and surplus levels, has guaranteed certain contractual obligations or has agreed toprovide, upon the occurrence of certain contingencies, reinsurance for such entity’s insurance liabilities. We anticipate that in the event thatthese arrangements place demands upon the Company, there will be sufficient liquidity and capital to enable the Company to meetanticipated demands. See “— The Holding Company — Liquidity and Capital Uses — Support Agreements.”
Litigation. Putative or certified class action litigation and other litigation, and claims and assessments against the Company, in addition tothose discussed elsewhere herein and those otherwise provided for in the Company’s consolidated financial statements, have arisen in thecourse of the Company’s business, including, but not limited to, in connection with its activities as an insurer, mortgage lending bank,employer, investor, investment advisor and taxpayer. Further, state insurance regulatory authorities and other federal and state authoritiesregularly make inquiries and conduct investigations concerning the Company’s compliance with applicable insurance and other laws andregulations.
It is not possible to predict or determine the ultimate outcome of all pending investigations and legal proceedings. In some of the mattersreferred to herein, very large and/or indeterminate amounts, including punitive and treble damages, are sought. Although in light of theseconsiderations, it is possible that an adverse outcome in certain cases could have a material adverse effect upon the Company’s financialposition, based on information currently known by the Company’s management, in its opinion, the outcome of such pending investigationsand legal proceedings are not likely to have such an effect. However, given the large and/or indeterminate amounts sought in certain of thesematters and the inherent unpredictability of litigation, it is possible that an adverse outcome in certain matters could, from time to time, have amaterial adverse effect on the Company’s consolidated net income or cash flows in particular quarterly or annual periods.
The Holding Company
CapitalRestrictions and Limitations on Bank Holding Companies and Financial Holding Companies. The Holding Company and its insured
depository institution subsidiary, MetLife Bank, are subject to risk-based and leverage capital guidelines issued by the federal bankingregulatory agencies for banks and bank and financial holding companies. The federal banking regulatory agencies are required by law to takespecific prompt corrective actions with respect to institutions that do not meet minimum capital standards. As of their most recently filedreports with the federal banking regulatory agencies, the Holding Company and MetLife Bank met the minimum capital standards as perfederal banking regulatory agencies with all of MetLife Bank’s risk-based and leverage capital ratios meeting the federal banking regulatory
71MetLife, Inc.

agencies “well capitalized” standards and all of the Holding Company’s risk-based and leverage capital ratios meeting the “adequatelycapitalized” standards. In addition to requirements which may be imposed in connection with the implementation of Dodd-Frank, if endorsedand adopted in the U.S., Basel III will also lead to increased capital and liquidity requirements for bank holding companies, such as MetLife,Inc. See “— Industry Trends — Financial and Economic Environment— Regulatory Changes.”
The following table contains the RBC ratios and the regulatory requirements for MetLife, Inc., as a bank holding company, and MetLifeBank:
MetLife, Inc.RBC Ratios — Bank Holding Company
2010 2009
RegulatoryRequirements
Minimum
RegulatoryRequirements
“Well Capitalized”
December 31,
Total RBC Ratio . . . . . . . . . . . . . . . . . . . . . . . . . . . . . . . . . . . . . 8.52% 9.88% 8.00% 10.00%
Tier 1 RBC Ratio . . . . . . . . . . . . . . . . . . . . . . . . . . . . . . . . . . . . 8.21% 9.44% 4.00% 6.00%
Tier 1 Leverage Ratio . . . . . . . . . . . . . . . . . . . . . . . . . . . . . . . . . 5.11% 5.71% 4.00% n/aMetLife Bank
RBC Ratios — Bank
2010 2009
RegulatoryRequirements
Minimum
RegulatoryRequirements
“Well Capitalized”
December 31,
Total RBC Ratio . . . . . . . . . . . . . . . . . . . . . . . . . . . . . . . . . . . 15.00% 13.41% 8.00% 10.00%
Tier 1 RBC Ratio . . . . . . . . . . . . . . . . . . . . . . . . . . . . . . . . . . . 14.16% 12.16% 4.00% 6.00%
Tier 1 Leverage Ratio . . . . . . . . . . . . . . . . . . . . . . . . . . . . . . . . 7.14% 6.64% 4.00% 5.00%Summary of Primary Sources and Uses of Liquidity and Capital. For information regarding the primary sources and uses of Holding
Company liquidity and capital, see “— The Company — Capital — Summary of Primary Sources and Uses of Liquidity and Capital.”
Liquidity and CapitalLiquidity and capital are managed to preserve stable, reliable and cost-effective sources of cash to meet all current and future financial
obligations and are provided by a variety of sources, including a portfolio of liquid assets, a diversified mix of short- and long-term fundingsources from the wholesale financial markets and the ability to borrow through credit and committed credit facilities. The Holding Company isan active participant in the global financial markets through which it obtains a significant amount of funding. These markets, which serve ascost-effective sources of funds, are critical components of the Holding Company’s liquidity and capital management. Decisions to accessthese markets are based upon relative costs, prospective views of balance sheet growth and a targeted liquidity profile and capital structure.A disruption in the financial markets could limit the Holding Company’s access to liquidity.
The Holding Company’s ability to maintain regular access to competitively priced wholesale funds is fostered by its current credit ratingsfrom the major credit rating agencies. We view our capital ratios, credit quality, stable and diverse earnings streams, diversity of liquiditysources and our liquidity monitoring procedures as critical to retaining such credit ratings. See “— The Company — Capital — RatingAgencies.”
Liquidity is monitored through the use of internal liquidity risk metrics, including the composition and level of the liquid asset portfolio,timing differences in short-term cash flow obligations, access to the financial markets for capital and debt transactions and exposure tocontingent draws on the Holding Company’s liquidity.
Liquidity and Capital SourcesDividends from Subsidiaries. The Holding Company relies in part on dividends from its subsidiaries to meet its cash requirements. The
Holding Company’s insurance subsidiaries are subject to regulatory restrictions on the payment of dividends imposed by the regulators oftheir respective domiciles. The dividend limitation for U.S. insurance subsidiaries is generally based on the surplus to policyholders at the endof the immediately preceding calendar year and statutory net gain from operations for the immediately preceding calendar year. Statutoryaccounting practices, as prescribed by insurance regulators of various states in which the Company conducts business, differ in certainrespects from accounting principles used in financial statements prepared in conformity with GAAP. The significant differences relate to thetreatment of DAC, certain deferred income tax, required investment liabilities, statutory reserve calculation assumptions, goodwill and surplusnotes.
The table below sets forth the dividends permitted to be paid by the respective insurance subsidiary without insurance regulatory approvaland the respective dividends paid:
Company
Permittedw/o
Approval(1) Paid(2)
Permittedw/o
Approval(3) Paid(2)
Permittedw/o
Approval(3) Paid(2)
Permittedw/o
Approval(3)
2011 2010 2009 2008
(In millions)
Metropolitan Life Insurance Company . . . . . . . . . . . . . . . . . . $1,321 $631(4) $1,262 $ — $552 $1,318(5) $1,299American Life Insurance Company(6) . . . . . . . . . . . . . . . . . . . $ 661 $ — $ 511 N/A N/A N/A N/AMetLife Insurance Company of Connecticut . . . . . . . . . . . . . . $ 517 $330 $ 659 $ — $714 $ 500 $1,026Metropolitan Property and Casualty Insurance Company . . . . . . $ — $260 $ — $300 $ 9 $ 300 $ —Metropolitan Tower Life Insurance Company . . . . . . . . . . . . . . $ 80 $569(7) $ 93 $ — $ 88 $ 277(8) $ 113
(1) Reflects dividend amounts that may be paid during 2011 without prior regulatory approval. However, because dividend tests may bebased on dividends previously paid over rolling 12-month periods, if paid before a specified date during 2011, some or all of suchdividends may require regulatory approval.
(2) All amounts paid, including those requiring regulatory approval.(3) Reflects dividend amounts that could have been paid during the relevant year without prior regulatory approval.
72 MetLife, Inc.

(4) Includes securities transferred to the Holding Company of $399 million.(5) Consists of shares of RGA stock distributed by MLIC to the Holding Company as an in-kind dividend of $1,318 million.(6) Reflects dividends permitted to be paid and the respective dividends paid since the Acquisition Date. See Note 2 to the Notes to the
Consolidated Financial Statements.(7) Includes shares of an affiliate distributed to the Holding Company as an in-kind dividend of $475 million.(8) Includes shares of an affiliate distributed to the Holding Company as an in-kind dividend of $164 million.
In addition to the amounts presented in the table above, for the years ended December 31, 2010, 2009 and 2008, cash dividends in theaggregate amount of $0, $215 million and $235 million, respectively, were paid to the Holding Company.
The dividend capacity of non-U.S. operations is subject to similar restrictions established by the local regulators. The non-U.S. regulatoryregimes also commonly limit the dividend payments to the parent to a portion of the prior year’s statutory income, as determined by the localaccounting principles. The regulators of the non-U.S. operations, including the Japan branch of American Life, may also limit or not permitprofit repatriations or other transfers of funds to the U.S. if such transfers would be detrimental to the solvency or financial strength of theoperations of the non-U.S. operations, or for other reasons. Most of the non-U.S. subsidiaries are second tier subsidiaries and are not directlyowned by the Holding Company. The capital and rating considerations applicable to the first tier subsidiaries may also impact the dividendflow into the Holding Company.
The Company’s management actively manages its target and excess capital levels and dividend flows on a pro-active basis and forecastslocal capital positions as part of the financial planning cycle. The dividend capacity of certain U.S. and non-U.S. subsidiaries is also subject tobusiness targets in excess of the minimum capital necessary to maintain the desired rating or level of financial strength in the relevant market.Management of the Holding Company cannot provide assurances that the Holding Company’s subsidiaries will have statutory earnings tosupport payment of dividends to the Holding Company in an amount sufficient to fund its cash requirements and pay cash dividends and thatthe applicable regulators will not disapprove any dividends that such subsidiaries must submit for approval. See Note 18 of the Notes to theConsolidated Financial Statements.
Liquid Assets. An integral part of the Holding Company’s liquidity management is the amount of liquid assets it holds. Liquid assetsinclude cash, cash equivalents, short-term investments and publicly-traded securities, excluding: (i) cash collateral received under theCompany’s securities lending program that has been reinvested in cash, cash equivalents, short-term investments and publicly-tradedsecurities; and (ii) cash collateral received from counterparties in connection with derivative instruments. At December 31, 2010 and 2009,the Holding Company had $2.8 billion and $3.8 billion, respectively, in liquid assets. In addition, the Holding Company has pledged collateraland has had collateral pledged to it, and may be required from time to time to pledge additional collateral or be entitled to have additionalcollateral pledged to it. At December 31, 2010 and 2009, the Holding Company had pledged $362 million and $289 million, respectively, ofliquid assets under collateral support agreements.
Shelf Registration. In November 2010, the Holding Company filed a shelf registration statement (the “2010 Shelf Registration State-ment”) with the U.S. Securities and Exchange Commission (“SEC”), which was automatically effective upon filing, in accordance with SECrules. SEC rules also allow for pay-as-you-go fees and the ability to add securities by filing automatically effective amendments forcompanies, such as the Holding Company, which qualify as “Well-Known Seasoned Issuers.” The 2010 Shelf Registration Statementregistered an unlimited amount of debt and equity securities and replaces the shelf registration statement that the Holding Company filed inNovember 2007, which expired in the fourth quarter of 2010. The terms of any offering will be established at the time of the offering.
Global Funding Sources. Liquidity is also provided by a variety of short-term instruments, including commercial paper. Capital isprovided by a variety of instruments, including medium- and long-term debt, junior subordinated debt securities, collateral financingarrangements, capital securities and stockholders’ equity. The diversity of the Holding Company’s funding sources enhances fundingflexibility, limits dependence on any one source of funds and generally lowers the cost of funds. Other sources of the Holding Company’sliquidity include programs for short-and long-term borrowing, as needed.
We continuously monitor and adjust our liquidity and capital plans for the Holding Company and its subsidiaries in light of changingrequirements and market conditions.
Long-term Debt. The following table summarizes the outstanding long-term debt of the Holding Company at:
2010 2009
December 31,
(In millions)
Long-term debt — unaffiliated . . . . . . . . . . . . . . . . . . . . . . . . . . . . . . . . . . . . . . . . . . . . $16,258 $10,458
Long-term debt — affiliated . . . . . . . . . . . . . . . . . . . . . . . . . . . . . . . . . . . . . . . . . . . . . . $ 665(1) $ 500
Collateral financing arrangements . . . . . . . . . . . . . . . . . . . . . . . . . . . . . . . . . . . . . . . . . . $ 2,797 $ 2,797
Junior subordinated debt securities . . . . . . . . . . . . . . . . . . . . . . . . . . . . . . . . . . . . . . . . . $ 1,748 $ 1,748
(1) Includes $165 million of affiliated senior notes associated with bonds held by ALICO.Short-term Debt. MetLife, Inc. maintains a commercial paper program, proceeds of which can be used to finance the general liquidity
needs of MetLife, Inc. and its subsidiaries. The Holding Company had no short-term debt outstanding at both December 31, 2010 and 2009.There was no short-term debt activity in 2010. During the years ended December 31, 2009 and 2008, the weighted average interest rate onshort-term debt, comprised only of commercial paper, was 1.25% and 2.5%, respectively. During the year ended December 31, 2009, theaverage daily balance on short-term debt was $5 million, and the average days outstanding was 6 days.
Debt Issuances and Other Borrowings. For information on debt issuances and other borrowings entered into by the Holding Company,see “— The Company — Liquidity and Capital Sources — Debt Issuances and Other Borrowings.”
73MetLife, Inc.

Senior Notes. The following table summarizes the Holding Company’s outstanding senior notes series by maturity date, excluding anypremium or discount, at December 31, 2010:
Maturity Date Principal Interest Rate
(In millions)
2011 . . . . . . . . . . . . . . . . . . . . . . . . . . . . . . . . . . . . . . . . . . . . . . . . . $ 750 6.13%
2012 . . . . . . . . . . . . . . . . . . . . . . . . . . . . . . . . . . . . . . . . . . . . . . . . . $ 400 5.38%
2012 . . . . . . . . . . . . . . . . . . . . . . . . . . . . . . . . . . . . . . . . . . . . . . . . . $ 397 3-month LIBOR + .032%
2013 . . . . . . . . . . . . . . . . . . . . . . . . . . . . . . . . . . . . . . . . . . . . . . . . . $ 500 5.00%
2013 . . . . . . . . . . . . . . . . . . . . . . . . . . . . . . . . . . . . . . . . . . . . . . . . . $ 250 3-month LIBOR + 1.25%
2014 . . . . . . . . . . . . . . . . . . . . . . . . . . . . . . . . . . . . . . . . . . . . . . . . . $ 350 5.50%
2014 . . . . . . . . . . . . . . . . . . . . . . . . . . . . . . . . . . . . . . . . . . . . . . . . . $1,000 2.38%
2015 . . . . . . . . . . . . . . . . . . . . . . . . . . . . . . . . . . . . . . . . . . . . . . . . . $1,000 5.00%
2016 . . . . . . . . . . . . . . . . . . . . . . . . . . . . . . . . . . . . . . . . . . . . . . . . . $1,250 6.75%
2018 . . . . . . . . . . . . . . . . . . . . . . . . . . . . . . . . . . . . . . . . . . . . . . . . . $1,035 6.82%
2018(1) . . . . . . . . . . . . . . . . . . . . . . . . . . . . . . . . . . . . . . . . . . . . . . . . $ 500 1.56%
2018(2) . . . . . . . . . . . . . . . . . . . . . . . . . . . . . . . . . . . . . . . . . . . . . . . . $ 500 2.46%
2019 . . . . . . . . . . . . . . . . . . . . . . . . . . . . . . . . . . . . . . . . . . . . . . . . . $1,035 7.72%
2020 . . . . . . . . . . . . . . . . . . . . . . . . . . . . . . . . . . . . . . . . . . . . . . . . . $ 729 5.25%
2021 . . . . . . . . . . . . . . . . . . . . . . . . . . . . . . . . . . . . . . . . . . . . . . . . . $1,000 4.75%
2023(1) . . . . . . . . . . . . . . . . . . . . . . . . . . . . . . . . . . . . . . . . . . . . . . . . $ 500 1.56%
2024 . . . . . . . . . . . . . . . . . . . . . . . . . . . . . . . . . . . . . . . . . . . . . . . . . $1,000 1.92%
2024 . . . . . . . . . . . . . . . . . . . . . . . . . . . . . . . . . . . . . . . . . . . . . . . . . $ 673 5.38%
2032 . . . . . . . . . . . . . . . . . . . . . . . . . . . . . . . . . . . . . . . . . . . . . . . . . $ 600 6.50%
2033 . . . . . . . . . . . . . . . . . . . . . . . . . . . . . . . . . . . . . . . . . . . . . . . . . $ 200 5.88%
2034 . . . . . . . . . . . . . . . . . . . . . . . . . . . . . . . . . . . . . . . . . . . . . . . . . $ 750 6.38%
2035 . . . . . . . . . . . . . . . . . . . . . . . . . . . . . . . . . . . . . . . . . . . . . . . . . $1,000 5.70%
2041 . . . . . . . . . . . . . . . . . . . . . . . . . . . . . . . . . . . . . . . . . . . . . . . . . $ 750 5.88%
2045(2) . . . . . . . . . . . . . . . . . . . . . . . . . . . . . . . . . . . . . . . . . . . . . . . . $ 500 2.46%
(1) Represents one of two tranches comprising the Series C Debt Securities.(2) Represents one of two tranches comprising the Series E Debt Securities.
Collateral Financing Arrangements. For information on collateral financing arrangements entered into by the Holding Company, see“— The Company — Liquidity and Capital Sources — Collateral Financing Arrangements.”
Credit and Committed Facilities. At December 31, 2010, the Holding Company, along with MetLife Funding, maintained $4.0 billion inunsecured credit facilities, the proceeds of which are available to be used for general corporate purposes, to support the borrowers’commercial paper programs and for the issuance of letters of credit. At December 31, 2010, the Holding Company had outstanding$1.5 billion in letters of credit and no drawdowns against this facility. Remaining unused commitments were $2.5 billion at December 31,2010.
The Holding Company maintains committed facilities with a capacity of $300 million. At December 31, 2010, the Holding Company hadoutstanding $300 million in letters of credit and no drawdowns against these facilities. There were no remaining unused commitments atDecember 31, 2010. In addition, the Holding Company is a party to committed facilities of certain of its subsidiaries, which aggregated$12.1 billion at December 31, 2010. The committed facilities are used as collateral for certain of the Company’s affiliated reinsuranceliabilities.
See Note 11 of the Notes to the Consolidated Financial Statements for further detail on these facilities.Covenants. Certain of the Holding Company’s debt instruments, credit facilities and committed facilities contain various administrative,
reporting, legal and financial covenants. The Holding Company believes it was in compliance with all covenants at December 31, 2010 and2009.
Preferred Stock, Convertible Preferred Stock, Common Stock and Equity Units. For information on preferred stock, convertiblepreferred stock, common stock and common equity units issued by the Holding Company, see “— The Company — Liquidity and CapitalSources — Preferred Stock,” “— Convertible Preferred Stock,” “— Common Stock,” and “— Equity Units,” respectively.
Liquidity and Capital UsesThe primary uses of liquidity of the Holding Company include debt service, cash dividends on preferred, convertible preferred and
common stock, capital contributions to subsidiaries, payment of general operating expenses and acquisitions. Based on our analysis andcomparison of our current and future cash inflows from the dividends we receive from subsidiaries that are permitted to be paid without priorinsurance regulatory approval, our asset portfolio and other cash flows and anticipated access to the capital markets, we believe there will besufficient liquidity and capital to enable the Holding Company to make payments on debt, make cash dividend payments on its preferred,convertible preferred and common stock, contribute capital to its subsidiaries, pay all general operating expenses and meet its cash needs.
Acquisitions. For information regarding the purchase price of the Acquisition, see “— The Company — Liquidity and Capital Uses —Acquisitions.”
Affiliated Capital Transactions. During the years ended December 31, 2010, 2009 and 2008, the Holding Company invested anaggregate of $699 million (excludes the Acquisition), $986 million and $2.6 billion, respectively, in various subsidiaries.
74 MetLife, Inc.

The Holding Company lends funds, as necessary, to its subsidiaries, some of which are regulated, to meet their capital requirements.Such loans are included in loans to subsidiaries and consisted of the following at:
Subsidiaries Interest Rate Maturity Date 2010 2009
December 31,
(In millions)
Metropolitan Life Insurance Company . . . . . . . . 6-month LIBOR + 1.80% December 31, 2011 $ 775 $ 775
Metropolitan Life Insurance Company . . . . . . . . 6-month LIBOR + 1.80% December 31, 2011 — 300
Metropolitan Life Insurance Company . . . . . . . . 7.13% December 15, 2032 400 400
Metropolitan Life Insurance Company . . . . . . . . 7.13% January 15, 2033 100 100
Total . . . . . . . . . . . . . . . . . . . . . . . . . . . . $1,275 $1,575
Debt Repayments. The Holding Company intends to either repay all or refinance in whole or in part the debt that is due in December2011. See “— The Holding Company — Liquidity and Capital Sources — Senior Notes.”
Support Agreements. The Holding Company is party to various capital support commitments and guarantees with certain of itssubsidiaries and a corporation in which it owns 50% of the equity. Under these arrangements, the Holding Company has agreed to causeeach such entity to meet specified capital and surplus levels or has guaranteed certain contractual obligations.
In November 2010, the Holding Company guaranteed the obligations of Exeter Reassurance Company, Ltd. (“Exeter”) in an aggregateamount up to $1.0 billion, under a reinsurance agreement with MetLife Europe Limited (“MEL”), under which Exeter reinsures the guaranteedliving benefits and guaranteed death benefits associated with certain unit-linked annuity contracts issued by MEL.
In January 2010, the Holding Company guaranteed the obligations of its subsidiary, Missouri Reinsurance (Barbados) Inc. (“MoRe”), undera retrocession agreement with RGA Reinsurance (Barbados) Inc., pursuant to which MoRe retrocedes certain group term life insuranceissued by MLIC.
In December 2009, the Holding Company, in connection with MetLife Reinsurance Company of Vermont (“MRV”)’s reinsurance of certainuniversal life and term life insurance risks, committed to the Vermont Department of Banking, Insurance, Securities and Health CareAdministration to take necessary action to cause the third protected cell of MRV to maintain total adjusted capital equal to or greater than200% of such protected cell’s authorized control level RBC, as defined in state insurance statutes. See “— The Company — Liquidity andCapital Sources — Credit and Committed Facilities” and Note 11 of the Notes to the Consolidated Financial Statements.
The Holding Company, in connection with MRV’s reinsurance of certain universal life and term life insurance risks, committed to theVermont Department of Banking, Insurance, Securities and Health Care Administration to take necessary action to cause each of the two initialprotected cells of MRV to maintain total adjusted capital equal to or greater than 200% of such protected cell’s authorized control level RBC,as defined in state insurance statutes. See “— The Company — Liquidity and Capital Sources — Credit and Committed Facilities” andNote 11 of the Notes to the Consolidated Financial Statements.
The Holding Company, in connection with the collateral financing arrangement associated with MRC’s reinsurance of a portion of theliabilities associated with the closed block, committed to the South Carolina Department of Insurance to make capital contributions, ifnecessary, to MRC so that MRC may at all times maintain its total adjusted capital at a level of not less than 200% of the company actionlevel RBC, as defined in state insurance statutes as in effect on the date of determination or December 31, 2007, whichever calculationproduces the greater capital requirement, or as otherwise required by the South Carolina Department of Insurance. See “— The Company —Liquidity and Capital Sources — Debt Issuances and Other Borrowings” and Note 12 of the Notes to the Consolidated Financial Statements.
The Holding Company, in connection with the collateral financing arrangement associated with MRSC’s reinsurance of universal lifesecondary guarantees, committed to the South Carolina Department of Insurance to take necessary action to cause MRSC to maintain totaladjusted capital equal to the greater of $250,000 or 100% of MRSC’s authorized control level RBC, as defined in state insurance statutes. See“— The Company — Liquidity and Capital Sources — Debt Issuances and Other Borrowings” and Note 12 of the Notes to the ConsolidatedFinancial Statements.
The Holding Company has net worth maintenance agreements with two of its insurance subsidiaries, MetLife Investors InsuranceCompany and First MetLife Investors Insurance Company. Under these agreements, as subsequently amended, the Holding Companyagreed, without limitation as to the amount, to cause each of these subsidiaries to have a minimum capital and surplus of $10 million, totaladjusted capital at a level not less than 150% of the company action level RBC, as defined by state insurance statutes, and liquidity necessaryto enable it to meet its current obligations on a timely basis.
The Holding Company entered into a net worth maintenance agreement with Mitsui Sumitomo MetLife Insurance Company Limited (“MSIMetLife”), an investment in Japan of which the Holding Company owns 50% of the equity. Under the agreement, the Holding Company agreed,without limitation as to amount, to cause MSI MetLife to have the amount of capital and surplus necessary for MSI MetLife to maintain asolvency ratio of at least 400%, as calculated in accordance with the Insurance Business Law of Japan, and to make such loans to MSI MetLifeas may be necessary to ensure that MSI MetLife has sufficient cash or other liquid assets to meet its payment obligations as they fall due. Asdescribed in Note 2 of the Notes to the Consolidated Financial Statements, the Holding Company reached an agreement to sell its 50%interest in MSI MetLife to a third-party. Upon the close of such sale, the Holding Company’s obligations under the net worth maintenanceagreement will terminate.
The Holding Company has guaranteed the obligations of its subsidiary, Exeter, under a reinsurance agreement with MSI MetLife, underwhich Exeter reinsures variable annuity business written by MSI MetLife. This guarantee will remain in place until such time as the reinsuranceagreement between Exeter and MSI MetLife is terminated, notwithstanding any prior disposition of the Holding Company’s interest in MSIMetLife as described in Note 2 of the Notes to the Consolidated Financial Statements.
The Holding Company also guarantees the obligations of a number of its subsidiaries under credit facilities with third-party banks. SeeNote 11 of the Notes to the Consolidated Financial Statements.
Adoption of New Accounting PronouncementsSee “Adoption of New Accounting Pronouncements” in Note 1 of the Notes to the Consolidated Financial Statements.
75MetLife, Inc.
Future Adoption of New Accounting PronouncementsSee “Future Adoption of New Accounting Pronouncements” in Note 1 of the Notes to the Consolidated Financial Statements.
Subsequent Events
DividendsOn February 18, 2011, the Holding Company announced dividends of $0.2500000 per share, for a total of $6 million, on its Series A
preferred shares, and $0.4062500 per share, for a total of $24 million, on its Series B preferred shares, subject to the final confirmation that ithas met the financial tests specified in the Series A and Series B preferred shares, which the Company anticipates will be made on or aboutMarch 7, 2011. Both dividends will be payable March 15, 2011 to shareholders of record as of February 28, 2011.
Credit FacilityOn February 1, 2011, the Holding Company entered into a committed facility with a third-party bank to provide letters of credit for the
benefit of MoRe, a captive reinsurance subsidiary, to address its short-term solvency needs based on guidance from the regulator. This one-year facility provides for the issuance of letters of credit in amounts up to $350 million. Under the facility, a letter of credit for $250 million wasissued on February 2, 2011 and increased to $295 million on February 23, 2011, which management believes satisfies MoRe’s solvencyrequirements.
Quantitative and Qualitative Disclosures About Market RiskRisk ManagementThe Company must effectively manage, measure and monitor the market risk associated with its assets and liabilities. It has developed an
integrated process for managing risk, which it conducts through its Enterprise Risk Management Department, Asset/Liability ManagementUnit, Treasury Department and Investment Department along with the management of the business segments. The Company has establishedand implemented comprehensive policies and procedures at both the corporate and business segment level to minimize the effects ofpotential market volatility.
The Company regularly analyzes its exposure to interest rate, equity market price and foreign currency exchange rate risks. As a result ofthat analysis, the Company has determined that the estimated fair values of certain assets and liabilities are materially exposed to changes ininterest rates, foreign currency exchange rates and changes in the equity markets.
Enterprise Risk Management. MetLife has established several financial and non-financial senior management committees as part of itsrisk management process. These committees manage capital and risk positions, approve ALM strategies and establish appropriate corporatebusiness standards. Further enhancing its committee structure, during the second quarter of 2010, MetLife created an Enterprise RiskCommittee made up of the following voting members: the Chief Financial Officer, the Chief Investment Officer, the President of U.S. Business,the President of International and the Chief Risk Officer. This committee is responsible for reviewing all material risks to the enterprise anddeciding on actions if necessary, in the event risks exceed desirable targets, taking into consideration best practices to resolve or mitigatethose risks.
MetLife also has a separate Enterprise Risk Management Department, which is responsible for risk management throughout MetLife andreports to MetLife’s Chief Risk Officer. The Enterprise Risk Management Department’s primary responsibilities consist of:
• implementing a corporate risk framework, which outlines the Company’s approach for managing risk on an enterprise-wide basis;• developing policies and procedures for managing, measuring, monitoring and controlling those risks identified in the corporate risk
framework;• establishing appropriate corporate risk tolerance levels;• deploying capital on an economic capital basis; and• reporting on a periodic basis to the Finance and Risk Committee of the Company’s Board of Directors; with respect to credit risk, to the
Investment Committee of the Company’s Board of Directors; and, reporting on various aspects of risk, to financial and non-financialsenior management committees.
Asset/Liability Management. The Company actively manages its assets using an approach that balances quality, diversification, asset/liability matching, liquidity, concentration and investment return. The goals of the investment process are to optimize, net of income tax, risk-adjusted investment income and risk-adjusted total return while ensuring that the assets and liabilities are reasonably managed on a cash flowand duration basis. The ALM process is the shared responsibility of the Financial Risk Management and Asset/Liability Management Unit,Enterprise Risk Management, the Portfolio Management Unit, and the senior members of the business segments and is governed by the ALMCommittees. The ALM Committees’ duties include reviewing and approving target portfolios, establishing investment guidelines and limitsand providing oversight of the ALM process on a periodic basis. The directives of the ALM Committees are carried out and monitored throughALM Working Groups which are set up to manage by product type. In addition, an ALM Steering Committee oversees the activities of theunderlying ALM Committees.
MetLife establishes target asset portfolios for each major insurance product, which represent the investment strategies used to profitablyfund its liabilities within acceptable levels of risk. These strategies are monitored through regular review of portfolio metrics, such as effectiveduration, yield curve sensitivity, convexity, liquidity, asset sector concentration and credit quality by the ALM Working Groups.
Market Risk ExposuresThe Company has exposure to market risk through its insurance operations and investment activities. For purposes of this disclosure,
“market risk” is defined as the risk of loss resulting from changes in interest rates, foreign currency exchange rates and equity market.Interest Rates. The Company’s exposure to interest rate changes results most significantly from its holdings of fixed maturity securities,
as well as its interest rate sensitive liabilities. The fixed maturity securities include U.S. and foreign government bonds, securities issued bygovernment agencies, corporate bonds and mortgage-backed securities, all of which are mainly exposed to changes in medium- and long-term interest rates. The interest rate sensitive liabilities for purposes of this disclosure include debt, policyholder account balances related tocertain investment type contracts, and net embedded derivatives on variable annuities with guaranteed minimum benefits which have thesame type of interest rate exposure (medium- and long-term interest rates) as fixed maturity securities. The Company employs productdesign, pricing and ALM strategies to reduce the adverse effects of interest rate movements. Product design and pricing strategies include
76 MetLife, Inc.

the use of surrender charges or restrictions on withdrawals in some products and the ability to reset credited rates for certain products. ALMstrategies include the use of derivatives and duration mismatch limits. See “Risk Factors — Changes in Market Interest Rates MaySignificantly Affect Our Profitability.”
Foreign Currency Exchange Rates. The Company’s exposure to fluctuations in foreign currency exchange rates against the U.S. dollarresults from its holdings in non-U.S. dollar denominated fixed maturity and equity securities, mortgage loans, and certain liabilities, as well asthrough its investments in foreign subsidiaries. The principal currencies that create foreign currency exchange rate risk in the Company’sinvestment portfolios are the Euro, the Japanese yen and the Canadian dollar. The principal currencies that create foreign currency risk in theCompany’s liabilities are the British pound, the Euro and the Swiss franc. Selectively, the Company uses U.S. dollar assets to support certainlong duration foreign currency liabilities. Through its investments in foreign subsidiaries and joint ventures, the Company is primarily exposedto the Mexican peso, the Japanese yen, the South Korean won, the Canadian dollar, the British pound, the Chilean peso, the Australian dollar,the Argentine peso, the Polish zloty, the Euro and the Hong Kong dollar. In addition to hedging with foreign currency swaps, forwards andoptions, local surplus in some countries is held entirely or in part in U.S. dollar assets which further minimizes exposure to foreign currencyexchange rate fluctuation risk. The Company has matched much of its foreign currency liabilities in its foreign subsidiaries with their respectiveforeign currency assets, thereby reducing its risk to foreign currency exchange rate fluctuation. See “Risk Factors — Fluctuations in ForeignCurrency Exchange Rates Could Negatively Affect Our Profitability.”
Equity Market. The Company has exposure to equity market risk through certain liabilities that involve long-term guarantees on equityperformance such as net embedded derivatives on variable annuities with guaranteed minimum benefits, certain policyholder accountbalances along with investments in equity securities. We manage this risk on an integrated basis with other risks through our ALM strategiesincluding the dynamic hedging of certain variable annuity guarantee benefits. The Company also manages equity market risk exposure in itsinvestment portfolio through the use of derivatives. Equity exposures associated with other limited partnership interests are excluded from thissection as they are not considered financial instruments under GAAP.
Management of Market Risk ExposuresThe Company uses a variety of strategies to manage interest rate, foreign currency exchange rate and equity market risk, including the use
of derivative instruments.Interest Rate Risk Management. To manage interest rate risk, the Company analyzes interest rate risk using various models, including
multi-scenario cash flow projection models that forecast cash flows of the liabilities and their supporting investments, including derivativeinstruments. These projections involve evaluating the potential gain or loss on most of the Company’s in-force business under variousincreasing and decreasing interest rate environments. The New York State Insurance Department regulations require that MetLife performsome of these analyses annually as part of MetLife’s review of the sufficiency of its regulatory reserves. For several of its legal entities, theCompany maintains segmented operating and surplus asset portfolios for the purpose of ALM and the allocation of investment income toproduct lines. For each segment, invested assets greater than or equal to the GAAP liabilities less the DAC asset and any non-invested assetsallocated to the segment are maintained, with any excess swept to the surplus segment. The business segments may reflect differences inlegal entity, statutory line of business and any product market characteristic which may drive a distinct investment strategy with respect toduration, liquidity or credit quality of the invested assets. Certain smaller entities make use of unsegmented general accounts for which theinvestment strategy reflects the aggregate characteristics of liabilities in those entities. The Company measures relative sensitivities of thevalue of its assets and liabilities to changes in key assumptions utilizing Company models. These models reflect specific product charac-teristics and include assumptions based on current and anticipated experience regarding lapse, mortality and interest crediting rates. Inaddition, these models include asset cash flow projections reflecting interest payments, sinking fund payments, principal payments, bondcalls, mortgage prepayments and defaults.
Common industry metrics, such as duration and convexity, are also used to measure the relative sensitivity of assets and liability values tochanges in interest rates. In computing the duration of liabilities, consideration is given to all policyholder guarantees and to how the Companyintends to set indeterminate policy elements such as interest credits or dividends. Each asset portfolio has a duration target based on theliability duration and the investment objectives of that portfolio. Where a liability cash flow may exceed the maturity of available assets, as is thecase with certain retirement and non-medical health products, the Company may support such liabilities with equity investments, derivativesor curve mismatch strategies.
Foreign Currency Exchange Rate Risk Management. Foreign currency exchange rate risk is assumed primarily in three ways: invest-ments in foreign subsidiaries, purchases of foreign currency denominated investments in the investment portfolio and the sale of certaininsurance products.
• The Company’s Treasury Department is responsible for managing the exposure to investments in foreign subsidiaries. Limits toexposures are established and monitored by the Treasury Department and managed by the Investment Department.
• The Investment Department is responsible for managing the exposure to foreign currency investments. Exposure limits to unhedgedforeign currency investments are incorporated into the standing authorizations granted to management by the Board of Directors andare reported to the Board of Directors on a periodic basis.
• The lines of business are responsible for establishing limits and managing any foreign exchange rate exposure caused by the sale orissuance of insurance products.
MetLife uses foreign currency swaps and forwards to hedge its foreign currency denominated fixed income investments, its equityexposure in subsidiaries and its foreign currency exposures caused by the sale of insurance products.
Equity Market Risk Management. Equity market risk exposure through the issuance of variable annuities is managed by the Company’sAsset/Liability Management Unit in partnership with the Investment Department. Equity market risk is realized through its investment in equitysecurities and is managed by its Investment Department. MetLife uses derivatives to hedge its equity exposure both in certain liabilityguarantees such as variable annuities with guaranteed minimum benefit and equity securities. These derivatives include exchange-tradedequity futures, equity index options contracts and equity variance swaps. The Company also employs reinsurance to manage theseexposures.
Hedging Activities. MetLife uses derivative contracts primarily to hedge a wide range of risks including interest rate risk, foreign currencyrisk, and equity risk. Derivative hedges are designed to reduce risk on an economic basis while considering their impact on accounting resultsand GAAP and Statutory capital. The construction of the Company’s derivative hedge programs vary depending on the type of risk being
77MetLife, Inc.
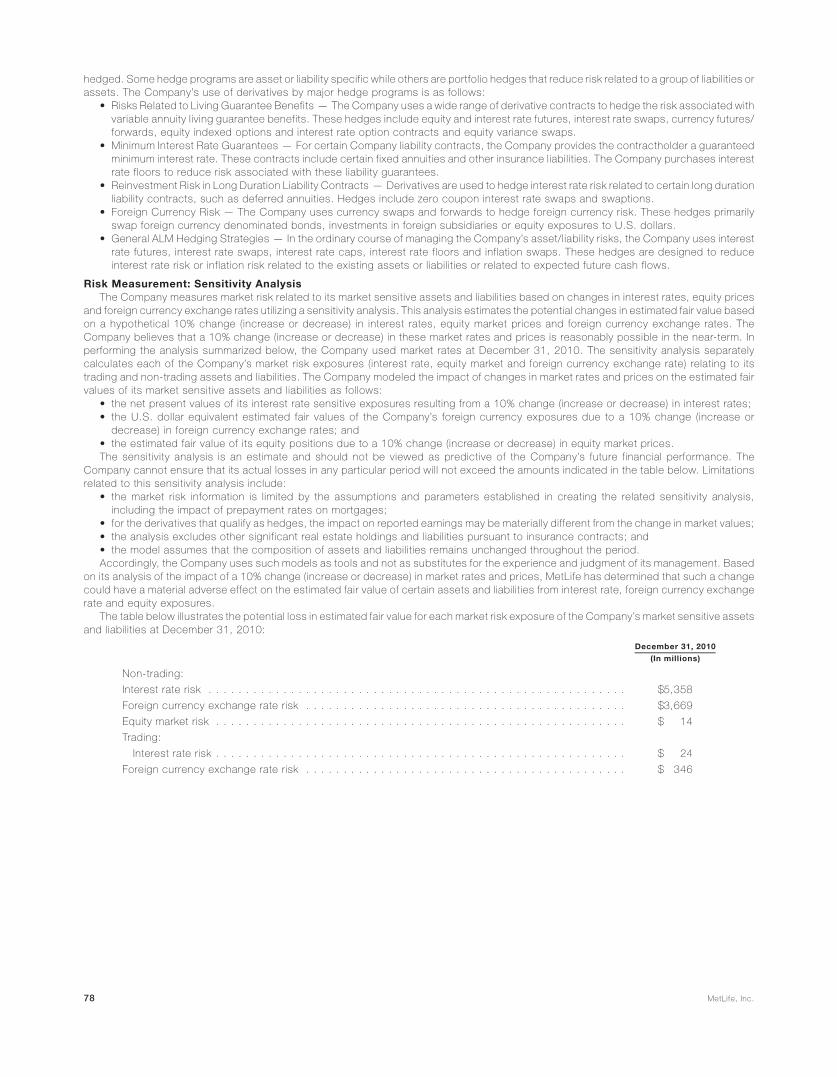
hedged. Some hedge programs are asset or liability specific while others are portfolio hedges that reduce risk related to a group of liabilities orassets. The Company’s use of derivatives by major hedge programs is as follows:
• Risks Related to Living Guarantee Benefits — The Company uses a wide range of derivative contracts to hedge the risk associated withvariable annuity living guarantee benefits. These hedges include equity and interest rate futures, interest rate swaps, currency futures/forwards, equity indexed options and interest rate option contracts and equity variance swaps.
• Minimum Interest Rate Guarantees — For certain Company liability contracts, the Company provides the contractholder a guaranteedminimum interest rate. These contracts include certain fixed annuities and other insurance liabilities. The Company purchases interestrate floors to reduce risk associated with these liability guarantees.
• Reinvestment Risk in Long Duration Liability Contracts — Derivatives are used to hedge interest rate risk related to certain long durationliability contracts, such as deferred annuities. Hedges include zero coupon interest rate swaps and swaptions.
• Foreign Currency Risk — The Company uses currency swaps and forwards to hedge foreign currency risk. These hedges primarilyswap foreign currency denominated bonds, investments in foreign subsidiaries or equity exposures to U.S. dollars.
• General ALM Hedging Strategies — In the ordinary course of managing the Company’s asset/liability risks, the Company uses interestrate futures, interest rate swaps, interest rate caps, interest rate floors and inflation swaps. These hedges are designed to reduceinterest rate risk or inflation risk related to the existing assets or liabilities or related to expected future cash flows.
Risk Measurement: Sensitivity AnalysisThe Company measures market risk related to its market sensitive assets and liabilities based on changes in interest rates, equity prices
and foreign currency exchange rates utilizing a sensitivity analysis. This analysis estimates the potential changes in estimated fair value basedon a hypothetical 10% change (increase or decrease) in interest rates, equity market prices and foreign currency exchange rates. TheCompany believes that a 10% change (increase or decrease) in these market rates and prices is reasonably possible in the near-term. Inperforming the analysis summarized below, the Company used market rates at December 31, 2010. The sensitivity analysis separatelycalculates each of the Company’s market risk exposures (interest rate, equity market and foreign currency exchange rate) relating to itstrading and non-trading assets and liabilities. The Company modeled the impact of changes in market rates and prices on the estimated fairvalues of its market sensitive assets and liabilities as follows:
• the net present values of its interest rate sensitive exposures resulting from a 10% change (increase or decrease) in interest rates;• the U.S. dollar equivalent estimated fair values of the Company’s foreign currency exposures due to a 10% change (increase or
decrease) in foreign currency exchange rates; and• the estimated fair value of its equity positions due to a 10% change (increase or decrease) in equity market prices.The sensitivity analysis is an estimate and should not be viewed as predictive of the Company’s future financial performance. The
Company cannot ensure that its actual losses in any particular period will not exceed the amounts indicated in the table below. Limitationsrelated to this sensitivity analysis include:
• the market risk information is limited by the assumptions and parameters established in creating the related sensitivity analysis,including the impact of prepayment rates on mortgages;
• for the derivatives that qualify as hedges, the impact on reported earnings may be materially different from the change in market values;• the analysis excludes other significant real estate holdings and liabilities pursuant to insurance contracts; and• the model assumes that the composition of assets and liabilities remains unchanged throughout the period.Accordingly, the Company uses such models as tools and not as substitutes for the experience and judgment of its management. Based
on its analysis of the impact of a 10% change (increase or decrease) in market rates and prices, MetLife has determined that such a changecould have a material adverse effect on the estimated fair value of certain assets and liabilities from interest rate, foreign currency exchangerate and equity exposures.
The table below illustrates the potential loss in estimated fair value for each market risk exposure of the Company’s market sensitive assetsand liabilities at December 31, 2010:
December 31, 2010
(In millions)
Non-trading:
Interest rate risk . . . . . . . . . . . . . . . . . . . . . . . . . . . . . . . . . . . . . . . . . . . . . . . . . . . . . . . . $5,358
Foreign currency exchange rate risk . . . . . . . . . . . . . . . . . . . . . . . . . . . . . . . . . . . . . . . . . . . $3,669
Equity market risk . . . . . . . . . . . . . . . . . . . . . . . . . . . . . . . . . . . . . . . . . . . . . . . . . . . . . . . $ 14
Trading:
Interest rate risk . . . . . . . . . . . . . . . . . . . . . . . . . . . . . . . . . . . . . . . . . . . . . . . . . . . . . . . $ 24
Foreign currency exchange rate risk . . . . . . . . . . . . . . . . . . . . . . . . . . . . . . . . . . . . . . . . . . . $ 346
78 MetLife, Inc.
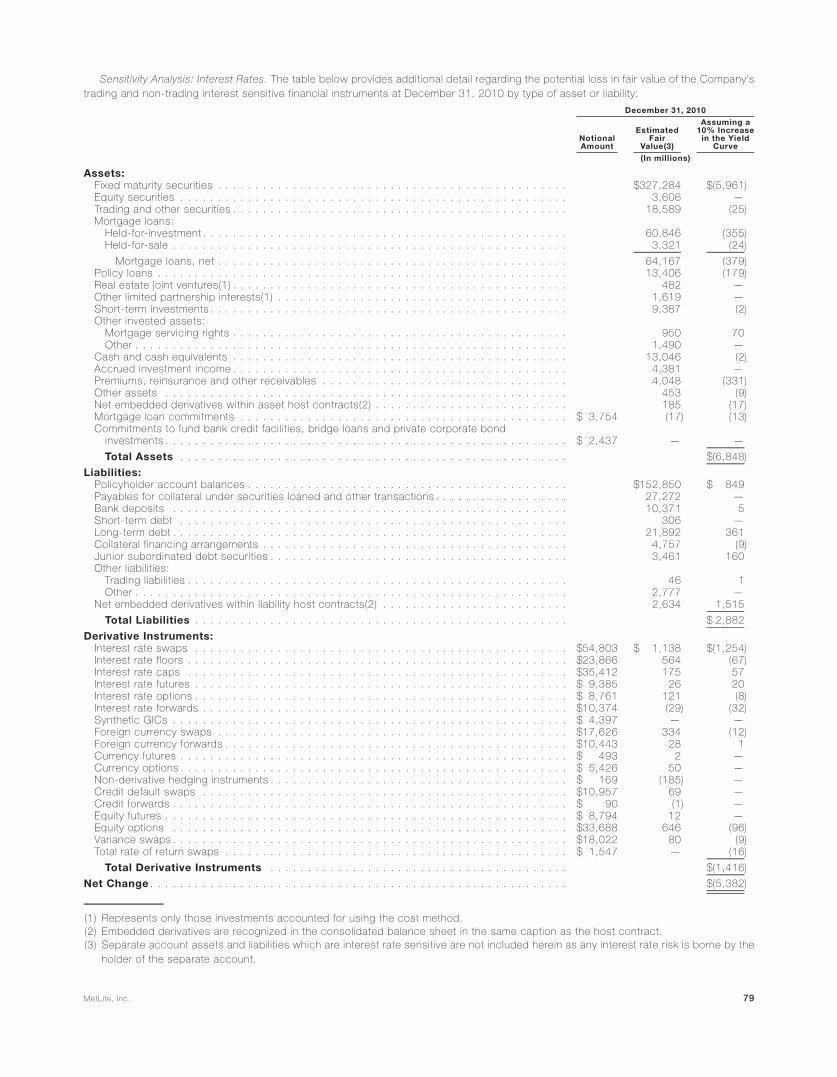
Sensitivity Analysis: Interest Rates. The table below provides additional detail regarding the potential loss in fair value of the Company’strading and non-trading interest sensitive financial instruments at December 31, 2010 by type of asset or liability:
NotionalAmount
EstimatedFair
Value(3)
Assuming a10% Increase
in the YieldCurve
December 31, 2010
(In millions)
Assets:Fixed maturity securities . . . . . . . . . . . . . . . . . . . . . . . . . . . . . . . . . . . . . . . . . . . . . . . $327,284 $(5,961)Equity securities . . . . . . . . . . . . . . . . . . . . . . . . . . . . . . . . . . . . . . . . . . . . . . . . . . . . 3,606 —Trading and other securities . . . . . . . . . . . . . . . . . . . . . . . . . . . . . . . . . . . . . . . . . . . . . 18,589 (25)Mortgage loans:
Held-for-investment . . . . . . . . . . . . . . . . . . . . . . . . . . . . . . . . . . . . . . . . . . . . . . . . . 60,846 (355)Held-for-sale . . . . . . . . . . . . . . . . . . . . . . . . . . . . . . . . . . . . . . . . . . . . . . . . . . . . . 3,321 (24)
Mortgage loans, net . . . . . . . . . . . . . . . . . . . . . . . . . . . . . . . . . . . . . . . . . . . . . . . 64,167 (379)Policy loans . . . . . . . . . . . . . . . . . . . . . . . . . . . . . . . . . . . . . . . . . . . . . . . . . . . . . . . 13,406 (179)Real estate joint ventures(1) . . . . . . . . . . . . . . . . . . . . . . . . . . . . . . . . . . . . . . . . . . . . . 482 —Other limited partnership interests(1) . . . . . . . . . . . . . . . . . . . . . . . . . . . . . . . . . . . . . . . 1,619 —Short-term investments . . . . . . . . . . . . . . . . . . . . . . . . . . . . . . . . . . . . . . . . . . . . . . . . 9,387 (2)Other invested assets:
Mortgage servicing rights . . . . . . . . . . . . . . . . . . . . . . . . . . . . . . . . . . . . . . . . . . . . . 950 70Other . . . . . . . . . . . . . . . . . . . . . . . . . . . . . . . . . . . . . . . . . . . . . . . . . . . . . . . . . . 1,490 —
Cash and cash equivalents . . . . . . . . . . . . . . . . . . . . . . . . . . . . . . . . . . . . . . . . . . . . . 13,046 (2)Accrued investment income . . . . . . . . . . . . . . . . . . . . . . . . . . . . . . . . . . . . . . . . . . . . . 4,381 —Premiums, reinsurance and other receivables . . . . . . . . . . . . . . . . . . . . . . . . . . . . . . . . . 4,048 (331)Other assets . . . . . . . . . . . . . . . . . . . . . . . . . . . . . . . . . . . . . . . . . . . . . . . . . . . . . . 453 (9)Net embedded derivatives within asset host contracts(2) . . . . . . . . . . . . . . . . . . . . . . . . . . 185 (17)Mortgage loan commitments . . . . . . . . . . . . . . . . . . . . . . . . . . . . . . . . . . . . . . . . . . . . $ 3,754 (17) (13)Commitments to fund bank credit facilities, bridge loans and private corporate bond
investments . . . . . . . . . . . . . . . . . . . . . . . . . . . . . . . . . . . . . . . . . . . . . . . . . . . . . . $ 2,437 — —
Total Assets . . . . . . . . . . . . . . . . . . . . . . . . . . . . . . . . . . . . . . . . . . . . . . . . . . . . $(6,848)
Liabilities:Policyholder account balances . . . . . . . . . . . . . . . . . . . . . . . . . . . . . . . . . . . . . . . . . . . $152,850 $ 849Payables for collateral under securities loaned and other transactions . . . . . . . . . . . . . . . . . . 27,272 —Bank deposits . . . . . . . . . . . . . . . . . . . . . . . . . . . . . . . . . . . . . . . . . . . . . . . . . . . . . 10,371 5Short-term debt . . . . . . . . . . . . . . . . . . . . . . . . . . . . . . . . . . . . . . . . . . . . . . . . . . . . 306 —Long-term debt . . . . . . . . . . . . . . . . . . . . . . . . . . . . . . . . . . . . . . . . . . . . . . . . . . . . . 21,892 361Collateral financing arrangements . . . . . . . . . . . . . . . . . . . . . . . . . . . . . . . . . . . . . . . . . 4,757 (9)Junior subordinated debt securities . . . . . . . . . . . . . . . . . . . . . . . . . . . . . . . . . . . . . . . . 3,461 160Other liabilities:
Trading liabilities . . . . . . . . . . . . . . . . . . . . . . . . . . . . . . . . . . . . . . . . . . . . . . . . . . . 46 1Other . . . . . . . . . . . . . . . . . . . . . . . . . . . . . . . . . . . . . . . . . . . . . . . . . . . . . . . . . . 2,777 —
Net embedded derivatives within liability host contracts(2) . . . . . . . . . . . . . . . . . . . . . . . . . 2,634 1,515
Total Liabilities . . . . . . . . . . . . . . . . . . . . . . . . . . . . . . . . . . . . . . . . . . . . . . . . . . $ 2,882
Derivative Instruments:Interest rate swaps . . . . . . . . . . . . . . . . . . . . . . . . . . . . . . . . . . . . . . . . . . . . . . . . . . $54,803 $ 1,138 $(1,254)Interest rate floors . . . . . . . . . . . . . . . . . . . . . . . . . . . . . . . . . . . . . . . . . . . . . . . . . . . $23,866 564 (67)Interest rate caps . . . . . . . . . . . . . . . . . . . . . . . . . . . . . . . . . . . . . . . . . . . . . . . . . . . $35,412 175 57Interest rate futures . . . . . . . . . . . . . . . . . . . . . . . . . . . . . . . . . . . . . . . . . . . . . . . . . . $ 9,385 26 20Interest rate options . . . . . . . . . . . . . . . . . . . . . . . . . . . . . . . . . . . . . . . . . . . . . . . . . . $ 8,761 121 (8)Interest rate forwards . . . . . . . . . . . . . . . . . . . . . . . . . . . . . . . . . . . . . . . . . . . . . . . . . $10,374 (29) (32)Synthetic GICs . . . . . . . . . . . . . . . . . . . . . . . . . . . . . . . . . . . . . . . . . . . . . . . . . . . . . $ 4,397 — —Foreign currency swaps . . . . . . . . . . . . . . . . . . . . . . . . . . . . . . . . . . . . . . . . . . . . . . . $17,626 334 (12)Foreign currency forwards . . . . . . . . . . . . . . . . . . . . . . . . . . . . . . . . . . . . . . . . . . . . . . $10,443 28 1Currency futures . . . . . . . . . . . . . . . . . . . . . . . . . . . . . . . . . . . . . . . . . . . . . . . . . . . . $ 493 2 —Currency options . . . . . . . . . . . . . . . . . . . . . . . . . . . . . . . . . . . . . . . . . . . . . . . . . . . . $ 5,426 50 —Non-derivative hedging instruments . . . . . . . . . . . . . . . . . . . . . . . . . . . . . . . . . . . . . . . . $ 169 (185) —Credit default swaps . . . . . . . . . . . . . . . . . . . . . . . . . . . . . . . . . . . . . . . . . . . . . . . . . $10,957 69 —Credit forwards . . . . . . . . . . . . . . . . . . . . . . . . . . . . . . . . . . . . . . . . . . . . . . . . . . . . . $ 90 (1) —Equity futures . . . . . . . . . . . . . . . . . . . . . . . . . . . . . . . . . . . . . . . . . . . . . . . . . . . . . . $ 8,794 12 —Equity options . . . . . . . . . . . . . . . . . . . . . . . . . . . . . . . . . . . . . . . . . . . . . . . . . . . . . $33,688 646 (96)Variance swaps . . . . . . . . . . . . . . . . . . . . . . . . . . . . . . . . . . . . . . . . . . . . . . . . . . . . . $18,022 80 (9)Total rate of return swaps . . . . . . . . . . . . . . . . . . . . . . . . . . . . . . . . . . . . . . . . . . . . . . $ 1,547 — (16)
Total Derivative Instruments . . . . . . . . . . . . . . . . . . . . . . . . . . . . . . . . . . . . . . . . $(1,416)
Net Change . . . . . . . . . . . . . . . . . . . . . . . . . . . . . . . . . . . . . . . . . . . . . . . . . . . . . . . . $(5,382)
(1) Represents only those investments accounted for using the cost method.(2) Embedded derivatives are recognized in the consolidated balance sheet in the same caption as the host contract.(3) Separate account assets and liabilities which are interest rate sensitive are not included herein as any interest rate risk is borne by the
holder of the separate account.
79MetLife, Inc.

This quantitative measure of risk has increased by $1,325 million, or 33%, to $5,382 million at December 31, 2010 from $4,057 million atDecember 31, 2009. Excluding the Acquisition which increased risk by $647 million, the quantitative measure of risk increased by$678 million or 17% at December 31, 2010 from December 31, 2009. The increase in risk is due to a change in the net assets andliabilities bases of $641 million. In addition, an increase of $954 million was due to the use of derivatives employed by the Company($445 million), an increase in the duration of the investment portfolio ($389 million), and an increase in premiums, reinsurance and otherreceivables ($120 million). This increase in risk was partially offset by a decrease in interest rates across the long end of the Swaps andU.S. Treasury curves resulting in a decrease of $424 million. Additionally, net embedded derivatives within liability host contracts increased by$520 million, partially due to a change made in the second quarter of 2010 related to how the Company estimates the spread over the swapcurve for purposes of determining the discount rate used to value those derivatives, which caused a corresponding decrease in risk. Theremainder of the fluctuation is attributable to numerous immaterial items.
80 MetLife, Inc.

Sensitivity Analysis: Foreign Currency Exchange Rates. The table below provides additional detail regarding the potential loss in estimatedfair value of the Company’s portfolio due to a 10% change in foreign currency exchange rates at December 31, 2010 by type of asset orliability:
NotionalAmount
EstimatedFair
Value (1)
Assuming a10% Increasein the Foreign
Exchange Rate
December 31, 2010
(In millions)
Assets:Fixed maturity securities . . . . . . . . . . . . . . . . . . . . . . . . . . . . . . . . . . . . . . . . . . . . . . $327,284 $(6,516)Equity securities . . . . . . . . . . . . . . . . . . . . . . . . . . . . . . . . . . . . . . . . . . . . . . . . . . . 3,606 (74)Trading and other securities . . . . . . . . . . . . . . . . . . . . . . . . . . . . . . . . . . . . . . . . . . . . 18,589 (346)Mortgage loans:
Held-for-investment . . . . . . . . . . . . . . . . . . . . . . . . . . . . . . . . . . . . . . . . . . . . . . . . 60,846 (414)Held-for-sale . . . . . . . . . . . . . . . . . . . . . . . . . . . . . . . . . . . . . . . . . . . . . . . . . . . . 3,321 —
Mortgage loans, net . . . . . . . . . . . . . . . . . . . . . . . . . . . . . . . . . . . . . . . . . . . . . . 64,167 (414)Policy loans . . . . . . . . . . . . . . . . . . . . . . . . . . . . . . . . . . . . . . . . . . . . . . . . . . . . . . 13,406 (199)Short-term investments . . . . . . . . . . . . . . . . . . . . . . . . . . . . . . . . . . . . . . . . . . . . . . . 9,387 (200)Other invested assets:
Mortgage servicing rights . . . . . . . . . . . . . . . . . . . . . . . . . . . . . . . . . . . . . . . . . . . . 950 —Other . . . . . . . . . . . . . . . . . . . . . . . . . . . . . . . . . . . . . . . . . . . . . . . . . . . . . . . . . 1,490 (143)
Cash and cash equivalents . . . . . . . . . . . . . . . . . . . . . . . . . . . . . . . . . . . . . . . . . . . . 13,046 (139)Accrued investment income . . . . . . . . . . . . . . . . . . . . . . . . . . . . . . . . . . . . . . . . . . . . 4,381 (11)Premiums, reinsurance and other receivables . . . . . . . . . . . . . . . . . . . . . . . . . . . . . . . . 4,048 (16)
Total Assets . . . . . . . . . . . . . . . . . . . . . . . . . . . . . . . . . . . . . . . . . . . . . . . . . . . $(8,058)
Liabilities:Policyholder account balances . . . . . . . . . . . . . . . . . . . . . . . . . . . . . . . . . . . . . . . . . . $152,850 $ 3,255Bank deposits . . . . . . . . . . . . . . . . . . . . . . . . . . . . . . . . . . . . . . . . . . . . . . . . . . . . . 10,371 —Long-term debt . . . . . . . . . . . . . . . . . . . . . . . . . . . . . . . . . . . . . . . . . . . . . . . . . . . . 21,892 37Other liabilities . . . . . . . . . . . . . . . . . . . . . . . . . . . . . . . . . . . . . . . . . . . . . . . . . . . . 2,777 9Net embedded derivatives within liability host contracts(2) . . . . . . . . . . . . . . . . . . . . . . . . 2,634 437
Total Liabilities . . . . . . . . . . . . . . . . . . . . . . . . . . . . . . . . . . . . . . . . . . . . . . . . . $ 3,738
Derivative Instruments:Interest rate swaps . . . . . . . . . . . . . . . . . . . . . . . . . . . . . . . . . . . . . . . . . . . . . . . . . $54,083 $ 1,138 $ (17)Interest rate floors . . . . . . . . . . . . . . . . . . . . . . . . . . . . . . . . . . . . . . . . . . . . . . . . . . $23,866 564 —Interest rate caps . . . . . . . . . . . . . . . . . . . . . . . . . . . . . . . . . . . . . . . . . . . . . . . . . . $35,412 175 —Interest rate futures . . . . . . . . . . . . . . . . . . . . . . . . . . . . . . . . . . . . . . . . . . . . . . . . . $ 9,385 26 (2)Interest rate options . . . . . . . . . . . . . . . . . . . . . . . . . . . . . . . . . . . . . . . . . . . . . . . . . $ 8,761 121 (2)Interest rate forwards . . . . . . . . . . . . . . . . . . . . . . . . . . . . . . . . . . . . . . . . . . . . . . . . $10,374 (29) —Synthetic GICs . . . . . . . . . . . . . . . . . . . . . . . . . . . . . . . . . . . . . . . . . . . . . . . . . . . . $ 4,397 — —Foreign currency swaps . . . . . . . . . . . . . . . . . . . . . . . . . . . . . . . . . . . . . . . . . . . . . . $17,626 334 271Foreign currency forwards . . . . . . . . . . . . . . . . . . . . . . . . . . . . . . . . . . . . . . . . . . . . . $10,443 28 73Currency futures . . . . . . . . . . . . . . . . . . . . . . . . . . . . . . . . . . . . . . . . . . . . . . . . . . . $ 493 2 (49)Currency options . . . . . . . . . . . . . . . . . . . . . . . . . . . . . . . . . . . . . . . . . . . . . . . . . . . $ 5,426 50 107Non-derivative hedging instruments . . . . . . . . . . . . . . . . . . . . . . . . . . . . . . . . . . . . . . . $ 169 (185) —Credit default swaps . . . . . . . . . . . . . . . . . . . . . . . . . . . . . . . . . . . . . . . . . . . . . . . . $10,957 69 —Credit forwards . . . . . . . . . . . . . . . . . . . . . . . . . . . . . . . . . . . . . . . . . . . . . . . . . . . . $ 90 (1) —Equity futures . . . . . . . . . . . . . . . . . . . . . . . . . . . . . . . . . . . . . . . . . . . . . . . . . . . . . $ 8,794 12 2Equity options . . . . . . . . . . . . . . . . . . . . . . . . . . . . . . . . . . . . . . . . . . . . . . . . . . . . . $33,688 646 (77)Variance swaps . . . . . . . . . . . . . . . . . . . . . . . . . . . . . . . . . . . . . . . . . . . . . . . . . . . . $18,022 80 (1)Total rate of return swaps . . . . . . . . . . . . . . . . . . . . . . . . . . . . . . . . . . . . . . . . . . . . . $ 1,547 — —
Total Derivative Instruments . . . . . . . . . . . . . . . . . . . . . . . . . . . . . . . . . . . . . . . . $ 305
Net Change . . . . . . . . . . . . . . . . . . . . . . . . . . . . . . . . . . . . . . . . . . . . . . . . . . . . . . . $(4,015)
(1) Estimated fair value presented in the table above represents the estimated fair value of all financial instruments within this financialstatement caption not necessarily those solely subject to foreign exchange risk.
(2) Embedded derivatives are recognized in the consolidated balance sheet in the same caption as the host contract.Foreign currency exchange rate risk increased by $3,124 million, to $4,015 million at December 31, 2010 from $891 million at
December 31, 2009. Excluding the Acquisition which increased risk by $2,646 million, the foreign currency exchange risk has increased
81MetLife, Inc.

by $478 million or 54% at December 31, 2010 from December 31, 2009. This change was due to an increase in exchange rate risk relating tofixed maturity securities of $722 million due to higher exposures primarily within the British pound and the Euro and to the sale of the pensioncloseout business in the U.K. Additionally, a decrease in the foreign exposure related to long-term debt and PABs contributed $66 million and$41 million, respectively, to the increase. This was partially offset by an increase in the foreign exposure related to net embedded derivativeswithin liability host contracts and the use of derivatives employed by the Company of $315 million and $101 million, respectively. Theremainder of the fluctuation is attributable to numerous immaterial items.
Sensitivity Analysis: Equity Market Prices. The table below provides additional detail regarding the potential loss in estimated fair value ofthe Company’s portfolio due to a 10% change in equity at December 31, 2010 by type of asset or liability:
NotionalAmount
EstimatedFair
Value(1)
Assuming a10% Decrease
in EquityPrices
December 31, 2010
(In millions)
Assets:
Equity securities . . . . . . . . . . . . . . . . . . . . . . . . . . . . . . . . . . . . . . . . . . . . . . . . . . . . $ 3,606 $(355)
Other invested assets:
Net embedded derivatives within asset host contracts(2) . . . . . . . . . . . . . . . . . . . . . . . . . 185 11
Total Assets . . . . . . . . . . . . . . . . . . . . . . . . . . . . . . . . . . . . . . . . . . . . . . . . . . . . $(344)
Liabilities:
Policyholder account balances . . . . . . . . . . . . . . . . . . . . . . . . . . . . . . . . . . . . . . . . . . $152,850 $ —
Bank deposits . . . . . . . . . . . . . . . . . . . . . . . . . . . . . . . . . . . . . . . . . . . . . . . . . . . . . 10,371 —
Other liabilities:
Net embedded derivatives within liability host contracts(2) . . . . . . . . . . . . . . . . . . . . . . . . . 2,634 (456)
Total Liabilities . . . . . . . . . . . . . . . . . . . . . . . . . . . . . . . . . . . . . . . . . . . . . . . . . . $(456)
Derivative Instruments:
Interest rate swaps . . . . . . . . . . . . . . . . . . . . . . . . . . . . . . . . . . . . . . . . . . . . . . . . . . $54,803 $ 1,138 $ —
Interest rate floors . . . . . . . . . . . . . . . . . . . . . . . . . . . . . . . . . . . . . . . . . . . . . . . . . . $23,866 564 —
Interest rate caps . . . . . . . . . . . . . . . . . . . . . . . . . . . . . . . . . . . . . . . . . . . . . . . . . . . $35,412 175 —
Interest rate futures . . . . . . . . . . . . . . . . . . . . . . . . . . . . . . . . . . . . . . . . . . . . . . . . . . $ 9,385 26 —
Interest rate options . . . . . . . . . . . . . . . . . . . . . . . . . . . . . . . . . . . . . . . . . . . . . . . . . $ 8,761 121 —
Interest rate forwards . . . . . . . . . . . . . . . . . . . . . . . . . . . . . . . . . . . . . . . . . . . . . . . . $10,374 (29) —
Synthetic GICs . . . . . . . . . . . . . . . . . . . . . . . . . . . . . . . . . . . . . . . . . . . . . . . . . . . . . $ 4,397 — —
Foreign currency swaps . . . . . . . . . . . . . . . . . . . . . . . . . . . . . . . . . . . . . . . . . . . . . . . $17,626 334 —
Foreign currency forwards . . . . . . . . . . . . . . . . . . . . . . . . . . . . . . . . . . . . . . . . . . . . . $10,443 28 —
Currency futures . . . . . . . . . . . . . . . . . . . . . . . . . . . . . . . . . . . . . . . . . . . . . . . . . . . $ 493 2 —
Currency options . . . . . . . . . . . . . . . . . . . . . . . . . . . . . . . . . . . . . . . . . . . . . . . . . . . $ 5,426 50 —
Non-derivative hedging instruments . . . . . . . . . . . . . . . . . . . . . . . . . . . . . . . . . . . . . . . $ 169 (185) —
Credit default swaps . . . . . . . . . . . . . . . . . . . . . . . . . . . . . . . . . . . . . . . . . . . . . . . . . $10,957 69 —
Credit forwards . . . . . . . . . . . . . . . . . . . . . . . . . . . . . . . . . . . . . . . . . . . . . . . . . . . . $ 90 (1) —
Equity futures . . . . . . . . . . . . . . . . . . . . . . . . . . . . . . . . . . . . . . . . . . . . . . . . . . . . . $ 8,794 12 3
Equity options . . . . . . . . . . . . . . . . . . . . . . . . . . . . . . . . . . . . . . . . . . . . . . . . . . . . . $33,688 646 628
Variance swaps . . . . . . . . . . . . . . . . . . . . . . . . . . . . . . . . . . . . . . . . . . . . . . . . . . . . $18,022 80 —
Total rate of return swaps . . . . . . . . . . . . . . . . . . . . . . . . . . . . . . . . . . . . . . . . . . . . . . $ 1,547 — 155
Total Derivative Instruments . . . . . . . . . . . . . . . . . . . . . . . . . . . . . . . . . . . . . . . . $ 786
Net Change . . . . . . . . . . . . . . . . . . . . . . . . . . . . . . . . . . . . . . . . . . . . . . . . . . . . . . . $ (14)
(1) Estimated fair value presented in the table above represents the estimated fair value of all financial instruments within this financialstatement caption not necessarily those solely subject to equity market risk.
(2) Embedded derivatives are recognized in the consolidated balance sheet in the same caption as the host contract.(3) During the fourth quarter of 2010, the analysis of the impact of a 10% change (increase or decrease) in equity market rates determined that
due to the inclusion of ALICO, a decrease of 10% had the most adverse effect on our equity risk while the prior year end’s analysis of equitymarket rates shows an increase of 10% had the most adverse effect.Equity price risk decreased by $204 million to $14 million at December 31, 2010 from $218 million at December 31, 2009. Excluding the
Acquisition which shifted the impact of a 10% change to a decrease in the equity market rates, the equity price risk has decreased by$191 million at December 31, 2010 from December 31, 2009. This decrease is primarily due to a change of $210 million attributed to the useof derivatives employed by the Company to hedge its equity exposures. Additionally, an increase in the net exposures related to netembedded derivatives within liability host contracts of $42 million contributed to the decrease. This was partially offset by a decrease of$60 million in equity securities. The remainder of the fluctuation is attributable to numerous insignificant items.
82 MetLife, Inc.

Changes in and Disagreements With Accountants on Accounting and Financial DisclosureNone.
Management’s Annual Report on Internal Control Over Financial ReportingManagement of MetLife, Inc. and subsidiaries is responsible for establishing and maintaining adequate internal control over financial
reporting. In fulfilling this responsibility, estimates and judgments by management are required to assess the expected benefits and relatedcosts of control procedures. The objectives of internal control include providing management with reasonable, but not absolute, assurancethat assets are safeguarded against loss from unauthorized use or disposition, and that transactions are executed in accordance withmanagement’s authorization and recorded properly to permit the preparation of consolidated financial statements in conformity withaccounting principles generally accepted in the United States of America (“GAAP”).
Management has documented and evaluated the effectiveness of the internal control of the Company at December 31, 2010 pertaining tofinancial reporting in accordance with the criteria established in Internal Control — Integrated Framework issued by the Committee ofSponsoring Organizations of the Treadway Commission.
On November 1, 2010, the Holding Company acquired all of the issued and outstanding capital stock of American Life Insurance Companyand Delaware American Life Insurance Company (collectively, “ALICO”). As allowed under the U.S. Securities and Exchange Commission (the“SEC”) guidance, management’s assessment of and conclusion regarding the design and effectiveness of internal control over financialreporting excluded the internal control over financial reporting of ALICO, which is relevant to the Company’s 2010 consolidated financialstatements as of and for the year ended December 31, 2010. ALICO represents 17% of total assets, and 2% of total revenues of MetLife, Inc.as of and for the year ended December 31, 2010. The financial reporting systems of ALICO have not yet been integrated into the Company’sfinancial reporting systems and, as such, the Company did not have the practical ability to perform an assessment of ALICO’s internal controlover financial reporting in time for this current year-end. Management expects to complete the process of integrating ALICO’s internal controlover financial reporting over the course of 2011. The ALICO acquisition represents a material change in internal control over financial reportingas defined in Exchange Act Rule 13a-15(f) during the quarter ended December 31, 2010.
In the opinion of management, MetLife, Inc. maintained effective internal control over financial reporting at December 31, 2010.Deloitte & Touche LLP, an independent registered public accounting firm, has audited the consolidated financial statements included in
the Annual Report on Form 10-K for the year ended December 31, 2010. The Report of the Independent Registered Public Accounting Firm ontheir audit of the consolidated financial statements is included at page F-1.
Attestation Report of the Company’s Registered Public Accounting FirmThe Company’s independent registered public accounting firm, Deloitte & Touche LLP, has issued their attestation report on manage-
ment’s internal control over financial reporting which is set forth below.
83MetLife, Inc.

REPORT OF INDEPENDENT REGISTERED PUBLIC ACCOUNTING FIRM
To the Board of Directors and Stockholders ofMetLife, Inc.:
We have audited the internal control over financial reporting of MetLife, Inc. and subsidiaries (the “Company”) as of December 31, 2010,based on criteria established in Internal Control — Integrated Framework issued by the Committee of Sponsoring Organizations of theTreadway Commission. As described in Management’s Annual Report on Internal Control Over Financial Reporting, management excludedfrom its assessment the internal control over financial reporting at ALICO, acquired on November 1, 2010, as the financial reporting systemsof ALICO have not yet been integrated into the Company’s financial reporting systems and, as such, the Company did not have the practicalability to perform an assessment of ALICO’s internal control over financial reporting in time for this current year-end. ALICO represents 17% oftotal assets and 2% of total revenues of the Company as of and for the year ended December 31, 2010. Accordingly, our audit did not includethe internal control over financial reporting at ALICO. The Company’s management is responsible for maintaining effective internal control overfinancial reporting and for its assessment of the effectiveness of internal control over financial reporting, included in the accompanyingManagement’s Annual Report on Internal Control Over Financial Reporting. Our responsibility is to express an opinion on the Company’sinternal control over financial reporting based on our audit.
We conducted our audit in accordance with the standards of the Public Company Accounting Oversight Board (United States). Thosestandards require that we plan and perform the audit to obtain reasonable assurance about whether effective internal control over financialreporting was maintained in all material respects. Our audit included obtaining an understanding of internal control over financial reporting,assessing the risk that a material weakness exists, testing and evaluating the design and operating effectiveness of internal control based onthe assessed risk, and performing such other procedures as we considered necessary in the circumstances. We believe that our auditprovides a reasonable basis for our opinion.
A company’s internal control over financial reporting is a process designed by, or under the supervision of, the company’s principalexecutive and principal financial officers, or persons performing similar functions, and effected by the company’s board of directors,management, and other personnel to provide reasonable assurance regarding the reliability of financial reporting and the preparation offinancial statements for external purposes in accordance with generally accepted accounting principles. A company’s internal control overfinancial reporting includes those policies and procedures that (1) pertain to the maintenance of records that, in reasonable detail, accuratelyand fairly reflect the transactions and dispositions of the assets of the company; (2) provide reasonable assurance that transactions arerecorded as necessary to permit preparation of financial statements in accordance with generally accepted accounting principles, and thatreceipts and expenditures of the company are being made only in accordance with authorizations of management and directors of thecompany; and (3) provide reasonable assurance regarding prevention or timely detection of unauthorized acquisition, use, or disposition ofthe company’s assets that could have a material effect on the financial statements.
Because of the inherent limitations of internal control over financial reporting, including the possibility of collusion or improper managementoverride of controls, material misstatements due to error or fraud may not be prevented or detected on a timely basis. Also, projections of anyevaluation of the effectiveness of the internal control over financial reporting to future periods are subject to the risk that the controls maybecome inadequate because of changes in conditions, or that the degree of compliance with the policies or procedures may deteriorate.
In our opinion, the Company maintained, in all material respects, effective internal control over financial reporting as of December 31,2010, based on the criteria established in Internal Control — Integrated Framework issued by the Committee of Sponsoring Organizations ofthe Treadway Commission.
We have also audited, in accordance with the standards of the Public Company Accounting Oversight Board (United States), theconsolidated financial statements of the Company as of and for the year ended December 31, 2010, and our report dated February 24, 2011expressed an unqualified opinion on those consolidated financial statements.
/s/ DELOITTE & TOUCHE LLPDELOITTE & TOUCHE LLPNew York, New York
February 24, 2011
84 MetLife, Inc.

Index to Consolidated Financial Statements
Page
Report of Independent Registered Public Accounting Firm . . . . . . . . . . . . . . . . . . . . . . . . . . . . . . . . . . . . . . . . . . . . . . F-1
Financial Statements at December 31, 2010 and 2009 and for the Years Ended December 31, 2010, 2009, and 2008:
Consolidated Balance Sheets . . . . . . . . . . . . . . . . . . . . . . . . . . . . . . . . . . . . . . . . . . . . . . . . . . . . . . . . . . . . . . . F-2
Consolidated Statements of Operations . . . . . . . . . . . . . . . . . . . . . . . . . . . . . . . . . . . . . . . . . . . . . . . . . . . . . . . . . F-3
Consolidated Statements of Equity . . . . . . . . . . . . . . . . . . . . . . . . . . . . . . . . . . . . . . . . . . . . . . . . . . . . . . . . . . . . F-4
Consolidated Statements of Cash Flows . . . . . . . . . . . . . . . . . . . . . . . . . . . . . . . . . . . . . . . . . . . . . . . . . . . . . . . . F-7
Notes to the Consolidated Financial Statements . . . . . . . . . . . . . . . . . . . . . . . . . . . . . . . . . . . . . . . . . . . . . . . . . . . . F-9
85MetLife, Inc.

(This page intentionally left blank)

REPORT OF INDEPENDENT REGISTERED PUBLIC ACCOUNTING FIRM
To the Board of Directors and Stockholders ofMetLife, Inc.:
We have audited the accompanying consolidated balance sheets of MetLife, Inc. and subsidiaries (the “Company”) as of December 31,2010 and 2009, and the related consolidated statements of operations, equity, and cash flows for each of the three years in the period endedDecember 31, 2010. These consolidated financial statements are the responsibility of the Company’s management. Our responsibility is toexpress an opinion on the consolidated financial statements based on our audits.
We conducted our audits in accordance with the standards of the Public Company Accounting Oversight Board (United States). Thosestandards require that we plan and perform the audit to obtain reasonable assurance about whether the consolidated financial statements arefree of material misstatement. An audit includes examining, on a test basis, evidence supporting the amounts and disclosures in theconsolidated financial statements. An audit also includes assessing the accounting principles used and significant estimates made bymanagement, as well as evaluating the overall financial statement presentation. We believe that our audits provide a reasonable basis for ouropinion.
In our opinion, such consolidated financial statements present fairly, in all material respects, the financial position of MetLife, Inc. andsubsidiaries as of December 31, 2010 and 2009, and the results of their operations and their cash flows for each of the three years in theperiod ended December 31, 2010, in conformity with accounting principles generally accepted in the United States of America.
As discussed in Note 1, the Company changed its method of accounting for the recognition and presentation of other-than-temporaryimpairment losses for certain investments as required by accounting guidance adopted on April 1, 2009, and changed its method ofaccounting for certain assets and liabilities to a fair value measurement approach as required by accounting guidance adopted on January 1,2008.
We have also audited, in accordance with the standards of the Public Company Accounting Oversight Board (United States), theCompany’s internal control over financial reporting as of December 31, 2010, based on the criteria established in Internal Control —Integrated Framework issued by the Committee of Sponsoring Organizations of the Treadway Commission, and our report, dated February 24,2011, expressed an unqualified opinion on the Company’s internal control over financial reporting.
/s/ DELOITTE & TOUCHE LLPDELOITTE & TOUCHE LLPNew York, New York
February 24, 2011
F-1MetLife, Inc.

MetLife, Inc.
Consolidated Balance SheetsDecember 31, 2010 and 2009
(In millions, except share and per share data)
2010 2009
AssetsInvestments:
Fixed maturity securities available-for-sale, at estimated fair value (amortized cost: $320,008 and $229,709, respectively;includes $3,330 and $3,171, respectively, relating to variable interest entities) . . . . . . . . . . . . . . . . . . . . . . . . . . . . . . $327,284 $227,642
Equity securities available-for-sale, at estimated fair value (cost: $3,625 and $3,187, respectively) . . . . . . . . . . . . . . . . . . . 3,606 3,084Trading and other securities, at estimated fair value (includes $463 and $420 of actively traded securities, respectively; and
$387 and $0, respectively, relating to variable interest entities) . . . . . . . . . . . . . . . . . . . . . . . . . . . . . . . . . . . . . . . 18,589 2,384Mortgage loans:
Held-for-investment, principally at amortized cost (net of valuation allowances of $664 and $721, respectively; includes$6,840 and $0, respectively, at estimated fair value, relating to variable interest entities) . . . . . . . . . . . . . . . . . . . . . . . 59,055 48,181
Held-for-sale, principally at estimated fair value . . . . . . . . . . . . . . . . . . . . . . . . . . . . . . . . . . . . . . . . . . . . . . . . . 3,321 2,728
Mortgage loans, net . . . . . . . . . . . . . . . . . . . . . . . . . . . . . . . . . . . . . . . . . . . . . . . . . . . . . . . . . . . . . . . . 62,376 50,909Policy loans . . . . . . . . . . . . . . . . . . . . . . . . . . . . . . . . . . . . . . . . . . . . . . . . . . . . . . . . . . . . . . . . . . . . . . . 11,914 10,061Real estate and real estate joint ventures (includes $10 and $18, respectively, relating to variable interest entities) . . . . . . . . . . 8,030 6,896Other limited partnership interests (includes $298 and $236, respectively, relating to variable interest entities) . . . . . . . . . . . . 6,416 5,508Short-term investments, principally at estimated fair value . . . . . . . . . . . . . . . . . . . . . . . . . . . . . . . . . . . . . . . . . . . . 9,387 8,374Other invested assets, principally at estimated fair value (includes $104 and $137, respectively, relating to variable interest entities) . . . . . . . . . . 15,430 12,709
Total investments . . . . . . . . . . . . . . . . . . . . . . . . . . . . . . . . . . . . . . . . . . . . . . . . . . . . . . . . . . . . . . . . . . 463,032 327,567Cash and cash equivalents, principally at estimated fair value (includes $69 and $68, respectively, relating to variable interest
entities) . . . . . . . . . . . . . . . . . . . . . . . . . . . . . . . . . . . . . . . . . . . . . . . . . . . . . . . . . . . . . . . . . . . . . . . . . . 13,046 10,112Accrued investment income (includes $34 and $0, respectively, relating to variable interest entities) . . . . . . . . . . . . . . . . . . . 4,381 3,173Premiums, reinsurance and other receivables (includes $2 and $0, respectively, relating to variable interest entities) . . . . . . . . . . 19,830 16,752Deferred policy acquisition costs and value of business acquired . . . . . . . . . . . . . . . . . . . . . . . . . . . . . . . . . . . . . . . . 27,307 19,256Current income tax recoverable . . . . . . . . . . . . . . . . . . . . . . . . . . . . . . . . . . . . . . . . . . . . . . . . . . . . . . . . . . . . . — 316Deferred income tax assets . . . . . . . . . . . . . . . . . . . . . . . . . . . . . . . . . . . . . . . . . . . . . . . . . . . . . . . . . . . . . . . — 1,228Goodwill . . . . . . . . . . . . . . . . . . . . . . . . . . . . . . . . . . . . . . . . . . . . . . . . . . . . . . . . . . . . . . . . . . . . . . . . . . 11,781 5,047Other assets (includes $6 and $16, respectively, relating to variable interest entities) . . . . . . . . . . . . . . . . . . . . . . . . . . . . . 8,192 6,822Separate account assets . . . . . . . . . . . . . . . . . . . . . . . . . . . . . . . . . . . . . . . . . . . . . . . . . . . . . . . . . . . . . . . . 183,337 149,041
Total assets . . . . . . . . . . . . . . . . . . . . . . . . . . . . . . . . . . . . . . . . . . . . . . . . . . . . . . . . . . . . . . . . . . . . . . $730,906 $539,314
Liabilities and EquityLiabilities
Future policy benefits . . . . . . . . . . . . . . . . . . . . . . . . . . . . . . . . . . . . . . . . . . . . . . . . . . . . . . . . . . . . . . . . . $173,373 $135,879Policyholder account balances . . . . . . . . . . . . . . . . . . . . . . . . . . . . . . . . . . . . . . . . . . . . . . . . . . . . . . . . . . . . 211,020 138,673Other policy-related balances . . . . . . . . . . . . . . . . . . . . . . . . . . . . . . . . . . . . . . . . . . . . . . . . . . . . . . . . . . . . 15,806 8,446Policyholder dividends payable . . . . . . . . . . . . . . . . . . . . . . . . . . . . . . . . . . . . . . . . . . . . . . . . . . . . . . . . . . . . 830 761Policyholder dividend obligation . . . . . . . . . . . . . . . . . . . . . . . . . . . . . . . . . . . . . . . . . . . . . . . . . . . . . . . . . . . 876 —Payables for collateral under securities loaned and other transactions . . . . . . . . . . . . . . . . . . . . . . . . . . . . . . . . . . . . 27,272 24,196Bank deposits . . . . . . . . . . . . . . . . . . . . . . . . . . . . . . . . . . . . . . . . . . . . . . . . . . . . . . . . . . . . . . . . . . . . . . 10,316 10,211Short-term debt . . . . . . . . . . . . . . . . . . . . . . . . . . . . . . . . . . . . . . . . . . . . . . . . . . . . . . . . . . . . . . . . . . . . . 306 912Long-term debt (includes $6,902 and $64, respectively, at estimated fair value, relating to variable interest entities) . . . . . . . . . 27,586 13,220Collateral financing arrangements . . . . . . . . . . . . . . . . . . . . . . . . . . . . . . . . . . . . . . . . . . . . . . . . . . . . . . . . . . 5,297 5,297Junior subordinated debt securities . . . . . . . . . . . . . . . . . . . . . . . . . . . . . . . . . . . . . . . . . . . . . . . . . . . . . . . . . 3,191 3,191Current income tax payable . . . . . . . . . . . . . . . . . . . . . . . . . . . . . . . . . . . . . . . . . . . . . . . . . . . . . . . . . . . . . . 316 —Deferred income tax liability . . . . . . . . . . . . . . . . . . . . . . . . . . . . . . . . . . . . . . . . . . . . . . . . . . . . . . . . . . . . . . 1,881 —Other liabilities (includes $93 and $26, respectively, relating to variable interest entities) . . . . . . . . . . . . . . . . . . . . . . . . . 20,386 15,989Separate account liabil it ies . . . . . . . . . . . . . . . . . . . . . . . . . . . . . . . . . . . . . . . . . . . . . . . . . . . . . . . . . . . . . . 183,337 149,041
Total liabilities . . . . . . . . . . . . . . . . . . . . . . . . . . . . . . . . . . . . . . . . . . . . . . . . . . . . . . . . . . . . . . . . . . . . . 681,793 505,816
Contingencies, Commitments and Guarantees (Note 16)Redeemable noncontroll ing interests in partially owned consolidated subsidiaries . . . . . . . . . . . . . . . . . . . . . . . . . . . . . . . 117 —
EquityMetLife, Inc.’s stockholders’ equity:Preferred stock, par value $0.01 per share; 200,000,000 shares authorized:
Preferred stock, 84,000,000 shares issued and outstanding; $2,100 aggregate liquidation preference . . . . . . . . . . . . . . . . . 1 1Convertible preferred stock, 6,857,000 shares issued and outstanding at December 31, 2010 . . . . . . . . . . . . . . . . . . . . . — —
Common stock, par value $0.01 per share; 3,000,000,000 shares authorized; 989,031,704 and 822,359,818 shares issued atDecember 31, 2010 and 2009, respectively; 985,837,817 and 818,833,810 shares outstanding at December 31, 2010 and2009, respectively . . . . . . . . . . . . . . . . . . . . . . . . . . . . . . . . . . . . . . . . . . . . . . . . . . . . . . . . . . . . . . . . . . . 10 8
Additional paid-in capital . . . . . . . . . . . . . . . . . . . . . . . . . . . . . . . . . . . . . . . . . . . . . . . . . . . . . . . . . . . . . . . . . 26,423 16,859Retained earnings . . . . . . . . . . . . . . . . . . . . . . . . . . . . . . . . . . . . . . . . . . . . . . . . . . . . . . . . . . . . . . . . . . . . . 21,363 19,501Treasury stock, at cost; 3,193,887 and 3,526,008 shares at December 31, 2010 and 2009, respectively . . . . . . . . . . . . . . . . (172) (190)Accumulated other comprehensive income (loss) . . . . . . . . . . . . . . . . . . . . . . . . . . . . . . . . . . . . . . . . . . . . . . . . . . 1,000 (3,058)
Total MetLife, Inc.’s stockholders’ equity . . . . . . . . . . . . . . . . . . . . . . . . . . . . . . . . . . . . . . . . . . . . . . . . . . . . . 48,625 33,121Noncontroll ing interests . . . . . . . . . . . . . . . . . . . . . . . . . . . . . . . . . . . . . . . . . . . . . . . . . . . . . . . . . . . . . . . . . 371 377
Total equity . . . . . . . . . . . . . . . . . . . . . . . . . . . . . . . . . . . . . . . . . . . . . . . . . . . . . . . . . . . . . . . . . . . . . . 48,996 33,498
Total liabilities and equity . . . . . . . . . . . . . . . . . . . . . . . . . . . . . . . . . . . . . . . . . . . . . . . . . . . . . . . . . . . . . . $730,906 $539,314
See accompanying notes to the consolidated financial statements.
F-2 MetLife, Inc.

MetLife, Inc.
Consolidated Statements of OperationsFor the Years Ended December 31, 2010, 2009 and 2008
(In millions, except per share data)
2010 2009 2008
RevenuesPremiums . . . . . . . . . . . . . . . . . . . . . . . . . . . . . . . . . . . . . . . . . . . . . . . . . . . . . . . $27,394 $26,460 $25,914Universal life and investment-type product policy fees . . . . . . . . . . . . . . . . . . . . . . . . 6,037 5,203 5,381Net investment income . . . . . . . . . . . . . . . . . . . . . . . . . . . . . . . . . . . . . . . . . . . . . . 17,615 14,837 16,289Other revenues . . . . . . . . . . . . . . . . . . . . . . . . . . . . . . . . . . . . . . . . . . . . . . . . . . . 2,328 2,329 1,586Net investment gains (losses):Other-than-temporary impairments on fixed maturity securities . . . . . . . . . . . . . . . . . . . (682) (2,439) (1,296)Other-than-temporary impairments on fixed maturity securities transferred to other
comprehensive income (loss) . . . . . . . . . . . . . . . . . . . . . . . . . . . . . . . . . . . . . . . . 212 939 —Other net investment gains (losses) . . . . . . . . . . . . . . . . . . . . . . . . . . . . . . . . . . . . . 78 (1,406) (802)
Total net investment gains (losses) . . . . . . . . . . . . . . . . . . . . . . . . . . . . . . . . . (392) (2,906) (2,098)Net derivative gains (losses) . . . . . . . . . . . . . . . . . . . . . . . . . . . . . . . . . . . . . . . . . . (265) (4,866) 3,910
Total revenues . . . . . . . . . . . . . . . . . . . . . . . . . . . . . . . . . . . . . . . . . . . . . . . 52,717 41,057 50,982
ExpensesPolicyholder benefits and claims . . . . . . . . . . . . . . . . . . . . . . . . . . . . . . . . . . . . . . . 29,545 28,336 27,437Interest credited to policyholder account balances . . . . . . . . . . . . . . . . . . . . . . . . . . . 4,925 4,849 4,788Policyholder dividends . . . . . . . . . . . . . . . . . . . . . . . . . . . . . . . . . . . . . . . . . . . . . . 1,486 1,650 1,751Other expenses . . . . . . . . . . . . . . . . . . . . . . . . . . . . . . . . . . . . . . . . . . . . . . . . . . 12,803 10,556 11,947
Total expenses . . . . . . . . . . . . . . . . . . . . . . . . . . . . . . . . . . . . . . . . . . . . . . . 48,759 45,391 45,923
Income (loss) from continuing operations before provision for income tax . . . . . . . . . . . 3,958 (4,334) 5,059Provision for income tax expense (benefit) . . . . . . . . . . . . . . . . . . . . . . . . . . . . . . . . 1,181 (2,015) 1,580
Income (loss) from continuing operations, net of income tax . . . . . . . . . . . . . . . . . . . . 2,777 (2,319) 3,479Income (loss) from discontinued operations, net of income tax . . . . . . . . . . . . . . . . . . . 9 41 (201)
Net income (loss) . . . . . . . . . . . . . . . . . . . . . . . . . . . . . . . . . . . . . . . . . . . . . . . . . 2,786 (2,278) 3,278Less: Net income (loss) attributable to noncontrolling interests . . . . . . . . . . . . . . . . . . . (4) (32) 69
Net income (loss) attributable to MetLife, Inc. . . . . . . . . . . . . . . . . . . . . . . . . . . . . . . 2,790 (2,246) 3,209Less: Preferred stock dividends . . . . . . . . . . . . . . . . . . . . . . . . . . . . . . . . . . . . . . . . 122 122 125
Net income (loss) available to MetLife, Inc.’s common shareholders . . . . . . . . . . . . . . . $ 2,668 $ (2,368) $ 3,084
Income (loss) from continuing operations, net of income tax, available to MetLife, Inc.’scommon shareholders per common share:Basic . . . . . . . . . . . . . . . . . . . . . . . . . . . . . . . . . . . . . . . . . . . . . . . . . . . . . . . . $ 3.01 $ (2.94) $ 4.60
Diluted . . . . . . . . . . . . . . . . . . . . . . . . . . . . . . . . . . . . . . . . . . . . . . . . . . . . . . . $ 2.99 $ (2.94) $ 4.54
Net income (loss) available to MetLife, Inc.’s common shareholders per common share:Basic . . . . . . . . . . . . . . . . . . . . . . . . . . . . . . . . . . . . . . . . . . . . . . . . . . . . . . . . $ 3.02 $ (2.89) $ 4.19
Diluted . . . . . . . . . . . . . . . . . . . . . . . . . . . . . . . . . . . . . . . . . . . . . . . . . . . . . . . $ 3.00 $ (2.89) $ 4.14
Cash dividends per common share . . . . . . . . . . . . . . . . . . . . . . . . . . . . . . . . . . . . . $ 0.74 $ 0.74 $ 0.74
See accompanying notes to the consolidated financial statements.
F-3MetLife, Inc.

Me
tLif
e,
Inc
.
Co
nso
lid
ate
dS
tate
me
nts
of
Eq
uit
yF
or
the
Ye
ar
En
de
dD
ec
em
be
r31
,20
10(I
nm
illi
on
s)
Pre
ferr
ed
Sto
ck
Co
nve
rtib
leP
refe
rre
dS
toc
kC
om
mo
nS
toc
k
Ad
dit
ion
al
Pa
id-i
nC
ap
ita
lR
eta
ine
dE
arn
ing
s
Tre
as
ury
Sto
ck
at
Co
st
Ne
tU
nre
ali
zed
Inve
stm
en
tG
ain
s(L
os
se
s)
Oth
er-
Th
an
-Te
mp
ora
ryIm
pa
irm
en
ts
Fo
reig
nC
urr
en
cy
Tra
ns
lati
on
Ad
jus
tme
nts
De
fin
ed
Be
ne
fit
Pla
ns
Ad
jus
tme
nt
Tota
lM
etL
ife
,In
c.’
sS
toc
kh
old
ers
’E
qu
ity
No
nc
on
tro
llin
gIn
tere
sts
(1)
Tota
lE
qu
ity
Ac
cu
mu
late
dO
the
rC
om
pre
he
ns
ive
Inc
om
e(L
os
s)
Bal
ance
atD
ecem
ber
31,
2009
..
..
..
..
.$1
$—$
8$1
6,85
9$1
9,50
1$(
190)
$(8
17)
$(51
3)$(
183)
$(1,
545)
$33,
121
$377
$33,
498
Cum
ulat
ive
effe
ctof
chan
gein
acco
untin
gpr
inci
ple,
neto
finc
ome
tax
(Not
e1)
..
..
.(1
2)31
1130
30B
alan
ceat
Janu
ary
1,20
10.
..
..
..
..
..
1—
816
,859
19,4
89(1
90)
(786
)(5
02)
(183
)(1
,545
)33
,151
377
33,5
28C
umul
ativ
eef
fect
ofch
ange
inac
coun
ting
prin
cipl
e,ne
tofi
ncom
eta
x(N
ote
1).
..
..
(10)
10—
—C
onve
rtib
lepr
efer
red
stoc
kis
suan
ce.
..
..
.—
2,80
52,
805
2,80
5C
omm
onst
ock
issu
ance
—ne
wly
issu
edsh
ares
rela
ted
tobu
sine
ssac
quis
ition
..
..
26,
727
6,72
96,
729
Issu
ance
ofst
ock
purc
hase
cont
ract
sre
late
dto
com
mon
equi
tyun
its.
..
..
..
..
..
..
(69)
(69)
(69)
Sto
ck-b
ased
com
pens
atio
n.
..
..
..
..
..
101
1811
911
9D
ivid
ends
onpr
efer
red
stoc
k.
..
..
..
..
..
(122
)(1
22)
(122
)D
ivid
ends
onco
mm
onst
ock
..
..
..
..
..
.(7
84)
(784
)(7
84)
Cha
nge
ineq
uity
ofno
ncon
trol
ling
inte
rest
s.
.(9
)(9
)C
ompr
ehen
sive
inco
me
(loss
):N
etin
com
e(lo
ss)
..
..
..
..
..
..
..
..
2,79
02,
790
(2)
2,78
8O
ther
com
preh
ensi
vein
com
e(lo
ss):
Unr
ealiz
edga
ins
(loss
es)o
nde
rivat
ive
inst
rum
ents
,ne
tofi
ncom
eta
x.
..
..
.11
1111
Unr
ealiz
edin
vest
men
tgai
ns(lo
sses
),ne
tof
rela
ted
offs
ets
and
inco
me
tax
..
..
4,12
113
64,
257
(3)
4,25
4Fo
reig
ncu
rren
cytra
nsla
tion
adju
stm
ents
,ne
tofi
ncom
eta
x.
..
..
..
..
..
..
.(3
58)
(358
)8
(350
)D
efin
edbe
nefit
plan
sad
just
men
t,ne
tof
inco
me
tax
..
..
..
..
..
..
..
..
..
9696
96O
ther
com
preh
ensi
vein
com
e(lo
ss)
..
..
4,00
65
4,01
1C
ompr
ehen
sive
inco
me
(loss
).
..
..
..
..
6,79
63
6,79
9B
alan
ceat
Dec
embe
r31
,20
10.
..
..
..
..
$1$—
$10
$26,
423
$21,
363
$(17
2)$3
,356
$(36
6)$(
541)
$(1,
449)
$48,
625
$371
$48,
996
(1)
Net
inco
me
(loss
)at
trib
utab
leto
no
nco
ntr
olli
ngin
tere
sts
excl
ude
sg
ains
(loss
es)
of
red
eem
able
non
cont
rolli
ngin
tere
sts
inp
artia
llyo
wne
dc
on
solid
ated
sub
sid
iarie
so
f($
2)
mill
ion
.
Se
eac
com
pan
yin
gno
tes
toth
ec
on
solid
ated
finan
cia
lsta
tem
ent
s.
F-4 MetLife, Inc.

Me
tLif
e,
Inc
.
Co
nso
lid
ate
dS
tate
me
nts
of
Eq
uit
y—
(Co
nti
nu
ed
)F
or
the
Ye
ar
En
de
dD
ec
em
be
r3
1,
20
09
(In
mil
lio
ns)
Pre
ferr
ed
Sto
ck
Co
mm
on
Sto
ck
Ad
dit
ion
al
Pa
id-i
nC
ap
ita
lR
eta
ine
dE
arn
ing
s
Tre
as
ury
Sto
ck
at
Co
st
Ne
tU
nre
ali
zed
Inve
stm
en
tG
ain
s(L
os
se
s)
Oth
er-
Th
an
-Te
mp
ora
ryIm
pa
irm
en
ts
Fo
reig
nC
urr
en
cy
Tra
ns
lati
on
Ad
jus
tme
nts
De
fin
ed
Be
ne
fit
Pla
ns
Ad
jus
tme
nt
Tota
lM
etL
ife
,In
c.’
sS
toc
kh
old
ers
’E
qu
ity
No
nc
on
tro
llin
gIn
tere
sts
Tota
lE
qu
ity
Ac
cu
mu
late
dO
the
rC
om
pre
he
ns
ive
Inc
om
e(L
os
s)
Bal
anc
eat
De
cem
ber
31
,2
00
8.
..
..
..
..
.$1
$8$1
5,8
11
$22
,40
3$(
23
6)$(
12
,56
4)$
—$(
24
6)$(
1,4
43)
$23
,73
4$2
51
$23
,98
5C
umu
lativ
ee
ffe
cto
fc
hang
ein
acco
unt
ing
prin
cip
le,
net
of
inc
om
eta
x(N
ote
1)
..
..
..
76
(76)
——
Co
mm
on
sto
ckis
suan
ce—
new
lyis
sued
shar
es
..
..
..
..
..
..
..
..
..
..
..
..
.1
,03
51
,03
51
,03
5Tr
eas
ury
sto
ck
tran
sact
ion
s,n
et.
..
..
..
..
.(7
)1
47
7S
toc
k-b
ased
co
mp
ens
atio
n.
..
..
..
..
..
..
20
32
52
52
Div
ide
nds
on
pre
ferr
ed
sto
ck
..
..
..
..
..
..
(12
2)(1
22)
(12
2)D
ivid
end
so
nc
om
mo
nst
oc
k.
..
..
..
..
..
.(6
10)
(61
0)(6
10)
Cha
nge
ineq
uity
of
no
nco
ntro
llin
gin
tere
sts
..
16
91
69
Co
mp
reh
ensi
vein
co
me
(loss
):N
et
inc
om
e(lo
ss)
..
..
..
..
..
..
..
..
..
(2,2
46)
(2,2
46)
(32)
(2,2
78)
Oth
erc
om
pre
hen
sive
inc
om
e(lo
ss):
Un
real
ize
dg
ain
s(lo
sse
s)o
nd
eriv
ativ
ein
stru
men
ts,
net
of
inco
me
tax
..
..
..
.(1
16)
(11
6)(1
16)
Un
real
ized
inve
stm
ent
gai
ns
(loss
es)
,ne
to
fre
late
do
ffse
tsan
din
co
me
tax
..
..
.1
1,8
63
(43
7)1
1,4
26
(11)
11
,41
5Fo
reig
ncu
rre
ncy
tran
slat
ion
adju
stm
ent
s,n
eto
fin
com
eta
x.
..
..
..
..
..
..
..
63
63
63
De
fined
be
nefit
pla
ns
adju
stm
ent,
net
of
inc
om
eta
x.
..
..
..
..
..
..
..
..
..
.(1
02)
(10
2)(1
02)
Oth
erc
om
pre
hen
sive
inc
om
e(lo
ss)
..
..
.1
1,2
71
(11)
11
,26
0
Co
mp
reh
ensi
vein
co
me
(loss
).
..
..
..
..
.9
,02
5(4
3)8
,98
2
Bal
anc
eat
De
cem
ber
31
,2
00
9.
..
..
..
..
.$1
$8$1
6,8
59
$19
,50
1$(
19
0)$
(81
7)$(
51
3)$(
18
3)$(
1,5
45)
$33
,12
1$3
77
$33
,49
8
Se
eac
com
pan
yin
gno
tes
toth
ec
on
solid
ated
finan
cia
lsta
tem
ent
s.
F-5MetLife, Inc.
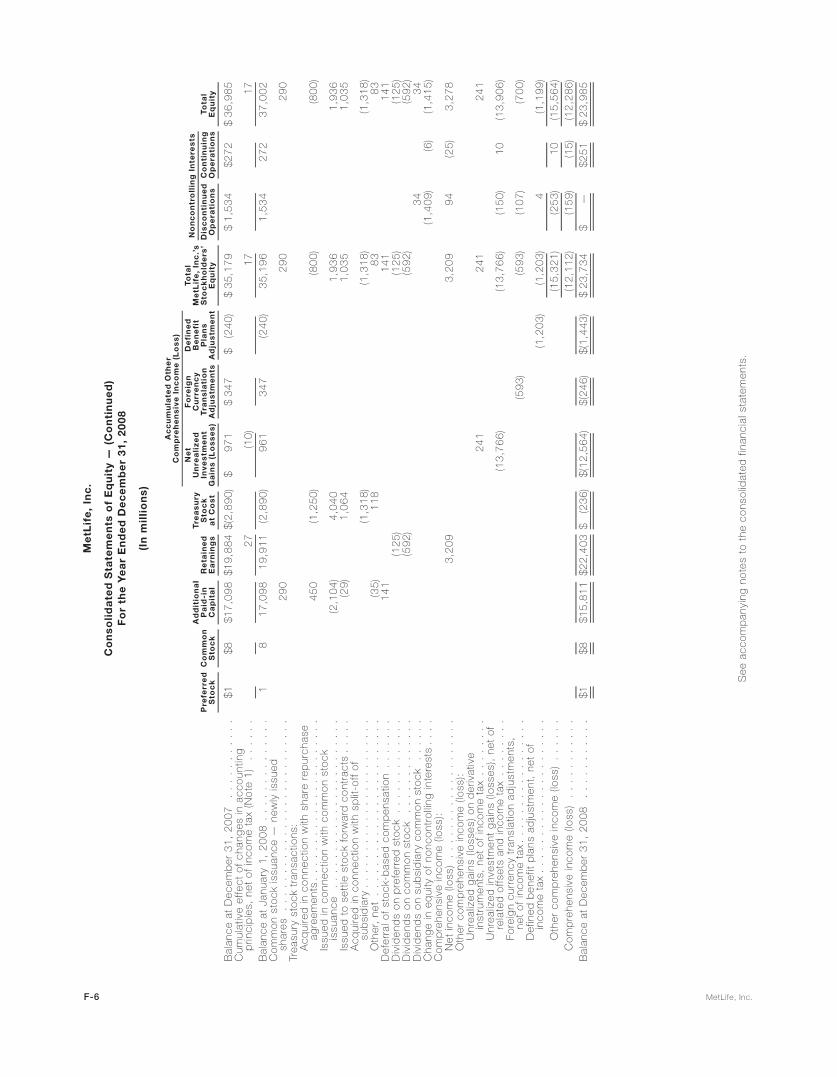
Me
tLif
e,
Inc
.
Co
nso
lid
ate
dS
tate
me
nts
of
Eq
uit
y—
(Co
nti
nu
ed
)F
or
the
Ye
ar
En
de
dD
ec
em
be
r3
1,
20
08
(In
mil
lio
ns)
Pre
ferr
ed
Sto
ck
Co
mm
on
Sto
ck
Ad
dit
ion
al
Pa
id-i
nC
ap
ita
lR
eta
ine
dE
arn
ing
s
Tre
as
ury
Sto
ck
at
Co
st
Ne
tU
nre
ali
zed
Inve
stm
en
tG
ain
s(L
os
se
s)
Fo
reig
nC
urr
en
cy
Tra
ns
lati
on
Ad
jus
tme
nts
De
fin
ed
Be
ne
fit
Pla
ns
Ad
jus
tme
nt
Tota
lM
etL
ife
,In
c.’
sS
toc
kh
old
ers
’E
qu
ity
Dis
co
nti
nu
ed
Op
era
tio
ns
Co
nti
nu
ing
Op
era
tio
ns
Tota
lE
qu
ity
Ac
cu
mu
late
dO
the
rC
om
pre
he
ns
ive
Inc
om
e(L
os
s)
No
nc
on
tro
llin
gIn
tere
sts
Bal
anc
eat
De
cem
ber
31
,2
00
7.
..
..
..
..
..
$1$8
$17
,09
8$1
9,8
84
$(2
,89
0)$
97
1$
34
7$
(24
0)$
35
,17
9$
1,5
34
$27
2$
36
,98
5C
umu
lativ
ee
ffe
cto
fc
hang
esin
acco
untin
gp
rinci
ple
s,n
et
of
inc
om
eta
x(N
ote
1)
..
..
..
27
(10)
17
17
Bal
anc
eat
Jan
uar
y1
,2
00
8.
..
..
..
..
..
..
.1
81
7,0
98
19
,91
1(2
,89
0)9
61
34
7(2
40)
35
,19
61
,53
42
72
37
,00
2C
om
mo
nst
ock
issu
ance
—ne
wly
issu
edsh
are
s.
..
..
..
..
..
..
..
..
..
..
..
..
.2
90
29
02
90
Tre
asu
ryst
oc
ktr
ansa
ctio
ns:
Acq
uire
din
co
nne
ctio
nw
ithsh
are
rep
urc
has
eag
ree
men
ts.
..
..
..
..
..
..
..
..
..
..
.4
50
(1,2
50)
(80
0)(8
00)
Issu
ed
inc
on
nect
ion
with
co
mm
on
sto
ck
issu
ance
..
..
..
..
..
..
..
..
..
..
..
.(2
,10
4)4
,04
01
,93
61
,93
6Is
sue
dto
sett
lest
oc
kfo
rwar
dco
ntra
cts
..
..
.(2
9)1
,06
41
,03
51
,03
5A
cqu
ired
inc
on
nect
ion
with
split
-off
of
sub
sid
iary
..
..
..
..
..
..
..
..
..
..
..
.(1
,31
8)(1
,31
8)(1
,31
8)O
ther
,n
et
..
..
..
..
..
..
..
..
..
..
..
..
(35)
11
88
38
3D
efe
rral
of
sto
ck-
bas
edc
om
pe
nsat
ion
..
..
..
.1
41
14
11
41
Div
ide
nds
on
pre
ferr
ed
sto
ck
..
..
..
..
..
..
.(1
25)
(12
5)(1
25)
Div
ide
nds
on
co
mm
on
sto
ck
..
..
..
..
..
..
.(5
92)
(59
2)(5
92)
Div
ide
nds
on
sub
sid
iary
com
mo
nst
oc
k.
..
..
.3
43
4C
hang
ein
equ
ityo
fn
on
cont
rolli
ng
inte
rest
s.
..
.(1
,40
9)(6
)(1
,41
5)C
om
pre
hen
sive
inc
om
e(lo
ss):
Ne
tin
co
me
(loss
).
..
..
..
..
..
..
..
..
..
3,2
09
3,2
09
94
(25)
3,2
78
Oth
erc
om
pre
hen
sive
inc
om
e(lo
ss):
Un
real
ize
dg
ain
s(lo
sse
s)o
nd
eriv
ativ
ein
stru
men
ts,
net
of
inco
me
tax
..
..
..
..
24
12
41
24
1U
nrea
lized
inve
stm
ent
gai
ns
(loss
es),
net
of
rela
ted
off
sets
and
inc
om
eta
x.
..
..
..
.(1
3,7
66)
(13
,76
6)(1
50)
10
(13
,90
6)Fo
reig
ncu
rre
ncy
tran
slat
ion
adju
stm
ent
s,n
eto
fin
com
eta
x.
..
..
..
..
..
..
..
..
(59
3)(5
93)
(10
7)(7
00)
De
fined
be
nefit
pla
ns
adju
stm
ent,
net
of
inc
om
eta
x.
..
..
..
..
..
..
..
..
..
..
(1,2
03)
(1,2
03)
4(1
,19
9)O
ther
co
mp
reh
ensi
vein
co
me
(loss
).
..
..
.(1
5,3
21)
(25
3)1
0(1
5,5
64)
Co
mp
reh
ensi
vein
co
me
(loss
).
..
..
..
..
..
(12
,11
2)(1
59)
(15)
(12
,28
6)B
alan
ce
atD
ece
mb
er3
1,
20
08
..
..
..
..
..
.$1
$8$1
5,8
11
$22
,40
3$
(23
6)$(
12
,56
4)$(
24
6)$(
1,4
43)
$2
3,7
34
$—
$25
1$
23
,98
5
Se
eac
com
pan
yin
gno
tes
toth
ec
on
solid
ated
finan
cia
lsta
tem
ent
s.
F-6 MetLife, Inc.

MetLife, Inc.
Consolidated Statements of Cash FlowsFor the Years Ended December 31, 2010, 2009 and 2008
(In millions)2010 2009 2008
Cash flows from operating activitiesNet income (loss) . . . . . . . . . . . . . . . . . . . . . . . . . . . . . . . . . . . . . . . . . . . . . . . . . . . . . $ 2,786 $ (2,278) $ 3,278Adjustments to reconcile net income (loss) to net cash provided by operating activities:
Depreciation and amortization expenses . . . . . . . . . . . . . . . . . . . . . . . . . . . . . . . . . . . 585 520 375Amortization of premiums and accretion of discounts associated with investments, net . . . . . (1,078) (967) (939)(Gains) losses on investments and derivatives and from sales of businesses, net . . . . . . . . . 854 7,715 (1,127)Undistributed equity earnings of real estate joint ventures and other limited partnership
interests . . . . . . . . . . . . . . . . . . . . . . . . . . . . . . . . . . . . . . . . . . . . . . . . . . . . . . . (430) 1,118 679Interest credited to policyholder account balances . . . . . . . . . . . . . . . . . . . . . . . . . . . . . 4,925 4,852 4,911Interest credited to bank deposits . . . . . . . . . . . . . . . . . . . . . . . . . . . . . . . . . . . . . . . . 137 163 166Universal life and investment-type product policy fees . . . . . . . . . . . . . . . . . . . . . . . . . . . (6,037) (5,218) (5,462)Change in trading and other securities . . . . . . . . . . . . . . . . . . . . . . . . . . . . . . . . . . . . . (1,369) (1,152) (418)Change in residential mortgage loans held-for-sale, net . . . . . . . . . . . . . . . . . . . . . . . . . . (487) (800) (1,946)Change in mortgage servicing rights . . . . . . . . . . . . . . . . . . . . . . . . . . . . . . . . . . . . . . (165) (687) (185)Change in accrued investment income . . . . . . . . . . . . . . . . . . . . . . . . . . . . . . . . . . . . (206) (110) 428Change in premiums, reinsurance and other receivables . . . . . . . . . . . . . . . . . . . . . . . . . (1,023) (1,653) (1,929)Change in deferred policy acquisition costs, net . . . . . . . . . . . . . . . . . . . . . . . . . . . . . . (541) (1,837) 545Change in income tax recoverable (payable) . . . . . . . . . . . . . . . . . . . . . . . . . . . . . . . . . 1,292 (2,614) 920Change in other assets . . . . . . . . . . . . . . . . . . . . . . . . . . . . . . . . . . . . . . . . . . . . . . 1,948 (660) 5,737Change in insurance-related liabilities and policy-related balances . . . . . . . . . . . . . . . . . . . 6,489 6,401 5,307Change in other liabilities . . . . . . . . . . . . . . . . . . . . . . . . . . . . . . . . . . . . . . . . . . . . . (315) 865 163Other, net . . . . . . . . . . . . . . . . . . . . . . . . . . . . . . . . . . . . . . . . . . . . . . . . . . . . . . . 631 145 199
Net cash provided by operating activities . . . . . . . . . . . . . . . . . . . . . . . . . . . . . . . . . . . . . . 7,996 3,803 10,702
Cash flows from investing activitiesSales, maturities and repayments of:
Fixed maturity securities . . . . . . . . . . . . . . . . . . . . . . . . . . . . . . . . . . . . . . . . . . . . . . 86,529 64,428 102,250Equity securities . . . . . . . . . . . . . . . . . . . . . . . . . . . . . . . . . . . . . . . . . . . . . . . . . . . 1,371 2,545 2,707Mortgage loans . . . . . . . . . . . . . . . . . . . . . . . . . . . . . . . . . . . . . . . . . . . . . . . . . . . . 6,361 5,769 6,077Real estate and real estate joint ventures . . . . . . . . . . . . . . . . . . . . . . . . . . . . . . . . . . . 322 43 140Other limited partnership interests . . . . . . . . . . . . . . . . . . . . . . . . . . . . . . . . . . . . . . . . 522 947 593
Purchases of:Fixed maturity securities . . . . . . . . . . . . . . . . . . . . . . . . . . . . . . . . . . . . . . . . . . . . . . (100,713) (83,940) (86,874)Equity securities . . . . . . . . . . . . . . . . . . . . . . . . . . . . . . . . . . . . . . . . . . . . . . . . . . . (949) (1,986) (1,494)Mortgage loans . . . . . . . . . . . . . . . . . . . . . . . . . . . . . . . . . . . . . . . . . . . . . . . . . . . . (8,967) (4,692) (10,096)Real estate and real estate joint ventures . . . . . . . . . . . . . . . . . . . . . . . . . . . . . . . . . . . (786) (579) (1,170)Other limited partnership interests . . . . . . . . . . . . . . . . . . . . . . . . . . . . . . . . . . . . . . . . (1,008) (803) (1,643)
Cash received in connection with freestanding derivatives . . . . . . . . . . . . . . . . . . . . . . . . . 1,814 3,292 8,168Cash paid in connection with freestanding derivatives . . . . . . . . . . . . . . . . . . . . . . . . . . . . (2,548) (5,393) (6,454)Sales of businesses, net of cash and cash equivalents disposed of $0, $180 and $0,
respectively . . . . . . . . . . . . . . . . . . . . . . . . . . . . . . . . . . . . . . . . . . . . . . . . . . . . . . — (50) (4)Disposal of subsidiary . . . . . . . . . . . . . . . . . . . . . . . . . . . . . . . . . . . . . . . . . . . . . . . . . — (19) (313)Purchases of businesses, net of cash and cash equivalents acquired of $4,175, $0 and $314,
respectively . . . . . . . . . . . . . . . . . . . . . . . . . . . . . . . . . . . . . . . . . . . . . . . . . . . . . . (3,021) — (469)Net change in policy loans . . . . . . . . . . . . . . . . . . . . . . . . . . . . . . . . . . . . . . . . . . . . . . (225) (259) (467)Net change in short-term investments . . . . . . . . . . . . . . . . . . . . . . . . . . . . . . . . . . . . . . 3,033 5,534 (11,269)Net change in other invested assets . . . . . . . . . . . . . . . . . . . . . . . . . . . . . . . . . . . . . . . 137 1,388 (2,206)Other, net . . . . . . . . . . . . . . . . . . . . . . . . . . . . . . . . . . . . . . . . . . . . . . . . . . . . . . . . . (186) (160) (147)
Net cash used in investing activities . . . . . . . . . . . . . . . . . . . . . . . . . . . . . . . . . . . . . . . . . $ (18,314) $(13,935) $ (2,671)
See accompanying notes to the consolidated financial statements.
F-7MetLife, Inc.

MetLife, Inc.
Consolidated Statements of Cash Flows — (Continued)For the Years Ended December 31, 2010, 2009 and 2008
(In millions)
2010 2009 2008
Cash flows from financing activitiesPolicyholder account balances:
Deposits . . . . . . . . . . . . . . . . . . . . . . . . . . . . . . . . . . . . . . . . . . . . . . . . . . . . . . . . . . . . . . . . . . . $ 74,296 $ 77,517 $ 70,051Withdrawals . . . . . . . . . . . . . . . . . . . . . . . . . . . . . . . . . . . . . . . . . . . . . . . . . . . . . . . . . . . . . . . . . (69,739) (79,799) (56,406)
Net change in payables for collateral under securities loaned and other transactions . . . . . . . . . . . . . . . . . . . . . . . . 3,076 (6,863) (13,077)Net change in bank deposits . . . . . . . . . . . . . . . . . . . . . . . . . . . . . . . . . . . . . . . . . . . . . . . . . . . . . . . . . (32) 3,164 2,185Net change in short-term debt . . . . . . . . . . . . . . . . . . . . . . . . . . . . . . . . . . . . . . . . . . . . . . . . . . . . . . . . (606) (1,747) 1,992Long-term debt issued . . . . . . . . . . . . . . . . . . . . . . . . . . . . . . . . . . . . . . . . . . . . . . . . . . . . . . . . . . . . 5,090 2,961 339Long-term debt repaid . . . . . . . . . . . . . . . . . . . . . . . . . . . . . . . . . . . . . . . . . . . . . . . . . . . . . . . . . . . . (1,061) (555) (422)Collateral financing arrangements issued . . . . . . . . . . . . . . . . . . . . . . . . . . . . . . . . . . . . . . . . . . . . . . . . . . — 105 310Cash received in connection with collateral financing arrangements . . . . . . . . . . . . . . . . . . . . . . . . . . . . . . . . . . — 775 —Cash paid in connection with collateral financing arrangements . . . . . . . . . . . . . . . . . . . . . . . . . . . . . . . . . . . . . — (400) (800)Junior subordinated debt securities issued . . . . . . . . . . . . . . . . . . . . . . . . . . . . . . . . . . . . . . . . . . . . . . . . . — 500 750Debt issuance costs . . . . . . . . . . . . . . . . . . . . . . . . . . . . . . . . . . . . . . . . . . . . . . . . . . . . . . . . . . . . . . (14) (30) (34)Common stock issued, net of issuance costs . . . . . . . . . . . . . . . . . . . . . . . . . . . . . . . . . . . . . . . . . . . . . . . 3,576 — 290Common stock issued to settle stock forward contracts . . . . . . . . . . . . . . . . . . . . . . . . . . . . . . . . . . . . . . . . . — 1,035 —Treasury stock acquired in connection with share repurchase agreements . . . . . . . . . . . . . . . . . . . . . . . . . . . . . . . — — (1,250)Treasury stock issued in connection with common stock issuance, net of issuance costs . . . . . . . . . . . . . . . . . . . . . . — — 1,936Treasury stock issued to settle stock forward contracts . . . . . . . . . . . . . . . . . . . . . . . . . . . . . . . . . . . . . . . . . — — 1,035Dividends on preferred stock . . . . . . . . . . . . . . . . . . . . . . . . . . . . . . . . . . . . . . . . . . . . . . . . . . . . . . . . . (122) (122) (125)Dividends on common stock . . . . . . . . . . . . . . . . . . . . . . . . . . . . . . . . . . . . . . . . . . . . . . . . . . . . . . . . . (784) (610) (592)Other, net . . . . . . . . . . . . . . . . . . . . . . . . . . . . . . . . . . . . . . . . . . . . . . . . . . . . . . . . . . . . . . . . . . . . (299) (34) 7
Net cash provided by (used in) financing activities . . . . . . . . . . . . . . . . . . . . . . . . . . . . . . . . . . . . . . . . . . . . . . 13,381 (4,103) 6,189
Effect of change in foreign currency exchange rates on cash and cash equivalents balances . . . . . . . . . . . . . . . . . . . . . (129) 108 (349)
Change in cash and cash equivalents . . . . . . . . . . . . . . . . . . . . . . . . . . . . . . . . . . . . . . . . . . . . . . . . . . . . . 2,934 (14,127) 13,871Cash and cash equivalents, beginning of year . . . . . . . . . . . . . . . . . . . . . . . . . . . . . . . . . . . . . . . . . . . . . . . . 10,112 24,239 10,368
Cash and cash equivalents, end of year . . . . . . . . . . . . . . . . . . . . . . . . . . . . . . . . . . . . . . . . . . . . . . . . . $ 13,046 $ 10,112 $ 24,239
Cash and cash equivalents, subsidiaries held-for-sale, beginning of year . . . . . . . . . . . . . . . . . . . . . . . . . . . . . . . . $ — $ 32 $ 407
Cash and cash equivalents, subsidiaries held-for-sale, end of year . . . . . . . . . . . . . . . . . . . . . . . . . . . . . . . $ — $ — $ 32
Cash and cash equivalents, from continuing operations, beginning of year . . . . . . . . . . . . . . . . . . . . . . . . . . . . . . . . $ 10,112 $ 24,207 $ 9,961
Cash and cash equivalents, from continuing operations, end of year . . . . . . . . . . . . . . . . . . . . . . . . . . . . . . $ 13,046 $ 10,112 $ 24,207
Supplemental disclosures of cash flow information:Net cash paid (received) during the year for:
Interest . . . . . . . . . . . . . . . . . . . . . . . . . . . . . . . . . . . . . . . . . . . . . . . . . . . . . . . . . . . . . . . . . . . . $ 1,489 $ 989 $ 1,107
Income tax . . . . . . . . . . . . . . . . . . . . . . . . . . . . . . . . . . . . . . . . . . . . . . . . . . . . . . . . . . . . . . . . . . $ (23) $ 397 $ 27
Non-cash transactions during the year:Business acquisitions:
Assets acquired . . . . . . . . . . . . . . . . . . . . . . . . . . . . . . . . . . . . . . . . . . . . . . . . . . . . . . . . . . . . . . $ 125,689 $ — $ 2,083Liabilit ies assumed . . . . . . . . . . . . . . . . . . . . . . . . . . . . . . . . . . . . . . . . . . . . . . . . . . . . . . . . . . . . (109,267) — (1,300)Redeemable and non-redeemable noncontroll ing interests assumed . . . . . . . . . . . . . . . . . . . . . . . . . . . . . . . (130) — —
Net assets acquired . . . . . . . . . . . . . . . . . . . . . . . . . . . . . . . . . . . . . . . . . . . . . . . . . . . . . . . . . . . 16,292 — 783Cash paid, excluding transaction costs of $88, $0 and $0, respectively . . . . . . . . . . . . . . . . . . . . . . . . . . . . . (7,196) — (783)Other purchase price adjustments . . . . . . . . . . . . . . . . . . . . . . . . . . . . . . . . . . . . . . . . . . . . . . . . . . . 98 — —
Securities issued . . . . . . . . . . . . . . . . . . . . . . . . . . . . . . . . . . . . . . . . . . . . . . . . . . . . . . . . . . . . . $ 9,194 $ — $ —
Disposal of subsidiary:Assets disposed . . . . . . . . . . . . . . . . . . . . . . . . . . . . . . . . . . . . . . . . . . . . . . . . . . . . . . . . . . . . . $ — $ — $ 22,135Liabilit ies disposed . . . . . . . . . . . . . . . . . . . . . . . . . . . . . . . . . . . . . . . . . . . . . . . . . . . . . . . . . . . . — — (20,689)
Net assets disposed . . . . . . . . . . . . . . . . . . . . . . . . . . . . . . . . . . . . . . . . . . . . . . . . . . . . . . . . . . . — — 1,446Cash disposed . . . . . . . . . . . . . . . . . . . . . . . . . . . . . . . . . . . . . . . . . . . . . . . . . . . . . . . . . . . . . . — — 270Transaction costs, including cash paid of $0, $19 and $43, respectively . . . . . . . . . . . . . . . . . . . . . . . . . . . . . — 2 60Treasury stock received in common stock exchange . . . . . . . . . . . . . . . . . . . . . . . . . . . . . . . . . . . . . . . . . — — (1,318)
Loss on disposal of subsidiary . . . . . . . . . . . . . . . . . . . . . . . . . . . . . . . . . . . . . . . . . . . . . . . . . . . . . $ — $ 2 $ 458
Remarketing of debt securities:Fixed maturity securities redeemed . . . . . . . . . . . . . . . . . . . . . . . . . . . . . . . . . . . . . . . . . . . . . . . . . . . $ — $ 32 $ 32
Long-term debt issued . . . . . . . . . . . . . . . . . . . . . . . . . . . . . . . . . . . . . . . . . . . . . . . . . . . . . . . . . . $ — $ 1,035 $ 1,035
Junior subordinated debt securities redeemed . . . . . . . . . . . . . . . . . . . . . . . . . . . . . . . . . . . . . . . . . . . . $ — $ 1,067 $ 1,067
Purchase money mortgage loans on sales of real estate joint ventures . . . . . . . . . . . . . . . . . . . . . . . . . . . . . . . . . $ 2 $ 93 $ —
Fixed maturity securities received in connection with insurance contract commutation . . . . . . . . . . . . . . . . . . . . . . . . $ — $ — $ 115
Real estate and real estate joint ventures acquired in satisfaction of debt . . . . . . . . . . . . . . . . . . . . . . . . . . . . . . . $ 93 $ 211 $ 1
See accompanying notes to the consolidated financial statements.
F-8 MetLife, Inc.

MetLife, Inc.
Notes to the Consolidated Financial Statements1. Business, Basis of Presentation and Summary of Significant Accounting Policies
Business“MetLife” or the “Company” refers to MetLife, Inc., a Delaware corporation incorporated in 1999 (the “Holding Company”), its subsidiaries
and affiliates. MetLife is a leading global provider of insurance, annuities and employee benefit programs throughout the United States,Japan, Latin America, Asia Pacific and Europe and the Middle East. Through its subsidiaries and affiliates, MetLife offers life insurance,annuities, auto and homeowners insurance, mortgage and deposit products and other financial services to individuals, as well as groupinsurance and retirement & savings products and services to corporations and other institutions.
Basis of PresentationThe accompanying consolidated financial statements include the accounts of the Holding Company and its subsidiaries, as well as
partnerships and joint ventures in which the Company has control, and variable interest entities (“VIEs”) for which the Company is the primarybeneficiary. See “— Adoption of New Accounting Pronouncements.” Closed block assets, liabilities, revenues and expenses are combinedon a line-by-line basis with the assets, liabilities, revenues and expenses outside the closed block based on the nature of the particular item.See Note 10. Intercompany accounts and transactions have been eliminated.
On November 1, 2010 (the “Acquisition Date”), MetLife, Inc. completed the acquisition of American Life Insurance Company (“AmericanLife”) from ALICO Holdings LLC (“ALICO Holdings”), a subsidiary of American International Group, Inc. (“AIG”), and Delaware American LifeInsurance Company (“DelAm”) from AIG, (American Life, together with DelAm, collectively, “ALICO”) (the “Acquisition”) for a total purchaseprice of $16.4 billion. The Acquisition has been accounted for using the acquisition method of accounting, which requires, among otherthings, that the consideration transferred be measured at fair value at the Acquisition Date and that most assets acquired and liabilitiesassumed be recognized at their estimated fair values as of the Acquisition Date. In addition, acquisition-related transaction costs areexpensed as incurred. Any excess of the purchase price consideration over the assigned values of the net assets acquired is recorded asgoodwill. ALICO’s fiscal year-end is November 30. Accordingly, the Company’s consolidated financial statements reflect the assets andliabilities of ALICO as of November 30, 2010 and the operating results of ALICO from the Acquisition Date through November 30, 2010. SeeNote 2.
Certain amounts in the prior years’ consolidated financial statements have been reclassified to conform with the 2010 presentation. Suchreclassifications include:
• Reclassification from other net investment gains (losses) of ($4,866) million and $3,910 million to net derivative gains (losses) in theconsolidated statements of operations for the years ended December 31, 2009 and 2008, respectively;
• Reclassification from net change in other invested assets of $3,292 million and $8,168 million to cash received in connection withfreestanding derivatives and ($5,393) million and ($6,454) million to cash paid in connection with freestanding derivatives, all withincash flows from investing activities, in the consolidated statements of cash flows for the years ended December 31, 2009 and 2008,respectively; and
• Realignment that affected assets, liabilities and results of operations on a segment basis with no impact to the consolidated results. SeeNote 22.
See Note 23 for reclassifications related to discontinued operations.
Summary of Significant Accounting Policies and Critical Accounting EstimatesThe preparation of financial statements in conformity with accounting principles generally accepted in the United States of America
(“GAAP”) requires management to adopt accounting policies and make estimates and assumptions that affect amounts reported in theconsolidated financial statements.
A description of critical estimates is incorporated within the discussion of the related accounting policies which follows. In applying thesepolicies, management makes subjective and complex judgments that frequently require estimates about matters that are inherentlyuncertain. Many of these policies, estimates and related judgments are common in the insurance and financial services industries; othersare specific to the Company’s businesses and operations. Actual results could differ from these estimates.
Fair ValueAs described below, certain assets and liabilities are measured at estimated fair value on the Company’s consolidated balance sheets. In
addition, the notes to these consolidated financial statements include further disclosures of estimated fair values. The Company defines fairvalue as the price that would be received to sell an asset or paid to transfer a liability (an exit price) in the principal or most advantageousmarket for the asset or liability in an orderly transaction between market participants on the measurement date. In many cases, the exit priceand the transaction (or entry) price will be the same at initial recognition. However, in certain cases, the transaction price may not represent fairvalue. The fair value of a liability is based on the amount that would be paid to transfer a liability to a third party with the same credit standing. Itrequires that fair value be a market-based measurement in which the fair value is determined based on a hypothetical transaction at themeasurement date, considered from the perspective of a market participant. When quoted prices are not used to determine fair value of anasset, the Company considers three broad valuation techniques: (i) the market approach, (ii) the income approach, and (iii) the costapproach. The Company determines the most appropriate valuation technique to use, given what is being measured and the availability ofsufficient inputs. The Company prioritizes the inputs to fair valuation techniques and allows for the use of unobservable inputs to the extentthat observable inputs are not available. The Company categorizes its assets and liabilities measured at estimated fair value into a three-levelhierarchy, based on the priority of the inputs to the respective valuation technique. The fair value hierarchy gives the highest priority to quotedprices in active markets for identical assets or liabilities (Level 1) and the lowest priority to unobservable inputs (Level 3). An asset or liability’sclassification within the fair value hierarchy is based on the lowest level of input to its valuation. The input levels are as follows:
Level 1 Unadjusted quoted prices in active markets for identical assets or liabilities. The Company defines active markets based onaverage trading volume for equity securities. The size of the bid/ask spread is used as an indicator of market activity for fixedmaturity securities.
F-9MetLife, Inc.

Level 2 Quoted prices in markets that are not active or inputs that are observable either directly or indirectly. Level 2 inputs includequoted prices for similar assets or liabilities other than quoted prices in Level 1; quoted prices in markets that are not active; orother significant inputs that are observable or can be derived principally from or corroborated by observable market data forsubstantially the full term of the assets or liabilities.
Level 3 Unobservable inputs that are supported by little or no market activity and are significant to the estimated fair value of the assets orliabilities. Unobservable inputs reflect the reporting entity’s own assumptions about the assumptions that market participantswould use in pricing the asset or liability. Level 3 assets and liabilities include financial instruments whose values are determinedusing pricing models, discounted cash flow methodologies, or similar techniques, as well as instruments for which thedetermination of estimated fair value requires significant management judgment or estimation.
Prior to January 1, 2009, the measurement and disclosures of fair value based on exit price excluded certain items such as nonfinancialassets and nonfinancial liabilities initially measured at estimated fair value in a business combination, reporting units measured at estimatedfair value in the first step of a goodwill impairment test and indefinite-lived intangible assets measured at estimated fair value for impairmentassessment.
In addition, the Company elected the fair value option (“FVO”) for certain of its financial instruments to better match measurement of assetsand liabilities in the consolidated statements of operations.
InvestmentsThe accounting policies for the Company’s principal investments are as follows:
Fixed Maturity and Equity Securities. The Company’s fixed maturity and equity securities are classified as available-for-sale andare reported at their estimated fair value.
Unrealized investment gains and losses on these securities are recorded as a separate component of other comprehensive income(loss), net of policyholder-related amounts and deferred income taxes. All security transactions are recorded on a trade date basis.Investment gains and losses on sales of securities are determined on a specific identification basis.
Interest income on fixed maturity securities is recorded when earned using an effective yield method giving effect to amortization ofpremiums and accretion of discounts. Dividends on equity securities are recorded when declared. These dividends and interestincome are recorded in net investment income.
Included within fixed maturity securities are loan-backed securities including mortgage-backed and asset-backed securities(“ABS”). Amortization of the premium or discount from the purchase of these securities considers the estimated timing and amount ofprepayments of the underlying loans. Actual prepayment experience is periodically reviewed and effective yields are recalculatedwhen differences arise between the prepayments originally anticipated and the actual prepayments received and currently anticipated.Prepayment assumptions for single class and multi-class mortgage-backed and ABS are estimated by management using inputsobtained from third-party specialists, including broker-dealers, and based on management’s knowledge of the current market. Forcredit-sensitive mortgage-backed and ABS and certain prepayment-sensitive securities, the effective yield is recalculated on aprospective basis. For all other mortgage-backed and ABS, the effective yield is recalculated on a retrospective basis.
The Company periodically evaluates fixed maturity and equity securities for impairment. The assessment of whether impairmentshave occurred is based on management’s case-by-case evaluation of the underlying reasons for the decline in estimated fair value.The Company’s review of its fixed maturity and equity securities for impairments includes an analysis of the total gross unrealizedlosses by three categories of severity and/or age of the gross unrealized loss, as summarized in Note 3 “— Aging of Gross UnrealizedLoss and OTTI Loss for Fixed Maturity and Equity Securities Available-for-Sale.” An extended and severe unrealized loss position on afixed maturity security may not have any impact on the ability of the issuer to service all scheduled interest and principal payments andthe Company’s evaluation of recoverability of all contractual cash flows or the ability to recover an amount at least equal to its amortizedcost based on the present value of the expected future cash flows to be collected. In contrast, for certain equity securities, greaterweight and consideration are given by the Company to a decline in market value and the likelihood such market value decline willrecover.
Additionally, management considers a wide range of factors about the security issuer and uses its best judgment in evaluating thecause of the decline in the estimated fair value of the security and in assessing the prospects for near-term recovery. Inherent inmanagement’s evaluation of the security are assumptions and estimates about the operations of the issuer and its future earningspotential. Considerations used by the Company in the impairment evaluation process include, but are not limited to: (i) the length oftime and the extent to which the estimated fair value has been below cost or amortized cost; (ii) the potential for impairments ofsecurities when the issuer is experiencing significant financial difficulties; (iii) the potential for impairments in an entire industry sector orsub-sector; (iv) the potential for impairments in certain economically depressed geographic locations; (v) the potential for impairmentsof securities where the issuer, series of issuers or industry has suffered a catastrophic type of loss or has exhausted natural resources;(vi) with respect to fixed maturity securities, whether the Company has the intent to sell or will more likely than not be required to sell aparticular security before the decline in estimated fair value below cost or amortized cost recovers; (vii) with respect to equitysecurities, whether the Company’s ability and intent to hold the security for a period of time sufficient to allow for the recovery of itsestimated fair value to an amount equal to or greater than cost; (viii) unfavorable changes in forecasted cash flows on mortgage-backed and ABS; and (ix) other subjective factors, including concentrations and information obtained from regulators and ratingagencies.
Effective April 1, 2009, the Company prospectively adopted guidance on the recognition and presentation of other-than-temporaryimpairment (“OTTI”) losses as described in “— Adoption of New Accounting Pronouncements — Financial Instruments.” The guidancerequires that an OTTI be recognized in earnings for a fixed maturity security in an unrealized loss position when it is anticipated that theamortized cost will not be recovered. In such situations, the OTTI recognized in earnings is the entire difference between the fixedmaturity security’s amortized cost and its estimated fair value only when either: (i) the Company has the intent to sell the fixed maturity
F-10 MetLife, Inc.
MetLife, Inc.
Notes to the Consolidated Financial Statements — (Continued)

security; or (ii) it is more likely than not that the Company will be required to sell the fixed maturity security before recovery of the declinein estimated fair value below amortized cost. If neither of these two conditions exist, the difference between the amortized cost of thefixed maturity security and the present value of projected future cash flows expected to be collected is recognized as an OTTI inearnings (“credit loss”). If the estimated fair value is less than the present value of projected future cash flows expected to be collected,this portion of OTTI related to other-than credit factors (“noncredit loss”) is recorded in other comprehensive income (loss). There wasno change for equity securities which, when an OTTI has occurred, continue to be impaired for the entire difference between the equitysecurity’s cost and its estimated fair value with a corresponding charge to earnings. The Company does not make any adjustments forsubsequent recoveries in value.
Prior to the adoption of the OTTI guidance, the Company recognized in earnings an OTTI for a fixed maturity security in an unrealizedloss position unless it could assert that it had both the intent and ability to hold the fixed maturity security for a period of time sufficient toallow for a recovery of estimated fair value to the security’s amortized cost. Also, prior to the adoption of this guidance, the entiredifference between the fixed maturity security’s amortized cost basis and its estimated fair value was recognized in earnings if it wasdetermined to have an OTTI.
With respect to equity securities, the Company considers in its OTTI analysis its intent and ability to hold a particular equity securityfor a period of time sufficient to allow for the recovery of its estimated fair value to an amount equal to or greater than cost. If a saledecision is made for an equity security and it is not expected to recover to an amount at least equal to cost prior to the expected time ofthe sale, the security will be deemed other-than-temporarily impaired in the period that the sale decision was made and an OTTI loss willbe recorded in earnings. When an OTTI loss has occurred, the OTTI loss is the entire difference between the equity security’s cost andits estimated fair value with a corresponding charge to earnings.
With respect to perpetual hybrid securities that have attributes of both debt and equity, some of which are classified as fixedmaturity securities and some of which are classified as non-redeemable preferred stock within equity securities, the Companyconsiders in its OTTI analysis whether there has been any deterioration in credit of the issuer and the likelihood of recovery in value ofthe securities that are in a severe and extended unrealized loss position. The Company also considers whether any perpetual hybridsecurities, with an unrealized loss, regardless of credit rating, have deferred any dividend payments. When an OTTI loss has occurred,the OTTI loss is the entire difference between the perpetual hybrid security’s cost and its estimated fair value with a correspondingcharge to earnings.
The Company’s methodology and significant inputs used to determine the amount of the credit loss on fixed maturity securitiesunder the OTTI guidance are as follows:
(i) The Company calculates the recovery value by performing a discounted cash flow analysis based on the present value offuture cash flows expected to be received. The discount rate is generally the effective interest rate of the fixed maturity securityprior to impairment.
(ii) When determining the collectability and the period over which value is expected to recover, the Company applies the sameconsiderations utilized in its overall impairment evaluation process which incorporates information regarding the specificsecurity, fundamentals of the industry and geographic area in which the security issuer operates, and overall macroeconomicconditions. Projected future cash flows are estimated using assumptions derived from management’s best estimates of likelyscenario-based outcomes after giving consideration to a variety of variables that include, but are not limited to: generalpayment terms of the security; the likelihood that the issuer can service the scheduled interest and principal payments; thequality and amount of any credit enhancements; the security’s position within the capital structure of the issuer; possiblecorporate restructurings or asset sales by the issuer; and changes to the rating of the security or the issuer by rating agencies.
(iii) Additional considerations are made when assessing the unique features that apply to certain structured securities such asresidential mortgage-backed securities (“RMBS”), commercial mortgage-backed securities (“CMBS”) and ABS. These addi-tional factors for structured securities include, but are not limited to: the quality of underlying collateral; expected prepaymentspeeds; current and forecasted loss severity; consideration of the payment terms of the underlying assets backing a particularsecurity; and the payment priority within the tranche structure of the security.
(iv) When determining the amount of the credit loss for U.S. and foreign corporate securities, foreign government securities andstate and political subdivision securities, management considers the estimated fair value as the recovery value when availableinformation does not indicate that another value is more appropriate. When information is identified that indicates a recoveryvalue other than estimated fair value, management considers in the determination of recovery value the same considerationsutilized in its overall impairment evaluation process which incorporates available information and management’s best estimateof scenarios-based outcomes regarding the specific security and issuer; possible corporate restructurings or asset sales bythe issuer; the quality and amount of any credit enhancements; the security’s position within the capital structure of the issuer;fundamentals of the industry and geographic area in which the security issuer operates, and the overall macroeconomicconditions.
The cost or amortized cost of fixed maturity and equity securities is adjusted for OTTI in the period in which the determination ismade. These impairments are included within net investment gains (losses). The Company does not change the revised cost basis forsubsequent recoveries in value.
In periods subsequent to the recognition of OTTI on a fixed maturity security, the Company accounts for the impaired security as if ithad been purchased on the measurement date of the impairment. Accordingly, the discount (or reduced premium) based on the newcost basis is accreted into net investment income over the remaining term of the fixed maturity security in a prospective manner basedon the amount and timing of estimated future cash flows.
The Company purchases and receives beneficial interests in special purpose entities (“SPEs”), which enhance the Company’s totalreturn on its investment portfolio principally by providing equity-based returns on fixed maturity securities. These investments are
F-11MetLife, Inc.
MetLife, Inc.
Notes to the Consolidated Financial Statements — (Continued)
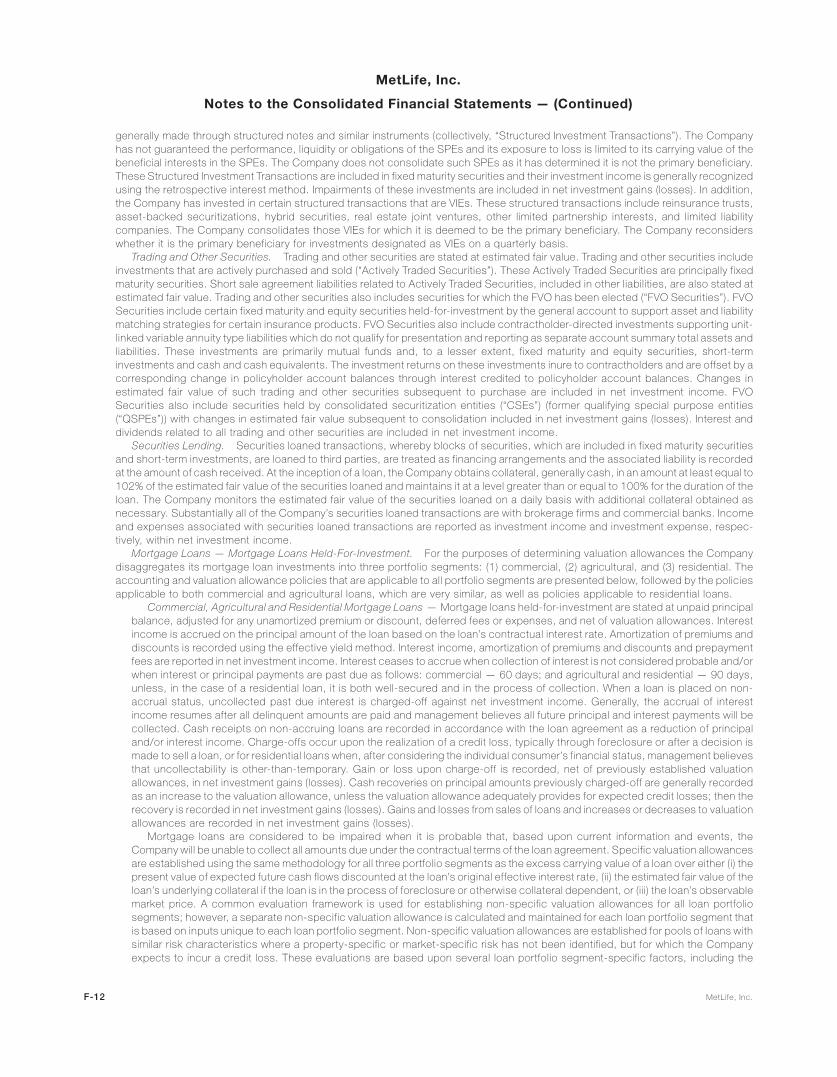
generally made through structured notes and similar instruments (collectively, “Structured Investment Transactions”). The Companyhas not guaranteed the performance, liquidity or obligations of the SPEs and its exposure to loss is limited to its carrying value of thebeneficial interests in the SPEs. The Company does not consolidate such SPEs as it has determined it is not the primary beneficiary.These Structured Investment Transactions are included in fixed maturity securities and their investment income is generally recognizedusing the retrospective interest method. Impairments of these investments are included in net investment gains (losses). In addition,the Company has invested in certain structured transactions that are VIEs. These structured transactions include reinsurance trusts,asset-backed securitizations, hybrid securities, real estate joint ventures, other limited partnership interests, and limited liabilitycompanies. The Company consolidates those VIEs for which it is deemed to be the primary beneficiary. The Company reconsiderswhether it is the primary beneficiary for investments designated as VIEs on a quarterly basis.
Trading and Other Securities. Trading and other securities are stated at estimated fair value. Trading and other securities includeinvestments that are actively purchased and sold (“Actively Traded Securities”). These Actively Traded Securities are principally fixedmaturity securities. Short sale agreement liabilities related to Actively Traded Securities, included in other liabilities, are also stated atestimated fair value. Trading and other securities also includes securities for which the FVO has been elected (“FVO Securities”). FVOSecurities include certain fixed maturity and equity securities held-for-investment by the general account to support asset and liabilitymatching strategies for certain insurance products. FVO Securities also include contractholder-directed investments supporting unit-linked variable annuity type liabilities which do not qualify for presentation and reporting as separate account summary total assets andliabilities. These investments are primarily mutual funds and, to a lesser extent, fixed maturity and equity securities, short-terminvestments and cash and cash equivalents. The investment returns on these investments inure to contractholders and are offset by acorresponding change in policyholder account balances through interest credited to policyholder account balances. Changes inestimated fair value of such trading and other securities subsequent to purchase are included in net investment income. FVOSecurities also include securities held by consolidated securitization entities (“CSEs”) (former qualifying special purpose entities(“QSPEs”)) with changes in estimated fair value subsequent to consolidation included in net investment gains (losses). Interest anddividends related to all trading and other securities are included in net investment income.
Securities Lending. Securities loaned transactions, whereby blocks of securities, which are included in fixed maturity securitiesand short-term investments, are loaned to third parties, are treated as financing arrangements and the associated liability is recordedat the amount of cash received. At the inception of a loan, the Company obtains collateral, generally cash, in an amount at least equal to102% of the estimated fair value of the securities loaned and maintains it at a level greater than or equal to 100% for the duration of theloan. The Company monitors the estimated fair value of the securities loaned on a daily basis with additional collateral obtained asnecessary. Substantially all of the Company’s securities loaned transactions are with brokerage firms and commercial banks. Incomeand expenses associated with securities loaned transactions are reported as investment income and investment expense, respec-tively, within net investment income.
Mortgage Loans — Mortgage Loans Held-For-Investment. For the purposes of determining valuation allowances the Companydisaggregates its mortgage loan investments into three portfolio segments: (1) commercial, (2) agricultural, and (3) residential. Theaccounting and valuation allowance policies that are applicable to all portfolio segments are presented below, followed by the policiesapplicable to both commercial and agricultural loans, which are very similar, as well as policies applicable to residential loans.
Commercial, Agricultural and Residential Mortgage Loans — Mortgage loans held-for-investment are stated at unpaid principalbalance, adjusted for any unamortized premium or discount, deferred fees or expenses, and net of valuation allowances. Interestincome is accrued on the principal amount of the loan based on the loan’s contractual interest rate. Amortization of premiums anddiscounts is recorded using the effective yield method. Interest income, amortization of premiums and discounts and prepaymentfees are reported in net investment income. Interest ceases to accrue when collection of interest is not considered probable and/orwhen interest or principal payments are past due as follows: commercial — 60 days; and agricultural and residential — 90 days,unless, in the case of a residential loan, it is both well-secured and in the process of collection. When a loan is placed on non-accrual status, uncollected past due interest is charged-off against net investment income. Generally, the accrual of interestincome resumes after all delinquent amounts are paid and management believes all future principal and interest payments will becollected. Cash receipts on non-accruing loans are recorded in accordance with the loan agreement as a reduction of principaland/or interest income. Charge-offs occur upon the realization of a credit loss, typically through foreclosure or after a decision ismade to sell a loan, or for residential loans when, after considering the individual consumer’s financial status, management believesthat uncollectability is other-than-temporary. Gain or loss upon charge-off is recorded, net of previously established valuationallowances, in net investment gains (losses). Cash recoveries on principal amounts previously charged-off are generally recordedas an increase to the valuation allowance, unless the valuation allowance adequately provides for expected credit losses; then therecovery is recorded in net investment gains (losses). Gains and losses from sales of loans and increases or decreases to valuationallowances are recorded in net investment gains (losses).
Mortgage loans are considered to be impaired when it is probable that, based upon current information and events, theCompany will be unable to collect all amounts due under the contractual terms of the loan agreement. Specific valuation allowancesare established using the same methodology for all three portfolio segments as the excess carrying value of a loan over either (i) thepresent value of expected future cash flows discounted at the loan’s original effective interest rate, (ii) the estimated fair value of theloan’s underlying collateral if the loan is in the process of foreclosure or otherwise collateral dependent, or (iii) the loan’s observablemarket price. A common evaluation framework is used for establishing non-specific valuation allowances for all loan portfoliosegments; however, a separate non-specific valuation allowance is calculated and maintained for each loan portfolio segment thatis based on inputs unique to each loan portfolio segment. Non-specific valuation allowances are established for pools of loans withsimilar risk characteristics where a property-specific or market-specific risk has not been identified, but for which the Companyexpects to incur a credit loss. These evaluations are based upon several loan portfolio segment-specific factors, including the
F-12 MetLife, Inc.
MetLife, Inc.
Notes to the Consolidated Financial Statements — (Continued)

Company’s experience for loan losses, defaults and loss severity, and loss expectations for loans with similar risk characteristics.The Company typically uses ten years, or more, of historical experience, in these evaluations. These evaluations are revised asconditions change and new information becomes available.
Commercial and Agricultural Mortgage Loans — All commercial and agricultural loans are monitored on an ongoing basis forpotential credit losses. For commercial loans, these ongoing reviews may include an analysis of the property financial statementsand rent roll, lease rollover analysis, property inspections, market analysis, estimated valuations of the underlying collateral,loan-to-value ratios, debt service coverage ratios, and tenant creditworthiness. The monitoring process focuses on higher riskloans, which include those that are classified as restructured, potentially delinquent, delinquent or in foreclosure, as well as loanswith higher loan-to-value ratios and lower debt service coverage ratios. The monitoring process for agricultural loans is generallysimilar, with a focus on higher risk loans, including reviews on a geographic and property-type basis. Higher risk commercial andagricultural loans are reviewed individually on an ongoing basis for potential credit loss and specific valuation allowances areestablished using the methodology described above for all loan portfolio segments. Quarterly, the remaining loans are reviewed ona pool basis by aggregating groups of loans that have similar risk characteristics for potential credit loss, and non-specific valuationallowances are established as described above using inputs that are unique to each segment of the loan portfolio.
For commercial loans, the Company’s primary credit quality indicator is the debt service coverage ratio, which compares aproperty’s net operating income to amounts needed to service the principal and interest due under the loan. Generally, the lower thedebt service coverage ratio, the higher the risk of experiencing a credit loss. The values utilized in calculating these ratios aredeveloped in connection with the ongoing review of the commercial loan portfolio and are routinely updated.
For agricultural loans, the Company’s primary credit qualify indicator is the loan-to-value ratio. Loan-to-value ratios compare theamount of the loan to the estimated fair value of the underlying collateral. A loan-to-value ratio greater than 100% indicates that theloan amount is greater than the collateral value. A loan-to-value ratio of less than 100% indicates an excess of collateral value overthe loan amount. Generally, the higher the loan-to-value ratio, the higher the risk of experiencing a credit loss. The values utilized incalculating these ratios are developed in connection with the ongoing review of the agricultural loan portfolio and are routinelyupdated.
Residential Mortgage Loans — The Company’s residential loan portfolio is comprised primarily of closed end, amortizingresidential loans and home equity lines of credit and it does not hold any optional adjustable rate mortgages, sub-prime, or lowteaser rate loans.
In contrast to the commercial and agricultural loan portfolios, residential loans are smaller-balance homogeneous loans that arecollectively evaluated for impairment. Non-specific valuation allowances are established using the evaluation framework describedabove for pools of loans with similar risk characteristics from inputs that are unique to the residential segment of the loan portfolio.Loan specific valuation allowances are only established on residential loans when they have been restructured and are establishedusing the methodology described above for all loan portfolio segments.
For residential loans, the Company’s primary credit quality indicator is whether the loan is performing or non-performing. TheCompany generally defines non-performing residential loans as those that are 90 or more days past due and/or in non-accrualstatus. The determination of performing or non-performing status is assessed monthly. Generally, non-performing residential loanshave a higher risk of experiencing a credit loss.
Also included in mortgage loans held-for-investment are commercial mortgage loans held by CSEs that were consolidated bythe Company on January 1, 2010 upon the adoption of new guidance. The Company elected FVO for these commercial mortgageloans, and thus they are stated at estimated fair value with changes in estimated fair value subsequent to consolidation recognizedin net investment gains (losses).Mortgage Loans — Mortgage Loans Held-For-Sale. Mortgage loans held-for-sale primarily include residential mortgage loans
which are originated with the intent to sell and for which FVO was elected. These residential mortgage loans are stated at estimated fairvalue with subsequent changes in estimated fair value recognized in other revenue. This caption also includes mortgage loanspreviously designated as held-for-investment about which the Company has subsequently changed its intention. At the time of transferto held-for-sale status, such mortgage loans are recorded at the lower of amortized cost or estimated fair value less expecteddisposition costs determined on an individual loan basis. Amortized cost is determined in the same manner as for mortgage loansheld-for-investment as described above. The amount by which amortized cost exceeds estimated fair value, less expected dispositioncosts, is recognized in net investment gains (losses).
Policy Loans. Policy loans are stated at unpaid principal balances. Interest income on such loans is recorded as earned in netinvestment income using the contractually agreed upon interest rate. Generally, interest is capitalized on the policy’s anniversary date.Valuation allowances are not established for policy loans, as these loans are fully collateralized by the cash surrender value of theunderlying insurance policies. Any unpaid principal or interest on the loan is deducted from the cash surrender value or the deathbenefit prior to settlement of the policy.
Real Estate. Real estate held-for-investment, including related improvements, is stated at cost less accumulated depreciation.Depreciation is provided on a straight-line basis over the estimated useful life of the asset (typically 20 to 55 years). Rental income isrecognized on a straight-line basis over the term of the respective leases. The Company classifies a property as held-for-sale if itcommits to a plan to sell a property within one year and actively markets the property in its current condition for a price that isreasonable in comparison to its estimated fair value. The Company classifies the results of operations and the gain or loss on sale of aproperty that either has been disposed of or classified as held-for-sale as discontinued operations, if the ongoing operations of theproperty will be eliminated from the ongoing operations of the Company and if the Company will not have any significant continuinginvolvement in the operations of the property after the sale. Real estate held-for-sale is stated at the lower of depreciated cost orestimated fair value less expected disposition costs. Real estate is not depreciated while it is classified as held-for-sale. The Company
F-13MetLife, Inc.
MetLife, Inc.
Notes to the Consolidated Financial Statements — (Continued)

periodically reviews its properties held-for-investment for impairment and tests properties for recoverability whenever events orchanges in circumstances indicate the carrying amount of the asset may not be recoverable and the carrying value of the propertyexceeds its estimated fair value. Properties whose carrying values are greater than their undiscounted cash flows are written down totheir estimated fair value, with the impairment loss included in net investment gains (losses). Impairment losses are based upon theestimated fair value of real estate, which is generally computed using the present value of expected future cash flows from the realestate discounted at a rate commensurate with the underlying risks. Real estate acquired upon foreclosure is recorded at the lower ofestimated fair value or the carrying value of the mortgage loan at the date of foreclosure.
Real Estate Joint Ventures and Other Limited Partnership Interests. The Company uses the equity method of accounting forinvestments in real estate joint ventures and other limited partnership interests consisting of leveraged buy-out funds, hedge funds andother private equity funds in which it has more than a minor equity interest or more than a minor influence over the joint ventures orpartnership’s operations, but does not have a controlling interest and is not the primary beneficiary. The equity method is also used forsuch investments in which the Company has more than a minor influence or more than a 20% interest. Generally, the Company recordsits share of earnings using a three-month lag methodology for instances where the timely financial information is available and thecontractual right exists to receive such financial information on a timely basis. The Company uses the cost method of accounting forinvestments in real estate joint ventures and other limited partnership interests in which it has a minor equity investment and virtually noinfluence over the joint ventures or the partnership’s operations. The Company reports the distributions from real estate joint venturesand other limited partnership interests accounted for under the cost method and equity in earnings from real estate joint ventures andother limited partnership interests accounted for under the equity method in net investment income. In addition to the investeesperforming regular evaluations for the impairment of underlying investments, the Company routinely evaluates its investments in realestate joint ventures and other limited partnerships for impairments. The Company considers its cost method investments for OTTIwhen the carrying value of real estate joint ventures and other limited partnership interests exceeds the net asset value (“NAV”). TheCompany takes into consideration the severity and duration of this excess when deciding if the cost method investment isother-than-temporarily impaired. For equity method investees, the Company considers financial and other information provided bythe investee, other known information and inherent risks in the underlying investments, as well as future capital commitments, indetermining whether an impairment has occurred. When an OTTI is deemed to have occurred, the Company records a realized capitalloss within net investment gains (losses) to record the investment at its estimated fair value.
Short-term Investments. Short-term investments include investments with remaining maturities of one year or less, but greaterthan three months, at the time of purchase and are stated at amortized cost, which approximates estimated fair value, or stated atestimated fair value, if available.
Other Invested Assets. Other invested assets consist principally of freestanding derivatives with positive estimated fair values,leveraged leases, investments in insurance enterprise joint ventures, tax credit partnerships, funding agreements, mortgage servicingrights (“MSRs”) and funds withheld.
Freestanding derivatives with positive estimated fair values are described in the derivatives accounting policy which follows.Leveraged leases are recorded net of non-recourse debt. The Company participates in lease transactions which are diversified by
industry, asset type and geographic area. The Company recognizes income on the leveraged leases by applying the leveraged lease’sestimated rate of return to the net investment in the lease. The Company regularly reviews residual values and impairs them to expectedvalues.
Joint venture investments represent the Company’s investments in entities that engage in insurance underwriting activities and areaccounted for under the equity method.
Tax credit partnerships are established for the purpose of investing in low-income housing and other social causes, where theprimary return on investment is in the form of tax credits and are also accounted for under the equity method or under the effective yieldmethod. The Company reports the equity in earnings of joint venture investments and tax credit partnerships in net investment income.
Funding agreements represent arrangements where the Company has long-term interest bearing amounts on deposit with thirdparties and are generally stated at amortized cost.
MSRs are measured at estimated fair value and are either acquired or are generated from the sale of originated residential mortgageloans where the servicing rights are retained by the Company. Changes in estimated fair value of MSRs are reported in other revenuesin the period in which the change occurs.
Funds withheld represent amounts contractually withheld by ceding companies in accordance with reinsurance agreements. TheCompany records a funds withheld receivable rather than the underlying investments. The Company recognizes interest on fundswithheld at rates defined by the terms of the agreement which may be contractually specified or directly related to the underlyinginvestments and records it in net investment income.
Investments Risks and Uncertainties. The Company’s investments are exposed to four primary sources of risk: credit, interest rate,liquidity risk, and market valuation. The financial statement risks, stemming from such investment risks, are those associated with thedetermination of estimated fair values, the diminished ability to sell certain investments in times of strained market conditions, the recognitionof impairments, the recognition of income on certain investments and the potential consolidation of VIEs. The use of different methodologies,assumptions and inputs relating to these financial statement risks may have a material effect on the amounts presented within theconsolidated financial statements.
When available, the estimated fair value of the Company’s fixed maturity and equity securities are based on quoted prices in active marketsthat are readily and regularly obtainable. Generally, these are the most liquid of the Company’s securities holdings and valuation of thesesecurities does not involve management judgment.
When quoted prices in active markets are not available, the determination of estimated fair value is based on market standard valuationmethodologies. The market standard valuation methodologies utilized include: discounted cash flow methodologies, matrix pricing or other
F-14 MetLife, Inc.
MetLife, Inc.
Notes to the Consolidated Financial Statements — (Continued)
similar techniques. The inputs to these market standard valuation methodologies include, but are not limited to: interest rates, credit standingof the issuer or counterparty, industry sector of the issuer, coupon rate, call provisions, sinking fund requirements, maturity, estimatedduration and management’s assumptions regarding liquidity and estimated future cash flows. Accordingly, the estimated fair values arebased on available market information and management’s judgments about financial instruments.
The significant inputs to the market standard valuation methodologies for certain types of securities with reasonable levels of pricetransparency are inputs that are observable in the market or can be derived principally from or corroborated by observable market data. Suchobservable inputs include benchmarking prices for similar assets in active, liquid markets, quoted prices in markets that are not active andobservable yields and spreads in the market.
When observable inputs are not available, the market standard valuation methodologies for determining the estimated fair value of certaintypes of securities that trade infrequently, and therefore have little or no price transparency, rely on inputs that are significant to the estimatedfair value that are not observable in the market or cannot be derived principally from or corroborated by observable market data. Theseunobservable inputs can be based in large part on management judgment or estimation, and cannot be supported by reference to marketactivity. Even though unobservable, these inputs are based on assumptions deemed appropriate given the circumstances and consistentwith what other market participants would use when pricing such securities.
The estimated fair value of residential mortgage loans held-for-sale is determined based on observable pricing of residential mortgageloans held-for-sale with similar characteristics, or observable pricing for securities backed by similar types of loans, adjusted to convert thesecurities prices to loan prices. Generally, quoted market prices are not available. When observable pricing for similar loans, or securities thatare backed by similar loans, are not available, the estimated fair values of residential mortgage loans held-for-sale are determined usingindependent broker quotations, which is intended to approximate the amounts that would be received from third parties. Certain othermortgage loans have also been designated as held-for-sale which are recorded at the lower of amortized cost or estimated fair value lessexpected disposition costs determined on an individual loan basis. For these loans, estimated fair value is determined using independentbroker quotations or, when the loan is in foreclosure or otherwise determined to be collateral dependent, the estimated fair value of theunderlying collateral estimated using internal models.
The estimated fair value of MSRs is principally determined through the use of internal discounted cash flow models which utilize variousassumptions. Valuation inputs and assumptions include generally observable items such as type and age of loan, loan interest rates, currentmarket interest rates, and certain unobservable inputs, including assumptions regarding estimates of discount rates, loan prepayments andservicing costs, all of which are sensitive to changing market conditions. The use of different valuation assumptions and inputs, as well asassumptions relating to the collection of expected cash flows, may have a material effect on the estimated fair values of MSRs.
Financial markets are susceptible to severe events evidenced by rapid depreciation in asset values accompanied by a reduction in assetliquidity. The Company’s ability to sell securities, or the price ultimately realized for these securities, depends upon the demand and liquidity inthe market and increases the use of judgment in determining the estimated fair value of certain securities.
The determination of the amount of allowances and impairments, as applicable, is described previously by investment type. Thedetermination of such allowances and impairments is highly subjective and is based upon the Company’s periodic evaluation andassessment of known and inherent risks associated with the respective asset class. Such evaluations and assessments are revised asconditions change and new information becomes available.
The recognition of income on certain investments (e.g. loan-backed securities, including mortgage-backed and ABS, certain structuredinvestment transactions, trading and other securities) is dependent upon market conditions, which could result in prepayments and changesin amounts to be earned.
The accounting guidance for the determination of when an entity is a VIE and when to consolidate a VIE is complex and requires significantmanagement judgment. The determination of the VIE’s primary beneficiary requires an evaluation of the contractual and implied rights andobligations associated with each party’s relationship with or involvement in the entity, an estimate of the entity’s expected losses andexpected residual returns and the allocation of such estimates to each party involved in the entity. The Company generally uses a qualitativeapproach to determine whether it is the primary beneficiary.
For most VIEs, the entity that has both the ability to direct the most significant activities of the VIE and the obligation to absorb losses orreceive benefits that could be significant to the VIE is considered the primary beneficiary. However, for VIEs that are investment companies orapply measurement principles consistent with those utilized by investment companies, the primary beneficiary is based on a risks andrewards model and is defined as the entity that will absorb a majority of a VIE’s expected losses, receive a majority of a VIE’s expected residualreturns if no single entity absorbs a majority of expected losses, or both. The Company reassesses its involvement with VIEs on a quarterlybasis. The use of different methodologies, assumptions and inputs in the determination of the primary beneficiary could have a material effecton the amounts presented within the consolidated financial statements.
Derivative Financial InstrumentsDerivatives are financial instruments whose values are derived from interest rates, foreign currency exchange rates, credit spreads,
and/or other financial indices. Derivatives may be exchange-traded or contracted in the over-the-counter market. The Company uses avariety of derivatives, including swaps, forwards, futures and option contracts, to manage various risks relating to its ongoing business. To alesser extent, the Company uses credit derivatives, such as credit default swaps, to synthetically replicate investment risks and returns whichare not readily available in the cash market. The Company also purchases certain securities, issues certain insurance policies and investmentcontracts and engages in certain reinsurance contracts that have embedded derivatives.
Freestanding derivatives are carried on the Company’s consolidated balance sheets either as assets within other invested assets or asliabilities within other liabilities at estimated fair value as determined through the use of quoted market prices for exchange-traded derivativesand interest rate forwards to sell certain to-be-announced securities or through the use of pricing models for over-the-counter derivatives.The determination of estimated fair value, when quoted market values are not available, is based on market standard valuation methodologiesand inputs that are assumed to be consistent with what other market participants would use when pricing the instruments. Derivative
F-15MetLife, Inc.
MetLife, Inc.
Notes to the Consolidated Financial Statements — (Continued)

valuations can be affected by changes in interest rates, foreign currency exchange rates, financial indices, credit spreads, default risk(including the counterparties to the contract), volatility, liquidity and changes in estimates and assumptions used in the pricing models.
The Company does not offset the fair value amounts recognized for derivatives executed with the same counterparty under the samemaster netting agreement.
If a derivative is not designated as an accounting hedge or its use in managing risk does not qualify for hedge accounting, changes in theestimated fair value of the derivative are generally reported in net derivative gains (losses) except for those (i) in policyholder benefits andclaims for economic hedges of variable annuity guarantees included in future policy benefits; (ii) in net investment income for economichedges of equity method investments in joint ventures, or for all derivatives held in relation to the trading portfolios; (iii) in other revenues forderivatives held in connection with the Company’s mortgage banking activities; and (iv) in other expenses for economic hedges of foreigncurrency exposure related to the Company’s international subsidiaries. The fluctuations in estimated fair value of derivatives which have notbeen designated for hedge accounting can result in significant volatility in net income.
To qualify for hedge accounting, at the inception of the hedging relationship, the Company formally documents its risk managementobjective and strategy for undertaking the hedging transaction, as well as its designation of the hedge as either (i) a hedge of the estimated fairvalue of a recognized asset or liability (“fair value hedge”); (ii) a hedge of a forecasted transaction or of the variability of cash flows to bereceived or paid related to a recognized asset or liability (“cash flow hedge”); or (iii) a hedge of a net investment in a foreign operation. In thisdocumentation, the Company sets forth how the hedging instrument is expected to hedge the designated risks related to the hedged itemand sets forth the method that will be used to retrospectively and prospectively assess the hedging instrument’s effectiveness and themethod which will be used to measure ineffectiveness. A derivative designated as a hedging instrument must be assessed as being highlyeffective in offsetting the designated risk of the hedged item. Hedge effectiveness is formally assessed at inception and periodicallythroughout the life of the designated hedging relationship. Assessments of hedge effectiveness and measurements of ineffectiveness arealso subject to interpretation and estimation and different interpretations or estimates may have a material effect on the amount reported in netincome.
The accounting for derivatives is complex and interpretations of the primary accounting guidance continue to evolve in practice.Judgment is applied in determining the availability and application of hedge accounting designations and the appropriate accountingtreatment under such accounting guidance. If it was determined that hedge accounting designations were not appropriately applied,reported net income could be materially affected.
Under a fair value hedge, changes in the estimated fair value of the hedging derivative, including amounts measured as ineffectiveness,and changes in the estimated fair value of the hedged item related to the designated risk being hedged, are reported within net derivativegains (losses). The estimated fair values of the hedging derivatives are exclusive of any accruals that are separately reported in theconsolidated statement of operations within interest income or interest expense to match the location of the hedged item. However, accrualsthat are not scheduled to settle until maturity are included in the estimated fair value of derivatives in the consolidated balance sheets.
Under a cash flow hedge, changes in the estimated fair value of the hedging derivative measured as effective are reported within othercomprehensive income (loss), a separate component of stockholders’ equity, and the deferred gains or losses on the derivative arereclassified into the consolidated statement of operations when the Company’s earnings are affected by the variability in cash flows of thehedged item. Changes in the estimated fair value of the hedging instrument measured as ineffectiveness are reported within net derivativegains (losses). The estimated fair values of the hedging derivatives are exclusive of any accruals that are separately reported in theconsolidated statement of operations within interest income or interest expense to match the location of the hedged item. However, accrualsthat are not scheduled to settle until maturity are included in the estimated fair value of derivatives in the consolidated balance sheets.
In a hedge of a net investment in a foreign operation, changes in the estimated fair value of the hedging derivative that are measured aseffective are reported within other comprehensive income (loss) consistent with the translation adjustment for the hedged net investment inthe foreign operation. Changes in the estimated fair value of the hedging instrument measured as ineffectiveness are reported within netderivative gains (losses).
The Company discontinues hedge accounting prospectively when: (i) it is determined that the derivative is no longer highly effective inoffsetting changes in the estimated fair value or cash flows of a hedged item; (ii) the derivative expires, is sold, terminated, or exercised; (iii) itis no longer probable that the hedged forecasted transaction will occur; or (iv) the derivative is de-designated as a hedging instrument.
When hedge accounting is discontinued because it is determined that the derivative is not highly effective in offsetting changes in theestimated fair value or cash flows of a hedged item, the derivative continues to be carried in the consolidated balance sheets at its estimatedfair value, with changes in estimated fair value recognized currently in net derivative gains (losses). The carrying value of the hedgedrecognized asset or liability under a fair value hedge is no longer adjusted for changes in its estimated fair value due to the hedged risk, and thecumulative adjustment to its carrying value is amortized into income over the remaining life of the hedged item. Provided the hedgedforecasted transaction is still probable of occurrence, the changes in estimated fair value of derivatives recorded in other comprehensiveincome (loss) related to discontinued cash flow hedges are released into the consolidated statement of operations when the Company’searnings are affected by the variability in cash flows of the hedged item.
When hedge accounting is discontinued because it is no longer probable that the forecasted transactions will occur on the anticipateddate or within two months of that date, the derivative continues to be carried in the consolidated balance sheets at its estimated fair value, withchanges in estimated fair value recognized currently in net derivative gains (losses). Deferred gains and losses of a derivative recorded inother comprehensive income (loss) pursuant to the discontinued cash flow hedge of a forecasted transaction that is no longer probable arerecognized immediately in net derivative gains (losses).
In all other situations in which hedge accounting is discontinued, the derivative is carried at its estimated fair value in the consolidatedbalance sheets, with changes in its estimated fair value recognized in the current period as net derivative gains (losses).
The Company is also a party to financial instruments that contain terms which are deemed to be embedded derivatives. The Companyassesses each identified embedded derivative to determine whether it is required to be bifurcated. If the instrument would not be accounted
F-16 MetLife, Inc.
MetLife, Inc.
Notes to the Consolidated Financial Statements — (Continued)
for in its entirety at estimated fair value and it is determined that the terms of the embedded derivative are not clearly and closely related to theeconomic characteristics of the host contract, and that a separate instrument with the same terms would qualify as a derivative instrument,the embedded derivative is bifurcated from the host contract and accounted for as a freestanding derivative. Such embedded derivatives arecarried in the consolidated balance sheets at estimated fair value with the host contract and changes in their estimated fair value are generallyreported in net derivative gains (losses) except for those in policyholder benefits and claims related to ceded reinsurance of guaranteedminimum income benefits (“GMIBs”). If the Company is unable to properly identify and measure an embedded derivative for separation from itshost contract, the entire contract is carried on the balance sheet at estimated fair value, with changes in estimated fair value recognized in thecurrent period in net investment gains (losses) or net investment income. Additionally, the Company may elect to carry an entire contract onthe balance sheet at estimated fair value, with changes in estimated fair value recognized in the current period in net investment gains (losses)or net investment income if that contract contains an embedded derivative that requires bifurcation.
Cash and Cash EquivalentsThe Company considers all highly liquid investments purchased with an original or remaining maturity of three months or less at the date of
purchase to be cash equivalents. Cash equivalents are stated at amortized cost, which approximates estimated fair value.
Property, Equipment, Leasehold Improvements and Computer SoftwareProperty, equipment and leasehold improvements, which are included in other assets, are stated at cost, less accumulated depreciation
and amortization. Depreciation is determined using the straight-line method over the estimated useful lives of the assets, as appropriate. Theestimated life for company occupied real estate property is generally 40 years. Estimated lives generally range from five to ten years forleasehold improvements and three to seven years for all other property and equipment. The cost basis of the property, equipment andleasehold improvements was $2.4 billion and $1.9 billion at December 31, 2010 and 2009, respectively. Accumulated depreciation andamortization of property, equipment and leasehold improvements was $1.2 billion and $1.0 billion at December 31, 2010 and 2009,respectively. Related depreciation and amortization expense was $152 million, $152 million and $150 million for the years ended Decem-ber 31, 2010, 2009 and 2008, respectively.
Computer software, which is included in other assets, is stated at cost, less accumulated amortization. Purchased software costs, as wellas certain internal and external costs incurred to develop internal-use computer software during the application development stage, arecapitalized. Such costs are amortized generally over a four-year period using the straight-line method. The cost basis of computer softwarewas $2.0 billion and $1.7 billion at December 31, 2010 and 2009, respectively. Accumulated amortization of capitalized software was$1.4 billion and $1.2 billion at December 31, 2010 and 2009, respectively. Related amortization expense was $189 million, $171 million and$153 million for the years ended December 31, 2010, 2009 and 2008, respectively.
Deferred Policy Acquisition Costs (“DAC”) and Value of Business Acquired (“VOBA”)The Company incurs significant costs in connection with acquiring new and renewal insurance business. Costs that vary with and relate to
the production of new business are deferred as DAC. Such costs consist principally of commissions and agency and policy issuanceexpenses. VOBA is an intangible asset that represents the excess of book value over the estimated fair value of acquired insurance, annuity,and investment-type contracts in-force at the acquisition date. The estimated fair value of the acquired liabilities is based on actuariallydetermined projections, by each block of business, of future policy and contract charges, premiums, mortality and morbidity, separateaccount performance, surrenders, operating expenses, investment returns, nonperformance risk adjustment and other factors. Actualexperience on the purchased business may vary from these projections. The recovery of DAC and VOBA is dependent upon the futureprofitability of the related business. DAC and VOBA are aggregated in the consolidated financial statements for reporting purposes.
DAC for credit, property and casualty insurance contracts, which is primarily composed of commissions and certain underwritingexpenses, is amortized on a pro rata basis over the applicable contract term or reinsurance treaty.
DAC and VOBA on life insurance, accident and health or investment-type contracts are amortized in proportion to gross premiums, grossmargins or gross profits, depending on the type of contract as described below.
The Company amortizes DAC and VOBA related to non-participating and non-dividend-paying traditional contracts (term insurance, non-participating whole life insurance, traditional group life insurance, credit insurance, non-medical health insurance, and accident and healthinsurance) over the entire premium paying period in proportion to the present value of actual historic and expected future gross premiums.The present value of expected premiums is based upon the premium requirement of each policy and assumptions for mortality, morbidity,persistency and investment returns at policy issuance, or policy acquisition (as it relates to VOBA), that include provisions for adversedeviation and are consistent with the assumptions used to calculate future policyholder benefit liabilities. These assumptions are not revisedafter policy issuance or acquisition unless the DAC or VOBA balance is deemed to be unrecoverable from future expected profits. Absent apremium deficiency, variability in amortization after policy issuance or acquisition is caused only by variability in premium volumes.
The Company amortizes DAC and VOBA related to participating, dividend-paying traditional contracts over the estimated lives of thecontracts in proportion to actual and expected future gross margins. The amortization includes interest based on rates in effect at inception oracquisition of the contracts. The future gross margins are dependent principally on investment returns, policyholder dividend scales,mortality, persistency, expenses to administer the business, creditworthiness of reinsurance counterparties and certain economic variables,such as inflation. For participating contracts within the closed block (dividend paying traditional contracts) future gross margins are alsodependent upon changes in the policyholder dividend obligation. Of these factors, the Company anticipates that investment returns,expenses, persistency and other factor changes as well as policyholder dividend scales are reasonably likely to impact significantly the rate ofDAC and VOBA amortization. Each reporting period, the Company updates the estimated gross margins with the actual gross margins for thatperiod. When the actual gross margins change from previously estimated gross margins, the cumulative DAC and VOBA amortization is re-estimated and adjusted by a cumulative charge or credit to current operations. When actual gross margins exceed those previouslyestimated, the DAC and VOBA amortization will increase, resulting in a current period charge to earnings. The opposite result occurs whenthe actual gross margins are below the previously estimated gross margins. Each reporting period, the Company also updates the actual
F-17MetLife, Inc.
MetLife, Inc.
Notes to the Consolidated Financial Statements — (Continued)

amount of business in-force, which impacts expected future gross margins. When expected future gross margins are below those previouslyestimated, the DAC and VOBA amortization will increase, resulting in a current period charge to earnings. The opposite result occurs whenthe expected future gross margins are above the previously estimated expected future gross margins. Each period, the Company alsoreviews the estimated gross margins for each block of business to determine the recoverability of DAC and VOBA balances.
The Company amortizes DAC and VOBA related to fixed and variable universal life contracts and fixed and variable deferred annuitycontracts over the estimated lives of the contracts in proportion to actual and expected future gross profits. The amortization includes interestbased on rates in effect at inception or acquisition of the contracts. The amount of future gross profits is dependent principally upon returns inexcess of the amounts credited to policyholders, mortality, persistency, interest crediting rates, expenses to administer the business,creditworthiness of reinsurance counterparties, the effect of any hedges used and certain economic variables, such as inflation. Of thesefactors, the Company anticipates that investment returns, expenses and persistency are reasonably likely to impact significantly the rate ofDAC and VOBA amortization. Each reporting period, the Company updates the estimated gross profits with the actual gross profits for thatperiod. When the actual gross profits change from previously estimated gross profits, the cumulative DAC and VOBA amortization is re-estimated and adjusted by a cumulative charge or credit to current operations. When actual gross profits exceed those previously estimated,the DAC and VOBA amortization will increase, resulting in a current period charge to earnings. The opposite result occurs when the actualgross profits are below the previously estimated gross profits. Each reporting period, the Company also updates the actual amount ofbusiness remaining in-force, which impacts expected future gross profits. When expected future gross profits are below those previouslyestimated, the DAC and VOBA amortization will increase, resulting in a current period charge to earnings. The opposite result occurs whenthe expected future gross profits are above the previously estimated expected future gross profits. Each period, the Company also reviewsthe estimated gross profits for each block of business to determine the recoverability of DAC and VOBA balances.
Separate account rates of return on variable universal life contracts and variable deferred annuity contracts affect in-force accountbalances on such contracts each reporting period which can result in significant fluctuations in amortization of DAC and VOBA. Returns thatare higher than the Company’s long-term expectation produce higher account balances, which increases the Company’s future feeexpectations and decreases future benefit payment expectations on minimum death and living benefit guarantees, resulting in higherexpected future gross profits. The opposite result occurs when returns are lower than the Company’s long-term expectation. The Company’spractice to determine the impact of gross profits resulting from returns on separate accounts assumes that long-term appreciation in equitymarkets is not changed by short-term market fluctuations, but is only changed when sustained interim deviations are expected. The Companymonitors these events and only changes the assumption when its long-term expectation changes.
The Company also periodically reviews other long-term assumptions underlying the projections of estimated gross margins and profits.These include investment returns, policyholder dividend scales, interest crediting rates, mortality, persistency and expenses to administerbusiness. Management annually updates assumptions used in the calculation of estimated gross margins and profits which may havesignificantly changed. If the update of assumptions causes expected future gross margins and profits to increase, DAC and VOBAamortization will decrease, resulting in a current period increase to earnings. The opposite result occurs when the assumption updatecauses expected future gross margins and profits to decrease.
Periodically, the Company modifies product benefits, features, rights or coverages that occur by the exchange of a contract for a newcontract, or by amendment, endorsement, or rider to a contract, or by election or coverage within a contract. If such modification, referred toas an internal replacement, substantially changes the contract, the associated DAC or VOBA is written off immediately through income andany new deferrable costs associated with the replacement contract are deferred. If the modification does not substantially change thecontract, the DAC or VOBA amortization on the original contract will continue and any acquisition costs associated with the relatedmodification are expensed.
Sales InducementsThe Company generally has two different types of sales inducements which are included in other assets: (i) the policyholder receives a
bonus whereby the policyholder’s initial account balance is increased by an amount equal to a specified percentage of the customer’sdeposit; and (ii) the policyholder receives a higher interest rate using a dollar cost averaging method than would have been received based onthe normal general account interest rate credited. The Company defers sales inducements and amortizes them over the life of the policy usingthe same methodology and assumptions used to amortize DAC. The amortization of sales inducements is included in policyholder benefitsand claims. Each year, or more frequently if circumstances indicate a potentially significant recoverability issue exists, the Company reviewsthe deferred sales inducements to determine the recoverability of these balances.
Value of Distribution Agreements and Customer Relationships AcquiredValue of distribution agreements (“VODA”) is reported in other assets and represents the present value of expected future profits
associated with the expected future business derived from the distribution agreements. Value of customer relationships acquired (“VOCRA”)is also reported in other assets and represents the present value of the expected future profits associated with the expected future businessacquired through existing customers of the acquired company or business. The VODA and VOCRA associated with past acquisitions areamortized over useful lives ranging from 10 to 40 years and such amortization is included in other expenses. Each year, or more frequently ifcircumstances indicate a potentially significant recoverability issue exists, the Company reviews VODA and VOCRA to determine therecoverability of these balances.
GoodwillGoodwill is the excess of cost over the estimated fair value of net assets acquired which represents the future economic benefits arising
from such net assets acquired that could not be individually identified. Goodwill is not amortized but is tested for impairment at least annuallyor more frequently if events or circumstances, such as adverse changes in the business climate, indicate that there may be justification forconducting an interim test. The Company performs its annual goodwill impairment testing during the third quarter of each year based upon
F-18 MetLife, Inc.
MetLife, Inc.
Notes to the Consolidated Financial Statements — (Continued)
data as of the close of the second quarter. Goodwill associated with a business acquisition is not tested for impairment during the year thebusiness is acquired unless there is a significant identified impairment event.
Impairment testing is performed using the fair value approach, which requires the use of estimates and judgment, at the “reporting unit”level. A reporting unit is the operating segment or a business one level below the operating segment, if discrete financial information isprepared and regularly reviewed by management at that level. For purposes of goodwill impairment testing, a significant portion of goodwillwithin Banking, Corporate & Other is allocated to reporting units within the Company’s segments.
For purposes of goodwill impairment testing, if the carrying value of a reporting unit exceeds its estimated fair value, there might be anindication of impairment. In such instances, the implied fair value of the goodwill is determined in the same manner as the amount of goodwillthat would be determined in a business acquisition. The excess of the carrying value of goodwill over the implied fair value of goodwill wouldbe recognized as an impairment and recorded as a charge against net income.
In performing the Company’s goodwill impairment tests, the estimated fair values of the reporting units are first determined using a marketmultiple approach. When further corroboration is required, the Company uses a discounted cash flow approach. For reporting units which areparticularly sensitive to market assumptions, such as the retirement products and individual life reporting units, the Company may useadditional valuation methodologies to estimate the reporting units’ fair values.
The key inputs, judgments and assumptions necessary in determining estimated fair value of the reporting units include projectedearnings, current book value (with and without accumulated other comprehensive income), the level of economic capital required to supportthe mix of business, long-term growth rates, comparative market multiples, the account value of in-force business, projections of new andrenewal business, as well as margins on such business, the level of interest rates, credit spreads, equity market levels and the discount ratethat the Company believes is appropriate for the respective reporting unit. The estimated fair values of the retirement products and individuallife reporting units are particularly sensitive to the equity market levels.
When testing goodwill for impairment, the Company also considers its market capitalization in relation to the aggregate estimated fair valueof its reporting units.
The Company applies significant judgment when determining the estimated fair value of the Company’s reporting units and whenassessing the relationship of market capitalization to the aggregate estimated fair value of its reporting units. The valuation methodologiesutilized are subject to key judgments and assumptions that are sensitive to change. Estimates of fair value are inherently uncertain andrepresent only management’s reasonable expectation regarding future developments. These estimates and the judgments and assumptionsupon which the estimates are based will, in all likelihood, differ in some respects from actual future results. Declines in the estimated fair valueof the Company’s reporting units could result in goodwill impairments in future periods which could materially adversely affect the Company’sresults of operations or financial position.
During the 2010 impairment tests of goodwill, the Company concluded that the fair values of all reporting units were in excess of theircarrying values and, therefore, goodwill was not impaired. On an ongoing basis, the Company evaluates potential triggering events that mayaffect the estimated fair value of the Company’s reporting units to assess whether any goodwill impairment exists. Deteriorating or adversemarket conditions for certain reporting units may have a significant impact on the estimated fair value of these reporting units and could resultin future impairments of goodwill.
See Note 7 for further consideration of goodwill impairment testing during 2010.
Liability for Future Policy Benefits and Policyholder Account BalancesThe Company establishes liabilities for amounts payable under insurance policies, including traditional life insurance, traditional annuities,
certain accident and health, and non-medical health insurance. Generally, amounts are payable over an extended period of time and relatedliabilities are calculated as the present value of future expected benefits to be paid reduced by the present value of future expected premiums.Such liabilities are established based on methods and underlying assumptions in accordance with GAAP and applicable actuarial standards.Principal assumptions used in the establishment of liabilities for future policy benefits are mortality, morbidity, policy lapse, renewal,retirement, disability incidence, disability terminations, investment returns, inflation, expenses and other contingent events as appropriate tothe respective product type and geographical area. These assumptions are established at the time the policy is issued and are intended toestimate the experience for the period the policy benefits are payable. Utilizing these assumptions, liabilities are established on a block ofbusiness basis.
Future policy benefit liabilities for participating traditional life insurance policies are equal to the aggregate of (i) net level premium reservesfor death and endowment policy benefits (calculated based upon the non-forfeiture interest rate, ranging from 3% to 7% for domesticbusiness and 1% to 12% for international business, and mortality rates guaranteed in calculating the cash surrender values described in suchcontracts); and (ii) the liability for terminal dividends for domestic business.
Participating business represented approximately 6% of the Company’s life insurance in-force at both December 31, 2010 and 2009.Participating policies represented approximately 26%, 28% and 27% of gross life insurance premiums for the years ended December 31,2010, 2009 and 2008, respectively.
Future policy benefit liabilities for non-participating traditional life insurance policies are equal to the aggregate of the present value ofexpected future benefit payments and related expenses less the present value of expected future net premiums. Assumptions as to mortalityand persistency are based upon the Company’s experience when the basis of the liability is established. Interest rate assumptions for theaggregate future policy benefit liabilities range from 3% to 8% for domestic business and 1% to 12% for international business.
Future policy benefit liabilities for individual and group traditional fixed annuities after annuitization are equal to the present value ofexpected future payments. Interest rate assumptions used in establishing such liabilities range from 2% to 11% for domestic business and 3%to 12% for international business.
Future policy benefit liabilities for non-medical health insurance, primarily related to domestic business, are calculated using the net levelpremium method and assumptions as to future morbidity, withdrawals and interest, which provide a margin for adverse deviation. Interest rateassumptions used in establishing such liabilities range from 4% to 7%.
F-19MetLife, Inc.
MetLife, Inc.
Notes to the Consolidated Financial Statements — (Continued)

Future policy benefit liabilities for disabled lives are estimated using the present value of benefits method and experience assumptions asto claim terminations, expenses and interest. Interest rate assumptions used in establishing such liabilities range from 3% to 8% for domesticbusiness and 2% to 9% for international business.
Liabilities for unpaid claims and claim expenses for property and casualty insurance are included in future policyholder benefits andrepresent the amount estimated for claims that have been reported but not settled and claims incurred but not reported. Liabilities for unpaidclaims are estimated based upon the Company’s historical experience and other actuarial assumptions that consider the effects of currentdevelopments, anticipated trends and risk management programs, reduced for anticipated salvage and subrogation. The effects of changesin such estimated liabilities are included in the results of operations in the period in which the changes occur.
The Company establishes future policy benefit liabilities for minimum death and income benefit guarantees relating to certain annuitycontracts and secondary and paid-up guarantees relating to certain life policies as follows:
• Guaranteed minimum death benefit (“GMDB”) liabilities are determined by estimating the expected value of death benefits in excess ofthe projected account balance and recognizing the excess ratably over the accumulation period based on total expected assessments.The Company regularly evaluates estimates used and adjusts the additional liability balance, with a related charge or credit to benefitexpense, if actual experience or other evidence suggests that earlier assumptions should be revised. The assumptions used inestimating the GMDB liabilities are consistent with those used for amortizing DAC, and are thus subject to the same variability and risk.The assumptions of investment performance and volatility are consistent with the historical experience of the appropriate underlyingequity index, such as the Standard & Poor’s (“S&P”) 500 Index. The benefit assumptions used in calculating the liabilities are based onthe average benefits payable over a range of scenarios.
• Guaranteed minimum income benefit (“GMIB”) liabilities are determined by estimating the expected value of the income benefits inexcess of the projected account balance at any future date of annuitization and recognizing the excess ratably over the accumulationperiod based on total expected assessments. The Company regularly evaluates estimates used and adjusts the additional liabilitybalance, with a related charge or credit to benefit expense, if actual experience or other evidence suggests that earlier assumptionsshould be revised. The assumptions used for estimating the GMIB liabilities are consistent with those used for estimating the GMDBliabilities. In addition, the calculation of guaranteed annuitization benefit liabilities incorporates an assumption for the percentage of thepotential annuitizations that may be elected by the contractholder. Certain GMIBs have settlement features that result in a portion of thatguarantee being accounted for as an embedded derivative and are recorded in policyholder account balances as described below.
Liabilities for universal and variable life secondary guarantees and paid-up guarantees are determined by estimating the expected value ofdeath benefits payable when the account balance is projected to be zero and recognizing those benefits ratably over the accumulation periodbased on total expected assessments. The Company regularly evaluates estimates used and adjusts the additional liability balances, with arelated charge or credit to benefit expense, if actual experience or other evidence suggests that earlier assumptions should be revised. Theassumptions used in estimating the secondary and paid-up guarantee liabilities are consistent with those used for amortizing DAC, and arethus subject to the same variability and risk. The assumptions of investment performance and volatility for variable products are consistentwith historical S&P experience. The benefits used in calculating the liabilities are based on the average benefits payable over a range ofscenarios.
The Company establishes policyholder account balances for guaranteed minimum benefits relating to certain variable annuity products asfollows:
• Guaranteed minimum withdrawal benefits (“GMWB”) guarantee the contractholder a return of their purchase payment via partialwithdrawals, even if the account value is reduced to zero, provided that the contractholder’s cumulative withdrawals in a contract yeardo not exceed a certain limit. The initial guaranteed withdrawal amount is equal to the initial benefit base as defined in the contract(typically, the initial purchase payments plus applicable bonus amounts). The GMWB is an embedded derivative, which is measured atestimated fair value separately from the host variable annuity product.
• Guaranteed minimum accumulation benefits (“GMAB”) and settlement features in certain GMIB described above provide thecontractholder, after a specified period of time determined at the time of issuance of the variable annuity contract, with a minimumaccumulation of their purchase payments even if the account value is reduced to zero. The initial guaranteed accumulation amount isequal to the initial benefit base as defined in the contract (typically, the initial purchase payments plus applicable bonus amounts). TheGMAB is an embedded derivative, which is measured at estimated fair value separately from the host variable annuity product.
For GMWB, GMAB and certain GMIB, the initial benefit base is increased by additional purchase payments made within a certain timeperiod and decreases by benefits paid and/or withdrawal amounts. After a specified period of time, the benefit base may also increase as aresult of an optional reset as defined in the contract.
GMWB, GMAB and certain GMIB are accounted for as embedded derivatives with changes in estimated fair value reported in netderivative gains (losses).
At inception of the GMWB, GMAB and certain GMIB contracts, the Company attributes to the embedded derivative a portion of theprojected future guarantee fees to be collected from the policyholder equal to the present value of projected future guaranteed benefits. Anyadditional fees represent “excess” fees and are reported in universal life and investment-type product policy fees.
The estimated fair values of these embedded derivatives are then determined based on the present value of projected future benefitsminus the present value of projected future fees. The projections of future benefits and future fees require capital market and actuarialassumptions including expectations concerning policyholder behavior. A risk neutral valuation methodology is used under which the cashflows from the guarantees are projected under multiple capital market scenarios using observable risk free rates. The valuation of theseembedded derivatives also includes an adjustment for the Company’s nonperformance risk and risk margins for non-capital market inputs.The nonperformance adjustment is determined by taking into consideration publicly available information relating to spreads in the secondarymarket for the Holding Company’s debt, including related credit default swaps. These observable spreads are then adjusted, as necessary, toreflect the priority of these liabilities and the claims paying ability of the issuing insurance subsidiaries compared to the Holding Company. Risk
F-20 MetLife, Inc.
MetLife, Inc.
Notes to the Consolidated Financial Statements — (Continued)

margins are established to capture the non-capital market risks of the instrument which represent the additional compensation a marketparticipant would require to assume the risks related to the uncertainties of such actuarial assumptions as annuitization, premiumpersistency, partial withdrawal and surrenders. The establishment of risk margins requires the use of significant management judgment.
These guaranteed minimum benefits may be more costly than expected in volatile or declining equity markets. Market conditionsincluding, but not limited to, changes in interest rates, equity indices, market volatility and foreign currency exchange rates, changes innonperformance risk, variations in actuarial assumptions regarding policyholder behavior, mortality and risk margins related to non-capitalmarket inputs may result in significant fluctuations in the estimated fair value of the guarantees that could materially affect net income.
The Company periodically reviews its estimates of actuarial liabilities for future policy benefits and compares them with its actualexperience. Differences between actual experience and the assumptions used in pricing these policies and guarantees, and in theestablishment of the related liabilities result in variances in profit and could result in losses. The effects of changes in such estimatedliabilities are included in the results of operations in the period in which the changes occur.
Policyholder account balances relate to investment-type contracts, universal life-type policies and certain guaranteed minimum benefits.Investment-type contracts principally include traditional individual fixed annuities in the accumulation phase and non-variable group annuitycontracts. Policyholder account balances for these contracts are equal to (i) policy account values, which consist of an accumulation of grosspremium payments and investment performance; (ii) credited interest, ranging from 1% to 17% for domestic business and 1% to 38% forinternational business, less expenses, mortality charges and withdrawals; and (iii) fair value adjustments relating to business combinations.
Other Policy-Related BalancesOther policy-related balances include policy and contract claims, unearned revenue liabilities, premiums received in advance, negative
VOBA, policyholder dividends due and unpaid and policyholder dividends left on deposit.The liability for policy and contract claims generally relates to incurred but not reported death, disability, long-term care and dental claims,
as well as claims which have been reported but not yet settled. The liability for these claims is based on the Company’s estimated ultimatecost of settling all claims. The Company derives estimates for the development of incurred but not reported claims principally from actuarialanalyses of historical patterns of claims and claims development for each line of business. The methods used to determine these estimatesare continually reviewed. Adjustments resulting from this continuous review process and differences between estimates and payments forclaims are recognized in policyholder benefits and claims expense in the period in which the estimates are changed or payments are made.
The unearned revenue liability relates to universal life-type and investment-type products and represents policy charges for services to beprovided in future periods. The charges are deferred as unearned revenue and amortized using the product’s estimated gross profits andmargins, similar to DAC. Such amortization is recorded in universal life and investment-type product policy fees.
The Company accounts for the prepayment of premiums on its individual life, group life and health contracts as premium received inadvance and applies the cash received to premiums when due.
For certain acquired blocks of business, the estimated fair value of the in-force contract obligations exceeded the book value of assumedin-force insurance policy liabilities, resulting in negative VOBA, which is presented separately from VOBA as an additional insurance liability.The fair value of the in-force contract obligations is based on actuarial determined projections by each block of business. Negative VOBA isamortized over the policy period in proportion to the approximate consumption of losses included in the liability usually expressed in terms ofinsurance in-force or account value. Such amortization is recorded as a contra-expense in other expenses in the consolidated statements ofoperations.
Also included in other policy-related balances are policyholder dividends due and unpaid on participating policies and policyholderdividends left on deposit. Such liabilities are presented at amounts contractually due to policyholders.
Recognition of Insurance Revenue and Related BenefitsPremiums related to traditional life and annuity policies with life contingencies and long-duration accident and health and credit insurance
policies are recognized as revenues when due from policyholders. Policyholder benefits and expenses are provided against such revenues torecognize profits over the estimated lives of the policies. When premiums are due over a significantly shorter period than the period over whichbenefits are provided, any excess profit is deferred and recognized into operations in a constant relationship to insurance in-force or, forannuities, the amount of expected future policy benefit payments.
Premiums related to short-duration non-medical health and disability contracts are recognized on a pro rata basis over the applicablecontract term.
Deposits related to universal life-type and investment-type products are credited to policyholder account balances. Revenues from suchcontracts consist of amounts assessed against policyholder account balances for mortality, policy administration and surrender charges andare recorded in universal life and investment-type product policy fees in the period in which services are provided. Amounts that are chargedto operations include interest credited and benefit claims incurred in excess of related policyholder account balances.
Premiums related to property and casualty contracts are recognized as revenue on a pro rata basis over the applicable contract term.Unearned premiums, representing the portion of premium written relating to the unexpired coverage, are included in future policy benefits.
Premiums, policy fees, policyholder benefits and expenses are presented net of reinsurance.The portion of fees allocated to embedded derivatives described previously is recognized within net derivative gains (losses) as part of the
estimated fair value of embedded derivatives.
Other RevenuesOther revenues include, in addition to items described elsewhere herein, advisory fees, broker-dealer commissions and fees and
administrative service fees. Such fees and commissions are recognized in the period in which services are performed. Other revenues alsoinclude changes in account value relating to corporate-owned life insurance (“COLI”). Under certain COLI contracts, if the Company reportscertain unlikely adverse results in its consolidated financial statements, withdrawals would not be immediately available and would be subjectto market value adjustment, which could result in a reduction of the account value.
F-21MetLife, Inc.
MetLife, Inc.
Notes to the Consolidated Financial Statements — (Continued)

Policyholder DividendsPolicyholder dividends are approved annually by the insurance subsidiaries’ boards of directors. The aggregate amount of policyholder
dividends is related to actual interest, mortality, morbidity and expense experience for the year, as well as management’s judgment as to theappropriate level of statutory surplus to be retained by the insurance subsidiaries.
Income TaxesThe Holding Company and its includable life insurance and non-life insurance subsidiaries file a consolidated U.S. federal income tax
return in accordance with the provisions of the Internal Revenue Code of 1986, as amended (the “Code”). Non-includable subsidiaries fileeither separate individual corporate tax returns or separate consolidated tax returns.
The Company’s accounting for income taxes represents management’s best estimate of various events and transactions.Deferred tax assets and liabilities resulting from temporary differences between the financial reporting and tax bases of assets and
liabilities are measured at the balance sheet date using enacted tax rates expected to apply to taxable income in the years the temporarydifferences are expected to reverse.
For U.S. federal income tax purposes, the Company anticipates making an election under the Code Section 338 as it relates to theAcquisition. As such, the tax basis in the acquired assets and liabilities is adjusted as of the Acquisition Date resulting in a change to therelated deferred income taxes.
The realization of deferred tax assets depends upon the existence of sufficient taxable income within the carryback or carryforwardperiods under the tax law in the applicable tax jurisdiction. Valuation allowances are established when management determines, based onavailable information, that it is more likely than not that deferred income tax assets will not be realized. Significant judgment is required indetermining whether valuation allowances should be established, as well as the amount of such allowances. When making such deter-mination, consideration is given to, among other things, the following:
(i) future taxable income exclusive of reversing temporary differences and carryforwards;(ii) future reversals of existing taxable temporary differences;(iii) taxable income in prior carryback years; and(iv) tax planning strategies.
The Company may be required to change its provision for income taxes in certain circumstances. Examples of such circumstancesinclude when the ultimate deductibility of certain items is challenged by taxing authorities (see Note 15) or when estimates used in determiningvaluation allowances on deferred tax assets significantly change or when receipt of new information indicates the need for adjustment invaluation allowances. Additionally, future events, such as changes in tax laws, tax regulations, or interpretations of such laws or regulations,could have an impact on the provision for income tax and the effective tax rate. Any such changes could significantly affect the amountsreported in the consolidated financial statements in the year these changes occur.
The Company determines whether it is more likely than not that a tax position will be sustained upon examination by the appropriate taxingauthorities before any part of the benefit can be recorded in the financial statements. A tax position is measured at the largest amount ofbenefit that is greater than 50 percent likely of being realized upon settlement. Unrecognized tax benefits due to tax uncertainties that do notmeet the threshold are included within other liabilities and are charged to earnings in the period that such determination is made.
The Company classifies interest recognized as interest expense and penalties recognized as a component of income tax.
ReinsuranceThe Company enters into reinsurance agreements primarily as a purchaser of reinsurance for its various insurance products and also as a
provider of reinsurance for some insurance products issued by third parties.For each of its reinsurance agreements, the Company determines whether the agreement provides indemnification against loss or liability
relating to insurance risk in accordance with applicable accounting standards. The Company reviews all contractual features, particularlythose that may limit the amount of insurance risk to which the reinsurer is subject or features that delay the timely reimbursement of claims.
For reinsurance of existing in-force blocks of long-duration contracts that transfer significant insurance risk, the difference, if any, betweenthe amounts paid (received), and the liabilities ceded (assumed) related to the underlying contracts is considered the net cost of reinsuranceat the inception of the reinsurance agreement. The net cost of reinsurance is recorded as an adjustment to DAC and recognized as acomponent of other expenses on a basis consistent with the way the acquisition costs on the underlying reinsured contracts would berecognized. Subsequent amounts paid (received) on the reinsurance of in-force blocks, as well as amounts paid (received) related to newbusiness, are recorded as ceded (assumed) premiums and ceded (assumed) future policy benefit liabilities are established.
For prospective reinsurance of short-duration contracts that meet the criteria for reinsurance accounting, amounts paid (received) arerecorded as ceded (assumed) premiums and ceded (assumed) unearned premiums and are reflected as a component of premiums and otherreceivables (future policy benefits). Such amounts are amortized through earned premiums over the remaining contract period in proportionto the amount of protection provided. For retroactive reinsurance of short-duration contracts that meet the criteria of reinsurance accounting,amounts paid (received) in excess of (which do not exceed) the related insurance liabilities ceded (assumed) are recognized immediately as aloss. Any gains on such retroactive agreements are deferred and recorded in other liabilities. The gains are amortized primarily using therecovery method.
The assumptions used to account for both long and short-duration reinsurance agreements are consistent with those used for theunderlying contracts. Ceded policyholder and contract related liabilities, other than those currently due, are reported gross on the balancesheet.
Amounts currently recoverable under reinsurance agreements are included in premiums, reinsurance and other receivables and amountscurrently payable are included in other liabilities. Such assets and liabilities relating to reinsurance agreements with the same reinsurer may berecorded net on the balance sheet, if a right of offset exists within the reinsurance agreement. In the event that reinsurers do not meet their
F-22 MetLife, Inc.
MetLife, Inc.
Notes to the Consolidated Financial Statements — (Continued)

obligations to the Company under the terms of the reinsurance agreements, reinsurance balances recoverable could become uncollectible.In such instances, reinsurance recoverable balances are stated net of allowances for uncollectible reinsurance.
Premiums, fees and policyholder benefits and claims include amounts assumed under reinsurance agreements and are net of reinsuranceceded. Amounts received from reinsurers for policy administration are reported in other revenues.
If the Company determines that a reinsurance agreement does not expose the reinsurer to a reasonable possibility of a significant lossfrom insurance risk, the Company records the agreement using the deposit method of accounting. Deposits received are included in otherliabilities and deposits made are included within premiums, reinsurance and other receivables. As amounts are paid or received, consistentwith the underlying contracts, the deposit assets or liabilities are adjusted. Interest on such deposits is recorded as other revenues or otherexpenses, as appropriate. Periodically, the Company evaluates the adequacy of the expected payments or recoveries and adjusts thedeposit asset or liability through other revenues or other expenses, as appropriate.
Accounting for reinsurance requires extensive use of assumptions and estimates, particularly related to the future performance of theunderlying business and the potential impact of counterparty credit risks. The Company periodically reviews actual and anticipatedexperience compared to the aforementioned assumptions used to establish assets and liabilities relating to ceded and assumed reinsuranceand evaluates the financial strength of counterparties to its reinsurance agreements using criteria similar to that evaluated in the securityimpairment process discussed previously.
Cessions under reinsurance arrangements do not discharge the Company’s obligations as the primary insurer.
Employee Benefit PlansCertain subsidiaries of the Holding Company (the “Subsidiaries”) sponsor and/or administer various plans that provide defined benefit
pension and other postretirement benefits covering eligible employees and sales representatives. Measurement dates used for all of theSubsidiaries’ defined benefit pension and other postretirement benefit plans correspond with the fiscal year ends of sponsoring Subsidiaries,which are December 31 for U.S. Subsidiaries and November 30 for most foreign Subsidiaries.
Pension benefits are provided utilizing either a traditional formula or cash balance formula. The traditional formula provides benefits basedupon years of credited service and either final average or career average earnings. The cash balance formula utilizes hypothetical or notionalaccounts which credit participants with benefits equal to a percentage of eligible pay, as well as earnings credits, determined annually basedupon the average annual rate of interest on 30-year Treasury securities, for each account balance.
The Subsidiaries also provide certain postemployment benefits and certain postretirement medical and life insurance benefits for retiredemployees. Employees of the Subsidiaries who were hired prior to 2003 (or, in certain cases, rehired during or after 2003) and meet age andservice criteria while working for one of the Subsidiaries, may become eligible for these other postretirement benefits, at various levels, inaccordance with the applicable plans. Virtually all retirees, or their beneficiaries, contribute a portion of the total cost of postretirementmedical benefits. Employees hired after 2003 are not eligible for any employer subsidy for postretirement medical benefits.
The projected pension benefit obligation (“PBO”) is defined as the actuarially calculated present value of vested and non-vested pensionbenefits accrued based on future salary levels. The accumulated pension benefit obligation (“ABO”) is the actuarial present value of vestedand non-vested pension benefits accrued based on current salary levels. Obligations, both PBO and ABO, of the defined benefit pensionplans are determined using a variety of actuarial assumptions, from which actual results may vary, as described below.
The expected postretirement plan benefit obligations (“EPBO”) represents the actuarial present value of all other postretirement benefitsexpected to be paid after retirement to employees and their dependents and is used in measuring the periodic postretirement benefitexpense. The accumulated postretirement plan benefit obligations (“APBO”) represents the actuarial present value of future other postre-tirement benefits attributed to employee services rendered through a particular date and is the valuation basis upon which liabilities areestablished. The APBO is determined using a variety of actuarial assumptions, from which actual results may vary, as described below.
The Company recognizes the funded status of the PBO for pension plans and the APBO for other postretirement plans for each of its plansin the consolidated balance sheets. The actuarial gains or losses, prior service costs and credits and the remaining net transition asset orobligation that had not yet been included in net periodic benefit costs are charged, net of income tax, to accumulated other comprehensiveincome (loss).
Net periodic benefit cost is determined using management estimates and actuarial assumptions to derive service cost, interest cost, andexpected return on plan assets for a particular year. Net periodic benefit cost also includes the applicable amortization of any prior servicecost (credit) arising from the increase (decrease) in prior years’ benefit costs due to plan amendments or initiation of new plans. These costsare amortized into net periodic benefit cost over the expected service years of employees whose benefits are affected by such planamendments. Actual experience related to plan assets and/or the benefit obligations may differ from that originally assumed whendetermining net periodic benefit cost for a particular period, resulting in gains or losses. To the extent such aggregate gains or lossesexceed 10 percent of the greater of the benefit obligations or the market-related asset value of the plans, they are amortized into net periodicbenefit cost over the expected service years of employees expected to receive benefits under the plans.
The obligations and expenses associated with these plans require an extensive use of assumptions such as the discount rate, expectedrate of return on plan assets, rate of future compensation increases, healthcare cost trend rates, as well as assumptions regarding participantdemographics such as rate and age of retirements, withdrawal rates and mortality. Management, in consultation with its external consultingactuarial firms, determines these assumptions based upon a variety of factors such as historical performance of the plan and its assets,currently available market and industry data and expected benefit payout streams. The assumptions used may differ materially from actualresults due to, among other factors, changing market and economic conditions and changes in participant demographics. These differencesmay have a significant effect on the Company’s consolidated financial statements and liquidity.
The Subsidiaries also sponsor defined contribution savings and investment plans (“SIP”) for substantially all employees under which aportion of employee contributions is matched. Applicable matching contributions are made each payroll period. Accordingly, the Companyrecognizes compensation cost for current matching contributions. As all contributions are transferred currently as earned to the SIP trust, noliability for matching contributions is recognized in the consolidated balance sheets.
F-23MetLife, Inc.
MetLife, Inc.
Notes to the Consolidated Financial Statements — (Continued)

Stock-Based CompensationAs more fully described in Note 18, the Company grants certain employees and directors stock-based compensation awards under
various plans that are subject to specific vesting conditions. The cost of all stock-based transactions is measured at fair value at grant dateand recognized over the period during which a grantee is required to provide goods or services in exchange for the award. Although the termsof the Company’s stock-based plans do not accelerate vesting upon retirement, or the attainment of retirement eligibility, the requisite serviceperiod subsequent to attaining such eligibility is considered nonsubstantive. Accordingly, the Company recognizes compensation expenserelated to stock-based awards over the shorter of the requisite service period or the period to attainment of retirement eligibility. An estimationof future forfeitures of stock-based awards is incorporated into the determination of compensation expense when recognizing expense overthe requisite service period.
Foreign CurrencyAssets, liabilities and operations of foreign affiliates and subsidiaries are recorded based on the functional currency of each entity. The
determination of the functional currency is made based on the appropriate economic and management indicators. With the exception ofcertain foreign operations, primarily Japan, where multiple functional currencies exist, the local currencies of foreign operations are thefunctional currencies. Assets and liabilities of foreign affiliates and subsidiaries are translated from the functional currency to U.S. dollars atthe exchange rates in effect at each year-end and income and expense accounts are translated at the average rates of exchange prevailingduring the year. The resulting translation adjustments are charged or credited directly to other comprehensive income or loss, net ofapplicable taxes. Gains and losses from foreign currency transactions, including the effect of re-measurement of monetary assets andliabilities to the appropriate functional currency, are reported as part of net investment gains (losses) in the period in which they occur.
Discontinued OperationsThe results of operations of a component of the Company that either has been disposed of or is classified as held-for-sale are reported in
discontinued operations if the operations and cash flows of the component have been or will be eliminated from the ongoing operations of theCompany as a result of the disposal transaction and the Company will not have any significant continuing involvement in the operations of thecomponent after the disposal transaction.
Earnings Per Common ShareBasic earnings per common share are computed based on the weighted average number of common shares, or their equivalent,
outstanding during the period. The difference between the number of shares assumed issued and number of shares assumed purchasedrepresents the dilutive shares. Diluted earnings per common share include the dilutive effect of the assumed: (i) exercise or issuance of stock-based awards using the treasury stock method; (ii) settlement of stock purchase contracts underlying common equity units using the treasurystock method; and (iii) settlement of accelerated common stock repurchase contracts. Under the treasury stock method, exercise orissuance of stock-based awards and settlement of the stock purchase contracts underlying common equity units is assumed to occur withthe proceeds used to purchase common stock at the average market price for the period. See Notes 14, 18 and 20.
Litigation ContingenciesThe Company is a party to a number of legal actions and is involved in a number of regulatory investigations. Given the inherent
unpredictability of these matters, it is difficult to estimate the impact on the Company’s financial position. Liabilities are established when it isprobable that a loss has been incurred and the amount of the loss can be reasonably estimated. On a quarterly and annual basis, theCompany reviews relevant information with respect to liabilities for litigation, regulatory investigations and litigation-related contingencies tobe reflected in the Company’s consolidated financial statements. It is possible that an adverse outcome in certain of the Company’s litigationand regulatory investigations, or the use of different assumptions in the determination of amounts recorded, could have a material effect uponthe Company’s consolidated net income or cash flows in particular quarterly or annual periods.
Separate AccountsSeparate accounts are established in conformity with insurance laws and are generally not chargeable with liabilities that arise from any
other business of the Company. Separate account assets are subject to general account claims only to the extent the value of such assetsexceeds the separate account liabilities. Assets within the Company’s separate accounts primarily include: mutual funds, fixed maturity andequity securities, mortgage loans, derivatives, hedge funds, other limited partnership interests, short-term investments and cash and cashequivalents. The Company reports separately, as assets and liabilities, investments held in separate accounts and liabilities of the separateaccounts if (i) such separate accounts are legally recognized; (ii) assets supporting the contract liabilities are legally insulated from theCompany’s general account liabilities; (iii) investments are directed by the contractholder; and (iv) all investment performance, net of contractfees and assessments, is passed through to the contractholder. The Company reports separate account assets meeting such criteria at theirfair value which is based on the estimated fair values of the underlying assets comprising the portfolios of an individual separate account.Investment performance (including investment income, net investment gains (losses) and changes in unrealized gains (losses)) and thecorresponding amounts credited to contractholders of such separate accounts are offset within the same line in the consolidated statementsof operations. Separate accounts credited with a contractual investment return are combined on a line-by-line basis with the Company’sgeneral account assets, liabilities, revenues and expenses and the accounting for these investments is consistent with the methodologiesdescribed herein for similar financial instruments held within the general account. Unit-linked separate account investments which aredirected by contractholders but do not meet one or more of the other above criteria are included in trading and other securities.
The Company’s revenues reflect fees charged to the separate accounts, including mortality charges, risk charges, policy administrationfees, investment management fees and surrender charges.
F-24 MetLife, Inc.
MetLife, Inc.
Notes to the Consolidated Financial Statements — (Continued)

Adoption of New Accounting Pronouncements
Financial InstrumentsEffective December 31, 2010, the Company adopted new guidance regarding disclosures about the credit quality of financing receivables
and valuation allowances for credit losses, including credit quality indicators. Such disclosures must be disaggregated by portfolio segmentor class based on how a company develops its valuation allowances for credit losses and how it manages its credit exposure. The Companyhas provided all material required disclosures in its consolidated financial statements. Certain additional disclosures will be required forreporting periods beginning March 31, 2011 and certain disclosures relating to troubled debt restructurings have been deferred indefinitely.
Effective July 1, 2010, the Company adopted new guidance regarding accounting for embedded credit derivatives within structuredsecurities. This guidance clarifies the type of embedded credit derivative that is exempt from embedded derivative bifurcation requirements.Specifically, embedded credit derivatives resulting only from subordination of one financial instrument to another continue to qualify for thescope exception. Embedded credit derivative features other than subordination must be analyzed to determine whether they requirebifurcation and separate accounting.
As a result of the adoption of this guidance, the Company elected FVO for certain structured securities that were previously accounted foras fixed maturity securities. Upon adoption, the Company reclassified $50 million of securities from fixed maturity securities to trading andother securities. These securities had cumulative unrealized losses of $10 million, net of income tax, which was recognized as a cumulativeeffect adjustment to decrease retained earnings with a corresponding increase to accumulated other comprehensive income (loss) as ofJuly 1, 2010.
Effective January 1, 2010, the Company adopted new guidance related to financial instrument transfers and consolidation of VIEs. Thefinancial instrument transfer guidance eliminates the concept of a QSPE, eliminates the guaranteed mortgage securitization exception,changes the criteria for achieving sale accounting when transferring a financial asset and changes the initial recognition of retained beneficialinterests. The new consolidation guidance changes the definition of the primary beneficiary, as well as the method of determining whether anentity is a primary beneficiary of a VIE from a quantitative model to a qualitative model. Under the new qualitative model, the entity that has boththe ability to direct the most significant activities of the VIE and the obligation to absorb losses or receive benefits that could be significant tothe VIE is considered to be the primary beneficiary of the VIE. The guidance requires a quarterly reassessment, as well as enhanceddisclosures, including the effects of a company’s involvement with VIEs on its financial statements.
As a result of the adoption of this guidance, the Company consolidated certain former QSPEs that were previously accounted for as fixedmaturity CMBS and equity security collateralized debt obligations. The Company also elected FVO for all of the consolidated assets andliabilities of these entities. Upon consolidation, the Company recorded $278 million of securities classified as trading and other securities,$6,769 million of commercial mortgage loans and $6,822 million of long-term debt based on estimated fair values at January 1, 2010 and de-recognized $179 million in fixed maturity securities and less than $1 million in equity securities. The consolidation also resulted in a decreasein retained earnings of $12 million, net of income tax, and an increase in accumulated other comprehensive income (loss) of $42 million, net ofincome tax, at January 1, 2010. For the year ended December 31, 2010, the Company recorded $426 million of net investment income on theconsolidated assets, $411 million of interest expense in other expenses on the related long-term debt, and $6 million in net investment gains(losses) to remeasure the assets and liabilities at their estimated fair values.
In addition, the Company also deconsolidated certain partnerships for which the Company does not have the power to direct activities andfor which the Company has concluded it is no longer the primary beneficiary. These deconsolidations did not result in a cumulative effectadjustment to retained earnings and did not have a material impact on the Company’s consolidated financial statements.
Also effective January 1, 2010, the Company adopted new guidance that indefinitely defers the above changes relating to the Company’sinterests in entities that have all the attributes of an investment company or for which it is industry practice to apply measurement principles forfinancial reporting that are consistent with those applied by an investment company. As a result of the deferral, the above guidance did notapply to certain real estate joint ventures and other limited partnership interests held by the Company.
As more fully described in “Summary of Significant Accounting Policies and Critical Accounting Estimates,” effective April 1, 2009, theCompany adopted OTTI guidance. This guidance amends the previously used methodology for determining whether an OTTI exists for fixedmaturity securities, changes the presentation of OTTI for fixed maturity securities and requires additional disclosures for OTTI on fixed maturityand equity securities in interim and annual financial statements.
The Company’s net cumulative effect adjustment of adopting the OTTI guidance was an increase of $76 million to retained earnings with acorresponding increase to accumulated other comprehensive loss to reclassify the noncredit loss portion of previously recognized OTTIlosses on fixed maturity securities held at April 1, 2009. This cumulative effect adjustment was comprised of an increase in the amortized costbasis of fixed maturity securities of $126 million, net of policyholder related amounts of $10 million and net of deferred income taxes of$40 million, resulting in the net cumulative effect adjustment of $76 million. The increase in the amortized cost basis of fixed maturitysecurities of $126 million by sector was as follows: $53 million — ABS, $43 million — RMBS, $17 million — U.S. corporate securities and$13 million — CMBS.
As a result of the adoption of the OTTI guidance, the Company’s pre-tax earnings for the year ended December 31, 2009 increased by$857 million, offset by an increase in other comprehensive loss representing OTTI relating to noncredit losses recognized during the yearended December 31, 2009.
Effective January 1, 2009, the Company adopted guidance on disclosures about derivative instruments and hedging. This guidancerequires enhanced qualitative disclosures about objectives and strategies for using derivatives, quantitative disclosures about fair valueamounts of and gains and losses on derivative instruments and disclosures about credit risk-related contingent features in derivativeagreements. The Company has provided all of the material disclosures in its consolidated financial statements.
F-25MetLife, Inc.
MetLife, Inc.
Notes to the Consolidated Financial Statements — (Continued)

The following pronouncements relating to financial instruments had no material impact on the Company’s consolidated financialstatements:
• Effective January 1, 2009, the Company adopted prospectively an update on accounting for transfers of financial assets andrepurchase financing transactions. This update provides guidance for evaluating whether to account for a transfer of a financial assetand repurchase financing as a single transaction or as two separate transactions.
• Effective December 31, 2008, the Company adopted guidance on the recognition of interest income and impairment on purchasedbeneficial interests and beneficial interests that continue to be held by a transferor in securitized financial assets. This new guidancemore closely aligns the determination of whether an OTTI has occurred for a beneficial interest in a securitized financial asset with theoriginal guidance for fixed maturity securities classified as available-for-sale or held-to-maturity.
• Effective January 1, 2008, the Company adopted guidance relating to application of the shortcut method of accounting for derivativeinstruments and hedging activities. This guidance permits interest rate swaps to have a non-zero fair value at inception when applyingthe shortcut method of assessing hedge effectiveness as long as the difference between the transaction price (zero) and the fair value(exit price), as defined by current accounting guidance on fair value measurements, is solely attributable to a bid-ask spread. Inaddition, entities are not precluded from applying the shortcut method of assessing hedge effectiveness in a hedging relationship ofinterest rate risk involving an interest bearing asset or liability in situations where the hedged item is not recognized for accountingpurposes until settlement date as long as the period between trade date and settlement date of the hedged item is consistent withgenerally established conventions in the marketplace.
• Effective January 1, 2008, the Company adopted guidance that permits a reporting entity to offset fair value amounts recognized for theright to reclaim cash collateral (a receivable) or the obligation to return cash collateral (a payable) against fair value amounts recognizedfor derivative instruments executed with the same counterparty under the same master netting arrangement that have been offset. Thisguidance also includes certain terminology modifications. Upon adoption of this guidance, the Company did not change its accountingpolicy of not offsetting fair value amounts recognized for derivative instruments under master netting arrangements.
Business Combinations and Noncontrolling InterestsEffective January 1, 2009, the Company adopted revised guidance on business combinations and accounting for noncontrolling interests
in the consolidated financial statements. Under this guidance:• All business combinations (whether full, partial or “step” acquisitions) result in all assets and liabilities of an acquired business being
recorded at fair value, with limited exceptions.• Acquisition costs are generally expensed as incurred; restructuring costs associated with a business combination are generally
expensed as incurred subsequent to the acquisition date.• The fair value of the purchase price, including the issuance of equity securities, is determined on the acquisition date.• Assets acquired and liabilities assumed in a business combination that arise from contingencies are recognized at fair value if the
acquisition-date fair value can be reasonably determined. If the fair value is not estimable, an asset or liability is recorded if existence orincurrence at the acquisition date is probable and its amount is reasonably estimable.
• Changes in deferred income tax asset valuation allowances and income tax uncertainties after the acquisition date generally affectincome tax expense.
• Noncontrolling interests (formerly known as “minority interests”) are valued at fair value at the acquisition date and are presented asequity rather than liabilities.
• Net income (loss) includes amounts attributable to noncontrolling interests.• When control is attained on previously noncontrolling interests, the previously held equity interests are remeasured at fair value and a
gain or loss is recognized.• Purchases or sales of equity interests that do not result in a change in control are accounted for as equity transactions.• When control is lost in a partial disposition, realized gains or losses are recorded on equity ownership sold and the remaining ownership
interest is remeasured and holding gains or losses are recognized.The adoption of this guidance on a prospective basis did not have an impact on the Company’s consolidated financial statements.
Financial statements and disclosures for periods prior to 2009 reflect the retrospective application of the accounting for noncontrollinginterests as required under this guidance.
Effective January 1, 2009, the Company adopted prospectively guidance on determination of the useful life of intangible assets. Thisguidance amends the factors that should be considered in developing renewal or extension assumptions used to determine the useful life of arecognized intangible asset. This change is intended to improve the consistency between the useful life of a recognized intangible asset andthe period of expected future cash flows used to measure the fair value of the asset. The Company determines useful lives and provides all ofthe material disclosures prospectively on intangible assets acquired on or after January 1, 2009 in accordance with this guidance.
Fair ValueEffective January 1, 2010, the Company adopted new guidance that requires new disclosures about significant transfers into and/or out
of Levels 1 and 2 of the fair value hierarchy and activity in Level 3. In addition, this guidance provides clarification of existing disclosurerequirements about level of disaggregation and inputs and valuation techniques. The adoption of this guidance did not have an impact on theCompany’s consolidated financial statements.
Effective January 1, 2008, the Company adopted fair value measurements guidance which defines fair value, establishes a consistentframework for measuring fair value, establishes a fair value hierarchy based on the observability of inputs used to measure fair value, andrequires enhanced disclosures about fair value measurements and applied this guidance prospectively to assets and liabilities measured atfair value. The adoption of this guidance changed the valuation of certain freestanding derivatives by moving from a mid to bid pricingconvention as it relates to certain volatility inputs, as well as the addition of liquidity adjustments and adjustments for risks inherent in aparticular input or valuation technique. The adoption of this guidance also changed the valuation of the Company’s embedded derivatives,
F-26 MetLife, Inc.
MetLife, Inc.
Notes to the Consolidated Financial Statements — (Continued)

most significantly the valuation of embedded derivatives associated with certain guarantees on variable annuity contracts. The change invaluation of embedded derivatives associated with guarantees on annuity contracts resulted from the incorporation of risk marginsassociated with non-capital market inputs and the inclusion of the Company’s nonperformance risk in their valuation. At January 1,2008, the impact of adopting the guidance on assets and liabilities measured at estimated fair value was $30 million ($19 million, net ofincome tax) and was recognized as a change in estimate in the accompanying consolidated statement of operations where it was presentedin the respective statement of operations caption to which the item measured at estimated fair value is presented. There were no significantchanges in estimated fair value of items measured at fair value and reflected in accumulated other comprehensive income (loss). The additionof risk margins and the Company’s nonperformance risk adjustment in the valuation of embedded derivatives associated with annuitycontracts may result in significant volatility in the Company’s consolidated net income in future periods. The Company provided all of thematerial disclosures in Note 5.
In February 2007, the Financial Accounting Standards Board (“FASB”) issued guidance related to the FVO for financial assets and financialliabilities. This guidance permits entities the option to measure most financial instruments and certain other items at fair value at specifiedelection dates and to recognize related unrealized gains and losses in earnings. The FVO is applied on an instrument-by-instrument basisupon adoption of the standard, upon the acquisition of an eligible financial asset, financial liability or firm commitment or when certainspecified reconsideration events occur. The fair value election is an irrevocable election. Effective January 1, 2008, the Company electedFVO on fixed maturity and equity securities backing certain pension products sold in Brazil. Such securities are presented as trading and othersecurities in the consolidated balance sheets with subsequent changes in estimated fair value recognized in net investment income.Previously, these securities were accounted for as available-for-sale securities and unrealized gains and losses on these securities wererecorded as a separate component of accumulated other comprehensive income (loss). The Company’s insurance joint venture in Japan alsoelected FVO for certain of its existing single premium deferred annuities and the assets supporting such liabilities. FVO was elected to achieveimproved reporting of the asset/liability matching associated with these products. Adoption of this guidance by the Company and itsJapanese joint venture resulted in an increase in retained earnings of $27 million, net of income tax, at January 1, 2008. The election of FVOresulted in the reclassification of $10 million, net of income tax, of net unrealized gains from accumulated other comprehensive income (loss)to retained earnings on January 1, 2008.
The following pronouncements relating to fair value had no material impact on the Company’s consolidated financial statements:• Effective September 30, 2008, the Company adopted guidance relating to the fair value measurements of financial assets when the
market for those assets is not active. It provides guidance on how a company’s internal cash flow and discount rate assumptions shouldbe considered in the measurement of fair value when relevant market data does not exist, how observable market information in aninactive market affects fair value measurement and how the use of market quotes should be considered when assessing the relevanceof observable and unobservable data available to measure fair value.
• Effective January 1, 2009, the Company implemented fair value measurements guidance for certain nonfinancial assets and liabilitiesthat are recorded at fair value on a non-recurring basis. This guidance applies to such items as: (i) nonfinancial assets and nonfinancialliabilities initially measured at estimated fair value in a business combination; (ii) reporting units measured at estimated fair value in thefirst step of a goodwill impairment test; and (iii) indefinite-lived intangible assets measured at estimated fair value for impairmentassessment.
• Effective January 1, 2009, the Company adopted prospectively guidance on issuer’s accounting for liabilities measured at fair valuewith a third-party credit enhancement. This guidance states that an issuer of a liability with a third-party credit enhancement should notinclude the effect of the credit enhancement in the fair value measurement of the liability. In addition, it requires disclosures about theexistence of any third-party credit enhancement related to liabilities that are measured at fair value.
• Effective April 1, 2009, the Company adopted guidance on: (i) estimating the fair value of an asset or liability if there was a significantdecrease in the volume and level of trading activity for these assets or liabilities; and (ii) identifying transactions that are not orderly. TheCompany has provided all of the material disclosures in its consolidated financial statements.
• Effective December 31, 2009, the Company adopted guidance on: (i) measuring the fair value of investments in certain entities thatcalculate NAV per share; (ii) how investments within its scope would be classified in the fair value hierarchy; and (iii) enhanced disclosurerequirements, for both interim and annual periods, about the nature and risks of investments measured at fair value on a recurring ornon-recurring basis.
• Effective December 31, 2009, the Company adopted guidance on measuring liabilities at fair value. This guidance provides clarificationfor measuring fair value in circumstances in which a quoted price in an active market for the identical liability is not available. In suchcircumstances a company is required to measure fair value using either a valuation technique that uses: (i) the quoted price of theidentical liability when traded as an asset; or (ii) quoted prices for similar liabilities or similar liabilities when traded as assets; or(iii) another valuation technique that is consistent with the principles of fair value measurement such as an income approach (e.g.,present value technique) or a market approach (e.g., “entry” value technique).
Defined Benefit and Other Postretirement PlansEffective December 31, 2009, the Company adopted guidance to enhance the transparency surrounding the types of assets and
associated risks in an employer’s defined benefit pension or other postretirement benefit plans. This guidance requires an employer todisclose information about the valuation of plan assets similar to that required under other fair value disclosure guidance. The Companyprovided all of the material disclosures in its consolidated financial statements.
Other PronouncementsEffective April 1, 2009, the Company adopted prospectively guidance which establishes general standards for accounting and
disclosures of events that occur subsequent to the balance sheet date but before financial statements are issued or available to be issued.The Company has provided all of the material disclosures in its consolidated financial statements.
F-27MetLife, Inc.
MetLife, Inc.
Notes to the Consolidated Financial Statements — (Continued)

The following pronouncements had no material impact on the Company’s consolidated financial statements:• Effective January 1, 2009, the Company adopted guidance on determining whether an instrument (or embedded feature) is indexed to
an entity’s own stock. This guidance provides a framework for evaluating the terms of a particular instrument and whether such termsqualify the instrument as being indexed to an entity’s own stock.
• Effective January 1, 2008, the Company adopted guidance on written loan commitments recorded at fair value through earnings. Itprovides guidance on (i) incorporating expected net future cash flows when related to the associated servicing of a loan whenmeasuring fair value; and (ii) broadening the U.S. Securities and Exchange Commission (“SEC”) staff’s view that internally-developedintangible assets should not be recorded as part of the fair value of a derivative loan commitment or to written loan commitments that areaccounted for at fair value through earnings. Internally-developed intangible assets are not considered a component of the relatedinstruments.
• Effective January 1, 2008, the Company prospectively adopted guidance on the sale of real estate when the agreement includes a buy-sell clause. This guidance addresses whether the existence of a buy-sell arrangement would preclude partial sales treatment when realestate is sold to a jointly owned entity and concludes that the existence of a buy-sell clause does not necessarily preclude partial saletreatment under current guidance.
Future Adoption of New Accounting PronouncementsIn December 2010, the FASB issued new guidance addressing when a business combination should be assumed to have occurred for the
purpose of providing pro forma disclosure (Accounting Standards Update (“ASU”) 2010-29, Business Combinations (Topic 805): Disclosureof Supplementary Pro Forma Information for Business Combinations). Under the new guidance, if an entity presents comparative financialstatements, the entity should disclose revenue and earnings of the combined entity as though the business combination that occurred duringthe current year had occurred as of the beginning of the comparable prior annual reporting period. The guidance also expands thesupplemental pro forma disclosures to include additional narratives. The guidance is effective for fiscal years beginning on or afterDecember 15, 2010. The Company will apply the guidance prospectively on its accounting for future acquisitions and does not expectthe adoption of this guidance to have a material impact on the Company’s consolidated financial statements.
In December 2010, the FASB issued new guidance regarding goodwill impairment testing (ASU 2010-28, Intangibles — Goodwill andOther (Topic 350): When to Perform Step 2 of the Goodwill Impairment Test for Reporting Units with Zero or Negative Carrying Amounts). Thisguidance modifies Step 1 of the goodwill impairment test for reporting units with zero or negative carrying amounts. For those reporting units,an entity would be required to perform Step 2 of the test if qualitative factors indicate that it is more likely than not that goodwill impairmentexists. The guidance is effective for the first quarter of 2011. The Company does not expect the adoption of this new guidance to have amaterial impact on its consolidated financial statements.
In October 2010, the FASB issued new guidance regarding accounting for deferred acquisition costs (ASU 2010-26, Accounting forCosts Associated with Acquiring or Renewing Insurance Contracts) effective for the first quarter of 2012. This guidance clarifies the costs thatshould be deferred by insurance entities when issuing and renewing insurance contracts. The guidance also specifies that only costs relateddirectly to successful acquisition of new or renewal contracts can be capitalized. All other acquisition-related costs should be expensed asincurred. The Company is currently evaluating the impact of this guidance on its consolidated financial statements.
In April 2010, the FASB issued new guidance regarding accounting for investment funds determined to be VIEs (ASU 2010-15, HowInvestments Held through Separate Accounts Affect an Insurer’s Consolidation Analysis of Those Investments). Under this guidance, aninsurance entity would not be required to consolidate a voting-interest investment fund when it holds the majority of the voting interests of thefund through its separate accounts. In addition, an insurance entity would not consider the interests held through separate accounts for thebenefit of policyholders in the insurer’s evaluation of its economics in a VIE, unless the separate account contractholder is a related party. Theguidance is effective for the first quarter of 2011. The Company does not expect the adoption of this new guidance to have a material impacton its consolidated financial statements.
2. Acquisitions and Dispositions
2010 Acquisition of ALICO
Description of TransactionOn the Acquisition Date, MetLife, Inc. acquired all of the issued and outstanding capital stock of American Life from ALICO Holdings, a
subsidiary of AIG, and DelAm from AIG for a total purchase price of $16.4 billion, which consisted of (i) cash of $7.2 billion (includes settlementof intercompany balances and certain other adjustments), and (ii) securities of MetLife, Inc. valued at $9.2 billion.
The $7.2 billion cash portion of the purchase price was funded through the issuance of common stock as described in Note 18, fixed andfloating rate senior debt as described in Note 11 as well as cash on hand. The securities issued to ALICO Holdings included(a) 78,239,712 shares of MetLife, Inc.’s common stock; (b) 6,857,000 shares of Series B Contingent Convertible Junior ParticipatingNon-Cumulative Perpetual Preferred Stock (the “Convertible Preferred Stock”) of MetLife, Inc.; and (c) 40 million common equity units ofMetLife, Inc. (the “Equity Units”) with an aggregate stated amount at issuance of $3.0 billion, initially consisting of (i) three purchase contracts(the “Series C Purchase Contracts,” the “Series D Purchase Contracts” and the “Series E Purchase Contracts” and, together, the “PurchaseContracts”), obligating the holder to purchase, on specified future settlement dates, a variable number of shares of MetLife, Inc.’s commonstock for a fixed price; and (ii) an interest in each of three series of debt securities (the “Series C Debt Securities,” the “Series D DebtSecurities” and the “Series E Debt Securities,” and, together, the “Debt Securities”) issued by MetLife, Inc. Distributions on the Equity Unitswill be made quarterly, through contract payments on the Purchase Contracts and interest payments on the Debt Securities, initially at anaggregate annual rate of 5.00% (an average annual rate of 3.02% on the Purchase Contracts and an average annual rate of 1.98% on the DebtSecurities) as described in Note 14.
ALICO is an international life insurance company, providing consumers and businesses with products and services for life insurance,accident and health insurance, retirement and wealth management solutions in 54 countries. The Acquisition will significantly broaden the
F-28 MetLife, Inc.
MetLife, Inc.
Notes to the Consolidated Financial Statements — (Continued)
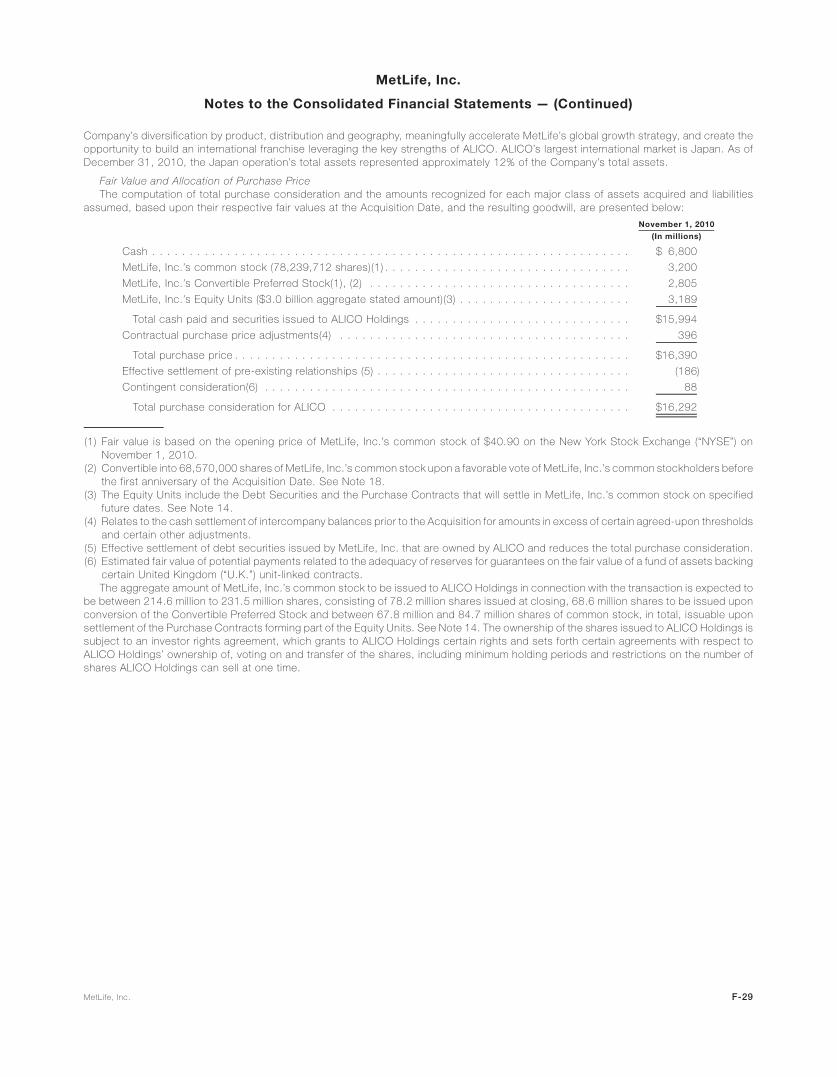
Company’s diversification by product, distribution and geography, meaningfully accelerate MetLife’s global growth strategy, and create theopportunity to build an international franchise leveraging the key strengths of ALICO. ALICO’s largest international market is Japan. As ofDecember 31, 2010, the Japan operation’s total assets represented approximately 12% of the Company’s total assets.
Fair Value and Allocation of Purchase PriceThe computation of total purchase consideration and the amounts recognized for each major class of assets acquired and liabilities
assumed, based upon their respective fair values at the Acquisition Date, and the resulting goodwill, are presented below:
November 1, 2010
(In millions)
Cash . . . . . . . . . . . . . . . . . . . . . . . . . . . . . . . . . . . . . . . . . . . . . . . . . . . . . . . . . . . . . . . . $ 6,800
MetLife, Inc.’s common stock (78,239,712 shares)(1) . . . . . . . . . . . . . . . . . . . . . . . . . . . . . . . . . 3,200
MetLife, Inc.’s Convertible Preferred Stock(1), (2) . . . . . . . . . . . . . . . . . . . . . . . . . . . . . . . . . . . 2,805
MetLife, Inc.’s Equity Units ($3.0 billion aggregate stated amount)(3) . . . . . . . . . . . . . . . . . . . . . . . 3,189
Total cash paid and securities issued to ALICO Holdings . . . . . . . . . . . . . . . . . . . . . . . . . . . . . $15,994
Contractual purchase price adjustments(4) . . . . . . . . . . . . . . . . . . . . . . . . . . . . . . . . . . . . . . . 396
Total purchase price . . . . . . . . . . . . . . . . . . . . . . . . . . . . . . . . . . . . . . . . . . . . . . . . . . . . . $16,390
Effective settlement of pre-existing relationships (5) . . . . . . . . . . . . . . . . . . . . . . . . . . . . . . . . . . (186)
Contingent consideration(6) . . . . . . . . . . . . . . . . . . . . . . . . . . . . . . . . . . . . . . . . . . . . . . . . . 88
Total purchase consideration for ALICO . . . . . . . . . . . . . . . . . . . . . . . . . . . . . . . . . . . . . . . . $16,292
(1) Fair value is based on the opening price of MetLife, Inc.’s common stock of $40.90 on the New York Stock Exchange (“NYSE”) onNovember 1, 2010.
(2) Convertible into 68,570,000 shares of MetLife, Inc.’s common stock upon a favorable vote of MetLife, Inc.’s common stockholders beforethe first anniversary of the Acquisition Date. See Note 18.
(3) The Equity Units include the Debt Securities and the Purchase Contracts that will settle in MetLife, Inc.’s common stock on specifiedfuture dates. See Note 14.
(4) Relates to the cash settlement of intercompany balances prior to the Acquisition for amounts in excess of certain agreed-upon thresholdsand certain other adjustments.
(5) Effective settlement of debt securities issued by MetLife, Inc. that are owned by ALICO and reduces the total purchase consideration.(6) Estimated fair value of potential payments related to the adequacy of reserves for guarantees on the fair value of a fund of assets backing
certain United Kingdom (“U.K.”) unit-linked contracts.The aggregate amount of MetLife, Inc.’s common stock to be issued to ALICO Holdings in connection with the transaction is expected to
be between 214.6 million to 231.5 million shares, consisting of 78.2 million shares issued at closing, 68.6 million shares to be issued uponconversion of the Convertible Preferred Stock and between 67.8 million and 84.7 million shares of common stock, in total, issuable uponsettlement of the Purchase Contracts forming part of the Equity Units. See Note 14. The ownership of the shares issued to ALICO Holdings issubject to an investor rights agreement, which grants to ALICO Holdings certain rights and sets forth certain agreements with respect toALICO Holdings’ ownership of, voting on and transfer of the shares, including minimum holding periods and restrictions on the number ofshares ALICO Holdings can sell at one time.
F-29MetLife, Inc.
MetLife, Inc.
Notes to the Consolidated Financial Statements — (Continued)

Recording of Assets Acquired and Liabilities AssumedThe following table summarizes the amounts recognized at fair value for each major class of assets acquired and liabilities assumed and
the resulting goodwill as of the Acquisition Date.
November 1, 2010
(In millions)
Assets acquired:
Total investments . . . . . . . . . . . . . . . . . . . . . . . . . . . . . . . . . . . . . . . . . . . . . . . . . . . . . . . . $101,036
Cash and cash equivalents . . . . . . . . . . . . . . . . . . . . . . . . . . . . . . . . . . . . . . . . . . . . . . . . . . 4,175
Accrued investment income . . . . . . . . . . . . . . . . . . . . . . . . . . . . . . . . . . . . . . . . . . . . . . . . . 948
Premiums, reinsurance and other receivables . . . . . . . . . . . . . . . . . . . . . . . . . . . . . . . . . . . . . . 1,971
VOBA . . . . . . . . . . . . . . . . . . . . . . . . . . . . . . . . . . . . . . . . . . . . . . . . . . . . . . . . . . . . . . . 9,210
Other assets . . . . . . . . . . . . . . . . . . . . . . . . . . . . . . . . . . . . . . . . . . . . . . . . . . . . . . . . . . . 1,146
Separate account assets . . . . . . . . . . . . . . . . . . . . . . . . . . . . . . . . . . . . . . . . . . . . . . . . . . . 244
Total assets . . . . . . . . . . . . . . . . . . . . . . . . . . . . . . . . . . . . . . . . . . . . . . . . . . . . . . . . . . $118,730
Liabilities assumed:
Future policy benefits . . . . . . . . . . . . . . . . . . . . . . . . . . . . . . . . . . . . . . . . . . . . . . . . . . . . . $ 31,811
Policyholder account balances . . . . . . . . . . . . . . . . . . . . . . . . . . . . . . . . . . . . . . . . . . . . . . . 66,652
Other policy-related balances . . . . . . . . . . . . . . . . . . . . . . . . . . . . . . . . . . . . . . . . . . . . . . . . 7,306
Current and deferred income tax liability . . . . . . . . . . . . . . . . . . . . . . . . . . . . . . . . . . . . . . . . . 336
Other liabilities . . . . . . . . . . . . . . . . . . . . . . . . . . . . . . . . . . . . . . . . . . . . . . . . . . . . . . . . . . 2,918
Separate account liabilities . . . . . . . . . . . . . . . . . . . . . . . . . . . . . . . . . . . . . . . . . . . . . . . . . . 244
Total liabilities . . . . . . . . . . . . . . . . . . . . . . . . . . . . . . . . . . . . . . . . . . . . . . . . . . . . . . . . . $109,267
Redeemable noncontrolling interests in partially owned consolidated subsidiariesassumed . . . . . . . . . . . . . . . . . . . . . . . . . . . . . . . . . . . . . . . . . . . . . . . . . . . . . . . . . . . $ 109
Noncontrolling interests . . . . . . . . . . . . . . . . . . . . . . . . . . . . . . . . . . . . . . . . . . . . . . . . . . . . (21)
Goodwill . . . . . . . . . . . . . . . . . . . . . . . . . . . . . . . . . . . . . . . . . . . . . . . . . . . . . . . . . . . . . . 6,959
Net assets acquired . . . . . . . . . . . . . . . . . . . . . . . . . . . . . . . . . . . . . . . . . . . . . . . . . . . . . . $ 16,292
GoodwillGoodwill is calculated as the excess of the consideration transferred over the net assets recognized and represents the future economic
benefits arising from other assets acquired and liabilities assumed that could not be individually identified. The goodwill recorded as part ofthe Acquisition includes the expected synergies and other benefits that management believes will result from combining the operations ofALICO with the operations of MetLife, including further diversification in geographic mix and product offerings and an increase in distributionstrength.
Of the $7.0 billion of goodwill, approximately $4.0 billion is estimated to be deductible for tax purposes. Of the $4.0 billion, approximately$573 million is estimated to be deductible for U.S. tax purposes prior to the completion of the anticipated restructuring of American Life’sforeign branches. See “—Branch Restructuring”. The goodwill resulting from the Acquisition was presented within the Company’s Inter-national segment.
Identified IntangiblesVOBA reflects the estimated fair value of in-force contracts acquired and represents the portion of the purchase price that is allocated to
the value of future profits embedded in acquired insurance annuity and investment-type contracts in-force at the Acquisition Date.The value of VODA and VOCRA, included in other assets, reflects the estimated fair value of ALICO’s distribution agreements and
customer relationships acquired at November 1, 2010 and will be amortized over the useful lives. Each year the Company will review VODAand VOCRA to determine the recoverability of these balances.
The use of discount rates was necessary to establish the fair value of VOBA and the identifiable intangibles. In selecting the appropriatediscount rates, management considered its weighted average cost of capital, as well as the weighted average cost of capital required bymarket participants. The fair value of acquired liabilities was determined using risk free rates adjusted for a nonperformance risk premium. Thenonperformance adjustment was determined by taking into consideration publicly available information relating to spreads in the secondarymarket for the Holding Company’s debt, including related credit default swaps. These observable spreads were then adjusted to reflect thepriority of these liabilities, the claims paying ability of the insurance subsidiaries compared to the Holding Company and, as necessary, therelative credit spreads of the liabilities’ currencies of denomination as compared to USD spreads.
F-30 MetLife, Inc.
MetLife, Inc.
Notes to the Consolidated Financial Statements — (Continued)

The fair values of business acquired, distribution agreements and customer relationships and the weighted average amortization periodsare as follows as of November 1, 2010:
November 1, 2010Weighted Average
Amortization Period
(In millions) (In years)
VOBA . . . . . . . . . . . . . . . . . . . . . . . . . . . . . . . . . . . . . . . . . . . . . . . . . . $9,210 8.2
VODA and VOCRA . . . . . . . . . . . . . . . . . . . . . . . . . . . . . . . . . . . . . . . . . . 341 10.3
Total value of amortizable intangible assets acquired . . . . . . . . . . . . . . . . . . . . $9,551 8.6
The estimated future amortization expense allocated to other expenses for the next five years for VOBA, VODA and VOCRA is$1,312 million in 2011, $1,076 million in 2012, $884 million in 2013, $759 million in 2014 and $653 million in 2015.
For certain acquired blocks of business, the estimated fair value of acquired liabilities exceeded the initial policy reserves assumed atNovember 1, 2010, resulting in a negative VOBA of $4.4 billion recorded at the Acquisition Date. Negative VOBA is recorded in other policy-related balances. The fair value of the in-force contract obligations was based on actuarially determined projections for each block ofbusiness. Negative VOBA is amortized over the policy period in proportion to premiums or the approximate consumption of losses included inthe liability usually expressed in terms of insurance in-force or account value. Such amortization is recorded as a contra-expense in otherexpenses.
Trademark AssetsIn connection with the Acquisition, the Company recognized $47 million in trademark assets recorded in other assets. The fair value of the
trademark assets will be recognized ratably over their expected useful lives which is generally between five to ten years.
Indemnification Assets and Contingent ConsiderationThe stock purchase agreement dated as of March 7, 2010, as amended by and among MetLife, Inc., AIG and ALICO Holdings (the “Stock
Purchase Agreement”) and related agreements include indemnification provisions that allocate the risk of losses arising out of contingenciesor other uncertainties that existed as of the Acquisition Date in accordance with the terms, and subject to the limitations and procedures,provided by such provisions. As applicable, the Company recognizes an indemnification asset at the same time that it recognizes theindemnified item, measured on the same basis as the indemnified item. The Company recognized the following indemnification assets andcontingencies as of the Acquisition Date in accordance with the indemnification provisions of the Stock Purchase Agreement and relatedagreements:
Investments — The Company established indemnification assets for the fair value of amounts expected to be recovered fromdefaults of certain fixed maturity securities, CMBS and mortgage loans. These indemnification assets are included in other investedassets at December 31, 2010.
Litigation — The Company established indemnification assets associated with certain settlements expected to be made inconnection with the suspension of withdrawals from certain unit-linked funds offered to certain policyholders. These indemnificationassets are included in other assets at December 31, 2010.
Section 338 Elections — MetLife, Inc. and American Life will be fully indemnified by ALICO Holdings for all taxes and any interestand penalties resulting from anticipated elections to be made with respect to American Life and its subsidiaries under Sec-tion 338(h)(10) and Section 338(g) of the Code. This indemnification asset is included in premiums, reinsurance and other receivablesat December 31, 2010.
The Company recognized an aggregate amount of $574 million for indemnification assets as of the Acquisition Date in accordance withthe indemnification provisions of the Stock Purchase Agreement and related agreements.
Contingent Consideration — American Life has guaranteed that the fair value of a fund of assets backing certain U.K. unit-linked contractswill have a value of at least £1 per unit on July 1, 2012. In accordance with the provisions of the Stock Purchase Agreement if the shortfallbetween the aggregate guaranteed amount and the fair value of the fund exceeds £106 million AIG will pay the difference to American Life andconversely, if the shortfall at July 1, 2012 is less than £106 million ALICO will pay the difference to AIG. The Company believes that the fairvalue of the fund will equal or exceed the guaranteed amount by July 1, 2012. Therefore, the Company recognized a contingent considerationliability in the amount of $88 million as of the Acquisition Date which was included as additional purchase consideration in determining theamount paid for ALICO.
Indemnification CollateralALICO Holdings may satisfy certain of its indemnification and other payment obligations by delivering cash, shares of stock or Equity Units
issued by MetLife, Inc. in connection with the Acquisition. The Equity Units were deposited into an indemnification collateral account on theAcquisition Date as security for these obligations. This collateral will be released periodically over a 30-month period on each of the12-month, 24-month and 30-month anniversaries of the Acquisition Date as follows: Equity Units with an aggregate stated amount of$1.0 billion (or such amount of net cash proceeds from the sale of Equity Units or other eligible collateral equal to such stated amount), less,on each such release date, specified reserve amounts, including, but not limited to, amounts necessary to satisfy then outstandingindemnification claims made by MetLife, Inc. However, if an AIG bankruptcy event occurs, any then remaining indemnification collateral willremain in the indemnification collateral account and will be released in part on each of the 30-month, 36-month and 48-month anniversaries ofthe Acquisition Date, less, on each such release date, any such specified reserved amounts.
Branch RestructuringOn March 4, 2010, American Life entered into a closing agreement (the “Closing Agreement”) with the Commissioner of the IRS with
respect to a U.S. withholding tax issue arising as a result of payments made by its foreign branches. The Closing Agreement provides thatAmerican Life’s foreign branches will not be required to withhold U.S. income tax on the income portion of payments made pursuant to
F-31MetLife, Inc.
MetLife, Inc.
Notes to the Consolidated Financial Statements — (Continued)

American Life’s life insurance and annuity contracts (“Covered Payments”) for any tax periods beginning on January 1, 2005 and ending onDecember 31, 2013 (the “Deferral Period”). The Closing Agreement requires that American Life submit a plan to the IRS within 90 days afterthe close of the Acquisition, indicating the steps American Life will take (on a country by country basis) to ensure that no substantial amount ofU.S. withholding tax will arise from Covered Payments made by American Life’s foreign branches to foreign customers after the DeferralPeriod. Such plan, which was submitted to the Internal Revenue Service (“IRS”) on January 29, 2011, involves the transfer of businesses fromcertain of the foreign branches of American Life to one or more existing or newly-formed subsidiaries of MetLife, Inc. or American Life.
A liability of $277 million was recognized in purchase accounting as of November 1, 2010, for the anticipated and estimated costsassociated with restructuring American Life’s foreign branches into subsidiaries in connection with the Closing Agreement.
Current and Deferred Income TaxThe future tax effects of temporary differences between financial reporting and tax bases of assets and liabilities are measured at the
balance sheet dates and are recorded as deferred income tax assets and liabilities, with certain exceptions such as certain temporarydifferences relating to goodwill under purchase accounting.
For federal income tax purposes, MetLife, Inc. and ALICO Holdings are expected to make Section 338 elections with respect to AmericanLife and certain of its subsidiaries. In addition, MetLife, Inc. and AIG are expected to make a Section 338 election with respect to DelAm.Under such elections, the U.S. tax basis of the assets deemed acquired and liabilities assumed of ALICO were adjusted as of the AcquisitionDate to reflect the consequences of the Section 338 elections.
The reversal of temporary differences (between financial reporting and U.S. tax bases of assets and liabilities) of American Life’s foreignbranches, post-branch restructuring, in connection with the Closing Agreement (i.e., generally, after the end of the Deferral Period) is notexpected to result in any direct U.S. tax effect. Thus, as of November 1, 2010, American Life reduced its net deferred tax asset of $425 millionby $671 million that reflects the amount of U.S. deferred tax asset that is expected to reverse post-branch restructuring. Therefore, AmericanLife recognized a U.S. net deferred tax liability of approximately $246 million in purchase accounting.
As of the Acquisition Date, ALICO’s current and deferred income tax liabilities are provisional and not yet finalized. Current income taxesmay be adjusted pending the resolution of the tax value of MetLife, Inc. securities delivered to ALICO Holdings as part of the purchaseconsideration on the Acquisition Date, the amount of taxes resulting from the Section 338 elections and the filing of income tax returns.Deferred income taxes may be adjusted as a result of changes in estimates and assumptions relating to the reversal of U.S. temporarydifferences prior to the completion of the anticipated restructuring of American Life’s foreign branches, the filing of income tax returns and asadditional information becomes available during the measurement period. We expect to finalize these amounts as soon as possible but nolater than one year from the Acquisition Date.
Revenues and Earnings of ALICOThe following table presents information for ALICO that is included in the Company’s consolidated statement of operations from the
Acquisition Date through November 30, 2010:
ALICO’s OperationsIncluded in MetLife’s
Results for theYear Ended December 31, 2010
(In millions)
Total revenues . . . . . . . . . . . . . . . . . . . . . . . . . . . . . . . . . . . . . . . . . . . . . . . . . . $950
Income (loss) from continuing operations, net of income tax . . . . . . . . . . . . . . . . . . . . . $ (2)
Supplemental Pro Forma Information (unaudited)The following table presents unaudited supplemental pro forma information as if the Acquisition had occurred on January 1, 2010 for the
year ended December 31, 2010 and on January 1, 2009 for the year ended December 31, 2009.
2010 2009
Years Ended December 31,
(In millions, exceptper share data)
Total revenues . . . . . . . . . . . . . . . . . . . . . . . . . . . . . . . . . . . . . . . . . . . . . . . . . . . . . $64,680 $54,282
Income (loss) from continuing operations, net of income tax, attributable to commonshareholders . . . . . . . . . . . . . . . . . . . . . . . . . . . . . . . . . . . . . . . . . . . . . . . . . . . . $ 3,888 $ (1,353)
Income (loss) from continuing operations, net of income tax, attributable to commonshareholders per common share:
Basic . . . . . . . . . . . . . . . . . . . . . . . . . . . . . . . . . . . . . . . . . . . . . . . . . . . . . . . . . $ 3.60 $ (1.29)
Diluted . . . . . . . . . . . . . . . . . . . . . . . . . . . . . . . . . . . . . . . . . . . . . . . . . . . . . . . . $ 3.57 $ (1.29)The pro forma information was derived from the historical financial information of MetLife and ALICO, reflecting the results of operations of
MetLife and ALICO for 2010 and 2009. The historical financial information has been adjusted to give effect to the pro forma events that aredirectly attributable to the Acquisition and factually supportable and expected to have a continuing impact on the combined results.Discontinued operations and the related earnings per share have been excluded from the presentation as they are non-recurring in nature.The pro forma information is not intended to reflect the results of operations of the combined company that would have resulted had theAcquisition been effective during the periods presented or the results that may be obtained by the combined company in the future. The proforma information does not reflect future events that may occur after the Acquisition, including, but not limited to, expense efficiencies orrevenue enhancements arising from the Acquisition and also does not give effect to certain one-time charges that MetLife expects to incursuch as restructuring and integration costs.
F-32 MetLife, Inc.
MetLife, Inc.
Notes to the Consolidated Financial Statements — (Continued)
The pro forma information primarily reflects the following pro forma adjustments:• reduction in net investment income to reflect the amortization or accretion associated with the new cost basis of the acquired fixed
maturities available-for-sale portfolio;• elimination of amortization associated with the elimination of ALICO’s historical DAC;• amortization of VOBA, VODA and VOCRA associated with the establishment of VOBA, VODA and VOCRA arising from the Acquisition;• reduction in other expenses associated with the amortization of negative VOBA;• reduction in revenues associated with the elimination of ALICO’s historical unearned revenue liability;• interest expense associated with the issuance of the Debt Securities to ALICO Holdings and the public issuance of senior notes in
connection with the financing of the Acquisition;• certain adjustments to conform to MetLife’s accounting policies; and• reversal of investment and derivative gains (losses) associated with certain transactions that were completed prior to the Acquisition
Date (conditions of closing).
Costs Related to AcquisitionTransaction and Integration-Related Expenses. The Company incurred $100 million of transaction costs for the year ended Decem-
ber 31, 2010. Transaction costs represent costs directly related to effecting the Acquisition and primarily include banking and legal expenses.Such costs have been expensed as incurred and are included in other expenses. These expenses have been reported within Banking,Corporate & Other.
Integration-related expenses incurred for the year ended December 31, 2010 and included in other expenses were $176 million.Integration costs represent incremental costs directly related to integrating ALICO, including expenses for consulting, rebranding and theintegration of information systems. As the integration of ALICO is an enterprise-wide initiative, these expenses have been reported withinBanking, Corporate & Other.
Restructuring Costs and Other Charges. As part of the integration of ALICO’s operations, management has initiated restructuring plansfocused on increasing productivity and improving the efficiency of the Company’s operations. For the year ended December 31, 2010, theCompany recognized a severance-related restructuring charge of $4 million associated with the termination of certain employees inconnection with this initiative which were reflected within other expenses. The Company did not make any cash payments related to theseseverance costs as of December 31, 2010.
Estimated restructuring costs may change as management continues to execute its restructuring plans. Management anticipates furtherrestructuring charges including severance, contract termination costs and other associated costs through the year ended December 31,2011. However, such restructuring plans are not sufficiently developed to enable the Company to make an estimate of such restructuringcharges at December 31, 2010.
2010 Pending DispositionIn October 2010, the Company and its joint venture partner, MS&AD Insurance Group Holdings, Inc. (“MS&AD”), reached an agreement
under which the Company intends to sell its 50% interest in Mitsui Sumitomo MetLife Insurance Co., Ltd. (“MSI MetLife”), a Japan domiciledlife insurance company, to MS&AD for approximately $275 million (¥22.5 billion). During the year ended December 31, 2010, the Companyrecorded an investment loss of $136 million, net of income tax, to record its investment in MSI MetLife at its estimated recoverable amount. Itis anticipated that the sale will close on or about April 1, 2011, subject to customary closing conditions, including obtaining requiredregulatory approvals.
2009 DispositionIn March 2009, the Company sold Cova Corporation (“Cova”), the parent company of Texas Life Insurance Company (“Texas Life”) to a
third-party for $130 million in cash consideration, excluding $1 million of transaction costs. The net assets sold were $101 million, resulting ina gain on disposal of $28 million, net of income tax. The Company also reclassified $4 million, net of income tax, of the 2009 operations ofTexas Life into discontinued operations in the consolidated financial statements. As a result, the Company recognized income fromdiscontinued operations of $32 million, net of income tax, during the year ended December 31, 2009. See Note 23.
2009 Disposition through Assumption ReinsuranceOn October 30, 2009, the Company completed the disposal, through assumption reinsurance, of substantially all of the insurance
business of MetLife Canada, a wholly-owned indirect subsidiary, to a third-party. Pursuant to the assumption reinsurance agreement, theconsideration paid by the Company was $259 million, comprised of cash of $14 million and fixed maturity securities, mortgage loans andother assets totaling $245 million. At the date of the assumption reinsurance agreement, the carrying value of insurance liabilities transferredwas $267 million, resulting in a gain of $5 million, net of income tax. The gain was recognized in net investment gains (losses).
2008 Acquisitions and DispositionDuring 2008, the Company made five acquisitions for $783 million. As a result of these acquisitions, MetLife’s Insurance Products
segment increased its product offering of dental and vision benefit plans, MetLife Bank, National Association (“MetLife Bank”) within Banking,Corporate & Other entered the mortgage origination and servicing business and the International segment increased its presence in Mexicoand Brazil. The acquisitions were each accounted for using the purchase method of accounting and, accordingly, commenced beingincluded in the operating results of the Company upon their respective closing dates. Total consideration paid by the Company for theseacquisitions consisted of $763 million in cash and $20 million in transaction costs. The net fair value of assets acquired and liabilities assumedtotaled $527 million, resulting in goodwill of $256 million. Goodwill increased by $122 million, $73 million and $61 million in the Internationalsegment, Insurance Products segment and Banking, Corporate & Other, respectively. The goodwill is deductible for tax purposes. VOCRA,VOBA and other intangibles increased by $137 million, $7 million and $6 million, respectively, as a result of these acquisitions. Furtherinformation on VOBA, goodwill and VOCRA is provided in Notes 6, 7 and 8, respectively.
F-33MetLife, Inc.
MetLife, Inc.
Notes to the Consolidated Financial Statements — (Continued)

In September 2008, the Company completed a tax-free split-off of its majority-owned subsidiary, Reinsurance Group of America,Incorporated (“RGA”). The Company and RGA entered into a recapitalization and distribution agreement, pursuant to which the Companyagreed to divest substantially all of its 52% interest in RGA to the Company’s stockholders. The split-off was effected through the following:
• A recapitalization of RGA common stock into two classes of common stock — RGA Class A common stock and RGA Class B commonstock. Pursuant to the terms of the recapitalization, each outstanding share of RGA common stock, including the 32,243,539 shares ofRGA common stock beneficially owned by the Company and its subsidiaries, was reclassified as one share of RGA Class A commonstock. Immediately thereafter, the Company and its subsidiaries exchanged 29,243,539 shares of its RGA Class A common stock —which represented all of the RGA Class A common stock beneficially owned by the Company and its subsidiaries other than3,000,000 shares of RGA Class A common stock — with RGA for 29,243,539 shares of RGA Class B common stock.
• An exchange offer, pursuant to which the Company offered to acquire MetLife common stock from its stockholders in exchange for all ofits 29,243,539 shares of RGA Class B common stock. The exchange ratio was determined based upon a ratio of the value of the MetLifeand RGA shares during the three-day period prior to the closing of the exchange offer. The 3,000,000 shares of the RGA Class Acommon stock were not subject to the tax-free exchange.
As a result of completion of the recapitalization and exchange offer, the Company received from MetLife stockholders 23,093,689 sharesof the Holding Company’s common stock with a market value of $1,318 million and, in exchange, delivered 29,243,539 shares of RGA’sClass B common stock with a net book value of $1,716 million. The resulting loss on disposition, inclusive of transaction costs of $60 million,was $458 million. During the third quarter of 2009, the Company incurred $2 million, net of income tax, of additional costs related to this split-off. The 3,000,000 shares of RGA Class A common stock retained by the Company are marketable equity securities which do not constitutesignificant continuing involvement in the operations of RGA; accordingly, they were classified within equity securities in the consolidatedfinancial statements of the Company at a cost basis of $157 million which is equivalent to the net book value of the shares. The equitysecurities have been recorded at fair value at each subsequent reporting date. The Company agreed to dispose of the remaining shares ofRGA within the next five years. In connection with the Company’s agreement to dispose of the remaining shares, the Company alsorecognized, in its provision for income tax on continuing operations, a deferred tax liability of $16 million which represents the differencebetween the book and taxable basis of the remaining investment in RGA. On February 15, 2011, the Company sold to RGA such remainingshares. The impact of the disposition of the Company’s investment in RGA was reflected in the Company’s consolidated financial statementsas discontinued operations. See Note 23.
3. Investments
Fixed Maturity and Equity Securities Available-for-SaleThe following tables present the cost or amortized cost, gross unrealized gain and loss, estimated fair value of the Company’s fixed
maturity and equity securities and the percentage that each sector represents by the respective total holdings for the periods shown. Theunrealized loss amounts presented below include the noncredit loss component of OTTI loss:
Cost orAmortized
Cost GainTemporary
LossOTTILoss
EstimatedFair
Value% ofTotal
Gross Unrealized
December 31, 2010
(In millions)
Fixed Maturity Securities:
U.S. corporate securities . . . . . . . . . . . . . . . . . . . $ 89,713 $ 4,486 $1,631 $ — $ 92,568 28.3%
Foreign corporate securities . . . . . . . . . . . . . . . . . 65,784 3,333 939 — 68,178 20.8
RMBS . . . . . . . . . . . . . . . . . . . . . . . . . . . . . . . . 44,468 1,652 917 470 44,733 13.7
Foreign government securities . . . . . . . . . . . . . . . . 42,154 1,856 610 — 43,400 13.2
U.S. Treasury, agency and government guaranteedsecurities(1) . . . . . . . . . . . . . . . . . . . . . . . . . . 32,469 1,394 559 — 33,304 10.2
CMBS . . . . . . . . . . . . . . . . . . . . . . . . . . . . . . . 20,213 740 266 12 20,675 6.3
ABS . . . . . . . . . . . . . . . . . . . . . . . . . . . . . . . . . 14,725 274 590 119 14,290 4.4
State and political subdivision securities . . . . . . . . . . 10,476 171 518 — 10,129 3.1
Other fixed maturity securities . . . . . . . . . . . . . . . . 6 1 — — 7 —
Total fixed maturity securities(2), (3) . . . . . . . . . . . $320,008 $13,907 $6,030 $601 $327,284 100.0%
Equity Securities:
Common stock . . . . . . . . . . . . . . . . . . . . . . . . . . $ 2,060 $ 146 $ 12 $ — $ 2,194 60.8%
Non-redeemable preferred stock(2) . . . . . . . . . . . . . 1,565 76 229 — 1,412 39.2
Total equity securities (4) . . . . . . . . . . . . . . . . . . $ 3,625 $ 222 $ 241 $ — $ 3,606 100.0%
F-34 MetLife, Inc.
MetLife, Inc.
Notes to the Consolidated Financial Statements — (Continued)
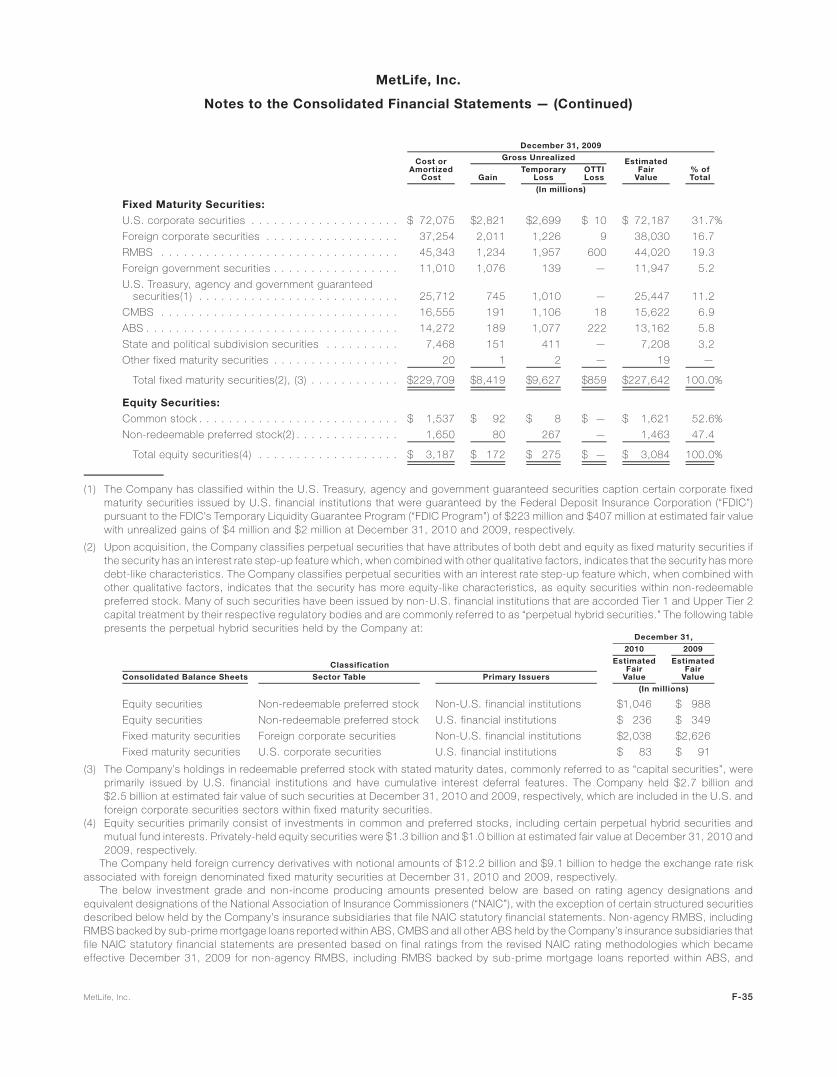
Cost orAmortized
Cost GainTemporary
LossOTTILoss
EstimatedFair
Value% ofTotal
Gross Unrealized
December 31, 2009
(In millions)
Fixed Maturity Securities:
U.S. corporate securities . . . . . . . . . . . . . . . . . . . . $ 72,075 $2,821 $2,699 $ 10 $ 72,187 31.7%
Foreign corporate securities . . . . . . . . . . . . . . . . . . 37,254 2,011 1,226 9 38,030 16.7
RMBS . . . . . . . . . . . . . . . . . . . . . . . . . . . . . . . . 45,343 1,234 1,957 600 44,020 19.3
Foreign government securities . . . . . . . . . . . . . . . . . 11,010 1,076 139 — 11,947 5.2
U.S. Treasury, agency and government guaranteedsecurities(1) . . . . . . . . . . . . . . . . . . . . . . . . . . . 25,712 745 1,010 — 25,447 11.2
CMBS . . . . . . . . . . . . . . . . . . . . . . . . . . . . . . . . 16,555 191 1,106 18 15,622 6.9
ABS . . . . . . . . . . . . . . . . . . . . . . . . . . . . . . . . . . 14,272 189 1,077 222 13,162 5.8
State and political subdivision securities . . . . . . . . . . 7,468 151 411 — 7,208 3.2
Other fixed maturity securities . . . . . . . . . . . . . . . . . 20 1 2 — 19 —
Total fixed maturity securities(2), (3) . . . . . . . . . . . . $229,709 $8,419 $9,627 $859 $227,642 100.0%
Equity Securities:
Common stock . . . . . . . . . . . . . . . . . . . . . . . . . . . $ 1,537 $ 92 $ 8 $ — $ 1,621 52.6%
Non-redeemable preferred stock(2) . . . . . . . . . . . . . . 1,650 80 267 — 1,463 47.4
Total equity securities(4) . . . . . . . . . . . . . . . . . . . $ 3,187 $ 172 $ 275 $ — $ 3,084 100.0%
(1) The Company has classified within the U.S. Treasury, agency and government guaranteed securities caption certain corporate fixedmaturity securities issued by U.S. financial institutions that were guaranteed by the Federal Deposit Insurance Corporation (“FDIC”)pursuant to the FDIC’s Temporary Liquidity Guarantee Program (“FDIC Program”) of $223 million and $407 million at estimated fair valuewith unrealized gains of $4 million and $2 million at December 31, 2010 and 2009, respectively.
(2) Upon acquisition, the Company classifies perpetual securities that have attributes of both debt and equity as fixed maturity securities ifthe security has an interest rate step-up feature which, when combined with other qualitative factors, indicates that the security has moredebt-like characteristics. The Company classifies perpetual securities with an interest rate step-up feature which, when combined withother qualitative factors, indicates that the security has more equity-like characteristics, as equity securities within non-redeemablepreferred stock. Many of such securities have been issued by non-U.S. financial institutions that are accorded Tier 1 and Upper Tier 2capital treatment by their respective regulatory bodies and are commonly referred to as “perpetual hybrid securities.” The following tablepresents the perpetual hybrid securities held by the Company at:
Consolidated Balance Sheets Sector Table Primary Issuers
EstimatedFair
Value
EstimatedFair
Value
Classification
2010 2009
December 31,
(In millions)
Equity securities Non-redeemable preferred stock Non-U.S. financial institutions $1,046 $ 988
Equity securities Non-redeemable preferred stock U.S. financial institutions $ 236 $ 349
Fixed maturity securities Foreign corporate securities Non-U.S. financial institutions $2,038 $2,626
Fixed maturity securities U.S. corporate securities U.S. financial institutions $ 83 $ 91
(3) The Company’s holdings in redeemable preferred stock with stated maturity dates, commonly referred to as “capital securities”, wereprimarily issued by U.S. financial institutions and have cumulative interest deferral features. The Company held $2.7 billion and$2.5 billion at estimated fair value of such securities at December 31, 2010 and 2009, respectively, which are included in the U.S. andforeign corporate securities sectors within fixed maturity securities.
(4) Equity securities primarily consist of investments in common and preferred stocks, including certain perpetual hybrid securities andmutual fund interests. Privately-held equity securities were $1.3 billion and $1.0 billion at estimated fair value at December 31, 2010 and2009, respectively.
The Company held foreign currency derivatives with notional amounts of $12.2 billion and $9.1 billion to hedge the exchange rate riskassociated with foreign denominated fixed maturity securities at December 31, 2010 and 2009, respectively.
The below investment grade and non-income producing amounts presented below are based on rating agency designations andequivalent designations of the National Association of Insurance Commissioners (“NAIC”), with the exception of certain structured securitiesdescribed below held by the Company’s insurance subsidiaries that file NAIC statutory financial statements. Non-agency RMBS, includingRMBS backed by sub-prime mortgage loans reported within ABS, CMBS and all other ABS held by the Company’s insurance subsidiaries thatfile NAIC statutory financial statements are presented based on final ratings from the revised NAIC rating methodologies which becameeffective December 31, 2009 for non-agency RMBS, including RMBS backed by sub-prime mortgage loans reported within ABS, and
F-35MetLife, Inc.
MetLife, Inc.
Notes to the Consolidated Financial Statements — (Continued)

December 31, 2010 for CMBS and the remaining ABS (which may not correspond to rating agency designations). All NAIC designation (e.g.,NAIC 1 — 6) amounts and percentages presented herein are based on the revised NAIC methodologies. All rating agency designation (e.g.,Aaa/AAA) amounts and percentages presented herein are based on rating agency designations without adjustment for the revised NAICmethodologies described above. Rating agency designations are based on availability of applicable ratings from rating agencies on the NAICacceptable rating organization list, including Moody’s Investors Service (“Moody’s”), S&P and Fitch Ratings (“Fitch”).
The following table presents selected information about certain fixed maturity securities held by the Company at:
2010 2009
December 31,
(In millions)
Below investment grade or non-rated fixed maturity securities:
Estimated fair value . . . . . . . . . . . . . . . . . . . . . . . . . . . . . . . . . . . . . . . . . . . . . . . . . $24,886 $20,201
Net unrealized gain (loss) . . . . . . . . . . . . . . . . . . . . . . . . . . . . . . . . . . . . . . . . . . . . . . $ (696) $ (2,609)
Non-income producing fixed maturity securities:
Estimated fair value . . . . . . . . . . . . . . . . . . . . . . . . . . . . . . . . . . . . . . . . . . . . . . . . . $ 130 $ 312
Net unrealized gain (loss) . . . . . . . . . . . . . . . . . . . . . . . . . . . . . . . . . . . . . . . . . . . . . . $ (23) $ (31)Concentrations of Credit Risk (Fixed Maturity Securities) — Summary. The following section contains a summary of the concentrations
of credit risk related to fixed maturity securities holdings.The Company was not exposed to any concentrations of credit risk of any single issuer greater than 10% of the Company’s equity, other
than the government securities summarized in the table below. The estimated fair value of the Company’s holdings in sovereign fixed maturitysecurities of Portugal, Ireland, Italy, Greece and Spain, commonly referred to as “Europe’s perimeter region,” was $1,562 million and$6 million prior to, and was $1,392 million and $6 million, after considering net purchased credit default swap protection at December 31,2010 and 2009, respectively. Collectively, the net exposure in these Europe perimeter region sovereign fixed maturity securities was 2.8% ofthe Company’s equity and 0.3% of total cash and invested assets at December 31, 2010.
2010 2009
December 31,
Estimated Fair Value
(In millions)
Government and agency fixed maturity securities:
United States(1) . . . . . . . . . . . . . . . . . . . . . . . . . . . . . . . . . . . . . . . . . . . . . . . . . . . . $33,304 $25,447
Japan . . . . . . . . . . . . . . . . . . . . . . . . . . . . . . . . . . . . . . . . . . . . . . . . . . . . . . . . . . $15,591 $ —
Mexico . . . . . . . . . . . . . . . . . . . . . . . . . . . . . . . . . . . . . . . . . . . . . . . . . . . . . . . . . . $ 5,050 $ 4,813
(1) Includes certain corporate fixed maturity securities guaranteed by the FDIC Program, as described above.Concentrations of Credit Risk (Fixed Maturity Securities) — U.S. and Foreign Corporate Securities. The Company maintains a diversified
portfolio of corporate fixed maturity securities across industries and issuers. This portfolio does not have an exposure to any single issuer inexcess of 1% of total investments. The tables below present for all corporate fixed maturity securities holdings, corporate securities by sector,U.S. corporate securities by major industry types, the largest exposure to a single issuer and the combined holdings in the ten issuers towhich it had the largest exposure at:
EstimatedFair
Value% ofTotal
EstimatedFair
Value% ofTotal
2010 2009
December 31,
(In millions)
Corporate fixed maturity securities — by sector:Foreign corporate fixed maturity securities(1) . . . . . . . . . . . . . . . . . . . . $ 68,178 42.4% $ 38,030 34.5%
U.S. corporate fixed maturity securities — by industry:Industrial . . . . . . . . . . . . . . . . . . . . . . . . . . . . . . . . . . . . . . . . . . . . 22,314 13.9 17,246 15.6Consumer . . . . . . . . . . . . . . . . . . . . . . . . . . . . . . . . . . . . . . . . . . . 21,737 13.5 16,924 15.4Finance . . . . . . . . . . . . . . . . . . . . . . . . . . . . . . . . . . . . . . . . . . . . 20,917 13.0 13,756 12.5Utility . . . . . . . . . . . . . . . . . . . . . . . . . . . . . . . . . . . . . . . . . . . . . . 17,027 10.6 14,785 13.4Communications . . . . . . . . . . . . . . . . . . . . . . . . . . . . . . . . . . . . . . 7,375 4.6 6,580 6.0Other . . . . . . . . . . . . . . . . . . . . . . . . . . . . . . . . . . . . . . . . . . . . . . 3,198 2.0 2,896 2.6
Total . . . . . . . . . . . . . . . . . . . . . . . . . . . . . . . . . . . . . . . . . . . . . $160,746 100.0% $110,217 100.0%
(1) Includes U.S. dollar-denominated debt obligations of foreign obligors and other foreign fixed maturity securities.
F-36 MetLife, Inc.
MetLife, Inc.
Notes to the Consolidated Financial Statements — (Continued)

EstimatedFair
Value% of Total
Investments
EstimatedFair
Value% of Total
Investments
2010 2009
December 31,
(In millions)
Concentrations within corporate fixed maturity securities:
Largest exposure to a single issuer . . . . . . . . . . . . . . . . . . . . . $ 2,291 0.5% $1,038 0.3%
Holdings in ten issuers with the largest exposures . . . . . . . . . . . . $14,247 3.1% $7,506 2.3%Concentrations of Credit Risk (Fixed Maturity Securities) — RMBS. The table below presents the Company’s RMBS holdings and
portion rated Aaa/AAA and portion rated NAIC 1 at:
EstimatedFair
Value% ofTotal
EstimatedFair
Value% ofTotal
2010 2009
December 31,
(In millions)
By security type:
Pass-through securities . . . . . . . . . . . . . . . . . . . . . . . . . . . . . . . . . . . . . . . . . . . . . $22,430 50.1% $19,540 44.4%
Collateralized mortgage obligations . . . . . . . . . . . . . . . . . . . . . . . . . . . . . . . . . . . . . . 22,303 49.9 24,480 55.6
Total RMBS . . . . . . . . . . . . . . . . . . . . . . . . . . . . . . . . . . . . . . . . . . . . . . . . . . . . $44,733 100.0% $44,020 100.0%
By risk profile:
Agency . . . . . . . . . . . . . . . . . . . . . . . . . . . . . . . . . . . . . . . . . . . . . . . . . . . . . . . . $34,254 76.6% $33,334 75.7%
Prime . . . . . . . . . . . . . . . . . . . . . . . . . . . . . . . . . . . . . . . . . . . . . . . . . . . . . . . . . 6,258 14.0 6,775 15.4
Alternative residential mortgage loans . . . . . . . . . . . . . . . . . . . . . . . . . . . . . . . . . . . . 4,221 9.4 3,911 8.9
Total RMBS . . . . . . . . . . . . . . . . . . . . . . . . . . . . . . . . . . . . . . . . . . . . . . . . . . . . $44,733 100.0% $44,020 100.0%
Portion rated Aaa/AAA . . . . . . . . . . . . . . . . . . . . . . . . . . . . . . . . . . . . . . . . . . . . . . . . $36,085 80.7% $35,626 80.9%
Portion rated NAIC 1 . . . . . . . . . . . . . . . . . . . . . . . . . . . . . . . . . . . . . . . . . . . . . . . . . $38,984 87.1% $38,464 87.4%
Pass-through mortgage-backed securities are a type of asset-backed security that is secured by a mortgage or collection of mortgages.The monthly mortgage payments from homeowners pass from the originating bank through an intermediary, such as a government agency orinvestment bank, which collects the payments, and for a fee, remits or passes these payments through to the holders of the pass-throughsecurities. Collateralized mortgage obligations are a type of mortgage-backed security structured by dividing the cash flows of mortgagesinto separate pools or tranches of risk that create multiple classes of bonds with varying maturities and priority of payments.
Prime residential mortgage lending includes the origination of residential mortgage loans to the most creditworthy borrowers with highquality credit profiles. Alternative residential mortgage loans (“Alt-A”) are a classification of mortgage loans where the risk profile of theborrower falls between prime and sub-prime. Sub-prime mortgage lending is the origination of residential mortgage loans to borrowers withweak credit profiles. Included within Alt-A RMBS are resecuritization of real estate mortgage investment conduit (“Re-REMIC”) securities. Re-REMIC Alt-A RMBS involve the pooling of previous issues of Alt-A RMBS and restructuring the combined pools to create new senior andsubordinated securities. The credit enhancement on the senior tranches is improved through the resecuritization. The Company’s holdingsare in senior tranches with significant credit enhancement.
The following tables present the Company’s investment in Alt-A RMBS by vintage year (vintage year refers to the year of origination and notto the year of purchase) and certain other selected data:
EstimatedFair
Value% ofTotal
EstimatedFair
Value% ofTotal
2010 2009
December 31,
(In millions)
Vintage Year:
2004 & Prior . . . . . . . . . . . . . . . . . . . . . . . . . . . . . . . . . . . . . . . . . . . . $ 93 2.2% $ 109 2.8%
2005 . . . . . . . . . . . . . . . . . . . . . . . . . . . . . . . . . . . . . . . . . . . . . . . . . 1,483 35.1 1,395 35.7
2006 . . . . . . . . . . . . . . . . . . . . . . . . . . . . . . . . . . . . . . . . . . . . . . . . . 1,013 24.0 811 20.7
2007 . . . . . . . . . . . . . . . . . . . . . . . . . . . . . . . . . . . . . . . . . . . . . . . . . 922 21.8 814 20.8
2008 . . . . . . . . . . . . . . . . . . . . . . . . . . . . . . . . . . . . . . . . . . . . . . . . . 7 0.2 — —
2009(1) . . . . . . . . . . . . . . . . . . . . . . . . . . . . . . . . . . . . . . . . . . . . . . . 671 15.9 782 20.0
2010(1) . . . . . . . . . . . . . . . . . . . . . . . . . . . . . . . . . . . . . . . . . . . . . . . 32 0.8 — —
Total . . . . . . . . . . . . . . . . . . . . . . . . . . . . . . . . . . . . . . . . . . . . . . . . . $4,221 100.0% $3,911 100.0%
F-37MetLife, Inc.
MetLife, Inc.
Notes to the Consolidated Financial Statements — (Continued)
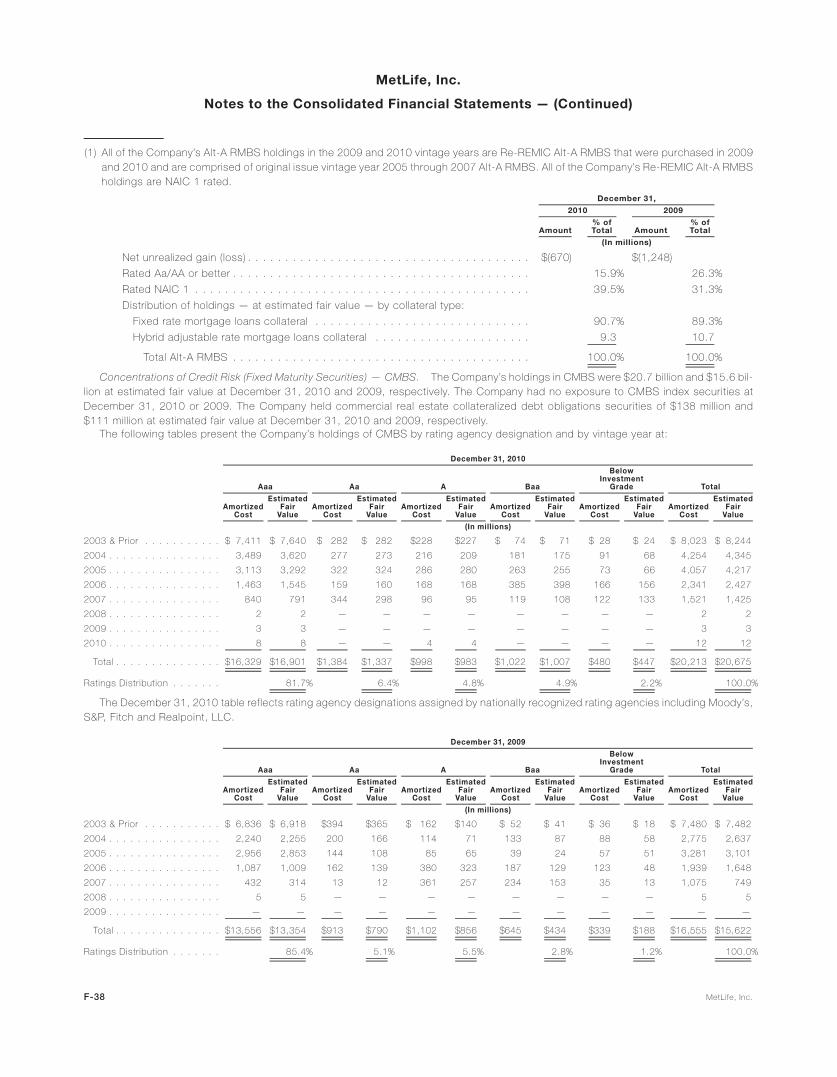
(1) All of the Company’s Alt-A RMBS holdings in the 2009 and 2010 vintage years are Re-REMIC Alt-A RMBS that were purchased in 2009and 2010 and are comprised of original issue vintage year 2005 through 2007 Alt-A RMBS. All of the Company’s Re-REMIC Alt-A RMBSholdings are NAIC 1 rated.
Amount% ofTotal Amount
% ofTotal
2010 2009
December 31,
(In millions)
Net unrealized gain (loss) . . . . . . . . . . . . . . . . . . . . . . . . . . . . . . . . . . . . . . $(670) $(1,248)
Rated Aa/AA or better . . . . . . . . . . . . . . . . . . . . . . . . . . . . . . . . . . . . . . . . 15.9% 26.3%
Rated NAIC 1 . . . . . . . . . . . . . . . . . . . . . . . . . . . . . . . . . . . . . . . . . . . . . 39.5% 31.3%
Distribution of holdings — at estimated fair value — by collateral type:
Fixed rate mortgage loans collateral . . . . . . . . . . . . . . . . . . . . . . . . . . . . . 90.7% 89.3%
Hybrid adjustable rate mortgage loans collateral . . . . . . . . . . . . . . . . . . . . . 9.3 10.7
Total Alt-A RMBS . . . . . . . . . . . . . . . . . . . . . . . . . . . . . . . . . . . . . . . . 100.0% 100.0%
Concentrations of Credit Risk (Fixed Maturity Securities) — CMBS. The Company’s holdings in CMBS were $20.7 billion and $15.6 bil-lion at estimated fair value at December 31, 2010 and 2009, respectively. The Company had no exposure to CMBS index securities atDecember 31, 2010 or 2009. The Company held commercial real estate collateralized debt obligations securities of $138 million and$111 million at estimated fair value at December 31, 2010 and 2009, respectively.
The following tables present the Company’s holdings of CMBS by rating agency designation and by vintage year at:
AmortizedCost
EstimatedFair
ValueAmortized
Cost
EstimatedFair
ValueAmortized
Cost
EstimatedFair
ValueAmortized
Cost
EstimatedFair
ValueAmortized
Cost
EstimatedFair
ValueAmortized
Cost
EstimatedFair
Value
Aaa Aa A Baa
BelowInvestment
Grade Total
December 31, 2010
(In millions)
2003 & Prior . . . . . . . . . . . $ 7,411 $ 7,640 $ 282 $ 282 $228 $227 $ 74 $ 71 $ 28 $ 24 $ 8,023 $ 8,244
2004 . . . . . . . . . . . . . . . . 3,489 3,620 277 273 216 209 181 175 91 68 4,254 4,345
2005 . . . . . . . . . . . . . . . . 3,113 3,292 322 324 286 280 263 255 73 66 4,057 4,217
2006 . . . . . . . . . . . . . . . . 1,463 1,545 159 160 168 168 385 398 166 156 2,341 2,427
2007 . . . . . . . . . . . . . . . . 840 791 344 298 96 95 119 108 122 133 1,521 1,425
2008 . . . . . . . . . . . . . . . . 2 2 — — — — — — — — 2 2
2009 . . . . . . . . . . . . . . . . 3 3 — — — — — — — — 3 3
2010 . . . . . . . . . . . . . . . . 8 8 — — 4 4 — — — — 12 12
Total . . . . . . . . . . . . . . . $16,329 $16,901 $1,384 $1,337 $998 $983 $1,022 $1,007 $480 $447 $20,213 $20,675
Ratings Distribution . . . . . . . 81.7% 6.4% 4.8% 4.9% 2.2% 100.0%
The December 31, 2010 table reflects rating agency designations assigned by nationally recognized rating agencies including Moody’s,S&P, Fitch and Realpoint, LLC.
AmortizedCost
EstimatedFair
ValueAmortized
Cost
EstimatedFair
ValueAmortized
Cost
EstimatedFair
ValueAmortized
Cost
EstimatedFair
ValueAmortized
Cost
EstimatedFair
ValueAmortized
Cost
EstimatedFair
Value
Aaa Aa A Baa
BelowInvestment
Grade Total
December 31, 2009
(In millions)
2003 & Prior . . . . . . . . . . . $ 6,836 $ 6,918 $394 $365 $ 162 $140 $ 52 $ 41 $ 36 $ 18 $ 7,480 $ 7,482
2004 . . . . . . . . . . . . . . . . 2,240 2,255 200 166 114 71 133 87 88 58 2,775 2,637
2005 . . . . . . . . . . . . . . . . 2,956 2,853 144 108 85 65 39 24 57 51 3,281 3,101
2006 . . . . . . . . . . . . . . . . 1,087 1,009 162 139 380 323 187 129 123 48 1,939 1,648
2007 . . . . . . . . . . . . . . . . 432 314 13 12 361 257 234 153 35 13 1,075 749
2008 . . . . . . . . . . . . . . . . 5 5 — — — — — — — — 5 5
2009 . . . . . . . . . . . . . . . . — — — — — — — — — — — —
Total . . . . . . . . . . . . . . . $13,556 $13,354 $913 $790 $1,102 $856 $645 $434 $339 $188 $16,555 $15,622
Ratings Distribution . . . . . . . 85.4% 5.1% 5.5% 2.8% 1.2% 100.0%
F-38 MetLife, Inc.
MetLife, Inc.
Notes to the Consolidated Financial Statements — (Continued)
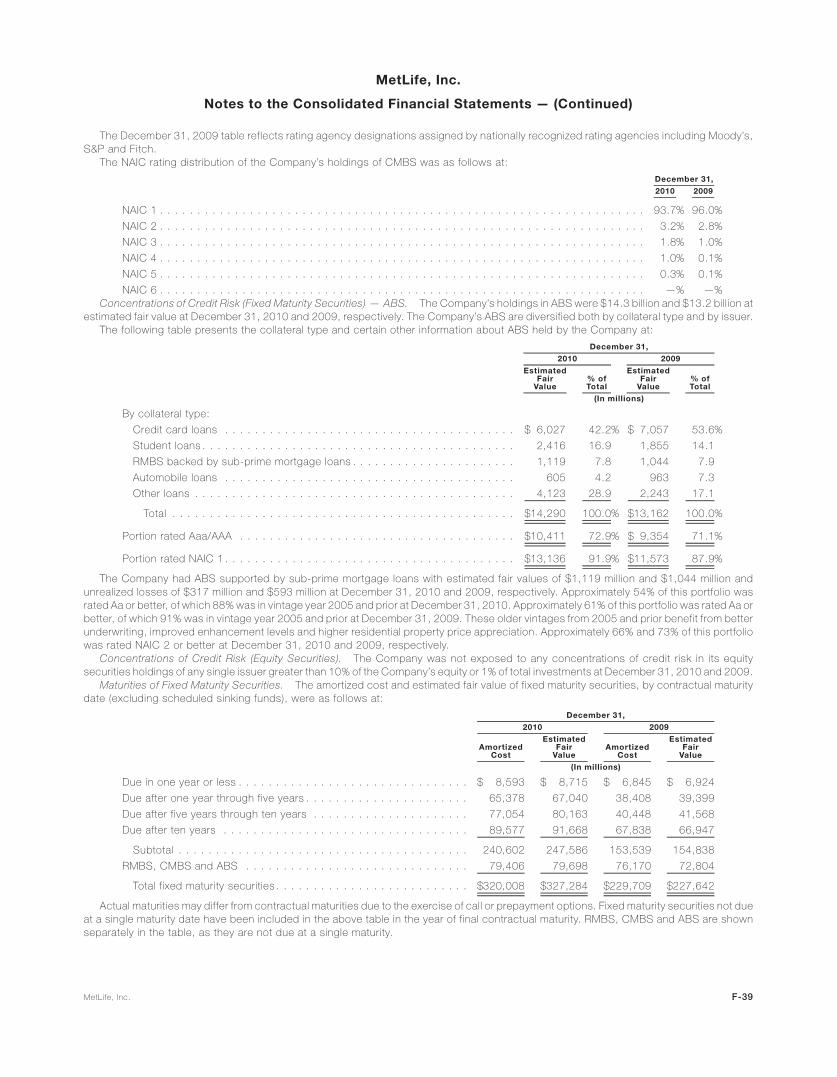
The December 31, 2009 table reflects rating agency designations assigned by nationally recognized rating agencies including Moody’s,S&P and Fitch.
The NAIC rating distribution of the Company’s holdings of CMBS was as follows at:
2010 2009
December 31,
NAIC 1 . . . . . . . . . . . . . . . . . . . . . . . . . . . . . . . . . . . . . . . . . . . . . . . . . . . . . . . . . . . . . . . . . 93.7% 96.0%
NAIC 2 . . . . . . . . . . . . . . . . . . . . . . . . . . . . . . . . . . . . . . . . . . . . . . . . . . . . . . . . . . . . . . . . . 3.2% 2.8%
NAIC 3 . . . . . . . . . . . . . . . . . . . . . . . . . . . . . . . . . . . . . . . . . . . . . . . . . . . . . . . . . . . . . . . . . 1.8% 1.0%
NAIC 4 . . . . . . . . . . . . . . . . . . . . . . . . . . . . . . . . . . . . . . . . . . . . . . . . . . . . . . . . . . . . . . . . . 1.0% 0.1%
NAIC 5 . . . . . . . . . . . . . . . . . . . . . . . . . . . . . . . . . . . . . . . . . . . . . . . . . . . . . . . . . . . . . . . . . 0.3% 0.1%
NAIC 6 . . . . . . . . . . . . . . . . . . . . . . . . . . . . . . . . . . . . . . . . . . . . . . . . . . . . . . . . . . . . . . . . . —% —%Concentrations of Credit Risk (Fixed Maturity Securities) — ABS. The Company’s holdings in ABS were $14.3 billion and $13.2 billion at
estimated fair value at December 31, 2010 and 2009, respectively. The Company’s ABS are diversified both by collateral type and by issuer.The following table presents the collateral type and certain other information about ABS held by the Company at:
EstimatedFair
Value% ofTotal
EstimatedFair
Value% ofTotal
2010 2009
December 31,
(In millions)
By collateral type:
Credit card loans . . . . . . . . . . . . . . . . . . . . . . . . . . . . . . . . . . . . . . . $ 6,027 42.2% $ 7,057 53.6%
Student loans . . . . . . . . . . . . . . . . . . . . . . . . . . . . . . . . . . . . . . . . . . 2,416 16.9 1,855 14.1
RMBS backed by sub-prime mortgage loans . . . . . . . . . . . . . . . . . . . . . . 1,119 7.8 1,044 7.9
Automobile loans . . . . . . . . . . . . . . . . . . . . . . . . . . . . . . . . . . . . . . . 605 4.2 963 7.3
Other loans . . . . . . . . . . . . . . . . . . . . . . . . . . . . . . . . . . . . . . . . . . . 4,123 28.9 2,243 17.1
Total . . . . . . . . . . . . . . . . . . . . . . . . . . . . . . . . . . . . . . . . . . . . . . $14,290 100.0% $13,162 100.0%
Portion rated Aaa/AAA . . . . . . . . . . . . . . . . . . . . . . . . . . . . . . . . . . . . . $10,411 72.9% $ 9,354 71.1%
Portion rated NAIC 1 . . . . . . . . . . . . . . . . . . . . . . . . . . . . . . . . . . . . . . . $13,136 91.9% $11,573 87.9%
The Company had ABS supported by sub-prime mortgage loans with estimated fair values of $1,119 million and $1,044 million andunrealized losses of $317 million and $593 million at December 31, 2010 and 2009, respectively. Approximately 54% of this portfolio wasrated Aa or better, of which 88% was in vintage year 2005 and prior at December 31, 2010. Approximately 61% of this portfolio was rated Aa orbetter, of which 91% was in vintage year 2005 and prior at December 31, 2009. These older vintages from 2005 and prior benefit from betterunderwriting, improved enhancement levels and higher residential property price appreciation. Approximately 66% and 73% of this portfoliowas rated NAIC 2 or better at December 31, 2010 and 2009, respectively.
Concentrations of Credit Risk (Equity Securities). The Company was not exposed to any concentrations of credit risk in its equitysecurities holdings of any single issuer greater than 10% of the Company’s equity or 1% of total investments at December 31, 2010 and 2009.
Maturities of Fixed Maturity Securities. The amortized cost and estimated fair value of fixed maturity securities, by contractual maturitydate (excluding scheduled sinking funds), were as follows at:
AmortizedCost
EstimatedFair
ValueAmortized
Cost
EstimatedFair
Value
2010 2009
December 31,
(In millions)
Due in one year or less . . . . . . . . . . . . . . . . . . . . . . . . . . . . . . . $ 8,593 $ 8,715 $ 6,845 $ 6,924
Due after one year through five years . . . . . . . . . . . . . . . . . . . . . . 65,378 67,040 38,408 39,399
Due after five years through ten years . . . . . . . . . . . . . . . . . . . . . 77,054 80,163 40,448 41,568
Due after ten years . . . . . . . . . . . . . . . . . . . . . . . . . . . . . . . . . 89,577 91,668 67,838 66,947
Subtotal . . . . . . . . . . . . . . . . . . . . . . . . . . . . . . . . . . . . . . . 240,602 247,586 153,539 154,838
RMBS, CMBS and ABS . . . . . . . . . . . . . . . . . . . . . . . . . . . . . . 79,406 79,698 76,170 72,804
Total fixed maturity securities . . . . . . . . . . . . . . . . . . . . . . . . . . $320,008 $327,284 $229,709 $227,642
Actual maturities may differ from contractual maturities due to the exercise of call or prepayment options. Fixed maturity securities not dueat a single maturity date have been included in the above table in the year of final contractual maturity. RMBS, CMBS and ABS are shownseparately in the table, as they are not due at a single maturity.
F-39MetLife, Inc.
MetLife, Inc.
Notes to the Consolidated Financial Statements — (Continued)

As discussed further in Note 2, an indemnification asset has been established in connection with certain investments acquired fromAmerican Life.
Evaluating Available-for-Sale Securities for Other-Than-Temporary ImpairmentAs described more fully in Note 1, the Company performs a regular evaluation, on a security-by-security basis, of its available-for-sale
securities holdings, including fixed maturity securities, equity securities and perpetual hybrid securities, in accordance with its impairmentpolicy in order to evaluate whether such investments are other-than-temporarily impaired. As described more fully in Note 1, effective April 1,2009, the Company adopted OTTI guidance that amends the methodology for determining for fixed maturity securities whether an OTTIexists, and for certain fixed maturity securities, changes how the amount of the OTTI loss that is charged to earnings is determined. There wasno change in the OTTI methodology for equity securities.
Net Unrealized Investment Gains (Losses)The components of net unrealized investment gains (losses), included in accumulated other comprehensive income (loss), were as
follows:
2010 2009 2008
Years Ended December 31,
(In millions)
Fixed maturity securities . . . . . . . . . . . . . . . . . . . . . . . . . . . . . . . . . . . . . . . . . $ 7,817 $(1,208) $(21,246)
Fixed maturity securities with noncredit OTTI losses in accumulated othercomprehensive income (loss) . . . . . . . . . . . . . . . . . . . . . . . . . . . . . . . . . . . . . (601) (859) —
Total fixed maturity securities . . . . . . . . . . . . . . . . . . . . . . . . . . . . . . . . . . . . . 7,216 (2,067) (21,246)
Equity securities . . . . . . . . . . . . . . . . . . . . . . . . . . . . . . . . . . . . . . . . . . . . . . . (3) (103) (934)
Derivatives . . . . . . . . . . . . . . . . . . . . . . . . . . . . . . . . . . . . . . . . . . . . . . . . . . (59) (144) (2)
Other . . . . . . . . . . . . . . . . . . . . . . . . . . . . . . . . . . . . . . . . . . . . . . . . . . . . . . 42 71 53
Subtotal . . . . . . . . . . . . . . . . . . . . . . . . . . . . . . . . . . . . . . . . . . . . . . . . . 7,196 (2,243) (22,129)
Amounts allocated from:
Insurance liability loss recognition . . . . . . . . . . . . . . . . . . . . . . . . . . . . . . . . . . (672) (118) 42
DAC and VOBA related to noncredit OTTI losses recognized in accumulated othercomprehensive income (loss) . . . . . . . . . . . . . . . . . . . . . . . . . . . . . . . . . . . 38 71 —
DAC and VOBA . . . . . . . . . . . . . . . . . . . . . . . . . . . . . . . . . . . . . . . . . . . . . . (1,205) 145 3,025
Policyholder dividend obligation . . . . . . . . . . . . . . . . . . . . . . . . . . . . . . . . . . . (876) — —
Subtotal . . . . . . . . . . . . . . . . . . . . . . . . . . . . . . . . . . . . . . . . . . . . . . . . . (2,715) 98 3,067
Deferred income tax benefit (expense) related to noncredit OTTI losses recognized inaccumulated other comprehensive income (loss) . . . . . . . . . . . . . . . . . . . . . . . . 197 275 —
Deferred income tax benefit (expense) . . . . . . . . . . . . . . . . . . . . . . . . . . . . . . . . (1,692) 539 6,508
Net unrealized investment gains (losses) . . . . . . . . . . . . . . . . . . . . . . . . . . . . . . . 2,986 (1,331) (12,554)
Net unrealized investment gains (losses) attributable to noncontrolling interests . . . . . . 4 1 (10)
Net unrealized investment gains (losses) attributable to MetLife, Inc. . . . . . . . . . . . . . $ 2,990 $(1,330) $(12,564)
Fixed maturity securities with noncredit OTTI losses in accumulated other comprehensive income (loss), as presented above of($601) million at December 31, 2010, includes ($859) million recognized prior to January 1, 2010, ($212) million (($202) million, net ofDAC) of noncredit OTTI losses recognized in the year ended December 31, 2010, $16 million transferred to retained earnings in connectionwith the adoption of guidance related to the consolidation of VIEs (see Note 1) for the year ended December 31, 2010, $137 million related tosecurities sold during the year ended December 31, 2010 for which a noncredit OTTI loss was previously recognized in accumulated othercomprehensive income (loss) and $317 million of subsequent increases in estimated fair value during the year ended December 31, 2010 onsuch securities for which a noncredit OTTI loss was previously recognized in accumulated other comprehensive income (loss).
Fixed maturity securities with noncredit OTTI losses in accumulated other comprehensive income (loss), as presented above of($859) million at December 31, 2009, includes ($126) million related to the transition adjustment recorded in 2009 upon the adoption ofguidance on the recognition and presentation of OTTI, ($939) million (($857) million, net of DAC) of noncredit OTTI losses recognized in theyear ended December 31, 2009 (as more fully described in Note 1), $20 million related to securities sold during the year ended December 31,2009 for which a noncredit OTTI loss was previously recognized in accumulated comprehensive income (loss) and $186 million ofsubsequent increases in estimated fair value during the year ended December 31, 2009 on such securities for which a noncredit OTTIloss was previously recognized in accumulated other comprehensive income (loss).
F-40 MetLife, Inc.
MetLife, Inc.
Notes to the Consolidated Financial Statements — (Continued)

The changes in net unrealized investment gains (losses) were as follows:
2010 2009 2008
Years Ended December 31,
(In millions)
Balance, beginning of period . . . . . . . . . . . . . . . . . . . . . . . . . . . . . . . . . . . . . . $(1,330) $(12,564) $ 971
Cumulative effect of change in accounting principles, net of income tax . . . . . . . . . . 52 (76) (10)
Fixed maturity securities on which noncredit OTTI losses have been recognized . . . . . 242 (733) —
Unrealized investment gains (losses) during the year . . . . . . . . . . . . . . . . . . . . . . 9,117 20,745 (25,536)
Unrealized investment losses of subsidiaries at the date of disposal . . . . . . . . . . . . — — 149
Unrealized investment gains (losses) relating to:
Insurance liability gain (loss) recognition . . . . . . . . . . . . . . . . . . . . . . . . . . . . . (554) (160) 650
DAC and VOBA related to noncredit OTTI losses recognized in accumulated othercomprehensive income (loss) . . . . . . . . . . . . . . . . . . . . . . . . . . . . . . . . . . (33) 61 —
DAC and VOBA . . . . . . . . . . . . . . . . . . . . . . . . . . . . . . . . . . . . . . . . . . . . . (1,350) (2,880) 3,370
DAC and VOBA of subsidiary at date of disposal . . . . . . . . . . . . . . . . . . . . . . . — — (18)
Policyholder dividend obligation . . . . . . . . . . . . . . . . . . . . . . . . . . . . . . . . . . (876) — 789
Deferred income tax benefit (expense) related to noncredit OTTI losses recognizedin accumulated other comprehensive income (loss) . . . . . . . . . . . . . . . . . . . . (73) 235 —
Deferred income tax benefit (expense) . . . . . . . . . . . . . . . . . . . . . . . . . . . . . . (2,208) (5,969) 6,991
Deferred income tax benefit (expense) of subsidiaries at date of disposal . . . . . . . . — — (60)
Net unrealized investment gains (losses) . . . . . . . . . . . . . . . . . . . . . . . . . . . . . . 2,987 (1,341) (12,704)
Net unrealized investment gains (losses) attributable to noncontrolling interests . . . . . 3 11 (10)
Net unrealized investment gains (losses) attributable to noncontrolling interests ofsubsidiary at date of disposal . . . . . . . . . . . . . . . . . . . . . . . . . . . . . . . . . . . . — — 150
Balance, end of period . . . . . . . . . . . . . . . . . . . . . . . . . . . . . . . . . . . . . . . . . $ 2,990 $ (1,330) $(12,564)
Change in net unrealized investment gains (losses) . . . . . . . . . . . . . . . . . . . . . . . $ 4,317 $ 11,223 $(13,665)
Change in net unrealized investment gains (losses) attributable to noncontrollinginterests . . . . . . . . . . . . . . . . . . . . . . . . . . . . . . . . . . . . . . . . . . . . . . . . . 3 11 (10)
Change in net unrealized investment gains (losses) attributable to noncontrollinginterests of subsidiary at date of disposal . . . . . . . . . . . . . . . . . . . . . . . . . . . . — — 150
Change in net unrealized investment gains (losses) attributable to MetLife, Inc. . . . . . $ 4,320 $ 11,234 $(13,525)
F-41MetLife, Inc.
MetLife, Inc.
Notes to the Consolidated Financial Statements — (Continued)

Continuous Gross Unrealized Loss and OTTI Loss for Fixed Maturity and Equity Securities Available-for-Sale by SectorThe following tables present the estimated fair value and gross unrealized loss of the Company’s fixed maturity and equity securities in an
unrealized loss position, aggregated by sector and by length of time that the securities have been in a continuous unrealized loss position.The unrealized loss amounts presented below include the noncredit component of OTTI loss. Fixed maturity securities on which a noncreditOTTI loss has been recognized in accumulated other comprehensive income (loss) are categorized by length of time as being “less than12 months” or “equal to or greater than 12 months” in a continuous unrealized loss position based on the point in time that the estimated fairvalue initially declined to below the amortized cost basis and not the period of time since the unrealized loss was deemed a noncredit OTTIloss.
EstimatedFair
Value
GrossUnrealized
Loss
EstimatedFair
Value
GrossUnrealized
Loss
EstimatedFair
Value
GrossUnrealized
Loss
Less than 12 MonthsEqual to or Greater
than 12 Months Total
December 31, 2010
(In millions, except number of securities)
Fixed Maturity Securities:U.S. corporate securities . . . . . . . . . . . . . . . . . . . . . . . . $ 23,309 $ 464 $ 8,386 $1,167 $ 31,695 $1,631Foreign corporate securities . . . . . . . . . . . . . . . . . . . . . . 22,530 417 4,007 522 26,537 939RMBS . . . . . . . . . . . . . . . . . . . . . . . . . . . . . . . . . . . . . 7,588 212 6,700 1,175 14,288 1,387Foreign government securities . . . . . . . . . . . . . . . . . . . . . 26,828 593 189 17 27,017 610U.S. Treasury, agency and government guaranteed
securities . . . . . . . . . . . . . . . . . . . . . . . . . . . . . . . . . 13,401 530 118 29 13,519 559CMBS . . . . . . . . . . . . . . . . . . . . . . . . . . . . . . . . . . . . 3,787 29 1,363 249 5,150 278ABS . . . . . . . . . . . . . . . . . . . . . . . . . . . . . . . . . . . . . . 2,713 42 3,029 667 5,742 709State and political subdivision securities . . . . . . . . . . . . . . 5,061 246 988 272 6,049 518Other fixed maturity securities . . . . . . . . . . . . . . . . . . . . . 1 — — — 1 —
Total fixed maturity securities . . . . . . . . . . . . . . . . . . . . $105,218 $2,533 $24,780 $4,098 $129,998 $6,631
Equity Securities:Common stock . . . . . . . . . . . . . . . . . . . . . . . . . . . . . . . $ 89 $ 12 $ 1 $ — $ 90 $ 12Non-redeemable preferred stock . . . . . . . . . . . . . . . . . . . 191 9 824 220 1,015 229
Total equity securities . . . . . . . . . . . . . . . . . . . . . . . . . $ 280 $ 21 $ 825 $ 220 $ 1,105 $ 241
Total number of securities in an unrealized loss position . . . . 5,793 1,738
EstimatedFair
Value
GrossUnrealized
Loss
EstimatedFair
Value
GrossUnrealized
Loss
EstimatedFair
Value
GrossUnrealized
Loss
Less than 12 MonthsEqual to or Greater
than 12 Months Total
December 31, 2009
(In millions, except number of securities)
Fixed Maturity Securities:U.S. corporate securities . . . . . . . . . . . . . . . . . . . . . . . . . $ 8,641 $ 395 $18,004 $2,314 $26,645 $ 2,709Foreign corporate securities . . . . . . . . . . . . . . . . . . . . . . . . 3,786 139 7,282 1,096 11,068 1,235RMBS . . . . . . . . . . . . . . . . . . . . . . . . . . . . . . . . . . . . . . 5,623 119 10,268 2,438 15,891 2,557Foreign government securities . . . . . . . . . . . . . . . . . . . . . . 2,318 55 507 84 2,825 139U.S. Treasury, agency and government guaranteed securities . . 15,051 990 51 20 15,102 1,010CMBS . . . . . . . . . . . . . . . . . . . . . . . . . . . . . . . . . . . . . . 2,052 29 5,435 1,095 7,487 1,124ABS . . . . . . . . . . . . . . . . . . . . . . . . . . . . . . . . . . . . . . . 1,259 143 5,875 1,156 7,134 1,299State and political subdivision securities . . . . . . . . . . . . . . . . 2,086 94 1,843 317 3,929 411Other fixed maturity securities . . . . . . . . . . . . . . . . . . . . . . 6 2 — — 6 2
Total fixed maturity securities . . . . . . . . . . . . . . . . . . . . . . $40,822 $1,966 $49,265 $8,520 $90,087 $10,486
Equity Securities:Common stock . . . . . . . . . . . . . . . . . . . . . . . . . . . . . . . . $ 56 $ 7 $ 14 $ 1 $ 70 $ 8Non-redeemable preferred stock . . . . . . . . . . . . . . . . . . . . 66 41 930 226 996 267
Total equity securities . . . . . . . . . . . . . . . . . . . . . . . . . . $ 122 $ 48 $ 944 $ 227 $ 1,066 $ 275
Total number of securities in an unrealized loss position . . . . . . 2,210 3,333
F-42 MetLife, Inc.
MetLife, Inc.
Notes to the Consolidated Financial Statements — (Continued)

Aging of Gross Unrealized Loss and OTTI Loss for Fixed Maturity and Equity Securities Available-for-SaleThe following tables present the cost or amortized cost, gross unrealized loss, including the portion of OTTI loss on fixed maturity
securities recognized in accumulated other comprehensive income (loss), gross unrealized loss as a percentage of cost or amortized costand number of securities for fixed maturity and equity securities where the estimated fair value had declined and remained below cost oramortized cost by less than 20%, or 20% or more at:
Less than20%
20% ormore
Less than20%
20% ormore
Less than20%
20% ormore
Cost or Amortized CostGross Unrealized
LossNumber ofSecurities
December 31, 2010
(In millions, except number of securities)
Fixed Maturity Securities:Less than six months . . . . . . . . . . . . . . . . . . . . . . . . . . . . . . . . . $105,968 $1,408 $2,379 $ 369 5,472 125Six months or greater but less than nine months . . . . . . . . . . . . . . . 1,125 376 29 102 104 29Nine months or greater but less than twelve months . . . . . . . . . . . . . 375 89 28 27 51 9Twelve months or greater . . . . . . . . . . . . . . . . . . . . . . . . . . . . . . 21,721 5,567 1,876 1,821 1,267 316
Total . . . . . . . . . . . . . . . . . . . . . . . . . . . . . . . . . . . . . . . . . . $129,189 $7,440 $4,312 $2,319
Percentage of amortized cost . . . . . . . . . . . . . . . . . . . . . . . . . . . 3% 31%
Equity Securities:Less than six months . . . . . . . . . . . . . . . . . . . . . . . . . . . . . . . . . $ 247 $ 94 $ 10 $ 22 131 33Six months or greater but less than nine months . . . . . . . . . . . . . . . 29 65 5 16 7 2Nine months or greater but less than twelve months . . . . . . . . . . . . . 6 47 — 16 4 2Twelve months or greater . . . . . . . . . . . . . . . . . . . . . . . . . . . . . . 518 340 56 116 40 15
Total . . . . . . . . . . . . . . . . . . . . . . . . . . . . . . . . . . . . . . . . . . $ 800 $ 546 $ 71 $ 170
Percentage of cost . . . . . . . . . . . . . . . . . . . . . . . . . . . . . . . . . . 9% 31%
Less than20%
20% ormore
Less than20%
20% ormore
Less than20%
20% ormore
Cost or Amortized CostGross Unrealized
LossNumber ofSecurities
December 31, 2009
(In millions, except number of securities)
Fixed Maturity Securities:Less than six months . . . . . . . . . . . . . . . . . . . . . . . . . . . . . . . . . $35,163 $ 2,658 $ 933 $ 713 1,725 186Six months or greater but less than nine months . . . . . . . . . . . . . . . 4,908 674 508 194 124 49Nine months or greater but less than twelve months . . . . . . . . . . . . . 1,723 1,659 167 517 106 79Twelve months or greater . . . . . . . . . . . . . . . . . . . . . . . . . . . . . . 41,721 12,067 3,207 4,247 2,369 724
Total . . . . . . . . . . . . . . . . . . . . . . . . . . . . . . . . . . . . . . . . . . $83,515 $17,058 $4,815 $5,671
Percentage of amortized cost . . . . . . . . . . . . . . . . . . . . . . . . . . . 6% 33%
Equity Securities:Less than six months . . . . . . . . . . . . . . . . . . . . . . . . . . . . . . . . . $ 66 $ 63 $ 7 $ 14 199 8Six months or greater but less than nine months . . . . . . . . . . . . . . . 6 1 1 1 15 2Nine months or greater but less than twelve months . . . . . . . . . . . . . 13 94 2 39 8 6Twelve months or greater . . . . . . . . . . . . . . . . . . . . . . . . . . . . . . 610 488 73 138 50 24
Total . . . . . . . . . . . . . . . . . . . . . . . . . . . . . . . . . . . . . . . . . . $ 695 $ 646 $ 83 $ 192
Percentage of cost . . . . . . . . . . . . . . . . . . . . . . . . . . . . . . . . . . 12% 30%
Equity securities with a gross unrealized loss of 20% or more for twelve months or greater decreased from $138 million at December 31,2009 to $116 million at December 31, 2010. As shown in the section “— Evaluating Temporarily Impaired Available-for-Sale Securities”below, the $116 million of equity securities with a gross unrealized loss of 20% or more for twelve months or greater at December 31, 2010were non-redeemable preferred stock, of which $115 million, or 99%, were financial services industry investment grade non-redeemablepreferred stock, of which 77% were rated A or better.
F-43MetLife, Inc.
MetLife, Inc.
Notes to the Consolidated Financial Statements — (Continued)

Concentration of Gross Unrealized Loss and OTTI Loss for Fixed Maturity and Equity Securities Available-for-SaleThe Company’s gross unrealized losses related to its fixed maturity and equity securities, including the portion of OTTI loss on fixed
maturity securities recognized in accumulated other comprehensive income (loss) of $6.9 billion and $10.8 billion at December 31, 2010 and2009, respectively, were concentrated, calculated as a percentage of gross unrealized loss and OTTI loss, by sector and industry as follows:
2010 2009
December 31,
Sector:
U.S. corporate securities . . . . . . . . . . . . . . . . . . . . . . . . . . . . . . . . . . . . . . . . . . . . . . . . . . . . 24% 25%
RMBS . . . . . . . . . . . . . . . . . . . . . . . . . . . . . . . . . . . . . . . . . . . . . . . . . . . . . . . . . . . . . . . . 20 24
Foreign corporate securities . . . . . . . . . . . . . . . . . . . . . . . . . . . . . . . . . . . . . . . . . . . . . . . . . . 14 11
ABS . . . . . . . . . . . . . . . . . . . . . . . . . . . . . . . . . . . . . . . . . . . . . . . . . . . . . . . . . . . . . . . . . 10 12
Foreign government securities . . . . . . . . . . . . . . . . . . . . . . . . . . . . . . . . . . . . . . . . . . . . . . . . 9 1
U.S. Treasury, agency and government guaranteed securities . . . . . . . . . . . . . . . . . . . . . . . . . . . . 8 9
State and political subdivision securities . . . . . . . . . . . . . . . . . . . . . . . . . . . . . . . . . . . . . . . . . . 8 4
CMBS . . . . . . . . . . . . . . . . . . . . . . . . . . . . . . . . . . . . . . . . . . . . . . . . . . . . . . . . . . . . . . . . 4 10
Other . . . . . . . . . . . . . . . . . . . . . . . . . . . . . . . . . . . . . . . . . . . . . . . . . . . . . . . . . . . . . . . . 3 4
Total . . . . . . . . . . . . . . . . . . . . . . . . . . . . . . . . . . . . . . . . . . . . . . . . . . . . . . . . . . . . . . . . 100% 100%
Industry:
Mortgage-backed . . . . . . . . . . . . . . . . . . . . . . . . . . . . . . . . . . . . . . . . . . . . . . . . . . . . . . . . 24% 34%
Finance . . . . . . . . . . . . . . . . . . . . . . . . . . . . . . . . . . . . . . . . . . . . . . . . . . . . . . . . . . . . . . . 21 22
Asset-backed . . . . . . . . . . . . . . . . . . . . . . . . . . . . . . . . . . . . . . . . . . . . . . . . . . . . . . . . . . . 10 12
Foreign government securities . . . . . . . . . . . . . . . . . . . . . . . . . . . . . . . . . . . . . . . . . . . . . . . . 9 1
U.S. Treasury, agency and government guaranteed securities . . . . . . . . . . . . . . . . . . . . . . . . . . . . 8 9
State and political subdivision securities . . . . . . . . . . . . . . . . . . . . . . . . . . . . . . . . . . . . . . . . . . 8 4
Utility . . . . . . . . . . . . . . . . . . . . . . . . . . . . . . . . . . . . . . . . . . . . . . . . . . . . . . . . . . . . . . . . 5 4
Consumer . . . . . . . . . . . . . . . . . . . . . . . . . . . . . . . . . . . . . . . . . . . . . . . . . . . . . . . . . . . . . 4 4
Communications . . . . . . . . . . . . . . . . . . . . . . . . . . . . . . . . . . . . . . . . . . . . . . . . . . . . . . . . . 2 2
Industrial . . . . . . . . . . . . . . . . . . . . . . . . . . . . . . . . . . . . . . . . . . . . . . . . . . . . . . . . . . . . . . 2 1
Other . . . . . . . . . . . . . . . . . . . . . . . . . . . . . . . . . . . . . . . . . . . . . . . . . . . . . . . . . . . . . . . . 7 7
Total . . . . . . . . . . . . . . . . . . . . . . . . . . . . . . . . . . . . . . . . . . . . . . . . . . . . . . . . . . . . . . . . 100% 100%
Evaluating Temporarily Impaired Available-for-Sale SecuritiesThe following table presents the Company’s fixed maturity and equity securities, each with a gross unrealized loss of greater than
$10 million, the number of securities, total gross unrealized loss and percentage of total gross unrealized loss at:
Fixed MaturitySecurities
EquitySecurities
Fixed MaturitySecurities
EquitySecurities
2010 2009
December 31,
(In millions, except number of securities)
Number of securities . . . . . . . . . . . . . . . . . . . . . . . . . . . . . . 107 6 223 9
Total gross unrealized loss . . . . . . . . . . . . . . . . . . . . . . . . . . $2,014 $103 $4,465 $132
Percentage of total gross unrealized loss . . . . . . . . . . . . . . . . . 30% 43% 43% 48%Fixed maturity and equity securities, each with a gross unrealized loss greater than $10 million, decreased $2.5 billion during the year
ended December 31, 2010. The cause of the decline in, or improvement in, gross unrealized losses for the year ended December 31, 2010,was primarily attributable to a decrease in interest rates and narrowing of credit spreads. These securities were included in the Company’sOTTI review process. Based upon the Company’s current evaluation of these securities and other available-for-sale securities in an unrealizedloss position in accordance with its impairment policy, and the Company’s current intentions and assessments (as applicable to the type ofsecurity) about holding, selling and any requirements to sell these securities, the Company has concluded that these securities are notother-than-temporarily impaired.
In the Company’s impairment review process, the duration and severity of an unrealized loss position for equity securities is given greaterweight and consideration than for fixed maturity securities. An extended and severe unrealized loss position on a fixed maturity security maynot have any impact on the ability of the issuer to service all scheduled interest and principal payments and the Company’s evaluation ofrecoverability of all contractual cash flows or the ability to recover an amount at least equal to its amortized cost based on the present value ofthe expected future cash flows to be collected. In contrast, for an equity security, greater weight and consideration is given by the Company toa decline in market value and the likelihood such market value decline will recover.
F-44 MetLife, Inc.
MetLife, Inc.
Notes to the Consolidated Financial Statements — (Continued)

The following table presents certain information about the Company’s equity securities available-for-sale with a gross unrealized loss of20% or more at December 31, 2010:
GrossUnrealized
Loss
GrossUnrealized
Loss
% of AllEquity
Securities
GrossUnrealized
Loss
% of AllNon-RedeemablePreferred Stock
GrossUnrealized
Loss% of All
Industries
% ARated or
Better
All EquitySecurities
All Types ofNon-RedeemablePreferred Stock All Industries Financial Services Industry
Investment Grade
Non-Redeemable Preferred Stock
(In millions)
Less than six months . . . . . . . . . . . . . $ 22 $ 18 82% $ 9 50% $ 9 100% 100%
Six months or greater but less thantwelve months . . . . . . . . . . . . . . . . 32 32 100% 32 100% 32 100% 50%
Twelve months or greater . . . . . . . . . . 116 116 100% 115 99% 115 100% 77%
All equity securities with a grossunrealized loss of 20% or more . . . . . $170 $166 98% $156 94% $156 100% 73%
In connection with the equity securities impairment review process, the Company evaluated its holdings in non-redeemable preferredstock, particularly those companies in the financial services industry. The Company considered several factors including whether there hasbeen any deterioration in credit of the issuer and the likelihood of recovery in value of non-redeemable preferred stock with a severe or anextended unrealized loss. The Company also considered whether any issuers of non-redeemable preferred stock with an unrealized loss heldby the Company, regardless of credit rating, have deferred any dividend payments. No such dividend payments had been deferred.
With respect to common stock holdings, the Company considered the duration and severity of the unrealized losses for securities in anunrealized loss position of 20% or more; and the duration of unrealized losses for securities in an unrealized loss position of less than 20% inan extended unrealized loss position (i.e., 12 months or greater).
Future OTTIs will depend primarily on economic fundamentals, issuer performance (including changes in the present value of future cashflows expected to be collected), changes in credit rating, changes in collateral valuation, changes in interest rates and changes in creditspreads. If economic fundamentals and any of the above factors deteriorate, additional OTTIs may be incurred in upcoming quarters.
Net Investment Gains (Losses)See “— Evaluating Available-for-Sale Securities for Other-Than-Temporary Impairment” for a discussion of changes in guidance adopted
April 1, 2009 that impacted how fixed maturity security OTTI losses that are charged to earnings are measured.The components of net investment gains (losses) were as follows:
2010 2009 2008
Years Ended December 31,
(In millions)
Total gains (losses) on fixed maturity securities:
Total OTTI losses recognized . . . . . . . . . . . . . . . . . . . . . . . . . . . . . . . . . . . . . . . . . $(682) $(2,439) $(1,296)
Less: Noncredit portion of OTTI losses transferred to and recognized in othercomprehensive income (loss) . . . . . . . . . . . . . . . . . . . . . . . . . . . . . . . . . . . . . . . 212 939 —
Net OTTI losses on fixed maturity securities recognized in earnings . . . . . . . . . . . . . . (470) (1,500) (1,296)
Fixed maturity securities — net gains (losses) on sales and disposals . . . . . . . . . . . . . 215 (163) (657)
Total gains (losses) on fixed maturity securities . . . . . . . . . . . . . . . . . . . . . . . . . . (255) (1,663) (1,953)
Other net investment gains (losses):
Equity securities . . . . . . . . . . . . . . . . . . . . . . . . . . . . . . . . . . . . . . . . . . . . . . . 104 (399) (253)
Mortgage loans . . . . . . . . . . . . . . . . . . . . . . . . . . . . . . . . . . . . . . . . . . . . . . . . 22 (442) (136)
Real estate and real estate joint ventures . . . . . . . . . . . . . . . . . . . . . . . . . . . . . . . (54) (164) (18)
Other limited partnership interests . . . . . . . . . . . . . . . . . . . . . . . . . . . . . . . . . . . . (18) (356) (140)
Other investment portfolio gains (losses) . . . . . . . . . . . . . . . . . . . . . . . . . . . . . . . . (6) (26) 134
Subtotal — investment portfolio gains (losses) . . . . . . . . . . . . . . . . . . . . . . . . . . . (207) (3,050) (2,366)
FVO consolidated securitization entities:
Commercial mortgage loans . . . . . . . . . . . . . . . . . . . . . . . . . . . . . . . . . . . . . . . . 758 — —
Securities . . . . . . . . . . . . . . . . . . . . . . . . . . . . . . . . . . . . . . . . . . . . . . . . . . . . (78) — —
Long-term debt — related to commercial mortgage loans . . . . . . . . . . . . . . . . . . . . . (722) — —
Long-term debt — related to securities . . . . . . . . . . . . . . . . . . . . . . . . . . . . . . . . . 48 — —
Other gains (losses)(1) . . . . . . . . . . . . . . . . . . . . . . . . . . . . . . . . . . . . . . . . . . . . . (191) 144 268
Subtotal FVO consolidated securitization entities and other gains (losses) . . . . . . . . . (185) 144 268
Total net investment gains (losses) . . . . . . . . . . . . . . . . . . . . . . . . . . . . . . . . . $(392) $(2,906) $(2,098)
F-45MetLife, Inc.
MetLife, Inc.
Notes to the Consolidated Financial Statements — (Continued)

(1) Other gains (losses) for the year ended December 31, 2010 includes a loss of $209 million related to recording the Company’s investmentin MSI MetLife at its estimated recoverable amount. See Note 2.See “— Variable Interest Entities” for discussion of CSEs included in the table above.Gains (losses) from foreign currency transactions included within net investment gains (losses) were $246 million, $226 million and
$363 million for the years ended December 31, 2010, 2009 and 2008, respectively.Proceeds from sales or disposals of fixed maturity and equity securities and the components of fixed maturity and equity securities net
investment gains (losses) were as shown below. Investment gains and losses on sales of securities are determined on a specific identificationbasis.
2010 2009 2008 2010 2009 2008 2010 2009 2008
Years Ended December 31, Years Ended December 31, Years Ended December 31,
Fixed Maturity Securities Equity Securities Total
(In millions)
Proceeds . . . . . . . . . . . . . . . . . . . . $54,559 $38,972 $62,495 $623 $ 950 $2,107 $55,182 $39,922 $64,602
Gross investment gains . . . . . . . . . . . 832 947 858 129 134 440 961 1,081 1,298
Gross investment losses . . . . . . . . . . (617) (1,110) (1,515) (11) (133) (263) (628) (1,243) (1,778)
Total OTTI losses recognized inearnings:
Credit-related . . . . . . . . . . . . . . . . (423) (1,137) (1,138) — — — (423) (1,137) (1,138)
Other(1) . . . . . . . . . . . . . . . . . . . . (47) (363) (158) (14) (400) (430) (61) (763) (588)
Total OTTI losses recognized inearnings . . . . . . . . . . . . . . . . . . (470) (1,500) (1,296) (14) (400) (430) (484) (1,900) (1,726)
Net investment gains (losses) . . . . . . . $ (255) $ (1,663) $ (1,953) $104 $(399) $ (253) $ (151) $ (2,062) $ (2,206)
(1) Other OTTI losses recognized in earnings include impairments on equity securities, impairments on perpetual hybrid securities classifiedwithin fixed maturity securities where the primary reason for the impairment was the severity and/or the duration of an unrealized lossposition and fixed maturity securities where there is an intent to sell or it is more likely than not that the Company will be required to sell thesecurity before recovery of the decline in estimated fair value.Fixed maturity security OTTI losses recognized in earnings related to the following sectors and industries within the U.S. and foreign
corporate securities sector:
2010 2009 2008
Years Ended December 31,
(In millions)
Sector:
U.S. and foreign corporate securities — by industry:
Finance . . . . . . . . . . . . . . . . . . . . . . . . . . . . . . . . . . . . . . . . . . . . . . . . . . . . . . $126 $ 459 $ 673
Consumer . . . . . . . . . . . . . . . . . . . . . . . . . . . . . . . . . . . . . . . . . . . . . . . . . . . . . 36 211 107
Communications . . . . . . . . . . . . . . . . . . . . . . . . . . . . . . . . . . . . . . . . . . . . . . . . 16 235 134
Utility . . . . . . . . . . . . . . . . . . . . . . . . . . . . . . . . . . . . . . . . . . . . . . . . . . . . . . . . 3 89 5
Industrial . . . . . . . . . . . . . . . . . . . . . . . . . . . . . . . . . . . . . . . . . . . . . . . . . . . . . 2 30 26
Other industries . . . . . . . . . . . . . . . . . . . . . . . . . . . . . . . . . . . . . . . . . . . . . . . . . — 26 185
Total U.S. and foreign corporate securities . . . . . . . . . . . . . . . . . . . . . . . . . . . . . . 183 1,050 1,130
ABS . . . . . . . . . . . . . . . . . . . . . . . . . . . . . . . . . . . . . . . . . . . . . . . . . . . . . . . . 103 168 99
RMBS . . . . . . . . . . . . . . . . . . . . . . . . . . . . . . . . . . . . . . . . . . . . . . . . . . . . . . . 98 193 —
CMBS . . . . . . . . . . . . . . . . . . . . . . . . . . . . . . . . . . . . . . . . . . . . . . . . . . . . . . . 86 88 65
Foreign government securities . . . . . . . . . . . . . . . . . . . . . . . . . . . . . . . . . . . . . . . . — 1 2
Total . . . . . . . . . . . . . . . . . . . . . . . . . . . . . . . . . . . . . . . . . . . . . . . . . . . . . . . $470 $1,500 $1,296
F-46 MetLife, Inc.
MetLife, Inc.
Notes to the Consolidated Financial Statements — (Continued)

Equity security OTTI losses recognized in earnings related to the following sectors and industries:
2010 2009 2008
Years Ended December 31,
(In millions)
Sector:
Non-redeemable preferred stock . . . . . . . . . . . . . . . . . . . . . . . . . . . . . . . . . . . . . $ 7 $ 333 $ 319
Common stock . . . . . . . . . . . . . . . . . . . . . . . . . . . . . . . . . . . . . . . . . . . . . . . . . 7 67 111
Total . . . . . . . . . . . . . . . . . . . . . . . . . . . . . . . . . . . . . . . . . . . . . . . . . . . . . . . $ 14 $ 400 $ 430
Industry:
Financial services industry:
Perpetual hybrid securities . . . . . . . . . . . . . . . . . . . . . . . . . . . . . . . . . . . . . . . . $ 3 $ 310 $ 90
Common and remaining non-redeemable preferred stock . . . . . . . . . . . . . . . . . . . . — 30 251
Total financial services industry . . . . . . . . . . . . . . . . . . . . . . . . . . . . . . . . . . . 3 340 341
Other industries . . . . . . . . . . . . . . . . . . . . . . . . . . . . . . . . . . . . . . . . . . . . . . . . . 11 60 89
Total . . . . . . . . . . . . . . . . . . . . . . . . . . . . . . . . . . . . . . . . . . . . . . . . . . . . . . . $ 14 $ 400 $ 430
Credit Loss Rollforward — Rollforward of the Cumulative Credit Loss Component of OTTI Loss Recognized in Earn-ings on Fixed Maturity Securities Still Held for Which a Portion of the OTTI Loss Was Recognized in Other Compre-hensive Income (Loss)The table below presents a rollforward of the cumulative credit loss component of OTTI loss recognized in earnings on fixed maturity
securities still held by the Company at December 31, 2010 and 2009, respectively, for which a portion of the OTTI loss was recognized inother comprehensive income (loss):
2010 2009
Years Ended December 31,
(In millions)
Balance, at January 1, . . . . . . . . . . . . . . . . . . . . . . . . . . . . . . . . . . . . . . . . . . . . . . . . $ 581 $ —
Credit loss component of OTTI loss not reclassified to other comprehensive income (loss) inthe cumulative effect transition adjustment . . . . . . . . . . . . . . . . . . . . . . . . . . . . . . . . . — 230
Additions:
Initial impairments — credit loss OTTI recognized on securities not previously impaired . . . . . 109 311
Additional impairments — credit loss OTTI recognized on securities previously impaired . . . . 125 91
Reductions:
Due to sales (maturities, pay downs or prepayments) during the period of securitiespreviously credit loss OTTI impaired . . . . . . . . . . . . . . . . . . . . . . . . . . . . . . . . . . . . (260) (49)
Due to securities de-recognized in connection with the adoption of new guidance related tothe consolidation of VIEs . . . . . . . . . . . . . . . . . . . . . . . . . . . . . . . . . . . . . . . . . . . . (100) —
Due to securities impaired to net present value of expected future cash flows . . . . . . . . . . . (2) —
Due to increases in cash flows — accretion of previous credit loss OTTI . . . . . . . . . . . . . . (10) (2)
Balance, at December 31, . . . . . . . . . . . . . . . . . . . . . . . . . . . . . . . . . . . . . . . . . . . . . $ 443 $581
F-47MetLife, Inc.
MetLife, Inc.
Notes to the Consolidated Financial Statements — (Continued)

Net Investment IncomeThe components of net investment income were as follows:
2010 2009 2008
Years Ended December 31,
(In millions)
Investment income:
Fixed maturity securities . . . . . . . . . . . . . . . . . . . . . . . . . . . . . . . . . . . . . . . . . $12,489 $11,617 $13,577
Equity securities . . . . . . . . . . . . . . . . . . . . . . . . . . . . . . . . . . . . . . . . . . . . . . 128 178 258
Trading and other securities — Actively Traded Securities and FVO general accountsecurities . . . . . . . . . . . . . . . . . . . . . . . . . . . . . . . . . . . . . . . . . . . . . . . . . 73 116 (27)
Mortgage loans . . . . . . . . . . . . . . . . . . . . . . . . . . . . . . . . . . . . . . . . . . . . . . . 2,826 2,743 2,855
Policy loans . . . . . . . . . . . . . . . . . . . . . . . . . . . . . . . . . . . . . . . . . . . . . . . . . 657 648 601
Real estate and real estate joint ventures . . . . . . . . . . . . . . . . . . . . . . . . . . . . . . 439 (197) 572
Other limited partnership interests . . . . . . . . . . . . . . . . . . . . . . . . . . . . . . . . . . . 879 174 (170)
Cash, cash equivalents and short-term investments . . . . . . . . . . . . . . . . . . . . . . . 102 129 353
International joint ventures(1) . . . . . . . . . . . . . . . . . . . . . . . . . . . . . . . . . . . . . . (81) (115) 43
Other . . . . . . . . . . . . . . . . . . . . . . . . . . . . . . . . . . . . . . . . . . . . . . . . . . . . . 235 205 350
Subtotal . . . . . . . . . . . . . . . . . . . . . . . . . . . . . . . . . . . . . . . . . . . . . . . . . 17,747 15,498 18,412
Less: Investment expenses . . . . . . . . . . . . . . . . . . . . . . . . . . . . . . . . . . . . . . 930 945 1,957
Subtotal, net . . . . . . . . . . . . . . . . . . . . . . . . . . . . . . . . . . . . . . . . . . . . . . 16,817 14,553 16,455
Trading and other securities — FVO contractholder-directed unit-linked investments . . 372 284 (166)
FVO consolidated securitization entities:
Commercial mortgage loans . . . . . . . . . . . . . . . . . . . . . . . . . . . . . . . . . . . . . 411 — —
Securities . . . . . . . . . . . . . . . . . . . . . . . . . . . . . . . . . . . . . . . . . . . . . . . . . 15 — —
Subtotal . . . . . . . . . . . . . . . . . . . . . . . . . . . . . . . . . . . . . . . . . . . . . . . . . 798 284 (166)
Net investment income . . . . . . . . . . . . . . . . . . . . . . . . . . . . . . . . . . . . . . $17,615 $14,837 $16,289
(1) Amounts are presented net of changes in estimated fair value of derivatives related to economic hedges of the Company’s investment inthese equity method international joint venture investments that do not qualify for hedge accounting of $36 million, ($143) million and$178 million for the years ended December 31, 2010, 2009 and 2008, respectively.See “— Variable Interest Entities” for discussion of CSEs included in the table above.
Securities LendingThe Company participates in securities lending programs whereby blocks of securities, which are included in fixed maturity securities and
short-term investments, are loaned to third parties, primarily brokerage firms and commercial banks. The Company generally obtainscollateral, generally cash, in an amount equal to 102% of the estimated fair value of the securities loaned, which is obtained at the inception ofa loan and maintained at a level greater than or equal to 100% for the duration of the loan. Securities loaned under such transactions may besold or repledged by the transferee. The Company is liable to return to its counterparties the cash collateral under its control. Thesetransactions are treated as financing arrangements and the associated liability is recorded at the amount of the cash received.
F-48 MetLife, Inc.
MetLife, Inc.
Notes to the Consolidated Financial Statements — (Continued)

Elements of the securities lending programs are presented below at:
2010 2009
December 31,
(In millions)
Securities on loan:
Amortized cost . . . . . . . . . . . . . . . . . . . . . . . . . . . . . . . . . . . . . . . . . . . . . . . . . . . . . $23,715 $21,012
Estimated fair value . . . . . . . . . . . . . . . . . . . . . . . . . . . . . . . . . . . . . . . . . . . . . . . . . . $24,230 $20,949
Aging of cash collateral liability:
Open(1) . . . . . . . . . . . . . . . . . . . . . . . . . . . . . . . . . . . . . . . . . . . . . . . . . . . . . . . . . . $ 2,752 $ 3,290
Less than thirty days . . . . . . . . . . . . . . . . . . . . . . . . . . . . . . . . . . . . . . . . . . . . . . . . . 12,301 13,605
Thirty days or greater but less than sixty days . . . . . . . . . . . . . . . . . . . . . . . . . . . . . . . . . 4,399 3,534
Sixty days or greater but less than ninety days . . . . . . . . . . . . . . . . . . . . . . . . . . . . . . . . . 2,291 92
Ninety days or greater . . . . . . . . . . . . . . . . . . . . . . . . . . . . . . . . . . . . . . . . . . . . . . . . 2,904 995
Total cash collateral liability . . . . . . . . . . . . . . . . . . . . . . . . . . . . . . . . . . . . . . . . . . . . $24,647 $21,516
Security collateral on deposit from counterparties . . . . . . . . . . . . . . . . . . . . . . . . . . . . . . . . $ — $ 6
Reinvestment portfolio — estimated fair value . . . . . . . . . . . . . . . . . . . . . . . . . . . . . . . . . . . $24,177 $20,339
(1) Open — meaning that the related loaned security could be returned to the Company on the next business day requiring the Company toimmediately return the cash collateral.The estimated fair value of the securities on loan related to the cash collateral on open at December 31, 2010 was $2.7 billion, of which
$2.3 billion were U.S. Treasury, agency and government guaranteed securities which, if put to the Company, can be immediately sold tosatisfy the cash requirements. The remainder of the securities on loan were primarily U.S. Treasury, agency and government guaranteedsecurities, and very liquid RMBS. The reinvestment portfolio acquired with the cash collateral consisted principally of fixed maturity securities(including RMBS, U.S. corporate, U.S. Treasury, agency and government guaranteed and ABS).
Security collateral on deposit from counterparties in connection with the securities lending transactions may not be sold or repledged,unless the counterparty is in default, and is not reflected in the consolidated financial statements. Separately, the Company had $49 millionand $46 million, at estimated fair value, of cash and security collateral on deposit from a counterparty to secure its interest in a pooledinvestment that is held by a third-party trustee, as custodian, at December 31, 2010 and 2009, respectively. This pooled investment isincluded within fixed maturity securities and had an estimated fair value of $49 million and $51 million at December 31, 2010 and 2009,respectively.
Invested Assets on Deposit, Held in Trust and Pledged as CollateralThe invested assets on deposit, invested assets held in trust and invested assets pledged as collateral are presented in the table below.
The amounts presented in the table below are at estimated fair value for cash and cash equivalents, short-term investments, fixed maturity,equity, trading and other securities and at carrying value for mortgage loans.
2010 2009
December 31,
(In millions)
Invested assets on deposit:
Regulatory agencies(1) . . . . . . . . . . . . . . . . . . . . . . . . . . . . . . . . . . . . . . . . . . . . . . . . $ 2,110 $ 1,383
Invested assets held in trust:
Collateral financing arrangements(2) . . . . . . . . . . . . . . . . . . . . . . . . . . . . . . . . . . . . . . . 5,340 5,653
Reinsurance arrangements(3) . . . . . . . . . . . . . . . . . . . . . . . . . . . . . . . . . . . . . . . . . . . . 3,090 2,719
Invested assets pledged as collateral:
Funding agreements and advances — FHLB of NY(4) . . . . . . . . . . . . . . . . . . . . . . . . . . . . 21,975 20,612
Funding agreements — FHLB of Boston(4) . . . . . . . . . . . . . . . . . . . . . . . . . . . . . . . . . . . 211 419
Funding agreements — Farmer Mac(5) . . . . . . . . . . . . . . . . . . . . . . . . . . . . . . . . . . . . . . 3,159 2,871
Federal Reserve Bank of New York(6) . . . . . . . . . . . . . . . . . . . . . . . . . . . . . . . . . . . . . . . 1,822 1,537
Collateral financing arrangements(7) . . . . . . . . . . . . . . . . . . . . . . . . . . . . . . . . . . . . . . . 112 80
Derivative transactions(8) . . . . . . . . . . . . . . . . . . . . . . . . . . . . . . . . . . . . . . . . . . . . . . 1,726 1,671
Short sale agreements(9) . . . . . . . . . . . . . . . . . . . . . . . . . . . . . . . . . . . . . . . . . . . . . . . 465 496
Total invested assets on deposit, held in trust and pledged as collateral . . . . . . . . . . . . . . . . $40,010 $37,441
(1) The Company has investment assets on deposit with regulatory agencies consisting primarily of cash and cash equivalents, short-terminvestments, fixed maturity securities and equity securities.
(2) The Company held in trust cash and securities, primarily fixed maturity and equity securities, to satisfy collateral requirements.
F-49MetLife, Inc.
MetLife, Inc.
Notes to the Consolidated Financial Statements — (Continued)

(3) The Company held in trust certain investments, primarily fixed maturity securities, in connection with certain reinsurance transactions.(4) The Company has pledged fixed maturity securities and mortgage loans in support of its funding agreements with, and advances from, the
Federal Home Loan Bank of New York (“FHLB of NY”) and has pledged fixed maturity securities in support of its funding agreements withthe Federal Home Loan Bank of Boston (“FHLB of Boston”). The nature of these Federal Home Loan Bank arrangements is described inNotes 8 and 11.
(5) The Company has pledged certain agricultural mortgage loans in connection with funding agreements issued to certain SPEs that haveissued securities guaranteed by the Federal Agricultural Mortgage Corporation (“Farmer Mac”). The nature of these Farmer Macarrangements is described in Note 8.
(6) The Company has pledged qualifying mortgage loans and fixed maturity securities in connection with collateralized borrowings from theFederal Reserve Bank of New York’s Term Auction Facility. The nature of the Federal Reserve Bank of New York arrangements is describedin Note 11.
(7) The Holding Company has pledged certain collateral in support of the collateral financing arrangements described in Note 12.(8) Certain of the Company’s invested assets are pledged as collateral for various derivative transactions as described in Note 4.(9) Certain of the Company’s Actively Traded Securities and cash and cash equivalents are pledged to secure liabilities associated with short
sale agreements in the Actively Traded Securities portfolio.See also “— Securities Lending” for the amount of the Company’s cash received from and due back to counterparties pursuant to the
Company’s securities lending program. See “— Variable Interest Entities” for assets of certain CSEs that can only be used to settle liabilities ofsuch entities.
Trading and Other SecuritiesThe tables below present certain information about the Company’s trading securities and other securities for which the FVO has been
elected:
2010 2009
December 31,
(In millions)
Actively Traded Securities . . . . . . . . . . . . . . . . . . . . . . . . . . . . . . . . . . . . . . . . . . . . . . . . $ 463 $ 420
FVO general account securities . . . . . . . . . . . . . . . . . . . . . . . . . . . . . . . . . . . . . . . . . . . . . 131 78
FVO contractholder-directed unit-linked investments . . . . . . . . . . . . . . . . . . . . . . . . . . . . . . . 17,794 1,886
FVO securities held by consolidated securitization entities . . . . . . . . . . . . . . . . . . . . . . . . . . . . 201 —
Total trading and other securities — at estimated fair value . . . . . . . . . . . . . . . . . . . . . . . . . . $18,589 $2,384
Actively Traded Securities — at estimated fair value . . . . . . . . . . . . . . . . . . . . . . . . . . . . . . . . $ 463 $ 420
Short sale agreement liabilities — at estimated fair value . . . . . . . . . . . . . . . . . . . . . . . . . . . . . (46) (106)
Net long/short position — at estimated fair value . . . . . . . . . . . . . . . . . . . . . . . . . . . . . . . . . . $ 417 $ 314
Investments pledged to secure short sale agreement liabilities . . . . . . . . . . . . . . . . . . . . . . . . . $ 465 $ 496
2010 2009 2008
Years EndedDecember 31,
(In millions)
Actively Traded Securities:
Net investment income . . . . . . . . . . . . . . . . . . . . . . . . . . . . . . . . . . . . . . . . . . . . . . $ 54 $ 98 $ (13)
Changes in estimated fair value included in net investment income . . . . . . . . . . . . . . . . . . $ 12 $ 18 $ (2)
FVO general account securities:
Net investment income . . . . . . . . . . . . . . . . . . . . . . . . . . . . . . . . . . . . . . . . . . . . . . $ 19 $ 18 $ (14)
Changes in estimated fair value included in net investment income . . . . . . . . . . . . . . . . . . $ 18 $ 16 $ (17)
FVO contractholder-directed unit-linked investments:
Net investment income . . . . . . . . . . . . . . . . . . . . . . . . . . . . . . . . . . . . . . . . . . . . . . $372 $284 $(166)
Changes in estimated fair value included in net investment income . . . . . . . . . . . . . . . . . . $322 $275 $(155)
FVO securities held by consolidated securitization entities:
Net investment income . . . . . . . . . . . . . . . . . . . . . . . . . . . . . . . . . . . . . . . . . . . . . . $ 15 $ — $ —
Changes in estimated fair value included in net investment gains (losses) . . . . . . . . . . . . . . $ (78) $ — $ —See Note 1 for discussion of FVO contractholder-directed unit-linked investments and “— Variable Interest Entities” for discussion of
CSEs included in the tables above. The FVO contractholder-directed unit-linked investments held as of December 31, 2010 were primarilydue to the Acquisition (see Note 2).
F-50 MetLife, Inc.
MetLife, Inc.
Notes to the Consolidated Financial Statements — (Continued)

Mortgage LoansMortgage loans are summarized as follows at:
CarryingValue
% ofTotal
CarryingValue
% ofTotal
2010 2009
December 31,
(In millions)
Mortgage loans held-for-investment:
Commercial mortgage loans . . . . . . . . . . . . . . . . . . . . . . . . . . . . . . . . . $37,820 60.7% $35,176 69.0%
Agricultural mortgage loans . . . . . . . . . . . . . . . . . . . . . . . . . . . . . . . . . 12,751 20.4 12,255 24.1
Residential mortgage loans . . . . . . . . . . . . . . . . . . . . . . . . . . . . . . . . . 2,308 3.7 1,471 2.9
Subtotal . . . . . . . . . . . . . . . . . . . . . . . . . . . . . . . . . . . . . . . . . . . . 52,879 84.8 48,902 96.0
Valuation allowances . . . . . . . . . . . . . . . . . . . . . . . . . . . . . . . . . . . . . (664) (1.1) (721) (1.4)
Subtotal mortgage loans held-for-investment, net . . . . . . . . . . . . . . . . . . 52,215 83.7 48,181 94.6
Commercial mortgage loans held by consolidated securitization entities —FVO . . . . . . . . . . . . . . . . . . . . . . . . . . . . . . . . . . . . . . . . . . . . . . . 6,840 11.0 — —
Total mortgage loans held-for-investment, net . . . . . . . . . . . . . . . . . . . . 59,055 94.7 48,181 94.6
Mortgage loans held-for-sale:
Residential mortgage loans — FVO . . . . . . . . . . . . . . . . . . . . . . . . . . . . 2,510 4.0 2,470 4.9
Mortgage loans — lower of amortized cost or estimated fair value(1) . . . . . . . 811 1.3 258 0.5
Total mortgage loans held-for-sale . . . . . . . . . . . . . . . . . . . . . . . . . . . . . . 3,321 5.3 2,728 5.4
Total mortgage loans, net . . . . . . . . . . . . . . . . . . . . . . . . . . . . . . . . . . . . $62,376 100.0% $50,909 100.0%
(1) Includes agricultural and residential mortgage loans.See “— Variable Interest Entities” for discussion of CSEs included in the table above.Concentration of Credit Risk — The Company diversifies its mortgage loan portfolio by both geographic region and property type to
reduce the risk of concentration. The Company’s commercial and agricultural mortgage loans are collateralized by properties primarilylocated in the United States, at 91%, with the remaining 9% collateralized by properties located outside the United States, calculated as apercent of total mortgage loans held-for-investment (excluding commercial mortgage loans held by CSEs) at December 31, 2010. Thecarrying value of the Company’s commercial and agricultural mortgage loans located in California, New York and Texas were 21%, 8% and7%, respectively, of total mortgage loans held-for-investment (excluding commercial mortgage loans held by CSEs) at December 31, 2010.Additionally, the Company manages risk when originating commercial and agricultural mortgage loans by generally lending only up to 75% ofthe estimated fair value of the underlying real estate.
Certain of the Company’s real estate joint ventures have mortgage loans with the Company. The carrying values of such mortgage loanswere $283 million and $368 million at December 31, 2010 and 2009, respectively.
The following tables present the recorded investment in mortgage loans held-for-investment, by portfolio segment, by method ofevaluation of credit loss, and the related valuation allowances, by type of credit loss, at:
2010 2009 2010 2009 2010 2009 2010 2009
Commercial Agricultural Residential Total
December 31,
(In millions)
Mortgage loans:
Evaluated individually for credit losses . . . . . $ 120 $ 102 $ 146 $ 211 $ 15 $ 3 $ 281 $ 316
Evaluated collectively for credit losses . . . . . 37,700 35,074 12,605 12,044 2,293 1,468 52,598 48,586
Total mortgage loans . . . . . . . . . . . . . . 37,820 35,176 12,751 12,255 2,308 1,471 52,879 48,902
Valuation allowances:
Specific credit losses . . . . . . . . . . . . . . . 36 41 52 82 — — 88 123
Non-specifically identified credit losses . . . . 526 548 36 33 14 17 576 598
Total valuation allowances . . . . . . . . . . . 562 589 88 115 14 17 664 721
Mortgage loans, net of valuation allowance . . . $37,258 $34,587 $12,663 $12,140 $2,294 $1,454 $52,215 $48,181
F-51MetLife, Inc.
MetLife, Inc.
Notes to the Consolidated Financial Statements — (Continued)

The following tables present the changes in the valuation allowance, by portfolio segment:
Commercial Agricultural Residential Total
Mortgage Loan Valuation Allowances
(In millions)
Balance at January 1, 2008 . . . . . . . . . . . . . . . . . . . . . . . . . . . . . . $167 $ 24 $ 6 $197
Provision (release) . . . . . . . . . . . . . . . . . . . . . . . . . . . . . . . . . . . 145 49 6 200
Charge-offs, net of recoveries . . . . . . . . . . . . . . . . . . . . . . . . . . . (80) (12) (1) (93)
Balance at December 31, 2008 . . . . . . . . . . . . . . . . . . . . . . . . . . . 232 61 11 304
Provision (release) . . . . . . . . . . . . . . . . . . . . . . . . . . . . . . . . . . . 384 79 12 475
Charge-offs, net of recoveries . . . . . . . . . . . . . . . . . . . . . . . . . . . (27) (25) (6) (58)
Balance at December 31, 2009 . . . . . . . . . . . . . . . . . . . . . . . . . . . 589 115 17 721
Provision (release) . . . . . . . . . . . . . . . . . . . . . . . . . . . . . . . . . . . (5) 12 2 9
Charge-offs, net of recoveries . . . . . . . . . . . . . . . . . . . . . . . . . . . (22) (39) (5) (66)
Balance at December 31, 2010 . . . . . . . . . . . . . . . . . . . . . . . . . . . $562 $ 88 $14 $664
Commercial Mortgage Loans — by Credit Quality Indicators with Estimated Fair Value: Presented below for the commercial mortgageloans held-for-investment is the recorded investment, prior to valuation allowances, by the indicated loan-to-value ratio categories and debtservice coverage ratio categories and estimated fair value of such mortgage loans by the indicated loan-to-value ratio categories at:
H 1.20x 1.00x - 1.20x G 1.00x Total % of TotalEstimatedFair Value % of Total
Debt Service Coverage Ratios
Recorded Investment
December 31, 2010
(In millions) (In millions)
Loan-to-value ratios:
Less than 65% . . . . . . . . . . . . . . . $16,664 $ 125 $ 483 $17,272 45.7% $18,183 46.9%
65% to 75% . . . . . . . . . . . . . . . . . 9,023 765 513 10,301 27.2 10,686 27.6
76% to 80% . . . . . . . . . . . . . . . . . 3,033 304 135 3,472 9.2 3,536 9.1
Greater than 80% . . . . . . . . . . . . . 4,155 1,813 807 6,775 17.9 6,374 16.4
Total . . . . . . . . . . . . . . . . . . . . $32,875 $3,007 $1,938 $37,820 100.0% $38,779 100.0%
Agricultural and Residential Mortgage Loans — by Credit Quality Indicator: The recorded investment in agricultural and residentialmortgage loans held-for-investment, prior to valuation allowances, by credit quality indicator, was at:
Recorded Investment % of Total Recorded Investment % of Total
Agricultural Mortgage Loans Residential Mortgage Loans
December 31, 2010
(In millions) (In millions)
Loan-to-value ratios: Performance indicators:
Less than 65% . . . . . . . . . . . . . . . . . . $11,483 90.1% Performing . . . . . . . . $2,225 96.4%
65% to 75% . . . . . . . . . . . . . . . . . . . . 885 6.9 Nonperforming . . . . . . 83 3.6
76% to 80% . . . . . . . . . . . . . . . . . . . . 48 0.4 Total . . . . . . . . . . . $2,308 100.0%Greater than 80% . . . . . . . . . . . . . . . . 335 2.6
Total . . . . . . . . . . . . . . . . . . . . . . . . $12,751 100.0%
Past Due and Interest Accrual Status of Mortgage Loans. The Company has a high quality, well performing, mortgage loan portfolio withapproximately 99% of all mortgage loans classified as performing.
Past Due. The Company defines delinquent mortgage loans consistent with industry practice, when interest and principal payments arepast due as follows: commercial mortgage loans — 60 days past due; agricultural mortgage loans — 90 days past due; and residentialmortgage loans — 60 days past due. The recorded investment in mortgage loans held-for-investment, prior to valuation allowances, pastdue according to these aging categories was $58 million, $159 million and $79 million for commercial, agricultural and residential mortgageloans, respectively, at December 31, 2010; and for all mortgage loans was $296 million and $220 million at December 31, 2010 and 2009,respectively.
Accrual Status. Past Due 90 Days or More and Still Accruing Interest. The recorded investment in mortgage loans held-for-investment,prior to valuation allowances, that were past due 90 days or more and still accruing interest was $1 million, $13 million and $11 million forcommercial, agricultural and residential mortgage loans, respectively, at December 31, 2010; and for all mortgage loans, was $25 million and$14 million at December 31, 2010 and 2009, respectively.
Accrual Status. Mortgage Loans in Nonaccrual Status. The recorded investment in mortgage loans held-for-investment, prior tovaluation allowances, that were in nonaccrual status was $7 million, $177 million and $25 million for commercial, agricultural and residential
F-52 MetLife, Inc.
MetLife, Inc.
Notes to the Consolidated Financial Statements — (Continued)

mortgage loans, respectively, at December 31, 2010; and for all mortgage loans, was $209 million and $263 million at December 31, 2010and 2009, respectively.
Impaired Mortgage Loans. The unpaid principal balance, recorded investment, valuation allowances and carrying value, net of valuationallowances, for impaired mortgage loans held-for-investment, by portfolio segment, at December 31, 2010 and for all impaired mortgageloans held-for-investment at December 31, 2009, were as follows at:
UnpaidPrincipalBalance
RecordedInvestment
ValuationAllowances
CarryingValue
UnpaidPrincipalBalance
RecordedInvestment
UnpaidPrincipalBalance
CarryingValue
Loans with a Valuation AllowanceLoans without
a Valuation Allowance All Impaired Loans
Impaired Mortgage Loans
(In millions)
At December 31, 2010:
Commercial mortgage loans . . . . . . . . . $120 $120 $ 36 $ 84 $ 99 $ 87 $219 $171
Agricultural mortgage loans . . . . . . . . . . 146 146 52 94 123 119 269 213
Residential mortgage loans . . . . . . . . . . 3 3 — 3 16 16 19 19
Total . . . . . . . . . . . . . . . . . . . . . . . $269 $269 $ 88 $181 $238 $222 $507 $403
Total mortgage loans at December 31,2009 . . . . . . . . . . . . . . . . . . . . . . . . $316 $316 $123 $193 $106 $106 $422 $299
Unpaid principal balance is generally prior to any charge-off.The average investment in impaired mortgage loans held-for-investment, and the related interest income, by portfolio segment, for the
year ended December 31, 2010 and for all mortgage loans for the years ended December 31, 2009 and 2008, respectively, was:
Cash Basis Accrual Basis
Interest Income Recognized
Impaired Mortgage Loans
Average Investment
(In millions)
For the Year Ended December 31, 2010:
Commercial mortgage loans . . . . . . . . . . . . . . . . . . . . . . . . . . . . $192 $ 5 $ 1
Agricultural mortgage loans . . . . . . . . . . . . . . . . . . . . . . . . . . . . . 284 6 2
Residential mortgage loans . . . . . . . . . . . . . . . . . . . . . . . . . . . . . 16 — —
Total . . . . . . . . . . . . . . . . . . . . . . . . . . . . . . . . . . . . . . . . . . $492 $11 $ 3
For the Year Ended December 31, 2009 . . . . . . . . . . . . . . . . . . . $338 $ 8 $ 1
For the Year Ended December 31, 2008 . . . . . . . . . . . . . . . . . . . $389 $12 $10
Real Estate and Real Estate Joint VenturesReal estate investments by type consisted of the following:
CarryingValue
% ofTotal
CarryingValue
% ofTotal
2010 2009
December 31,
(In millions)
Traditional . . . . . . . . . . . . . . . . . . . . . . . . . . . . . . . . . . . . . . . . . . . . . . . $5,163 64.3% $4,135 60.0%
Real estate joint ventures and funds . . . . . . . . . . . . . . . . . . . . . . . . . . . . . . 2,707 33.7 2,579 37.4
Real estate and real estate joint ventures . . . . . . . . . . . . . . . . . . . . . . . . . . 7,870 98.0 6,714 97.4
Foreclosed . . . . . . . . . . . . . . . . . . . . . . . . . . . . . . . . . . . . . . . . . . . . . . 152 1.9 127 1.8
Real estate held-for-investment . . . . . . . . . . . . . . . . . . . . . . . . . . . . . . . . 8,022 99.9 6,841 99.2
Real estate held-for-sale . . . . . . . . . . . . . . . . . . . . . . . . . . . . . . . . . . . . . . 8 0.1 55 0.8
Total real estate and real estate joint ventures . . . . . . . . . . . . . . . . . . . . . . . $8,030 100.0% $6,896 100.0%
The Company classifies within traditional real estate its investment in income-producing real estate, which is comprised primarily ofwholly-owned real estate and, to a much lesser extent joint ventures with interests in single property income-producing real estate. TheCompany classifies within real estate joint ventures and funds, its investments in joint ventures with interests in multi-property projects withvarying strategies ranging from the development of properties to the operation of income-producing properties as well as its investments inreal estate private equity funds. From time to time, the Company transfers investments from these joint ventures to traditional real estate, if theCompany retains an interest in the joint venture after a completed property commences operations and the Company intends to retain aninterest in the property.
F-53MetLife, Inc.
MetLife, Inc.
Notes to the Consolidated Financial Statements — (Continued)

Properties acquired through foreclosure were $165 million, $127 million and less than $1 million for the years ended December 31, 2010,2009 and 2008, respectively, and includes commercial, agricultural and residential properties. After the Company acquires propertiesthrough foreclosure, it evaluates whether the property is appropriate for retention in its traditional real estate portfolio. Foreclosed real estateheld at December 31, 2010 and 2009 includes those properties the Company has not selected for retention in its traditional real estateportfolio and which do not meet the criteria to be classified as held-for-sale.
The wholly-owned real estate within traditional real estate is net of accumulated depreciation of $1.7 billion and $1.4 billion atDecember 31, 2010 and 2009, respectively. Related depreciation expense on traditional wholly-owned real estate was $151 million,$135 million and $136 million for the years ended December 31, 2010, 2009 and 2008, respectively. These amounts include depreciationexpense related to discontinued operations of less than $1 million for the year ended December 31, 2010, and $1 million for both the yearsended December 31, 2009 and 2008. The estimated fair value of the traditional real estate investment portfolio was $6.6 billion and $5.4billion at December 31, 2010, and 2009, respectively.
Impairments recognized on real estate held-for-investment were $48 million, $160 million and $20 million for the years ended Decem-ber 31, 2010, 2009 and 2008, respectively. Impairments recognized on real estate held-for-sale were $1 million for the year endedDecember 31, 2010. There were no impairments recognized on real estate held-for-sale for each of the years ended December 31, 2009 and2008. The Company’s carrying value of real estate held-for-sale has been reduced by impairments recorded prior to 2009 of $1 million at bothDecember 31, 2010 and 2009. The carrying value of non-income producing real estate was $137 million, $76 million and $28 million atDecember 31, 2010, 2009 and 2008, respectively.
The Company diversifies its real estate investments by both geographic region and property type to reduce risk of concentration. TheCompany’s real estate investments are primarily located in the United States, at 88%, with the remaining 12% located outside the UnitedStates , at December 31, 2010. The three locations with the largest real estate investments were California, Florida and Japan at 21%, 12%and 10%, respectively, at December 31, 2010.
The Company’s real estate investments by property type are categorized as follows:
CarryingValue
% ofTotal
CarryingValue
% ofTotal
2010 2009
December 31,
(In millions)
Office . . . . . . . . . . . . . . . . . . . . . . . . . . . . . . . . . . . . . . . . . . . . . . . . . . $4,369 54.4% $3,557 51.6%
Apartments . . . . . . . . . . . . . . . . . . . . . . . . . . . . . . . . . . . . . . . . . . . . . . 1,774 22.1 1,438 20.9
Real estate private equity funds . . . . . . . . . . . . . . . . . . . . . . . . . . . . . . . . . 552 6.9 504 7.3
Industrial . . . . . . . . . . . . . . . . . . . . . . . . . . . . . . . . . . . . . . . . . . . . . . . . 433 5.4 436 6.3
Retail . . . . . . . . . . . . . . . . . . . . . . . . . . . . . . . . . . . . . . . . . . . . . . . . . . 389 4.8 467 6.8
Hotel . . . . . . . . . . . . . . . . . . . . . . . . . . . . . . . . . . . . . . . . . . . . . . . . . . 233 2.9 203 2.9
Land . . . . . . . . . . . . . . . . . . . . . . . . . . . . . . . . . . . . . . . . . . . . . . . . . . . 133 1.7 110 1.6
Agriculture . . . . . . . . . . . . . . . . . . . . . . . . . . . . . . . . . . . . . . . . . . . . . . . 17 0.2 57 0.8
Other . . . . . . . . . . . . . . . . . . . . . . . . . . . . . . . . . . . . . . . . . . . . . . . . . . 130 1.6 124 1.8
Total real estate and real estate joint ventures . . . . . . . . . . . . . . . . . . . . . . . $8,030 100.0% $6,896 100.0%
Other Limited Partnership InterestsThe carrying value of other limited partnership interests (which primarily represent ownership interests in pooled investment funds that
principally make private equity investments in companies in the United States and overseas) was $6.4 billion and $5.5 billion at December 31,2010 and 2009, respectively. Included within other limited partnership interests were $1.0 billion, at both December 31, 2010 and 2009, ofinvestments in hedge funds. Impairments of other limited partnership interests, principally cost method other limited partnership interests,were $12 million, $354 million and $105 million for the years ended December 31, 2010, 2009 and 2008, respectively.
Collectively Significant Equity Method InvestmentsThe Company holds investments in real estate joint ventures, real estate funds and other limited partnership interests consisting of
leveraged buy-out funds, hedge funds, private equity funds, joint ventures and other funds. The portion of these investments accounted forunder the equity method had a carrying value of $8.7 billion as of December 31, 2010. The Company’s maximum exposure to loss related tothese equity method investments is limited to the carrying value of these investments plus unfunded commitments of $2.9 billion as ofDecember 31, 2010. Except for certain real estate joint ventures, the Company’s investments in real estate funds and other limitedpartnership interests are generally of a passive nature in that the Company does not participate in the management of the entities.
As further described in Note 1, the Company generally records its share of earnings in its equity method investments using a three-monthlag methodology and within net investment income. As of December 31, 2010, aggregate net investment income from these equity methodreal estate joint ventures, real estate funds and other limited partnership interests exceeded 10% of the Company’s consolidated pre-taxincome (loss) from continuing operations. Accordingly, the Company is providing the following aggregated summarized financial data for suchequity method investments. This aggregated summarized financial data does not represent the Company’s proportionate share of the assets,liabilities, or earnings of such entities.
As of, and for the year ended December 31, 2010, the aggregated summarized financial data presented below reflects the latest availablefinancial information. Aggregate total assets of these entities totaled $262.9 billion and $209.9 billion as of December 31, 2010 and 2009,respectively. Aggregate total liabilities of these entities totaled $77.6 billion and $64.5 billion as of December 31, 2010 and 2009,
F-54 MetLife, Inc.
MetLife, Inc.
Notes to the Consolidated Financial Statements — (Continued)

respectively. Aggregate net income (loss) of these entities totaled $18.7 billion, $22.8 billion and ($23.3) billion for the years endedDecember 31, 2010, 2009 and 2008, respectively. Aggregate net income (loss) from real estate joint ventures, real estate funds and otherlimited partnership interests is primarily comprised of investment income, including recurring investment income and realized and unrealizedinvestment gains (losses).
Other Invested AssetsThe following table presents the carrying value of the Company’s other invested assets by type at:
CarryingValue
% ofTotal
CarryingValue
% ofTotal
2010 2009
December 31,
(In millions)
Freestanding derivatives with positive fair values . . . . . . . . . . . . . . . . . . . . . $ 7,777 50.4% $ 6,133 48.2%
Leveraged leases, net of non-recourse debt . . . . . . . . . . . . . . . . . . . . . . . . 2,191 14.2 2,227 17.5
Tax credit partnerships . . . . . . . . . . . . . . . . . . . . . . . . . . . . . . . . . . . . . . 976 6.3 719 5.7
MSRs . . . . . . . . . . . . . . . . . . . . . . . . . . . . . . . . . . . . . . . . . . . . . . . . . 950 6.2 878 6.9
Joint venture investments . . . . . . . . . . . . . . . . . . . . . . . . . . . . . . . . . . . . 694 4.5 977 7.7
Funds withheld . . . . . . . . . . . . . . . . . . . . . . . . . . . . . . . . . . . . . . . . . . . 551 3.6 505 4.0
Funding agreements . . . . . . . . . . . . . . . . . . . . . . . . . . . . . . . . . . . . . . . — — 409 3.2
Other . . . . . . . . . . . . . . . . . . . . . . . . . . . . . . . . . . . . . . . . . . . . . . . . . 2,291 14.8 861 6.8
Total . . . . . . . . . . . . . . . . . . . . . . . . . . . . . . . . . . . . . . . . . . . . . . . . $15,430 100.0% $12,709 100.0%
See Note 4 for information regarding the freestanding derivatives with positive estimated fair values. See the following sections,“Leveraged Leases” and “Mortgage Servicing Rights,” for the composition of leveraged leases and for information on MSRs. Tax creditpartnerships are established for the purpose of investing in low-income housing and other social causes, where the primary return oninvestment is in the form of income tax credits, and are accounted for under the equity method or under the effective yield method. Jointventure investments are accounted for under the equity method and represent the Company’s investment in insurance underwriting jointventures in China, Japan (see Note 2) and Chile. Funds withheld represent amounts contractually withheld by ceding companies inaccordance with reinsurance agreements. Funding agreements represent arrangements where the Company has long-term interest bearingamounts on deposit with third parties and are generally stated at amortized cost.
Leveraged LeasesInvestment in leveraged leases, included in other invested assets, consisted of the following:
2010 2009
December 31,
(In millions)
Rental receivables, net . . . . . . . . . . . . . . . . . . . . . . . . . . . . . . . . . . . . . . . . . . . . . . . . . . $ 1,882 $ 1,698
Estimated residual values . . . . . . . . . . . . . . . . . . . . . . . . . . . . . . . . . . . . . . . . . . . . . . . . . 1,682 1,921
Subtotal . . . . . . . . . . . . . . . . . . . . . . . . . . . . . . . . . . . . . . . . . . . . . . . . . . . . . . . . . . 3,564 3,619
Unearned income . . . . . . . . . . . . . . . . . . . . . . . . . . . . . . . . . . . . . . . . . . . . . . . . . . . . . . (1,373) (1,392)
Investment in leveraged leases . . . . . . . . . . . . . . . . . . . . . . . . . . . . . . . . . . . . . . . . . . . . $ 2,191 $ 2,227
The rental receivables set forth above are generally due in periodic installments. The payment periods range from one to 15 years, but incertain circumstances are as long as 30 years. For rental receivables, the Company’s primary credit quality indicator is whether the rentalreceivable is performing or non-performing. The Company generally defines non-performing rental receivables as those that are 90 days ormore past due. The determination of performing or non-performing status is assessed monthly. As of December 31, 2010, all of the rentalreceivables were performing.
The Company’s deferred income tax liability related to leveraged leases was $1.4 billion and $1.3 billion at December 31, 2010 and 2009,respectively.
The components of net income from investment in leveraged leases were as follows:
2010 2009 2008
Years Ended December 31,
(In millions)
Net income from investment in leveraged leases . . . . . . . . . . . . . . . . . . . . . . . . . . . . . . $123 $114 $116
Less: Income tax expense on leveraged leases net investment income . . . . . . . . . . . . . . . . (43) (40) (40)
Net investment income after income tax from investment in leveraged leases . . . . . . . . . . . . $ 80 $ 74 $ 76
F-55MetLife, Inc.
MetLife, Inc.
Notes to the Consolidated Financial Statements — (Continued)
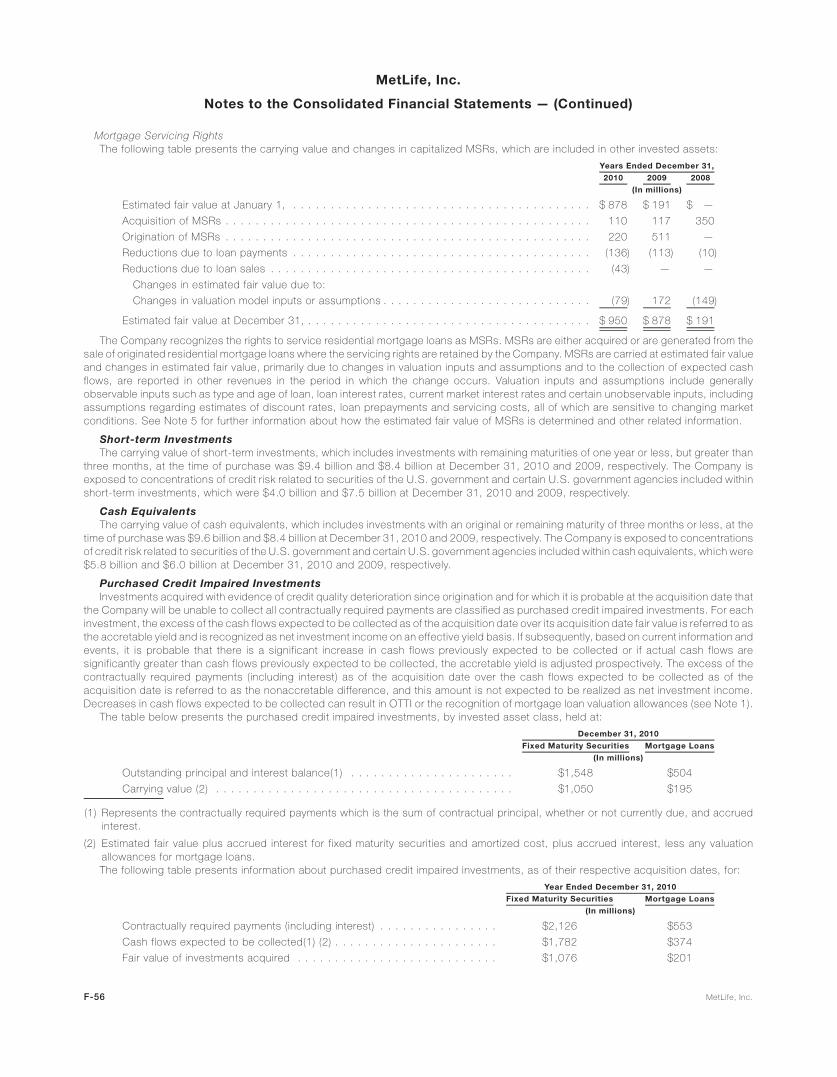
Mortgage Servicing RightsThe following table presents the carrying value and changes in capitalized MSRs, which are included in other invested assets:
2010 2009 2008
Years Ended December 31,
(In millions)
Estimated fair value at January 1, . . . . . . . . . . . . . . . . . . . . . . . . . . . . . . . . . . . . . . . . $ 878 $ 191 $ —
Acquisition of MSRs . . . . . . . . . . . . . . . . . . . . . . . . . . . . . . . . . . . . . . . . . . . . . . . . . 110 117 350
Origination of MSRs . . . . . . . . . . . . . . . . . . . . . . . . . . . . . . . . . . . . . . . . . . . . . . . . . 220 511 —
Reductions due to loan payments . . . . . . . . . . . . . . . . . . . . . . . . . . . . . . . . . . . . . . . . (136) (113) (10)
Reductions due to loan sales . . . . . . . . . . . . . . . . . . . . . . . . . . . . . . . . . . . . . . . . . . . (43) — —
Changes in estimated fair value due to:
Changes in valuation model inputs or assumptions . . . . . . . . . . . . . . . . . . . . . . . . . . . . (79) 172 (149)
Estimated fair value at December 31, . . . . . . . . . . . . . . . . . . . . . . . . . . . . . . . . . . . . . . $ 950 $ 878 $ 191
The Company recognizes the rights to service residential mortgage loans as MSRs. MSRs are either acquired or are generated from thesale of originated residential mortgage loans where the servicing rights are retained by the Company. MSRs are carried at estimated fair valueand changes in estimated fair value, primarily due to changes in valuation inputs and assumptions and to the collection of expected cashflows, are reported in other revenues in the period in which the change occurs. Valuation inputs and assumptions include generallyobservable inputs such as type and age of loan, loan interest rates, current market interest rates and certain unobservable inputs, includingassumptions regarding estimates of discount rates, loan prepayments and servicing costs, all of which are sensitive to changing marketconditions. See Note 5 for further information about how the estimated fair value of MSRs is determined and other related information.
Short-term InvestmentsThe carrying value of short-term investments, which includes investments with remaining maturities of one year or less, but greater than
three months, at the time of purchase was $9.4 billion and $8.4 billion at December 31, 2010 and 2009, respectively. The Company isexposed to concentrations of credit risk related to securities of the U.S. government and certain U.S. government agencies included withinshort-term investments, which were $4.0 billion and $7.5 billion at December 31, 2010 and 2009, respectively.
Cash EquivalentsThe carrying value of cash equivalents, which includes investments with an original or remaining maturity of three months or less, at the
time of purchase was $9.6 billion and $8.4 billion at December 31, 2010 and 2009, respectively. The Company is exposed to concentrationsof credit risk related to securities of the U.S. government and certain U.S. government agencies included within cash equivalents, which were$5.8 billion and $6.0 billion at December 31, 2010 and 2009, respectively.
Purchased Credit Impaired InvestmentsInvestments acquired with evidence of credit quality deterioration since origination and for which it is probable at the acquisition date that
the Company will be unable to collect all contractually required payments are classified as purchased credit impaired investments. For eachinvestment, the excess of the cash flows expected to be collected as of the acquisition date over its acquisition date fair value is referred to asthe accretable yield and is recognized as net investment income on an effective yield basis. If subsequently, based on current information andevents, it is probable that there is a significant increase in cash flows previously expected to be collected or if actual cash flows aresignificantly greater than cash flows previously expected to be collected, the accretable yield is adjusted prospectively. The excess of thecontractually required payments (including interest) as of the acquisition date over the cash flows expected to be collected as of theacquisition date is referred to as the nonaccretable difference, and this amount is not expected to be realized as net investment income.Decreases in cash flows expected to be collected can result in OTTI or the recognition of mortgage loan valuation allowances (see Note 1).
The table below presents the purchased credit impaired investments, by invested asset class, held at:
Fixed Maturity Securities Mortgage Loans
December 31, 2010
(In millions)
Outstanding principal and interest balance(1) . . . . . . . . . . . . . . . . . . . . . . $1,548 $504
Carrying value (2) . . . . . . . . . . . . . . . . . . . . . . . . . . . . . . . . . . . . . . . . $1,050 $195
(1) Represents the contractually required payments which is the sum of contractual principal, whether or not currently due, and accruedinterest.
(2) Estimated fair value plus accrued interest for fixed maturity securities and amortized cost, plus accrued interest, less any valuationallowances for mortgage loans.The following table presents information about purchased credit impaired investments, as of their respective acquisition dates, for:
Fixed Maturity Securities Mortgage Loans
Year Ended December 31, 2010
(In millions)
Contractually required payments (including interest) . . . . . . . . . . . . . . . . $2,126 $553
Cash flows expected to be collected(1) (2) . . . . . . . . . . . . . . . . . . . . . . $1,782 $374
Fair value of investments acquired . . . . . . . . . . . . . . . . . . . . . . . . . . . $1,076 $201
F-56 MetLife, Inc.
MetLife, Inc.
Notes to the Consolidated Financial Statements — (Continued)

(1) Represents undiscounted principal and interest cash flow expectations, at the date of acquisition.
(2) A portion of the difference between the contractually required payments (including interest) and the cash flows expected to be collectedon certain of the investments acquired from American Life has been established as an indemnification asset as discussed further inNote 2.The following table presents activity for the accretable yield on purchased credit impaired investments for:
Fixed Maturity Securities Mortgage Loans
December 31, 2010
(In millions)
Accretable yield, January 1, . . . . . . . . . . . . . . . . . . . . . . . . . . . . . . . . . . $ — $ —
Investments purchased . . . . . . . . . . . . . . . . . . . . . . . . . . . . . . . . . . . 606 —
Acquisition(1) . . . . . . . . . . . . . . . . . . . . . . . . . . . . . . . . . . . . . . . . . . 100 173
Accretion recognized in net investment income . . . . . . . . . . . . . . . . . . . . (62) (3)
Reclassification (to) from nonaccretable difference . . . . . . . . . . . . . . . . . . (103) —
Accretable yield, December 31, . . . . . . . . . . . . . . . . . . . . . . . . . . . . . . . $ 541 $170
(1) As described further in Note 2, all investments acquired with American Life were recorded at estimated fair value as of the AcquisitionDate. This activity relates to acquired fixed maturity securities and mortgage loans with a credit impairment inherent in the estimated fairvalue.
Variable Interest EntitiesThe Company holds investments in certain entities that are VIEs. In certain instances, the Company holds both the power to direct the
most significant activities of the entity, as well as an economic interest in the entity and, as such, consistent with the new guidance describedin Note 1, is deemed to be the primary beneficiary or consolidator of the entity. The following table presents the total assets and total liabilitiesrelating to VIEs for which the Company has concluded that it is the primary beneficiary and which are consolidated in the Company’s financialstatements at December 31, 2010 and 2009. Creditors or beneficial interest holders of VIEs where the Company is the primary beneficiaryhave no recourse to the general credit of the Company, as the Company’s obligation to the VIEs is limited to the amount of its committedinvestment.
TotalAssets
TotalLiabilities
TotalAssets
TotalLiabilities
2010 2009
December 31,
(In millions)
Consolidated securitization entities(1) . . . . . . . . . . . . . . . . . . . . . . . . . $ 7,114 $6,892 $ — $—
MRSC collateral financing arrangement(2) . . . . . . . . . . . . . . . . . . . . . . . 3,333 — 3,230 —
Other limited partnership interests . . . . . . . . . . . . . . . . . . . . . . . . . . . . 319 85 367 72
Trading securities . . . . . . . . . . . . . . . . . . . . . . . . . . . . . . . . . . . . . . 186 — — —
Other invested assets . . . . . . . . . . . . . . . . . . . . . . . . . . . . . . . . . . . . 108 1 27 1
Real estate joint ventures . . . . . . . . . . . . . . . . . . . . . . . . . . . . . . . . . 20 17 22 17
Total . . . . . . . . . . . . . . . . . . . . . . . . . . . . . . . . . . . . . . . . . . . . . $11,080 $6,995 $3,646 $90
(1) As discussed in Note 1, upon the adoption of new guidance effective January 1, 2010, the Company consolidated former QSPEs that arestructured as CMBS and former QSPEs that are structured as collateralized debt obligations. At December 31, 2010, these entities heldtotal assets of $7,114 million, consisting of $201 million of FVO securities held by CSEs classified within trading and other securities,$6,840 million of commercial mortgage loans, $34 million of accrued investment income and $39 million of cash. These entities had totalliabilities of $6,892 million, consisting of $6,820 million of long-term debt and $72 million of other liabilities. The assets of these entitiescan only be used to settle their respective liabilities, and under no circumstances is the Company or any of its subsidiaries or affiliatesliable for any principal or interest shortfalls should any arise. The Company’s exposure is limited to that of its remaining investment in theformer QSPEs of $201 million at estimated fair value at December 31, 2010. The long-term debt referred to above bears interest atprimarily fixed rates ranging from 2.25% to 5.57%, payable primarily on a monthly basis and is expected to be repaid over the next 7 years.Interest expense related to these obligations, included in other expenses, was $411 million for the year ended December 31, 2010.
(2) See Note 12 for a description of the MetLife Reinsurance Company of South Carolina (“MRSC”) collateral financing arrangement. Theseassets consist of the following, at estimated fair value at:
F-57MetLife, Inc.
MetLife, Inc.
Notes to the Consolidated Financial Statements — (Continued)

2010 2009
December 31,
(In millions)
Fixed maturity securities available-for-sale:
ABS . . . . . . . . . . . . . . . . . . . . . . . . . . . . . . . . . . . . . . . . . . . . . . . . . . . . . . . . . . . . . . $1,333 $ 963
U.S. corporate securities . . . . . . . . . . . . . . . . . . . . . . . . . . . . . . . . . . . . . . . . . . . . . . . . 893 1,049
RMBS . . . . . . . . . . . . . . . . . . . . . . . . . . . . . . . . . . . . . . . . . . . . . . . . . . . . . . . . . . . . . 547 672
CMBS . . . . . . . . . . . . . . . . . . . . . . . . . . . . . . . . . . . . . . . . . . . . . . . . . . . . . . . . . . . . 383 348
Foreign corporate securities . . . . . . . . . . . . . . . . . . . . . . . . . . . . . . . . . . . . . . . . . . . . . . 139 80
U.S. Treasury, agency and government guaranteed securities . . . . . . . . . . . . . . . . . . . . . . . . . — 33
State and political subdivision securities . . . . . . . . . . . . . . . . . . . . . . . . . . . . . . . . . . . . . . 30 21
Foreign government securities . . . . . . . . . . . . . . . . . . . . . . . . . . . . . . . . . . . . . . . . . . . . . 5 5
Cash and cash equivalents (including cash held in trust of less than $1 million for both years) . . . . . 3 59
Total . . . . . . . . . . . . . . . . . . . . . . . . . . . . . . . . . . . . . . . . . . . . . . . . . . . . . . . . . . . . . . . $3,333 $3,230
The following table presents the carrying amount and maximum exposure to loss relating to VIEs for which the Company holds significantvariable interests but is not the primary beneficiary and which have not been consolidated at:
CarryingAmount
MaximumExposureto Loss(1)
CarryingAmount
MaximumExposureto Loss(1)
2010 2009
December 31,
(In millions)
Fixed maturity securities available-for-sale:
RMBS(2) . . . . . . . . . . . . . . . . . . . . . . . . . . . . . . . . . . . . . . . . . . $44,733 $44,733 $ — $ —
CMBS(2) . . . . . . . . . . . . . . . . . . . . . . . . . . . . . . . . . . . . . . . . . . 20,675 20,675 — —
ABS(2) . . . . . . . . . . . . . . . . . . . . . . . . . . . . . . . . . . . . . . . . . . . . 14,290 14,290 — —
Foreign corporate securities . . . . . . . . . . . . . . . . . . . . . . . . . . . . . . 2,968 2,968 1,254 1,254
U.S. corporate securities . . . . . . . . . . . . . . . . . . . . . . . . . . . . . . . . 2,447 2,447 1,216 1,216
Other limited partnership interests . . . . . . . . . . . . . . . . . . . . . . . . . . . 4,383 6,479 2,543 2,887
Trading securities . . . . . . . . . . . . . . . . . . . . . . . . . . . . . . . . . . . . . . 789 789 — —
Other invested assets . . . . . . . . . . . . . . . . . . . . . . . . . . . . . . . . . . . 576 773 416 409
Mortgage loans . . . . . . . . . . . . . . . . . . . . . . . . . . . . . . . . . . . . . . . 350 350 — —
Real estate joint ventures . . . . . . . . . . . . . . . . . . . . . . . . . . . . . . . . . 40 108 30 30
Equity securities available-for-sale:
Non-redeemable preferred stock . . . . . . . . . . . . . . . . . . . . . . . . . . . — — 31 31
Total . . . . . . . . . . . . . . . . . . . . . . . . . . . . . . . . . . . . . . . . . . . . . $91,251 $93,612 $5,490 $5,827
(1) The maximum exposure to loss relating to the fixed maturity, equity and trading securities is equal to the carrying amounts or carryingamounts of retained interests. The maximum exposure to loss relating to the other limited partnership interests and real estate jointventures is equal to the carrying amounts plus any unfunded commitments of the Company. Such a maximum loss would be expected tooccur only upon bankruptcy of the issuer or investee. The maximum exposure to loss relating to the mortgage loans is equal to the carryingamounts plus any unfunded commitments of the Company. For certain of its investments in other invested assets, the Company’s return isin the form of income tax credits which are guaranteed by a creditworthy third-party. For such investments, the maximum exposure to lossis equal to the carrying amounts plus any unfunded commitments, reduced by amounts guaranteed by third parties of $231 million and$232 million at December 31, 2010 and 2009, respectively.
(2) As discussed in Note 1, the Company adopted new guidance effective January 1, 2010 which eliminated the concept of a QSPE. As aresult, the Company concluded it held variable interests in RMBS, CMBS and ABS. For these interests, the Company’s involvement islimited to that of a passive investor.As described in Note 16, the Company makes commitments to fund partnership investments in the normal course of business. Excluding
these commitments, the Company did not provide financial or other support to investees designated as VIEs during the years endedDecember 31, 2010, 2009 and 2008.
4. Derivative Financial Instruments
Accounting for Derivative Financial InstrumentsSee Note 1 for a description of the Company’s accounting policies for derivative financial instruments.See Note 5 for information about the fair value hierarchy for derivatives.
F-58 MetLife, Inc.
MetLife, Inc.
Notes to the Consolidated Financial Statements — (Continued)

Primary Risks Managed by Derivative Financial Instruments and Non-Derivative Financial InstrumentsThe Company is exposed to various risks relating to its ongoing business operations, including interest rate risk, foreign currency risk,
credit risk and equity market risk. The Company uses a variety of strategies to manage these risks, including the use of derivative instruments.The following table presents the gross notional amount, estimated fair value and primary underlying risk exposure of the Company’s derivativefinancial instruments, excluding embedded derivatives, held at:
Primary UnderlyingRisk Exposure Instrument Type
NotionalAmount Assets Liabilities
NotionalAmount Assets Liabilities
Estimated FairValue(1)
2010
Estimated FairValue(1)
2009
December 31,
(In millions)
Interest rate Interest rate swaps . . . . . . . . . . . . . . . . . . . $ 54,803 $2,654 $1,516 $ 38,152 $1,570 $1,255
Interest rate floors . . . . . . . . . . . . . . . . . . . 23,866 630 66 23,691 461 37
Interest rate caps . . . . . . . . . . . . . . . . . . . . 35,412 176 1 28,409 283 —
Interest rate futures . . . . . . . . . . . . . . . . . . 9,385 43 17 7,563 8 10
Interest rate options . . . . . . . . . . . . . . . . . . 8,761 144 23 4,050 117 57
Interest rate forwards . . . . . . . . . . . . . . . . . 10,374 106 135 9,921 66 27
Synthetic GICs . . . . . . . . . . . . . . . . . . . . . 4,397 — — 4,352 — —
Foreign currency Foreign currency swaps . . . . . . . . . . . . . . . 17,626 1,616 1,282 16,879 1,514 1,392
Foreign currency forwards . . . . . . . . . . . . . . 10,443 119 91 6,485 83 57
Currency futures . . . . . . . . . . . . . . . . . . . . 493 2 — — — —
Currency options . . . . . . . . . . . . . . . . . . . . 5,426 50 — 822 18 —
Non-derivative hedging instruments(2) . . . . . . 169 — 185 — — —
Credit Credit default swaps . . . . . . . . . . . . . . . . . . 10,957 173 104 6,723 74 130
Credit forwards . . . . . . . . . . . . . . . . . . . . . 90 2 3 220 2 6
Equity market Equity futures . . . . . . . . . . . . . . . . . . . . . . 8,794 21 9 7,405 44 21
Equity options . . . . . . . . . . . . . . . . . . . . . . 33,688 1,843 1,197 27,175 1,712 1,018
Variance swaps . . . . . . . . . . . . . . . . . . . . . 18,022 198 118 13,654 181 58
Total rate of return swaps . . . . . . . . . . . . . . 1,547 — — 376 — 47
Total . . . . . . . . . . . . . . . . . . . . . . . . . . . $254,253 $7,777 $4,747 $195,877 $6,133 $4,115
(1) The estimated fair value of all derivatives in an asset position is reported within other invested assets in the consolidated balance sheetsand the estimated fair value of all derivatives in a liability position is reported within other liabilities in the consolidated balance sheets.
(2) The estimated fair value of non-derivative hedging instruments represents the amortized cost of the instruments, as adjusted for foreigncurrency transaction gains or losses. Non-derivative hedging instruments are reported within policyholder account balances in theconsolidated balance sheets.
F-59MetLife, Inc.
MetLife, Inc.
Notes to the Consolidated Financial Statements — (Continued)

The following table presents the gross notional amount of derivative financial instruments by maturity at December 31, 2010:
One Year orLess
After One YearThrough Five
Years
After Five YearsThrough Ten
YearsAfter Ten
Years Total
Remaining Life
(In millions)
Interest rate swaps . . . . . . . . . . . . . . . . . . . . . $ 4,970 $14,491 $16,403 $18,939 $ 54,803
Interest rate floors . . . . . . . . . . . . . . . . . . . . . — 13,048 7,318 3,500 23,866
Interest rate caps . . . . . . . . . . . . . . . . . . . . . . 5,000 28,436 1,976 — 35,412
Interest rate futures . . . . . . . . . . . . . . . . . . . . . 9,385 — — — 9,385
Interest rate options . . . . . . . . . . . . . . . . . . . . 1,853 5,206 1,702 — 8,761
Interest rate forwards . . . . . . . . . . . . . . . . . . . 9,409 860 105 — 10,374
Synthetic GICs . . . . . . . . . . . . . . . . . . . . . . . . 4,397 — — — 4,397
Foreign currency swaps . . . . . . . . . . . . . . . . . . 3,262 5,857 5,999 2,508 17,626
Foreign currency forwards . . . . . . . . . . . . . . . . 10,337 24 20 62 10,443
Currency futures . . . . . . . . . . . . . . . . . . . . . . 493 — — — 493
Currency options . . . . . . . . . . . . . . . . . . . . . . 5,426 — — — 5,426
Non-derivative hedging instruments . . . . . . . . . . 169 — — — 169
Credit default swaps . . . . . . . . . . . . . . . . . . . . 111 10,197 649 — 10,957
Credit forwards . . . . . . . . . . . . . . . . . . . . . . . 90 — — — 90
Equity futures . . . . . . . . . . . . . . . . . . . . . . . . 8,794 — — — 8,794
Equity options . . . . . . . . . . . . . . . . . . . . . . . . 20,856 3,346 9,486 — 33,688
Variance swaps . . . . . . . . . . . . . . . . . . . . . . . 1,411 1,795 14,493 323 18,022
Total rate of return swaps . . . . . . . . . . . . . . . . . 1,492 55 — — 1,547
Total . . . . . . . . . . . . . . . . . . . . . . . . . . . . . $87,455 $83,315 $58,151 $25,332 $254,253
Interest rate swaps are used by the Company primarily to reduce market risks from changes in interest rates and to alter interest rateexposure arising from mismatches between assets and liabilities (duration mismatches). In an interest rate swap, the Company agrees withanother party to exchange, at specified intervals, the difference between fixed rate and floating rate interest amounts as calculated byreference to an agreed notional principal amount. These transactions are entered into pursuant to master agreements that provide for a singlenet payment to be made by the counterparty at each due date. The Company utilizes interest rate swaps in fair value, cash flow and non-qualifying hedging relationships.
The Company also enters into basis swaps to better match the cash flows from assets and related liabilities. In a basis swap, both legs ofthe swap are floating with each based on a different index. Generally, no cash is exchanged at the outset of the contract and no principalpayments are made by either party. A single net payment is usually made by one counterparty at each due date. Basis swaps are included ininterest rate swaps in the preceding table. The Company utilizes basis swaps in non-qualifying hedging relationships.
Inflation swaps are used as an economic hedge to reduce inflation risk generated from inflation-indexed liabilities. Inflation swaps areincluded in interest rate swaps in the preceding table. The Company utilizes inflation swaps in non-qualifying hedging relationships.
Implied volatility swaps are used by the Company primarily as economic hedges of interest rate risk associated with the Company’sinvestments in mortgage-backed securities. In an implied volatility swap, the Company exchanges fixed payments for floating payments thatare linked to certain market volatility measures. If implied volatility rises, the floating payments that the Company receives will increase, and ifimplied volatility falls, the floating payments that the Company receives will decrease. Implied volatility swaps are included in interest rateswaps in the preceding table. The Company utilizes implied volatility swaps in non-qualifying hedging relationships.
The Company purchases interest rate caps and floors primarily to protect its floating rate liabilities against rises in interest rates above aspecified level, and against interest rate exposure arising from mismatches between assets and liabilities (duration mismatches), as well as toprotect its minimum rate guarantee liabilities against declines in interest rates below a specified level, respectively. In certain instances, theCompany locks in the economic impact of existing purchased caps and floors by entering into offsetting written caps and floors. TheCompany utilizes interest rate caps and floors in non-qualifying hedging relationships.
In exchange-traded interest rate (Treasury and swap) futures transactions, the Company agrees to purchase or sell a specified number ofcontracts, the value of which is determined by the different classes of interest rate securities, and to post variation margin on a daily basis in anamount equal to the difference in the daily market values of those contracts. The Company enters into exchange- traded futures withregulated futures commission merchants that are members of the exchange. Exchange-traded interest rate (Treasury and swap) futures areused primarily to hedge mismatches between the duration of assets in a portfolio and the duration of liabilities supported by those assets, tohedge against changes in value of securities the Company owns or anticipates acquiring and to hedge against changes in interest rates onanticipated liability issuances by replicating Treasury or swap curve performance. The Company utilizes exchange-traded interest rate futuresin non-qualifying hedging relationships.
Swaptions are used by the Company to hedge interest rate risk associated with the Company’s long-term liabilities and invested assets. Aswaption is an option to enter into a swap with a forward starting effective date. In certain instances, the Company locks in the economicimpact of existing purchased swaptions by entering into offsetting written swaptions. The Company pays a premium for purchased swaptions
F-60 MetLife, Inc.
MetLife, Inc.
Notes to the Consolidated Financial Statements — (Continued)

and receives a premium for written swaptions. Swaptions are included in interest rate options in the preceding table. The Company utilizesswaptions in non-qualifying hedging relationships.
The Company writes covered call options on its portfolio of U.S. Treasuries as an income generation strategy. In a covered call transaction,the Company receives a premium at the inception of the contract in exchange for giving the derivative counterparty the right to purchase thereferenced security from the Company at a predetermined price. The call option is “covered” because the Company owns the referencedsecurity over the term of the option. Covered call options are included in interest rate options in the preceding table. The Company utilizescovered call options in non-qualifying hedging relationships.
The Company enters into interest rate forwards to buy and sell securities. The price is agreed upon at the time of the contract and paymentfor such a contract is made at a specified future date. The Company also uses interest rate forwards to sell to be announced securities aseconomic hedges against the risk of changes in the fair value of mortgage loans held-for-sale and interest rate lock commitments. TheCompany utilizes interest rate forwards in cash flow and non-qualifying hedging relationships.
Interest rate lock commitments are short-term commitments to fund mortgage loan applications in process (the pipeline) for a fixed term fora fixed rate or spread. During the term of an interest rate lock commitment, the Company is exposed to the risk that interest rates will changefrom the rate quoted to the potential borrower. Interest rate lock commitments to fund mortgage loans that will be held-for-sale are consideredderivative instruments. Interest rate lock commitments are included in interest rate forwards in the preceding table. Interest rate lockcommitments are not designated as hedging instruments.
A synthetic GIC is a contract that simulates the performance of a traditional guaranteed interest contract through the use of financialinstruments. Under a synthetic GIC, the policyholder owns the underlying assets. The Company guarantees a rate return on those assets for apremium. Synthetic GICs are not designated as hedging instruments.
Foreign currency derivatives, including foreign currency swaps, foreign currency forwards and currency option contracts, are used by theCompany to reduce the risk from fluctuations in foreign currency exchange rates associated with its assets and liabilities denominated inforeign currencies. The Company also uses foreign currency forwards and swaps to hedge the foreign currency risk associated with certain ofits net investments in foreign operations.
In a foreign currency swap transaction, the Company agrees with another party to exchange, at specified intervals, the difference betweenone currency and another at a fixed exchange rate, generally set at inception, calculated by reference to an agreed upon principal amount.The principal amount of each currency is exchanged at the inception and termination of the currency swap by each party. The Companyutilizes foreign currency swaps in fair value, cash flow, net investment in foreign operations and non-qualifying hedging relationships.
In a foreign currency forward transaction, the Company agrees with another party to deliver a specified amount of an identified currency ata specified future date. The price is agreed upon at the time of the contract and payment for such a contract is made in a different currency atthe specified future date. The Company utilizes foreign currency forwards in net investment in foreign operations and non-qualifying hedgingrelationships.
In exchange-traded currency futures transactions, the Company agrees to purchase or sell a specified number of contracts, the value ofwhich is determined by referenced currencies, and to post variation margin on a daily basis in an amount equal to the difference in the dailymarket values of those contracts. The Company enters into exchange-traded futures with regulated futures commission merchants that aremembers of the exchange. Exchange-traded currency futures are used primarily to hedge currency mismatches between assets andliabilities. The Company utilizes exchange-traded currency futures in non-qualifying hedging relationships.
The Company enters into currency option contracts that give it the right, but not the obligation, to sell the foreign currency amount inexchange for a functional currency amount within a limited time at a contracted price. The contracts may also be net settled in cash, based ondifferentials in the foreign exchange rate and the strike price. The Company uses currency options to hedge against the foreign currencyexposure inherent in certain of its variable annuity products. The Company also uses currency options as an economic hedge of foreigncurrency exposure related to the Company’s international subsidiaries. The Company utilizes currency options in non-qualifying hedgingrelationships.
The Company uses certain of its foreign currency denominated funding agreements to hedge portions of its net investments in foreignoperations against adverse movements in exchange rates. Such contracts are included in non-derivative hedging instruments in thepreceding table.
Swap spreadlocks are used by the Company to hedge invested assets on an economic basis against the risk of changes in credit spreads.Swap spreadlocks are forward transactions between two parties whose underlying reference index is a forward starting interest rate swapwhere the Company agrees to pay a coupon based on a predetermined reference swap spread in exchange for receiving a coupon based ona floating rate. The Company has the option to cash settle with the counterparty in lieu of maintaining the swap after the effective date. TheCompany utilizes swap spreadlocks in non-qualifying hedging relationships.
Certain credit default swaps are used by the Company to hedge against credit-related changes in the value of its investments and todiversify its credit risk exposure in certain portfolios. In a credit default swap transaction, the Company agrees with another party, at specifiedintervals, to pay a premium to hedge credit risk. If a credit event, as defined by the contract, occurs, generally the contract will require theswap to be settled gross by the delivery of par quantities of the referenced investment equal to the specified swap notional in exchange for thepayment of cash amounts by the counterparty equal to the par value of the investment surrendered. The Company utilizes credit defaultswaps in non-qualifying hedging relationships.
Credit default swaps are also used to synthetically create investments that are either more expensive to acquire or otherwise unavailable inthe cash markets. These transactions are a combination of a derivative and a cash instrument such as a U.S. Treasury or Agency security. TheCompany also enters into certain credit default swaps held in relation to trading portfolios for the purpose of generating profits on short-termdifferences in price. These credit default swaps are not designated as hedging instruments.
The Company enters into forwards to lock in the price to be paid for forward purchases of certain securities. The price is agreed upon at thetime of the contract and payment for the contract is made at a specified future date. When the primary purpose of entering into these
F-61MetLife, Inc.
MetLife, Inc.
Notes to the Consolidated Financial Statements — (Continued)
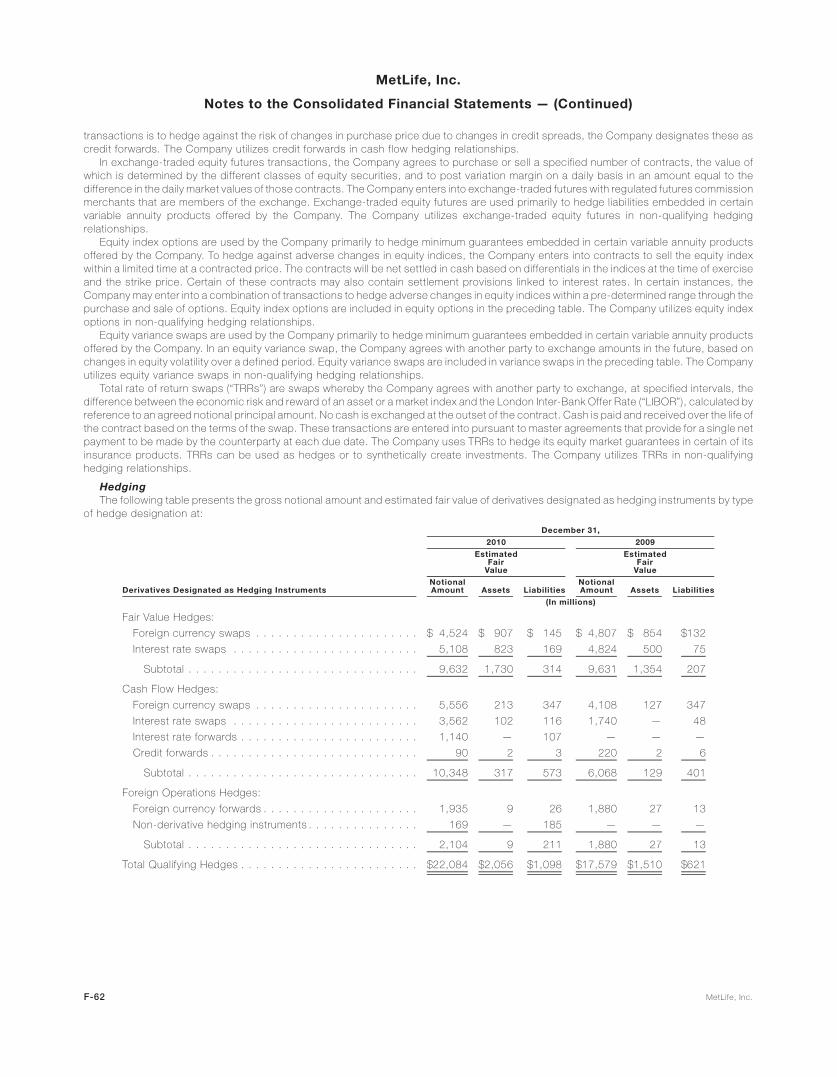
transactions is to hedge against the risk of changes in purchase price due to changes in credit spreads, the Company designates these ascredit forwards. The Company utilizes credit forwards in cash flow hedging relationships.
In exchange-traded equity futures transactions, the Company agrees to purchase or sell a specified number of contracts, the value ofwhich is determined by the different classes of equity securities, and to post variation margin on a daily basis in an amount equal to thedifference in the daily market values of those contracts. The Company enters into exchange-traded futures with regulated futures commissionmerchants that are members of the exchange. Exchange-traded equity futures are used primarily to hedge liabilities embedded in certainvariable annuity products offered by the Company. The Company utilizes exchange-traded equity futures in non-qualifying hedgingrelationships.
Equity index options are used by the Company primarily to hedge minimum guarantees embedded in certain variable annuity productsoffered by the Company. To hedge against adverse changes in equity indices, the Company enters into contracts to sell the equity indexwithin a limited time at a contracted price. The contracts will be net settled in cash based on differentials in the indices at the time of exerciseand the strike price. Certain of these contracts may also contain settlement provisions linked to interest rates. In certain instances, theCompany may enter into a combination of transactions to hedge adverse changes in equity indices within a pre-determined range through thepurchase and sale of options. Equity index options are included in equity options in the preceding table. The Company utilizes equity indexoptions in non-qualifying hedging relationships.
Equity variance swaps are used by the Company primarily to hedge minimum guarantees embedded in certain variable annuity productsoffered by the Company. In an equity variance swap, the Company agrees with another party to exchange amounts in the future, based onchanges in equity volatility over a defined period. Equity variance swaps are included in variance swaps in the preceding table. The Companyutilizes equity variance swaps in non-qualifying hedging relationships.
Total rate of return swaps (“TRRs”) are swaps whereby the Company agrees with another party to exchange, at specified intervals, thedifference between the economic risk and reward of an asset or a market index and the London Inter-Bank Offer Rate (“LIBOR”), calculated byreference to an agreed notional principal amount. No cash is exchanged at the outset of the contract. Cash is paid and received over the life ofthe contract based on the terms of the swap. These transactions are entered into pursuant to master agreements that provide for a single netpayment to be made by the counterparty at each due date. The Company uses TRRs to hedge its equity market guarantees in certain of itsinsurance products. TRRs can be used as hedges or to synthetically create investments. The Company utilizes TRRs in non-qualifyinghedging relationships.
HedgingThe following table presents the gross notional amount and estimated fair value of derivatives designated as hedging instruments by type
of hedge designation at:
Derivatives Designated as Hedging InstrumentsNotionalAmount Assets Liabilities
NotionalAmount Assets Liabilities
EstimatedFair
Value
EstimatedFair
Value
2010 2009
December 31,
(In millions)
Fair Value Hedges:
Foreign currency swaps . . . . . . . . . . . . . . . . . . . . . . $ 4,524 $ 907 $ 145 $ 4,807 $ 854 $132
Interest rate swaps . . . . . . . . . . . . . . . . . . . . . . . . . 5,108 823 169 4,824 500 75
Subtotal . . . . . . . . . . . . . . . . . . . . . . . . . . . . . . . 9,632 1,730 314 9,631 1,354 207
Cash Flow Hedges:
Foreign currency swaps . . . . . . . . . . . . . . . . . . . . . . 5,556 213 347 4,108 127 347
Interest rate swaps . . . . . . . . . . . . . . . . . . . . . . . . . 3,562 102 116 1,740 — 48
Interest rate forwards . . . . . . . . . . . . . . . . . . . . . . . . 1,140 — 107 — — —
Credit forwards . . . . . . . . . . . . . . . . . . . . . . . . . . . . 90 2 3 220 2 6
Subtotal . . . . . . . . . . . . . . . . . . . . . . . . . . . . . . . 10,348 317 573 6,068 129 401
Foreign Operations Hedges:
Foreign currency forwards . . . . . . . . . . . . . . . . . . . . . 1,935 9 26 1,880 27 13
Non-derivative hedging instruments . . . . . . . . . . . . . . . 169 — 185 — — —
Subtotal . . . . . . . . . . . . . . . . . . . . . . . . . . . . . . . 2,104 9 211 1,880 27 13
Total Qualifying Hedges . . . . . . . . . . . . . . . . . . . . . . . . $22,084 $2,056 $1,098 $17,579 $1,510 $621
F-62 MetLife, Inc.
MetLife, Inc.
Notes to the Consolidated Financial Statements — (Continued)
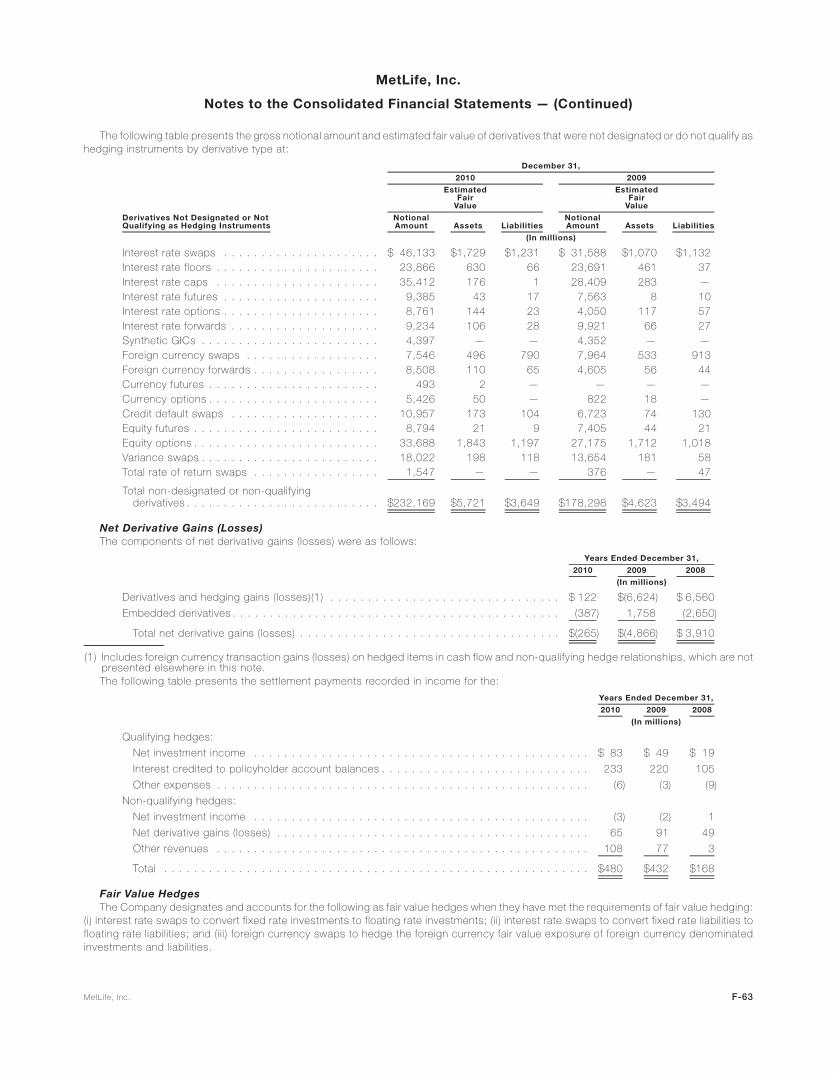
The following table presents the gross notional amount and estimated fair value of derivatives that were not designated or do not qualify ashedging instruments by derivative type at:
Derivatives Not Designated or NotQualifying as Hedging Instruments
NotionalAmount Assets Liabilities
NotionalAmount Assets Liabilities
EstimatedFair
Value
EstimatedFair
Value
2010 2009
December 31,
(In millions)
Interest rate swaps . . . . . . . . . . . . . . . . . . . . . $ 46,133 $1,729 $1,231 $ 31,588 $1,070 $1,132Interest rate floors . . . . . . . . . . . . . . . . . . . . . . 23,866 630 66 23,691 461 37Interest rate caps . . . . . . . . . . . . . . . . . . . . . . 35,412 176 1 28,409 283 —Interest rate futures . . . . . . . . . . . . . . . . . . . . . 9,385 43 17 7,563 8 10Interest rate options . . . . . . . . . . . . . . . . . . . . . 8,761 144 23 4,050 117 57Interest rate forwards . . . . . . . . . . . . . . . . . . . . 9,234 106 28 9,921 66 27Synthetic GICs . . . . . . . . . . . . . . . . . . . . . . . . 4,397 — — 4,352 — —Foreign currency swaps . . . . . . . . . . . . . . . . . . 7,546 496 790 7,964 533 913Foreign currency forwards . . . . . . . . . . . . . . . . . 8,508 110 65 4,605 56 44Currency futures . . . . . . . . . . . . . . . . . . . . . . . 493 2 — — — —Currency options . . . . . . . . . . . . . . . . . . . . . . . 5,426 50 — 822 18 —Credit default swaps . . . . . . . . . . . . . . . . . . . . 10,957 173 104 6,723 74 130Equity futures . . . . . . . . . . . . . . . . . . . . . . . . . 8,794 21 9 7,405 44 21Equity options . . . . . . . . . . . . . . . . . . . . . . . . . 33,688 1,843 1,197 27,175 1,712 1,018Variance swaps . . . . . . . . . . . . . . . . . . . . . . . . 18,022 198 118 13,654 181 58Total rate of return swaps . . . . . . . . . . . . . . . . . 1,547 — — 376 — 47
Total non-designated or non-qualifyingderivatives . . . . . . . . . . . . . . . . . . . . . . . . . . $232,169 $5,721 $3,649 $178,298 $4,623 $3,494
Net Derivative Gains (Losses)The components of net derivative gains (losses) were as follows:
2010 2009 2008
Years Ended December 31,
(In millions)
Derivatives and hedging gains (losses)(1) . . . . . . . . . . . . . . . . . . . . . . . . . . . . . . . $ 122 $(6,624) $ 6,560
Embedded derivatives . . . . . . . . . . . . . . . . . . . . . . . . . . . . . . . . . . . . . . . . . . . . (387) 1,758 (2,650)
Total net derivative gains (losses) . . . . . . . . . . . . . . . . . . . . . . . . . . . . . . . . . . . $(265) $(4,866) $ 3,910
(1) Includes foreign currency transaction gains (losses) on hedged items in cash flow and non-qualifying hedge relationships, which are notpresented elsewhere in this note.The following table presents the settlement payments recorded in income for the:
2010 2009 2008
Years Ended December 31,
(In millions)
Qualifying hedges:
Net investment income . . . . . . . . . . . . . . . . . . . . . . . . . . . . . . . . . . . . . . . . . . . . . $ 83 $ 49 $ 19
Interest credited to policyholder account balances . . . . . . . . . . . . . . . . . . . . . . . . . . . . 233 220 105
Other expenses . . . . . . . . . . . . . . . . . . . . . . . . . . . . . . . . . . . . . . . . . . . . . . . . . . (6) (3) (9)
Non-qualifying hedges:
Net investment income . . . . . . . . . . . . . . . . . . . . . . . . . . . . . . . . . . . . . . . . . . . . . (3) (2) 1
Net derivative gains (losses) . . . . . . . . . . . . . . . . . . . . . . . . . . . . . . . . . . . . . . . . . . 65 91 49
Other revenues . . . . . . . . . . . . . . . . . . . . . . . . . . . . . . . . . . . . . . . . . . . . . . . . . . 108 77 3
Total . . . . . . . . . . . . . . . . . . . . . . . . . . . . . . . . . . . . . . . . . . . . . . . . . . . . . . . . . $480 $432 $168
Fair Value HedgesThe Company designates and accounts for the following as fair value hedges when they have met the requirements of fair value hedging:
(i) interest rate swaps to convert fixed rate investments to floating rate investments; (ii) interest rate swaps to convert fixed rate liabilities tofloating rate liabilities; and (iii) foreign currency swaps to hedge the foreign currency fair value exposure of foreign currency denominatedinvestments and liabilities.
F-63MetLife, Inc.
MetLife, Inc.
Notes to the Consolidated Financial Statements — (Continued)
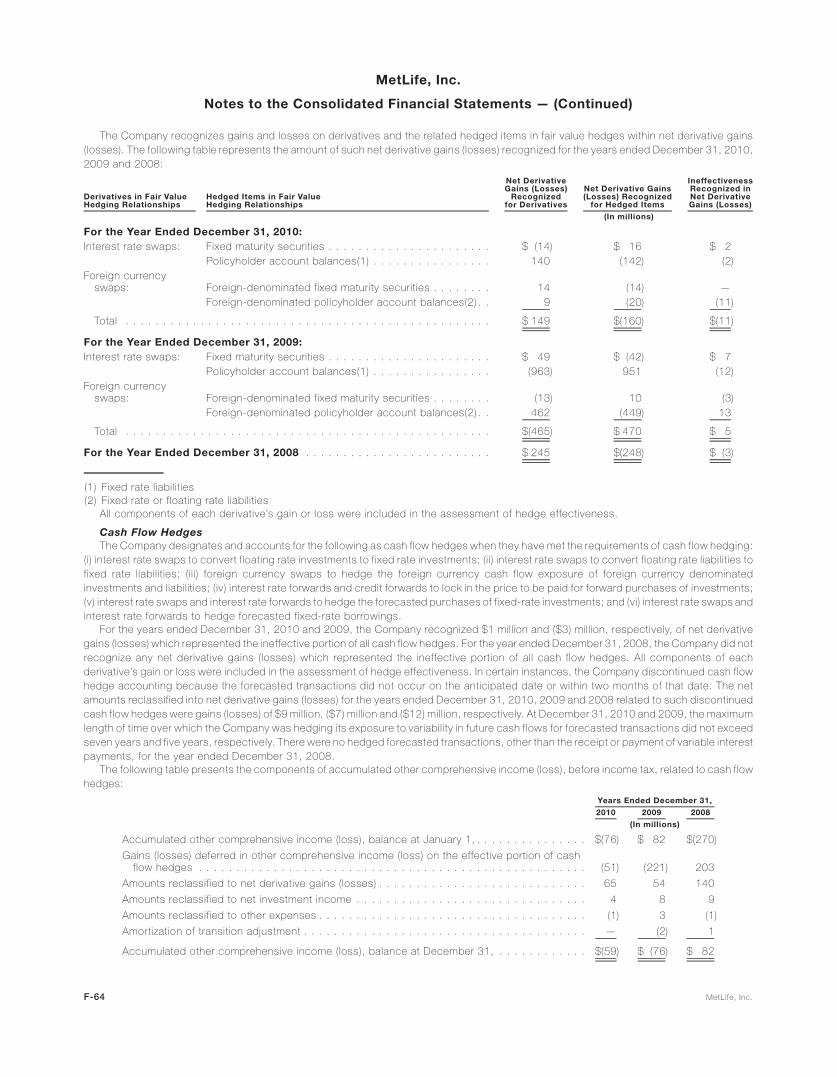
The Company recognizes gains and losses on derivatives and the related hedged items in fair value hedges within net derivative gains(losses). The following table represents the amount of such net derivative gains (losses) recognized for the years ended December 31, 2010,2009 and 2008:
Derivatives in Fair ValueHedging Relationships
Hedged Items in Fair ValueHedging Relationships
Net DerivativeGains (Losses)
Recognizedfor Derivatives
Net Derivative Gains(Losses) Recognized
for Hedged Items
IneffectivenessRecognized inNet DerivativeGains (Losses)
(In millions)
For the Year Ended December 31, 2010:Interest rate swaps: Fixed maturity securities . . . . . . . . . . . . . . . . . . . . . . $ (14) $ 16 $ 2
Policyholder account balances(1) . . . . . . . . . . . . . . . . 140 (142) (2)Foreign currency
swaps: Foreign-denominated fixed maturity securities . . . . . . . . 14 (14) —Foreign-denominated policyholder account balances(2) . . 9 (20) (11)
Total . . . . . . . . . . . . . . . . . . . . . . . . . . . . . . . . . . . . . . . . . . . . . . . . . $ 149 $(160) $(11)
For the Year Ended December 31, 2009:Interest rate swaps: Fixed maturity securities . . . . . . . . . . . . . . . . . . . . . . $ 49 $ (42) $ 7
Policyholder account balances(1) . . . . . . . . . . . . . . . . (963) 951 (12)Foreign currency
swaps: Foreign-denominated fixed maturity securities . . . . . . . . (13) 10 (3)Foreign-denominated policyholder account balances(2) . . 462 (449) 13
Total . . . . . . . . . . . . . . . . . . . . . . . . . . . . . . . . . . . . . . . . . . . . . . . . . $(465) $ 470 $ 5
For the Year Ended December 31, 2008 . . . . . . . . . . . . . . . . . . . . . . . . . $ 245 $(248) $ (3)
(1) Fixed rate liabilities(2) Fixed rate or floating rate liabilities
All components of each derivative’s gain or loss were included in the assessment of hedge effectiveness.
Cash Flow HedgesThe Company designates and accounts for the following as cash flow hedges when they have met the requirements of cash flow hedging:
(i) interest rate swaps to convert floating rate investments to fixed rate investments; (ii) interest rate swaps to convert floating rate liabilities tofixed rate liabilities; (iii) foreign currency swaps to hedge the foreign currency cash flow exposure of foreign currency denominatedinvestments and liabilities; (iv) interest rate forwards and credit forwards to lock in the price to be paid for forward purchases of investments;(v) interest rate swaps and interest rate forwards to hedge the forecasted purchases of fixed-rate investments; and (vi) interest rate swaps andinterest rate forwards to hedge forecasted fixed-rate borrowings.
For the years ended December 31, 2010 and 2009, the Company recognized $1 million and ($3) million, respectively, of net derivativegains (losses) which represented the ineffective portion of all cash flow hedges. For the year ended December 31, 2008, the Company did notrecognize any net derivative gains (losses) which represented the ineffective portion of all cash flow hedges. All components of eachderivative’s gain or loss were included in the assessment of hedge effectiveness. In certain instances, the Company discontinued cash flowhedge accounting because the forecasted transactions did not occur on the anticipated date or within two months of that date. The netamounts reclassified into net derivative gains (losses) for the years ended December 31, 2010, 2009 and 2008 related to such discontinuedcash flow hedges were gains (losses) of $9 million, ($7) million and ($12) million, respectively. At December 31, 2010 and 2009, the maximumlength of time over which the Company was hedging its exposure to variability in future cash flows for forecasted transactions did not exceedseven years and five years, respectively. There were no hedged forecasted transactions, other than the receipt or payment of variable interestpayments, for the year ended December 31, 2008.
The following table presents the components of accumulated other comprehensive income (loss), before income tax, related to cash flowhedges:
2010 2009 2008
Years Ended December 31,
(In millions)
Accumulated other comprehensive income (loss), balance at January 1, . . . . . . . . . . . . . . . $(76) $ 82 $(270)
Gains (losses) deferred in other comprehensive income (loss) on the effective portion of cashflow hedges . . . . . . . . . . . . . . . . . . . . . . . . . . . . . . . . . . . . . . . . . . . . . . . . . . . . (51) (221) 203
Amounts reclassified to net derivative gains (losses) . . . . . . . . . . . . . . . . . . . . . . . . . . . . 65 54 140
Amounts reclassified to net investment income . . . . . . . . . . . . . . . . . . . . . . . . . . . . . . . 4 8 9
Amounts reclassified to other expenses . . . . . . . . . . . . . . . . . . . . . . . . . . . . . . . . . . . . (1) 3 (1)
Amortization of transition adjustment . . . . . . . . . . . . . . . . . . . . . . . . . . . . . . . . . . . . . . — (2) 1
Accumulated other comprehensive income (loss), balance at December 31, . . . . . . . . . . . . $(59) $ (76) $ 82
F-64 MetLife, Inc.
MetLife, Inc.
Notes to the Consolidated Financial Statements — (Continued)

At December 31, 2010, $3 million of deferred net losses on derivatives in accumulated other comprehensive income (loss) was expectedto be reclassified to earnings within the next 12 months.
The following table presents the effects of derivatives in cash flow hedging relationships on the consolidated statements of operations andthe consolidated statements of equity for the years ended December 31, 2010, 2009 and 2008:
Net DerivativeGains (Losses)
Net InvestmentIncome
OtherExpenses
Net DerivativeGains (Losses)
Net InvestmentIncome
(Effective Portion) (Effective Portion)
(Ineffective Portion andAmount Excluded fromEffectiveness Testing)
Derivatives in Cash FlowHedging Relationships
Amount of Gains(Losses) Deferred
in Accumulated OtherComprehensive Income
(Loss) on Derivatives
Amount and Locationof Gains (Losses)
Recognized in Income (Loss)on Derivatives
Amount and Locationof Gains (Losses)Reclassified from
Accumulated Other ComprehensiveIncome (Loss) into Income (Loss)
(In millions)
For the Year EndedDecember 31, 2010:
Interest rate swaps . . . . . . . . . . . $ 13 $ — $ — $ (1) $ 3 $—
Foreign currency swaps . . . . . . . 34 (79) (6) 2 — —
Interest rate forwards . . . . . . . . . (117) 14 2 — (2) —
Credit forwards . . . . . . . . . . . . . 19 — — — — —
Total . . . . . . . . . . . . . . . . . . . $ (51) $ (65) $ (4) $ 1 $ 1 $—
For the Year EndedDecember 31, 2009:
Interest rate swaps . . . . . . . . . . . $ (45) $ — $ — $ (4) $ (2) $—
Foreign currency swaps . . . . . . . (319) (133) (6) 1 (1) —
Interest rate forwards . . . . . . . . . 147 79 — — — —
Credit forwards . . . . . . . . . . . . . (4) — — — — —
Total . . . . . . . . . . . . . . . . . . . $(221) $ (54) $ (6) $ (3) $ (3) $—
For the Year EndedDecember 31, 2008:
Foreign currency swaps . . . . . . . $ 203 $(140) $(10) $ 1 $— $—
Hedges of Net Investments in Foreign OperationsThe Company uses foreign exchange contracts, which may include foreign currency swaps, forwards and options, to hedge portions of its
net investments in foreign operations against adverse movements in exchange rates. The Company measures ineffectiveness on thesecontracts based upon the change in forward rates. In addition, the Company may also use non-derivative financial instruments to hedgeportions of its net investments in foreign operations against adverse movements in exchange rates. The Company measures ineffectivenesson non-derivative financial instruments based upon the change in spot rates.
When net investments in foreign operations are sold or substantially liquidated, the amounts in accumulated other comprehensive income(loss) are reclassified to the consolidated statements of operations, while a pro rata portion will be reclassified upon partial sale of the netinvestments in foreign operations.
The following table presents the effects of derivatives and non-derivative financial instruments in net investment hedging relationships inthe consolidated statements of operations and the consolidated statements of equity for the years ended December 31, 2010, 2009 and2008:
Derivatives and Non-Derivative Hedging Instruments in NetInvestment Hedging Relationships (1), (2) 2010 2009 2008 2010 2009 2008
Years Ended December 31,Years Ended
December 31,
Net Investment Gains(Losses)
Amount of Gains (Losses)Deferred in Accumulated
Other ComprehensiveIncome (Loss)
(Effective Portion)
Amount and Locationof Gains (Losses)Reclassified From
Accumulated OtherComprehensive
Income(Loss) into Income
(Loss)(Effective Portion)
(In millions)
Foreign currency forwards . . . . . . . . . . . . . . . . . . . . . . . . . . . . . . . . . . . . . . . . $(167) $(244) $338 $— $ (59) $—
Foreign currency swaps . . . . . . . . . . . . . . . . . . . . . . . . . . . . . . . . . . . . . . . . . . — (18) 76 — (63) —
Non-derivative hedging instruments . . . . . . . . . . . . . . . . . . . . . . . . . . . . . . . . . . (16) (37) 81 — (11) —
Total . . . . . . . . . . . . . . . . . . . . . . . . . . . . . . . . . . . . . . . . . . . . . . . . . . . . . $(183) $(299) $495 $— $(133) $—
F-65MetLife, Inc.
MetLife, Inc.
Notes to the Consolidated Financial Statements — (Continued)

(1) During the years ended December 31, 2010 and 2008, there were no sales or substantial liquidations of net investments in foreignoperations that would have required the reclassification of gains or losses from accumulated other comprehensive income (loss) intoearnings. During the year ended December 31, 2009, the Company substantially liquidated, through assumption reinsurance (seeNote 2), the portion of its Canadian operations that was being hedged in a net investment hedging relationship. As a result, the Companyreclassified losses of $133 million from accumulated other comprehensive income (loss) into earnings.
(2) There was no ineffectiveness recognized for the Company’s hedges of net investments in foreign operations.At December 31, 2010 and 2009, the cumulative foreign currency translation gain (loss) recorded in accumulated other comprehensive
income (loss) related to hedges of net investments in foreign operations was ($223) million and ($40) million, respectively.
Non-Qualifying Derivatives and Derivatives for Purposes Other Than HedgingThe Company enters into the following derivatives that do not qualify for hedge accounting or for purposes other than hedging: (i) interest
rate swaps, implied volatility swaps, caps and floors and interest rate futures to economically hedge its exposure to interest rates; (ii) foreigncurrency forwards, swaps, option contracts, and future contracts to economically hedge its exposure to adverse movements in exchangerates; (iii) credit default swaps to economically hedge exposure to adverse movements in credit; (iv) equity futures, equity index options,interest rate futures, TRRs and equity variance swaps to economically hedge liabilities embedded in certain variable annuity products;(v) swap spreadlocks to economically hedge invested assets against the risk of changes in credit spreads; (vi) interest rate forwards to buyand sell securities to economically hedge its exposure to interest rates; (vii) credit default swaps and TRRs to synthetically createinvestments; (viii) basis swaps to better match the cash flows of assets and related liabilities; (ix) credit default swaps held in relation totrading portfolios; (x) swaptions to hedge interest rate risk; (xi) inflation swaps to reduce risk generated from inflation-indexed liabilities;(xii) covered call options for income generation; (xiii) interest rate lock commitments; (xiv) synthetic GICs; and (xv) equity options toeconomically hedge certain invested assets against adverse changes in equity indices.
The following tables present the amount and location of gains (losses) recognized in income for derivatives that were not designated orqualifying as hedging instruments:
NetDerivative
Gains (Losses)
NetInvestmentIncome(1)
PolicyholderBenefits
and Claims(2)Other
Revenues(3)Other
Expenses(4)
(In millions)
For the Year Ended December 31, 2010:
Interest rate swaps . . . . . . . . . . . . . . . . . . . . $ 622 $ 4 $ 39 $ 172 $—
Interest rate floors . . . . . . . . . . . . . . . . . . . . . 144 — — — —
Interest rate caps . . . . . . . . . . . . . . . . . . . . . (185) — — — —
Interest rate futures . . . . . . . . . . . . . . . . . . . . 77 (4) — (3) —
Equity futures . . . . . . . . . . . . . . . . . . . . . . . . (58) (25) (314) — —
Foreign currency swaps . . . . . . . . . . . . . . . . . 52 — — — —
Foreign currency forwards . . . . . . . . . . . . . . . . 250 55 — — —
Currency futures . . . . . . . . . . . . . . . . . . . . . . (23) — — — —
Currency options . . . . . . . . . . . . . . . . . . . . . . (83) (1) — — (4)
Equity options . . . . . . . . . . . . . . . . . . . . . . . . (683) (16) — — —
Interest rate options . . . . . . . . . . . . . . . . . . . . 25 — — (6) —
Interest rate forwards . . . . . . . . . . . . . . . . . . . 8 — — (74) —
Variance swaps . . . . . . . . . . . . . . . . . . . . . . . (55) — — — —
Credit default swaps . . . . . . . . . . . . . . . . . . . 34 (2) — — —
Total rate of return swaps . . . . . . . . . . . . . . . . 14 — — — —
Total . . . . . . . . . . . . . . . . . . . . . . . . . . . . $ 139 $ 11 $(275) $ 89 $ (4)
For the Year Ended December 31, 2009:
Interest rate swaps . . . . . . . . . . . . . . . . . . . . $(1,700) $ (5) $ (13) $(161) $—
Interest rate floors . . . . . . . . . . . . . . . . . . . . . (907) — — — —
Interest rate caps . . . . . . . . . . . . . . . . . . . . . 33 — — — —
Interest rate futures . . . . . . . . . . . . . . . . . . . . (366) 2 — — —
Equity futures . . . . . . . . . . . . . . . . . . . . . . . . (681) (38) (363) — —
Foreign currency swaps . . . . . . . . . . . . . . . . . (405) — — — —
Foreign currency forwards . . . . . . . . . . . . . . . . (102) (24) — — —
Currency options . . . . . . . . . . . . . . . . . . . . . . (36) (1) — — (3)
Equity options . . . . . . . . . . . . . . . . . . . . . . . . (1,713) (68) — — —
Interest rate options . . . . . . . . . . . . . . . . . . . . (379) — — — —
Interest rate forwards . . . . . . . . . . . . . . . . . . . (7) — — (4) —
F-66 MetLife, Inc.
MetLife, Inc.
Notes to the Consolidated Financial Statements — (Continued)
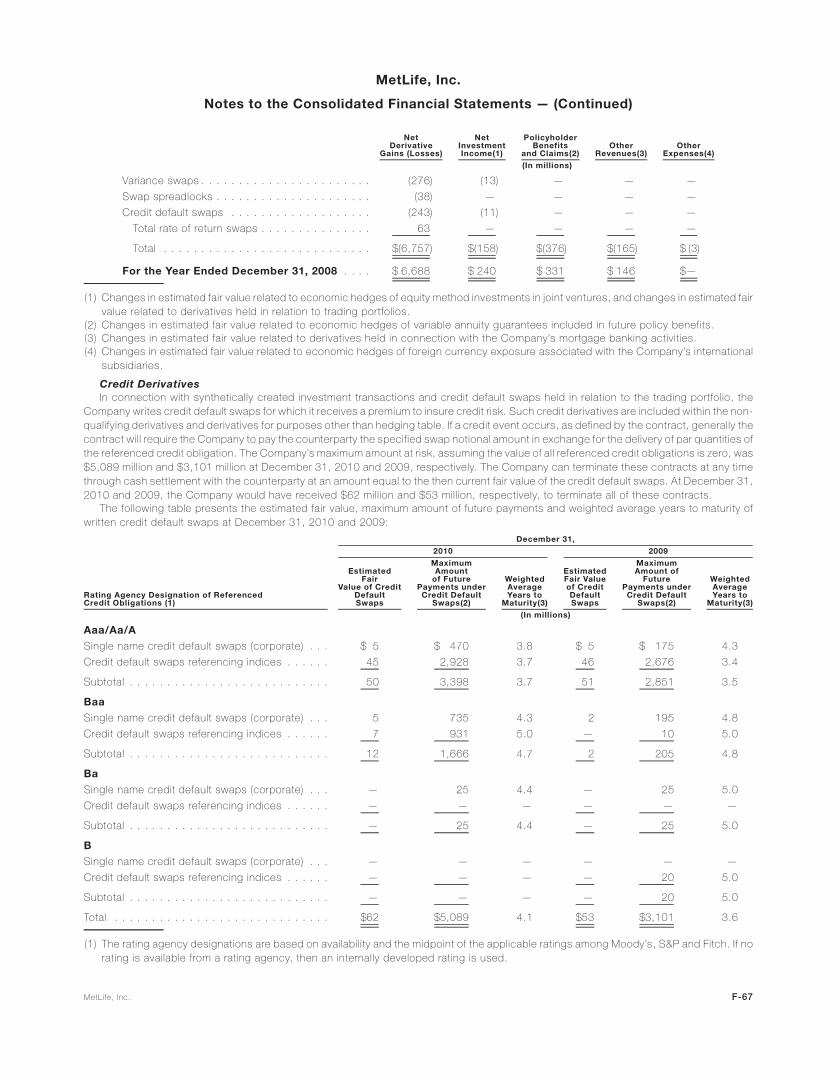
NetDerivative
Gains (Losses)
NetInvestmentIncome(1)
PolicyholderBenefits
and Claims(2)Other
Revenues(3)Other
Expenses(4)
(In millions)
Variance swaps . . . . . . . . . . . . . . . . . . . . . . . (276) (13) — — —
Swap spreadlocks . . . . . . . . . . . . . . . . . . . . . (38) — — — —
Credit default swaps . . . . . . . . . . . . . . . . . . . (243) (11) — — —
Total rate of return swaps . . . . . . . . . . . . . . . 63 — — — —
Total . . . . . . . . . . . . . . . . . . . . . . . . . . . . $(6,757) $(158) $(376) $(165) $ (3)
For the Year Ended December 31, 2008 . . . . $ 6,688 $ 240 $ 331 $ 146 $—
(1) Changes in estimated fair value related to economic hedges of equity method investments in joint ventures, and changes in estimated fairvalue related to derivatives held in relation to trading portfolios.
(2) Changes in estimated fair value related to economic hedges of variable annuity guarantees included in future policy benefits.(3) Changes in estimated fair value related to derivatives held in connection with the Company’s mortgage banking activities.(4) Changes in estimated fair value related to economic hedges of foreign currency exposure associated with the Company’s international
subsidiaries.
Credit DerivativesIn connection with synthetically created investment transactions and credit default swaps held in relation to the trading portfolio, the
Company writes credit default swaps for which it receives a premium to insure credit risk. Such credit derivatives are included within the non-qualifying derivatives and derivatives for purposes other than hedging table. If a credit event occurs, as defined by the contract, generally thecontract will require the Company to pay the counterparty the specified swap notional amount in exchange for the delivery of par quantities ofthe referenced credit obligation. The Company’s maximum amount at risk, assuming the value of all referenced credit obligations is zero, was$5,089 million and $3,101 million at December 31, 2010 and 2009, respectively. The Company can terminate these contracts at any timethrough cash settlement with the counterparty at an amount equal to the then current fair value of the credit default swaps. At December 31,2010 and 2009, the Company would have received $62 million and $53 million, respectively, to terminate all of these contracts.
The following table presents the estimated fair value, maximum amount of future payments and weighted average years to maturity ofwritten credit default swaps at December 31, 2010 and 2009:
Rating Agency Designation of ReferencedCredit Obligations (1)
EstimatedFair
Value of CreditDefaultSwaps
MaximumAmount
of FuturePayments under
Credit DefaultSwaps(2)
WeightedAverageYears to
Maturity(3)
EstimatedFair Valueof CreditDefaultSwaps
MaximumAmount of
FuturePayments under
Credit DefaultSwaps(2)
WeightedAverageYears to
Maturity(3)
2010 2009
December 31,
(In millions)
Aaa/Aa/A
Single name credit default swaps (corporate) . . . $ 5 $ 470 3.8 $ 5 $ 175 4.3
Credit default swaps referencing indices . . . . . . 45 2,928 3.7 46 2,676 3.4
Subtotal . . . . . . . . . . . . . . . . . . . . . . . . . . . 50 3,398 3.7 51 2,851 3.5
Baa
Single name credit default swaps (corporate) . . . 5 735 4.3 2 195 4.8
Credit default swaps referencing indices . . . . . . 7 931 5.0 — 10 5.0
Subtotal . . . . . . . . . . . . . . . . . . . . . . . . . . . 12 1,666 4.7 2 205 4.8
Ba
Single name credit default swaps (corporate) . . . — 25 4.4 — 25 5.0
Credit default swaps referencing indices . . . . . . — — — — — —
Subtotal . . . . . . . . . . . . . . . . . . . . . . . . . . . — 25 4.4 — 25 5.0
B
Single name credit default swaps (corporate) . . . — — — — — —
Credit default swaps referencing indices . . . . . . — — — — 20 5.0
Subtotal . . . . . . . . . . . . . . . . . . . . . . . . . . . — — — — 20 5.0
Total . . . . . . . . . . . . . . . . . . . . . . . . . . . . . $62 $5,089 4.1 $53 $3,101 3.6
(1) The rating agency designations are based on availability and the midpoint of the applicable ratings among Moody’s, S&P and Fitch. If norating is available from a rating agency, then an internally developed rating is used.
F-67MetLife, Inc.
MetLife, Inc.
Notes to the Consolidated Financial Statements — (Continued)

(2) Assumes the value of the referenced credit obligations is zero.(3) The weighted average years to maturity of the credit default swaps is calculated based on weighted average notional amounts.
The Company has also entered into credit default swaps to purchase credit protection on certain of the referenced credit obligations in thetable above. As a result, the maximum amounts of potential future recoveries available to offset the $5,089 million and $3,101 million from thetable above were $120 million and $31 million at December 31, 2010 and 2009, respectively.
Credit Risk on Freestanding DerivativesThe Company may be exposed to credit-related losses in the event of nonperformance by counterparties to derivative financial
instruments. Generally, the current credit exposure of the Company’s derivative contracts is limited to the net positive estimated fair valueof derivative contracts at the reporting date after taking into consideration the existence of netting agreements and any collateral receivedpursuant to credit support annexes.
The Company manages its credit risk related to over-the-counter derivatives by entering into transactions with creditworthy counter-parties, maintaining collateral arrangements and through the use of master agreements that provide for a single net payment to be made byone counterparty to another at each due date and upon termination. Because exchange-traded futures are effected through regulatedexchanges, and positions are marked to market on a daily basis, the Company has minimal exposure to credit-related losses in the event ofnonperformance by counterparties to such derivative instruments. See Note 5 for a description of the impact of credit risk on the valuation ofderivative instruments.
The Company enters into various collateral arrangements, which require both the pledging and accepting of collateral in connection withits derivative instruments. At December 31, 2010 and 2009, the Company was obligated to return cash collateral under its control of$2,625 million and $2,680 million, respectively. This unrestricted cash collateral is included in cash and cash equivalents or in short-terminvestments and the obligation to return it is included in payables for collateral under securities loaned and other transactions in theconsolidated balance sheets. At December 31, 2010 and 2009, the Company had also accepted collateral consisting of various securitieswith a fair market value of $984 million and $221 million, respectively, which were held in separate custodial accounts. The Company ispermitted by contract to sell or repledge this collateral, but at December 31, 2010, none of the collateral had been sold or repledged.
The Company’s collateral arrangements for its over-the-counter derivatives generally require the counterparty in a net liability position,after considering the effect of netting agreements, to pledge collateral when the fair value of that counterparty’s derivatives reaches a pre-determined threshold. Certain of these arrangements also include credit-contingent provisions that provide for a reduction of thesethresholds (on a sliding scale that converges toward zero) in the event of downgrades in the credit ratings of the Company and/or thecounterparty. In addition, certain of the Company’s netting agreements for derivative instruments contain provisions that require the Companyto maintain a specific investment grade credit rating from at least one of the major credit rating agencies. If the Company’s credit ratings wereto fall below that specific investment grade credit rating, it would be in violation of these provisions, and the counterparties to the derivativeinstruments could request immediate payment or demand immediate and ongoing full overnight collateralization on derivative instrumentsthat are in a net liability position after considering the effect of netting agreements.
The following table presents the estimated fair value of the Company’s over-the-counter derivatives that are in a net liability position afterconsidering the effect of netting agreements, together with the estimated fair value and balance sheet location of the collateral pledged. Thetable also presents the incremental collateral that the Company would be required to provide if there was a one notch downgrade in theCompany’s credit rating at the reporting date or if the Company’s credit rating sustained a downgrade to a level that triggered full overnightcollateralization or termination of the derivative position at the reporting date. Derivatives that are not subject to collateral agreements are notincluded in the scope of this table.
Fixed MaturitySecurities(2) Cash(3)
One NotchDowngrade
in theCompany’s
CreditRating
Downgrade in theCompany’s Credit Ratingto a Level that Triggers
Full OvernightCollateralization or
Terminationof the Derivative Position
EstimatedFair Value(1) of
Derivatives in NetLiability Position
EstimatedFair Value of
CollateralProvided:
Fair Value of Incremental CollateralProvided Upon:
(In millions)
December 31, 2010:
Derivatives subject to credit-contingent provisions . . . $1,167 $1,024 $— $99 $231
Derivatives not subject to credit-contingentprovisions . . . . . . . . . . . . . . . . . . . . . . . . . . . . 22 — 43 — —
Total . . . . . . . . . . . . . . . . . . . . . . . . . . . . . . . $1,189 $1,024 $43 $99 $231
December 31, 2009:
Derivatives subject to credit-contingent provisions . . . $1,163 $1,017 $— $90 $218
Derivatives not subject to credit-contingentprovisions . . . . . . . . . . . . . . . . . . . . . . . . . . . . 48 42 — — —
Total . . . . . . . . . . . . . . . . . . . . . . . . . . . . . . . $1,211 $1,059 $— $90 $218
(1) After taking into consideration the existence of netting agreements.(2) Included in fixed maturity securities in the consolidated balance sheets. The counterparties are permitted by contract to sell or repledge
this collateral.
F-68 MetLife, Inc.
MetLife, Inc.
Notes to the Consolidated Financial Statements — (Continued)

(3) Included in premiums, reinsurance and other receivables in the consolidated balance sheets.Without considering the effect of netting agreements, the estimated fair value of the Company’s over-the-counter derivatives with credit-
contingent provisions that were in a gross liability position at December 31, 2010 was $1,742 million. At December 31, 2010, the Companyprovided securities collateral of $1,024 million in connection with these derivatives. In the unlikely event that both: (i) the Company’s creditrating was downgraded to a level that triggers full overnight collateralization or termination of all derivative positions; and (ii) the Company’snetting agreements were deemed to be legally unenforceable, then the additional collateral that the Company would be required to provide toits counterparties in connection with its derivatives in a gross liability position at December 31, 2010 would be $718 million. This amount doesnot consider gross derivative assets of $575 million for which the Company has the contractual right of offset.
The Company also has exchange-traded futures and options, which require the pledging of collateral. At December 31, 2010 and 2009,the Company pledged securities collateral for exchange-traded futures and options of $40 million and $50 million, respectively, which isincluded in fixed maturity securities. The counterparties are permitted by contract to sell or repledge this collateral. At December 31, 2010and 2009, the Company provided cash collateral for exchange-traded futures and options of $662 million and $562 million, respectively,which is included in premiums, reinsurance and other receivables.
Embedded DerivativesThe Company has certain embedded derivatives that are required to be separated from their host contracts and accounted for as
derivatives. These host contracts principally include: variable annuities with guaranteed minimum benefits, including GMWBs, GMABs andcertain GMIBs; ceded reinsurance contracts of guaranteed minimum benefits related to GMABs and certain GMIBs; and funding agreementswith equity or bond indexed crediting rates.
The following table presents the estimated fair value of the Company’s embedded derivatives at:
2010 2009
December 31,
(In millions)
Net embedded derivatives within asset host contracts:
Ceded guaranteed minimum benefits . . . . . . . . . . . . . . . . . . . . . . . . . . . . . . . . . . . . . . . . . $ 185 $ 76
Options embedded in debt or equity securities . . . . . . . . . . . . . . . . . . . . . . . . . . . . . . . . . . (57) (37)
Net embedded derivatives within asset host contracts . . . . . . . . . . . . . . . . . . . . . . . . . . . . $ 128 $ 39
Net embedded derivatives within liability host contracts:
Direct guaranteed minimum benefits . . . . . . . . . . . . . . . . . . . . . . . . . . . . . . . . . . . . . . . . . $2,556 $1,500
Other . . . . . . . . . . . . . . . . . . . . . . . . . . . . . . . . . . . . . . . . . . . . . . . . . . . . . . . . . . . . . 78 5
Net embedded derivatives within liability host contracts . . . . . . . . . . . . . . . . . . . . . . . . . . . $2,634 $1,505
The following table presents changes in estimated fair value related to embedded derivatives:
2010 2009 2008
Years Ended December 31,
(In millions)
Net derivative gains (losses)(1) . . . . . . . . . . . . . . . . . . . . . . . . . . . . . . . . . . . . . . . . $(387) $1,758 $(2,650)
Policyholder benefits and claims . . . . . . . . . . . . . . . . . . . . . . . . . . . . . . . . . . . . . . . $ 8 $ (114) $ 182
(1) The valuation of guaranteed minimum benefits includes an adjustment for nonperformance risk. Included in net derivative gains (losses),in connection with this adjustment, were gains (losses) of ($96) million, ($1,932) million and $2,994 million for the years endedDecember 31, 2010, 2009 and 2008, respectively. Net derivative gains (losses) for the year ended December 31, 2010 included aloss of $955 million relating to a refinement for estimating nonperformance risk in fair value measurements implemented at June 30, 2010.See Note 5.
F-69MetLife, Inc.
MetLife, Inc.
Notes to the Consolidated Financial Statements — (Continued)

5. Fair ValueConsiderable judgment is often required in interpreting market data to develop estimates of fair value and the use of different assumptions
or valuation methodologies may have a material effect on the estimated fair value amounts.
Assets and Liabilities Measured at Fair Value
Recurring Fair Value MeasurementsThe assets and liabilities measured at estimated fair value on a recurring basis, including those items for which the Company has elected
the FVO, were determined as described below. These estimated fair values and their corresponding placement in the fair value hierarchy aresummarized as follows:
Quoted Prices inActive Markets for
Identical Assetsand Liabilities
(Level 1)
Significant OtherObservable Inputs
(Level 2)
SignificantUnobservable
Inputs(Level 3)
TotalEstimated
FairValue
Fair Value Measurements at Reporting Date Using
December 31, 2010
(In millions)
AssetsFixed maturity securities:
U.S. corporate securities . . . . . . . . . . . . . . . . . . . . . . . . . . . . . $ — $ 85,419 $ 7,149 $ 92,568Foreign corporate securities . . . . . . . . . . . . . . . . . . . . . . . . . . . — 62,401 5,777 68,178RMBS . . . . . . . . . . . . . . . . . . . . . . . . . . . . . . . . . . . . . . . . . 274 43,037 1,422 44,733Foreign government securities . . . . . . . . . . . . . . . . . . . . . . . . . 149 40,092 3,159 43,400U.S. Treasury, agency and government guaranteed securities . . . . . 14,602 18,623 79 33,304CMBS . . . . . . . . . . . . . . . . . . . . . . . . . . . . . . . . . . . . . . . . . — 19,664 1,011 20,675ABS . . . . . . . . . . . . . . . . . . . . . . . . . . . . . . . . . . . . . . . . . . — 10,142 4,148 14,290State and political subdivision securities . . . . . . . . . . . . . . . . . . . — 10,083 46 10,129Other fixed maturity securities . . . . . . . . . . . . . . . . . . . . . . . . . — 3 4 7
Total fixed maturity securities . . . . . . . . . . . . . . . . . . . . . . . . . 15,025 289,464 22,795 327,284
Equity securities:Common stock . . . . . . . . . . . . . . . . . . . . . . . . . . . . . . . . . . . 832 1,094 268 2,194Non-redeemable preferred stock . . . . . . . . . . . . . . . . . . . . . . . . — 507 905 1,412
Total equity securities . . . . . . . . . . . . . . . . . . . . . . . . . . . . . 832 1,601 1,173 3,606
Trading and other securities:Actively Traded Securities . . . . . . . . . . . . . . . . . . . . . . . . . . . . — 453 10 463FVO general account securities . . . . . . . . . . . . . . . . . . . . . . . . — 54 77 131FVO contractholder-directed unit-linked investments . . . . . . . . . . . 6,270 10,789 735 17,794FVO securities held by consolidated securitization entities . . . . . . . — 201 — 201
Total trading and other securities . . . . . . . . . . . . . . . . . . . . . . 6,270 11,497 822 18,589Short-term investments(1) . . . . . . . . . . . . . . . . . . . . . . . . . . . . . 3,026 4,681 858 8,565
Mortgage loans:Mortgage loans held by consolidated securitization entities . . . . . . . — 6,840 — 6,840Mortgage loans held-for-sale(2) . . . . . . . . . . . . . . . . . . . . . . . . — 2,486 24 2,510
Total mortgage loans . . . . . . . . . . . . . . . . . . . . . . . . . . . . . . — 9,326 24 9,350MSRs(3) . . . . . . . . . . . . . . . . . . . . . . . . . . . . . . . . . . . . . . . . . — — 950 950Other invested assets — investment funds . . . . . . . . . . . . . . . . . . . 373 121 — 494Derivative assets:(4)
Interest rate contracts . . . . . . . . . . . . . . . . . . . . . . . . . . . . . . . 131 3,583 39 3,753Foreign currency contracts . . . . . . . . . . . . . . . . . . . . . . . . . . . 2 1,711 74 1,787Credit contracts . . . . . . . . . . . . . . . . . . . . . . . . . . . . . . . . . . — 125 50 175Equity market contracts . . . . . . . . . . . . . . . . . . . . . . . . . . . . . . 23 1,757 282 2,062
Total derivative assets . . . . . . . . . . . . . . . . . . . . . . . . . . . . . 156 7,176 445 7,777Net embedded derivatives within asset host contracts(5) . . . . . . . . . — — 185 185Separate account assets(6) . . . . . . . . . . . . . . . . . . . . . . . . . . . . 25,660 155,589 2,088 183,337
Total assets . . . . . . . . . . . . . . . . . . . . . . . . . . . . . . . . . . . . . $51,342 $479,455 $29,340 $560,137
F-70 MetLife, Inc.
MetLife, Inc.
Notes to the Consolidated Financial Statements — (Continued)

Quoted Prices inActive Markets for
Identical Assetsand Liabilities
(Level 1)
Significant OtherObservable Inputs
(Level 2)
SignificantUnobservable
Inputs(Level 3)
TotalEstimated
FairValue
Fair Value Measurements at Reporting Date Using
December 31, 2010
(In millions)
LiabilitiesDerivative liabilities:(4)
Interest rate contracts . . . . . . . . . . . . . . . . . . . . . . . . . . . . . . . $ 35 $ 1,598 $ 125 $ 1,758Foreign currency contracts . . . . . . . . . . . . . . . . . . . . . . . . . . . — 1,372 1 1,373Credit contracts . . . . . . . . . . . . . . . . . . . . . . . . . . . . . . . . . . — 101 6 107Equity market contracts . . . . . . . . . . . . . . . . . . . . . . . . . . . . . . 10 1,174 140 1,324
Total derivative liabilities . . . . . . . . . . . . . . . . . . . . . . . . . . . . 45 4,245 272 4,562Net embedded derivatives within liability host contracts(5) . . . . . . . . . — 11 2,623 2,634Long-term debt of consolidated securitization entities . . . . . . . . . . . . — 6,636 184 6,820Trading liabilities(7) . . . . . . . . . . . . . . . . . . . . . . . . . . . . . . . . . . 46 — — 46
Total liabilities . . . . . . . . . . . . . . . . . . . . . . . . . . . . . . . . . . . . $ 91 $ 10,892 $ 3,079 $ 14,062
See “— Variable Interest Entities” in Note 3 for discussion of CSEs included in the table above.
Quoted Prices inActive Markets for
Identical Assetsand Liabilities
(Level 1)
Significant OtherObservable Inputs
(Level 2)
SignificantUnobservable
Inputs(Level 3)
TotalEstimated
FairValue
Fair Value Measurements at Reporting Date Using
December 31, 2009
(In millions)
AssetsFixed maturity securities:
U.S. corporate securities . . . . . . . . . . . . . . . . . . . . . . . . . . . . . . . . $ — $ 65,493 $ 6,694 $ 72,187Foreign corporate securities . . . . . . . . . . . . . . . . . . . . . . . . . . . . . . — 32,738 5,292 38,030RMBS . . . . . . . . . . . . . . . . . . . . . . . . . . . . . . . . . . . . . . . . . . . . — 42,180 1,840 44,020Foreign government securities . . . . . . . . . . . . . . . . . . . . . . . . . . . . . 306 11,240 401 11,947U.S. Treasury, agency and government guaranteed securities . . . . . . . . 10,951 14,459 37 25,447CMBS . . . . . . . . . . . . . . . . . . . . . . . . . . . . . . . . . . . . . . . . . . . . — 15,483 139 15,622ABS . . . . . . . . . . . . . . . . . . . . . . . . . . . . . . . . . . . . . . . . . . . . . . — 10,450 2,712 13,162State and political subdivision securities . . . . . . . . . . . . . . . . . . . . . . — 7,139 69 7,208Other fixed maturity securities . . . . . . . . . . . . . . . . . . . . . . . . . . . . . — 13 6 19
Total fixed maturity securities . . . . . . . . . . . . . . . . . . . . . . . . . . . . 11,257 199,195 17,190 227,642
Equity securities:Common stock . . . . . . . . . . . . . . . . . . . . . . . . . . . . . . . . . . . . . . . 490 995 136 1,621Non-redeemable preferred stock . . . . . . . . . . . . . . . . . . . . . . . . . . . — 359 1,104 1,463
Total equity securities . . . . . . . . . . . . . . . . . . . . . . . . . . . . . . . . . 490 1,354 1,240 3,084
Trading and other securities . . . . . . . . . . . . . . . . . . . . . . . . . . . . . . . . 1,886 415 83 2,384Short-term investments(1) . . . . . . . . . . . . . . . . . . . . . . . . . . . . . . . . . 5,650 2,500 23 8,173Mortgage loans held-for-sale(2) . . . . . . . . . . . . . . . . . . . . . . . . . . . . . — 2,445 25 2,470MSRs(3) . . . . . . . . . . . . . . . . . . . . . . . . . . . . . . . . . . . . . . . . . . . . — — 878 878Derivative assets(4) . . . . . . . . . . . . . . . . . . . . . . . . . . . . . . . . . . . . . 103 5,600 430 6,133Net embedded derivatives within asset host contracts(5) . . . . . . . . . . . . . — — 76 76Separate account assets(6) . . . . . . . . . . . . . . . . . . . . . . . . . . . . . . . . 17,601 129,545 1,895 149,041
Total assets . . . . . . . . . . . . . . . . . . . . . . . . . . . . . . . . . . . . . . . . . $36,987 $341,054 $21,840 $399,881
LiabilitiesDerivative liabilities(4) . . . . . . . . . . . . . . . . . . . . . . . . . . . . . . . . . . . . $ 51 $ 3,990 $ 74 $ 4,115Net embedded derivatives within liability host contracts(5) . . . . . . . . . . . . — (26) 1,531 1,505Trading liabilities(7) . . . . . . . . . . . . . . . . . . . . . . . . . . . . . . . . . . . . . . 106 — — 106
Total liabilities . . . . . . . . . . . . . . . . . . . . . . . . . . . . . . . . . . . . . . . . $ 157 $ 3,964 $ 1,605 $ 5,726
F-71MetLife, Inc.
MetLife, Inc.
Notes to the Consolidated Financial Statements — (Continued)

(1) Short-term investments as presented in the tables above differ from the amounts presented in the consolidated balance sheets becausecertain short-term investments are not measured at estimated fair value (e.g., time deposits, etc.), and therefore are excluded from thetables presented above.
(2) Mortgage loans held-for-sale as presented in the tables above differ from the amount presented in the consolidated balance sheets asthese tables only include residential mortgage loans held-for-sale measured at estimated fair value on a recurring basis.
(3) MSRs are presented within other invested assets in the consolidated balance sheets.(4) Derivative assets are presented within other invested assets in the consolidated balance sheets and derivative liabilities are presented
within other liabilities in the consolidated balance sheets. The amounts are presented gross in the tables above to reflect the presentationin the consolidated balance sheets, but are presented net for purposes of the rollforward in the Fair Value Measurements Using SignificantUnobservable Inputs (Level 3) tables which follow. At December 31, 2010 and 2009, certain non-derivative hedging instruments of$185 million and $0, respectively, which are carried at amortized cost, are included with the liabilities total in Note 4 but excluded fromderivative liabilities in the tables above as they are not derivative instruments.
(5) Net embedded derivatives within asset host contracts are presented within premiums, reinsurance and other receivables in theconsolidated balance sheets. Net embedded derivatives within liability host contracts are presented primarily within policyholderaccount balances in the consolidated balance sheets. At December 31, 2010, fixed maturity securities and equity securities alsoincluded embedded derivatives of $5 million and ($62) million, respectively. At December 31, 2009, fixed maturity securities and equitysecurities included embedded derivatives of $0 and ($37) million, respectively.
(6) Separate account assets are measured at estimated fair value. Investment performance related to separate account assets is fully offsetby corresponding amounts credited to contractholders whose liability is reflected within separate account liabilities. Separate accountliabilities are set equal to the estimated fair value of separate account assets.
(7) Trading liabilities are presented within other liabilities in the consolidated balance sheets.The methods and assumptions used to estimate the fair value of financial instruments are summarized as follows:Fixed Maturity Securities, Equity Securities, Trading and Other Securities and Short-term InvestmentsWhen available, the estimated fair value of the Company’s fixed maturity, equity and trading and other securities are based on quoted
prices in active markets that are readily and regularly obtainable. Generally, these are the most liquid of the Company’s securities holdings andvaluation of these securities does not involve management judgment.
When quoted prices in active markets are not available, the determination of estimated fair value is based on market standard valuationmethodologies. The market standard valuation methodologies utilized include: discounted cash flow methodologies, matrix pricing or othersimilar techniques. The inputs in applying these market standard valuation methodologies include, but are not limited to: interest rates, creditstanding of the issuer or counterparty, industry sector of the issuer, coupon rate, call provisions, sinking fund requirements, maturity andmanagement’s assumptions regarding estimated duration, liquidity and estimated future cash flows. Accordingly, the estimated fair valuesare based on available market information and management’s judgments about financial instruments.
The significant inputs to the market standard valuation methodologies for certain types of securities with reasonable levels of pricetransparency are inputs that are observable in the market or can be derived principally from or corroborated by observable market data. Suchobservable inputs include benchmarking prices for similar assets in active markets, quoted prices in markets that are not active andobservable yields and spreads in the market.
When observable inputs are not available, the market standard valuation methodologies for determining the estimated fair value of certaintypes of securities that trade infrequently, and therefore have little or no price transparency, rely on inputs that are significant to the estimatedfair value that are not observable in the market or cannot be derived principally from or corroborated by observable market data. Theseunobservable inputs can be based in large part on management judgment or estimation and cannot be supported by reference to marketactivity. Even though unobservable, these inputs are assumed to be consistent with what other market participants would use when pricingsuch securities and are considered appropriate given the circumstances.
The estimated fair value of FVO securities held by CSEs is determined on a basis consistent with the methodologies described herein forfixed maturity securities and equity securities. As discussed in Note 1, the Company adopted new guidance effective January 1, 2010 andconsolidated certain securitization entities that hold securities that have been accounted for under the FVO and classified within trading andother securities.
The use of different methodologies, assumptions and inputs may have a material effect on the estimated fair values of the Company’ssecurities holdings.
Mortgage LoansMortgage loans presented in the tables above consist of commercial mortgage loans held by CSEs and residential mortgage loans
held-for-sale for which the Company has elected the FVO and which are carried at estimated fair value. As discussed in Note 1, the Companyadopted new guidance effective January 1, 2010 and consolidated certain securitization entities that hold commercial mortgage loans. See“— Valuation Techniques and Inputs by Level Within the Three-Level Fair Value Hierarchy by Major Classes of Assets and Liabilities” below fora discussion of the methods and assumptions used to estimate the fair value of these financial instruments.
MSRsAlthough MSRs are not financial instruments, the Company has included them in the preceding table as a result of its election to carry
MSRs at estimated fair value. See “— Valuation Techniques and Inputs by Level Within the Three-Level Fair Value Hierarchy by Major Classesof Assets and Liabilities” below for a discussion of the methods and assumptions used to estimate the fair value of these financial instruments.
F-72 MetLife, Inc.
MetLife, Inc.
Notes to the Consolidated Financial Statements — (Continued)
Other Invested Assets — Investment FundsThe estimated fair value of these investment funds is determined on a basis consistent with the methodologies described herein for trading
and other securities.
DerivativesThe estimated fair value of derivatives is determined through the use of quoted market prices for exchange-traded derivatives and interest
rate forwards to sell certain to be announced securities, or through the use of pricing models for over-the-counter derivatives. Thedetermination of estimated fair value, when quoted market values are not available, is based on market standard valuation methodologies andinputs that are assumed to be consistent with what other market participants would use when pricing the instruments. Derivative valuationscan be affected by changes in interest rates, foreign currency exchange rates, financial indices, credit spreads, default risk (including thecounterparties to the contract), volatility, liquidity and changes in estimates and assumptions used in the pricing models.
The significant inputs to the pricing models for most over-the-counter derivatives are inputs that are observable in the market or can bederived principally from or corroborated by observable market data. Significant inputs that are observable generally include: interest rates,foreign currency exchange rates, interest rate curves, credit curves and volatility. However, certain over-the-counter derivatives may rely oninputs that are significant to the estimated fair value that are not observable in the market or cannot be derived principally from or corroboratedby observable market data. Significant inputs that are unobservable generally include: independent broker quotes, credit correlationassumptions, references to emerging market currencies and inputs that are outside the observable portion of the interest rate curve, creditcurve, volatility or other relevant market measure. These unobservable inputs may involve significant management judgment or estimation.Even though unobservable, these inputs are based on assumptions deemed appropriate given the circumstances and are assumed to beconsistent with what other market participants would use when pricing such instruments.
The credit risk of both the counterparty and the Company are considered in determining the estimated fair value for all over-the-counterderivatives, and any potential credit adjustment is based on the net exposure by counterparty after taking into account the effects of nettingagreements and collateral arrangements. The Company values its derivative positions using the standard swap curve which includes aspread to the risk free rate. This credit spread is appropriate for those parties that execute trades at pricing levels consistent with the standardswap curve. As the Company and its significant derivative counterparties consistently execute trades at such pricing levels, additional creditrisk adjustments are not currently required in the valuation process. The Company’s ability to consistently execute at such pricing levels is inpart due to the netting agreements and collateral arrangements that are in place with all of its significant derivative counterparties. Theevaluation of the requirement to make additional credit risk adjustments is performed by the Company each reporting period.
Most inputs for over-the-counter derivatives are mid market inputs but, in certain cases, bid level inputs are used when they are deemedmore representative of exit value. Market liquidity, as well as the use of different methodologies, assumptions and inputs, may have a materialeffect on the estimated fair values of the Company’s derivatives and could materially affect net income.
Embedded Derivatives Within Asset and Liability Host ContractsEmbedded derivatives principally include certain direct, assumed and ceded variable annuity guarantees and equity or bond indexed
crediting rates within certain funding agreements. Embedded derivatives are recorded in the consolidated financial statements at estimatedfair value with changes in estimated fair value reported in net income.
The Company issues certain variable annuity products with guaranteed minimum benefit guarantees. GMWBs, GMABs and certain GMIBsare embedded derivatives, which are measured at estimated fair value separately from the host variable annuity contract, with changes inestimated fair value reported in net derivative gains (losses). These embedded derivatives are classified within policyholder account balancesin the consolidated balance sheets.
The fair value of these guarantees is estimated using the present value of future benefits minus the present value of future fees usingactuarial and capital market assumptions related to the projected cash flows over the expected lives of the contracts. A risk neutral valuationmethodology is used under which the cash flows from the guarantees are projected under multiple capital market scenarios using observablerisk free rates, currency exchange rates and observable and estimated implied volatilities.
The valuation of these guarantee liabilities includes adjustments for nonperformance risk and for a risk margin related to non-capital marketinputs. Both of these adjustments are captured as components of the spread which, when combined with the risk free rate, is used todiscount the cash flows of the liability for purposes of determining its fair value.
The nonperformance adjustment is determined by taking into consideration publicly available information relating to spreads in thesecondary market for the Holding Company’s debt, including related credit default swaps. These observable spreads are then adjusted, asnecessary, to reflect the priority of these liabilities and the claims paying ability of the issuing insurance subsidiaries compared to the HoldingCompany.
Risk margins are established to capture the non-capital market risks of the instrument which represent the additional compensation amarket participant would require to assume the risks related to the uncertainties of such actuarial assumptions as annuitization, premiumpersistency, partial withdrawal and surrenders. The establishment of risk margins requires the use of significant management judgment,including assumptions of the amount and cost of capital needed to cover the guarantees. These guarantees may be more costly thanexpected in volatile or declining equity markets. Market conditions including, but not limited to, changes in interest rates, equity indices,market volatility and foreign currency exchange rates; changes in nonperformance risk; and variations in actuarial assumptions regardingpolicyholder behavior, mortality and risk margins related to non-capital market inputs may result in significant fluctuations in the estimated fairvalue of the guarantees that could materially affect net income.
The Company ceded the risk associated with certain of the GMIB and GMAB described above. These reinsurance contracts containembedded derivatives which are included in premiums, reinsurance and other receivables in the consolidated balance sheets with changesin estimated fair value reported in net derivative gains (losses) or policyholder benefits and claims depending on the statement of operations
F-73MetLife, Inc.
MetLife, Inc.
Notes to the Consolidated Financial Statements — (Continued)
classification of the direct risk. The value of the embedded derivatives on the ceded risk is determined using a methodology consistent withthat described previously for the guarantees directly written by the Company.
As part of its regular review of critical accounting estimates, the Company periodically assesses inputs for estimating nonperformance risk(commonly referred to as “own credit”) in fair value measurements. During the second quarter of 2010, the Company completed a study thataggregated and evaluated data, including historical recovery rates of insurance companies, as well as policyholder behavior observed overthe past two years as the recent financial crisis evolved. As a result, at the end of the second quarter of 2010, the Company refined the way inwhich its insurance subsidiaries incorporate expected recovery rates into the nonperformance risk adjustment for purposes of estimating thefair value of investment-type contracts and embedded derivatives within insurance contracts. The Company recognized a loss of $577 mil-lion, net of DAC and income tax, relating to implementing the refinement at June 30, 2010. The refinement reduced both basic and diluted netincome available to MetLife, Inc.’s common shareholders per common share by $0.65 for the year ended December 31, 2010.
The estimated fair value of the embedded derivatives within funds withheld related to certain ceded reinsurance is determined based onthe change in estimated fair value of the underlying assets held by the Company in a reference portfolio backing the funds withheld liability.The estimated fair value of the underlying assets is determined as described above in “— Fixed Maturity Securities, Equity Securities, Tradingand Other Securities and Short-term Investments.” The estimated fair value of these embedded derivatives is included, along with their fundswithheld hosts, in other liabilities in the consolidated balance sheets with changes in estimated fair value recorded in net derivative gains(losses). Changes in the credit spreads on the underlying assets, interest rates and market volatility may result in significant fluctuations in theestimated fair value of these embedded derivatives that could materially affect net income.
The estimated fair value of the embedded equity and bond indexed derivatives contained in certain funding agreements is determinedusing market standard swap valuation models and observable market inputs, including an adjustment for nonperformance risk. The estimatedfair value of these embedded derivatives are included, along with their funding agreements host, within policyholder account balances withchanges in estimated fair value recorded in net derivative gains (losses). Changes in equity and bond indices, interest rates and theCompany’s credit standing may result in significant fluctuations in the estimated fair value of these embedded derivatives that could materiallyaffect net income.
Separate Account AssetsSeparate account assets are carried at estimated fair value and reported as a summarized total on the consolidated balance sheets. The
estimated fair value of separate account assets is based on the estimated fair value of the underlying assets owned by the separate account.Assets within the Company’s separate accounts include: mutual funds, fixed maturity securities, equity securities, mortgage loans,derivatives, hedge funds, other limited partnership interests, short-term investments and cash and cash equivalents. See “— ValuationTechniques and Inputs by Level Within the Three-Level Fair Value Hierarchy by Major Classes of Assets and Liabilities” below for a discussionof the methods and assumptions used to estimate the fair value of these financial instruments.
Long-term Debt of CSEsThe Company has elected the FVO for the long-term debt of CSEs, which are carried at estimated fair value. See “— Valuation Techniques
and Inputs by Level Within the Three-Level Fair Value Hierarchy by Major Classes of Assets and Liabilities” below for a discussion of themethods and assumptions used to estimate the fair value of these financial instruments.
Trading LiabilitiesTrading liabilities are recorded at estimated fair value with subsequent changes in estimated fair value recognized in net investment
income. The estimated fair value of trading liabilities is determined on a basis consistent with the methodologies described in “— FixedMaturity Securities, Equity Securities and Trading and Other Securities.”
Valuation Techniques and Inputs by Level Within the Three-Level Fair Value Hierarchy by Major Classes of Assets andLiabilities
A description of the significant valuation techniques and inputs to the determination of estimated fair value for the more significant assetand liability classes measured at fair value on a recurring basis is as follows:
The Company determines the estimated fair value of its investments using primarily the market approach and the income approach. Theuse of quoted prices for identical assets and matrix pricing or other similar techniques are examples of market approaches, while the use ofdiscounted cash flow methodologies is an example of the income approach. The Company attempts to maximize the use of observable inputsand minimize the use of unobservable inputs in selecting whether the market or income approach is used.
While certain investments have been classified as Level 1 from the use of unadjusted quoted prices for identical investments supported byhigh volumes of trading activity and narrow bid/ask spreads, most investments have been classified as Level 2 because the significant inputsused to measure the fair value on a recurring basis of the same or similar investment are market observable or can be corroborated usingmarket observable information for the full term of the investment. Level 3 investments include those where estimated fair values are based onsignificant unobservable inputs that are supported by little or no market activity and may reflect our own assumptions about what factorsmarket participants would use in pricing these investments.
Level 1 Measurements:
Fixed Maturity Securities, Equity Securities, Trading and Other Securities and Short-term InvestmentsThese securities are comprised of U.S. Treasury, agency and government guaranteed fixed maturity securities, foreign government
securities, RMBS — principally to-be-announced securities, exchange traded common stock, exchange traded mutual fund interestsincluded in equity securities, exchange traded registered mutual fund interests included in trading and other securities and short-term moneymarket securities, including U.S. Treasury bills. Valuation of these securities is based on unadjusted quoted prices in active markets that arereadily and
F-74 MetLife, Inc.
MetLife, Inc.
Notes to the Consolidated Financial Statements — (Continued)

regularly available. Contractholder-directed unit-linked investments reported within trading and other securities include certain registeredmutual fund interests priced using daily NAV provided by the fund managers.
Derivative Assets and Derivative LiabilitiesThese assets and liabilities are comprised of exchange-traded derivatives, as well as interest rate forwards to sell certain to be announced
securities. Valuation of these assets and liabilities is based on unadjusted quoted prices in active markets that are readily and regularlyavailable.
Separate Account AssetsThese assets are comprised of securities that are similar in nature to the fixed maturity securities, equity securities and short-term
investments referred to above; and certain exchange-traded derivatives, including financial futures and owned options. Valuation is based onunadjusted quoted prices in active markets that are readily and regularly available.
Level 2 Measurements:
Fixed Maturity Securities, Equity Securities, Trading and Other Securities and Short-term InvestmentsThis level includes fixed maturity securities and equity securities priced principally by independent pricing services using observable
inputs. Trading and other securities and short-term investments within this level are of a similar nature and class to the Level 2 securitiesdescribed below; accordingly, the valuation techniques and significant market standard observable inputs used in their valuation are alsosimilar to those described below. Contractholder-directed unit-linked investments reported within trading and other securities include certainmutual fund interests without readily determinable fair values given prices are not published publicly. Valuation of these mutual funds is basedupon quoted prices or reported NAV provided by the fund managers, which were based on observable inputs.
U.S. corporate and foreign corporate securities. These securities are principally valued using the market and income approaches.Valuation is based primarily on quoted prices in markets that are not active, or using matrix pricing or other similar techniques that usestandard market observable inputs such as a benchmark yields, spreads off benchmark yields, new issuances, issuer rating, duration,and trades of identical or comparable securities. Investment grade privately placed securities are valued using a discounted cash flowmethodologies using standard market observable inputs, and inputs derived from, or corroborated by, market observable data includingmarket yield curve, duration, call provisions, observable prices and spreads for similar publicly traded or privately traded issues thatincorporate the credit quality and industry sector of the issuer. This level also includes certain below investment grade privately placedfixed maturity securities priced by independent pricing services that use observable inputs.Structured securities comprised of RMBS, CMBS and ABS. These securities are principally valued using the market approach.Valuation is based primarily on matrix pricing or other similar techniques using standard market inputs including spreads for activelytraded securities, spreads off benchmark yields, expected prepayment speeds and volumes, current and forecasted loss severity,rating, weighted average coupon, weighted average maturity, average delinquency rates, geographic region, debt-service coverageratios and issuance-specific information including, but not limited to: collateral type, payment terms of the underlying assets, paymentpriority within the tranche, structure of the security, deal performance and vintage of loans.U.S. Treasury, agency and government guaranteed securities. These securities are principally valued using the market approach.Valuation is based primarily on quoted prices in markets that are not active, or using matrix pricing or other similar techniques usingstandard market observable inputs such as benchmark U.S. Treasury yield curve, the spread off the U.S. Treasury curve for the identicalsecurity and comparable securities that are actively traded.Foreign government and state and political subdivision securities. These securities are principally valued using the market approach.Valuation is based primarily on matrix pricing or other similar techniques using standard market observable inputs including benchmarkU.S. Treasury or other yields, issuer ratings, broker-dealer quotes, issuer spreads and reported trades of similar securities, includingthose within the same sub-sector or with a similar maturity or credit rating.Common and non-redeemable preferred stock. These securities are principally valued using the market approach where marketquotes are available but are not considered actively traded. Valuation is based principally on observable inputs including quoted prices inmarkets that are not considered active.
Mortgage Loans Held by CSEsThese commercial mortgage loans are principally valued using the market approach. The principal market for these commercial loan
portfolios is the securitization market. The Company uses the quoted securitization market price of the obligations of the CSEs to determinethe estimated fair value of these commercial loan portfolios. These market prices are determined principally by independent pricing servicesusing observable inputs.
Mortgage Loans Held-For-SaleResidential mortgage loans held-for-sale are principally valued using the market approach and valued primarily using readily available
observable pricing for similar loans or securities backed by similar loans. The unobservable adjustments to such prices are insignificant.
Derivative Assets and Derivative LiabilitiesThis level includes all types of derivative instruments utilized by the Company with the exception of exchange-traded derivatives and
interest rate forwards to sell certain to be announced securities included within Level 1 and those derivative instruments with unobservableinputs as described in Level 3. These derivatives are principally valued using an income approach.
Interest rate contracts.Non-option-based — Valuations are based on present value techniques, which utilize significant inputs that may include the swap yield
curve, LIBOR basis curves, and repurchase rates.
F-75MetLife, Inc.
MetLife, Inc.
Notes to the Consolidated Financial Statements — (Continued)

Option-based — Valuations are based on option pricing models, which utilize significant inputs that may include the swap yield curve,LIBOR basis curves, and interest rate volatility.
Foreign currency contracts.Non-option-based — Valuations are based on present value techniques, which utilize significant inputs that may include the swap yield
curve, LIBOR basis curves, currency spot rates, and cross currency basis curves.Option-based — Valuations are based on option pricing models, which utilize significant inputs that may include the swap yield curve,
LIBOR basis curves, currency spot rates, cross currency basis curves, and currency volatility.
Credit contracts.Non-option-based — Valuations are based on present value techniques, which utilize significant inputs that may include the swap yield
curve, credit curves, and recovery rates.
Equity market contracts.Non-option-based — Valuations are based on present value techniques, which utilize significant inputs that may include the swap yield
curve, spot equity index levels, and dividend yield curves.Option-based — Valuations are based on option pricing models, which utilize significant inputs that may include the swap yield curve,
spot equity index levels, dividend yield curves, and equity volatility.
Embedded Derivatives Contained in Certain Funding AgreementsThese derivatives are principally valued using an income approach. Valuations are based on present value techniques, which utilize
significant inputs that may include the swap yield curve and the spot equity and bond index level.
Separate Account AssetsThese assets are comprised of investments that are similar in nature to the fixed maturity securities, equity securities, short-term
investments and derivatives referred to above. Also included are certain mutual funds and hedge funds without readily determinable fairvalues given prices are not published publicly. Valuation of the mutual funds and hedge funds is based upon quoted prices or reported NAVprovided by the fund managers.
Long-term Debt of CSEsThe estimated fair value of the long-term debt of the Company’s CSEs is based on quoted prices when traded as assets in active markets
or, if not available, based on market standard valuation methodologies, consistent with the Company’s methods and assumptions used toestimate the fair value of comparable fixed maturity securities.
Level 3 Measurements:In general, investments classified within Level 3 use many of the same valuation techniques and inputs as described above. However, if
key inputs are unobservable, or if the investments are less liquid and there is very limited trading activity, the investments are generallyclassified as Level 3. The use of independent non-binding broker quotations to value investments generally indicates there is a lack of liquidityor the general lack of transparency in the process to develop the valuation estimates generally causing these investments to be classified inLevel 3.
Fixed Maturity Securities, Equity Securities, Trading and Other Securities and Short-term InvestmentsThis level includes fixed maturity securities and equity securities priced principally by independent broker quotations or market standard
valuation methodologies using inputs that are not market observable or cannot be derived principally from or corroborated by observablemarket data. Trading and other securities and short-term investments within this level are of a similar nature and class to the Level 3 securitiesdescribed below; accordingly, the valuation techniques and significant market standard observable inputs used in their valuation are alsosimilar to those described below.
U.S. corporate and foreign corporate securities. These securities, including financial services industry hybrid securities classifiedwithin fixed maturity securities, are principally valued using the market and income approaches. Valuations are based primarily on matrixpricing or other similar techniques that utilize unobservable inputs or cannot be derived principally from, or corroborated by, observablemarket data, including illiquidity premiums and spread adjustments to reflect industry trends or specific credit-related issues. Valuationsmay be based on independent non-binding broker quotations. Generally, below investment grade privately placed or distressedsecurities included in this level are valued using discounted cash flow methodologies which rely upon significant, unobservable inputsand inputs that cannot be derived principally from, or corroborated by, observable market data.Structured securities comprised of RMBS, CMBS and ABS. These securities are principally valued using the market approach.Valuation is based primarily on matrix pricing or other similar techniques that utilize inputs that are unobservable or cannot be derivedprincipally from, or corroborated by, observable market data, or are based on independent non-binding broker quotations. Belowinvestment grade securities and ABS supported by sub-prime mortgage loans included in this level are valued based on inputs includingquoted prices for identical or similar securities that are less liquid and based on lower levels of trading activity than securities classified inLevel 2, and certain of these securities are valued based on independent non-binding broker quotations.Foreign government and state and political subdivision securities. These securities are principally valued using the market approach.Valuation is based primarily on matrix pricing or other similar techniques, however these securities are less liquid and certain of the inputsare based on very limited trading activity.Common and non-redeemable preferred stock. These securities, including privately held securities and financial services industryhybrid securities classified within equity securities, are principally valued using the market and income approaches. Valuations are basedprimarily on matrix pricing or other similar techniques using inputs such as comparable credit rating and issuance structure. Equitysecurities valuations determined with discounted cash flow methodologies use inputs such as earnings multiples based on comparable
F-76 MetLife, Inc.
MetLife, Inc.
Notes to the Consolidated Financial Statements — (Continued)

public companies, and industry-specific non-earnings based multiples. Certain of these securities are valued based on independentnon-binding broker quotations.
Mortgage LoansMortgage loans include residential mortgage loans held-for-sale for which pricing for similar loans or securities backed by similar loans is
not observable and the estimated fair value is determined using unobservable independent broker quotations or valuation models.
MSRsMSRs, which are valued using an income approach, are carried at estimated fair value and have multiple significant unobservable inputs
including assumptions regarding estimates of discount rates, loan prepayments and servicing costs. Sales of MSRs tend to occur in privatetransactions where the precise terms and conditions of the sales are typically not readily available and observable market valuations arelimited. As such, the Company relies primarily on a discounted cash flow model to estimate the fair value of the MSRs. The model requiresinputs such as type of loan (fixed vs. variable and agency vs. other), age of loan, loan interest rates and current market interest rates that aregenerally observable. The model also requires the use of unobservable inputs including assumptions regarding estimates of discount rates,loan prepayments and servicing costs.
Derivative Assets and Derivative LiabilitiesThese derivatives are principally valued using an income approach. Valuations of non-option-based derivatives utilize present value
techniques, whereas valuations of option-based derivatives utilize option pricing models. These valuation methodologies generally use thesame inputs as described in the corresponding sections above for Level 2 measurements of derivatives. However, these derivatives result inLevel 3 classification because one or more of the significant inputs are not observable in the market or cannot be derived principally from, orcorroborated by, observable market data.
Interest rate contracts.Non-option-based — Significant unobservable inputs may include pull through rates on interest rate lock commitments and the
extrapolation beyond observable limits of the swap yield curve and LIBOR basis curves.Option-based — Significant unobservable inputs may include the extrapolation beyond observable limits of the swap yield curve, LIBOR
basis curves, and interest rate volatility.
Foreign currency contracts.Non-option-based — Significant unobservable inputs may include the extrapolation beyond observable limits of the swap yield curve,
LIBOR basis curves and cross currency basis curves. Certain of these derivatives are valued based on independent non-binding brokerquotations.
Option-based — Significant unobservable inputs may include currency correlation and the extrapolation beyond observable limits of theswap yield curve, LIBOR basis curves, cross currency basis curves and currency volatility.
Credit contracts.Non-option-based — Significant unobservable inputs may include credit correlation, repurchase rates, and the extrapolation beyond
observable limits of the swap yield curve and credit curves. Certain of these derivatives are valued based on independent non-binding brokerquotations.
Equity market contracts.Non-option-based — Significant unobservable inputs may include the extrapolation beyond observable limits of dividend yield curves.Option-based — Significant unobservable inputs may include the extrapolation beyond observable limits of dividend yield curves and
equity volatility. Certain of these derivatives are valued based on independent non-binding broker quotations.
Guaranteed Minimum Benefit GuaranteesThese embedded derivatives are principally valued using an income approach. Valuations are based on option pricing techniques, which
utilize significant inputs that may include swap yield curve, currency exchange rates and implied volatilities. These embedded derivativesresult in Level 3 classification because one or more of the significant inputs are not observable in the market or cannot be derived principallyfrom, or corroborated by, observable market data. Significant unobservable inputs generally include: the extrapolation beyond observablelimits of the swap yield curve and implied volatilities, actuarial assumptions for policyholder behavior and mortality and the potential variabilityin policyholder behavior and mortality, nonperformance risk and cost of capital for purposes of calculating the risk margin.
Reinsurance Ceded on Certain Guaranteed Minimum Benefit GuaranteesThese embedded derivatives are principally valued using an income approach. Valuations are based on option pricing techniques, which
utilize significant inputs that may include swap yield curve, currency exchange rates and implied volatilities. These embedded derivativesresult in Level 3 classification because one or more of the significant inputs are not observable in the market or cannot be derived principallyfrom, or corroborated by, observable market data. Significant unobservable inputs generally include: the extrapolation beyond observablelimits of the swap yield curve and implied volatilities, actuarial assumptions for policyholder behavior and mortality and the potential variabilityin policyholder behavior and mortality, counterparty credit spreads and cost of capital for purposes of calculating the risk margin.
Embedded Derivatives Within Funds Withheld Related to Certain Ceded ReinsuranceThese derivatives are principally valued using an income approach. Valuations are based on present value techniques, which utilize
significant inputs that may include the swap yield curve and the fair value of assets within the reference portfolio. These embedded derivativesresult in Level 3 classification because one or more of the significant inputs are not observable in the market or cannot be derived principallyfrom, or corroborated by, observable market data. Significant unobservable inputs generally include: the fair value of certain assets within the
F-77MetLife, Inc.
MetLife, Inc.
Notes to the Consolidated Financial Statements — (Continued)

reference portfolio which are not observable in the market and cannot be derived principally from, or corroborated by, observable marketdata.
Separate Account AssetsThese assets are comprised of investments that are similar in nature to the fixed maturity securities, equity securities and derivatives
referred to above. Separate account assets within this level also include mortgage loans and other limited partnership interests. Theestimated fair value of mortgage loans is determined by discounting expected future cash flows, using current interest rates for similar loanswith similar credit risk. Other limited partnership interests are valued giving consideration to the value of the underlying holdings of thepartnerships and by applying a premium or discount, if appropriate, for factors such as liquidity, bid/ask spreads, the performance record ofthe fund manager or other relevant variables which may impact the exit value of the particular partnership interest.
Long-term Debt of CSEsThe estimated fair value of the long-term debt of the Company’s CSEs are priced principally through independent broker quotations or
market standard valuation methodologies using inputs that are not market observable or cannot be derived from or corroborated byobservable market data.
Transfers between Levels 1 and 2:During the year ended December 31, 2010, transfers between Levels 1 and 2 were not significant.
Transfers into or out of Level 3:Overall, transfers into and/or out of Level 3 are attributable to a change in the observability of inputs. Assets and liabilities are transferred
into Level 3 when a significant input cannot be corroborated with market observable data. This occurs when market activity decreasessignificantly and underlying inputs cannot be observed, current prices are not available, and/or when there are significant variances in quotedprices, thereby affecting transparency. Assets and liabilities are transferred out of Level 3 when circumstances change such that a significantinput can be corroborated with market observable data. This may be due to a significant increase in market activity, a specific event, or one ormore significant input(s) becoming observable. Transfers into and/or out of any level are assumed to occur at the beginning of the period.Significant transfers into and/or out of Level 3 assets and liabilities for the year ended December 31, 2010 are summarized below.
During the year ended December 31, 2010, fixed maturity securities transfers into Level 3 of $1,736 million and separate account assetstransfers into Level 3 of $46 million, resulted primarily from current market conditions characterized by a lack of trading activity, decreasedliquidity and credit ratings downgrades (e.g., from investment grade to below investment grade). These current market conditions haveresulted in decreased transparency of valuations and an increased use of broker quotations and unobservable inputs to determine estimatedfair value principally for certain private placements included in U.S. and foreign corporate securities and certain CMBS.
During the year ended December 31, 2010, fixed maturity securities transfers out of Level 3 of $1,683 million and separate account assetstransfers out of Level 3 of $234 million, resulted primarily from increased transparency of both new issuances that subsequent to issuanceand establishment of trading activity, became priced by independent pricing services and existing issuances that, over time, the Companywas able to corroborate pricing received from independent pricing services with observable inputs or increases in market activity andupgraded credit ratings primarily for certain U.S. and foreign corporate securities, RMBS and ABS.
F-78 MetLife, Inc.
MetLife, Inc.
Notes to the Consolidated Financial Statements — (Continued)

A rollforward of all assets and liabilities measured at estimated fair value on a recurring basis using significant unobservable (Level 3) inputsis as follows:
Balance,January 1, Earnings(1), (2)
OtherComprehensiveIncome (Loss)
Purchases,Sales,
Issuances andSettlements(3)
Transfer IntoLevel 3 (4)
Transfer Outof Level 3 (4)
Balance,December 31,
Total Realized/UnrealizedGains (Losses) included in:
Fair Value Measurements Using Significant Unobservable Inputs (Level 3)
(In millions)
Year Ended December 31, 2010:
Assets:
Fixed maturity securities:
U.S. corporate securities . . . . . . . . . . . . . . . . . . . . $ 6,694 $ 9 $ 277 $ (415) $ 898 $ (314) $ 7,149
Foreign corporate securities . . . . . . . . . . . . . . . . . . . 5,292 (19) 323 304 501 (624) 5,777
RMBS . . . . . . . . . . . . . . . . . . . . . . . . . . . . . . . . 1,840 27 63 (303) 87 (292) 1,422
Foreign government securities . . . . . . . . . . . . . . . . . 401 1 (93) 2,965 40 (155) 3,159
U.S. Treasury, agency and government guaranteedsecurities . . . . . . . . . . . . . . . . . . . . . . . . . . . . . 37 — 2 (6) 46 — 79
CMBS . . . . . . . . . . . . . . . . . . . . . . . . . . . . . . . . 139 (5) 89 684 132 (28) 1,011
ABS . . . . . . . . . . . . . . . . . . . . . . . . . . . . . . . . . 2,712 (53) 411 1,286 32 (240) 4,148
State and political subdivision securities . . . . . . . . . . . 69 — (2) 9 — (30) 46
Other fixed maturity securities . . . . . . . . . . . . . . . . . . 6 1 2 (5) — — 4
Total fixed maturity securities . . . . . . . . . . . . . . . . . $17,190 $ (39) $1,072 $4,519 $1,736 $(1,683) $22,795
Equity securities:
Common stock . . . . . . . . . . . . . . . . . . . . . . . . . . $ 136 $ 5 $ 7 $ 128 $ 1 $ (9) $ 268
Non-redeemable preferred stock . . . . . . . . . . . . . . . . 1,104 46 12 (250) — (7) 905
Total equity securities . . . . . . . . . . . . . . . . . . . . . $ 1,240 $ 51 $ 19 $ (122) $ 1 $ (16) $ 1,173
Trading and other securities:
Actively Traded Securities . . . . . . . . . . . . . . . . . . . . $ 32 $ — $ — $ (22) $ — $ — $ 10
FVO general account securities . . . . . . . . . . . . . . . . . 51 8 — (1) 37 (18) 77
FVO contractholder-directed unit-linked investments . . . . — (15) — 750 — — 735
Total trading and other securities . . . . . . . . . . . . . . $ 83 $ (7) $ — $ 727 $ 37 $ (18) $ 822
Short-term investments . . . . . . . . . . . . . . . . . . . . . . . $ 23 $ 2 $ (9) $ 842 $ — $ — $ 858
Mortgage loans held-for-sale . . . . . . . . . . . . . . . . . . . $ 25 $ (2) $ — $ — $ 10 $ (9) $ 24
MSRs(5), (6) . . . . . . . . . . . . . . . . . . . . . . . . . . . . . $ 878 $ (79) $ — $ 151 $ — $ — $ 950
Net derivatives:(7)
Interest rate contracts . . . . . . . . . . . . . . . . . . . . . . $ 7 $ 37 $ (107) $ (23) $ — $ — $ (86)
Foreign currency contracts . . . . . . . . . . . . . . . . . . . 108 42 2 (57) — (22) 73
Credit contracts . . . . . . . . . . . . . . . . . . . . . . . . . . 42 4 13 (15) — — 44
Equity market contracts . . . . . . . . . . . . . . . . . . . . . 199 (88) 11 20 — — 142
Total net derivatives . . . . . . . . . . . . . . . . . . . . . . $ 356 $ (5) $ (81) $ (75) $ — $ (22) $ 173
Separate account assets(8) . . . . . . . . . . . . . . . . . . . . $ 1,895 $139 $ — $ 242 $ 46 $ (234) $ 2,088
Balance,January 1, Earnings(1), (2)
OtherComprehensiveIncome (Loss)
Purchases,Sales,
Issuances andSettlements(3)
Transfer IntoLevel 3(4)
Transfer Outof Level 3(4)
Balance,December 31,
Total Realized/Unrealized(Gains) Losses included in:
Fair Value Measurements Using Significant Unobservable Inputs (Level 3)
(In millions)
Year Ended December 31, 2010:
Liabilities:
Net embedded derivatives(9) . . . . . . . . . . . . . . . . . . . . $1,455 $335 $226 $422 $— $— $2,438
Long-term debt of consolidated securitization entities(10) . . $ — $ (48) $ — $232 $— $— $ 184
Trading liabilities . . . . . . . . . . . . . . . . . . . . . . . . . . . $ — $ — $ — $ — $— $— $ —
F-79MetLife, Inc.
MetLife, Inc.
Notes to the Consolidated Financial Statements — (Continued)

Balance,January 1, Earnings(1), (2)
OtherComprehensiveIncome (Loss)
Purchases,Sales,
Issuances andSettlements(3)
Transfer Intoand/or Out
of Level 3 (4)Balance,
December 31,
Total Realized/UnrealizedGains (Losses) included in:
Fair Value Measurements Using Significant Unobservable Inputs (Level 3)
(In millions)
Year Ended December 31, 2009:
Assets:
Fixed maturity securities:
U.S. corporate securities . . . . . . . . . . . . . . . . . . . . . . . . . . . . $ 7,498 $(429) $ 939 $(1,358) $ 44 $ 6,694
Foreign corporate securities . . . . . . . . . . . . . . . . . . . . . . . . . . 5,944 (330) 1,517 (511) (1,328) 5,292
RMBS . . . . . . . . . . . . . . . . . . . . . . . . . . . . . . . . . . . . . . . . 595 31 105 1,199 (90) 1,840
Foreign government securities . . . . . . . . . . . . . . . . . . . . . . . . . 408 (40) 54 6 (27) 401
U.S. Treasury, agency and government guaranteed securities . . . . . . 88 — (1) (29) (21) 37
CMBS . . . . . . . . . . . . . . . . . . . . . . . . . . . . . . . . . . . . . . . 260 (36) 53 (44) (94) 139
ABS . . . . . . . . . . . . . . . . . . . . . . . . . . . . . . . . . . . . . . . . . 2,452 (121) 578 (212) 15 2,712
State and political subdivision securities . . . . . . . . . . . . . . . . . . . 123 — 7 (19) (42) 69
Other fixed maturity securities . . . . . . . . . . . . . . . . . . . . . . . . . 40 1 — (35) — 6
Total fixed maturity securities . . . . . . . . . . . . . . . . . . . . . . . . $17,408 $(924) $3,252 $(1,003) $(1,543) $17,190
Equity securities:
Common stock . . . . . . . . . . . . . . . . . . . . . . . . . . . . . . . . . . $ 105 $ (2) $ 6 $ 23 $ 4 $ 136
Non-redeemable preferred stock . . . . . . . . . . . . . . . . . . . . . . . 1,274 (357) 486 (254) (45) 1,104
Total equity securities . . . . . . . . . . . . . . . . . . . . . . . . . . . . . $ 1,379 $(359) $ 492 $ (231) $ (41) $ 1,240
Trading and other securities . . . . . . . . . . . . . . . . . . . . . . . . . . . . $ 175 $ 16 $ — $ (108) $ — $ 83
Short-term investments . . . . . . . . . . . . . . . . . . . . . . . . . . . . . . $ 100 $ (21) $ — $ (51) $ (5) $ 23
Mortgage loans held-for-sale . . . . . . . . . . . . . . . . . . . . . . . . . . . $ 177 $ (3) $ — $ 2 $ (151) $ 25
MSRs(5), (6) . . . . . . . . . . . . . . . . . . . . . . . . . . . . . . . . . . . . . $ 191 $ 172 $ — $ 515 $ — $ 878
Net derivatives(7) . . . . . . . . . . . . . . . . . . . . . . . . . . . . . . . . . . $ 2,547 $(273) $ (11) $ 97 $(2,004) $ 356
Separate account assets(8) . . . . . . . . . . . . . . . . . . . . . . . . . . . . $ 1,758 $(213) $ — $ 485 $ (135) $ 1,895
Balance,January 1, Earnings(1), (2)
OtherComprehensiveIncome (Loss)
Purchases,Sales,
Issuances andSettlements(3)
Transfer Intoand/or Out
of Level 3(4)Balance,
December 31,
Total Realized/Unrealized(Gains) Losses included in:
Fair Value Measurements Using Significant Unobservable Inputs (Level 3)
(In millions)
Year Ended December 31, 2009:
Liabilities:
Net embedded derivatives(9) . . . . . . . . . . . . . . . . . . . . . . . . . . . $2,929 $(1,602) $(15) $143 $— $1,455
F-80 MetLife, Inc.
MetLife, Inc.
Notes to the Consolidated Financial Statements — (Continued)

Balance,December 31, 2007
Impact ofAdoption(11)
Balance,January 1, Earnings(1), (2)
OtherComprehensiveIncome (Loss)
Purchases,Sales,
Issuances andSettlements(3)
Transfer Intoand/or Out
of Level 3 (4)Balance,
December 31,
Total Realized/UnrealizedGains (Losses) included in:
Fair Value Measurements Using Significant Unobservable Inputs (Level 3)
(In millions)
Year Ended December 31, 2008:
Assets:
Fixed maturity securities:
U.S. corporate securities . . . . . . . . . $ 8,368 $— $ 8,368 $ (696) $(1,758) $ 859 $ 725 $ 7,498
Foreign corporate securities . . . . . . . . 7,228 (8) 7,220 (12) (2,873) (57) 1,666 5,944
RMBS . . . . . . . . . . . . . . . . . . . . . 1,423 — 1,423 4 (218) (204) (410) 595
Foreign government securities . . . . . . 785 — 785 19 (101) (295) — 408
U.S. Treasury, agency and governmentguaranteed securities . . . . . . . . . . 80 — 80 — (1) 3 6 88
CMBS . . . . . . . . . . . . . . . . . . . . . 539 — 539 (72) (136) 2 (73) 260
ABS . . . . . . . . . . . . . . . . . . . . . . 4,490 — 4,490 (125) (1,136) (740) (37) 2,452
State and political subdivisionsecurities . . . . . . . . . . . . . . . . . 124 — 124 — (8) 45 (38) 123
Other fixed maturity securities . . . . . . 289 — 289 1 (41) (209) — 40
Total fixed maturity securities . . . . . . $23,326 $ (8) $23,318 $ (881) $(6,272) $(596) $1,839 $17,408
Equity securities:
Common stock . . . . . . . . . . . . . . . $ 183 $— $ 183 $ (2) $ (12) $ (46) $ (18) $ 105
Non-redeemable preferred stock . . . . . 2,188 — 2,188 (195) (466) (242) (11) 1,274
Total equity securities . . . . . . . . . . $ 2,371 $— $ 2,371 $ (197) $ (478) $(288) $ (29) $ 1,379
Trading and other securities . . . . . . . . . $ 183 $ 8 $ 191 $ (26) $ — $ 18 $ (8) $ 175
Short-term investments . . . . . . . . . . . . $ 179 $— $ 179 $ — $ — $ (79) $ — $ 100
Mortgage loans held-for-sale . . . . . . . . $ — $— $ — $ 4 $ — $ 171 $ 2 $ 177
MSRs(5), (6) . . . . . . . . . . . . . . . . . . $ — $— $ — $ (149) $ — $ 340 $ — $ 191
Net derivatives(7) . . . . . . . . . . . . . . . $ 789 $ (1) $ 788 $1,729 $ — $ 29 $ 1 $ 2,547
Separate account assets(8) . . . . . . . . . $ 1,464 $— $ 1,464 $ (129) $ — $ 90 $ 333 $ 1,758
Balance,December 31, 2007
Impact ofAdoption(11)
Balance,January 1, Earnings(1), (2)
OtherComprehensiveIncome (Loss)
Purchases,Sales,
Issuances andSettlements(3)
Transfer Intoand/or Out
of Level 3(4)Balance,
December 31,
Total Realized/Unrealized(Gains) Losses included in:
Fair Value Measurements Using Significant Unobservable Inputs (Level 3)
(In millions)
Year Ended December 31, 2008:
Liabilities:
Net embedded derivatives(9) . . . . . . . . . . . . . . . . . $278 $(24) $254 $2,500 $81 $94 $— $2,929
(1) Amortization of premium/discount is included within net investment income which is reported within the earnings caption of total gains(losses). Impairments charged to earnings on securities and certain mortgage loans are included within net investment gains (losses)which are reported within the earnings caption of total gains (losses); while changes in estimated fair value of certain mortgage loans andMSRs are recorded in other revenues. Lapses associated with embedded derivatives are included with the earnings caption of totalgains (losses).
(2) Interest and dividend accruals, as well as cash interest coupons and dividends received, are excluded from the rollforward.
(3) The amount reported within purchases, sales, issuances and settlements is the purchase/issuance price (for purchases and issuances)and the sales/settlement proceeds (for sales and settlements) based upon the actual date purchased/issued or sold/settled. Itemspurchased/issued and sold/settled in the same period are excluded from the rollforward. For embedded derivatives, attributed fees areincluded within this caption along with settlements, if any. Purchases, sales, issuances and settlements for the year ended Decem-ber 31, 2010 include financial instruments acquired from ALICO as follows: fixed maturity securities $5,435 million, equity securities$68 million, trading and other securities $582 million, short-term investments $216 million, net derivatives ($10) million, separateaccount assets $244 million and net embedded derivatives ($116) million.
(4) Total gains and losses (in earnings and other comprehensive income (loss)) are calculated assuming transfers into and/or out of Level 3occurred at the beginning of the period. Items transferred into and out in the same period are excluded from the rollforward.
(5) The additions and reductions (due to loan payments and sales) affecting MSRs were $330 million and ($179) million, respectively, for theyear ended December 31, 2010. The additions and reductions (due to loan payments) affecting MSRs were $628 million and
F-81MetLife, Inc.
MetLife, Inc.
Notes to the Consolidated Financial Statements — (Continued)

($113) million, respectively, for the year ended December 31, 2009. The additions and reductions (due to loan payments) affectingMSRs were $350 million and ($10) million, respectively, for the year ended December 31, 2008.
(6) The changes in estimated fair value due to changes in valuation model inputs or assumptions and other changes in estimated fair valueaffecting MSRs were ($79) million, $172 million and ($149) million for the years ended December 31, 2010, 2009 and 2008,respectively.
(7) Freestanding derivative assets and liabilities are presented net for purposes of the rollforward.
(8) Investment performance related to separate account assets is fully offset by corresponding amounts credited to contractholders whoseliability is reflected within separate account liabilities.
(9) Embedded derivative assets and liabilities are presented net for purposes of the rollforward.
(10) The long-term debt at January 1, 2010 of the CSEs is reported within the purchases, sales, issuances and settlements activity column ofthe rollforward.
(11) The impact of adoption of fair value measurement guidance represents the amount recognized in earnings resulting from a change inestimate for certain Level 3 financial instruments held at January 1, 2008. The net impact of adoption on Level 3 assets and liabilitiespresented in the table above was a $23 million increase to net assets. Such amount was also impacted by an increase to DAC of$17 million. The impact of this adoption on RGA — not reflected in the table above as a result of the inclusion of RGA in discontinuedoperations — was a net increase of $2 million (i.e., a decrease in Level 3 net embedded derivative liabilities of $17 million, offset by aDAC decrease of $15 million) for a total increase of $42 million in Level 3 net assets. This increase of $42 million, offset by a $12 millionreduction in the estimated fair value of Level 2 freestanding derivatives, resulted in a total net impact of adoption of $30 million.
F-82 MetLife, Inc.
MetLife, Inc.
Notes to the Consolidated Financial Statements — (Continued)

The tables below summarize both realized and unrealized gains and losses due to changes in estimated fair value recorded in earnings forLevel 3 assets and liabilities:
NetInvestment
Income
NetInvestment
Gains(Losses)
NetDerivative
Gains(Losses)
OtherRevenues
PolicyholderBenefits and
ClaimsOther
Expenses Total
Classification of Realized/Unrealized Gains(Losses) included in Earnings
Total Gains and Losses
(In millions)
Year Ended December 31, 2010:
Assets:
Fixed maturity securities:
U.S. corporate securities . . . . . . . . . . . . . . . . . $ 22 $ (13) $ — $ — $— $— $ 9
Foreign corporate securities . . . . . . . . . . . . . . . 15 (34) — — — — (19)
RMBS . . . . . . . . . . . . . . . . . . . . . . . . . . . . . 36 (9) — — — — 27
Foreign government securities . . . . . . . . . . . . . . 6 (5) — — — — 1
CMBS . . . . . . . . . . . . . . . . . . . . . . . . . . . . . 1 (6) — — — — (5)
ABS . . . . . . . . . . . . . . . . . . . . . . . . . . . . . . . 37 (90) — — — — (53)
State and political subdivision securities . . . . . . . — — — — — — —
Other fixed maturity securities . . . . . . . . . . . . . . 1 — — — — — 1
Total fixed maturity securities . . . . . . . . . . . . . $118 $(157) $ — $ — $— $— $ (39)
Equity securities:
Common stock . . . . . . . . . . . . . . . . . . . . . . . . $ — $ 5 $ — $ — $— $— $ 5
Non-redeemable preferred stock . . . . . . . . . . . . — 46 — — — — 46
Total equity securities . . . . . . . . . . . . . . . . . . $ — $ 51 $ — $ — $— $— $ 51
Trading and other securities:
Actively Traded Securities . . . . . . . . . . . . . . . . . . $ — $ — $ — $ — $— $— $ —
FVO general account securities . . . . . . . . . . . . . . 8 — — — — — 8
FVO contractholder-directed unit-linkedinvestments . . . . . . . . . . . . . . . . . . . . . . . . . . (15) — — — — — (15)
Total trading and other securities . . . . . . . . . . . $ (7) $ — $ — $ — $— $— $ (7)
Short-term investments . . . . . . . . . . . . . . . . . . . . $ 2 $ — $ — $ — $— $— $ 2
Mortgage loans held-for-sale . . . . . . . . . . . . . . . . $ — $ — $ — $ (2) $— $— $ (2)
MSRs . . . . . . . . . . . . . . . . . . . . . . . . . . . . . . . $ — $ — $ — $(79) $— $— $ (79)
Net derivatives:
Interest rate contracts . . . . . . . . . . . . . . . . . . . $ — $ — $ 36 $ 1 $— $— $ 37
Foreign currency contracts . . . . . . . . . . . . . . . . — — 46 — — (4) 42
Credit contracts . . . . . . . . . . . . . . . . . . . . . . . — — 4 — — — 4
Equity market contracts . . . . . . . . . . . . . . . . . . — — (88) — — — (88)
Total net derivatives . . . . . . . . . . . . . . . . . . . $ — $ — $ (2) $ 1 $— $ (4) $ (5)
Liabilities:
Net embedded derivatives . . . . . . . . . . . . . . . . . . $ — $ — $(343) $ — $ 8 $— $(335)
Long-term debt of consolidated securitizationentities . . . . . . . . . . . . . . . . . . . . . . . . . . . . . $ — $ 48 $ — $ — $— $— $ 48
F-83MetLife, Inc.
MetLife, Inc.
Notes to the Consolidated Financial Statements — (Continued)

NetInvestment
Income
NetInvestment
Gains(Losses)
NetDerivative
Gains(Losses)
OtherRevenues
PolicyholderBenefits and
ClaimsOther
Expenses Total
Classification of Realized/Unrealized Gains(Losses) included in Earnings
Total Gains and Losses
(In millions)
Year Ended December 31, 2009:Assets:Fixed maturity securities:
U.S. corporate securities . . . . . . . . . . . . . . . . $ 15 $(444) $ — $ — $ — $— $ (429)Foreign corporate securities . . . . . . . . . . . . . . (4) (326) — — — — (330)RMBS . . . . . . . . . . . . . . . . . . . . . . . . . . . . . 30 1 — — — — 31Foreign government securities . . . . . . . . . . . . . 12 (52) — — — — (40)CMBS . . . . . . . . . . . . . . . . . . . . . . . . . . . . 1 (37) — — — — (36)ABS . . . . . . . . . . . . . . . . . . . . . . . . . . . . . . 8 (129) — — — — (121)State and political subdivision securities . . . . . . — — — — — — —Other fixed maturity securities . . . . . . . . . . . . . 1 — — — — — 1
Total fixed maturity securities . . . . . . . . . . . . $ 63 $(987) $ — $ — $ — $— $ (924)
Equity securities:Common stock . . . . . . . . . . . . . . . . . . . . . . . $ — $ (2) $ — $ — $ — $— $ (2)Non-redeemable preferred stock . . . . . . . . . . . — (357) — — — — (357)
Total equity securities . . . . . . . . . . . . . . . . . $ — $(359) $ — $ — $ — $— $ (359)
Trading and other securities . . . . . . . . . . . . . . . . $ 16 $ — $ — $ — $ — $— $ 16Short-term investments . . . . . . . . . . . . . . . . . . . $ — $ (21) $ — $ — $ — $— $ (21)Mortgage loans held-for-sale . . . . . . . . . . . . . . . $ — $ — $ — $ (3) $ — $— $ (3)MSRs . . . . . . . . . . . . . . . . . . . . . . . . . . . . . . $ — $ — $ — $172 $ — $— $ 172Net derivatives . . . . . . . . . . . . . . . . . . . . . . . . $(13) $ — $ (225) $ (33) $ — $ (2) $ (273)Liabilities:Net embedded derivatives . . . . . . . . . . . . . . . . . $ — $ — $1,716 $ — $(114) $— $1,602
NetInvestment
Income
NetInvestment
Gains(Losses)
NetDerivative
Gains(Losses)
OtherRevenues
PolicyholderBenefits and
ClaimsOther
Expenses Total
Classification of Realized/Unrealized Gains(Losses) included in Earnings
Total Gains and Losses
(In millions)
Year Ended December 31, 2008:Assets:Fixed maturity securities:
U.S. corporate securities . . . . . . . . . . . . . . . . $ 15 $ (711) $ — $ — $ — $— $ (696)Foreign corporate securities . . . . . . . . . . . . . . 123 (135) — — — — (12)RMBS . . . . . . . . . . . . . . . . . . . . . . . . . . . . 3 1 — — — — 4Foreign government securities . . . . . . . . . . . . . 27 (8) — — — — 19CMBS . . . . . . . . . . . . . . . . . . . . . . . . . . . . 4 (76) — — — — (72)ABS . . . . . . . . . . . . . . . . . . . . . . . . . . . . . 4 (129) — — — — (125)State and political subdivision securities . . . . . . (1) 1 — — — — —Other fixed maturity securities . . . . . . . . . . . . . 1 — — — — — 1
Total fixed maturity securities . . . . . . . . . . . . $176 $(1,057) $ — $ — $ — $— $ (881)
Equity securities:Common stock . . . . . . . . . . . . . . . . . . . . . . $ — $ (2) $ — $ — $ — $— $ (2)Non-redeemable preferred stock . . . . . . . . . . . — (195) — — — — (195)
Total equity securities . . . . . . . . . . . . . . . . . $ — $ (197) $ — $ — $ — $— $ (197)
Trading and other securities . . . . . . . . . . . . . . . $ (26) $ — $ — $ — $ — $— $ (26)Short-term investments . . . . . . . . . . . . . . . . . . $ 1 $ (1) $ — $ — $ — $— $ —Mortgage loans held-for-sale . . . . . . . . . . . . . . . $ — $ — $ — $ 4 $ — $— $ 4MSRs . . . . . . . . . . . . . . . . . . . . . . . . . . . . . . $ — $ — $ — $(149) $ — $— $ (149)Net derivatives . . . . . . . . . . . . . . . . . . . . . . . . $103 $ — $ 1,587 $ 39 $ — $— $ 1,729Liabilities:Net embedded derivatives . . . . . . . . . . . . . . . . . $ — $ — $(2,682) $ — $182 $— $(2,500)
F-84 MetLife, Inc.
MetLife, Inc.
Notes to the Consolidated Financial Statements — (Continued)

The tables below summarize the portion of unrealized gains and losses, due to changes in estimated fair value, recorded in earnings forLevel 3 assets and liabilities that were still held at the respective time periods:
NetInvestment
Income
NetInvestment
Gains(Losses)
NetDerivative
Gains(Losses)
OtherRevenues
PolicyholderBenefits and
ClaimsOther
Expenses Total
Changes in Unrealized Gains (Losses)Relating to Assets and Liabilities Held at December 31, 2010
(In millions)
Year Ended December 31, 2010:Assets:Fixed maturity securities:
U.S. corporate securities . . . . . . . . . . . . . . . . . $ 13 $ (44) $ — $ — $— $— $ (31)Foreign corporate securities . . . . . . . . . . . . . . . 15 (43) — — — — (28)RMBS . . . . . . . . . . . . . . . . . . . . . . . . . . . . . 36 — — — — — 36Foreign government securities . . . . . . . . . . . . . . 10 — — — — — 10CMBS . . . . . . . . . . . . . . . . . . . . . . . . . . . . . 1 (6) — — — — (5)ABS . . . . . . . . . . . . . . . . . . . . . . . . . . . . . . . 36 (52) — — — — (16)State and political subdivision securities . . . . . . . — — — — — — —Other fixed maturity securities . . . . . . . . . . . . . . 1 — — — — — 1
Total fixed maturity securities . . . . . . . . . . . . . $112 $(145) $ — $ — $— $— $ (33)
Equity securities:Common stock . . . . . . . . . . . . . . . . . . . . . . . . $ — $ (2) $ — $ — $— $— $ (2)Non-redeemable preferred stock . . . . . . . . . . . . — (3) — — — — (3)
Total equity securities . . . . . . . . . . . . . . . . . . $ — $ (5) $ — $ — $— $— $ (5)
Trading and other securities:Actively Traded Securities . . . . . . . . . . . . . . . . . $ — $ — $ — $ — $— $— $ —FVO general account securities . . . . . . . . . . . . . 12 — — — — — 12FVO contractholder-directed unit-linked
investments . . . . . . . . . . . . . . . . . . . . . . . . (15) — — — — — (15)
Total trading and other securities . . . . . . . . . . . $ (3) $ — $ — $ — $— $— $ (3)
Short-term investments . . . . . . . . . . . . . . . . . . . . $ 2 $ — $ — $ — $— $— $ 2Mortgage loans held-for-sale . . . . . . . . . . . . . . . . $ — $ — $ — $ (2) $— $— $ (2)MSRs . . . . . . . . . . . . . . . . . . . . . . . . . . . . . . . $ — $ — $ — $(28) $— $— $ (28)Net derivatives:
Interest rate contracts . . . . . . . . . . . . . . . . . . . $ — $ — $ 36 $ 5 $— $— $ 41Foreign currency contracts . . . . . . . . . . . . . . . . — — 45 — — — 45Credit contracts . . . . . . . . . . . . . . . . . . . . . . . — — 6 — — — 6Equity market contracts . . . . . . . . . . . . . . . . . . — — (82) — — — (82)
Total net derivatives . . . . . . . . . . . . . . . . . . . $ — $ — $ 5 $ 5 $— $— $ 10
Liabilities:Net embedded derivatives . . . . . . . . . . . . . . . . . . $ — $ — $(363) $ — $ 8 $— $(355)Long-term debt of consolidated securitization
entities . . . . . . . . . . . . . . . . . . . . . . . . . . . . . $ — $ 48 $ — $ — $— $— $ 48
F-85MetLife, Inc.
MetLife, Inc.
Notes to the Consolidated Financial Statements — (Continued)
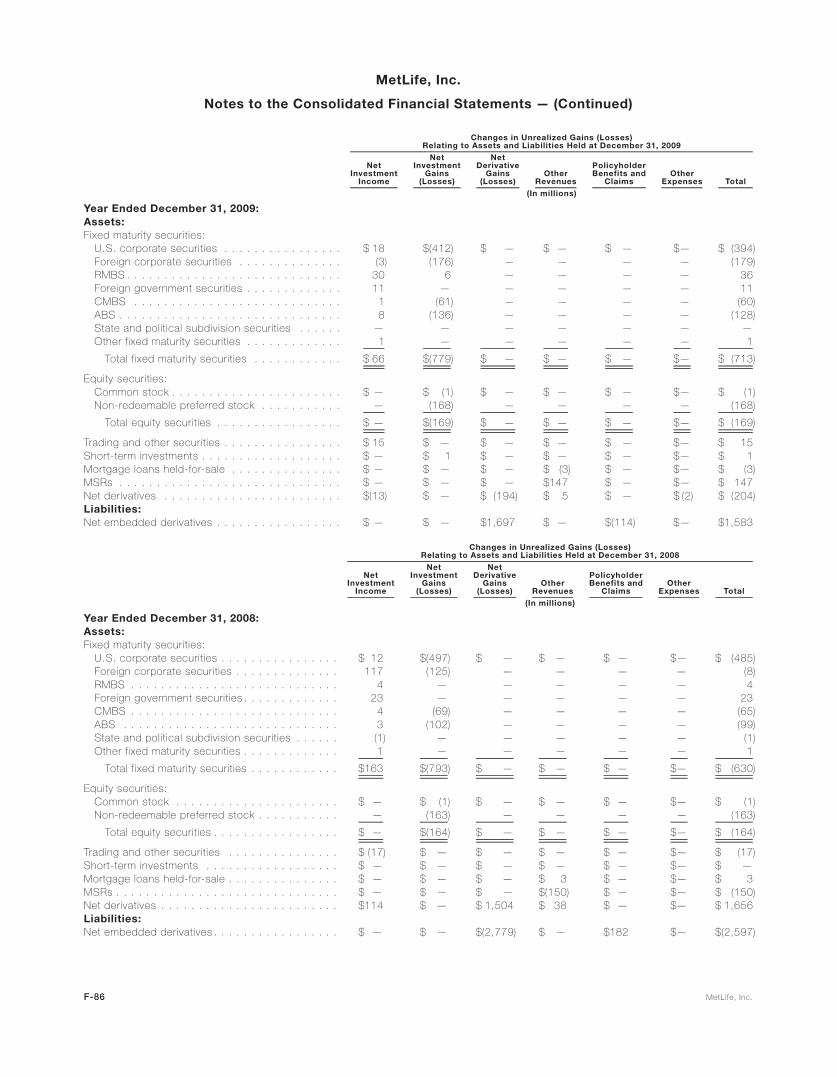
NetInvestment
Income
NetInvestment
Gains(Losses)
NetDerivative
Gains(Losses)
OtherRevenues
PolicyholderBenefits and
ClaimsOther
Expenses Total
Changes in Unrealized Gains (Losses)Relating to Assets and Liabilities Held at December 31, 2009
(In millions)
Year Ended December 31, 2009:Assets:Fixed maturity securities:
U.S. corporate securities . . . . . . . . . . . . . . . . $ 18 $(412) $ — $ — $ — $— $ (394)Foreign corporate securities . . . . . . . . . . . . . . (3) (176) — — — — (179)RMBS . . . . . . . . . . . . . . . . . . . . . . . . . . . . . 30 6 — — — — 36Foreign government securities . . . . . . . . . . . . . 11 — — — — — 11CMBS . . . . . . . . . . . . . . . . . . . . . . . . . . . . 1 (61) — — — — (60)ABS . . . . . . . . . . . . . . . . . . . . . . . . . . . . . . 8 (136) — — — — (128)State and political subdivision securities . . . . . . — — — — — — —Other fixed maturity securities . . . . . . . . . . . . . 1 — — — — — 1
Total fixed maturity securities . . . . . . . . . . . . $ 66 $(779) $ — $ — $ — $— $ (713)
Equity securities:Common stock . . . . . . . . . . . . . . . . . . . . . . . $ — $ (1) $ — $ — $ — $— $ (1)Non-redeemable preferred stock . . . . . . . . . . . — (168) — — — — (168)
Total equity securities . . . . . . . . . . . . . . . . . $ — $(169) $ — $ — $ — $— $ (169)
Trading and other securities . . . . . . . . . . . . . . . . $ 15 $ — $ — $ — $ — $— $ 15Short-term investments . . . . . . . . . . . . . . . . . . . $ — $ 1 $ — $ — $ — $— $ 1Mortgage loans held-for-sale . . . . . . . . . . . . . . . $ — $ — $ — $ (3) $ — $— $ (3)MSRs . . . . . . . . . . . . . . . . . . . . . . . . . . . . . . $ — $ — $ — $147 $ — $— $ 147Net derivatives . . . . . . . . . . . . . . . . . . . . . . . . $(13) $ — $ (194) $ 5 $ — $ (2) $ (204)Liabilities:Net embedded derivatives . . . . . . . . . . . . . . . . . $ — $ — $1,697 $ — $(114) $— $1,583
NetInvestment
Income
NetInvestment
Gains(Losses)
NetDerivative
Gains(Losses)
OtherRevenues
PolicyholderBenefits and
ClaimsOther
Expenses Total
Changes in Unrealized Gains (Losses)Relating to Assets and Liabilities Held at December 31, 2008
(In millions)
Year Ended December 31, 2008:Assets:Fixed maturity securities:
U.S. corporate securities . . . . . . . . . . . . . . . . $ 12 $(497) $ — $ — $ — $— $ (485)Foreign corporate securities . . . . . . . . . . . . . . 117 (125) — — — — (8)RMBS . . . . . . . . . . . . . . . . . . . . . . . . . . . . 4 — — — — — 4Foreign government securities . . . . . . . . . . . . . 23 — — — — — 23CMBS . . . . . . . . . . . . . . . . . . . . . . . . . . . . 4 (69) — — — — (65)ABS . . . . . . . . . . . . . . . . . . . . . . . . . . . . . 3 (102) — — — — (99)State and political subdivision securities . . . . . . (1) — — — — — (1)Other fixed maturity securities . . . . . . . . . . . . . 1 — — — — — 1
Total fixed maturity securities . . . . . . . . . . . . $163 $(793) $ — $ — $ — $— $ (630)
Equity securities:Common stock . . . . . . . . . . . . . . . . . . . . . . $ — $ (1) $ — $ — $ — $— $ (1)Non-redeemable preferred stock . . . . . . . . . . . — (163) — — — — (163)
Total equity securities . . . . . . . . . . . . . . . . . $ — $(164) $ — $ — $ — $— $ (164)
Trading and other securities . . . . . . . . . . . . . . . $ (17) $ — $ — $ — $ — $— $ (17)Short-term investments . . . . . . . . . . . . . . . . . . $ — $ — $ — $ — $ — $— $ —Mortgage loans held-for-sale . . . . . . . . . . . . . . . $ — $ — $ — $ 3 $ — $— $ 3MSRs . . . . . . . . . . . . . . . . . . . . . . . . . . . . . . $ — $ — $ — $(150) $ — $— $ (150)Net derivatives . . . . . . . . . . . . . . . . . . . . . . . . $114 $ — $ 1,504 $ 38 $ — $— $ 1,656Liabilities:Net embedded derivatives . . . . . . . . . . . . . . . . . $ — $ — $(2,779) $ — $182 $— $(2,597)
F-86 MetLife, Inc.
MetLife, Inc.
Notes to the Consolidated Financial Statements — (Continued)
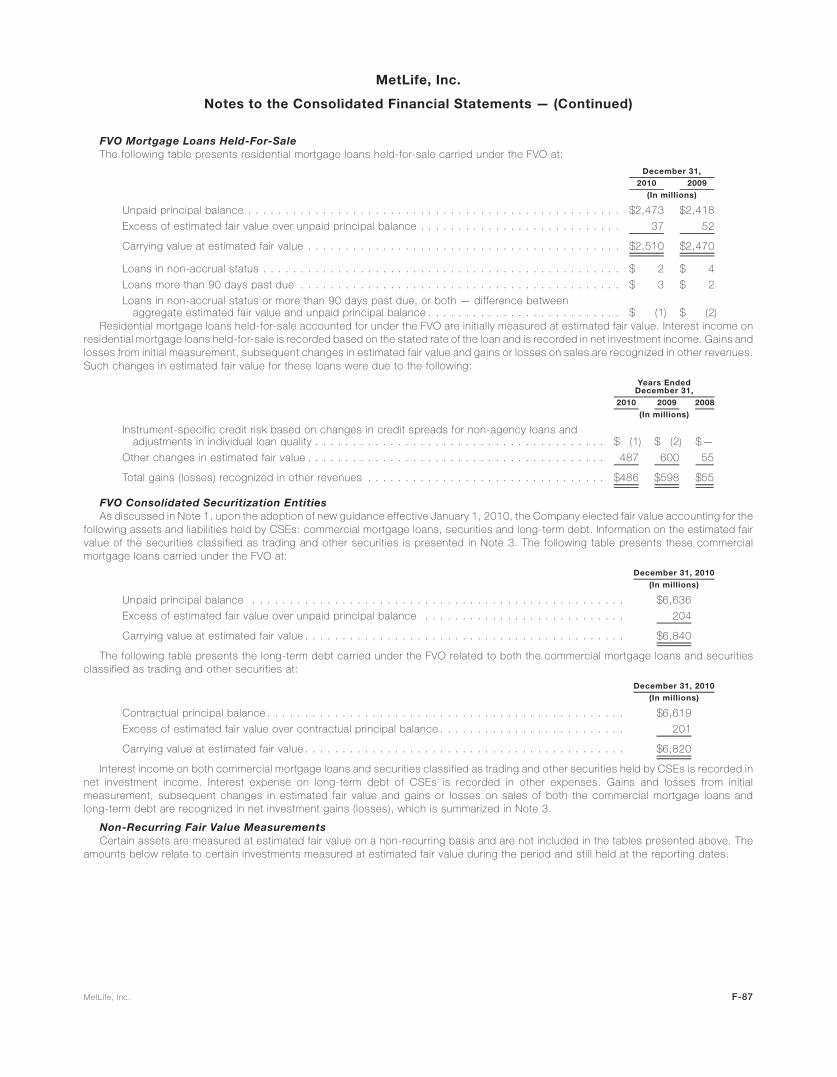
FVO Mortgage Loans Held-For-SaleThe following table presents residential mortgage loans held-for-sale carried under the FVO at:
2010 2009
December 31,
(In millions)
Unpaid principal balance . . . . . . . . . . . . . . . . . . . . . . . . . . . . . . . . . . . . . . . . . . . . . . . . . . $2,473 $2,418
Excess of estimated fair value over unpaid principal balance . . . . . . . . . . . . . . . . . . . . . . . . . . . 37 52
Carrying value at estimated fair value . . . . . . . . . . . . . . . . . . . . . . . . . . . . . . . . . . . . . . . . . . $2,510 $2,470
Loans in non-accrual status . . . . . . . . . . . . . . . . . . . . . . . . . . . . . . . . . . . . . . . . . . . . . . . . $ 2 $ 4
Loans more than 90 days past due . . . . . . . . . . . . . . . . . . . . . . . . . . . . . . . . . . . . . . . . . . . $ 3 $ 2
Loans in non-accrual status or more than 90 days past due, or both — difference betweenaggregate estimated fair value and unpaid principal balance . . . . . . . . . . . . . . . . . . . . . . . . . . $ (1) $ (2)
Residential mortgage loans held-for-sale accounted for under the FVO are initially measured at estimated fair value. Interest income onresidential mortgage loans held-for-sale is recorded based on the stated rate of the loan and is recorded in net investment income. Gains andlosses from initial measurement, subsequent changes in estimated fair value and gains or losses on sales are recognized in other revenues.Such changes in estimated fair value for these loans were due to the following:
2010 2009 2008
Years EndedDecember 31,
(In millions)
Instrument-specific credit risk based on changes in credit spreads for non-agency loans andadjustments in individual loan quality . . . . . . . . . . . . . . . . . . . . . . . . . . . . . . . . . . . . . . . $ (1) $ (2) $—
Other changes in estimated fair value . . . . . . . . . . . . . . . . . . . . . . . . . . . . . . . . . . . . . . . . 487 600 55
Total gains (losses) recognized in other revenues . . . . . . . . . . . . . . . . . . . . . . . . . . . . . . . . $486 $598 $55
FVO Consolidated Securitization EntitiesAs discussed in Note 1, upon the adoption of new guidance effective January 1, 2010, the Company elected fair value accounting for the
following assets and liabilities held by CSEs: commercial mortgage loans, securities and long-term debt. Information on the estimated fairvalue of the securities classified as trading and other securities is presented in Note 3. The following table presents these commercialmortgage loans carried under the FVO at:
December 31, 2010
(In millions)
Unpaid principal balance . . . . . . . . . . . . . . . . . . . . . . . . . . . . . . . . . . . . . . . . . . . . . . . . . . $6,636
Excess of estimated fair value over unpaid principal balance . . . . . . . . . . . . . . . . . . . . . . . . . . . 204
Carrying value at estimated fair value . . . . . . . . . . . . . . . . . . . . . . . . . . . . . . . . . . . . . . . . . . . $6,840
The following table presents the long-term debt carried under the FVO related to both the commercial mortgage loans and securitiesclassified as trading and other securities at:
December 31, 2010
(In millions)
Contractual principal balance . . . . . . . . . . . . . . . . . . . . . . . . . . . . . . . . . . . . . . . . . . . . . . . . $6,619
Excess of estimated fair value over contractual principal balance . . . . . . . . . . . . . . . . . . . . . . . . . 201
Carrying value at estimated fair value . . . . . . . . . . . . . . . . . . . . . . . . . . . . . . . . . . . . . . . . . . . $6,820
Interest income on both commercial mortgage loans and securities classified as trading and other securities held by CSEs is recorded innet investment income. Interest expense on long-term debt of CSEs is recorded in other expenses. Gains and losses from initialmeasurement, subsequent changes in estimated fair value and gains or losses on sales of both the commercial mortgage loans andlong-term debt are recognized in net investment gains (losses), which is summarized in Note 3.
Non-Recurring Fair Value MeasurementsCertain assets are measured at estimated fair value on a non-recurring basis and are not included in the tables presented above. The
amounts below relate to certain investments measured at estimated fair value during the period and still held at the reporting dates.
F-87MetLife, Inc.
MetLife, Inc.
Notes to the Consolidated Financial Statements — (Continued)

CarryingValue Prior toMeasurement
EstimatedFair
Value AfterMeasurement
NetInvestment
Gains(Losses)
CarryingValue Prior toMeasurement
EstimatedFair
Value AfterMeasurement
NetInvestment
Gains(Losses)
CarryingValue Prior toMeasurement
EstimatedFair
Value AfterMeasurement
NetInvestment
Gains(Losses)
2010 2009 2008
Years Ended December 31,
(In millions)
Mortgage loans:(1)Held-for-investment . . . . . $179 $164 $(15) $294 $202 $ (92) $257 $188 $ (69)Held-for-sale . . . . . . . . . 35 33 (2) 9 8 (1) 42 32 (10)
Mortgage loans, net . . . . $214 $197 $(17) $303 $210 $ (93) $299 $220 $ (79)
Other limited partnershipinterests(2) . . . . . . . . . . $ 35 $ 23 $(12) $915 $561 $(354) $242 $137 $(105)
Real estate jointventures(3) . . . . . . . . . . $ 33 $ 8 $(25) $175 $ 93 $ (82) $ — $ — $ —
(1) Mortgage loans — The impaired mortgage loans presented above were written down to their estimated fair values at the date theimpairments were recognized and are reported as losses above. Subsequent improvements in estimated fair value on previously impairedloans recorded through a reduction in the previously established valuation allowance are reported as gains above. Estimated fair valuesfor impaired mortgage loans are based on observable market prices or, if the loans are in foreclosure or are otherwise determined to becollateral dependent, on the estimated fair value of the underlying collateral, or the present value of the expected future cash flows.Impairments to estimated fair value and decreases in previous impairments from subsequent improvements in estimated fair valuerepresent non-recurring fair value measurements that have been categorized as Level 3 due to the lack of price transparency inherent inthe limited markets for such mortgage loans.
(2) Other limited partnership interests — The impaired investments presented above were accounted for using the cost method. Impair-ments on these cost method investments were recognized at estimated fair value determined from information provided in the financialstatements of the underlying entities in the period in which the impairment was incurred. These impairments to estimated fair valuerepresent non-recurring fair value measurements that have been classified as Level 3 due to the limited activity and price transparencyinherent in the market for such investments. This category includes several private equity and debt funds that typically invest primarily in adiversified pool of investments across certain investment strategies including domestic and international leveraged buyout funds; power,energy, timber and infrastructure development funds; venture capital funds; below investment grade debt and mezzanine debt funds. Theestimated fair values of these investments have been determined using the NAV of the Company’s ownership interest in the partners’capital. Distributions from these investments will be generated from investment gains, from operating income from the underlyinginvestments of the funds and from liquidation of the underlying assets of the funds. It is estimated that the underlying assets of the fundswill be liquidated over the next 2 to 10 years. Unfunded commitments for these investments were $34 million at December 31, 2010.
(3) Real estate joint ventures — The impaired investments presented above were accounted for using the cost method. Impairments onthese cost method investments were recognized at estimated fair value determined from information provided in the financial statementsof the underlying entities in the period in which the impairment was incurred. These impairments to estimated fair value represent non-recurring fair value measurements that have been classified as Level 3 due to the limited activity and price transparency inherent in themarket for such investments. This category includes several real estate funds that typically invest primarily in commercial real estate. Theestimated fair values of these investments have been determined using the NAV of the Company’s ownership interest in the partners’capital. Distributions from these investments will be generated from investment gains, from operating income from the underlyinginvestments of the funds and from liquidation of the underlying assets of the funds. It is estimated that the underlying assets of the fundswill be liquidated over the next 2 to 10 years. Unfunded commitments for these investments were $6 million at December 31, 2010.
F-88 MetLife, Inc.
MetLife, Inc.
Notes to the Consolidated Financial Statements — (Continued)

Fair Value of Financial InstrumentsAmounts related to the Company’s financial instruments that were not measured at fair value on a recurring basis, were as follows:
December 31, 2010NotionalAmount
CarryingValue
EstimatedFair
Value
(In millions)
Assets
Mortgage loans:(1)
Held-for-investment . . . . . . . . . . . . . . . . . . . . . . . . . . . . . . . . . . . . . . . . . . . . . . . . . . . . $ 52,215 $ 54,006
Held-for-sale . . . . . . . . . . . . . . . . . . . . . . . . . . . . . . . . . . . . . . . . . . . . . . . . . . . . . . . . $ 811 $ 811
Mortgage loans, net . . . . . . . . . . . . . . . . . . . . . . . . . . . . . . . . . . . . . . . . . . . . . . . . . . $ 53,026 $ 54,817
Policy loans . . . . . . . . . . . . . . . . . . . . . . . . . . . . . . . . . . . . . . . . . . . . . . . . . . . . . . . . . . $ 11,914 $ 13,406
Real estate joint ventures(2) . . . . . . . . . . . . . . . . . . . . . . . . . . . . . . . . . . . . . . . . . . . . . . . . $ 451 $ 482
Other limited partnership interests(2) . . . . . . . . . . . . . . . . . . . . . . . . . . . . . . . . . . . . . . . . . . $ 1,539 $ 1,619
Short-term investments(3) . . . . . . . . . . . . . . . . . . . . . . . . . . . . . . . . . . . . . . . . . . . . . . . . . $ 822 $ 822
Other invested assets(2) . . . . . . . . . . . . . . . . . . . . . . . . . . . . . . . . . . . . . . . . . . . . . . . . . . $ 1,490 $ 1,490
Cash and cash equivalents . . . . . . . . . . . . . . . . . . . . . . . . . . . . . . . . . . . . . . . . . . . . . . . . $ 13,046 $ 13,046
Accrued investment income . . . . . . . . . . . . . . . . . . . . . . . . . . . . . . . . . . . . . . . . . . . . . . . . $ 4,381 $ 4,381
Premiums, reinsurance and other receivables(2) . . . . . . . . . . . . . . . . . . . . . . . . . . . . . . . . . . . $ 3,752 $ 4,048
Other assets(2) . . . . . . . . . . . . . . . . . . . . . . . . . . . . . . . . . . . . . . . . . . . . . . . . . . . . . . . . $ 466 $ 453
Liabilities
Policyholder account balances(2) . . . . . . . . . . . . . . . . . . . . . . . . . . . . . . . . . . . . . . . . . . . . $146,927 $152,850
Payables for collateral under securities loaned and other transactions . . . . . . . . . . . . . . . . . . . . . $ 27,272 $ 27,272
Bank deposits . . . . . . . . . . . . . . . . . . . . . . . . . . . . . . . . . . . . . . . . . . . . . . . . . . . . . . . . . $ 10,316 $ 10,371
Short-term debt . . . . . . . . . . . . . . . . . . . . . . . . . . . . . . . . . . . . . . . . . . . . . . . . . . . . . . . . $ 306 $ 306
Long-term debt(2) . . . . . . . . . . . . . . . . . . . . . . . . . . . . . . . . . . . . . . . . . . . . . . . . . . . . . . $ 20,734 $ 21,892
Collateral financing arrangements . . . . . . . . . . . . . . . . . . . . . . . . . . . . . . . . . . . . . . . . . . . . $ 5,297 $ 4,757
Junior subordinated debt securities . . . . . . . . . . . . . . . . . . . . . . . . . . . . . . . . . . . . . . . . . . . $ 3,191 $ 3,461
Other liabilities(2) . . . . . . . . . . . . . . . . . . . . . . . . . . . . . . . . . . . . . . . . . . . . . . . . . . . . . . . $ 2,777 $ 2,777
Separate account liabilities(2) . . . . . . . . . . . . . . . . . . . . . . . . . . . . . . . . . . . . . . . . . . . . . . . $ 42,160 $ 42,160
Commitments(4)
Mortgage loan commitments . . . . . . . . . . . . . . . . . . . . . . . . . . . . . . . . . . . . . . . . . . . . . . . $3,754 $ — $ (17)
Commitments to fund bank credit facilities, bridge loans and private corporate bond investments . . . $2,437 $ — $ —
F-89MetLife, Inc.
MetLife, Inc.
Notes to the Consolidated Financial Statements — (Continued)

December 31, 2009NotionalAmount
CarryingValue
EstimatedFair
Value
(In millions)
Assets
Mortgage loans:(1)
Held-for-investment . . . . . . . . . . . . . . . . . . . . . . . . . . . . . . . . . . . . . . . . . . . . . . . . . . . . . $48,181 $46,315
Held-for-sale . . . . . . . . . . . . . . . . . . . . . . . . . . . . . . . . . . . . . . . . . . . . . . . . . . . . . . . . . . 258 258
Mortgage loans, net . . . . . . . . . . . . . . . . . . . . . . . . . . . . . . . . . . . . . . . . . . . . . . . . . . . . $48,439 $46,573
Policy loans . . . . . . . . . . . . . . . . . . . . . . . . . . . . . . . . . . . . . . . . . . . . . . . . . . . . . . . . . . . . $10,061 $11,294
Real estate joint ventures(2) . . . . . . . . . . . . . . . . . . . . . . . . . . . . . . . . . . . . . . . . . . . . . . . . . $ 115 $ 127
Other limited partnership interests(2) . . . . . . . . . . . . . . . . . . . . . . . . . . . . . . . . . . . . . . . . . . . . $ 1,571 $ 1,581
Short-term investments(3) . . . . . . . . . . . . . . . . . . . . . . . . . . . . . . . . . . . . . . . . . . . . . . . . . . . $ 201 $ 201
Other invested assets(2) . . . . . . . . . . . . . . . . . . . . . . . . . . . . . . . . . . . . . . . . . . . . . . . . . . . . $ 1,241 $ 1,284
Cash and cash equivalents . . . . . . . . . . . . . . . . . . . . . . . . . . . . . . . . . . . . . . . . . . . . . . . . . . $10,112 $10,112
Accrued investment income . . . . . . . . . . . . . . . . . . . . . . . . . . . . . . . . . . . . . . . . . . . . . . . . . $ 3,173 $ 3,173
Premiums, reinsurance and other receivables(2) . . . . . . . . . . . . . . . . . . . . . . . . . . . . . . . . . . . . $ 3,375 $ 3,532
Other assets(2) . . . . . . . . . . . . . . . . . . . . . . . . . . . . . . . . . . . . . . . . . . . . . . . . . . . . . . . . . $ 425 $ 440
Liabilities
Policyholder account balances(2) . . . . . . . . . . . . . . . . . . . . . . . . . . . . . . . . . . . . . . . . . . . . . . $97,131 $96,735
Payables for collateral under securities loaned and other transactions . . . . . . . . . . . . . . . . . . . . . . $24,196 $24,196
Bank deposits . . . . . . . . . . . . . . . . . . . . . . . . . . . . . . . . . . . . . . . . . . . . . . . . . . . . . . . . . . $10,211 $10,300
Short-term debt . . . . . . . . . . . . . . . . . . . . . . . . . . . . . . . . . . . . . . . . . . . . . . . . . . . . . . . . . $ 912 $ 912
Long-term debt(2) . . . . . . . . . . . . . . . . . . . . . . . . . . . . . . . . . . . . . . . . . . . . . . . . . . . . . . . . $13,185 $13,831
Collateral financing arrangements . . . . . . . . . . . . . . . . . . . . . . . . . . . . . . . . . . . . . . . . . . . . . . $ 5,297 $ 2,877
Junior subordinated debt securities . . . . . . . . . . . . . . . . . . . . . . . . . . . . . . . . . . . . . . . . . . . . $ 3,191 $ 3,167
Other liabilities(2) . . . . . . . . . . . . . . . . . . . . . . . . . . . . . . . . . . . . . . . . . . . . . . . . . . . . . . . . $ 1,788 $ 1,788
Separate account liabilities(2) . . . . . . . . . . . . . . . . . . . . . . . . . . . . . . . . . . . . . . . . . . . . . . . . $32,171 $32,171
Commitments (4)
Mortgage loan commitments . . . . . . . . . . . . . . . . . . . . . . . . . . . . . . . . . . . . . . . . . . . . . . . . . $2,220 $ — $ (48)
Commitments to fund bank credit facilities, bridge loans and private corporate bond investments . . . . $1,261 $ — $ (52)
(1) Mortgage loans held-for-investment as presented in the tables above differ from the amount presented in the consolidated balancesheets because these tables do not include commercial mortgage loans held by CSEs. Mortgage loans held-for-sale as presented in thetables above differ from the amount presented in the consolidated balance sheets because these tables do not include residentialmortgage loans held-for-sale accounted for under the FVO.
(2) Carrying values presented herein differ from those presented in the consolidated balance sheets because certain items within therespective financial statement caption are not considered financial instruments. Financial statement captions excluded from the tableabove are not considered financial instruments.
(3) Short-term investments as presented in the tables above differ from the amounts presented in the consolidated balance sheets becausethese tables do not include short-term investments that meet the definition of a security, which are measured at estimated fair value on arecurring basis.
(4) Commitments are off-balance sheet obligations. Negative estimated fair values represent off-balance sheet liabilities.The methods and assumptions used to estimate the fair value of financial instruments are summarized as follows:The assets and liabilities measured at estimated fair value on a recurring basis include: fixed maturity securities, equity securities, trading
and other securities, mortgage loans held by CSEs, mortgage loans held-for-sale accounted for under the FVO, MSRs, derivative assets andliabilities, net embedded derivatives within asset and liability host contracts, separate account assets, long-term debt of CSEs and tradingliabilities. These assets and liabilities are described in the section “— Recurring Fair Value Measurements” and, therefore, are excluded fromthe tables above. The estimated fair value for these financial instruments approximates carrying value.
Mortgage LoansThese mortgage loans are principally comprised of commercial and agricultural mortgage loans, which are originated for investment
purposes and are primarily carried at amortized cost. Residential mortgage and consumer loans are generally purchased from third parties for
F-90 MetLife, Inc.
MetLife, Inc.
Notes to the Consolidated Financial Statements — (Continued)
investment purposes and are principally carried at amortized cost, while those originated for sale and not carried under the FVO are carried atthe lower of cost or estimated fair value. The estimated fair values of these mortgage loans are determined as follows:
Mortgage loans held-for-investment. — For commercial and agricultural mortgage loans held-for-investment and carried at amortizedcost, estimated fair value was primarily determined by estimating expected future cash flows and discounting them using current interestrates for similar mortgage loans with similar credit risk. For residential mortgage loans held-for-investment and carried at amortized cost,estimated fair value was primarily determined from observable pricing for similar loans.Mortgage loans held-for-sale. — Certain mortgage loans previously classified as held-for-investment have been designated asheld-for-sale. For these mortgage loans, estimated fair value is determined using independent broker quotations or, when the mortgageloan is in foreclosure or otherwise determined to be collateral dependent, the fair value of the underlying collateral is estimated usinginternal models. For residential mortgage loans originated for sale, the estimated fair value is determined principally from observablemarket pricing or from internal models.
Policy LoansFor policy loans with fixed interest rates, estimated fair values are determined using a discounted cash flow model applied to groups of
similar policy loans determined by the nature of the underlying insurance liabilities. Cash flow estimates are developed applying a weighted-average interest rate to the outstanding principal balance of the respective group of policy loans and an estimated average maturitydetermined through experience studies of the past performance of policyholder repayment behavior for similar loans. These cash flows arediscounted using current risk-free interest rates with no adjustment for borrower credit risk as these loans are fully collateralized by the cashsurrender value of the underlying insurance policy. The estimated fair value for policy loans with variable interest rates approximates carryingvalue due to the absence of borrower credit risk and the short time period between interest rate resets, which presents minimal risk of amaterial change in estimated fair value due to changes in market interest rates.
Real Estate Joint Ventures and Other Limited Partnership InterestsReal estate joint ventures and other limited partnership interests included in the preceding tables consist of those investments accounted
for using the cost method. The remaining carrying value recognized in the consolidated balance sheets represents investments in real estatecarried at cost less accumulated depreciation, or real estate joint ventures and other limited partnership interests accounted for using theequity method, which do not meet the definition of financial instruments for which fair value is required to be disclosed.
The estimated fair values for other limited partnership interests and real estate joint ventures accounted for under the cost method aregenerally based on the Company’s share of the NAV as provided in the financial statements of the investees. In certain circumstances,management may adjust the NAV by a premium or discount when it has sufficient evidence to support applying such adjustments.
Short-term InvestmentsCertain short-term investments do not qualify as securities and are recognized at amortized cost in the consolidated balance sheets. For
these instruments, the Company believes that there is minimal risk of material changes in interest rates or credit of the issuer such thatestimated fair value approximates carrying value. In light of recent market conditions, short-term investments have been monitored to ensurethere is sufficient demand and maintenance of issuer credit quality and the Company has determined additional adjustment is not required.
Other Invested AssetsOther invested assets within the preceding tables are principally comprised of an investment in a funding agreement, funds withheld,
various interest-bearing assets held in foreign subsidiaries and certain amounts due under contractual indemnifications.The estimated fair value of the investment in funding agreements is estimated by discounting the expected future cash flows using current
market rates and the credit risk of the note issuer. For funds withheld and the various interest-bearing assets held in foreign subsidiaries, theCompany evaluates the specific facts and circumstances of each instrument to determine the appropriate estimated fair values. Theseestimated fair values were not materially different from the recognized carrying values.
Cash and Cash EquivalentsDue to the short-term maturities of cash and cash equivalents, the Company believes there is minimal risk of material changes in interest
rates or credit of the issuer such that estimated fair value generally approximates carrying value. In light of recent market conditions, cash andcash equivalent instruments have been monitored to ensure there is sufficient demand and maintenance of issuer credit quality, or sufficientsolvency in the case of depository institutions, and the Company has determined additional adjustment is not required.
Accrued Investment IncomeDue to the short term until settlement of accrued investment income, the Company believes there is minimal risk of material changes in
interest rates or credit of the issuer such that estimated fair value approximates carrying value. In light of recent market conditions, theCompany has monitored the credit quality of the issuers and has determined additional adjustment is not required.
Premiums, Reinsurance and Other ReceivablesPremiums, reinsurance and other receivables in the preceding tables are principally comprised of certain amounts recoverable under
reinsurance contracts, amounts on deposit with financial institutions to facilitate daily settlements related to certain derivative positions andamounts receivable for securities sold but not yet settled.
Premiums receivable and those amounts recoverable under reinsurance treaties determined to transfer sufficient risk are not financialinstruments subject to disclosure and thus have been excluded from the amounts presented in the preceding tables. Amounts recoverableunder ceded reinsurance contracts, which the Company has determined do not transfer sufficient risk such that they are accounted for usingthe deposit method of accounting, have been included in the preceding tables. The estimated fair value is determined as the present value ofexpected future cash flows under the related contracts, which were discounted using an interest rate determined to reflect the appropriatecredit standing of the assuming counterparty.
F-91MetLife, Inc.
MetLife, Inc.
Notes to the Consolidated Financial Statements — (Continued)

The amounts on deposit for derivative settlements essentially represent the equivalent of demand deposit balances and amounts due forsecurities sold are generally received over short periods such that the estimated fair value approximates carrying value. In light of recentmarket conditions, the Company has monitored the solvency position of the financial institutions and has determined additional adjustmentsare not required.
Other AssetsOther assets in the preceding tables is a receivable for cash paid to an unaffiliated financial institution under the MetLife Reinsurance
Company of Charleston (“MRC”) collateral financing arrangement as described in Note 12. With the exception of the receivable for cash paidto the unaffiliated financial institution, other assets are not considered financial instruments subject to disclosure. Accordingly, the amountpresented in the preceding tables represents the receivable for the cash paid to the unaffiliated financial institution under the MRC collateralfinancing arrangement for which the estimated fair value was determined by discounting the expected future cash flows using a discount ratethat reflects the credit rating of the unaffiliated financial institution.
Policyholder Account BalancesPolicyholder account balances in the tables above include investment contracts. Embedded derivatives on investment contracts and
certain variable annuity guarantees accounted for as embedded derivatives are included in this caption in the consolidated financialstatements but excluded from this caption in the tables above as they are separately presented in “— Recurring Fair Value Measurements.”The remaining difference between the amounts reflected as policyholder account balances in the preceding table and those recognized in theconsolidated balance sheets represents those amounts due under contracts that satisfy the definition of insurance contracts and are notconsidered financial instruments.
The investment contracts primarily include certain funding agreements, fixed deferred annuities, modified guaranteed annuities, fixedterm payout annuities and total control accounts. The fair values for these investment contracts are estimated by discounting best estimatefuture cash flows using current market risk-free interest rates and adding a spread to reflect the nonperformance risk in the liability.
Payables for Collateral Under Securities Loaned and Other TransactionsThe estimated fair value for payables for collateral under securities loaned and other transactions approximates carrying value. The related
agreements to loan securities are short-term in nature such that the Company believes there is limited risk of a material change in marketinterest rates. Additionally, because borrowers are cross-collateralized by the borrowed securities, the Company believes no additionalconsideration for changes in nonperformance risk are necessary.
Bank DepositsDue to the frequency of interest rate resets on customer bank deposits held in money market accounts, the Company believes that there is
minimal risk of a material change in interest rates such that the estimated fair value approximates carrying value. For time deposits, estimatedfair values are estimated by discounting the expected cash flows to maturity using a discount rate based on an average market rate forcertificates of deposit being offered by a representative group of large financial institutions at the date of the valuation.
Short-term and Long-term Debt, Collateral Financing Arrangements and Junior Subordinated Debt SecuritiesThe estimated fair value for short-term debt approximates carrying value due to the short-term nature of these obligations. The estimated
fair values of long-term debt, collateral financing arrangements and junior subordinated debt securities are generally determined bydiscounting expected future cash flows using market rates currently available for debt with similar remaining maturities and reflecting thecredit risk of the Company, including inputs when available, from actively traded debt of the Company or other companies with similar types ofborrowing arrangements. Risk-adjusted discount rates applied to the expected future cash flows can vary significantly based upon thespecific terms of each individual arrangement, including, but not limited to: subordinated rights; contractual interest rates in relation to currentmarket rates; the structuring of the arrangement; and the nature and observability of the applicable valuation inputs. Use of different risk-adjusted discount rates could result in different estimated fair values.
The carrying value of long-term debt presented in the table above differs from the amounts presented in the consolidated balance sheetsas it does not include capital leases which are not required to be disclosed at estimated fair value.
Other LiabilitiesOther liabilities included in the tables above reflect those other liabilities that satisfy the definition of financial instruments subject to
disclosure. These items consist primarily of interest and dividends payable; amounts due for securities purchased but not yet settled; andamounts payable under certain assumed reinsurance treaties accounted for as deposit type treaties. The Company evaluates the specificterms, facts and circumstances of each instrument to determine the appropriate estimated fair values, which were not materially different fromthe carrying values.
Separate Account LiabilitiesSeparate account liabilities included in the preceding tables represent those balances due to policyholders under contracts that are
classified as investment contracts. The remaining amounts presented in the consolidated balance sheets represent those contractsclassified as insurance contracts, which do not satisfy the definition of financial instruments.
Separate account liabilities classified as investment contracts primarily represent variable annuities with no significant mortality risk to theCompany such that the death benefit is equal to the account balance; funding agreements related to group life contracts; and certaincontracts that provide for benefit funding.
Separate account liabilities are recognized in the consolidated balance sheets at an equivalent value of the related separate accountassets. Separate account assets, which equal net deposits, net investment income and realized and unrealized investment gains and losses,are fully offset by corresponding amounts credited to the contractholders’ liability which is reflected in separate account liabilities. Sinceseparate account liabilities are fully funded by cash flows from the separate account assets which are recognized at estimated fair value as
F-92 MetLife, Inc.
MetLife, Inc.
Notes to the Consolidated Financial Statements — (Continued)
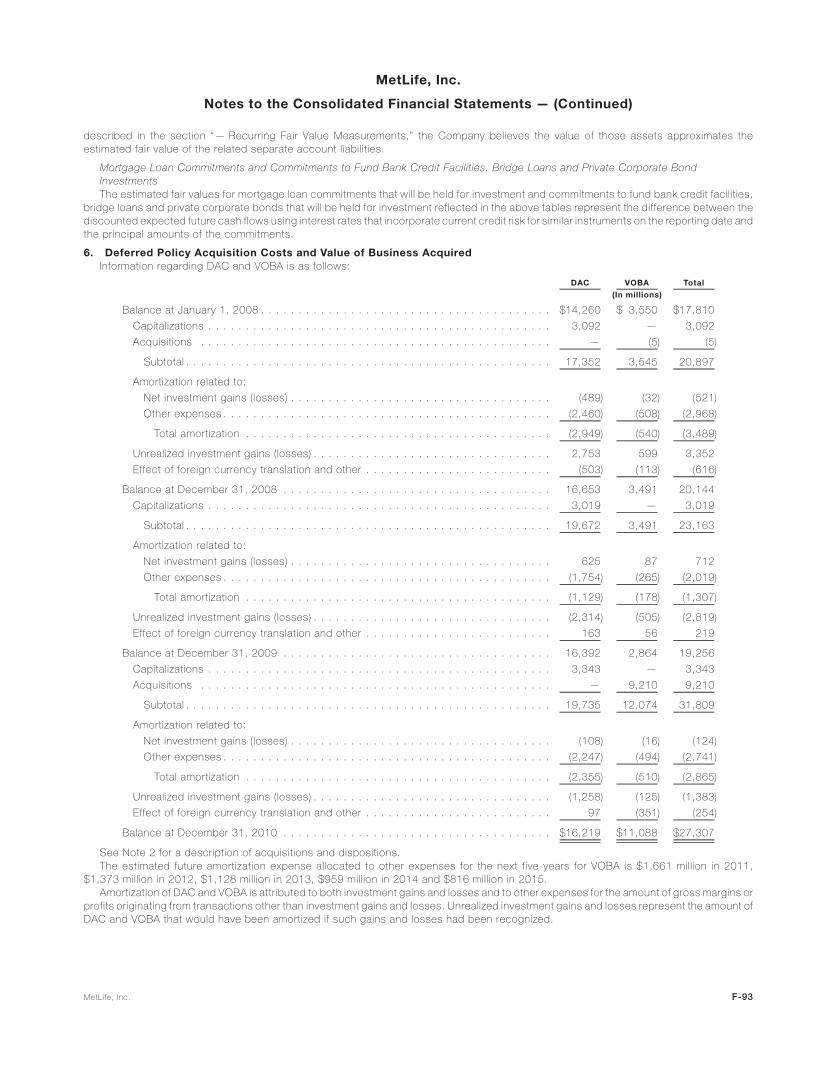
described in the section “— Recurring Fair Value Measurements,” the Company believes the value of those assets approximates theestimated fair value of the related separate account liabilities.
Mortgage Loan Commitments and Commitments to Fund Bank Credit Facilities, Bridge Loans and Private Corporate BondInvestmentsThe estimated fair values for mortgage loan commitments that will be held for investment and commitments to fund bank credit facilities,
bridge loans and private corporate bonds that will be held for investment reflected in the above tables represent the difference between thediscounted expected future cash flows using interest rates that incorporate current credit risk for similar instruments on the reporting date andthe principal amounts of the commitments.
6. Deferred Policy Acquisition Costs and Value of Business AcquiredInformation regarding DAC and VOBA is as follows:
DAC VOBA Total
(In millions)
Balance at January 1, 2008 . . . . . . . . . . . . . . . . . . . . . . . . . . . . . . . . . . . . . . . $14,260 $ 3,550 $17,810
Capitalizations . . . . . . . . . . . . . . . . . . . . . . . . . . . . . . . . . . . . . . . . . . . . . . 3,092 — 3,092
Acquisitions . . . . . . . . . . . . . . . . . . . . . . . . . . . . . . . . . . . . . . . . . . . . . . . — (5) (5)
Subtotal . . . . . . . . . . . . . . . . . . . . . . . . . . . . . . . . . . . . . . . . . . . . . . . . . 17,352 3,545 20,897
Amortization related to:
Net investment gains (losses) . . . . . . . . . . . . . . . . . . . . . . . . . . . . . . . . . . . (489) (32) (521)
Other expenses . . . . . . . . . . . . . . . . . . . . . . . . . . . . . . . . . . . . . . . . . . . . (2,460) (508) (2,968)
Total amortization . . . . . . . . . . . . . . . . . . . . . . . . . . . . . . . . . . . . . . . . . (2,949) (540) (3,489)
Unrealized investment gains (losses) . . . . . . . . . . . . . . . . . . . . . . . . . . . . . . . . 2,753 599 3,352
Effect of foreign currency translation and other . . . . . . . . . . . . . . . . . . . . . . . . . (503) (113) (616)
Balance at December 31, 2008 . . . . . . . . . . . . . . . . . . . . . . . . . . . . . . . . . . . . 16,653 3,491 20,144
Capitalizations . . . . . . . . . . . . . . . . . . . . . . . . . . . . . . . . . . . . . . . . . . . . . . 3,019 — 3,019
Subtotal . . . . . . . . . . . . . . . . . . . . . . . . . . . . . . . . . . . . . . . . . . . . . . . . . 19,672 3,491 23,163
Amortization related to:
Net investment gains (losses) . . . . . . . . . . . . . . . . . . . . . . . . . . . . . . . . . . . 625 87 712
Other expenses . . . . . . . . . . . . . . . . . . . . . . . . . . . . . . . . . . . . . . . . . . . . (1,754) (265) (2,019)
Total amortization . . . . . . . . . . . . . . . . . . . . . . . . . . . . . . . . . . . . . . . . . (1,129) (178) (1,307)
Unrealized investment gains (losses) . . . . . . . . . . . . . . . . . . . . . . . . . . . . . . . . (2,314) (505) (2,819)
Effect of foreign currency translation and other . . . . . . . . . . . . . . . . . . . . . . . . . 163 56 219
Balance at December 31, 2009 . . . . . . . . . . . . . . . . . . . . . . . . . . . . . . . . . . . . 16,392 2,864 19,256
Capitalizations . . . . . . . . . . . . . . . . . . . . . . . . . . . . . . . . . . . . . . . . . . . . . . 3,343 — 3,343
Acquisitions . . . . . . . . . . . . . . . . . . . . . . . . . . . . . . . . . . . . . . . . . . . . . . . — 9,210 9,210
Subtotal . . . . . . . . . . . . . . . . . . . . . . . . . . . . . . . . . . . . . . . . . . . . . . . . . 19,735 12,074 31,809
Amortization related to:
Net investment gains (losses) . . . . . . . . . . . . . . . . . . . . . . . . . . . . . . . . . . . (108) (16) (124)
Other expenses . . . . . . . . . . . . . . . . . . . . . . . . . . . . . . . . . . . . . . . . . . . . (2,247) (494) (2,741)
Total amortization . . . . . . . . . . . . . . . . . . . . . . . . . . . . . . . . . . . . . . . . . (2,355) (510) (2,865)
Unrealized investment gains (losses) . . . . . . . . . . . . . . . . . . . . . . . . . . . . . . . . (1,258) (125) (1,383)
Effect of foreign currency translation and other . . . . . . . . . . . . . . . . . . . . . . . . . 97 (351) (254)
Balance at December 31, 2010 . . . . . . . . . . . . . . . . . . . . . . . . . . . . . . . . . . . . $16,219 $11,088 $27,307
See Note 2 for a description of acquisitions and dispositions.The estimated future amortization expense allocated to other expenses for the next five years for VOBA is $1,661 million in 2011,
$1,373 million in 2012, $1,128 million in 2013, $959 million in 2014 and $816 million in 2015.Amortization of DAC and VOBA is attributed to both investment gains and losses and to other expenses for the amount of gross margins or
profits originating from transactions other than investment gains and losses. Unrealized investment gains and losses represent the amount ofDAC and VOBA that would have been amortized if such gains and losses had been recognized.
F-93MetLife, Inc.
MetLife, Inc.
Notes to the Consolidated Financial Statements — (Continued)

Information regarding DAC and VOBA by segment and reporting unit is as follows:
2010 2009 2010 2009 2010 2009
December 31,
DAC VOBA Total
(In millions)
U.S. Business:
Insurance Products:
Group life . . . . . . . . . . . . . . . . . . . . . . . . . . $ 25 $ 27 $ — $ — $ 25 $ 27
Individual life . . . . . . . . . . . . . . . . . . . . . . . . 7,257 8,129 833 1,005 8,090 9,134
Non-medical health . . . . . . . . . . . . . . . . . . . 965 942 — — 965 942
Total Insurance Products . . . . . . . . . . . . . . . 8,247 9,098 833 1,005 9,080 10,103
Retirement Products . . . . . . . . . . . . . . . . . . . . 4,706 4,612 1,094 1,412 5,800 6,024
Corporate Benefit Funding . . . . . . . . . . . . . . . . 74 72 1 2 75 74
Auto & Home . . . . . . . . . . . . . . . . . . . . . . . . . 190 181 — — 190 181
Total U.S. Business . . . . . . . . . . . . . . . . . . 13,217 13,963 1,928 2,419 15,145 16,382
International . . . . . . . . . . . . . . . . . . . . . . . . . . . 3,000 2,426 9,159 444 12,159 2,870
Banking, Corporate & Other . . . . . . . . . . . . . . . . . 2 3 1 1 3 4
Total . . . . . . . . . . . . . . . . . . . . . . . . . . $16,219 $16,392 $11,088 $2,864 $27,307 $19,256
7. GoodwillGoodwill is the excess of cost over the estimated fair value of net assets acquired. Information regarding goodwill is as follows:
2010 2009 2008
December 31,
(In millions)
Balance at January 1, . . . . . . . . . . . . . . . . . . . . . . . . . . . . . . . . . . . . . . . . . . . . $ 5,047 $5,008 $4,814
Acquisitions . . . . . . . . . . . . . . . . . . . . . . . . . . . . . . . . . . . . . . . . . . . . . . . . . . . 6,959 — 256
Effect of foreign currency translation and other . . . . . . . . . . . . . . . . . . . . . . . . . . . . (225) 39 (62)
Balance at December 31, . . . . . . . . . . . . . . . . . . . . . . . . . . . . . . . . . . . . . . . . . . $11,781 $5,047 $5,008
Information regarding allocated goodwill by segment and reporting unit is as follows:
2010 2009
December 31,
(In millions)
U.S. Business:
Insurance Products:
Group life . . . . . . . . . . . . . . . . . . . . . . . . . . . . . . . . . . . . . . . . . . . . . . . . . . . . . . . . . $ 2 $ 2
Individual life . . . . . . . . . . . . . . . . . . . . . . . . . . . . . . . . . . . . . . . . . . . . . . . . . . . . . . . 1,263 1,263
Non-medical health . . . . . . . . . . . . . . . . . . . . . . . . . . . . . . . . . . . . . . . . . . . . . . . . . . . 149 149
Total Insurance Products . . . . . . . . . . . . . . . . . . . . . . . . . . . . . . . . . . . . . . . . . . . . . . 1,414 1,414
Retirement Products . . . . . . . . . . . . . . . . . . . . . . . . . . . . . . . . . . . . . . . . . . . . . . . . . . . 1,692 1,692
Corporate Benefit Funding . . . . . . . . . . . . . . . . . . . . . . . . . . . . . . . . . . . . . . . . . . . . . . . 900 900
Auto & Home . . . . . . . . . . . . . . . . . . . . . . . . . . . . . . . . . . . . . . . . . . . . . . . . . . . . . . . . 157 157
Total U.S. Business . . . . . . . . . . . . . . . . . . . . . . . . . . . . . . . . . . . . . . . . . . . . . . . . . . . . . 4,163 4,163
International:
Latin America . . . . . . . . . . . . . . . . . . . . . . . . . . . . . . . . . . . . . . . . . . . . . . . . . . . . . . . . 229 214
Asia Pacific . . . . . . . . . . . . . . . . . . . . . . . . . . . . . . . . . . . . . . . . . . . . . . . . . . . . . . . . . 72 160
Europe and the Middle East . . . . . . . . . . . . . . . . . . . . . . . . . . . . . . . . . . . . . . . . . . . . . . . 38 40
Total International . . . . . . . . . . . . . . . . . . . . . . . . . . . . . . . . . . . . . . . . . . . . . . . . . . 339 414
Banking, Corporate & Other . . . . . . . . . . . . . . . . . . . . . . . . . . . . . . . . . . . . . . . . . . . . . . . . 470 470
Total . . . . . . . . . . . . . . . . . . . . . . . . . . . . . . . . . . . . . . . . . . . . . . . . . . . . . . . . . . . . . . . $4,972 $5,047
The above table does not include goodwill of $6,809 million at December 31, 2010, associated with ALICO which has not yet beenallocated to a reporting unit due to the timing of the Acquisition. See Note 2 for a description of acquisitions and dispositions.
F-94 MetLife, Inc.
MetLife, Inc.
Notes to the Consolidated Financial Statements — (Continued)
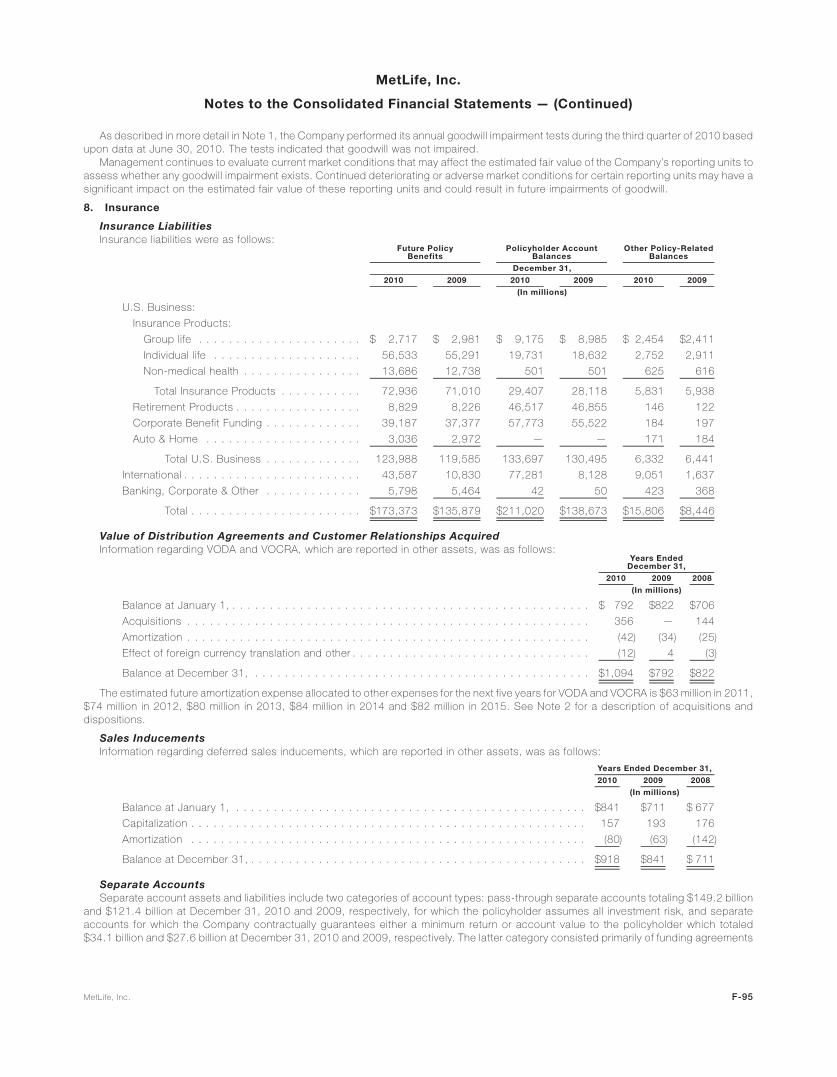
As described in more detail in Note 1, the Company performed its annual goodwill impairment tests during the third quarter of 2010 basedupon data at June 30, 2010. The tests indicated that goodwill was not impaired.
Management continues to evaluate current market conditions that may affect the estimated fair value of the Company’s reporting units toassess whether any goodwill impairment exists. Continued deteriorating or adverse market conditions for certain reporting units may have asignificant impact on the estimated fair value of these reporting units and could result in future impairments of goodwill.
8. Insurance
Insurance LiabilitiesInsurance liabilities were as follows:
2010 2009 2010 2009 2010 2009
December 31,
Future PolicyBenefits
Policyholder AccountBalances
Other Policy-RelatedBalances
(In millions)
U.S. Business:
Insurance Products:
Group life . . . . . . . . . . . . . . . . . . . . . . $ 2,717 $ 2,981 $ 9,175 $ 8,985 $ 2,454 $2,411
Individual life . . . . . . . . . . . . . . . . . . . . 56,533 55,291 19,731 18,632 2,752 2,911
Non-medical health . . . . . . . . . . . . . . . . 13,686 12,738 501 501 625 616
Total Insurance Products . . . . . . . . . . . 72,936 71,010 29,407 28,118 5,831 5,938
Retirement Products . . . . . . . . . . . . . . . . . 8,829 8,226 46,517 46,855 146 122
Corporate Benefit Funding . . . . . . . . . . . . . 39,187 37,377 57,773 55,522 184 197
Auto & Home . . . . . . . . . . . . . . . . . . . . . 3,036 2,972 — — 171 184
Total U.S. Business . . . . . . . . . . . . . 123,988 119,585 133,697 130,495 6,332 6,441
International . . . . . . . . . . . . . . . . . . . . . . . . 43,587 10,830 77,281 8,128 9,051 1,637
Banking, Corporate & Other . . . . . . . . . . . . . 5,798 5,464 42 50 423 368
Total . . . . . . . . . . . . . . . . . . . . . . . $173,373 $135,879 $211,020 $138,673 $15,806 $8,446
Value of Distribution Agreements and Customer Relationships AcquiredInformation regarding VODA and VOCRA, which are reported in other assets, was as follows:
2010 2009 2008
Years EndedDecember 31,
(In millions)
Balance at January 1, . . . . . . . . . . . . . . . . . . . . . . . . . . . . . . . . . . . . . . . . . . . . . . . . $ 792 $822 $706
Acquisitions . . . . . . . . . . . . . . . . . . . . . . . . . . . . . . . . . . . . . . . . . . . . . . . . . . . . . . 356 — 144
Amortization . . . . . . . . . . . . . . . . . . . . . . . . . . . . . . . . . . . . . . . . . . . . . . . . . . . . . . (42) (34) (25)
Effect of foreign currency translation and other . . . . . . . . . . . . . . . . . . . . . . . . . . . . . . . . (12) 4 (3)
Balance at December 31, . . . . . . . . . . . . . . . . . . . . . . . . . . . . . . . . . . . . . . . . . . . . . $1,094 $792 $822
The estimated future amortization expense allocated to other expenses for the next five years for VODA and VOCRA is $63 million in 2011,$74 million in 2012, $80 million in 2013, $84 million in 2014 and $82 million in 2015. See Note 2 for a description of acquisitions anddispositions.
Sales InducementsInformation regarding deferred sales inducements, which are reported in other assets, was as follows:
2010 2009 2008
Years Ended December 31,
(In millions)
Balance at January 1, . . . . . . . . . . . . . . . . . . . . . . . . . . . . . . . . . . . . . . . . . . . . . . . $841 $711 $ 677
Capitalization . . . . . . . . . . . . . . . . . . . . . . . . . . . . . . . . . . . . . . . . . . . . . . . . . . . . . 157 193 176
Amortization . . . . . . . . . . . . . . . . . . . . . . . . . . . . . . . . . . . . . . . . . . . . . . . . . . . . . (80) (63) (142)
Balance at December 31, . . . . . . . . . . . . . . . . . . . . . . . . . . . . . . . . . . . . . . . . . . . . . $918 $841 $ 711
Separate AccountsSeparate account assets and liabilities include two categories of account types: pass-through separate accounts totaling $149.2 billion
and $121.4 billion at December 31, 2010 and 2009, respectively, for which the policyholder assumes all investment risk, and separateaccounts for which the Company contractually guarantees either a minimum return or account value to the policyholder which totaled$34.1 billion and $27.6 billion at December 31, 2010 and 2009, respectively. The latter category consisted primarily of funding agreements
F-95MetLife, Inc.
MetLife, Inc.
Notes to the Consolidated Financial Statements — (Continued)

and participating close-out contracts. The average interest rate credited on these contracts was 3.32% and 3.35% at December 31, 2010and 2009, respectively.
Fees charged to the separate accounts by the Company (including mortality charges, policy administration fees and surrender charges)are reflected in the Company’s revenues as universal life and investment-type product policy fees and totaled $3.2 billion, $2.6 billion and$3.2 billion for the years ended December 31, 2010, 2009 and 2008, respectively.
The Company’s proportional interest in separate accounts was included in the consolidated balance sheets as follows at:
2010 2009
December 31,
(In millions)
Fixed maturity securities . . . . . . . . . . . . . . . . . . . . . . . . . . . . . . . . . . . . . . . . . . . . . . . . . . . . $257 $11
Equity securities . . . . . . . . . . . . . . . . . . . . . . . . . . . . . . . . . . . . . . . . . . . . . . . . . . . . . . . . . $ 33 $57
Cash and cash equivalents . . . . . . . . . . . . . . . . . . . . . . . . . . . . . . . . . . . . . . . . . . . . . . . . . . $ 74 $ 2For the years ended December 31, 2010, 2009 and 2008, there were no investment gains (losses) on transfers of assets from the general
account to the separate accounts.
Obligations Under Funding AgreementsThe Company issues fixed and floating rate funding agreements, which are denominated in either U.S. dollars or foreign currencies, to
certain SPEs that have issued either debt securities or commercial paper for which payment of interest and principal is secured by suchfunding agreements. During the years ended December 31, 2010, 2009 and 2008, the Company issued $34.1 billion, $28.6 billion and$20.9 billion, respectively, and repaid $30.9 billion, $32.0 billion and $19.8 billion, respectively, of such funding agreements. AtDecember 31, 2010 and 2009, funding agreements outstanding, which are included in policyholder account balances, were $27.2 billionand $23.3 billion, respectively. During the years ended December 31, 2010, 2009 and 2008, interest credited on the funding agreements,which is included in interest credited to policyholder account balances, was $0.6 billion, $0.7 billion and $1.1 billion, respectively.
MetLife Insurance Company of Connecticut (“MICC”) is a member of the FHLB of Boston and held $70 million of common stock of theFHLB of Boston at both December 31, 2010 and 2009, which is included in equity securities. MICC has also entered into funding agreementswith the FHLB of Boston in exchange for cash and for which the FHLB of Boston has been granted a blanket lien on certain MICC assets,including RMBS, to collateralize MICC’s obligations under the funding agreements. MICC maintains control over these pledged assets, andmay use, commingle, encumber or dispose of any portion of the collateral as long as there is no event of default and the remaining qualifiedcollateral is sufficient to satisfy the collateral maintenance level. Upon any event of default by MICC, the FHLB of Boston’s recovery on thecollateral is limited to the amount of MICC’s liability to the FHLB of Boston. The amount of MICC’s liability for funding agreements with the FHLBof Boston was $100 million and $326 million at December 31, 2010 and 2009, respectively, which is included in policyholder accountbalances. The advances on these funding agreements are collateralized by mortgage-backed securities with estimated fair values of$211 million and $419 million at December 31, 2010 and 2009, respectively. During the years ended December 31, 2010, 2009 and 2008,interest credited on the funding agreements, which is included in interest credited to policyholder account balances, was $1 million,$6 million and $15 million, respectively.
Metropolitan Life Insurance Company (“MLIC”) is a member of the FHLB of NY and held $890 million and $742 million of common stock ofthe FHLB of NY at December 31, 2010 and 2009, respectively, which is included in equity securities. MLIC has also entered into fundingagreements with the FHLB of NY in exchange for cash and for which the FHLB of NY has been granted a lien on certain MLIC assets, includingRMBS to collateralize MLIC’s obligations under the funding agreements. MLIC maintains control over these pledged assets, and may use,commingle, encumber or dispose of any portion of the collateral as long as there is no event of default and the remaining qualified collateral issufficient to satisfy the collateral maintenance level. Upon any event of default by MLIC, the FHLB of NY’s recovery on the collateral is limited tothe amount of MLIC’s liability to the FHLB of NY. The amount of the MLIC’s liability for funding agreements with the FHLB of NY was $12.6 billionand $13.7 billion at December 31, 2010 and 2009, respectively, which is included in policyholder account balances. The advances on theseagreements were collateralized by mortgage-backed securities with estimated fair values of $14.2 billion and $15.1 billion at December 31,2010 and 2009, respectively. During the years ended December 31, 2010, 2009 and 2008, interest credited on the funding agreements,which is included in interest credited to policyholder account balances, was $276 million, $333 million and $229 million, respectively.
During 2010, MetLife Investors Insurance Company (“MLIIC”) and General American Life Insurance Company (“GALIC”) became membersof the Federal Home Loan Bank of Des Moines (“FHLB of Des Moines) and each held $10 million of common stock of the FHLB of Des Moinesat December 31, 2010, which is included in equity securities. MLIIC and GALIC had no funding agreements with the FHLB of Des Moines atDecember 31, 2010.
MLIC and MICC have each issued funding agreements to certain SPEs that have issued debt securities for which payment of interest andprincipal is secured by such funding agreements, and such debt securities are also guaranteed as to payment of interest and principal byFarmer Mac, a federally chartered instrumentality of the United States. The obligations under these funding agreements are secured by apledge of certain eligible agricultural real estate mortgage loans and may, under certain circumstances, be secured by other qualifiedcollateral. The amount of the Company’s liability for funding agreements issued to such SPEs was $2.8 billion and $2.5 billion at December 31,2010 and 2009, respectively, which is included in policyholder account balances. The obligations under these funding agreements arecollateralized by designated agricultural real estate mortgage loans with estimated fair values of $3.2 billion and $2.9 billion at December 31,2010 and 2009, respectively. During the years ended December 31, 2010, 2009 and 2008, interest credited on the funding agreements,which is included in interest credited to policyholder account balances, was $135 million, $132 million and $132 million, respectively.
F-96 MetLife, Inc.
MetLife, Inc.
Notes to the Consolidated Financial Statements — (Continued)

Liabilities for Unpaid Claims and Claim ExpensesInformation regarding the liabilities for unpaid claims and claim expenses relating to property and casualty, group accident and non-
medical health policies and contracts, which are reported in future policy benefits and other policy-related balances, is as follows:
2010 2009 2008
Years Ended December 31,
(In millions)
Balance at January 1, . . . . . . . . . . . . . . . . . . . . . . . . . . . . . . . . . . . . . . . . . . . $ 8,219 $ 8,260 $ 7,836
Less: Reinsurance recoverables . . . . . . . . . . . . . . . . . . . . . . . . . . . . . . . . . . . 547 1,042 955
Net balance at January 1, . . . . . . . . . . . . . . . . . . . . . . . . . . . . . . . . . . . . . . . . . 7,672 7,218 6,881
Acquisitions, net . . . . . . . . . . . . . . . . . . . . . . . . . . . . . . . . . . . . . . . . . . . . . . . 583 — —
Incurred related to:
Current year . . . . . . . . . . . . . . . . . . . . . . . . . . . . . . . . . . . . . . . . . . . . . . . . 6,482 6,569 6,263
Prior years . . . . . . . . . . . . . . . . . . . . . . . . . . . . . . . . . . . . . . . . . . . . . . . . . (75) (152) (353)
Total incurred . . . . . . . . . . . . . . . . . . . . . . . . . . . . . . . . . . . . . . . . . . . . . . 6,407 6,417 5,910
Paid related to:
Current year . . . . . . . . . . . . . . . . . . . . . . . . . . . . . . . . . . . . . . . . . . . . . . . . (4,050) (3,972) (3,861)
Prior years . . . . . . . . . . . . . . . . . . . . . . . . . . . . . . . . . . . . . . . . . . . . . . . . . (2,102) (1,991) (1,712)
Total paid . . . . . . . . . . . . . . . . . . . . . . . . . . . . . . . . . . . . . . . . . . . . . . . . . (6,152) (5,963) (5,573)
Net balance at December 31, . . . . . . . . . . . . . . . . . . . . . . . . . . . . . . . . . . . . . . 8,510 7,672 7,218
Add: Reinsurance recoverables . . . . . . . . . . . . . . . . . . . . . . . . . . . . . . . . . . . . 2,198 547 1,042
Balance at December 31, . . . . . . . . . . . . . . . . . . . . . . . . . . . . . . . . . . . . . . . . . $10,708 $ 8,219 $ 8,260
During 2010, 2009 and 2008, as a result of changes in estimates of insured events in the respective prior year, claims and claimadjustment expenses associated with prior years decreased by $75 million, $152 million and $353 million, respectively, due to a reduction inprior year automobile bodily injury and homeowners’ severity, reduced loss adjustment expenses, improved loss ratio for non-medical healthclaim liabilities and improved claim management.
GuaranteesThe Company issues annuity contracts which may include contractual guarantees to the contractholder for: (i) return of no less than total
deposits made to the contract less any partial withdrawals (“return of net deposits”); and (ii) the highest contract value on a specifiedanniversary date minus any withdrawals following the contract anniversary, or total deposits made to the contract less any partial withdrawalsplus a minimum return (“anniversary contract value” or “minimum return”). The Company also issues annuity contracts that apply a lower rateof funds deposited if the contractholder elects to surrender the contract for cash and a higher rate if the contractholder elects to annuitize(“two tier annuities”). These guarantees include benefits that are payable in the event of death, maturity or at annuitization.
The Company also issues universal and variable life contracts where the Company contractually guarantees to the contractholder asecondary guarantee or a guaranteed paid-up benefit.
F-97MetLife, Inc.
MetLife, Inc.
Notes to the Consolidated Financial Statements — (Continued)

Information regarding the types of guarantees relating to annuity contracts and universal and variable life contracts is as follows:
In theEvent of Death
AtAnnuitization
In theEvent of Death
AtAnnuitization
2010 2009
December 31,
(In millions)
Annuity Contracts(1)
Return of Net Deposits
Separate account value . . . . . . . . . . . . . . . . . . . . . . . . $ 55,753 $ 390 $ 41,125 N/A
Net amount at risk(2) . . . . . . . . . . . . . . . . . . . . . . . . . . $ 6,194 (3) $ 289 (4) $ 4,585 (3) N/A
Average attained age of contractholders . . . . . . . . . . . . . 62 years 67 years 62 years N/A
Anniversary Contract Value or Minimum Return
Separate account value . . . . . . . . . . . . . . . . . . . . . . . . $ 92,041 $ 55,668 $ 78,808 $ 40,234
Net amount at risk(2) . . . . . . . . . . . . . . . . . . . . . . . . . . $ 5,297 (3) $ 6,373 (4) $ 9,039 (3) $ 7,361 (4)
Average attained age of contractholders . . . . . . . . . . . . . 62 years 61 years 61 years 61 years
Two Tier Annuities
General account value . . . . . . . . . . . . . . . . . . . . . . . . . N/A $ 280 N/A $ 282
Net amount at risk(2) . . . . . . . . . . . . . . . . . . . . . . . . . . N/A $ 49 (5) N/A $ 50 (5)
Average attained age of contractholders . . . . . . . . . . . . . N/A 62 years N/A 61 years
SecondaryGuarantees
Paid-UpGuarantees
SecondaryGuarantees
Paid-UpGuarantees
2010 2009
December 31,
(In millions)
Universal and Variable Life Contracts(1)
Account value (general and separate account) . . . . . . . . . . . $ 11,015 $ 4,102 $ 9,483 $ 4,104
Net amount at risk(2) . . . . . . . . . . . . . . . . . . . . . . . . . . . $156,432 (3) $ 26,851 (3) $150,905 (3) $ 28,826 (3)
Average attained age of policyholders . . . . . . . . . . . . . . . . 52 years 58 years 52 years 57 years
(1) The Company’s annuity and life contracts with guarantees may offer more than one type of guarantee in each contract. Therefore, theamounts listed above may not be mutually exclusive.
(2) The net amount at risk is based on the direct and assumed amount at risk (excluding ceded reinsurance).(3) The net amount at risk for guarantees of amounts in the event of death is defined as the current GMDB in excess of the current account
balance at the balance sheet date.(4) The net amount at risk for guarantees of amounts at annuitization is defined as the present value of the minimum guaranteed annuity
payments available to the contractholder determined in accordance with the terms of the contract in excess of the current accountbalance.
(5) The net amount at risk for two tier annuities is based on the excess of the upper tier, adjusted for a profit margin, less the lower tier.
F-98 MetLife, Inc.
MetLife, Inc.
Notes to the Consolidated Financial Statements — (Continued)

Information regarding the liabilities for guarantees (excluding base policy liabilities) relating to annuity and universal and variable lifecontracts is as follows:
GuaranteedDeath
Benefits
GuaranteedAnnuitization
BenefitsSecondaryGuarantees
Paid-UpGuarantees Total
Annuity ContractsUniversal and Variable
Life Contracts
(In millions)
Direct
Balance at January 1, 2008 . . . . . . . . . . . . . . . . . . $ 80 $ 78 $ 152 $121 $ 431
Incurred guaranteed benefits . . . . . . . . . . . . . . . . 267 325 119 19 730
Paid guaranteed benefits . . . . . . . . . . . . . . . . . . (96) — — — (96)
Balance at December 31, 2008 . . . . . . . . . . . . . . . 251 403 271 140 1,065
Incurred guaranteed benefits . . . . . . . . . . . . . . . . 118 (1) 233 34 384
Paid guaranteed benefits . . . . . . . . . . . . . . . . . . (201) — — — (201)
Balance at December 31, 2009 . . . . . . . . . . . . . . . 168 402 504 174 1,248
Acquisitions . . . . . . . . . . . . . . . . . . . . . . . . . . 46 110 2,952 — 3,108
Incurred guaranteed benefits . . . . . . . . . . . . . . . . 149 111 536 24 820
Paid guaranteed benefits . . . . . . . . . . . . . . . . . . (91) — (1) — (92)
Balance at December 31, 2010 . . . . . . . . . . . . . . . $ 272 $623 $3,991 $198 $5,084
Ceded
Balance at January 1, 2008 . . . . . . . . . . . . . . . . . . $ 6 $ 4 $ 55 $ 75 $ 140
Incurred guaranteed benefits . . . . . . . . . . . . . . . . 18 (4) 25 15 54
Paid guaranteed benefits . . . . . . . . . . . . . . . . . . (16) — — — (16)
Balance at December 31, 2008 . . . . . . . . . . . . . . . 8 — 80 90 178
Incurred guaranteed benefits . . . . . . . . . . . . . . . . 26 — 102 32 160
Paid guaranteed benefits . . . . . . . . . . . . . . . . . . (28) — — — (28)
Balance at December 31, 2009 . . . . . . . . . . . . . . . 6 — 182 122 310
Acquisitions . . . . . . . . . . . . . . . . . . . . . . . . . . 30 — — — 30
Incurred guaranteed benefits . . . . . . . . . . . . . . . . 18 (1) 412 17 446
Paid guaranteed benefits . . . . . . . . . . . . . . . . . . (15) — — — (15)
Balance at December 31, 2010 . . . . . . . . . . . . . . . $ 39 $ (1) $ 594 $139 $ 771
Net
Balance at January 1, 2008 . . . . . . . . . . . . . . . . . . $ 74 $ 74 $ 97 $ 46 $ 291
Incurred guaranteed benefits . . . . . . . . . . . . . . . . 249 329 94 4 676
Paid guaranteed benefits . . . . . . . . . . . . . . . . . . (80) — — — (80)
Balance at December 31, 2008 . . . . . . . . . . . . . . . 243 403 191 50 887
Incurred guaranteed benefits . . . . . . . . . . . . . . . . 92 (1) 131 2 224
Paid guaranteed benefits . . . . . . . . . . . . . . . . . . (173) — — — (173)
Balance at December 31, 2009 . . . . . . . . . . . . . . . 162 402 322 52 938
Acquisitions . . . . . . . . . . . . . . . . . . . . . . . . . . 16 110 2,952 — 3,078
Incurred guaranteed benefits . . . . . . . . . . . . . . . . 131 112 124 7 374
Paid guaranteed benefits . . . . . . . . . . . . . . . . . . (76) — (1) — (77)
Balance at December 31, 2010 . . . . . . . . . . . . . . . $ 233 $624 $3,397 $ 59 $4,313
F-99MetLife, Inc.
MetLife, Inc.
Notes to the Consolidated Financial Statements — (Continued)

Account balances of contracts with insurance guarantees are invested in separate account asset classes as follows:
2010 2009
December 31,
(In millions)
Fund Groupings:
Equity . . . . . . . . . . . . . . . . . . . . . . . . . . . . . . . . . . . . . . . . . . . . . . . . . . . . . . . . . . $ 59,546 $48,852
Balanced . . . . . . . . . . . . . . . . . . . . . . . . . . . . . . . . . . . . . . . . . . . . . . . . . . . . . . . . 40,199 31,011
Bond . . . . . . . . . . . . . . . . . . . . . . . . . . . . . . . . . . . . . . . . . . . . . . . . . . . . . . . . . . . 9,539 7,166
Money Market . . . . . . . . . . . . . . . . . . . . . . . . . . . . . . . . . . . . . . . . . . . . . . . . . . . . . 1,584 2,104
Specialty . . . . . . . . . . . . . . . . . . . . . . . . . . . . . . . . . . . . . . . . . . . . . . . . . . . . . . . . 2,192 1,865
Total . . . . . . . . . . . . . . . . . . . . . . . . . . . . . . . . . . . . . . . . . . . . . . . . . . . . . . . . . . $113,060 $90,998
9. ReinsuranceThe Company participates in reinsurance activities in order to limit losses, minimize exposure to significant risks and provide additional
capacity for future growth.For its individual life insurance products, the Company has historically reinsured the mortality risk primarily on an excess of retention basis
or a quota share basis. The Company currently reinsures 90% of the mortality risk in excess of $1 million for most products and reinsures up to90% of the mortality risk for certain other products. In addition to reinsuring mortality risk as described above, the Company reinsures otherrisks, as well as specific coverages. Placement of reinsurance is done primarily on an automatic basis and also on a facultative basis for riskswith specified characteristics. On a case by case basis, the Company may retain up to $20 million per life and reinsure 100% of amounts inexcess of the amount the Company retains. The Company evaluates its reinsurance programs routinely and may increase or decrease itsretention at any time.
For other policies within the Insurance Products segment, the Company generally retains most of the risk and only cedes particular risks oncertain client arrangements.
The Company’s Retirement Products segment reinsures a portion of the living and death benefit guarantees issued in connection with itsvariable annuities. Under these reinsurance agreements, the Company pays a reinsurance premium generally based on fees associated withthe guarantees collected from policyholders, and receives reimbursement for benefits paid or accrued in excess of account values, subject tocertain limitations.
The Company’s Corporate Benefit Funding segment periodically engages in reinsurance activities, as considered appropriate. The impactof these activities on the financial results of this segment has not been significant.
The Company’s Auto & Home segment purchases reinsurance to manage its exposure to large losses (primarily catastrophe losses) andto protect statutory surplus. The Company cedes to reinsurers a portion of losses and premiums based upon the exposure of the policiessubject to reinsurance. To manage exposure to large property and casualty losses, the Company utilizes property catastrophe, casualty andproperty per risk excess of loss agreements.
For its life insurance products within the International segment, the Company reinsures, depending on the product, risks above thecorporate retention limit of up to $5 million to external reinsurers on a yearly renewable term basis. The Company’s international businessesmay also reinsure certain risks with external reinsurers depending upon the nature of the risk and local regulatory requirements. TheCompany’s International segment reinsures, for selected large corporate customers, its group employee benefits or credit insurancebusiness with various client-affiliated reinsurance companies, covering policies issued to the employees or customers of the clients.Additionally, the Company cedes and assumes risk with other insurance companies when either company requires a business partner withthe appropriate local licensing to issue certain types of policies in certain countries. In these cases, the assuming company typicallyunderwrites the risks, develops the products and assumes most or all of the risk. The Company’s International segment also has reinsuranceagreements in force that reinsure a portion of the living and death benefit guarantees issued in connection with its variable annuities. Underthese agreements, the Company pays reinsurance fees associated with the guarantees collected from policyholders, and receivesreimbursement for benefits paid or accrued in excess of account values, subject to certain limitations.
The Company also reinsures, through 100% quota share reinsurance agreements, certain long-term care and workers’ compensationbusiness written by MICC. These are run-off businesses which have been included within Banking, Corporate & Other.
The Company has exposure to catastrophes, which could contribute to significant fluctuations in the Company’s results of operations.The Company uses excess of retention and quota share reinsurance agreements to provide greater diversification of risk and minimizeexposure to larger risks. For its International segment, the Company currently purchases catastrophe coverage to insure risks within certaincountries deemed by management to be exposed to the greatest catastrophic risks.
The Company reinsures its business through a diversified group of well-capitalized, highly rated reinsurers. The Company analyzes recenttrends in arbitration and litigation outcomes in disputes, if any, with its reinsurers. The Company monitors ratings and evaluates the financialstrength of its reinsurers by analyzing their financial statements. In addition, the reinsurance recoverable balance due from each reinsurer isevaluated as part of the overall monitoring process. Recoverability of reinsurance recoverable balances is evaluated based on theseanalyses. The Company generally secures large reinsurance recoverable balances with various forms of collateral, including secured trusts,funds withheld accounts and irrevocable letters of credit. These reinsurance recoverable balances are stated net of allowances foruncollectible reinsurance, which at December 31, 2010 and 2009, were immaterial.
The Company has secured certain reinsurance recoverable balances with various forms of collateral, including secured trusts, fundswithheld accounts and irrevocable letters of credit. The Company had $5.5 billion and $4.4 billion of unsecured unaffiliated reinsurancerecoverable balances at December 31, 2010 and 2009, respectively.
F-100 MetLife, Inc.
MetLife, Inc.
Notes to the Consolidated Financial Statements — (Continued)

At December 31, 2010, the Company had $13.1 billion of net unaffiliated ceded reinsurance recoverables. Of this total, $10.0 billion, or76%, were with the Company’s five largest unaffiliated ceded reinsurers, including $3.6 billion of which were unsecured. At December 31,2009, the Company had $11.7 billion of net unaffiliated ceded reinsurance recoverables. Of this total, $9.2 billion, or 79%, were with theCompany’s five largest unaffiliated ceded reinsurers, including $3.0 billion of which were unsecured.
The Company has reinsured with an unaffiliated third-party reinsurer, 49.25% of the closed block through a modified coinsuranceagreement. The Company accounts for this agreement under the deposit method of accounting. The Company, having the right of offset, hasoffset the modified coinsurance deposit with the deposit recoverable.
The amounts in the consolidated statements of operations include the impact of reinsurance. Information regarding the effect ofreinsurance is as follows:
2010 2009 2008
Years Ended December 31,
(In millions)
Premiums:
Direct premiums . . . . . . . . . . . . . . . . . . . . . . . . . . . . . . . . . . . . . . . . . . . . . $27,923 $27,472 $27,058
Reinsurance assumed . . . . . . . . . . . . . . . . . . . . . . . . . . . . . . . . . . . . . . . . . 1,377 1,313 1,466
Reinsurance ceded . . . . . . . . . . . . . . . . . . . . . . . . . . . . . . . . . . . . . . . . . . . (1,906) (2,325) (2,610)
Net premiums . . . . . . . . . . . . . . . . . . . . . . . . . . . . . . . . . . . . . . . . . . . . . $27,394 $26,460 $25,914
Universal life and investment-type product policy fees:
Direct universal life and investment-type product policy fees . . . . . . . . . . . . . . . . $ 6,630 $ 5,790 $ 5,909
Reinsurance assumed . . . . . . . . . . . . . . . . . . . . . . . . . . . . . . . . . . . . . . . . . 138 106 79
Reinsurance ceded . . . . . . . . . . . . . . . . . . . . . . . . . . . . . . . . . . . . . . . . . . . (731) (693) (607)
Net universal life and investment-type product policy fees . . . . . . . . . . . . . . . . $ 6,037 $ 5,203 $ 5,381
Other revenues:
Direct other revenues . . . . . . . . . . . . . . . . . . . . . . . . . . . . . . . . . . . . . . . . . $ 2,256 $ 2,264 $ 1,481
Reinsurance assumed . . . . . . . . . . . . . . . . . . . . . . . . . . . . . . . . . . . . . . . . . — 1 —
Reinsurance ceded . . . . . . . . . . . . . . . . . . . . . . . . . . . . . . . . . . . . . . . . . . . 72 64 105
Net other revenues . . . . . . . . . . . . . . . . . . . . . . . . . . . . . . . . . . . . . . . . . $ 2,328 $ 2,329 $ 1,586
Policyholder benefits and claims:
Direct policyholder benefits and claims . . . . . . . . . . . . . . . . . . . . . . . . . . . . . . $31,762 $30,363 $29,772
Reinsurance assumed . . . . . . . . . . . . . . . . . . . . . . . . . . . . . . . . . . . . . . . . . 1,275 1,024 1,235
Reinsurance ceded . . . . . . . . . . . . . . . . . . . . . . . . . . . . . . . . . . . . . . . . . . . (3,492) (3,051) (3,570)
Net policyholder benefits and claims . . . . . . . . . . . . . . . . . . . . . . . . . . . . . . $29,545 $28,336 $27,437
Interest credited to policyholder account balances:
Direct interest credited to policyholder account balances . . . . . . . . . . . . . . . . . . $ 4,923 $ 4,846 $ 4,787
Reinsurance assumed . . . . . . . . . . . . . . . . . . . . . . . . . . . . . . . . . . . . . . . . . 2 3 1
Reinsurance ceded . . . . . . . . . . . . . . . . . . . . . . . . . . . . . . . . . . . . . . . . . . . — — —
Net interest credited to policyholder account balances . . . . . . . . . . . . . . . . . . $ 4,925 $ 4,849 $ 4,788
Policyholder dividends:
Direct policyholder dividends . . . . . . . . . . . . . . . . . . . . . . . . . . . . . . . . . . . . $ 1,486 $ 1,650 $ 1,751
Reinsurance assumed . . . . . . . . . . . . . . . . . . . . . . . . . . . . . . . . . . . . . . . . . 17 13 5
Reinsurance ceded . . . . . . . . . . . . . . . . . . . . . . . . . . . . . . . . . . . . . . . . . . . (17) (13) (5)
Net policyholder dividends . . . . . . . . . . . . . . . . . . . . . . . . . . . . . . . . . . . . . $ 1,486 $ 1,650 $ 1,751
Other expenses:
Direct other expenses . . . . . . . . . . . . . . . . . . . . . . . . . . . . . . . . . . . . . . . . . $12,911 $10,602 $12,107
Reinsurance assumed . . . . . . . . . . . . . . . . . . . . . . . . . . . . . . . . . . . . . . . . . 116 100 57
Reinsurance ceded . . . . . . . . . . . . . . . . . . . . . . . . . . . . . . . . . . . . . . . . . . . (224) (146) (217)
Net other expenses . . . . . . . . . . . . . . . . . . . . . . . . . . . . . . . . . . . . . . . . . $12,803 $10,556 $11,947
F-101MetLife, Inc.
MetLife, Inc.
Notes to the Consolidated Financial Statements — (Continued)

The amounts in the consolidated balance sheets include the impact of reinsurance. Information regarding the effect of reinsurance is asfollows:
TotalBalance
Sheet Assumed CededTotal, Net ofReinsurance
December 31, 2010
(In millions)
Assets:
Premiums, reinsurance and other receivables . . . . . . . . . . . . . . . . . $ 19,830 $ 722 $13,561 $ 5,547
Deferred policy acquisition costs and value of business acquired . . . . . 27,307 176 (179) 27,310
Total assets . . . . . . . . . . . . . . . . . . . . . . . . . . . . . . . . . . . . . . $ 47,137 $ 898 $13,382 $ 32,857
Liabilities:
Future policy benefits . . . . . . . . . . . . . . . . . . . . . . . . . . . . . . . . . $173,373 $2,074 $ (65) $171,364
Policyholder account balances . . . . . . . . . . . . . . . . . . . . . . . . . . . 211,020 2,237 — 208,783
Other policy-related balances . . . . . . . . . . . . . . . . . . . . . . . . . . . . 15,806 265 506 15,035
Other liabilities . . . . . . . . . . . . . . . . . . . . . . . . . . . . . . . . . . . . . 20,386 608 2,703 17,075
Total liabilities . . . . . . . . . . . . . . . . . . . . . . . . . . . . . . . . . . . . . $420,585 $5,184 $ 3,144 $412,257
TotalBalance
Sheet Assumed CededTotal, Net ofReinsurance
December 31, 2009
(In millions)
Assets:
Premiums, reinsurance and other receivables . . . . . . . . . . . . . . . . . $ 16,752 $ 550 $12,274 $ 3,928
Deferred policy acquisition costs and value of business acquired . . . . . 19,256 190 (206) 19,272
Total assets . . . . . . . . . . . . . . . . . . . . . . . . . . . . . . . . . . . . . . $ 36,008 $ 740 $12,068 $ 23,200
Liabilities:
Future policy benefits . . . . . . . . . . . . . . . . . . . . . . . . . . . . . . . . . $135,879 $2,000 $ (43) $133,922
Policyholder account balances . . . . . . . . . . . . . . . . . . . . . . . . . . . 138,673 1,321 — 137,352
Other policy-related balances . . . . . . . . . . . . . . . . . . . . . . . . . . . . 8,446 257 494 7,695
Other liabilities . . . . . . . . . . . . . . . . . . . . . . . . . . . . . . . . . . . . . 15,989 364 2,489 13,136
Total liabilities . . . . . . . . . . . . . . . . . . . . . . . . . . . . . . . . . . . . . $298,987 $3,942 $ 2,940 $292,105
Reinsurance agreements that do not expose the Company to a reasonable possibility of a significant loss from insurance risk are recordedusing the deposit method of accounting. The deposit assets on ceded reinsurance were $2,530 million and $2,564 million at December 31,2010 and 2009, respectively. The deposit liabilities for assumed reinsurance were $47 million and $52 million at December 31, 2010 and2009, respectively.
10. Closed BlockOn April 7, 2000 (the “Demutualization Date”), MLIC converted from a mutual life insurance company to a stock life insurance company and
became a wholly-owned subsidiary of MetLife, Inc. The conversion was pursuant to an order by the New York Superintendent of Insurance(the “Superintendent”) approving MLIC’s plan of reorganization, as amended (the “Plan”). On the Demutualization Date, MLIC established aclosed block for the benefit of holders of certain individual life insurance policies of MLIC. Assets have been allocated to the closed block in anamount that has been determined to produce cash flows which, together with anticipated revenues from the policies included in the closedblock, are reasonably expected to be sufficient to support obligations and liabilities relating to these policies, including, but not limited to,provisions for the payment of claims and certain expenses and taxes, and to provide for the continuation of policyholder dividend scales ineffect for 1999, if the experience underlying such dividend scales continues, and for appropriate adjustments in such scales if the experiencechanges. At least annually, the Company compares actual and projected experience against the experience assumed in the then-currentdividend scales. Dividend scales are adjusted periodically to give effect to changes in experience.
The closed block assets, the cash flows generated by the closed block assets and the anticipated revenues from the policies in the closedblock will benefit only the holders of the policies in the closed block. To the extent that, over time, cash flows from the assets allocated to theclosed block and claims and other experience related to the closed block are, in the aggregate, more or less favorable than what wasassumed when the closed block was established, total dividends paid to closed block policyholders in the future may be greater than or lessthan the total dividends that would have been paid to these policyholders if the policyholder dividend scales in effect for 1999 had beencontinued. Any cash flows in excess of amounts assumed will be available for distribution over time to closed block policyholders and will notbe available to stockholders. If the closed block has insufficient funds to make guaranteed policy benefit payments, such payments will bemade from assets outside of the closed block. The closed block will continue in effect as long as any policy in the closed block remains in-force. The expected life of the closed block is over 100 years.
F-102 MetLife, Inc.
MetLife, Inc.
Notes to the Consolidated Financial Statements — (Continued)

The Company uses the same accounting principles to account for the participating policies included in the closed block as it used prior tothe Demutualization Date. However, the Company establishes a policyholder dividend obligation for earnings that will be paid to policyholdersas additional dividends as described below. The excess of closed block liabilities over closed block assets at the Demutualization Date(adjusted to eliminate the impact of related amounts in accumulated other comprehensive income) represents the estimated maximum futureearnings from the closed block expected to result from operations attributed to the closed block after income taxes. Earnings of the closedblock are recognized in income over the period the policies and contracts in the closed block remain in-force. Management believes that overtime the actual cumulative earnings of the closed block will approximately equal the expected cumulative earnings due to the effect ofdividend changes. If, over the period the closed block remains in existence, the actual cumulative earnings of the closed block are greaterthan the expected cumulative earnings of the closed block, the Company will pay the excess of the actual cumulative earnings of the closedblock over the expected cumulative earnings to closed block policyholders as additional policyholder dividends unless offset by futureunfavorable experience of the closed block and, accordingly, will recognize only the expected cumulative earnings in income with the excessrecorded as a policyholder dividend obligation. If over such period, the actual cumulative earnings of the closed block are less than theexpected cumulative earnings of the closed block, the Company will recognize only the actual earnings in income. However, the Companymay change policyholder dividend scales in the future, which would be intended to increase future actual earnings until the actual cumulativeearnings equal the expected cumulative earnings.
Experience within the closed block, in particular mortality and investment yields, as well as realized and unrealized gains and losses,directly impact the policyholder dividend obligation. The policyholder dividend obligation increased to $876 million at December 31, 2010,from zero at December 31, 2009, as a result of recent unrealized gains in the closed block. Amortization of the closed block DAC, whichresides outside of the closed block, is based upon cumulative actual and expected earnings within the closed block. Accordingly, theCompany’s net income continues to be sensitive to the actual performance of the closed block.
F-103MetLife, Inc.
MetLife, Inc.
Notes to the Consolidated Financial Statements — (Continued)

Information regarding the closed block liabilities and assets designated to the closed block was as follows:
2010 2009
December 31,
(In millions)
Closed Block Liabilities
Future policy benefits . . . . . . . . . . . . . . . . . . . . . . . . . . . . . . . . . . . . . . . . . . . . . . . . . . $43,456 $43,576
Other policy-related balances . . . . . . . . . . . . . . . . . . . . . . . . . . . . . . . . . . . . . . . . . . . . . 316 307
Policyholder dividends payable . . . . . . . . . . . . . . . . . . . . . . . . . . . . . . . . . . . . . . . . . . . . 579 615
Policyholder dividend obligation . . . . . . . . . . . . . . . . . . . . . . . . . . . . . . . . . . . . . . . . . . . . 876 —
Current income tax payable . . . . . . . . . . . . . . . . . . . . . . . . . . . . . . . . . . . . . . . . . . . . . . 178 —
Other liabilities . . . . . . . . . . . . . . . . . . . . . . . . . . . . . . . . . . . . . . . . . . . . . . . . . . . . . . . 627 576
Total closed block liabilities . . . . . . . . . . . . . . . . . . . . . . . . . . . . . . . . . . . . . . . . . . . . . 46,032 45,074
Assets Designated to the Closed Block
Investments:
Fixed maturity securities available-for-sale, at estimated fair value (amortized cost: $27,067 and$27,129, respectively) . . . . . . . . . . . . . . . . . . . . . . . . . . . . . . . . . . . . . . . . . . . . . . . 28,768 27,375
Equity securities available-for-sale, at estimated fair value (cost: $110 and $204, respectively) . . 102 218
Mortgage loans . . . . . . . . . . . . . . . . . . . . . . . . . . . . . . . . . . . . . . . . . . . . . . . . . . . . . 6,253 6,200
Policy loans . . . . . . . . . . . . . . . . . . . . . . . . . . . . . . . . . . . . . . . . . . . . . . . . . . . . . . . 4,629 4,538
Real estate and real estate joint ventures held-for-investment . . . . . . . . . . . . . . . . . . . . . . . 328 321
Short-term investments . . . . . . . . . . . . . . . . . . . . . . . . . . . . . . . . . . . . . . . . . . . . . . . . 1 1
Other invested assets . . . . . . . . . . . . . . . . . . . . . . . . . . . . . . . . . . . . . . . . . . . . . . . . . 729 463
Total investments . . . . . . . . . . . . . . . . . . . . . . . . . . . . . . . . . . . . . . . . . . . . . . . . . . 40,810 39,116
Cash and cash equivalents . . . . . . . . . . . . . . . . . . . . . . . . . . . . . . . . . . . . . . . . . . . . . . . 236 241
Accrued investment income . . . . . . . . . . . . . . . . . . . . . . . . . . . . . . . . . . . . . . . . . . . . . . 518 489
Premiums, reinsurance and other receivables . . . . . . . . . . . . . . . . . . . . . . . . . . . . . . . . . . . 95 78
Current income tax recoverable . . . . . . . . . . . . . . . . . . . . . . . . . . . . . . . . . . . . . . . . . . . . — 112
Deferred income tax assets . . . . . . . . . . . . . . . . . . . . . . . . . . . . . . . . . . . . . . . . . . . . . . 474 612
Total assets designated to the closed block . . . . . . . . . . . . . . . . . . . . . . . . . . . . . . . . . . 42,133 40,648
Excess of closed block liabilities over assets designated to the closed block . . . . . . . . . . . . . . . 3,899 4,426
Amounts included in accumulated other comprehensive income (loss):
Unrealized investment gains (losses), net of income tax of $594 and $89, respectively . . . . . . . 1,101 166
Unrealized gains (losses) on derivative instruments, net of income tax of $5 and ($3),respectively . . . . . . . . . . . . . . . . . . . . . . . . . . . . . . . . . . . . . . . . . . . . . . . . . . . . . . 10 (5)
Allocated to policyholder dividend obligation, net of income tax of ($307) and $0, respectively . . (569) —
Total amounts included in accumulated other comprehensive income (loss) . . . . . . . . . . . . . . 542 161
Maximum future earnings to be recognized from closed block assets and liabilities . . . . . . . . . . . $ 4,441 $ 4,587
Information regarding the closed block policyholder dividend obligation was as follows:
2010 2009 2008
Years EndedDecember 31,
(In millions)
Balance at January 1, . . . . . . . . . . . . . . . . . . . . . . . . . . . . . . . . . . . . . . . . . . . . . . . . . $ — $— $ 789
Change in unrealized investment and derivative gains (losses) . . . . . . . . . . . . . . . . . . . . . . . 876 — (789)
Balance at December 31, . . . . . . . . . . . . . . . . . . . . . . . . . . . . . . . . . . . . . . . . . . . . . . $876 $— $ —
F-104 MetLife, Inc.
MetLife, Inc.
Notes to the Consolidated Financial Statements — (Continued)

Information regarding the closed block revenues and expenses was as follows:
2010 2009 2008
Years Ended December 31,
(In millions)
Revenues
Premiums . . . . . . . . . . . . . . . . . . . . . . . . . . . . . . . . . . . . . . . . . . . . . . . . . . . . . $2,461 $2,708 $2,787
Net investment income . . . . . . . . . . . . . . . . . . . . . . . . . . . . . . . . . . . . . . . . . . . . 2,294 2,197 2,248
Net investment gains (losses):
Other-than-temporary impairments on fixed maturity securities . . . . . . . . . . . . . . . . . . (32) (107) (94)
Other-than-temporary impairments on fixed maturity securities transferred to othercomprehensive income (loss) . . . . . . . . . . . . . . . . . . . . . . . . . . . . . . . . . . . . . — 40 —
Other net investment gains (losses) . . . . . . . . . . . . . . . . . . . . . . . . . . . . . . . . . . . 71 327 (19)
Total net investment gains (losses) . . . . . . . . . . . . . . . . . . . . . . . . . . . . . . . . . . 39 260 (113)
Net derivative gains (losses) . . . . . . . . . . . . . . . . . . . . . . . . . . . . . . . . . . . . . . . . (27) (128) 29
Total revenues . . . . . . . . . . . . . . . . . . . . . . . . . . . . . . . . . . . . . . . . . . . . . . . 4,767 5,037 4,951
Expenses
Policyholder benefits and claims . . . . . . . . . . . . . . . . . . . . . . . . . . . . . . . . . . . . . . 3,115 3,329 3,393
Policyholder dividends . . . . . . . . . . . . . . . . . . . . . . . . . . . . . . . . . . . . . . . . . . . . . 1,235 1,394 1,498
Other expenses . . . . . . . . . . . . . . . . . . . . . . . . . . . . . . . . . . . . . . . . . . . . . . . . . 199 203 217
Total expenses . . . . . . . . . . . . . . . . . . . . . . . . . . . . . . . . . . . . . . . . . . . . . . . 4,549 4,926 5,108
Revenues, net of expenses before provision for income tax expense (benefit) . . . . . . . . . 218 111 (157)
Provision for income tax expense (benefit) . . . . . . . . . . . . . . . . . . . . . . . . . . . . . . . . 72 36 (68)
Revenues, net of expenses and provision for income tax expense (benefit) . . . . . . . . . . . $ 146 $ 75 $ (89)
The change in the maximum future earnings of the closed block was as follows:
2010 2009 2008
Years Ended December 31,
(In millions)
Balance at December 31, . . . . . . . . . . . . . . . . . . . . . . . . . . . . . . . . . . . . . . . . . . . $4,441 $4,587 $4,518
Less:
Closed block adjustment(1) . . . . . . . . . . . . . . . . . . . . . . . . . . . . . . . . . . . . . . . . — 144 —
Balance at January 1, . . . . . . . . . . . . . . . . . . . . . . . . . . . . . . . . . . . . . . . . . . . . . 4,587 4,518 4,429
Change during year . . . . . . . . . . . . . . . . . . . . . . . . . . . . . . . . . . . . . . . . . . . . . . $ (146) $ (75) $ 89
(1) The closed block adjustment represents an intra-company reallocation of assets which affected the closed block. The adjustment had noimpact on the Company’s consolidated financial statements.MLIC charges the closed block with federal income taxes, state and local premium taxes and other additive state or local taxes, as well as
investment management expenses relating to the closed block as provided in the Plan. MLIC also charges the closed block for expenses ofmaintaining the policies included in the closed block.
11. Long-term and Short-term DebtLong-term and short-term debt outstanding is as follows:
RangeWeightedAverage Maturity 2010 2009
December 31,Interest Rates
(In millions)
Senior notes . . . . . . . . . . . . . . . . . . . . . . . . . . . 0.61%-7.72% 5.58% 2011-2045 $16,258 $10,458
Advances agreements . . . . . . . . . . . . . . . . . . . . . 0.23%-4.86% 2.41% 2011-2015 3,600 1,846
Surplus notes . . . . . . . . . . . . . . . . . . . . . . . . . . . 7.63%-7.88% 7.85% 2015-2025 699 698
Fixed rate notes . . . . . . . . . . . . . . . . . . . . . . . . . 3.76%-15.00% 8.67% 2011-2012 82 63
Other notes with varying interest rates . . . . . . . . . . . 1.98%-8.00% 7.20% 2013-2030 95 120
Capital lease obligations . . . . . . . . . . . . . . . . . . . . 32 35
Total long-term debt(1) . . . . . . . . . . . . . . . . . . . . . 20,766 13,220
Total short-term debt . . . . . . . . . . . . . . . . . . . . . . 306 912
Total . . . . . . . . . . . . . . . . . . . . . . . . . . . . . . . $21,072 $14,132
F-105MetLife, Inc.
MetLife, Inc.
Notes to the Consolidated Financial Statements — (Continued)

(1) Excludes $6,820 million at December 31, 2010 of long-term debt relating to CSEs. See Note 3.The aggregate maturities of long-term debt at December 31, 2010 for the next five years and thereafter are $1,405 million in 2011,
$1,520 million in 2012, $1,464 million in 2013, $1,653 million in 2014, $2,365 million in 2015 and $12,358 million thereafter.Advances agreements and capital lease obligations are collateralized and rank highest in priority, followed by unsecured senior debt which
consists of senior notes, fixed rate notes and other notes with varying interest rates, followed by subordinated debt which consists of juniorsubordinated debt securities. Payments of interest and principal on the Company’s surplus notes, which are subordinate to all otherobligations at the operating company level and senior to obligations at the Holding Company, may be made only with the prior approval of theinsurance department of the state of domicile. Collateral financing arrangements are supported by either surplus notes of subsidiaries orfinancing arrangements with the Holding Company and, accordingly, have priority consistent with other such obligations.
Certain of the Company’s debt instruments, credit facilities and committed facilities contain various administrative, reporting, legal andfinancial covenants. The Company believes it was in compliance with all covenants at both December 31, 2010 and 2009.
Senior Notes — Senior Debt Securities Underlying Equity UnitsIn connection with the financing of the Acquisition (see Note 2) in November 2010, MetLife, Inc. issued to ALICO Holdings $3,000 million
(estimated fair value of $3,011 million) in three series of Debt Securities, which constitute a part of the Equity Units more fully described inNote 14. The Debt Securities (Series C, D and E) are subject to remarketing, initially bear interest at 1.56%, 1.92% and 2.46%, respectively(an average rate of 1.98%), and carry initial maturity dates of June 15, 2023, June 15, 2024 and June 15, 2045, respectively. The interestrates will be reset in connection with the successful remarketings of the Debt Securities. Prior to the first scheduled attempted remarketing ofthe Series C Debt Securities, such Debt Securities will be divided into two tranches equal in principal amount with maturity dates of June 15,2018 and June 15, 2023. Prior to the first scheduled attempted remarketing of the Series E Debt Securities, such Debt Securities will bedivided into two tranches equal in principal amount with maturity dates of June 15, 2018 and June 15, 2045.
Senior Notes — OtherIn August 2010, in anticipation of the Acquisition, MetLife, Inc. issued senior notes as follows:• $1,000 million senior notes due February 6, 2014, which bear interest at a fixed rate of 2.375%, payable semiannually;• $1,000 million senior notes due February 8, 2021, which bear interest at a fixed rate of 4.75%, payable semiannually;• $750 million senior notes due February 6, 2041, which bear interest at a fixed rate of 5.875%, payable semiannually; and• $250 million floating rate senior notes due August 6, 2013, which bear interest at a rate equal to three-month LIBOR, reset quarterly,
plus 1.25%, payable quarterly.In connection with these offerings, MetLife, Inc. incurred $15 million of issuance costs which have been capitalized and included in other
assets. These costs are being amortized over the terms of the senior notes.In May 2009, MetLife, Inc. issued $1,250 million of senior notes due June 1, 2016. The notes bear interest at a fixed rate of 6.75%, payable
semiannually. In connection with the offering, the Holding Company incurred $6 million of issuance costs which have been capitalized andincluded in other assets. These costs are being amortized over the term of the notes.
In March 2009, MetLife, Inc. issued $397 million of floating rate senior notes due June 29, 2012 under the FDIC Program. The notes bearinterest at a rate equal to three-month LIBOR, reset quarterly, plus 0.32%. The notes are not redeemable prior to their maturity. In connectionwith the offering, the Holding Company incurred $15 million of issuance costs which have been capitalized and included in other assets.These costs are being amortized over the term of the notes.
In February 2009, MetLife, Inc. remarketed its existing $1,035 million 4.91% Series B junior subordinated debt securities as 7.717% seniordebt securities, Series B, due 2019. In August 2008, the Holding Company remarketed its existing $1,035 million 4.82% Series A juniorsubordinated debt securities as 6.817% senior debt securities, Series A, due 2018. Interest on both series of debt securities is payablesemiannually. The Series A and Series B junior subordinated debt securities were originally issued in 2005 in connection with certain commonequity units. See Notes 13 and 14.
Advances from the Federal Home Loan Bank of New YorkMetLife Bank is a member of the FHLB of NY and held $187 million and $124 million of common stock of the FHLB of NY at December 31,
2010 and 2009, respectively, which is included in equity securities. MetLife Bank has also entered into advances agreements with the FHLBof NY whereby MetLife Bank has received cash advances and under which the FHLB of NY has been granted a blanket lien on certain ofMetLife Bank’s residential mortgage loans, mortgage loans held-for-sale, commercial mortgage loans and mortgage-backed securities tocollateralize MetLife Bank’s repayment obligations. Upon any event of default by MetLife Bank, the FHLB of NY’s recovery is limited to theamount of MetLife Bank’s liability under the advances agreements. The amount of MetLife Bank’s liability for advances from the FHLB of NYwas $3.8 billion and $2.4 billion at December 31, 2010 and 2009, respectively, which is included in long-term debt and short-term debtdepending upon the original tenor of the advance. During the years ended December 31, 2010, 2009 and 2008, MetLife Bank receivedadvances related to long-term borrowings totaling $2,103 million, $1,280 million and $220 million, respectively, from the FHLB of NY. MetLifeBank made repayments to the FHLB of NY of $349 million, $497 million and $371 million related to long-term borrowings for the years endedDecember 31, 2010, 2009 and 2008, respectively. The advances related to both long-term and short-term debt were collateralized byresidential mortgage loans, mortgage loans held-for-sale, commercial mortgage loans and mortgage-backed securities with estimated fairvalues of $7.8 billion and $5.5 billion at December 31, 2010 and 2009, respectively.
Collateralized Borrowing from the Federal Reserve Bank of New YorkMetLife Bank is a depository institution that is approved to use the Federal Reserve Bank of New York Discount Window borrowing
privileges. In order to utilize these privileges, MetLife Bank has pledged qualifying loans and investment securities to the Federal ReserveBank of New York as collateral. MetLife Bank had no liability for advances from the Federal Reserve Bank of New York at both December 31,2010 and 2009. The estimated fair value of loan and investment security collateral pledged by MetLife Bank to the Federal Reserve Bank of
F-106 MetLife, Inc.
MetLife, Inc.
Notes to the Consolidated Financial Statements — (Continued)

New York at December 31, 2010 and 2009 was $1.8 billion and $1.5 billion, respectively. During the years ended December 31, 2009 and2008, the weighted average interest rate on these advances was 0.26% and 0.79%, respectively. During the year ended December 31, 2009,the average daily balance of these advances was $1,513 million and these advances were outstanding for an average of 24 days. There wereno such advances during the year ended December 31, 2010.
Short-term DebtShort-term debt with maturities of one year or less is as follows:
2010 2009
December 31,
(In millions)
Commercial paper . . . . . . . . . . . . . . . . . . . . . . . . . . . . . . . . . . . . . . . . . . . . . . . . . . . $ 102 $ 319
MetLife Bank, N.A. — Advances agreements with the FHLB of NY . . . . . . . . . . . . . . . . . . . . 190 585
Other . . . . . . . . . . . . . . . . . . . . . . . . . . . . . . . . . . . . . . . . . . . . . . . . . . . . . . . . . . . . 14 8
Total short-term debt . . . . . . . . . . . . . . . . . . . . . . . . . . . . . . . . . . . . . . . . . . . . . . . . $ 306 $ 912
Average daily balance . . . . . . . . . . . . . . . . . . . . . . . . . . . . . . . . . . . . . . . . . . . . . . . . . $ 687 $ 2,845
Average days outstanding . . . . . . . . . . . . . . . . . . . . . . . . . . . . . . . . . . . . . . . . . . . . . . 21 days 16 daysDuring the years ended December 31, 2010, 2009 and 2008, the weighted average interest rate on short-term debt was 0.35%, 0.42%
and 2.40%, respectively.
Interest ExpenseInterest expense related to the Company’s indebtedness included in other expenses was $815 million, $713 million and $554 million for
the years ended December 31, 2010, 2009 and 2008, respectively, and does not include interest expense on collateral financingarrangements, junior subordinated debt securities or common equity units. See Notes 12, 13 and 14.
Credit and Committed FacilitiesThe Company maintains unsecured credit facilities and committed facilities, which aggregated $4.0 billion and $12.4 billion, respectively,
at December 31, 2010. When drawn upon, these facilities bear interest at varying rates in accordance with the respective agreements.Credit Facilities. The unsecured credit facilities are used for general corporate purposes, to support the borrowers’ commercial paper
programs and for the issuance of letters of credit. Total fees expensed associated with these credit facilities were $17 million, $43 million and$17 million for the years ended December 31, 2010, 2009 and 2008, respectively. Information on these credit facilities at December 31, 2010is as follows:
Borrower(s) Expiration Capacity
Letter ofCredit
Issuances DrawdownsUnused
Commitments
(In millions)
MetLife, Inc. and MetLife Funding, Inc. . . . . . . . October 2011 $1,000 $ — $ — $1,000
MetLife, Inc. and MetLife Funding, Inc. . . . . . . . October 2013 (1) 3,000 1,507 — 1,493
Total . . . . . . . . . . . . . . . . . . . . . . . . . . . . $4,000 $1,507 $ — $2,493
(1) All borrowings under the credit agreement must be repaid by October 2013, except that letters of credit outstanding upon termination mayremain outstanding until October 2014.Committed Facilities. The committed facilities are used for collateral for certain of the Company’s affiliated reinsurance liabilities. Total
fees expensed associated with these committed facilities were $92 million, $55 million and $35 million for the years ended December 31,2010, 2009 and 2008, respectively. Information on these committed facilities at December 31, 2010 is as follows:
Account Party/Borrower(s) Expiration Capacity
Letter ofCredit
Issuances DrawdownsUnused
CommitmentsMaturity(Years)
(In millions)
MetLife, Inc. . . . . . . . . . . . . . . . . . . August 2011 $ 300 $ 300 $ — $ — —
Exeter Reassurance Company Ltd.,MetLife, Inc., & Missouri Reinsurance(Barbados), Inc. . . . . . . . . . . . . . . . June 2016 500 490 — 10 5
MetLife Reinsurance Company ofVermont & MetLife, Inc. . . . . . . . . . . December 2020 (1) 350 350 — — 10
Exeter Reassurance Company Ltd. . . . . December 2027 (1) 650 535 — 115 17
MetLife Reinsurance Company of SouthCarolina & MetLife, Inc. . . . . . . . . . . June 2037 3,500 — 2,797 703 26
MetLife Reinsurance Company ofVermont & MetLife, Inc. . . . . . . . . . . December 2037 (1) 2,896 1,603 — 1,293 27
MetLife Reinsurance Company ofVermont & MetLife, Inc. . . . . . . . . . . September 2038 (1) 4,250 2,160 — 2,090 27
Total(2) . . . . . . . . . . . . . . . . . . . . . . $12,446 $5,438 $2,797 $4,211
F-107MetLife, Inc.
MetLife, Inc.
Notes to the Consolidated Financial Statements — (Continued)

(1) The Holding Company is a guarantor under this agreement.(2) See also Note 24.
As a result of the offerings of certain senior notes (see “— Senior Notes — Other”) and common stock (see Note 18), the commitmentletter for a $5.0 billion senior credit facility, which the Holding Company signed to partially finance the Acquisition, was terminated. DuringMarch 2010, the Holding Company paid $28 million in fees related to this senior credit facility, all of which were expensed during the yearended December 31, 2010. See Note 19.
12. Collateral Financing Arrangements
Associated with the Closed BlockIn December 2007, MLIC reinsured a portion of its closed block liabilities to MRC, a wholly-owned subsidiary of the Company. In
connection with this transaction, MRC issued, to investors placed by an unaffiliated financial institution, $2.5 billion in aggregate principalamount of 35-year surplus notes to provide statutory reserve support for the assumed closed block liabilities. Interest on the surplus notesaccrues at an annual rate of 3-month LIBOR plus 0.55%, payable quarterly. The ability of MRC to make interest and principal payments on thesurplus notes is contingent upon South Carolina regulatory approval. At both December 31, 2010 and 2009, the amount of the surplus notesoutstanding was $2.5 billion.
Simultaneous with the issuance of the surplus notes, the Holding Company entered into an agreement with the unaffiliated financialinstitution, under which the Holding Company is entitled to the interest paid by MRC on the surplus notes of 3-month LIBOR plus 0.55% inexchange for the payment of 3-month LIBOR plus 1.12%, payable quarterly on such amount as adjusted, as described below. The HoldingCompany may also be required to pledge collateral or make payments to the unaffiliated financial institution related to any decline in theestimated fair value of the surplus notes. Any such payments would be accounted for as a receivable and included in other assets on theCompany’s consolidated balance sheets and would not reduce the principal amount outstanding of the surplus notes. Such payments would,however, reduce the amount of interest payments due from the Holding Company under the agreement. Any payment received from theunaffiliated financial institution would reduce the receivable by an amount equal to such payment and would also increase the amount ofinterest payments due from the Holding Company under the agreement. In addition, the unaffiliated financial institution may be required topledge collateral to the Holding Company related to any increase in the estimated fair value of the surplus notes. During 2008, the HoldingCompany paid an aggregate of $800 million to the unaffiliated financial institution relating to declines in the estimated fair value of the surplusnotes. The Holding Company did not receive any payments from the unaffiliated financial institution during 2008. During 2009, on a net basis,the Holding Company received $375 million from the unaffiliated financial institution related to changes in the estimated fair value of thesurplus notes. No payments were made or received by the Holding Company during 2010. Since the closing of the collateral financingarrangement in December 2007, on a net basis, the Holding Company has paid $425 million to the unaffiliated financial institution related tochanges in the estimated fair value of the surplus notes. In addition, at December 31, 2008, the Holding Company had pledged collateral withan estimated fair value of $230 million to the unaffiliated financial institution. At December 31, 2009, the Holding Company had no collateralpledged to the unaffiliated financial institution in connection with this agreement. At December 31, 2010, the Holding Company had pledgedcollateral with an estimated fair value of $49 million to the unaffiliated financial institution. The Holding Company may also be required to makea payment to the unaffiliated financial institution in connection with any early termination of this agreement.
A majority of the proceeds from the offering of the surplus notes was placed in a trust, which is consolidated by the Company, to supportMRC’s statutory obligations associated with the assumed closed block liabilities. During 2007, MRC deposited $2.0 billion into the trust, fromthe proceeds of the surplus notes issued in 2007. During 2008, MRC deposited an additional $314 million into the trust. No amount wasdeposited into the trust during 2009. During 2010, MRC transferred $497 million out of the trust. At December 31, 2010 and 2009, theestimated fair value of assets held in trust by the Company was $2.0 billion and $2.4 billion, respectively. The assets are principally invested infixed maturity securities and are presented as such within the Company’s consolidated balance sheets, with the related income includedwithin net investment income in the Company’s consolidated statements of operations. Interest on the collateral financing arrangement isincluded as a component of other expenses.
Total interest expense related to the collateral financing arrangement was $36 million, $51 million and $117 million for the years endedDecember 31, 2010, 2009 and 2008, respectively.
Associated with Secondary GuaranteesIn May 2007, the Holding Company and MRSC, a wholly-owned subsidiary of the Company, entered into a 30-year collateral financing
arrangement with an unaffiliated financial institution that provides up to $3.5 billion of statutory reserve support for MRSC associated withreinsurance obligations under intercompany reinsurance agreements. Such statutory reserves are associated with universal life secondaryguarantees and are required under U.S. Valuation of Life Policies Model Regulation (commonly referred to as Regulation A-XXX). At bothDecember 31, 2010 and 2009, $2.8 billion had been drawn upon under the collateral financing arrangement. The collateral financingarrangement may be extended by agreement of the Holding Company and the unaffiliated financial institution on each anniversary of theclosing.
Proceeds from the collateral financing arrangement were placed in trusts to support MRSC’s statutory obligations associated with thereinsurance of secondary guarantees. The trusts are VIEs which are consolidated by the Company. The unaffiliated financial institution isentitled to the return on the investment portfolio held by the trusts. At December 31, 2010 and 2009, the Company held assets in trust with anestimated fair value of $3.3 billion and $3.2 billion, respectively, associated with the collateral financing arrangement. The assets areprincipally invested in fixed maturity securities and are presented as such within the Company’s consolidated balance sheets, with the relatedincome included within net investment income in the Company’s consolidated statements of operations. Interest on the collateral financingarrangement is included as a component of other expenses.
F-108 MetLife, Inc.
MetLife, Inc.
Notes to the Consolidated Financial Statements — (Continued)
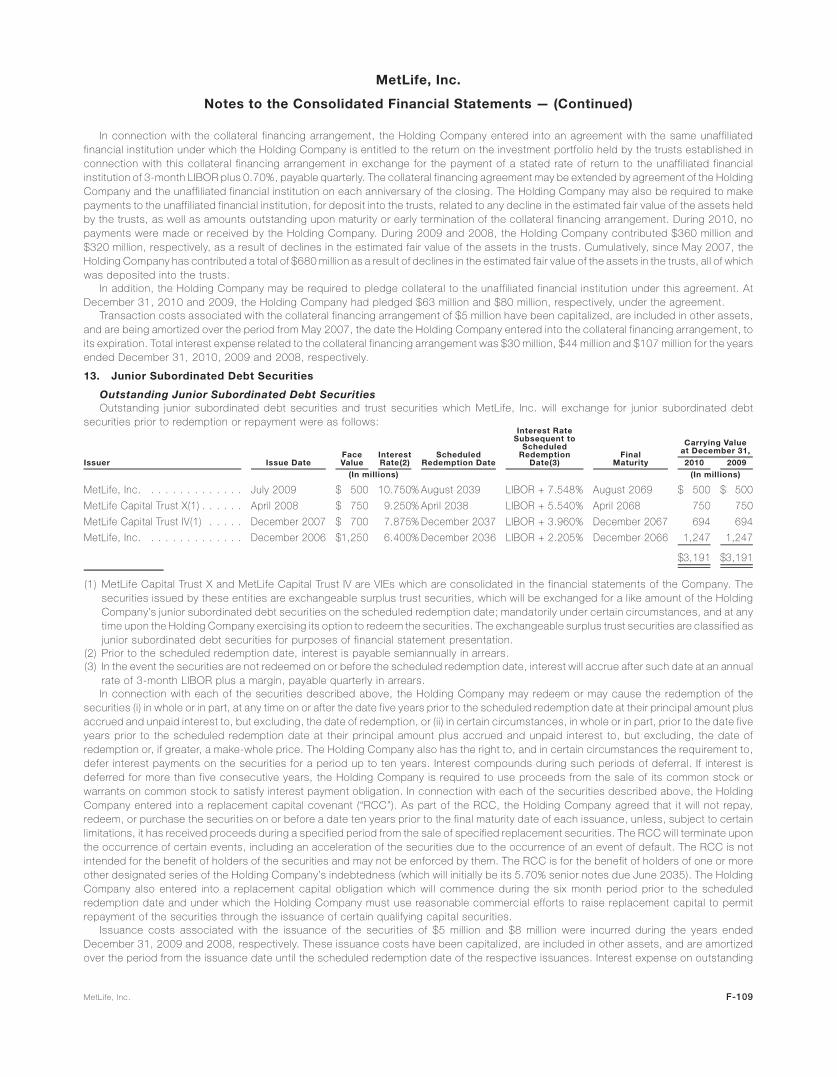
In connection with the collateral financing arrangement, the Holding Company entered into an agreement with the same unaffiliatedfinancial institution under which the Holding Company is entitled to the return on the investment portfolio held by the trusts established inconnection with this collateral financing arrangement in exchange for the payment of a stated rate of return to the unaffiliated financialinstitution of 3-month LIBOR plus 0.70%, payable quarterly. The collateral financing agreement may be extended by agreement of the HoldingCompany and the unaffiliated financial institution on each anniversary of the closing. The Holding Company may also be required to makepayments to the unaffiliated financial institution, for deposit into the trusts, related to any decline in the estimated fair value of the assets heldby the trusts, as well as amounts outstanding upon maturity or early termination of the collateral financing arrangement. During 2010, nopayments were made or received by the Holding Company. During 2009 and 2008, the Holding Company contributed $360 million and$320 million, respectively, as a result of declines in the estimated fair value of the assets in the trusts. Cumulatively, since May 2007, theHolding Company has contributed a total of $680 million as a result of declines in the estimated fair value of the assets in the trusts, all of whichwas deposited into the trusts.
In addition, the Holding Company may be required to pledge collateral to the unaffiliated financial institution under this agreement. AtDecember 31, 2010 and 2009, the Holding Company had pledged $63 million and $80 million, respectively, under the agreement.
Transaction costs associated with the collateral financing arrangement of $5 million have been capitalized, are included in other assets,and are being amortized over the period from May 2007, the date the Holding Company entered into the collateral financing arrangement, toits expiration. Total interest expense related to the collateral financing arrangement was $30 million, $44 million and $107 million for the yearsended December 31, 2010, 2009 and 2008, respectively.
13. Junior Subordinated Debt Securities
Outstanding Junior Subordinated Debt SecuritiesOutstanding junior subordinated debt securities and trust securities which MetLife, Inc. will exchange for junior subordinated debt
securities prior to redemption or repayment were as follows:
Issuer Issue DateFaceValue
InterestRate(2)
ScheduledRedemption Date
Interest RateSubsequent to
ScheduledRedemption
Date(3)Final
Maturity 2010 2009
Carrying Valueat December 31,
(In millions) (In millions)
MetLife, Inc. . . . . . . . . . . . . . July 2009 $ 500 10.750% August 2039 LIBOR + 7.548% August 2069 $ 500 $ 500
MetLife Capital Trust X(1) . . . . . . April 2008 $ 750 9.250% April 2038 LIBOR + 5.540% April 2068 750 750
MetLife Capital Trust IV(1) . . . . . December 2007 $ 700 7.875% December 2037 LIBOR + 3.960% December 2067 694 694
MetLife, Inc. . . . . . . . . . . . . . December 2006 $1,250 6.400% December 2036 LIBOR + 2.205% December 2066 1,247 1,247
$3,191 $3,191
(1) MetLife Capital Trust X and MetLife Capital Trust IV are VIEs which are consolidated in the financial statements of the Company. Thesecurities issued by these entities are exchangeable surplus trust securities, which will be exchanged for a like amount of the HoldingCompany’s junior subordinated debt securities on the scheduled redemption date; mandatorily under certain circumstances, and at anytime upon the Holding Company exercising its option to redeem the securities. The exchangeable surplus trust securities are classified asjunior subordinated debt securities for purposes of financial statement presentation.
(2) Prior to the scheduled redemption date, interest is payable semiannually in arrears.(3) In the event the securities are not redeemed on or before the scheduled redemption date, interest will accrue after such date at an annual
rate of 3-month LIBOR plus a margin, payable quarterly in arrears.In connection with each of the securities described above, the Holding Company may redeem or may cause the redemption of the
securities (i) in whole or in part, at any time on or after the date five years prior to the scheduled redemption date at their principal amount plusaccrued and unpaid interest to, but excluding, the date of redemption, or (ii) in certain circumstances, in whole or in part, prior to the date fiveyears prior to the scheduled redemption date at their principal amount plus accrued and unpaid interest to, but excluding, the date ofredemption or, if greater, a make-whole price. The Holding Company also has the right to, and in certain circumstances the requirement to,defer interest payments on the securities for a period up to ten years. Interest compounds during such periods of deferral. If interest isdeferred for more than five consecutive years, the Holding Company is required to use proceeds from the sale of its common stock orwarrants on common stock to satisfy interest payment obligation. In connection with each of the securities described above, the HoldingCompany entered into a replacement capital covenant (“RCC”). As part of the RCC, the Holding Company agreed that it will not repay,redeem, or purchase the securities on or before a date ten years prior to the final maturity date of each issuance, unless, subject to certainlimitations, it has received proceeds during a specified period from the sale of specified replacement securities. The RCC will terminate uponthe occurrence of certain events, including an acceleration of the securities due to the occurrence of an event of default. The RCC is notintended for the benefit of holders of the securities and may not be enforced by them. The RCC is for the benefit of holders of one or moreother designated series of the Holding Company’s indebtedness (which will initially be its 5.70% senior notes due June 2035). The HoldingCompany also entered into a replacement capital obligation which will commence during the six month period prior to the scheduledredemption date and under which the Holding Company must use reasonable commercial efforts to raise replacement capital to permitrepayment of the securities through the issuance of certain qualifying capital securities.
Issuance costs associated with the issuance of the securities of $5 million and $8 million were incurred during the years endedDecember 31, 2009 and 2008, respectively. These issuance costs have been capitalized, are included in other assets, and are amortizedover the period from the issuance date until the scheduled redemption date of the respective issuances. Interest expense on outstanding
F-109MetLife, Inc.
MetLife, Inc.
Notes to the Consolidated Financial Statements — (Continued)
junior subordinated debt securities was $258 million, $231 million and $186 million for the years ended December 31, 2010, 2009 and 2008,respectively.
Junior Subordinated Debt Securities Underlying Common Equity UnitsIn June 2005, the Holding Company issued $1,067 million 4.82% Series A and $1,067 million 4.91% Series B junior subordinated debt
securities due no later than February 2039 and February 2040, respectively, for a total of $2,134 million, in exchange for $64 million in trustcommon securities of MetLife Capital Trust II (“Series A Trust”) and MetLife Capital Trust III (“Series B Trust”) and, together with the Series ATrust, (the “Capital Trusts”), both subsidiary trusts of MetLife, Inc., and $2,070 million in aggregate cash proceeds from the sale by thesubsidiary trusts of trust preferred securities, constituting part of the common equity units. The subsidiary trusts each issued $1,035 million oftrust preferred securities and $32 million of trust common securities.
In August 2008, the Series A Trust was dissolved and $32 million of the Series A junior subordinated debt securities were returned to theHolding Company concurrently with the cancellation of the $32 million of trust common securities of the Series A Trust held by MetLife, Inc.Upon dissolution of the Series A Trust, the remaining $1,035 million of Series A junior subordinated debt securities were distributed to theholders of the trust preferred securities and such trust preferred securities were cancelled. In connection with the remarketing transaction inAugust 2008, the remaining $1,035 million of MetLife, Inc. Series A junior subordinated debt securities were modified, as permitted by theirterms, to be 6.817% senior debt securities, Series A, due August 2018. The Company did not receive any proceeds from the remarketing.See also Notes 11, 14 and 18.
In February 2009, the Series B Trust was dissolved and $32 million of the Series B junior subordinated debt securities were returned to theHolding Company concurrently with the cancellation of the $32 million of trust common securities of the Series B Trust held by MetLife, Inc.Upon dissolution of the Series B Trust, the remaining $1,035 million of Series B junior subordinated debt securities were distributed to theholders of the trust preferred securities and such trust preferred securities were cancelled. In connection with the remarketing transaction inFebruary 2009, the remaining $1,035 million of MetLife, Inc. Series B junior subordinated debt securities were modified, as permitted by theirterms, to be 7.717% senior debt securities, Series B, due February 2019. The Company did not receive any proceeds from the remarketing.See also Notes 11, 14 and 18.
Interest expense on the junior subordinated debt securities underlying the common equity units was $6 million and $84 million for the yearsended December 31, 2009 and 2008, respectively. There was no interest expense on the junior subordinated debt securities underlying thecommon equity units for the year ended December 31, 2010.
14. Common Equity Units
Acquisition of ALICOIn connection with the financing of the Acquisition (see Note 2) in November 2010, MetLife, Inc. issued to ALICO Holdings 40.0 million
Equity Units with an aggregate stated amount at issuance of $3,000 million and an estimated fair value of $3,189 million. Each Equity Unit hasan initial stated amount of $75 per unit and initially consists of: (i) three Purchase Contracts, each of which obligates the holder to purchase,on a subsequent settlement date, a variable number of shares of MetLife, Inc. common stock, par value $0.01 per share, for a purchase priceof $25 ($75 in the aggregate); and (ii) a 1⁄40 undivided beneficial ownership interest in each of three series of Debt Securities issued by MetLife,Inc., each series of Debt Securities having an aggregate principal amount of $1,000 million. Distributions on the Equity Units will be madequarterly, and will consist of contract payments on the Purchase Contracts and interest payments on the Debt Securities, at an aggregateannual rate of 5.00% of the stated amount at any time. The excess of the estimated fair value of the Equity Units over the estimated fair value ofthe Debt Securities (see Note 11), after accounting for the present value of future contract payments recorded in other liabilities, results in anet decrease to additional paid-in capital of $69 million, representing the fair value of the Purchase Contracts discussed below.
The Equity Units, the Debt Securities and the common stock issuable upon settlement of the Purchase Contracts are subject to the termsof an investor rights agreement entered into among MetLife, Inc., AIG and ALICO Holdings, which grants to ALICO Holdings certain rights andsets forth certain agreements with respect to ALICO Holdings’ ownership, voting and transfer of the shares, including minimum holdingperiods, restrictions on the number of shares ALICO Holdings can sell at one time, its agreement to vote the common stock in the sameproportion as the common stock voted by all other holders and its agreement not to seek control or influence the Company’s management orBoard of Directors. The Equity Units are not listed on any exchange or inter-dealer quotation system. The Equity Units have been pledged tosecure certain indemnification obligations of ALICO Holdings under the Stock Purchase Agreement. See Note 2.
Purchase ContractsSettlement of the Purchase Contracts of each series will occur upon the successful remarketing of the related series of Debt Securities, or
upon a final failed remarketing of the related series, as described below under “— Debt Securities.” On each settlement date subsequent to asuccessful remarketing, the holder will pay $25 per Equity Unit and MetLife, Inc. will issue to such holder a variable number of shares of itscommon stock in settlement of the applicable Purchase Contract. The number of shares to be issued will depend on the average of the dailyvolume-weighted average prices of MetLife, Inc.’s common stock during the 20 trading day periods ending on, and including, the third dayprior to the initial scheduled settlement date for each series of Purchase Contracts. The initially-scheduled settlement dates are October 10,2012 for the Series C Purchase Contracts, September 11, 2013 for the Series D Purchase Contracts and October 8, 2014 for the Series EPurchase Contracts. If the average value of MetLife, Inc.’s common stock as calculated pursuant to the Stock Purchase Agreement during theapplicable 20 trading day period is less than or equal to $35.42, as such amount may be adjusted (the “Reference Price”), the number ofshares to be issued in settlement of the Purchase Contract will equal $25 divided by the Reference Price, as calculated pursuant to the StockPurchase Agreement (the “Maximum Settlement Rate”). If the market value of MetLife, Inc.’s common stock is greater than or equal to$44.275, as such amount may be adjusted (the “Threshold Appreciation Price”), the number of shares to be issued in settlement of thePurchase Contract will equal $25 divided by the Threshold Appreciation Price, as so calculated (the “Minimum Settlement Rate”). If the marketvalue of MetLife, Inc.’s common stock is greater than the Reference Price and less than the Threshold Appreciation Price, the number ofshares to be issued will equal $25 divided by the applicable market value, as so calculated. In the event of an unsuccessful remarketing of any
F-110 MetLife, Inc.
MetLife, Inc.
Notes to the Consolidated Financial Statements — (Continued)

series of Debt Securities and the postponement of settlement to a later date, the average market value used to calculate the settlement ratefor a particular series will not be recalculated, although certain corporate events may require adjustments to the settlement rate. Aftersettlement of all the Purchase Contracts, MetLife, Inc. will receive proceeds of $3,000 million and issue between 67.8 million and 84.7 millionshares of its common stock, subject to certain adjustments. The holder of an Equity Unit may, at its option, settle the related PurchaseContracts before the applicable settlement date. However, upon early settlement, the holder will receive the Minimum Settlement Rate.
Distributions on the Purchase Contracts will be made quarterly at an average annual rate of 3.02%. The value of the Purchase Contracts atissuance of $247 million was calculated as the present value of the future contract payments and was recorded in other liabilities with anoffsetting decrease in additional paid-in capital. The other liabilities balance will be reduced as contract payments are made. For the yearended December 31, 2010, no contract payments were made.
Debt SecuritiesThe Debt Securities are senior, unsecured notes of MetLife, Inc. which, in the aggregate, pay quarterly distributions at an initial average
annual rate of 1.98% and are included in long-term debt (see Note 11 for further discussion of terms). The Debt Securities will be initiallypledged as collateral to secure the obligations of each Equity Unit holder under the related Purchase Contracts. Each series of the DebtSecurities will be subject to a remarketing and sold on behalf of participating holders to investors. The proceeds of a remarketing, net of anyrelated fees, will be applied on behalf of participating holders who so elect to settle any obligation of the holder to pay cash under the relatedPurchase Contract on the applicable settlement dates. The initially-scheduled remarketing dates are October 10, 2012 for the Series C DebtSecurities, September 11, 2013 for the Series D Debt Securities and October 8, 2014 for the Series E Debt Securities, subject to delay ifthere are one or more unsuccessful remarketings. If the initial attempted remarketing of a series is unsuccessful, up to two additionalremarketing attempts will occur. At the remarketing date, the remarketing agent may reset the interest rate on the Debt Securities, subject to areset cap for each of the first two attempted remarketings of each series. If a remarketing is successful, the reset rate will apply to alloutstanding Debt Securities of the applicable tranche of the remarketed series, whether or not the holder participated in the remarketing andwill become effective on the settlement date of such remarketing. If the first remarketing attempt with respect to a series is unsuccessful, theapplicable Purchase Contract settlement date will be delayed for three calendar months, at which time a second remarketing attempt willoccur in connection with settlement. If the second remarketing attempt is unsuccessful, one additional delay may occur on the same basis. Ifboth additional remarketing attempts are unsuccessful, a “final failed remarketing” will have occurred, and the interest rate on such series ofDebt Securities will not be reset and the holder may put such series of Debt Securities to MetLife, Inc. at a price equal to its principal amountplus accrued and unpaid interest, if any, and apply the principal amount against the holder’s obligations under the related Purchase Contract.
Earnings Per Common ShareThe treasury stock method is used to determine the potential dilution of the Purchase Contracts on earnings per common share. There
was no dilution associated with the Purchase Contracts for the year ended December 31, 2010.
Acquisition of The Travelers Insurance CompanyIn connection with financing the acquisition of The Travelers Insurance Company on July 1, 2005, the Holding Company distributed and
sold 82.8 million 6.375% common equity units for $2,070 million in proceeds in a registered public offering on June 21, 2005. The commonequity units consisted of interests in trust preferred securities issued by MetLife Capital Trusts II and III, and stock purchase contracts issuedby the Holding Company. The only assets of MetLife Capital Trusts II and III were junior subordinated debt securities issued by the HoldingCompany. The common equity units ceased to exist upon the closing of the remarketing of the underlying debt instruments and the settlementof the stock purchase contracts in August 2008 and February 2009. See Notes 13 and 18.
15. Income TaxThe provision for income tax from continuing operations was as follows:
2010 2009 2008
Years Ended December 31,
(In millions)
Current:
Federal . . . . . . . . . . . . . . . . . . . . . . . . . . . . . . . . . . . . . . . . . . . . . . . . . . . . . $ 141 $ (231) $ (35)
State and local . . . . . . . . . . . . . . . . . . . . . . . . . . . . . . . . . . . . . . . . . . . . . . . . 21 12 10
Foreign . . . . . . . . . . . . . . . . . . . . . . . . . . . . . . . . . . . . . . . . . . . . . . . . . . . . . 203 236 623
Subtotal . . . . . . . . . . . . . . . . . . . . . . . . . . . . . . . . . . . . . . . . . . . . . . . . . . . 365 17 598
Deferred:
Federal . . . . . . . . . . . . . . . . . . . . . . . . . . . . . . . . . . . . . . . . . . . . . . . . . . . . . 670 (2,135) 1,056
State and local . . . . . . . . . . . . . . . . . . . . . . . . . . . . . . . . . . . . . . . . . . . . . . . . (7) 26 (6)
Foreign . . . . . . . . . . . . . . . . . . . . . . . . . . . . . . . . . . . . . . . . . . . . . . . . . . . . . 153 77 (68)
Subtotal . . . . . . . . . . . . . . . . . . . . . . . . . . . . . . . . . . . . . . . . . . . . . . . . . . . 816 (2,032) 982
Provision for income tax expense (benefit) . . . . . . . . . . . . . . . . . . . . . . . . . . . . . . . . $1,181 $(2,015) $1,580
F-111MetLife, Inc.
MetLife, Inc.
Notes to the Consolidated Financial Statements — (Continued)

The reconciliation of the income tax provision at the U.S. statutory rate to the provision for income tax as reported for continuing operationswas as follows:
2010 2009 2008
Years Ended December 31,
(In millions)
Tax provision at U.S. statutory rate . . . . . . . . . . . . . . . . . . . . . . . . . . . . . . . . . . . . $1,385 $(1,517) $1,771
Tax effect of:
Tax-exempt investment income . . . . . . . . . . . . . . . . . . . . . . . . . . . . . . . . . . . . . (242) (288) (254)
State and local income tax . . . . . . . . . . . . . . . . . . . . . . . . . . . . . . . . . . . . . . . . 9 17 2
Prior year tax . . . . . . . . . . . . . . . . . . . . . . . . . . . . . . . . . . . . . . . . . . . . . . . . . 59 (26) 53
Tax credits . . . . . . . . . . . . . . . . . . . . . . . . . . . . . . . . . . . . . . . . . . . . . . . . . . (82) (87) (58)
Foreign tax rate differential and change in valuation allowance . . . . . . . . . . . . . . . . . 26 (118) 65
Other, net . . . . . . . . . . . . . . . . . . . . . . . . . . . . . . . . . . . . . . . . . . . . . . . . . . . 26 4 1
Provision for income tax expense (benefit) . . . . . . . . . . . . . . . . . . . . . . . . . . . . . . . . $1,181 $(2,015) $1,580
Deferred income tax represents the tax effect of the differences between the book and tax basis of assets and liabilities. Net deferredincome tax assets and liabilities consisted of the following:
2010 2009
December 31,
(In millions)
Deferred income tax assets:
Policyholder liabilities and receivables . . . . . . . . . . . . . . . . . . . . . . . . . . . . . . . . . . . . . . . $ 5,169 $3,929
Net operating loss carryforwards . . . . . . . . . . . . . . . . . . . . . . . . . . . . . . . . . . . . . . . . . . 1,400 871
Employee benefits . . . . . . . . . . . . . . . . . . . . . . . . . . . . . . . . . . . . . . . . . . . . . . . . . . . . 664 661
Capital loss carryforwards . . . . . . . . . . . . . . . . . . . . . . . . . . . . . . . . . . . . . . . . . . . . . . . 408 551
Tax credit carryforwards . . . . . . . . . . . . . . . . . . . . . . . . . . . . . . . . . . . . . . . . . . . . . . . . 459 401
Net unrealized investment losses . . . . . . . . . . . . . . . . . . . . . . . . . . . . . . . . . . . . . . . . . . — 816
Litigation-related and government mandated . . . . . . . . . . . . . . . . . . . . . . . . . . . . . . . . . . . 227 240
Other . . . . . . . . . . . . . . . . . . . . . . . . . . . . . . . . . . . . . . . . . . . . . . . . . . . . . . . . . . . . 331 276
8,658 7,745
Less: Valuation allowance . . . . . . . . . . . . . . . . . . . . . . . . . . . . . . . . . . . . . . . . . . . . . . . 261 217
8,397 7,528
Deferred income tax liabilities:
Investments, including derivatives . . . . . . . . . . . . . . . . . . . . . . . . . . . . . . . . . . . . . . . . . . 1,253 1,434
Intangibles . . . . . . . . . . . . . . . . . . . . . . . . . . . . . . . . . . . . . . . . . . . . . . . . . . . . . . . . . 3,068 334
Net unrealized investment gains . . . . . . . . . . . . . . . . . . . . . . . . . . . . . . . . . . . . . . . . . . . 1,490 —
DAC . . . . . . . . . . . . . . . . . . . . . . . . . . . . . . . . . . . . . . . . . . . . . . . . . . . . . . . . . . . . . 4,342 4,439
Other . . . . . . . . . . . . . . . . . . . . . . . . . . . . . . . . . . . . . . . . . . . . . . . . . . . . . . . . . . . . 125 93
10,278 6,300
Net deferred income tax asset (liability) . . . . . . . . . . . . . . . . . . . . . . . . . . . . . . . . . . . . . . . . $ (1,881) $1,228
Domestic net operating loss carryforwards of $2,181 million at December 31, 2010 will expire beginning in 2020. State net operating losscarryforwards of $123 million at December 31, 2010 will expire beginning in 2011. Foreign net operating loss carryforwards of $2,132 millionat December 31, 2010 were generated in various foreign countries with expiration periods of five years to indefinite expiration. Domesticcapital loss carryforwards of $1,130 million at December 31, 2010 will expire beginning in 2011. Foreign capital loss carryforwards of$35 million at December 31, 2010 will expire beginning in 2014. Tax credit carryforwards were $459 million at December 31, 2010.
The Company has recorded a valuation allowance related to tax benefits of certain state and foreign net operating and capital losscarryforwards and certain foreign unrealized losses. The valuation allowance reflects management’s assessment, based on availableinformation, that it is more likely than not that the deferred income tax asset for certain foreign net operating and capital loss carryforwards andcertain foreign unrealized losses will not be realized. The tax benefit will be recognized when management believes that it is more likely thannot that these deferred income tax assets are realizable. In 2010, the Company recorded an overall increase to the deferred tax valuationallowance of $44 million, comprised of a decrease of $2 million related to certain foreign unrealized losses, an increase of $18 million relatedto certain foreign capital loss carryforwards, an increase of $28 million related to certain state and foreign net operating loss carryforwards.
The Company has not provided U.S. deferred taxes on cumulative earnings of certain non-U.S. affiliates and associated companies thathave been reinvested indefinitely. These earnings relate to ongoing operations and have been reinvested in active non-U.S. business
F-112 MetLife, Inc.
MetLife, Inc.
Notes to the Consolidated Financial Statements — (Continued)
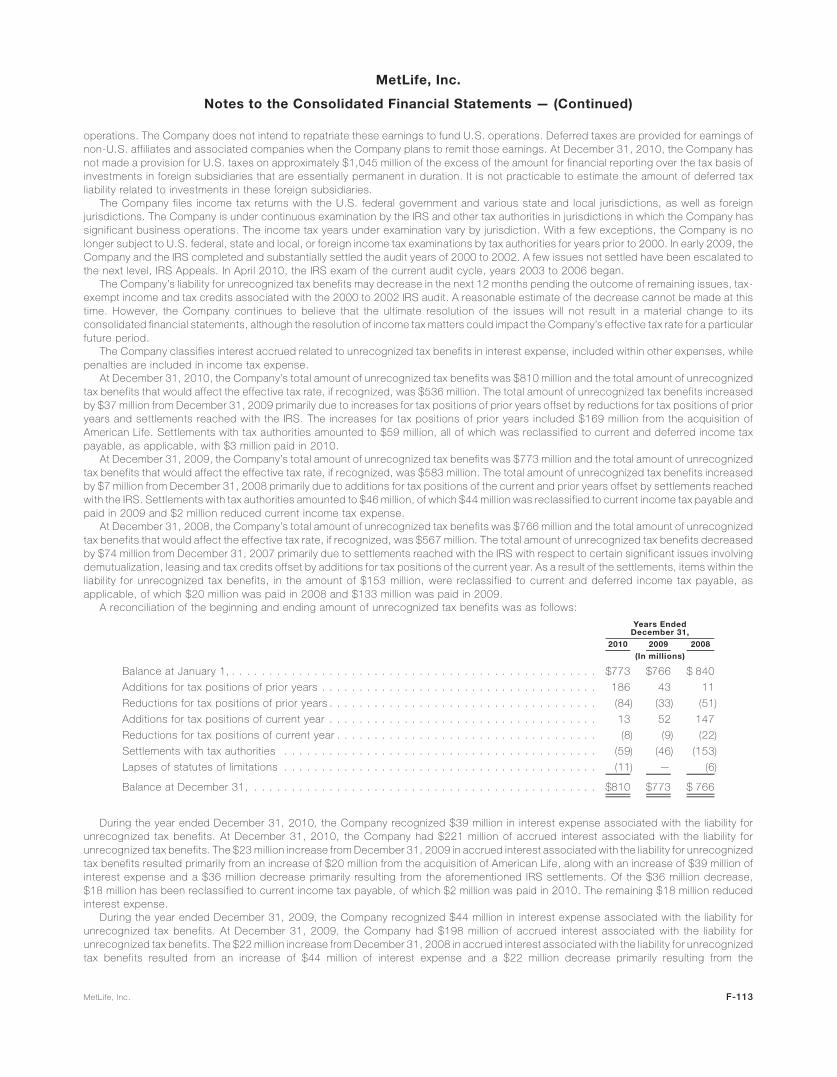
operations. The Company does not intend to repatriate these earnings to fund U.S. operations. Deferred taxes are provided for earnings ofnon-U.S. affiliates and associated companies when the Company plans to remit those earnings. At December 31, 2010, the Company hasnot made a provision for U.S. taxes on approximately $1,045 million of the excess of the amount for financial reporting over the tax basis ofinvestments in foreign subsidiaries that are essentially permanent in duration. It is not practicable to estimate the amount of deferred taxliability related to investments in these foreign subsidiaries.
The Company files income tax returns with the U.S. federal government and various state and local jurisdictions, as well as foreignjurisdictions. The Company is under continuous examination by the IRS and other tax authorities in jurisdictions in which the Company hassignificant business operations. The income tax years under examination vary by jurisdiction. With a few exceptions, the Company is nolonger subject to U.S. federal, state and local, or foreign income tax examinations by tax authorities for years prior to 2000. In early 2009, theCompany and the IRS completed and substantially settled the audit years of 2000 to 2002. A few issues not settled have been escalated tothe next level, IRS Appeals. In April 2010, the IRS exam of the current audit cycle, years 2003 to 2006 began.
The Company’s liability for unrecognized tax benefits may decrease in the next 12 months pending the outcome of remaining issues, tax-exempt income and tax credits associated with the 2000 to 2002 IRS audit. A reasonable estimate of the decrease cannot be made at thistime. However, the Company continues to believe that the ultimate resolution of the issues will not result in a material change to itsconsolidated financial statements, although the resolution of income tax matters could impact the Company’s effective tax rate for a particularfuture period.
The Company classifies interest accrued related to unrecognized tax benefits in interest expense, included within other expenses, whilepenalties are included in income tax expense.
At December 31, 2010, the Company’s total amount of unrecognized tax benefits was $810 million and the total amount of unrecognizedtax benefits that would affect the effective tax rate, if recognized, was $536 million. The total amount of unrecognized tax benefits increasedby $37 million from December 31, 2009 primarily due to increases for tax positions of prior years offset by reductions for tax positions of prioryears and settlements reached with the IRS. The increases for tax positions of prior years included $169 million from the acquisition ofAmerican Life. Settlements with tax authorities amounted to $59 million, all of which was reclassified to current and deferred income taxpayable, as applicable, with $3 million paid in 2010.
At December 31, 2009, the Company’s total amount of unrecognized tax benefits was $773 million and the total amount of unrecognizedtax benefits that would affect the effective tax rate, if recognized, was $583 million. The total amount of unrecognized tax benefits increasedby $7 million from December 31, 2008 primarily due to additions for tax positions of the current and prior years offset by settlements reachedwith the IRS. Settlements with tax authorities amounted to $46 million, of which $44 million was reclassified to current income tax payable andpaid in 2009 and $2 million reduced current income tax expense.
At December 31, 2008, the Company’s total amount of unrecognized tax benefits was $766 million and the total amount of unrecognizedtax benefits that would affect the effective tax rate, if recognized, was $567 million. The total amount of unrecognized tax benefits decreasedby $74 million from December 31, 2007 primarily due to settlements reached with the IRS with respect to certain significant issues involvingdemutualization, leasing and tax credits offset by additions for tax positions of the current year. As a result of the settlements, items within theliability for unrecognized tax benefits, in the amount of $153 million, were reclassified to current and deferred income tax payable, asapplicable, of which $20 million was paid in 2008 and $133 million was paid in 2009.
A reconciliation of the beginning and ending amount of unrecognized tax benefits was as follows:
2010 2009 2008
Years EndedDecember 31,
(In millions)
Balance at January 1, . . . . . . . . . . . . . . . . . . . . . . . . . . . . . . . . . . . . . . . . . . . . . . . . . $773 $766 $ 840
Additions for tax positions of prior years . . . . . . . . . . . . . . . . . . . . . . . . . . . . . . . . . . . . . 186 43 11
Reductions for tax positions of prior years . . . . . . . . . . . . . . . . . . . . . . . . . . . . . . . . . . . . (84) (33) (51)
Additions for tax positions of current year . . . . . . . . . . . . . . . . . . . . . . . . . . . . . . . . . . . . 13 52 147
Reductions for tax positions of current year . . . . . . . . . . . . . . . . . . . . . . . . . . . . . . . . . . . (8) (9) (22)
Settlements with tax authorities . . . . . . . . . . . . . . . . . . . . . . . . . . . . . . . . . . . . . . . . . . (59) (46) (153)
Lapses of statutes of limitations . . . . . . . . . . . . . . . . . . . . . . . . . . . . . . . . . . . . . . . . . . (11) — (6)
Balance at December 31, . . . . . . . . . . . . . . . . . . . . . . . . . . . . . . . . . . . . . . . . . . . . . . $810 $773 $ 766
During the year ended December 31, 2010, the Company recognized $39 million in interest expense associated with the liability forunrecognized tax benefits. At December 31, 2010, the Company had $221 million of accrued interest associated with the liability forunrecognized tax benefits. The $23 million increase from December 31, 2009 in accrued interest associated with the liability for unrecognizedtax benefits resulted primarily from an increase of $20 million from the acquisition of American Life, along with an increase of $39 million ofinterest expense and a $36 million decrease primarily resulting from the aforementioned IRS settlements. Of the $36 million decrease,$18 million has been reclassified to current income tax payable, of which $2 million was paid in 2010. The remaining $18 million reducedinterest expense.
During the year ended December 31, 2009, the Company recognized $44 million in interest expense associated with the liability forunrecognized tax benefits. At December 31, 2009, the Company had $198 million of accrued interest associated with the liability forunrecognized tax benefits. The $22 million increase from December 31, 2008 in accrued interest associated with the liability for unrecognizedtax benefits resulted from an increase of $44 million of interest expense and a $22 million decrease primarily resulting from the
F-113MetLife, Inc.
MetLife, Inc.
Notes to the Consolidated Financial Statements — (Continued)

aforementioned IRS settlements. Of the $22 million decrease, $20 million was reclassified to current income tax payable and was paid in2009. The remaining $2 million reduced interest expense.
During the year ended December 31, 2008, the Company recognized $37 million in interest expense associated with the liability forunrecognized tax benefits. At December 31, 2008, the Company had $176 million of accrued interest associated with the liability forunrecognized tax benefits. The $42 million decrease from December 31, 2007 in accrued interest associated with the liability forunrecognized tax benefits resulted from an increase of $37 million of interest expense and a $79 million decrease primarily resulting fromthe aforementioned IRS settlements. Of the $79 million decrease, $78 million was reclassified to current income tax payable in 2008, with$7 million and $71 million paid in 2008 and 2009, respectively. The remaining $1 million reduced interest expense.
The U.S. Treasury Department and the IRS have indicated that they intend to address through regulations the methodology to be followedin determining the dividends received deduction (“DRD”), related to variable life insurance and annuity contracts. The DRD reduces theamount of dividend income subject to tax and is a significant component of the difference between the actual tax expense and expectedamount determined using the federal statutory tax rate of 35%. Any regulations that the IRS ultimately proposes for issuance in this area will besubject to public notice and comment, at which time insurance companies and other interested parties will have the opportunity to raise legaland practical questions about the content, scope and application of such regulations. As a result, the ultimate timing and substance of anysuch regulations are unknown at this time. For the years ended December 31, 2010 and 2009, the Company recognized an income taxbenefit of $87 million and $216 million, respectively, related to the separate account DRD. The 2010 benefit included an expense of$57 million related to a true-up of the 2009 tax return. The 2009 benefit included a benefit of $33 million related to a true up of the 2008 taxreturn.
16. Contingencies, Commitments and Guarantees
Contingencies
LitigationThe Company is a defendant in a large number of litigation matters. In some of the matters, very large and/or indeterminate amounts,
including punitive and treble damages, are sought. Modern pleading practice in the United States permits considerable variation in theassertion of monetary damages or other relief. Jurisdictions may permit claimants not to specify the monetary damages sought or may permitclaimants to state only that the amount sought is sufficient to invoke the jurisdiction of the trial court. In addition, jurisdictions may permitplaintiffs to allege monetary damages in amounts well exceeding reasonably possible verdicts in the jurisdiction for similar matters. Thisvariability in pleadings, together with the actual experience of the Company in litigating or resolving through settlement numerous claims overan extended period of time, demonstrates to management that the monetary relief which may be specified in a lawsuit or claim bears littlerelevance to its merits or disposition value.
Due to the vagaries of litigation, the outcome of a litigation matter and the amount or range of potential loss at particular points in time maynormally be difficult to ascertain. Uncertainties can include how fact finders will evaluate documentary evidence and the credibility andeffectiveness of witness testimony, and how trial and appellate courts will apply the law in the context of the pleadings or evidence presented,whether by motion practice, or at trial or on appeal. Disposition valuations are also subject to the uncertainty of how opposing parties and theircounsel will themselves view the relevant evidence and applicable law.
On a quarterly and annual basis, the Company reviews relevant information with respect to litigation and contingencies to be reflected inthe Company’s consolidated financial statements. The review includes senior legal and financial personnel. Estimates of possible losses orranges of loss for particular matters cannot in the ordinary course be made with a reasonable degree of certainty. Liabilities are establishedwhen it is probable that a loss has been incurred and the amount of the loss can be reasonably estimated. Liabilities have been established fora number of the matters noted below. It is possible that some of the matters could require the Company to pay damages or make otherexpenditures or establish accruals in amounts that could not be estimated at December 31, 2010.
Asbestos-Related ClaimsMLIC is and has been a defendant in a large number of asbestos-related suits filed primarily in state courts. These suits principally allege
that the plaintiff or plaintiffs suffered personal injury resulting from exposure to asbestos and seek both actual and punitive damages. MLIChas never engaged in the business of manufacturing, producing, distributing or selling asbestos or asbestos-containing products nor hasMLIC issued liability or workers’ compensation insurance to companies in the business of manufacturing, producing, distributing or sellingasbestos or asbestos-containing products. The lawsuits principally have focused on allegations with respect to certain research, publicationand other activities of one or more of MLIC’s employees during the period from the 1920’s through approximately the 1950’s and allege thatMLIC learned or should have learned of certain health risks posed by asbestos and, among other things, improperly publicized or failed todisclose those health risks. MLIC believes that it should not have legal liability in these cases. The outcome of most asbestos litigationmatters, however, is uncertain and can be impacted by numerous variables, including differences in legal rulings in various jurisdictions, thenature of the alleged injury and factors unrelated to the ultimate legal merit of the claims asserted against MLIC. MLIC employs a number ofresolution strategies to manage its asbestos loss exposure, including seeking resolution of pending litigation by judicial rulings and settlingindividual or groups of claims or lawsuits under appropriate circumstances.
Claims asserted against MLIC have included negligence, intentional tort and conspiracy concerning the health risks associated withasbestos. MLIC’s defenses (beyond denial of certain factual allegations) include that: (i) MLIC owed no duty to the plaintiffs— it had no specialrelationship with the plaintiffs and did not manufacture, produce, distribute or sell the asbestos products that allegedly injured plaintiffs;(ii) plaintiffs did not rely on any actions of MLIC; (iii) MLIC’s conduct was not the cause of the plaintiffs’ injuries; (iv) plaintiffs’ exposure occurredafter the dangers of asbestos were known; and (v) the applicable time with respect to filing suit has expired. During the course of the litigation,certain trial courts have granted motions dismissing claims against MLIC, while other trial courts have denied MLIC’s motions to dismiss.There can be no assurance that MLIC will receive favorable decisions on motions in the future. While most cases brought to date have settled,MLIC intends to continue to defend aggressively against claims based on asbestos exposure, including defending claims at trials.
F-114 MetLife, Inc.
MetLife, Inc.
Notes to the Consolidated Financial Statements — (Continued)

The approximate total number of asbestos personal injury claims pending against MLIC as of the dates indicated, the approximate numberof new claims during the years ended on those dates and the approximate total settlement payments made to resolve asbestos personalinjury claims at or during those years are set forth in the following table:
2010 2009 2008
December 31,
(In millions, except number ofclaims)
Asbestos personal injury claims at year end . . . . . . . . . . . . . . . . . . . . . . . . . . . . 68,513 68,804 74,027
Number of new claims during the year . . . . . . . . . . . . . . . . . . . . . . . . . . . . . . . . 5,670 3,910 5,063
Settlement payments during the year(1) . . . . . . . . . . . . . . . . . . . . . . . . . . . . . . . $ 34.9 $ 37.6 $ 99.0
(1) Settlement payments represent payments made by MLIC during the year in connection with settlements made in that year and in prioryears. Amounts do not include MLIC’s attorneys’ fees and expenses and do not reflect amounts received from insurance carriers.In 2007, MLIC received approximately 7,161 new claims, ending the year with a total of approximately 79,717 claims, and paid
approximately $28.2 million for settlements reached in 2007 and prior years. In 2006, MLIC received approximately 7,870 new claims, endingthe year with a total of approximately 87,070 claims, and paid approximately $35.5 million for settlements reached in 2006 and prior years. In2005, MLIC received approximately 18,500 new claims, ending the year with a total of approximately 100,250 claims, and paid approximately$74.3 million for settlements reached in 2005 and prior years. In 2004, MLIC received approximately 23,900 new claims, ending the year witha total of approximately 108,000 claims, and paid approximately $85.5 million for settlements reached in 2004 and prior years. In 2003, MLICreceived approximately 58,750 new claims, ending the year with a total of approximately 111,700 claims, and paid approximately$84.2 million for settlements reached in 2003 and prior years. The number of asbestos cases that may be brought, the aggregate amountof any liability that MLIC may incur, and the total amount paid in settlements in any given year are uncertain and may vary significantly from yearto year.
The ability of MLIC to estimate its ultimate asbestos exposure is subject to considerable uncertainty, and the conditions impacting itsliability can be dynamic and subject to change. The availability of reliable data is limited and it is difficult to predict with any certainty thenumerous variables that can affect liability estimates, including the number of future claims, the cost to resolve claims, the disease mix andseverity of disease in pending and future claims, the impact of the number of new claims filed in a particular jurisdiction and variations in thelaw in the jurisdictions in which claims are filed, the possible impact of tort reform efforts, the willingness of courts to allow plaintiffs to pursueclaims against MLIC when exposure to asbestos took place after the dangers of asbestos exposure were well known, and the impact of anypossible future adverse verdicts and their amounts.
The ability to make estimates regarding ultimate asbestos exposure declines significantly as the estimates relate to years further in thefuture. In the Company’s judgment, there is a future point after which losses cease to be probable and reasonably estimable. It is reasonablypossible that the Company’s total exposure to asbestos claims may be materially greater than the asbestos liability currently accrued and thatfuture charges to income may be necessary. While the potential future charges could be material in the particular quarterly or annual periods inwhich they are recorded, based on information currently known by management, management does not believe any such charges are likely tohave a material adverse effect on the Company’s financial position.
During 1998, MLIC paid $878 million in premiums for excess insurance policies for asbestos-related claims. The excess insurancepolicies for asbestos-related claims provided for recovery of losses up to $1.5 billion in excess of a $400 million self-insured retention. TheCompany’s initial option to commute the excess insurance policies for asbestos-related claims would have arisen at the end of 2008. OnSeptember 29, 2008, MLIC entered into agreements commuting the excess insurance policies at September 30, 2008. As a result of thecommutation of the policies, MLIC received cash and securities totaling $632 million. Of this total, MLIC received $115 million in fixed maturitysecurities on September 26, 2008, $200 million in cash on October 29, 2008, and $317 million in cash on January 29, 2009. MLICrecognized a loss on commutation of the policies in the amount of $35.3 million during 2008.
In the years prior to commutation, the excess insurance policies for asbestos-related claims were subject to annual and per claimsublimits. Amounts exceeding the sublimits during 2007, 2006 and 2005 were approximately $16 million, $8 million and $0, respectively.Amounts were recoverable under the policies annually with respect to claims paid during the prior calendar year. Each asbestos-relatedpolicy contained an experience fund and a reference fund that provided for payments to MLIC at the commutation date if the reference fundwas greater than zero at commutation or pro rata reductions from time to time in the loss reimbursements to MLIC if the cumulative return onthe reference fund was less than the return specified in the experience fund. The return in the reference fund was tied to performance of theS&P 500 Index and the Lehman Brothers Aggregate Bond Index. A claim with respect to the prior year was made under the excess insurancepolicies in each year from 2003 through 2008 for the amounts paid with respect to asbestos litigation in excess of the retention. The foregoneloss reimbursements were approximately $62.2 million with respect to claims for the period of 2002 through 2007. Because the policies werecommuted at September 30, 2008, there will be no claims under the policies or forgone loss reimbursements with respect to payments madein 2008 and thereafter.
The Company believes adequate provision has been made in its consolidated financial statements for all probable and reasonablyestimable losses for asbestos-related claims. MLIC’s recorded asbestos liability is based on its estimation of the following elements, asinformed by the facts presently known to it, its understanding of current law and its past experiences: (i) the probable and reasonablyestimable liability for asbestos claims already asserted against MLIC, including claims settled but not yet paid; (ii) the probable and reasonablyestimable liability for asbestos claims not yet asserted against MLIC, but which MLIC believes are reasonably probable of assertion; and(iii) the legal defense costs associated with the foregoing claims. Significant assumptions underlying MLIC’s analysis of the adequacy of itsrecorded liability with respect to asbestos litigation include: (i) the number of future claims; (ii) the cost to resolve claims; and (iii) the cost todefend claims.
F-115MetLife, Inc.
MetLife, Inc.
Notes to the Consolidated Financial Statements — (Continued)
MLIC reevaluates on a quarterly and annual basis its exposure from asbestos litigation, including studying its claims experience, reviewingexternal literature regarding asbestos claims experience in the United States, assessing relevant trends impacting asbestos liability andconsidering numerous variables that can affect its asbestos liability exposure on an overall or per claim basis. These variables includebankruptcies of other companies involved in asbestos litigation, legislative and judicial developments, the number of pending claims involvingserious disease, the number of new claims filed against it and other defendants and the jurisdictions in which claims are pending. Aspreviously disclosed, in 2002 MLIC increased its recorded liability for asbestos-related claims by $402 million from approximately $820 millionto $1,225 million. Based upon its regular reevaluation of its exposure from asbestos litigation, MLIC has updated its liability analysis forasbestos-related claims through December 31, 2010.
Regulatory MattersThe Company receives and responds to subpoenas or other inquiries from state regulators, including state insurance commissioners;
state attorneys general or other state governmental authorities; federal regulators, including the SEC; federal governmental authorities,including congressional committees; and the Financial Industry Regulatory Authority (“FINRA”) seeking a broad range of information. Theissues involved in information requests and regulatory matters vary widely. The Company cooperates in these inquiries.
Attorneys general from 50 states and several state banking and mortgage regulators announced a multistate joint investigation ofmortgage servicers to determine whether inaccurate affidavits or other documents were submitted in support of foreclosure proceedings.MetLife Bank, and specifically its mortgage servicing department within MetLife Home Loans, received requests for information from some ofthese state attorneys general and other regulators. Also, the Acting Comptroller of the Currency disclosed in testimony before Congress that14 mortgage servicing businesses affiliated with banking organizations, including that of MetLife Bank, have been the subject of an intra-agency confidential “horizontal examination” of mortgage servicing and foreclosure activities. The Acting Comptroller also testified thatfederal banking regulators expect to issue administrative enforcement orders to such businesses and to seek civil money penalties. TheActing Comptroller’s testimony also indicated that other federal agencies, including the Department of Justice and the Federal TradeCommission, were examining potential actions with respect to such businesses. MetLife is cooperating with its regulators in connection withtheir review of these matters but cannot predict the outcome of these matters. It is possible that additional state or federal regulators orlegislative bodies may pursue similar investigations or make related inquiries. Management believes that the Company’s financial statementsas a whole will not be materially affected by the MetLife Bank regulatory matters.
United States of America v. EME Homer City Generation, L.P., et al. (W.D. Pa., filed January 4, 2011). On January 4, 2011, the UnitedStates commenced a civil action in United States District Court for the Western District of Pennsylvania against EME Homer City GenerationL.P. (“EME Homer City”), Homer City OL6 LLC, and other defendants regarding the operations of the Homer City Generating Station, anelectricity generating facility. Homer City OL6 LLC, an entity owned by MLIC, is a passive investor with a noncontrolling interest in theelectricity generating facility, which is solely operated by the lessee, EME Homer City. The complaint seeks injunctive relief and assessment ofcivil penalties for alleged violations of the federal Clean Air Act and Pennsylvania’s State Implementation Plan. The alleged violations were thesubject of Notices of Violations (“NOVs”) that the Environmental Protection Agency (“EPA”) issued to EME Homer City, Homer City OL6 LLC,and others in June 2008 and May 2010. On January 7, 2011, the United States District Court for the Western District of Pennsylvania grantedthe motion by the Pennsylvania Department of Environmental Protection and the State of New York to intervene in the lawsuit as additionalplaintiffs. On January 7, 2011, two plaintiffs filed a putative class action titled Scott Jackson and Maria Jackson v. EME Homer City GenerationL.P., et. al. in the United States District Court for the Western District of Pennsylvania on behalf of a putative class of persons who haveallegedly incurred damage to their persons and/or property because of the violations alleged in the action brought by the United States.Homer City OL6 LLC is a defendant in this action. EME Homer City has acknowledged its obligation to indemnify Homer City OL6 LLC for anyclaims relating to the NOVs.
In the Matter of Chemform, Inc. Site, Pompano Beach, Broward County, Florida. In July 2010, the EPA advised MLIC that it believedpayments were due under two settlement agreements, known as “Administrative Orders on Consent,” that New England Mutual LifeInsurance Company (“New England Mutual”) signed in 1989 and 1992 with respect to the cleanup of a Superfund site in Florida (the“Chemform Site”). The EPA originally contacted MLIC (as successor to New England Mutual) and a third party in 2001, and advised that theyowed additional clean-up costs for the Chemform Site. The matter was not resolved at that time. The EPA is requesting payment of an amountunder $1 million from MLIC and a third party for past costs and for future environmental testing costs at the Chemform Site.
Regulatory authorities in a small number of states and FINRA, and occasionally the SEC, have had investigations or inquiries relating tosales of individual life insurance policies or annuities or other products by MLIC, MICC, New England Life Insurance Company and GALIC, andthe four Company broker-dealers, which are MetLife Securities, Inc. (“MSI”), New England Securities Corporation, Walnut Street Securities,Inc. and Tower Square Securities, Inc. These investigations often focus on the conduct of particular financial services representatives and thesale of unregistered or unsuitable products or the misuse of client assets. Over the past several years, these and a number of investigationsby other regulatory authorities were resolved for monetary payments and certain other relief, including restitution payments. The Companymay continue to resolve investigations in a similar manner. The Company believes adequate provision has been made in its consolidatedfinancial statements for all probable and reasonably estimable losses for these sales practices-related investigations or inquiries.
Retained Asset Account MattersThe New York Attorney General announced on July 29, 2010 that his office had launched a major fraud investigation into the life insurance
industry for practices related to the use of retained asset accounts as a settlement option for death benefits and that subpoenas requestingcomprehensive data related to retained asset accounts had been served on MetLife and other insurance carriers. The Company received thesubpoena on July 30, 2010. The Company also has received requests for documents and information from U.S. congressional committeesand members as well as various state regulatory bodies, including the New York Insurance Department. It is possible that other state andfederal regulators or legislative bodies may pursue similar investigations or make related inquiries. Management cannot predict what effectany such investigations might have on the Company’s earnings or the availability of the Company’s retained asset account known as the TotalControl Account (“TCA”), but management believes that the Company’s consolidated financial statements taken as a whole would not be
F-116 MetLife, Inc.
MetLife, Inc.
Notes to the Consolidated Financial Statements — (Continued)
materially affected. Management believes that any allegations that information about the TCA is not adequately disclosed or that the accountsare fraudulent or otherwise violate state or federal laws are without merit.
MLIC is a defendant in lawsuits related to the TCA. The lawsuits include claims of breach of contract, breach of a common law fiduciaryduty or a quasi-fiduciary duty such as a confidential or special relationship, or breach of a fiduciary duty under the Employee RetirementIncome Security Act of 1974 (“ERISA”).
Clark, et al. v. Metropolitan Life Insurance Company (D. Nev., filed March 28, 2008). This putative class action lawsuit alleges breach ofcontract and breach of a common law fiduciary and/or quasi-fiduciary duty arising from use of the TCA to pay life insurance policy deathbenefits. As damages, plaintiffs seek disgorgement of the difference between the interest paid to the account holders and the investmentearnings on the assets backing the accounts. In March 2009, the court granted in part and denied in part MLIC’s motion to dismiss,dismissing the fiduciary duty and unjust enrichment claims but allowing a breach of contract claim and a special or confidential relationshipclaim to go forward. On September 9, 2010, the court granted MLIC’s motion for summary judgment. On September 20, 2010, plaintiff filed aNotice of Appeal to the United States Court of Appeals for the Ninth Circuit.
Faber, et al. v. Metropolitan Life Insurance Company (S.D.N.Y., filed December 4, 2008). This putative class action lawsuit alleges thatMLIC’s use of the TCA as the settlement option under group life insurance policies violates MLIC’s fiduciary duties under ERISA. As damages,plaintiffs seek disgorgement of the difference between the interest paid to the account holders and the investment earnings on the assetsbacking the accounts. On October 23, 2009, the court granted MLIC’s motion to dismiss with prejudice. On November 24, 2009, plaintiffsfiled a Notice of Appeal to the United States Court of Appeals for the Second Circuit.
Keife, et al. v. Metropolitan Life Insurance Company (D. Nev., filed in state court on July 30, 2010 and removed to federal court onSeptember 7, 2010). This putative class action lawsuit raises a breach of contract claim arising from MLIC’s use of the TCA to pay lifeinsurance benefits under the Federal Employees’ Group Life Insurance program. As damages, plaintiffs seek disgorgement of the differencebetween the interest paid to the account holders and the investment earnings on the assets backing the accounts. In September 2010,plaintiffs filed a motion for class certification of the breach of contract claim, which the court has stayed. On November 22, 2010, MLIC filed amotion to dismiss.
Other U.S. LitigationTravelers Ins. Co., et al. v. Banc of America Securities LLC (S.D.N.Y., filed December 13, 2001). On January 6, 2009, after a jury trial, the
district court entered a judgment in favor of The Travelers Insurance Company, now known as MICC, in the amount of approximately$42 million in connection with securities and common law claims against the defendant. On May 14, 2009, the district court issued an opinionand order denying the defendant’s post judgment motion seeking a judgment in its favor or, in the alternative, a new trial. On July 20, 2010, theUnited States Court of Appeals for the Second Circuit issued an order affirming the district court’s judgment in favor of MICC and the districtcourt’s order denying defendant’s post-trial motions. On October 14, 2010, the Second Circuit issued an order denying defendant’s petitionfor rehearing of its appeal. On October 20, 2010, the defendant paid MICC approximately $42 million, which represents the judgment amountdue to MICC. This lawsuit is now fully resolved.
Roberts, et al. v. Tishman Speyer Properties, et al. (Sup. Ct., N.Y. County, filed January 22, 2007). This lawsuit was filed by a putativeclass of market rate tenants at Stuyvesant Town and Peter Cooper Village against parties including Metropolitan Tower Life InsuranceCompany (“MTL”) and Metropolitan Insurance and Annuity Company. Metropolitan Insurance and Annuity Company has merged into MTL andno longer exists as a separate entity. These tenants claim that MTL, as former owner, and the current owner improperly deregulatedapartments while receiving J-51 tax abatements. The lawsuit seeks declaratory relief and damages for rent overcharges. Although thetenants allege over $200 million in damages in the complaint, MTL strongly disputes the tenants’ damages amounts. In October 2009, theNew York State Court of Appeals issued an opinion denying MTL’s motion to dismiss the complaint. The lawsuit has returned to the trial courtwhere MTL continues to vigorously defend against the claims. The Company believes adequate provision has been made in its consolidatedfinancial statements for all probable and reasonably estimable losses for this lawsuit. It is reasonably possible that the Company’s totalexposure may be greater than the liability currently accrued and that future charges to income may be necessary. Management believes thatthe Company’s financial statements as a whole will not be materially affected by any such future charges.
Thomas, et al. v. Metropolitan Life Ins. Co., et al. (W.D. Okla., filed January 31, 2007). A putative class action complaint was filed againstMLIC and MSI. Plaintiffs asserted legal theories of violations of the federal securities laws and violations of state laws with respect to the saleof certain proprietary products by the Company’s agency distribution group. Plaintiffs sought rescission, compensatory damages, interest,punitive damages and attorneys’ fees and expenses. In August 2009, the district court granted defendants’ motion for summary judgment.On February 2, 2011, the United States Court of Appeals for the Tenth Circuit affirmed the judgment of the district court granting MLIC’s andMSI’s summary judgment motion.
Sales Practices Claims. Over the past several years, the Company has faced numerous claims, including class action lawsuits, allegingimproper marketing or sales of individual life insurance policies, annuities, mutual funds or other products. Some of the current cases seeksubstantial damages, including punitive and treble damages and attorneys’ fees. The Company continues to vigorously defend against theclaims in these matters. The Company believes adequate provision has been made in its consolidated financial statements for all probableand reasonably estimable losses for sales practices matters.
International LitigationSun Life Assurance Company of Canada v. Metropolitan Life Ins. Co. (Super. Ct., Ontario, October 2006). In 2006, Sun Life Assurance
Company of Canada (“Sun Life”), as successor to the purchaser of MLIC’s Canadian operations, filed this lawsuit in Toronto, seeking adeclaration that MLIC remains liable for “market conduct claims” related to certain individual life insurance policies sold by MLIC and that havebeen transferred to Sun Life. Sun Life had asked that the court require MLIC to indemnify Sun Life for these claims pursuant to indemnityprovisions in the sale agreement for the sale of MLIC’s Canadian operations entered into in June of 1998. In January 2010, the court foundthat Sun Life had given timely notice of its claim for indemnification but, because it found that Sun Life had not yet incurred an indemnifiableloss, granted MLIC’s motion for summary judgment. Both parties appealed. In September 2010, Sun Life notified MLIC that a purported class
F-117MetLife, Inc.
MetLife, Inc.
Notes to the Consolidated Financial Statements — (Continued)
action lawsuit was filed against Sun Life in Toronto, Kang v. Sun Life Assurance Co. (Super. Ct., Ontario, September 2010), alleging salespractices claims regarding the same individual policies sold by MLIC and transferred to Sun Life. Sun Life contends that MLIC is obligated toindemnify Sun Life for some or all of the claims in this lawsuit. MLIC is currently not a party to the Kang v. Sun Life lawsuit.
Italy Fund Redemption Suspension Complaints and Litigation. As a result of suspension of withdrawals and diminution in value in certainfunds offered within certain unit-linked policies sold by the Italian branch of Alico Life International, Ltd. (“ALIL”), a number of policyholdersinvested in those funds have either commenced or threatened litigation against ALIL, alleging misrepresentation, inadequate disclosures andother related claims. These policyholders contacted ALIL beginning in July 2009 alleging that the funds operated at variance to the publishedprospectus and that prospectus risk disclosures were allegedly wrong, unclear, and misleading. The limited number of lawsuits that havebeen filed to date have either been resolved or are proceeding through litigation. In March 2010, ALIL learned that the public prosecutor inMilan had opened a formal investigation into the actions of ALIL employees, as well as of employees of ALIL’s major distributor, based upon apolicyholder complaint. The complaint filed by the policyholder has now been withdrawn. ALIL is cooperating with the Italian and Irishregulatory authorities, which have jurisdiction in connection with this matter. The Stock Purchase Agreement includes a provision pursuant towhich the Holding Company and certain related parties may seek indemnification for liabilities in excess of an agreed upon amount arising outof certain specified policyholder claims and governmental investigations in connection with the above-mentioned unit-linked policies. Seealso “Indemnification Assets and Contingent Consideration” in Note 2.
SummaryPutative or certified class action litigation and other litigation and claims and assessments against the Company, in addition to those
discussed previously and those otherwise provided for in the Company’s consolidated financial statements, have arisen in the course of theCompany’s business, including, but not limited to, in connection with its activities as an insurer, mortgage lending bank, employer, investor,investment advisor and taxpayer. Further, state insurance regulatory authorities and other federal and state authorities regularly makeinquiries and conduct investigations concerning the Company’s compliance with applicable insurance and other laws and regulations.
It is not possible to predict the ultimate outcome or provide reasonable ranges of potential losses of all pending investigations and legalproceedings. In some of the matters referred to previously, very large and/or indeterminate amounts, including punitive and treble damages,are sought. Although in light of these considerations it is possible that an adverse outcome in certain cases could have a material adverseeffect upon the Company’s financial position, based on information currently known by the Company’s management, in its opinion, theoutcomes of such pending investigations and legal proceedings are not likely to have such an effect. However, given the large and/orindeterminate amounts sought in certain of these matters and the inherent unpredictability of litigation, it is possible that an adverse outcomein certain matters could, from time to time, have a material adverse effect on the Company’s consolidated net income or cash flows inparticular quarterly or annual periods.
Insolvency AssessmentsMost of the jurisdictions in which the Company is admitted to transact business require insurers doing business within the jurisdiction to
participate in guaranty associations, which are organized to pay contractual benefits owed pursuant to insurance policies issued by impaired,insolvent or failed insurers. These associations levy assessments, up to prescribed limits, on all member insurers in a particular state on thebasis of the proportionate share of the premiums written by member insurers in the lines of business in which the impaired, insolvent or failedinsurer engaged. Some states permit member insurers to recover assessments paid through full or partial premium tax offsets. In addition,Japan has established a Policyholder Protection Commission as a contingency to protect policyholders against the insolvency of lifeinsurance companies in Japan through assessments to companies licensed to provide life insurance.
Assets and liabilities held for insolvency assessments were as follows:
2010 2009
December 31,
(In millions)
Other Assets:
Premium tax offset for future undiscounted assessments . . . . . . . . . . . . . . . . . . . . . . . . . . . . . . $55 $54
Premium tax offsets currently available for paid assessments . . . . . . . . . . . . . . . . . . . . . . . . . . . 8 9
Receivable for reimbursement of paid assessments (1) . . . . . . . . . . . . . . . . . . . . . . . . . . . . . . . 6 4
$69 $67
Other Liabilities:
Insolvency assessments . . . . . . . . . . . . . . . . . . . . . . . . . . . . . . . . . . . . . . . . . . . . . . . . . . . $94 $86
(1) The Company holds a receivable from the seller of a prior acquisition in accordance with the purchase agreement.Assessments levied against the Company were $4 million, $2 million and $2 million for the years ended December 31, 2010, 2009 and
2008, respectively.
ArgentinaThe Argentine economic, regulatory and legal environment, including interpretations of laws and regulations by regulators and courts, is
uncertain. Potential legal or governmental actions related to pension reform, fiduciary responsibilities, performance guarantees and taxrulings could adversely affect the results of the Company.
In 2007, pension reform legislation in Argentina was enacted which relieved the Company of its obligation to provide death and disabilitypolicy coverages and resulted in the elimination of related insurance liabilities. The reform reinstituted the government’s pension plan systemand allowed for pension participants to transfer their future contributions to the government pension plan system.
F-118 MetLife, Inc.
MetLife, Inc.
Notes to the Consolidated Financial Statements — (Continued)

Although it no longer received compensation, the Company continued to be responsible for managing the funds of those participants thattransferred to the government system. This change resulted in the establishment of a liability for future servicing obligations and theelimination of the Company’s obligations under death and disability policy coverages. During 2008, the future servicing obligation wasreduced by $23 million, net of income tax, when information regarding the level of participation in the government pension plan became fullyavailable.
In September 2008, the Argentine Supreme Court ruled against the validity of the 2002 Pesification Law enacted by the Argentinegovernment. This ruling applied to certain social security pension annuity contractholders that had filed a lawsuit against the 2002 PesificationLaw. The annuity contracts impacted by this ruling, which were deemed peso denominated under the 2002 Pesification Law, are nowconsidered to be U.S. dollar denominated obligations of the Company. The applicable contingent liabilities were then adjusted and refined tobe consistent with this ruling. The impact of the refinements resulting from the change in these contingent liabilities and the associated futurepolicyholder benefits was an increase to net income of $34 million, net of income tax, during the year ended December 31, 2008.
In October 2008, the Argentine government announced its intention to nationalize private pensions and, in December 2008, the Argentinegovernment nationalized the private pension system seizing the underlying investments of participants which were being managed by theCompany. With this action, the Company’s pension business in Argentina ceased to exist and the Company eliminated certain assets andliabilities held in connection with the pension business. Deferred acquisition costs, deferred tax assets, and liabilities — primarily the liabilityfor future servicing obligation referred to above — were eliminated and the Company incurred severance costs associated with thetermination of employees. The impact of the elimination of assets and liabilities and the incurral of severance costs was an increase tonet income of $6 million, net of income tax, during the year ended December 31, 2008.
In March 2009, in light of market developments resulting from the Supreme Court ruling contrary to the Pesification Law and theimplementation by the Company of a program to allow the contractholders that had not filed a lawsuit to convert to U.S. dollars the socialsecurity annuity contracts denominated in pesos by the Pesification Law, the Company further reduced the outstanding contingent liabilitiesby $108 million, net of income tax, which was partially offset by the establishment of contingent liabilities from the implementation of theprogram to convert these contracts to U.S. dollars of $13 million, net of income tax, resulting in a decrease to net loss of $95 million, net ofincome tax, for the year ended December 31, 2009.
Further governmental or legal actions are possible in Argentina. Such actions may impact the level of existing liabilities or may createadditional obligations or benefits to the Company’s operations in Argentina. Management has made its best estimate of its obligations basedupon information currently available; however, further governmental or legal actions could result in changes in obligations which couldmaterially impact the amounts presented within the consolidated financial statements.
Commitments
LeasesIn accordance with industry practice, certain of the Company’s income from lease agreements with retail tenants are contingent upon the
level of the tenants’ revenues. Additionally, the Company, as lessee, has entered into various lease and sublease agreements for officespace, information technology and other equipment. Future minimum rental and sublease income, and minimum gross rental paymentsrelating to these lease agreements are as follows:
RentalIncome
SubleaseIncome
GrossRental
Payments
(In millions)
2011 . . . . . . . . . . . . . . . . . . . . . . . . . . . . . . . . . . . . . . . . . . . . . . . . . . . . . . . $444 $18 $366
2012 . . . . . . . . . . . . . . . . . . . . . . . . . . . . . . . . . . . . . . . . . . . . . . . . . . . . . . . $375 $17 $280
2013 . . . . . . . . . . . . . . . . . . . . . . . . . . . . . . . . . . . . . . . . . . . . . . . . . . . . . . . $331 $16 $237
2014 . . . . . . . . . . . . . . . . . . . . . . . . . . . . . . . . . . . . . . . . . . . . . . . . . . . . . . . $286 $10 $167
2015 . . . . . . . . . . . . . . . . . . . . . . . . . . . . . . . . . . . . . . . . . . . . . . . . . . . . . . . $236 $ 6 $136
Thereafter . . . . . . . . . . . . . . . . . . . . . . . . . . . . . . . . . . . . . . . . . . . . . . . . . . . . $724 $44 $965
During 2008, the Company moved certain of its operations in New York from Long Island City, Queens to Manhattan. As a result of thismovement of operations and current market conditions, which precluded the Company’s immediate and complete sublet of all unused spacein both Long Island City and Manhattan, the Company incurred a lease impairment charge of $38 million which is included within otherexpenses in Banking, Corporate & Other. The impairment charge was determined based upon the present value of the gross rental paymentsless sublease income discounted at a risk-adjusted rate over the remaining lease terms which range from 15-20 years. The Company hasmade assumptions with respect to the timing and amount of future sublease income in the determination of this impairment charge. During2009, pending sublease deals were impacted by the further decline of market conditions, which resulted in an additional lease impairmentcharge of $52 million. See Note 19 for discussion of $28 million of such charges related to restructuring. Additional impairment charges couldbe incurred should market conditions deteriorate further or last for a period significantly longer than anticipated.
Commitments to Fund Partnership InvestmentsThe Company makes commitments to fund partnership investments in the normal course of business. The amounts of these unfunded
commitments were $3.8 billion and $4.1 billion at December 31, 2010 and 2009, respectively. The Company anticipates that these amountswill be invested in partnerships over the next five years.
F-119MetLife, Inc.
MetLife, Inc.
Notes to the Consolidated Financial Statements — (Continued)
Mortgage Loan CommitmentsThe Company has issued interest rate lock commitments on certain residential mortgage loan applications totaling $2.5 billion and
$2.7 billion at December 31, 2010 and 2009, respectively. The Company intends to sell the majority of these originated residential mortgageloans. Interest rate lock commitments to fund mortgage loans that will be held-for-sale are considered derivatives and their estimated fairvalue and notional amounts are included within interest rate forwards in Note 4.
The Company also commits to lend funds under certain other mortgage loan commitments that will be held-for-investment. The amountsof these mortgage loan commitments were $3.8 billion and $2.2 billion at December 31, 2010 and 2009, respectively.
Commitments to Fund Bank Credit Facilities, Bridge Loans and Private Corporate Bond InvestmentsThe Company commits to lend funds under bank credit facilities, bridge loans and private corporate bond investments. The amounts of
these unfunded commitments were $2.4 billion and $1.3 billion at December 31, 2010 and 2009, respectively.
GuaranteesIn the normal course of its business, the Company has provided certain indemnities, guarantees and commitments to third parties
pursuant to which it may be required to make payments now or in the future. In the context of acquisition, disposition, investment and othertransactions, the Company has provided indemnities and guarantees, including those related to tax, environmental and other specificliabilities and other indemnities and guarantees that are triggered by, among other things, breaches of representations, warranties orcovenants provided by the Company. In addition, in the normal course of business, the Company provides indemnifications to counterpartiesin contracts with triggers similar to the foregoing, as well as for certain other liabilities, such as third-party lawsuits. These obligations are oftensubject to time limitations that vary in duration, including contractual limitations and those that arise by operation of law, such as applicablestatutes of limitation. In some cases, the maximum potential obligation under the indemnities and guarantees is subject to a contractuallimitation ranging from less than $1 million to $800 million, with a cumulative maximum of $1.6 billion, while in other cases such limitations arenot specified or applicable. Since certain of these obligations are not subject to limitations, the Company does not believe that it is possible todetermine the maximum potential amount that could become due under these guarantees in the future. Management believes that it is unlikelythe Company will have to make any material payments under these indemnities, guarantees, or commitments.
In addition, the Company indemnifies its directors and officers as provided in its charters and by-laws. Also, the Company indemnifies itsagents for liabilities incurred as a result of their representation of the Company’s interests. Since these indemnities are generally not subject tolimitation with respect to duration or amount, the Company does not believe that it is possible to determine the maximum potential amount thatcould become due under these indemnities in the future.
The Company has also guaranteed minimum investment returns on certain international retirement funds in accordance with local laws.Since these guarantees are not subject to limitation with respect to duration or amount, the Company does not believe that it is possible todetermine the maximum potential amount that could become due under these guarantees in the future.
During the year ended December 31, 2010, the Company did not record any additional liabilities for indemnities, guarantees andcommitments. The Company’s recorded liabilities were $5 million at both December 31, 2010 and 2009, for indemnities, guarantees andcommitments.
17. Employee Benefit Plans
Pension and Other Postretirement Benefit PlansThe Subsidiaries sponsor and/or administer various qualified and non-qualified defined benefit pension plans and other postretirement
employee benefit plans covering employees and sales representatives who meet specified eligibility requirements. Pension benefits areprovided utilizing either a traditional formula or cash balance formula. The traditional formula provides benefits that are primarily based uponyears of credited service and final average earnings. The cash balance formula primarily utilizes hypothetical or notional accounts which creditparticipants with benefits equal to a percentage of eligible pay, as well as earnings credits, determined annually based upon the averageannual rate of interest on 30-year U.S. Treasury securities, for each account balance. At December 31, 2010, the majority of activeparticipants were accruing benefits under the cash balance formula; however, approximately 90% of the Subsidiaries’ obligations result frombenefits calculated with the traditional formula. The U.S. non-qualified pension plans provide supplemental benefits in excess of limitsapplicable to a qualified plan.
The Subsidiaries also provide certain postemployment benefits and certain postretirement medical and life insurance benefits for retiredemployees. Employees of the Subsidiaries who were hired prior to 2003 (or, in certain cases, rehired during or after 2003) and meet age andservice criteria while working for one of the Subsidiaries may become eligible for these other postretirement benefits, at various levels, inaccordance with the applicable plans. Virtually all retirees, or their beneficiaries, contribute a portion of the total costs of postretirementmedical benefits. Employees hired after 2003 are not eligible for any employer subsidy for postretirement medical benefits.
In connection with the Acquisition, domestic American Life employees who became employees of certain Subsidiaries (including thosewho remained employees of companies acquired in the Acquisition) were credited with service recognized by AIG for purposes of determiningeligibility under the pension plans with respect to benefits earned under the pension plans subsequent to the closing date of the Acquisition.
Additionally, in connection with the Acquisition, the Company acquired certain pension plans sponsored by American Life. As of the end ofthe year, these plans had liabilities of approximately $595 million and assets of approximately $97 million.
Measurement dates used for all of the Subsidiaries’ defined benefit pension and other postretirement benefit plans correspond with thefiscal year ends of sponsoring Subsidiaries, which are December 31 for most Subsidiaries and November 30 for American Life.
F-120 MetLife, Inc.
MetLife, Inc.
Notes to the Consolidated Financial Statements — (Continued)

Obligations, Funded Status and Net Periodic Benefit Costs
2010 2009 2010 2009
December 31,
PensionBenefits
OtherPostretirement
Benefits
(In millions)
Change in benefit obligations:
Benefit obligations at beginning of year . . . . . . . . . . . . . . . . . . . . . . . . . . . $ 6,649 $6,041 $1,847 $1,632
Service costs . . . . . . . . . . . . . . . . . . . . . . . . . . . . . . . . . . . . . . . . . . 180 170 17 22
Interest costs . . . . . . . . . . . . . . . . . . . . . . . . . . . . . . . . . . . . . . . . . . 399 395 113 125
Plan participants’ contributions . . . . . . . . . . . . . . . . . . . . . . . . . . . . . . . — — 34 30
Net actuarial (gains) losses . . . . . . . . . . . . . . . . . . . . . . . . . . . . . . . . . 271 421 73 351
Acquisition, settlements and curtailments . . . . . . . . . . . . . . . . . . . . . . . . 639 12 — —
Change in benefits . . . . . . . . . . . . . . . . . . . . . . . . . . . . . . . . . . . . . . 1 (6) (80) (167)
Prescription drug subsidy . . . . . . . . . . . . . . . . . . . . . . . . . . . . . . . . . . — — 12 12
Benefits paid . . . . . . . . . . . . . . . . . . . . . . . . . . . . . . . . . . . . . . . . . . (420) (384) (154) (158)
Transfers . . . . . . . . . . . . . . . . . . . . . . . . . . . . . . . . . . . . . . . . . . . . . — — (17) —
Benefit obligations at end of year . . . . . . . . . . . . . . . . . . . . . . . . . . . . . . . 7,719 6,649 1,845 1,847
Change in plan assets:
Fair value of plan assets at beginning of year . . . . . . . . . . . . . . . . . . . . . . . 5,770 5,559 1,121 1,011
Actual return on plan assets . . . . . . . . . . . . . . . . . . . . . . . . . . . . . . . . 716 525 102 137
Acquisition and settlements . . . . . . . . . . . . . . . . . . . . . . . . . . . . . . . . . 97 — — —
Plan participants’ contributions . . . . . . . . . . . . . . . . . . . . . . . . . . . . . . . — — 34 2
Employer contributions . . . . . . . . . . . . . . . . . . . . . . . . . . . . . . . . . . . . 325 70 95 4
Benefits paid . . . . . . . . . . . . . . . . . . . . . . . . . . . . . . . . . . . . . . . . . . (420) (384) (140) (33)
Transfers . . . . . . . . . . . . . . . . . . . . . . . . . . . . . . . . . . . . . . . . . . . . . — — (12) —
Fair value of plan assets at end of year . . . . . . . . . . . . . . . . . . . . . . . . . 6,488 5,770 1,200 1,121
Funded status at end of year . . . . . . . . . . . . . . . . . . . . . . . . . . . . . . . . $(1,231) $ (879) $ (645) $ (726)
Amounts recognized in the consolidated balance sheets consist of:
Other assets . . . . . . . . . . . . . . . . . . . . . . . . . . . . . . . . . . . . . . . . . . $ 112 $ — $ — $ —
Other liabilities . . . . . . . . . . . . . . . . . . . . . . . . . . . . . . . . . . . . . . . . . (1,343) (879) (645) (726)
Net amount recognized . . . . . . . . . . . . . . . . . . . . . . . . . . . . . . . . . . . . $(1,231) $ (879) $ (645) $ (726)
Accumulated other comprehensive (income) loss:
Net actuarial losses . . . . . . . . . . . . . . . . . . . . . . . . . . . . . . . . . . . . . . $ 2,092 $2,267 $ 400 $ 388
Prior service costs (credit) . . . . . . . . . . . . . . . . . . . . . . . . . . . . . . . . . . 20 25 (285) (288)
Accumulated other comprehensive (income) loss . . . . . . . . . . . . . . . . . . . 2,112 2,292 115 100
Deferred income tax (benefit) . . . . . . . . . . . . . . . . . . . . . . . . . . . . . . . . (738) (811) (40) (36)
Accumulated other comprehensive (income) loss, net of income tax . . . . . . . $ 1,374 $1,481 $ 75 $ 64
The aggregate projected benefit obligation and aggregate fair value of plan assets for the pension benefit plans were as follows:
2010 2009 2010 2009 2010 2009
December 31,
Qualified PlansNon-Qualified
Plans Total
(In millions)
Aggregate fair value of plan assets . . . . . . . . . . . . . . . . . . $6,484 $5,770 $ 4 $ — $ 6,488 $5,770
Aggregate projected benefit obligations . . . . . . . . . . . . . . . 6,835 5,862 884 787 7,719 6,649
Over (under) funded . . . . . . . . . . . . . . . . . . . . . . . . . . . $ (351) $ (92) $(880) $(787) $(1,231) $ (879)
The accumulated benefit obligations for all defined benefit pension plans were $7,320 million and $6,321 million at December 31, 2010and 2009, respectively.
F-121MetLife, Inc.
MetLife, Inc.
Notes to the Consolidated Financial Statements — (Continued)
The aggregate pension accumulated benefit obligation and aggregate fair value of plan assets for pension benefit plans with accumulatedbenefit obligations in excess of plan assets was as follows:
2010 2009
December 31,
(In millions)
Projected benefit obligations . . . . . . . . . . . . . . . . . . . . . . . . . . . . . . . . . . . . . . . . . . . . . . . . . $1,436 $798
Accumulated benefit obligations . . . . . . . . . . . . . . . . . . . . . . . . . . . . . . . . . . . . . . . . . . . . . . $1,307 $714
Fair value of plan assets . . . . . . . . . . . . . . . . . . . . . . . . . . . . . . . . . . . . . . . . . . . . . . . . . . . . $ 106 $ 1
Information for pension and other postretirement benefit plans with a projected benefit obligation in excess of plan assets were as follows:
2010 2009 2010 2009
December 31,
PensionBenefits
OtherPostretirement
Benefits
(In millions)
Projected benefit obligations . . . . . . . . . . . . . . . . . . . . . . . . . . . . . . . . . . $1,803 $6,580 $1,845 $1,847
Fair value of plan assets . . . . . . . . . . . . . . . . . . . . . . . . . . . . . . . . . . . . . $ 461 $5,700 $1,200 $1,121
Net periodic pension costs and net periodic other postretirement benefit plan costs are comprised of the following:i) Service Costs — Service costs are the increase in the projected (expected) pension benefit obligation resulting from benefits
payable to employees of the Subsidiaries on service rendered during the current year.ii) Interest Costs on the Liability — Interest costs are the time value adjustment on the projected (expected) pension benefit
obligation at the end of each year.iii) Settlement and Curtailment Costs — The aggregate amount of net gains (losses) recognized in net periodic benefit costs due to
settlements and curtailments. Settlements result from actions that relieve/eliminate the plan’s responsibility for benefit obligationsor risks associated with the obligations or assets used for the settlement. Curtailments result from an event that significantlyreduces/eliminates plan participants’ expected years of future services or benefit accruals.
iv) Expected Return on Plan Assets — Expected return on plan assets is the assumed return earned by the accumulated pension andother postretirement fund assets in a particular year.
v) Amortization of Net Actuarial Gains (Losses) — Actuarial gains and losses result from differences between the actual experienceand the expected experience on pension and other postretirement plan assets or projected (expected) pension benefit obligationduring a particular period. These gains and losses are accumulated and, to the extent they exceed 10% of the greater of the PBOor the fair value of plan assets, the excess is amortized into pension and other postretirement benefit costs over the expectedservice years of the employees.
vi) Amortization of Prior Service Costs — These costs relate to the recognition of increases or decreases in pension and otherpostretirement benefit obligation due to amendments in plans or initiation of new plans. These increases or decreases in obligationare recognized in accumulated other comprehensive income (loss) at the time of the amendment. These costs are then amortizedto pension and other postretirement benefit costs over the expected service years of the employees affected by the change.
F-122 MetLife, Inc.
MetLife, Inc.
Notes to the Consolidated Financial Statements — (Continued)

The components of net periodic benefit costs and other changes in plan assets and benefit obligations recognized in other compre-hensive income (loss) were as follows:
2010 2009 2008 2010 2009 2008
Years Ended December 31,
PensionBenefits
OtherPostretirement
Benefits
(In millions)
Net Periodic Benefit Costs:
Service costs . . . . . . . . . . . . . . . . . . . . . . . . . . . . . . . . . . . . . . . . . . $ 180 $ 170 $ 164 $ 17 $ 22 $ 21
Interest costs . . . . . . . . . . . . . . . . . . . . . . . . . . . . . . . . . . . . . . . . . . 399 395 379 113 125 103
Settlement and curtailment costs . . . . . . . . . . . . . . . . . . . . . . . . . . . . . . 8 17 — 1 — —
Expected return on plan assets . . . . . . . . . . . . . . . . . . . . . . . . . . . . . . . (450) (439) (517) (79) (72) (86)
Amortization of net actuarial (gains) losses . . . . . . . . . . . . . . . . . . . . . . . . 196 227 24 38 42 (1)
Amortization of prior service costs (credit) . . . . . . . . . . . . . . . . . . . . . . . . 7 10 15 (83) (36) (37)
Net periodic benefit costs . . . . . . . . . . . . . . . . . . . . . . . . . . . . . . . . . 340 380 65 7 81 —
Net periodic benefit costs of subsidiary at date of disposal . . . . . . . . . . . . — — 1 — — —
Total net periodic benefit costs . . . . . . . . . . . . . . . . . . . . . . . . . . . . . . 340 380 66 7 81 —
Other Changes in Plan Assets and Benefit Obligations Recognized inOther Comprehensive Income (Loss):
Net actuarial (gains) losses . . . . . . . . . . . . . . . . . . . . . . . . . . . . . . . . . . 22 310 1,561 50 283 259
Prior service costs (credit) . . . . . . . . . . . . . . . . . . . . . . . . . . . . . . . . . . 1 (10) (19) (80) (167) 36
Amortization of net actuarial gains (losses) . . . . . . . . . . . . . . . . . . . . . . . . (196) (227) (24) (38) (42) 1
Amortization of prior service (costs) credit . . . . . . . . . . . . . . . . . . . . . . . . (7) (10) (15) 83 36 37
Total recognized in other comprehensive income (loss) . . . . . . . . . . . . . . (180) 63 1,503 15 110 333
Total recognized in net periodic benefit costs and other comprehensiveincome (loss) . . . . . . . . . . . . . . . . . . . . . . . . . . . . . . . . . . . . . . . . $ 160 $ 443 $1,569 $ 22 $ 191 $333
For the year ended December 31, 2010, included within other comprehensive income (loss) were other changes in plan assets and benefitobligations associated with pension benefits of ($180) million and other postretirement benefits of $15 million for an aggregate reduction inother comprehensive income (loss) of ($165) million before income tax and ($96) million, net of income tax.
The estimated net actuarial (gains) losses and prior service costs (credit) for the pension plans that will be amortized from accumulatedother comprehensive income (loss) into net periodic benefit costs over the next year are $176 million and $5 million, respectively.
The estimated net actuarial (gains) losses and prior service costs (credit) for the defined benefit other postretirement benefit plans that willbe amortized from accumulated other comprehensive income (loss) into net periodic benefit costs over the next year are $34 million and($108) million, respectively.
The Medicare Modernization Act of 2003 created various subsidies for sponsors of retiree drug programs. Two common ways of providingsubsidies were the Retiree Drug Subsidy (“RDS”) and Medicare Part D Prescription Drug Plans (“PDP”). From 2006 through 2010, theCompany applied for and received the RDS each year. The RDS program provides the subsidy through cash payments made by Medicare tothe Company, resulting in smaller net claims paid by the Company. A summary of the reduction to the APBO and the related reduction to thecomponents of net periodic other postretirement benefits plan costs resulting from receipt of the RDS is presented below. As of January 1,2011, as a result of changes made under the Patient Protection and Affordable Care Act of 2010, the Company will no longer apply for theRDS. Instead it has joined PDP and will indirectly receive Medicare subsidies in the form of smaller gross benefit payments for prescriptiondrug coverage.
2010 2009 2008
December 31,
(In millions)
Cumulative reduction in other postretirement benefits obligations:
Balance at January 1, . . . . . . . . . . . . . . . . . . . . . . . . . . . . . . . . . . . . . . . . . . . . . . . $ 247 $317 $299
Service costs . . . . . . . . . . . . . . . . . . . . . . . . . . . . . . . . . . . . . . . . . . . . . . . . . . . . . 3 2 5
Interest costs . . . . . . . . . . . . . . . . . . . . . . . . . . . . . . . . . . . . . . . . . . . . . . . . . . . . . 16 16 20
Net actuarial gains (losses) . . . . . . . . . . . . . . . . . . . . . . . . . . . . . . . . . . . . . . . . . . . . (255) (76) 3
Prescription drug subsidy . . . . . . . . . . . . . . . . . . . . . . . . . . . . . . . . . . . . . . . . . . . . . (11) (12) (10)
Balance at December 31, . . . . . . . . . . . . . . . . . . . . . . . . . . . . . . . . . . . . . . . . . . . $ — $247 $317
F-123MetLife, Inc.
MetLife, Inc.
Notes to the Consolidated Financial Statements — (Continued)

2010 2009 2008
Years EndedDecember 31,
(In millions)
Reduction in net periodic other postretirement benefit costs:
Service costs . . . . . . . . . . . . . . . . . . . . . . . . . . . . . . . . . . . . . . . . . . . . . . . . . . . . $ 3 $ 2 $ 5
Interest costs . . . . . . . . . . . . . . . . . . . . . . . . . . . . . . . . . . . . . . . . . . . . . . . . . . . . 16 16 20
Amortization of net actuarial gains (losses) . . . . . . . . . . . . . . . . . . . . . . . . . . . . . . . . . . 10 11 —
Total reduction in net periodic benefit costs . . . . . . . . . . . . . . . . . . . . . . . . . . . . . . . $29 $29 $25
The Company received subsidies of $8 million, $12 million and $12 million for the years ended December 31, 2010, 2009 and 2008,respectively.
AssumptionsAssumptions used in determining benefit obligations were as follows:
2010 2009 2010 2009
December 31,
OtherPostretirement
BenefitsPensionBenefits
Weighted average discount rate . . . . . . . . . . . . . . . . . . . . . . . 5.80% 6.25% 5.80% 6.25%
Rate of compensation increase . . . . . . . . . . . . . . . . . . . . . . . . 3.5%-7.5% 2.0%-7.5% N/A N/AAssumptions used in determining net periodic benefit costs were as follows:
2010 2009 2008 2010 2009 2008
December 31,
Other PostretirementBenefitsPension Benefits
Weighted average discount rate . . . . . . . . . . . . . 6.25% 6.60% 6.65% 6.25% 6.60% 6.65%
Weighted average expected rate of return on planassets . . . . . . . . . . . . . . . . . . . . . . . . . . . . 8.00% 8.25% 8.25% 7.20% 7.36% 7.33%
Rate of compensation increase . . . . . . . . . . . . . . 3.5%-7.5% 3.5%-7.5% 3.5%-8% N/A N/A N/A
The weighted average discount rate for most plans is determined annually based on the yield, measured on a yield to worst basis, of ahypothetical portfolio constructed of high quality debt instruments available on the valuation date, which would provide the necessary futurecash flows to pay the aggregate projected benefit obligation when due.
The weighted average expected rate of return on plan assets is based on anticipated performance of the various asset sectors in which theplans invest, weighted by target allocation percentages. Anticipated future performance is based on long-term historical returns of the planassets by sector, adjusted for the Subsidiaries’ long-term expectations on the performance of the markets. While the precise expected returnderived using this approach will fluctuate from year to year, the policy of most of the Subsidiaries’ is to hold this long-term assumptionconstant as long as it remains within reasonable tolerance from the derived rate.
The weighted average expected return on plan assets for use in that plan’s valuation in 2011 is currently anticipated to be 7.25% forpension benefits and postretirement medical benefits and 5.25% for postretirement life benefits.
The assumed healthcare costs trend rates used in measuring the APBO and net periodic benefit costs were as follows:
2010 2009
December 31,
Pre-and Post-Medicare eligibleclaims . . . . . . . . . . . . . . . . . . . .
7.8% in 2011, gradually decreasingeach year until 2083 reaching theultimate rate of 4.4%.
8.2% in 2010, gradually decreasingeach year until 2079 reaching theultimate rate of 4.1%.
Assumed healthcare costs trend rates may have a significant effect on the amounts reported for healthcare plans. A one-percentage pointchange in assumed healthcare costs trend rates would have the following effects:
One PercentIncrease
One PercentDecrease
(In millions)
Effect on total of service and interest costs components . . . . . . . . . . . . . . . . . . . . . . . . . $ 8 $ (8)
Effect of accumulated postretirement benefit obligations . . . . . . . . . . . . . . . . . . . . . . . . . $86 $(104)
Plan AssetsMost Subsidiaries have issued group annuity and life insurance contracts supporting the pension and other postretirement benefit plans
assets, which are invested primarily in separate accounts.
F-124 MetLife, Inc.
MetLife, Inc.
Notes to the Consolidated Financial Statements — (Continued)

The underlying assets of the separate accounts are principally comprised of cash and cash equivalents, short-term investments, fixedmaturity and equity securities, mutual funds, real estate, private equity investments and hedge funds investments.
The comparative presentation of the 2009 plan assets has been realigned to conform to the 2010 presentation to disclose the estimatedfair value of the underlying assets of each separate account at the security level.
The pension and postretirement plan assets and liabilities measured at estimated fair value on a recurring basis were determined asdescribed below. These estimated fair values and their corresponding placement in the fair value hierarchy are summarized as follows:
QuotedPrices
In ActiveMarkets
forIdentical
Assets andLiabilities(Level 1)
SignificantOther
ObservableInputs
(Level 2)
SignificantUnobservable
Inputs(Level 3)
TotalEstimated
FairValue
QuotedPrices
In ActiveMarkets
forIdentical
Assets andLiabilities(Level 1)
SignificantOther
ObservableInputs
(Level 2)
SignificantUnobservable
Inputs(Level 3)
TotalEstimated
FairValue
Fair Value Measurements atReporting Date Using
Fair Value Measurements atReporting Date Using
Pension Benefits Other Postretirement Benefits
December 31, 2010
(In millions)
Assets
Fixed maturity securities:
Corporate . . . . . . . . . . . . . . . . . $ — $1,528 $ 49 $1,577 $ — $ 67 $ 4 $ 71
Federal agencies . . . . . . . . . . . . . — 175 — 175 — 15 — 15
Foreign bonds . . . . . . . . . . . . . . . 1 222 4 227 — 19 — 19
Municipals . . . . . . . . . . . . . . . . . — 137 — 137 — 37 1 38
Preferred stocks . . . . . . . . . . . . . — 4 — 4 — — — —
U.S. government bonds . . . . . . . . 650 136 — 786 82 — — 82
Total fixed maturity securities . . . . 651 2,202 53 2,906 82 138 5 225
Equity securities:
Common stock — domestic . . . . . . 1,410 93 240 1,743 359 3 — 362
Common stock — foreign . . . . . . . 469 35 — 504 77 — — 77
Total equity securities . . . . . . . . 1,879 128 240 2,247 436 3 — 439
Money market securities . . . . . . . . . . 200 100 — 300 1 1 — 2
Pass-through securities . . . . . . . . . . — 321 2 323 — 73 6 79
Derivative securities . . . . . . . . . . . . 3 (5) 11 9 — — — —
Short-term investments . . . . . . . . . . (9) 105 — 96 8 443 — 451
Other invested assets . . . . . . . . . . . 16 63 471 550 — — — —
Other receivables . . . . . . . . . . . . . . — 39 — 39 — 3 — 3
Securities receivable . . . . . . . . . . . . — 70 — 70 — 2 — 2
Real estate . . . . . . . . . . . . . . . . . . — — 8 8 — — — —
Total assets . . . . . . . . . . . . . $2,740 $3,023 $785 $6,548 $527 $663 $11 $1,201
Liabilities
Securities payable . . . . . . . . . . . . . $ — $ 60 $ — $ 60 $ — $ 1 $— $ 1
Total liabilities . . . . . . . . . . . . $ — $ 60 $ — $ 60 $ — $ 1 $— $ 1
Total assets and liabilities . . . $2,740 $2,963 $785 $6,488 $527 $662 $11 $1,200
F-125MetLife, Inc.
MetLife, Inc.
Notes to the Consolidated Financial Statements — (Continued)

QuotedPrices
In ActiveMarkets
forIdenticalAssets
(Level 1)
SignificantOther
ObservableInputs
(Level 2)
SignificantUnobservable
Inputs(Level 3)
TotalEstimated
FairValue
QuotedPrices
In ActiveMarkets
forIdenticalAssets
(Level 1)
SignificantOther
ObservableInputs
(Level 2)
SignificantUnobservable
Inputs(Level 3)
TotalEstimated
FairValue
Fair Value Measurements atReporting Date Using
Fair Value Measurements atReporting Date Using
Pension Benefits Other Postretirement Benefits
December 31, 2009
(In millions)
Assets
Fixed maturity securities:
Corporate . . . . . . . . . . . . . . . . . . . . $ — $1,458 $ 68 $1,526 $ — $ 48 $— $ 48
Federal agencies . . . . . . . . . . . . . . . (41) 140 — 99 — 30 — 30
Foreign bonds . . . . . . . . . . . . . . . . . 1 195 5 201 — 6 — 6
Municipals . . . . . . . . . . . . . . . . . . . . — 56 — 56 — 21 — 21
Preferred stocks . . . . . . . . . . . . . . . . — 2 — 2 — — — —
U.S. government bonds . . . . . . . . . . . 319 50 — 369 45 — — 45
U.S. treasury notes . . . . . . . . . . . . . . — — — — 12 — — 12
Total fixed maturity securities . . . . . . 279 1,901 73 2,253 57 105 — 162
Equity securities:
Common stock — domestic . . . . . . . . 1,565 238 241 2,044 342 6 — 348
Common stock — foreign . . . . . . . . . . 393 — — 393 72 — — 72
Total equity securities . . . . . . . . . . . 1,958 238 241 2,437 414 6 — 420
Money market securities . . . . . . . . . . . . 72 56 — 128 12 1 — 13
Pass-through securities . . . . . . . . . . . . . 1 376 69 446 — 75 9 84
Derivative securities . . . . . . . . . . . . . . . 3 — — 3 — — — —
Short-term investments . . . . . . . . . . . . . 2 115 — 117 — 442 — 442
Other invested assets . . . . . . . . . . . . . . 13 — 373 386 — — — —
Total assets . . . . . . . . . . . . . . . . $2,328 $2,686 $756 $5,770 $483 $629 $ 9 $1,121
The pension and other postretirement benefit plan assets are categorized into the three-level fair value hierarchy, as defined in Note 1,based upon the priority of the inputs to the respective valuation technique. The following summarizes the types of assets included within thethree-level fair value hierarchy presented in the table above.
Level 1 This category includes investments in liquid securities, such as cash, short-term money market and bank time deposits,expected to mature within a year.
Level 2 This category includes certain separate accounts that are primarily invested in liquid and readily marketable securities. Theestimated fair value of such separate account is based upon reported NAV provided by fund managers and this value representsthe amount at which transfers into and out of the respective separate account are effected. These separate accounts providereasonable levels of price transparency and can be corroborated through observable market data.Certain separate accounts are invested in investment partnerships designated as hedge funds. The values for these separateaccounts is determined monthly based on the NAV of the underlying hedge fund investment. Additionally, such hedge fundsgenerally contain lock out or other waiting period provisions for redemption requests to be filled. While the reporting andredemption restrictions may limit the frequency of trading activity in separate accounts invested in hedge funds, the reportedNAV, and thus the referenced value of the separate account, provides a reasonable level of price transparency that can becorroborated through observable market data. Directly held investments are primarily invested in U.S. and foreign governmentand corporate securities.
Level 3 This category includes separate accounts that are invested in real estate and private equity investments that provide little or noprice transparency due to the infrequency with which the underlying assets trade and generally require additional time toliquidate in an orderly manner. Accordingly, the values for separate accounts invested in these alternative asset classes arebased on inputs that cannot be readily derived from or corroborated by observable market data.
F-126 MetLife, Inc.
MetLife, Inc.
Notes to the Consolidated Financial Statements — (Continued)

A rollforward of all pension and other postretirement benefit plan assets measured at estimated fair value on a recurring basis usingsignificant unobservable (Level 3) inputs is as follows:
Balance,January 1, Earnings
OtherComprehensiveIncome (Loss)
Purchases,Sales,
Issuances andSettlements
Transfer IntoLevel 3
Transfer Outof Level 3
Balance,December 31,
Total Realized/UnrealizedGains (Losses) included in:
(In millions)
Year Ended December 31, 2010:
Pension:
Fixed maturity securities:
Corporate . . . . . . . . . . . . . . . . . . . . . $ 68 $ — $ 7 $(17) $ 4 $(13) $ 49
Foreign bonds . . . . . . . . . . . . . . . . . . . 5 — 1 (2) — — 4
Total fixed maturity securities . . . . . . . . 73 — 8 (19) 4 (13) 53
Equity securities:
Common stock — domestic . . . . . . . . . . 241 — (2) 1 — — 240
Total equity securities . . . . . . . . . . . . 241 — (2) 1 — — 240
Pass-through securities . . . . . . . . . . . . . . 69 (11) 14 (71) 2 (1) 2
Derivative securities(1) . . . . . . . . . . . . . . . — 3 (3) (1) 12 — 11
Other invested assets . . . . . . . . . . . . . . . 373 78 (4) 24 — — 471
Real estate(1) . . . . . . . . . . . . . . . . . . . . — — — — 8 — 8
Total pension assets . . . . . . . . . . . . $756 $ 70 $13 $(66) $26 $(14) $785
Other postretirement:
Fixed maturity securities:
Corporate . . . . . . . . . . . . . . . . . . . . . $ — $ — $ 1 $ — $ 3 $ — $ 4
Municipals . . . . . . . . . . . . . . . . . . . . . — — — — 1 — 1
Total fixed maturity securities . . . . . . . . — — 1 — 4 — 5
Pass-through securities . . . . . . . . . . . . . . 9 (4) 1 (1) 1 — 6
Total other postretirement assets . . . . $ 9 $ (4) $ 2 $ (1) $ 5 $ — $ 11
Total assets . . . . . . . . . . . . . . . . $765 $ 66 $15 $(67) $31 $(14) $796
(1) Derivative securities and real estate transfers into Level 3 are due to the Acquisition and are not related to the changes in Level 3classification at the security level.
F-127MetLife, Inc.
MetLife, Inc.
Notes to the Consolidated Financial Statements — (Continued)

Balance,January 1, Earnings
OtherComprehensiveIncome (Loss)
Purchases,Sales,
Issuances andSettlements
Transfer Intoand/or Outof Level 3
Balance,December 31,
Total Realized/UnrealizedGains (Losses) included in:
(In millions)
Year Ended December 31, 2009:
Pension:
Fixed maturity securities:
Corporate . . . . . . . . . . . . . . . . $ 57 $ (5) $ 21 $ (3) $ (2) $ 68
Foreign bonds . . . . . . . . . . . . . 4 (1) 5 (3) — 5
Total fixed maturity securities . . 61 (6) 26 (6) (2) 73
Equity securities:
Common stock — domestic . . . . 460 — (232) 13 — 241
Total equity securities . . . . . . . 460 — (232) 13 — 241
Pass-through securities . . . . . . . . . 80 (2) 8 (24) 7 69
Derivative securities . . . . . . . . . . . 40 36 (39) (37) — —
Other invested assets . . . . . . . . . . 392 4 (59) 36 — 373
Total pension assets . . . . . . $1,033 $ 32 $(296) $(18) $ 5 $756
Other postretirement:
Pass-through securities . . . . . . . . . $ 13 $(17) $ 17 $ (4) $— $ 9
Total other postretirementassets . . . . . . . . . . . . . . $ 13 $(17) $ 17 $ (4) $— $ 9
Total assets . . . . . . . . . . . $1,046 $ 15 $(279) $(22) $ 5 $765
The U.S. Subsidiaries provide employees with benefits under various ERISA benefit plans. These include qualified pension plans,postretirement medical plans and certain retiree life insurance coverage. The assets of the Subsidiaries’ qualified pension plans are held ininsurance group annuity contracts, and the vast majority of the assets of the postretirement medical plan and backing the retiree life coverageare held in insurance contracts. All of these contracts are issued by Company insurance affiliates, and the assets under the contracts are heldin insurance separate accounts that have been established by the Company. The insurance contract provider engages investmentmanagement firms (“Managers”) to serve as sub-advisors for the separate accounts based on the specific investment needs and requestsidentified by the plan fiduciary. These Managers have portfolio management discretion over the purchasing and selling of securities and otherinvestment assets pursuant to the respective investment management agreements and guidelines established for each insurance separateaccount. The assets of the qualified pension plans and postretirement medical plans (the “Invested Plans”) are well diversified across multipleasset categories and across a number of different Managers, with the intent of minimizing risk concentrations within any given asset categoryor with any given Manager.
The Invested Plans, other than those held in participant directed investment accounts, are managed in accordance with investmentpolicies consistent with the longer-term nature of related benefit obligations and within prudent risk parameters. Specifically, investmentpolicies are oriented toward (i) maximizing the Invested Plan’s funded status; (ii) minimizing the volatility of the Invested Plan’s funded status;(iii) generating asset returns that exceed liability increases; and (iv) targeting rates of return in excess of a custom benchmark and industrystandards over appropriate reference time periods. These goals are expected to be met through identifying appropriate and diversified assetclasses and allocations, ensuring adequate liquidity to pay benefits and expenses when due and controlling the costs of administering andmanaging the Invested Plan’s investments. Independent investment consultants are periodically used to evaluate the investment risk ofInvested Plan’s assets relative to liabilities, analyze the economic and portfolio impact of various asset allocations and managementstrategies and to recommend asset allocations.
Certain foreign subsidiaries sponsor defined benefit plans that cover employees and sales representatives who meet specified eligibilityrequirements. Pension benefits are provided utilizing either a traditional formula or cash balance formula, similar to the U.S. plans discussedabove. The investment objectives are also similar, subject to local regulations. Generally, these international pension plans invest directly inhigh quality equity and fixed maturity securities. The assets of the foreign pension plans are comprised of cash and cash equivalents, equityand fixed maturity securities, real estate and hedge fund investments.
Derivative contracts may be used to reduce investment risk, to manage duration and to replicate the risk/return profile of an asset or assetclass. Derivatives may not be used to leverage a portfolio in any manner, such as to magnify exposure to an asset, asset class, interest ratesor any other financial variable. Derivatives are also prohibited for use in creating exposures to securities, currencies, indices or any otherfinancial variable that are otherwise restricted.
F-128 MetLife, Inc.
MetLife, Inc.
Notes to the Consolidated Financial Statements — (Continued)

The tables below summarize the actual weighted average allocation by major asset class for the Invested Plans:
Defined Benefit Plan Postretirement Medical Postretirement Life
Actual Allocation
Year Ended December 31, 2010:
Asset Class:
Fixed maturity securities (target range) . . . . . . . . . . . . . . 50% to 80% 20% to 50% —
Corporate . . . . . . . . . . . . . . . . . . . . . . . . . . . . . . . 24% 9% —
Federal agency . . . . . . . . . . . . . . . . . . . . . . . . . . . . 3 2 —
Foreign bonds . . . . . . . . . . . . . . . . . . . . . . . . . . . . . 3 3 —
Municipals . . . . . . . . . . . . . . . . . . . . . . . . . . . . . . . 2 5 —
U.S. government bonds . . . . . . . . . . . . . . . . . . . . . . 12 11 —
Total fixed maturity securities . . . . . . . . . . . . . . . . . . 44% 30% —
Equity securities (target range) . . . . . . . . . . . . . . . . . . . 0% to 40% 50% to 80% —
Common stock — domestic . . . . . . . . . . . . . . . . . . . . 27% 48% —
Common stock — foreign . . . . . . . . . . . . . . . . . . . . . 8 10 —
Total equity securities . . . . . . . . . . . . . . . . . . . . . . 35% 58% —
Money market securities . . . . . . . . . . . . . . . . . . . . . . . 5% — —
Pass-through securities . . . . . . . . . . . . . . . . . . . . . . . . 5 10 —
Short-term investments . . . . . . . . . . . . . . . . . . . . . . . . 1 1 100%
Other invested assets . . . . . . . . . . . . . . . . . . . . . . . . . 8 — —
Other receivables . . . . . . . . . . . . . . . . . . . . . . . . . . . . 1 1 —
Securities receivable . . . . . . . . . . . . . . . . . . . . . . . . . . 1 — —
Total assets . . . . . . . . . . . . . . . . . . . . . . . . . . . 100% 100% 100%
Defined Benefit Plan Postretirement Medical Postretirement Life
Actual Allocation
Year Ended December 31, 2009:
Asset Class:
Fixed maturity securities (target range) . . . . . . . . . . . . . . 35% to 55% 10% to 40% —
Corporate . . . . . . . . . . . . . . . . . . . . . . . . . . . . . . . 26% 7% —
Federal agency . . . . . . . . . . . . . . . . . . . . . . . . . . . . 2 4 —
Foreign bonds . . . . . . . . . . . . . . . . . . . . . . . . . . . . . 4 1 —
Municipals . . . . . . . . . . . . . . . . . . . . . . . . . . . . . . . 1 3 —
U.S. government bonds . . . . . . . . . . . . . . . . . . . . . . 6 7 —
U.S. treasury notes . . . . . . . . . . . . . . . . . . . . . . . . . — 2 —
Total fixed maturity securities . . . . . . . . . . . . . . . . . . 39% 24% —
Equity securities (target range) . . . . . . . . . . . . . . . . . . . 25% to 45% 50% to 80% —
Common stock — domestic . . . . . . . . . . . . . . . . . . . . 35% 51% —
Common stock — foreign . . . . . . . . . . . . . . . . . . . . . 7 11 —
Total equity securities . . . . . . . . . . . . . . . . . . . . . . 42% 62% —
Money market securities . . . . . . . . . . . . . . . . . . . . . . . 2% 2% —
Pass-through securities . . . . . . . . . . . . . . . . . . . . . . . . 8 12 —
Short-term investments . . . . . . . . . . . . . . . . . . . . . . . . 2 — 100%
Other invested assets . . . . . . . . . . . . . . . . . . . . . . . . . 7 — —
Total assets . . . . . . . . . . . . . . . . . . . . . . . . . . 100% 100% 100%
The target ranges in the tables above are forward-looking.
Expected Future Contributions and Benefit PaymentsIt is the Subsidiaries’ practice to make contributions to the qualified pension plan to comply with minimum funding requirements of ERISA.
In accordance with such practice, no contributions were required for both of the years ended December 31, 2010 and 2009. No contributionswill be required for 2011. The Subsidiaries made discretionary contributions of $255 million to the qualified pension plan during the year
F-129MetLife, Inc.
MetLife, Inc.
Notes to the Consolidated Financial Statements — (Continued)
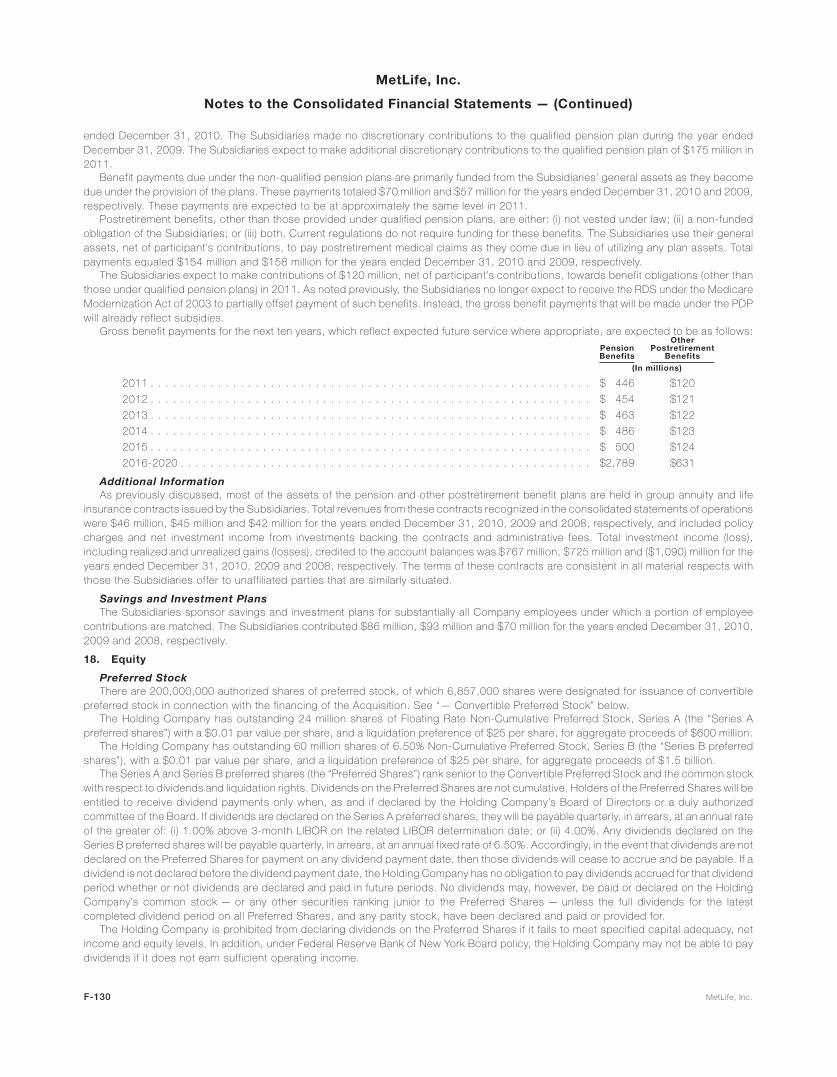
ended December 31, 2010. The Subsidiaries made no discretionary contributions to the qualified pension plan during the year endedDecember 31, 2009. The Subsidiaries expect to make additional discretionary contributions to the qualified pension plan of $175 million in2011.
Benefit payments due under the non-qualified pension plans are primarily funded from the Subsidiaries’ general assets as they becomedue under the provision of the plans. These payments totaled $70 million and $57 million for the years ended December 31, 2010 and 2009,respectively. These payments are expected to be at approximately the same level in 2011.
Postretirement benefits, other than those provided under qualified pension plans, are either: (i) not vested under law; (ii) a non-fundedobligation of the Subsidiaries; or (iii) both. Current regulations do not require funding for these benefits. The Subsidiaries use their generalassets, net of participant’s contributions, to pay postretirement medical claims as they come due in lieu of utilizing any plan assets. Totalpayments equaled $154 million and $158 million for the years ended December 31, 2010 and 2009, respectively.
The Subsidiaries expect to make contributions of $120 million, net of participant’s contributions, towards benefit obligations (other thanthose under qualified pension plans) in 2011. As noted previously, the Subsidiaries no longer expect to receive the RDS under the MedicareModernization Act of 2003 to partially offset payment of such benefits. Instead, the gross benefit payments that will be made under the PDPwill already reflect subsidies.
Gross benefit payments for the next ten years, which reflect expected future service where appropriate, are expected to be as follows:
PensionBenefits
OtherPostretirement
Benefits
(In millions)
2011 . . . . . . . . . . . . . . . . . . . . . . . . . . . . . . . . . . . . . . . . . . . . . . . . . . . . . . . . . . . $ 446 $120
2012 . . . . . . . . . . . . . . . . . . . . . . . . . . . . . . . . . . . . . . . . . . . . . . . . . . . . . . . . . . . $ 454 $121
2013 . . . . . . . . . . . . . . . . . . . . . . . . . . . . . . . . . . . . . . . . . . . . . . . . . . . . . . . . . . . $ 463 $122
2014 . . . . . . . . . . . . . . . . . . . . . . . . . . . . . . . . . . . . . . . . . . . . . . . . . . . . . . . . . . . $ 486 $123
2015 . . . . . . . . . . . . . . . . . . . . . . . . . . . . . . . . . . . . . . . . . . . . . . . . . . . . . . . . . . . $ 500 $124
2016-2020 . . . . . . . . . . . . . . . . . . . . . . . . . . . . . . . . . . . . . . . . . . . . . . . . . . . . . . . $2,789 $631
Additional InformationAs previously discussed, most of the assets of the pension and other postretirement benefit plans are held in group annuity and life
insurance contracts issued by the Subsidiaries. Total revenues from these contracts recognized in the consolidated statements of operationswere $46 million, $45 million and $42 million for the years ended December 31, 2010, 2009 and 2008, respectively, and included policycharges and net investment income from investments backing the contracts and administrative fees. Total investment income (loss),including realized and unrealized gains (losses), credited to the account balances was $767 million, $725 million and ($1,090) million for theyears ended December 31, 2010, 2009 and 2008, respectively. The terms of these contracts are consistent in all material respects withthose the Subsidiaries offer to unaffiliated parties that are similarly situated.
Savings and Investment PlansThe Subsidiaries sponsor savings and investment plans for substantially all Company employees under which a portion of employee
contributions are matched. The Subsidiaries contributed $86 million, $93 million and $70 million for the years ended December 31, 2010,2009 and 2008, respectively.
18. Equity
Preferred StockThere are 200,000,000 authorized shares of preferred stock, of which 6,857,000 shares were designated for issuance of convertible
preferred stock in connection with the financing of the Acquisition. See “— Convertible Preferred Stock” below.The Holding Company has outstanding 24 million shares of Floating Rate Non-Cumulative Preferred Stock, Series A (the “Series A
preferred shares”) with a $0.01 par value per share, and a liquidation preference of $25 per share, for aggregate proceeds of $600 million.The Holding Company has outstanding 60 million shares of 6.50% Non-Cumulative Preferred Stock, Series B (the “Series B preferred
shares”), with a $0.01 par value per share, and a liquidation preference of $25 per share, for aggregate proceeds of $1.5 billion.The Series A and Series B preferred shares (the “Preferred Shares”) rank senior to the Convertible Preferred Stock and the common stock
with respect to dividends and liquidation rights. Dividends on the Preferred Shares are not cumulative. Holders of the Preferred Shares will beentitled to receive dividend payments only when, as and if declared by the Holding Company’s Board of Directors or a duly authorizedcommittee of the Board. If dividends are declared on the Series A preferred shares, they will be payable quarterly, in arrears, at an annual rateof the greater of: (i) 1.00% above 3-month LIBOR on the related LIBOR determination date; or (ii) 4.00%. Any dividends declared on theSeries B preferred shares will be payable quarterly, in arrears, at an annual fixed rate of 6.50%. Accordingly, in the event that dividends are notdeclared on the Preferred Shares for payment on any dividend payment date, then those dividends will cease to accrue and be payable. If adividend is not declared before the dividend payment date, the Holding Company has no obligation to pay dividends accrued for that dividendperiod whether or not dividends are declared and paid in future periods. No dividends may, however, be paid or declared on the HoldingCompany’s common stock — or any other securities ranking junior to the Preferred Shares — unless the full dividends for the latestcompleted dividend period on all Preferred Shares, and any parity stock, have been declared and paid or provided for.
The Holding Company is prohibited from declaring dividends on the Preferred Shares if it fails to meet specified capital adequacy, netincome and equity levels. In addition, under Federal Reserve Bank of New York Board policy, the Holding Company may not be able to paydividends if it does not earn sufficient operating income.
F-130 MetLife, Inc.
MetLife, Inc.
Notes to the Consolidated Financial Statements — (Continued)

The Preferred Shares do not have voting rights except in certain circumstances where the dividends have not been paid for an equivalentof six or more dividend payment periods whether or not those periods are consecutive. Under such circumstances, the holders of thePreferred Shares have certain voting rights with respect to members of the Board of Directors of the Holding Company.
The Preferred Shares are not subject to any mandatory redemption, sinking fund, retirement fund, purchase fund or similar provisions. ThePreferred Shares are redeemable at the Holding Company’s option in whole or in part, at a redemption price of $25 per Preferred Share, plusdeclared and unpaid dividends.
In December 2008, the Holding Company entered into an RCC related to the Preferred Shares. As a part of the RCC, the Holding Companyagreed that it will not repay, redeem or purchase the Preferred Shares on or before December 31, 2018, unless such repayment, redemptionor purchase is made from the proceeds of the issuance of certain capital securities. The RCC is for the benefit of holders of one or more seriesof its indebtedness as designated from time to time by the Holding Company. The RCC will terminate upon the occurrence of certain events,including the date on which there are no series of outstanding eligible debt securities.
In connection with the offering of the Preferred Shares, the Holding Company incurred $57 million of issuance costs which have beenrecorded as a reduction of additional paid-in capital.
Information on the declaration, record and payment dates, as well as per share and aggregate dividend amounts, for the Preferred Sharesis as follows:
Declaration Date Record Date Payment DateSeries A
Per ShareSeries A
AggregateSeries B
Per ShareSeries B
Aggregate
Dividend
(In millions, except per share data)
November 15, 2010 . . . . . November 30, 2010 December 15, 2010 $0.2527777 $ 7 $0.4062500 $24
August 16, 2010 . . . . . . . August 31, 2010 September 15, 2010 $0.2555555 6 $0.4062500 24
May 17, 2010 . . . . . . . . . May 31, 2010 June 15, 2010 $0.2555555 7 $0.4062500 24
March 5, 2010 . . . . . . . . February 28, 2010 March 15, 2010 $0.2500000 6 $0.4062500 24
$26 $96
November 16, 2009 . . . . . November 30, 2009 December 15, 2009 $0.2527777 $ 7 $0.4062500 $24
August 17, 2009 . . . . . . . August 31, 2009 September 15, 2009 $0.2555555 6 $0.4062500 24
May 15, 2009 . . . . . . . . . May 31, 2009 June 15, 2009 $0.2555555 7 $0.4062500 24
March 5, 2009 . . . . . . . . February 28, 2009 March 16, 2009 $0.2500000 6 $0.4062500 24
$26 $96
November 17, 2008 . . . . . November 30, 2008 December 15, 2008 $0.2527777 $ 7 $0.4062500 $24
August 15, 2008 . . . . . . . August 31, 2008 September 15, 2008 $0.2555555 6 $0.4062500 24
May 15, 2008 . . . . . . . . . May 31, 2008 June 16, 2008 $0.2555555 7 $0.4062500 24
March 5, 2008 . . . . . . . . February 29, 2008 March 17, 2008 $0.3785745 9 $0.4062500 24
$29 $96
See Note 24 for information on subsequent dividends declared.
Convertible Preferred StockIn connection with the financing of the Acquisition (see Note 2) in November 2010, the Holding Company issued to ALICO Holdings
6,857,000 shares of Convertible Preferred Stock with a $0.01 par value per share, a liquidation preference of $0.01 per share and a fair valueof $2,805 million.
The Convertible Preferred Stock will convert into 68,570,000 shares of the Holding Company’s common stock (subject to anti-dilutionadjustments) upon a favorable vote of the Holding Company’s common stockholders. If the Company (i) pays a dividend or makes anotherdistribution on common stock to all holders of common stock payable, in whole or in part, in shares of common stock; (ii) subdivides or splitsthe outstanding shares of common stock into a greater number of shares; or (iii) combines or reclassifies the outstanding shares of commonstock into a smaller number of shares, then the conversion rate will be adjusted by multiplying the conversion rate by the number of shares ofcommon stock which a person who owns only one share of common stock immediately before the record date or effective date of theapplicable event would own immediately after giving effect to such dividend, distribution, subdivision, split, combination or reclassification. Ifa favorable vote of its common stockholders is not obtained by the first anniversary of the Acquisition Date, then the Company must payALICO Holdings approximately $300 million and use reasonable efforts to list the preferred stock on NYSE. The Convertible Preferred Stockranks senior to the common stock with respect to dividends and liquidation rights, and holders of the Convertible Preferred Stock will beentitled to receive dividend payments only when, as and if declared by the Holding Company’s Board of Directors. Under the terms of theConvertible Preferred Stock, the Board will declare a dividend payment or other distribution on the Convertible Preferred Stock on an as-converted basis at any time and with the same terms as any dividend or other distribution declared on MetLife, Inc.’s common stock. Nodistribution is payable on the Convertible Preferred Stock unless there is a concurrent distribution on the MetLife, Inc. common stock.
The Convertible Preferred Stock does not have voting rights except in certain circumstances when the Convertible Preferred Stock islisted on the same exchange on which MetLife, Inc.’s common stock is listed, and where the dividends have not been paid notwithstandingpayment of dividends on MetLife, Inc.’s common stock for an equivalent of six or more dividend payment periods whether or not those periodsare consecutive. Under such circumstances, the holders of the Convertible Preferred Stock have certain voting rights with respect to
F-131MetLife, Inc.
MetLife, Inc.
Notes to the Consolidated Financial Statements — (Continued)
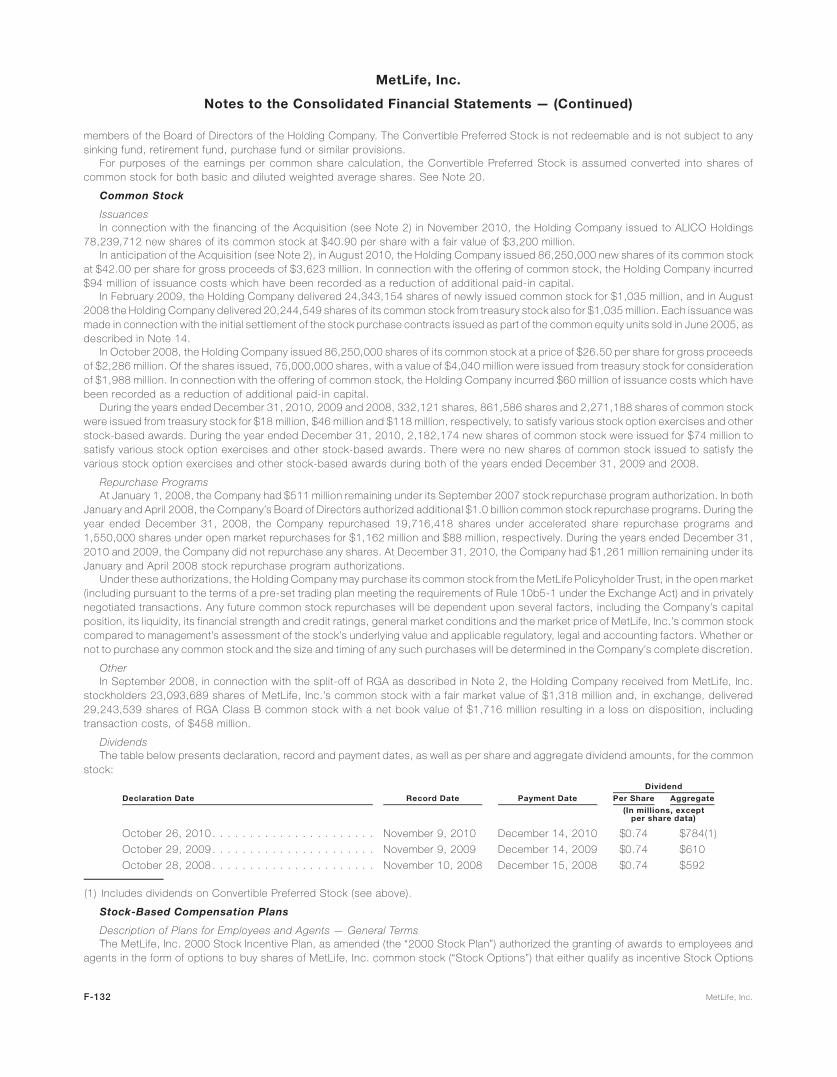
members of the Board of Directors of the Holding Company. The Convertible Preferred Stock is not redeemable and is not subject to anysinking fund, retirement fund, purchase fund or similar provisions.
For purposes of the earnings per common share calculation, the Convertible Preferred Stock is assumed converted into shares ofcommon stock for both basic and diluted weighted average shares. See Note 20.
Common Stock
IssuancesIn connection with the financing of the Acquisition (see Note 2) in November 2010, the Holding Company issued to ALICO Holdings
78,239,712 new shares of its common stock at $40.90 per share with a fair value of $3,200 million.In anticipation of the Acquisition (see Note 2), in August 2010, the Holding Company issued 86,250,000 new shares of its common stock
at $42.00 per share for gross proceeds of $3,623 million. In connection with the offering of common stock, the Holding Company incurred$94 million of issuance costs which have been recorded as a reduction of additional paid-in capital.
In February 2009, the Holding Company delivered 24,343,154 shares of newly issued common stock for $1,035 million, and in August2008 the Holding Company delivered 20,244,549 shares of its common stock from treasury stock also for $1,035 million. Each issuance wasmade in connection with the initial settlement of the stock purchase contracts issued as part of the common equity units sold in June 2005, asdescribed in Note 14.
In October 2008, the Holding Company issued 86,250,000 shares of its common stock at a price of $26.50 per share for gross proceedsof $2,286 million. Of the shares issued, 75,000,000 shares, with a value of $4,040 million were issued from treasury stock for considerationof $1,988 million. In connection with the offering of common stock, the Holding Company incurred $60 million of issuance costs which havebeen recorded as a reduction of additional paid-in capital.
During the years ended December 31, 2010, 2009 and 2008, 332,121 shares, 861,586 shares and 2,271,188 shares of common stockwere issued from treasury stock for $18 million, $46 million and $118 million, respectively, to satisfy various stock option exercises and otherstock-based awards. During the year ended December 31, 2010, 2,182,174 new shares of common stock were issued for $74 million tosatisfy various stock option exercises and other stock-based awards. There were no new shares of common stock issued to satisfy thevarious stock option exercises and other stock-based awards during both of the years ended December 31, 2009 and 2008.
Repurchase ProgramsAt January 1, 2008, the Company had $511 million remaining under its September 2007 stock repurchase program authorization. In both
January and April 2008, the Company’s Board of Directors authorized additional $1.0 billion common stock repurchase programs. During theyear ended December 31, 2008, the Company repurchased 19,716,418 shares under accelerated share repurchase programs and1,550,000 shares under open market repurchases for $1,162 million and $88 million, respectively. During the years ended December 31,2010 and 2009, the Company did not repurchase any shares. At December 31, 2010, the Company had $1,261 million remaining under itsJanuary and April 2008 stock repurchase program authorizations.
Under these authorizations, the Holding Company may purchase its common stock from the MetLife Policyholder Trust, in the open market(including pursuant to the terms of a pre-set trading plan meeting the requirements of Rule 10b5-1 under the Exchange Act) and in privatelynegotiated transactions. Any future common stock repurchases will be dependent upon several factors, including the Company’s capitalposition, its liquidity, its financial strength and credit ratings, general market conditions and the market price of MetLife, Inc.’s common stockcompared to management’s assessment of the stock’s underlying value and applicable regulatory, legal and accounting factors. Whether ornot to purchase any common stock and the size and timing of any such purchases will be determined in the Company’s complete discretion.
OtherIn September 2008, in connection with the split-off of RGA as described in Note 2, the Holding Company received from MetLife, Inc.
stockholders 23,093,689 shares of MetLife, Inc.’s common stock with a fair market value of $1,318 million and, in exchange, delivered29,243,539 shares of RGA Class B common stock with a net book value of $1,716 million resulting in a loss on disposition, includingtransaction costs, of $458 million.
DividendsThe table below presents declaration, record and payment dates, as well as per share and aggregate dividend amounts, for the common
stock:
Declaration Date Record Date Payment Date Per Share Aggregate
Dividend
(In millions, exceptper share data)
October 26, 2010 . . . . . . . . . . . . . . . . . . . . . . November 9, 2010 December 14, 2010 $0.74 $784(1)
October 29, 2009 . . . . . . . . . . . . . . . . . . . . . . November 9, 2009 December 14, 2009 $0.74 $610
October 28, 2008 . . . . . . . . . . . . . . . . . . . . . . November 10, 2008 December 15, 2008 $0.74 $592
(1) Includes dividends on Convertible Preferred Stock (see above).
Stock-Based Compensation Plans
Description of Plans for Employees and Agents — General TermsThe MetLife, Inc. 2000 Stock Incentive Plan, as amended (the “2000 Stock Plan”) authorized the granting of awards to employees and
agents in the form of options to buy shares of MetLife, Inc. common stock (“Stock Options”) that either qualify as incentive Stock Options
F-132 MetLife, Inc.
MetLife, Inc.
Notes to the Consolidated Financial Statements — (Continued)

under Section 422A of the Code or are non-qualified. By December 31, 2009 all awards under the 2000 Stock Plan had either vested or beenforfeited. No awards were made under the 2000 Stock Plan in 2010.
Under the MetLife, Inc. 2005 Stock and Incentive Compensation Plan (the “2005 Stock Plan”), awards granted to employees and agentsmay be in the form of Stock Options, Stock Appreciation Rights, Restricted Stock or Restricted Stock Units, Performance Shares orPerformance Share Units, Cash-Based Awards and Stock-Based Awards (each as defined in the 2005 Stock Plan with reference to MetLife,Inc. common stock).
The aggregate number of shares authorized for issuance under the 2005 Stock Plan is 68,000,000, plus those shares available but notutilized under the 2000 Stock Plan and those shares utilized under the 2000 Stock Plan that are recovered due to forfeiture of Stock Options.Each share issued under the 2005 Stock Plan in connection with a Stock Option or Stock Appreciation Right reduces the number of sharesremaining for issuance under that plan by one, and each share issued under the 2005 Stock Plan in connection with awards other than StockOptions or Stock Appreciation Rights reduces the number of shares remaining for issuance under that plan by 1.179 shares. At December 31,2010, the aggregate number of shares remaining available for issuance pursuant to the 2005 Stock Plan was 40,477,451. Stock Optionexercises and other awards settled in shares are satisfied through the issuance of shares held in treasury by the Company or by the issuanceof new shares.
Compensation expense related to awards under the 2005 Stock Plan is recognized based on the number of awards expected to vest,which represents the awards granted less expected forfeitures over the life of the award, as estimated at the date of grant. Unless a materialdeviation from the assumed forfeiture rate is observed during the term in which the awards are expensed, any adjustment necessary to reflectdifferences in actual experience is recognized in the period the award becomes payable or exercisable.
Compensation expense related to awards under the 2005 Stock Plan is principally related to the issuance of Stock Options, PerformanceShares and Restricted Stock Units. The majority of the awards granted each year under the 2005 Stock Plan are made in the first quarter ofeach year.
Description of Plans for Directors — General TermsThe MetLife, Inc. 2000 Directors Stock Plan, as amended (the “2000 Directors Stock Plan”) authorized the granting of awards in the form of
MetLife, Inc. common stock, non-qualified Stock Options, or a combination of the foregoing to non-management Directors of MetLife, Inc. Asof December 31, 2009, all awards under the 2000 Directors Stock Plan had either vested or been forfeited. No awards were made under the2000 Directors Stock Plan in 2010.
Under the MetLife, Inc. 2005 Non-Management Director Stock Compensation Plan (the “2005 Directors Stock Plan”), awards granted maybe in the form of non-qualified Stock Options, Stock Appreciation Rights, Restricted Stock or Restricted Stock Units, or Stock-Based Awards(each as defined in the 2005 Directors Stock Plan with reference to MetLife, Inc. common stock) to non-management Directors of MetLife,Inc. The number of shares authorized for issuance under the 2005 Directors Stock Plan is 2,000,000. There were no shares carried forwardfrom the 2000 Directors Stock Plan to the 2005 Directors Stock Plan. At December 31, 2010, the aggregate number of shares remainingavailable for issuance pursuant to the 2005 Directors Stock Plan was 1,808,114. Stock Option exercises and other awards settled in sharesare satisfied through the issuance of shares held in treasury by the Company or by the issuance of new shares.
Compensation expense related to awards under the 2005 Directors Plan is recognized based on the number of shares awarded. TheStock-Based Awards granted under the 2005 Directors Plan have vested immediately. The majority of the awards granted each year under the2005 Directors Stock Plan are made in the second quarter of each year.
Compensation Expense Related to Stock-Based CompensationThe components of compensation expense related to stock-based compensation, excluding the insignificant compensation expense
related to the 2005 Directors Stock Plan, is as follows:
2010 2009 2008
Years EndedDecember 31,
(In millions)
Stock Options . . . . . . . . . . . . . . . . . . . . . . . . . . . . . . . . . . . . . . . . . . . . . . . . . . . . . . . $45 $55 $ 51
Performance Shares(1) . . . . . . . . . . . . . . . . . . . . . . . . . . . . . . . . . . . . . . . . . . . . . . . . . . 29 11 70
Restricted Stock Units . . . . . . . . . . . . . . . . . . . . . . . . . . . . . . . . . . . . . . . . . . . . . . . . . . 10 3 2
Total compensation expenses related to the Incentive Plans . . . . . . . . . . . . . . . . . . . . . . . . . . $84 $69 $123
Income tax benefits . . . . . . . . . . . . . . . . . . . . . . . . . . . . . . . . . . . . . . . . . . . . . . . . . . . . $29 $24 $ 43
(1) Performance Shares expected to vest and the related compensation expenses may be further adjusted by the performance factor mostlikely to be achieved, as estimated by management, at the end of the performance period.The following table presents the total unrecognized compensation expense related to stock-based compensation and the expected
weighted average period over which these expenses will be recognized at:
ExpenseWeighted Average
Period
December 31, 2010
(In millions) (Years)
Stock Options . . . . . . . . . . . . . . . . . . . . . . . . . . . . . . . . . . . . . . . . . . . . . . . . . $39 1.73
Performance Shares . . . . . . . . . . . . . . . . . . . . . . . . . . . . . . . . . . . . . . . . . . . . . $30 1.74
Restricted Stock Units . . . . . . . . . . . . . . . . . . . . . . . . . . . . . . . . . . . . . . . . . . . . $14 1.87
F-133MetLife, Inc.
MetLife, Inc.
Notes to the Consolidated Financial Statements — (Continued)

Stock OptionsStock Options are the contingent right of award holders to purchase shares of MetLife, Inc. common stock at a stated price for a limited
time. All Stock Options have an exercise price equal to the closing price of MetLife, Inc. common stock reported on the NYSE on the date ofgrant, and have a maximum term of ten years. The vast majority of Stock Options granted have become or will become exercisable at a rate ofone-third of each award on each of the first three anniversaries of the grant date. Other Stock Options have become or will becomeexercisable on the third anniversary of the grant date. Vesting is subject to continued service, except for employees who are retirementeligible and in certain other limited circumstances.
A summary of the activity related to Stock Options for the year ended December 31, 2010 is as follows:
Shares UnderOption
Weighted AverageExercise Price
WeightedAverage
RemainingContractual
Term
AggregateIntrinsicValue(1)
(Years) (In millions)
Outstanding at January 1, 2010 . . . . . . . . . . . . . . . . . . . 30,152,405 $38.51 5.50 $ —
Granted(2) . . . . . . . . . . . . . . . . . . . . . . . . . . . . . . . . . 4,683,144 $35.06
Exercised . . . . . . . . . . . . . . . . . . . . . . . . . . . . . . . . . (1,742,003) $29.74
Expired . . . . . . . . . . . . . . . . . . . . . . . . . . . . . . . . . . . (154,947) $47.78
Forfeited . . . . . . . . . . . . . . . . . . . . . . . . . . . . . . . . . . (236,268) $34.64
Outstanding at December 31, 2010 . . . . . . . . . . . . . . . . 32,702,331 $38.47 5.30 $195
Aggregate number of stock options expected to vest atDecember 31, 2010 . . . . . . . . . . . . . . . . . . . . . . . . . 31,930,964 $38.62 5.21 $186
Exercisable at December 31, 2010 . . . . . . . . . . . . . . . . . 23,405,998 $40.43 4.00 $ 94
(1) The aggregate intrinsic value was computed using the closing share price on December 31, 2010 of $44.44 and December 31, 2009 of$35.35, as applicable.
(2) The total fair value on the date of the grant was $53 million.The fair value of Stock Options is estimated on the date of grant using a binomial lattice model. Significant assumptions used in the
Company’s binomial lattice model, which are further described below, include: expected volatility of the price of MetLife, Inc. common stock;risk-free rate of return; expected dividend yield on MetLife, Inc. common stock; exercise multiple; and the post-vesting termination rate.
Expected volatility is based upon an analysis of historical prices of MetLife, Inc. common stock and call options on that common stocktraded on the open market. The Company uses a weighted-average of the implied volatility for publicly-traded call options with the longestremaining maturity nearest to the money as of each valuation date and the historical volatility, calculated using monthly closing prices ofMetLife, Inc.’s common stock. The Company chose a monthly measurement interval for historical volatility as it believes this better depicts thenature of employee option exercise decisions being based on longer-term trends in the price of the underlying shares rather than on dailyprice movements.
The binomial lattice model used by the Company incorporates different risk-free rates based on the imputed forward rates forU.S. Treasury Strips for each year over the contractual term of the option. The table below presents the full range of rates that were usedfor options granted during the respective periods.
Dividend yield is determined based on historical dividend distributions compared to the price of the underlying common stock as of thevaluation date and held constant over the life of the Stock Option.
The binomial lattice model used by the Company incorporates the contractual term of the Stock Options and then factors in expectedexercise behavior and a post-vesting termination rate, or the rate at which vested options are exercised or expire prematurely due totermination of employment, to derive an expected life. Exercise behavior in the binomial lattice model used by the Company is expressedusing an exercise multiple, which reflects the ratio of exercise price to the strike price of Stock Options granted at which holders of the StockOptions are expected to exercise. The exercise multiple is derived from actual historical exercise activity. The post-vesting termination rate isdetermined from actual historical exercise experience and expiration activity under the Incentive Plans.
F-134 MetLife, Inc.
MetLife, Inc.
Notes to the Consolidated Financial Statements — (Continued)
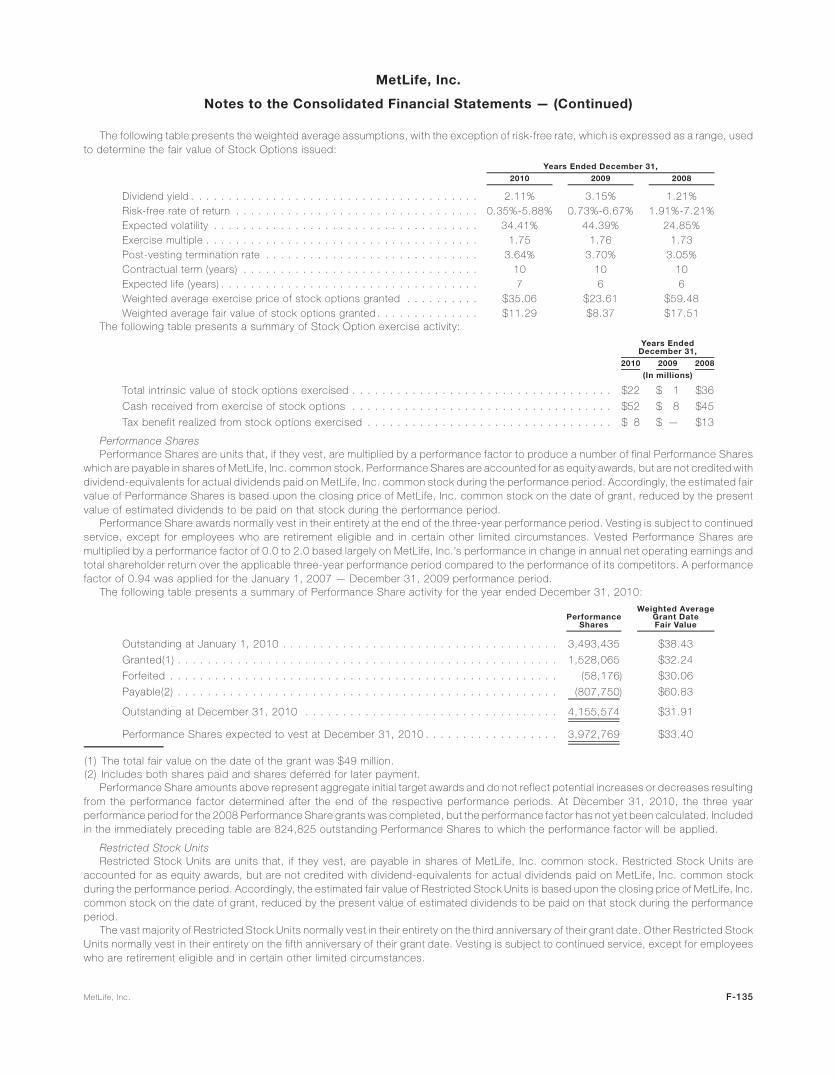
The following table presents the weighted average assumptions, with the exception of risk-free rate, which is expressed as a range, usedto determine the fair value of Stock Options issued:
2010 2009 2008
Years Ended December 31,
Dividend yield . . . . . . . . . . . . . . . . . . . . . . . . . . . . . . . . . . . . . . . 2.11% 3.15% 1.21%Risk-free rate of return . . . . . . . . . . . . . . . . . . . . . . . . . . . . . . . . . 0.35%-5.88% 0.73%-6.67% 1.91%-7.21%Expected volatility . . . . . . . . . . . . . . . . . . . . . . . . . . . . . . . . . . . . 34.41% 44.39% 24.85%Exercise multiple . . . . . . . . . . . . . . . . . . . . . . . . . . . . . . . . . . . . . 1.75 1.76 1.73Post-vesting termination rate . . . . . . . . . . . . . . . . . . . . . . . . . . . . . 3.64% 3.70% 3.05%Contractual term (years) . . . . . . . . . . . . . . . . . . . . . . . . . . . . . . . . 10 10 10Expected life (years) . . . . . . . . . . . . . . . . . . . . . . . . . . . . . . . . . . . 7 6 6Weighted average exercise price of stock options granted . . . . . . . . . . $35.06 $23.61 $59.48Weighted average fair value of stock options granted . . . . . . . . . . . . . . $11.29 $8.37 $17.51
The following table presents a summary of Stock Option exercise activity:
2010 2009 2008
Years EndedDecember 31,
(In millions)
Total intrinsic value of stock options exercised . . . . . . . . . . . . . . . . . . . . . . . . . . . . . . . . . . . $22 $ 1 $36
Cash received from exercise of stock options . . . . . . . . . . . . . . . . . . . . . . . . . . . . . . . . . . . $52 $ 8 $45
Tax benefit realized from stock options exercised . . . . . . . . . . . . . . . . . . . . . . . . . . . . . . . . . $ 8 $ — $13
Performance SharesPerformance Shares are units that, if they vest, are multiplied by a performance factor to produce a number of final Performance Shares
which are payable in shares of MetLife, Inc. common stock. Performance Shares are accounted for as equity awards, but are not credited withdividend-equivalents for actual dividends paid on MetLife, Inc. common stock during the performance period. Accordingly, the estimated fairvalue of Performance Shares is based upon the closing price of MetLife, Inc. common stock on the date of grant, reduced by the presentvalue of estimated dividends to be paid on that stock during the performance period.
Performance Share awards normally vest in their entirety at the end of the three-year performance period. Vesting is subject to continuedservice, except for employees who are retirement eligible and in certain other limited circumstances. Vested Performance Shares aremultiplied by a performance factor of 0.0 to 2.0 based largely on MetLife, Inc.’s performance in change in annual net operating earnings andtotal shareholder return over the applicable three-year performance period compared to the performance of its competitors. A performancefactor of 0.94 was applied for the January 1, 2007 — December 31, 2009 performance period.
The following table presents a summary of Performance Share activity for the year ended December 31, 2010:
PerformanceShares
Weighted AverageGrant DateFair Value
Outstanding at January 1, 2010 . . . . . . . . . . . . . . . . . . . . . . . . . . . . . . . . . . . . . 3,493,435 $38.43
Granted(1) . . . . . . . . . . . . . . . . . . . . . . . . . . . . . . . . . . . . . . . . . . . . . . . . . . . 1,528,065 $32.24
Forfeited . . . . . . . . . . . . . . . . . . . . . . . . . . . . . . . . . . . . . . . . . . . . . . . . . . . . (58,176) $30.06
Payable(2) . . . . . . . . . . . . . . . . . . . . . . . . . . . . . . . . . . . . . . . . . . . . . . . . . . . (807,750) $60.83
Outstanding at December 31, 2010 . . . . . . . . . . . . . . . . . . . . . . . . . . . . . . . . . . 4,155,574 $31.91
Performance Shares expected to vest at December 31, 2010 . . . . . . . . . . . . . . . . . . 3,972,769 $33.40
(1) The total fair value on the date of the grant was $49 million.(2) Includes both shares paid and shares deferred for later payment.
Performance Share amounts above represent aggregate initial target awards and do not reflect potential increases or decreases resultingfrom the performance factor determined after the end of the respective performance periods. At December 31, 2010, the three yearperformance period for the 2008 Performance Share grants was completed, but the performance factor has not yet been calculated. Includedin the immediately preceding table are 824,825 outstanding Performance Shares to which the performance factor will be applied.
Restricted Stock UnitsRestricted Stock Units are units that, if they vest, are payable in shares of MetLife, Inc. common stock. Restricted Stock Units are
accounted for as equity awards, but are not credited with dividend-equivalents for actual dividends paid on MetLife, Inc. common stockduring the performance period. Accordingly, the estimated fair value of Restricted Stock Units is based upon the closing price of MetLife, Inc.common stock on the date of grant, reduced by the present value of estimated dividends to be paid on that stock during the performanceperiod.
The vast majority of Restricted Stock Units normally vest in their entirety on the third anniversary of their grant date. Other Restricted StockUnits normally vest in their entirety on the fifth anniversary of their grant date. Vesting is subject to continued service, except for employeeswho are retirement eligible and in certain other limited circumstances.
F-135MetLife, Inc.
MetLife, Inc.
Notes to the Consolidated Financial Statements — (Continued)

The following table presents a summary of Restricted Stock Unit activity for the year ended December 31, 2010:
Restricted StockUnits
Weighted AverageGrant DateFair Value
Outstanding at January 1, 2010 . . . . . . . . . . . . . . . . . . . . . . . . . . . . . . . . . . . 393,362 $28.05
Granted(1) . . . . . . . . . . . . . . . . . . . . . . . . . . . . . . . . . . . . . . . . . . . . . . . . . 607,200 $32.32
Forfeited . . . . . . . . . . . . . . . . . . . . . . . . . . . . . . . . . . . . . . . . . . . . . . . . . . (31,275) $27.31
Payable(2) . . . . . . . . . . . . . . . . . . . . . . . . . . . . . . . . . . . . . . . . . . . . . . . . . (32,115) $63.32
Outstanding at December 31, 2010 . . . . . . . . . . . . . . . . . . . . . . . . . . . . . . . . 937,172 $29.63
Restricted Stock Units expected to vest at December 31, 2010 . . . . . . . . . . . . . . 937,172 $29.63
(1) The total fair value on the date of the grant was $20 million.(2) Includes both shares paid and shares deferred for later payment.
Statutory Equity and IncomeExcept for American Life, each insurance company’s state of domicile imposes minimum risk-based capital (“RBC”) requirements that
were developed by the NAIC. The formulas for determining the amount of RBC specify various weighting factors that are applied to financialbalances or various levels of activity based on the perceived degree of risk. Regulatory compliance is determined by a ratio of total adjustedcapital, as defined by the NAIC, to authorized control level RBC, as defined by the NAIC. Companies below specific trigger points or ratios areclassified within certain levels, each of which requires specified corrective action. Each of the Holding Company’s U.S. insurancesubsidiaries exceeded the minimum RBC requirements for all periods presented herein.
American Life does not write business in Delaware or any other domestic state and, as such, is exempt from RBC by Delaware law.American Life operations are regulated by applicable authorities of the countries in which the company operates and are subject to capital andsolvency requirements in those countries.
The NAIC has adopted the Codification of Statutory Accounting Principles (“Statutory Codification”). Statutory Codification is intended tostandardize regulatory accounting and reporting to state insurance departments. However, statutory accounting principles continue to beestablished by individual state laws and permitted practices. The New York Insurance Department (the “Department”) has adopted StatutoryCodification with certain modifications for the preparation of statutory financial statements of insurance companies domiciled in New York.Modifications by the various state insurance departments may impact the effect of Statutory Codification on the statutory capital and surplusof the Holding Company’s U.S. insurance subsidiaries.
Statutory accounting principles differ from GAAP primarily by charging policy acquisition costs to expense as incurred, establishing futurepolicy benefit liabilities using different actuarial assumptions, reporting surplus notes as surplus instead of debt and valuing securities on adifferent basis.
In addition, certain assets are not admitted under statutory accounting principles and are charged directly to surplus. The most significantassets not admitted by the Company are net deferred income tax assets resulting from temporary differences between statutory accountingprinciples basis and tax basis not expected to reverse and become recoverable within three years. Further, statutory accounting principles donot give recognition to purchase accounting adjustments.
Statutory net income (loss) of MLIC, a New York domiciled insurer, was $2,066 million, $1,221 million and ($338) million for the yearsended December 31, 2010, 2009 and 2008, respectively. Statutory capital and surplus, to be filed with the Department, was $13.2 billion and$12.6 billion at December 31, 2010 and 2009, respectively.
Statutory net income of American Life, a Delaware domiciled insurer, of approximately $800 million will be reported in the Statutory AnnualStatement for the year ended December 31, 2010. Statutory capital and surplus, to be filed with the Delaware Insurance Department wasapproximately $4.0 billion at December 31, 2010.
Statutory net income of MICC, a Connecticut domiciled insurer, was $668 million, $81 million and $242 million for the years endedDecember 31, 2010, 2009 and 2008, respectively. Statutory capital and surplus, to be filed with the Connecticut Insurance Department, was$5.1 billion and $4.9 billion at December 31, 2010 and 2009, respectively.
Statutory net income of Metropolitan Property and Casualty Insurance Company (“MPC”), a Rhode Island domiciled insurer, was$273 million, $266 million and $308 million for the years ended December 31, 2010, 2009 and 2008, respectively. Statutory capital andsurplus, to be filed with the Insurance Department of Rhode Island, was $1.8 billion at both December 31, 2010 and 2009.
Statutory net income of MTL, a Delaware domiciled insurer, was $151 million, $57 million and $212 million for the years endedDecember 31, 2010, 2009 and 2008, respectively. Statutory capital and surplus, to be filed with the Delaware Insurance Departmentwas $805 million and $867 million at December 31, 2010 and 2009, respectively.
F-136 MetLife, Inc.
MetLife, Inc.
Notes to the Consolidated Financial Statements — (Continued)

Dividend RestrictionsThe table below sets forth the dividends permitted to be paid by the respective insurance subsidiary without insurance regulatory approval
and the respective dividends paid:
CompanyPermitted w/o
Approval(1) Paid (2)Permitted w/o
Approval(3) Paid(2)Permitted w/o
Approval(3)
2011 2010 2009
(In millions)
Metropolitan Life Insurance Company . . . . . . . . . . $1,321 $631 (4) $1,262 $ — $552
American Life Insurance Company (5) . . . . . . . . . . $ 661 $ — $ 511 N/A N/A
MetLife Insurance Company of Connecticut . . . . . . $ 517 $330 $ 659 $ — $714
Metropolitan Property and Casualty InsuranceCompany . . . . . . . . . . . . . . . . . . . . . . . . . . . $ — $260 $ — $300 $ 9
Metropolitan Tower Life Insurance Company . . . . . . $ 80 $569 (6) $ 93 $ — $ 88
(1) Reflects dividend amounts that may be paid during 2011 without prior regulatory approval. However, because dividend tests may bebased on dividends previously paid over rolling 12-month periods, if paid before a specified date during 2011, some or all of suchdividends may require regulatory approval.
(2) All amounts paid, including those requiring regulatory approval.(3) Reflects dividend amounts that could have been paid during the relevant year without prior regulatory approval.(4) Includes securities transferred to the Holding Company of $399 million.(5) Reflects approximate dividends permitted to be paid and the respective dividends paid since the Acquisition Date. See Note 2.(6) Includes shares of an affiliate distributed to the Holding Company as an in-kind dividend of $475 million.
In addition to the amounts presented in the table above, for the years ended December 31, 2010 and 2009, cash dividends in theaggregate amount of $0 and $215 million, respectively, were paid to the Holding Company.
Under New York State Insurance Law, MLIC is permitted, without prior insurance regulatory clearance, to pay stockholder dividends to theHolding Company as long as the aggregate amount of all such dividends in any calendar year does not exceed the lesser of: (i) 10% of itssurplus to policyholders as of the end of the immediately preceding calendar year; or (ii) its statutory net gain from operations for theimmediately preceding calendar year (excluding realized capital gains). MLIC will be permitted to pay a dividend to the Holding Company inexcess of the lesser of such two amounts only if it files notice of its intention to declare such a dividend and the amount thereof with theSuperintendent and the Superintendent does not disapprove the dividend within 30 days of its filing. Under New York State Insurance Law,the Superintendent has broad discretion in determining whether the financial condition of a stock life insurance company would support thepayment of such dividends to its shareholders.
Under Delaware State Insurance Law, each of American Life and MTL is permitted, without prior insurance regulatory clearance, to pay astockholder dividend to the Holding Company as long as the amount of the dividend when aggregated with all other dividends in thepreceding 12 months does not exceed the greater of: (i) 10% of its surplus to policyholders as of the end of the immediately precedingcalendar year; or (ii) its statutory net gain from operations for the immediately preceding calendar year (excluding realized capital gains). Eachof American Life and MTL will be permitted to pay a dividend to the Holding Company in excess of the greater of such two amounts only if it filesnotice of the declaration of such a dividend and the amount thereof with the Delaware Commissioner of Insurance (the “DelawareCommissioner”) and the Delaware Commissioner either approves the distribution of the dividend or does not disapprove the distributionwithin 30 days of its filing. In addition, any dividend that exceeds earned surplus (defined as unassigned funds) as of the last filed annualstatutory statement requires insurance regulatory approval. Under Delaware State Insurance Law, the Delaware Commissioner has broaddiscretion in determining whether the financial condition of a stock life insurance company would support the payment of such dividends to itsshareholders.
Under Connecticut State Insurance Law, MICC is permitted, without prior insurance regulatory clearance, to pay stockholder dividends toits stockholders as long as the amount of such dividends, when aggregated with all other dividends in the preceding 12 months, does notexceed the greater of: (i) 10% of its surplus to policyholders as of the end of the immediately preceding calendar year; or (ii) its statutory netgain from operations for the immediately preceding calendar year. MICC will be permitted to pay a dividend in excess of the greater of suchtwo amounts only if it files notice of its declaration of such a dividend and the amount thereof with the Connecticut Commissioner of Insurance(the “Connecticut Commissioner”) and the Connecticut Commissioner does not disapprove the payment within 30 days after notice. Inaddition, any dividend that exceeds earned surplus (unassigned funds, reduced by 25% of unrealized appreciation in value or revaluation ofassets or unrealized profits on investments) as of the last filed annual statutory statement requires insurance regulatory approval. UnderConnecticut State Insurance Law, the Connecticut Commissioner has broad discretion in determining whether the financial condition of astock life insurance company would support the payment of such dividends to its shareholders.
Under Rhode Island State Insurance Law, MPC is permitted, without prior insurance regulatory clearance, to pay a stockholder dividend tothe Holding Company as long as the aggregate amount of all such dividends in any twelve-month period does not exceed the lesser of: (i) 10%of its surplus to policyholders as of the end of the immediately preceding calendar year; or (ii) net income, not including realized capital gains,for the immediately preceding calendar year, which may include carry forward net income from the second and third preceding calendar yearsexcluding realized capital gains and less dividends paid in the second and immediately preceding calendar years. MPC will be permitted topay a dividend to the Holding Company in excess of the lesser of such two amounts only if it files notice of its intention to declare such adividend and the amount thereof with the Rhode Island Commissioner of Insurance (the “Rhode Island Commissioner”) and the Rhode IslandCommissioner does not disapprove the distribution within 30 days of its filing. Under Rhode Island State Insurance Code, the Rhode Island
F-137MetLife, Inc.
MetLife, Inc.
Notes to the Consolidated Financial Statements — (Continued)

Commissioner has broad discretion in determining whether the financial condition of a stock property and casualty insurance company wouldsupport the payment of such dividends to its shareholders.
Other Comprehensive Income (Loss)The following table sets forth the reclassification adjustments required for the years ended December 31, 2010, 2009 and 2008 in other
comprehensive income (loss) that are included as part of net income for the current year that have been reported as a part of othercomprehensive income (loss) in the current or prior year:
2010 2009 2008
Years Ended December 31,
(In millions)
Holding gains (losses) on investments arising during the year . . . . . . . . . . . . . . . . . . . . . $10,092 $18,548 $(26,650)
Income tax effect of holding gains (losses) . . . . . . . . . . . . . . . . . . . . . . . . . . . . . . . . (3,516) (6,243) 8,989
Reclassification adjustments:
Recognized holding (gains) losses included in current year income . . . . . . . . . . . . . . . . (143) 1,954 2,040
Amortization of premiums and accretion of discounts associated with investments . . . . . . (590) (490) (926)
Income tax effect . . . . . . . . . . . . . . . . . . . . . . . . . . . . . . . . . . . . . . . . . . . . . . . . 255 (493) (377)
Allocation of holding (gains) losses on investments relating to other policyholder amounts . . . (2,813) (2,979) 4,809
Income tax effect of allocation of holding (gains) losses to other policyholder amounts . . . . . 980 1,002 (1,621)
Unrealized investment loss of subsidiary at date of sale . . . . . . . . . . . . . . . . . . . . . . . . — — 131
Deferred income tax on unrealized investment loss of subsidiary at date of sale . . . . . . . . . — — (60)
Net unrealized investment gains (losses), net of income tax . . . . . . . . . . . . . . . . . . . . . . 4,265 11,299 (13,665)
Foreign currency translation adjustments, net of income tax . . . . . . . . . . . . . . . . . . . . . . (350) 63 (700)
Defined benefit plans adjustment, net of income tax . . . . . . . . . . . . . . . . . . . . . . . . . . . 96 (102) (1,199)
Other comprehensive income (loss) . . . . . . . . . . . . . . . . . . . . . . . . . . . . . . . . . . . . . 4,011 11,260 (15,564)
Other comprehensive income (loss) attributable to noncontrolling interests . . . . . . . . . . . . (5) 11 (10)
Other comprehensive income (loss) attributable to noncontrolling interests of subsidiary atdate of disposal . . . . . . . . . . . . . . . . . . . . . . . . . . . . . . . . . . . . . . . . . . . . . . . . — — 150
Foreign currency translation adjustments attributable to noncontrolling interests of subsidiaryat date of disposal . . . . . . . . . . . . . . . . . . . . . . . . . . . . . . . . . . . . . . . . . . . . . . — — 107
Defined benefit plans adjustment attributable to noncontrolling interests of subsidiary at dateof disposal . . . . . . . . . . . . . . . . . . . . . . . . . . . . . . . . . . . . . . . . . . . . . . . . . . . — — (4)
Other comprehensive income (loss) attributable to MetLife, Inc., excluding cumulative effectof change in accounting principle . . . . . . . . . . . . . . . . . . . . . . . . . . . . . . . . . . . . . 4,006 11,271 (15,321)
Cumulative effect of change in accounting principle, net of income tax of $27 million,$40 million and $0 (see Note 1) . . . . . . . . . . . . . . . . . . . . . . . . . . . . . . . . . . . . . . 52 (76) —
Other comprehensive income (loss) attributable to MetLife, Inc. . . . . . . . . . . . . . . . . . . . $ 4,058 $11,195 $(15,321)
19. Other ExpensesInformation on other expenses was as follows:
2010 2009 2008
Years Ended December 31,
(In millions)
Compensation . . . . . . . . . . . . . . . . . . . . . . . . . . . . . . . . . . . . . . . . . . . . . . . $ 3,584 $ 3,402 $ 3,299
Pension, postretirement & postemployment benefit costs . . . . . . . . . . . . . . . . . . . . 380 452 120
Commissions . . . . . . . . . . . . . . . . . . . . . . . . . . . . . . . . . . . . . . . . . . . . . . . . 3,646 3,433 3,384
Volume-related costs . . . . . . . . . . . . . . . . . . . . . . . . . . . . . . . . . . . . . . . . . . . 379 407 354
Interest credited to bank deposits . . . . . . . . . . . . . . . . . . . . . . . . . . . . . . . . . . . 137 163 166
Capitalization of DAC . . . . . . . . . . . . . . . . . . . . . . . . . . . . . . . . . . . . . . . . . . . (3,343) (3,019) (3,092)
Amortization of DAC and VOBA . . . . . . . . . . . . . . . . . . . . . . . . . . . . . . . . . . . . 2,801 1,307 3,489
Interest expense on debt and debt issue costs . . . . . . . . . . . . . . . . . . . . . . . . . . 1,550 1,044 1,051
Premium taxes, licenses & fees . . . . . . . . . . . . . . . . . . . . . . . . . . . . . . . . . . . . 514 527 471
Professional services . . . . . . . . . . . . . . . . . . . . . . . . . . . . . . . . . . . . . . . . . . . 1,104 902 949
Rent, net of sublease income . . . . . . . . . . . . . . . . . . . . . . . . . . . . . . . . . . . . . . 307 385 373
Other . . . . . . . . . . . . . . . . . . . . . . . . . . . . . . . . . . . . . . . . . . . . . . . . . . . . . 1,744 1,553 1,383
Total other expenses . . . . . . . . . . . . . . . . . . . . . . . . . . . . . . . . . . . . . . . . . . . $12,803 $10,556 $11,947
F-138 MetLife, Inc.
MetLife, Inc.
Notes to the Consolidated Financial Statements — (Continued)

Capitalization of DAC and Amortization of DAC and VOBASee Note 6 for DAC and VOBA by segment and a rollforward of each including impacts of capitalization and amortization. See also Note 10
for a description of the DAC amortization impact associated with the closed block. Amortization of DAC and VOBA includes amortization ofnegative VOBA related to the Acquisition of $64 million for the year ended December 31, 2010. Negative VOBA is recorded in other policy-related balances (see Note 2) and therefore, the amortization of negative VOBA is an offset to the VOBA amortization in Note 6.
Interest Expense on Debt and Debt Issue CostsSee Notes 11, 12, 13 and 14 for attribution of interest expense by debt issuance. Interest expense on debt and debt issue costs includes
interest expense related to CSEs of $411 million for the year ended December 31, 2010, and $0 for both of the years ended December 31,2009 and 2008. See Note 3.
Lease ImpairmentsSee Note 16 for description of lease impairments included within other expenses.
Costs Related to the AcquisitionSee Note 2 for transaction costs and integration-related expenses related to the Acquisition which were included in other expenses.
Restructuring ChargesIn September 2008, the Company began an enterprise-wide cost reduction and revenue enhancement initiative which is expected to be
fully implemented by December 31, 2011. This initiative is focused on reducing complexity, leveraging scale, increasing productivity andimproving the effectiveness of the Company’s operations, as well as providing a foundation for future growth. These restructuring costs wereincluded in other expenses. As the expenses relate to an enterprise-wide initiative, they were incurred within Banking, Corporate & Other.Estimated restructuring costs may change as management continues to execute its restructuring plans. Restructuring charges associatedwith this enterprise-wide initiative were as follows:
2010 2009 2008
Years EndedDecember 31,
(In millions)
Balance at January 1, . . . . . . . . . . . . . . . . . . . . . . . . . . . . . . . . . . . . . . . . . . . . . . . . . $ 36 $ 86 $ —
Severance charges . . . . . . . . . . . . . . . . . . . . . . . . . . . . . . . . . . . . . . . . . . . . . . . . . 17 84 109
Change in severance charge estimates . . . . . . . . . . . . . . . . . . . . . . . . . . . . . . . . . . . . (1) (8) (8)
Cash payments . . . . . . . . . . . . . . . . . . . . . . . . . . . . . . . . . . . . . . . . . . . . . . . . . . . (45) (126) (15)
Balance at December 31, . . . . . . . . . . . . . . . . . . . . . . . . . . . . . . . . . . . . . . . . . . . . . . $ 7 $ 36 $ 86
Restructuring charges incurred in current period . . . . . . . . . . . . . . . . . . . . . . . . . . . . . . . $ 16 $ 76 $101
Total restructuring charges incurred since inception of program . . . . . . . . . . . . . . . . . . . . . . $193 $ 177 $101
For the years ended December 31, 2010, 2009 and 2008, the change in severance charge estimates of ($1) million, ($8) million and($8) million, respectively, was due to changes in estimates for variable incentive compensation, COBRA benefits, employee outplacementservices and for employees whose severance status changed.
In addition to the above charges, the Company has recognized lease charges of $28 million associated with the consolidation of officespace since the inception of the initiative.
Management anticipates further restructuring charges, including severance, lease and asset impairments, will be incurred during the yearending December 31, 2011. However, such restructuring plans were not sufficiently developed to enable the Company to make an estimateof such restructuring charges at December 31, 2010.
See Note 2 for discussion of restructuring charges related to the Acquisition.
F-139MetLife, Inc.
MetLife, Inc.
Notes to the Consolidated Financial Statements — (Continued)

20. Earnings Per Common ShareThe following table presents the weighted average shares used in calculating basic earnings per common share and those used in
calculating diluted earnings per common share for each income category presented below:
2010 2009 2008
Years Ended December 31,
(In millions, except share and per share data)
Weighted Average Shares:Weighted average common stock outstanding for basic earnings per
common share (1) . . . . . . . . . . . . . . . . . . . . . . . . . . . . . . . . . . . 882,436,532 818,462,150 735,184,337
Incremental common shares from assumed:
Stock purchase contracts underlying common equity units (2) . . . . . . . . — — 2,043,553
Exercise or issuance of stock-based awards (3) . . . . . . . . . . . . . . . . . 7,131,346 — 7,557,540
Weighted average common stock outstanding for diluted earnings percommon share(1) . . . . . . . . . . . . . . . . . . . . . . . . . . . . . . . . . . . . 889,567,878 818,462,150 744,785,430
Income (Loss) from Continuing Operations:Income (loss) from continuing operations, net of income tax . . . . . . . . . . . $ 2,777 $ (2,319) $ 3,479
Less: Income (loss) from continuing operations, net of income tax,attributable to noncontrolling interests . . . . . . . . . . . . . . . . . . . . . . (4) (32) (25)
Less: Preferred stock dividends . . . . . . . . . . . . . . . . . . . . . . . . . . . 122 122 125
Income (loss) from continuing operations, net of income tax, available toMetLife, Inc.’s common shareholders . . . . . . . . . . . . . . . . . . . . . . $ 2,659 $ (2,409) $ 3,379
Basic . . . . . . . . . . . . . . . . . . . . . . . . . . . . . . . . . . . . . . . . . . . $ 3.01 $ (2.94) $ 4.60
Diluted . . . . . . . . . . . . . . . . . . . . . . . . . . . . . . . . . . . . . . . . . . . $ 2.99 $ (2.94) $ 4.54
Income (Loss) from Discontinued Operations:Income (loss) from discontinued operations, net of income tax . . . . . . . . . $ 9 $ 41 $ (201)
Less: Income (loss) from discontinued operations, net of income tax,attributable to noncontrolling interests . . . . . . . . . . . . . . . . . . . . . . — — 94
Income (loss) from discontinued operations, net of income tax, available toMetLife, Inc.’s common shareholders . . . . . . . . . . . . . . . . . . . . . . . . $ 9 $ 41 $ (295)
Basic . . . . . . . . . . . . . . . . . . . . . . . . . . . . . . . . . . . . . . . . . . . $ 0.01 $ 0.05 $ (0.41)
Diluted . . . . . . . . . . . . . . . . . . . . . . . . . . . . . . . . . . . . . . . . . . . $ 0.01 $ 0.05 $ (0.40)
Net Income (Loss):Net income (loss) . . . . . . . . . . . . . . . . . . . . . . . . . . . . . . . . . . . . . $ 2,786 $ (2,278) $ 3,278
Less: Net income (loss) attributable to noncontrolling interests . . . . . . . . (4) (32) 69
Less: Preferred stock dividends . . . . . . . . . . . . . . . . . . . . . . . . . . . 122 122 125
Net income (loss) available to MetLife, Inc.’s common shareholders . . . . . . $ 2,668 $ (2,368) $ 3,084
Basic . . . . . . . . . . . . . . . . . . . . . . . . . . . . . . . . . . . . . . . . . . . $ 3.02 $ (2.89) $ 4.19
Diluted . . . . . . . . . . . . . . . . . . . . . . . . . . . . . . . . . . . . . . . . . . . $ 3.00 $ (2.89) $ 4.14
(1) For purposes of the earnings per common share calculation, the Convertible Preferred Stock is assumed converted into shares ofcommon stock for both basic and diluted weighted average shares. See Note 18 for a description of the Convertible Preferred Stock.
(2) See Note 14 for a description of the Company’s common equity units.
(3) For the year ended December 31, 2009, 4,213,700 shares related to the assumed exercise or issuance of stock-based awards havebeen excluded from the calculation of diluted earnings per common share as these assumed shares are anti-dilutive.
F-140 MetLife, Inc.
MetLife, Inc.
Notes to the Consolidated Financial Statements — (Continued)

21. Quarterly Results of Operations (Unaudited)The unaudited quarterly results of operations for 2010 and 2009 are summarized in the table below:
March 31, June 30, September 30, December 31,
Three Months Ended
(In millions, except per share data)
2010Total revenues . . . . . . . . . . . . . . . . . . . . . . . . . . . . . . . . . . . . . . . . . . . . $13,190 $14,245 $12,444 $12,838Total expenses . . . . . . . . . . . . . . . . . . . . . . . . . . . . . . . . . . . . . . . . . . . . $11,999 $11,875 $12,051 $12,834Income (loss) from continuing operations, net of income tax . . . . . . . . . . . . . . . . . . . $ 833 $ 1,540 $ 322 $ 82Income (loss) from discontinued operations, net of income tax . . . . . . . . . . . . . . . . . $ 1 $ 7 $ (2) $ 3Net income (loss) . . . . . . . . . . . . . . . . . . . . . . . . . . . . . . . . . . . . . . . . . . $ 834 $ 1,547 $ 320 $ 85Less: Net income (loss) attr ibutable to noncontroll ing interests . . . . . . . . . . . . . . . . . $ (1) $ (10) $ 4 $ 3Net income (loss) attr ibutable to MetLife, Inc. . . . . . . . . . . . . . . . . . . . . . . . . . . $ 835 $ 1,557 $ 316 $ 82Less: Preferred stock dividends . . . . . . . . . . . . . . . . . . . . . . . . . . . . . . . . . . $ 30 $ 31 $ 30 $ 31Net income (loss) available to MetLife, Inc.’s common shareholders . . . . . . . . . . . . . . $ 805 $ 1,526 $ 286 $ 51Basic earnings per common share:
Income (loss) from continuing operations, net of income tax, available to MetLife, Inc.’scommon shareholders . . . . . . . . . . . . . . . . . . . . . . . . . . . . . . . . . . . . . $ 0.98 $ 1.84 $ 0.33 $ 0.05
Income (loss) from discontinued operations, net of income tax, attributable to MetLife,Inc. . . . . . . . . . . . . . . . . . . . . . . . . . . . . . . . . . . . . . . . . . . . . . . . $ — $ 0.01 $ — $ —
Net income (loss) attr ibutable to MetLife, Inc. . . . . . . . . . . . . . . . . . . . . . . . . . $ 1.02 $ 1.90 $ 0.36 $ 0.08Net income (loss) available to MetLife, Inc.’s common shareholders . . . . . . . . . . . . . $ 0.98 $ 1.85 $ 0.33 $ 0.05
Diluted earnings per common share:Income (loss) from continuing operations, net of income tax, available to MetLife, Inc.’s
common shareholders . . . . . . . . . . . . . . . . . . . . . . . . . . . . . . . . . . . . . $ 0.97 $ 1.83 $ 0.32 $ 0.05Income (loss) from discontinued operations, net of income tax, attributable to MetLife,
Inc. . . . . . . . . . . . . . . . . . . . . . . . . . . . . . . . . . . . . . . . . . . . . . . . $ — $ 0.01 $ — $ —Net income (loss) attr ibutable to MetLife, Inc. . . . . . . . . . . . . . . . . . . . . . . . . . $ 1.01 $ 1.87 $ 0.36 $ 0.08Net income (loss) available to MetLife, Inc.’s common shareholders . . . . . . . . . . . . . $ 0.97 $ 1.84 $ 0.32 $ 0.05
2009Total revenues . . . . . . . . . . . . . . . . . . . . . . . . . . . . . . . . . . . . . . . . . . . . $10,214 $ 8,264 $10,238 $12,341Total expenses . . . . . . . . . . . . . . . . . . . . . . . . . . . . . . . . . . . . . . . . . . . . $11,176 $10,640 $11,413 $12,162Income (loss) from continuing operations, net of income tax . . . . . . . . . . . . . . . . . . . $ (585) $ (1,420) $ (624) $ 310Income (loss) from discontinued operations, net of income tax . . . . . . . . . . . . . . . . . $ 37 $ 2 $ (1) $ 3Net income (loss) . . . . . . . . . . . . . . . . . . . . . . . . . . . . . . . . . . . . . . . . . . $ (548) $ (1,418) $ (625) $ 313Less: Net income (loss) attr ibutable to noncontroll ing interests . . . . . . . . . . . . . . . . . $ (4) $ (16) $ (5) $ (7)Net income (loss) attr ibutable to MetLife, Inc. . . . . . . . . . . . . . . . . . . . . . . . . . . $ (544) $ (1,402) $ (620) $ 320Less: Preferred stock dividends . . . . . . . . . . . . . . . . . . . . . . . . . . . . . . . . . . $ 30 $ 31 $ 30 $ 31Net income (loss) available to MetLife, Inc.’s common shareholders . . . . . . . . . . . . . . $ (574) $ (1,433) $ (650) $ 289Basic earnings per common share:
Income (loss) from continuing operations, net of income tax, available to MetLife, Inc.’scommon shareholders . . . . . . . . . . . . . . . . . . . . . . . . . . . . . . . . . . . . . $ (0.76) $ (1.74) $ (0.79) $ 0.35
Income (loss) from discontinued operations, net of income tax, attributable to MetLife,Inc. . . . . . . . . . . . . . . . . . . . . . . . . . . . . . . . . . . . . . . . . . . . . . . . $ 0.05 $ — $ — $ —
Net income (loss) attr ibutable to MetLife, Inc. . . . . . . . . . . . . . . . . . . . . . . . . . $ (0.67) $ (1.71) $ (0.75) $ 0.39Net income (loss) available to MetLife, Inc.’s common shareholders . . . . . . . . . . . . . $ (0.71) $ (1.74) $ (0.79) $ 0.35
Diluted earnings per common share:Income (loss) from continuing operations, net of income tax, available to MetLife, Inc.’s
common shareholders . . . . . . . . . . . . . . . . . . . . . . . . . . . . . . . . . . . . . $ (0.76) $ (1.74) $ (0.79) $ 0.35Income (loss) from discontinued operations, net of income tax, attributable to MetLife,
Inc. . . . . . . . . . . . . . . . . . . . . . . . . . . . . . . . . . . . . . . . . . . . . . . . $ 0.05 $ — $ — $ —Net income (loss) attr ibutable to MetLife, Inc. . . . . . . . . . . . . . . . . . . . . . . . . . $ (0.67) $ (1.71) $ (0.75) $ 0.39Net income (loss) available to MetLife, Inc.’s common shareholders . . . . . . . . . . . . . $ (0.71) $ (1.74) $ (0.79) $ 0.35
22. Business Segment InformationMetLife is organized into five segments: Insurance Products, Retirement Products, Corporate Benefit Funding and Auto & Home
(collectively, “U.S. Business”) and International. The assets and liabilities of ALICO as of November 30, 2010 and the operating resultsof ALICO from the Acquisition Date through November 30, 2010 are included in the International segment. In addition, the Company reportscertain of its results of operations in Banking, Corporate & Other, which includes MetLife Bank and other business activities. For reportingpurposes beginning in 2011, our non-U.S. Business results will be presented within two separate segments: Japan and Other InternationalRegions.
Insurance Products offers a broad range of protection products and services to individuals and corporations, as well as other institutionsand their respective employees, and is organized into three distinct businesses: Group Life, Individual Life and Non-Medical Health. Group
F-141MetLife, Inc.
MetLife, Inc.
Notes to the Consolidated Financial Statements — (Continued)

Life insurance products and services include variable life, universal life and term life products. Individual Life insurance products and servicesinclude variable life, universal life, term life and whole life products. Non-Medical Health products and services include dental insurance,short- and long-term disability, long-term care and other insurance products. Retirement Products offers asset accumulation and incomeproducts, including a wide variety of annuities. Corporate Benefit Funding offers pension risk solutions, structured settlements, stable valueand investment products and other benefit funding products. Auto & Home provides personal lines property and casualty insurance,including private passenger automobile, homeowners and personal excess liability insurance. In the fourth quarter of 2010, managementrealigned certain income annuity products within the Company’s segments to better conform to the way it manages and assesses itsbusiness and began reporting such product results in the Retirement Products segment, previously reported in the Corporate BenefitFunding segment. Accordingly, prior period results for these segments have been adjusted by $29 million and $13 million of operating losses,net of $15 million and $8 million of income tax benefits, for the years ended December 31, 2009 and 2008, respectively, to reflect suchproduct reclassifications.
International provides life insurance, accident and health insurance, credit insurance, annuities, endowments and retirement & savingsproducts to both individuals and groups.
Banking, Corporate & Other contains the excess capital not allocated to the segments, the results of operations of MetLife Bank, variousstart-up entities and run-off entities, as well as interest expense related to the majority of the Company’s outstanding debt and expensesassociated with certain legal proceedings and income tax audit issues. Banking, Corporate & Other also includes the elimination ofintersegment amounts, which generally relate to intersegment loans, which bear interest rates commensurate with related borrowings.
Operating earnings is the measure of segment profit or loss the Company uses to evaluate segment performance and allocate resources.Consistent with GAAP accounting guidance for segment reporting, it is the Company’s measure of segment performance reported below.Operating earnings does not equate to income (loss) from continuing operations, net of income tax or net income (loss) as determined inaccordance with GAAP and should not be viewed as a substitute for those GAAP measures. The Company believes the presentation ofoperating earnings herein as the Company measures it for management purposes enhances the understanding of its performance byhighlighting the results from operations and the underlying profitability drivers of the businesses.
Operating earnings is defined as operating revenues less operating expenses, net of income tax.Operating revenues is defined as GAAP revenues (i) less net investment gains (losses) and net derivative gains (losses); (ii) less
amortization of unearned revenue related to net investment gains (losses) and net derivative gains (losses); (iii) plus scheduled periodicsettlement payments on derivatives that are hedges of investments but do not qualify for hedge accounting treatment; (iv) plus income fromdiscontinued real estate operations; (v) less net investment income related to contractholder-directed unit-linked investments; and (vi) plus,for operating joint ventures reported under the equity method of accounting, the aforementioned adjustments, those identified in thedefinition of operating expenses and changes in fair value of hedges of operating joint venture liabilities, all net of income tax.
Operating expenses is defined as GAAP expenses (i) less changes in policyholder benefits associated with asset value fluctuationsrelated to experience-rated contractholder liabilities and certain inflation-indexed liabilities; (ii) less costs related to business combinations(since January 1, 2009) and noncontrolling interests; (iii) less amortization of DAC and VOBA and changes in the policyholder dividendobligation related to net investment gains (losses) and net derivative gains (losses); (iv) less interest credited to policyholder accountbalances related to contractholder-directed unit-linked investments; and (v) plus scheduled periodic settlement payments on derivatives thatare hedges of policyholder account balances but do not qualify for hedge accounting treatment.
In addition, operating revenues and operating expenses do not reflect the consolidation of certain securitization entities that are VIEs asrequired under GAAP.
Set forth in the tables below is certain financial information with respect to the Company’s segments, as well as Banking, Corporate &Other for the years ended December 31, 2010, 2009 and 2008 and at December 31, 2010 and 2009. The accounting policies of thesegments are the same as those of the Company, except for the method of capital allocation and the accounting for gains (losses) fromintercompany sales, which are eliminated in consolidation. Economic capital is an internally developed risk capital model, the purpose ofwhich is to measure the risk in the business and to provide a basis upon which capital is deployed. The economic capital model accounts forthe unique and specific nature of the risks inherent in the Company’s businesses. As a part of the economic capital process, a portion of netinvestment income is credited to the segments based on the level of allocated equity. The Company allocates certain non-recurring items,such as expenses associated with certain legal proceedings, to Banking, Corporate & Other.
F-142 MetLife, Inc.
MetLife, Inc.
Notes to the Consolidated Financial Statements — (Continued)

Year Ended December 31, 2010InsuranceProducts
RetirementProducts
CorporateBenefitFunding
Auto& Home Total International
Banking,Corporate
& Other Total AdjustmentsTotal
Consolidated
U.S. Business
Operating Earnings
(In millions)
Revenues
Premiums . . . . . . . . . . . . . . . . $17,200 $ 875 $1,938 $2,923 $22,936 $4,447 $ 11 $27,394 $ — $27,394
Universal life and investment-typeproduct policy fees . . . . . . . . . 2,247 2,234 226 — 4,707 1,329 — 6,036 1 6,037
Net investment income . . . . . . . . 6,068 3,395 4,954 209 14,626 1,703 992 17,321 294 17,615
Other revenues . . . . . . . . . . . . 761 220 246 22 1,249 35 1,044 2,328 — 2,328
Net investment gains (losses) . . . . — — — — — — — — (392) (392)
Net derivative gains (losses) . . . . . — — — — — — — — (265) (265)
Total revenues . . . . . . . . . . . . 26,276 6,724 7,364 3,154 43,518 7,514 2,047 53,079 (362) 52,717
Expenses
Policyholder benefits and claimsand policyholder dividends . . . . 19,075 1,879 4,041 2,021 27,016 3,723 (14) 30,725 306 31,031
Interest credited to policyholderaccount balances . . . . . . . . . . 963 1,612 1,445 — 4,020 683 — 4,703 222 4,925
Interest credited to bankdeposits . . . . . . . . . . . . . . . — — — — — — 137 137 — 137
Capitalization of DAC . . . . . . . . . (841) (1,067) (19) (448) (2,375) (968) — (3,343) — (3,343)
Amortization of DAC and VOBA . . . 966 724 16 439 2,145 537 1 2,683 118 2,801
Interest expense on debt . . . . . . 1 3 6 — 10 3 1,126 1,139 411 1,550
Other expenses . . . . . . . . . . . . 4,080 2,437 460 769 7,746 2,538 1,155 11,439 219 11,658
Total expenses . . . . . . . . . . . 24,244 5,588 5,949 2,781 38,562 6,516 2,405 47,483 1,276 48,759
Provision for income tax expense(benefit) . . . . . . . . . . . . . . . 711 397 495 73 1,676 206 (300) 1,582 (401) 1,181
Operating earnings . . . . . . . . $ 1,321 $ 739 $ 920 $ 300 $ 3,280 $ 792 $ (58) 4,014
Adjustments to:
Total revenues . . . . . . . . . . . . (362)
Total expenses . . . . . . . . . . . (1,276)
Provision for income tax(expense) benefit . . . . . . . . . 401
Income (loss) from continuingoperations, net of incometax . . . . . . . . . . . . . . . . . . $ 2,777 $ 2,777
At December 31, 2010:InsuranceProducts
RetirementProducts
CorporateBenefitFunding
Auto& Home Total International
Banking,Corporate
& Other Total
U.S. Business
(In millions)
Total assets . . . . . . . . . . . . . . . . . . . . . . . $141,366 $177,056 $172,918 $5,541 $496,881 $164,995 $69,030 $730,906
Separate account assets . . . . . . . . . . . . . $ 9,567 $107,335 $ 56,571 $ — $173,473 $ 9,864 $ — $183,337
Separate account liabilities . . . . . . . . . . . $ 9,567 $107,335 $ 56,571 $ — $173,473 $ 9,864 $ — $183,337
F-143MetLife, Inc.
MetLife, Inc.
Notes to the Consolidated Financial Statements — (Continued)
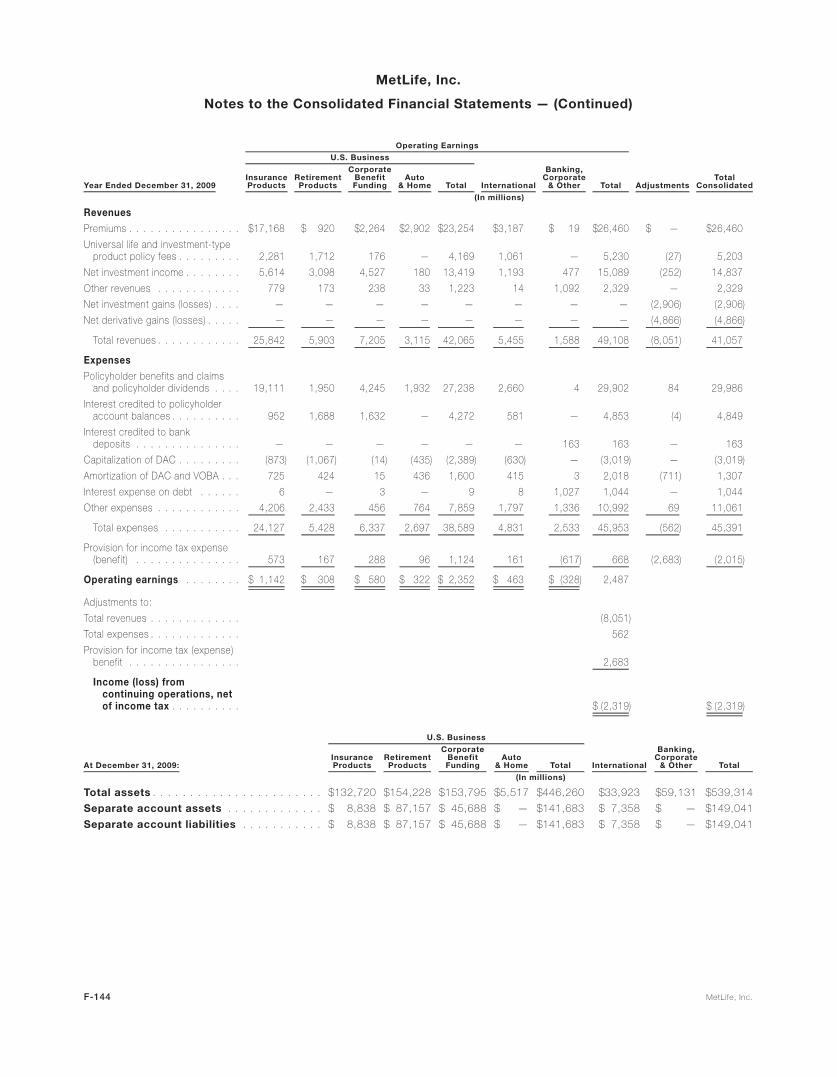
Year Ended December 31, 2009InsuranceProducts
RetirementProducts
CorporateBenefitFunding
Auto& Home Total International
Banking,Corporate
& Other Total AdjustmentsTotal
Consolidated
U.S. Business
Operating Earnings
(In millions)
Revenues
Premiums . . . . . . . . . . . . . . . . $17,168 $ 920 $2,264 $2,902 $23,254 $3,187 $ 19 $26,460 $ — $26,460
Universal life and investment-typeproduct policy fees . . . . . . . . . 2,281 1,712 176 — 4,169 1,061 — 5,230 (27) 5,203
Net investment income . . . . . . . . 5,614 3,098 4,527 180 13,419 1,193 477 15,089 (252) 14,837
Other revenues . . . . . . . . . . . . 779 173 238 33 1,223 14 1,092 2,329 — 2,329
Net investment gains (losses) . . . . — — — — — — — — (2,906) (2,906)
Net derivative gains (losses) . . . . . — — — — — — — — (4,866) (4,866)
Total revenues . . . . . . . . . . . . 25,842 5,903 7,205 3,115 42,065 5,455 1,588 49,108 (8,051) 41,057
Expenses
Policyholder benefits and claimsand policyholder dividends . . . . 19,111 1,950 4,245 1,932 27,238 2,660 4 29,902 84 29,986
Interest credited to policyholderaccount balances . . . . . . . . . . 952 1,688 1,632 — 4,272 581 — 4,853 (4) 4,849
Interest credited to bankdeposits . . . . . . . . . . . . . . . — — — — — — 163 163 — 163
Capitalization of DAC . . . . . . . . . (873) (1,067) (14) (435) (2,389) (630) — (3,019) — (3,019)
Amortization of DAC and VOBA . . . 725 424 15 436 1,600 415 3 2,018 (711) 1,307
Interest expense on debt . . . . . . 6 — 3 — 9 8 1,027 1,044 — 1,044
Other expenses . . . . . . . . . . . . 4,206 2,433 456 764 7,859 1,797 1,336 10,992 69 11,061
Total expenses . . . . . . . . . . . 24,127 5,428 6,337 2,697 38,589 4,831 2,533 45,953 (562) 45,391
Provision for income tax expense(benefit) . . . . . . . . . . . . . . . 573 167 288 96 1,124 161 (617) 668 (2,683) (2,015)
Operating earnings . . . . . . . . $ 1,142 $ 308 $ 580 $ 322 $ 2,352 $ 463 $ (328) 2,487
Adjustments to:
Total revenues . . . . . . . . . . . . . (8,051)
Total expenses . . . . . . . . . . . . . 562
Provision for income tax (expense)benefit . . . . . . . . . . . . . . . . 2,683
Income (loss) fromcontinuing operations, netof income tax . . . . . . . . . . $ (2,319) $ (2,319)
At December 31, 2009:InsuranceProducts
RetirementProducts
CorporateBenefitFunding
Auto& Home Total International
Banking,Corporate
& Other Total
U.S. Business
(In millions)
Total assets . . . . . . . . . . . . . . . . . . . . . . . $132,720 $154,228 $153,795 $5,517 $446,260 $33,923 $59,131 $539,314
Separate account assets . . . . . . . . . . . . . $ 8,838 $ 87,157 $ 45,688 $ — $141,683 $ 7,358 $ — $149,041
Separate account liabilities . . . . . . . . . . . $ 8,838 $ 87,157 $ 45,688 $ — $141,683 $ 7,358 $ — $149,041
F-144 MetLife, Inc.
MetLife, Inc.
Notes to the Consolidated Financial Statements — (Continued)

Year Ended December 31, 2008InsuranceProducts
RetirementProducts
CorporateBenefitFunding
Auto&
Home Total International
Banking,Corporate
& Other Total AdjustmentsTotal
Consolidated
U.S. Business
Operating Earnings
(In millions)
Revenues
Premiums . . . . . . . . . . . . . . . . $16,402 $ 696 $2,348 $2,971 $22,417 $3,470 $ 27 $25,914 $ — $25,914
Universal life and investment-typeproduct policy fees . . . . . . . . . 2,171 1,870 227 — 4,268 1,095 — 5,363 18 5,381
Net investment income . . . . . . . . 5,787 2,624 5,615 186 14,212 1,180 808 16,200 89 16,289
Other revenues . . . . . . . . . . . . . 819 169 358 38 1,384 18 184 1,586 — 1,586
Net investment gains (losses) . . . . — — — — — — — — (2,098) (2,098)
Net derivative gains (losses) . . . . . — — — — — — — — 3,910 3,910
Total revenues . . . . . . . . . . . . 25,179 5,359 8,548 3,195 42,281 5,763 1,019 49,063 1,919 50,982
Expenses
Policyholder benefits and claimsand policyholder dividends . . . . 18,183 1,271 4,398 1,924 25,776 3,185 46 29,007 181 29,188
Interest credited to policyholderaccount balances . . . . . . . . . . 930 1,338 2,297 — 4,565 171 7 4,743 45 4,788
Interest credited to bankdeposits . . . . . . . . . . . . . . . . — — — — — — 166 166 — 166
Capitalization of DAC . . . . . . . . . (849) (980) (18) (444) (2,291) (798) (3) (3,092) — (3,092)
Amortization of DAC and VOBA . . . 743 1,356 29 454 2,582 381 5 2,968 521 3,489
Interest expense on debt . . . . . . . 5 2 2 — 9 9 1,033 1,051 — 1,051
Other expenses . . . . . . . . . . . . 4,196 2,101 440 794 7,531 2,079 699 10,309 24 10,333
Total expenses . . . . . . . . . . . . 23,208 5,088 7,148 2,728 38,172 5,027 1,953 45,152 771 45,923
Provision for income tax expense(benefit) . . . . . . . . . . . . . . . . 661 91 474 104 1,330 257 (495) 1,092 488 1,580
Operating earnings . . . . . . . . . $ 1,310 $ 180 $ 926 $ 363 $ 2,779 $ 479 $ (439) 2,819
Adjustments to:
Total revenues . . . . . . . . . . . . 1,919
Total expenses . . . . . . . . . . . . (771)
Provision for income tax (expense)benefit . . . . . . . . . . . . . . . . . (488)
Income (loss) from continuingoperations, net of incometax . . . . . . . . . . . . . . . . . . . $ 3,479 $ 3,479
Net investment income is based upon the actual results of each segment’s specifically identifiable asset portfolio adjusted for allocatedequity. Other costs are allocated to each of the segments based upon: (i) a review of the nature of such costs; (ii) time studies analyzing theamount of employee compensation costs incurred by each segment; and (iii) cost estimates included in the Company’s product pricing.
Operating revenues derived from any customer did not exceed 10% of consolidated operating revenues for the years ended Decem-ber 31, 2010, 2009 and 2008. Operating revenues from U.S. operations were $44.9 billion, $42.8 billion and $42.9 billion for the years endedDecember 31, 2010, 2009 and 2008, respectively, which represented 85%, 87% and 87%, respectively, of consolidated operating revenues.
23. Discontinued Operations
Real EstateThe Company actively manages its real estate portfolio with the objective of maximizing earnings through selective acquisitions and
dispositions. Income related to real estate classified as held-for-sale or sold is presented in discontinued operations. These assets arecarried at the lower of depreciated cost or estimated fair value less expected disposition costs. Income from discontinued real estateoperations, net of income tax, was $3 million, $11 million and $13 million for the years ended December 31, 2010, 2009 and 2008,respectively.
The carrying value of real estate related to discontinued operations was $8 million and $55 million at December 31, 2010 and 2009,respectively.
F-145MetLife, Inc.
MetLife, Inc.
Notes to the Consolidated Financial Statements — (Continued)

Operations
Texas Life Insurance CompanyDuring the fourth quarter of 2008, the Holding Company entered into an agreement to sell its wholly-owned subsidiary, Cova, the parent
company of Texas Life, to a third-party and the sale occurred in March 2009. See Note 2. The following table presents the amounts related tothe operations of Cova that have been reflected as discontinued operations in the consolidated statements of operations:
2009 2008
Years Ended December 31,
(In millions)
Total revenues . . . . . . . . . . . . . . . . . . . . . . . . . . . . . . . . . . . . . . . . . . . . . . . . . . . $25 $134
Total expenses . . . . . . . . . . . . . . . . . . . . . . . . . . . . . . . . . . . . . . . . . . . . . . . . . . . 19 119
Income before provision for income tax . . . . . . . . . . . . . . . . . . . . . . . . . . . . . . . . . . . 6 15
Provision for income tax . . . . . . . . . . . . . . . . . . . . . . . . . . . . . . . . . . . . . . . . . . . . . 2 4
Income from operations of discontinued operations, net of income tax . . . . . . . . . . . . . . . 4 11
Gain on disposal, net of income tax . . . . . . . . . . . . . . . . . . . . . . . . . . . . . . . . . . . . . 28 37
Income from discontinued operations, net of income tax . . . . . . . . . . . . . . . . . . . . . . . . $32 $ 48
Reinsurance Group of America, IncorporatedAs more fully described in Note 2, the Company completed a tax-free split-off of its majority-owned subsidiary, RGA in September 2008.
The following table presents the amounts related to the operations of RGA that have been reflected as discontinued operations in theconsolidated statements of operations:
Year EndedDecember 31, 2008
(In millions)
Total revenues . . . . . . . . . . . . . . . . . . . . . . . . . . . . . . . . . . . . . . . . . . . . . . . . . . . . . . . . . $3,952
Total expenses . . . . . . . . . . . . . . . . . . . . . . . . . . . . . . . . . . . . . . . . . . . . . . . . . . . . . . . . . 3,796
Income before provision for income tax . . . . . . . . . . . . . . . . . . . . . . . . . . . . . . . . . . . . . . . . . 156
Provision for income tax . . . . . . . . . . . . . . . . . . . . . . . . . . . . . . . . . . . . . . . . . . . . . . . . . . . 53
Income from discontinued operations, net of income tax, available to MetLife, Inc.’s commonshareholders . . . . . . . . . . . . . . . . . . . . . . . . . . . . . . . . . . . . . . . . . . . . . . . . . . . . . . . . . 103
Income from discontinued operations, net of income tax, attributable to noncontrolling interests . . . . 94
Loss on disposal, net of income tax . . . . . . . . . . . . . . . . . . . . . . . . . . . . . . . . . . . . . . . . . . . (458)
Income (loss) from discontinued operations, net of income tax . . . . . . . . . . . . . . . . . . . . . . . . . . $ (261)
The operations of RGA included direct policies and reinsurance agreements with MetLife and some of its subsidiaries. These agreementsare generally terminable by either party upon 90 days written notice with respect to future new business. Agreements related to existingbusiness generally are not terminable, unless the underlying policies terminate or are recaptured. These direct policies and reinsuranceagreements do not constitute significant continuing involvement by the Company with RGA. Included in continuing operations in theCompany’s consolidated statements of operations are amounts related to these transactions, including ceded amounts that reducedpremiums and fees by $158 million and ceded amounts that reduced policyholder benefits and claims by $136 million for the year endedDecember 31, 2008 that have not been eliminated as these transactions have continued after the RGA disposition.
24. Subsequent Events
DividendsOn February 18, 2011, the Holding Company announced dividends of $0.2500000 per share, for a total of $6 million, on its Series A
preferred shares, and $0.4062500 per share, for a total of $24 million, on its Series B preferred shares, subject to the final confirmation that ithas met the financial tests specified in the Series A and Series B preferred shares, which the Company anticipates will be made on or aboutMarch 7, 2011. Both dividends will be payable March 15, 2011 to shareholders of record as of February 28, 2011.
Credit FacilityOn February 1, 2011, the Holding Company entered into a committed facility with a third-party bank to provide letters of credit for the
benefit of Missouri Reinsurance (Barbados) Inc. (“MoRe”), a captive reinsurance subsidiary, to address its short-term solvency needs basedon guidance from the regulator. This one-year facility provides for the issuance of letters of credit in amounts up to $350 million. Under thefacility, a letter of credit for $250 million was issued on February 2, 2011 and increased to $295 million on February 23, 2011, whichmanagement believes satisfies MoRe’s solvency requirements.
F-146 MetLife, Inc.
MetLife, Inc.
Notes to the Consolidated Financial Statements — (Continued)

(This page intentionally left blank)

BOARD OF DIRECTORS EXECUTIVE OFFICERS
C. ROBERT HENRIKSONChairman of the Board,President and ChiefExecutive Officer,MetLife, Inc.
Chair, Executive CommitteeMember, InvestmentCommittee of MetropolitanLife Insurance Company
SYLVIA MATHEWS BURWELLPresident, GlobalDevelopment Program, TheBill and Melinda GatesFoundation
Member, Governance andCorporate ResponsibilityCommittee and InvestmentCommittee of MetropolitanLife Insurance Company
EDUARDO CASTRO-WRIGHTVice Chairman, Wal-MartStores, Inc.
Member, CompensationCommittee, Governance andCorporate ResponsibilityCommittee, and InvestmentCommittee of MetropolitanLife Insurance Company
CHERYL W. GRISÉ (LeadDirector)Retired Executive VicePresident, Northeast Utilities
Chair, Governance andCorporate ResponsibilityCommitteeMember, Audit Committee,Compensation Committee,and Executive Committee
R. GLENN HUBBARD, PH.D.Dean and Russell L. CarsonProfessor of Economics andFinance, Graduate School ofBusiness,Columbia University
Chair, Investment Committeeof Metropolitan Life InsuranceCompanyMember, ExecutiveCommittee and Finance andRisk Committee
JOHN M. KEANESenior Partner, SCP Partners,and President, GSI, LLCGeneral, United States Army(Retired)
Member, Audit Committeeand Governance andCorporate ResponsibilityCommittee
ALFRED F. KELLY, JR.Retired President, AmericanExpress Company
Chair, Finance and RiskCommitteeMember, Audit Committeeand CompensationCommittee
JAMES M. KILTSPartner, Centerview PartnersManagement, LLC
Chair, CompensationCommitteeMember, InvestmentCommittee of MetropolitanLife Insurance Company
CATHERINE R. KINNEYRetired Group Executive VicePresident, Listings,Marketing & Branding, NYSEEuronext
Member, Audit Committeeand Finance and RiskCommittee
HUGH B. PRICEVisiting Professor of Publicand International Affairs,Woodrow Wilson School,Princeton University
Member, Audit Committeeand CompensationCommittee
DAVID SATCHER, M.D., PH.D.Director, Satcher HealthLeadership Institute and theCenter of Excellence onHealth Disparities,Morehouse School ofMedicineFormer Surgeon General,United States
Member, ExecutiveCommittee, Governance andCorporate ResponsibilityCommittee, and InvestmentCommittee of MetropolitanLife Insurance Company
KENTON J. SICCHITANORetired Global ManagingPartner,PricewaterhouseCoopers LLP
Chair, Audit CommitteeMember, CompensationCommittee and Finance andRisk Policy Committee
LULU C. WANGChief Executive Officer,Tupelo Capital ManagementLLC
Member, Finance and RiskPolicy Committee andInvestment Committee ofMetropolitan Life InsuranceCompany
C. ROBERT HENRIKSONChairman of the Board,President and Chief ExecutiveOfficer
GWENN L. CARRExecutive Vice President,Office of the Chairman
KATHLEEN A. HENKELExecutive Vice President,Human Resources
STEVEN A. KANDARIANExecutive Vice President andChief Investment Officer
NICHOLAS D. LATRENTAExecutive Vice President andGeneral Counsel
MARIA R. MORRISExecutive Vice President,Technology and Operations
WILLIAM J. MULLANEYPresident, U.S. Business
WILLIAM J. TOPPETAPresident, International
WILLIAM J. WHEELERExecutive Vice President andChief Financial Officer
86 MetLife, Inc.

CONTACT INFORMATION
Corporate HeadquartersMetLife, Inc.200 Park AvenueNew York, NY 10166-0188212-578-2211www.metlife.com
Transfer Agent/Shareholder RecordsFor information or assistance regarding shareholder accounts ordividend checks, please contact MetLife, Inc.’s transfer agent:
BNY Mellon Shareowner ServicesP.O. Box 358015Pittsburgh, PA 15252-80151-800-649-3593TDD for Hearing Impaired: 800-231-5469www.bnymellon.com/shareowner/isd
Trustee, MetLife Policyholder TrustWilmington Trust CompanyRodney Square North1100 North Market StreetWilmington, DE 19890302-651-1000www.wilmingtontrust.com
Additional Resources
Investor Information:http://investor.metlife.com
Governance Information:www.metlife.com/corporategovernance
MetLife News:www.metlife.com/about/press-room
CORPORATE INFORMATION
Corporate Profile
MetLife, Inc. is a leading global provider of insurance, annuities and
employee benefit programs, serving 90 million customers in over
60 countries. Through its subsidiaries and affiliates, MetLife holds
leading market positions in the United States, Japan, Latin
America, Asia Pacific, Europe and the Middle East. For more
information, visit www.metlife.com.
Form 10-K and Other InformationMetLife, Inc. will provide to shareholders without charge,upon written or oral request, a copy of MetLife, Inc.’sAnnual Report on Form 10-K (including financialstatements and financial statement schedules, butwithout exhibits), as amended on Form 10-K/A, for thefiscal year ended December 31, 2010. MetLife, Inc. willfurnish to requesting shareholders any exhibit to theForm 10-K or Form 10-K/A upon the payment ofreasonable expenses incurred by MetLife, Inc. infurnishing such exhibit. Requests should be directed toMetLife Investor Relations, MetLife, Inc., 1095 Avenue ofthe Americas, New York, New York 10036, via the Internetby going to http://investor.metlife.com and selecting“Information Requests,” or by calling 1-800-753-4904.The Annual Report on Form 10-K and Form 10-K/A mayalso be accessed at http://investor.metlife.com byselecting “Financial Information,” “SEC Filings,”“MetLife, Inc. — View SEC Filings” as well as at thewebsite of the U.S. Securities and Exchange Commissionat www.sec.gov.
Dividend Information and Common Stock PerformanceMetLife Inc.’s common stock is traded on the New York StockExchange (“NYSE”) under the trading symbol “MET.” MetLife, Inc.declared an annual dividend of $0.74 per common share onOctober 26, 2010 and October 29, 2009. Future common stockdividend decisions will be determined by MetLife, Inc.’s Board ofDirectors after taking into consideration factors such as MetLife,Inc.’s current earnings, expected medium- and long-term earnings,financial condition, regulatory capital position, and applicablegovernmental regulations and policies. The payment of dividends
and other distributions to MetLife, Inc. by its insurance subsidiariesis regulated by insurance laws and regulations. See“Management’s Discussion and Analysis of Financial Conditionand Results of Operations — Liquidity and Capital Resources —The Holding Company — Liquidity and Capital Sources —Dividends from Subsidiaries” and Note 18 of Notes toConsolidated Financial Statements.
The following table presents the high and low closing prices for thecommon stock of MetLife, Inc. on the NYSE for the periodsindicated.
2010 High Low
Common StockPrice
First quarter . . . . . . . . . . . . . . . . . . . . $43.34 $33.64
Second quarter . . . . . . . . . . . . . . . . . $47.10 $37.76
Third quarter . . . . . . . . . . . . . . . . . . . $42.73 $36.49
Fourth quarter . . . . . . . . . . . . . . . . . . $44.92 $37.74
2009 High Low
Common StockPrice
First quarter . . . . . . . . . . . . . . . . . . . . $35.97 $12.10
Second quarter . . . . . . . . . . . . . . . . . $35.50 $23.43
Third quarter . . . . . . . . . . . . . . . . . . . $40.83 $26.90
Fourth quarter . . . . . . . . . . . . . . . . . . $38.35 $33.22
As of March 1, 2011, there were approximately 4.4 millionbeneficial owners of common stock of MetLife, Inc.
87MetLife, Inc.

CUMULATIVE TOTAL RETURN
Based upon an initial investment of $100 on December 31, 2005
with dividends reinvested
$0
$50
$100
$150
31-Dec-05 31-Dec-06 31-Dec-07 31-Dec-08 31-Dec-09 31-Dec-10
MetLife Inc. S&P 500 S&P 500 Insurance S&P 500 Financials
Source: Capital IQ
88 MetLife, Inc.

(This page intentionally left blank)

(This page intentionally left blank)

MetLife, Inc.200 Park AvenueNew York, NY 10166-0188www.metlife.com
0710-6222 © 2011 Peanuts Worldwide LLC