annual operating budget - city of...
TRANSCRIPT


i
ANNUAL OPERATING BUDGET
FOR FISCAL YEAR
OCTOBER 1, 2017 - SEPTEMBER 30, 2018
Bob F. Brown
Mayor
City Council
Guessippina Bonner
Ward 1
Mark Hicks
Ward 4
Robert Shankle
Ward 2
Rocky Thigpen
Ward 5
Lynn Torres
Ward 3
Sarah Murray
Ward 6
Keith Wright, City Manager
Belinda Melancon, Director of Finance

ii
S.B. 656 Notice
This budget will raise more total property taxes than last year’s
budget by $113,188 (1.2%), and of that amount $111,065 is tax
revenue to be raised from new property added to the tax roll this
year.
On September 19, 2017, the members of the governing body
voted on the budget as follows:
For: Bob F. Brown, Mayor Mark Hicks
Guessippina Bonner Rocky Thigpen
Robert Shankle Sarah Murrah
Lynn Torres
Against:
Present and not voting:
Absent:
Property Tax Rate Comparison 2017-2018 2016-2017 Property Tax Rate: $0.531135/100 $0.529942/100
Effective Tax Rate: $0.531135/100 $0.529942/100
Effective Maintenance & Operation Tax Rate: $0.381135/100 $0.379942/100
Rollback Tax Rate: $0.855416/100 $0.645344/100
Debt Rate: $0.150000/100 $0.150000/100
Total debt obligation for City of Lufkin secured by property
taxes: $51,525,000

iii
CITY OF LUFKIN Vision Statement
Guided by City Council Leadership, we will be an organization
that offers an excellent quality of life for its citizens.
Our Mission
To meet the needs of the citizens.
Our Values
We will COMMUNICATE -
Throughout the organization
To create solutions
Everyone’s input is valued
We will have INTEGRITY -
We are trustworthy
We have a willingness to serve
We have a commitment to fairness
We will be held ACCOUNTABLE -
We accept responsibility for our actions and results
We will strive for TEAMWORK -
We will work together harmoniously toward common goals
We will demonstrate a strong WORK ETHIC -
We display a daily effort in applying required skills to complete assigned tasks
We will be INNOVATIVE –
We encourage and support change through seeking better ways to do our jobs

iv

v
Table of Contents
SECTION TITLE
Title Page and City Officials ............................................................................................................................ i
S.B. 656 Notice ............................................................................................................................................... ii
City of Lufkin Mission Statement ..................................................................................................................iii
TABLE OF CONTENTS .............................................................................................................................................. v
MANAGER’S MESSAGE
Transmittal Letter ............................................................................................................................................ 1
Organizational Chart ....................................................................................................................................... 7
Departmental Matrix ....................................................................................................................................... 8
GFOA Award .................................................................................................................................................. 9
READER’S GUIDE
Overview ....................................................................................................................................................... 11
Organization of the Budget Document .......................................................................................................... 12
City of Lufkin Profile .................................................................................................................................... 13
Budget Calendar Fiscal 2018 ........................................................................................................................ 17
Description of Fund Structure and City Finances.......................................................................................... 21
Budget Process .............................................................................................................................................. 27
Long-range Financial Planning ..................................................................................................................... 29
Strategic Planning ......................................................................................................................................... 31
Key Revenue Assumptions and Trends ......................................................................................................... 46
Guide to the Detail Budget Pages .................................................................................................................. 51
BUDGET OVERVIEW
General Fund Revenues................................................................................................................................. 55
General Fund Expenditures ........................................................................................................................... 60
General Fund Balance ................................................................................................................................... 62
Water/Wastewater Fund Revenues ................................................................................................................ 64
Water/Wastewater Fund Expenses ................................................................................................................ 65
Water/Wastewater Working Capital .............................................................................................................. 68
Solid Waste/Recycling Fund Revenues ......................................................................................................... 69
Solid Waste/Recycling Fund Expenses ......................................................................................................... 70
Solid Waste Working Capital ........................................................................................................................ 72
Other Funds ................................................................................................................................................... 73
Hotel/Motel Tax Fund Revenues .................................................................................................... 75

vi
Hotel/Motel Tax Fund Expenditures ............................................................................................... 76
Hotel/Motel Tax Fund Balance ....................................................................................................... 76
Special Recreation Fund Revenues ................................................................................................. 78
Special Recreation Fund Expenditures ........................................................................................... 79
Special Recreation Fund Balance .................................................................................................... 80
Pines Theater Special Events Revenues .......................................................................................... 81
Pines Theater Special Events Expenditures .................................................................................... 81
Pines Theater Special Events Fund Balance ................................................................................... 81
Zoo Building Fund Revenues.......................................................................................................... 82
Zoo Building Fund Expenditures .................................................................................................... 83
Zoo Building Fund Balance ............................................................................................................ 83
Court Security/Technology Fund Revenues.................................................................................... 84
Court Security/Technology Fund Expenditures .............................................................................. 84
Court Security/Technology Fund Balance ...................................................................................... 84
Main Street/Comm Dev Dwntown Fund ........................................................................................ 85
Animal Control Kurth Grant Fund .................................................................................................. 85
Animal Attic Gift Fund ................................................................................................................... 86
Component Units ........................................................................................................................................... 87
Economic Development Fund Revenues ........................................................................................ 88
Economic Development Fund Expenditures ................................................................................... 88
Economic Development Fund Balance ........................................................................................... 89
Lufkin Convention & Visitor Bureau Fund Revenues .................................................................... 90
Lufkin Convention & Visitor Bureau Fund Expenditures .............................................................. 90
Lufkin Convention & Visitor Bureau Fund Balance ....................................................................... 91
FUND SUMMARIES
Budget Overview ........................................................................................................................................... 93
Total Operating Budget Resources ................................................................................................................ 94
Combined Budget Resources ........................................................................................................................ 95
Combined Fund Summaries (all funds) ......................................................................................................... 96
Summary of Major Revenues and Expenditures ........................................................................................... 98
General Fund Summary............................................................................................................................... 100
General Fund Revenues by Source .............................................................................................................. 101
General Fund Expenditures by Department ................................................................................................ 103
Water/Wastewater Fund Summary .............................................................................................................. 104
Water/Wastewater Expenditures by Department......................................................................................... 105
Water/Wastewater Depreciation Fund Request ........................................................................................... 106
Solid Waste/Recycling Fund Summary ....................................................................................................... 107

vii
Solid Waste/Recycling Fund Expenditures by Department ........................................................................ 108
Solid Waste Depreciation Fund .................................................................................................................. 109
Hotel/Motel Tax Fund Summary ................................................................................................................. 110
Hotel/Motel Tax Fund Expenditures by Department .................................................................................. 110
Special Recreation Fund Summary ............................................................................................................. 111
Pines Theater Special Events Fund ............................................................................................................. 112
Zoo Building Fund Summary ...................................................................................................................... 113
Court Security/Technology Fund Summary ................................................................................................ 114
Main Street/Comm Dev Dwntwn Fund ....................................................................................................... 115
Animal Control Kurth Grant Fund Summary .............................................................................................. 116
Animal Attic Gift Shop Fund Summary ...................................................................................................... 117
Economic Development Fund Summary ..................................................................................................... 118
Lufkin Convention & Visitor Bureau Summary ......................................................................................... 119
Debt Service Fund Summary ...................................................................................................................... 120
Equipment Acquisition and Replacement Fund Summary .......................................................................... 121
DETAIL BUDGETS
GENERAL FUND .................................................................................................................................................... 123
General Government Departments ........................................................................................................................ 123
General Government ................................................................................................................................... 124
City Administration ..................................................................................................................................... 128
Finance Department .................................................................................................................................... 130
Legal Department ........................................................................................................................................ 134
Tax Department ........................................................................................................................................... 136
Human Resources ........................................................................................................................................ 137
Building Services ........................................................................................................................................ 139
Information Technology .............................................................................................................................. 143
Public Safety Departments...................................................................................................................................... 145
Police Department ....................................................................................................................................... 146
Fire Department ........................................................................................................................................... 153
Municipal Court .......................................................................................................................................... 158
City Marshal ................................................................................................................................................ 160
Inspection Services ...................................................................................................................................... 162
Emergency Management ............................................................................................................................. 164
Animal Control ............................................................................................................................................ 166
Public Works Departments ..................................................................................................................................... 168
Engineering Department.............................................................................................................................. 169
Street Department ........................................................................................................................................ 171

viii
Fleet Services .............................................................................................................................................. 177
Community Development Departments ................................................................................................................ 179
Planning and Zoning ................................................................................................................................... 180
Community Development ........................................................................................................................... 182
Cultural and Recreation Departments .................................................................................................................. 184
Parks & Recreation Department .................................................................................................................. 185
Ellen Trout Zoo ........................................................................................................................................... 189
Kurth Memorial Library .............................................................................................................................. 191
Non-Departmental ....................................................................................................................................... 193
WATER/WASTEWATER FUND ............................................................................................................................ 195
Utility Collections ....................................................................................................................................... 196
Wastewater Treatment Department ............................................................................................................. 200
Water Production Department ..................................................................................................................... 206
Water /Sewer Utilities Department ............................................................................................................. 210
Non-Departmental ....................................................................................................................................... 215
SOLID WASTE AND RECYCLING FUND ........................................................................................................... 217
Solid Waste Department .............................................................................................................................. 218
Recycling Department ................................................................................................................................. 225
Non-Departmental ....................................................................................................................................... 227
OTHER FUNDS ...................................................................................................................................................... 229
Hotel/Motel Tax Fund ................................................................................................................................. 230
Non-Departmental ....................................................................................................................................... 233
Special Recreation Fund .............................................................................................................................. 234
Non-Departmental ....................................................................................................................................... 244
Pines Theater Special Events Fund ............................................................................................................. 245
Ellen Trout Zoo Building Fund ................................................................................................................... 246
Court Security/Technology Fund ................................................................................................................ 247
Non-Departmental ....................................................................................................................................... 250
Community Dev/Dwntwn Fund .................................................................................................................. 251
Animal Control Kurth Grant Fund .............................................................................................................. 252
Animal Attic Gift Shop Fund ...................................................................................................................... 253
Equipment Replacement & Acquisition Fund ............................................................................................. 254
COMPONENT UNITS
Overview ..................................................................................................................................................... 255
Economic Development Fund ..................................................................................................................... 256
Non-Departmental ....................................................................................................................................... 259
Lufkin Convention & Visitor Bureau .......................................................................................................... 260

ix
Non-Departmental ....................................................................................................................................... 262
DEBT SERVICE
Debt Service Fund ....................................................................................................................................... 263
General Obligation Debt Service Fund ....................................................................................................... 266
General Obligation Debt Requirements ...................................................................................................... 267
General Obligation Bond Annual Debt Requirements ................................................................................ 268
Water/Wastewater Debt Requirement ......................................................................................................... 278
Notes Payable, Schedule of Requirement.................................................................................................... 278
CAPITAL IMPROVEMENTS PROGRAM
Capital Funds............................................................................................................................................... 279
Tax Supported Capital Projects ................................................................................................................... 282
Revenue Supported Capital Projects ........................................................................................................... 283
Water/Wastewater Renewal & Replacement Fund ..................................................................................... 284
Solid Waste Depreciation Fund ................................................................................................................... 285
Equipment Replacement & Acquisition Fund ............................................................................................. 286
Capital Improvements Program Summary of Completed Projects .............................................................. 288
APPENDIX
Appropriations Ordinance ........................................................................................................................... 295
Tax Rate Ordinance ..................................................................................................................................... 298
Residential Garbage Collection Charge Ordinance ..................................................................................... 300
City Financial Policies................................................................................................................................. 301
Glossary of Terms ....................................................................................................................................... 305
Chart of Accounts ........................................................................................................................................ 309
Fixed Asset Policy ....................................................................................................................................... 318
Five-Year Personnel History ....................................................................................................................... 323
Water/Wastewater Fund General & Administrative Charges ...................................................................... 328
Solid Waste & Recycling Fund General & Administrative Charges ........................................................... 329
Economic Development Fund General & Administrative Charges ............................................................. 330
Lufkin Convention & Visitor Bureau Fund General & Administrative Charges ........................................ 331

x

Page 1

Page 2

Page 3

Page 4

Page 5

Page 6

Page 7

Department Matrix
The table below reflects the correlation between departments and the service centers. Listed across the
top are the responsibility centers. Listed along the left side of the matrix are the departments, or service
centers. Appropriate areas have been shaded in distinguishing colors to indicate which departmental
responsibility centers.
Departments
Responsibility Centers
General
Governme
nt
Public
Works
Public
Safety
Community
Development Culture &
Recreation
General Fund -Major General Government City Administration Finance Legal
Tax Human Resources Building Services Information Technology Police Fire Municipal Court City Marshall Inspection Services Emergency Management Animal Control Engineering
Streets Parks and Recreation Fleet Maintenance Planning & Zoning Zoo Community Dev/Main St Library Water/Wastewater-Major Utility Collections Wastewater Treatment Water Production Water/Sewer Utilities Solid Waste Fund-Major Solid Waste Recycling Special Revenue Fund Convention Center Special Recreation Pines Theater Zoo Building Court
Security/Technology
Animal Control Kurth
Grant
Animal Attic Gift Shop Community Dev/Dwtwn Component Units Economic Development LCVB
Page 8
Page 9

Page 10

READER’S GUIDE TO THE 2017-2018
CITY OF LUFKIN OPERATING BUDGET
OVERVIEW
The READER’S GUIDE is intended to facilitate the readability of the Fiscal 2018 Operating
Budget by the citizens of Lufkin. It is designed to enhance the effectiveness of this document as
a communications device. The Introduction section includes the City Manager’s letter of
transmittal to the City Council. Included in this section are the following subjects:
Organization of the Budget Document
City of Lufkin Profile
Description of Fund Structure and City Finances
The Operating Budget Calendar
The Budget Process
Long-Range Financial Planning
Strategic Planning
Key Revenue Assumptions and Trends
Guide to the Detail Budget Pages
Page 11

ORGANIZATION OF THE
BUDGET DOCUMENT
A brief summary of the information contained in the various sections of the budget document is
outlined below:
The MANAGER’S MESSAGE is a formal transmittal letter designed to summarize key budget
decisions and major initiatives of the Fiscal 2017 Budget.
The READER’S GUIDE provides information pertaining to the various sections located in this
document. This section provides demographic and local economic information about the City of
Lufkin, describes the fund structure of the City, explains the budget process and budget calendar,
describes the key revenue assumptions, explains the strategic planning process, describes the
process of adopting and amending the budget, and explains the detail budget pages.
The BUDGET OVERVIEW discusses major revenue and expenditure projections, including
primary strategies planned for operations in Fiscal 2018 and the financial plan for achieving
them. Also, a summary of the ending working capital for each fund is provided along with a
discussion of how the current budget relates to the City’s Financial Policies.
The FUND SUMMARIES section provides historical and graphical comparisons and budgeted
projections for all revenues and expenditures within each fund.
The DETAIL SECTION provides the budget detail for each department and departmental
division within the appropriate fund category. The budget detail includes financial and personnel
data, departmental/divisional mission statements, descriptions of service, objectives and
performance measures.
The DEBT SERVICE section provides a listing of the City’s outstanding general obligation and
Water/Wastewater Fund debt.
The CAPITAL IMPROVEMENTS PROGRAM section summarizes the Fiscal 2018 Capital
Improvements Program (CIP) emphasizing the impact of capital projects on the operating
budget.
The APPENDIX contains ordinances adopting this budget, establishing the tax rate for the
current Fiscal year, and raising residential garbage collection charges, provides a copy of the
City Financial Policies, a glossary of frequently used terms, chart of accounts, personnel
historical comparisons and General and Administrative (G&A) allocation calculations.
Page 12

CITY OF LUFKIN PROFILE
The City of Lufkin is located on US Highway 59, 120
miles north of Houston, 166 miles southeast of Dallas and
110 miles southwest of Shreveport, Louisiana. As the
County Seat of Angelina County, Lufkin enjoys a strong
retail, commercial and industrial base. Known as a
progressive city, Lufkin offers its citizens an abundance of
recreational opportunities. Its natural resources (including
pine and hardwood forests, lakes and rivers), provide
opportunities for hunting, fishing and water sports. A rich
heritage, strong civic pride and a government committed
to community development make Lufkin the perfect place
for commercial and residential life.
Climate
Average temperature in January - low 38º, high 59º.
Average temperature in July - low 72º, high 94º.
Average precipitation – 38.9 inches per year.
Population Lufkin is the commercial hub of a ten county rural market region, serving over 300,000
residents. Population in the county during the last thirty-five years has grown by thirty-eight
percent, twenty-seven percent growth occurred in the City of Lufkin. The following table
reflects population growth for Lufkin and Angelina County over the last four decades.
Population Growth
1980 1990 2000 2010 2015
City of Lufkin 28,562 30,206 32,709 35,067 36,333
Angelina County 63,987 69,884 80,130 86,771 88,255
City Government
The City of Lufkin is a Home Rule city operating as a Council-Manager form of government.
The Council consists of a Mayor and six council members. The City provides fire and police
protection. The City’s current ISO Public Protection Classification is four based on scale of one
to ten with one being the best. Standard and Poor’s and Moody’s Investment Service have rated
the City’s General Obligation bonds AA- and Aa2 respectively, and the Revenue bonds are rated
AA- and Aa2.
Page 13
Education
The Lufkin Independent School District operates twelve elementary schools, one junior high
school, and one high school. Total LISD enrollment is 8,232 students. One Charter school and
three private schools also serve the area.
Angelina College, a two-year college established in 1968, offers exemplary nursing and technical
training programs to its students. Fall 2016 enrollment totaled approximately 5,927 of which
53% are from outside the county and 44% are full-time students. In addition, there are 707
enrolled in Community Services classes offered by the College in 2016-2017.
Stephen F. Austin State University, located in Nacogdoches, 20 miles north of Lufkin, is a four-
year university offering courses in many different fields. Total enrollment is approximately
12,954 students for the fall 2017 semester.
Community Facilities and Attractions The Pitser Garrison Convention Center is located on the corner of 2nd and Paul streets offering
meeting, banquet and concert facilities currently with a capacity of 2,000 expanded to provide
disaster sheltering.
Kurth Memorial Library, located on Raguet Street in Lufkin, houses the Ora McMullen
Genealogical Collection.
Ellen Trout Zoo, located on the north side of Loop 287 at Ellen Trout Drive, is an impressive,
accredited zoo facility featuring many exotic animals.
Downtown Lufkin is the site of many dining establishments, unique retail shops and antique
collections. Main Street is an integral part of the Downtown experience hosting events
throughout the year.
The Texas Forestry Museum, located at 1903 Atkinson Drive, and the Museum of East Texas,
located across from the Convention Center, provide a pictorial and narrative history of the East
Texas area.
The Pines Theatre is a 431-seat multi-use venue operated by the City of Lufkin in the historic
downtown district. The Pines offers a variety of programming to entertain patrons of all ages.
Recreation
Parks and recreational opportunities include ten public parks, one swimming pool, 2 spray play
pads, three golf courses, and 14 tennis courts.
Lake Sam Rayburn, located southeast of Lufkin, is the largest manmade lake in Texas with 560
miles of shoreline impacting five counties.
Lufkin is nestled between two National forests; Angelina National Forest located southeast of
Lufkin impacts four counties and Davy Crockett National Forest located west of Lufkin impacts
Page 14

two counties. The forests provide plenty of fresh air and spaces for hunting, fishing, camping,
swimming, hiking and horseback riding.
US Corps of Engineers also has nine facilities for recreational use within an easy 50 mile drive
of Lufkin. The activities available at each facility vary but the following activities are available
at one or more: camping, swimming, fishing, hunting, canoeing, kayaking, hiking, biking, bird
watching, and horseback riding. Many of the facilities provide access to Lake Sam Rayburn.
Neches Davy Crockett Paddling Trail is a 9.2 mile stretch of the Neches River well known for
the Neches River Rendezvous, an annual float trip hosted by the Lufkin/Angelina County
Chamber of Commerce and the Lufkin Convention and Visitors Bureau.
This river segment is great for a family outing with a float time of 3 to 6 hours (depending on
water level, flow rate and wind speed) even though there are occasional logjams and snags to
avoid, especially when water is low. A variety of water types including quiet pools and several
small riffles are present. There are no man-made obstructions.
Golf facilities include Crown Colony Golf Course and the Lufkin Country Club. The Crown
Colony course is rated as one of the top destination golf course in Texas by Golf Week in 2004.
The Lufkin Country Club opened in 1935 offers a scenic 18-hole course.
Utilities Several retail electric providers provide electric service to the City and surrounding area offering
ample electric power supply at competitive rates to residential, commercial and industrial
customers.
Oncor Electric Delivery provides electric transmission and distribution services to the area.
Deregulation of the electric industry required TU Electric to split its corporate structure into two
companies: a regulated company (the wires portion, i.e. Oncor); and a deregulated company (the
electric production portion, i.e. TXU Energy).
CenterPoint Energy provides natural gas service to both residential and commercial/industrial
customers within the City.
The City of Lufkin provides water, sewer, solid waste and recycling services to all customers
within the city.
Consolidated Communications Telephone Company offers a 100% digital switching, fiber optic
network with SONET.
Suddenlink Cable Company provides television, internet, phone, and security services for
businesses as well as residential customers.
Transportation
Private airport service is available at Angelina County Airport, which offers a 100 ft. by 5,400 ft.
lighted, grooved asphalt runway. Nine over-the-road carriers serve the area. The Angelina &
Page 15

Neches River and Union Pacific Railroads provide rail service. The District provides local bus
transportation to various locations within the city as well as commuter service to Nacogdoches
and Diboll.
Taxation
The Angelina County Appraisal District appraises property within Angelina County. Ad
valorem taxes are assessed per $100 of assessed value. Tax rates of the various taxing entities
for Fiscal 2018 are reflected in the following table.
Fiscal 2018 Ad Valorem Tax Rates
Taxing Entity Tax Rate per $100 Assessed Value
Angelina County $0.458803
City of Lufkin $0.531135
Lufkin Independent School District $1.213000
Angelina College $0.180992
Total $2.383930
41.97
Major Employers
The ten largest employers within the county employ 26.50% of the workforce in the area. The
ten largest employers are reflected in the following table.
Major Employers of Angelina County
# of Employees Rank Percentage of Total
City Employment Lufkin ISD 1000+ 1 10.4%
Pilgrim’s Pride 1000+ 2 8.11%
Brookshire Brothers/Polk Oil 1000+ 3 7.04%
Lufkin State Supporting
Living Center
1000+ 4 7.04%
CHI St. Lukes Health
Memorial
1000+ 5 7.04%
Woodland Heights Medical
Systems
500-999 6 3.09%
Georgia Pacific 500-999 7 3.70%
City of Lufkin 400-500 8 3.10%
Walmart 400-500 9 3.00%
Angelina County 400-500 10 2.70%
Page 16

CITY OF LUFKIN
FY2018 BUDGET PREPARATION
CALENDAR OF EVENTS DATE ACTION RESPONSIBILITY DESCRIPTION
Scheduled as
needed
HTE Training Training will be held in the
department requesting the training.
April 25, 2017 Budget Kickoff
Room 102 @11am
Department Heads,
Applicable Staff and
Budget Team
Initial budget meeting to establish
guidelines for the FY2018 budget
process, budget format, requirements,
and distribute budget instruction
manuals and materials.
May 16, 2017 Send Budget
Review Schedule to
Department Heads
Laura Flores Schedule of meetings will be
developed and sent to department
heads.
May 19, 2017 Draft FY2018
Departmental
updated forms due
to Finance Dept.
Department Heads
and applicable staff
Draft FY2018 Departmental Budget
forms due to Finance Dept. including
UPDATED Mission Statements,
Description of Services, Work
Program, and Performance Measures.
Departmental Budget Pages will be
generated, reviewed and returned for
corrections during Departmental
Budget Reviews.
May 19, 2017 FY 2017 Revised
Revenue Estimates
and Budget
Expenditure
Estimates
Department Heads
and Applicable Staff
Completed Revenue estimates and
current year annualized expenditures
are due in HTE from responsible
departments.
May 19, 2017 Completed FY2018
Revenue Estimates
and Budget Drafts
and Supplemental
Requests
Finance Department Departmental FY2018 budget drafts
due to be completed in HTE. Finance
will begin to prepare for budget
review.
May 22, 2016 Change Security All Departments Change Authority in HTE so that no
further changes can be made to the
FY2018 Revised Revenues and
Expenditures and FY2018 Proposed
Revenue Estimates and Expenditures
by the Departments.
Page 17

May 26, 2017 Computer Setup Finance Department Coordinate Computer Setup for Room
202 for Budget Reviews.
May 30 – June
10, 2017
Departmental
FY2018 Budget
and Supplemental
Request Reviews
Rm 202
City Manager,
Department Heads,
Staff, & Budget Team
Staff and Budget Team to meet with
each Department Head to review
departmental budgets. Draft
Departmental Budget Pages will be
returned for corrections at each
Departmental Review.
June 16, 2017
Completed
FY2018
Departmental
Budget Page Due
to Finance Dept.
Department Heads
and Applicable Staff
Completed FY2018 Departmental
Budget Page due to Finance Dept.
including UPDATED Mission
Statements, Description of Services,
Work Program, and Performance
Measures.
July 26, 2017 Council Budget
Workshop
City Council & City
Staff
Council review of departmental
budget requests
July 25, 2017
(by July 31,
2017)
Receive Certified
Property Values
Chief Appraiser
Complete Ad Valorem revenue
projections for budget.
August 1, 2017 File Draft Budget Budget Officer A copy of the Draft Budget Book is
filed with the municipal clerk and is
available for inspection by the public
and published on the City’s website.
August 1, 2017 Set public hearing
on Draft Budget
City Council Council sets date for public hearing on
budget.
August 4, 2017 Effective and
Rollback Tax
Rates Published
Tax
Assessor/Collector
/Finance Director
The effective tax rate for fiscal 2017
is published in the local newspaper.
August 4, 2017 Publish notice of
budget hearing
Budget team Publish notice of budget hearing in
local newspaper and on the City of
Lufkin website.
August 15, 2017 Budget
Submission to
Council
Public Hearing*
Discussion on Tax
Rate*
City Manager
City Council
Draft Budget and transmittal letter
submitted to City Council.
A public hearing is held by Council to
receive public input regarding the FY
2017/2018 Operating Budget.
If proposed tax rate exceeds the
effective rate or rollback rate take
Page 18

record vote.
August 27, 2016 Notice of
Proposed Tax
Rate
City
Secretary/Finance
Director
1st ¼ Page notice in newspaper,
Website and TV. Must be published
at least 7 days before public hearings.
Must run 60 second notice on public
TV at least 5 times per day between 7
am and 9 pm for at least 7 days.
September 5,
2017
1st Reading of
Budget
Ordinance*
1st Reading of
Solid Waste
Ordinance*
1st Reading of the
Proposed Tax
Rate
City Council First reading of Budget Ordinance.
First reading of proposed ordinance
amending Code of Ordinances making
changes to raise the rates for
residential garbage collection and
providing an effective date.
First reading of proposed tax rate.
September 19,
2017
2nd Reading of
Budget
Ordinance*
2nd Reading of
Solid Waste
Ordinance*
2nd Reading of the
Proposed Tax
Rate*
City Council Second reading of Budget Ordinance
and adoption.
Second reading of proposed ordinance
amending Code of Ordinances making
changes to raise the rates for
residential garbage collection and
providing an effective date, and
adoption.
Seconding reading of the proposed tax
rate and adoption.
December 5,
2017
Distribution of
Final Budget
Document
Budget Team Final Budget Document published and
distributed.
* Requires 72 hour Open Meeting Notice
Page 19

Page 20

DESCRIPTION OF FUND STRUCTURE
AND CITY FINANCES
Governmental accounting systems are operated on a “fund” basis. A fund is defined as a Fiscal
and accounting entity with a self-balancing set of accounts recording cash and other financial
resources, together with all related liabilities and residual equities or balances, and changes
therein, which are segregated for the purpose of carrying on specific activities or attaining certain
objectives in accordance with special regulations, restrictions or limitations. The funds
contained in this budget are segregated into two Fund Types: Governmental Funds and
Proprietary Funds. Governmental funds are used for most government activities while
proprietary funds are based on the premise that the city service will be conducted as a business
with user fees covering expenditures. Listed below are descriptions of the funds maintained by
the City and included in this document.
This budget was developed and will be implemented and monitored on a modified accrual basis
with some exceptions as listed below in the section titled “Comparison between Budget and
Financial Reporting”. The proprietary funds budget was developed and will be implemented and
monitored on an accrual basis of accounting in most cases. Exceptions are listed below in the
section titled “Comparison between Budget and Financial Reporting”.
Budgetary control is maintained at the category, or object class, level (personnel services,
supplies, maintenance, etc.) for each department. Open encumbrances lapse at September 30th of
each year. Those encumbrances carried forward to the next fiscal year are re-appropriated in the
subsequent year and the budget is increased to reflect these carried forward encumbrances.
Unspent and unencumbered appropriations lapse at the end of the Fiscal year.
GOVERNMENTAL FUNDS
General Fund – accounts for all financial resources except those to be accounted for in another
fund. Property and other taxes, franchise fees, fines, licenses and fees for services provide the
resources necessary to fund the typical municipal services such as Public Safety, Parks and
Leisure, Administration, Public Works and Community Development activities. The General
Fund budget is prepared on a modified accrual basis wherein the City’s obligations, due within
the current budget year, are budgeted as expenditures, but revenues are budgeted only to the
extent they will be available and measurable.
Special Revenue Funds – account for the proceeds of specific revenue sources that are legally
restricted to expenditures for specified purposes. The City budgets eight special revenue funds.
The Hotel/Motel Tax Fund receives its primary revenues from hotel/motel tax revenues. The
Ellen Trout Zoo Building Fund receives admissions fees and donations from Zoo patrons to be
used specifically for improvements and exhibits to the Zoo. The Special Recreation Fund
receives user fees from athletic associations and leagues for maintenance of the athletic fields
and facilities. The Pines Theater Special Events Fund is used to account for the financial
transactions associated with a series of cultural events to be held at the recently renovated
Page 21

historic Pines Theater. The Municipal Court Security/Technology Fund receives a set fee from
each fine collected in Municipal Court. These funds are used to purchase security equipment as
well as salaries for security employees and to purchase computer equipment and software for the
Municipal Court. The Main Street/Community Development Downtown Fund is supported from
events, entertainment and festivals that take place in the City’s downtown area. The Animal
Control Kurth Grant Fund is supported solely by the Kurth Foundation. These funds are to be
used for the support of the Kurth Memorial Animal Shelter. The Animal’s Attic Gift Shop
revenues are strictly donations. These contributions are used to purchase vaccines and medicines
for animals in the Shelter. The special revenue funds are governmental fund types and therefore
these budgets are prepared on a modified accrual basis as outlined in the General Fund section
above.
Debt Service Fund – accounts for the accumulation of monies that are set aside to pay principal,
interest and fees on debt incurred through the sale of bonds and other debt instruments. Proceeds
from these tax and revenue supported bonds are used to make long-term capital improvements to
streets, drainage systems, water, wastewater and solid waste projects. The Debt Service Fund is
classified as a governmental fund type and its budget is therefore prepared on a modified accrual
basis as stated in the General Fund section above.
Capital Project Funds – account for financial resources to be used for the acquisition or
construction of major capital facilities other than those financed directly by proprietary funds.
The Capital Project Funds are classified as governmental fund types and their budgets are
therefore prepared on a modified accrual basis as previously stated in the General Fund section.
Component Units - The Economic Development Fund receives its revenue from a portion of the
sales taxes collections received by the City. These funds are for the economic development and
promotion of business within the City. The Lufkin Convention and Visitor Bureau receives the
majority of its funding from the Hotel/Motel Tax Fund. These funds are to promote tourism and
create maximum hotel occupancy within the City of Lufkin.
PROPRIETARY FUNDS
Enterprise Funds – account for operations that are financed and operated in a manner similar to
private business in that the cost of providing goods and services (expenses, including
depreciation) to the general public be financed or recovered primarily through user charges; or
where the governing body has decided that periodic determination of revenues earned, expenses
incurred, and/or net income is appropriate for capital maintenance, public policy, manage
control, accountability or other purposes. The Water/Wastewater Fund and the Solid Waste &
Recycling Fund are enterprise funds maintained by the City of Lufkin. The budget basis for
enterprise funds is on an accrual basis, with the exceptions noted earlier. Expenses of these
funds are recognized as encumbrances when a commitment is made. Revenues are recognized
when they are obligated to the City (for example, water user fees are recognized as revenues
when service is provided).
Page 22

Internal Service Fund - The Equipment Acquisition and Replacement Fund revenues are
transferred from the departments and are accrued from the depreciation of equipment.
Accumulated funds are to be used to replace and purchase new equipment, vehicles and
machinery.
Page 23

Funds Structure
All Funds
(Budgeted as part of Budget Process)
Governmental
General Fund
(FD 101)Special Revenue
Hotel/Motel Tax
(FD 206)
Special Recreation
(FD 221)
Pines Theater Special Events (FD 225)
Zoo Building
(FD 226)
Court Security / Technology
(FD 228)
Animal Control Kurth Grant (FD 241)
Animal Attic
(FD 242)
Community Dev/Dwntn(FD234)
Debt Service
(FD 401)
Component Units
Economic Development
(FD 290)
Lufkin Convention & Visitor Bureau
(FD 295)
Proprietary
Enterprise
Water / Wastewater
(FD 501)
Water / Wastewater Renewal &
Replacement (FD 380)
Solid Waste / Recycling (FD 548 )
Internal Service
Equipment Acquisition (FD 641)
Page 24

All Funds - Budgeted separately throughout
the year / project
Governmental
Special Revenue
Police Forfeiture Funds (FD 227)
Police Grants
( FD 250)
Insurance Loss Fund (FD 217)
Capital Projects
Street Construction
(FD 300)
Convention Center
(FD 308)
2010 Capital Improvements
(FD 313)
Proprietary
Internal Service
Active Group Health Insurance
(FD 615)
Retiree Group Health Insurance
(FD 616)
Enterprise
Solid Waste / Recycling
Depreciation Fund
(FD 348)
Water / Wastewater
Revenue Supported Debt (FD 451)
2009 Certificate of Obligation Fund
(FD 357)
Page 25

COMPARISON BETWEEN BUDGET AND FINANCIAL REPORTING
The Comprehensive Annual Financial Report (CAFR) of the City shows the status of the City’s
finances on the basis of GAAP. In most cases this conforms to the way in which the City
prepares its budget. Exceptions are as follows:
A Compensated absences liabilities that are expected to be liquidated with expendable
available financial resources are accrued as earned by employees (GAAP) as opposed to
being expended when paid (Budget).
B General and Administrative charges (G&A) are recognized as direct expenses of the
Enterprise Funds, Water/Wastewater and Solid Waste/Recycling and Component Units,
Economic Development Fund and Lufkin Convention & Visitors Bureau on a GAAP
basis as opposed to being accounted for and funded by operating transfers into the
General Fund from the Water/Wastewater and Solid Waste/Recycling Enterprise Funds
and Economic Development component unit on the Budget basis.
C Principal payments on long-term debt within the Enterprise Funds are applied to the
outstanding liability on a GAAP basis, as opposed to being expended on a Budget basis.
D Capital outlay within the Enterprise Funds are recorded as assets on a GAAP basis and
expended on a Budget basis
E Depreciation expense is recorded on a GAAP basis only.
F The CAFR shows fund expenses and revenues on a GAAP basis.
G Interest income within the Enterprise Funds recorded on a GAAP basis in the CAFR but
recorded in the budget in the period in which the interest is expected to be received.
H Gains and losses on the disposal of fixed assets are recorded on a GAAP basis only.
Page 26

BUDGET PROCESS
DEFINITION AND AUTHORITY The budget is an essential element of financial planning, control and evaluation for the City and
reflects and supports the policies and direction provided by Council. Budget appropriations are
matched with anticipated revenues to fund expenditures necessary to provide citizen services
while maintaining unencumbered fund balances consistent with Council Financial Policies. The
City Charter establishes the City’s Fiscal year as October 1st through September 30th. By
Charter, the City Manager is required to submit to Council, at least forty-five days prior to the
end of the Fiscal year, a proposed budget reflecting a complete financial plan for the ensuing
Fiscal year. The Council is required to adopt the budget no later than the twenty-seventh day of
September.
BUDGET PREPARATION The City’s budget process consists of four major phases that are followed in order to obtain the
desired results. They include:
1. Planning/Preparation
2. Administrative Review
3. Presentation/Approval
4. Execution/Monitoring
These four phases comprise the budget cycle:
BUDGET PLANNING/PREPARATION The Planning/Preparation phase of the budget cycle begins in January. At this point the
administrative staff begins formulating goals and assessing needs for the coming budget year.
Once these goals are agreed upon and needs have been identified, budget instructions are created
for departments to follow. These instructions, departmental budget files, budget forms, and other
budget information are distributed to department heads in a “Budget Kickoff Meeting” that is
held in the month of April. Departmental budgets are completed and returned to the Finance
Department by a specific date in mid-May. Strategic planning retreat is held off-site in mid-July
for council members, city manager and department heads to address capital improvements and
program changes that may impact department operating budgets.
BUDGET REVIEW Administrative Review occurs in late May/early June once departmental budgets are returned to
the Finance Department. They are reviewed for content and mathematical accuracy by Finance
staff. Necessary corrections and changes are made and departmental budgets are forwarded to
administrative staff for review. The administrative staff schedules meetings with each individual
department head. At this meeting they turn in and justify departmental work plans for the
coming year and explain how their plans accomplish Council priorities as well as present
justification for their requests. These Departmental budgets are then reviewed by the City
Manager, where suggestions for improvement are made; items are eliminated that do not meet
Page 27

effectiveness tests, and whether supplemental requests are a necessity for the upcoming budget
year.
BUDGET PRESENTATION/ADOPTION The adoption process begins with staff presentation to Council of an overview of the revenues,
expenditures and fund balances of each operating fund of the City, a summary of major changes
such as rate and fee increases/decreases, and recommendations regarding organization-wide
salary adjustments. The Council is provided a detail listing of all departmental requests and
significant changes. At this time, Council decisions are made based on previous performance
and overall necessity. During the month of August and September, City Council holds public
hearings on the budget that allow citizens to voice their opinions and concerns on all aspects of
the preliminary budget. After citizen input has been received, staff prepares the final budget and
City Council formally adopts the budget prior to the 27th of September. Should the Council not
take action on or prior to the twenty-seventh day of September, the budget, as submitted, is
deemed adopted by the Council.
BUDGET EXECUTION/MONITORING The budget process then moves into the Execution/Monitoring phase. This phase requires the
administrative staff to review the adopted budget and note any policy or program changes
Council may have made that differ from the preliminary budget. These are reviewed and
discussed with department heads. The adopted budget becomes effective on October 1st for the
new Fiscal year. During the ensuing twelve-month period, the budget is under review to ensure
that spending levels are maintained at, or below, the budget allowances.
BUDGET AMENDMENT The City Charter, Article V, Section 3, Appropriations, provides for a budget amendment
process. It states, in part,
“The Council may transfer any unencumbered appropriation balance or portion
thereof from one office, department, or agency to another, at any time. The City
Manager shall have authority, with council approval, to transfer appropriation
balances from one expenditure account to another within a single office,
department or agency.”
Thus, if during the year situations arise whereby additional funds are needed by a department; a
Budget Amendment Request is prepared and submitted to Council for approval stating the
reasons that additional funds are required.
If only line item changes are required within a departmental budget, the department head submits
a Budget Adjustment Request to the City Manager for approval. The Request reflects the
account(s) from which funds are requesting to be transferred and the account(s) to which funds
will be transferred. Reasons for the transfer are stated, and the City Manager approves or
disapproves the request. All approved changes are forwarded to the Finance Department for
entry into the financial system.
Page 28

LONG-RANGE FINANCIAL PLANNING
The City’s commitment to long-term fiscal stability has been challenged over the past several
years due to the economic downturn and loss of sales tax revenue, which currently makes up
approximately 40% of the General Fund budget. The City has managed to overcome the budget
deficits with contingency plans such as reducing expenditures and by delaying hiring vacant
positions by 90 days. Through this contingency the City has maintained a strong fund balance
with excess of $ 1,065,967 over required reserves.
Developing the City of Lufkin long-range plans requires several steps to project revenues and
expenditures that extends beyond the budget year.
Step 1: Mobilization Phase. In this phase, the City will develop its financial plan for the future.
Planning includes:
a. Assessing Economic Conditions
b. Identifying City Spending Priorities
c. Creating Economic Growth
Step 2: The Analysis Phase. In this phase, the City will develop long-term projections. The
Five-Year Forecast estimate a 2% growth in overall revenues and expenditures. The following
chart outlines the City’s forecast of General Fund revenues and expenditures for budget Fiscal
2018 and projected for Fiscal 2019 through Fiscal 2023. The projections show the potential for
challenging future budget preparation, as growth in expenditures is projected to outpace growth
in revenues.
Step 3: The decision Phase. In this phase, the City will create strategies to create economic
growth based upon the scope and analysis previously done.
Step 4: The execution Phase. In this phase, the City along with council members and staff will
put the long-range planning into place.
It is important to realize that the projections represent conservative growth, assuming that City
services remain at their current service levels with existing staff and operating budget.
Projections include cost escalation for expenditures to accurately represent the reality the City
will face if no further budget modifications are made.
The City has the possibility of significant growth to the tax base, franchise fees and water sales
with the construction of a large power plant. It is estimated that construction will take
approximately two years. Additional boost to the economy during construction may be seen but
has not been a consideration in long-range planning. Upon completion of the project, the City’s
goals and long-range planning could change significantly with the potential revenue increase.
Page 29

FY2016 FY2017 FY2018 FY2019 FY2020 FY2021 FY2022 FY2023
Actual Adopted Adopted Projected Projected Projected Projected Projected
Taxes $20,275,604 $20,781,382 $20,810,288 $21,226,494 $21,651,024 $22,084,044 $22,525,725 $22,976,239
Franchise taxes 2,466,089 2,397,000 2,330,000 2,376,600 2,424,132 2,472,615 2,522,067 2,572,508
Licenses & permits 298,120 308,970 245,700 250,614 255,626 260,739 265,954 271,273
Charges for service 2,656,647 2,686,765 2,674,050 2,727,531 2,782,082 2,837,723 2,894,478 2,952,367
Fines & forfeitures 1,170,750 1,095,675 1,096,175 1,118,099 1,140,460 1,163,270 1,186,535 1,210,266
Miscellaneous revenue 503,785 388,810 368,760 376,135 383,658 391,331 399,158 407,141
Inter-governmental revenue - 19,000 22,956 -
Sub-Total 27,370,995 27,677,602 27,547,929 28,075,472 28,636,982 29,209,722 29,793,916 30,389,794
Intra-governmental revenue 4,792,877 5,403,610 5,088,988 5,190,768 5,294,583 5,400,475 5,508,484 5,618,654
Total Revenues & Transfers $32,163,872 $33,081,212 $32,636,917 $33,266,240 $33,931,565 $34,610,196 $35,302,400 $36,008,448
Personnel services 24,123,945$ 25,024,638$ 24,962,692$ 25,461,946$ 25,971,185$ 26,490,608$ 27,020,421$ 27,560,829$
Supplies 1,818,201 1,708,887 1,614,276 1,646,562 1,679,493 1,713,083 1,747,344 1,782,291
Equipment maintenance 1,860,550 2,091,037 1,984,741 2,024,436 2,064,925 2,106,223 2,148,347 2,191,314
Miscellaneous services 4,169,481 4,228,376 4,243,186 4,328,050 4,414,611 4,502,903 4,592,961 4,684,820
Sundry charges 147,150 145,250 145,750 143,944 143,944 143,944 143,944 143,944
Debt service 39,799 90,881 90,882 30,000 30,000 30,000 30,000 30,000
Transfers out 217,500 220,289 370,056 225,000 225,000 225,000 225,000 225,000
Capital outlay - - - - - - - -
Total Operating Expenditures $32,376,626 $33,509,358 $33,411,583 $33,859,937 $34,529,157 $35,211,761 $35,908,017 $36,618,199
Surplus(Deficit) (212,754) (428,146) (774,666) (593,697) (597,592) (601,565) (605,617) (609,751)
Surplus(Deficit) as Percentage of
Operating Budget -0.66% -1.29% -2.37% -1.78% -1.76% -1.74% -1.72% -1.69%
GENERAL FUND -FIVE YEAR FORECAST
FY2019-2023
Page 30

STRATEGIC PLANNING
The Lufkin City Council is elected to set policy and make decisions regarding City services to its
citizens. In so doing, the Council must set priorities they believe are in the best interest and
represent the desires of the citizens they represent. A retreat is held, early in the budget process
each year, in which Council and staff discuss concerns, short and long term needs, philosophies
and policies. Through these planning sessions and discussions, Council is able to develop a
prioritized ranking of those needs they believe to be most important to the community and
provide staff direction with which to formulate the coming year’s budget.
The first Council Retreat was held in May 1999. The focus of the retreat was to identify
community needs, establishing priorities, developing goals and identifying objectives for
meeting those goals. Primary to this process was adoption of a continuing capital improvements
program (CIP) tailored to address specific goals. Subsequently, these goals were reorganized
and non-CIP items were added to create a more complete strategic planning model. As certain
projects were completed, unforeseen significant needs were moved to the forefront and other less
critical projects were delayed. Ultimately, the once five-year CIP has evolved into a continuous
plan which is updated each budget year.
In Fiscal 2018 the City of Lufkin has initiated a vision for the future of Lufkin. The
Comprehensive Plan is in phase one, The Baseline Analysis, of the process.
The Comprehensive Plan is developed in four phases:
1. Baseline Analysis: The starting point for plan development. Demographic and
socioeconomic data are collected along with data on land use, community form, transportation,
and community services. This starting point provides context for plan recommendations and
serves as a benchmark for measuring plan implementation.
2. Comprehensive Plan Development: The heart of the Comprehensive Plan is the Future Land
Use Map which identifies how and where the community should grow. This map is supported
by the Plan Elements: Transportation and Mobility, Local Prosperity, Parks and Recreation,
Community Facilities and Services, Quality of Life, Natural Resources, and Cultural Resources.
3. Implementation Strategy Development: This element includes a Short Term Work Plan, a
matrix outlining specific projects and steps (and their costs) the City and City partners intend to
take over the firs few fiscal years of plan implementation.
4. Adoption / Implementation / Monitoring: As an official policy document, the Plan is adopted
by the City Council. Following adoption, the plan is implemented according to the
Implementation Strategy. Annual monitoring will ensure that the plan remains relevant and
meets the needs of the community.
The goals and objectives including those originally established by Council in 1999, objectives
covered in subsequent conferences, and aspects that staff feels are imperative to the overall
fitness of the city are listed in the following pages. This is the status of these projects as of Fiscal
year-end 2017. Completed Objectives are in blue.
Page 31
Goal: Improve drainage and correct problems within the City of Lufkin
Objectives:
1. Continue to monitor development within the City in order to insure
that all drainage requirements are being met.
2. Maintain all regional detention facilities and remove volume as needed
to meet the needs of new development.
3. Evaluate possible construction of two regional detention ponds.
Status:
Objective 1 All new developments are required to complete and submit a drainage
study if the impervious improvements exceed 14,000 square feet or if
under that amount, there has been isolated flooding situations. All
drainage studies are maintained by the Engineering Department and
may be utilized by other developers as needed.
Objective 2 Developers are allowed to purchase volume from the regional detention
facilities if the development is within close enough proximity of the
pond. This practice helps to offset the cost of on-site detention and
assists the developer in not having to use valuable developable land for
detention. The developer submits the standard drainage study and then
requests that they be allowed to purchase volume from that pond within
the closest tributary. The City then contracts out the actual removal of
volume from the pond as required.
Objective 3 The Engineering Department will continue to evaluate possible funding
sources, whether through CIP monies or grants provided through
FEMA.
Goal: Develop and implement street improvements for better mobility within the city.
Objectives:
1. Conduct inventory of all streets and classify by quality standards Street
Improvement Plan. This is a perpetual project.
2. Prepare recommendations for street overlay program and submit to
Council by March of each year.
3. Implement improvements to the central business district that were
approved in the TEA 21-grant award.
4. Continue schedule of activities for street improvements approved by
voters in the 2001 May election.
5. Continue schedule of activities for street improvements approved
during 2010 & 2012 capital improvements planning sessions.
Status:
Objective 1 An inventory of all streets has been completed utilizing the US Corp of
Engineers computer program, “MicroPaver”. A pavement condition index
Page 32

was developed for each street. This activity is now an ongoing part of the
street maintenance program and an inventory is completed every two
years.
Objective 2 A prioritized list of street construction is currently being developed using
two categories – reconstruction and overlay. This list is presented to
Council in March each year.
Objective 3 The Downtown Sidewalk and Improvement Project – funded by Texas
Department of Transportation through the T21 grant was completed in
Fiscal 2006
Objective 4 Voters approved a bond proposal of four streets in May 2001. The streets
include Abney Avenue, Angelina Street, Lotus Lane, and Whitehouse
Drive. Angelina construction was completed in 2004. Abney Street
construction was completed in April 2006. Whitehouse Drive
construction was finished in June 2007. Lotus Lane was completed in
2009.
Objective 5A Street projects identified to be funded by 2010 bond issue proceeds are
Columbine Drive storm drain replacement, Carrol Avenue bridge
replacement, Fuller Springs Drive street reconstruction, and Sayers Street
reconstruction. Design and survey phase has begun on projects and is
funded by proceeds from the reimbursement resolution.
Objective 5B Tentative street projects identified to be funded by 2012 bond issue
proceeds are Joyce Lane Reconstruction, North Brentwood Extension,
Knight Avenue Reconstruction, Champions Drive Reconstruction,
Carriage Drive Reconstruction, Moffett Road Reconstruction, Pershing
Avenue Reconstruction, Third Street Reconstruction, Windsor Drive
Reconstruction, Jones Street Reconstruction, Hill Street Reconstruction,
Spence Street Reconstruction, Tom Temple Street Reconstruction, and
Atkinson Drive Street Reconstruction. Also, a Monopole Replacement
and the Fire Department Storage building.
Objective 5C Tentative street projects identified to be funded by 2015 bond issue
proceeds are Whitehouse Drive West and McHale/Chester streets culver
replacement.
Goal: Provide safe, secure environment for citizens of Lufkin.
Objectives:
1. Provide vehicular rotation schedule for public safety vehicles.
2. Replace fire rescue pumpers and provide rotation schedule for
ambulance replacements through CIP planning.
Page 33
3. Expand community and neighborhood policing projects on an ongoing
basis.
4. Coordinate with Angelina College in developing a fire academy for
training new personnel and recruits.
5. Increase fire staff to accommodate the two man in-two man out rule
established by Texas State Legislature.
6. Construct new Fire Station on Old Union Road. Relocate existing Fire
Station #4 to a more efficient area.
7. Replacement of Fire vehicles in a timely manner to avoid costly
maintenance and downtime from worn out equipment.
8. Acquire grants to assist with the purchase of new Fire equipment for
emergency situations.
9. Combine and relocate Fire Station #1 and Fire Station #3 to improve
operational efficiency, effectiveness and possibly upgrade the ISO
rating from 4 to an ISO rating of 3 or 2.
10. Raze and reconstruct Fire Station #5 at present location to provide for
future organizational growth and add functionality for a modern fire
department. The current station is strategically located but is in a
deteriorating condition which does not allow for expansion and is not
suitable to house modern fire apparatus.
Status:
Objective 1 Both the Fire and Police departments have developed rotation schedules
for their fleets and, as budget constraints allow, have been able to maintain
the rotation schedules. Rotation of vehicles according to rotation
schedules is ongoing.
Objective 2A A fire pumper was purchased and placed in service during the summer of
2000. An ambulance replacement schedule was developed and placed into
the Capital Improvements Program for funding. Five have been purchased.
One replacement fire pumper was purchased during Fiscal 2008. Two fire
med units and remounts were ordered in Fiscal 2010 to be funded from
Equipment Amortization and Replacement Fund.
Objective 2B Proposal is being developed for apparatus rotation. Example: With five
stations, ordering one pumper every four years will provide a 20-year life
span for equipment. Some current apparatuses are older than the 20-year
replacement goal.
Objective 3 In 1999, there were three active neighborhood associations in Lufkin. The
Community Policing Officers became active in these groups and have
assisted in organizing ten total associations. A patrol Lieutenant is
assigned to those neighborhood associations in his area of town to address
the needs of the citizens. Each patrol officer is also assigned a registered
sex offender to monitor their location and activity should they commit any
law violations.
Page 34

Objective 4 A Fire Academy has been successfully developed at Angelina College.
Recruits can receive Fire and EMT Basic certification through the
Academy. Paramedic training is also available through the College EMS
training program.
Objective 5 This item is on hold pending future funding. One firefighter position was
added in Fiscal 2010 to accommodate scheduling.
Objective 6 Land was purchased in Fiscal 2002. City staff and a local architect firm
are working on a new Fire Station Design on Old Union Road, which will
replace existing Station #4 on the Southwest Loop. The new station was
complete in Fiscal 2008.
Objective 7 A ladder truck was purchased and delivered during Fiscal 2006. One fire
pumper was purchased during Fiscal 2008. The purchases of one fire
engine and one rescue truck were purchased from Fiscal 2012 bond
proceeds. One fire engine is tentatively scheduled for replacement in
Fiscal 2015 to be paid from bond proceeds.
Objective 8 Various Homeland Security grants have been awarded. The Fire
Department has purchased equipment that will be useful in a number of
emergency situations.
Objective 9 Land was purchased in July 2010 with funding from Certificates of
Obligation to be issued in October 2010. Design and plan completed since
using same design and plans from Station #4. Construction completed in
Fiscal 2012.
Objective 10 Reconstruction of Station #5 in progress and should be complete FY 2014
with funds from bond issue proceeds.
Goal: Establish reliable, broad based communications for public safety and citizen
information purposes.
Objectives:
1. Upgrade and replace the current police communications system.
Project to include purchase and installation of a new radio system for
data transmission, which allows field reports to be transmitted
electronically, as well as “on-line” driver’s license and license plate
checks from the field.
2. Complete the update of each City department’s web site. Provide
training for one staff member from each department in Microsoft Front
Page to maintain the department’s web page.
Page 35

3. Expand online services for citizen use: including online building
permits, inquiry and payment of utility accounts, recreation class
schedules, fine payments, and ambulance service fee payments.
4. The Police Department has budgeted to purchase a radio voting system
that will allow a greater area of radio reception in the recently annexed
regions. The project is estimated to be completed in the early part of
Fiscal 2010.
Status:
Objective 1A Staff negotiated with AT&T to build a CDPD system. The “build out”
was completed in March 2001. Hardware and software were purchased
for police vehicles. The project was complete in May 2002 and is
operational.
Objective 1B In 2004, AT&T upgraded the Police Departments existing CDPD network
to a GPRS network, which greatly exceeded the capabilities of the
previous CDPD network by providing many enhanced benefits and
services such as a wider coverage area and higher-speed data transfer.
Objective 1C In 2011, the Police Departments received a DETCOG Homeland Security
Grant in the amount of $132,803 to upgrade to digital radio equipment for
officers. Radio upgrade began in FY 2013 and should be complete along
with a monopole replacement in FY 2014.
Objective 2 The City’s website was updated in Fiscal 2006 and is maintained by the
City’s Webmaster. Requests for updates by the departments are
forwarded to the Webmaster on a continual basis.
Objective 2A The City’s website was updated providing citizens of Lufkin access to up
to date information on crimes and police-involved incidents that occur
within the Lufkin city limits via Crime Reports at www.crimereports.com.
Objective 3 The City implemented an on-line interactive application in Fiscal 2002 that
allows utility customers to view and pay their bills via the Internet. The
City’s Municipal Court system is now a live site and is now capable of
paying fines on-line, as well as in person.
Objective 3A The City purchased Autocite ticket writers to automate the process of
ticket writing in the Police Department to ticket collection in Municipal
Court Department.
Objective 4 The City has budgeted to purchase a radio voting system in Fiscal 2008.
The project was completed in Fiscal 2008.
Goal: Provide increased beautification and quality of life projects for the citizens and
visitors of Lufkin.
Page 36
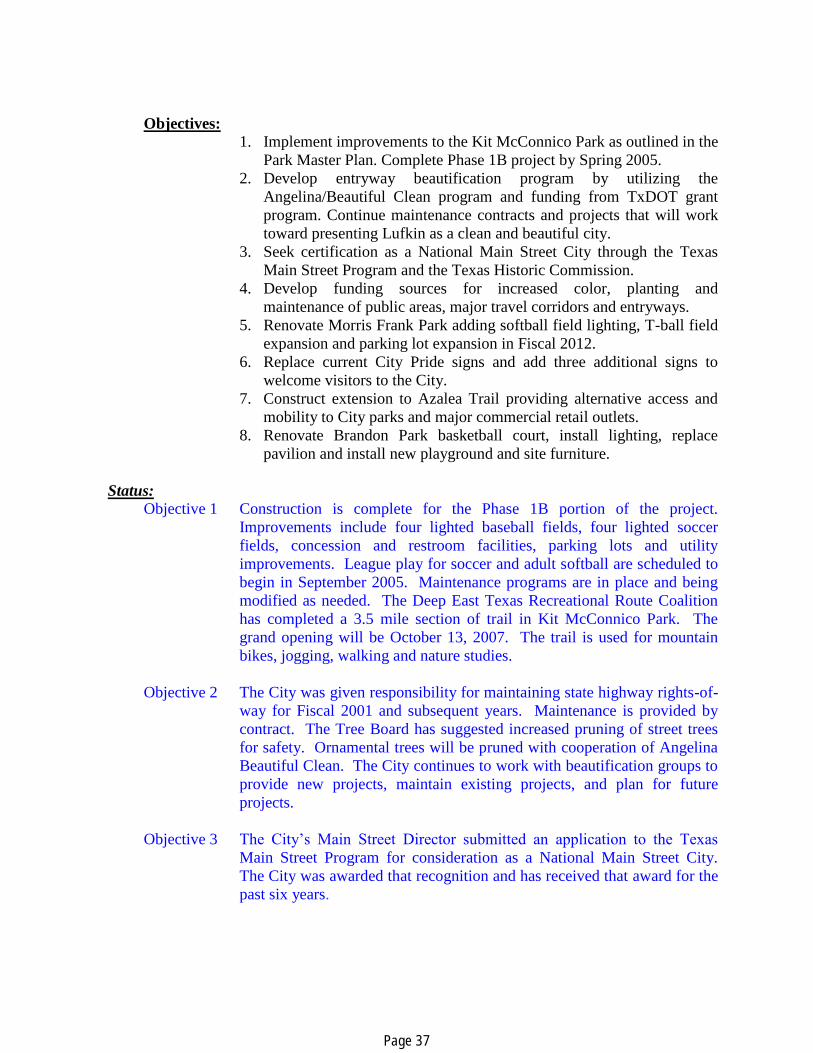
Objectives:
1. Implement improvements to the Kit McConnico Park as outlined in the
Park Master Plan. Complete Phase 1B project by Spring 2005.
2. Develop entryway beautification program by utilizing the
Angelina/Beautiful Clean program and funding from TxDOT grant
program. Continue maintenance contracts and projects that will work
toward presenting Lufkin as a clean and beautiful city.
3. Seek certification as a National Main Street City through the Texas
Main Street Program and the Texas Historic Commission.
4. Develop funding sources for increased color, planting and
maintenance of public areas, major travel corridors and entryways.
5. Renovate Morris Frank Park adding softball field lighting, T-ball field
expansion and parking lot expansion in Fiscal 2012.
6. Replace current City Pride signs and add three additional signs to
welcome visitors to the City.
7. Construct extension to Azalea Trail providing alternative access and
mobility to City parks and major commercial retail outlets.
8. Renovate Brandon Park basketball court, install lighting, replace
pavilion and install new playground and site furniture.
Status:
Objective 1 Construction is complete for the Phase 1B portion of the project.
Improvements include four lighted baseball fields, four lighted soccer
fields, concession and restroom facilities, parking lots and utility
improvements. League play for soccer and adult softball are scheduled to
begin in September 2005. Maintenance programs are in place and being
modified as needed. The Deep East Texas Recreational Route Coalition
has completed a 3.5 mile section of trail in Kit McConnico Park. The
grand opening will be October 13, 2007. The trail is used for mountain
bikes, jogging, walking and nature studies.
Objective 2 The City was given responsibility for maintaining state highway rights-of-
way for Fiscal 2001 and subsequent years. Maintenance is provided by
contract. The Tree Board has suggested increased pruning of street trees
for safety. Ornamental trees will be pruned with cooperation of Angelina
Beautiful Clean. The City continues to work with beautification groups to
provide new projects, maintain existing projects, and plan for future
projects.
Objective 3 The City’s Main Street Director submitted an application to the Texas
Main Street Program for consideration as a National Main Street City.
The City was awarded that recognition and has received that award for the
past six years.
Page 37
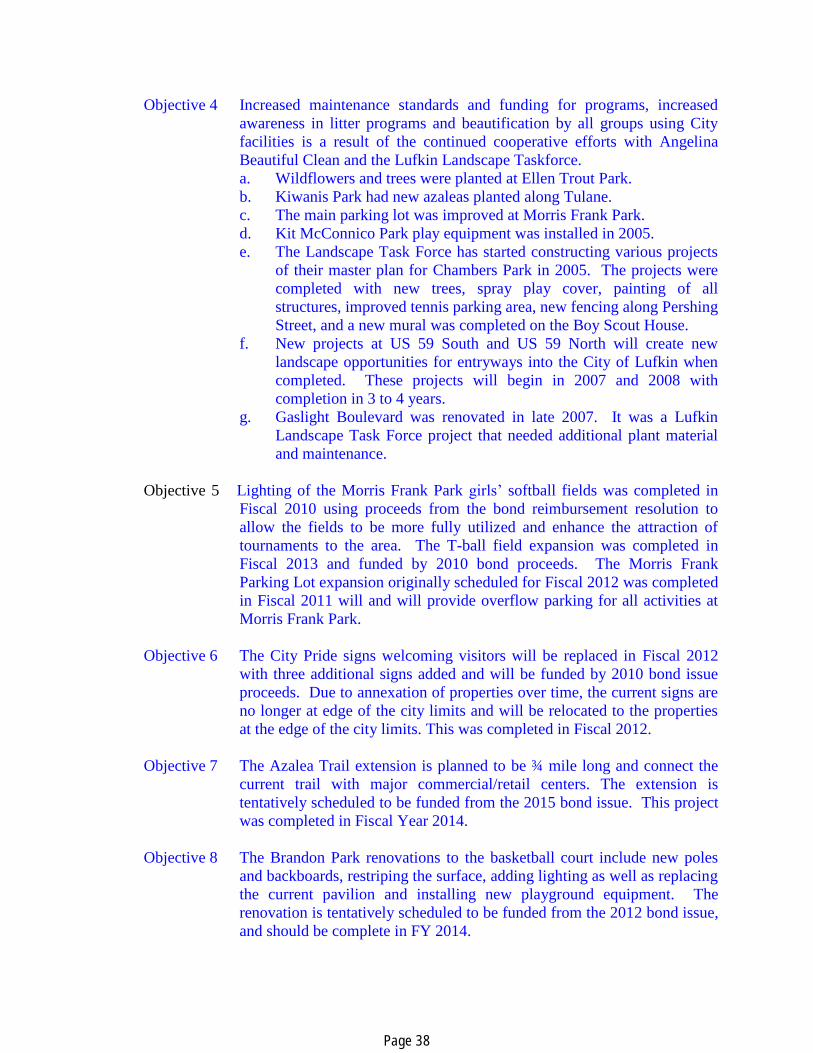
Objective 4 Increased maintenance standards and funding for programs, increased
awareness in litter programs and beautification by all groups using City
facilities is a result of the continued cooperative efforts with Angelina
Beautiful Clean and the Lufkin Landscape Taskforce.
a. Wildflowers and trees were planted at Ellen Trout Park.
b. Kiwanis Park had new azaleas planted along Tulane.
c. The main parking lot was improved at Morris Frank Park.
d. Kit McConnico Park play equipment was installed in 2005.
e. The Landscape Task Force has started constructing various projects
of their master plan for Chambers Park in 2005. The projects were
completed with new trees, spray play cover, painting of all
structures, improved tennis parking area, new fencing along Pershing
Street, and a new mural was completed on the Boy Scout House.
f. New projects at US 59 South and US 59 North will create new
landscape opportunities for entryways into the City of Lufkin when
completed. These projects will begin in 2007 and 2008 with
completion in 3 to 4 years.
g. Gaslight Boulevard was renovated in late 2007. It was a Lufkin
Landscape Task Force project that needed additional plant material
and maintenance.
Objective 5 Lighting of the Morris Frank Park girls’ softball fields was completed in
Fiscal 2010 using proceeds from the bond reimbursement resolution to
allow the fields to be more fully utilized and enhance the attraction of
tournaments to the area. The T-ball field expansion was completed in
Fiscal 2013 and funded by 2010 bond proceeds. The Morris Frank
Parking Lot expansion originally scheduled for Fiscal 2012 was completed
in Fiscal 2011 will and will provide overflow parking for all activities at
Morris Frank Park.
Objective 6 The City Pride signs welcoming visitors will be replaced in Fiscal 2012
with three additional signs added and will be funded by 2010 bond issue
proceeds. Due to annexation of properties over time, the current signs are
no longer at edge of the city limits and will be relocated to the properties
at the edge of the city limits. This was completed in Fiscal 2012.
Objective 7 The Azalea Trail extension is planned to be ¾ mile long and connect the
current trail with major commercial/retail centers. The extension is
tentatively scheduled to be funded from the 2015 bond issue. This project
was completed in Fiscal Year 2014.
Objective 8 The Brandon Park renovations to the basketball court include new poles
and backboards, restriping the surface, adding lighting as well as replacing
the current pavilion and installing new playground equipment. The
renovation is tentatively scheduled to be funded from the 2012 bond issue,
and should be complete in FY 2014.
Page 38

Goal: Maintain the Ellen Trout Zoo to be deemed worthy of its slogan as the “Finest Small
City Zoo in the Nation.”
Objectives:
1. Expand current facilities to accommodate upcoming features and
increased attendance.
2. Develop funding for new exhibits through private and public donations
and new innovations.
3. Develop and create new exhibits to increase attendance and interest in
the zoo.
4. Construct Ellen Trout Zoo-Walking Trail around Ellen Trout Lake to
provide an additional recreational area.
5. Construct Zoo commissary for storing and preparing animal food to
increase efficiency.
Status: Objective 1A The parking area was expanded in Fiscal 2002 to alleviate the
overcrowded parking situation.
Objective 1B Restrooms were added in Fiscal 2004 to the new African area to provide
patrons with facilities in the back area of the zoo. These were opened to
the public in May 2004 and have received very favorable reviews.
Objective 2 The Zoo increased admission fees in April 2003 to shoulder the burden of
increasing costs on both the implementation of new exhibits and recurring
costs on the city’s General Fund. These fees were increased again in July
2007.
Objective 3A The zoo will begin expansion with the development of an African area.
This area has since completed both a giraffe and White rhino exhibit in
Fiscal 2001. The giraffe exhibit has had a new arrival with the birth of a
new male giraffe in late 2002.
Objective 3B The hippoquarium and crocodile exhibits were completed during 2003.
These exhibits are fully functional and the zoo has already increased the
hippopotamus population with the birth of a new hippo in late September
2003.
Objective 3C A new primate and Komodo dragon exhibit was completed during Fiscal
2004. Plans are underway for the outdoor portion of this exhibit to be
completed in the future. An African aviary was constructed in 2005 by the
Lufkin Rotary Club and took the place of the scheduled primate exhibit.
Objective 3D In late 2004 work began on the botanical exhibit and was completed in
April 2005. This exhibit is dedicated to the memory of Nancy
Wannamacher. This will also provide the public with additional seating.
Page 39

Objective 3E Design and fundraising began for the new Education Center and office
complex at a new location in the southern part of the zoo near the newly
completed parking lot. Fundraising was completed and construction was
completed in Fiscal 2010.
Objective 3F A new outdoor exhibit was constructed for the Zoo’s five Chinese
alligators by the Lufkin Rotary club in 2006.
Objective 4 The Ellen Trout Zoo walking trail was eliminated from the 2012 bond
fund planning.
Objective 5 Scheduled for construction in Fiscal 2013 to be funded by fund balance
from the Zoo Building Fund and should be complete in FY 2017.
Goal: Refurbish the existing, near thirty-year old Convention Center while keeping the
establishment accessible and functional for scheduled events. In Fiscal year 2011, remodel,
expand and update the existing Convention Center to house and shelter large groups in
times of emergencies to be funded by Hurricane Ike grant funding in coordination with
Angelina County.
Objectives:
1. Replace existing equipment and fixtures such as the HVAC unit,
moveable walls, telescoping.
2. Update the color scheme by replacing the upholstery on seating,
carpeting and drapes in the stage area.
3. Improve the lighting equipment by adding additional, up to date, stage
lighting.
4. Replace the sound system with a system that will provide greater
sound quality and new technology.
5. Tint windows in the Front Lobby Reception Area to help with cooling
costs.
6. Replace Lobby Entrance doors to satisfy safety and building codes.
7. Install WIFI and a Mounted Projector in Main Events Room.
8. Remodel and refurbish Dressing Rooms and back entry halls. Install
gate for better security of equipment in Master Control Room and
Kitchen.
9. Upgrade Landscaping.
10. Add outdoor Christmas Decorations.
11. Remodel, expand and update the existing Convention Center.
Status:
Objective 1A A new HVAC unit replaced the 25-year-old unit in Fiscal 2001. This new
unit is more energy efficient by only heating and cooling areas as needed.
Page 40

Objective 1B New movable walls replaced non-functioning existing walls in Fiscal
2002. The new walls are reliable and provide, on a consistent basis, areas
that are more accommodating to patrons.
Objective 1C Telescoping seating replaced damaged seating in Fiscal 2002. The new
seating provided a safer place for patrons to sit and the new design is
easier to operate for Civic Center employees.
Objective 1D The sound system was replaced in Fiscal 2006. The new system will
provide a better sound and will have new technological advances that the
current one lacks.
Objective 2A When the telescoping seating mechanism was changed, the color scheme
for the existing seating was also updated to reflect an elegantly modern
scheme. This update was completed in Fiscal 2002.
Objective 2B The worn carpet in the Civic Center was replaced in March of 2004.
Objective 2C The stage curtain and back drapes were replaced in Fiscal 2006. This step
completed the color scheme change.
Objective 3 Eight new Stage Lights were replaced in FY 2006. Stage Lights were
placed intermittently alongside remaining front-track stage lights of the
area. These new lights provide a better quality of lighting with greater
control of maneuverability for customers.
Objective 4 The Sound System was replaced in 2006. It consists of new mixers,
equalizers, amplifiers, speakers and other sound equipment including
relocating the Master Sound Rack. Replacing this System has added a
greater quality of service for our customers during their events.
Objective 5 The glass areas of the Front Lobby Reception area were tinted in Fiscal
2007 from floor to ceiling with a bronze Llumar Window Film with a 10
year warranty. This process allows the Lobby area better insulation in the
winter and summer months respectively.
Objective 6 Eight Front Lobby Entrance Doors were replaced in Fiscal 2007 with
bronze tinted anodized aluminum frames, and bronze tempered glass.
Each door included new panic bars; continuous hinges with inside dogable
exit devices; outside key-locks; thresholds; and weather stripping. There
is one handicap door for ADA compliance.
Objective 7A As an added feature to our customers, WIFI was installed in the Main
Events Room for using during events in Fiscal 2007.
Page 41

Objective 7B To maximize space and use, a Mounted Projector was installed in 2007 in
the Main Events Room. The projector is operated by remote from a
specified laptop. This projected included wiring cable to strategic areas of
the room to allow the customer to be able to conduct their presentation
from various angles throughout the room to meet their accommodation
needs.
Objective 8A The Ladies’ and Men’s restroom was remodeled in FY 2007, which
included replacing water damaged sheetrock, existing toilets, sinks, vanity
and doors. The existing showers were replaced with ADA approved
showers with seating. The Dressing Rooms were painted and
appropriately attractive décor was added for ambiance. The remodeling of
the dressing rooms has greatly enhanced the customer’s enjoyment in
using these rooms for their events when needed.
Objective 8B The back entry areas were painted and wainscoted with vinyl paneling;
including replacing the vinyl bases with newer material.
Objective 8C A gate was installed and is kept locked at all times to secure the master
control areas from public access. This area houses the Civic Center’s
main computer equipment, main electrical boxes, and telephone
equipment along with the hot water heater.
Objective 9A Soil in the flowerbed area has been upgraded with a mixture of sand and
compost for future planting and healthy growth. This was completed in
FY 2007.
Objective 9B In Fiscal 2008, brick retaining walls were placed on both north and south
side areas. New landscaping was completed including new magnolia
trees.
Objective 10 In Fiscal 2008 the addition of Christmas decorations in the form of holiday
signage and other festive lights on the front Plaza and surrounding outside
areas of the building were added. This included installation of adequate
electrical outlets and other equipment for proper hanging. This will add a
festive and colorful ambiance to the Civic Center as customers celebrate
the Holidays.
Objective 11 Expand Convention Center to over twice original size to house and shelter
large groups in times of emergencies to be funded by Hurricane Ike grant
funding in coordination with Angelina County. This was completed in
FY 2013.
Goal: Instill a love for reading in the community, while maintaining the new state of the art
Kurth Memorial Library facility.
Page 42

Objectives:
1. Acquire reading materials that encourage reading and increasing
knowledge in an innovative, welcoming environment.
2. Provide educational programs to the community.
Status:
Objective 1 The Library is under the constant process of providing an ethnic diversity
to its shelves through obtaining books written in Spanish. Also, books on
audio to assist beginning readers provide the community with opportunity.
As the need arises, the library is prepared to acquire books of varying
ethnic cultures as to inspire a love of reading.
Objective 2 The Library is committed in providing quality educational programs for
school children. This allows children opportunities to visit the library with
peers, and will hopefully instill an appreciation of books that will continue
for years. The Library also instructs the community using the Internet as a
learning tool.
Goal: Implement improvements to the Emergency Management System as to provide a
safe environment for the citizens of Lufkin.
Objective: 1. Continue to improve the mitigation, response and recovery activities of
the Emergency Management office.
Status:
Objective 1A The National Weather Service designates the City of Lufkin as a Storm
Ready community. This means that the city is ready to respond in the
event that hazardous weather threatens.
Objective 1B The city expended the Office of Domestic Preparedness Grant of $277,000
in improving the equipment capabilities of the Fire, Police, Public Works
Administration, and the Emergency Management Departments.
Objective 1C A Mitigation Action Plan has been developed as required by the State of
Texas and FEMA.
Objective 1D Everbridge Incident Notification service was implemented in Fiscal 2011
to resolve incidents more quickly, increase awareness and safety, reduce
communication costs, gain operational efficiencies and improve
compliance and reporting.
Goal: Develop operational procedures as to improve the collection of waste throughout the
city.
Objectives:
1. Revise the Solid Waste Collection Ordinance for the City of Lufkin.
Page 43

2. Reconstruct the collection routes
3. To implement the different Solid Waste and Special Collections
programs. (Commercial Dumpster Program, Residential Cart upgrade
and a Work Order system.)
4. To implement a new rate structure for Special Collections.
Status:
Objective 1 Information has been collected from other cities. Staff will work as a team
on the update. Target date for completion is the end of October 2007.
Objective 2 Route audits have been performed. GPS equipment has been installed on
each collection vehicle to gather statistical information. Further planning
of the routes will result in increased efficiency.
Objective 3 The commercial dumpster program has been implemented. The
Residential cart upgrade will allow citizens to upgrade from the previously
issued 65 gallon cart to a 96 gallon cart. This program began in early
2008.
Objective 4 Special Collections will go to a “work order only” system as well a rate
structure being developed for collections over 2-yards. This project began
mid-year 2008. The “Litter Critter” service was added in Fiscal 2011 to
provide residential customers with short-term access to dumpster program
at residences.
Goal: Improve the operations of the City of Lufkin Recycling Department.
Objectives:
1. Complete the study of and install automated equipment for upgrading
the recycling process.
2. Continue to monitor wastewater disposal with emphasis on the
feasibility of bio-solids composting.
3. Implement educational opportunities in the community through the use
of the Recycling Coordinator.
Status:
Objective 1 The City’s Recycling process is expected to continue with the installation
of a new baler in Fiscal 2007 and with the addition of part-time employees
to process recyclables in Fiscal 2008.
Objective 2 The Composting Operation was terminated in Fiscal 2007. The operation
was reviewed and it was determined that composting was not a cost
effective operation for the City.
Objective 3 Educational opportunities are ongoing, and include schools, civic
organizations, business groups and neighborhood associations. Expanding
Page 44

regional recycling efforts, along with commercial recycling education and
participation, will be a focus. Applications for grants have been and will
continue to be submitted with DETCOG to fund local and regional
programs.
Goal: Attract new businesses and provide positive growth to the City of Lufkin and
surrounding area.
Objectives:
1. Propose an Economic Development (ED) Plan.
2. Develop funding for ED Plan.
3. Implement ED Plan by Summer 2004.
4. Develop Lufkin Business Park
Status:
Objective 1A Proposed during Council discussions late Fiscal 2003.
Objective 1B Workshop was scheduled for early Fiscal 2004. The citizens voted to
implement the ED plan in February 2004.
Objective 2 Determination for the funding was determined after workshop. Funding
has been determined to be ⅛ of a cent from a portion of the sales tax
revenue.
Objective 3 Implementation of the ED began in the summer of 2004, with the
appointment of a Board of Directors for the Economic
Development Corporation.
Objective 4A Land was purchased during Fiscal year 2009 and Fiscal 2010 for
the Lufkin Business Park.
Objective 4B Old Moffett road construction and reconstruction behind the
property to the new TxDOT turnaround has been approved to be
funded by an EDA grant. Water and sewer lines, drainage and
road entrances for the 1st phase of the construction has been
approved.
Objective 4C One business has began operations in the Industrial Business Park with
return of loan payments.
Objective 4D Angelina Tank began operations in FY 2012 in the Shell Building.
Page 45

KEY REVENUE ASSUMPTIONS AND TRENDS
FOR FISCAL 2018
On an ongoing basis throughout the Fiscal year, finance staff monitors and reviews all revenues
at a detailed level regarding collection versus budget estimate, and probability of collection.
Early in the budget process, a complete set of revenue assumptions are prepared by the
department responsible for the revenue. Revenue estimates are based on trends of prior year’s
revenues and adjusted for various assumptions in the current budget year. These assumptions
provide the basis for revenue projections throughout the budget process and include the
expectations for local economic and population growth and expected service levels.
The City of Lufkin receives revenues from a variety of sources. The Budget Overview section of
this document provides a detailed explanation of the individual revenues for each fund. This
section highlights the major revenues included in this year’s budget for the major funds.
GENERAL FUND
AD VALOREM TAXES AND ASSESSED PROPERTY VALUES
The City’s property tax is levied each October 1, based on the assessed value of all real and
business personal property located within the City. The Angelina County Appraisal District
establishes and certifies the appraised values at or near 100% of estimated market value.
Homeowners aged 65 and over, disabled persons and veterans are eligible, and may qualify for
tax exemptions. The Angelina County Appraisal District can provide additional information on
the eligibility requirements for these exemptions.
$1.81 $1.90
$2.05 $2.09 $2.09 $2.15 $2.19 $2.19 $2.03
$2.21 $2.19
-
0.50
1.00
1.50
2.00
2.50
2008 2009 2010 2011 2012 2013 2014 2015 2016 2017 2018
Fiscal Year
Assessed Property Values Ten Year History
Series2 Series1
($ i
n B
illi
on
s)
Page 46

Ad valorem tax revenue is determined by two major factors: the total assessed value established
by the Appraisal District and the tax rate established by the Lufkin City Council. The assessed
property values have decreased during the past year however new property was added that
allowed the City the capacity to adopt the effective tax rate of $0.531135 per $100 valuation.
The City’s total certified assessed property value for Fiscal 2018 is $2,194,747,857 according to
the Appraisal District. The City’s tax rate for Fiscal 2018 is $0.531135 per $100 valuation. The
Fiscal 2018 operating and maintenance tax rate of $0.381135 per $100 valuation will generate
$7,452,400 of ad valorem tax revenue to the General Fund projecting a 98% collection rate. Ad
valorem tax revenue is the second largest revenue source to the General Fund, accounting for
22.78% of total projected revenue for Fiscal 2018. The General Fund allocation of total ad
valorem tax revenue equals approximately 71.76% of total ad valorem tax collections; the
remaining 28.24% is allocated to the General Obligation Debt Service Fund for the retirement of
bond indebtedness.
The table below provides a ten-year history of Lufkin’s ad valorem tax rate, levy, and
collections, as well as the projected tax collection and distribution of revenues for Fiscal 2018, or
tax year 2017.
ANALYSIS OF TAX COLLECTIONS
Tax
Roll
Tax Rate
per
$100/value
Tax Levy Current
Collections
Current
Collections
to Tax
Levy
Delinquent
Collections
Including
Penalty &
Interest
Total
Collections
Total
Collections/Current
Collections
2008 0.555400 9,768,773 9,498,223 97.23% 328,374 9,909,330 101.44%
2009 0.533800 9,893,510 9,680,139 97.84% 77,722,541 87,402,680 883.43%
2010 0.513800 9,725,704 9,479,079 97.46% 440,775 9,919,854 102.00%
2011 0.513800 9,880,019 9,498,096 96.13% 210,318 9,708,414 96.76%
2012 0.503800 9,850,889 9,552,443 96.97% 259,729 9,812,172 97.57%
2013 0.503800 9,931,262 9,737,126 98.05% 611,741 10,348,867 106.28%
2014 0.523800 10,311,645 10,102,616 97.97% 224,963 10,327,579 102.20%
2015 0.523800 10,551,727 10,307,189 97.68% 254,990 10,632,911 103.16%
2016 0.529942 10,615,673 10,428,061 98.23% 330,317 10,758378 103.17%
2017 0.531135 10,385.173
Fiscal 2018 Tax Rate Distribution Revenues
General Fund $0.381135 71.76% $7,452,400
Debt Service Fund $0.1500 28.24% $2,932,773
TOTAL $0.531135 100.00%
Page 47

SALES TAXES
The City of Lufkin receives 1.5% of the 8.25% sales tax revenue paid to the Texas State
Comptroller for the sale of all taxable goods and services within the City limits. Of the 1.5%
received from the state, 0.125% was approved by voters in 2004 to be allocated to Lufkin
Economic Development Corporation; a 4B corporation organized under the State’s Economic
Development Corporation Act, and 0.375% was approved in 2004 for property tax relief. Sales
tax revenue continues to be the largest revenue source for the City’s General Fund, representing
42.90% of total revenues.
Revenues from sales taxes are projected to decrease slightly in Fiscal 2018. The total projected
sales tax revenue is $14,259,124, .86% below the revised estimate for Fiscal 2017. However, the
net projected sales tax revenue is estimated to be $13,070,864. This net amount reflects the
allocation of $1,188,260 to Lufkin Economic Development Corporation. The chart below reflects
sales tax collections for the last ten years. The estimated revenue for FY 2018 is net of the
Economic Development allocation.
FRANCHISE FEES The City of Lufkin maintains agreements with various utilities that require them to compensate
the City for use of City streets, alleys and easements. The franchise agreements require the
utilities to compensate the City between 2% and 4% of their gross receipts for use of the City’s
rights-of-way. Total franchise and agreement fees for Fiscal 2018 are anticipated to be
$2,330,000 which is slightly lower than the revised revenue estimate of $2,352,684 for Fiscal
2017.
$0.00
$2.00
$4.00
$6.00
$8.00
$10.00
$12.00
$14.00
$16.00
2008 2009 2010 2011 2012 2013 2014 2015 2016 2017
Rev
2018
Est
$11.12$11.44
$10.95
$11.30$12.92
$12.90$13.15
$14.08 $14.33 $14.38$14.26
Sales Tax Collections Ten Year History
Page 48
WATER/WASTEWATER FUND The City provides water and sewer services to its citizens for which it collects monthly charges.
These charges are based on metered water consumption multiplied by the appropriate water and
wastewater rates. The 2007 Water Rate Study by Freese and Nichols was re-evaluated for FY
2016 and it was determined that an increase of 6% for water and sewer rates would increase
operating capital. For FY 2018 no increase was implemented to water and sewer rates.
Water/Wastewater revenue includes charges for water and wastewater consumption as well as
fees for water and sewer taps, water meters, service connections and wastewater pretreatment
testing. Total Fiscal 2017 revised water and wastewater revenues are estimated to be
$17,419,935, an increase of .77% above Fiscal 2016 actual revenues of $17,286,698. Fiscal
2018 revenue is projected to be $17,411,486 a .05% decrease from the Fiscal 2017 revised
revenue.
SOLID WASTE AND RECYCLING FUND The City of Lufkin is the exclusive provider of solid waste and recycling services for residential,
commercial and industrial corporate citizens. Charges for service are billed on a monthly basis
to all users. Residential garbage is picked up once weekly on Mondays or Tuesdays and
recycled materials are picked up once weekly on Thursdays or Fridays. Commercial and
industrial customer garbage and recycled materials are picked up on predetermined route
schedules based on customer pickup frequency.
A Solid Waste rate study was performed during FY 2016. Results of this study indicated a need
for an increase in rates. Rates have not increased since FY 1999. An increase of $1.00 for
residential sanitation rates was implemented for FY 2017. Per rate study, an additional $1.00
increase for residential sanitation rates is included for FY 2018. Total revenues for the Fund are
estimated to be $6,705,500, a slight increase above Fiscal 2017 revised estimate of $6,558,248
due to a slight increase in residential collections.
HOTEL/MOTEL TAX FUND The City receives hotel/motel tax receipts that are generated from a 7% tax levy added to the cost
of occupancy on hotel and motel rooms within the City. State law restricts use of these tax
receipts to tourism promotion, capital construction, operation of recreation facilities, and cultural
activities. The City has nine-teen hotels, motels, and bed and breakfasts within its taxing
jurisdiction. These are expected to generate $950,000 of hotel/motel tax receipts in Fiscal 2018,
same as the Fiscal 2017 estimate of $950,000. The City actually received for Fiscal 2016
$1,150,324 in hotel/motel occupancy tax. Revenue from this Hotel/Motel Occupancy tax is used
to promote tourism and the hotel/motel industry as well as the Convention Center.
SPECIAL RECREATION FUND The Special Recreation Fund was established several years ago as a self-supporting unit wherein
recreation activity costs are supported through user fees. This fund provides Parks’ management
segregated cost data to assist in determining the adequacy of the fees and facilitate tracking costs
of the various activities.
Page 49

Revenues are derived from user fees charged for softball, volleyball, basketball, gymnastics,
recreation classes, baseball, concessions, and special events. Total Fiscal 2018 revenues for the
Recreation Fund are projected to be $457,470, an increase of 1.38% from the revised Fiscal 2017
estimate of $451,260 and are estimated to be sufficient to cover the costs of operation and
provide a fund balance of $91,915.
PINES THEATER SPECIAL EVENTS FUND
The Pines Theater Special Events Fund was established by a sponsorship from the Lufkin
Convention & Visitor Bureau as a mechanism to fund a series of cultural events and promote the
historic Pines Theater. The series of events scheduled in Fiscal 2018 are designed to bring
culture and arts to our residents along with attracting visitors to the community. The Fiscal 2018
projected revenue is $150,963 to be generated from contributions, concessions, souvenir sales,
playbill ads and admission/ticket sales for the events.
ELLEN TROUT ZOO BUILDING FUND The Ellen Trout Zoo Building Fund was established as a funding mechanism to make capital
improvements and expand the Zoo through additional exhibits. Sources of revenue include
admission fees, donations, animal sales and adoptions, and other miscellaneous fees.
Revenue for Fiscal 2018 is projected to be $338,110 which is an increase from the Fiscal 2017
revised estimate of $335,410.
Page 50

A GUIDE TO THE DETAIL BUDGET PAGES
1. Fund – The Fiscal entity in which the department operates.
2. Department – The department in which the division operates.
3. Mission Statement – The departmental commitment to the citizens and organization in
meeting the needs of the community.
4. Description of Services – A short overview and explanation of the services provided to
the organization and/or citizens by the department.
5. Fiscal 2018 Work Program – The major planned accomplishments for the coming
Fiscal year.
6. Performance Measures – Specific quantitative measures of work performed within a
department.
1
3 5
6
4
2
Page 51

A GUIDE TO THE DETAIL BUDGET PAGES
7. Expenditures – Summary budget data by expenditure category for personnel services,
benefits, supplies, maintenance of structures and equipment, miscellaneous services,
sundry charges, debt service and capital outlay.
8. Authorized Positions – Full time and part time position listings for current and past
budget years.
9. Significant Changes – Highlights of proposed major changes, enhancements of service
or a new service, method of improving efficiency or effectiveness of an existing service
for the coming budget year.
7
8
9
Page 52

A GUIDE TO THE DETAIL BUDGET PAGES
10. Division – The cost center that provides the activity, function or services.
11. Division Description – The division’s primary service responsibility and mission.
12. Expenditures - Summary division budget data by expenditure category for personnel
services, benefits, supplies, maintenance of structures and equipment, miscellaneous
services, sundry charges, debt service and capital outlay.
13. Authorized Positions - Full time and part time position listings for current and past
budget years for the division.
10
11
12
13
Page 53

Page 54

GENERAL FUND
REVENUES The General Fund consists of eight major revenue classifications: Taxes – include Ad Valorem,
Sales, and Mixed Beverage Taxes; Franchise Taxes – paid to the City by utility companies for
the right to use rights-of-way; Licenses and Permits – consist of fishing, chauffeur, and
peddler’s licenses and permits for buildings, signs and various other uses; Charges for Service –
include Emergency Medical Service (EMS) and false alarm fees; Fines and Forfeitures - fines
assessed for misdemeanor traffic, parking, animal control, code enforcement violations, business
licenses, permit and inspection fees; Other Revenues – include animal shelter fees, park fees,
and inter-governmental revenue such as grants received from other governmental agencies;
Interest income – consists of interest income from investment of idle cash; and, Transfers of
Intra-Governmental Revenue – revenues received from other funds within the City for services
provided.
Revenues for Fiscal 2018 are projected to be $32,708,018. This represents a 1.42% decrease
below revised estimates for Fiscal 2017 of $33,177,537 and a 1.31% decrease from the Fiscal
2016 actual revenues of $33,070,427. The following graph represents total revenues by major
category.
Ad Valorem Taxes$7,644,444
Sales Taxes $13,070,864
Mixed Beverage Tax$93,880
Franchise Taxes$2,331,100
Fines and Permits$1,341,875
Charges for Services$2,674,050
Interest Income$60,000 Intra Governmental
$4,782,621
Transfers$378,368
O ther Revenues$330,816
General Fund RevenuesTotal: $32,708,018
Page 55

AD VALOREM TAXES Ad valorem taxes are the City’s second largest General Fund revenue source and are based on
assessed property values. The City’s taxable assessed property value (before freeze) for Fiscal
2018 is $2,034,876,699, a decrease of .23% over the previous year’s tax roll. Stable construction
values of approximately $14 million, and $34.5 million of property reappraisals, by the Angelina
County Appraisal District, are the reason for the decrease. The following graph represents a ten-
year history of property values for the City of Lufkin.
Ad Valorem taxes are divided between general operating and maintenance requirements and
general obligation debt service. The City’s tax rate for Fiscal 2018 is $0.531135 per $100 of
assessed property values. The tax rate for general operations for Fiscal 2018 is $0.381135; the
tax rate for debt service is $0.1500.
$0.00
$0.50
$1.00
$1.50
$2.00
$2.50
2007 2008 2009 2010 2011 2012 2013 2014 2015 2016 2017 2018
$1.60 $1.70 $1.80 $1.89 $1.94 $1.93 $1.98$2.19 $2.01 $2.03 $2.04 $2.03
Taxable Assessed Property Values Ten Year History
Fiscal Year
$0.00
$0.10
$0.20
$0.30
$0.40
$0.50
$0.60
0.3532 0.3532 0.3316 0.3338 0.3338 0.3338 0.33380.3638 0.3738 0.379942 0.381135
0.2022 0.20220.2022 0.1800 0.1800 0.1700 0.1700
0.1600 0.1500 0.1500 0.1500
(Ta
x R
ate
in
cen
ts/$
100
valu
ati
on )
Ad Valorem Tax Rate Ten Year History
Debt Service Rate O&M Rate
Page 56
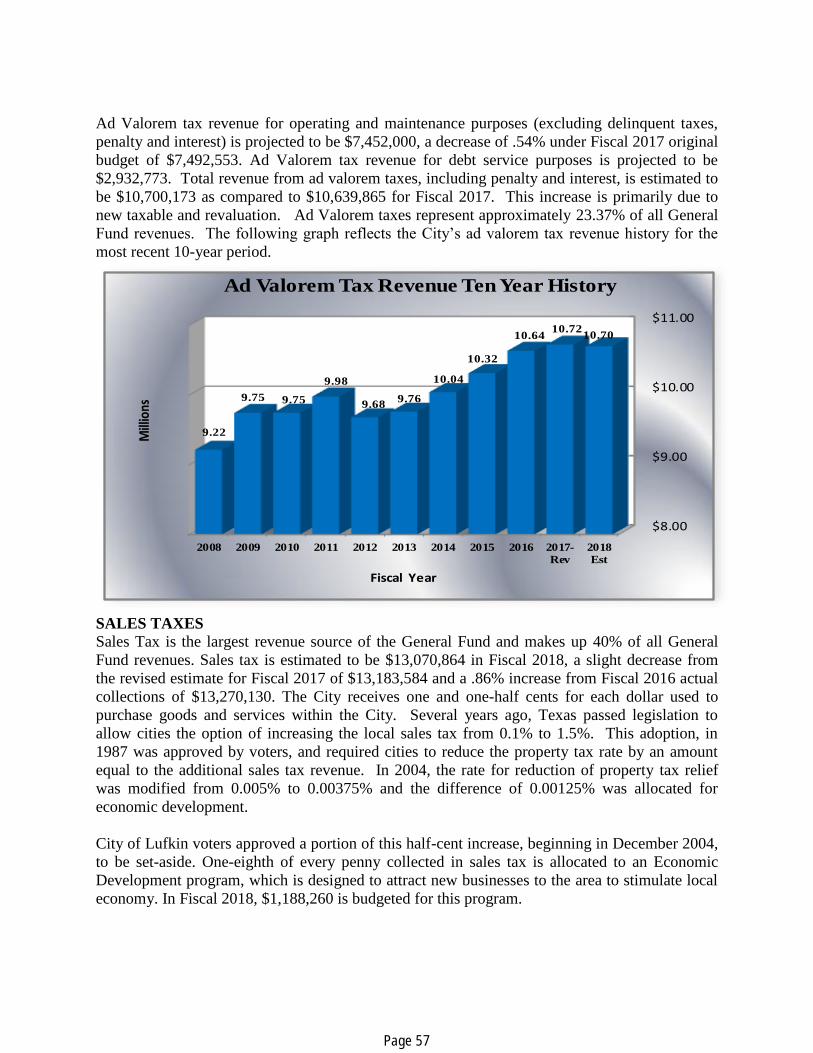
Ad Valorem tax revenue for operating and maintenance purposes (excluding delinquent taxes,
penalty and interest) is projected to be $7,452,000, a decrease of .54% under Fiscal 2017 original
budget of $7,492,553. Ad Valorem tax revenue for debt service purposes is projected to be
$2,932,773. Total revenue from ad valorem taxes, including penalty and interest, is estimated to
be $10,700,173 as compared to $10,639,865 for Fiscal 2017. This increase is primarily due to
new taxable and revaluation. Ad Valorem taxes represent approximately 23.37% of all General
Fund revenues. The following graph reflects the City’s ad valorem tax revenue history for the
most recent 10-year period.
SALES TAXES
Sales Tax is the largest revenue source of the General Fund and makes up 40% of all General
Fund revenues. Sales tax is estimated to be $13,070,864 in Fiscal 2018, a slight decrease from
the revised estimate for Fiscal 2017 of $13,183,584 and a .86% increase from Fiscal 2016 actual
collections of $13,270,130. The City receives one and one-half cents for each dollar used to
purchase goods and services within the City. Several years ago, Texas passed legislation to
allow cities the option of increasing the local sales tax from 0.1% to 1.5%. This adoption, in
1987 was approved by voters, and required cities to reduce the property tax rate by an amount
equal to the additional sales tax revenue. In 2004, the rate for reduction of property tax relief
was modified from 0.005% to 0.00375% and the difference of 0.00125% was allocated for
economic development.
City of Lufkin voters approved a portion of this half-cent increase, beginning in December 2004,
to be set-aside. One-eighth of every penny collected in sales tax is allocated to an Economic
Development program, which is designed to attract new businesses to the area to stimulate local
economy. In Fiscal 2018, $1,188,260 is budgeted for this program.
$8.00
$9.00
$10.00
$11.00
2008 2009 2010 2011 2012 2013 2014 2015 2016 2017-
Rev
2018
Est
9.22
9.75 9.75
9.98
9.689.76
10.04
10.32
10.6410.72
10.70
Mill
ions
Fiscal Year
Ad Valorem Tax Revenue Ten Year History
Page 57

FRANCHISE FEES
Franchise fees are paid to the City of Lufkin by local utilities (Oncor Electric Delivery,
Centerpoint Energy, Consolidated Communications, Sudden-Link Cable, and all taxi cab
services) for the right to use city streets, alleys, and rights-of-way. The franchise agreements
require the utilities to compensate the City between 2% and 4% of their gross receipts. The City
had maintained an Industrial District Agreement which provided an annual payment per year
with a paper manufacturer that sold operations during 2010 and did not remit payments to the
City through 2012. The City reinstituted proceedings to annex the property and surrounding
property which border the Industrial Rail Park in Fiscal 2013. Total franchise and agreement
fees for Fiscal 2018 are anticipated to be $2,331,100, which is 2.79% less than the Fiscal 2017
revised estimate. The table below reflects a five-year history of Franchise Fee collections for the
City of Lufkin.
Source
Actual
Fiscal
2014
Actual
Fiscal
2015
Actual
Fiscal
2016
Revised
Fiscal
2017
Estimated
Fiscal
2018 Oncor Electric $1,538,361 $1,547,385 $1,519,456 $1,448,539 $1,450,000
Centerpoint Energy 290,366 287,965 233,243 235,000 235,000
Consolidated Communications 277,071 312,036 223,713 264,500 264,500
Sudden-Link Cable 347,673 287,942 268,358 270,000 270,000
Various 0 45,598 49,826 1,100 1,100
Video Service Fees 0 0 89,507 86,000 86,000
Verdant Ind 0 0 00 48,645 24,500
Electric Delivery Case 16,959 0 0 0 0
Total $2,470,430 $2,480,926 $2,384,103 $2,353,784 $2,331,100
FINES AND PERMITS
The City operates a Municipal Court that collects fines for class “C” misdemeanors, traffic
violations, parking tickets, warrant fees, and code enforcement violations. The Municipal Court
Judge, appointed by Council, assesses the fines. Estimated revenues, including red light fines,
for Fiscal 2018 are $1,096,175, a .96% increase from the revised estimate of $1,085,802 for
Fiscal 2017. The increase in revenue over the past four years is attributed the utilization of the
Omni System and the Red Light Camera System. The Omni system connects the city to several
state databases, which enables the City to collect a higher percentage of fines. The City
implemented a Red Light Camera System which began operation in Fiscal 2008. Licenses and
Permits include fees charged for business licenses, general construction permits, inspection of
electrical, plumbing and mechanical installations, as well as code enforcement and other
miscellaneous fees. This revenue makes up approximately .75% of the total General Fund
revenues and is estimated to be $245,700 for Fiscal 2018, an 8.56% increase over the revised
estimate of $226,321 for Fiscal 2017. Building permits and inspection fees are anticipated to
level out, for the next Fiscal year, based on several planned projects and developments.
Page 58
CHARGES FOR SERVICE
The City of Lufkin provides emergency medical service (EMS) to Lufkin citizens and parts of
Angelina County. A fee is collected from citizens who use this service and the County is
charged a contract fee of $237,000 for EMS services provided in the County. Beginning April
2014 the City of Lufkin began in house billing for EMS ambulance services. The City’s EMS
service fees are projected to total $2,400,000 for Fiscal 2018. Actual ambulance fees collected in
Fiscal 2016 was $2,524,121
.
INTEREST INCOME
Interest income consists of interest income from investment of idle cash primarily in pooled
funds, money market funds and Certificates of Deposit with a maximum maturity of two years.
The interest projection for Fiscal 2018 is projected to be $60,000. The investment rate for Fiscal
2018 is projected to be 0.65%.
OTHER REVENUES
Miscellaneous revenues include Animal Shelter fees, Park revenues, Library fine/fees, and
income from charges for accident reports, records checks, zone changes, city housing rental,
salary reimbursement, and grants from federal, state and local agencies for various public safety,
recreational and community-oriented programs. These revenues are expected to generate
$330,816 for Fiscal 2018, a decrease of $83,255 from the Fiscal 2017 revised estimate of
$414,071.
TRANSFERS - INTRA-GOVERNMENTAL REVENUES
Intra-governmental revenues represent transfers among Funds and General and Administrative
charges assessed by the General Fund to other funds in recognition of services rendered such as
administration, personnel, accounting, data processing, etc. These revenues are projected to total
$4,782,621 in General and Administrative and $378,368 in transfers from other funds in Fiscal
2018, totaling $5,160,988 a decrease of 4.58% below the Fiscal 2017 revised estimate of
$5,408,610.
Page 59

EXPENDITURES
General Fund expenditures for Fiscal 2018 are estimated to be $33,411,583, which is $356,465
or 1.06% less than revised totals for Fiscal 2017 of $33,768,048. The following table provides a
comparison of departmental expenditures by organizational classification. Detailed departmental
expenditures, excluding transfers, are provided in the detail budget pages.
Expenditures are separated into major categories for analysis and control. These categories
include Personnel Services, Benefits, Materials and Supplies, Equipment and Structure
Maintenance, Miscellaneous Services, Sundry Charges, Debt Service, and Capital Outlay. The
following chart depicts the General Fund Expenditures by major category for Fiscal 2018.
Personnel Services$24,962,692
Supplies$1,614,276 Equipment
Maintenance$1,984,741 Miscellaneous
Sevices$4,243,186
Sundry$145,750
Debt Service$90,882
Transfers$370,056
General Fund Expenditures - Fiscal 2018Total : $33,411,583
GENERAL FUND EXPENDITURE COMPARISON BY CATEGORY
Category
FY 2016
Actual
FY 2017
Revised
FY 2018
Budget
% Change
Budget/
Revised
General Government $3,909,633 $4,184,239 $4,210,354 .62%
Public Safety 19,372,453 19,347,740 19,187,059 -.083%
Public Works 4,788,209 5,348,594 4,930,485 -7.82%
Culture and Recreation 3,898,420 3,915,692 3,908,445 -.019%
Community Development 420,860 427,243 254,527 -40.43%
Non-Departmental 1,269,812 544,540 920,713 -32.04%
Total $ 33,759,387 $ 33,768,048 $ 33,411,583 -1.06%
Page 60

PERSONNEL SERVICES
This category of expenditures includes salaries and benefits for all employees within the General
Fund. Included in Personnel Services are salaries, overtime pay, certificate pay, car allowance,
and longevity pay. Benefits include social security payments, retirement, and employee health
insurance. Personnel Services remains the General Fund’s largest expenditure and accounts for
74.71% of total General Fund expenditures for Fiscal 2018. Total personnel services
expenditures are estimated to be $24,962,692, a .36% decrease from the revised Fiscal 2017
estimate of $25,053,993. Fiscal year 2018 includes budgeted salaries and benefits for whole year
while Fiscal 2017 revised budget is reduced for the impact of vacancies that occur throughout the
year.
SUPPLIES
Supplies are defined as articles or commodities that are consumed or materially altered when
used and include office supplies, publications (blueprints, catalogs, magazines, newspapers, etc.),
postage, printing, stationary, food supplies, vehicle fuels, minor tools (hand tools, axes, etc.),
minor utensils (brooms, cones, glassware, etc.), cleaning supplies, medical supplies and all new
equipment, not meeting the City’s capitalization policy. Supplies represent 4.83% of all General
Fund expenditures and are projected to be $1,614,276 in Fiscal 2018. This is a 3.06% decrease
below the revised estimate for Fiscal 2017 of $1,665,277.
EQUIPMENT & STRUCTURE MAINTENANCE
All expenditures for the maintenance and repair of equipment and structures fall into this
category. Equipment includes furniture, machinery, equipment (backhoes, tub grinders, fuel
trailers, playground equipment, lawn mowers, etc.), small instruments (survey equipment,
calculators, etc.), motor vehicles, books, meters, computer and copy machines, and telephone
equipment. Structure expenditures include materials and commodities purchased in their existing
state to be used in the course of maintaining buildings and structures owned by the City, as well
as, contracts for maintenance and repairs of these items. Structures include items such as
bridges, sanitary sewers, storm sewers, streets, swimming pools, and parking lots. These
expenditures are estimated to be $1,984,741 for Fiscal 2018, a decrease of 15.96% below the
Fiscal 2017 revised estimate of $2,361,728. This category of expenditures is 5.94% of total
appropriations in the General Fund.
MISCELLANEOUS SERVICES
Miscellaneous Services include activities performed by persons or entities other than municipal
employees or departments. They are typically performed under contract to the City and include
items such as communications (messaging, telephones, etc.), insurance, advertising, freight
service, electricity, heating fuel, and custodial services. This category of expenditures represents
12.70% of General Fund expenditures and is estimated to be $4,243,186 for Fiscal 2018. This is
a .38% increase from the Fiscal 2017 revised estimate of $4,226,993.
Page 61

SUNDRY CHARGES
Sundry Charges are those expenditures for which the City of Lufkin has a legal or moral
obligation and include items such as contributions, gratuities, damages, witness fees, and other
such charges. The City contributes funding to several local non-profit organizations. Several of
the larger contributions go to City/County Health Unit, and the Transit System. Total sundry
expenditures are estimated to be $145,750 for Fiscal 2018, a decrease of 2.11% from the revised
estimate of $148,887 for Fiscal 2017.
DEBT SERVICE AND TRANSFERS
Debt Service represents lease purchase payments for capital assets and transfers to other funds
supported by General Fund monies. This category costs of $460,938 increased for Fiscal 2018
from the revised estimate for Fiscal 2017 of 311,170 due to a note payable for a phone system
upgrade and bunker gear for the Fire Department.
CAPITAL OUTLAY
Capital Outlay expenditures include items of a permanent nature, having a life of more than one
year and costing in excess of $5,000. This includes items such as land, equipment, buildings,
and structures. This category of costs varies from year to year depending upon departmental
needs for new or replacement capital. No capital outlay was budgeted for Fiscal 2018.
FUND BALANCE The City’s Financial Policies require that the General Fund maintain a fund balance that is
equivalent of 90 days or 25% of the original annual adopted General Fund Expenditure Budget.
However, during the development of the Fiscal 2004-2005 Budget, Council modified the policy
to enable the City to reduce the fund balance requirement up to 5% as considered necessary. This
balance is reserved for use in emergency situations such as natural disasters, for additional
budget appropriations, unanticipated expenditure needs or for other uses so identified by Council
as appropriate. More importantly, the fund balance is maintained to reflect the City’s Fiscal
strength and financial commitment to its citizens, financial institutions and bondholders. The
fund balance of the General Fund for Fiscal 2018 is estimated to be $9,186,325, of which
$8,352,896 is the required reserve and a negative $703,565 is assigned fund balance. The
projected fund balance represents approximately 101 days of expenses or 25% of General Fund
expenditures. The City has consistently met its fund balance policy for the last ten years and is
committed to continuing that trend.
The following graph provides a ten-year history of fund balance for the City’s General Fund
compared to the fund balance required by Council Financial Policies. The actual fund balances
in each Fiscal year exceeded the required fund balances because actual departmental
expenditures were less than the amounts budgeted. In each year there were unspent budgeted
funds resulting from employee vacancies and uncompleted projects in the various departments.
These projects were completed in the subsequent years. Revenues are budgeted conservatively
resulting in actual revenues exceeding estimates; contributing to the increase in the difference.
Page 62

$0.0
$2.0
$4.0
$6.0
$8.0
$10.0
$12.0
$14.0
2008 2009 2010 2011 2012 2013 2014 2015 2016 2017
Rev
2018
Est.
$11.30
$11.79$11.25 $11.47
$9.69 $9.63 $9.72
$10.61 $10.48$9.89
$9.11
$6.61
$7.28
$7.08
$7.38
$7.27
$7.71
$7.49
$7.84
$7.84
$8.44
$8.44
Fiscal Year
General Fund Balance Actual vs. Required
Ten Year History
Actual Required
In M
illi
on
s
Page 63

WATER/WASTEWATER FUND
REVENUES The City provides water and sewer service to residents within the city limits and provides
wholesale water to several adjacent communities. In January 1999, the City assumed ownership
and operating responsibility for the Burke Water Supply Corporation, which provides water
needs to the Burke community and surrounding area. The City currently pumps water from 24
(twenty-four) ground water wells that have thus far met the needs of the City’s water customers.
Additionally, the City owns water rights on Lake Sam Rayburn for up to 28,000 acre-feet of
water per day. The City entered into a water storage contract with the United States for 43,000
acre-feet on Sam Rayburn in 1970 and 1976. The 1970 contract grants the City 18,000 acre-feet
of storage for present water supply and the 1976 contract grants an additional 25,000 acre-feet of
storage for future water demands. In 2003 the City completed a comprehensive water needs
assessment and an evaluation of future water demands. During Fiscal 2010, the City acquired
Kurth Lake and the Abitibi Water Well Field which tripled its daily production capacity.
Therefore, it does not anticipate the need to begin withdrawing water from Lake Rayburn until
sometime after 2041.
Water/Wastewater Revenue Comparisons
Revenue
Fiscal 2016
Actual
Fiscal 2017
Budget
Fiscal 2017
Revised
Fiscal 2018
Budget
% Change
Revised to
Budget
Water Revenues $ 9,119,178 $ 9,190,810 $ 9,245,000 $ 9,245,000 0.00%
Wastewater
Revenues 7,140,115 7,575,460 7,720,000 7,720,000 0.00%
Water Connections 87,205 75,000 75,000 75,000 0.00%
Sewer Connections 19,638 26,000 22,000 22,000 0.00%
Service Charges 185,536 170,000 190,000 180,000 -5.26%
Misc. Revenue 50,226 11,300 27,863 23,300 -16.38%
Interest Income 16,519 12,000 16,500 17,000 3.03%
Intra-Governmental 119,803 123,572 123,572 129,186 1.54%
Total Revenues $17,286,698 $17,184,142 $17,419,835 $17,411,486 -0.05%
The table above reflects a comparison of Water/Wastewater Fund revenues for Fiscal 2016
actual, Fiscal 2017 (budget and revised), and Fiscal 2018 budget estimate. Fiscal 2018 total
revenues are estimated to be $17,411,486, a decrease of 0.05% under Fiscal 2017 revised
estimates of $17,419,835.
Water revenues for Fiscal 2018 are estimated to be $9,245,000, same as the Fiscal 2017 revised
estimate. Wastewater revenues of $7,720,000 are estimated to remain constant from the Fiscal
2017. There are no rate changes for Water/Sewer rates for Fiscal 2018. The City Council
approved a 6% increase in both water and sewer rates as proposed in the earlier rate study for
Fiscal 2016 to boost the health of fund balances. The rate study provided information for future
Page 64

increases over a period of several years according to anticipated growth and expansion in the
City and to cover the cost of the Abitibi Water Well field and Kurth Lake acquisition.
Other revenues include new water and sewer connections, service charges, sewer pre-treatment
testing charges, interest income and miscellaneous revenues. These revenue estimates combined
equal $317,300 or 4.24% less than the Fiscal 2017 revised estimates of $331,363.
An Intra-governmental transfer of $129,186 is from the Solid Waste Fund. This transfer
represents an administrative charge recognizing the collection of sanitation fees for the Solid
Waste/Recycling Fund. These revenues are collected through the Utility Collections department.
EXPENSES
The Water/Wastewater Fund expenses for Fiscal 2018 are estimated to decrease .05% from
revised estimates for Fiscal 2017. Total projected expenses are estimated to be $17,427,015
compared to the revised estimate for Fiscal 2017 of $17,735,449. The Water/Wastewater Fund
consists of five departments: Utility Collections, Water Production, Wastewater Treatment,
Water/Sewer Utilities and Non-Departmental. Other expenses include Intra-governmental and
Debt Retirement Transfers.
Departmental expenses are divided into major categories to assist managers in analyzing and
controlling their departmental costs. As discussed in the General Fund Expenditure section,
these categories include Personnel Services, Benefits, Supplies, Equipment and Structure
Maintenance, Miscellaneous Services, Sundry Charges, Debt Service, and Capital Outlay.
Utilties Collections
861,239
5%
Water/Sewer Utilities
3,484,415
20%
Wastewater Treatment
2,145,001
12%
Water Production
2,090,730
12%
Non- Departmental
424,477
3%
Debt Retirement
3,546,645
20%
Transfers
4,874,508
28%
Water-Wastewater Expenses by Department Fiscal 2018Total $17,427,015
Page 65

The following chart provides a breakdown of expenses by category. Total expenses are
$17,427,015.
PERSONNEL SERVICES
Personnel Services include salary and benefit costs for all employees within the
Water/Wastewater Fund. Expenses for Fiscal 2018 are estimated to be $3,745,144 and represent
an increase of 5.88% above Fiscal 2017 revised estimates of $3,537,074. Some vacant positions
were filled by contracted services through temporary agencies for 90 days prior to hiring of the
individuals. The funds are budgeted for 100% filled positions and then amounts are transferred
from salary budgets to contracted services budgets during the year as vacancies occur and
invoices are paid to the temp contractors.
SUPPLIES
Supplies are defined as articles or commodities that are consumed or materially altered when
used and include office supplies, publications (blueprints, catalogs, magazines, newspapers, etc.),
postage, printing, stationary, food supplies, vehicle fuels, minor tools (hand tools, axes, etc.),
minor utensils (brooms, cones, glassware, etc.), cleaning supplies, medical supplies and all new
equipment, not meeting the city’s capitalization policy. Materials and supplies are estimated to
be $966,235 in Fiscal 2018 compared to $940,260 for the Fiscal 2017 revised estimate. This is a
2.76% increase.
EQUIPMENT& STRUCTURE MAINTENANCE
Expenses for the maintenance of equipment and structures fall into this category. Total expenses
for Fiscal 2018 are estimated to be $1,259,685 which represents a 1.33% increase from the
revised estimate of $1,243,173 for Fiscal 2017.
Personnel Services
3,745,144
21.49%
Supplies
966,235
5.54%
Equipment
Maintenance
1,259,685
7.23%
Miscellaneous
Sevices
2,871,798
16.48%
General and
Administrative
2,641,151
15.16%
Capital Outlay
13,000
0.07%
Funded
Depreciation
2,107,905
12.10%
Provision for Bad
Debts
150,000
0.86%
Intra-governmental
Transfers
125,452
0.72%
Debt Retirement
3,546,645
20.35%
Water-Wastewater Fund Expenses by Category Fiscal 2018
Total $17,427,015
Page 66
MISCELLANEOUS SERVICES
Miscellaneous Services includes a variety of expenses such as electricity, temporary employees,
credit card merchant fees, telephone communications, water / wastewater testing services,
custodial services, advertising, and other expenses. Expenses in this category are estimated to be
$2,871,798. The original budget for Fiscal 2017 budget of $2,930,705 was then revised to
$2,970,150 due to an increase in special services expenses of $34,445 for special sewer testing
within our local industries. The Pineywoods Groundwater Conservation District, which
encompasses Angelina and Nacogdoches Counties and includes representatives of both counties,
the cities of Lufkin and Nacogdoches and the business community, formed July 2001, to monitor
ground water use and conduct usage and recharge studies of the Carrizo-Wilcox Aquifer, from
which Lufkin gets all of its water requirements. Fees for these services are derived come from
this category.
SUNDRY CHARGES
Sundry Charges include legal and moral obligations of the City and include contributions,
gratuities, judgments, bad debts, etc., incurred by the City. No expenses are expected for this
category for Fiscal 2018. This is based on several years of past experience of collection of total
water and sewer revenues. The City continues to maintain an excellent utility billing collection
rate.
CAPITAL OUTLAY
Capital Outlay includes physical assets having a life of more than one year and a value greater
than $5,000. For FY2018, purchase of a new HD Line printer at a cost of $13,000 for Utility
Collections department is included in the budget.
INTRA-GOVERNMENTAL CHARGES
Intra-Governmental Charges include Intra-governmental transfers, General and Administrative
(G&A) Charges and Funded Depreciation transfers to the Water/Wastewater
Renewal/Replacement Fund.
Intra-governmental transfers for Fiscal 2018 are expected to be $125,452 a decrease of $440,066
from revised Fiscal 2017.
G&A charges represent amounts charged for services provided by certain General Fund
departments to departments in the Water/Wastewater Fund and are made to cover the cost of
accounting, purchasing, information technology, fleet maintenance, engineering, and human
resources assistance. The amount budgeted for Fiscal 2018 is $2,641,151 and is derived by
formula. This amount is based on the budgeted costs of service departments within the General
Fund. An allocation table of G&A calculations can be found in the Appendix, on page 328 of
this document.
Depreciation transfers to the Water/Wastewater Renewal & Replacement Fund represent cash
transfers in an amount equal to actual depreciation expense incurred in the operating fund in the
Page 67

second preceding year. These cash transfers are restricted in use. Approximately three-fourths
the amount transferred each year may be used for replacement of capital items. The other one-
fourth is retained to provide future funding for major plant replacements. The transfer for Fiscal
2018 is budgeted at $2,107,905 a decrease of .11% from the revised Fiscal 2017 estimate.
TRANSFERS TO DEBT SERVICE
This category of expenses includes transfers to the Revenue Bond Retirement and Reserve Fund
for payment of long term debt issued by the City’s Utility System. Transfers of $3,546,645 will
be made in Fiscal 2018. This is a decrease of $231,360 from the revised estimate of $3,778,005
and is attributable to continued borrowings relating to the asbestos cement water line
replacement project. Standard and Poor’s and Moody’s Investment Service have rated the City’s
Revenue Supported bonds AA- and Aa2, respectively. A comprehensive discussion of Utility
System debt can be found in the Debt Service Fund section of this document.
WORKING CAPITAL BALANCE Council Financial Policies require that the City’s Enterprise Funds maintain a working capital
balance of 45 days of budgeted expenses or $2,178,377. The working capital balance in the
Water/Wastewater Fund is projected to be $3,976,917 in Fiscal 2018, which is $15,529 less than
the working capital of $3,992,446 for the Fiscal 2017 revised amount.
Page 68

SOLID WASTE AND RECYCLING FUND
REVENUES The City’s Solid Waste and Recycling departments provide both residential and commercial
solid waste service to the entire city. The Solid Waste and Recycling Fund includes revenues
from residential collection service, commercial and roll-off container collection services, garbage
bag sales, sale of recycled materials, miscellaneous and interest revenues. Total revenues for
Fiscal 2018 are estimated to be $6,705,500, a 2.25% increase from Fiscal 2017 revised estimates
of $6,558,332. Collection revenues comprise approximately 72.68% of total revenues in the
Solid Waste and Recycling Fund. An explanation of each revenue source and comparison with
the Fiscal 2017 revised estimate follows.
SANITATION COLLECTION REVENUES
Sanitation collection includes one solid waste and one recycling pickup per week to residential
customers in the City. Commercial collection service includes two-, three-, four-, six- and eight-
yard containers that are picked up on a predefined commercial route schedule that allows the
customer to choose the frequency, size and number of containers he/she requires. The preceding
table provides a comparison of Fiscal 2017 revised revenues to Fiscal 2018 projected revenues.
A rate increase of $1.00 for residential sanitation rates in Fiscal 2018 is included in this budget.
Collection revenues for Fiscal 2018 are projected to be $4,874,000, which include residential,
commercial, and sanitation cart collections.
SOLID WASTE AND RECYCLING FUND
Comparison of Collection Revenues
Collection Classification
Fiscal
2017
Revised
Fiscal
2018
Budget
% Change
Budget
To
Revised
Residential Collections $ 2,090,000 $ 2,284,000 9.28%
Commercial Collections 2,350,000 2,350,000 0.00%
Commercial Cart Pickups 240,000 240,000 0.00%
Commercial Non-Compacted Pick ups 750,000 750,000 0.00%
Commercial Compacted Roll-Offs 420,000 420,000 0.00%
Commercial Special Pickups 35,000 40,000 14.29%
Sanitation Container Revenues 110,000 110,000 0.00%
Sale of Recycled Materials 400,000 350,000 -12.50%
Miscellaneous Income 140,248 139,500 -.53%
Interest Income 23,000 22,000 -4.35%
Total Revenues $6,558,248 $ 6,705,500 2.25%
Page 69

RESIDENTIAL COLLECTION REVENUES
Residential revenues of $2,284,000 are estimated to increase for Fiscal 2018 as that of Fiscal
2017 revised due to rate increase approved by Council.
COMMERCIAL COLLECTION REVENUES
Commercial Collection includes commercial front load containers, 90 gallon can pickups, roll off
containers (both compacted and non-compacted), special pickups that include customer requests
outside their regular route pickup, requested pickups outside the city limits and recycling
pickups. Total commercial collection revenues for Fiscal 2018 are anticipated to be $2,350,000,
same as Fiscal 2017.
SANITATION CONTAINER REVENUES
The Solid Waste Department previously purchased two-, three-, four-, six- and eight-yard
commercial containers in bulk quantities for resale to its commercial customers at slightly above
the City’s cost. The dumpsters are City of Lufkin property and are rented to commercial
customers for a monthly fee. Revenue from the rental of these containers is recorded in this
account. Sanitation container program revenue estimates for Fiscal 2018 are projected to be
$240,000 with no change from the 2017 revised revenue.
SALE OF RECYCLED MATERIALS Recycled materials include paper products, aluminum and metal cans, plastics and compost.
Sales of these materials fluctuate with market demand and thus can fluctuate widely from year to
year. The revised revenues for 2017 were estimated at $400,000. Revenue estimates for Fiscal
2018 are projected at $350,000 due primarily to stable demand and market price for paper
products.
INTEREST INCOME Interest Income is earned from the investment of idle funds. Interest income for Fiscal 2018 is
estimated to be $22,000 a decrease of $1,000 from Fiscal 2017. The total amount budgeted is
estimated to decrease because interest income is calculated on a budget or cash basis. Lower
rates of return in the marketplace necessitated a change in investment instruments moving from
those with quarterly interest payments to Certificates of Deposit which pay interest at maturity;
in some instances this may be two years later.
EXPENSES
The Solid Waste and Recycling Fund include two operating departments: Solid Waste and
Recycling. These departments are responsible for the pickup and disposal of disposable and
recyclable materials within the City of Lufkin. These departments are located at the Southpark
Business Park on FM 819 between Loop 287 and US 59 South.
Expenses for the Fund are projected to increase 3.36% from Fiscal 2017 revised estimates of
$6,497,972 to the Fiscal 2018 budget estimate, $6,715,985. The following graph reflects a
comparison of Fiscal 2017 revised and Fiscal 2018 budget estimates by expenditure category.
Page 70

The following narrative provides an explanation of expenses.
PERSONNEL SERVICES
Personnel Services include salary and benefit costs for all employees within the Solid
Waste/Recycling Fund. Expenses for Fiscal 2018 are estimated to be $1,537,179 and represent
an increase of 4.77% from Fiscal 2017 revised estimates of $1,467,193.
SUPPLIES
In Fiscal 2018, expenses for materials and supplies are estimated to be $438,900 an increase of
13.21% above the revised estimate of $387,700 for Fiscal 2016. This increase reflects increases
for motor vehicle fuel, general supplies, uniform expense, books and equipment purchases.
EQUIPMENT & STRUCTURE MAINTENANCE The Solid Waste and Recycling Fund runs a fleet of automated garbage trucks equipped with
sophisticated hydraulics and mobile data terminals that require both routine and non-routine
maintenance of a technical nature. An increase of 7.63% is anticipated in this expense category.
The Fiscal 2018 estimate is $310,250 compared to the revised estimate for Fiscal 2017 of
$288,250.
$0
$500
$1,000
$1,500
$2,000
$2,500
$1,467
$388 $288
$2,112 $1,899
$35
$308
$0
$1,537
$439$310
$1,936
$2,253
$35
$206
$0
Thousa
nds
Solid Waste-Recycling Fund Comparison by Expense Category
FY2017 Revised FY2018 Budget
Page 71

MISCELLANEOUS SERVICES
The major expenditure in miscellaneous services is county landfill charges the City pays for use
of the Angelina County Landfill. Prior to Fiscal year 2013, these charges were based on cubic
yards of refuse dumped at the landfill site. In Fiscal 2012 a five year inter-local agreement was
instituted between the City and the County with the rate set at $22.00 per ton to be adjusted
annually based on 75% of the Consumer Price Index at Houston, Texas on June 1st of each
succeeding year. Miscellaneous Services expenses for Fiscal 2018 are estimated to be
$1,935,820 representing a decrease of 8.33% below the Fiscal 2017 revised estimate of
$2,111,804.
CAPITAL OUTLAY No capital outlay was estimated for Fiscal 2018.
INTRA-GOVERNMENTAL CHARGES
Intra-Governmental Charges include General and Administrative (G&A) charges, and transfers
to the General Obligation Debt Service Fund. Total charges for Fiscal 2018 are projected to be,
$2,493,836, an increase above the revised estimate of $2,242,540 from Fiscal 2017 due to
increasing general and administrative charges.
General and Administrative charges represent charges for service by certain General Fund
departments to departments in the Solid Waste & Recycling Fund and are made to cover the cost
of accounting, purchasing, data processing, engineering, and human resources assistance. This
expenditure is derived by formula and is $2,252,636 for Fiscal 2018, an increase of 18.61%
above the revised 2017 amount. An allocation table of G&A calculations can be found in the
Appendix on page 329.
WORKING CAPITAL BALANCE City Financial Policies require that the City’s Enterprise Funds maintain a working capital
balance of 45 days of budgeted expenses. The working capital balance in the Solid Waste &
Recycling Fund is projected to be $4,884,215 in Fiscal 2018, which exceeds the required
working capital balance of $839,498 by $4,044,717.
Page 72

OTHER FUNDS There are eight other funds for which the City Council appropriates Fiscal expenditures. They
are the Hotel/Motel Tax Fund, the Special Recreation Fund, the Pines Theater Special Events
Fund, the Ellen Trout Zoo Building Fund, the Court Security/Technology Fund, Main
Street/Community Development Improvement Fund, The Animal Control Kurth Grant and the
Animal Attic Gift Funds.
The Hotel/Motel Tax Fund is used to provide funding for the operation and maintenance of the
Pitser Garrison Convention Center. Space in the Convention Center is leased to various
organizations for business conferences, concerts, organizational meetings and school
graduations. Operation of the Museum of East Texas, Texas Forestry Museum, Lufkin Visitor
and Convention Bureau, and the Angelina County Exposition Center are partially funded by
revenues from the Hotel/Motel Tax Fund, i.e. hotel/motel taxes.
The Special Recreation Fund was established to account for the revenues and operating and
maintenance expenses of the baseball, softball, basketball, gymnastics and other athletic leagues.
Approximately 5,000 adults and children participate in the various programs offered by the
recreation staff. Revenues generated by these recreation and sports programs are retained by the
fund to pay operating and maintenance expenses and to upgrade facilities.
The Pines Theater Special Events Fund is used to account for a series of events hosted by the
Lufkin Convention and Visitor Bureau and scheduled to be held at the newly renovated historic
Pines Theater downtown. The events are designed to increase cultural awareness and promote
tourism in the area.
The Ellen Trout Zoo Building Fund is used to account for donations to the Zoo and for revenues
generated from admissions receipts. These funds are used to make physical improvements to the
Zoo and to acquire animals for display.
The Court Security/Technology Fund was developed as a Municipal Court fund. The Security
revenues generated are used to finance items for the purpose of providing security services for
the building housing the Municipal Court. The Technology revenues are to be used exclusively
for the purchase and maintenance of computer systems including network, hard, software,
imaging systems, electronic kiosks, electronic ticket writers and document management systems
for the Municipal Court.
Main Street/Community Development Fund was created to promote downtown Lufkin. Main
Street Lufkin produces several annual events throughout the year which attract thousands, among
these are the Annual Downtown Hoedown Festival, Downtown Halloween Trick or Treat and the
festive Main Street Lufkin Lighted Christmas Parade.
The Animal Control Kurth Grant Fund is used to account for contributions received from the
Kurth Foundation for the financing and benefit of the Kurth Memorial Animal Shelter and
Animal Services.
Page 73

The Animal Control Animal Attic Gift Shop Fund was developed to account for donations to the
Kurth Memorial Animal Shelter and the use of such donations in support of the animals in the
shelter.
Page 74
HOTEL/MOTEL TAX FUND
REVENUES The Hotel/Motel Tax Fund collects revenues from several sources such as hotel/motel occupancy
tax, fees from use of the Convention Center, and services offered to patrons by the Convention
Center such as equipment usage, security and concessions. Total estimated revenue for Fiscal
2018 is projected to be $1,206,200, a 3.25% decrease from the Fiscal 2017 revised estimate of
$1,246,765. This slight difference is primarily due to a decrease in hotel/motel occupancy and
transfers from other funds.
HOTEL/MOTEL OCCUPANCY TAX
The City charges a 7% room rental occupancy tax to hotels and motels within the City of Lufkin
and its extraterritorial jurisdiction. The City divides this revenue among four different
organizations as depicted in chart on page 78. The hotel/motel occupancy tax revenue is
projected to be $950,000 in Fiscal 2018, same as the revised Fiscal 2017.
RENTAL AND USE FEES
Fees received from rental of the Convention Center facilities are projected to be $140,000 for
Fiscal 2018, a decrease of $10,000 from the revised estimate of Fiscal 2017.
ALCOHOLIC BEVERAGE SALES
In FY 2011 the Convention Center obtained a liquor permit and began serving alcoholic
beverages at events in efforts to better control consumption on the premises. Sales are projected
to be $40,000 for Fiscal 2018, a minimal decrease from the revised Fiscal 2017 sales projection.
OTHER REVENUES AND FEES Other revenues and fees include security fees, concessions, equipment replacement charges, and
miscellaneous revenue. For a fee, the Convention Center offers security services and provides
refreshment concessions to those renters requesting the service. In the event Convention Center
equipment is broken or destroyed during use by renters, they are required to pay an equipment
replacement fee. These revenues and fees, taken together, are estimated to total $76,000 as
compared to the revised budget $121,565 in Fiscal 2017. This decrease is mainly attributable to
a lower transfer amount, new fees for additional services such as audio video, equipment usage,
crew set-up/breakdown, and beverage service.
INTEREST INCOME Interest income is earned from investment of idle cash invested in pools and CD’s. The
investment rate for Fiscal 2018 is estimated to be 0.50%, providing revenues of $200.
Page 75
EXPENDITURES PERSONNEL SERVICES
Personnel Services which includes salaries and benefits for Fiscal 2018 are projected to be
$348,266. This is a slight increase of 0.75% from revised Fiscal 2017.
SUPPLIES
Materials and supplies expenditures are anticipated to be $35,100 in Fiscal 2018, a decrease of
.85% below the Fiscal 2017 revised estimate of $35,400. For Fiscal 2016 a projector and screen
was purchased to enhance services to the newly renovated Convention Center.
EQUIPMENT & STRUCTURE MAINTENANCE
The Convention Center maintains sound equipment, heating and air conditioning equipment, and
stage equipment. Fiscal 2018 expenditures are projected to be $24,500 compared to the revised
Fiscal 2017 estimate of $24,200. Expenditures of kitchen equipment and radio repairs have
made this category increase for this budget year.
MISCELLANEOUS SERVICES
Miscellaneous services include items such as electricity, heating fuel, building insurance,
custodial services and other contract services. The Fiscal 2018 estimate of $184,447, an increase
from the Fiscal 2017 revised estimate of $189,877 largely due to decrease charges in electricity
costs, temp employees and other miscellaneous expenses associated with the expanded facilities.
SUNDRY CHARGES Council allocates a portion of the hotel/motel tax to several local agencies in support of
economic development, tourism and community enhancement. These agencies include the
Angelina County Exposition Center – 14.3% of actual hotel/motel tax receipts, the Museum of
East Texas – 7% of hotel/motel tax receipts capped at budget amount, the Texas Forestry
Museum - 5% hotel/motel taxes capped at budget amount, and the newly formed Lufkin Visitor
and Convention Bureau – 42% of actual hotel/motel tax receipts. The chart on the subsequent
page reflects the Fiscal 2016 actual; Fiscal 2017 original and revised; and Fiscal 2018 budget
amounts for these activities.
CAPITAL OUTLAY
There are no capital expenditures scheduled for Fiscal 2018.
TRANSFERS
A transfer of $873 is budgeted for Fiscal 2018. A transfer of $2,917 to the General Fund for the
Arts Alliance contribution was budgeted for Fiscal 2016 actual amount.
FUND BALANCE The fund balance for the Convention Center Fund is estimated to be $4,434 for Fiscal 2018. City
Financial Policies require a fund balance equal to 12.5% of expenditures, or $151,570.
Page 76

$-
$50,000
$100,000
$150,000
$200,000
$250,000
$300,000
$350,000
$400,000
FY2016 Actual FY2017 Budget FY2017 Revised FY2018 Budget
52
,50
0
52
,50
0
52
,50
0
52
,50
0 1
31,9
18
125,1
25
13
5,8
50
13
0,0
00
39
,10
6
37,5
00
37
,50
0
37,5
00
38
7,4
51
36
7,5
00
399,0
00
399,0
00
Convention Center Agency Contributions
Museum of East Texas Exposition Center
Texas Forestry Museum Lufkin Convention & Visitors Bureau
(in
do
lla
rs)
Page 77

SPECIAL RECREATION FUND
REVENUES The Special Recreation Fund generates revenues from user charges and fees charged to
participants in City sponsored league play such as baseball, softball, volleyball, basketball,
gymnastics leagues and concession revenues. Total revenue is projected to be $457,470 in Fiscal
2018, which is a 1.38% increase from Fiscal 2017 revised estimate of $451,260.
BASEBALL
The Parks and Recreation Department manages various baseball teams with scheduled games
throughout the year. Also, baseball tournaments are held in the City’s parks enhancing the
baseball programs. The revenues for Fiscal 2018 are projected to be $74,410, a slight increase of
$7,910 from the revised estimate of $68,000 for Fiscal 2017.
SOFTBALL
Softball leagues have grown in popularity during the past decade. This growth has resulted in
increased revenues. The Fiscal 2018 estimated revenue is projected to be $135,000 same as the
Fiscal 2017 revised estimate.
VOLLEYBALL
Volleyball has decreased in popularity and generates very little or no revenue. For Fiscal 2018,
revenue is projected at $4,995, same as the Fiscal 2017 revised estimate.
BASKETBALL
Basketball remains a steady income generator for the Special Recreation Fund. Estimated
revenue for Fiscal 2018 of $28,925 is an increase of 1.96% from the Fiscal 2017 revised revenue
estimate of $28,370.
FOOTBALL
Football is a new sports program added for Fiscal Year 2018. The program is projected to recruit
120 players at $65.00 each for a total of $7,800.
GYMNASTICS Gymnastics, taught at the Recreation Center, is projected to generate revenues of $34,800 for
Fiscal 2018. This estimate is a 1.83% increase from the Fiscal 2017 revised estimate of $34,175.
SPECIAL EVENTS
Fiscal 2017 original budget for Special events was increased mid-year to account for new events
such as Daddy Daughter Dance. For Fiscal 2018, this category will be expected to collect
$6,500 for Special Events.
CONCESSION REVENUES
Concession operations were also assumed with the baseball program to help defray costs
associated with the operation of the program. The Fiscal 2018 revenues are projected to be
$135,000 which is the same as the revised Fiscal 2017 estimate.
Page 78

OTHER REVENUES The Special Recreation Fund also generates revenues from recreation classes, other
miscellaneous sources, as well as investment of idle funds. These revenues are projected to be
$29,440 for Fiscal 2018 an increase by $120 from the Fiscal year 2017 revised estimate of
37,120.
INTEREST INCOME
Interest income for Fiscal 2018 is estimated to be $600, the same amount budgeted for the Fiscal
2017 revised estimate.
EXPENDITURES PERSONNEL SERVICES Personnel Services include salary and benefit costs for all employees within the Recreation Fund.
Employees in this category are mainly part-time concession workers. Expenses for Fiscal 2018
are estimated to be $48,002. This category of expenditures is expected to decrease from the
Fiscal 2017 revised estimate.
SUPPLIES All equipment, used in sports and recreation leagues, is purchased from this expenditure
category, and is projected to be $122,915 in Fiscal 2018. This is a decrease of 4.40% from the
Fiscal 2017 revised estimate of $128,575.
EQUIPMENT & STRUCTURE MAINTENANCE Expenditures in this category are projected to decrease from $19,900 in Fiscal 2017 to $19,650
in Fiscal 2018. This represents an decrease of 1.26%, which is primarily due to controlled
expenditures for ball park field repairs and maintenance.
MISCELLANEOUS SERVICES
Miscellaneous Services expenditures are estimated to increase by 5.14% in Fiscal 2018 to
$206,525, compared with the revised estimate of $196,431 for Fiscal 2017. These expenditures
fluctuate from year to year depending on program participation, which is projected to increase.
SUNDRY CHARGES There are no expenditures anticipated in this category.
CAPITAL OUTLAY
There are no Capital Outlay budgeted in 2018.
INTRA-GOVERNMENTAL TRANSFERS
Transfers to the General Fund totaling $59,769 are budgeted to reimburse the General Fund for
projected salary costs of an athletic coordinator and recreation specialist positions.
Page 79

FUND BALANCE City Financial Policies require a fund balance in the Recreation Fund of 12.5% of expenditures,
which for Fiscal 2018 is $57,108. The fund balance estimate for Fiscal 2018 is $91,915, which is
$34,807 above the required balance.
-
50,000
100,000
150,000
Special RecreationFiscal 2018
Revenue
Expend
Page 80

PINES THEATER SPECIAL EVENTS FUND
REVENUES The Pines Theater Special Events Fund collects revenues from several sources. Total estimated
revenue for Fiscal 2018 is projected to be $150,963. Several events intending to entice tourists
to the beautiful East Texas area are scheduled throughout the coming fiscal year.
ADMISSION/TICKET SALES
Admissions and ticket sales for the special events are projected to generate $88,013, 58.3% of
the total budgeted revenue for Fiscal 2018.
CONCESSIONS
Concession sales for the special events held at the Pines Theater are projected to yield $15,000.
USE FEES
Use fees for the special events held at the Pines Theater are projected to yield $29,000.
OTHER REVENUES
Other revenues generated from private contributions, souvenir sales, playbill ads, and interest are
projected to yield the remaining $18,950 or 12.55% of the total projected revenue. These
revenues could also be from alcoholic beverage sales for Pines Presents, movies, weddings,
concerts, and private rentals.
EXPENDITURES PERSONNEL SERVICES No personnel salaries or benefits are charged to this fund.
SUPPLIES Supplies for Fiscal 2018 are projected to be $16,625 of which theatre supplies accounts for
12.03% and concession supplies accounts for 87.97%.
EQUIPMENT MAINTENANCE Equipment maintenance for Fiscal 2018 are projected to be $3,570 for painting of the stage,
carpet cleaning done twice a year, and projector maintenance.
MISCELLANEOUS SERVICES
Miscellaneous Services expenditures are estimated to be $152,140 for Fiscal 2018 of which
$100,000 is budgeted for entertainers and $38,715 is for advertising, tickets, temps for events
and $13,425 for various miscellaneous expenses.
FUND BALANCE This fund is intended to operate primarily on a breakeven basis. The fund balance is projected to
be a negative $37,772 at the end of Fiscal 2018.
Page 81
ELLEN TROUT ZOO BUILDING FUND REVENUES The Ellen Trout Zoo Building Fund is used to record transactions associated with new
construction, renovation, upgrades and expansion to the Ellen Trout Zoo facilities. Revenues are
generated from admission fees, sales of animals, safari classes, animal adoptions, concessions,
miscellaneous revenue, interest income and donations. Revenues for Fiscal 2018 total $338,110
of which approximately 89% is generated from admission fees. Donations vary from year to
year, but are usually less than $1,000 per year.
ADMISSION FEES
Admission fees were increased beginning October 1, 2015 for Fiscal 2016. New fees are $7 for
adults and $3.50 for children between the ages of 4 and 11. (Children under 4 are admitted free.)
Revenues budgeted for Fiscal 2018 are projected to be the same as revised Fiscal 2017 of
$300,000.
DONATIONS
Individuals and organizations such as “Friends of the Zoo” make donations. Donors are given
free passes to the Ellen Trout Zoo and to other zoos around the country. Projected revenue
donations for Fiscal 2018 is estimated at $1,000.
SAFARI CLASSES
The Zoo holds educational safari classes that provide the student an inside look at the care and
handling of the animals and operation of the Zoo. The fees charged for these classes are applied
to the cost of providing them. Fees were projected to be $26,110 in Fiscal 2018 same as revised
Fiscal 2017.
ANIMAL ADOPTION DONATIONS
Zoo patrons make animal adoption donations to help support their favorite animal at the Zoo.
The funds are used to purchase food and supplies for the animal, and a plaque is erected with the
donor’s name. These donations vary year to year ranging from $645 to $5,455 and are
conservatively estimated for Fiscal 2018 to be $1,000.
MISCELLANEOUS REVENUES
These revenues include sale of animals, concessions and other miscellaneous items that the Zoo
Building Fund receives. Total combined miscellaneous revenues for Fiscal 2018 are estimated to
be $2,000.
INTEREST INCOME Interest income is anticipated to be $8,000 for Fiscal 2018 which is the same as the Fiscal year
2017 revised estimate. This is based on an investment rate of 0.50%.
Page 82

EXPENDITURES PERSONNEL SERVICES
No personnel salaries or benefits are charged to this fund.
SUPPLIES
Supplies include plant and landscape materials and educational supplies used in various Zoo
educational programs. Expenditures are expected to be $84,400 in Fiscal 2018, reflecting a
decrease of $21,800 from the revised Fiscal 2017 budget of $106,200.
EQUIPMENT & STRUCTURE MAINTENANCE Expenditures in this category are projected at $135,400 for Fiscal 2018 of which $44,000 is
budgeted for general repairs and $91,400 to repair various structures and exhibits .
MISCELLANEOUS SERVICES
Miscellaneous services are projected to be $34,800 for Fiscal 2018. A zoo master plan was began
in Fiscal 2017 to improve landscaping in the zoo areas.
SUNDRY CHARGES
There are no expenditures budgeted in this category.
INTRA-GOVERNMENTAL TRANSFERS
A transfer to the General Fund of $28,599 is budgeted for projected payroll costs of a full-time
laborer position.
CAPITAL OUTLAY
There are no expenditures budgeted in this category.
FUND BALANCE
City Financial Policies require the Zoo Building Fund to maintain a fund balance of zero or
greater because this fund serves as a construction fund for zoo expansion projects and depends
heavily on contributions for its income. However, excess funds are retained from year to year
and applied to various projects or used as grant matches. The Fund has maintained fund
balances in previous years and is anticipated to have a fund balance of $1,391,440 at Fiscal 2018
year-end.
Page 83

COURT SECURITY/TECHNOLOGY FUND
REVENUES The Court Security/Technology Fund revenues are generated through the Municipal Court. By
Ordinance an assessment of $7.00 is included in the cost of each fine. $3.00 of each assessment
is to be used for security and $4.00 is to be used for technology purposes in the Municipal Court.
Fiscal year 2018 revenues are estimated to remain the same as previous year budget of $40,000.
EXPENDITURES PERSONNEL SERVICES
No personnel salaries or benefits are charged to this fund.
SUPPLIES
Court Security supplies are anticipated to be $5,460 in Fiscal 2018, an increase of $355 from
Fiscal year 2017 revised estimate of $5,105. Supplies in this category include purchases to outfit
the City Marshal’s ammunition, supply, and uniform needs.
EQUIPMENT & STRUCTURE MAINTENANCE
Expenditures in Fiscal 2018 in this category are expected to remain the same as prior year
revised amount of $17,340. Expenditures in this category will be for Computer program
maintenance fees and security camera repairs as needed.
MISCELLANEOUS SERVICES
Anticipated costs of miscellaneous services are $2,710 for Fiscal 2018 which is an decrease of
$166 below the Fiscal 201 revised estimate of $2,866. Travel & Training and Dues &
membership are expensed in this category.
SUNDRY CHARGES
There are no expenditures budgeted in this category.
CAPITAL OUTLAY
There are no expenditures budgeted in this category in Fiscal 2018.
INTRA-GOVERNMENTAL TRANSFERS
There are no expenditures budgeted in this category in Fiscal 2018.
FUND BALANCE City Financial Policies requires the Court Security/Technology Fund to maintain a fund balance
of zero or greater. However, excess funds are retained from year to year and applied to various
security, and technology equipment purchases. The revised Fiscal 2017 ending fund balance was
estimated at $42,776 with an anticipated fund balance of $51,256 for Fiscal 2018.
Page 84

MAIN STREET/COMM DEV DWNTN FUND
REVENUES The revenues for this fund are strictly contributions received from the City’s Hoedown Booth
rentals and memberships. Current Year revenues are estimated to be $22,645.
EXPENDITURES
SUPPLIES
Expenditures in this category such as event supplies, lights, signs, and food supplies are expected
to be $5,450 in Fiscal 2018.
MISCELLANEOUS SERVICES
Expenditures in the category are for event costs, entertainment, landscaping, and advertising.
Fiscal year 2018 expenditures are expected to be $14,000.
ANIMAL CONTROL KURTH GRANT FUND
REVENUES The revenues for this fund are strictly contributions received as a grant through the Kurth
Foundation in support of the Kurth Memorial Animal Shelter and interest earnings on those
funds. Current Year revenues are estimated to be $91,200.
EXPENDITURES MISCELLANEOUS SERVICES
Expenditures for this category are expected to be $40,000 for Fiscal 2018. Monies will be used
to provide spay and neutering services.
INTRA-GOVERNMENTAL TRANSFERS
Expenditures in the fund are for the non-salaried operations of the Kurth Memorial Animal
Shelter. Fiscal year 2017 expenditures include a transfer to the General Fund to subsidize the
costs of supplies needed for shelter operations. The transfer to the General Fund is budgeted at
$90,000 for Fiscal 2018.
Page 85

ANIMAL ATTIC GIFT FUND
REVENUES Animal Attic Gift Fund revenues are donations received from individuals for the support of
animals at the shelter. Current year revenues are expected to be approximately $15,150, which is
comprised of donations and interest income.
EXPENDITURES
SUPPLIES
Expenditures in this category is for purchasing a chicken coop at $1,000 for this budget year.
EQUIPMENT MAINTENANCE
Expenditures for Fiscal 2018 is $6,000 in this category are for trench drain covers.
CAPITAL OUTLAY
Expenditures for Fiscal 2018 in this category are expected to be $10,000 for the purchase of an 8
foot animal control slide-in unit.
Page 86

COMPONENT UNITS There are two component units for which the City appropriates Fiscal expenditures. These
governmental fund types are budgeted on a modified accrual basis wherein obligations of the
Component units are budgeted as expenditures but revenues are recognized and recorded when
they are available and become measurable.
The Economic Development Fund is a Component Unit and was established to account for the
sales tax portion allocated to economic development within the City. Revenues to the fund are
derived from 1/8th of each cent of sales tax collections in the City.
The Lufkin Convention and Visitor Bureau was formed in 2010 with the primary objective to
create maximum hotel occupancy within the city through a marketing program aimed at
attracting and securing overnight visitors who will spend money in the Lufkin area.
Page 87
ECONOMIC DEVELOPMENT FUND –
COMPONENT UNIT
(Discretely Presented)
REVENUES
Revenues for the Economic Development Fund are derived from the City’s Sales Tax Revenues
and interest income. 1/8 of each cent of the City’s Sales Tax Revenues is dedicated to the
Economic Development Fund. Revenues for Fiscal 2018 are anticipated to be $1,502,739. This
is a decrease below the Fiscal 2017 revised estimate of $1,512,187 due to decrease in sales tax
revenue.
EXPENDITURES PERSONNEL SERVICES
Salaries and benefits for the Economic Development Fund including non-departmental portions
are anticipated to be $211,726 in Fiscal 2018. In FY 2018, budget was increased to hire an
Economic Development director and specialist positions. In FY2017 the director duties were
performed by the administration.
SUPPLIES
Expenditures for supplies are anticipated to be $10,440 in Fiscal 2018 slightly increasing from
the $9,750 revised estimate for Fiscal 2017.
EQUIPMENT & STRUCTURE MAINTENANCE
There are no expenditures budgeted in this category.
MISCELLANEOUS SERVICES
Anticipated costs of miscellaneous services are $242,635 for Fiscal 2018, above the Fiscal 2017
revised estimate of $234,705 by 3.38%.
SUNDRY CHARGES
Sundry charges include incentives paid by the Economic Development Fund. The Fiscal 2018
estimate is $19,000 and $15,330 from the non-departmental sundry charges. Total sundry
charges for Fiscal 2018 is $3,820 higher than the $30,510 for Fiscal 2017 revised.
CAPITAL OUTLAY
There are no expenditures budgeted in this category.
DEBT SERVICE
Note interest payments to Banc Corp South for Angelina Manufacturing in Fiscal 2108 are
$185,479.
Page 88

NON-DEPARTMENTAL
Non-departmental expenditures may include personnel services, miscellaneous services, sundry
charges, debt service expenses, and transfers. General and administrative expenses are
transferred to the General Fund to reimburse for services provided by other departments such as
accounting, purchasing, data processing and human resources assistance within the City.
General and administrative fees for Fiscal year 2018 are $15,330. An allocation table of G&A
calculations can be found in the Appendix on page 330.
FUND BALANCE Council Financial Policies requires the Economic Development Fund to maintain a fund balance
of zero or greater. However, excess funds are retained from year to year and are applied to the
fund balance for future expansion projects to boost the economy and development of business
within the City of Lufkin. The anticipated fund balance at Fiscal 2018 year-end is $8,234,062.
Page 89

LUFKIN CONVENTION AND VISITOR BUREAU –
COMPONENT UNIT
(Discretely Presented)
REVENUES
Revenues for the Lufkin Convention and Visitor Bureau (LCVB) are derived from the City’s
Hotel/Motel Tax. Forty-two percent ($399,000) of the hotel/motel occupancy tax collected and
recorded in the Hotel/Motel Tax Fund is allocated to the Lufkin Convention and Visitor Bureau.
Total revenues for Fiscal 2018 are anticipated to be $513,380, which includes estimated interest
earnings of $1,200 and revenues from various events of $34,600.
EXPENDITURES PERSONNEL SERVICES
Salaries and benefits for the LCVB are anticipated to be $243,215 in Fiscal 2017, increasing by
$86,815 from the Fiscal 2017 revised estimate of $156,400. This increase is due to a newly
added division of Main Street to this fund. The position of Main Street director will be funded
by a transfer from the General Fund.
SUPPLIES
Expenditures for supplies are anticipated to increase to $7,756 in Fiscal 2018 from the revised
estimate of $6,050 for Fiscal 2017.
EQUIPMENT & STRUCTURE MAINTENANCE
There are no expenditures budgeted in this category.
MISCELLANEOUS SERVICES
Anticipated costs of miscellaneous services are $342,685 for Fiscal 2018, above the Fiscal 2017
revised estimate of $300,650 by 13.98%.
SUNDRY CHARGES
Anticipated costs for sundry charges for Fiscal year 2018 are $3,640, which is $1,860 more than
the revised estimate for Fiscal 2017 of $1,780.
CAPITAL OUTLAY
There are no expenditures budgeted in this category.
NON-DEPARTMENTAL
A contingency of $100,000 was set aside for necessities as approved by the Lufkin Convention
and Visitor Bureau Board. General and administrative expenses are transferred to the General
Fund to reimburse for services provided by other departments such as accounting, purchasing,
data processing and human resources assistance within the City. General and administrative fees
Page 90
for Fiscal year 2018 are $2,690. An allocation table of G&A calculations can be found in the
Appendix on page 331.
FUND BALANCE The Council has not adopted any fund balance policies for the LCVB. Expenditures are
budgeted based on revenue projections. The fund balance for LCVB is projected to be a
$160,073 at the end of Fiscal year 2018.
Page 91

Page 92
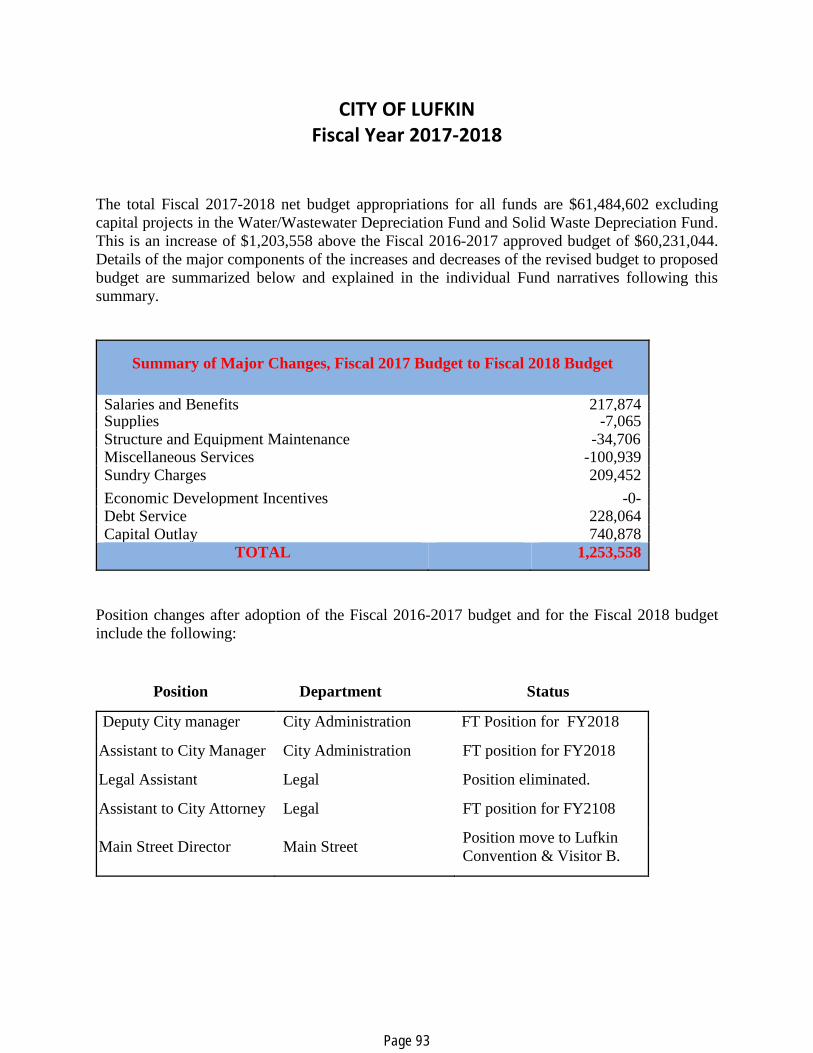
CITY OF LUFKIN Fiscal Year 2017-2018
The total Fiscal 2017-2018 net budget appropriations for all funds are $61,484,602 excluding
capital projects in the Water/Wastewater Depreciation Fund and Solid Waste Depreciation Fund.
This is an increase of $1,203,558 above the Fiscal 2016-2017 approved budget of $60,231,044.
Details of the major components of the increases and decreases of the revised budget to proposed
budget are summarized below and explained in the individual Fund narratives following this
summary.
Position changes after adoption of the Fiscal 2016-2017 budget and for the Fiscal 2018 budget
include the following:
Position Department Status
Deputy City manager City Administration FT Position for FY2018
Assistant to City Manager City Administration FT position for FY2018
Legal Assistant Legal Position eliminated.
Assistant to City Attorney Legal FT position for FY2108
Main Street Director Main Street Position move to Lufkin
Convention & Visitor B.
Summary of Major Changes, Fiscal 2017 Budget to Fiscal 2018 Budget
Salaries and Benefits 217,874 Supplies -7,065 Structure and Equipment Maintenance -34,706
317,197 Miscellaneous Services -100,939 Sundry Charges 209,452
Economic Development Incentives -0- Debt Service 228,064 Capital Outlay 740,878
TOTAL 1,253,558
Page 93

Fiscal Fiscal Fiscal Fiscal Fiscal
2014 2015 2016 2017 2018
GENERAL FUND
Full Time 348 353 354 355 350
Part Time 19 18 17 17 17
Total 367 371 371 372 367
WATER-WASTEWATER FUND
Full Time 71 71 70 70 72
Part Time 2 2 2 2 2
Total 73 73 72 72 74
SOLID WASTE-RECYCLING FUND
Full Time 33 33 33 33 34
Part Time 0 0 0 0 0
Total 33 33 33 33 34
CONVENTION CENTER FUND
Full Time 8 8 8 8 8
Part Time 0 0 0 0 0
Total 8 8 8 8 8
COURT SECURITY-TECHNOLOGY FUND
Full Time 0 0 0 0 0
Part Time 0 0 0 0 0
Total 0 0 0 0 0
SPECIAL RECREATION FUND
Full Time 0 0 0 0 0
Part Time 25 25 25 25 25
Total 0 0 0 0 0
ECONOMIC DEVELOPMENT FUND
Full Time 2 2 2 2 2
Part Time 0 0 0 0 0
Total 2 2 2 2 2
LUFKIN CONVENTION & VISITOR BUREAU
Full Time 2 2 2 2 3
Part Time 0 0 0 0 0
Total 2 2 2 2 3
CITY WIDE TOTAL
Full Time 464 469 469 470 469
Part Time 46 45 44 44 44
Total 510 514 513 514 513
FISCAL 2018
TOTAL OPERATING BUDGET RESOURCES
CITY OF LUFKIN, TEXAS
Page 94

Water Wastewater$17,282,300
29%
O ther$4,133,899
7%
Taxes$21,926,524
36%
Franchise Fees$2,330,000
4%
Solid Waste$6,705,500
11%Fines & Permits
$1,381,875 2%
Debt Retirement$3,042,773
5%
Charges for Service$3,575,193
6%
Combined Budget Resources
$60,378,064
Personnel Services$31,122,924
44%
Supplies$3,428,557
5%
Equipment Maintenance
$3,775,136
5% Miscellaneous Sevices
$10,256,746
15%
Sundry$3,815,605
5%
Debt Service$6,959,795
10%Transfers$4,109,793
6%
Intra-governmental$5,203,283
7%
Capital Outlay$1,834,363
3%
Combined Budget Expenditures
$61,484,602
Page 95

FY2016 FY2017 FY2017 FY2018
Actual Budget Adjusted Budget
Beginning Balances
General Fund 11,169,361$ 9,871,452$ 10,480,401$ 9,889,890$
Water/Wastewater Fund 3,428,154 4,730,853 4,307,960 3,992,446
Solid Waste Disposal Fund 4,735,655 4,802,387 4,833,939 4,894,700
Hotel/Motel Tax Fund (225,075) (187,635) (15,584) 10,795
Special Recreation Fund 86,410 74,111 92,769 91,306
Pines Theater Special Events Fund 23,168 (7,027) (14,887) (16,400)
Ellen Trout Zoo Fund 1,812,718 987,654 1,418,823 1,336,529
Court Security/Technology Fund 12,484 3,436 14,212 28,901
Heritage Festival Contribution 23,211 18,822 27,933 32,946
Animal Control-Kurth Grant Fund 229,918 134,598 105,462 51,662
Animals Attic Gift Shop Fund 40,372 28,522 38,764 23,324
General Obligation Debt
Service Fund 1,811,937 1,268,478 1,406,542 1,806,925
Equipment Acquisition & Repl Fund 994,672 608,001 784,824 1,370,449
Sub-Total Operating Funds 24,142,985$ 22,333,652$ 23,481,158$ 23,513,473$
Economic Development Fund 8,230,177 7,874,493 8,550,058 8,153,933
Lufkin Convention & Visitor Bureau 214,914 123,250 269,213 243,989
Total Beginning Balances 32,588,076$ 30,331,395$ 32,300,429$ 31,911,395$
Revenues and Transfers In
General Fund 33,070,427$ 33,081,212$ 33,177,537$ 32,708,018$
Water/Wastewater Fund 17,286,698 17,184,142 17,419,935 17,411,486
Solid Waste Disposal Fund 6,469,005 6,472,332 6,558,248 6,705,500
Hotel/Motel Tax Fund 1,391,917 1,187,150 1,246,765 1,206,200
Special Recreation Fund 413,915 485,955 451,260 457,470
Pines Theater Special Events Fund 155,052 172,863 152,441 150,963
Ellen Trout Zoo Fund 432,620 312,291 335,410 338,110
Court Security/Technology Fund 34,953 40,000 40,000 40,000
Heritage Festival Contribution 19,642 18,945 22,713 22,645
Animal Control-Kurth Grant Fund 117,064 146,200 91,200 91,200
Animals Attic Gift Shop Fund 11,559 10,150 15,628 15,150
General Obligation Debt
Service Fund 16,074,321 6,365,179 6,897,217 6,645,618
Equipment Acquisition & Repl Fund 1,903,181 1,814,776 1,816,276 1,591,185
Sub-Total Operating Funds 77,380,354$ 67,291,195$ 68,224,630$ 67,383,545$
Economic Development Fund 1,296,940 1,490,009 1,512,187 1,502,739
Lufkin Convention & Visitor Bureau 464,614 417,150 439,656 513,380
Total Revenues & Transfers In 79,141,908$ 69,198,354$ 70,176,473$ 69,399,664$
Less: Interfund Transfers in 8,092,868 8,917,474 9,363,587 9,021,600
Net Budget Revenue 71,049,040$ 60,280,880$ 60,812,886$ 60,378,064$
Total Funds Available 103,637,116$ 90,612,275$ 93,113,315$ 92,289,459$
CITY OF LUFKIN
COMBINED FUNDS SUMMARY
Fiscal Year 2018 Operating Budget
Page 96

FY2016 FY2017 FY2017 FY2018
Actual Budget Adjusted Budget
Appropriations and Transfers Out
General Fund 33,759,387$ 33,509,358$ 33,768,048$ 33,411,583$
Water/Wastewater Fund 16,406,892 17,429,667 17,735,449 17,427,015
Solid Waste Disposal Fund 6,370,721 6,629,747 6,497,487 6,715,985
Hotel/Motel Tax Fund 1,182,426 1,177,598 1,220,386 1,212,561
Special Recreation Fund 407,556 465,694 452,723 456,861
Pines Theater Special Events Fund 193,107 172,835 153,954 172,335
Ellen Trout Zoo Fund 826,515 282,099 417,704 283,199
Court Security/Technology Fund 33,225 37,955 25,311 25,510
Heritage Festival Contribution 14,920 17,700 17,700 19,450
Animal Control-Kurth Grant Fund 241,520 145,000 145,000 130,000
Animals Attic Gift Shop Fund 13,167 20,590 31,068 17,000
General Obligation Debt
Service Fund 16,479,716 6,526,559 6,496,834 6,683,434
Equipment Acquisition & Repl Fund 2,113,029 1,093,485 1,230,651 1,931,363
Sub-Total Operating Funds 78,042,181$ 67,508,287$ 68,192,315$ 68,486,296$
Economic Development Fund 977,059 1,210,747 1,908,312 1,422,610
Lufkin Convention & Visitor Bureau 410,315 479,484 464,880 597,296
Total Appropriations & Transfers Out 79,429,555 69,198,518 70,565,507 70,506,202
Less: Interfund Transfers Out 8,092,868 8,917,474 9,363,587 9,021,600
Net Budget Appropriations 71,336,687$ 60,281,044$ 61,201,920$ 61,484,602$
Ending Balances
General Fund 10,480,401 9,443,306 9,889,890 9,186,325
Water/Wastewater Fund 4,307,960 4,485,328 3,992,446 3,976,917
Solid Waste Disposal Fund 4,833,939 4,644,972 4,894,700 4,884,215
Hotel/Motel Tax Fund (15,584) (178,083) 10,795 4,434
Special Recreation Fund 92,769 94,372 91,306 91,915
Pines Theater Special Events Fund (14,887) (6,999) (16,400) (37,772)
Ellen Trout Zoo Fund 1,418,823 1,017,846 1,336,529 1,391,440
Court Security/Technology Fund 14,212 5,481 28,901 43,391
Main Street/Comm Dev Downtown 27,933 20,067 32,946 36,141
Animal Control-Kurth Grant Fund 105,462 135,798 51,662 12,862
Animals Attic Gift Shop Fund 38,764 18,082 23,324 21,474
General Obligation Debt
Service Fund 1,406,542 1,107,098 1,806,925 1,769,109
Equipment Acquisition & Repl Fund 784,824 1,329,292 1,370,449 1,030,271
Sub-Total Operating Funds 23,481,158$ 22,116,560$ 23,513,473$ 22,410,722$
Economic Development Fund 8,550,058 8,153,755 8,153,933 8,234,062
Lufkin Convention & Visitor Bureau 269,213 60,916 243,989 160,073
Total Ending Balances 32,300,429 30,331,231 31,911,395 30,804,857
Total Funds Applied 103,637,116$ 90,612,275$ 93,113,315$ 92,289,459$
COMBINED FUNDS SUMMARY
Fiscal Year 2018 Operating Budget
CITY OF LUFKIN
Page 97
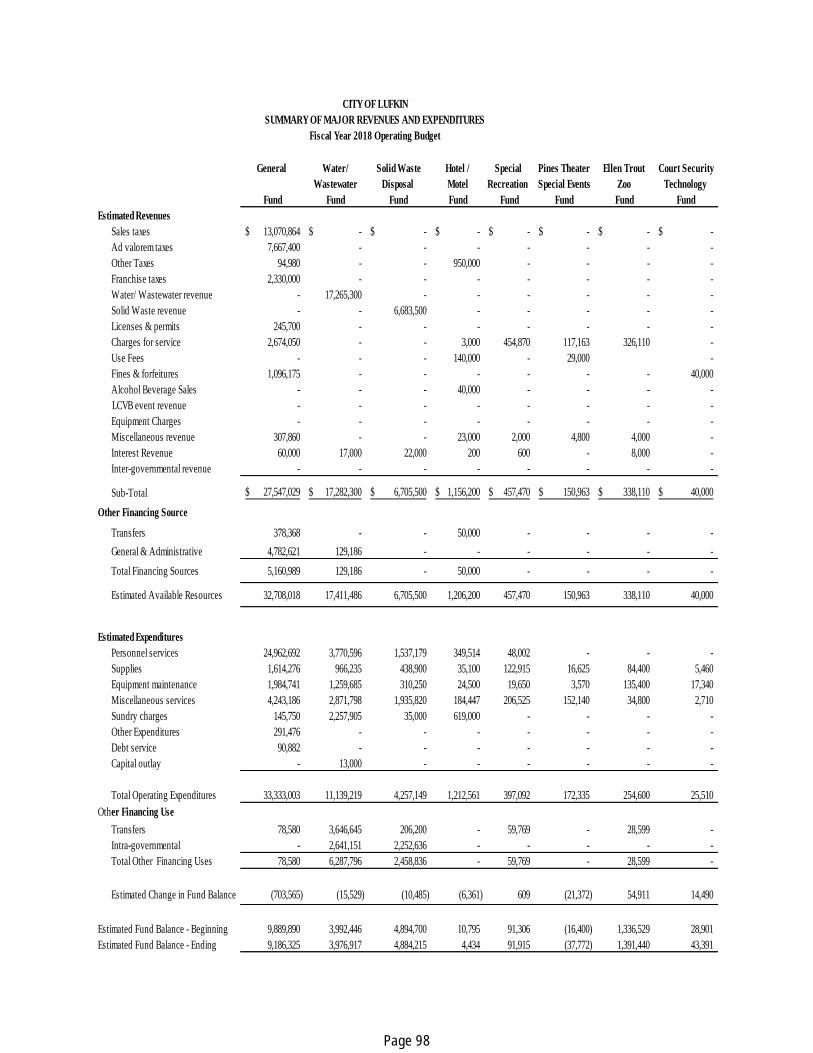
General Water/ Solid Waste Hotel / Special Pines Theater Ellen Trout Court Security
Wastewater Disposal Motel Recreation Special Events Zoo Technology
Fund Fund Fund Fund Fund Fund Fund Fund
Estimated Revenues
Sales taxes 13,070,864$ -$ -$ -$ -$ -$ -$ -$
Ad valorem taxes 7,667,400 - - - - - - -
Other Taxes 94,980 - - 950,000 - - - -
Franchise taxes 2,330,000 - - - - - - -
Water/ Wastewater revenue - 17,265,300 - - - - - -
Solid Waste revenue - - 6,683,500 - - - - -
Licenses & permits 245,700 - - - - - - -
Charges for service 2,674,050 - - 3,000 454,870 117,163 326,110 -
Use Fees - - - 140,000 - 29,000 -
Fines & forfeitures 1,096,175 - - - - - - 40,000
Alcohol Beverage Sales - - - 40,000 - - - -
LCVB event revenue - - - - - - - -
Equipment Charges - - - - - - - -
Miscellaneous revenue 307,860 - - 23,000 2,000 4,800 4,000 -
Interest Revenue 60,000 17,000 22,000 200 600 - 8,000 -
Inter-governmental revenue - - - - - - - -
Sub-Total 27,547,029$ 17,282,300$ 6,705,500$ 1,156,200$ 457,470$ 150,963$ 338,110$ 40,000$
Other Financing Source
Transfers 378,368 - - 50,000 - - - -
General & Administrative 4,782,621 129,186 - - - - - -
Total Financing Sources 5,160,989 129,186 - 50,000 - - - -
Estimated Available Resources 32,708,018 17,411,486 6,705,500 1,206,200 457,470 150,963 338,110 40,000
Estimated Expenditures
Personnel services 24,962,692 3,770,596 1,537,179 349,514 48,002 - - -
Supplies 1,614,276 966,235 438,900 35,100 122,915 16,625 84,400 5,460
Equipment maintenance 1,984,741 1,259,685 310,250 24,500 19,650 3,570 135,400 17,340
Miscellaneous services 4,243,186 2,871,798 1,935,820 184,447 206,525 152,140 34,800 2,710
Sundry charges 145,750 2,257,905 35,000 619,000 - - - -
Other Expenditures 291,476 - - - - - - -
Debt service 90,882 - - - - - - -
Capital outlay - 13,000 - - - - - -
Total Operating Expenditures 33,333,003 11,139,219 4,257,149 1,212,561 397,092 172,335 254,600 25,510
Other Financing Use
Transfers 78,580 3,646,645 206,200 - 59,769 - 28,599 -
Intra-governmental - 2,641,151 2,252,636 - - - - -
Total Other Financing Uses 78,580 6,287,796 2,458,836 - 59,769 - 28,599 -
Estimated Change in Fund Balance (703,565) (15,529) (10,485) (6,361) 609 (21,372) 54,911 14,490
Estimated Fund Balance - Beginning 9,889,890 3,992,446 4,894,700 10,795 91,306 (16,400) 1,336,529 28,901
Estimated Fund Balance - Ending 9,186,325 3,976,917 4,884,215 4,434 91,915 (37,772) 1,391,440 43,391
SUMMARY OF MAJOR REVENUES AND EXPENDITURES
Fiscal Year 2018 Operating Budget
CITY OF LUFKIN
Page 98

MainStreet Animal Animal's Attic Debt Equipment Economic Lufkin Total
Comm Dev.Dwntwn Control Gift Shop Service Acq & Repl Development CVB Budgeted
Fund Fund Fund Fund Fund Fund Fund Funds
-$ -$ -$ -$ -$ 1,188,260$ -$ 14,259,124$
- - - 3,032,773 - - - 10,700,173
- - - - - - - 1,044,980
- - - - - - - 2,330,000
- - - - - - - 17,265,300
- - - - - - - 6,683,500
- - - - - - - 245,700
- - - - - - - 3,575,193
- - - - - - - 169,000
- - - - - - - 1,136,175
- - - - - - - 40,000
- - - - - - 31,650 31,650
- - - - 1,585,185 - - 1,585,185
22,525 90,000 15,000 - - 298,479 401,950 1,169,614
120 1,200 150 10,000 6,000 16,000 1,200 142,470
- - - - - - -
22,645$ 91,200$ 15,150$ 3,042,773$ 1,591,185$ 1,502,739$ 434,800$ 60,378,064$
- - - 3,602,845 - - 78,580 4,109,793
- - - - - - - 4,911,807
- - - 3,602,845 - - 78,580 9,021,600
22,645 91,200 15,150 6,645,618 1,591,185 1,502,739 513,380 69,399,664 -
- - - - - 211,726 243,215 31,122,924
5,450 - 1,000 - 120,000 10,440 7,756 3,428,557
14,000 - 6,000 - - - - 3,775,136
- 40,000 - - 242,635 342,685 10,256,746
- - - - - 757,000 950 3,815,605
- - - - - - - 291,476
- - - 6,683,434 - 185,479 - 6,959,795
- - 10,000 - 1,811,363 - - 1,834,363
-
19,450 40,000 17,000 6,683,434 1,931,363 1,407,280 594,606 61,484,602
-
- 90,000 - - - - - 4,109,793
- - - - - 15,330 2,690 4,911,807
- 90,000 - - - 15,330 2,690 9,021,600
-
3,195 (38,800) (1,850) (37,816) (340,178) 80,129 (83,916) (1,106,538)
-
32,946 51,662 23,324 1,806,925 1,370,449 8,153,933 243,989 31,911,395
36,141 12,862 21,474 1,769,109 1,030,271 8,234,062 160,073 30,804,857
Page 99

FY2016 FY2017 FY2017 FY2018
Actual Budget Adjusted Budget
Beginning Balance 11,169,361$ 9,871,452$ 10,480,401$ 9,889,890$
Revenues
Taxes 21,036,636 20,781,382 20,952,684 20,833,244
Franchise taxes 2,382,981 2,397,000 2,352,684 2,330,000
Licenses & permits 321,834 308,970 226,321 245,700
Charges for service 2,813,904 2,686,765 2,677,365 2,674,050
Fines & forfeitures 1,063,801 1,095,675 1,085,802 1,096,175
Miscellaneous revenue 553,564 388,810 446,665 367,860
Inter-governmental revenue 106,203 19,000.00 27,406 -
Sub-Total 28,278,923 27,677,602 27,768,927 27,547,029
Intra-governmental revenue 4,791,504 5,403,610 5,408,610 5,160,989
Total Revenues & Transfers 33,070,427 33,081,212 33,177,537 32,708,018
Total Funds Available 44,239,788$ 42,952,664$ 43,657,938$ 42,597,908$
Expenditures
Personnel services 24,962,057$ 25,024,638$ 25,053,993$ 24,962,692$
Supplies 1,736,315 1,708,887 1,665,277 1,614,276
Equipment maintenance 1,903,432 2,091,037 2,361,728 1,984,741
Miscellaneous services 3,839,179 4,228,376 4,226,993 4,243,186
Sundry charges 122,941 145,250 148,887 145,750
Debt service 0 90,881 90,881 90,882
Transfers out 1,167,416 220,289 220,289 370,056
Capital outlay 28,047 - - -
Total Operating Expenditures 33,759,387 33,509,358 33,768,048 33,411,583
Excess(deficiency) of revenues
over expenditures (688,960) (428,146) (590,511) (703,565)
Fund balance ending 10,480,401 9,443,306 9,889,890 9,186,325
Total Funds Applied 44,239,788$ 42,952,664$ 43,657,938$ 42,597,908$
General government 3,909,633$ 4,177,994$ 4,184,239$ 4,210,354$
Public safety 19,372,453 18,656,005 19,347,740 19,187,059
Public works 4,788,209 5,184,946 5,348,594 4,930,485
Culture and recreation 3,898,420 4,095,236 3,915,692 3,908,445
Community development 420,860 434,701 427,243 254,527
Non departmental 202,396 740,187 324,251 550,657
Transfers 1,167,416 220,289 220,289 370,056
Total Departmental Expenditures 33,759,387 33,509,358 33,768,048 33,411,583
Excess(deficiency) of revenues
over expenditures (688,960) (428,146) (590,511) (703,565)
Fund balance ending 10,480,401 9,443,306 9,889,890 9,186,325
Total Funds Applied 44,239,788$ 42,952,664$ 43,657,938$ 42,597,908$
Fund balance requirements 8,439,847 8,377,340 8,442,012 8,352,896
Amount over Policy 2,040,554$ 1,065,967$ 1,447,878$ 833,429$
CITY OF LUFKIN
GENERAL FUND SUMMARY
Fiscal Year 2018 Operating Budget
Page 100

FY2016 FY2017 FY2017 FY2018
SOURCE OF REVENUE Actual Budget Adjusted Budget
Taxes
Ad Valorem - current year 7,432,761$ 7,492,553$ 7,460,000$ 7,452,400$
Ad Valorem - prior year 122,180 95,000 120,000 120,000
Penalty & interest 94,691 95,000 95,000 95,000
Sales taxes 14,476,505 14,190,359 14,382,092 14,259,124
Economic development trf (1,206,375) (1,182,530) (1,198,508) (1,188,260)
Mixed beverage taxes 115,752 90,000 93,000 93,880
Taxicab tax 1,122 1,000 1,100 1,100
Total Taxes 21,036,636 20,781,382 20,952,684 20,833,244
Franchise Taxes
Electric franchise taxes 1,519,456 1,520,000$ 1,448,539 1,450,000$
Gas franchise taxes 233,243 270,000 235,000 235,000
Communications franchise taxes 268,719 260,000 264,500 x 264,500
Cable franchise taxes 272,056 280,000 270,000 270,000
Other 89,507 67,000 134,645 110,500
Total Franchise Taxes 2,382,981 2,397,000 2,352,684 2,330,000
Licenses & Permits
Building permits & inspect. fees 189,317 180,000$ 120,000 130,000$
Plumbing permits & inspect. fees 19,627 15,575 11,806 13,000
Heat/Vent permits & inspect. fees 19,599 16,585 17,340 17,000
Electrical permits & inspect. fees 24,227 19,880 12,037 15,000
Other permits 65,205 73,110 61,864 67,025
Other licenses 3,859 3,820 3,274 3,675
Total Licenses & Permits 321,834 308,970 226,321 245,700
Charges for Service
EMS ambulance fees 2,524,121 2,400,000 2,400,000 2,400,000
County EMS/ambulance fees 236,265 236,265 236,265 237,000
Miscellaneous charges-EMS 21,212 16,500 9,000 6,500
Miscellaneous charges-Other 32,306 34,000 32,100 30,550
Total Charges for Services 2,813,904 2,686,765 2,677,365 2,674,050
Fines & Forfeitures
Court fines 772,594 822,500 812,627 816,000
Parking meter fines 25 175 175 175
Red light fines 291,182 273,000 273,000 280,000
Total Fines & Forfeitures 1,063,801 1,095,675 1,085,802 1,096,175
Miscellaneous Revenues
Parks 27,159 26,000 29,000 29,500
Library 22,674 27,000 18,000 23,000
Zoo 104,016 103,000 103,000 103,000
Animal shelter fees 78,271 81,050 67,900 66,900
Sale of Property 31,826 - 44,768 -
Salvage & auction 75,559 - 300 -
CITY OF LUFKIN
GENERAL FUND
REVENUE BY SOURCE
Fiscal Year 2018 Operating Budget
Page 101
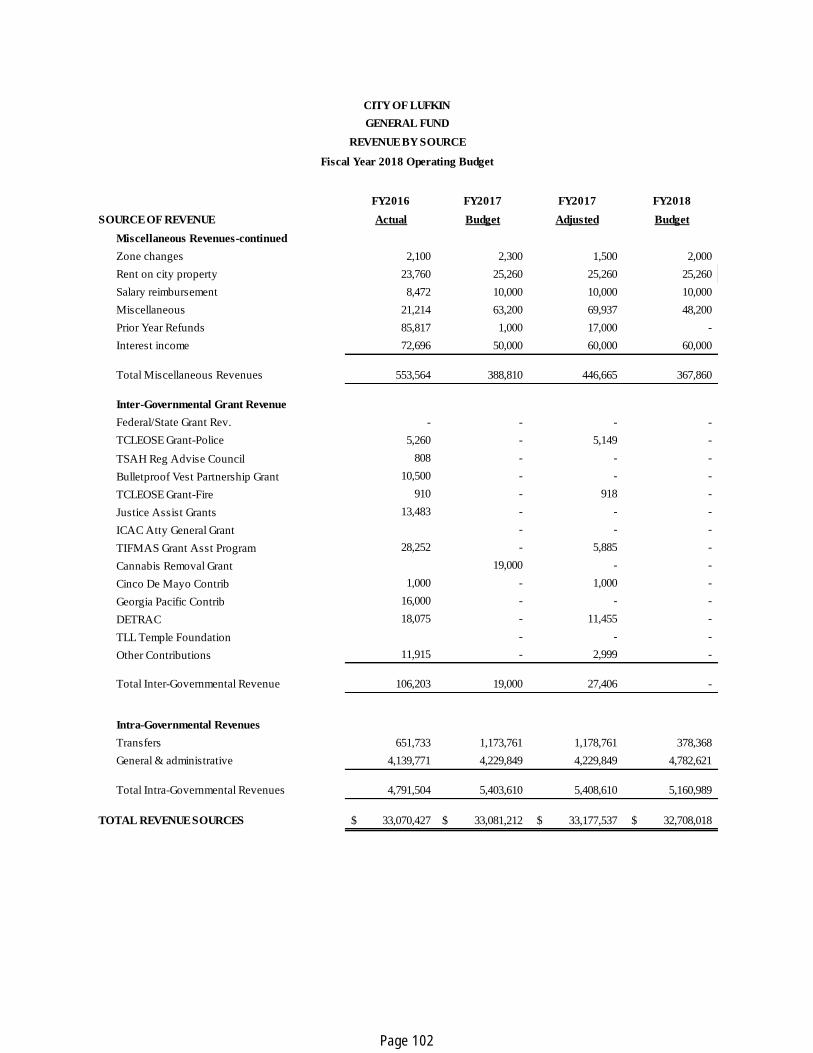
FY2016 FY2017 FY2017 FY2018
SOURCE OF REVENUE Actual Budget Adjusted Budget
Miscellaneous Revenues-continued
Zone changes 2,100 2,300 1,500 2,000
Rent on city property 23,760 25,260 25,260 25,260
Salary reimbursement 8,472 10,000 10,000 10,000
Miscellaneous 21,214 63,200 69,937 48,200
Prior Year Refunds 85,817 1,000 17,000 -
Interest income 72,696 50,000 60,000 60,000
Total Miscellaneous Revenues 553,564 388,810 446,665 367,860
Inter-Governmental Grant Revenue
Federal/State Grant Rev. - - - -
TCLEOSE Grant-Police 5,260 - 5,149 -
TSAH Reg Advise Council 808 - - -
Bulletproof Vest Partnership Grant 10,500 - - -
TCLEOSE Grant-Fire 910 - 918 -
Justice Assist Grants 13,483 - - -
ICAC Atty General Grant - - -
TIFMAS Grant Asst Program 28,252 - 5,885 -
Cannabis Removal Grant 19,000 - -
Cinco De Mayo Contrib 1,000 - 1,000 -
Georgia Pacific Contrib 16,000 - - -
DETRAC 18,075 - 11,455 -
TLL Temple Foundation - - -
Other Contributions 11,915 - 2,999 -
Total Inter-Governmental Revenue 106,203 19,000 27,406 -
Intra-Governmental Revenues
Transfers 651,733 1,173,761 1,178,761 378,368
General & administrative 4,139,771 4,229,849 4,229,849 4,782,621
Total Intra-Governmental Revenues 4,791,504 5,403,610 5,408,610 5,160,989
TOTAL REVENUE SOURCES 33,070,427$ 33,081,212$ 33,177,537$ 32,708,018$
CITY OF LUFKIN
GENERAL FUND
REVENUE BY SOURCE
Fiscal Year 2018 Operating Budget
Page 102
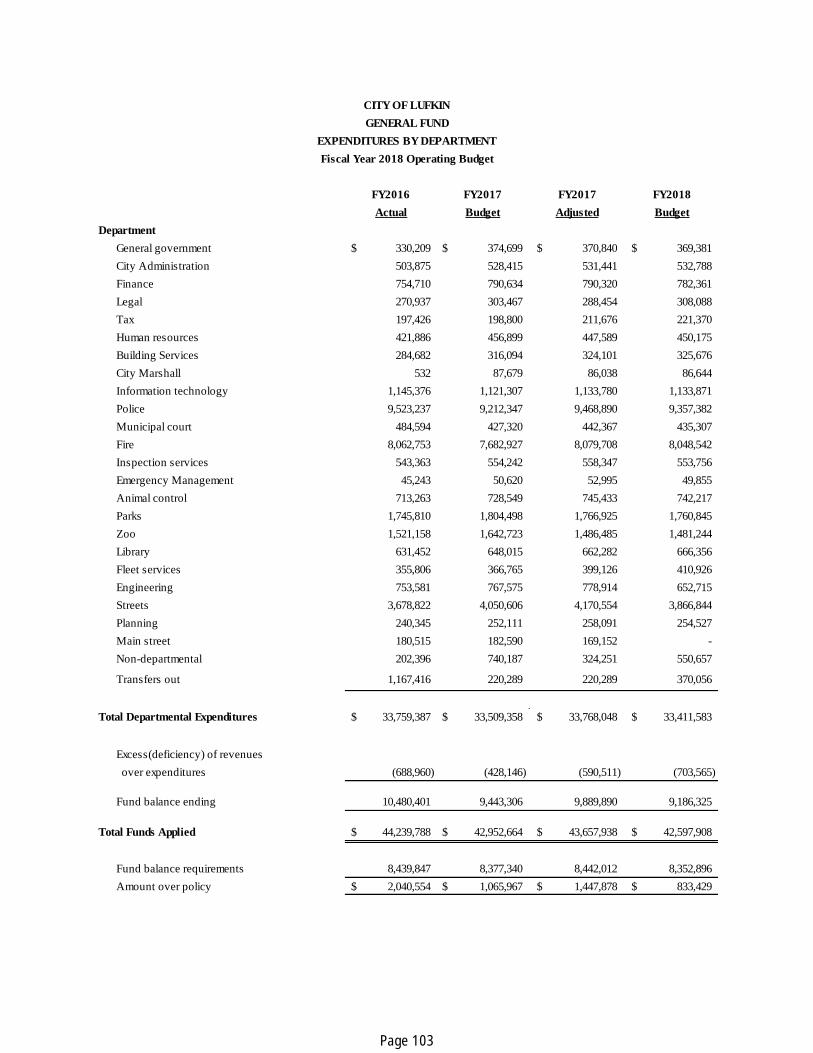
FY2016 FY2017 FY2017 FY2018
Actual Budget Adjusted Budget
Department
General government 330,209$ 374,699$ 370,840$ 369,381$
City Administration 503,875 528,415 531,441 532,788
Finance 754,710 790,634 790,320 782,361
Legal 270,937 303,467 288,454 308,088
Tax 197,426 198,800 211,676 221,370
Human resources 421,886 456,899 447,589 450,175
Building Services 284,682 316,094 324,101 325,676
City Marshall 532 87,679 86,038 86,644
Information technology 1,145,376 1,121,307 1,133,780 1,133,871
Police 9,523,237 9,212,347 9,468,890 9,357,382
Municipal court 484,594 427,320 442,367 435,307
Fire 8,062,753 7,682,927 8,079,708 8,048,542
Inspection services 543,363 554,242 558,347 553,756
Emergency Management 45,243 50,620 52,995 49,855
Animal control 713,263 728,549 745,433 742,217
Parks 1,745,810 1,804,498 1,766,925 1,760,845
Zoo 1,521,158 1,642,723 1,486,485 1,481,244
Library 631,452 648,015 662,282 666,356
Fleet services 355,806 366,765 399,126 410,926
Engineering 753,581 767,575 778,914 652,715
Streets 3,678,822 4,050,606 4,170,554 3,866,844
Planning 240,345 252,111 258,091 254,527
Main street 180,515 182,590 169,152 -
Non-departmental 202,396 740,187 324,251 550,657
Transfers out 1,167,416 220,289 220,289 370,056
Total Departmental Expenditures 33,759,387$ 33,509,358$ 33,768,048$ 33,411,583$
Excess(deficiency) of revenues
over expenditures (688,960) (428,146) (590,511) (703,565)
Fund balance ending 10,480,401 9,443,306 9,889,890 9,186,325
Total Funds Applied 44,239,788$ 42,952,664$ 43,657,938$ 42,597,908$
Fund balance requirements 8,439,847 8,377,340 8,442,012 8,352,896
Amount over policy 2,040,554$ 1,065,967$ 1,447,878$ 833,429$
CITY OF LUFKIN
GENERAL FUND
EXPENDITURES BY DEPARTMENT
Fiscal Year 2018 Operating Budget
Page 103

FY2016 FY2017 FY2017 FY2018
Actual Budget Adjusted Budget
Beginning Working Capital Balance 3,428,154$ 4,730,853$ 4,307,960$ 3,992,446$
Revenues
Water service revenue 9,119,178 9,190,810 9,245,000 9,245,000
Sewer service charges 7,688,593 7,575,460 7,720,000 7,720,000
Sub-Total 16,807,771 16,766,270 16,965,000 16,965,000
Water connections 87,205 75,000 75,000 75,000
Sewer connections 19,638 26,000 22,000 22,000
Service charges 185,536 170,000 190,000 180,000
Miscellaneous revenues 50,226 11,300 27,863 23,300
Interest income 16,519 12,000 16,500 17,000
Sub-Total 359,124 294,300 331,363 317,300
Inter/Intra-governmental revenues 119,803 123,572 123,572 129,186
Total Revenues 17,286,698 17,184,142 17,419,935 17,411,486
Total Funds Available 20,714,852$ 21,914,995$ 21,727,895$ 21,403,932$
Expenditures
Personnel services 3,086,516$ 3,729,343$ 3,537,074$ 3,770,596$
Supplies 924,229 932,895 940,260 966,235
Equipment maintenance 1,298,706 1,238,045 1,243,173 1,259,685
Miscellaneous services 2,609,678 2,930,705 2,970,150 2,871,798
Sundry charges - - - -
General and administrative 2,385,669 2,440,991 2,440,991 2,641,151
Funded depreciation 2,110,278 2,110,278 2,110,278 2,107,905
Provision for bad debts 408,523 150,000 150,000 150,000
Capital outlay - - - 13,000
Intra-governmental transfers 453,845 565,518 565,518 100,000
Transfers to debt retirement 3,129,448 3,331,892 3,778,005 3,546,645
Total 16,406,892 17,429,667 17,735,449 17,427,015
Change in Net Position 879,806 (245,525) (315,514) (15,529)
Working capital balance ending 4,307,960 4,485,328 3,992,446 3,976,917
Total Funds Applied 20,714,852$ 21,914,995$ 21,727,895$ 21,403,932$
CITY OF LUFKIN
WATER/ WASTEWATER OPERATING ENTERPRISE FUND
Fiscal Year 2018 Operating Budget
Page 104
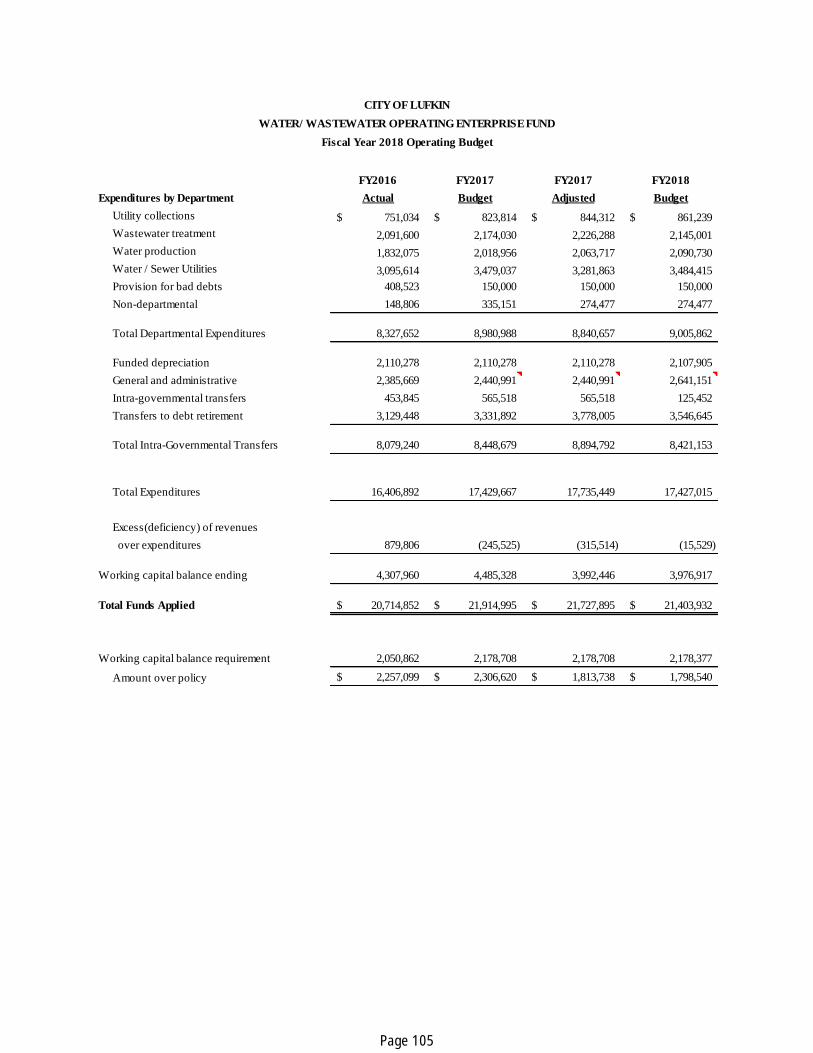
FY2016 FY2017 FY2017 FY2018
Actual Budget Adjusted Budget
Utility collections 751,034$ 823,814$ 844,312$ 861,239$
Wastewater treatment 2,091,600 2,174,030 2,226,288 2,145,001
Water production 1,832,075 2,018,956 2,063,717 2,090,730
Water / Sewer Utilities 3,095,614 3,479,037 3,281,863 3,484,415
Provision for bad debts 408,523 150,000 150,000 150,000
Non-departmental 148,806 335,151 274,477 274,477
Total Departmental Expenditures 8,327,652 8,980,988 8,840,657 9,005,862
Funded depreciation 2,110,278 2,110,278 2,110,278 2,107,905
General and administrative 2,385,669 2,440,991 2,440,991 2,641,151
Intra-governmental transfers 453,845 565,518 565,518 125,452
Transfers to debt retirement 3,129,448 3,331,892 3,778,005 3,546,645
Total Intra-Governmental Transfers 8,079,240 8,448,679 8,894,792 8,421,153
Total Expenditures 16,406,892 17,429,667 17,735,449 17,427,015
Excess(deficiency) of revenues
over expenditures 879,806 (245,525) (315,514) (15,529)
Working capital balance ending 4,307,960 4,485,328 3,992,446 3,976,917
Total Funds Applied 20,714,852$ 21,914,995$ 21,727,895$ 21,403,932$
Working capital balance requirement 2,050,862 2,178,708 2,178,708 2,178,377
Amount over policy 2,257,099$ 2,306,620$ 1,813,738$ 1,798,540$
Expenditures by Department
CITY OF LUFKIN
WATER/ WASTEWATER OPERATING ENTERPRISE FUND
Fiscal Year 2018 Operating Budget
Page 105

Department Description Amount
Utility Collections Meter replacement & Installation of 2 Fixed Read Ant. 220,000
Utility Collections Carpet Replacement in Utility Collection offices 8,500
Parks Mosquito Fogger 6,500
Parks Roof replacement Morris Frank restroom 18,240
Sewer Utilities Boiler #3 Replacement 170,000
Wastewater Treatment Gravity Thickener Repair 25,000
Wastewater Treatment Fiinal Clarifier 135,000
Sewer Utilities Lift Station Repairs 21,000
Sewer Utilities Camera Van Supplement 60,000
Sewer Utilities McElrroy Fusion Machine 36,000
Water Production Arena Street Water Line Replacement 26,800
Water Production Linkwood area Water Line Replacements 24,400
Water Production Card Drive Water Line Replacements 40,740
Water Production Electric Hoist for Water Plant #3 10,000
Water Production Replace Booster Pump #6 @ Water Plant #1 20,000
Total 822,180$
Depreciation Fund Requests
CITY OF LUFKIN
WATER/ WASTEWATER DEPRECIATION FUND
Fiscal Year 2018 Operating Budget
Page 106
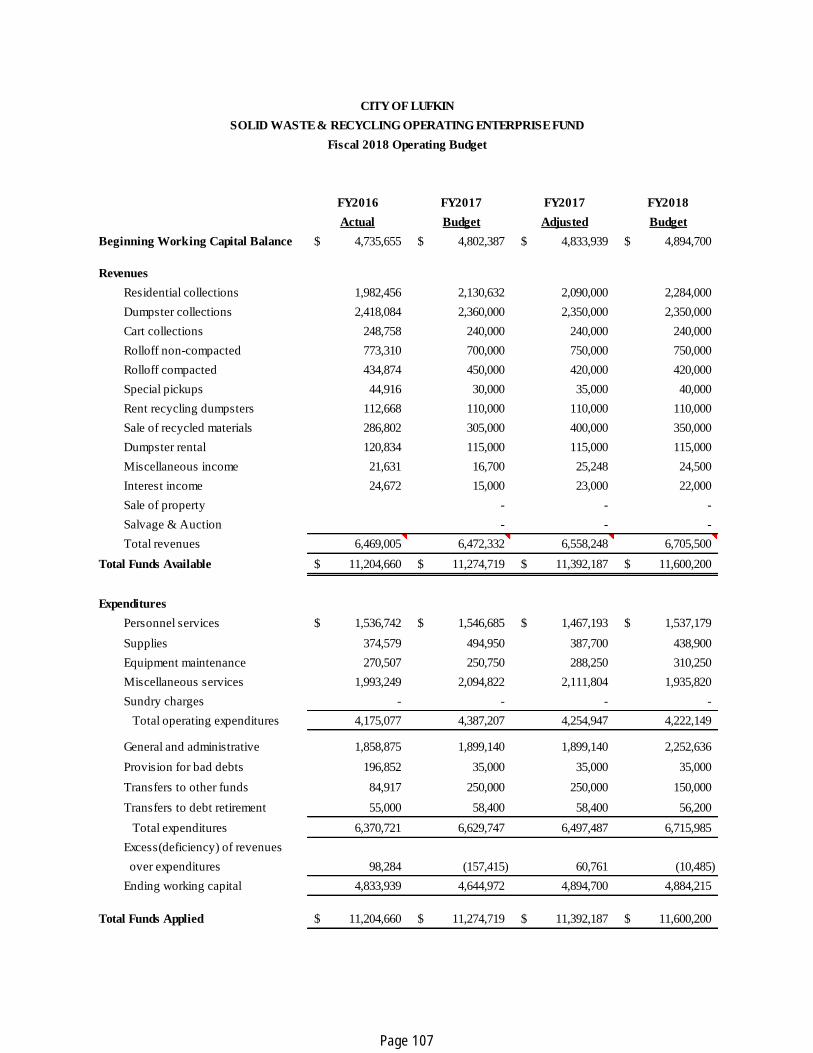
FY2016 FY2017 FY2017 FY2018
Actual Budget Adjusted Budget
Beginning Working Capital Balance 4,735,655$ 4,802,387$ 4,833,939$ 4,894,700$
Revenues
Residential collections 1,982,456 2,130,632 2,090,000 2,284,000
Dumpster collections 2,418,084 2,360,000 2,350,000 2,350,000
Cart collections 248,758 240,000 240,000 240,000
Rolloff non-compacted 773,310 700,000 750,000 750,000
Rolloff compacted 434,874 450,000 420,000 420,000
Special pickups 44,916 30,000 35,000 40,000
Rent recycling dumpsters 112,668 110,000 110,000 110,000
Sale of recycled materials 286,802 305,000 400,000 350,000
Dumpster rental 120,834 115,000 115,000 115,000
Miscellaneous income 21,631 16,700 25,248 24,500
Interest income 24,672 15,000 23,000 22,000
Sale of property - - -
Salvage & Auction - - -
Total revenues 6,469,005 6,472,332 6,558,248 6,705,500
Total Funds Available 11,204,660$ 11,274,719$ 11,392,187$ 11,600,200$
Expenditures
Personnel services 1,536,742$ 1,546,685$ 1,467,193$ 1,537,179$
Supplies 374,579 494,950 387,700 438,900
Equipment maintenance 270,507 250,750 288,250 310,250
Miscellaneous services 1,993,249 2,094,822 2,111,804 1,935,820
Sundry charges - - - -
Total operating expenditures 4,175,077 4,387,207 4,254,947 4,222,149
General and administrative 1,858,875 1,899,140 1,899,140 2,252,636
Provision for bad debts 196,852 35,000 35,000 35,000
Transfers to other funds 84,917 250,000 250,000 150,000
Transfers to debt retirement 55,000 58,400 58,400 56,200
Total expenditures 6,370,721 6,629,747 6,497,487 6,715,985
Excess(deficiency) of revenues
over expenditures 98,284 (157,415) 60,761 (10,485)
Ending working capital 4,833,939 4,644,972 4,894,700 4,884,215
Total Funds Applied 11,204,660$ 11,274,719$ 11,392,187$ 11,600,200$
CITY OF LUFKIN
SOLID WASTE & RECYCLING OPERATING ENTERPRISE FUND
Fiscal 2018 Operating Budget
Page 107

FY2016 FY2017 FY2017 FY2018
Departmental Expenditures Actual Budget Adjusted Budget
Solid waste disposal department 3,696,796$ 3,798,532$ 3,726,353$ 3,646,288$
Recycling department 468,942 555,760 520,303 556,751
Non-departmental 9,339 32,915 8,291 19,110
Total departmental expenditures 4,175,077 4,387,207 4,254,947 4,222,149
Transfers to other funds 84,917 250,000 250,000 150,000
General and administrative 1,858,875 1,899,140 1,899,140 2,252,636
Provision for bad debts 196,852 35,000 35,000 35,000
Sub-Total 2,140,644 2,184,140 2,184,140 2,437,636
Transfers to debt retirement 55,000 58,400 58,400 56,200
Total expenditures 6,370,721 6,629,747 6,497,487 6,715,985
Excess(deficiency) of revenues
over expenditures 98,284 (157,415) 60,761 (10,485)
Ending working capital 4,833,939 4,644,972 4,894,700 4,884,215
Total Funds Applied 11,204,660$ 11,274,719$ 11,392,187$ 11,600,200$
Working capital balance requirement 785,431 828,718 828,718 839,498
Amount over policy 4,048,508$ 3,816,254$ 4,065,982$ 4,044,717$
SOLID WASTE & RECYCLING OPERATING ENTERPRISE FUND
Fiscal 2018 Operating Budget
CITY OF LUFKIN
Page 108

Department Description Amount
Solid Waste Curatto Can 40,000
Solid Waste Rear Loader- Special Collections 160,118
Total 200,118$
CITY OF LUFKIN
SOLID WASTE DEPRECIATION FUND
Fiscal Year 2018 Operating Budget
Depreciation Fund Requests
Page 109

FY2016 FY2017 FY2017 FY2018
Actual Budget Adjusted Budget
Beginning Balance (225,075)$ (187,635)$ (15,584)$ 10,795$
Revenues
Hotel/Motel occupancy tax 1,150,324 875,000 950,000 950,000
Other revenues & fees 1,535 950 1,565 1,500
Use Fees 119,764 150,000 130,000 140,000
Concessions 1,482 2,000 1,000 1,500
Miscellaneous revenues (3,256) 0 - -
Equipment replacement charges 4,800 9,000 7,000 8,000
Security fees 11,533 15,000 12,000 15,000
Alcoholic Beverage sales 35,381 35,000 45,000 40,000
Pines Theater Concessions - - - -
Pines Theater Admissions/Ticket Sales - - - -
Transfers 70,000 100,000 100,000 50,000
Interest income 354 200 200 200
Total Revenues 1,391,917 1,187,150 1,246,765 1,206,200
Total Funds Available 1,166,842$ 999,515$ 1,231,181$ 1,216,995$
Expenditures
Personnel services 341,355$ 343,266$ 346,059$ 348,641$
Supplies 41,572 35,900 35,400 35,100
Equipment maintenance 22,504 25,000 24,200 24,500
Miscellaneous services 164,708 190,807 189,877 184,447
Sundry charges 609,370 582,625 624,850 619,000
Capital outlay - - - -
Transfers to other funds 2,917 - - 873
Total Departmental Expenditures 1,182,426 1,177,598 1,220,386 1,212,561
Excess(deficiency) of revenues
over expenditures 209,491 9,552 26,379 (6,361)
Fund balance ending (15,584) (178,083) 10,795 4,434
Total Funds Applied $1,166,842 $999,515 $1,231,181 $1,216,995
FY2016 FY2017 FY2017 FY2018
Expenditures by Department Actual Budget Adjusted Budget
Civic Center 553,380$ 578,390$ 585,779$ 587,431$
Museum of East Texas 52,500 52,500 52,500 52,500
Exposition Center 131,918 125,125 135,850 130,000
Texas Forestry Museum 37,500 37,500 37,500 37,500
Lufkin Convention & Tourism Bureau 387,451 367,500 399,000 399,000
Non-departmental 19,676 16,583 9,757 6,130
Total Departmental Expenditures 1,182,425 1,177,598 1,220,386 1,212,561
Excess(deficiency) of revenues
over expenditures 209,492 9,552 26,379 (6,361)
Fund balance ending (15,583) (178,083) 10,795 4,434
Total Funds Applied 1,166,842$ 999,515$ 1,231,181$ 1,216,995$
Fund balance requirement 147,803 147,200 147,200 151,570
Amount over policy (163,386)$ (325,283)$ (136,405)$ (147,136)$
CITY OF LUFKIN
HOTEL/MOTEL TAX FUND
Fiscal 2018 Operating Budget
Page 110

FY2016 FY2017 FY2017 FY2018
Actual Budget Adjusted Budget
Beginning Balance 86,410$ 74,111$ 92,769$ 91,306$
Revenues
Recreation Classes 18,748 18,900 19,800 20,440
Softball 134,689 149,850 135,000 135,000
Volleyball 683 4,995 4,995 4,995
Basketball 25,613 29,925 28,370 28,925
Gymnastics 33,968 34,175 34,175 34,800
Football - - 7,800 7,800
Special events 5,342 5,800 8,000 6,500
Miscellaneous income (359) 2,000 2,020 2,000
Baseball 67,791 82,910 68,000 74,410
Concessions 118,823 150,000 135,000 135,000
Contributions 8,000 7,000 7,500 7,000
Interest income 617 400 600 600
Total Revenues 413,915 485,955 451,260 457,470
Total Funds Available 500,325$ 560,066$ 544,029$ 548,776$
Expenditures
Personnel services 39,788$ 47,975$ 48,048$ 48,002$
Supplies 105,300 123,860 128,575 122,915
Equipment maintenance 17,505 19,900 19,900 19,650
Miscellaneous services 185,193 214,190 196,431 206,525
Capital outlay - - - -
Transfers 59,770 59,769 59,769 59,769
Total Expenditures 407,556 465,694 452,723 456,861
Excess(deficiency) of revenues
over expenditures 6,359 20,261 (1,463) 609
Fund balance ending 92,769 94,372 91,306 91,915
Total Funds Applied 500,325$ 560,066$ 544,029$ 548,776$
FY2016 FY2017 FY2017 FY2018
Actual Budget Adjusted Budget
Expenditures by Activity
Softball 121,096$ 139,050$ 133,300$ 129,800$
Volleyball 1,309 3,545 3,545 3,670
Basketball 19,442 23,070 20,676 23,270
Football - - 5,115 6,320
Gymnastics 26,309 28,845 28,845 28,645
Special events 3,594 5,125 7,875 4,750
Recreation classes 20,511 17,575 19,750 20,025
Baseball 61,118 77,440 62,500 69,310
Concessions 94,407 111,275 111,348 111,302
Transfers 59,769 59,769 59,769 59,769
Total Departmental Expenditures 407,555 465,694 452,723 456,861
Excess(deficiency) of revenues over expenditures 6,360 20,261 (1,463) 609
Fund balance ending 92,770 94,372 91,306 91,915
Total Funds Applied 500,325$ 560,066$ 544,029$ 548,776$
Policy reserve 50,944 58,212 58,212 57,108
Amount over policy 41,826$ 36,160$ 33,094$ 34,807$
CITY OF LUFKIN
RECREATION FUND
Fiscal 2018 Operating Budget
Page 111

FY2016 FY2017 FY2017 FY2018
Actual Budget Adjusted Budget
Beginning Balance 23,168$ (7,027)$ (14,887)$ (16,400)$
Revenues
Contributions 3,512 2,800 1,700 2,300
Concessions 17,295 21,500 15,000 15,000
Use Fees 25,301 29,000 29,000 29,000
Souvenir Sales - 150 150 150
Playbill Ads 12,425 20,000 12,325 14,000
Miscellaneous 2,656 4,000 6,253 2,500
Admissions/ Ticket Sales 93,815 95,313 88,013 88,013
Interest income 48 100 - -
Total Revenues 155,052 172,863 152,441 150,963
Total Funds Available 178,220$ 165,836$ 137,554$ 134,563$
Expenditures
Supplies 14,072$ 21,125$ 14,125$ 16,625$
Equipment maintenance 2,905 3,570 3,570 3,570
Miscellaneous services 176,130 148,140 136,259 152,140
Total Expenditures 193,107 172,835 153,954 172,335
Excess(deficiency) of revenues
over expenditures (38,055) 28 (1,513) (21,372)
Fund balance ending (14,887) (6,999) (16,400) (37,772)
Total Funds Applied 178,220$ 165,836$ 137,554$ 134,563$
FY2016 FY2017 FY2017 FY2018
Actual Budget Adjusted Budget
Expenditures by Activity
Special Events 193,109$ 172,835$ 153,954$ 172,335$
Total Departmental Expenditures 193,109 172,835 153,954 172,335
Excess(deficiency) of revenues
over expenditures (38,057) 28 (1,513) (21,372)
Fund balance ending (14,889) (6,999) (16,400) (37,772)
Total Funds Applied 178,220$ 165,836$ 137,554$ 134,563$
CITY OF LUFKIN
PINES THEATER SPECIAL EVENTS FUND
Fiscal 2018 Operating Budget
Page 112

FY2016 FY2017 FY2017 FY2018
Actual Budget Adjusted Budget
Beginning Balance 1,812,718$ 987,654$ 1,418,823$ 1,336,529$
Revenues
Admission fees 336,485 270,000 300,000 300,000
Safari classes 23,622 28,111 26,110 26,110
Miscellaneous revenues 219 2,225 100 1,000
Donations 56,263 1,350 500 1,000
Sale of animals 3,255 1,335 200 1,000
Animal adoption donations 2,965 2,270 500 1,000
Interest income 9,811 7,000 8,000 8,000
Total Revenues 432,620 312,291 335,410 338,110
Total Funds Available 2,245,338$ 1,299,945$ 1,754,233$ 1,674,639$
Expenditures
Supplies 71,897$ 84,400$ 106,200$ 84,400$
Equipment maintenance 145,391 139,200 221,100 135,400
Miscellaneous services 36,782 29,900 61,805 34,800
Capital Outlay 543,846 - - -
Transfers out 28,599 28,599 28,599 28,599
Total Expenditures 826,515 282,099 417,704 283,199
Excess(deficiency) of revenues
over expenditures (393,895) 30,192 (82,294) 54,911
Fund balance ending 1,418,823 1,017,846 1,336,529 1,391,440
Total Funds Applied 2,245,338$ 1,299,945$ 1,754,233$ 1,674,639$
CITY OF LUFKIN
ELLEN TROUT ZOO BUILDING FUND
Fiscal 2018 Operating Budget
Page 113

FY2016 FY2017 FY2017 FY2018
Actual Budget Adjusted Budget
Beginning Balance 12,484$ 3,436$ 14,212$ 28,901$
Revenues
Other 34,946 40,000 40,000 40,000
General Fund Transfer - - - -
Interest income 7 - - -
Total Revenues 34,953 40,000 40,000 40,000
Total Funds Available 47,437$ 43,436$ 54,212$ 68,901$
Expenditures
Supplies 2,989$ 4,405$ 5,105$ 5,460$
Equipment maintenance 28,768 30,840 17,340 17,340
Miscellaneous services 1,468 2,710 2,866 2,710
Transfer to general fund - - - -
Total Expenditures 33,225 37,955 25,311 25,510
Excess(deficiency) of revenues
over expenditures 1,728 2,045 14,689 14,490
Fund balance ending 14,212 5,481 28,901 43,391
Total Funds Applied 47,437$ 43,436$ 54,212$ 68,901$
FY2016 FY2017 FY2017 FY2018
Technology Fund Actual Budget Adjusted Budget
Beginning Balance (9,871)$ (1,161)$ (18,933)$ (13,873)$
Revenues 19,955 23,000 23,000 23,000
Expenditures 29,017 31,440 17,940 16,990
Excess(deficiency) of revenues
over expenditures (9,062) (8,440) 5,060 6,010
Fund balance ending (18,933) (9,601) (13,873) (7,863)
Security Fund
Beginning Balance 22,355$ (38,553)$ 33,147$ 42,776$
Revenues 14,998 17,000 17,000 17,000
Expenditures 4,206 6,515 7,371 8,520
Excess(deficiency) of revenues
over expenditures 10,792 10,485 9,629 8,480
Fund balance ending 33,147 (28,068) 42,776 51,256
Total Funds Applied 47,437$ 286$ 54,214$ 68,903$
CITY OF LUFKIN
COURT SECURITY/TECHNOLOGY FUND
Fiscal 2018 Operating Budget
Page 114

FY2016 FY2017 FY2017 FY2018
Actual Budget Adjusted Budget
Beginning Balance 23,211$ 18,822$ 27,933$ 32,946$
Revenues
Other - - - -
Contributions 370 - 75 -
Hoedown Booth Rental 11,415 11,220 14,843 14,850
Mainstreet Memberships 7,725 7,675 7,675 7,675
Interest income 132 50 120 120
Total Revenues 19,642 18,945 22,713 22,645
Total Funds Available 42,853$ 37,767$ 50,646$ 55,591$
Expenditures
Supplies 5,245$ 6,200$ 6,200$ 5,450$
Miscellaneous services 9,675 11,500 11,500 14,000
Total Expenditures and transfers 14,920 17,700 17,700 19,450
Excess(deficiency) of revenues
over expenditures 4,722 1,245 5,013 3,195
Fund balance ending 27,933 20,067 32,946 36,141
Total Funds Applied 42,853$ 37,767$ 50,646$ 55,591$
CITY OF LUFKIN
Main Street/Comm Dev. Downtown Impr
Fiscal 2018 Operating Budget
Page 115

FY2016 FY2017 FY2017 FY2018
Actual Budget Adjusted Budget
Beginning Balance 229,918$ 134,598$ 105,462$ 51,662$
Revenues
Other 115,832 145,000 90,000 90,000
Interest income 1,232 1,200 1,200 1,200
Total Revenues 117,064 146,200 91,200 91,200
Total Funds Available 346,982$ 280,798$ 196,662$ 142,862$
Expenditures
Miscellaneous services -$ -$ -$ 40,000$
Equipment maintenance 50,000 - - -
Transfer to general fund 191,520 145,000 145,000 90,000
Total Expenditures and transfers 241,520 145,000 145,000 130,000
Excess(deficiency) of revenues
over expenditures (124,456) 1,200 (53,800) (38,800)
Fund balance ending 105,462 135,798 51,662 12,862
Total Funds Applied 346,982$ 280,798$ 196,662$ 142,862$
CITY OF LUFKIN
ANIMAL CONTROL-KURTH GRANT FUND
Fiscal 2018 Operating Budget
Page 116

FY2016 FY2017 FY2017 FY2018
Actual Budget Adjusted Budget
Beginning Balance 40,372$ 28,522$ 38,764$ 23,324$
Revenues
Donations 11,322 10,000 15,478 15,000
Spay / Neuter Contributions - - - -
Interest income 237 150 150 150
Total Revenues 11,559 10,150 15,628 15,150
Total Funds Available 51,931$ 38,672$ 54,392$ 38,474$
Expenditures
Supplies - - - 1,000
Equipment Maintenance 700$ -$ -$ 6,000$
Capital outlay - - - 10,000
Transfers - - 5,000 -
Miscellaneous services 12,467 20,590 26,068 -
Total Expenditures 13,167$ 20,590$ 31,068$ 17,000$
Excess(deficiency) of revenues
over expenditures (1,608) (10,440) (15,440) (1,850)
Fund balance ending 38,764 18,082 23,324 21,474
Total Funds Applied 51,931$ 38,672$ 54,392$ 38,474$
CITY OF LUFKIN
ANIMALS ATTIC GIFT SHOP
Fiscal 2018 Operating Budget
Page 117
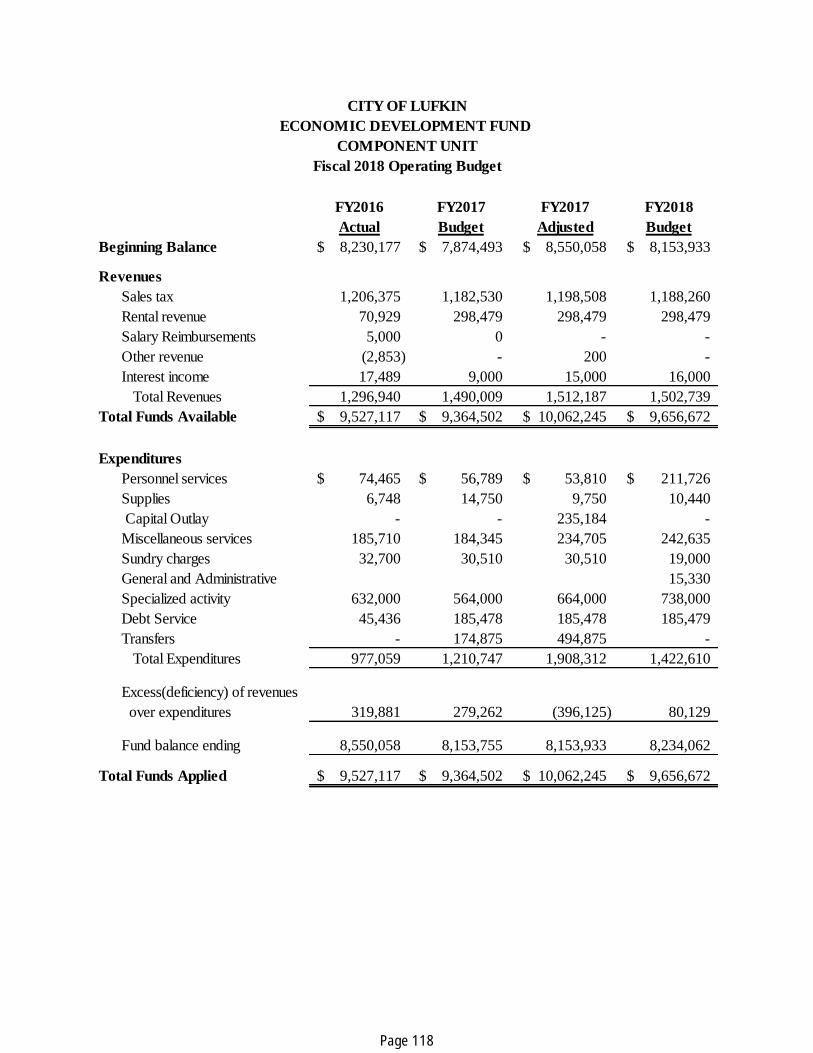
FY2016 FY2017 FY2017 FY2018
Actual Budget Adjusted Budget
Beginning Balance 8,230,177$ 7,874,493$ 8,550,058$ 8,153,933$
Revenues
Sales tax 1,206,375 1,182,530 1,198,508 1,188,260
Rental revenue 70,929 298,479 298,479 298,479
Salary Reimbursements 5,000 0 - -
Other revenue (2,853) - 200 -
Interest income 17,489 9,000 15,000 16,000
Total Revenues 1,296,940 1,490,009 1,512,187 1,502,739
Total Funds Available 9,527,117$ 9,364,502$ 10,062,245$ 9,656,672$
Expenditures
Personnel services 74,465$ 56,789$ 53,810$ 211,726$
Supplies 6,748 14,750 9,750 10,440
Capital Outlay - - 235,184 -
Miscellaneous services 185,710 184,345 234,705 242,635
Sundry charges 32,700 30,510 30,510 19,000
General and Administrative 15,330
Specialized activity 632,000 564,000 664,000 738,000
Debt Service 45,436 185,478 185,478 185,479
Transfers - 174,875 494,875 -
Total Expenditures 977,059 1,210,747 1,908,312 1,422,610
Excess(deficiency) of revenues
over expenditures 319,881 279,262 (396,125) 80,129
Fund balance ending 8,550,058 8,153,755 8,153,933 8,234,062
Total Funds Applied 9,527,117$ 9,364,502$ 10,062,245$ 9,656,672$
CITY OF LUFKIN
ECONOMIC DEVELOPMENT FUND
Fiscal 2018 Operating Budget
COMPONENT UNIT
Page 118

FY2016 FY2017 FY2017 FY2018
Actual Budget Adjusted Budget
Beginning Balance 214,914$ 123,250$ 269,213$ 243,989$
Revenues
Contribution from Hotel/Motel Tax 387,451 367,500 399,000 399,000
Souvenier Sales 190 150 210 150
Corks & Forks Event 5,684 6,000 7,300 6,500
Lufkin's Bistro 28,390 15,000 21,953 20,000
Yule Love Lufkin Christmas 22,522 25,000 4,080 -
Farm Feast Event 12,989 3,000 2,613 5,000
Other revenue 5,001 - 3,300 2,950
General Fund - - - 78,580
Interest income 2,387 500 1,200 1,200
Total Revenues 464,614 417,150 439,656 513,380
Total Funds Available 679,528$ 540,400$ 708,869$ 757,369$
Expenditures
Personnel services 152,911$ 156,354$ 156,400$ 243,215$
Supplies 4,924 8,250 6,050 7,756
Miscellaneous services 251,150 313,100 300,650 342,685
General and Administrative 1,330 1,780 1,780 2,690
Sundry charges - - - 950
Total Expenditures 410,315 479,484 464,880 597,296
Excess(deficiency) of revenues
over expenditures 54,299 (62,334) (25,224) (83,916)
Fund balance ending 269,213$ 60,916$ 243,989$ 160,073$
Total Funds Applied 679,528$ 540,400$ 708,869$ 757,369$
CITY OF LUFKIN
LUFKIN CONVENTION & VISITOR BUREAU
COMPONENT UNIT
Fiscal 2018 Operating Budget
Page 119

FY2016 FY2017 FY2017 FY2018
Actual Budget Adjusted Budget
Beginning Balance 1,811,937$ 1,268,478$ 1,406,542$ 1,806,925$
Revenues
Current year collections 2,987,208 3,052,312 3,049,812 3,032,773
Interest income 18,183 8,000 11,000 10,000
Other-Transfer
fromWater/Wastewater Fund3,129,448 3,246,467 3,778,005 3,546,645
Other-Transfer from Solid
Waste/Recycling Fund55,000 58,400 58,400 56,200
Other Revenue 13,447 - - -
Other financing sources-proceeds 9,871,035 - - -
Total Revenues 16,074,321 6,365,179 6,897,217 6,645,618
Total Funds Available 17,886,258$ 7,633,657$ 8,303,759$ 8,452,543$
Expenditures
Principal payments 4,535,000$ 4,695,000$ 4,685,000$ 5,020,000$
Interest payments 1,916,340 1,822,559 1,802,834 1,657,084
Debt service fees 135,750 9,000 9,000 6,350
Other Financing Uses 9,892,626 - - -
Total Expenditures 16,479,716 6,526,559 6,496,834 6,683,434
Excess(deficiency) of revenues
over expenditures (405,395) (161,380) 400,383 (37,816)
Fund balance ending 1,406,542 1,107,098 1,806,925 1,769,109
Total Funds Applied 17,886,258$ 7,633,657$ 8,303,759$ 8,452,543$
CITY OF LUFKIN
DEBT SERVICE FUND
Fiscal 2018 Operating Budget
Page 120
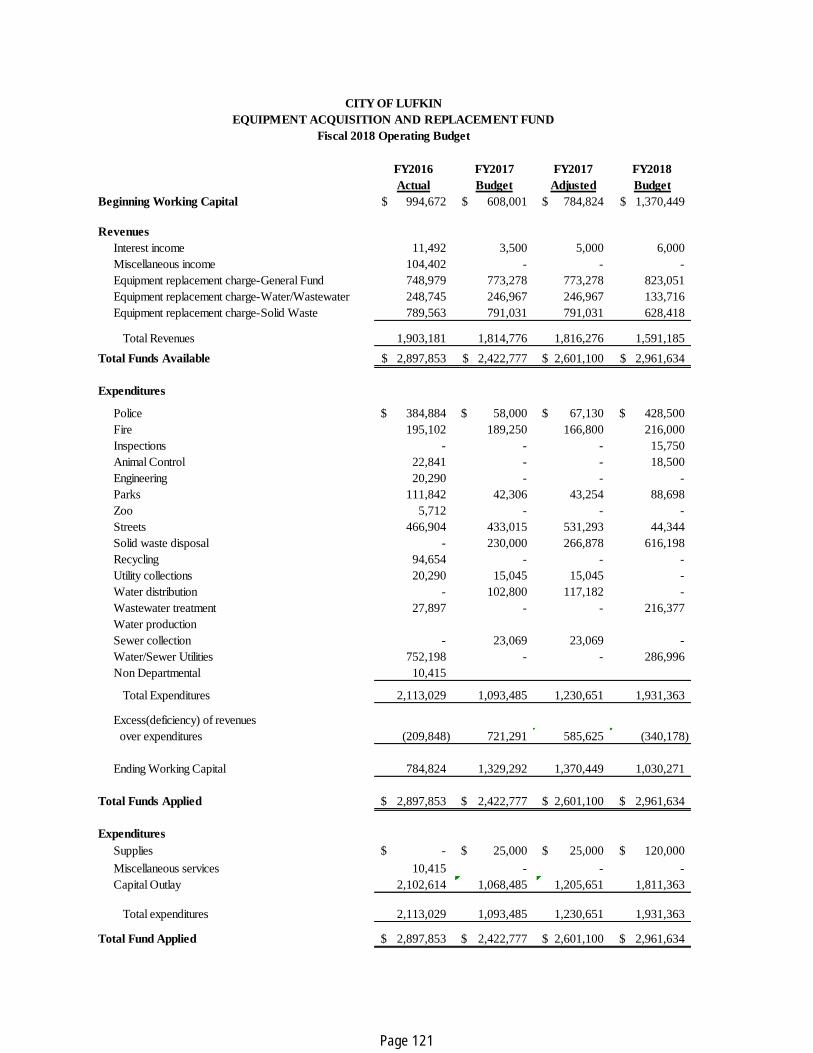
FY2016 FY2017 FY2017 FY2018
Actual Budget Adjusted Budget
Beginning Working Capital 994,672$ 608,001$ 784,824$ 1,370,449$
Revenues
Interest income 11,492 3,500 5,000 6,000
Miscellaneous income 104,402 - - -
Equipment replacement charge-General Fund 748,979 773,278 773,278 823,051
Equipment replacement charge-Water/Wastewater 248,745 246,967 246,967 133,716
Equipment replacement charge-Solid Waste 789,563 791,031 791,031 628,418
Total Revenues 1,903,181 1,814,776 1,816,276 1,591,185
Total Funds Available 2,897,853$ 2,422,777$ 2,601,100$ 2,961,634$
Expenditures
Police 384,884$ 58,000$ 67,130$ 428,500$
Fire 195,102 189,250 166,800 216,000
Inspections - - - 15,750
Animal Control 22,841 - - 18,500
Engineering 20,290 - - -
Parks 111,842 42,306 43,254 88,698
Zoo 5,712 - - -
Streets 466,904 433,015 531,293 44,344
Solid waste disposal - 230,000 266,878 616,198
Recycling 94,654 - - -
Utility collections 20,290 15,045 15,045 -
Water distribution - 102,800 117,182 -
Wastewater treatment 27,897 - - 216,377
Water production
Sewer collection - 23,069 23,069 -
Water/Sewer Utilities 752,198 - - 286,996
Non Departmental 10,415
Total Expenditures 2,113,029 1,093,485 1,230,651 1,931,363
Excess(deficiency) of revenues
over expenditures (209,848) 721,291 585,625 (340,178)
Ending Working Capital 784,824 1,329,292 1,370,449 1,030,271
Total Funds Applied 2,897,853$ 2,422,777$ 2,601,100$ 2,961,634$
Expenditures
Supplies -$ 25,000$ 25,000$ 120,000$
Miscellaneous services 10,415 - - -
Capital Outlay 2,102,614 1,068,485 1,205,651 1,811,363
Total expenditures 2,113,029 1,093,485 1,230,651 1,931,363
Total Fund Applied 2,897,853$ 2,422,777$ 2,601,100$ 2,961,634$
CITY OF LUFKIN
EQUIPMENT ACQUISITION AND REPLACEMENT FUND
Fiscal 2018 Operating Budget
Page 121

Page 122

GENERAL FUND
The General Fund is the operating fund of the City and accounts for all revenues and expenditures not accounted for in other funds. It accounts for a wide variety of revenues and finances a broad range of governmental services. Primarily ad valorem taxes, general sales taxes, franchise taxes, charges for services, and other miscellaneous revenues support the General Fund. General Fund expenditures support major governmental functions and include General Government and Administrative Services, Public Safety, Public Works, Community Development, and Cultural and Recreational Services. The City of Lufkin strives to maintain the highest levels of service at the least possible cost to its citizens. Service levels are maintained through sound decision-making practices. This provides for the allocation of funds in the best possible manner. The budget basis of the General Fund and general government type funds is prepared on a modified accrual basis. Briefly this means that obligations of the City are budgeted as expenditures, but revenues are recognized when they become available and measurable. The following section provides an overview of each department within the General Fund. Here, departmental expenditures, mission statements, descriptions of services, Fiscal 2018 work programs, performance measures, personnel summaries, and division breakdowns, can be found. By reading this information, one should better understand the responsibilities of each department, the department’s goals for Fiscal 2018, and the extent to which each department is meeting those goals. A line item breakdown of all departmental expenditures can be obtained by contacting the City of Lufkin Finance Department.
G
EN
ER
AL
FU
ND
CI
TY
O
F
LU
FK
IN
,
TE
XA
S
Fiscal Year
2018
General Government Departments include the following:
General Government
City Administration
Finance
Legal
Tax
Human Resources
Building Services
Information Technology
Page 123

WORKLOAD INDICATORS & PERFORMANCE MEASURES
GENERAL FUND
MISSION
The mission of the City Council is to provide effective, efficient and responsive local government through the establishment of policies reflecting community needs and goals. Simply put “to meet the needs of the citizens”.
DESCRIPTION OF SERVICES PROVIDED
The department of General Government includes the City Council and City Secretary. The City Secretary provides the following services:
Maintaining minutes of City Council meetings and records of the City
Preparing Council Agenda Packets
Issuing licenses and permits for alcohol sales and vendors
The City Council consists of a mayor, elected at-large and six council members, each representing a separate Ward. The Council meets twice a month to address issues brought before it regarding policies and governance. The Council provides policy direction to the City Manager and staff in the delivery of services to the citizens of Lufkin.
2018 WORK PROGRAM
The Lufkin City Council has established goals and objectives to provide consistent and high quality services to the citizens and businesses in Lufkin. This includes the implementation of the next phase of the Capital Improvement Program. The City Secretary’s office will continue to provide services to both Administration and City Council as well as complete projects to include the electronic storage and preservation of the City’s records.
CI
TY
O
F
LU
FK
IN
,
TE
XA
S
Ge
ne
ra
l G
ov
er
nm
en
t Fiscal Year
2018
Description 2015-2016
Actual 2016-2017 Revised
2017-2018 Budget
Number of City Council Agenda Packets Prepared 648 650 650
Number of City Council Packets prepared & distrib-uted by Friday deadline
648 650 650
% of City Council Packets prepared & distributed on Friday before meeting
100% 100% 100%
Number of Vendor Permits issued 25 28 30
Number of Vendor licenses with errors 0 0 0
Percentage of correctly issued vendor licenses 100% 100% 100%
Page 124

DEPARTMENT General Government
AUTHORIZED POSITIONS 2015-2016
Actual 2016-2017 Approved
2016-2017 Revised
2017-2018 Budget
City Secretary 1 1 1 1
Executive Secretary 1 1 1 1
FULL TIME 2 2 2 2
PART TIME 0 0 0 0
TOTAL 2 2 2 2
EXPENDITURES 2015-2016
Actual 2016-2017 Approved
2016-2017 Revised
2017-2018 Budget
Personnel Services 97,450 96,276 99,255 99,470
Benefits 35,132 38,603 39,333 39,336
Supplies 17,400 27,535 25,535 20,350
Miscellaneous Services 73,795 99,315 91,747 97,255
Sundry Charges 106,432 112,970 114,970 112,970
TOTAL 330,209 374,699 370,840 369,381
FUND General
SIGNIFICANT CHANGES
Page 125
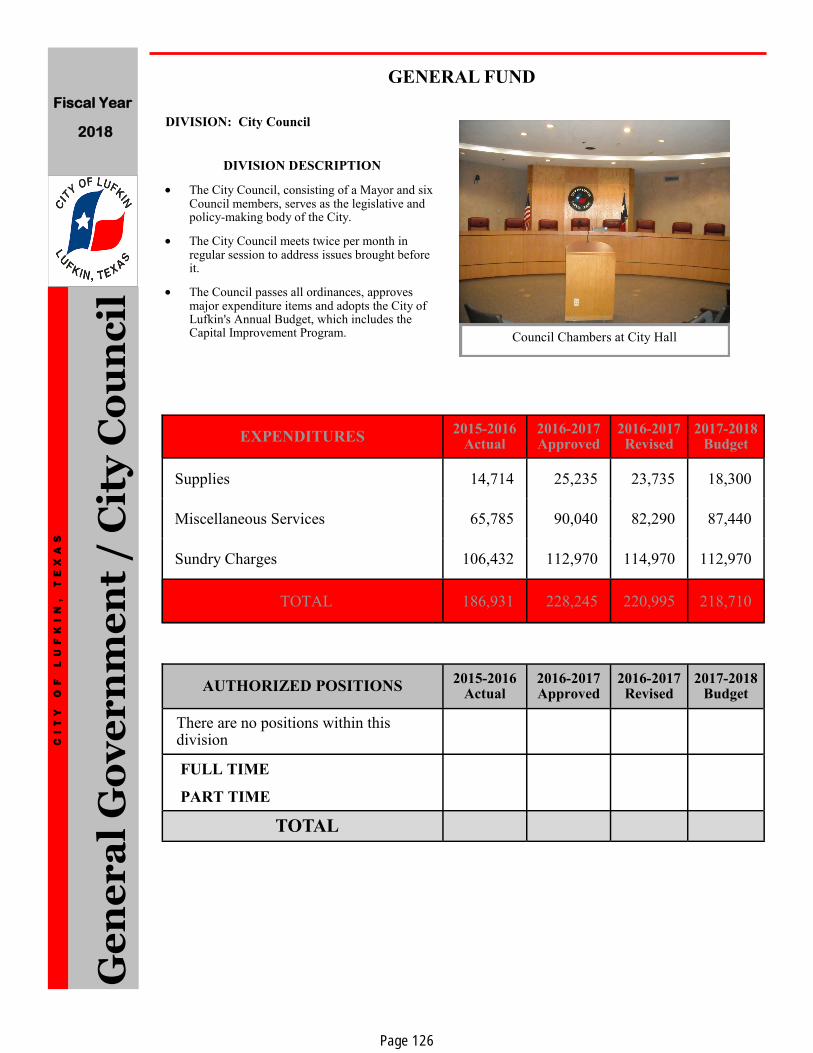
Council Chambers at City Hall
GENERAL FUND
Ge
ne
ra
l G
ov
er
nm
en
t /
Cit
y C
ou
nc
il
CI
TY
O
F
LU
FK
IN
,
TE
XA
S
AUTHORIZED POSITIONS 2015-2016
Actual 2016-2017 Approved
2016-2017 Revised
2017-2018 Budget
There are no positions within this division
FULL TIME
PART TIME
TOTAL
DIVISION: City Council
DIVISION DESCRIPTION
The City Council, consisting of a Mayor and six Council members, serves as the legislative and policy-making body of the City.
The City Council meets twice per month in regular session to address issues brought before it.
The Council passes all ordinances, approves major expenditure items and adopts the City of Lufkin's Annual Budget, which includes the Capital Improvement Program.
EXPENDITURES 2015-2016
Actual 2016-2017 Approved
2016-2017 Revised
2017-2018 Budget
Supplies 14,714 25,235 23,735 18,300
Miscellaneous Services 65,785 90,040 82,290 87,440
Sundry Charges 106,432 112,970 114,970 112,970
TOTAL 186,931 228,245 220,995 218,710
Fiscal Year
2018
Page 126

DIVISION: City Secretary
DIVISION DESCRIPTION
The City Secretary's office is responsible for providing service to the City Council, maintaining the minutes of City Council meetings and records of the City, preparing council agenda packets, and issuing licenses and permits to vendors.
The City Secretary is the Records Retention Officer for the City of Lufkin.
The City Secretary is the Election Administrator for the City of Lufkin and is responsible for supervising and conducting all City elections.
The City Secretary is responsible for issuing
licenses to all taxicab operations occurring within the City of Lufkin. The City receives two percent (2%) of all gross receipts from the operation of all limousines or taxicabs in the City of Lufkin.
The City Secretary receives monies for the license, application and processing of alcohol sales in the City of Lufkin.
The City Secretary issues and maintains titles for all vehicles in the City of Lufkin fleet.
The City Secretary maintains all contract and agreements for the City of Lufkin, including franchise agreements.
The City Secretary accepts all payments of franchise fees to the City of Lufkin.
Ge
ne
ra
l G
ov
er
nm
en
t /
Cit
y S
ec
re
tar
y
CI
TY
O
F
LU
FK
IN
,
TE
XA
S
AUTHORIZED POSITIONS 2015-2016
Actual 2016-2017 Approved
2016-2017 Revised
2017-2018 Budget
City Secretary 1 1 1 1
Executive Secretary
1
1
1
1
FULL TIME 2 2 2 2
PART TIME 0 0 0 0
TOTAL 2 2 2 2
EXPENDITURES 2015-2016
Actual 2016-2017 Approved
2016-2017 Revised
2017-2018 Budget
Personnel Services 97,450 96,276 99,255 99,470
Benefits 35,132 38,603 39,333 39,336
Supplies 2,686 2,300 1,800 2,050
Miscellaneous Services 8,010 9,275 9,457 9,815
TOTAL 143,278 146,454 149,845 150,671
GENERAL FUND
Fiscal Year
2018
Page 127

MISSION
The mission of the City Administration's Office is to administer the policies and directives established by the City Council, through efficient, effective management of the organization, and to uphold the organizational values stated in the mission statement.
DESCRIPTION OF SERVICES PROVIDED
City Administration includes the City Manager who is appointed by the City Council and is the executive officer of the City as well as the Assistant City Manager.
The Manager provides overall management of the City organization and is responsible for implementing the policies and goals established by the City Council.
The City Administration's responsibilities include planning, organizing and overseeing all city operations and advising Council on the city’s current and future needs.
WORK PROGRAM
In Fiscal 2018, the City Manager will work in conjunction with the City Council to continue a Capital Improvement Plan for the City of Lufkin and master plan for Ellen Trout Zoo.
In addition, the City Manager will provide continuous oversight of the City operations to maintain financial stability during the current economic climate.
Cit
y A
dm
inis
tra
tio
n
CI
TY
O
F
LU
FK
IN
,
TE
XA
S
WORKLOAD INDICATORS & PERFORMANCE MEASURES
GENERAL FUND
Description 2015-2016
Actual 2016-2017 Revised
2017-2018 Budget
Number of citizen complaints 380 375 245
Number of citizen complaints responded to within two business days
342 350 230
Respond to citizen complaints and requests within two business days 90% of time
90% 90% 90%
Number of semi-monthly project status reports and council updates completed
24 24 24
Number of council meetings held 24 24 24
Prepare agenda for Council meetings within required time-line 100% of time
100% 100% 100%
Fiscal Year
2018
Page 128
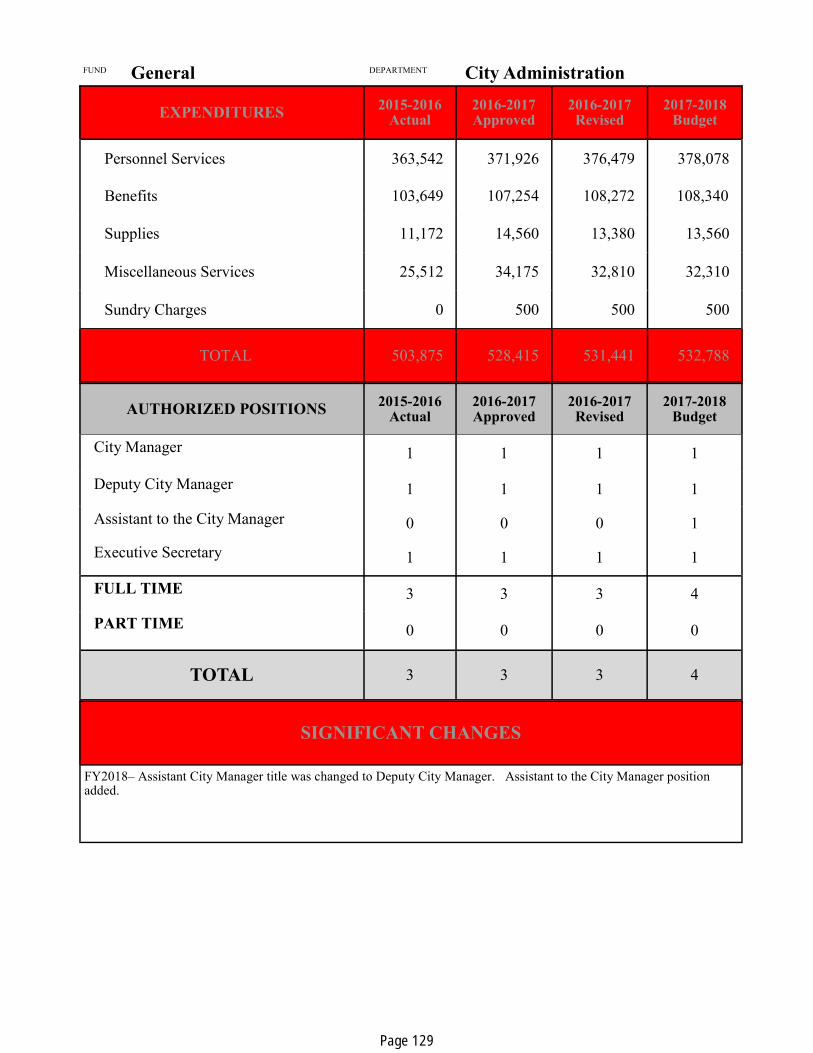
FUND General DEPARTMENT City Administration
AUTHORIZED POSITIONS 2015-2016
Actual 2016-2017 Approved
2016-2017 Revised
2017-2018 Budget
City Manager 1 1 1 1
Deputy City Manager 1 1 1 1
Assistant to the City Manager 0 0 0 1
Executive Secretary 1 1 1 1
FULL TIME 3 3 3 4
PART TIME 0 0 0 0
TOTAL 3 3 3 4
SIGNIFICANT CHANGES
FY2018– Assistant City Manager title was changed to Deputy City Manager. Assistant to the City Manager position added.
EXPENDITURES 2015-2016
Actual 2016-2017 Approved
2016-2017 Revised
2017-2018 Budget
Personnel Services 363,542 371,926 376,479 378,078
Benefits 103,649 107,254 108,272 108,340
Supplies 11,172 14,560 13,380 13,560
Miscellaneous Services 25,512 34,175 32,810 32,310
Sundry Charges 0 500 500 500
TOTAL 503,875 528,415 531,441 532,788
Page 129
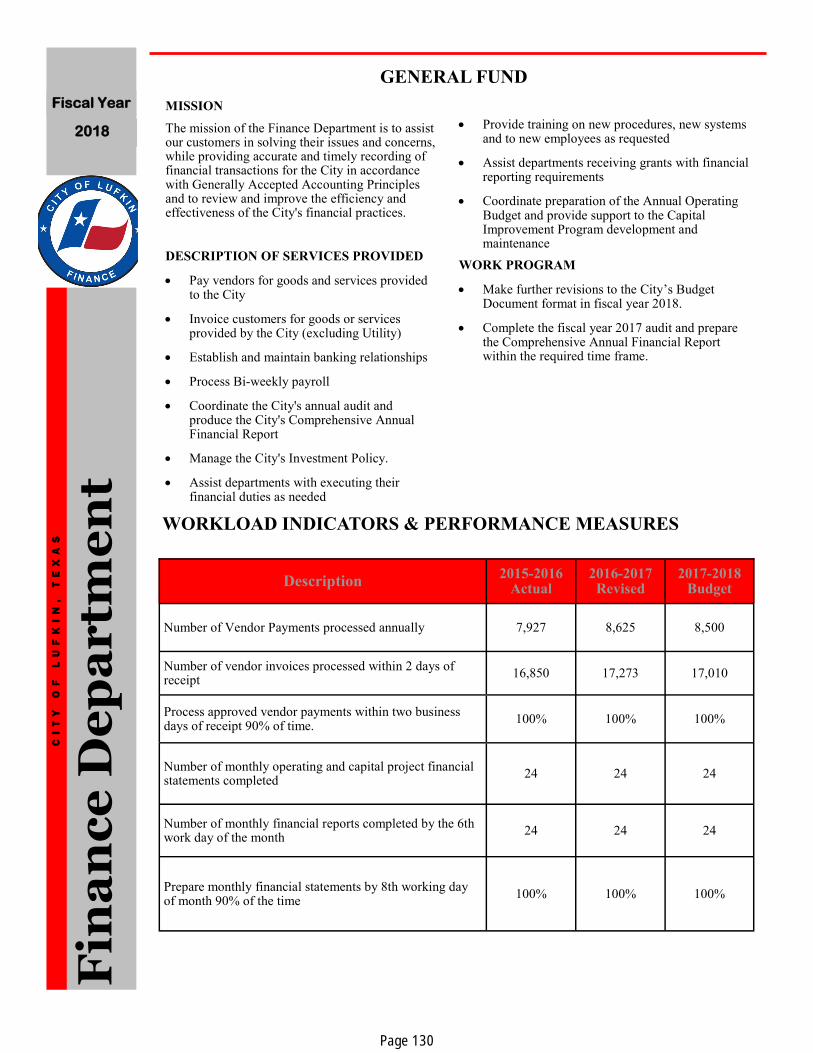
MISSION
The mission of the Finance Department is to assist our customers in solving their issues and concerns, while providing accurate and timely recording of financial transactions for the City in accordance with Generally Accepted Accounting Principles and to review and improve the efficiency and effectiveness of the City's financial practices.
DESCRIPTION OF SERVICES PROVIDED
Pay vendors for goods and services provided to the City
Invoice customers for goods or services provided by the City (excluding Utility)
Establish and maintain banking relationships
Process Bi-weekly payroll
Coordinate the City's annual audit and produce the City's Comprehensive Annual Financial Report
Manage the City's Investment Policy.
Assist departments with executing their financial duties as needed
Provide training on new procedures, new systems and to new employees as requested
Assist departments receiving grants with financial reporting requirements
Coordinate preparation of the Annual Operating Budget and provide support to the Capital Improvement Program development and maintenance
WORK PROGRAM
Make further revisions to the City’s Budget Document format in fiscal year 2018.
Complete the fiscal year 2017 audit and prepare the Comprehensive Annual Financial Report within the required time frame.
Fin
an
ce
De
pa
rtm
en
t C
IT
Y
OF
L
UF
KI
N,
T
EX
AS
WORKLOAD INDICATORS & PERFORMANCE MEASURES
GENERAL FUND
Description 2015-2016
Actual 2016-2017 Revised
2017-2018 Budget
Number of Vendor Payments processed annually 7,927 8,625 8,500
Number of vendor invoices processed within 2 days of receipt
16,850 17,273 17,010
Process approved vendor payments within two business days of receipt 90% of time.
100% 100% 100%
Number of monthly operating and capital project financial statements completed
24 24 24
Number of monthly financial reports completed by the 6th work day of the month
24 24 24
Prepare monthly financial statements by 8th working day of month 90% of the time
100% 100% 100%
Fiscal Year
2018
Page 130
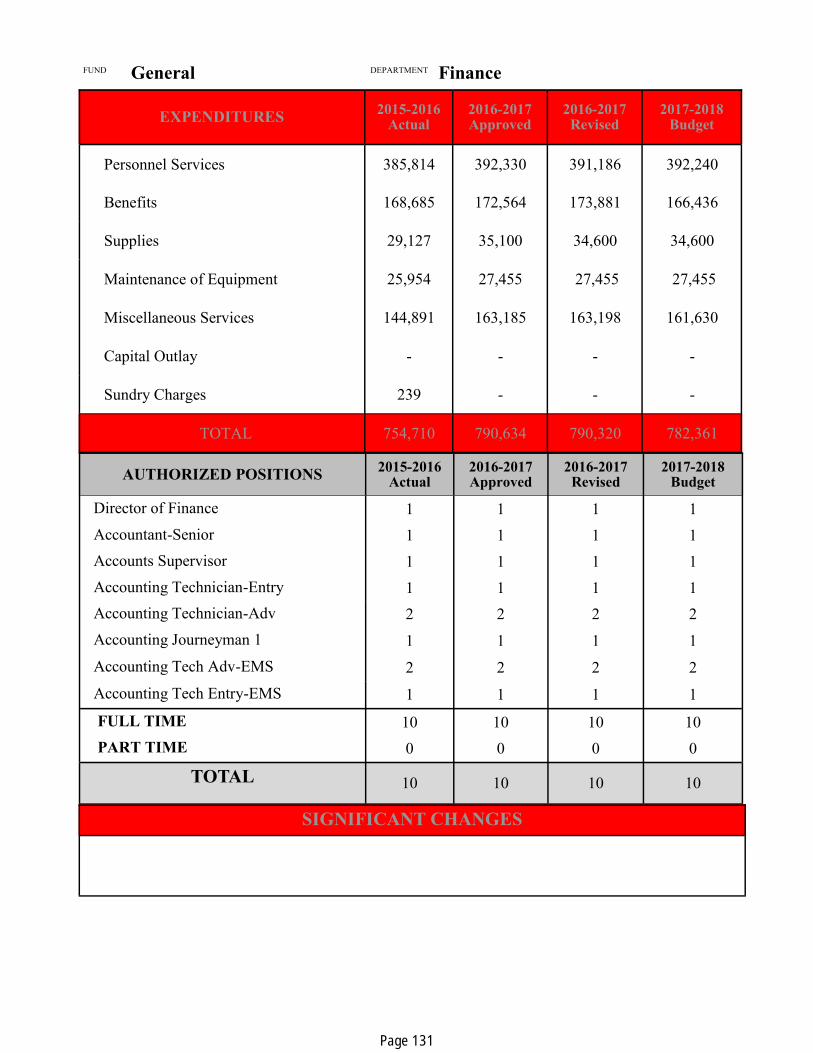
FUND General DEPARTMENT Finance
AUTHORIZED POSITIONS 2015-2016
Actual 2016-2017 Approved
2016-2017 Revised
2017-2018 Budget
Director of Finance 1 1 1 1
Accountant-Senior 1 1 1 1
Accounts Supervisor 1 1 1 1
Accounting Technician-Entry 1 1 1 1
Accounting Technician-Adv 2 2 2 2
Accounting Journeyman 1 1 1 1 1
Accounting Tech Adv-EMS 2 2 2 2
Accounting Tech Entry-EMS 1 1 1 1
FULL TIME 10 10 10 10
PART TIME 0 0 0 0
TOTAL 10 10 10 10
EXPENDITURES 2015-2016
Actual 2016-2017 Approved
2016-2017 Revised
2017-2018 Budget
Personnel Services 385,814 392,330 391,186 392,240
Benefits 168,685 172,564 173,881 166,436
Supplies 29,127 35,100 34,600 34,600
Maintenance of Equipment 25,954 27,455 27,455 27,455
Miscellaneous Services 144,891 163,185 163,198 161,630
Capital Outlay - - - -
Sundry Charges 239 - - -
TOTAL 754,710 790,634 790,320 782,361
SIGNIFICANT CHANGES
Page 131

GENERAL FUND
Fin
an
ce
De
pa
rtm
en
t C
IT
Y
OF
L
UF
KI
N,
T
EX
AS
DIVISION: Finance
DIVISION DESCRIPTION
Conducts the financial business of the City including Accounts Payable, Accounts Receivable, Grant management, and maintain Fixed Assets.
Fiscal Year
2018
EXPENDITURES 2015-2016
Actual 2016-2017 Approved
2016-2017 Revised
2017-2018 Budget
Personnel Services 303,340 304,125 310,067 310,844
Benefits 126,138 127,982 130,665 130,678
Supplies 16,619 20,400 20,400 20,400
Maintenance of Equipment 4,474 5,975 5,975 5,975
Miscellaneous Services 124,551 140,080 140,080 137,930
Sundry Charges 239 - - -
TOTAL 575,361 598,562 607,187 605,827
AUTHORIZED POSITIONS 2015-2016
Actual 2016-2017 Approved
2016-2017 Revised
2017-2018 Budget
Director of Finance 1 1 1 1
Accountant-Senior 1 1 1 1
Accounts Supervisor 1 1 1 1
Accounting Technician-Entry 1 1 1 1
Accounting Technician-Adv 2 2 2 2
Accounting Tech Journeyman 1 1 1 1
FULL TIME 7 7 7 7
PART TIME 0 0 0 0
TOTAL 7 7 7 7
Page 132

GENERAL FUND
Fin
an
ce
De
pa
rtm
en
t C
IT
Y
OF
L
UF
KI
N,
T
EX
AS
DIVISION: EMS Billing
DIVISION DESCRIPTION
Responsible for billing for the utilization of the City’s EMS service within the City and the county. Filing patient insurance and collection of payments.
Fiscal Year
2018
EXPENDITURES 2015-2016
Actual 2016-2017 Approved
2016-2017 Revised
2017-2018 Budget
Personnel Services 82,474 88,205 81,119 81,396
Benefits 42,547 44,582 43,216 35,758
Supplies 12,508 14,700 14,200 14,200
Maintenance of Equipment 21,480 21,480 21,480 21,480
Miscellaneous Services 20,340 23,105 23,118 23,700
TOTAL 176,913 177,896 186,745 192,072
AUTHORIZED POSITIONS 2015-2016
Actual 2016-2017 Approved
2016-2017 Revised
2017-2018 Budget
Accounting Tech Adv-EMS 2 2 2 2
Accounting Tech Entry EMS 1 1 1 1
FULL TIME 3 3 3 3
PART TIME 0 0 0 0
TOTAL 3 3 3 3
Page 133

LEGAL DEPARTMENT
MISSION
The mission of the City Attorney is to be the legal adviser to the City Manager, the City Council, or any committee thereof, all official boards and commissions and all city officers and employees with respect to any legal question involving an official duty or any legal matter pertaining to the affairs of the City of Lufkin.
DESCRIPTION OF SERVICES PROVIDED
The City Attorney oversees all legal matters of the City, ensures the efficient operation of the City’s Municipal Court Prosecution Services.
The City Attorney serves as the Police and Fire Department Legal Advisor.
The City Attorney as the Police Legal Advisor provides legal advice and counsel to the Lufkin Police Department, and instructs its officers on every-changing laws and court rulings.
WORK PROGRAM
The City Attorney will continue to represent the city in all litigation and controversies and prosecute all cases brought before the Lufkin Municipal Court. The City Attorney will approve as to form in writing all proposed ordinances before they shall be adopted, or file with the city council, in writing, his objection thereto. The City Attorney will advise the city council, the city manager and all the departments of the City concerning new or proposed state or federal legislation, and to represent the City before all legislative bodies in matters affecting the City. The City Attorney will continue in his role as legal advisor and counselor to the Lufkin Police Department and Fire Department.
Le
ga
l D
ep
ar
tme
nt
C
IT
Y
OF
L
UF
KI
N,
T
EX
AS
GENERAL FUND
Fiscal Year
2018
Description 2014-2015
Actual 2015-2016
Revised
2016-2017 Budget
Number of cases litigated in Municipal Court 362 384 550
Number of city ordinances, amendments to ordinances, and resolutions prepared and / or approved
66 46 70
Respond to City departmental requests for legal advice within 2 working days after receiving the request 90% of time
100% 100% 100%
Number of civil service matters and general litigation han-dled.
35 40 45
Number of legal opinions and memorandums written 40 35 45
Review and approve Economic Development agreements and contracts in a timely manner 100% of the time
100% 100% 100%
WORKLOAD INDICATORS & PERFORMANCE MEASURES
Page 134

FUND General DEPARTMENT Legal
AUTHORIZED POSITIONS 2015-2016
Actual 2016-2017 Approved
2016-2017 Revised
2017-2018 Budget
Attorney 1 1 1 1
Assistant City Attorney 0 0 0 1
Legal Assistant 1 1 1 0
FULL TIME 2 2 2 2
PART TIME 0 0 0 0
TOTAL 2 2 2 2
EXPENDITURES 2015-2016
Actual 2016-2017 Approved
2016-2017 Revised
2017-2018 Budget
Personnel Services 181,291 181,942 185,599 209,301
Benefits 57,971 60,100 61,850 67,598
Supplies 4,025 4,820 4,250 4,750
Miscellaneous Services 27,650 50,605 36,755 26,439
TOTAL 270,937 303,467 288,454 308,088
SIGNIFICANT CHANGES
FY2018-Legal Assistant position was eliminated. Assistant Attorney was added to Legal department positions.
Page 135

TAX DEPARTMENT
MISSION
The mission of the Tax Department is assess and collect all ad valorem taxes payable to the City of Lufkin.
DESCRIPTION OF SERVICES PROVIDED
The City contracts with the Angelina County Appraisal District and the County Tax Office to assess, bill and collect its ad valorem taxes.
As the County Tax Office collects tax payments, the payments are wire transferred to the City's depository bank.
WORK PROGRAM
This department is used solely for the purpose of accumulating costs associated with contractual services for Tax appraisal, assessment and collection.
Ta
x D
ep
ar
tme
nt
C
IT
Y
OF
L
UF
KI
N,
T
EX
AS
GENERAL FUND
Fiscal Year
2018
FUND General DEPARTMENT Tax
EXPENDITURES 2015-2016
Actual 2016-2017 Approved
2016-2017 Revised
2017-2018 Budget
Miscellaneous Services 197,426 198,800 211,676 221,370
TOTAL 197,426 198,800 211,676 221,370
AUTHORIZED POSITIONS 2015-2016
Actual 2016-2017 Approved
2016-2017 Revised
2017-2018 Budget
There are no positions assigned to this department.
FULL TIME
PART TIME
TOTAL
Page 136

MISSION
The City of Lufkin Human Resources Department administers employee benefits and provides personnel support to the various city departments in order to hire and maintain a quality workforce to serve the citizens of Lufkin.
DESCRIPTION OF SERVICES PROVIDED
The Human Resources Department provides centralized personnel services for all City of Lufkin departments.
The department provides guidance and direction to support the Purchasing Policy to ensure that all departments operate within the guidelines set forth by the City Council.
The HR department administers salary and wage studies, reviews and recommends changes to employee benefits and administers risk management, workers compensation, retirement, and unemployment functions.
The HR Director is the Civil Service Director for the Civil Service employees of the City of Lufkin.
WORK PROGRAM
The Human Resources Department will continue to screen new applications systematically in order to provide quality candidates in a timely manner in support of the City departments’ work force needs.
Employee injury claims will be reported promptly to the City’s insurance carrier in order to quickly meet the medical needs of the employees and contain workers compensation costs.
Human Resources will continue to update and provide forms on the intranet site as well as provided in the HR lobby area for convenience of the employees.
Human Resources will continue to review the Employee Handbook to update and better inform employees and supervisors.
Risk Management will continue to handle and track liability claims not handled by TML-IRP.
The Fire Pension administrator will be working with PensionEZ to maintain one administrative system for Lufkin Fire Pension.
Hu
ma
n R
es
ou
rc
es
C
IT
Y
OF
L
UF
KI
N,
T
EX
AS
WORKLOAD INDICATORS & PERFORMANCE MEASURES
GENERAL FUND
Fiscal Year
2018
Description 2015-2016
Actual 2016-2017 Revised
2017-2018 Budget
Number of workers compensation claims submitted to insurance carrier annually
70 65 77
Number of workers compensation claims submitted to insurance carrier annually within 2 working days of receipt
68 63 74
Workers compensation claims reported to insurance carrier within 2 working days of receipt.
97% 97% 96%
Number of applications received annually 859 700 800
Number of applications screened annually within 5 working days of receipt
859 700 800
Applications screened within 5 working days of re-ceipt.
100% 100% 100%
Page 137
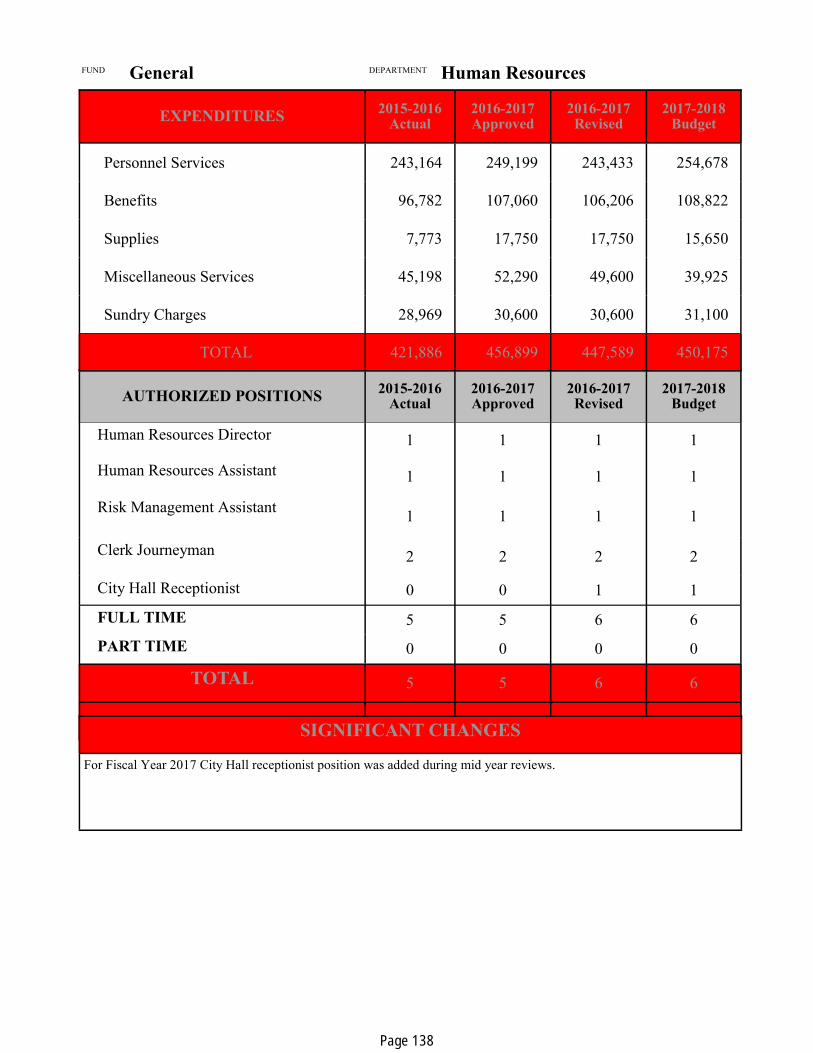
AUTHORIZED POSITIONS 2015-2016
Actual 2016-2017 Approved
2016-2017 Revised
2017-2018 Budget
Human Resources Director 1 1 1 1
Human Resources Assistant 1 1 1 1
Risk Management Assistant 1 1 1 1
Clerk Journeyman 2 2 2 2
City Hall Receptionist 0 0 1 1
FULL TIME 5 5 6 6
PART TIME 0 0 0 0
TOTAL 5 5 6 6
FUND General DEPARTMENT Human Resources
SIGNIFICANT CHANGES
For Fiscal Year 2017 City Hall receptionist position was added during mid year reviews.
EXPENDITURES 2015-2016
Actual 2016-2017 Approved
2016-2017 Revised
2017-2018 Budget
Personnel Services 243,164 249,199 243,433 254,678
Benefits 96,782 107,060 106,206 108,822
Supplies 7,773 17,750 17,750 15,650
Miscellaneous Services 45,198 52,290 49,600 39,925
Sundry Charges 28,969 30,600 30,600 31,100
TOTAL 421,886 456,899 447,589 450,175
Page 138
MISSION
The mission of the Building Services Department is to maintain a clean, safe and comfortable envi-ronment for the citizens, visitors and employees of the City of Lufkin.
DESCRIPTION OF SERVICES PROVIDED
The Building Services Department performs clean-ing and maintenance tasks within the various City facilities.
These tasks include:
Cleaning offices, meeting areas, public areas, stairways, restrooms and hallways
Emptying trash, replacing trash bags, collect-ing recyclable material
Sweep, mop, buff, vacuum or clean all floors located within city hall and municipal court buildings
Dust all furniture and fixtures as required
Wash and disinfect all washroom floors, toi-lets, toilet seats, urinals and hand wash sinks
Replenish toilet tissue, hand towels and soap as needed
Clean all entrances and exits including glass, doors and hardware
Keep outside areas near exits and entrance
free of debris
Clean, wash and disinfect drinking fountains
Wash all finger marks from walls, doors, light fixtures, hardware and glass
Perform and/or report any maintenance repairs or issues
Take mail to mailbox each afternoon
Other items deemed necessary by department head
WORK PROGRAM
The fiscal year 2018 goal for the Building Services depart-ment is to continue to provide a clean, safe and healthy work environment for city employees and guests to the City of Lufkin, Texas City Hall building and the new Municipal Court building.
Bu
ild
ing
Se
rv
ice
s
CI
TY
O
F
LU
FK
IN
,
TE
XA
S
WORKLOAD INDICATORS & PERFORMANCE MEASURES
GENERAL FUND
Fiscal Year
2018
Description 2015-2016
Actual 2016-2017 Revised
2017-2018 Budget
Total Square Feet of Municipal Buildings 68,940 68,940 68,940
Office Space Footage Cleaned daily per FTE 28,470 28,470 28,470
Office Space Footage Cleaned daily perm PTE 3,000 3,000 3,000
Supply Cost per Total Square Feet of Municipal Buildings 1.59 1.59 1.59
Total number of preventable accidents/ health issues due to unkempt conditions
0 0 0
Page 139

AUTHORIZED POSITIONS 2015-2016
Actual 2016-2017 Approved
2016-2017 Revised
2017-2018 Budget
Custodian 3 3 3 3
FULL TIME 2 2 2 2
PART TIME 1 1 1 1
TOTAL 3 3 3 3
EXPENDITURES 2015-2016
Actual 2016-2017 Approved
2016-2017 Revised
2017-2018 Budget
Personnel Services 56,766 57,050 58,107 58,370
Benefits 28,773 28,644 30,594 30,606
Supplies 20,403 24,100 23,600 23,600
Maintenance of Equipment 54,834 72,500 77,000 77,500
Miscellaneous Services 123,906 133,800 134,800 135,600
TOTAL 284,682 316,094 324,101 325,676
FUND General DEPARTMENT Building Services
SIGNIFICANT CHANGES
Page 140

DIVISION: Building Maintenance
DIVISION DESCRIPTION
The Building Maintenance department is responsible for the care and maintenance of the Lufkin City Hall building. The City Hall building Includes the offices of the Mayor, City Manager, Deputy City Manager, Human Resources, Public Works, Planning, City Engineer, Finance, Information Technology, Utility Collections, Main Street, Inspection Services, Police Department, and the Municipal Court building.
Bu
ild
ing
Se
rv
ice
s /
Bu
ild
ing
Ma
inte
na
nc
e
CI
TY
O
F
LU
FK
IN
,
TE
XA
S
AUTHORIZED POSITIONS 2015-2016
Actual 2016-2017 Approved
2016-2017 Revised
2017-2018 Budget
Custodians 3 3 3 3
FULL TIME 2 2 2 2
PART TIME 1 1 1 1
TOTAL 3 3 3 3
EXPENDITURES 2015-2016
Actual 2016-2017 Approved
2016-2017 Revised
2017-2018 Budget
Personnel Services 56,766 57,050 58,107 58,370
Benefits 28,773 28,644 30,594 30,606
Supplies 18,252 21,600 21,100 21,100
Maintenance of Equipment 50,178 64,500 69,000 69,500
Miscellaneous Services 123,906 133,800 134,800 135,600
TOTAL 277,875 305,594 313,601 315,176
GENERAL FUND
Fiscal Year
2018
Page 141

FUND:
DEPARTMENT: Building Services
DIVISION: Police Building
DIVISION DESCRIPTION
The Police Building Division is the cost center for the care and maintenance of the Lufkin Police Southbase building.
Bu
ild
ing
Se
rv
ice
s /
Po
lic
e B
uil
din
g
CI
TY
O
F
LU
FK
IN
,
TE
XA
S
AUTHORIZED POSITIONS 2015-2016
Actual 2016-2017 Approved
2016-2017 Revised
2017-2018 Budget
There are no positions authorized for this division.
FULL TIME
PART TIME
TOTAL
EXPENDITURES 2015-2016
Actual 2016-2017 Approved
2016-2017 Revised
2017-2018 Budget
Supplies 2,151 2,500 2,500 2,500
Maintenance of Equipment 4,656 8,000 8,000 8,000
Miscellaneous Services - - - -
TOTAL 6,807 10,500 10,000 10,500
Fiscal Year
2018
Page 142

MISSION
The City of Lufkin IT Department is committed to facilitating the use of information by employees and citizens through providing a computing environment that supports the decision making process.
DESCRIPTION OF SERVICES PROVIDED
The IT Department is responsible for maintaining the City's computer systems, which include a Wide Area Network connecting 18 remote sites by wireless broadband and 3 remote sites by fiber optic cable, with over 450 workstations and more than 500 telephones connected by twisted pair cable. The system is comprised of one iSeries server, one NaviLine server, 19 Windows 2003 servers, 10 Windows 2008 servers, 18 Windows 2012 servers and 11 Linux servers.
The department is responsible for equipment installation, network management, data fault protection, internal and Internet email services, World Wide Web services and groupware, all of which are running on internal servers. Additionally, the department is responsible for the maintenance and troubleshooting of the citywide telephone system (both desk phones and cellular phones), and advises department heads and administrators regarding cellular phone plans, equipment and usage.
The department provides advice to users on information systems, maintains a training program to assist users to become self-sufficient, maintains a trouble desk to assist users with problems, and has a hardware repair facility capable of repairing most PC failures.
The IT Department is responsible for maintaining the City's computer systems, which include a Wide
Area Network connecting 18 remote sites by wireless broadband and 3 remote sites by fiber optic cable, with over 450 workstations and more than 500 telephones connected by twisted pair cable. The system is comprised of one iSeries server, one NaviLine server, 19 Windows 2003 servers, 10 Windows 2008 servers, 18 Windows 2012 servers and 11 Linux servers.
In addition, the IT Department is responsible for programming on the City's Public Access Channel (Suddenlink Channel 15), and for coordinating the installation and maintenance of the City wide public Wi-Fi network.
The IT Department is committed to assisting the employees of the City of Lufkin with innovative information services designed to improve productivity and efficiency.
WORK PROGRAM
For the fiscal year 2018, the IT Department will concentrate on developing, testing and implementing the following initiatives: an expansion to our City Hall/Police Station building access system which will bring all code secured doors into one system; enhancements to the redundancy and failover capabilities of the wireless network; expansion of our Channel 15 broadcast capabilities, both on-air and across the Web; investigate new Web 2.0 Social Networking applications to enhance client productivity; upgrade to the latest version of SunGard Public Sector (HTE) software; make modifications to the current layout of the server room to allow for increased efficiency; add new services and features to the City’s messaging systems, thereby enhancing productivity of City employees; maintenance and modifications to our physical plant to enhance the structured cabling and air conditioning system in the server room; investigate new backup software to enhance our current backup strategy and overcome some shortcomings in our existing backup software; and structured auditing of the security of our network, both physical and electronic. In addition, we will continue to upgrade NetMotion and Crimes softwares as needed to implement enhanced authentication for the Police Department in order to meet CJIS requirements.
WORKLOAD INDICATORS & PERFORMANCE MEASURES
Info
rm
ati
on
Te
ch
no
log
y
CI
TY
O
F
LU
FK
IN
,
TE
XA
S
GENERAL FUND
Fiscal Year
2018
Description 2014-2015
Actual 2015-2016 Revised
2016-2017 Budget
iSeries/NaviLine logon and resources available for 90% of customer base for greater than 90% of the day
98% 99% 99%
Local Area Network traffic exchanged within City Hall and fiber-connected remote facilities for greater than 90% of the day
98% 99% 99%
Wide Area Network traffic exchanged between City Hall and 90% of Remote Facilities for greater than 90% of each day for 100% of days
96% 98% 99%
Number of websites hosted 72 74 74
Hosted websites available for 95%+ of the day for 360+ days per year
100% 100% 100%
90% of Help Desk Tickets closed within one week of sub-mission
85% 85% 90%
Description 2015-2016
Actual 2016-2017 Revised
2017-2018 Budget
iSeries/NaviLine logon and resources available for 90% of customer base for greater than 90% of the day
98% 99% 99%
Local Area Network traffic exchanged within City Hall and fiber-connected remote facilities for greater than 90% of the day
98% 99% 99%
Wide Area Network traffic exchanged between City Hall and 90% of Remote Facilities for greater than 90% of each day for 100% of days
96% 98% 99%
Number of websites hosted 72 74 74
Hosted websites available for 95%+ of the day for 360+ days per year
100% 100% 100%
90% of Help Desk Tickets closed within one week of sub-mission
85% 85% 90%
Page 143

AUTHORIZED POSITIONS 2015-2016
Actual 2016-2017 Approved
2016-2017 Revised
2017-2018 Budget
Director 1 1 1 1
Systems Analyst 3 3 3 3
System Technician 1 1 1 1
System Specialist 1 1 1 1
IT Technician 1 1 1 1
FULL TIME 7 7 7 7
PART TIME 0 0 0 0
TOTAL 7 7 7 7
FUND General DEPARTMENT Information Technology
SIGNIFICANT CHANGES
EXPENDITURES 2015-2016
Actual 2016-2017 Approved
2016-2017 Revised
2017-2018 Budget
Personnel Services 444,471 443,289 451,983 452,697
Benefits 161,824 163,715 167,494 167,501
Supplies 176,544 89,980 88,580 82,005
Maintenance of Equipment 234,351 255,993 255,993 265,958
Miscellaneous Services 128,186 168,330 169,730 165,710
TOTAL 1,145,376 1,121,307 1,133,780 1,133,871
Page 144

P
UB
LIC
S
AF
ET
Y
Public Safety Departments include the following:
Police Department
Fire Department
Municipal Court
City Marshall
Inspection Services
Emergency Management
Animal Control
C
IT
Y
OF
L
UF
KI
N,
T
EX
AS
Fiscal Year
2018
Page 145

MISSION
The Lufkin Police Department is committed to the reduction of crime and the fear of crime by work-ing with the community to preserve life and protect property, maintain human rights and promote indi-vidual responsibility. We are dedicated to safe-guarding public confidence and providing a safe place for all to live, work and raise families.
DESCRIPTION OF SERVICES PROVIDED
Protect constitutional guarantees
Identify criminal offenders and criminal activ-ity and, where appropriate, to apprehend of-fenders and participate in subsequent court proceedings
Reduce the opportunity for the commission of some crime through preventive patrol and other measures
Aid individuals who are in danger of physical harm
Facilitate the movement of people and vehi-cles
Assist those who cannot care for themselves
Resolve conflict
Identify problems that are potentially serious law enforcement or governmental problems
Create and maintain a feeling of security in the community
Promote and preserve civil order; and to provide other services on an emergency basis
WORK PROGRAM
The Lufkin Police Department plans to take the fol-lowing steps to meet our citizen’s needs and evolving expectations:
1. Training – New and inexperienced person-nel require a great deal of training to be fully ready to meet the challenges they will face. A significant percentage of our per-sonnel are new and inexperienced. One specific topic that all LPD officers will at-tend this year is Tactical De-escalation Techniques. This is training designed to improve an officers communication and negotiation skills with the goal of decreas-ing the need to engage in physical force techniques. Other, cost conscious training options will be used to bring all of our per-sonnel up to the level needed for optimum performance.
2. Retention of Personnel – The City of Lufkin has done a tremendous job in giving us tools and options to attract and hire enough personnel to fully staff our sworn positions. We will have to remain diligent and be creative to avoid fallen behind in the area of retention. We will explore all rea-sonable options to make LPD a great place to stay.
Po
lic
e D
ep
ar
tme
nt
CI
TY
O
F
LU
FK
IN
,
TE
XA
S
WORKLOAD INDICATORS & PERFORMANCE MEASURES
GENERAL FUND
Fiscal Year
2018
Description 2015-2016
Actual 2016-2017 Revised
2017-2018 Budget
Total calls for service 40,700 43,900 45,400
Comply with all applicable Texas Police Chiefs Associa-tion best practices standards to achieve recognized status
85% 85% 88%
Emergency responses under 2 minutes 58% 66% 65%
Non-emergency responses under 6 minutes 76% 80% 84%
Page 146

DEPARTMENT Police Department FUND General
EXPENDITURES 2015-2016
Actual 2016-2017 Approved
2016-2017 Revised
2017-2018 Budget
Personnel Services 6,100,763 6,031,534 6,119,218 6,007,332
Benefits 2,240,171 2,085,562 2,250,729 2,228,135
Supplies 499,946 359,465 328,257 338,022
Maintenance of Equipment 133,699 161,685 189,185 167,685
Miscellaneous Services 548,658 573,101 580,501 615,208
Sundry Charges - 1,000 1,000 1,000
Capital Outlay - - - -
TOTAL 9,523,237 9,212,347 9,468,890 9,357,382
SIGNIFICANT CHANGES
FY2016: Police Lieutenant position hired as a Patrol Officer. Two Police Sergeant positions hired as a Patrol officer. Added one Police officer positions. Added a Public relations Specialist. Added one Part-Time Communication Operator. FY 2017: Midyear position changes-Police GEO Base Manager position closed. Opened Clerk Apprentice position. FY 2018: No anticipated significant changes.
AUTHORIZED POSITIONS 2015-2016
Actual 2016-2017 Approved
2016-2017 Revised
2017-2018 Budget
Police Chief 1 1 1 1
Assistant Police Chief 1 1 1 1
Administrative Assistant 1 1 1 1
Police Special Services Manager 1 1 1 1
Police Relations Specialist 1 1 1 1
Police Lieutenant 6 6 6 6
Police Sergeant 6 6 6 6
Police Corporal 6 6 6 6
Police Officer 57 57 57 57
Police Communications Supervisor 1 1 1 1
Police Communications Operator 13 13 13 13
Police Crime Scene Technician 3 3 3 3
Clerk-Journeyman 2 2 2 2
Clerk Apprentice 0 0 1 1
Terminal Agency Coordinator 1 1 1 1
Police GEO Base Manager 1 1 0 0
FULL TIME 100 100 100 100
PART TIME 1 1 1 1
TOTAL 101 101 101 101
Page 147
DIVISION: Administration
DIVISION DESCRIPTION
The Administration Division is charged with the organization, direction, and control of all resources of the City of Lufkin Police Department.
Po
lic
e D
ep
ar
tme
nt
/ A
dm
inis
tra
tio
n
CI
TY
O
F
LU
FK
IN
,
TE
XA
S
AUTHORIZED POSITIONS 2015-2016
Actual 2016-2017 Revised
2017-2018 Budget
2016-2017 Approved
Police Chief 1 1 1 1
Assistant Police Chief 1 1 1 1
Administrative Assistant 1 1 1 1
Publice Relations Specialist 1 1 1 1
Police Special Services Manager 1 1 1 1
FULL TIME 5 5 5 5
PART TIME 0 0 0 0
TOTAL 5 5 5 5
EXPENDITURES 2015-2016
Actual 2016-2017 Approved
2016-2017 Revised
2017-2018 Budget
Personnel Services 345,643 346,998 373,093 345,701
Benefits 121,836 121,318 128,518 122,365
Supplies 141,166 39,315 37,275 34,040
Maintenance of Equipment 73,070 94,185 88,185 86,685
Miscellaneous Services 181,796 167,075 174,475 184,480
Sundry Charges - 1,000 1,000 1,000
Capital Outlay - - - -
TOTAL 863,511 769,891 802,546 774,271
GENERAL FUND
Fiscal Year
2018
Page 148

DIVISION: Patrol
DIVISION DESCRIPTION
The primary responsibility of the Patrol Division is the protection of the lives and property of the citi-zens of Lufkin and the safe, orderly flow of traffic.
Po
lic
e D
ep
ar
tme
nt
/ P
atr
ol
CI
TY
O
F
LU
FK
IN
,
TE
XA
S
EXPENDITURES 2015-2016
Actual 2016-2017 Approved
2016-2017 Revised
2017-2018 Budget
Personnel Services 3,611,374 3,435,017 3,501,064 3,434,299
Benefits 1,303,337 1,192,882 1,289,526 1,278,826
Supplies 283,477 269,700 245,532 255,532
Maintenance of Equipment 42,947 42,000 75,500 55,500
Miscellaneous Services 275,190 288,355 288,355 303,500
Sundry - - - -
TOTAL 5,516,325 5,227,954 5,399,977 5,327,657
GENERAL FUND
Fiscal Year
2018
AUTHORIZED POSITIONS 2015-2016
Actual 2016-2017 Approved
2016-2017 Revised
2017-2018 Budget
Police Lieutenant 4 4 4 4
Police Sergeant 4 4 4 4
Police Corporal 4 4 4 4
Police Officer—Patrol 44 44 44 44
FULL TIME 56 56 56 56
PART TIME 0 0 0 0
TOTAL 56 56 56 56
Page 149

DIVISION: Communication
DIVISION DESCRIPTION
The Communications Division's primary function is to receive calls for service and relay that infor-mation to the proper Police and Fire personnel.
Po
lic
e D
ep
ar
tme
nt
/ C
om
mu
nic
ati
on
CI
TY
O
F
LU
FK
IN
,
TE
XA
S
EXPENDITURES 2015-2016
Actual 2016-2017 Approved
2016-2017 Revised
2017-2018 Budget
Personnel Services 649,112 691,765 706,571 709,291
Benefits 260,640 255,738 267,327 267,020
Supplies 22,716 8,750 8,750 8,750
Maintenance of Equipment 8,273 17,500 17,500 17,500
Miscellaneous Services 1,554 5,500 5,500 5,500
Capital Outlay - - - -
TOTAL 942,295 979,253 1,005,648 1,008,061
GENERAL FUND
Fiscal Year
2018
AUTHORIZED POSITIONS 2015-2016
Actual 2016-2017 Approved
2016-2017 Revised
2017-2018 Budget
Police Lieutenant 1 1 1 1
Police Communications Supervisor 1 1 1 1
Police Communications Operator 13 13 13 13
FULL TIME 14 14 14 14
PART TIME 1 1 1 1
TOTAL 15 15 15 15
Page 150

DIVISION: CID & Narcotics
DIVISION DESCRIPTION
The CID and Narcotics Division is responsible for the follow up investigation of criminal offenses and the investigation into illegal narcotic transactions.
Po
lic
e D
ep
ar
tme
nt
/ C
ID &
Na
rc
oti
cs
CI
TY
O
F
LU
FK
IN
,
TE
XA
S
EXPENDITURES 2015-2016
Actual 2016-2017 Approved
2016-2017 Revised
2017-2018 Budget
Personnel Services 1,383,821 1,447,868 1,437,676 1,415,231
Benefits 505,794 467,139 518,373 512,978
Supplies 52,121 41,200 36,200 39,200
Maintenance of Equipment 9,409 8,000 8,000 8,000
Miscellaneous Services 81,359 102,471 102,471 112,028
TOTAL 2,032,504 2,066,678 2,102,720 2,087,437
GENERAL FUND
Fiscal Year
2018
AUTHORIZED POSITIONS 2015-2016
Actual 2016-2017 Approved
2016-2017 Revised
2017-2018 Budget
Police Lieutenant 1 1 1 1
Police Sergeant 2 2 2 2
Police Corporal 2 2 2 2
Police Officer—Investigators 13 13 13 13
Police Crime Scene Investigator 3 3 3 3
Clerk-Journeyman 1 1 1 1
Property Room Clerk 0 0 0 0
FULL TIME 22 22 22 22
PART TIME 0 0 0 0
TOTAL 22 22 22 22
Page 151

DIVISION: Support Services
DIVISION DESCRIPTION
The Support Services division includes records retention and geo-base services.
Po
lic
e D
ep
ar
tme
nt
/ S
up
po
rt
Se
rv
ice
s
CI
TY
O
F
LU
FK
IN
,
TE
XA
S
EXPENDITURES 2015-2016
Actual 2016-2017 Approved
2016-2017 Revised
2017-2018 Budget
Personnel Services 110,813 109,886 100,814 102,810
Benefits 48,564 48,485 46,985 46,946
Supplies 466 500 500 500
Miscellaneous Services 8,759 9,700 9,700 9,700
TOTAL 162,369 164,556 165,827 168,571
GENERAL FUND
Fiscal Year
2018
AUTHORIZED POSITIONS 2015-2016
Actual 2016-2017 Approved
2016-2017 Revised
2017-2018 Budget
Clerk Journeyman 1 1 1 1
Clerk Apprentice 0 0 1 1
Terminal Agency Coordinator 1 1 1 1
Police GEO Base Manager 1 1 0 0
FULL TIME 3 3 3 3
PART TIME 0 0 0 0
TOTAL 3 3 3 3
Page 152

MISSION
The mission of the Lufkin Fire Department is to protect lives and property through a variety of public safety services under the direction of the City of Lufkin.
DESCRIPTION OF SERVICES PROVIDED
The Lufkin Fire Department provides all hazards response and mitigation services to the community through:
Risk reduction analysis and planning
Public awareness and education campaigns
Fire suppression
Emergency medical response
Technical rescue
Hazardous materials response
Plans review
Fire and life safety code enforcement
Fire investigation activities
WORK PROGRAM
The Lufkin Fire Department will strive to meet the following goals during the 2017-18 budget year: Develop fire and injury prevention strategies to
reduce morbidity and mortality in the community based on statistical review and analysis of root cause. Increase inspections, and training to comply with our ISO 2 rating. Enhance disaster readiness through network development and training. Continue succession planning and education.
Fir
e D
ep
ar
tme
nt
CI
TY
O
F
LU
FK
IN
,
TE
XA
S
WORKLOAD INDICATORS & PERFORMANCE MEASURES
GENERAL FUND
Aerial Platform Truck purchased with Grant Funds
Fiscal Year
2018
Description 2015-2016
Actual 2016-2017
Revised
2017-2018 Budget
Total Number of EMS Responses 8,500 8,438 9,402
Total Number of Fire Responses 3855 3923 3874
Respond to emergency incidents within the City of Lufkin within 5 minutes 90% of the time.
75% 80% 85%
Total Number of Structure Fires 68 62 45
Total Number of Structure Fire related Deaths 1 0 0
Strive to ensure that there are 0 civilian deaths due to structure fires within the City of Lufkin 100% of the time.
100% 100% 100%
Page 153

DEPARTMENT Fire Department FUND General
EXPENDITURES 2015-2016
Actual 2016-2017 Approved
2016-2017 Revised
2017-2018 Budget
Personnel Services 5,224,337 5,115,352 5,227,611 5,161,667
Benefits 1,833,084 1,663,068 1,857,663 1,856,096
Supplies 370,019 394,175 417,638 403,150
Maintenance of Equipment 221,038 128,165 211,026 206,664
Miscellaneous Services 368,061 382,067 365,670 420,865
Sundry Charges 27 100 100 100
Capital Outlay 13,187 - - -
TOTAL 8,062,753 7,682,927 8,079,708 8,048,542
AUTHORIZED POSITIONS 2015-2016
Actual 2016-2017 Approved
2016-2017 Revised
2017-2018 Budget
Fire Chief 1 1 1 1
Assistant Fire Chief 1 1 1 1
Clerk –Senior Level 1 1 1 1
Maintenance Worker 1 0 0 0
Battalion Chief 5 5 5 5
Captain 18 18 18 18
Lieutenant 15 15 15 15
Firefighters 39 39 39 39
FULL TIME 81 80 80 80
PART TIME 0 0 0 0
TOTAL 81 80 80 80
SIGNIFICANT CHANGES
FY2016- Maintenance Worker salary expenditure is paid out of Water/Sewer Department.
Page 154

DIVISION: Fire Administration
DIVISION DESCRIPTION
The Fire Administration Division provides overall management and direction for the department, de-velops policies and procedures for operations, and coordinates training. Fire Administration also pro-vides quality assurance review for all EMS calls, and procures all medical supplies, bunker gear, fire and rescue equipment, and hazardous material mit-igation supplies and special operations equipment.
Fir
e D
ep
ar
tme
nt
/ F
ire
Ad
min
istr
ati
on
CI
TY
O
F
LU
FK
IN
,
TE
XA
S
AUTHORIZED POSITIONS
2015-2016 Actual
2016-2017 Approved
2016-2017 Revised
2017-2018 Budget
Fire Chief 1 1 1 1
Assistant Fire Chief 1 1 1 1
Administrative Assistant 1 1 1 1
Maintenance Worker 1 0 0 0
Battalion Chief 1 1 1 1
Captains 2 2 2 2
FULL TIME 7 6 6 6
PART TIME 0 0 0 0
TOTAL 7 6 6 6
EXPENDITURES 2015-2016
Actual 2016-2017 Approved
2016-2017 Revised
2017-2018 Budget
Personnel Services 474,190 449,842 455,732 457,382
Benefits 166,445 146,598 153,035 153,231
Supplies 15,468 19,600 16,808 18,790
Maintenance of Equipment 26,950 5,100 20,311 12,599
Miscellaneous Services 121,519 122,335 122,535 124,344
Capital Outlay 13,187 - - -
TOTAL 817,759 743,475 768,421 766,346
GENERAL FUND
Fiscal Year
2018
Page 155
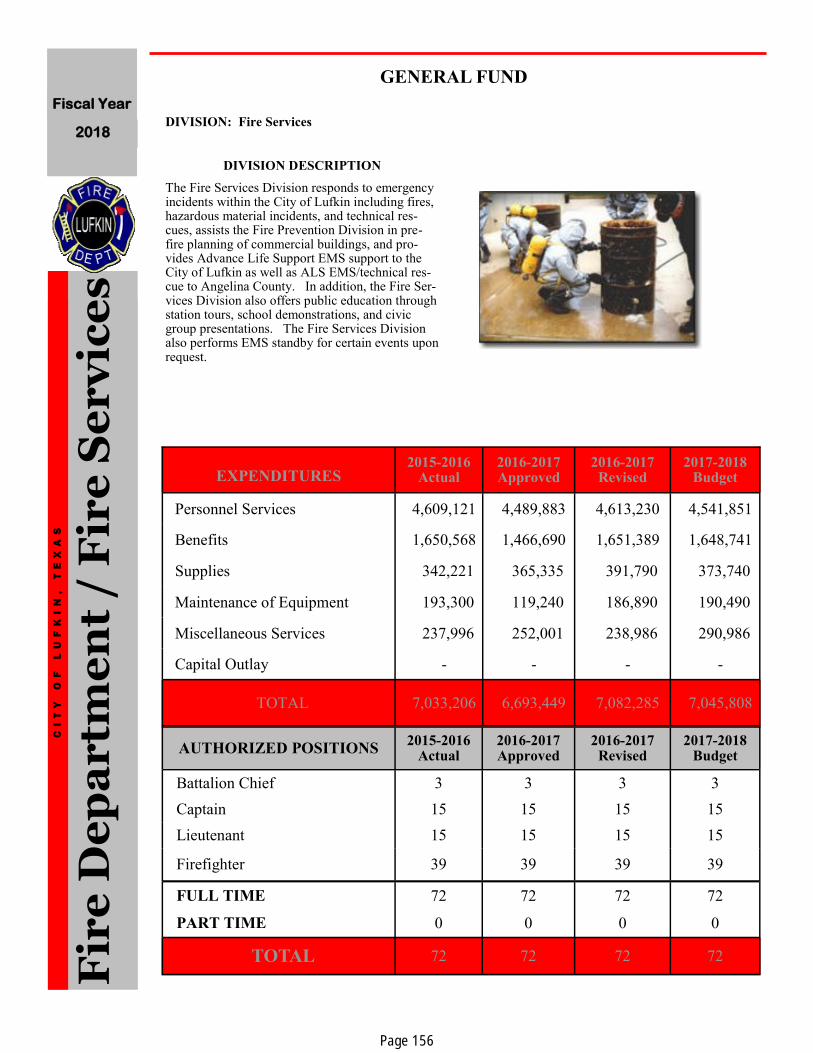
DIVISION: Fire Services
DIVISION DESCRIPTION
The Fire Services Division responds to emergency incidents within the City of Lufkin including fires, hazardous material incidents, and technical res-cues, assists the Fire Prevention Division in pre-fire planning of commercial buildings, and pro-vides Advance Life Support EMS support to the City of Lufkin as well as ALS EMS/technical res-cue to Angelina County. In addition, the Fire Ser-vices Division also offers public education through station tours, school demonstrations, and civic group presentations. The Fire Services Division also performs EMS standby for certain events upon request.
Fir
e D
ep
ar
tme
nt
/ F
ire
Se
rv
ice
s
CI
TY
O
F
LU
FK
IN
,
TE
XA
S
AUTHORIZED POSITIONS 2015-2016
Actual 2016-2017 Approved
2016-2017 Revised
2017-2018 Budget
Battalion Chief 3 3 3 3
Captain 15 15 15 15
Lieutenant 15 15 15 15
Firefighter 39 39 39 39
FULL TIME 72 72 72 72
PART TIME 0 0 0 0
TOTAL 72 72 72 72
EXPENDITURES 2015-2016
Actual 2016-2017 Approved
2016-2017 Revised
2017-2018 Budget
Personnel Services 4,609,121 4,489,883 4,613,230 4,541,851
Benefits 1,650,568 1,466,690 1,651,389 1,648,741
Supplies 342,221 365,335 391,790 373,740
Maintenance of Equipment 193,300 119,240 186,890 190,490
Miscellaneous Services 237,996 252,001 238,986 290,986
Capital Outlay - - - -
TOTAL 7,033,206 6,693,449 7,082,285 7,045,808
GENERAL FUND
Fiscal Year
2018
Page 156

DIVISION: Fire Prevention
DIVISION DESCRIPTION
The Fire Prevention Division is responsible for the inspection of commercial structures for fire and life safety matters; plan review for commercial building, fire sprinkler, and fire alarm permit appli-cations; investigation of fires to determine the cause and origin; collection and presentation of evidence for the prosecution of arson cases; main-tain the state fire reporting system; provide training and materials for fire prevention education; assist
with public relations; and enforce the Smoking Pollu-tion Control Ordinance.
Fir
e D
ep
ar
tme
nt
/ F
ire
Pr
ev
en
tio
n
CI
TY
O
F
LU
FK
IN
,
TE
XA
S
AUTHORIZED POSITIONS 2015-2016
Actual 2016-2017 Approved
2016-2017 Revised
2017-2018 Budget
Battalion Chief—Fire Marshall 1 1 1 1
Captain—Fire Inspector 1 1 1 1
FULL TIME 2 2 2 2
PART TIME 0 0 0 0
TOTAL 2 2 2 2
EXPENDITURES 2015-2016
Actual 2016-2017 Approved
2016-2017 Revised
2017-2018 Budget
Personnel Services 141,026 175,627 158,649 162,434
Benefits 49,07 49,480 53,239 54,124
Supplies 12,330 9,240 9,040 10,620
Maintenance of Equipment 788 3,825 3,825 3,575
Miscellaneous Services 8,546 7,731 4,149 5,535
Sundry Charges 27 100 100 100
TOTAL 211,788 246,003 229,002 236,388
GENERAL FUND
Fiscal Year
2018
Page 157
MISSION
The mission of the Municipal Court is to apply facts and laws to each complaint in the manner that is both uniform and fair, in order to meet the needs of the citizens of Lufkin.
DESCRIPTION OF SERVICES PROVIDED
The Municipal Court provides a service to the public that is part of the criminal justice system, which deters unacceptable and illegal conduct, while ensuring that each individual is treated with courtesy and dignity, and is informed of his/her obligations and options under the law.
Municipal Court is responsible for processing all complaints with diligence and efficiency so that all laws are enforced uniformly.
The Court is responsible for maintaining accurate records regarding complaints filed and funds received.
Municipal Court is responsible for maintaining records for criminal justice purposes and preparing monthly reports for the State of Texas and the City of Lufkin.
WORK PROGRAM
The Municipal Court will continue to work with Linebarger Goggan Blair & Sampson LLP Services on collection cases. Municipal Court will also continue participating in the Omni program and will conduct annual warrant sweeps to hold defendants accountable for their actions.
Mu
nic
ipa
l C
ou
rt
CI
TY
O
F
LU
FK
IN
,
TE
XA
S
WORKLOAD INDICATORS & PERFORMANCE MEASURES
GENERAL FUND
Fiscal Year
2018
Description 2015-2016
Actual 2016-2017
Revised 2017-2018
Budget
Number of Citations Filed 7,052 7,500 8,000
Number of Citations Deferred 798 850 850
% of Citations Deferred 11% 11% 11%
Page 158
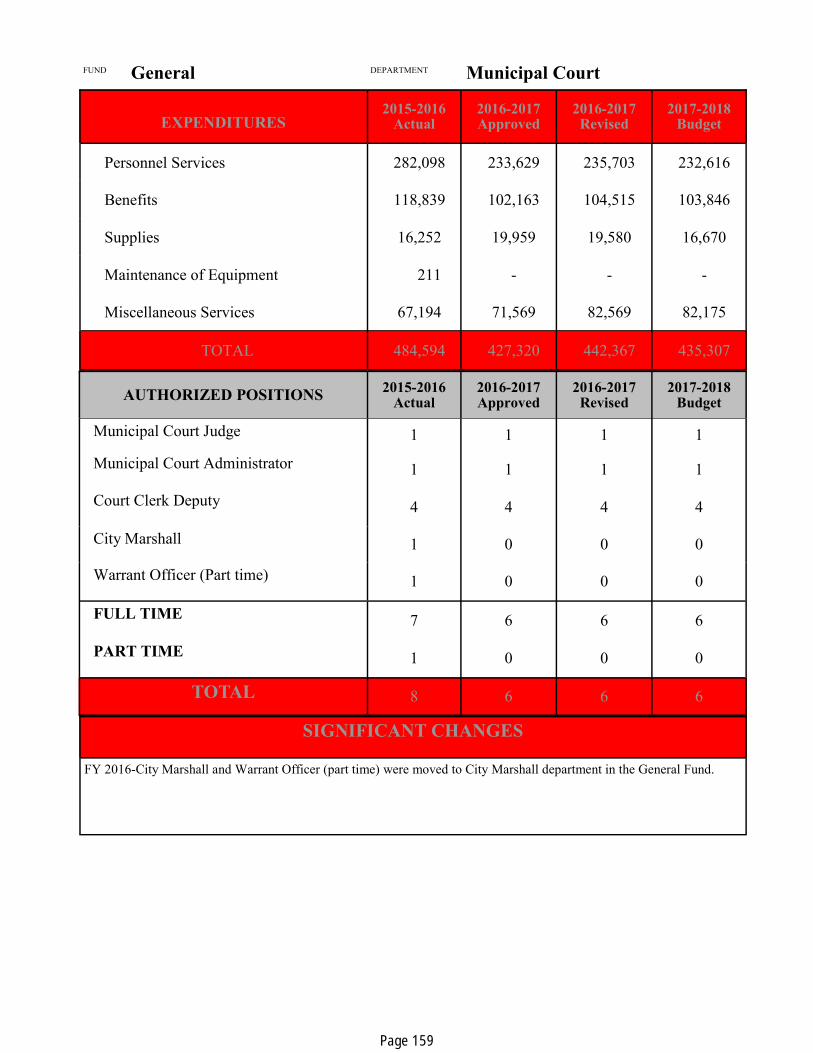
AUTHORIZED POSITIONS 2015-2016
Actual 2016-2017 Approved
2016-2017 Revised
2017-2018 Budget
Municipal Court Judge 1 1 1 1
Municipal Court Administrator 1 1 1 1
Court Clerk Deputy 4 4 4 4
City Marshall 1 0 0 0
Warrant Officer (Part time) 1 0 0 0
FULL TIME 7 6 6 6
PART TIME 1 0 0 0
TOTAL 8 6 6 6
FUND General DEPARTMENT Municipal Court
SIGNIFICANT CHANGES
FY 2016-City Marshall and Warrant Officer (part time) were moved to City Marshall department in the General Fund.
EXPENDITURES 2015-2016
Actual 2016-2017 Approved
2016-2017 Revised
2017-2018 Budget
Personnel Services 282,098 233,629 235,703 232,616
Benefits 118,839 102,163 104,515 103,846
Supplies 16,252 19,959 19,580 16,670
Maintenance of Equipment 211 - - -
Miscellaneous Services 67,194 71,569 82,569 82,175
TOTAL 484,594 427,320 442,367 435,307
Page 159

MISSION
The mission of the Lufkin City Marshall’s Office is to conduct a professional law enforcement agency that is fair and equal to all people. To maintain security for the Lufkin Municipal Court and to serve and protect the citizens of Lufkin and Angelina County. To have a positive atmosphere for the citizens we come in contact with on a daily basis.
DESCRIPTION OF SERVICES PROVIDED
The Marshall’s office is to provide a safe and secure court.
To continuously serve the cities class C warrants..
To manage and operate the ATS red-light camera systems.
WORK PROGRAM
The Lufkin City Marshal’s office will continue to provide safety and security for the City’s Municipal Court and the citizens of Lufkin and Angelina. The Marshal’s office will also continue to operate all areas of the Red-light Safety program and continue to serve the cities warrants and to serve and protect the people with fair and equal justice.
Cit
y M
ar
sh
all
C
IT
Y
OF
L
UF
KI
N,
T
EX
AS
WORKLOAD INDICATORS & PERFORMANCE MEASURES
GENERAL FUND
Fiscal Year
2018
Description 2015-2016
Actual 2016-2017
Revised 2017-2018
Budget
Number of Warrants Issued 8,418 9,000 9,000
Number of Warrant Sweeps per year 1 1 1
Number of Warrants Resolved during warrant sweep periods
829 858 900
Page 160

AUTHORIZED POSITIONS 2015-2016
Actual 2016-2017 Approved
2016-2017 Revised
2017-2018 Budget
City Marshall 0 1 1 1
Warrant Officer (Part time) 0 1 1 1
FULL TIME 0 1 1 1
PART TIME 0 1 1 1
TOTAL 0 2 2 2
FUND General DEPARTMENT City Marshall
SIGNIFICANT CHANGES
FY 2016-New department for City Marshall and Warrant Officer (part time).
EXPENDITURES 2015-2016
Actual 2016-2017 Approved
2016-2017 Revised
2017-2018 Budget
Personnel Services 448 53,407 53,005 53,043
Benefits 84 21,009 20,392 20,376
Supplies - 9,427 8,805 9,405
Maintenance of Equipment - - - -
Miscellaneous Services - 3,536 3,536 3,520
TOTAL 532 87,679 86,038 86,644
Page 161

MISSION
The mission of Inspection Services Department is to enhance and protect the public health, safety, and welfare through the review, inspection, and enforcement of City and State Codes as they relate to public improvements with, building, fire and code enforcement.
DESCRIPTION OF SERVICES PROVIDED
The Inspection Services Department consists of three areas of responsibility. The major areas of consideration are building, fire, and administration of related codes.
The Building Code Division’s duties include reviewing new and renovated projects for compliance with State and local building, plumbing, mechanical, gas and electrical codes.
Fire Code responsibilities include inspecting for compliance of national as well as local adopted ordinances, inspecting buildings and housings, and enforcing fire code complaints.
Building Code enforcement responsibilities include administering departmental policies, ordinances and codes, accepting and processing all building permit requests, responding to customer inquiries regarding
building codes, communicating local ordinance requirements to customers, educating and training the public as well as contractors. Inspection Services also provides interpretive support to the construction industry regarding methods and materials of construction and their compliance with the building codes.
WORK PROGRAM
The Department’s primary goals are to seek and understand the concerns of the citizens of Lufkin, to establish reasonable timelines, and to provide the quality and professionalism that is essential to ensuring a safe built environment. In addition to simultaneously minimizing bureaucratic barriers to residents and businesses. The Department will continue striving to meet citizens expectations of excellence by reducing plan review times while maintaining a high level of compliance. Code Enforcement will continue taking an aggressive stance in requiring sub-standard structures be removed or repaired throughout the City according to local laws and ordinances.
Ins
pe
cti
on
Se
rv
ice
s
CI
TY
O
F
LU
FK
IN
,
TE
XA
S
WORKLOAD INDICATORS & PERFORMANCE MEASURES
GENERAL FUND
Fiscal Year
2018
Description 2015-2016
Actual 2016-2017 Revised
2017-2018 Budget
Total Number Construction Plans Reviewed 511 481 496
Total Number of Construction Plans Reviewed in 3 Busi-ness Days or Less
418 413 472
Review Construction Plans Within 3 Business Days 95% of Time
82% 90% 95%
Total Number of Code Enforcement Complaints 1,865 1,608 1,737
Total Number of Code Enforcement Complaints Investi-gated Within 8 Hours of Call
1,772 1,528 1,702
Investigate Complaints Within 8 Hours of Call 95% of the Time
97% 98% 98%
Page 162

DEPARTMENT Inspection Services FUND General
EXPENDITURES 2015-2016
Actual 2016-2017 Approved
2016-2017 Revised
2017-2018 Budget
Personnel Services 338,339 338,759 345,280 346,177
Benefits 142,083 142,201 144,622 144,497
Supplies 17,478 20,950 17,730 16,860
Maintenance of Equipment 1,007 1,500 1,000 1,500
Miscellaneous Services 44,456 50,832 49,715 44,722
TOTAL 543,363 554,242 558,347 553,756
AUTHORIZED POSITIONS 2015-2016
Actual 2016-2017 Approved
2016-2017 Revised
2017-2018 Budget
Inspection Services Director 1 1 1 1
Clerk-Journeyman 1 1 1 1
Plan Reviewer 1 1 1 1
Building Inspector 2 2 2 2
Code Enforcement Officer 3 3 3 3
FULL TIME 8 8 8 8
PART TIME 0 0 0 0
TOTAL 8 8 8 8
SIGNIFICANT CHANGES
Page 163
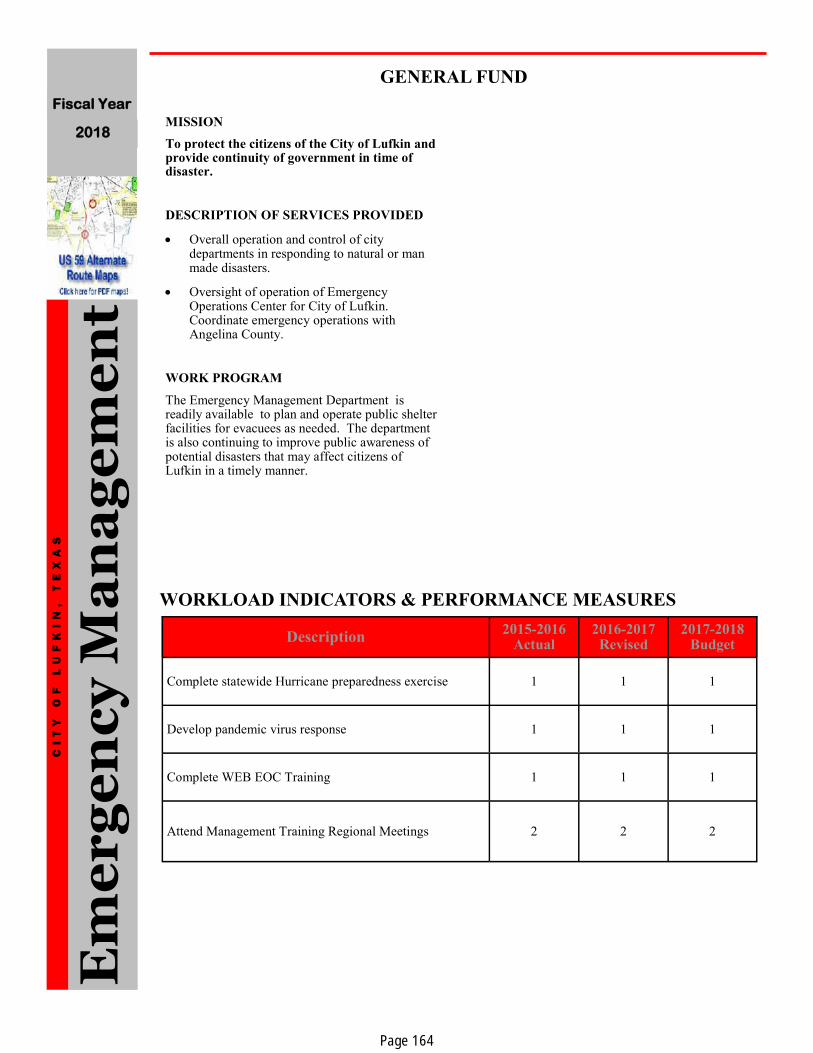
MISSION
To protect the citizens of the City of Lufkin and provide continuity of government in time of disaster.
DESCRIPTION OF SERVICES PROVIDED
Overall operation and control of city departments in responding to natural or man made disasters.
Oversight of operation of Emergency Operations Center for City of Lufkin. Coordinate emergency operations with Angelina County.
WORK PROGRAM
The Emergency Management Department is readily available to plan and operate public shelter facilities for evacuees as needed. The department is also continuing to improve public awareness of potential disasters that may affect citizens of Lufkin in a timely manner.
Em
er
ge
nc
y M
an
ag
em
en
t C
IT
Y
OF
L
UF
KI
N,
T
EX
AS
Description 2015-2016
Actual 2016-2017 Revised
2017-2018 Budget
Complete statewide Hurricane preparedness exercise 1 1 1
Develop pandemic virus response 1 1 1
Complete WEB EOC Training 1 1 1
Attend Management Training Regional Meetings 2 2 2
WORKLOAD INDICATORS & PERFORMANCE MEASURES
GENERAL FUND
Fiscal Year
2018
Page 164

DEPARTMENT Emergency Management FUND General
EXPENDITURES 2015-2016
Actual 2016-2017 Approved
2016-2017 Revised
2017-2018 Budget
Supplies 2,570 1,320 1,320 1,320
Miscellaneous Services 42,673 49,300 51,675 48,535
TOTAL 45,243 50,620 52,995 49,855
AUTHORIZED POSITIONS 2015-2016
Actual 2016-2017 Approved
2016-2017 Revised
2017-2018 Budget
There are no authorized positions for this department
FULL TIME
PART TIME
TOTAL
SIGNIFICANT CHANGES
Page 165

MISSION
The mission of the Lufkin Animal Control Department is to protect the health and safety of our residents through the prevention of rabies, enforcement of state and local animal related laws, and promotion of responsible pet ownership. The objective of every Animal Control employee is to provide outstanding service to the public and to protect animals and promote their humane treatment.
DESCRIPTION OF SERVICES PROVIDED
Enforce local animal related ordinances through education, warnings, and citations.
Promote responsible pet ownership through educational programs with local schools and community groups.
Provide the community with adoption services for unclaimed and unwanted animals utilizing all forms of media to promote our animals.
Co-operation with the Animal Rescue and Animal Welfare organizations to re-home unwanted pets.
Manage the Kurth Memorial Animal Shelter meeting state standards and providing care for approximately 8,000 animals a year.
Release domesticated animals and pets to owners whenever possible and appropriate.
Relieve pain and suffering of animals.
Animal Control officers respond to a variety of animal related situations from livestock to domestic animals.
WORK PROGRAM
An
ima
l C
on
tro
l C
IT
Y
OF
L
UF
KI
N,
T
EX
AS
WORKLOAD INDICATORS & PERFORMANCE MEASURES
GENERAL FUND
Animal Control will provide quick and efficient response to all requests for service by citizens. Provide education programs to community groups and schools on bite prevention, rabies awareness and responsible pet ownership. Shelter staff will focus on delivering the best and most humane care possible for all animals that enter the shelter while providing excellent customer services to the public. Work with volunteers to operate adoption events and other special events to promote our animals an re-home as many as possible.
Animal Control Facility in Lufkin, Texas
Fiscal Year
2018
Description 2015-2016
Actual 2016-2017
Revised
2017-2018 Budget
Number of animals received at shelter 5,012 4,800 5,000
Number of animals adopted 961 1,200 1,200
Number of animals reclaimed 423 450 500
Number of animals sent to rescue 586 600 650
Number of animals euthanized 2,581 2,200 2,000
Euthanasia rate 51% 46% 40%
Page 166

DEPARTMENT Animal Control FUND General
EXPENDITURES 2015-2016
Actual 2016-2017 Approved
2016-2017 Revised
2017-2018 Budget
Personnel Services 365,662 360,874 368,877 376,332
Benefits 171,417 161,860 172,101 173,831
Supplies 55,711 67,290 65,290 65,700
Maintenance of Equipment 12,890 17,500 18,500 18,000
Miscellaneous Services 107,583 121,025 120,665 108,354
TOTAL 713,263 728,549 745,433 742,217
AUTHORIZED POSITIONS
2015-2016 Actual
2016-2017 Approved
2016-2017 Revised
2017-2018 Budget
Animal Control Director 1 1 1 1
Animal Control Supervisor Assistant 1 1 1 1
Clerk Journeyman 1 1 1 1
Animal Control Officer-Lead 1 1 1 1
Animal Control Officer 3 3 3 3
Laborer 4 4 4 4
FULL TIME 11 11 11 11
PART TIME 0 0 0 0
TOTAL 10 11 11 11
SIGNIFICANT CHANGES
There are no significant changes planned for 2018.
Page 167

P
UB
LIC
W
OR
KS
Public Works Departments include the following:
Engineering
Streets
Fleet Maintenance
CI
TY
O
F
LU
FK
IN
,
TE
XA
S
Fiscal Year
2018
Page 168

MISSION
The mission of the Engineering Department is to provide quality professional engineering services to the various departments of the City of Lufkin for the construction of Public Works and Public Utilities projects at the most efficient cost possible.
DESCRIPTION OF SERVICES PROVIDED
The Engineering Department provides complete engineering design services for Public Works, Public Utilities, Ellen Trout Zoo and Parks projects, which include water and sewer main extensions and repairs, water and sewer plant improvements, drainage improvements, and street maintenance improvements.
The department also reviews building permits and ensures that all construction is in accordance with City Ordinances and other government agencies; issues water and sewer taps for new utility service for the public and handles floodplain and floodway management.
The Engineering Department completes surveys for designs for the Engineering department and also for private engineering and architect firms.
The Engineering Department provides other
services such as plat administration and review, issuance of utility permits, and state road permits.
The GIS (Geographical Information System) is in the Engineering Department. It supplies and maintains information for the City's water and sewer utilities, planning, property boundaries, streets, addressing, easements, right-of-ways, floodplain and floodway, and drainage. It also does map production.
The survey crew provides information for GIS mapping.
WORK PROGRAM
The Engineering Department will strive to ensure plats are reviewed within seven days of receipt and permits for construction are approved in a timely manner. Complete surveys and designs for Capital Improvement Projects and others as the need arises.
WORKLOAD INDICATORS & PERFORMANCE MEASURES
En
gin
ee
rin
g
CI
TY
O
F
LU
FK
IN
,
TE
XA
S
GENERAL FUND
Fiscal Year
2018
Description 2015-2016
Actual 2016-2017
Revised
2017-2018 Budget
Number of Plats reviewed 35 35 36
Plat reviews are Completed within 7 days 90% of the time. 97% 95% 95%
Number of Permits Reviewed 335 310 310
Approve Permits for Construction within 2 days 90% of the time.
95% 93% 93%
Page 169

DEPARTMENT Engineering FUND General
EXPENDITURES 2015-2016
Actual 2016-2017 Approved
2016-2017 Revised
2017-2018 Budget
Personnel Services 472,202 475,472 484,484 391,875
Benefits 178,381 182,940 186,582 149,822
Supplies 11,506 15,405 15,405 15,460
Maintenance of Equipment 17,809 19,950 19,950 21,290
Miscellaneous Services 63,223 73,808 72,493 74,268
Capital 10,460 - - -
TOTAL 753,581 767,575 778,914 652,715
AUTHORIZED POSITIONS 2015-2016
Actual 2016-2017 Approved
2016-2017 Revised
2017-2018 Budget
City Engineer / Director of Public Utili-ties 1 1 1 1
Clerk - Sr. Level 1 1 1 1
Engineering Tech II 1 1 1 1
Construction Inspector 2 2 2 0
Survey Crew Chief 1 1 1 1
GIS Coordinator 1 1 1 1
Engineering Tech I 1 1 1 1
GPS Technician 1 1 1 1
FULL TIME 9 9 9 7
PART TIME 0 0 0 0
TOTAL 9 9 9 7
SIGNIFICANT CHANGES
FY2018: The Construction inspector positions/expense distribution will be moved to Water/Sewer.
Page 170

MISSION
The mission of the Street Department is to provide quality streets, drainage, and traffic control devices, for the citizens of Lufkin.
DESCRIPTION OF SERVICES PROVIDED
The Street Department consists of 34 full time employees that maintain and repair 211.4 miles of streets. This includes street overlays, pothole patching and utility cuts, crack sealing, and base repair.
The department constructs new full-depth asphalt streets on lime-stabilized sub-grade along with some street reconstruction.
The department also constructs and maintains the drainage systems consisting of detention ponds, open ditches, creeks, channels, storm drains, drainage culverts, inlets, curbs, and gutters.
The department sweeps streets, maintains right-of-ways by mowing, edging, application of herbicide and maintains traffic control devices including signs, signal lights, school flashers and pavement markings.
WORK PROGRAM
The Street Department will continue to maintain streets, right-of-ways, detention ponds, drainage systems, and traffic control devices. The department will strive to complete the 2018 Street Overlay List.
Str
ee
t D
ep
ar
tme
nt
CI
TY
O
F
LU
FK
IN
,
TE
XA
S
WORKLOAD INDICATORS & PERFORMANCE MEASURES
GENERAL FUND
Fiscal Year
2018
Description 2015-2016
Actual 2016-2017 Revised
2017-2018 Budget
Number of street overlay projects completed annually 18 23 18
Number of street overlay projects completed within 1 week of due date
15 18 16
Street overlay projects completed within 1 week of due date 70% of time
83% 78% 88%
Feet of open channels cleaned 22,310 18,625 20,500
Feet of open channels cleaned within 3 weeks of inspec-tion
19,187 16,204 17,630
Open channels cleaned within 3 weeks of inspection 80% of time
86% 87% 86%
Page 171

DEPARTMENT Street Department FUND General
EXPENDITURES 2015-2016
Actual 2016-2017 Approved
2016-2017 Revised
2017-2018 Budget
Personnel Services 1,081,676 1,053,619 1,048,317 1,100,320
Benefits 483,484 518,920 521,240 533,974
Supplies 173,720 218,650 190,795 182,270
Maintenance of Equipment 973,779 1,243,650 1,394,880 1,041,150
Miscellaneous Services 961,763 1,015,767 1,015,322 1,009,130
Capital Outlay 4,400 - - -
TOTAL 3,678,822 4,050,606 4,170,554 3,866,844
AUTHORIZED POSITIONS 2015-2016
Actual 2016-2017 Approved
2016-2017 Revised
2017-2018 Budget
Street Superintendent 1 1 1 1
Assistant Superintendent 1 1 1 1
Administrative Assistant 1 1 1 1
Crew Leader III 3 3 3 3
Crew Leader II 2 2 2 2
Light Equipment Operator 2 2 2 2
Heavy Equipment Operator 3 3 3 3
General Craftsman 1 1 1 1
Concrete Technician 1 1 1 1
Driver II 8 8 8 8
Street Sweeper Operator 2 2 2 2
Street Mowing Technician 2 2 2 2
Utility Technician 2 2 2 2
Maintenance Worker 5 5 5 5
Laborer I (part-time) 1 1 1 1
FULL TIME 34 34 34 34
PART TIME 1 1 1 1
TOTAL 35 35 35 35
SIGNIFICANT CHANGES
Page 172

DIVISION: Administration
DIVISION DESCRIPTION
The Administration Division is responsible for the direction and supervision of all Street Department projects and personnel. This division also maintains departmental records of projects and prepares the budget.
Str
ee
t /
Ad
min
istr
ati
on
C
IT
Y
OF
L
UF
KI
N,
T
EX
AS
AUTHORIZED POSITIONS 2015-2016
Actual 2016-2017
Revised 2017-2018
Budget 2016-2017 Approved
Street Superintendent 1 1 1 1
Assistant Street Superintendent 1 1 1 1
Administrative Assistant 1 1 1 1
FULL TIME 3 3 3 3
PART TIME 0 0 0 0
TOTAL 3 3 3 3
EXPENDITURES 2015-2016
Actual 2016-2017 Approved
2016-2017 Revised
2017-2018 Budget
Personnel Services 167,342 165,952 169,133 169,265
Benefits 63,327 61,604 63,373 63,692
Supplies 6,279 5,660 5,280 5,280
Maintenance of Equipment 650 750 750 750
Miscellaneous Services 12,653 14,790 14,845 14,770
Capital Outlay 4,400 - - -
TOTAL 254,651 248,756 253,381 253,757
GENERAL FUND
Fiscal Year
2018
Page 173

DIVISION: Street & Drainage Repair
DIVISION DESCRIPTION
The Repair Division is responsible for all street and drainage repairs, such as patching potholes and repairing utility cuts and storm drains. The division also maintains and constructs new drainage systems.
Str
ee
t /
Str
ee
t &
Dr
ain
ag
e R
ep
air
CI
TY
O
F
LU
FK
IN
,
TE
XA
S
AUTHORIZED POSITIONS 2015-2016
Actual 2016-2017 Revised
2017-2018 Budget
2016-2017 Approved
Crew Leader III 1 1 1 1
Crew Leader II 1 1 1 1
Heavy Equipment Operator 1 1 1 1
Concrete Technician 1 1 1 1
Driver II 2 2 2 2
Utilities Technician 2 2 2 2
Maintenance Worker 2 2 2 2
FULL TIME 10 10 10 10
PART TIME 0 0 0 0
TOTAL 10 10 10 10
EXPENDITURES 2015-2016
Actual 2016-2017 Approved
2016-2017 Revised
2017-2018 Budget
Personnel Services 284,156 289,423 260,620 298,854
Benefits 130,913 146,571 140,260 149,590
Supplies 31,109 39,195 31,195 31,195
Maintenance of Equipment 260,345 321,650 313,125 321,650
Miscellaneous Services 45,177 59,086 58,586 52,872
TOTAL 751,700 855,925 803,786 854,161
GENERAL FUND
Fiscal Year
2018
Page 174
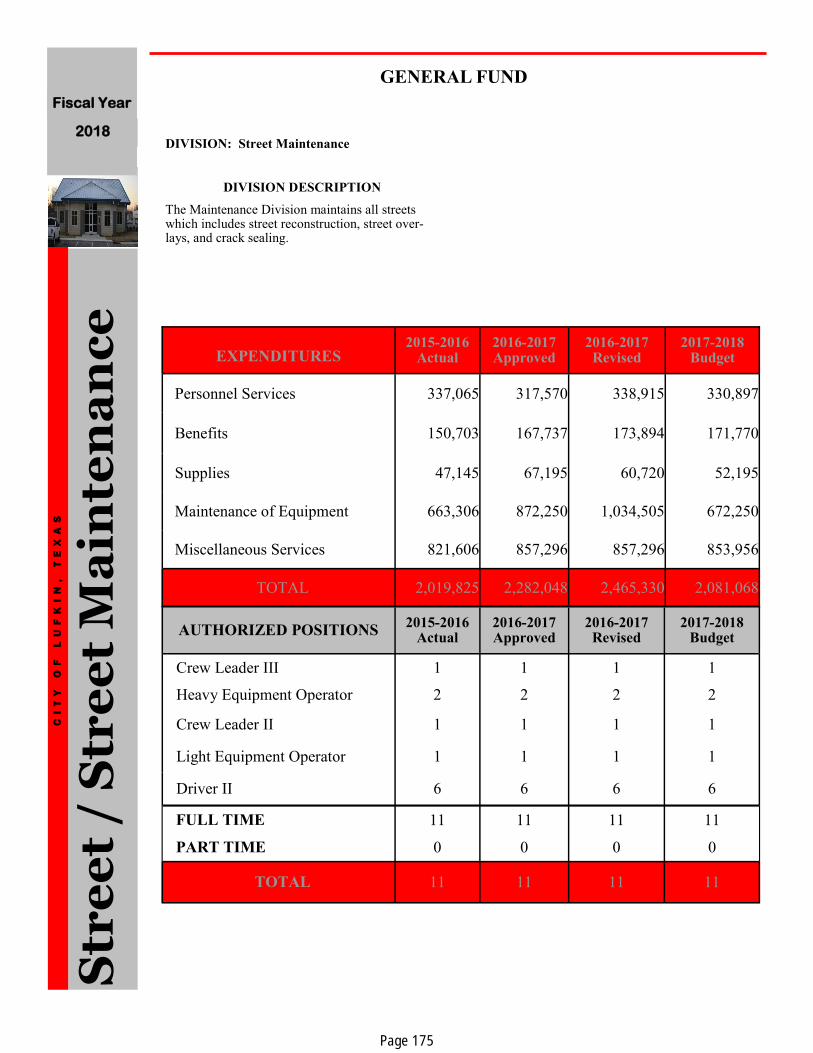
DIVISION: Street Maintenance
DIVISION DESCRIPTION
The Maintenance Division maintains all streets which includes street reconstruction, street over-lays, and crack sealing.
Str
ee
t /
Str
ee
t M
ain
ten
an
ce
C
IT
Y
OF
L
UF
KI
N,
T
EX
AS
AUTHORIZED POSITIONS 2015-2016
Actual 2016-2017 Approved
2016-2017 Revised
2017-2018 Budget
Crew Leader III 1 1 1 1
Heavy Equipment Operator 2 2 2 2
Crew Leader II 1 1 1 1
Light Equipment Operator 1 1 1 1
Driver II 6 6 6 6
FULL TIME 11 11 11 11
PART TIME 0 0 0 0
TOTAL 11 11 11 11
EXPENDITURES 2015-2016
Actual 2016-2017 Approved
2016-2017 Revised
2017-2018 Budget
Personnel Services 337,065 317,570 338,915 330,897
Benefits 150,703 167,737 173,894 171,770
Supplies 47,145 67,195 60,720 52,195
Maintenance of Equipment 663,306 872,250 1,034,505 672,250
Miscellaneous Services 821,606 857,296 857,296 853,956
TOTAL 2,019,825 2,282,048 2,465,330 2,081,068
GENERAL FUND
Fiscal Year
2018
Page 175

DIVISION: ROW & Traffic Control
DIVISION DESCRIPTION
This division is responsible for street sweeping and right-of-way maintenance including mowing, edging, and herbicide application throughout the City. The division also maintains all traffic control devices and pavement markings.
Str
ee
t /
RO
W &
Tr
aff
ic C
on
tro
l C
IT
Y
OF
L
UF
KI
N,
T
EX
AS
AUTHORIZED POSITIONS 2015-2016
Actual 2016-2017 Approved
2016-2017 Revised
2017-2018 Budget
Crew Leader III 1 1 1 1
General Craftsman 1 1 1 1
Light Equipment Operator 1 1 1 1
Sweeper Operator/Driver II 2 2 2 2
Mowing Technician 2 2 2 2
Maintenance Worker 3 3 3 3
Labor-Part Time Seasonal l 1 1 1
FULL TIME 10 10 10 10
PART TIME 1 1 1 1
TOTAL 11 11 11 11
EXPENDITURES 2015-2016
Actual 2016-2017 Approved
2016-2017 Revised
2017-2018 Budget
Personnel Services 293,113 280,674 279,649 301,304
Benefits 138,541 143,008 143,713 148,922
Supplies 89,187 106,600 93,600 93,600
Maintenance of Equipment 49,478 49,000 46,500 46,500
Miscellaneous Services 82,327 84,595 84,595 87,532
Capital Outlay - - - -
TOTAL 652,646 663,877 648,057 677,858
GENERAL FUND
Fiscal Year
2018
Page 176

MISSION
The mission of the Fleet Services Department is to provide the best possible service to the City departments through high quality maintenance and mechanical repair of City vehicles and equipment in the most efficient, timely, and cost effective manner possible.
DESCRIPTION OF SERVICES PROVIDED
The Fleet Services Department services and maintains the City's vehicles and equipment as well as maintains quality control standards through repair records.
All city vehicles and equipment undergo routine preventive maintenance in order to ensure fleet reliability and safety.
A parts inventory is kept on site to provide a faster turnaround time to the City departments.
Pool vehicles are kept for departments to use in the event an extra is needed.
WORK PROGRAM
Fleet Services personnel will continue to strive to complete preventative maintenance within scheduled timeframe. Also fleet personnel will strive to process all fuel and maintenance charges within thirty days or less.
Fle
et
Se
rv
ice
s
CI
TY
O
F
LU
FK
IN
,
TE
XA
S
Description 2014-2015
Actual 2015-2016 Revised
2017-2018 Budget
Total number of new work orders 1,817 1,840 1,855
Total number of preventive maintenance work orders 385 400 425
Completed Preventative Maintenance within schedule 90% of the time.
90% 95% 95%
Total number of fuel charges processed monthly. 1,700 1,725 1,715
% of fuel charges processed in 30 days. 100% 100% 100%
% of fuel charges processed monthly 90% of the time. 90% 95% 95%
WORKLOAD INDICATORS & PERFORMANCE MEASURES
GENERAL FUND
Fleet Maintenance Facility for City of Lufkin
Fiscal Year
2018
Page 177

DEPARTMENT Fleet Services FUND General
EXPENDITURES 2015-2016
Actual 2016-2017 Approved
2016-2017 Revised
2017-2018 Budget
Personnel Services 216,302 216,294 240,723 248,015
Benefits 98,238 97,333 112,215 114,048
Supplies 20,187 20,850 18,450 19,850
Maintenance of Equipment 18,255 14,850 9,050 12,050
Miscellaneous Services 16,550 17,438 18,688 16,963
Sundry Charges -13,726 - - -
TOTAL 355,806 366,765 399,126 410,926
AUTHORIZED POSITIONS 2015-2016
Actual 2016-2017 Approved
2016-2017 Revised
2017-2018 Budget
Fleet Garage Supervisor 1 1 1 1
Warehouse Clerk 1 1 1 1
Equipment Mechanic 4 4 4 4
Foreman 1 1 1 1
FULL TIME 7 7 7 7
PART TIME 0 0 0 0
TOTAL 7 7 7 7
SIGNIFICANT CHANGES
Page 178
The Community Development Departments include the following:
Planning and Zoning
Community Development / Mainstreet
CO
MM
UN
ITY
DE
VE
LO
PM
EN
T
CI
TY
O
F
LU
FK
IN
,
TE
XA
S
Fiscal Year
2018
Page 179

MISSION
The mission of the Planning and Zoning Department is to promote quality growth and development that will serve the current and future needs of Lufkin in a proactive manner.
DESCRIPTION OF SERVICES PROVIDED
The Planning and Zoning (P&Z) Department serves the public by providing technical assistance relating to adopted land use regulations and serving in an advisory role to developers along with performing subdivision, zoning, permit review and annexations.
The Department is responsible for making recommendations to the P&Z Commission and City Council on matters pertaining to the development of the City.
The P&Z Department is the City's liaison to local entities endeavoring to retain, expand, and attract business to Lufkin and provide affordable housing opportunities.
WORK PROGRAM
In fiscal year 2018, Planning and Zoning department will focus on continued evaluation and adoption, where appropriate, of development ordinances; serve as an assistant to professional developers; the general public and the governing body related to land use; implement Green Initiatives in Lufkin in support of community sustainability; while continuing staff development and education to stay informed of current trends in Planning on the local, state, and national level. Respond to citizen interest in developing a long range Trails program with an emphasis on walkability of the downtown area while planning for a healthy, active city.
Pla
nn
ing
& Z
on
ing
C
IT
Y
OF
L
UF
KI
N,
T
EX
AS
Description 2015-2016
Actual 2016-2017 Revised
2017-2018 Budget
Number of Plat reviews completed 45 40 401
Number of plat reviews completed within 2 business days 40 35 35
Complete all plat reviews within 2 business days, 95% of time
98% 95% 95%
Number of Zoning Cases 25 20 20
Number of zoning cases meeting legal documentation deadlines
25 20 20
Complete zoning case deadlines, 90% of the time 95% 95% 95%
WORKLOAD INDICATORS & PERFORMANCE MEASURES
GENERAL FUND
Fiscal Year
2018
Page 180

DEPARTMENT Planning and Zoning FUND General
EXPENDITURES 2015-2016
Actual 2016-2017 Approved
2016-2017 Revised
2017-2018 Budget
Personnel Services 164,074 159,130 163,622 162,464
Benefits 54,759 61,141 59,266 62,283
Supplies 5,593 7,550 12,608 9,550
Maintenance of Equipment - 4,900 4,800 4,900
Miscellaneous Services 14,919 19,390 17,295 15,330
Sundry Charges 1,000 - 500 -
TOTAL 240,345 252,111 258,091 254,527
AUTHORIZED POSITIONS 2015-2016
Actual 2016-2017 Approved
2016-2017 Revised
2017-2018 Budget
Planning & Zoning Director 1 1 1 1
Assistant City Planner 1 1 1 1
Clerk - Journeyman 1 1 1 1
FULL TIME 3 3 3 3
PART TIME 0 0 0 0
TOTAL 3 3 3 3
SIGNIFICANT CHANGES
Page 181
Beginning fiscal year 2018, the Main Street department will be merged with Lufkin Convention and Visitors Bureau (LCVB) to continue to promote the City’s downtown Main Street programs, events, and beautification.
Co
mm
un
ity
De
ve
lop
me
nt
C
IT
Y
OF
L
UF
KI
N,
T
EX
AS
Description 2015-2016
Actual 2016-2017 Revised
2017-2018 Budget
Number of community events 12 12 -
Number of community events with sponsorships 12 12 -
% of community events sponsored with a minimum 50% sponsorship rate
100% 100% -
Total number of downtown properties available for lease and/or sale logged and posted to website.
12 12 -
Number of new businesses referred for tax abatement, etc. 1 0 -
Log 90% of downtown properties available for lease and sale and refer new businesses for tax abatement.
100% 100% -
WORKLOAD INDICATORS & PERFORMANCE MEASURES
GENERAL FUND
Fiscal Year
2018
Page 182

DEPARTMENT Community Development FUND General
EXPENDITURES 2015-2016
Actual 2016-2017 Approved
2016-2017 Revised
2017-2018 Budget
Personnel Services 117,315 117,313 105,178 -
Benefits 50,716 49,929 49,026 -
Supplies 3,565 4,367 4,367 -
Miscellaneous Services 8,919 10,981 10,581 -
Incentives - - - -
TOTAL 180,515 182,590 169,152 -
AUTHORIZED POSITIONS 2015-2016
Actual 2016-2017 Approved
2016-2017 Revised
2017-2018 Budget
Main Street Director 1 1 1 0
Clerk-Journeyman 1 1 1 0
Maintenance Worker 1 1 1 0
FULL TIME 3 3 3 0
PART TIME 0 0 0 0
TOTAL 3 3 3 0
SIGNIFICANT CHANGES
FY2018: Community Development/Main Street department will be eliminated. Director position moved to LCVB. Clerk-Journeyman was eliminated. Maintenance worker position/expense distribution transferred to Solid Waste Dept.
Page 183
The Cultural and Recreational Departments include the following:
Parks and Recreation Department
Ellen Trout Zoo
Kurth Memorial Library
CU
LT
UR
E A
ND
RE
CR
EA
TIO
N
CI
TY
O
F
LU
FK
IN
,
TE
XA
S
Fiscal Year
2018
Page 184

MISSION
The mission of the Parks & Recreation Department is to ensure safe, clean, and enjoyable parks and recreation facilities through programs that will accommodate the leisure needs of the citizens of Lufkin.
DESCRIPTION OF SERVICES PROVIDED
The Parks and Recreation Department maintains park grounds, equipment, and support facilities in all city parks.
The department coordinates seasonal projects, sports leagues, special events, and leisure activities with independent organizations to meet the increasing demand for leisure activities in the local parks.
Additional duties of the department include landscape maintenance of several public buildings and right-of-ways, delivering bleachers and tables for numerous city events, fogging for mosquitoes, and assisting with tournament scheduling and maintenance.
WORK PROGRAM
The Parks Department will be replacing the roof
on the restroom facility at boy’s baseball at Morris Frank Park. The Department will continue to make improvements to the restrooms at Grace Dunne Richardson Park. New plumbing fixtures will be installed at the restrooms at Kit McConnico Park. The Department will continue to make improvements to the baseball/softball fields. The Parks Department will be working with Lufkin Landscape Task Force at beautifying Gaslight Blvd. The City will be trying to build an outdoor skate park at Kiwanis Park. The Parks Department will be working with the Angelina Rotary Club at installing three new water fountains at Kiwanis Park. The Parks Department will be making improvements to the Azalea Trail with better lighting and adding asphalt where needed. The Department will continue to cut dead trees in all parks, grind stumps and add saw dust to all playgrounds
Pa
rk
s a
nd
Re
cr
ea
tio
n D
ep
ar
tme
nt
CI
TY
O
F
LU
FK
IN
,
TE
XA
S
WORKLOAD INDICATORS & PERFORMANCE MEASURES
GENERAL FUND
Fiscal Year
2018
Description 2015-2016
Actual 2016-2017
Revised 2017-2018
Budget
Number of Participants in Recreation Programs 1,500 1,800 1,900
Number of Athletic Tournaments Sponsored 7 7 7
Fully utilize 50% of Recreational Facilities, 75% of time 75% 75% 75%
Number of Park and Playground Inspections Performed 36 36 36
Number of Pesticide Applications 95% of time 95% 95% 95%
Parks will meet Inspection Guidelines, 95% of time 95% 95% 95%
Page 185

DEPARTMENT Parks and Recreation FUND General
EXPENDITURES 2015-2016
Actual 2016-2017 Approved
2016-2017 Revised
2017-2018 Budget
Personnel Services 743,715 762,950 701,282 736,443
Benefits 343,073 361,408 377,103 373,074
Supplies 84,112 132,484 128,484 115,594
Maintenance of Equipment 173,707 103,344 113,344 100,744
Miscellaneous Services 401,203 444,232 446,632 434,910
Sundry Charges - 80 80 80
Capital Outlay - - - -
TOTAL 1,745,810 1,804,498 1,766,925 1,760,845
SIGNIFICANT CHANGES
AUTHORIZED POSITIONS 2015-2016
Actual 2016-2017 Approved
2016-2017 Revised
2017-2018 Budget
Director—Parks & Leisure 1 1 1 1
Assistant Director Parks 1 1 1 1
Parks Superintendent 1 1 1 1
Clerk Senior Level 1 1 1 1
Crew Leader I 2 2 2 2
Crew Leader II 1 1 1 1
Laborer 16 16 16 16
Custodian/Building Maintenance 2 2 2 2
Downtown Center Supervisor (P/T) 1 1 1 1
Recreation Specialist 2 2 2 2
Lifeguard (P/T) 3 3 3 3
League Supervisor (P/T) 1 1 1 1
FULL TIME 27 27 27 27
PART TIME 5 5 5 5
TOTAL 32 32 32 32
Page 186

DIVISION: Administration
DIVISION DESCRIPTION
The Administration division includes office and recreation staff and is responsible for the direction of the Parks and Recreation Department. This also includes a recreational staff that is supported by the General Fund and the Parks Advisory Board appointed by City Council.
Pa
rk
s a
nd
Re
cr
ea
tio
n /
Ad
min
istr
ati
on
CI
TY
O
F
LU
FK
IN
,
TE
XA
S
EXPENDITURES 2015-2016
Actual 2016-2017 Approved
2016-2017 Revised
2017-2018 Budget
Personnel Services 224,355 239,199 243,794 245,262
Benefits 89,962 91,748 96,559 96,710
Supplies 3,292 5,470 5,470 5,060
Miscellaneous Services 17,159 22,936 22,936 22,031
Sundry Charges - 80 80 80
TOTAL 334,768 359,433 368,839 369,143
GENERAL FUND
Fiscal Year
2018
Bronaugh Park
AUTHORIZED POSITIONS 2015-2016
Actual 2016-2017 Approved
2016-2017 Revised
2017-2018 Budget
Director—Parks & Leisure 1 1 1 1
Assistant Director—Parks 1 1 1 1
Clerk Senior Level 1 1 1 1
Downtown Center Supervisor (P/T) 1 1 1 1
Recreation Specialist 2 2 2 2
League Supervisor (P/T) 1 1 1 1
Lifeguard (P/T) 3 3 3 3
FULL TIME 5 5 5 5
PART TIME 5 5 5 5
TOTAL 10 10 10 10
Page 187

DIVISION: Park Maintenance
DIVISION DESCRIPTION
The Park Maintenance division includes employees and expenses for the maintenance of parks, recreation facilities, community centers, beautification projects, fogging, maintaining ball fields and special events hosted by the City or special interest groups within the City.
Pa
rk
s a
nd
Re
cr
ea
tio
n /
Pa
rk
Ma
inte
na
nc
e
CI
TY
O
F
LU
FK
IN
,
TE
XA
S
AUTHORIZED POSITIONS 2015-2016
Actual 2016-2017 Approved
2016-2017 Revised
2017-2018 Budget
Parks Superintendent 1 1 1 1
Crew Leader I 2 2 2 2
Crew Leader II 1 1 1 1
Laborer 16 16 16 16
Custodian / Building Maintenance 2 2 2 2
FULL TIME 22 22 22 22
PART TIME 0 0 0 0
TOTAL 22 22 22 22
EXPENDITURES 2015-2016
Actual 2016-2017 Approved
2016-2017 Revised
2017-2018 Budget
Personnel Services 519,360 523,751 457,488 491,181
Benefits 253,111 269,660 280,544 276,364
Supplies 80,820 127,014 123,014 110,534
Maintenance of Equipment 173,707 103,344 113,344 100,744
Miscellaneous Services 384,044 421,296 423,696 412,879
Capital Outlay - - - -
TOTAL 1,411,042 1,445,065 1,398,086 1,391,702
GENERAL FUND
Big Climber at Kiwanis Park
Fiscal Year
2018
Page 188
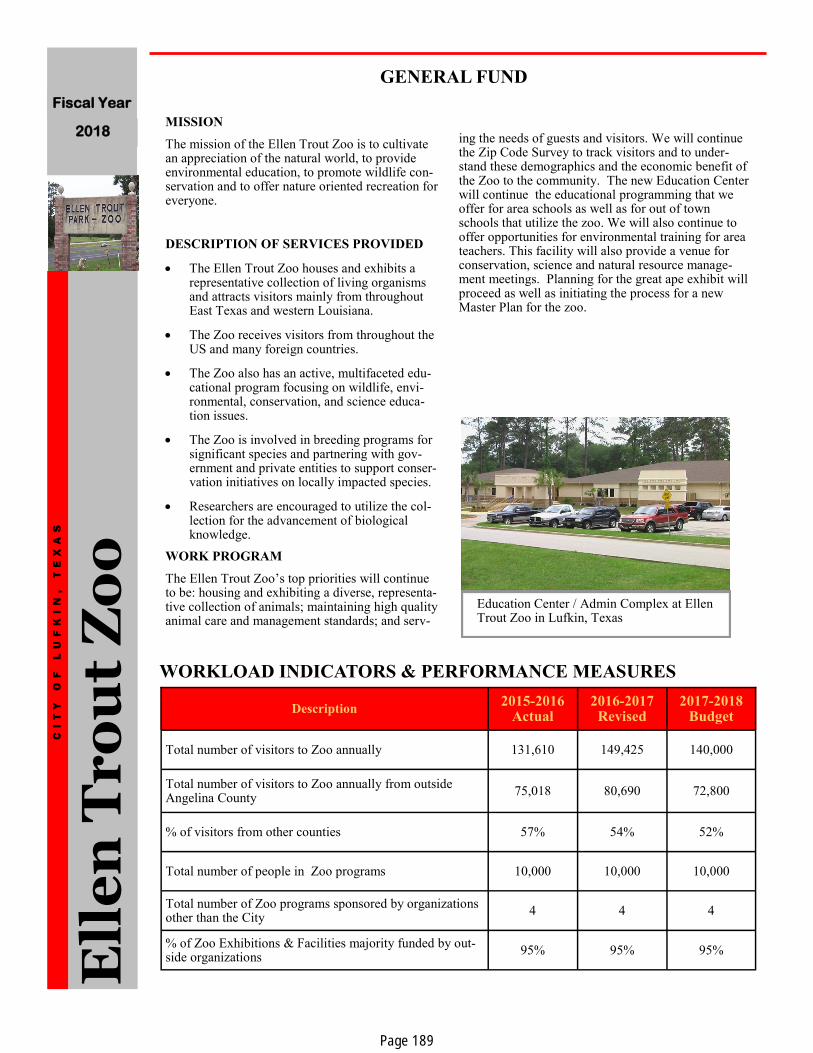
MISSION
The mission of the Ellen Trout Zoo is to cultivate an appreciation of the natural world, to provide environmental education, to promote wildlife con-servation and to offer nature oriented recreation for everyone.
DESCRIPTION OF SERVICES PROVIDED
The Ellen Trout Zoo houses and exhibits a representative collection of living organisms and attracts visitors mainly from throughout East Texas and western Louisiana.
The Zoo receives visitors from throughout the US and many foreign countries.
The Zoo also has an active, multifaceted edu-cational program focusing on wildlife, envi-ronmental, conservation, and science educa-tion issues.
The Zoo is involved in breeding programs for significant species and partnering with gov-ernment and private entities to support conser-vation initiatives on locally impacted species.
Researchers are encouraged to utilize the col-lection for the advancement of biological knowledge.
WORK PROGRAM
The Ellen Trout Zoo’s top priorities will continue to be: housing and exhibiting a diverse, representa-tive collection of animals; maintaining high quality animal care and management standards; and serv-
ing the needs of guests and visitors. We will continue the Zip Code Survey to track visitors and to under-stand these demographics and the economic benefit of the Zoo to the community. The new Education Center will continue the educational programming that we offer for area schools as well as for out of town schools that utilize the zoo. We will also continue to offer opportunities for environmental training for area teachers. This facility will also provide a venue for conservation, science and natural resource manage-ment meetings. Planning for the great ape exhibit will proceed as well as initiating the process for a new Master Plan for the zoo.
Ell
en
Tr
ou
t Z
oo
C
IT
Y
OF
L
UF
KI
N,
T
EX
AS
WORKLOAD INDICATORS & PERFORMANCE MEASURES
GENERAL FUND
Education Center / Admin Complex at Ellen Trout Zoo in Lufkin, Texas
Fiscal Year
2018
Description 2015-2016
Actual 2016-2017
Revised
2017-2018 Budget
Total number of visitors to Zoo annually 131,610 149,425 140,000
Total number of visitors to Zoo annually from outside Angelina County
75,018 80,690 72,800
% of visitors from other counties 57% 54% 52%
Total number of people in Zoo programs 10,000 10,000 10,000
Total number of Zoo programs sponsored by organizations other than the City
4 4 4
% of Zoo Exhibitions & Facilities majority funded by out-side organizations
95% 95% 95%
Page 189
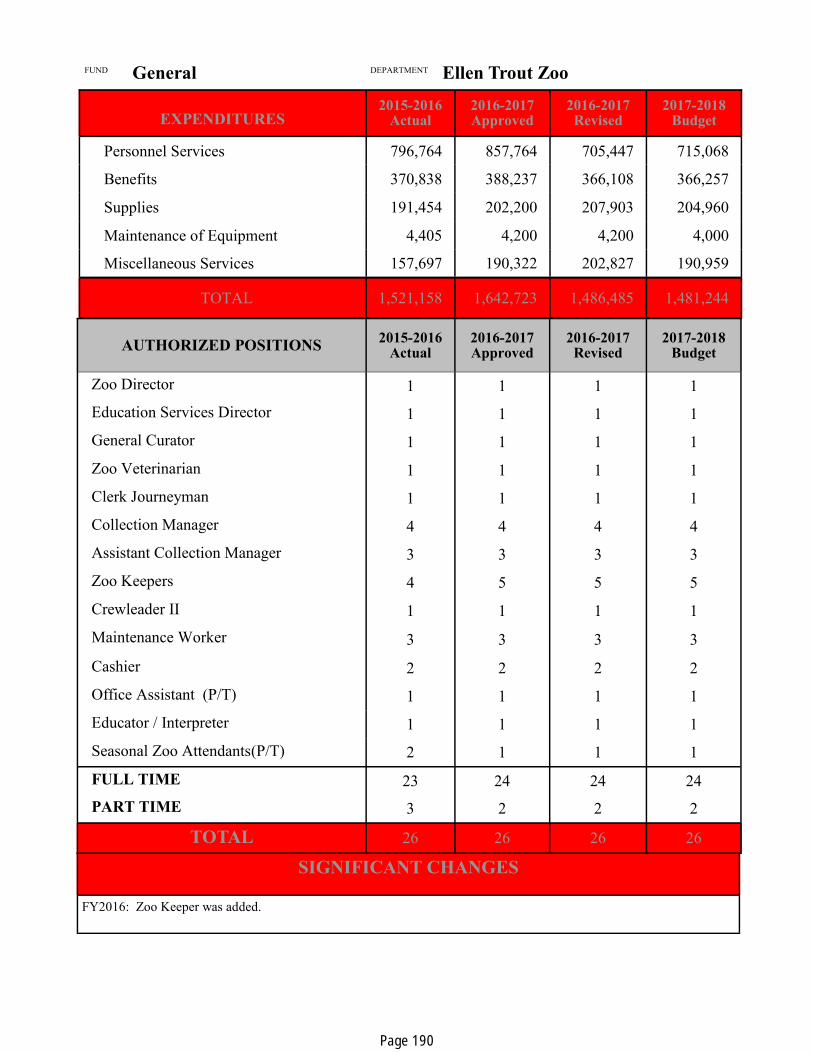
DEPARTMENT Ellen Trout Zoo FUND General
EXPENDITURES 2015-2016
Actual 2016-2017 Approved
2016-2017 Revised
2017-2018 Budget
Personnel Services 796,764 857,764 705,447 715,068
Benefits 370,838 388,237 366,108 366,257
Supplies 191,454 202,200 207,903 204,960
Maintenance of Equipment 4,405 4,200 4,200 4,000
Miscellaneous Services 157,697 190,322 202,827 190,959
TOTAL 1,521,158 1,642,723 1,486,485 1,481,244
AUTHORIZED POSITIONS 2015-2016
Actual 2016-2017 Approved
2016-2017 Revised
2017-2018 Budget
Zoo Director 1 1 1 1
Education Services Director 1 1 1 1
General Curator 1 1 1 1
Zoo Veterinarian 1 1 1 1
Clerk Journeyman 1 1 1 1
Collection Manager 4 4 4 4
Assistant Collection Manager 3 3 3 3
Zoo Keepers 4 5 5 5
Crewleader II 1 1 1 1
Maintenance Worker 3 3 3 3
Cashier 2 2 2 2
Office Assistant (P/T) 1 1 1 1
Educator / Interpreter 1 1 1 1
Seasonal Zoo Attendants(P/T) 2 1 1 1
FULL TIME 23 24 24 24
PART TIME 3 2 2 2
TOTAL 26 26 26 26
SIGNIFICANT CHANGES
FY2016: Zoo Keeper was added.
Page 190

MISSION
The library exists to provide excellent information services, improve literacy and promote lifelong learning for all citizens of Angelina County by providing up-to-date information on all subjects, in a variety of formats, representing varying viewpoints, and by providing a well-trained, service-oriented staff.
DESCRIPTION OF SERVICES PROVIDED
The Library selects, purchases, organizes, catalogs, stores, preserves and maintains information.
The Library organizes, stores and retrieves information in a variety of formats.
The Library disseminates information, for education, self-improvement, business, medical, hobby, research, study and pleasure.
The Library provides educational and
enrichment programs to encourage literacy among all citizens and encourages lifelong learning.
WORK PROGRAM
The primary goals of the Kurth Memorial Library for the fiscal year 2018 are to develop and implement a new strategic plan to provide the community with services over the next 5 years. Ongoing goals include increasing the library’s visibility and scope within the community through advertising and collaboration and continuing to improve existing outreach and programming services.
Ku
rth
Me
mo
ria
l L
ibr
ar
y
CI
TY
O
F
LU
FK
IN
,
TE
XA
S
WORKLOAD INDICATORS & PERFORMANCE MEASURES
GENERAL FUND
Fiscal Year
2018
2015-2016 Actual
2016-2017 Revised
2017-2018 Budget
Number of Help Desk Requests 95,620 80,000 85,000
Total Circulation and In-House Use 322,964 260,000 290,000
Number of Patron Visits 129,441 130,000 130,000
Number of Materials Processed (New, reprocessed, Withdrawn)
31,571 26,000 25,000
Number of Programs for Public 571 530 500
Patron attendance at Program 24,366 35,000 30,000
Page 191

DEPARTMENT Kurth Memorial Library FUND General
EXPENDITURES 2015-2016
Actual 2016-2017 Approved
2016-2017 Revised
2017-2018 Budget
Personnel Services 353,289 353,321 363,378 366,294
Benefits 161,294 162,424 166,634 167,792
Supplies 17,758 20,950 20,950 20,950
Maintenance of Equipment 31,493 35,045 35,045 35,545
Miscellaneous Services 67,618 76,275 76,275 75,775
TOTAL 631,452 648.015 662,282 666,356
AUTHORIZED POSITIONS 2015-2016
Actual 2016-2017 Approved
2016-2017 Revised
2017-2018 Budget
Library Director 1 1 1 1
Assistant Library Director 1 1 1 1
Clerk-Entry Level 4 4 4 4
Library Assistant 2 2 2 2
Library Assistant IT-Tech 1 1 1 1
Library Aide (Part time) 5 5 5 5
Library Assistant (Summer) 1 1 1 1
Custodian 1 1 1 1
FULL TIME 10 10 10 10
PART TIME 6 6 6 6
TOTAL 16 16 16 16
SIGNIFICANT CHANGES
Materials budget contributed by Board was cut by about 33%. Technology budget contributed by Board was cut by about 66%.
Page 192

No
n—
De
pa
rtm
en
tal
CI
TY
O
F
LU
FK
IN
,
TE
XA
S
WORK PROGRAM
Budgeted in the department for Fiscal year 2018 are the following items:
Unemployment Insurance Claims $ 10,000
Liability Insurance Premium $ 147,233
Contingency Amount $ 75,000
Lease Payments: Principal and Interest $ 90,882
Retiree Insurance Premium Transfer $ 165,000
EXPENDITURES 2015-2016
Actual 2016-2017 Approved
2016-2017 Revised
2017-2018 Budget
Personnel Services - 417,073 - 227,542
Benefits 298 10,000 10,000 10,000
Miscellaneous Services 202,098 222,233 222,233 222,233
Sundry Charges - - 1,137 -
Debt Service - 90,881 90,881 90,882
Transfer 1,167,416 220,289 220,289 370,056
TOTAL 1,369,812 960,476 544,540 920,713
AUTHORIZED POSITIONS 2015-2016
Actual 2016-2017 Approved
2016-2017 Revised
2017-2018 Budget
There are no positions assigned to this division.
FULL TIME
PART TIME
TOTAL
SIGNIFICANT CHANGES
.
Fiscal Year
2018
GENERAL FUND
MISSION Non-departmental expenditures represent expendi-tures that are unique in nature, apply to the fund in total, or represent expenditures that apply to all de-partments.
DESCRIPTION OF SERVICES PROVIDED This is a non-operational department established for the purpose of handling items that apply to the fund as a whole, not to specific individual departments.
Items included as expenditures are bad debt expens-es, software payments, insurance payments and con-tingency accounts.
Page 193

Page 194

Wa
ter
/ W
as
tew
ate
r F
un
d
C
IT
Y
OF
L
UF
KI
N,
T
EX
AS
WATER/WASTEWATER FUND
The Water/Wastewater Fund is used to account for the provision of water and wastewater services to residents of the City. All activities necessary to provide water/wastewater services are included in this fund. Accounting activities are similar to commercial accounting in that revenues and expenses are accounted for on a full accrual basis, depreciation expense is recognized on the income statement, and all costs are recovered through user charges. The Water/Wastewater Fund contains four departments: Utility Collections, Wastewater Treatment, Water Production and Water/Sewer Utilities. Utility Collections is responsible for billing and collecting water, wastewater, and solid waste revenues, and collects in excess of $21 million each year. The Wastewater Treatment department is responsible for treating all wastewater from the wastewater collection system. The treatment plant is a waste activated sludge plant with a treatment capacity of 11.3 million gallons per day. The plant experiences an average daily flow of over 6 million gallons and maintains a laboratory and staff to test industrial waste discharge to ensure compliance with effluent discharge limits and pre-treatment standards. The Water Production department is responsible for maintaining adequate water supplies for the City of Lufkin. There are currently twenty-four water wells that provide water for the City, with four ground and five elevated storage tanks as reserves. The Water/Sewer Utilities department maintains the wastewater collection system. Its primary function is repair and replacement of existing water and sewer lines, but is also responsible for new water and sewer taps, installing extension lines, and infiltration/inflow correction. .
Fiscal Year
2018
Page 195
MISSION
The mission of the Utility Collection Department is to provide accurate and timely utility billings, collections and record keeping while insuring prompt deposit of revenues for the benefit of the City in its efforts to provide services to the citizens of Lufkin.
DESCRIPTION OF SERVICES PROVIDED
The Utility Collection Department performs meter reading, billing and collection functions. Approximately 15,450 meters are read per month.
Meter readers also disconnect services on non-deposit accounts and provide this information to service personnel.
Service personnel develop routes, connect and disconnect services for nonpayment of bills, perform customer requested inspections and check for leaks as required.
Office personnel maintain customer accounts, perform customer billing functions, collect customer deposits, maintain billing records, prepare work orders and coordinate new cus-tomer services.
They also assist customers with billing inquiries and receive customer payments.
WORK PROGRAM
The Utility Collections department will continue to
develop employees customer service expertise with
available resources and applicable training materials.
The department will provide and maintain information
regarding meter change-out procedures and schedul-
ing to ensure optimal application of meter reliability
and accuracy of billing information. The department
will also interface with appropriate departments to
maintain current radio frequency reading effective-
ness.
Uti
lity
Co
lle
cti
on
s
CI
TY
O
F
LU
FK
IN
,
TE
XA
S
WORKLOAD INDICATORS & PERFORMANCE MEASURES
WATER / WASTEWATER FUND
Fiscal Year
2018
Description 2015-2016
Actual 2016-2017 Revised
2017-2018 Budget
Total number of bills generated monthly. 15,300 15,350 15,450
Total accurate number of bills generated monthly within 2 working days of cycle billing date.
15,250 15,350 15,450
Bill all active utility customers on a monthly basis within 99% accuracy level within 2 working days of cycle date.
100% 100% 100%
Total number of customer requested connects/disconnects on Monthly basis.
462 476 500
Number of connects/disconnects completed within one working day of request
457 476 500
Performed connects/disconnects within one working day of request 98% of time.
98% 98% 100%
Page 196

DEPARTMENT Utility Collections FUND Water / Wastewater
EXPENDITURES 2015-2016
Actual 2016-2017 Approved
2016-2017 Revised
2017-2018 Budget
Personnel Services 414,668 411,610 419,718 420,579
Benefits 124,498 188,917 191,902 191,878
Supplies 97,686 101,060 97,060 97,060
Maintenance of Equipment 11,373 18,980 17,340 20,420
Miscellaneous Services 102,809 103,247 118,292 118,302
Capital Outlay - - - 13,000
TOTAL 751,034 823,814 844,312 861,239
AUTHORIZED POSITIONS 2015-2016
Actual 2016-2017 Approved
2016-2017 Revised
2017-2018 Budget
Director of Utility Collections 1 1 1 1
Office Manager 1 1 1 1
Accounting Tech Entry 2 2 2 2
Utility Billing Clerk 3 3 3 3
Crew Leader III 1 1 1 1
Maintenance Worker 2 2 2 2
Meter Reader 2 2 2 2
FULL TIME 12 12 12 12
PART TIME 0 0 0 0
TOTAL 12 12 12 12
SIGNIFICANT CHANGES
Page 197

DIVISION: Billing and Collection
DIVISION DESCRIPTION
The Billing and Collection division includes de-partmental administration, utility billing, and col-lection activities. The administrative function is responsible for the day-to-day management, policy formulation, and planning activities of the depart-ment. Billing and collection activities include utili-ty bill processing and mailing, collection of utility payments, and cash reconciliation of billing and collection.
Uti
lity
Co
lle
cti
on
s /
Bil
lin
g a
nd
Co
lle
cti
on
CI
TY
O
F
LU
FK
IN
,
TE
XA
S
AUTHORIZED POSITIONS 2015-2016
Actual 2016-2017
Revised 2017-2018
Budget 2016-2017 Approved
Director of Utility Collections 1 1 1 1
Office Manager 1 1 1 1
Account Technician Entry 2 2 2 2
Utility Billing Clerk 3 3 3 3
FULL TIME 7 7 7 7
PART TIME 0 0 0 0
TOTAL 7 7 7 7
EXPENDITURES 2015-2016
Actual 2016-2017 Approved
2016-2017 Revised
2017-2018 Budget
Personnel Services 261,489 258,448 263,414 263,928
Benefits 73,887 116,244 118,205 118,214
Supplies 83,680 79,760 79,760 79,760
Maintenance of Equipment 4,599 8,170 6,530 7,510
Miscellaneous Services 92,151 88,885 105,155 104,050
Capital - - - 13,000
TOTAL 515,806 551,507 573,064 586,462
WATER / WASTEWATER FUND
Fiscal Year
2018
Page 198

DIVISION: Meter Reading
DIVISION DESCRIPTION
The Meter Reading division is responsible for reading residential and commercial water meters throughout the city, disconnecting service for non-payment of utility bill, performing customer requested inspections, responding to customer questions and/or concerns, connection/disconnection of services as requested by customer and reviewing questionable readings prior to billing.
Uti
lity
Co
lle
cti
on
s /
Me
ter
Re
ad
ing
CI
TY
O
F
LU
FK
IN
,
TE
XA
S
AUTHORIZED POSITIONS 2015-2016
Actual 2016-2017 Approved
2016-2017 Revised
2017-2018 Budget
Crew Leader 1 1 1 1
Maintenance Worker 2 2 2 2
Meter Reader 2 2 2 2
FULL TIME 5 5 5 5
PART TIME 0 0 0 0
TOTAL 5 5 5 5
WATER / WASTEWATER FUND
EXPENDITURES 2015-2016
Actual 2016-2017 Approved
2016-2017 Revised
2017-2018 Budget
Personnel Services 153,179 153,162 156,304 156,651
Benefits 50,611 72,673 73,697 73,664
Supplies 14,006 21,300 17,300 17,300
Maintenance of Equipment 6,774 10,810 10,810 12,910
Miscellaneous Services 10,658 14,362 13,137 14,252
TOTAL 235,228 272,307 271,248 274,777
Fiscal Year
2018
Page 199
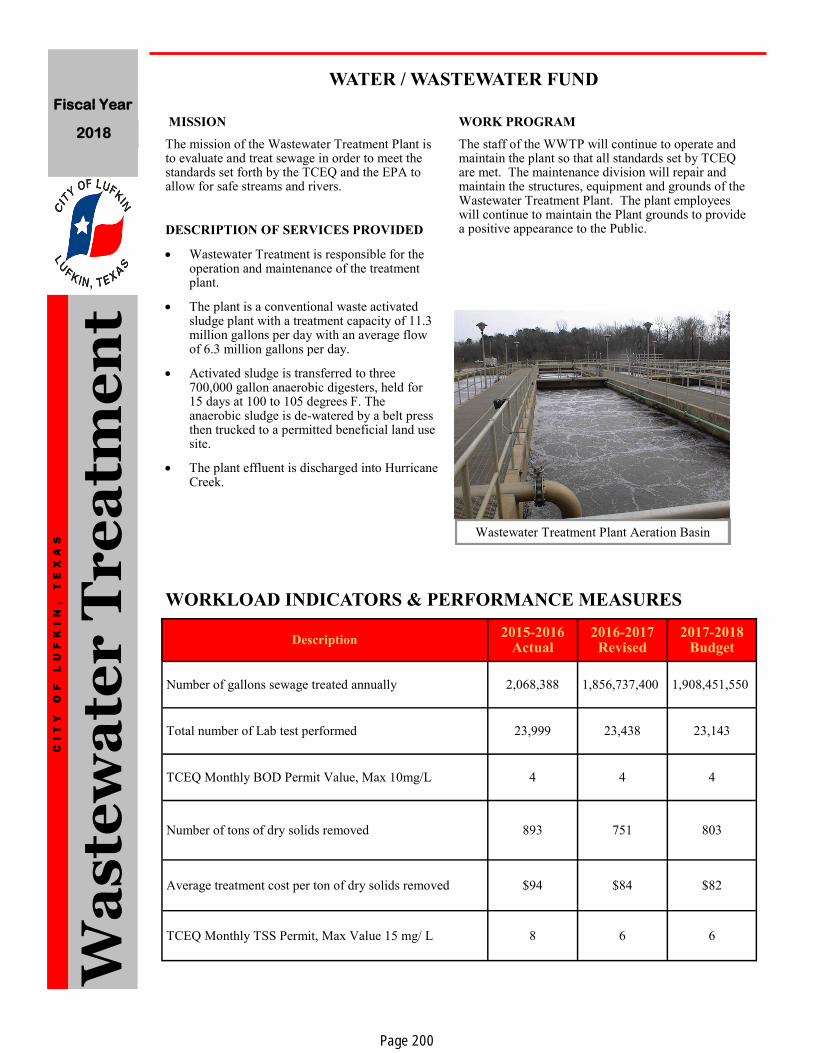
MISSION
The mission of the Wastewater Treatment Plant is to evaluate and treat sewage in order to meet the standards set forth by the TCEQ and the EPA to allow for safe streams and rivers.
DESCRIPTION OF SERVICES PROVIDED
Wastewater Treatment is responsible for the operation and maintenance of the treatment plant.
The plant is a conventional waste activated sludge plant with a treatment capacity of 11.3 million gallons per day with an average flow of 6.3 million gallons per day.
Activated sludge is transferred to three 700,000 gallon anaerobic digesters, held for 15 days at 100 to 105 degrees F. The anaerobic sludge is de-watered by a belt press then trucked to a permitted beneficial land use site.
The plant effluent is discharged into Hurricane Creek.
WORK PROGRAM
The staff of the WWTP will continue to operate and maintain the plant so that all standards set by TCEQ are met. The maintenance division will repair and maintain the structures, equipment and grounds of the Wastewater Treatment Plant. The plant employees will continue to maintain the Plant grounds to provide a positive appearance to the Public.
Wa
ste
wa
ter
Tr
ea
tme
nt
CI
TY
O
F
LU
FK
IN
,
TE
XA
S
WORKLOAD INDICATORS & PERFORMANCE MEASURES
WATER / WASTEWATER FUND
Wastewater Treatment Plant Aeration Basin
Fiscal Year
2018
Description 2015-2016
Actual 2016-2017 Revised
2017-2018 Budget
Number of gallons sewage treated annually 2,068,388 1,856,737,400 1,908,451,550
Total number of Lab test performed 23,999 23,438 23,143
TCEQ Monthly BOD Permit Value, Max 10mg/L 4 4 4
Number of tons of dry solids removed 893 751 803
Average treatment cost per ton of dry solids removed $94 $84 $82
TCEQ Monthly TSS Permit, Max Value 15 mg/ L 8 6 6
Page 200

DEPARTMENT Wastewater Treatment FUND Water / Wastewater
EXPENDITURES 2015-2016
Actual 2016-2017 Approved
2016-2017 Revised
2017-2018 Budget
Personnel Services 701,445 739,808 774,955 721,794
Benefits 223,733 339,777 327,520 323,672
Supplies 261,063 266,365 265,365 280,915
Maintenance of Equipment 253,294 178,500 185,768 185,500
Miscellaneous Services 652,065 649,580 672,680 633,120
TOTAL 2,091,600 2,174,030 2,226,288 2,145,001
AUTHORIZED POSITIONS 2015-2016
Actual 2016-2017 Approved
2016-2017 Revised
2017-2018 Budget
Director Utility Plant Operations 1 1 1 1
Asst. Director Utility Plant Operations 1 1 1 1
Office Manager 1 1 1 1
Environmental Manager 1 1 1 1
Environmental Technician 1 1 1 1
Lab Supervisor 1 1 1 1
Lab Technician 1 1 1 1
Operator II 1 1 1 1
Operator III 4 4 4 4
Truck Driver 1 1 1 1
Utility Worker 3 3 3 3
Maintenance Mechanic I 1 1 1 1
Maintenance Mechanic II 1 1 1 1
Maintenance Mechanic III 1 1 1 1
Electrical Maintenance Tech 1 1 1 1
Grounds Maintenance (Summer) 1 1 1 1
FULL TIME 20 20 20 20
PART TIME 1 1 1 1
TOTAL 21 21 21 21
SIGNIFICANT CHANGES
Page 201

DIVISION: Administration
DIVISION DESCRIPTION
The Administration Division supports all inter-departmental goals, receives additional training on environmental compliance regulations, implements all environmental regulation upgrades, collaborates with Plant Lab personnel on daily analysis, in-structs and guides the operators and mechanics, implements and enforces the City’s Pretreatment Program.
Wa
ste
wa
ter
Tr
ea
tme
nt
/ A
dm
inis
tra
tio
n
CI
TY
O
F
LU
FK
IN
,
TE
XA
S
AUTHORIZED POSITIONS 2015-2016
Actual 2016-2017
Revised 2017-2018
Budget 2016-2017 Approved
Director Utility Plant Operations 1 1 1 1
Asst. Director Utility Plant Operations 1 1 1 1
Office Manager 1 1 1 1
Environmental Manager 1 1 1 1
Environmental Technician 1 1 1 1
FULL TIME 5 5 5 5
PART TIME 0 0 0 0
TOTAL 5 5 5 5
EXPENDITURES 2015-2016
Actual 2016-2017 Approved
2016-2017 Revised
2017-2018 Budget
Personnel Services 247,243 244,405 288,444 236,121
Benefits 60,479 97,262 101,870 96,695
Supplies 9,660 10,265 10,265 10,265
Maintenance of Equipment 938 1,000 1,000 1,000
Miscellaneous Services 485,580 493,635 494,635 497,150
TOTAL 803,900 846,567 896,214 841,231
WATER / WASTEWATER FUND
Fiscal Year
2018
Page 202

DIVISION: Operations
DIVISION DESCRIPTION
The Operations Division is responsible for the efficient operation of the Wastewater Control Plant. The Division strives to meet goals established by the Administrative Division and the Administration of the City of Lufkin. Each operator is responsible for the plant effluent and biosolids disposal ensuring there is no state or federal violation
Wa
ste
wa
ter
Tr
ea
tme
nt
/ O
pe
ra
tio
ns
CI
TY
O
F
LU
FK
IN
,
TE
XA
S
AUTHORIZED POSITIONS 2015-2016
Actual 2016-2017 Approved
2016-2017 Revised
2017-2018 Budget
Operator II 1 1 1 1
Operator III 4 4 4 4
FULL TIME 5 5 5 5
PART TIME 0 0 0 0
TOTAL 5 5 5 5
EXPENDITURES 2015-2016
Actual 2016-2017 Approved
2016-2017 Revised
2017-2018 Budget
Personnel Services 174,285 179,042 164,930 174,161
Benefits 51,880 77,583 73,894 77,597
Supplies 182,372 192,750 192,750 207,050
Miscellaneous Services 581 3,000 4,500 4,500
TOTAL 409,118 452,375 436,074 463,308
WATER / WASTEWATER FUND Fiscal Year
2018
Page 203

DIVISION: Maintenance
DIVISION DESCRIPTION
The Maintenance Division is responsible for maintaining and repairing equipment and tools associated with the Wastewater Treatment Plant and Water Plant.
Wa
ste
wa
ter
Tr
ea
tme
nt
/ M
ain
ten
an
ce
CI
TY
O
F
LU
FK
IN
,
TE
XA
S
AUTHORIZED POSITIONS 2015-2016
Actual 2016-2017 Revised
2017-2018 Budget
2016-2017 Approved
Maintenance Mechanic I 1 1 1 1
Maintenance Mechanic II 1 1 1 1
Maintenance Mechanic III 1 1 1 1
Electrical Maintenance Tech 1 1 1 1
Utility Worker 3 3 3 3
Truck Driver 1 1 1 1
Grounds Maintenance (Summer) 1 1 1 1
FULL TIME 8 8 8 8
PART TIME 1 1 1 1
TOTAL 9 9 9 9
EXPENDITURES 2015-2016
Actual 2016-2017 Approved
2016-2017 Revised
2017-2018 Budget
Personnel Services 211,868 246,287 240,659 239,223
Benefits 75,197 117,122 116,463 116,054
Supplies 41,310 42,300 41,300 42,300
Maintenance of Equipment 252,356 177,500 184,768 184,500
Miscellaneous Services 43,422 43,545 43,545 22,070
TOTAL 624,153 626,754 626,735 604,147
WATER / WASTEWATER FUND
Fiscal Year
2018
Page 204

DIVISION: Laboratory
DIVISION DESCRIPTION
The Laboratory Division is responsible for testing samples to ensure that the effluent and industrial pretreatment samples is consistent with standards set by Local, State and Federal statutes.
Wa
ste
wa
ter
Tr
ea
tme
nt
/ L
ab
or
ato
ry
CI
TY
O
F
LU
FK
IN
,
TE
XA
S
AUTHORIZED POSITIONS 2015-2016
Actual 2016-2017 Approved
2016-2017 Revised
2017-2018 Budget
Laboratory Supervisor 1 1 1 1
Laboratory Technician 1 1 1 1
FULL TIME 2 2 2 2
PART TIME 0 0 0 0
TOTAL 2 2 2 2
EXPENDITURES 2015-2016
Actual 2016-2017 Approved
2016-2017 Revised
2017-2018 Budget
Personnel Services 68,049 70,074 80,922 72,289
Benefits 36,177 47,810 35,293 33,326
Supplies 27,721 21,050 21,050 21,300
Miscellaneous Services 122,482 109,400 130,000 109,400
TOTAL 254,429 248,334 267,265 236,315
WATER / WASTEWATER FUND
Fiscal Year
2018
Page 205
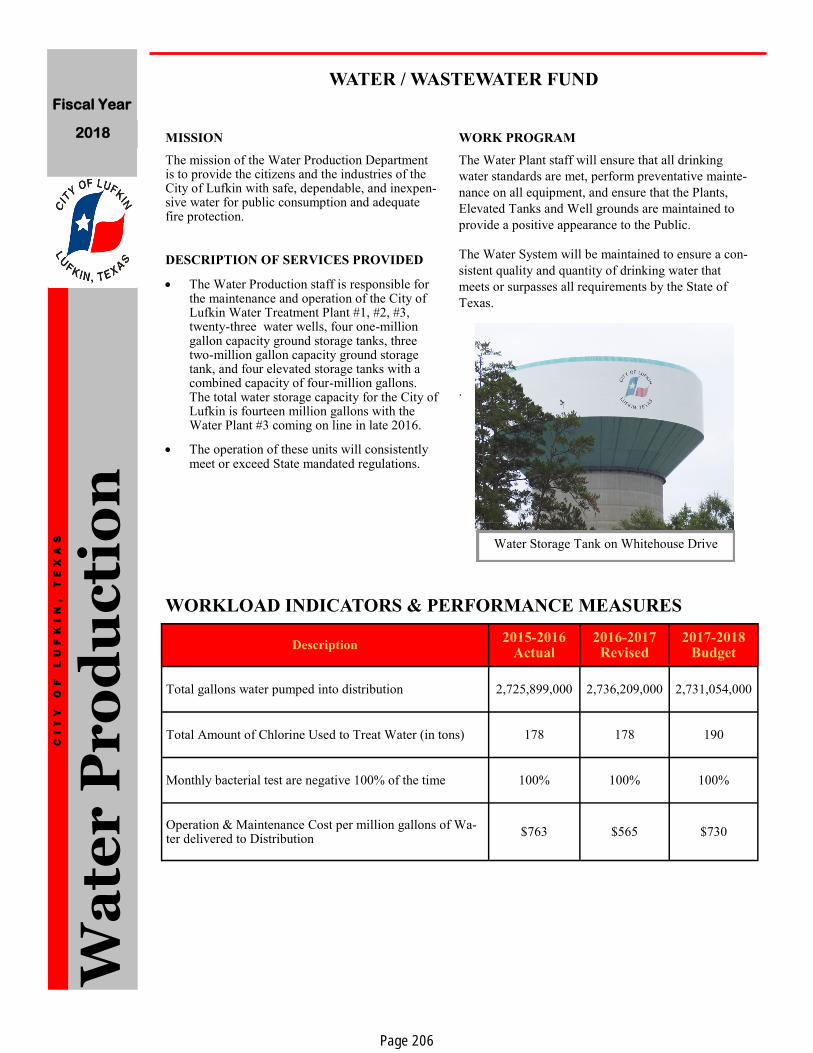
MISSION
The mission of the Water Production Department is to provide the citizens and the industries of the City of Lufkin with safe, dependable, and inexpen-sive water for public consumption and adequate fire protection.
DESCRIPTION OF SERVICES PROVIDED
The Water Production staff is responsible for the maintenance and operation of the City of Lufkin Water Treatment Plant #1, #2, #3, twenty-three water wells, four one-million gallon capacity ground storage tanks, three two-million gallon capacity ground storage tank, and four elevated storage tanks with a combined capacity of four-million gallons. The total water storage capacity for the City of Lufkin is fourteen million gallons with the Water Plant #3 coming on line in late 2016.
The operation of these units will consistently meet or exceed State mandated regulations.
WORK PROGRAM
The Water Plant staff will ensure that all drinking
water standards are met, perform preventative mainte-
nance on all equipment, and ensure that the Plants,
Elevated Tanks and Well grounds are maintained to
provide a positive appearance to the Public.
The Water System will be maintained to ensure a con-
sistent quality and quantity of drinking water that
meets or surpasses all requirements by the State of
Texas.
.
Wa
ter
Pr
od
uc
tio
n
CI
TY
O
F
LU
FK
IN
,
TE
XA
S
WORKLOAD INDICATORS & PERFORMANCE MEASURES
WATER / WASTEWATER FUND
Water Storage Tank on Whitehouse Drive
Fiscal Year
2018
Description 2015-2016
Actual 2016-2017 Revised
2017-2018 Budget
Total gallons water pumped into distribution 2,725,899,000 2,736,209,000 2,731,054,000
Total Amount of Chlorine Used to Treat Water (in tons) 178 178 190
Monthly bacterial test are negative 100% of the time 100% 100% 100%
Operation & Maintenance Cost per million gallons of Wa-ter delivered to Distribution
$763 $565 $730
Page 206

DEPARTMENT Water Production FUND Water / Wastewater
EXPENDITURES 2015-2016
Actual 2016-2017 Approved
2016-2017 Revised
2017-2018 Budget
Personnel Services 42,787 45,124 45,743 50,323
Benefits 20,974 24,661 26,003 24,896
Supplies 275,915 273,800 314,300 314,800
Maintenance of Equipment 120,225 137,000 137,000 137,000
Miscellaneous Services 1,372,164 1,538,371 1,510,671 1,563,711
TOTAL 1,832,075 2,018,956 2,063,717 2,090,730
AUTHORIZED POSITIONS 2015-2016
Actual 2016-2017 Approved
2016-2017 Revised
2017-2018 Budget
Operator II 1 1 1 1
Grounds Maintenance (Summer) 1 1 1 1
FULL TIME 1 1 1 1
PART TIME 1 1 1 1
TOTAL 2 2 2 2
SIGNIFICANT CHANGES
Page 207

DIVISION: Operations
DIVISION DESCRIPTION
The Operations Division is responsible for the operation of the water system ensuring a high quality drinking water is provided to the citizens and industry of Lufkin at the lowest possible cost.
Wa
ter
Pr
od
uc
tio
n /
Op
er
ati
on
s
CI
TY
O
F
LU
FK
IN
,
TE
XA
S
AUTHORIZED POSITIONS 2015-2016
Actual 2016-2017 Approved
2016-2017 Revised
2017-2018 Budget
Operator II 1 1 1 1
Grounds Maintenance (Summer) 1 1 1 1
FULL TIME 1 1 1 1
PART TIME 1 1 1 1
TOTAL 2 2 2 2
EXPENDITURES 2015-2016
Actual 2016-2017 Approved
2016-2017 Revised
2017-2018 Budget
Personnel Services 42,797 45,124 45,743 50,323
Benefits 20,974 24,661 26,003 24,896
Supplies 263,461 256,800 299,300 299,300
Miscellaneous Services 1,368,723 1,534,930 1,537,230 1,560,270
TOTAL 1,695,955 1,861,515 1,908,276 1,934,789
WATER / WASTEWATER FUND
Fiscal Year
2018
Page 208
DIVISION: Maintenance
DIVISION DESCRIPTION
The Maintenance Division is responsible for maintaining all of the equipment, including water wells.
Wa
ter
Pr
od
uc
tio
n /
Ma
inte
na
nc
e
CI
TY
O
F
LU
FK
IN
,
TE
XA
S
AUTHORIZED POSITIONS 2016-2017
Actual 2016-2017 Approved
2016-2017 Revised
2017-2018 Budget
There are no positions assigned to this division.
FULL TIME
PART TIME
TOTAL
EXPENDITURES 2015-2016
Actual 2016-2017 Approved
2016-2017 Revised
2017-2018 Budget
Supplies 12,454 17,000 15,000 15,500
Maintenance of Equipment 120,225 137,000 137,000 137,000
Miscellaneous Services 3,441 3,441 3,441 3,441
TOTAL 136,120 157,441 155,441 155,941
WATER / WASTEWATER FUND
Fiscal Year
2018
Page 209

MISSION
The mission of the Water and Sewer Utility Department is to provide the citizens of Lufkin with the highest quality and reliable service. Our goal is to operate in a cost effective manner by maintaining the water distribution system and sewer collection system with minimum interruptions of service.
DESCRIPTION OF SERVICES PROVIDED
The Water and Sewer Utility Department is responsible for all water distribution and sewer collection functions.
The service responsibilities include maintenance of water and sewer mains, water and sewer taps, fire hydrant repair, pipe bursting, repair or replace broken mains, unstop sewer mains, dead end flushing of water mains, code enforcement of backflow preventers, and grease trap pumping.
The department strives to meet the needs of the citizens on a daily basis by performing
these functions in as timely and accurate manner as possible.
WORK PROGRAM
The Water and Wastewater Utility Department goals are to operate in a cost effective manner by maintaining the water distribution system and sewer collection system with minimum interruptions of service to the citizens of Lufkin.
.
Wa
ter
/Se
we
r U
tili
tie
s
CI
TY
O
F
LU
FK
IN
,
TE
XA
S
Description 2015-2016
Actual 2016-2017 Revised
2017-2018 Budget
Number of new water taps annually 175 136 112
Number of water leaks repaired annually 422 456 376
Water taps completed within 10 days of request 95% of the time
93% 95% 82%
Number of sewage stoppages annually 413 434 396
Feet of sewer main televised annually 32,557 35,316 36,417
Repair water leaks within 3 days of request 80% of the time
87% 86% 74%
WORKLOAD INDICATORS & PERFORMANCE MEASURES
WATER / WASTEWATER FUND
Fiscal Year
2018
Page 210
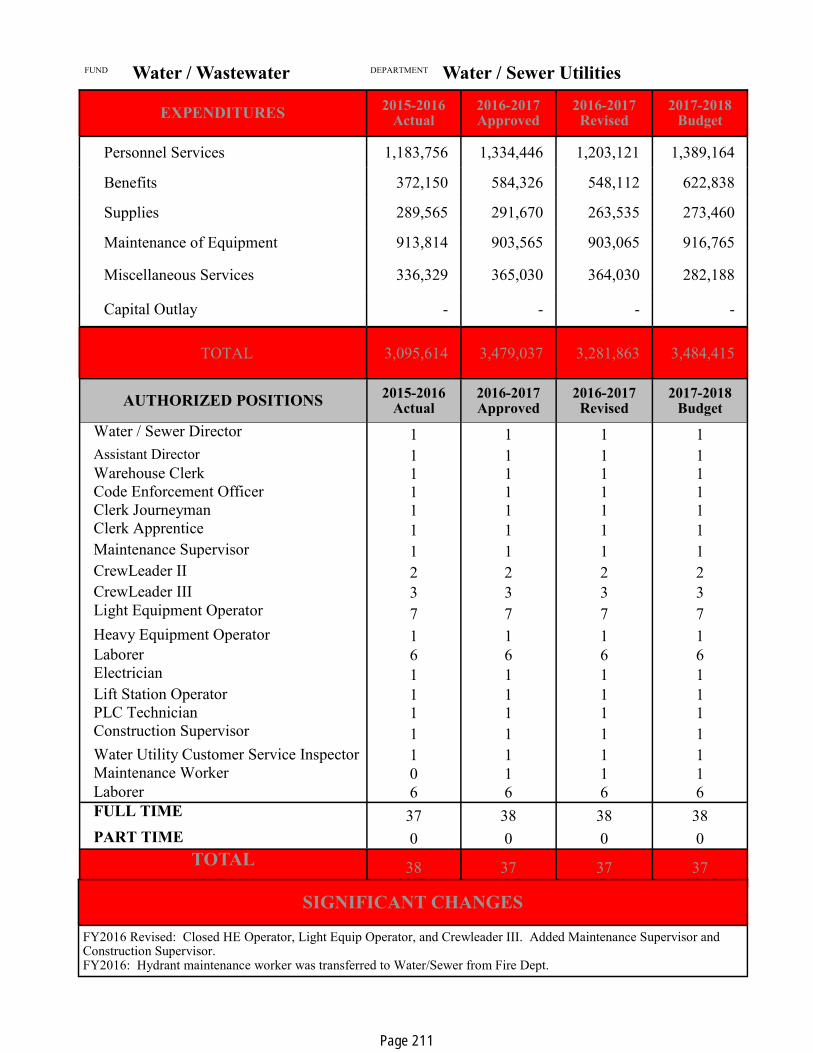
DEPARTMENT Water / Sewer Utilities FUND Water / Wastewater
EXPENDITURES 2015-2016
Actual 2016-2017 Approved
2016-2017 Revised
2017-2018 Budget
Personnel Services 1,183,756 1,334,446 1,203,121 1,389,164
Benefits 372,150 584,326 548,112 622,838
Supplies 289,565 291,670 263,535 273,460
Maintenance of Equipment 913,814 903,565 903,065 916,765
Miscellaneous Services 336,329 365,030 364,030 282,188
Capital Outlay - - - -
TOTAL 3,095,614 3,479,037 3,281,863 3,484,415
AUTHORIZED POSITIONS 2015-2016
Actual 2016-2017 Approved
2016-2017 Revised
2017-2018 Budget
Water / Sewer Director 1 1 1 1
Assistant Director 1 1 1 1 Warehouse Clerk 1 1 1 1 Code Enforcement Officer 1 1 1 1 Clerk Journeyman 1 1 1 1 Clerk Apprentice 1 1 1 1
Maintenance Supervisor 1 1 1 1
CrewLeader II 2 2 2 2
CrewLeader III 3 3 3 3 Light Equipment Operator 7 7 7 7
Heavy Equipment Operator 1 1 1 1
Laborer 6 6 6 6 Electrician 1 1 1 1
Lift Station Operator 1 1 1 1 PLC Technician 1 1 1 1 Construction Supervisor 1 1 1 1
Water Utility Customer Service Inspector 1 1 1 1 Maintenance Worker 0 1 1 1 Laborer 6 6 6 6
FULL TIME 37 38 38 38
PART TIME 0 0 0 0
TOTAL 38 37 37 37
SIGNIFICANT CHANGES
FY2016 Revised: Closed HE Operator, Light Equip Operator, and Crewleader III. Added Maintenance Supervisor and Construction Supervisor. FY2016: Hydrant maintenance worker was transferred to Water/Sewer from Fire Dept.
Page 211

DIVISION: Water/Sewer Administration
DIVISION DESCRIPTION
The Water / Sewer Utilities Department strive to provide the citizens of Lufkin with thigh quality and reliable service. Prepares, submits and over-sees an annual budget. Ensures compliance with policies and procedures. Strives to operate in a cost effective manner with minimum interruptions
of service to the water distribution and sewer collec-tions systems.
Wa
ter
/Se
we
r U
tili
tie
s/A
dm
inis
tra
tio
n
CI
TY
O
F
LU
FK
IN
,
TE
XA
S
AUTHORIZED POSITIONS 2015-2016
Actual 2016-2017 Approved
2016-2017 Revised
2017-2018 Budget
Water / Sewer Utilities Director 1 1 1 1
Assistant Director 1 1 1 1
Warehouse Clerk 1 1 1 1
Code Enforcement Officer 1 1 1 1
Maintenance Supervisor 1 1 1 1
Clerk Journeyman 1 1 1 1
Clerk Apprentice 1 1 1 1
Maintenance Worker-Hydrant 0 1 1 1
FULL TIME 7 8 8 8
PART TIME 0 0 0 0
TOTAL 7 8 8 8
EXPENDITURES 2015-2016
Actual 2016-2017 Approved
2016-2017 Revised
2017-2018 Budget
Personnel Services 215,016 305,914 245,167 245,254
Benefits 70,506 134,766 100,086 105,702
Supplies 22,848 26,680 23,545 24,970
Maintenance of Equipment 12,952 15,230 14,730 28,430
Miscellaneous Services 73,318 88,140 87,140 87,075
TOTAL 394,640 570,730 470,668 491,431
WATER / WASTEWATER FUND
Fiscal Year
2018
Page 212

DIVISION: Water Utilities
DIVISION DESCRIPTION
The Water Utilities department is responsible for all water utility functions. This responsibility en-compasses services such as maintenance of the water distribution system, meter services, water taps, fire hydrant repair, repairs or replacement of broken water lines, locating water lines for utilities
and contractors, carrying out the radio read meter change out program. The Water Distribution depart-ment is responsible for extending water lines to ac-commodate the growth of the City. The Water Distri-bution Department continuously strives to meet the needs of the citizens on a daily basis by performing these functions in as timely and accurate manner as possible.
Wa
ter
/Se
we
r U
tili
tie
s/W
ate
r U
tili
tie
s
CI
TY
O
F
LU
FK
IN
,
TE
XA
S
AUTHORIZED POSITIONS 2015-2016
Actual 2016-2017 Approved
2016-2017 Revised
2017-2018 Budget
Crew Leader III 1 1 1 1
Crew Leader II 2 2 2 2
Light Equipment Operator 3 3 3 3
Maintenance Worker 2 2 2 2
Water Utility Customer Service Inspec-tor 1 1 1 1
Laborer 6 6 6 6
FULL TIME 15 15 15 15
PART TIME 0 0 0 0
TOTAL 15 15 15 15
EXPENDITURES 2015-2016
Actual 2016-2017 Approved
2016-2017 Revised
2017-2018 Budget
Personnel Services 410,517 439,447 396,492 480,302
Benefits 144,235 211,074 194,614 230,992
Supplies 63,923 77,510 67,510 67,510
Maintenance of Equipment 531,925 533,130 533,130 533,130
Miscellaneous Services 53,889 53,928 53,928 35,338
TOTAL 1,204,489 1,315,089 1,245,674 1,347,272
WATER / WASTEWATER FUND
Fiscal Year
2018
Page 213

DIVISION: Sewer Utilities
DIVISION DESCRIPTION
The Sewer Collections Department is responsible for all sewer utilities functions. The responsibility encompasses services such as maintenance of the sewer collections system, cleaning sewer lines, sewer taps, manhole repair, repair or replacement of broken sewer lines, locating sewer lines for oth-
er utilities and contractors. Televising of sewer lines, daily inspections of sewer lift stations. The sewer collections department is responsible for extending sewer lines to accommodate the growth of the City. The sewer collections Department continuously strives to meet the needs of the citizens on a daily basis by performing these functions in a timely and accurate manner as possible.
Wa
ter
/Se
we
r U
tili
tie
s/S
ew
er
Uti
liti
es
CI
TY
O
F
LU
FK
IN
,
TE
XA
S
AUTHORIZED POSITIONS 2015-2016
Actual 2016-2017 Approved
2016-2017 Revised
2017-2018 Budget
Crew Leader III 2 2 2 2
Light Equipment Operator 4 4 4 4
Heavy Equipment Operator 1 1 1 1
Electrician 1 1 1 1
Lift Station Operator 1 1 1 1
PLC Technician 1 1 1 1
Construction Supervisor 1 1 1 1 Maintenance Worker 4 4 4 4
FULL TIME 15 15 15 15
PART TIME 0 0 0 0
TOTAL 15 15 15 15
EXPENDITURES 2015-2016
Actual 2016-2017 Approved
2016-2017 Revised
2017-2018 Budget
Personnel Services 558,223 589,085 561,462 663,608
Benefits 157,409 238,486 253,412 286,144
Supplies 202,794 187,480 172,480 180,980
Maintenance of Equipment 368,937 355,205 355,205 355,205
Miscellaneous Services 209,122 222,962 222,962 159,775
Capital Outlay - - - -
TOTAL 1,496,485 1,593,218 1,565,521 1,645,712
WATER / WASTEWATER FUND
Fiscal Year
2018
Page 214

MISSION
Non-departmental expenditures represent expenditures that are unique in nature, apply to the fund in total, or represent expenditures that apply to all departments.
DESCRIPTION OF SERVICES PROVIDED
This is a non-operational department established for the purpose of handling items that apply to the fund as a whole, not to specific individual departments. Items included as expenditures are bad debt expenses, software payments, insurance payments and contingency accounts.
No
n—
De
pa
rtm
en
tal
CI
TY
O
F
LU
FK
IN
,
TE
XA
S
WATER / WASTEWATER FUND
WORK PROGRAM
Budgeted in the department for fiscal year 2018 are the following items:
Liability Insurance Premium $ 124,477
Contingency Amount $ 150,000
Allowance for Uncollectible Accounts $ 150,000
General and Administrative Charges $2,641,151
Funded Depreciation Transfers $2,107,905
Debt Service Transfers $3,546,645
Transfer to General Fund $ 100,000
AUTHORIZED POSITIONS 2015-2016
Actual 2016-2017 Approved
2016-2017 Revised
2017-2018 Budget
There are no positions assigned to this division.
FULL TIME
PART TIME
TOTAL
EXPENDITURES 2015-2016
Actual 2016-2017 Approved
2016-2017 Revised
2017-2018 Budget
Personnel Services - 60,674 - 25,452
Benefits 2,495 - - -
Miscellaneous Services 146,311 274,477 274,477 274,477
Sundry Charges 4,904,470 4,701,269 4,701,269 4,899,056
Transfers 3,583,293 3,897,410 4,343,523 3,646,645
TOTAL 8,636,569 8,933,830 9,319,269 8,845,630
Fiscal Year
2018
Page 215
Page 216

So
lid
Wa
ste
/ R
ec
yc
lin
g F
un
d
CI
TY
O
F
LU
FK
IN
,
TE
XA
S
SOLID WASTE AND RECYCLING FUND
The Solid Waste and Recycling Fund is an enterprise fund that is used to account for the activities of the Solid Waste and Recycling services. All activities required to provide these services are included in this fund. Accounting activities of the Sol-id Waste and Recycling Fund are recorded similar to commercial accounting in that full accrual accounting is utilized. The Solid Waste department provides twice weekly pickup of residential garbage and recycled materials. One pickup includes household garbage only; the other pickup includes only recycled materials. The department also provides pickup of yard trimmings, brush and white goods to residential customers at no charge. Com-mercial customers are provided two-, three-, four-, six-, or eight-cubic yard contain-er service, picked up one to five times weekly, based on customer selection.
Fiscal Year
2018
Page 217

MISSION
The mission of the Solid Waste Department is to provide waste and debris pickup for both residences and businesses within the City of Lufkin as efficient and safe as possible.
DESCRIPTION OF SERVICES PROVIDED
The Solid Waste Department provides solid waste collection for residential customers utilizing a fully automated collection system. This service is provided through a once a week household garbage collection and a once a week single stream recyclables collection.
Commercial and Industrial customers located within the City of Lufkin are offered front-load type and roll-off type (compacted and non-compacted) service with an available service frequency from once a week to up to six times weekly.
Yard trimmings, brush, and junk collections are available to homeowners at no extra cost by submitting a work order request.
The Litter Critter is a small dumpster that is rented by residential customers for small household cleanups, household remodels, and garage cleanouts.
Litter Abatement crew collects trash from City
of Lufkin right of ways and some special events hosted by the City of Lufkin.
WORK PROGRAM
To continue to monitor the Special Collections division and evaluate possible changes. This collection is very costly and the Residential Collections revenue is struggling to subsidize this program.
So
lid
Wa
ste
De
pa
rtm
en
t C
IT
Y
OF
L
UF
KI
N,
T
EX
AS
WORKLOAD INDICATORS & PERFORMANCE MEASURES
SOLID WASTE / RECYCLING FUND Fiscal Year
2018
The Litter Critter
Description 2015-2016
Actual 2016-2017 Revised
2017-2018 Budget
Number of residential customers served 11,100 11,100 11,900
Number of commercial customers served 891 880 885
Complete scheduled routes within specified timeframes, 95% of time
96% 96% 96%
Complete work orders within one week, 95% of time. 68% 65% 65%
Page 218
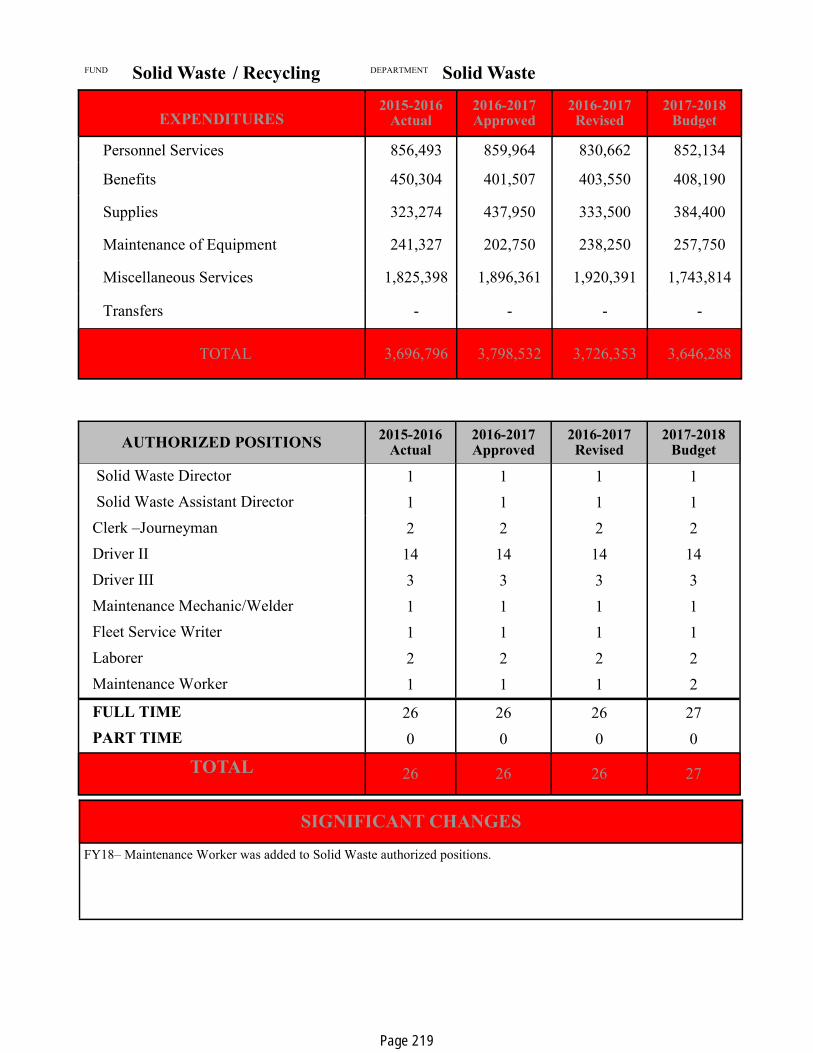
DEPARTMENT Solid Waste FUND Solid Waste / Recycling
EXPENDITURES 2015-2016
Actual 2016-2017 Approved
2016-2017 Revised
2017-2018 Budget
Personnel Services 856,493 859,964 830,662 852,134
Benefits 450,304 401,507 403,550 408,190
Supplies 323,274 437,950 333,500 384,400
Maintenance of Equipment 241,327 202,750 238,250 257,750
Miscellaneous Services 1,825,398 1,896,361 1,920,391 1,743,814
Transfers - - - -
TOTAL 3,696,796 3,798,532 3,726,353 3,646,288
AUTHORIZED POSITIONS 2015-2016
Actual 2016-2017 Approved
2016-2017 Revised
2017-2018 Budget
Solid Waste Director 1 1 1 1
Solid Waste Assistant Director 1 1 1 1
Clerk –Journeyman 2 2 2 2
Driver II 14 14 14 14
Driver III 3 3 3 3
Maintenance Mechanic/Welder 1 1 1 1
Fleet Service Writer 1 1 1 1
Laborer 2 2 2 2
Maintenance Worker 1 1 1 2
FULL TIME 26 26 26 27
PART TIME 0 0 0 0
TOTAL 26 26 26 27
SIGNIFICANT CHANGES
FY18– Maintenance Worker was added to Solid Waste authorized positions.
Page 219

DIVISION: Administration
DIVISION DESCRIPTION
The Administration division is responsible for providing overall management, planning and direction of the daily activities of the Solid Waste and Recycling Departments.
So
lid
Wa
ste
/ A
dm
inis
tra
tio
n
CI
TY
O
F
LU
FK
IN
,
TE
XA
S
AUTHORIZED POSITIONS 2015-2016
Actual 2016-2017 Approved
2016-2017 Revised
2017-2018 Budget
Solid Waste Director 1 1 1 1
Solid Waste Assistant Director 1 1 1 1
Clerk –Journeyman 2 2 2 2
Maintenance Worker 0 0 0 1
FULL TIME 4 4 4 5
PART TIME 0 0 0 0
TOTAL 4 4 4 5
EXPENDITURES 2015-2016
Actual 2016-2017 Approved
2016-2017 Revised
2017-2018 Budget
Personnel Services 163,521 165,559 168,760 198,221
Benefits 79,817 71,170 72,196 86,442
Supplies 24,614 24,700 27,200 28,100
Maintenance of Equipment 6,007 2,500 3,500 12,250
Miscellaneous Services 41,323 55,615 70,510 56,560
TOTAL 315,282 319,544 342,166 381,573
SOLID WASTE / RECYCLING FUND Fiscal Year
2018
Page 220
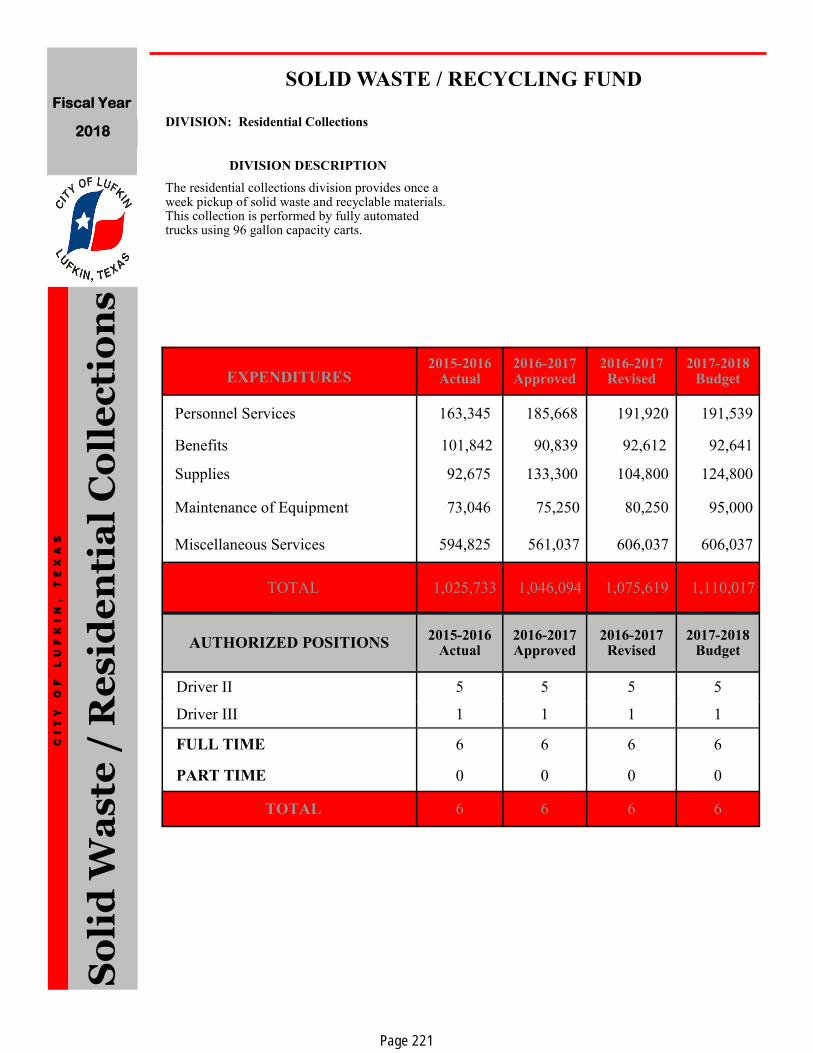
DIVISION: Residential Collections
DIVISION DESCRIPTION
The residential collections division provides once a week pickup of solid waste and recyclable materials. This collection is performed by fully automated trucks using 96 gallon capacity carts.
So
lid
Wa
ste
/ R
es
ide
nti
al
Co
lle
cti
on
s
CI
TY
O
F
LU
FK
IN
,
TE
XA
S
AUTHORIZED POSITIONS 2015-2016
Actual 2016-2017 Approved
2016-2017 Revised
2017-2018 Budget
Driver II 5 5 5 5
Driver III 1 1 1 1
FULL TIME 6 6 6 6
PART TIME 0 0 0 0
TOTAL 6 6 6 6
EXPENDITURES 2015-2016
Actual 2016-2017 Approved
2016-2017 Revised
2017-2018 Budget
Personnel Services 163,345 185,668 191,920 191,539
Benefits 101,842 90,839 92,612 92,641
Supplies 92,675 133,300 104,800 124,800
Maintenance of Equipment 73,046 75,250 80,250 95,000
Miscellaneous Services 594,825 561,037 606,037 606,037
TOTAL 1,025,733 1,046,094 1,075,619 1,110,017
SOLID WASTE / RECYCLING FUND Fiscal Year
2018
Page 221

DIVISION: Commercial Collection
DIVISION DESCRIPTION
The Commercial Collection Division is responsible for providing garbage and recycling collection for the commercial establishments in the City on a regularly scheduled basis as selected by the customer.
So
lid
Wa
ste
/ C
om
me
rc
ial
Co
lle
cti
on
CI
TY
O
F
LU
FK
IN
,
TE
XA
S
AUTHORIZED POSITIONS 2015-2016
Actual 2016-2017 Approved
2016-2017 Revised
2017-2018 Budget
Driver II 4 4 4 4
Driver III 2 2 2 2
SW Fleeet Service 1 1 1 1
Maintenance Mechanic/Welder 1 1 1 1
FULL TIME 8 8 8 8
PART TIME 0 0 0 0
TOTAL 8 8 8 8
EXPENDITURES 2015-2016
Actual 2016-2017 Approved
2016-2017 Revised
2017-2018 Budget
Personnel Services 241,079 253,822 233,784 235,567
Benefits 127,854 115,700 110,915 110,896
Supplies 113,642 155,800 114,400 125,300
Maintenance of Equipment 109,442 80,000 89,500 90,500
Miscellaneous Services 665,051 667,225 666,360 503,748
TOTAL 1,257,068 1,272,547 1,214,959 1,066,011
SOLID WASTE / RECYCLING FUND Fiscal Year
2018
Page 222
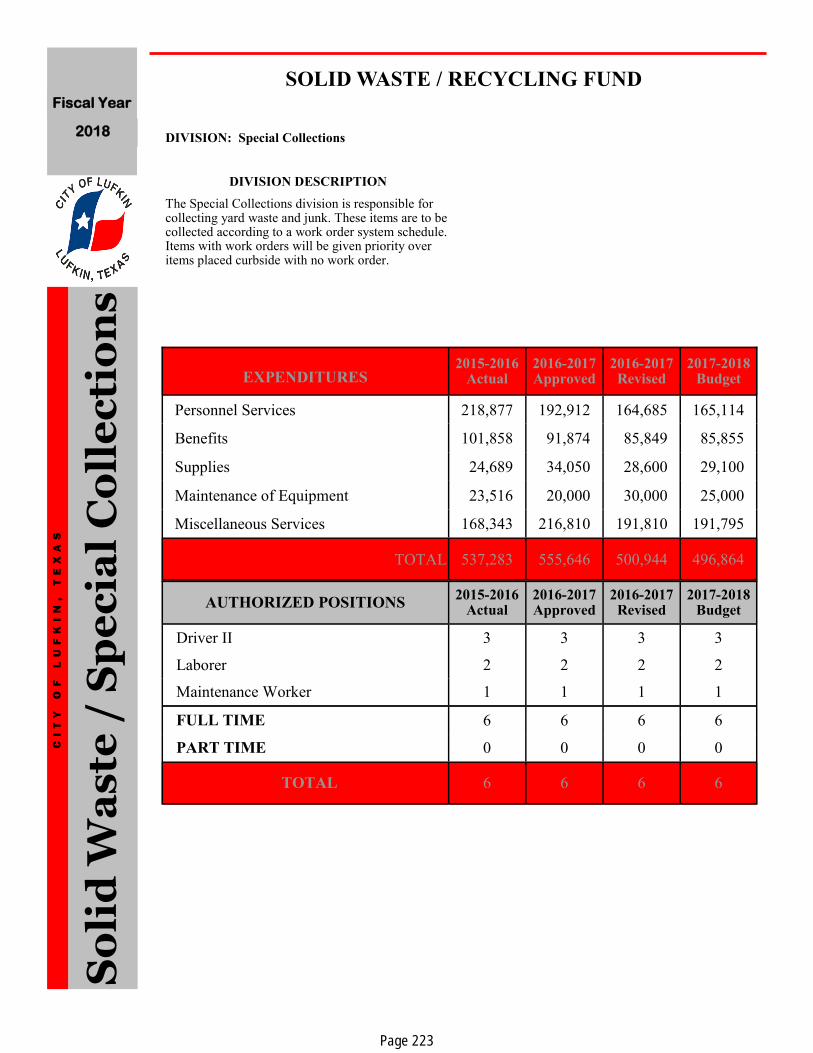
DIVISION: Special Collections
DIVISION DESCRIPTION
The Special Collections division is responsible for collecting yard waste and junk. These items are to be collected according to a work order system schedule. Items with work orders will be given priority over items placed curbside with no work order.
So
lid
Wa
ste
/ S
pe
cia
l C
oll
ec
tio
ns
CI
TY
O
F
LU
FK
IN
,
TE
XA
S
AUTHORIZED POSITIONS 2015-2016
Actual 2016-2017 Approved
2016-2017 Revised
2017-2018 Budget
Driver II 3 3 3 3
Laborer 2 2 2 2
Maintenance Worker 1 1 1 1
FULL TIME 6 6 6 6
PART TIME 0 0 0 0
TOTAL 6 6 6 6
EXPENDITURES 2015-2016
Actual 2016-2017 Approved
2016-2017 Revised
2017-2018 Budget
Personnel Services 218,877 192,912 164,685 165,114
Benefits 101,858 91,874 85,849 85,855
Supplies 24,689 34,050 28,600 29,100
Maintenance of Equipment 23,516 20,000 30,000 25,000
Miscellaneous Services 168,343 216,810 191,810 191,795
TOTAL 537,283 555,646 500,944 496,864
SOLID WASTE / RECYCLING FUND Fiscal Year
2018
Page 223

DIVISION: Roll-off Collections
DIVISION DESCRIPTION
The Roll-Off Division provides commercial, industri-al and construction waste collection services within the City of Lufkin. This service is performed by uti-lizing 20, 30 or 40 cubic yard roll-off type collection boxes.
So
lid
Wa
ste
/ R
oll
-off
Co
lle
cti
on
s
CI
TY
O
F
LU
FK
IN
,
TE
XA
S
AUTHORIZED POSITIONS 2015-2016
Actual 2016-2017 Approved
2016-2017 Revised
2017-2018 Budget
Driver II 2 2 2 2
FULL TIME 2 2 2 2
PART TIME 0 0 0 0
TOTAL 2 2 2 2
EXPENDITURES 2015-2016
Actual 2016-2017 Approved
2016-2017 Revised
2017-2018 Budget
Personnel Services 69,671 62,003 71,513 61,693
Benefits 38,933 31,924 41,978 32,356
Supplies 67,654 90,100 58,500 77,100
Maintenance of Equipment 29,316 25,000 35,000 35,000
Miscellaneous Services 355,856 395,674 385,674 385,674
TOTAL 561,430 604,701 592,665 591,823
SOLID WASTE /RECYCLING FUND Fiscal Year
2018
Page 224

MISSION
The mission of the Recycling Department is to establish and perform a Recycling Program that works with the City and Regional Solid Waste Plans.
DESCRIPTION OF SERVICES PROVIDED
The Regional Recycling Center works in conjunction with the Solid Waste collection divisions within the Solid Waste department.
This department receives and process all recyclable material that is delivered to the Recycling Center.
This material is sorted by the different types and then run through a baler. The baled material is then sold to various recyclers.
WORK PROGRAM
The Recycling Department will continue to
promote the Recycling program through education
and public awareness. The department will
evaluate proposals to reduce costs such as reducing
the recyclable materials collected from
neighboring counties and other purchasing decisions
that promote efficiencies within the department.
So
lid
Wa
ste
/ R
ec
yc
lin
g
CI
TY
O
F
LU
FK
IN
,
TE
XA
S
Description 2015-2016
Actual 2016-2017
Revised 2017-2018
Budget
Average number of tons of recyclables collected per day 12 12 12
Average number of cubic yards of solid waste collected monthly
15,325 15,335 15,335
Tons of material sold and shipped from the Recycling Center.
2,760 2,800 3,000
Number of residents that participate in annual tire day 390 375 400
WORKLOAD INDICATORS & PERFORMANCE MEASURES
SOLID WASTE / RECYCLING FUND Fiscal Year
2018
Sorting recyclables at the Lufkin Recycling Center
Page 225

DEPARTMENT Recycling FUND Solid Waste / Recycling
EXPENDITURES 2015-2016 Ac-
tual 2016-2017 Approved
2016-2017 Revised
2017-2018 Budget
Personnel Services 131,016 165,179 142,656 169,560
Benefits 97,833 94,411 89,325 95,476
Supplies 51,305 57,000 54,200 54,500
Maintenance of Equipment 29,180 48,000 50,000 52,500
Miscellaneous Services 159,608 191,170 184,122 184,715
TOTAL 468,942 555,760 520,303 556,751
AUTHORIZED POSITIONS 2015-2016
Actual 2016-2017 Approved
2016-2017 Revised
2017-2018 Budget
Crew Leader II 1 1 1 1
Laborer 5 5 5 5
Maintenance Worker 1 1 1 1
FULL TIME 7 7 7 7
PART TIME 0 0 0 0
TOTAL 7 7 7 7
SIGNIFICANT CHANGES
Page 226
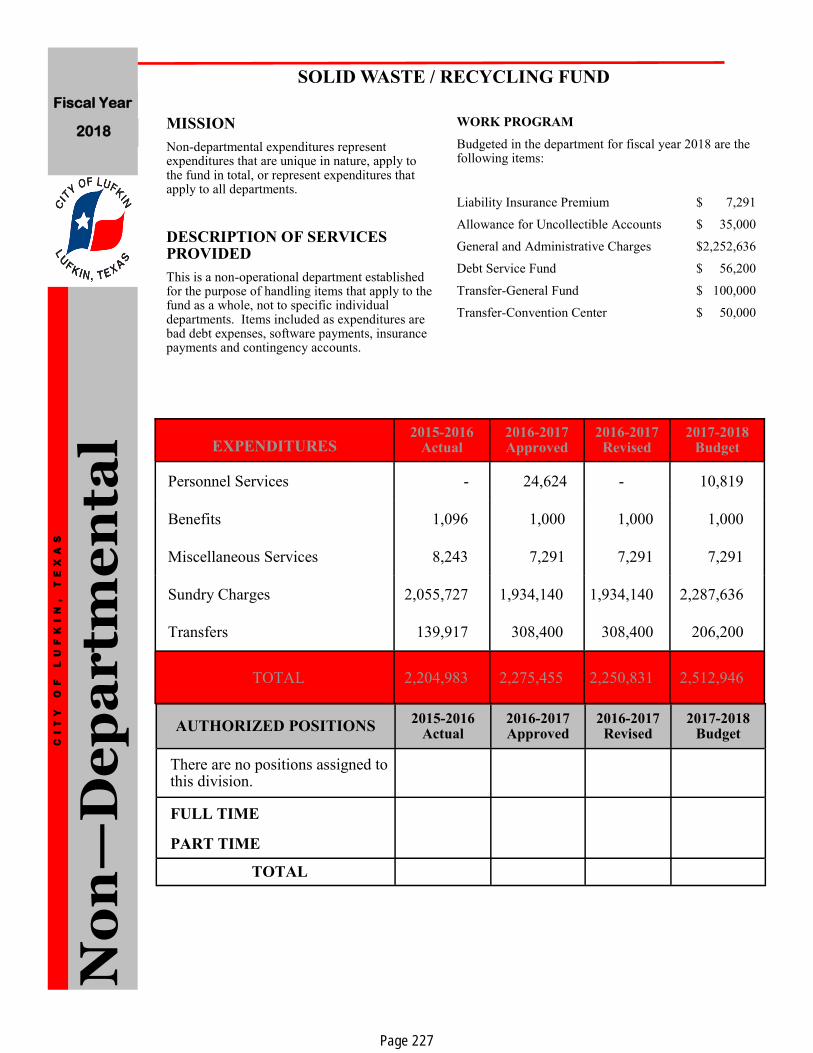
MISSION
Non-departmental expenditures represent expenditures that are unique in nature, apply to the fund in total, or represent expenditures that apply to all departments.
DESCRIPTION OF SERVICES PROVIDED
This is a non-operational department established for the purpose of handling items that apply to the fund as a whole, not to specific individual departments. Items included as expenditures are bad debt expenses, software payments, insurance payments and contingency accounts.
No
n—
De
pa
rtm
en
tal
CI
TY
O
F
LU
FK
IN
,
TE
XA
S
SOLID WASTE / RECYCLING FUND
WORK PROGRAM
Budgeted in the department for fiscal year 2018 are the following items:
Liability Insurance Premium $ 7,291
Allowance for Uncollectible Accounts $ 35,000
General and Administrative Charges $2,252,636
Debt Service Fund $ 56,200
Transfer-General Fund $ 100,000
Transfer-Convention Center $ 50,000
AUTHORIZED POSITIONS 2015-2016
Actual 2016-2017 Approved
2016-2017 Revised
2017-2018 Budget
There are no positions assigned to this division.
FULL TIME
PART TIME
TOTAL
EXPENDITURES 2015-2016
Actual 2016-2017 Approved
2016-2017 Revised
2017-2018 Budget
Personnel Services - 24,624 - 10,819
Benefits 1,096 1,000 1,000 1,000
Miscellaneous Services 8,243 7,291 7,291 7,291
Sundry Charges 2,055,727 1,934,140 1,934,140 2,287,636
Transfers 139,917 308,400 308,400 206,200
TOTAL 2,204,983 2,275,455 2,250,831 2,512,946
Fiscal Year
2018
Page 227

Page 228

OT
HE
R F
UN
DS
C
IT
Y
OF
L
UF
KI
N,
T
EX
AS
OTHER FUNDS
HOTEL/MOTEL TAX FUND The Hotel/Motel Tax Fund is a special revenue fund that accounts for the activities of the Pitser Garrison Convention Center, and contributes to the Museum of East Texas, Lufkin Convention and Tourism Bureau, Angelina County Exposition Center, and Texas Forestry Museum. Primary funding is generated from the Hotel/Motel Occupancy Tax; user fees are also set to cover cost of use.
SPECIAL RECREATION FUND The Special Recreation Fund is a special revenue fund that accounts for recreational activities sponsored by the City’s Park Department, which include softball, volleyball, and basketball leagues, as well as, gymnastics. Funds are used for operation and maintenance of the ball fields and recreation center.
PINES THEATER SPECIAL EVENTS The Pines Theater Special Event Fund is a special revenue fund that accounts for a series of cultural events planned for the newly renovated Pines Theater downtown.
ZOO BUILDING FUND The Zoo Building Fund is a special revenue fund that accounts for donations, gate receipts, other miscellaneous revenues and operating expenses for the purchase of animals, facilities repair, and capital expansion.
COURT SECURITY/TECHNOLOGY FUND The Court Security/Technology Fund is a special revenue fund that accounts for the Security/Technology fee collected on all Municipal Court Fines. The revenues collected support the salary for the Part-time City Marshall as well as the purchase of computer equipment for the Municipal Court.
COMMUNITY DEV/DOWNTOWN FESTIVAL The Community Dev/Dwntn Festival Fund is a special revenue fund that accounts for funds raised at the City supported multi-cultural annual festival.
ANIMAL CONTROL KURTH GRANT FUND The Animal Control Kurth Grant Fund is a special revenue fund that accounts for the contributions made to the Kurth Memorial Animal Shelter from the Kurth Foundation.
ANIMAL ATTIC GIFT FUND The Animal Attic Gift Fund is a special revenue fund that accounts for donations and other miscellaneous revenues. These funds are used for the purchase of veterinary equipment and animal care supplies.
EQUIPMENT ACQUISITION AND REPLACEMENT FUND The Equipment Acquisition and Replacement Fund is an internal service fund that accounts for the depreciation cost on all rolling stock type vehicles, machinery and equipment. The accumulated depreciation is transferred to this fund annual to accumulate for the purpose of replacing and acquiring new equipment. The governmental fund types are budgeted on a modified accrual basis wherein obligations of the City are budgeted as expenditures but revenues are recognized and recorded when they are available and become measurable.
Fiscal Year
2018
Page 229

MISSION
The mission of the Pitser Garrison Civic Center is to provide a safe, beneficial, and enjoyable facility for special events and concerts for citizens, tourists and visitors to Lufkin.
DESCRIPTION OF SERVICES PROVIDED
The Pitser Garrison Civic Center provides a meet-ing place for events such as seminars, receptions, banquets, concerts, and many other gatherings.
The Center provides a full catering kitchen, stage, sound system, concession area, dressing areas, and auxiliary equipment such as a piano, microphones, tape and CD players, podiums, spotlights, and screens.
The staff is available to serve the customer in com-plete set-up, including tables and chairs, custodial, security, and maintenance services.
WORK PROGRAM
The work program for the 2016 Fiscal year is to continually train the staff to acquire the utmost efficiency in all aspects of the Convention Center and train all staff to operate all equipment without assistance, when circumstances arise. We are striving to keep all Saturdays filled, with the goal of additional rentals on Friday or Sunday. Our rental goal is to add two multi-day, mid-week conferences and have at least one become an annual event. We will continue to search for out-of-town renters to bring more revenue to the City as a whole as-well-as the Convention Center.
Ho
tel/
Mo
tel
Ta
x F
un
d -
Pit
se
r G
ar
ris
on
C
on
ve
nti
on
Ce
nte
r
CI
TY
O
F
LU
FK
IN
,
TE
XA
S
Description 2015-2016
Actual 2016-2017
Revised 2017-2018
Budget
Total Number of Days Rented 175 186 200
Total Number of Events 127 198 250
Percentage of Multi-day Rentals 36% 38% 40%
Total of Annual Rentals 55 58 65
Total Number of Kitchen Rentals 63 99 110
Percentage of Multi-day Annual Rentals with Hotel Stays 26% 35% 40%
WORKLOAD INDICATORS & PERFORMANCE MEASURES
HOTEL / MOTEL TAX FUND Fiscal Year
2018
Page 230

DEPARTMENT Convention Center FUND Hotel / Motel Tax Fund
EXPENDITURES 2015-2016
Actual 2016-2017 Approved
2016-2017 Revised
2017-2018 Budget
Personnel Services 229,359 224,453 226,947 227,754
Benefits 111,996 118,813 119,112 120,887
Supplies 41,572 35,900 35,400 35,100
Maintenance of Equipment 22,504 25,000 24,200 24,500
Miscellaneous Services 164,708 190,807 189.877 184,447
Sundry 609,369 582,625 624,850 619,000
Transfers 2,918 - - 873
TOTAL 1,182,425 1,177,598 1,220,386 1,212,561
AUTHORIZED POSITIONS 2015-2016
Actual 2016-2017 Approved
2016-2017 Revised
2017-2018 Budget
Convention Center Director 1 1 1 1
Assistant Director 1 1 1 1
Crew Leader 1 1 1 1
Laborer 5 5 5 5
FULL TIME 8 8 8 8
PART TIME 0 0 0 0
TOTAL 8 8 8 8
SIGNIFICANT CHANGES
Page 231

MISSION
The mission of the Hotel/Motel Tax Fund is to help provide funding to entities within the City of Lufkin which help promote tourism, provide educational experiences as well as entertainment for the citizens, and visitors of the City.
DESCRIPTION OF SERVICES PROVIDED
The Hotel/Motel Tax Fund helps to provide funding for the Museum of East Texas, George H. Henderson Exposition Center, Texas Forestry Museum and Lufkin Convention and Tourism Bureau.
The funding from the Hotel/Motel Tax Fund is used for operational support of the facilities of these entities.
WORK PROGRAM
The Fiscal year 2018 appropriations budget for the entities is as follows:
The Museum of East Texas $ 52,500
George H. Henderson Exposition Center $130,000
Texas Forestry Museum $ 37,500
Lufkin Convention and Visitor Bureau $399,000
Ho
tel/
Mo
tel
Ta
x F
un
d -
Ta
x A
pp
ro
pr
iati
on
s
CI
TY
O
F
LU
FK
IN
,
TE
XA
S
EXPENDITURES
2015-2016 Actual
2016-2017 Approved
2016-2017 Revised
2017-2018 Budget
Sundry Charges 609,369 582,625 624,850 619,000
TOTAL 609,369 582,625 624,850 619,000
AUTHORIZED POSITIONS 2015-2016
Actual 2016-2017 Approved
2016-2017 Revised
2017-2018 Budget
There are no positions assigned to this department.
FULL TIME
PART TIME
TOTAL
HOTEL / MOTEL TAX FUND Fiscal Year
2018
Page 232

MISSION
Non-Departmental expenditures represent expendi-tures that are unique in nature, apply to the fund in total, or represent expenditures that apply to all departments.
DESCRIPTION OF SERVICES PROVIDED
This is a non-operational department established for the purpose of handling items that apply to the fund as a whole, not to specific individual depart-ments. Items included as expenditures are bad debt expenses, liability and unemployment insurance.
WORK PROGRAM
Continue providing accurate estimates for items budg-eted in this department.
Non-departmental budgets include the following items:
Liability Insurance Premium $ 3,757
Ho
tel
/ M
ote
l T
ax
Fu
nd
—N
on
de
pa
rtm
en
tal
CI
TY
O
F
LU
FK
IN
,
TE
XA
S
EXPENDITURES 2015-2016
Actual 2016-2017 Approved
2016-2017 Revised
2017-2018 Budget
Personnel Services 6,835 6,826 - 2,373
Miscellaneous Services 9,924 9,757 9,757 3,757
Transfers 2,917 - - -
TOTAL 19,676 16,583 9,757 6,130
AUTHORIZED POSITIONS 2015-2016
Actual 2016-2017 Approved
2016-2017 Revised
2017-2018 Budget
There are no positions assigned to this department.
FULL TIME
PART TIME
TOTAL
HOTEL / MOTEL TAX FUND Fiscal Year
2018
Page 233

MISSION
The mission of the Recreation Department is to add to the quality of life by accommodating the leisure needs of all ages through sporting and recreational activities, and special events that are safe and enjoyable.
DESCRIPTION OF SERVICES PROVIDED
The Recreation Department offers a wide variety of sporting events, recreation classes, and special events for all ages.
Instructors are evaluated through observation and parent evaluation, which assist in ensuring customer satisfaction.
All leagues are monitored for safety.
The Department is responsible for registration of participants, receiving fees, park reservations, securing gym space, swimming pool, and working
with the Texas USA, TAAF and FASA.
The Recreation Department is also in charge of the annual Easter Egg Hunt, July 4th Extravaganza, the annual Mizuno girl’s fast-pitch softball tournament, and the Daddy/Daughter Dance.
WORK PROGRAM
The Department will continue to offer a wide variety of recreation programs this year. Softball will continue to increase teams using the Kit McConnico fields. The 4th of July Extravaganza hosted by Love and Associates Law Firm will be a planning priority this year. The Department looks forward to working with K-Fox Radio to increase participation in the annual Easter Egg Hunt. The Daddy/Daughter Dance will be a big attraction in 2018. The Department is working hard at trying to bring baseball tournaments to Lufkin.
Re
cr
ea
tio
n
CI
TY
O
F
LU
FK
IN
,
TE
XA
S
Description 2015-2016
Actual 2016-2017
Revised 2017-2018
Budget
This is a non-operational department
WORKLOAD INDICATORS & PERFORMANCE MEASURES
EXPENDITURES 2015-2016
Actual 2016-2017 Approved
2016-2017 Revised
2017-2018 Budget
Personnel Services 36,370 44,000 44,046 44,000
Benefits 3,418 3,975 4,002 4,002
Supplies 105,300 123,860 128,575 122,915
Maintenance of Equipment 17,505 19,900 19,900 19,650
Miscellaneous Services 185,193 214,190 196,431 206,525
Transfers 59,769 59,769 59,769 59,769
TOTAL 407,555 465,694 452,723 456,861
AUTHORIZED POSITIONS 2015-2016
Actual 2016-2017 Approved
2016-2017 Revised
2017-2018 Budget
Concession Stand Workers 25 25 25 25
FULL TIME - - - -
PART TIME 25 25 25 25
TOTAL 25 25 25 25
SPECIAL RECREATION FUND Fiscal Year
2018
Page 234

DIVISION: Softball
DIVISION DESCRIPTION
This division is for youth and adult softball leagues. The teams participating in the program pay league fees and direct costs for field use. Maintenance of the fields is provided through the park maintenance budget.
Re
cr
ea
tio
n /
So
ftb
all
C
IT
Y
OF
L
UF
KI
N,
T
EX
AS
AUTHORIZED POSITIONS 2015-2016
Actual 2016-2017 Approved
2016-2017 Revised
2017-2018 Budget
There are no positions assigned to this division.
FULL TIME
PART TIME
TOTAL
EXPENDITURES 2015-2016
Actual 2016-2017 Approved
2016-2017 Revised
2017-2018 Budget
Supplies 24,083 23,200 30,200 23,050
Maintenance of Equipment 11,738 14,000 14,000 13,750
Miscellaneous Services 85,275 101,850 89,100 93,000
TOTAL 121,096 139,050 133,300 129,800
SPECIAL RECREATION FUND Fiscal Year
2018
Page 235

DIVISION: Volleyball
DIVISION DESCRIPTION
This division is for the volleyball leagues. The teams participating in the program pay league fees and direct costs for field use. Maintenance of the fields is provided through the park maintenance budget.
Re
cr
ea
tio
n /
Vo
lle
yb
all
C
IT
Y
OF
L
UF
KI
N,
T
EX
AS
AUTHORIZED POSITIONS 2015-2016
Actual 2016-2017 Approved
2016-2017 Revised
2017-2018 Budget
There are no positions assigned to this division.
FULL TIME
PART TIME
TOTAL
EXPENDITURES 2015-2016
Actual 2016-2017 Approved
2016-2017 Revised
2017-2018 Budget
Supplies 744 1,875 1,875 2,000
Miscellaneous Services 565 1,670 1,670 1,670
TOTAL 1,309 3,545 3,545 3,670
SPECIAL RECREATION FUND Fiscal Year
2018
Page 236

DIVISION: Basketball
DIVISION DESCRIPTION
This division is provided for youth and adult bas-ketball programs.
Re
cr
ea
tio
n /
Ba
sk
etb
all
C
IT
Y
OF
L
UF
KI
N,
T
EX
AS
EXPENDITURES 2015-2016
Actual 2016-2017 Approved
2016-2017 Revised
2017-2018 Budget
Supplies 4,495 7,070 6,600 7,170
Miscellaneous Services 14,947 16,000 14,046 16,100
TOTAL 19,442 23,070 20,676 23,270
SPECIAL RECREATION FUND Fiscal Year
2018
AUTHORIZED POSITIONS 2015-2016
Actual 2016-2017 Approved
2016-2017 Revised
2017-2018 Budget
There are no positions assigned to this division.
FULL TIME
PART TIME
TOTAL
Page 237
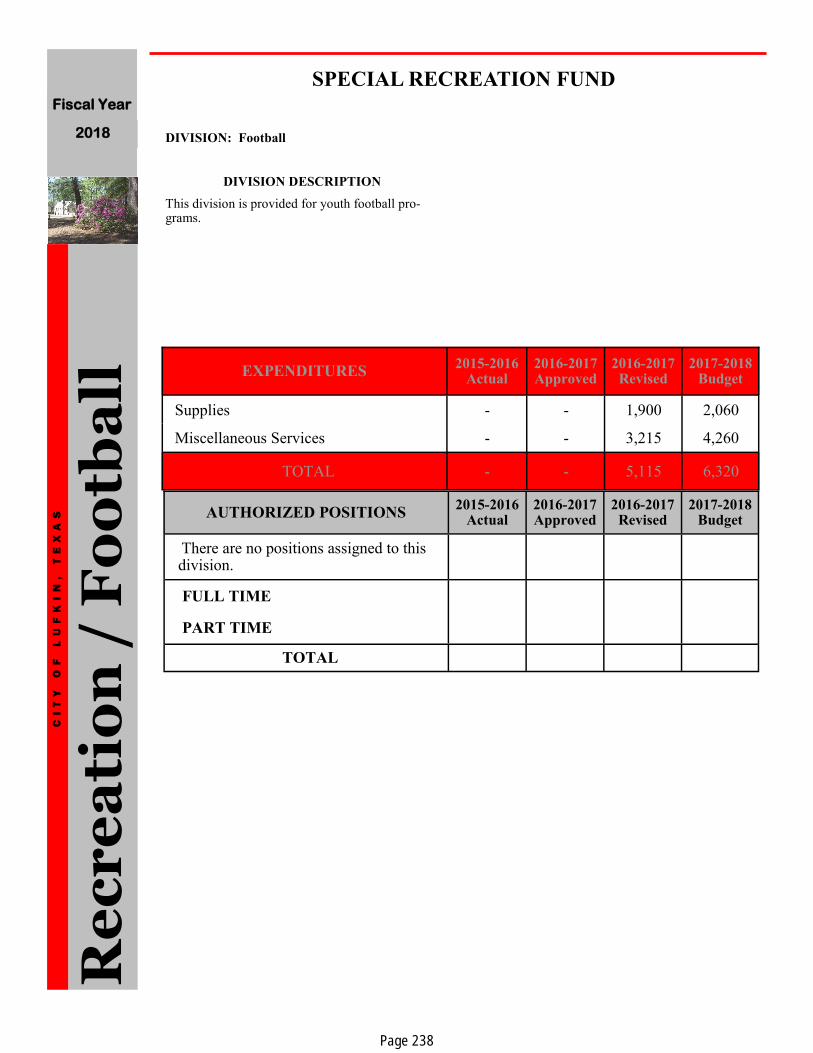
DIVISION: Football
DIVISION DESCRIPTION
This division is provided for youth football pro-grams.
Re
cr
ea
tio
n /
Fo
otb
all
C
IT
Y
OF
L
UF
KI
N,
T
EX
AS
EXPENDITURES 2015-2016
Actual 2016-2017 Approved
2016-2017 Revised
2017-2018 Budget
Supplies - - 1,900 2,060
Miscellaneous Services - - 3,215 4,260
TOTAL - - 5,115 6,320
SPECIAL RECREATION FUND Fiscal Year
2018
AUTHORIZED POSITIONS 2015-2016
Actual 2016-2017 Approved
2016-2017 Revised
2017-2018 Budget
There are no positions assigned to this division.
FULL TIME
PART TIME
TOTAL
Page 238
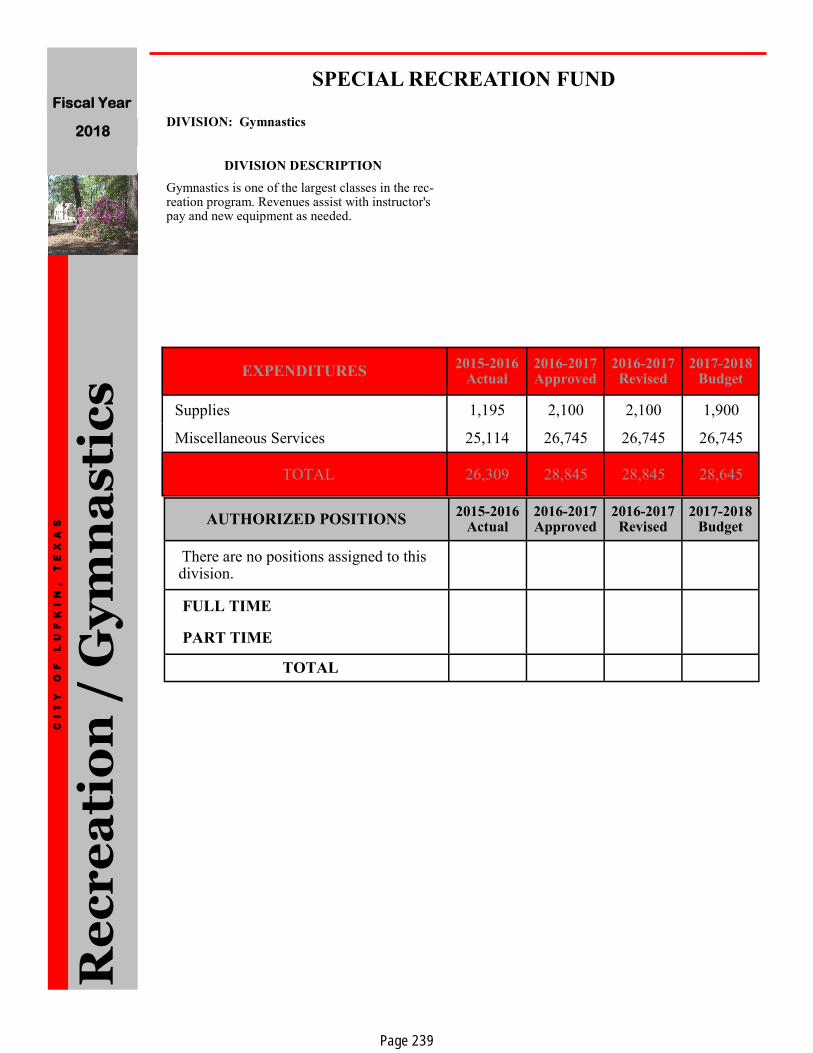
DIVISION: Gymnastics
DIVISION DESCRIPTION
Gymnastics is one of the largest classes in the rec-reation program. Revenues assist with instructor's pay and new equipment as needed.
Re
cr
ea
tio
n /
Gy
mn
as
tic
s
CI
TY
O
F
LU
FK
IN
,
TE
XA
S
EXPENDITURES 2015-2016
Actual 2016-2017 Approved
2016-2017 Revised
2017-2018 Budget
Supplies 1,195 2,100 2,100 1,900
Miscellaneous Services 25,114 26,745 26,745 26,745
TOTAL 26,309 28,845 28,845 28,645
SPECIAL RECREATION FUND Fiscal Year
2018
AUTHORIZED POSITIONS 2015-2016
Actual 2016-2017 Approved
2016-2017 Revised
2017-2018 Budget
There are no positions assigned to this division.
FULL TIME
PART TIME
TOTAL
Page 239

DIVISION: Special Events
DIVISION DESCRIPTION
This division is for activities planned and spon-sored by the Parks and Recreation department. Currently, our special events include the Annual Easter Egg Hunt, Punt, Pass and Kick, kickball tournament, and the July 4th Extravaganza. Dona-tions, sponsors, vendors, and user fees provide funding for this division.
Re
cr
ea
tio
n /
Sp
ec
ial
Ev
en
ts
CI
TY
O
F
LU
FK
IN
,
TE
XA
S
EXPENDITURES 2015-2016
Actual 2016-2017 Approved
2016-2017 Revised
2017-2018 Budget
Supplies 803 1,750 1,750 1,250
Miscellaneous Services 2,791 3,375 6,125 3,500
TOTAL 3,594 5,125 7,875 4,750
SPECIAL RECREATION FUND
Fiscal Year
2018
AUTHORIZED POSITIONS 2015-2016
Actual 2016-2017 Approved
2016-2017 Revised
2017-2018 Budget
There are no positions assigned to this division.
FULL TIME
PART TIME
TOTAL
Page 240

DIVISION: Recreation Classes
DIVISION DESCRIPTION
This division is for payment of instructors and ex-penses related to the recreation activities offered through the Recreation Program.
Re
cr
ea
tio
n /
Re
cr
ea
tio
n C
las
se
s
CI
TY
O
F
LU
FK
IN
,
TE
XA
S
EXPENDITURES 2015-2016
Actual 2016-2017 Approved
2016-2017 Revised
2017-2018 Budget
Supplies 89 475 350 425
Miscellaneous Services 20,422 17,100 19,400 19,600
TOTAL 20,511 17,575 19,750 20,025
SPECIAL RECREATION FUND Fiscal Year
2018
AUTHORIZED POSITIONS 2015-2016
Actual 2016-2017 Approved
2016-2017 Revised
2017-2018 Budget
There are no positions assigned to this division.
FULL TIME
PART TIME
TOTAL
Page 241

DIVISION: Baseball
DIVISION DESCRIPTION
This division accounts for youth baseball which is our largest youth sport. Registration fees pay for um-pires, equipment, uniforms, sanction fees, and insur-ance are paid from this division.
Re
cr
ea
tio
n /
Ba
se
ba
ll
CI
TY
O
F
LU
FK
IN
,
TE
XA
S
EXPENDITURES 2015-2016
Actual 2016-2017 Approved
2016-2017 Revised
2017-2018 Budget
Supplies 19,272 24,090 20,500 21,760
Maintenance of Equipment 5,767 5,900 5,900 5,900
Miscellaneous Services 36,079 47,450 36,100 41,650
TOTAL 61,118 77,440 62,500 69,310
SPECIAL RECREATION FUND Fiscal Year
2018
AUTHORIZED POSITIONS 2015-2016
Actual 2016-2017 Approved
2016-2017 Revised
2017-2018 Budget
There are no positions assigned to this division.
FULL TIME
PART TIME
TOTAL
Page 242
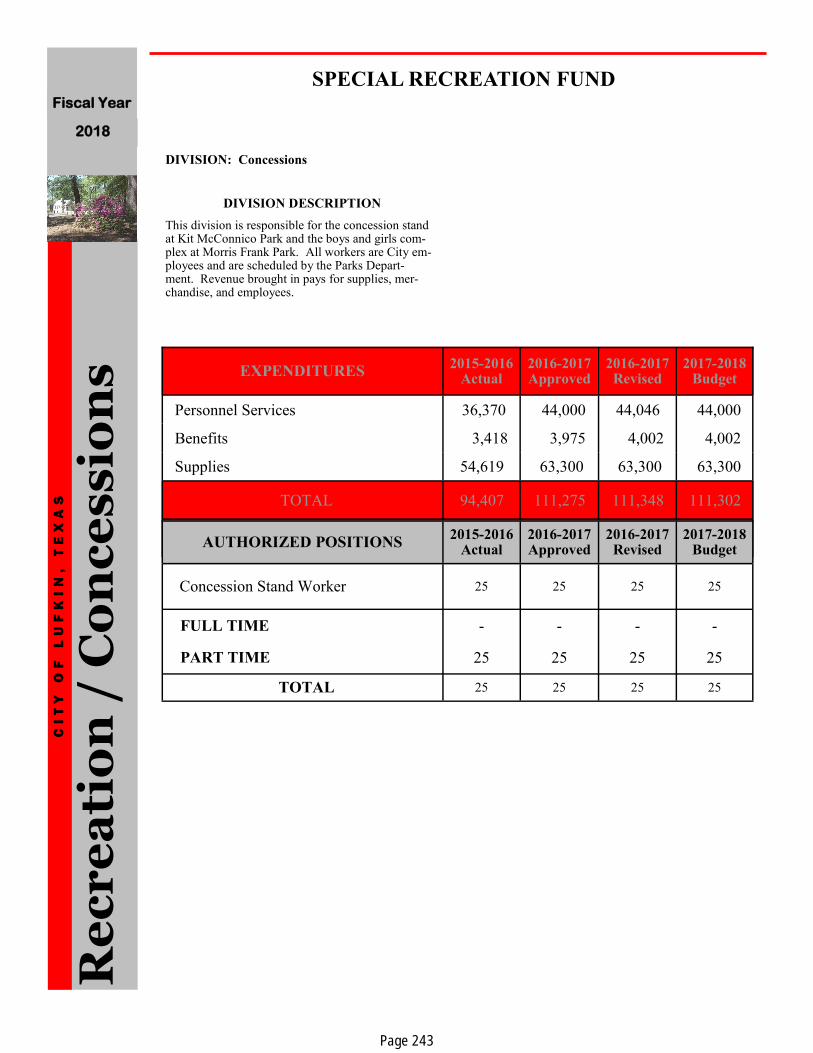
DIVISION: Concessions
DIVISION DESCRIPTION
This division is responsible for the concession stand at Kit McConnico Park and the boys and girls com-plex at Morris Frank Park. All workers are City em-ployees and are scheduled by the Parks Depart-ment. Revenue brought in pays for supplies, mer-chandise, and employees.
Re
cr
ea
tio
n /
Co
nc
es
sio
ns
C
IT
Y
OF
L
UF
KI
N,
T
EX
AS
EXPENDITURES 2015-2016
Actual 2016-2017 Approved
2016-2017 Revised
2017-2018 Budget
Personnel Services 36,370 44,000 44,046 44,000
Benefits 3,418 3,975 4,002 4,002
Supplies 54,619 63,300 63,300 63,300
TOTAL 94,407 111,275 111,348 111,302
AUTHORIZED POSITIONS 2015-2016
Actual 2016-2017 Approved
2016-2017 Revised
2017-2018 Budget
Concession Stand Worker 25 25 25 25
FULL TIME - - - -
PART TIME 25 25 25 25
TOTAL 25 25 25 25
SPECIAL RECREATION FUND Fiscal Year
2018
Page 243

MISSION
Non-Departmental expenditures represent expendi-tures that are unique in nature, apply to the fund in total, or represent expenditures that apply to all departments.
DESCRIPTION OF SERVICES PROVIDED
This is a non-operational department established for the purpose of handling items that apply to the fund as a whole, not to specific individual depart-ments. Items included as expenditures are bad debt expenses, liability and unemployment insurance.
WORK PROGRAM
Continue providing accurate estimates for items budg-eted in this department.
Non-departmental budgets include the following items:
Transfer to General Fund $ 59,769
Re
cr
ea
tio
n—
No
n d
ep
ar
tme
nta
l
CI
TY
O
F
LU
FK
IN
,
TE
XA
S
Description 2015-2016
Actual 2016-2017 Revised
2017-2018 Budget
This is a non operational department and does not have performance measures.
EXPENDITURES 2015-2016
Actual 2016-2017 Approved
2016-2017 Revised
2017-2018 Budget
Transfers 59,770 59,769 59,769 59,769
TOTAL 59,770 59,769 59,769 59,769
SPECIAL RECREATION FUND Fiscal Year
2018
AUTHORIZED POSITIONS 2015-2016
Actual 2016-2017 Approved
2016-2017 Revised
2017-2018 Budget
There are no positions assigned to this division.
FULL TIME
PART TIME
TOTAL
Page 244

MISSION
The mission of the Pines Theater Special Events fund is to host a series of cultural events and to promote the use of the historical Pines Theater.
DESCRIPTION OF SERVICES PROVIDED
The Pines Theater Special Events Fund was created in fiscal year 2012 from a sponsorship by Lufkin Convention & Visitor Bureau to promote a series of special events at The Pines and help bring culture and arts to our residents along with attracting visi-tors to our community.
The Pines Theatre host movies every month throughout the year.
The Pines Theatre Venue is rented for various social events including weddings, recitals, ban-quets, award ceremonies and school programs.
From October 2016 through September 2017, a
total of 12 movies will have been shown.
From October—September 2017, a total of 8 shows will have been presented through The Pines Presents.
From October 2016-September 2017 The Pines has been rented a total of 102 times. This includes private rentals for weddings, corporate events, engagement parties, and other musical events, schools, etc.
Pin
es
Th
ea
ter
Sp
ec
ial
Ev
en
ts
CI
TY
O
F
LU
FK
IN
,
TE
XA
S Description
2015-2016 Actual
2016-2017 Revised
2017-2018 Budget
This is a non-operational department
WORKLOAD INDICATORS & PERFORMANCE MEASURES
EXPENDITURES 2015-2016
Actual 2016-2017 Approved
2016-2017 Revised
2017-2018 Budget
Supplies 14,072 21,125 14,125 16,625
Maintenance of Equipment 2,905 3,570 3,570 3,570
Miscellaneous Services 176,130 148,140 136,249 152,140
TOTAL 193,107 172,835 153,954 172,335
Pines Theater Special Events Fiscal Year
2018
AUTHORIZED POSITIONS 2015-2016
Actual 2016-2017 Approved
2016-2017 Revised
2017-2018 Budget
There are no positions assigned to this division.
FULL TIME
PART TIME
TOTAL
Page 245

MISSION
The mission of the Zoo Building Fund is to provide financial assistance to the Ellen Trout Zoo in order to help make the zoo a diverse, enjoyable and safe facility for all of the animals, visitors and staff.
DESCRIPTION OF SERVICES PROVIDED
The Zoo Building Fund is supported by donations, admission fees, Adopt-An-Animal and other reve-nue generated by the zoo.
These revenues are used for facility improvements and animal purchases.
Since 1976, all exhibits, animal purchases, much of the landscaping and many other improvements have been made possible by public support of the zoo and by the utilization of this fund.
WORK PROGRAM
Zoo improvements including major exhibit renovations, landscaping projects, animal acquisitions, plant acquisitions, and other physical plant projects are functions of the Zoo Building Fund work program. Funding capital projects and the implementation of the Zoo’s Master Plan are other im-portant aspects of the Zoo Building Fund work program. The Zoo Building Fund aids the development of naturalistic, emersion exhibits to create an exciting experience for zoo guests and for the welfare of the animals. Civic club projects and the ever-popular Summer Zoo Safari and Jr. Zookeeper programs are also accomplished by the use of this fund.
Ell
en
Tr
ou
t Z
oo
C
IT
Y
OF
L
UF
KI
N,
T
EX
AS
Description 2015-2016
Actual 2016-2017 Revised
2017-2018 Budget
This is a non-operational department
WORKLOAD INDICATORS & PERFORMANCE MEASURES
EXPENDITURES 2015-2016
Actual 2016-2017 Approved
2016-2017 Revised
2017-2018 Budget
Supplies 71,897 84,400 106,200 84,400
Maintenance of Equipment 145,391 139,200 221,100 135,400
Miscellaneous Services 36,782 29,900 61,805 34,800
Capital Outlay 543,846 - - -
Transfers 28,599 28,599 28,599 28,599
TOTAL 826,515 282,099 417,704 283,199
ZOO BUILDING FUND Fiscal Year
2018
AUTHORIZED POSITIONS 2015-2016
Actual 2016-2017 Approved
2016-2017 Revised
2017-2018 Budget
There are no positions assigned to this division.
FULL TIME
PART TIME
TOTAL
Page 246

MISSION
This is a designated fund within the Department of Mu-nicipal Court.
DESCRIPTION OF SERVICES PROVIDED
These funds are used to purchase security and technology improvements to the Court.
A seven dollar fee is collected on every traffic citation and on every state law and city ordi-nance violation filed in the court for this fund.
WORK PROGRAM
The technology portion of the fund is to be used exclusively to purchase or maintain computer systems, computer net-works, computer hardware, computer software, imaging systems, electronic kiosks, electronic ticket takers, and doc-ument management systems for Municipal Court.
The Security portion of the fund is to be used to finance items when used for the purpose of providing security ser-vices for the building housing the Municipal Court.
Mu
nic
ipa
l C
ou
rt
CI
TY
O
F
LU
FK
IN
,
TE
XA
S
Description 2015-2016
Actual 2016-2017 Revised
2017-2018 Budget
This is a non-operational department
WORKLOAD INDICATORS & PERFORMANCE MEASURES
EXPENDITURES 2015-2016
Actual 2016-2017 Approved
2016-2017 Revised
2017-2018 Budget
Supplies 2,989 4,405 5,105 5,460
Maintenance of Equipment 28,768 30,840 17,340 17,340
Miscellaneous Services 1,468 2,710 2,866 2,710
Transfers - - - -
TOTAL 33,225 37,955 25,311 25,510
COURT SECURITY / TECHNOLOGY FUND
Fiscal Year
2018
AUTHORIZED POSITIONS 2015-2016
Actual 2016-2017 Approved
2016-2017 Revised
2017-2018 Budget
There are no positions assigned to this division.
FULL TIME
PART TIME
TOTAL
Page 247

DIVISION: Technology
DIVISION DESCRIPTION
This portion of the Court Security/Technology Fund allows for the purchase of equipment, hardware and software for use within the Municipal Court.
Mu
nic
ipa
l C
ou
rt
/ T
ec
hn
olo
gy
C
IT
Y
OF
L
UF
KI
N,
T
EX
AS
COURT SECURITY / TECHNOLOGY FUND
EXPENDITURES 2015-2016
Actual 2016-2017 Approved
2016-2017 Revised
2017-2018 Budget
Supplies 324 950 950 -
Maintenance of Equipment 28,693 30,490 16,990 16,690
TOTAL 29,017 31,440 17,940 16,990
Fiscal Year
2018
AUTHORIZED POSITIONS 2015-2016
Actual 2016-2017 Approved
2016-2017 Revised
2017-2018 Budget
There are no positions assigned to this division.
FULL TIME
PART TIME
TOTAL
Page 248

DIVISION: Security
DIVISION DESCRIPTION
This division of the Court Security/Technology Fund allows for the expenditures related to the security of the Municipal Court including salaries, uniforms and benefits for a bailiff as well as security equipment and installation.
Mu
nic
ipa
l C
ou
rt
/ S
ec
ur
ity
C
IT
Y
OF
L
UF
KI
N,
T
EX
AS
COURT SECURITY / TECHNOLOGY FUND
EXPENDITURES 2015-2016
Actual 2016-2017 Approved
2016-2017 Revised
2017-2018 Budget
Supplies 2,663 3,455 4,155 5,460
Maintenance of Equipment 75 350 350 350
Miscellaneous Services 1,468 2,710 2,866 2,710
TOTAL 4,206 6,515 7,371 8,520
Fiscal Year
2018
AUTHORIZED POSITIONS 2015-2016
Actual 2016-2017 Approved
2016-2017 Revised
2017-2018 Budget
There are no positions assigned to this division.
FULL TIME
PART TIME
TOTAL
Page 249

MISSION
Non-departmental expenditures represent expendi-tures that are unique in nature, apply to the fund in total, or represent expenditures that apply to all departments.
DESCRIPTION OF SERVICES
This is a non-operational department established for the purpose of handling items that apply to the fund as a whole, not to specific individual depart-
ments. Items included as expenditures are bad debt expenses, software payments, and insurance.
No
n—
De
pa
rtm
en
tal
CI
TY
O
F
LU
FK
IN
,
TE
XA
S
COURT SECURITY / TECHNOLOGY FUND
EXPENDITURES 2015-2016
Actual 2016-2017 Approved
2016-2017 Revised
2017-2018 Budget
Transfers - - - -
TOTAL - - - -
Fiscal Year
2018
AUTHORIZED POSITIONS 2015-2016
Actual 2016-2017 Approved
2016-2017 Revised
2017-2018 Budget
There are no positions assigned to this division.
FULL TIME
PART TIME
TOTAL
Page 250

DESCRIPTION OF SERVICES
This is a non-operational department established for the purpose of handling items that apply to the fund as a whole, not to specific individual depart-ments.
Co
mm
un
ity
De
v/D
wn
twn
F
es
tiv
al
CI
TY
O
F
LU
FK
IN
,
TE
XA
S
Community Development/Downtown
EXPENDITURES 2015-2016
Actual 2016-2017 Approved
2016-2017 Revised
2017-2018 Budget
Supplies 5,245 6,200 6,200 5,450
Miscellaneous Services 9,675 11,500 11,500 14,000
TOTAL 14,920 17,700 17,700 19,450
Fiscal Year
2018
AUTHORIZED POSITIONS 2015-2016
Actual 2016-2017 Approved
2016-2017 Revised
2017-2018 Budget
There are no positions assigned to this division.
FULL TIME
PART TIME
TOTAL
Page 251

MISSION
This is a designated fund used exclusively for Animal Control.
DESCRIPTION OF SERVICES PROVIDED
The Kurth Grant Fund benefits the Animal Shelter in the purchase of supplies and equipment necessary for shelter operations. This benefits not only the citizens of Lufkin, but also all Angelina County citizens.
WORK PROGRAM
There is no work program associated with this fund.
The following items are budgeted in this department:
Transfer to General Fund $90,000
An
ima
l C
on
tro
l C
IT
Y
OF
L
UF
KI
N,
T
EX
AS
Description 2015-2016
Actual 2016-2017 Revised
2017-2018 Budget
This is a non-operational department.
EXPENDITURES 2015-2016
Actual 2016-2017 Approved
2016-2017 Revised
2017-2018 Budget
Miscellaneous Services - - - 40,000
Maintenance of Equipment 50,000 - - -
Transfers 191,520 145,000 145,000 90,000
TOTAL 241,520 145,000 145,000 130,000
ANIMAL CONTROL—KURTH GRANT FUND Fiscal Year
2018
AUTHORIZED POSITIONS 2015-2016
Actual 2016-2017 Approved
2016-2017 Revised
2017-2018 Budget
There are no positions assigned to this division.
FULL TIME
PART TIME
TOTAL
Page 252
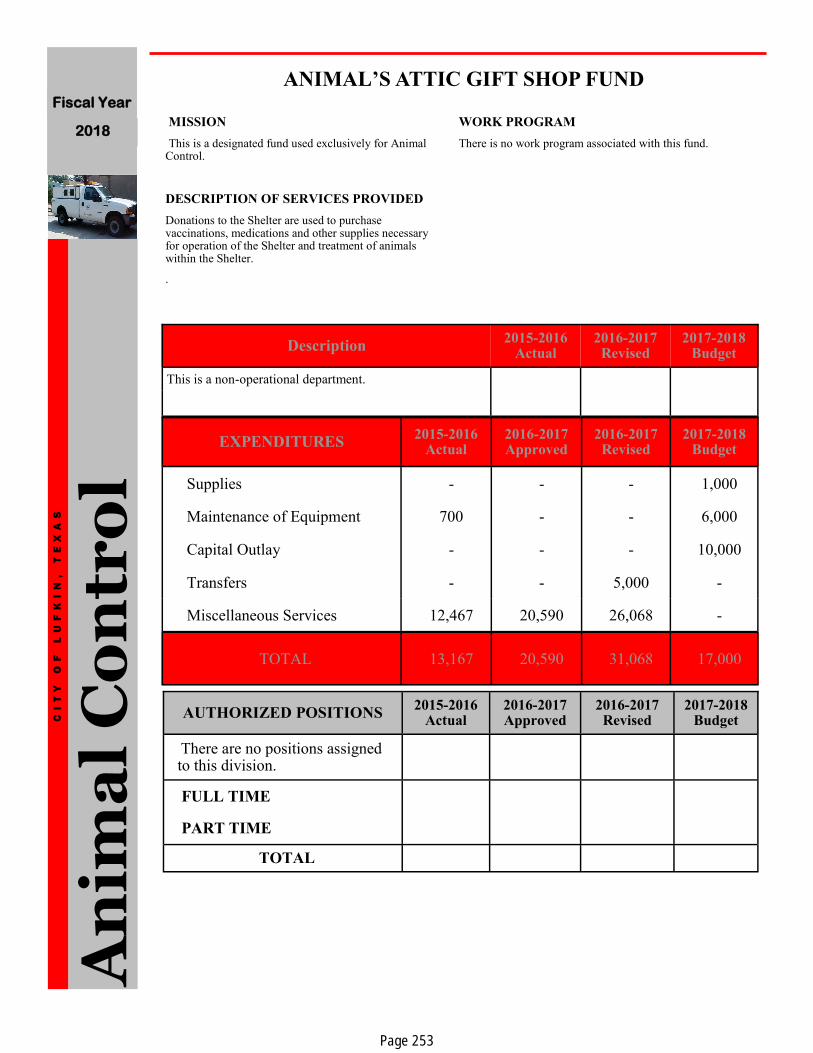
MISSION
This is a designated fund used exclusively for Animal Control.
DESCRIPTION OF SERVICES PROVIDED
Donations to the Shelter are used to purchase vaccinations, medications and other supplies necessary for operation of the Shelter and treatment of animals within the Shelter.
.
WORK PROGRAM
There is no work program associated with this fund.
An
ima
l C
on
tro
l
CI
TY
O
F
LU
FK
IN
,
TE
XA
S
Description 2015-2016
Actual 2016-2017 Revised
2017-2018 Budget
This is a non-operational department.
EXPENDITURES 2015-2016
Actual 2016-2017 Approved
2016-2017 Revised
2017-2018 Budget
Supplies - - - 1,000
Maintenance of Equipment 700 - - 6,000
Capital Outlay - - - 10,000
Transfers - - 5,000 -
Miscellaneous Services 12,467 20,590 26,068 -
TOTAL 13,167 20,590 31,068 17,000
ANIMAL’S ATTIC GIFT SHOP FUND Fiscal Year
2018
AUTHORIZED POSITIONS 2015-2016
Actual 2016-2017 Approved
2016-2017 Revised
2017-2018 Budget
There are no positions assigned to this division.
FULL TIME
PART TIME
TOTAL
Page 253

MISSION
This fund allows for the accumulation of the depreciation on equipment to allow for acquisition and / or replacement of equipment, vehicles and machinery except for those items with long life expectancy.
DESCRIPTION OF SERVICES PROVIDED
The Public Works Director coordinates with the participating departments to determine the equipment replacement schedules and estimated useful lives and estimated cost of equipment purchased. The disposal of equipment is coordinated with the City’s purchasing
department under the management of the Human Resources Department..
.
WORK PROGRAM
In fiscal year 2018, the City will continue analyzing the condition of equipment for replacement within the established guidelines. Adjustments will be made as necessary to provide the most efficient use of resources.
Eq
uip
me
nt
Am
or
tiz
ati
on
C
IT
Y
OF
L
UF
KI
N,
T
EX
AS
Description 2015-2016
Actual 2016-2017
Revised 2017-2018
Budget
This is a non-operational department.
EXPENDITURES 2015-2016
Actual 2016-2017 Approved
2016-2017 Revised
2017-2018 Budget
Supplies - 25,000 25,000 120,000
Miscellaneous Services 10,415 - - -
Capital Outlay 2,102,614 1,068,485 1,205,651 1,811,363
TOTAL 2,113,029 1,093,485 1,230,651 1,931,363
EQUIPMENT ACQUISITION AND REPLACEMENT FUND Fiscal Year
2018
AUTHORIZED POSITIONS 2015-2016
Actual 2016-2017 Approved
2016-2017 Revised
2017-2018 Budget
There are no positions assigned to this division.
FULL TIME
PART TIME
TOTAL
Page 254
CO
MP
ON
EN
T U
NIT
S
CI
TY
O
F
LU
FK
IN
,
TE
XA
S
COMPONENT UNITS
ECONOMIC DEVELOPMENT FUND– COMPONENT UNIT The Economic Development Fund is a discretely presented component unit that accounts for a portion of sales revenues designated for economic development projects.
LUFKIN CONVENTION AND VISITORS BUREAU – COMPONENT UNIT The Lufkin Convention and Visitor Bureau was formed in 2010 with the primary objective to create maximum hotel occupancy within the city through a marketing program aimed at attracting and securing overnight visitors who will spend money in the Lufkin area.
The governmental fund types are budgeted on a modified accrual basis wherein obligations of the City are budgeted as expenditures but revenues are recognized and recorded when they are available and become measurable.
Fiscal Year
2018
Page 255

Ec
on
om
ic D
ev
elo
pm
en
t C
or
p.
CI
TY
O
F
LU
FK
IN
,
TE
XA
S
ECONOMIC DEVELOPMENT FUND – COMPONENT UNIT
The Economic Development Fund accounts for a portion of revenues designated for economic development projects. This fund receives its revenue from a portion of the sales taxes collections received by the City and the funds are designated for the economic development and promotion of business within the City.
Fiscal Year
2018
Page 256
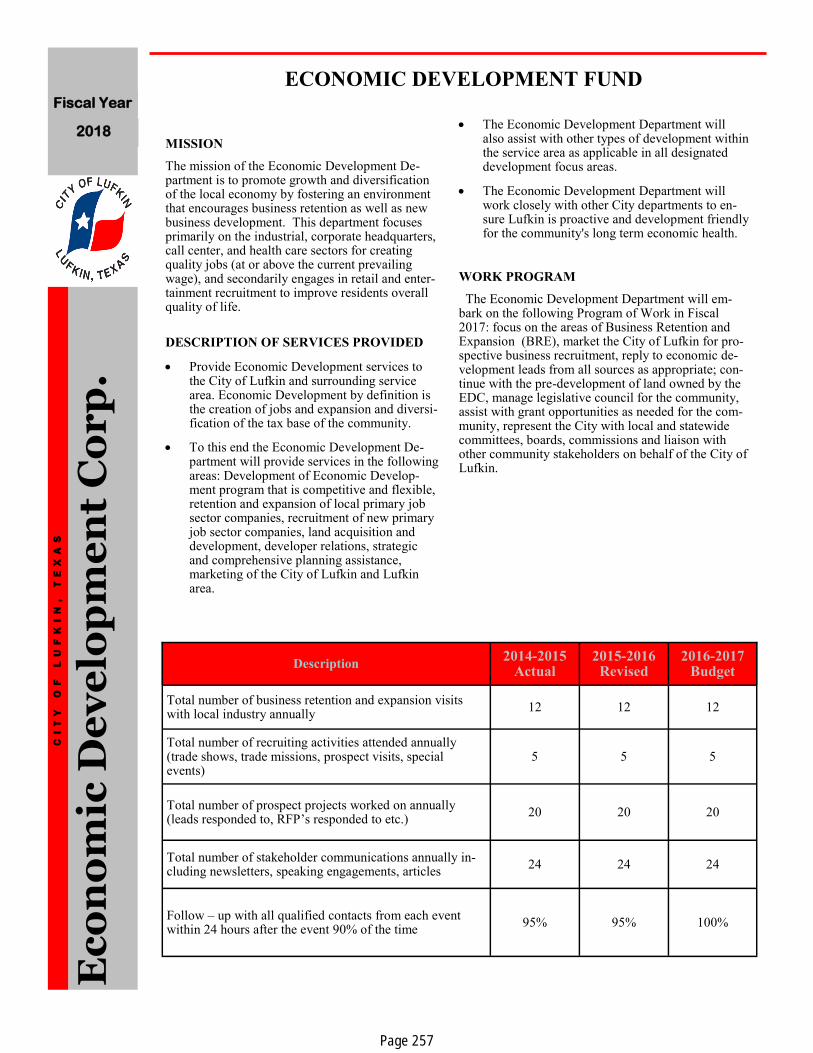
MISSION
The mission of the Economic Development De-partment is to promote growth and diversification of the local economy by fostering an environment that encourages business retention as well as new business development. This department focuses primarily on the industrial, corporate headquarters, call center, and health care sectors for creating quality jobs (at or above the current prevailing wage), and secondarily engages in retail and enter-tainment recruitment to improve residents overall quality of life.
DESCRIPTION OF SERVICES PROVIDED
Provide Economic Development services to the City of Lufkin and surrounding service area. Economic Development by definition is the creation of jobs and expansion and diversi-fication of the tax base of the community.
To this end the Economic Development De-partment will provide services in the following areas: Development of Economic Develop-ment program that is competitive and flexible, retention and expansion of local primary job sector companies, recruitment of new primary job sector companies, land acquisition and development, developer relations, strategic and comprehensive planning assistance, marketing of the City of Lufkin and Lufkin area.
The Economic Development Department will also assist with other types of development within the service area as applicable in all designated development focus areas.
The Economic Development Department will work closely with other City departments to en-sure Lufkin is proactive and development friendly for the community's long term economic health.
WORK PROGRAM
The Economic Development Department will em-bark on the following Program of Work in Fiscal 2017: focus on the areas of Business Retention and Expansion (BRE), market the City of Lufkin for pro-spective business recruitment, reply to economic de-velopment leads from all sources as appropriate; con-tinue with the pre-development of land owned by the EDC, manage legislative council for the community, assist with grant opportunities as needed for the com-munity, represent the City with local and statewide committees, boards, commissions and liaison with other community stakeholders on behalf of the City of Lufkin.
Ec
on
om
ic D
ev
elo
pm
en
t C
or
p.
CI
TY
O
F
LU
FK
IN
,
TE
XA
S
ECONOMIC DEVELOPMENT FUND Fiscal Year
2018
Description 2014-2015
Actual 2015-2016
Revised 2016-2017
Budget
Total number of business retention and expansion visits with local industry annually
12 12 12
Total number of recruiting activities attended annually (trade shows, trade missions, prospect visits, special events)
5 5 5
Total number of prospect projects worked on annually (leads responded to, RFP’s responded to etc.)
20 20 20
Total number of stakeholder communications annually in-cluding newsletters, speaking engagements, articles
24 24 24
Follow – up with all qualified contacts from each event within 24 hours after the event 90% of the time
95% 95% 100%
Page 257

DEPARTMENT Economic Development FUND Economic Development Fund
EXPENDITURES 2015-2016
Actual 2016-2017 Approved
2016-2017 Revised
2017-2018 Budget
Personnel Services 39,091 33,936 32,353 153,208
Benefits 35,374 22,853 21,457 58,518
Economic Development Incentives 632,000 564,000 664,000 738,000
Supplies 6,748 14,750 9,750 10,440
Miscellaneous Services 185,710 184,345 234,705 242,635
Capital Outlay - - 235,184 -
Transfers - 174,875 494,875 -
Debt Service 45,436 185,478 185,478 185,479
Sundry Charges 32,700 30,510 30,510 34,330
TOTAL 977,059 1,210,747 1,908,312 1,422,610
AUTHORIZED POSITIONS
Director of Economic Development 1 1 1 1
Clerk Senior Level 1 1 1 1
FULL TIME 2 2 2 2
PART TIME 0 0 0 0
TOTAL 2 2 2 2
SIGNIFICANT CHANGES
2015-2016 Actual
2016-2017 Approved
2016-2017 Revised
2017-2018 Budget
Page 258

MISSION
Non-Departmental expenditures represent expendi-tures that are unique in nature, apply to the fund in total, or represent expenditures that apply to all departments.
DESCRIPTION OF SERVICES PROVIDED
This is a non-operational department established for the purpose of handling items that apply to the fund as a whole, not to specific individual depart-ments. Items included as expenditures are bad debt expenses, liability and unemployment insurance.
WORK PROGRAM
Continue providing accurate estimates for items budg-eted in this department.
Non-departmental budget includes the following item:
Personnel Services $
Insurance $ 2,600
General and Administrative Charges $ 15,330
Debt Service $185,479
Ec
on
om
ic D
ev
elo
pm
en
t /
No
n-d
ep
ar
tme
nta
l
CI
TY
O
F
LU
FK
IN
,
TE
XA
S
EXPENDITURES 2015-2016
Actual 2016-2017 Approved
2016-2017 Revised
2017-2018 Budget
Personnel Services - 790 - -
Miscellaneous Services 10,375 2,600 - 2,600
Sundry Charges 13,700 11,510 11,510 15,330
Transfers - 174,875 494,875 -
Debt Service 45,436 185,478 185,478 185,479
TOTAL 69,511 375,253 691,863 203,409
ECONOMIC DEVELOPMENT FUND Fiscal Year
2018
AUTHORIZED POSITIONS
There are no positions assigned to this division.
FULL TIME
PART TIME
TOTAL
2015-2016 Actual
2016-2017 Approved
2016-2017 Revised
2017-2018 Budget
Page 259

MISSION
The primary objective of the Lufkin Convention and Visitors Bureau (LCVB) is to create maximum hotel occupancy within the city through a market-ing program aimed at attracting and securing over-night visitors who will spend money in the Lufkin area.
DESCRIPTION OF SERVICES PROVIDED
The LCVB will promote the city, attract meet-ings, bring convention and tourism business to the community.
The LCVB will enhance the growth and de-velopment of Lufkin and Angelina County by increasing visitor and convention business.
The LCVB will contribute to the identity and economic well being of Lufkin.
The LCVB will take a leadership role with the community and business partners to provide an outstanding visitor experience. We will create and maintain up to date brochures and other materials relative to the hospitality in-dustry.
The LCVB will participate in trade shows and travel industry activities designed to reach consumers and meeting planners.
The LCVB will coordinate services for groups which may include any or all of the following:
registration assistance, name badges, promotional items, welcome bags, city tours and other activi-ties.
WORK PROGRAM
Lufkin Convention and Visitor Bureau (LCVB) will continue the tabletop advertising campaign in addition to utilizing social media and national magazines such as Texas Parks and Wildlife, Texas Highways and Texas Monthly to get the word out that Lufkin, Texas is a great place to visit in efforts to increase tourism business to the community.
LCVB will also continue to sponsor events that en-hance the tourism industry such as the angling CAST tournament; and recreational activities such as the Pineywoods Purgatory and Neches River Rendezvous that have participation rates from outside the county of 50% or more.
LCVB will also be actively soliciting convention busi-ness and supplying local hotels/motels with visitor’s guides and maps of the area attractions.
LCVB will continue to build on annual events such as Lufkin’s Bistro, Corks and Forks, Angelina County AirFest, Yule Love Lufkin, among others and reach out to outlying areas to bring visitors to the communi-ty for these events.
Lu
fkin
Co
nv
en
tio
n &
Vis
ito
rs
Bu
re
au
CI
TY
O
F
LU
FK
IN
,
TE
XA
S
Description
Total number of events promoted 70 80 80
Total number of events promoted with greater than 50% participation from outside the county.
20 20 19
Promote events that have a participation rate from outside the county 75% of the time
15 15 19
Total number of advertising campaigns completed within the fiscal year
10 12 14
Total number of advertising campaigns with a 20% re-sponse rate
7 8 9
Complete advertising campaigns with a 20% response rate 75% of the time
7 7 9
LUFKIN CONVENTION & VISITORS BUREAU FUND Fiscal Year
2018
2015-2016 Actual
2016-2017 Revised
2017-2018 Budget
Page 260

DEPARTMENT Lufkin Convention & Visitors Bureau FUND Lufkin Convention & Visitors Bureau
EXPENDITURES 2015-2016
Actual 2016-2017 Approved
2016-2017 Revised
2017-2018 Budget
Personnel Services 108,356 112,967 112,430 197,664
Benefits 44,555 43,387 43,970 45,551
Supplies 4,924 8,250 6,050 7,756
Sundry 1,330 1,780 1,780 3,640
Miscellaneous Services 251,150 313,100 300,650 342,685
TOTAL 410,315 479,484 464,880 597,296
AUTHORIZED POSITIONS
LCVB Director 1 1 1 1
Clerk Senior Level 1 1 1 1
FULL TIME 2 2 2 2
PART TIME 0 0 0 0
TOTAL 2 2 2 2 SIGNIFICANT CHANGES
2015-2016 Actual
2016-2017 Approved
2016-2017 Revised
2017-2018 Budget
Page 261

MISSION
Non-Departmental expenditures represent expendi-tures that are unique in nature, apply to the fund in total, or represent expenditures that apply to all departments.
DESCRIPTION OF SERVICES PROVIDED
This is a non-operational department established for the purpose of handling items that apply to the fund as a whole, not to specific individual depart-ments. Items included as expenditures general and administrative expenses and contingency.
WORK PROGRAM
Continue providing accurate estimates for items budg-eted in this department.
Non-departmental budget includes the following item:
General and Administrative Charges $ 2,690
Contingency requiring Board Approval $100,000
Lu
fkin
Co
nv
en
tio
n &
Vis
ito
r B
ur
ea
u /
No
n-d
ep
ar
tme
nta
l
CI
TY
O
F
LU
FK
IN
,
TE
XA
S
Description 2015-2016
Actual 2016-2017 Revised
2017-2018 Budget
This is a non operational department and does not have performance measures.
EXPENDITURES 2015-2016
Actual 2016-2017 Approved
2016-2017 Revised
2017-2018 Budget
Personnel Services - 2,637 - 951
Miscellaneous Services - 100,000 50,000 100,000
Sundry Charges 1,330 1,780 1,780 2,690
TOTAL 1,330 104,417 51,780 103,641
LUFKIN CONVENTION & VISITORS BUREAU FUND Fiscal Year
2018
AUTHORIZED POSITIONS 2015-2016
Actual 2016-2017 Approved
2016-2017 Revised
2017-2018 Budget
There are no positions assigned to this division.
FULL TIME
PART TIME
TOTAL
Page 262
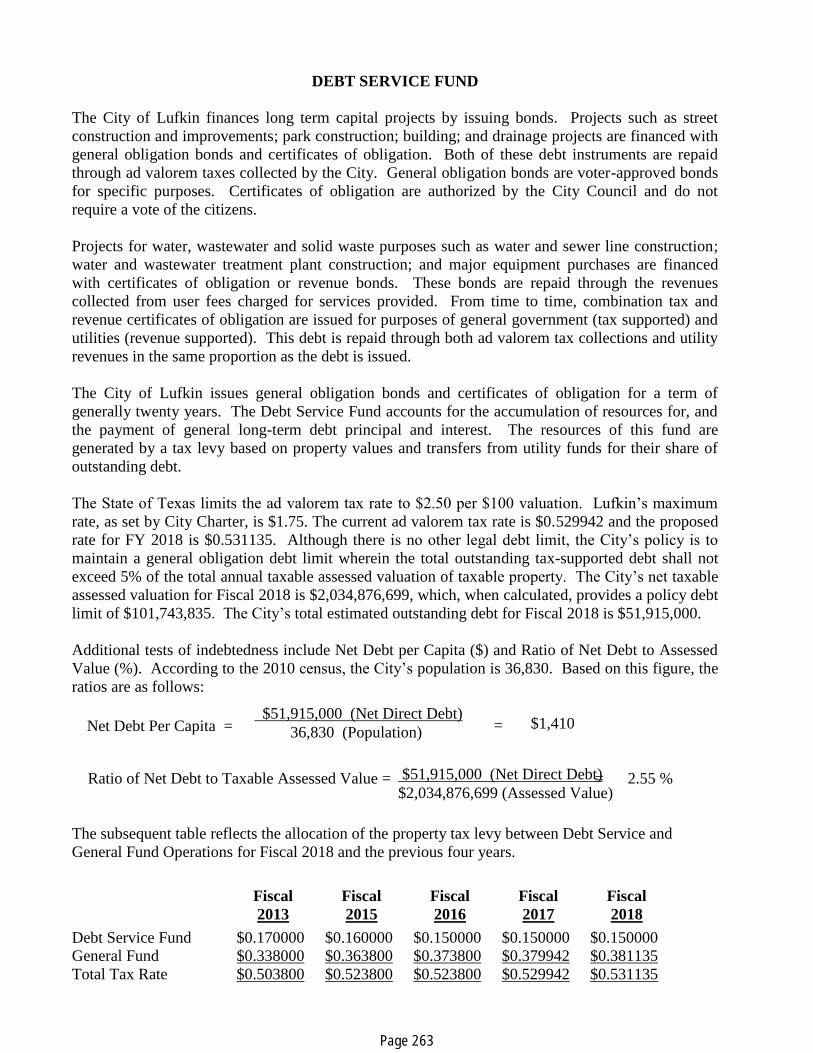
DEBT SERVICE FUND
The City of Lufkin finances long term capital projects by issuing bonds. Projects such as street
construction and improvements; park construction; building; and drainage projects are financed with
general obligation bonds and certificates of obligation. Both of these debt instruments are repaid
through ad valorem taxes collected by the City. General obligation bonds are voter-approved bonds
for specific purposes. Certificates of obligation are authorized by the City Council and do not
require a vote of the citizens.
Projects for water, wastewater and solid waste purposes such as water and sewer line construction;
water and wastewater treatment plant construction; and major equipment purchases are financed
with certificates of obligation or revenue bonds. These bonds are repaid through the revenues
collected from user fees charged for services provided. From time to time, combination tax and
revenue certificates of obligation are issued for purposes of general government (tax supported) and
utilities (revenue supported). This debt is repaid through both ad valorem tax collections and utility
revenues in the same proportion as the debt is issued.
The City of Lufkin issues general obligation bonds and certificates of obligation for a term of
generally twenty years. The Debt Service Fund accounts for the accumulation of resources for, and
the payment of general long-term debt principal and interest. The resources of this fund are
generated by a tax levy based on property values and transfers from utility funds for their share of
outstanding debt.
The State of Texas limits the ad valorem tax rate to $2.50 per $100 valuation. Lufkin’s maximum
rate, as set by City Charter, is $1.75. The current ad valorem tax rate is $0.529942 and the proposed
rate for FY 2018 is $0.531135. Although there is no other legal debt limit, the City’s policy is to
maintain a general obligation debt limit wherein the total outstanding tax-supported debt shall not
exceed 5% of the total annual taxable assessed valuation of taxable property. The City’s net taxable
assessed valuation for Fiscal 2018 is $2,034,876,699, which, when calculated, provides a policy debt
limit of $101,743,835. The City’s total estimated outstanding debt for Fiscal 2018 is $51,915,000.
Additional tests of indebtedness include Net Debt per Capita ($) and Ratio of Net Debt to Assessed
Value (%). According to the 2010 census, the City’s population is 36,830. Based on this figure, the
ratios are as follows:
$1,410
Ratio of Net Debt to Taxable Assessed Value = = 2.55 %
The subsequent table reflects the allocation of the property tax levy between Debt Service and
General Fund Operations for Fiscal 2018 and the previous four years.
Fiscal
2013
Fiscal
2015
Fiscal
2016
Fiscal
2017
Fiscal
2018
Debt Service Fund $0.170000 $0.160000 $0.150000 $0.150000 $0.150000
General Fund $0.338000 $0.363800 $0.373800 $0.379942 $0.381135
Total Tax Rate $0.503800 $0.523800 $0.523800 $0.529942 $0.531135
Net Debt Per Capita = $51,915,000 (Net Direct Debt)
36,830 (Population) =
$51,915,000 (Net Direct Debt)
$2,034,876,699 (Assessed Value)
Page 263

The steady increase in taxable value related to both property reappraisals and new construction value
additions has allowed the City to maintain a stable tax rate with minimal increases. A tax increase of
¾ cent as well as a shift of one cent from the operating and maintenance portion of the tax rate to
debt service was included in the Fiscal 2000 budget to fund the 1999 Capital Improvements
Program. In May 2001, citizens approved a $7,686,322 Street Bond Program (2001 Street Bond
Program) that required a 6.4-cent tax increase to fund. As a result, tax increases of 2.2 cents per year
in Fiscal 2002 and 2003 have been approved in the debt service portion of the tax rate. The third,
and final, increase was included in Fiscal 2004 and amounted to a 2-cent increase. In Fiscal 2010
the effective tax rate was adopted reducing the tax rate by 2.16 cents. For Fiscal 2011 an additional
2.0 cent reduction was implemented, and in Fiscal 2013 a 1-cent reduction further offsets the
increases imposed by the Street Bond Program. In Fiscal 2015 a 2-cent increase and a shift of 1-cent
from I&S to M&O was be implemented to make changes in the pay scales of the Police and Fire
Departments. In Fiscal 2016 an additional 1-cent shift from I&S to M&O has allowed the City to
prepare for possible downturns in the local economy, associated with the downsizing and potential
closing of a local industry. No adjustments are planned for Fiscal 2018.
Council adopted a Continuing Capital Improvements Program (CIP) in the fall of 1999 to be
financed with Certificates of Obligation (CO). Four bond issues have been sold; one in Fiscal 2000
for $4,400,000, a second in Fiscal 2002 for $9,450,000, and a third in September 2003 for
$1,700,000, and a fourth in Fiscal 2004 for $8,200,000 and a final issue of $7,610,000 in June 2007.
A new Capital Improvements Program (CIP) was developed and implementation began during
FY2010. The second phase began in FY 2013 with a bond issue of $7,100,000.
Debt Service Fund is used to account for the accumulation of revenues, i.e. ad valorem taxes and
interest income, for the payment of principal and interest on general long-term debt. The first
schedule, on page 264 reflects the City’s Debt Service Fund. The fund balance in the Debt Service
Fund is maintained so that funds can be accumulated to pay the City’s general long-term debt
obligations with a minimum impact on the tax rate. Consequently, the amount remaining in the fund
balance will vary from year to year with the bond financing activity of the City. The minimum fund
balance goal to be maintained by the City is 10% of debt service for that year.
The tables, on pages 265-275, detail the Debt Service Fund and each current outstanding bond issue
that is owed by the City. The tables show the date of issue, the years remaining on the payment
schedule, and the amount of principal and interest due in each year. The first debt service table is a
summary of all outstanding issues.
REVENUE BOND DEBT SERVICE
Revenue bond debt service is paid from the revenues of the Utility System. Standard and Poor’s and
Moody’s Investment Service have rated the City’s Certificate of Obligation bonds AA- and A1,
respectively. Total outstanding debt at October 1, 2017 is $51,915,000.
The City entered into agreements with the Army Corps of Engineers in 1970 and 1976 to purchase
surface water for present and future water supply rights from Lake Sam Rayburn. The 1970
agreement included the purchase of 18,000 acre-feet of water from the Corps at a cost of $220,000.
The purchase price, financed by a note payable, spans a period of over 50 years at 2.591% interest.
As of January 1, 2014 the City had repaid $184,327. The balance of $14,820 is scheduled for
payment, in full, on January 1, 2019. The second agreement entered into with the Corps was for the
Page 264

purchase of 25,000 acre-feet of water. The total cost of this purchase was $305,600 to be repaid
over a 40-year period at an interest rate of 2.591%. This note has been paid in full.
The Texas Commission on Environmental Quality (TCEQ) has sanctioned the City to replace
approximately 54 miles of asbestos cement water pipe. This project was expected to take six years
to complete at a cost of approximately $16.0 million. The City has received approval from the
Texas Water Development Board (TWDB) for a $16.0 million loan with which to replace these
lines. The loan takes the form of a bond issue, which the TWDB sells. The City draws on these
funds at regular intervals, at which time interest begins to accrue on the drawn funds. The first draw
was dated November 1, 2000 in the amount of $715,000. Draw #2, dated July 2002, amounted to
$1,960,000; draw #3, filed with the TWDB in September 2002 amounted to $1,600,000; draw #4,
dated May 2003 for $1,835,000; draw #5, dated December 2003 for $1,210,000; draw #6, dated
December 2004 for $845,000; draw #7, dated April 2006 for $1,065,000; draw #8, dated December
2006 for $2,660,000; draw #9, dated March 2007 for $1,065,000, draw #10, dated April 2008 for
$1,075,000 and draw #11 dated August 2009 for $1,215,000. Draw #11 completed funding for the
water line replacement project. In Fiscal 2011 these bonds were refunded as part of the 2010
General Obligation Refunding Bonds.
The CIP includes approximately $6.8 million of water and sewer projects. These projects are
financed with combination tax and revenue certificates of obligation. This debt is reflected in the
General Obligation Debt Service Fund as part of the tax supported debt; however, funds from the
Water/Wastewater Utility are transferred to the Debt Service Fund each year to cover the debt
service associated with any revenue-supported projects. Consequently, of the $9.75 million issued in
Fiscal 2002, $1.9 million was for water and wastewater projects. In Fiscal 2004, $8.2 million was
issued with $2.2 million for water and wastewater projects and in Fiscal 2007, $5.87 million was
issued with $1.21 million for water and wastewater projects. This was the final issue for the CIP.
The amount to be transferred to the Debt Service Fund in Fiscal 2014 is $3,786,264. During Fiscal
2009, the City issued $17.4 million Certificates of Obligation in addition to using $3 million of
accumulated Water/Wastewater reserve funds to purchase Kurth Lake, Abitibi water well field and
fund various sewer projects totaling approximately $5 million as required by TCEQ. In Fiscal 2014
an issue of $5,100,000 was made in certificates of obligation to complete the I&I projects.
The tables relating to Revenue Bond debt on page 276 include information on the two outstanding
notes payable owed by the City. The tables reflect the date of issue, the years remaining on the
payment schedule, and the amount of principal and interest due in each year.
Page 265

FY2016 FY2017 FY2017 FY2018
Actual Budget Adjusted Budget
Beginning Balance 1,811,937$ 1,268,478$ 1,406,542$ 1,806,925$
Revenues
Current year collections 2,987,208 3,052,312 3,049,812 3,044,518
Interest income 18,183 8,000 11,000 10,000
Other-Transfer
fromWater/Wastewater Fund3,129,448 3,246,467 3,778,005 3,546,645
Other-Transfer from Solid
Waste/Recycling Fund55,000 58,400 58,400 56,200
Other Revenue 13,447 - - (11,745)
Other financing sources-proceeds 9,871,035 - - -
Total Revenues 16,074,321 6,365,179 6,897,217 6,645,618
Total Funds Available 17,886,258$ 7,633,657$ 8,303,759$ 8,452,543$
Expenditures
Principal payments 4,535,000$ 4,695,000$ 4,685,000$ 5,020,000$
Interest payments 1,916,340 1,822,559 1,802,834 1,657,084
Debt service fees 135,750 9,000 9,000 6,350
Other Financing Uses 9,892,626 - - -
Total Expenditures 16,479,716 6,526,559 6,496,834 6,683,434
Excess(deficiency) of revenues
over expenditures (405,395) (161,380) 400,383 (37,816)
Fund balance ending 1,406,542 1,107,098 1,806,925 1,769,109
Total Funds Applied 17,886,258$ 7,633,657$ 8,303,759$ 8,452,543$
CITY OF LUFKIN
DEBT SERVICE FUND
Fiscal 2018 Operating Budget
Page 266

Principal Paying
Outstanding Agent
Issue Purpose 10/1/2017 Principal Interest Fees Total
2009 C.O./Utility Improvements 7,175,000 820,763 671,150 6,750 8,673,663
2010 C.O. Improvements 7,115,000 1,156,900 1,156,900 10,500 9,439,300
2010 G.O. Refunding Bond 4,810,000 236,400 236,400 3,000 5,285,800
2011 G.O. Refunding Bond 4,935,000 162,235 162,235 5,250 5,264,720
2012 C.O. Improvements 5,900,000 551,972 551,972 8,800 7,012,744
2013 C.O. Improvements 4,250,000 643,153 673,153 8,800 5,575,106
2014 G.O. Refunding Bond 4,085,000 274,000 274,000 6,000 4,639,000
2015 G.O. Refunding Bond 4,900,000 437,325 437,325 7,500 5,782,150
2016 G.O. Refunding Bond 8,745,000 1,537,675 1,390,700 12,750 11,686,125
Total $51,915,000 $5,820,423 $5,553,835 $69,350 $63,358,608
GENERAL OBLIGATION BONDS
DEBT REQUIREMENTS
SUMMARY
Fiscal 2018 Operating Budget
Requirements for Fiscal 2018
Page 267
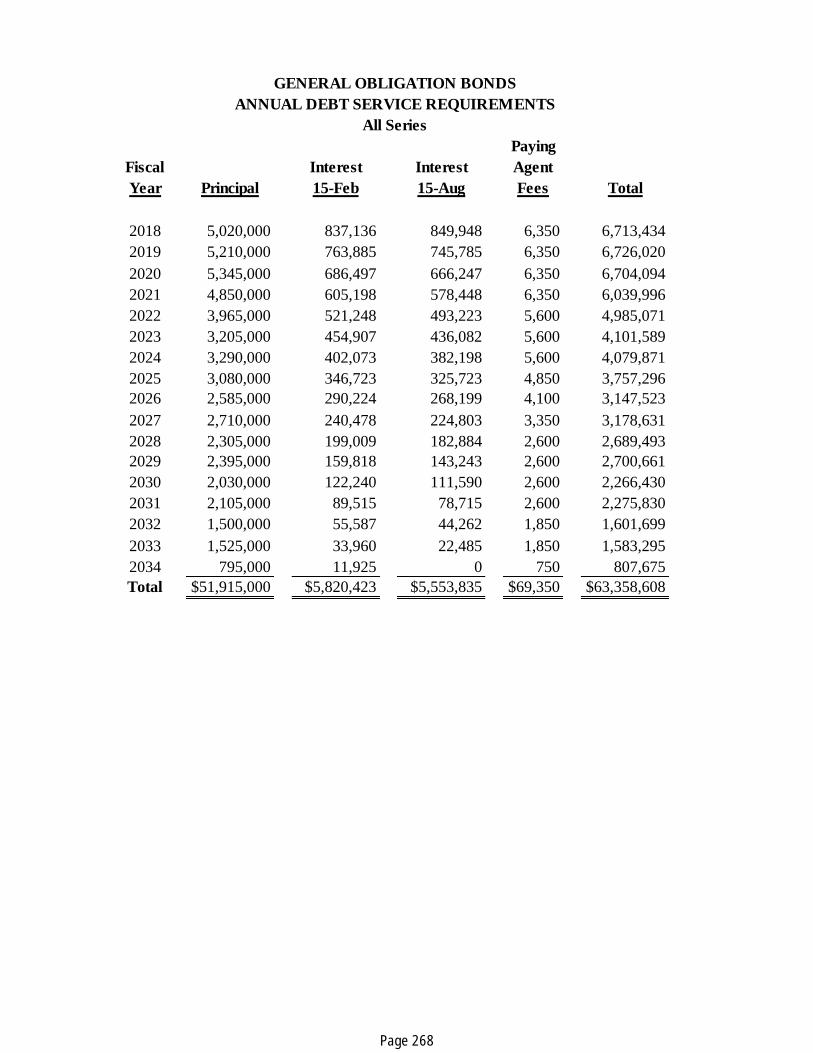
Paying
Fiscal Interest Interest Agent
Year Principal 15-Feb 15-Aug Fees Total
2018 5,020,000 837,136 849,948 6,350 6,713,434
2019 5,210,000 763,885 745,785 6,350 6,726,020
2020 5,345,000 686,497 666,247 6,350 6,704,094
2021 4,850,000 605,198 578,448 6,350 6,039,996
2022 3,965,000 521,248 493,223 5,600 4,985,071
2023 3,205,000 454,907 436,082 5,600 4,101,589
2024 3,290,000 402,073 382,198 5,600 4,079,871
2025 3,080,000 346,723 325,723 4,850 3,757,296
2026 2,585,000 290,224 268,199 4,100 3,147,523
2027 2,710,000 240,478 224,803 3,350 3,178,631
2028 2,305,000 199,009 182,884 2,600 2,689,493
2029 2,395,000 159,818 143,243 2,600 2,700,661
2030 2,030,000 122,240 111,590 2,600 2,266,430
2031 2,105,000 89,515 78,715 2,600 2,275,830
2032 1,500,000 55,587 44,262 1,850 1,601,699
2033 1,525,000 33,960 22,485 1,850 1,583,295
2034 795,000 11,925 0 750 807,675
Total $51,915,000 $5,820,423 $5,553,835 $69,350 $63,358,608
GENERAL OBLIGATION BONDS
ANNUAL DEBT SERVICE REQUIREMENTS
All Series
Page 268

Paying
Fiscal Interest Interest Agent
Year Principal 15-Feb 15-Aug Fees Total
2018 675,000 149,613 137,800 750 963,163
2019 700,000 137,800 125,200 750 963,750
2020 725,000 125,200 110,700 750 961,650
2021 775,000 110,700 95,200 750 981,650
2022 800,000 95,200 78,800 750 974,750
2023 825,000 78,800 60,650 750 965,200
2024 850,000 60,650 41,525 750 952,925
2025 900,000 41,525 21,275 750 963,550
2026 925,000 21,275 - 750 947,025
Totals $7,175,000 $820,763 $671,150 $6,750 $8,673,663
SCHEDULE OF REQUIREMENTS
CERTIFICATES OF OBLIGATION BONDS
Original Issue: $ 17,400,000
Interest Rate: 4.62%
Series 2009
Dated: March 12, 2009
DEBT SERVICE
Page 269

Paying
Fiscal Interest Interest Agent
Year Principal 15-Feb 15-Aug Fees Total
2018 390,000 142,300 142,300 750 675,350
2019 405,000 134,500 134,500 750 674,750
2020 425,000 126,400 126,400 750 678,550
2021 435,000 117,900 117,900 750 671,550
2022 455,000 109,200 109,200 750 674,150
2023 470,000 100,100 100,100 750 670,950
2024 495,000 90,700 90,700 750 677,150
2025 515,000 80,800 80,800 750 677,350
2026 530,000 70,500 70,500 750 671,750
2027 555,000 59,900 59,900 750 675,550
2028 570,000 48,800 48,800 750 668,350
2029 600,000 37,400 37,400 750 675,550
2030 620,000 25,400 25,400 750 671,550
2031 650,000 13,000 13,000 750 676,750
Totals $7,115,000 $1,156,900 $1,156,900 $10,500 $9,439,300
Original Issue: $ 9,145,000
Interest Rate: 2.0 - 4.0%
DEBT SERVICE
SCHEDULE OF REQUIREMENTS
CERTIFICATES OF OBLIGATION BONDS
Series 2010
Dated: November 15, 2010
Page 270

Paying
Fiscal Interest Interest Agent
Year Principal 15-Feb 15-Aug Fees Total
2018 1,195,000 96,200 96,200 750 1,388,150
2019 1,260,000 72,300 72,300 750 1,405,350
2020 1,315,000 47,100 47,100 750 1,409,950
2021 1,040,000 20,800 20,800 750 1,082,350
Totals $4,810,000 $236,400 $236,400 $3,000 $5,285,800
DEBT SERVICE
SCHEDULE OF REQUIREMENTS
GENERAL OBLIGATION REFUNDING BONDS
Series 2010
Dated: November 15, 2010
Original Issue: $12,130,000
Interest Rate: 2.0 - 4.0%
Page 271
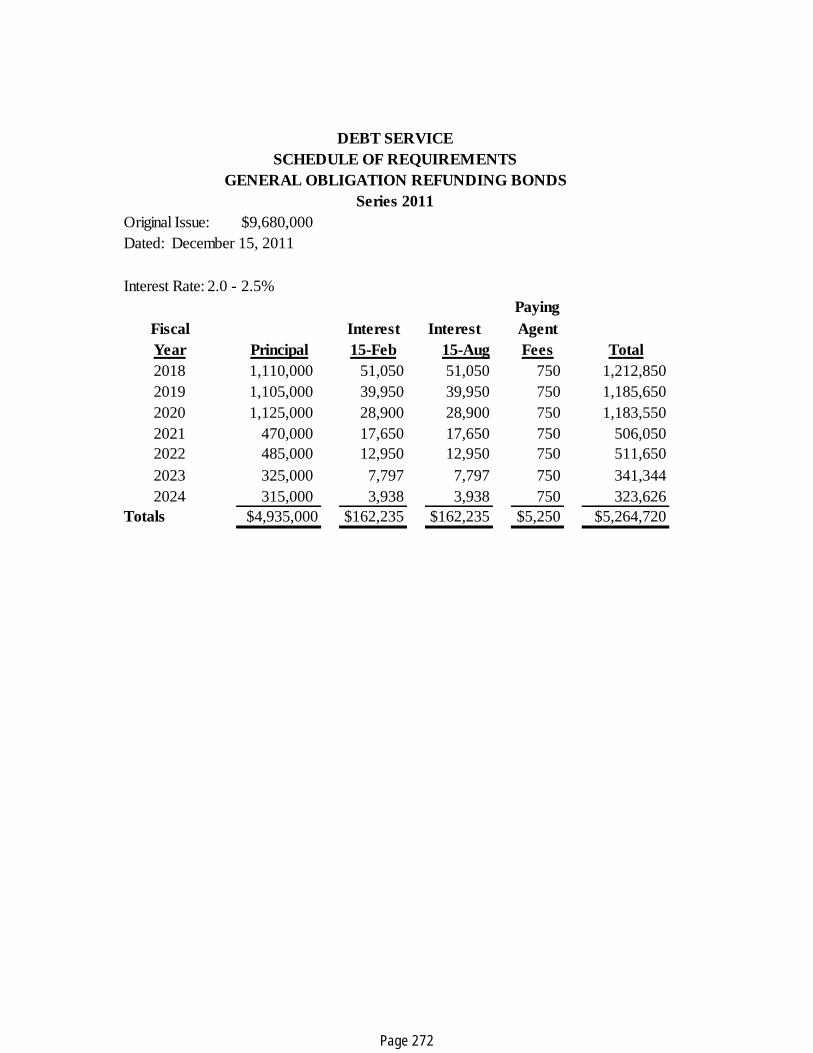
Original Issue: $9,680,000
Paying
Fiscal Interest Interest Agent
Year Principal 15-Feb 15-Aug Fees Total
2018 1,110,000 51,050 51,050 750 1,212,850
2019 1,105,000 39,950 39,950 750 1,185,650
2020 1,125,000 28,900 28,900 750 1,183,550
2021 470,000 17,650 17,650 750 506,050
2022 485,000 12,950 12,950 750 511,650
2023 325,000 7,797 7,797 750 341,344
2024 315,000 3,938 3,938 750 323,626
Totals $4,935,000 $162,235 $162,235 $5,250 $5,264,720
DEBT SERVICE
GENERAL OBLIGATION REFUNDING BONDS
Interest Rate: 2.0 - 2.5%
SCHEDULE OF REQUIREMENTS
Series 2011
Dated: December 15, 2011
Page 272

Paying
Fiscal Interest Interest Agent
Year Principal 15-Feb 15-Aug Fees Total
2018 325,000 57,844 57,844 550 441,238
2019 325,000 56,219 56,219 550 437,988
2020 325,000 53,781 53,781 550 433,112
2021 325,000 51,344 51,344 550 428,238
2022 350,000 48,094 48,094 550 446,738
2023 350,000 44,594 44,594 550 439,738
2024 350,000 41,094 41,094 550 432,738
2025 350,000 37,594 37,594 550 425,738
2026 375,000 34,094 34,094 550 443,738
2027 375,000 30,344 30,344 550 436,238
2028 375,000 26,594 26,594 550 428,738
2029 400,000 22,844 22,844 550 446,238
2030 400,000 18,844 18,844 550 438,238
2031 425,000 14,344 14,344 550 454,238
2032 425,000 9,563 9,563 550 444,676
2033 425,000 4,781 4,781 550 435,112
Totals $5,900,000 $551,972 $551,972 $8,800 $7,012,744
Interest Rate: 2.0 - 4.0%
DEBT SERVICE
SCHEDULE OF REQUIREMENTS
CERTIFICATES OF OBLIGATION BONDS
Series 2012
Original Issue: $7,100,000
Dated: December 15, 2012
Page 273

Paying
Fiscal Interest Interest Agent
Year Principal 15-Feb 15-Aug Fees Total
2018 215,000 65,954 95,954 550 377,458
2019 220,000 63,266 63,266 550 347,082
2020 225,000 60,516 60,516 550 346,582
2021 230,000 57,704 57,704 550 345,958
2022 235,000 54,829 54,829 550 345,208
2023 240,000 51,891 51,891 550 344,332
2024 250,000 48,891 48,891 550 348,332
2025 255,000 45,454 45,454 550 346,458
2026 265,000 41,055 41,055 550 347,660
2027 275,000 36,484 36,484 550 348,518
2028 285,000 34,740 34,740 550 355,030
2029 290,000 26,824 26,824 550 344,198
2030 300,000 21,821 21,821 550 344,192
2031 310,000 16,646 16,646 550 343,842
2032 320,000 11,299 11,299 550 343,148
2033 335,000 5,779 5,779 550 347,108
Totals $4,250,000 $643,153 $673,153 $8,800 $5,575,106
Interest Rate: 2.5 - 3.45%
DEBT SERVICE
SCHEDULE OF REQUIREMENTS
CERTIFICATES OF OBLIGATION BONDS
Series 2013
Original Issue: $5,100,000
Dated: December 31, 2013
Page 274
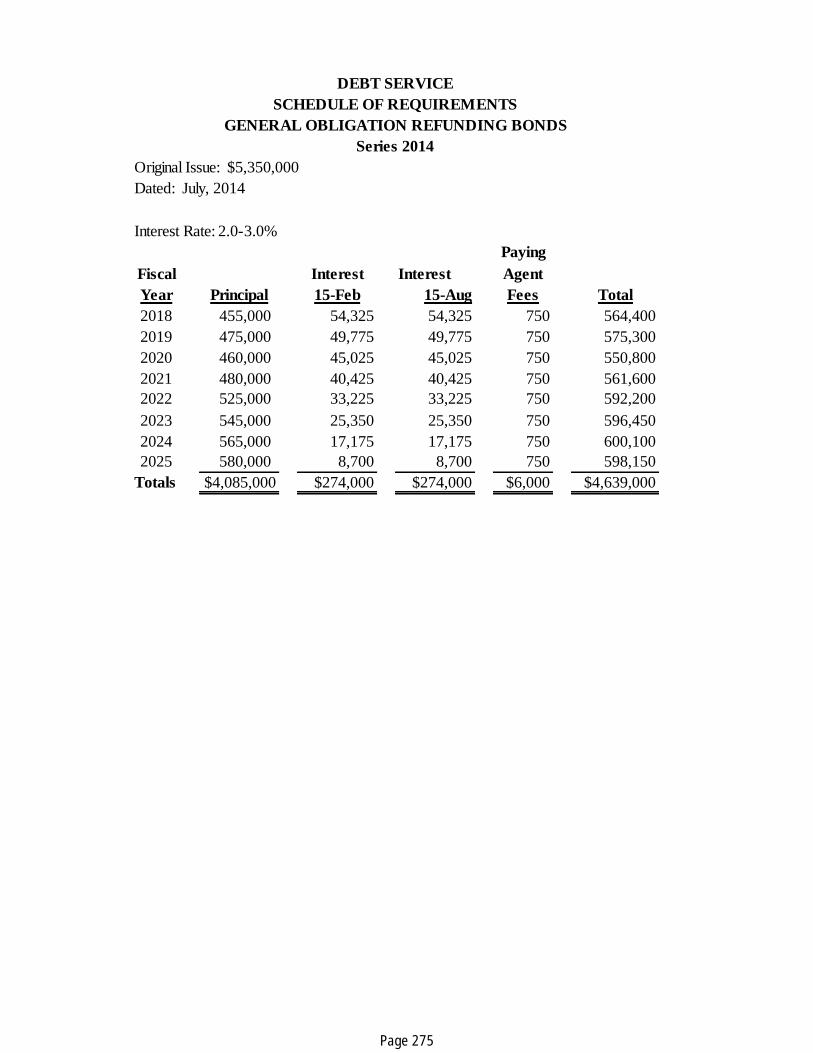
Paying
Fiscal Interest Interest Agent
Year Principal 15-Feb 15-Aug Fees Total
2018 455,000 54,325 54,325 750 564,400
2019 475,000 49,775 49,775 750 575,300
2020 460,000 45,025 45,025 750 550,800
2021 480,000 40,425 40,425 750 561,600
2022 525,000 33,225 33,225 750 592,200
2023 545,000 25,350 25,350 750 596,450
2024 565,000 17,175 17,175 750 600,100
2025 580,000 8,700 8,700 750 598,150
Totals $4,085,000 $274,000 $274,000 $6,000 $4,639,000
DEBT SERVICE
SCHEDULE OF REQUIREMENTS
GENERAL OBLIGATION REFUNDING BONDS
Series 2014
Original Issue: $5,350,000
Dated: July, 2014
Interest Rate: 2.0-3.0%
Page 275

Paying
Fiscal Interest Interest Agent
Year Principal 15-Feb 15-Aug Fees Total
2018 440,000 72,875 72,875 750 586,500
2019 500,000 68,475 68,475 750 637,700
2020 515,000 63,475 63,475 750 642,700
2021 645,000 58,325 58,325 750 762,400
2022 650,000 48,650 48,650 750 748,050
2023 405,000 38,900 38,900 750 483,550
2024 415,000 32,825 32,825 750 481,400
2025 430,000 26,600 26,600 750 483,950
2026 440,000 18,000 18,000 750 476,750
2027 460,000 9,200 9,200 750 479,150
Totals $4,900,000 $437,325 $437,325 $7,500 $5,782,150
DEBT SERVICE
SCHEDULE OF REQUIREMENTS
GENERAL OBLIGATION REFUNDING BONDS
Series 2015
Original Issue: $4,970,000
Dated: May 19, 2015
Interest Rate: 2.0 - 3.0%
Page 276

Paying
Fiscal Interest Interest Agent
Year Principal 15-Feb 15-Aug Fees Total
2018 215,000 146,975 141,600 750 504,325
2019 220,000 141,600 136,100 750 498,450
2020 230,000 136,100 130,350 750 497,200
2021 450,000 130,350 119,100 750 700,200
2022 465,000 119,100 107,475 750 692,325
2023 45,000 107,475 106,800 750 260,025
2024 50,000 106,800 106,050 750 263,600
2025 50,000 106,050 105,300 750 262,100
2026 50,000 105,300 104,550 750 260,600
2027 1,045,000 104,550 88,875 750 1,239,175
2028 1,075,000 88,875 72,750 750 1,237,375
2029 1,105,000 72,750 56,175 750 1,234,675
2030 710,000 56,175 45,525 750 812,450
2031 720,000 45,525 34,725 750 801,000
2032 755,000 34,725 23,400 750 813,875
2033 765,000 23,400 11,925 750 801,075
2034 795,000 11,925 - 750 807,675
Totals $8,745,000 $1,537,675 $1,390,700 $12,750 $11,686,125
Interest Rate: 3.0 - 5.0%
DEBT SERVICE
SCHEDULE OF REQUIREMENTS
GENERAL OBLIGATION REFUNDING BONDS
Series 2016
Original Issue: $9,080,000
Dated: May 1, 2016
Page 277

Remaining Total Annual
Balance Interest Payment
1/1/1970 Present Water Supply $14,820 $6,604 $1,095 $7,699
WATER/WASTEWATER
DEBT REQUIREMENTS
Fiscal 2018
Principal
SUMMARY
Notes Payable to Army Corp of Engineers
Original Note: $220,000
Date:
Payment Date Principal Interest Total Outstanding
Paid to-date $205,182 $145,527 $350,709 $14,820
1/1/2018 7,315 384 7,699 7,505
1/1/2019 7,505 194 7,699 -
1.25% Storage-Present Water Supply 18,000 Acre-Feet
NOTE PAYABLE
SCHEDULE OF REQUIREMENTS
U.S. Army Corp of Engineers
January 1, 1970
Interest Rate: 2.591%
Page 278

CAPITAL FUNDS
CAPITAL IMPROVEMENTS PROGRAM
TAX SUPPORTED FUNDS Tax supported funds are governmental fund types that are budgeted on a project basis
which may span more than one year. Any funds not spent in current year will automatically
be carried forward to the next year until the project is completed. The project is generally
discussed as part of the capital improvements program during strategic planning and
adopted during the budget process. Funding sources include transfers from operating
funds, general obligation bond issues, certificates of obligation issues, grants and
donations. Some projects may be approved or modified during the course of the year
through budget amendments as necessitated by changing events.
REVENUE SUPPORTED FUNDS Revenue supported funds are enterprise fund types that are budgeted on a project basis
which may span more than one year. Any funds not spent in current year will automatically
be carried forward to the next year until the project is completed. The project is generally
discussed as part of the capital improvements program during strategic planning and
adopted during the budget process. Funding sources include revenue bonds, transfers from
enterprise funds, certificates of obligation issues, state revolving fund bonds, grants and
donations. Some projects may be approved or modified during the course of the year
through budget amendments as necessitated by changing events.
RENEWAL AND REPLACEMENT FUNDS The City maintains two renewal and replacement funds: the Water/Wastewater Renewal &
Replacement Fund and the Solid Waste/Recycling Renewal & Replacement Fund. These funds
were established in fiscal 1996 to provide long-term funding to replace exhausted equipment and
to provide funds for replacement and/or expansion of plant facilities. Cash transfers from the
Water/Wastewater Fund in an amount equal to the second preceding year’s depreciation charges
less the amount required for the Equipment Acquisition and Replacement Fund, fund this Fund.
The City Council modified the policy effective October 1, 2009 to reserve 25% of the actual cash
transfer for system expansion. The City Council modified the policy for the Solid
Waste/Recycling Renewal & Replacement Fund to eliminate any funding requirements in fiscal
2007 and thereafter with the implementation of the Equipment Acquisition and Replacement Fund
which is used to replace rolling stock for the City. Projects will continue to be funded from the
Solid Waste/Recycling Renewal & Replacement Fund until all reserves are depleted.
EQUIPMENT ACQUISITION AND REPLACEMENT FUND The Equipment Acquisition and Replacement Fund is an internal service fund that accounts for
the depreciation cost on all rolling stock type vehicles, machinery and equipment. An amount
equivalent to the annual straight line depreciation expense is prorated and transferred to this fund
on a monthly basis for the purpose of accumulating funds necessary to replace and acquire new
equipment. These expenditures are completed within the budget year and are adopted as part of
the annual operating budget process.
Page 279

The summary does not include projects funded by grants, contributions from outside sources, or
capital budgets for component units.
Responsibility Center
Included in
Operating
Budget
Included in
CIP -
Tax
Supported
Included in
CIP -
Revenue
Supported
Included in
Solid Waste
Depreciation
Fund
Included in
Water/
Wastewater
Renewal &
Replacement
Fund
Included in
Equipment
Acquisition
&
Replacement
Fund Total
General Government - - - - - -
Public Works - - - - 761,440 1,163,915 1,925,355
Public Safety - - - - - 678,750 678,750
Community Development - - - - - -
Culture & Recreation - - - - 24,740 88,698 113,438
Total -$ -$ -$ -$ 786,180$ 1,931,363$ 2,717,543$
2018 Budgeted Capital Expenditures (New Projects)
Public Works71%
Public Safety25%
Culture & Recreation4%
FY2018 Budgeted Capital Expenditures
Page 280
CAPITAL IMPROVEMENTS PROGRAM
The Capital Improvements Program (CIP) is a long-range capital budget typically covering a three
to ten year time frame and including major capital purchases and/or construction projects that are
funded through bonds, operating revenues, grants or other funding mechanisms.
The City of Lufkin established a Continuing Capital Improvements Program in 1999. This
tentative ten-year program was approved by Council and updated in November 2008 with a five
year program. Non routine equipment purchases and/or projects included in the CIP are required
to have a life of more than 15 years and a minimum cost of $50,000. Bonds and Certificates of
Obligation (CO’s) typically fund expenditures meeting this definition, although occasionally
grants and donations will also fund expenditures meeting this definition.
Certificates of Obligation are issued periodically to provide adequate cash for planned projects and
equipment purchases. In addition, transfers may be made from other funds to provide sources to
pay for planned capital expenditures.
The CIP contains the following categories:
Tax Supported Projects – funded by the debt portion of the ad valorem taxes collected
annually or governmental fund balance. Tax supported projects fall into the following
sub-categories:
General Government – includes projects related to Administration, Finance and/or
projects common to multiple governmental fund departments.
Public Safety – includes Police, Fire, Municipal Court, Animal Control and
Inspection Services projects.
Culture and Recreation – includes Parks, Zoo, Library, and Civic Center projects.
Public Works – includes streets and drainage, curb and gutter, sidewalk construction.
Revenue supported projects are funded by revenues of the enterprise funds, i.e.
Water/Wastewater and Solid Waste/Recycling and fall into the following sub-categories:
Water – includes water and water production projects such as transmission and
distribution water lines, water line relocation, and water wells.
Wastewater – includes wastewater treatment plant construction projects,
installation of transmission and collection sewer lines, and sewer line relocations.
Solid Waste – includes capital projects relating specifically to solid waste
collection activities.
Recycling – includes capital projects relating specifically to recycling activities
such as building construction and equipment purchases.
Page 281
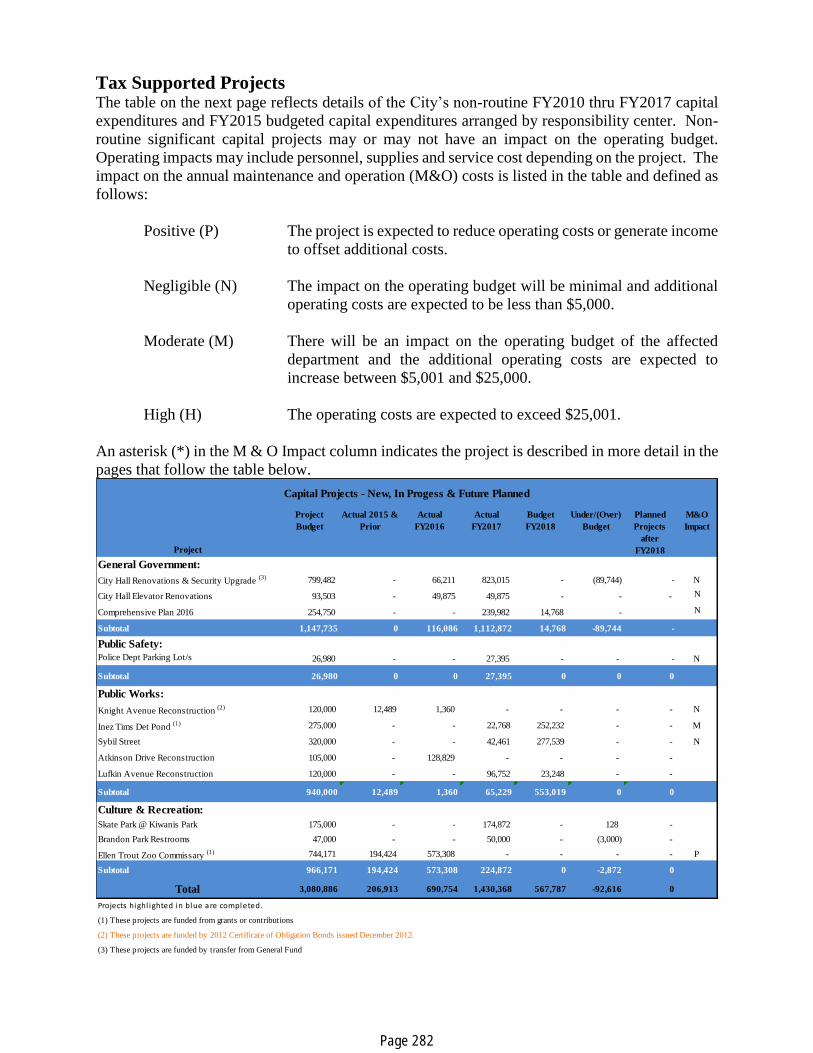
Tax Supported Projects The table on the next page reflects details of the City’s non-routine FY2010 thru FY2017 capital
expenditures and FY2015 budgeted capital expenditures arranged by responsibility center. Non-
routine significant capital projects may or may not have an impact on the operating budget.
Operating impacts may include personnel, supplies and service cost depending on the project. The
impact on the annual maintenance and operation (M&O) costs is listed in the table and defined as
follows:
Positive (P) The project is expected to reduce operating costs or generate income
to offset additional costs.
Negligible (N) The impact on the operating budget will be minimal and additional
operating costs are expected to be less than $5,000.
Moderate (M) There will be an impact on the operating budget of the affected
department and the additional operating costs are expected to
increase between $5,001 and $25,000.
High (H) The operating costs are expected to exceed $25,001.
An asterisk (*) in the M & O Impact column indicates the project is described in more detail in the
pages that follow the table below.
Project
Project
Budget
Actual 2015 &
Prior
Actual
FY2016
Actual
FY2017
Budget
FY2018
Under/(Over)
Budget
Planned
Projects
after
FY2018
M&O
Impact
General Government:
City Hall Renovations & Security Upgrade (3) 799,482 - 66,211 823,015 - (89,744) - N
City Hall Elevator Renovations 93,503 - 49,875 49,875 - - - N
Comprehensive Plan 2016 254,750 - - 239,982 14,768 - N
Subtotal 1,147,735 0 116,086 1,112,872 14,768 -89,744 -
Public Safety:
Police Dept Parking Lot/s 26,980 - - 27,395 - - - N
Subtotal 26,980 0 0 27,395 0 0 0
Public Works:
Knight Avenue Reconstruction (2) 120,000 12,489 1,360 - - - - N
Inez Tims Det Pond (1) 275,000 - - 22,768 252,232 - - M
Sybil Street 320,000 - - 42,461 277,539 - - N
Atkinson Drive Reconstruction 105,000 - 128,829 - - - -
Lufkin Avenue Reconstruction 120,000 - - 96,752 23,248 - -
Subtotal 940,000 12,489 1,360 65,229 553,019 0 0
Culture & Recreation:
Skate Park @ Kiwanis Park 175,000 - - 174,872 - 128 -
Brandon Park Restrooms 47,000 - - 50,000 - (3,000) -
Ellen Trout Zoo Commissary (1) 744,171 194,424 573,308 - - - - P
Subtotal 966,171 194,424 573,308 224,872 0 -2,872 0
Total 3,080,886 206,913 690,754 1,430,368 567,787 -92,616 0
Projects highl ighted in blue are completed.
(1) These projects are funded from grants or contributions
(2) These projects are funded by 2012 Certificate of Obligation Bonds issued December 2012.
(3) These projects are funded by transfer from General Fund
Capital Projects - New, In Progess & Future Planned
Page 282

The City Council had several planning sessions to review capital projects. Some projects that were
included in CIP for future years were removed from future plans by the current administration and
others added in their place.
REVENUE SUPPORTED PROJECTS
Water and wastewater rates have increased by 6% in fiscal years 2010, 2011 and 2012 and none
for 2013, 2014, and 2015; however, in order for the Water/Wastewater Fund to meet obligations,
the fourth increase of 6% was implemented in Fiscal 2016 budget. The fund maintains a 45 day
working cash balance as required by Council Financial Policies. The rate increases were based
on study conducted by Freese & Nichols, Inc. and adopted by City Council for fiscal years 2016.
No increase was adopted for Fiscal 2017 and 2018.
Proper maintenance of water and sewer lines will in effect reduce long-term cost for the Water and
Wastewater Fund. Although there are some operating cost for these projects, the City will benefit
long term in that lines will be kept in operation for longer periods of time with proper maintenance.
Project
Project
Budget
Actual
2015 &
Prior
Actual
FY2016
Actual
FY2017
Budget
FY2018
Under/(Over)
Budget
Planned
Projects
after
FY2018
M&O
Impact
Leach Street Reconstruction 275,000 - - 119,353 - - - P
Water Plant #3 1,758,510 547,669 1,209,241 - - - - P
24" Water Line Hwy 103E to Hwy 59S 1,219,734 600,172 515,094 - - - - *
Kit McConnico I/I Project G 240,000 20,628 - - 219,372 - - P
Kit McConnico I/I Project H 630,000 13,069 131,048 39,310 446,573 - -
Kit McConnico I/I Project I 690,000 - - 72,707 617,293 - -
Central I & I - Project F 250,000 - - - 250,000 - - M
Total 5,063,244 1,181,538 1,855,383 231,370 1,533,238 0 0
Projects highl ighted in blue are completed.
Revenue Supported Capital Projects - New, In Progess & Future Planned
Page 283

WATER/WASTEWATER RENEWAL & REPLACEMENT FUND
Each year as part of the budget process, utility fund departments prepare replacement equipment
requests for routine capital projects to be funded from the Renewal & Replacement Funds. The
City Manager, along with applicable staff, reviews these requests, rank as to importance, and
present results to Council for approval. A list of items approved is reflected in the following tables
for the Water/Wastewater Renewal and Replacement Fund. Completed items for previous year
are shown in blue.
Department Description Budget Expended
WWTP/Water Prod Fiscal 2009-2011 Completed Projects 5,741,947 5,741,947
Fiscal 2012 Completed Projects 916,130 783,608
Fiscal 2013 Completed Projects 2,858,665 2,223,033
Fiscal 2014 Completed Projects 2,902,750 2,602,748
Fiscal 2015 Completed Projects 1,363,563 1,357,668
Fiscal 2016 Completed Projects 735,895 718,212
Pineywoods Academy Sewer Line 20,000 19956
24” Water Line 103E-59S 765,000 773421
SCADA Equipment 10,000 2,708
BOD & TSS Study 25,000 21,330
Digester, Press, & Preair Maintenance 139,213 106,521
WWTP Pumps 59,528 -0-
2 20” Utility Trailers & Jet Cam 30,000 29,650
Water Plant #3@ Abitibi 341,490 345,661
Yard Piping 11,000 2,206
Painting ground Storage Tank #5 450,000 360,476
Well Rehabilitation @ Abitibi Well Fld 100,000 118,120
Road Resurfacing at Water Plant 33,000 18,736
Lift St. Repair FM 1194 30,000 12,923
Subtotal 16,533,181 15,238,924
Added Fiscal 2017: Meter Replacement 218,000 214,924
Sungard mobile work order service 21,615 19,619
Replace Boiler #1 @WWTP 158,000 158,000
Recoat Final Clarifier, Wires 135,000 1,310
Polymer Injection for Centrifuge 45,000 31,849
Jet machine/Vac Truck 200,000 213,070
Electric Lift with Boom 11,000 9,565
Ditch Witch 16,000 15,980
2 Heavy Duty Trailers 11,000 8,600
Turner St. Line Replacement 9,600 9580
John Kolb Rd. Line Replacement 30,000 30,000
Pershing area Line Replacement 15,600 15,600
Replace 2 soft starts for pumps 20,000 19,412
Replace Cathodic Protection System 14,500 14,300
Replace Booster Pump #3 #WP#2 12,500 12,500
Repair fence erosion @WP#1 36,000 3,623
Replace Chorine Scale system @WP#1 32,600 32,490
Overlay of Kurth Lake Road 73,000 72956
Chlorine Contact Basin 920,000 4,774
Water Well#6 Pump Repair 128,410 128,410
Subtotal 2,107,825 1,016,562
Page 284

SOLID WASTE DEPRECIATION FUND
The Solid Waste/Recycling Depreciation Funds are being depleted and will no longer be funded.
Department Description Budget Expended
Added Fiscal 2018 Meter Replacement 220,000 -0-
Carpet Replacement in Utility Collections 8,500 -0-
Mossquito Fogger-Parks 6,500 -0-
Roof replacement-Morris Frank Park 18,240 -0-
Boiler #3 Replacement 170,000 -0-
Gravity Thickener Repair 25,000 -0-
Final Clarifier 135,000 -0-
Lift St Repair 21,000 -0-
Camera Van Supplement 60,000 -0-
McElroy Fusion Machine 36,000 -0-
Arena Street Water Line Replacement 26,800 -0-
Linkwood area Water Line Replacement 24,400 -0-
Card Drive Water Line Replacement 40,740 -0-
Electric Hoist for Water Plant #3 10,000 -0-
Replace booster Pump #6 @WP#1 20,000 -0-
Subtotal 822,180 -0-
Total $19,463,186 $16,255,486
Page 285

EQUIPMENT ACQUISITION & REPLACEMENT FUND
REVENUES
Revenues for the Equipment Acquisition and Replacement Fund are charged to the Departmental
budgets to cover the cost of annual depreciation on the City’s rolling stock or other machinery and
equipment. After a one time initial transfer in from the General, Water/Wastewater and Solid
Waste funds in fiscal 2006, annual replacement cost on each piece of equipment will be recorded
in this fund until such time as the equipment is ready for replacement. All machinery and
equipment is placed on a schedule for replacement based upon anticipated life of the equipment.
Revenues for fiscal 2018 are anticipated to be $1,585,185.
EXPENDITURES
SUPPLIES Expenditures for fiscal year 2018 are projected to be $120,000 of patrol supplies.
EQUIPMENT & STRUCTURE MAINTENANCE
There are no equipment and structure maintenance projected for either Fiscal 2017.
MISCELLANEOUS SERVICES
There are no miscellaneous services expenditures charged to this account for Fiscal 2018.
CAPITAL OUTLAY
All expenditures in the fund are routine capital in nature with the exception of the fleet vehicles
that the City maintains for employees occasional use while conducting City business. The fiscal
2018 estimated expenditures are $1,931,363.
Page 286

WORKING CAPITAL BALANCE City Financial Policies require the Equipment Acquisition & Replacement Fund to maintain a
working capital balance of zero or greater. However, excess funds are retained from year to year
to be applied toward future purchases. The anticipated working capital balance at fiscal 2018 year-
end is $1,030,271
.
Department Item to be purchased Amount
Police Dept Equipment 120,000
Police Dept 6- Chevy Tahoe 210,000
Police Dept Ford F350 Van Crime Scene 18,500
Police Dept 4- Ford Fusions 80,000
Fire Dept Chevrolet Med Unit 200,000
Fire Dept Stryker Stretcher 16,000
Inspections Ford F-150 Truck 15,750
Animal Control Ford F-150 Truck 18,500
Solid Waste Peterbilt Front Loader 235,000
Solid Waste Peterbilt Front Loader 230,000
Solid Waste Ford F-150 Truck 16,198
Solid Waste Peterbilt Roll-off Truck 135,000
Street Dept Ford F-250 Truck w/Utility 23,500
Street Dept John Deere 4WD Tractor 20,844
Parks Tractor and mower 72,500
Parks Truck 16,198
Water W Treatment John Deere 450G Dozer 85,000
Water W Treatment Freightline FL112 Dump Truck 112,000
Water W Treatment Ford F-150Van Small SUV 19,377
Water/Sewer John Deere Excavator 53,996
Water/Sewer Ford F250 4WD Utility Ext Cab 28,000
Water/Sewer Ford Van w/TV Insp System 130,000
Water/Sewer Freightliner Single Axle 6YD Dump 75,000
Total $1,931,363
Page 287

CAPITAL IMPROVEMENTS PROGRAM SUMMARY OF COMPLETED PROJECTS
FISCAL 2006-2017
General Government Projects
$948,000 – Wireless Wide area Network and Ethernet phone system include
installation of wireless connections from the City Hall complex to 16 nodes, or
outlying City offices. The telephony portion of the project is installed “on top of”
the wireless portion of the project. The project was completed in May 2002 and
saves the City approximately $120,000 annually with a payback of about 6 years.
$5,103,500 – Main Street Downtown Project includes both City and TEA 21 State
Grant funds. The grant was approved in fiscal 2001 and includes construction of
period lighting, sidewalk renovation and park benches. The City’s portion will be
used for street reconstruction throughout the downtown district.
$1,717,796 – Pines Theatre Renovation includes renovations to the old downtown
area Pines Theatre. A new marquee, roofing and interior remodel complete plans
for a downtown attraction that may feature plays, dinner theatre and much more.
Renovations completed in November 2012 and grand opening was held December
1, 2012.
$398,000- Fair Housing Plan Study completed in Fiscal 2014.
$619,423-CDBG Pinewood Parks Apt completed in Fiscal 2014.
$264,005-Lubbock Street completed in Fiscal 2014.
$398,000-Radio Upgrade completed in Fiscal 2015.
$1,028,519-Denman Ave Drainage completed in Fiscal 2016.
Public Safety Projects
$313,300 – Pumper Unit an additional unit was purchased in fiscal 2007.
$1,185,475 – Fire Station #4 A newly constructed fire station to replace the
existing Fire Station #4 was completed during fiscal 2008.
$464,718 – Pumper Engine #7 was replaced in fiscal 2011 funded by Certificates
of Obligation funds issued in October 2010.
$480,600 – Rescue #1 replacement was purchased in fiscal 2012 funded by
Certificates of Obligation issued in 2010.
$107,716- Fire Station #1 Renovations completed in fiscal 2013 to fire station
funded by grant monies.
Page 288
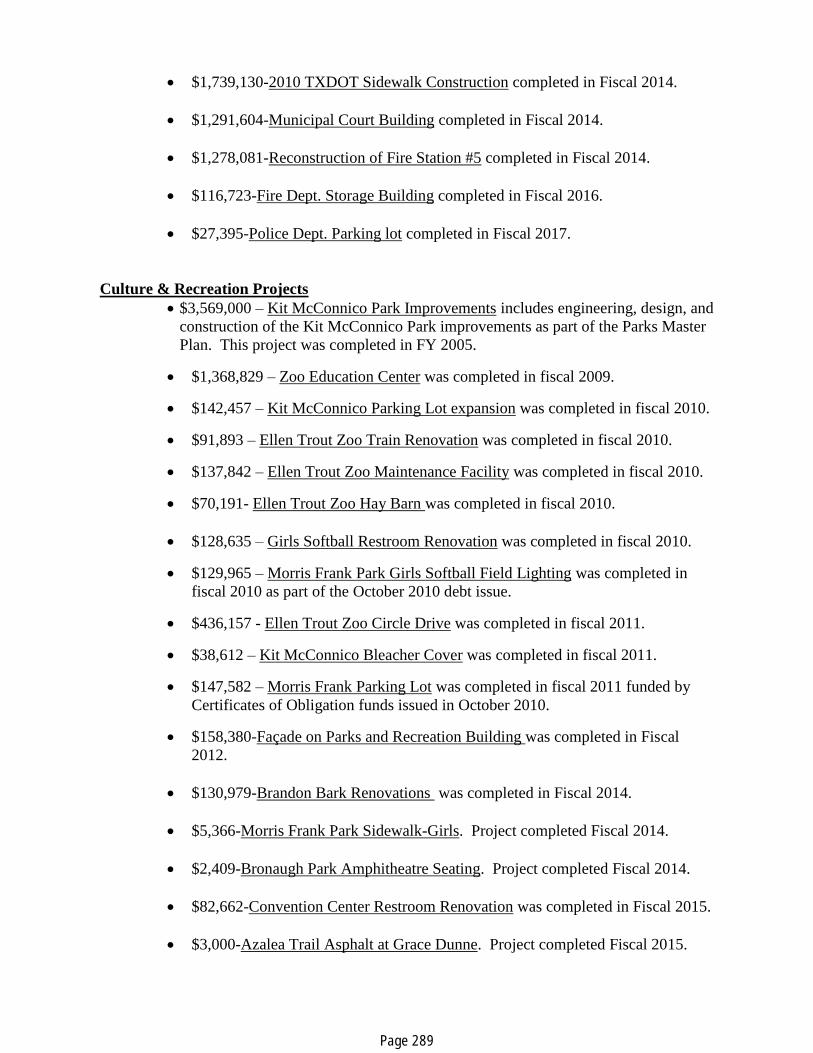
$1,739,130-2010 TXDOT Sidewalk Construction completed in Fiscal 2014.
$1,291,604-Municipal Court Building completed in Fiscal 2014.
$1,278,081-Reconstruction of Fire Station #5 completed in Fiscal 2014.
$116,723-Fire Dept. Storage Building completed in Fiscal 2016.
$27,395-Police Dept. Parking lot completed in Fiscal 2017.
Culture & Recreation Projects
$3,569,000 – Kit McConnico Park Improvements includes engineering, design, and
construction of the Kit McConnico Park improvements as part of the Parks Master
Plan. This project was completed in FY 2005.
$1,368,829 – Zoo Education Center was completed in fiscal 2009.
$142,457 – Kit McConnico Parking Lot expansion was completed in fiscal 2010.
$91,893 – Ellen Trout Zoo Train Renovation was completed in fiscal 2010.
$137,842 – Ellen Trout Zoo Maintenance Facility was completed in fiscal 2010.
$70,191- Ellen Trout Zoo Hay Barn was completed in fiscal 2010.
$128,635 – Girls Softball Restroom Renovation was completed in fiscal 2010.
$129,965 – Morris Frank Park Girls Softball Field Lighting was completed in
fiscal 2010 as part of the October 2010 debt issue.
$436,157 - Ellen Trout Zoo Circle Drive was completed in fiscal 2011.
$38,612 – Kit McConnico Bleacher Cover was completed in fiscal 2011.
$147,582 – Morris Frank Parking Lot was completed in fiscal 2011 funded by
Certificates of Obligation funds issued in October 2010.
$158,380-Façade on Parks and Recreation Building was completed in Fiscal
2012.
$130,979-Brandon Bark Renovations was completed in Fiscal 2014.
$5,366-Morris Frank Park Sidewalk-Girls. Project completed Fiscal 2014.
$2,409-Bronaugh Park Amphitheatre Seating. Project completed Fiscal 2014.
$82,662-Convention Center Restroom Renovation was completed in Fiscal 2015.
$3,000-Azalea Trail Asphalt at Grace Dunne. Project completed Fiscal 2015.
Page 289
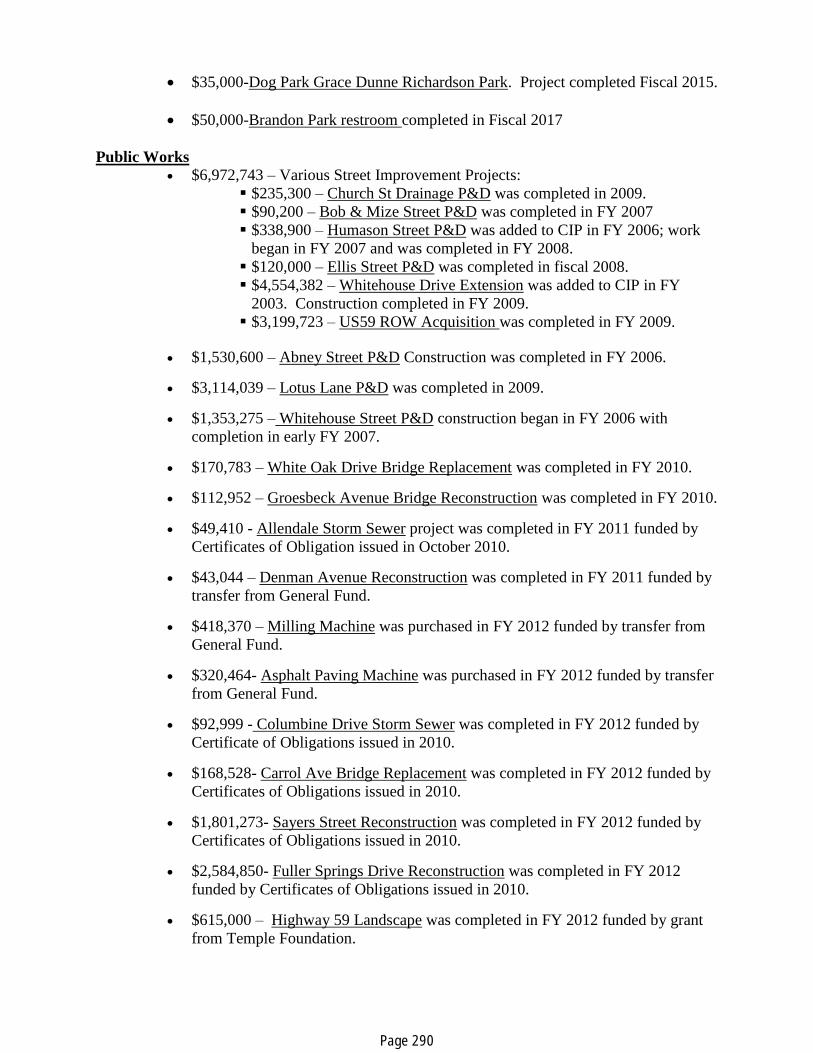
$35,000-Dog Park Grace Dunne Richardson Park. Project completed Fiscal 2015.
$50,000-Brandon Park restroom completed in Fiscal 2017
Public Works
$6,972,743 – Various Street Improvement Projects:
$235,300 – Church St Drainage P&D was completed in 2009.
$90,200 – Bob & Mize Street P&D was completed in FY 2007
$338,900 – Humason Street P&D was added to CIP in FY 2006; work
began in FY 2007 and was completed in FY 2008.
$120,000 – Ellis Street P&D was completed in fiscal 2008.
$4,554,382 – Whitehouse Drive Extension was added to CIP in FY
2003. Construction completed in FY 2009.
$3,199,723 – US59 ROW Acquisition was completed in FY 2009.
$1,530,600 – Abney Street P&D Construction was completed in FY 2006.
$3,114,039 – Lotus Lane P&D was completed in 2009.
$1,353,275 – Whitehouse Street P&D construction began in FY 2006 with
completion in early FY 2007.
$170,783 – White Oak Drive Bridge Replacement was completed in FY 2010.
$112,952 – Groesbeck Avenue Bridge Reconstruction was completed in FY 2010.
$49,410 - Allendale Storm Sewer project was completed in FY 2011 funded by
Certificates of Obligation issued in October 2010.
$43,044 – Denman Avenue Reconstruction was completed in FY 2011 funded by
transfer from General Fund.
$418,370 – Milling Machine was purchased in FY 2012 funded by transfer from
General Fund.
$320,464- Asphalt Paving Machine was purchased in FY 2012 funded by transfer
from General Fund.
$92,999 - Columbine Drive Storm Sewer was completed in FY 2012 funded by
Certificate of Obligations issued in 2010.
$168,528- Carrol Ave Bridge Replacement was completed in FY 2012 funded by
Certificates of Obligations issued in 2010.
$1,801,273- Sayers Street Reconstruction was completed in FY 2012 funded by
Certificates of Obligations issued in 2010.
$2,584,850- Fuller Springs Drive Reconstruction was completed in FY 2012
funded by Certificates of Obligations issued in 2010.
$615,000 – Highway 59 Landscape was completed in FY 2012 funded by grant
from Temple Foundation.
Page 290

$187,760 – Tymco Street Sweeper purchased in FY 2013.
$188,072 – Champions Drive Reconstruction was completed in FY 2013.
$142,603 – Pershing Ave Reconstruction was completed in FY 2013.
$143,487 – Windsor Drive Reconstruction was completed in FY 2013.
$736,148- North Brentwood Drive Extension was completed in Fiscal 2014.
$275,000-Lubbock Street Reconstruction was completed in Fiscal 2014.
$701,221-Joyce Lane Reconstruction was completed in Fiscal 2014.
$237,572-Carriage Drive Reconditioning was completed in Fiscal 2014.
$167,500-Angelina Street Reconstruction was completed in Fiscal 2015.
Water Projects
$17,147,905 – Asbestos Cement Line Replacement is a five-year project that
includes approximately 57 miles of asbestos cement water lines and is
approximately 100% complete. Construction began in fiscal 2001 and completed
in fiscal 2009. Also included is the Ellen Street Ground Storage Tank
rehabilitation project completed in fiscal 2009 at $541,350 and Crown Colony
water line replacement costing $2,202,336 completed in FY 2009 of the $17
million total. This project was completed in 2009.
$67,500 – Water Plant Control System was completed in early FY 2007.
$965,000 – Water Well #15 consists of drilling and construction. The project was
completed in FY 2005.
$846,000 – Main Street Downtown Project replacement of water and sewer lines
in the central business district and is being done simultaneously with the street,
sidewalk, and period lighting project. The project was completed in FY 2005.
$154,420 – Mantooth Water Line Replacement has been engineered and the
construction phase has not yet been set.
$297,000 – Abney Utility Relocation portion of the Abney Street reconstruction
was completed in FY 2005.
$72,500 – Whitehouse Utility Relocation was completed in FY 2006.
$375,000 – Lotus Lane Utility Relocation is projected was completed in FY 2008.
$15,133,211 – Kurth Lake and Abitibi Water Wells purchased in FY 2009.
Page 291

$1,316,000 – Waterline to Diboll was completed in FY 2012 for a total cost of
$964,530 and funded by Wastewater Depreciation Fund.
$1,490,000-Rehabilitation of Two 2 Million Ground Storage Tanks completed in
Fiscal 2014.
$515,063-Lift Water Wells was completed in Fiscal 2014.
$31,954-Lift Water Well No.29. Project completed Fiscal 2015.
$88,257-Kurth Lake Boat Ramp, Dam Repair, and piers. Projects completed in
Fiscal 2017.
Wastewater Projects
$978,000 – Kit McConnico Force Main consists of constructing sewer force main
from the Kit McConnico complex to the appropriate lift station. Construction was
complete in FY 2005.
$102,300 – Kit McConnico Utility Relocation was completed in FY 2005.
$737,050 – Equalization Basin & Head Works includes construction of an
additional storm water lagoon at the treatment facility and adjustments and over
sizing to piping and pumping facilities to accommodate the additional lagoon.
Project began construction during FY 2003 and completed in FY 2010.
$760,000 – Chlorine Contact Basin includes construction of a unit identical to the
existing unit which will increase treatment capacity and allow for repairs to the
old unit. This project was implemented in FY 2005 and is continuing.
$117,012- Copeland Street Sewer Lift Station was completed in FY 2010.
$66,228 – Kit McConnico Lift Station Pump was completed in FY 2010.
$655,000-Digester Rebuild was completed in FY 2011 for a total cost of
$654,770.
$156,450 – SSCS U.S. Highway 69 Annexed Area was completed in FY 2011
for total cost of $140,273.
$1,232,470- US Highway 59 Lift Station and Line Extension was completed in
FY 2012 for a total cost of $939,574.
$1,028,730- Kit McConnico I/I Project K was completed in FY 2012 for a total
cost of $789,652.
$1,756,910-Water Plant #3 completed in Fiscal 2017.
$1,115,266-24” Water Line Hwy 103E. to Hwy 59S completed in FY 2017.
Page 292

Water/Wastewater Renewal & Replacement Projects
$1,770,592 – Radio Frequency (RF) Meter Reading Project benefits the Utility
Collections department and encompasses purchase and installation of hardware
(RF meters, computers) and software for remote meter reading via vehicle. The
third phase of this project was completed in FY 2008.
$45,200 – Kiln St. Water Line Replacement to replace existing water line will be
constructed in FY 2007 and was completed in FY 2008.
$210,000 – Sybil Street Utility Replacement began in fiscal 2007 with completion
in FY 2008.
$425,000 – Chestnut/Denman Water Line Replacement the process of replacing
existing lines began in FY 2007 and was completed during fiscal 2008.
$23,045 – Infrared Camera was purchased in FY 2006 to replace existing
equipment.
$230,000 – Belt Press was replaced to upgrade and maintain the life of the
wastewater treatment facility.
$35,000 – Weir Baffles will be replaced in order to create a fully functional
operation at the wastewater treatment facility this project began in FY 2006 and
marked completion in FY 2008.
$60,000 – Replace Kit McConnico Parking Lot to replace damaged portion of
new parking lot – damaged by utility construction. This was completed in FY
2006.
$45,000 – 1½ Ton Truck was purchased to replace existing equipment in FY
2006.
$165,000 – Motor Grader to replace existing motor grader was purchased in FY
2006.
$2,993,775 – Highway 59 South Utility Line Replacement was completed in FY
2009.
$58,855 – Solids Handling Building Roof Repair – was completed in FY 2009.
$24,689 – Implant Water Pump Replacement was completed in FY 2009.
$24,300 – Primary Sludge Pump was purchased in FY 2009.
$76,650 – Winch 12-ton Pipebursting Machine was purchased in FY 2009.
$24,400 – PW Building Security System was purchased in FY 2009.
$128,014- Rehabilitation of One Million Gallon Tank WTP was completed in FY
2010.
Page 293

$1,131,821 – Sam Rayburn Waterline Project to provide water from Sam Rayburn
Dam to City of Lufkin was abandoned in FY 2011 due to the capacity provided by
the Abitibi Water Well Field purchase.
$300,089 – ML King/Raguet Sewer Line project was completed in FY 2011.
$49,733 – Raw Sewage Pump purchased in FY 2013.
$39,895 – Secondary Return Pump purchased in FY 2013.
$1,378,267 –Highway 59 North Utility Relocation completed FY 2013.
$76,000-Raw Sewage Pump completed in Fiscal 2014.
$53,395-Return Activated Sludge Pump completed in Fiscal 2014.
$67,500-Car Wash at Public works completed in Fiscal 2015.
$130,997-Walden Ct. Lift Station replacement completed in Fiscal 2015.
$141,607-Spur Plaza Sewer Extension completed in Fiscal 2015.
$119,229-Cured in Place Line Equipment completed in Fiscal 2016.
$29,406-Oletta Line Replacement-completed in Fiscal 2016.
$72,956-Kurth Lake Road Improvements completed in Fiscal 2017.
Solid Waste & Recycling Renewal & Replacement Projects
$2,730,243 – Public Works Facility will house the Street, Water Distribution and
Sewer Collection departments, as well as, serve as Emergency Management
Operations center. A warehousing area was included in the facility. This project
began the engineering and design phase in FY 2006; construction was completed
in FY 2009.
$1,769,467 – Storage Facility for recycling was constructed in FY 2009 to add
storage for recyclables as well as remodeling and expansion of the Solid Waste
Facility.
$332,160 – Two Fuel Station complexes were completed in FY 2010 to provide
fueling stations for City vehicles, eliminating the need for the City to contract for
fuel purchases other than bulk fuel.
$30,874-Curatto Can purchase in Fiscal 2016.
Page 294
Page 295

Page 296

Page 297
Page 298

Page 299

Page 300

APPENDIX
FINANCIAL POLICY GUIDELINES
Financial policies are followed in the day-to-day financial management of the City. These policies
provide critical guidelines to be followed in the budget preparation process in an effort to ensure
the City’s continued financial stability. These policies are reviewed annually with the City Council
Finance Sub-Committee and updated as economic and financial conditions change. These policies
follow.
CITY OF LUFKIN COUNCIL FINANCIAL POLICIES
PURPOSE AND NEED FOR POLICY
The City Council desires to establish a statement of written policy for the City of Lufkin that shall
provide a framework for prudent management of the City’s financial resources.
The written policy shall demonstrate to the citizens of Lufkin, the financial community, and the
bond rating agencies that the City of Lufkin is committed to a strong fiscal operation. The policy
shall also provide precedents for future policy makers and financial managers on common financial
goals and strategies.
POLICY
1. The City of Lufkin shall maintain an operating position in all governmental funds such that
annual expenditures shall not exceed annual resources, including fund balances.
2. The City of Lufkin shall maintain an operating position in all proprietary funds such that annual
expenses shall not exceed annual resources, including working cash balances.
3. The City shall protect the physical assets of the City to ensure the value, integrity and utility
of these major investments of the City’s resources.
4. This policy shall be reviewed and updated periodically and will be presented to the City
Council for approval of any significant changes.
5. The following sections outline the procedures and guidelines for accomplishing this policy.
OPERATING CONDITION 1. A multi-year financial forecast shall be prepared annually projecting revenues and
expenditures for all operating funds. This forecast shall be used as a planning tool in
developing the following year’s operating budget.
2. Rates, fees and charges for service shall be reviewed annually and adjusted as necessary to
respond to cost increases or other changing circumstances.
Page 301

3. Activities within enterprise funds shall be budgeted so that revenues support cost of service,
satisfy bond covenants, and provide adequate levels of working capital.
4. Insurance coverage shall be examined annually to ensure that policy limits are adequate and in
compliance with bonds covenants.
5. Estimated costs and funding sources shall be identified prior to any project being submitted for
Council approval.
DEBT MANAGEMENT 1. Debt shall not be used for funding operating expenses.
2. Bonds shall be sold only to finance long-term capital projects.
3. An asset or project shall not be financed over a period longer than the estimated useful life of
that asset or project.
4. An analysis will be provided to Council disclosing estimated annual operating expenses
associated with any capital project or asset financed by debt.
5. City staff shall prepare a multi-year Capital Improvement Program (CIP), updated annually,
which will meet the anticipated growth requirements of the City. The Council as a guide for
staff shall adopt the CIP in planning the subsequent year’s capital and financing needs.
6. Total outstanding tax-supported debt shall not exceed five percent (5%) of the total annual
assessed valuation of taxable property.
7. Budgeted employer costs for retirement (Texas Municipal Retirement System-TMRS) shall be
reviewed and any excess amounts shall be reserved and applied toward future cost adjustments.
(Effective October 1,
DEPRECIATION FUND
The City shall maintain a Water & Sewer Depreciation Fund. This Fund shall be financed by
systematic budgeted transfers approved by Council each year and will be equal to the actual annual
depreciation expense recorded for the second preceding fiscal year of the fiscal year in which the
fund will be budgeted. The following guidelines will be followed in administration of this Fund.
(Effective October, 1, 2009)
1. Approximately twenty-five percent (25%) of the actual annual transfer of cash to this Fund
shall be retained and reserved for future system expansion.
2. Approximately seventy-five percent (75%) of the actual annual transfer of cash to this Fund
shall be available and may be used for the renewal or replacement of maintenance or capital
items.
Page 302
FINANCIAL CONDITION The City’s goal shall be to maintain balances of immediately accessible cash and investments in
each operating fund for cash flow purposes. These balances shall be established during each
annual budget process according to the guidelines outlined below.
1. Governmental Fund Types
General Fund - An amount equal to approximately twenty-five percent (25%) of
original adopted budgeted expenditures shall be reserved as Fund Balance. The City
Council has authorized up to five percent (5%) reduction to (20%) in the reserve to
support the implementation of the Economic Development Sales Tax initiative
approved by election in February of 2004. The Fund Balance continues above the 25%
goal. Should some portion of the 5% reduction be required in future years, a repayment
policy will be established.
Civic Center Fund - An amount equal to approximately twelve and one-half percent
(12.5%) of original adopted budgeted expenditures shall be reserved as Fund Balance.
Should the Civic Center Fund develop cash balances insufficient to meet operating
needs, the City Manager or Finance Director are authorized to advance such working
capital as needed from the General Fund not to exceed a cumulative amount of $75,000.
Special Recreation Fund - An amount equal to approximately twelve and one-half
percent (12.5%) of original adopted budgeted expenditures shall be reserved as Fund
Balance.
2. Proprietary Fund Types:
Water & Sewer Fund - An amount equal to at least twelve and one-half percent (12.5%)
of original adopted budgeted expenditures shall be reserved as Working Capital
Balance.
Solid Waste Fund - An amount equal to at least twelve and one-half percent (12.5%)
of original adopted budgeted expenditures shall be reserved as Working Capital
Balance.
3. Other Funds and Fund Types:
Other Governmental and Proprietary Funds not specifically referred to above shall be fully
self-supporting to the extent that the fund balance, working capital or retained earnings of
each fund shall be zero or greater. The City Manager and Finance Director are authorized
to advance up to $50,000 to the various grants received by the City in anticipation of
reimbursement of such amounts. The City Manager or Finance Director is authorized to
advance up to $50,000 to the Medical Savings Fund to cover cash flow needs.
4. The Insurance Loss Fund shall be actuarially determined and periodically reviewed to evaluate
experience and degree of risk assumptions.
ASSET MANAGEMENT
1. In addition to anticipated growth requirements of the City, the multi-year Capital Improvement
Program will be developed and presented in March of each year that identifies major
infrastructure repair and rehabilitation needs.
Page 303
2. The City will prepare and maintain a facilities master plan. This document will serve as a
management tool to project space needs including construction and/or modification of
facilities.
3. Repair, renovation and maintenance shall be regularly performed to protect the life of the assets
and to ensure their safety and utility. A systematic program of routine and preventive
maintenance shall be developed based on need identification and prioritization.
4. The Annual Operating Budget will provide sufficient funding levels for ongoing maintenance
of the infrastructure.
ACCOUNTING, AUDITING AND FINANCIAL MANAGEMENT 1. Accounting systems shall produce information that is consistent with generally accepted
accounting principles for governmental entities.
2. An independent public accounting firm shall conduct an annual comprehensive audit of all
funds.
3. Net revenues of the Water & Sewer Fund shall be maintained at a level sufficient to cover
average annual debt service requirements by 1.25 times.
RESPONSIBILITY AND AUTHORITY The City Manager shall have accountability to the City Council concerning the financial strategies
outlined in this policy.
Page 304

Glossary of Terms
ACCRUAL ACCOUNTING - a basis of accounting in which revenues are recognized in the accounting period in
which they are earned, and expenses are recognized in the period in which they are incurred.
AD VALOREM TAX - a tax levied on the assessed value of real property (also known as “property taxes”).
AMORTIZATION - building up of a fund over a period of time to replace productive assets at the end of their useful
lives through a series of equal periodic payments.
APPRAISED VALUE - a valuation set upon real estate or other property by County Property Appraiser as a basis
for levying taxes.
APPROPRIATION - a specific amount of money authorized by the City Council to make expenditures or incur
obligations for specific purposes, frequently used as an interchangeable term with “expenditures”.
APPROPRIATION ORDINANCE - the official enactment, by City Council, to legally authorize City staff to
obligate and expend resources.
BALANCED BUDGET - a budget in which estimated revenues equal estimated expenditures.
BOND - a written promise to pay a specific sum of money, called “face value” or “principal,” at a specified date in
the future, called “maturity date,” together with periodic interest at a specific rate.
BONDED DEBT - the portion of the indebtedness representing outstanding bonds
BUDGET - a financial plan, for a specified period, of operations that matches all planned revenues and expenditures
with the services provided to the residents of the City.
BUDGET CALENDAR - the schedule of key dates that the City follows in the preparation and adoption of the
budget.
BUDGET DOCUMENT - the instrument used by the budget-making authority to present a comprehensive financial
plan of operations for the City Council.
BUDGET MESSAGE - the opening section of the budget from the City Manager, which provides the City Council
with a general summary of the most important aspects of the budget.
BUDGETARY CONTROL - the control of the management of a government or enterprise in accordance with an
approved budget for the purpose of keeping expenditures within the limitations of available appropriations and
available revenues.
CALCULATED EFFECTIVE TAX RATE - State Law prescribes a formula for calculating the effective tax rate
for cities. The net effect is to produce a tax rate that goes down when property values rise. It is intended to generate
approximately the same amount of revenues as the previous year.
CAPITAL IMPROVEMENTS PROGRAM (CIP) - a multiyear plan that forecasts spending for all capital projects
including buildings, equipment, and future accommodations.
CAPITAL PROJECTS FUND - A fund created to account for all financial resources to be used for the acquisition
or the construction of major capital facilities or equipment.
CAPITAL OUTLAYS - expenditures which result in the acquisition of or the addition of fixed assets.
CERTIFICATES OF OBLIGATION (CO’s) - tax supported bonds that are similar to general obligation bonds and
can be issued after meeting strict publication requirements and with final approval of the City Council.
CITY COUNCIL - The Mayor and six (6) Council members acting as the legislative and policymaking body of the
City.
Page 305
COMPREHENSIVE ANNUAL FINANCIAL REPORT (CAFR) - A financial report that encompasses all funds
and component units of the government. The CAFR should contain (a) the basic financial statements and required
supplementary information, (b) combining statements to support columns in the basic financial statements that
aggregate information from more than one fund or component unit, and (c) individual fund statements as needed. The
CAFR is the governmental unit’s official annual report and also should contain introductory information, schedules
necessary to demonstrate compliance with finance-related legal and contractual provisions, and statistical data. The
CAFR of a public employee retirement system or an investment pool also should provide information on investments.
Likewise, the CAFR of a public employee retirement system should provide actuarial information.
CONTRACTUAL SERVICES - services performed for the City by individuals, businesses, or utilities.
CURRENT TAXES - taxes levied and due within the fiscal year.
DEBT SERVICE FUND - a fund established to account for the accumulation of resources for, and the payment of,
long-term debt principal and interest.
DELINQUENT TAXES - taxes that remain unpaid after the due date has passed.
DEPARTMENT - a major organizational unit of the City that holds responsibility for one or more divisions.
DEPRECIATION – the allocation of the cost of an asset over its estimated useful life.
DIVISION - a major organizational unit of the City that holds responsibility for one or more activities.
ENCUMBRANCE - the commitment of appropriated funds to purchase an item or service. To set aside funds for
disbursement.
ENTERPRISE FUND - a fund established to account for operations of the water and sewer systems. It is operated
in a manner similar to a private business enterprise.
ESTIMATED REVENUE - the amount of revenues projected to be collected in the fiscal year.
EXPENDITURES - a decrease in the net financial resources of the City due to the acquisition of goods and services.
EFFECTIVE TAX RATE- consists of last year’s adjusted taxes after the taxes on lost property are removed. This is
then divided by the current year’s adjusted tax base.
FISCAL YEAR - a 12-month period to which the Annual Budget applies. The City of Lufkin Fiscal Year begins on
October 1 and ends on September 30.
FINANCIAL ACCOUNTING STANDARDS BOARD (FASB) – The authoritative accounting
and financial reporting standard-setting body for business enterprises and not-for-profit
organizations. The FASB is the direct successor of the Committee on Accounting Procedure
and the Accounting Principles Board. The GASB and its predecessors have elected to apply
a number of the FASB’s standards, as well as those of its predecessors, to state and local
governments.
FRANCHISE FEE - a fee paid by public service utilities for use of public property in providing their services.
FUND - an accounting entity with a self-balancing set of accounts that record the financial transactions for specific
activities or government functions.
FUND ACCOUNTING - a governmental accounting system that is organized and operated under funds.
FUND BALANCE- the difference between assets and liabilities reported in a governmental fund.
GENERALLY ACCEPTED ACCOUNTING PRINCIPLES (GAAP) - Generally Accepted Accounting Principles
determines through common practice or as set forth by the Governmental Accounting Standards Board, Financial
Accounting Standards Board, or various other accounting standards setting bodies.
Page 306

GENERAL FUND - the fund used to account for all financial resources except those required to be accounted for by
other funds.
GENERAL OBLIGATIONS BOND (GOB) - bonds that finance a variety of public projects with the full faith and
credit of the City.
GOVERNMENT FINANCE OFFICERS ASSOCIATION (GFOA) - An association of public finance
professionals founded in 1906 as the Municipal Finance Officers Association. The GFOA has played a major role in
the development and promotion of GAPP for state and local government since its inception and has sponsored the
Certificate of Achievement for Excellence in Financial Reporting Program since 1946.
GOVERNMENTAL ACCOUNTING STANDARDS BOARD (GASB) - The ultimate authoritative accounting and
financial reporting standard-setting body for state and local governments. The GASB was established in June 1984 to
replace the National Council on Governmental Accounting.
GOVERNMENTAL FUNDS – funds generally used to account for tax-supported activities. There are five different
types of governmental funds: the general fund, special revenue funds, debt services funds, capital projects funds, and
permanent funds.
GRANT - a contribution by a government or other organization to support a particular function.
INFRASTRUCTURE - the underlying permanent foundation or basic framework.
INTEREST EARNINGS - the earnings from available funds invested during the year.
INTERGOVERNMENTAL REVENUES - revenues transferred from other governments, such as grants,
entitlements, etc.
LIABILITIES - debts or other legal obligations arising out of transactions in the past that must be liquidated, renewed,
or refunded at some future date.
LONG-TERM DEBT - unmatured debt of a government expected to be repaid from government funds.
MAINTENANCE - all materials or contract expenditures covering repairs and upkeep of City buildings, machinery,
equipment, systems, and land.
MATERIALS AND SUPPLIES - materials necessary to conduct departmental activities.
MODIFIED ACCRUAL ACCOUNTING - a basis of accounting in which revenues are recognized in the period in
which they become available and measurable. Expenditures are recognized in the accounting period in which the fund
liability is incurred.
OPERATING BUDGET - plans of current expenditures and the proposed means of financing them. Law requires
the establishment and use of an annual operating budget.
PART-TIME - employees who work less than 30 hours per week and are not entitled to full-time employee benefits.
PERFORMANCE MEASURES - Specific quantitative and/or qualitative measures of work performed within an
activity or program.
PERSONNEL SERVICES - the costs associated with compensating employees for their labor. This includes salaries
and fringe benefits.
PROPERTY TAXES - used to describe all revenues received from current taxes, delinquent taxes, penalties, and
interest on delinquent taxes. Levied according to property valuation and tax rate.
RESERVE - an account used to indicate that a portion of a fund balance is restricted for a specific purpose.
REVENUE - funds that a government receives as income.
RETAINED EARNINGS - earned surplus or accumulated earnings or unappropriated profit.
Page 307

RISK MANAGEMENT - an organized attempt to protect a government’s assets against accidental loss.
SPECIAL REVENUE FUND - a fund used to account for the proceeds of specific revenue sources that are legally
restricted to expenditures for specified purposes.
SUNDRY CHARGES - includes items that are not in the supply or maintenance category. May be for services
provided by private businesses, public utilities, contract labor, outside consultants, or damages against the City.
TAX BASE - the total value of all real and personal property in the City as of January 1st each year, as certified by
the Appraisal Review Board. This represents net value after exemptions.
TAX LEVY - the product when the tax base multiplies the tax rate per one hundred dollars.
TAX RATE - set by council and made up of two (2) components: debt service and operations rates.
TEXAS COMMISSION ON ENVIRIONMENTAL QUALITY (TCEQ) - Water and wastewater placed emitted
or extracted from the state’s water ways, such as but not limited to, lakes and streams is governed by this state
legislative body.
TEXAS MUNICIPAL RETIREMENT SYSTEM (TMRS) - This system is an agency created by the State of Texas
and administered in accordance with the Texas Municipal Retirement System Act, Subtitle G of Title 8, government
code as a retirement and disability pension system for municipal employees in the State of Texas. As much, TMRS is
a public trust fund, which has the responsibility of administering the System in accordance with the TMRS Act and
bears a fiduciary obligation to the State of Texas, the TMRS member cities and the public employees who are its
beneficiaries.
WORKING CAPITAL – is the amount of current assets less current liabilities.
Page 308

Chart of Accounts
Revised 05/26/16
10. Personnel Services
10-01: Supervisor salaries – Supervisors, whether salaried or hourly, include full-time managers, assistant
managers, administrative managers, department heads, foremen and supervisors. Salaries, including
vacation pay, of individuals filling these types of positions are budgeted and charged to this account.
10-02: Clerical salaries - Clerical positions include full-time secretarial, administrative assistant, clerical
(all types), office assistants and office aides. Salaries, including vacation pay, of individuals filling
these types of positions are budgeted and charged to this account.
10-03: Operational salaries – Operational positions are non-supervisory professional positions and
positions that perform operational aspects for the department and include accountants, animal
officers and attendants, fire fighters, police officers, IT technicians, inspections personnel, librarians,
skilled labor, semi-skilled labor, laborers, operators, meter readers, electricians, and other like titles.
Salaries, including vacation pay, of individuals filling these types of positions are budgeted and
charged to this account.
10-04: Maintenance salaries – Maintenance positions are defined as positions that perform various types
of maintenance as opposed to performing operational functions. These include grounds
maintenance, maintenance mechanic, equipment operator, skilled labor, semi-skilled labor, laborers
and any other positions that provide maintenance functions. Salaries, including vacation pay, of
individuals filling these types of positions are budgeted and charged to this account.
10-05: Part-time/temporary salaries – Part-time/temporary employees are employees of the City and
work less than 40 hours per week on a regular basis. Salary costs of all employees classified as part-
time/temporary are charged and budgeted to this account. (Does not include contract labor.)
10-06: Relief/step-up pay – Relief/step-up pay occurs when an employee of a lower payroll rank fills the
job a higher payroll rank for a temporary time frame. This frequently occurs within the fire
department. Salary costs for relief/step-up pay are charged and budgeted to this account.
10-07: Accrued sick leave – Accrued sick leave is sick leave that has been earned but not yet taken. It is a
liability to the City and is recorded at the end of the fiscal year for each department. This is not,
however, a budgeted account.
10-08: Overtime – Overtime is typically defined as hours worked in excess of 40 hours per week; for fire
employees, overtime are hours worked in excess of 212 hours in a 28-day cycle; and, overtime for
police officers is hours worked in excess of 160hours in a 28-day cycle. Overtime pay is budgeted
and charged to this account.
10-09: Certification pay – Certification pay is additional pay awarded certain positions that require
advanced training. (Please check with Human Resources for a list of positions requiring
certification.) All certification pay is budgeted and charged to this account.
10-10: Longevity – Longevity pay represents pay incentive for years of service. An employee receives $8
per month per year of service after his/her first year of employment. Longevity pay is budgeted and
recorded in this account.
Page 309

10-11: Sick leave – Sick leave is provided for full-time employees absent due to illness. Sick leave is not
budgeted since it cannot be estimated. When sick leave is taken, however, it is charged to this
account as opposed to the employee’s home salary account.
10-12: Vacation pay – Vacation pay represents pay received for vacation. Vacation leave is not budgeted.
When vacation leave is taken, however, it is charged to this account as opposed to the employee’s
home salary account. Vacation leave is earned as written in the Employee Handbook.
10-15: Car allowance – Certain positions receive car allowances either because the employee uses his/her
personal vehicle in conducting City business or as a condition of employment. Car allowance is
budgeted and recorded in this account.
10-16: Cleaning/Clothing allowance – Certain Police Department positions receive cleaning and/or
allowances for the maintenance of their uniforms and for clothing required for specific investigative
positions.
10-99:
Temporary Employees – Individuals who are considered temporary employees but are working
in budgeted positions are budgeted and charged to this account.
11. Benefits
11-01: FICA – FICA is the City's contribution/match toward the employees Social Security contribution.
All employees, except certain fire civil service employees are required to participate in Social
Security. The rate of contribution is computed by multiplying total salary (including overtime, step-
up and other pay), certificate pay, longevity pay and car allowance by the appropriate rate as dictated
by the Federal Government. All FICA costs are budgeted and charged to this account.
11-02: Retirement – Retirement is the City's contribution/match toward employees’ retirement, which
includesTexas Municipal Retirement System (TMRS). The City matches the TMRS employee
retirement contribution on a 2 to 1 basis. The City contribution rate fluctuates from year to year.
All City TMRS contributions are budgeted and charged to this account.
11-03: Workers compensation – Workers compensation is the premium cost to the City for carrying
workers compensation coverage on employees. This premium cost is budgeted and charged to this
account.
11-04: Health/life insurance – Health/life insurance includes the contribution to the Group Health
Insurance Fund from the various departments of the City for full-time employee health and life
insurance coverage. This is a benefit paid by the City on behalf of the employee. Health/life
insurance premiums are budgeted and charged to this account.
11-05: Unemployment insurance – Unemployment insurance represents premium cost to pay the
unemployment insurance coverage for employees. This account is used to budget and charge
unemployment insurance premiums.
11-07: Sick leave incentive – Sick leave incentive is a monetary reward given to employees for excellent
attendance. Amounts paid for sick leave incentive are budgeted and charged to this account.
11-12: Firemen’s Retirement – Retirement is City’s contribution toward employees’ retirement in the
Firemen’s Pension Fund. All City Firemen’s Pension Fund contributions are budgeted and charged
to this account.
20. Supplies
Page 310

20-01: Supplies – Supplies are expendable materials used in routine operations. Included are calculator
tape, pens, pencils, copy paper, envelopes, forms, exam forms/booklets, batteries (with the exception
of rolling stock and items with unit numbers), computer supplies and software, chemicals, cleaning,
light bulbs, A/C filters, medical, animal, shop, testing, education, and metal or descriptive signage.
Christmas lights and decorations, recreation and like items, such as gloves, volleyball nets, belt clips.
Halloween candy for downtown trick or treat, breakroom and kitchen supplies should be budgeted
in this line item. Hardware and lumber used to board up houses. This does not include lumber and
hardware such as nails, screws, etc. used in maintenance and repair of City property and equipment.
All supplies are budgeted and charged to this account.
20-03: Food supplies - Food supplies represent foodstuffs to be consumed in the course of business. They
include: coffee, water, soft drinks, and foods purchased for consumption at City meetings or
functions. Food supplies purchased and consumed under these guidelines are budgeted and charged
to this account. Meals consumed while traveling on city business are charged to account 50-06,
Travel and Training. Food items purchased for resale in concessions stands are charged to 20-
33. Food for City sponsored programs and public events should be budgeted in 50-40. 20-04: Uniforms – Uniforms include City provided work, fire and police uniforms as well as uniform
allowances for employees required to wear uniforms. Uniform costs, such as Sam Brown Keepers,
and hard hats are budgeted and charged to this account. Rain coats, rubber boots and other personal
protection equipment are charged to this account.
20-06: Motor vehicle fuel - Motor vehicle fuels include gasoline and diesel fuels consumed by the City's
fleet in the execution of City duties. Motor vehicle fuel is budgeted and charged to this account. 20-17: Books and Other publications– This account represents books, publications, periodicals,
newspaper and other printed materials used in the normal course of business. Included in this
account are legal and professional volumes, and library patron books – the value and purpose of
which extends over many years. Books meeting these criteria are budgeted and charged to this
account. Subscriptions to the Lufkin Daily News are charged to this account. Advertising and
promotions paid to Lufkin Daily News are charged to account 50-04.
20-21: Equipment – Equipment includes office, communications, technical, operational and maintenance
equipment not meeting capitalization criteria. It includes items such as printers, calculators, hand
tools, small motors, shop equipment, tool boxes for vehicles, telephone equipment, engineering tools
and equipment, desks, chairs, file cabinets, credenzas, equipment, park maintenance equipment, Zoo
animals, Recycle cans, air conditioners, etc. Equipment items are budgeted and charged to this
account.
20-30: Bar Supplies – Only for Convention Center, the Pines and LCVB use. Bar supplies includes all
the miscellaneous supplies need to stock the alcoholic beverage bar at the Convention Center
excluding all beverages.
20-31: Alcoholic Beverages – Only for Convention Center, the Pines and LCVB use.
20-32: Non-Alcoholic Beverages – Only for Convention Center, the Pines and LCVB use.
Page 311

20-33: Concessions Food & Supply - Food and supplies purchased for use in the resale of food items from
concession stands. This includes food, drinks and containers used to in their respective sale such as
cups, paper plates, wax paper wraps, Styrofoam containers, etc. This does not include cleaning
products such as soap, paper towels, Clorax, Lysol, etc.
40. Machinery/Equipment Maintenance 40-01: Buildings maintenance – Buildings maintenance includes the repair and maintenance of City
buildings as opposed to capital improvements. If the work is contracted, this includes materials and
labor. Items include painting, plumbing, lighting fixtures, lumber and hardware for repair, window
glass, electrical repair, roof repair, etc. Buildings maintenance items are budgeted and charged to
this account.
40-02: Machinery/equipment maintenance – Machinery and equipment include the maintenance and/or
repair of office, construction and field machinery and equipment such as backhoes, graders, and
other off-road machinery and equipment; bush hogs and mowers, calculators, defibrillators, guns,
air packs, power hand tools; fixed machinery and equipment such as tub grinders, chlorinators,
generators, time clocks, satellite screens, kitchen equipment, air conditioners. This account also
includes parts and maintenance agreements. If the work is contracted, this includes materials and
labor. Machinery/equipment repair and maintenance is budgeted and charged to this account.
40-03: Structures maintenance – Structures maintenance includes repair and maintenance to structures
(as opposed to capital improvements) such as water & sewer lines, streets, bridges, sidewalks,
parking lots, drainage, pools, ball fields, tennis courts, fences and other similar structures (Does not
include buildings). If the work is contracted, this includes materials and labor. Structure
maintenance items are budgeted and charged to this account.
40-04: Motor vehicles – Motor vehicles includes the maintenance and/or repair costs to licensed, on-road
vehicles such as scheduled and unscheduled maintenance and repair, parts and supplies as well as
commercial repairs. Motor vehicles maintenance/repair is budgeted and charged to this account.
Includes deductibles paid for insurance related repairs.
40-05: Furniture/fixtures maintenance – This account has been deleted and combined with either 40-
01 or 40-02.
40-18: Telephone/communications equipment maintenance - Telephone/ communications equipment
includes maintenance and repair of phone systems, cellular phones, pagers, faxes, modems, mobile
radios, TVs, cameras, VCRs, tape recorders, other similar equipment as well as maintenance
agreements on such equipment. If the work is contracted, this includes materials and labor.
Telephone/communications equipment maintenance is budgeted and charged to this account.
40-20: Computer equipment maintenance– This account includes maintenance and/or repair of desktop,
laptop, mainframe, and network computers; servers, routers, wireless antennas, lines, switches,
(personal computer) printers, scanners, and other equipment associated with computer equipment.
If the work is contracted, this includes materials and labor. It also includes maintenance agreements
for both hardware and software and annual software license renewals. Computer equipment
maintenance is budgeted and charged to this account.
40-21: Reproduction equipment maintenance - Reproduction equipment includes copiers and
combination copier/printer/scanner/fax equipment that are usually stand-alone pieces of equipment.
If the work is contracted, this includes materials and labor. Costs associated with the maintenance,
repair of reproduction equipment, as well as maintenance agreements are budgeted and charged to
this account.
Page 312
50. Services
50-01: Communication services – Communication services include monthly charges for telephone service
(including long-distance), pagers, cellular phones, telegraph, cable and/or satellite TV, Internet and
messenger service. Costs of communication services are budgeted and charged to this account.
50-02: Office and Equipment rental – Equipment rental includes the cost of renting any equipment or
office space on a recurring basis for a fee. It also includes tool allowance provided by the City to
mechanics. Office, construction and field equipment such as copier usage, copier leases, printers,
cable, notary bonds and renewals, backhoes, tractors, portable toilet rentals, etc. are budgeted and
charged to this account.
50-03: Insurance- Insurance expense allocated from prepaid insurance account.
50-04: Special services – Special services include accounting, legal, engineering, insurance, advertising,
medical exams, background checks, license checks, permit renewals, recording deeds, sports
officials' contract services, special investigations, jury duty, court costs, temporary personnel
services, janitorial services and rug rental/cleaning services, landscape services, and other similar
services. The cost of special services is budgeted and charged to this account.
50-05: Economic Development Corporation Only: Marketing Incentives
50-06: Travel and training – Travel and training includes transportation, registration, meals, lodging and
incidentals associated with required job training, professional conferences and similar job related
events. The cost associated with travel/training, as well as local mileage reimbursement for business
use of personal vehicle is budgeted and charged to this account.
50-12: Freight and delivery service – Freight/delivery service includes transportation costs associated
with product delivery to the City FOB shipping point, FedEx, UPS and other similar services. The
cost of freight and delivery service is budgeted and charged to this account.
50-13: Dues and memberships – Professional membership dues, including notary and other required
license, in work related organizations, directly related membership subscriptions to professional
periodicals, and other expenses are budgeted and charged to this account
50-14: Landfill charges – Charges incurred to dispose of solid waste at the County landfill are budgeted
and charged to this account.
50-21: Sewer service – Sewer service includes the sewer treatment service provided by City sewer
treatment facilities. Costs incurred for sewer treatment service is budgeted and charged to this
account.
50-22: Sanitation service – Sanitation service consists of solid waste and recycling pickup services. Costs
incurred for sanitation services are budgeted and charged to this account.
Page 313

50-23: Electric service – Electric service includes electric power, meter sets and related services provided
by electric power companies. Costs incurred for these services are budgeted and charged to this
account.
50-24: Heating fuel service – Costs incurred for natural gas, propane, butane and other heating fuel service
are budgeted and charged to this account.
50-40: Special Events – Costs incurred in the production of Special Events such as Bistro, Corks
and Forks, Tire Day, Electronic Recycling Day, Downtown Hoedown, Library Programs,
Zoo Programs, The Pines special events, etc. to capture the total costs of the event. This
also includes City sponsored programs and public events like July 4th. This includes all
supplies, rentals, food, and drinks specifically for the event. This does not include
consumable supplies which may be used for multiple events.
50-41: Equipment Amortization – Costs incurred for the replacement of equipment. Budgeted amounts
will be transferred to the Equipment Acquisition and Replacement Fund annually.
60. Other Charges
60-01: Contributions, gratuities and rewards – Items such as donations, contributions, prizes, and floral
arrangements are budgeted and charged to this account.
60-04: Judgments and damages - Judgments and damages include payment of legal judgments awarded
against the City and damages to property by the City either negotiated or awarded by the courts.
Costs incurred for judgments and damages are budgeted and charged to this account.
60-08: Other charges - This account includes miscellaneous charges not otherwise classified. Costs of this
nature are budgeted and charged to this account.
60-50: Bad debts - Bad debts are debts, notes and/or accounts receivables that are judged to be
uncollectable. Bad debts should be budgeted and charged to this account.
60-55: General & administrative charges – General and administrative (G&A) charges represent services
provided by departments of one Fund to departments of another Fund. G&A charges are budgeted
and charged to this account.
70. Debt Service (Finance Use Only)
70-01: Lease payment - principal -This account is used to record the principal portion of a lease purchase
payment.
70-02: Lease payment - interest - This account is used to record the interest portion of a lease purchase
payment.
70-03: Debt service - principal - This account is used to record the principal portion of a debt service
payment.
70-04: Debt service - interest - This account is used to record the interest portion of a debt service payment.
72. Transfer Accounts (Finance Use Only)
72-01: General Fund - This account is used to record transfers to the General Fund.
Page 314

72-02: Special Recreation Fund - This account is usedto record transfers to the Special Recreation Fund.
72-03: 1998 Tax & Rev CO's - This account is used to record transfers to the 1998 Tax & Revenue
Certificates of Obligation Fund.
72-09: Park Improvement Fund - This account is used to record transfers to the Park Improvement Fund.
72-17: Insurance Loss Fund - This account is used to record transfers to the Insurance Loss Fund.
72-20: Civic Center Fund - This account is used to record transfers to the Civic Center Fund.
72-21: Group Hospital Insurance Fund - This account is used to record transfers to the Group Hospital
Insurance Fund.
72-23: Home Grant Fund - This account is used to record transfers to the Home Grant Fund.
72-24: Animal Control-Kurth Grant - This account is usedto record transfers to the Animal Control Kurth
Grant Fund.
72-30: Street Construction Fund - This account is used to record transfers to the Street Construction Fund.
(Street Const Fund)
72-45: Revenue Bond Debt Service Fund - This account is used to record transfers to the Revenue Bond
Debt Service Fund (Rev Bad Debt Svc Fund).
72-53: Asbestos Pipe Replacement Fund - This account is used to record transfers to the Asbestos Pipe
Replacement Fund (Asbestos Pipe Replacement Fund).
72-54: 1997 Water & Sewer Improvements Fund - This account is used to record transfers to the 1997
Water & Sewer Improvements Fund. (1997 Water & Sewer Improvement Fund).
72-80: Water/Wastewater Renewal & Replacement Fund - This account is used to record transfers to
the Water/Wastewater Renewal and Replacement Fund (Water/Wastewater R&R Fund).
72-81: Water Construction Fund - This account is used to record transfers to the Water Construction Fund
(Water Const Fund).
72-82: Sewer Construction Fund - This account is used to record transfers to the Sewer Construction Fund
(Sewer Const Fund).
72-84: Solid Waste Renewal & Replacement Fund - This account is used to record transfers to the Solid
Waste & Recycling Renewal and Replacement Fund (Solid Waste R&R Fund).
80. Land & Improvements
80-01: Land – This account is used to budget and record the purchase of land and associated costs such as
appraisals, negotiations, surveys, abstracts, deed recordings, etc.
80-02: Improvements other than building – Improvements other than buildings include grading, leveling,
inspections, first sodding, plantings, terracing, etc. Expenditures associated with these items are
budgeted and charged to this account.
80-03: Engineering & design – Engineering and design includes architectural, engineering and design
services associated with construction and purchase of capital assets. Expenditures for these services
are budgeted and charged to this account.
Page 315

81. Buildings and Structures
81-01: Buildings – Buildings includes major repair and/or construction of new buildings that meet the
City’s capitalization policy. Buildings also include structures enclosing pumps, wells or electrical
equipment, but not the equipment. Expenditures for buildings are budgeted and charged to this
account.
81-02: Streets, structures – Streets, structures include streets, roadways, bridges, culverts, sidewalks and
associated items. Expenditures of this nature are budgeted and charged to this account.
81-06: Drainage improvements – Drainage improvements include storm sewers, drains, detention ponds
and other items associated with the transfer and control of rainwater. Costs associated with drainage
improvements are budgeted and charged to this account.
81-08: Utility relocation – Utility relocation includes relocation of water, sewer, electric and other utility
lines. Expenditures of this nature are budgeted and charged to this account.
81-10: Water storage facilities – Water storage facilities include ground and elevated water storage tanks,
supports, foundations, buildings, outbuildings. This account does not include piping, pumping and
other equipment required for storage construction. Costs associated with water storage facilities are
budgeted and charged to this account.
81-11: Water treatment facilities – Water treatment facilities include buildings, holding structures, piping,
retaining structures, purification structures; does not include equipment. Costs associated with water
treatment facilities, i.e. buildings and structures, are budgeted and charged to this account.
81-13: Water transmission, distribution lines – This account includes transmission and distribution lines
used to transport potable water from water wells to treatment facilities and from treatment facilities
to end-users. The cost includes the ditch digging, preparation, laying of the line, pressure testing,
covering and other costs necessary to deliver potable water from the source to the end user, whether
performed by force labor or contractor. All costs associated with water transmission and distribution
line construction are budgeted and charged to this account.
81-14: Water wells – Costs of water wells includes platform construction, drilling rigging, outbuildings
and other items associated with the building and structure of water wells, but do not include the
equipment and machinery necessary for operation. Costs meeting this definition are budgeted and
charged to this account.
81-16: Wastewater treatment facilities – Wastewater treatment facilities include the buildings, holding
ponds and structures, treatment structures. Not included in this account is machinery and equipment
attached to the structures and buildings necessary for operation. Costs meeting this definition are
budgeted and charged to this account.
81-17: Sewer collection lines – Sewer collection lines includes the cost of ditch digging, preparation, laying
of the line, pressure testing, covering and other costs necessary to transport wastewater from the
source to the treatment facility, whether performed by force labor or contractor. Costs meeting this
definition are budgeted and charged to this account.
81-30: Sewer lift stations – Sewer lift stations include the station structure and all costs associated with its
construction. It does not include machinery and equipment necessary for operation of the lift station.
All costs meeting this definition are budgeted and charged to this account.
Page 316

81-40: Other – This account is used to record all buildings and structures that do not meet the definitions
of other Buildings and Structures accounts, and includes structures such as swimming pools, tennis
courts, parking lots, play equipment, etc. Costs meeting this definition are budgeted and charged to
this account
82. Machinery and Equipment
82-01: Furniture and fixtures - Furniture and fixtures used in this context are defined as equipment, and
include desks, chairs, credenzas, tables and similar items meeting the City’s capitalization policy.
Costs meeting this definition are budgeted and charged to this account.
82-02: Machinery & equipment - Machinery and equipment include off-road machinery and equipment,
i.e. backhoes, graders, bush hogs, tractor mowers; fixed machinery, i.e. tub grinders, generators,
pumps; office equipment, i.e. paper shredders, calculators, copiers and playground equipment. This
account does not include water and wastewater treatment machinery and equipment or computer
equipment (meeting capitalization policy), which are covered in other accounts. Costs meeting this
definition are budgeted and charged to this account.
82-04: Motor vehicles - Motor vehicles include licensed on-road vehicles, such as automobiles, dump
trucks, pickups, tractor-trailer rigs, etc. Costs meeting this definition are budgeted and charged to
this account.
82-06: Water system equipment – Water treatment equipment include all machinery and equipment
necessary to produce, treat and convey water to meet potable water standards and includes pumps,
chlorinators, clarifiers, gauges, etc. Costs meeting this definition are budgeted and charged to this
account.
82-08: Wastewater treatment equipment - Wastewater system equipment includes all machinery and
equipment necessary to convey and treat wastewater to meet TNRCC standards and includes pumps,
chlorinators, clarifiers, digesters, gauges, etc. Costs meeting this definition are budgeted and
charged to this account.
82-12: Meters & sets – Meters and sets include the cost of setting the meters and boxes, including material
and labor. Costs of meters and sets are budgeted and charged to this account.
82-13: Communications equipment – Communications equipment includes purchase and installation
costs of communication systems (telephone, computer, radio frequency) and individual equipment
exceeding capitalization criteria. Costs meeting this definition are budgeted and charged to this
account.
82-14: Software – Software meeting the City’s capitalization criteria are to be budgeted and charged to this
account.
82-28: Books – Books include legal volumes, patron library book collections, rare book collections and
other volumes and collections that meet the city’s capitalization policy. Items meeting this definition
are budgeted and charged to this account.
85-99: Reclassification to PP&E - This account is used to reclassify fixed assets from various funds to
fixed assets in the fixed asset system, and is used only by the Finance department.
Page 317

FIXED ASSET POLICY (Abridged Version)
NEED FOR POLICY:
The City does not have established procedures to account for the purchase, transfer and disposal
of its property and equipment (fixed assets). These fixed assets represent a significant resource to
the City for accomplishing its services to the citizens.
PURPOSE OF POLICY:
This policy establishes comprehensive guidelines to account for the acquisition, transfer and
disposal of fixed assets for all City departments and ensure that the current physical characteristics
of property are accurately reflected in City records.
POLICY:
Fixed Assets are long-lived tangible assets obtained or controlled as a result of past transactions,
events or circumstances. Fixed assets include buildings, equipment, improvements other than
buildings, and land. For purposes of this policy, capitalization of an asset must meet the following
criteria:
1. $5,000 on tangible personal property (furniture, fixtures, vehicles, computers, off road
equipment, etc)
2. $50,000 on new infrastructure including water, sewer, streets, bridges, storm water
lines etc.,
3. For improvements to buildings, machinery & equipment, and vehicles the capital
outlay must be greater than $10,000 and either extend the useful life for 10 years or be
greater than 10% of the original cost of the asset
Example: Replace engine in backhoe for $13,500 and original cost was
$121,700—over $10,000 and greater than 10% of the original cost = capital. If
cost of the engine was less than $12,170 and was not expected to extend the life
for 10 years, the replacement would be maintenance.
Example: Replace roof on Main Fire Station for $27,000, original cost was
$18,000—over $10,000 and greater than 10% of the original cost and will more
than likely extend the useful life for 10 years = capital.
Fixed asset acquisitions shall be reviewed and only items meeting the City’s capitalization criteria
(fixed asset definition) shall be charged to capital accounts.
Page 318

Generally Accepted Accounting Principles (GAAP) will be followed in recording fixed asset
purchases (direct and capital lease), construction work-in-progress, asset retirement, accumulated
depreciation and depreciation expense.
MAJOR FIXED ASSET CATEGORIES:
Summary of Major Fixed Asset Categories:
Land 80-01: Is real property for which the City holds the title. The land cost
includes appraisals, survey costs, recording fees and other charges necessary to
acquire the land.
Buildings 81-01: Is a structure with a foundation and a roof that may or may not
have full enclosure.
Improvements other than buildings 81-02 through 81-40: Are those that are not
specifically identifiable as the costs to build a building. Assets that are normally
included in this category are grading, paving, fencing, playground and picnic
equipment, landscaping, irrigation systems, concrete work, miscellaneous
structures, plumbing and electrical. Also included are utility improvements such as
water and sewer transmission, distribution and collection lines, lift stations,
pumping stations, etc.
Machinery and equipment 82-02: Is property that is complete within itself and is
not a component (HVAC, plumbing, electrical, etc) of a building. Machinery and
equipment such as backhoes, graders, caterpillars, bulldozers, portable generators,
copiers, PCs, PC systems, table saws, welding machines, are examples of items
included here.
Computer Software 82-14: (A component of Machinery and equipment)
Computer software, fixed assets, are purchased programmed computer
instructions (application software) having a cost of at least $10,000 and a
useful life of greater than one year. Software developed by City staff is not
recorded as a fixed asset unless it meets certain criteria to be determined.
Vehicles 82-04: Is road worthy equipment required to be licensed such as a car,
bus, pickup truck, dump truck, motorcycle, or van used for transportation of City
employees in the performance of their job duties.
**FIXED ASSETS PURCHASED UNDER CAPITAL LEASE: (Not in Use in FY 2015)
A leased item must meet one (1) or more of the following criteria to be considered a fixed asset:
Page 319
Transfer of ownership: Ownership transfers to the City by the end of the lease term.
Lease purchase option: Lease has a bargain purchase option (i.e. substantially less than
fair market value).
Lease term: The lease term is 75% or more of the leased property’s estimated economic
life.
Present value: The present value of the minimum lease payment at the inception of the
lease, excluding executory cost, is 90% or more of the fair market value of the leased
property.
ASSET ACQUISITION AND COST BASIS DETERMINATION:
Definition of Acquisition: Obtaining title to a fixed asset by direct purchase, capital lease
agreement, construction, donation, transfer, improvement, or condemnation.
Direct purchase: the purchase price plus the costs necessary to place the asset in use.
Capital Lease: the lesser of the present value of lease payments or the fair value of the
leased property. If no interest rate is stated in the lease, the discount rate should be the
incremental borrowing rate for the City as determined by the Finance Department.
Construction: the costs incurred during construction of an asset including those costs
necessary to place the asset in service.
Developer Contributions: the developer’s cost basis for the construction of the asset.
Donation: the fair market value of the asset on the date of the donation; the assessed value
shall be used for land donations.
Transfer: transfers between departments or locations are recorded at a cost no greater
than net book value (cost less accumulated depreciation), the basis in the City’s records at
the time of transfer.
Improvements: costs for asset improvements are added to the cost basis if they result in
one of the following changes:
Additional or more valuable asset services
Extension of economic life of the asset
Condemnation: fixed assets acquired through condemnation or the right of eminent
domain is recorded at the cost deemed to be fair compensation for the property.
Cost Basis by Asset Category:
Land: includes the acquisition price, legal and title fees, survey, appraisal and recording
fees, any unpaid taxes assumed, negotiation costs, etc.
Buildings: include acquisition cost, costs of all fixtures permanently attached and made
part of the building, and any other costs required to prepare the asset for its intended use.
The recorded cost for a constructed building includes contractor payments, in-house labor
cost, professional fees for architects, attorneys, appraisers, and financial advisors, damage
claims, insurance, and other costs incurred during the period of construction required to
prepare the asset for its intended use.
Page 320

Improvements other than buildings: include construction costs, including materials and
labor and other charges incurred to prepare the asset for its intended use.
Machinery and Equipment: include acquisition cost plus trade-in allowance, freight,
taxes, installation costs, and other charges incurred to place the asset in use.
PCs/PC Systems: include equipment, software, and other costs incurred to
prepare the asset for its intended use with some distinct rules and exceptions:
All hardware costs for a new PC system (even if purchased from
different vendors) is included in the cost of the fixed asset if the total
value is $1,000 or more.
Printers are recorded as a separate fixed asset if the cost is $1,000 or
more; otherwise, printers may be recorded as a controllable (see
Appendix B) asset or not recorded at all.
The cost of individual PC components such as monitors and
upgrades not purchased as part of the new system will be recorded
as a separate fixed asset if the cost is $1,000 or more.
If PC systems include software that is not separately priced by the
vendor, the software is considered to have no cost value and is
recorded as part of the fixed asset.
Computer Software: include contract price, payments for modifications,
training, etc. required to prepare the software for use.
Vehicles: include the purchase price of the vehicle, delivery charges and any of the
ancillary costs required to put the vehicle in service.
CONTROLLABLE ASSETS:
Definition: A controllable asset is an asset that does not meet the City’s criteria for a fixed asset,
but due to the nature of the item, such as high likelihood of theft or compliance with state or federal
guidelines, greater accountability is required. A controllable asset is tangible property with a value
of less than $1,000 and an expected useful life of one year or more. A minimum value of $500 is
recommended for recording controllable assets.
Responsibility: The department director will work with Finance to determine what additional
types of assets should be included on the system as controllable assets. Basic criteria for
determining that an asset is a controllable asset are:
Page 321

Will the loss of the asset be obvious or will you need a fixed asset inventory
to determine that it is missing?
Do state or federal guidelines require it to be tracked?
Is the nature of the asset such that it needs to be tracked?
Is the asset likely to be missing in this department’s environment?
Departments may have other criteria that need to be considered due to their specific operations.
Controllable assets are subject to the same requirements as fixed assets regarding security,
maintenance, and utilization. The owner department assumes responsibility for tracking and
recording controllable assets. Controllable assets will not be reported in the City’s audited
financial statements.
Page 322

Department
Fiscal
2014
Fiscal
2015
Fiscal
2016
Fiscal
2017
Fiscal
2018
General Government
Full Time 2 2 2 2 2
Part Time 0 0 0 0 0
Total 2 2 2 2 2
Administration
Full Time 3 3 3 3 3
Part Time 0 0 0 0 0
Total 3 3 3 3 3
Finance
Full Time 7 10 10 10 10
Part Time 0 0 0 0 0
Total 7 10 10 10 10
Legal
Full Time 2 2 2 2 2
Part Time 0 0 0 0 0
Total 2 2 2 2 2
Municipal Court
Full Time 7 7 7 6 6
Part Time 1 1 1 0 0
Total 8 8 8 6 6
City Marshall
Full Time 0 0 0 1 1
Part Time 0 0 0 1 1
Total 0 0 0 2 2
Human Resources
Full Time 5 5 5 6 6
Part Time 0 0 0 0 0
Total 5 5 5 6 6
City of LufkinFive-Year Personnel History
Page 323

Department
Fiscal
2014
Fiscal
2015
Fiscal
2016
Fiscal
2017
Fiscal
2018
Building Services
Full Time 2 2 2 2 2
Part Time 0 1 1 1 1
Total 2 3 3 3 3
Information Technology
Full Time 6 7 7 7 7
Part Time 0 0 0 0 0
Total 6 7 7 7 7
Police
Full Time 99 99 100 100 100
Part Time 1 1 1 1 1
Total 100 100 101 101 101
Fire
Full Time 81 81 80 80 80
Part Time 0 0 0 0 0
Total 81 81 80 80 80
Inspection Services
Full Time 8 8 8 8 8
Part Time 0 0 0 0 0
Total 8 8 8 8 8
Animal Control
Full Time 10 10 11 11 11
Part Time 0 0 0 0 0
Total 10 10 11 11 11
Engineering
Full Time 9 9 9 9 7
Part Time 0 0 0 0 0
Total 9 9 9 9 7
(Continued)
City of LufkinFive-Year Personnel History
Page 324

Department
Fiscal
2014
Fiscal
2015
Fiscal
2016
Fiscal
2017
Fiscal
2018
Streets
Full Time 34 34 34 34 34
Part Time 1 1 1 1 1
Total 35 35 35 35 35
Parks & Recreation
Full Time 27 27 27 27 27
Part Time 5 5 5 5 5
Total 32 32 32 32 32
Fleet Maintenance
Full Time 7 7 7 7 7
Part Time 0 0 0 0 0
Total 7 7 7 7 7
Planning & Zoning
Full Time 3 3 3 3 3
Part Time 0 0 0 0 0
Total 3 3 3 3 3
Community Development (Main Street)
Full Time 3 3 3 3 0
Part Time 0 0 0 0 0
Total 3 3 3 3 0
Ellen Trout Zoo
Full Time 24 24 24 24 24
Part Time 3 3 2 2 2
Total 27 27 26 26 26
Kurth Memorial Library
Full Time 9 10 10 10 10
Part Time 8 6 6 6 6
Total 17 16 16 16 16
City of LufkinFive-Year Personnel History
(Continued)
Page 325

Department
Fiscal
2014
Fiscal
2015
Fiscal
2016
Fiscal
2017
Fiscal
2018
Utility Collections
Full Time 12 12 12 12 12
Part Time 0 0 0 0 0
Total 12 12 12 12 12
Wastewater Treatment
Full Time 20 20 20 20 20
Part Time 1 1 1 1 1
Total 21 21 21 21 21
Water Production
Full Time 1 1 1 1 1
Part Time 1 1 1 1 1
Total 2 2 2 2 2
Water/Sewer Utilities
Full Time 38 38 37 37 39
Part Time 0 0 0 0 0
Total 38 38 37 37 39
Solid Waste
Full Time 26 26 26 26 27
Part Time 0 0 0 0 0
Total 26 26 26 26 27
Recycling
Full Time 7 7 7 7 7
Part Time 0 0 0 0 0
Total 7 7 7 7 7
City of LufkinFive-Year Personnel History
(Continued)
Page 326

Department
Fiscal
2014
Fiscal
2015
Fiscal
2016
Fiscal
2017
Fiscal
2018
Convention Center
Full Time 8 8 8 8 8
Part Time 0 0 0 0 0
Total 8 8 8 8 8
Special Recreation Fund
Full Time 0 0 0 0 0
Part Time 25 25 25 25 25
Total 25 25 25 25 25
Economic Development
Full Time 2 2 2 2 2
Part Time 0 0 0 0 0
Total 2 2 2 2 2
Lufkin Convention & Visitor Bureau
Full Time 2 2 2 2 3
Part Time 0 0 0 0 0
Total 2 2 2 2 3
Total Full Time 464 469 469 470 469
Total Part Time 46 45 44 44 44
Total Employees 510 514 513 514 513
Five-Year Personnel History
(Continued)
City of Lufkin
Page 327

C
osts
Allo
cate
dE
ST
.
Perc
en
tF
Y 2
016
Perc
en
tF
Y 2
017
Perc
en
tF
Y 2
018
Co
st
Cen
ter
to G
en
era
lB
ud
get
to G
en
era
lB
ud
get
to G
en
era
lB
ud
get
Cit
y C
ou
ncil/C
ity
Secre
tary
23%
81,8
64.3
6$
23%
86,1
80.7
7$
25%
92,3
45.2
5$
Cit
y A
dm
inis
trati
on
35%
176,2
43.5
5$
35%
182,8
57.1
5$
42%
223,7
70.9
6$
Fin
an
ce
36%
273,5
77.6
8$
36%
284,6
28.2
4$
40%
312,9
44.4
0$
Leg
al
26%
75,6
44.9
2$
26%
78,9
01.4
2$
30%
92,4
26.4
0$
Hu
man
Reso
urc
es/P
urc
hasin
g43%
173,5
78.9
6$
43%
191,2
21.0
0$
45%
202,5
78.7
5$
Mu
nic
ipal B
uild
ing
16%
49,7
88.3
2$
16%
50,5
75.0
4$
20%
65,1
35.2
0$
Info
rmati
on
Tech
no
log
y33%
379,0
97.7
3$
33%
370,0
31.3
1$
35%
396,8
54.8
5$
Fir
e D
ep
art
men
t (1
)
Insp
ecti
on
Serv
ices
42%
228,2
53.2
0$
42%
232,7
81.6
4$
45%
249,1
90.2
0$
Em
erg
en
cy
Man
ag
em
en
t25%
12,3
87.5
0$
25%
12,6
55.0
0$
25%
12,4
63.7
5$
En
gin
eeri
ng
63%
468,1
73.1
6$
63%
483,5
72.2
5$
65%
424,2
64.7
5$
Str
eet
9%
344,2
04.5
5$
9%
346,5
54.5
4$
11%
425,3
52.8
4$
Fle
et
Main
ten
an
ce
33%
122,8
55.3
7$
33%
121,0
32.4
5$
35%
143,8
24.1
0$
To
tal to
Gen
era
l2,3
85,6
69.3
0$
2,4
40,9
90.8
1$
2,6
41,1
51.4
5$
1 H
yd
ran
t M
ain
ten
an
ce
CIT
Y O
F L
UF
KIN
WA
TE
R/W
AS
TE
WA
TE
R F
UN
D
Fis
cal 2
016, 2017 a
nd F
iscal 2018 G
enera
l &
Adm
inis
trative C
harg
es C
om
pari
son
Page 328

C
osts
Allo
cate
dE
ST
.
Perc
en
tF
Y 2
016
Perc
en
tF
Y 2
017
Perc
en
tF
Y 2
018
FY
2018 B
ud
get
Co
st
Cen
ter
to G
en
era
lB
ud
get
to G
en
era
lB
ud
get
to G
en
era
lB
ud
get
Cit
y C
ou
ncil/C
ity
Secre
tary
17%
60,5
08.4
4$
17%
63,6
98.8
3$
20%
73,8
76.2
0$
369,3
81
Cit
y A
dm
inis
trati
on
42%
211,4
92.2
6$
42%
219,4
28.5
8$
40%
213,1
15.2
0$
532,7
88
Fin
an
ce
33%
250,7
79.5
4$
33%
260,9
09.2
2$
38%
297,2
97.1
8$
782,3
61
Leg
al
30%
87,2
82.6
0$
30%
91,0
40.1
0$
30%
92,4
26.4
0$
308,0
88
Hu
man
Reso
urc
es/P
urc
hasin
g40%
161,4
68.8
0$
40%
177,8
80.0
0$
35%
157,5
61.2
5$
450,1
75
Mu
nic
ipal B
uild
ing
6%
18,6
70.6
2$
6%
18,9
65.6
4$
5%
16,2
83.8
0$
325,6
76
Info
rmati
on
Tech
no
log
y33%
379,0
97.7
3$
33%
370,0
31.3
1$
35%
396,8
54.8
5$
1,1
33,8
71
Em
erg
en
cy
Man
ag
em
en
t25%
12,3
87.5
0$
25%
12,6
55.0
0$
25%
12,4
63.7
5$
49,8
55
En
gin
eeri
ng
12%
89,1
75.8
4$
12%
92,1
09.0
0$
25%
163,1
78.7
5$
652,7
15
Str
eet
8%
305,9
59.6
0$
8%
308,0
48.4
8$
14%
536,0
21.9
2$
3,8
66,8
44
Fle
et
Main
ten
an
ce
33%
122,8
55.3
7$
33%
121,0
32.4
5$
40%
164,3
70.4
0$
410,9
26
Main
Str
eet
22%
39,3
94.0
8$
22%
39,7
69.8
4$
22%
-$
-
To
tal to
Gen
era
l1,7
39,0
72.3
8$
1,7
75,5
68.4
5$
2,1
23,4
49.7
0$
Tra
nsfe
r to
Wate
r an
d S
ew
er
Fu
nd
15%
119,8
03.3
5$
15%
123,5
72.1
0$
15%
129,1
85.8
5$
1,8
58,8
75.7
3$
1,8
58,8
75.7
3$
2,2
52,6
35.5
5$
CIT
Y O
F L
UF
KIN
SO
LID
WA
ST
E &
RE
CY
CL
ING
FU
ND
Fis
cal 2
016, 2017 a
nd F
iscal 2018 G
enera
l &
Adm
inis
trative C
harg
es
Com
pari
son
Page 329

Cost
Center
FY2018 Dept
Budget
Dept Budget
as Percent of
Total General
Fund
Appropriation
($33246531)
Economic
Development to
Total General
Fund
Appropriation
Estimated
FY2018 Budget
City Council/City Secretary 369,381$ 1.11% 60,550$ 670$
City Administration 532,788$ 1.60% 60,550$ 970$
Finance 782,361$ 2.35% 60,550$ 1,420$
Legal 308,088$ 0.93% 60,550$ 560$
Human Resources/Purchasing 450,175$ 1.35% 60,550$ 820$
Municipal Building 325,676$ 0.98% 60,550$ 590$
Information Technology 1,133,871$ 3.41% 60,550$ 2,070$
Engineering 652,715$ 1.96% 60,550$ 1,190$
Street 3,866,844$ 11.63% 60,550$ 7,040$
Total to General 8,421,899$ 15,330$
Economic Development Budget FY2018 1,418,790
General Fund Budget FY2018 33,246,531
Relationship between Economic Development/General Fund Appropriation in % 4.27%
Relationship between Economic Development/General Fund Appropriation in $ 60,550
CITY OF LUFKIN
ECONOMIC DEVELOPMENT
Fiscal 2018 General & Administrative Charges Comparison
Page 330

Cost
Center
FY2018 Dept
Budget
Dept Budget
as Percent of
Total General
Fund
Appropriation
LCVB Total to
Total General
Fund
Appropriation
Estimated
FY2018 Budget
City Council/City Secretary 369,381$ 1.11% 10,660$ 120$
City Administration 532,788$ 1.60% 10,660$ 170$
Finance 782,361$ 2.35% 10,660$ 250$
Legal 308,088$ 0.93% 10,660$ 100$
Human Resources/Purchasing 450,175$ 1.35% 10,660$ 140$
Municipal Building 325,676$ 0.98% 10,660$ 100$
Information Technology 1,133,871$ 3.41% 10,660$ 360$
Engineering 652,715$ 1.96% 10,660$ 210$
Street 3,866,844$ 11.63% 10,660$ 1,240$
Total to General 8,421,899$ 2,690$
Lufkin Convention & Visitor Bureau Budget FY2018 595,435
General Fund Budget FY2018 33,246,531
Relationship between LCVB / General Fund Appropriation in % 1.79%
Relationship between LCVB / General Fund Appropriation in $ 10,660
CITY OF LUFKIN
LUFKIN CONVENTION & VISITOR BUREAU
Fiscal 2018 General & Administrative Charges Comparison
Page 331

Page 332