annual meeting - erie 1 boces · district/ school name administrative instructional support ......
TRANSCRIPT

Annual Meeting 2012 For Schools East of Buffalo

Welcome Susan A. Lawkowski, Ed.D. Trust Chair

Trustees Labor Management John Pope Susan Lawkowski, Ed.D. (Chair) Kathleen Ballard James Fregelette (Vice Chair) Joseph Borgisi Nancy Bojanowski Scott Decker Doreen Casacci Cynthia Kapturowski Melody Jason

State of the Trust Darleen Michalak, Ph.D. Plan Administrator/Ex officio Trustee

NY44 Health Benefits Plan Trust
Darleen A. Michalak, Ph.D. Plan Administrator/Ex Officio Trustee Erie 1 BOCES 355 Harlem Road West Seneca, NY14224
Presented By:
Annual Meeting—State of the Trust

2003-2004 -2012-2013: 10 YEARS!!!!!!
6
NY44 Health Benefits Plan Trust (formerly Erie 1 BOCES Health Benefits Plan Trust) based on Article 44 of NYS Insurance Law
• Labor/ Management Arrangement • Partnership with Health Insurance Companies
for medical claims: Nova/ Independent Health for WNY and MVP for East of Buffalo
• Partnership for payment of pharmacy claims: Pharmacy Benefit Dimensions
• Amazing Growth in 10 Years

7
0
1000
2000
3000
4000
5000
6000
7000
8000
9000
10000
7/1/2003 7/1/2004 7/1/2005 7/1/2006 7/1/2007 7/1/2008 7/1/2009 7/1/2010 7/1/2011 7/1/2012 11/1/2012
700 750 800
1400
1900
3100
5500
6600
8000
9300
10000
Enrollment from Fiscal Year 2003 - 2013

8
District/ School Name Administrative Instructional Support
Akron X X
Alden X X X
Charter School for Applied Technologies X X X
Cheektowaga X X X
Cheektowaga-Maryvale X X X
Cheektowaga-Sloan X X X
Cleveland Hill X X X
Community Charter School X X X
Depew UFSD X
Ellicottville X
Elmwood Franklin School X X X
Erie 1 BOCES X X X
Frontier X X
Gowanda X X X
Grand Island X X X
Hamburg X X X
Iroquois X X X
Kadimah X X X
Kenmore-Tonawanda X
Lackawanna X X X
Lewiston-Porter X X X
Niagara Falls City X X X
North Collins X X X
Pinnacle X X X
Pioneer X X X
Springville Griffith Institute X X X
St. Francis High School X X X
Sweet Home X X X
The Park School X X X
West Seneca X
Represents Districts/ Schools with 100% participation
Western New York Schools

9
Schools East of Buffalo District/ School Name Administrative Instructional Support
Alfred-Almond X X X
Canajoharie CSD X X X
Canisteo-Greenwood X X X
Fulton Montgomery Community College X X
** Franklin CSD X X X
North Rockland CSD X X X
Represents Districts/ Schools with 100% participation
As of November 1, 2012 there are 35 schools/ districts with 94 separate units
**As of January 1, 2013 there will be 36 schools/ districts with 97 separate units

10
K-12 Enrollment Trend

Trust Objectives Remain the Same:
• Cut costs for health insurance coverage, NOT health coverage benefits
• Work collaboratively with labor units, school management and TPAs
• Enhance benefits for enrollees, when possible
• Focus on health and wellness
Comply with Patient Protection Affordable Care Act legislation
11

12
Cost Containment

13
Annual Rate Increases Plan Year
Single Contribution (Monthly)
Family Contribution (Monthly)
Percent Increase
Total Annual Cost Avoidance for Erie 1 BOCES
2003-2004 253.45$ 702.04$ 8.0% 355,424.64$
2004-2005 264.18$ 731.97$ 4.8% 627,709.44$
2005-2006 278.81$ 767.82$ 5.3% 1,191,137.64$
2006-2007 305.30$ 829.25$ 8.5% 1,729,859.64$
2007-2008 332.50$ 903.00$ 8.9% 2,345,672.52$
2008-2009 369.10$ 975.25$ 9.5% 2,897,929.92$
2009-2010 407.32$ 1,068.03$ 9.5% 2,461,879.44$
2010-2011 439.50$ 1,185.00$ 9.5% 2,418,795.84$
2011-2012 479.50$ 1,266.00$ 7.9% 2,790,529.92$
2012-2013* 497.00$ 1,322.00$ 4.9% 3,412,936.20$ 20,231,875.20$ Total Cost Avoidance 2003-2013
*Year 2012-2013 estimated cost containment based on June 2012 enrollment in NY44 Trust plan

Estimated Cost Containment 2003 – 2012 for All Schools
Approximately $75 million
Rate increases remain under 10%
For schools in Western New York with Nova/Independent Health, rates ranged from 4.8% to 9.5%
14

Fiscal Challenges for Schools Continue
• Annual decreases in revenue from federal and state sources are leading to budget cuts for schools
• Declining student enrollments are impacting school operations
• Cap on Property Taxes limits revenue source for some schools
• Increased costs for retirement, insurance, health benefits impact schools 15

Annual Employer Contribution Rate NYS Employees’ Retirement System (ERS)
Year ERS Rate
2013-14……………………………………………………………..20.9% 2012-13……………………………………………………………..18.9% 2011-12……………………………………………………………..16.3% 2010-11……………………………………………………………..11.9% 2009-10…………………………………………………………….. 7.4% 2008-09…………………………………………………………….. 8.5% Source: Office of the State Comptroller On Board, 9/10/2012
16

17
Healthcare Cost Trends
National Data Source: “Segal Health Plan Cost Trend Survey,” 2005-2012 Local Data Source: Independent Health’s Trending Information for Large Group Populations, 2005-2012 Catholic Health Cost Trends

18
Enhanced Benefits
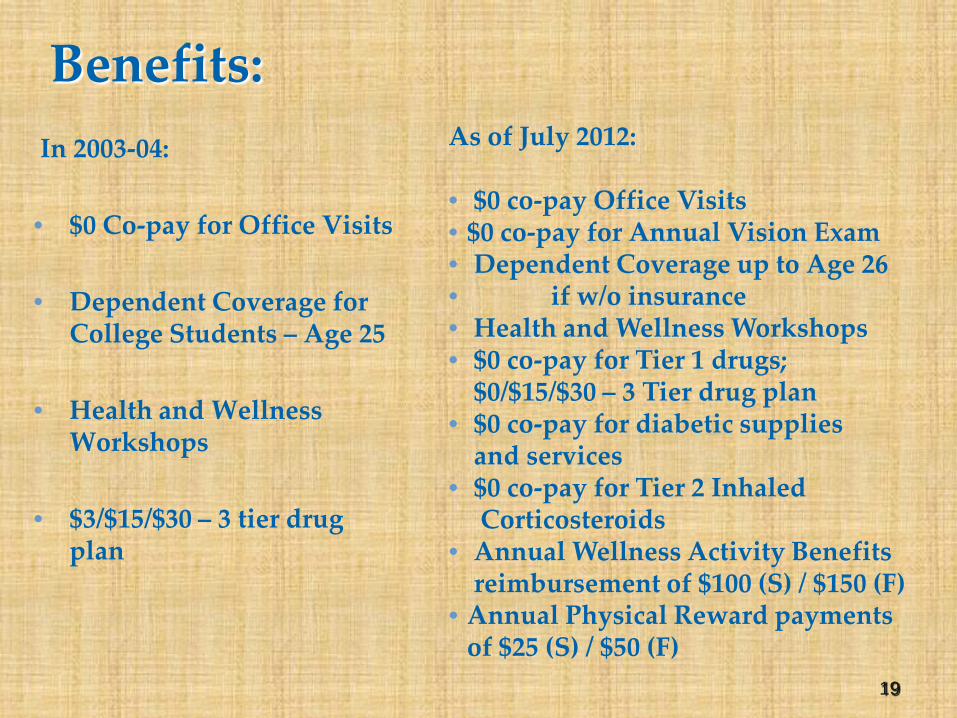
Benefits: In 2003-04: • $0 Co-pay for Office Visits
• Dependent Coverage for
College Students – Age 25
• Health and Wellness Workshops
• $3/$15/$30 – 3 tier drug plan
As of July 2012: • $0 co-pay Office Visits • $0 co-pay for Annual Vision Exam • Dependent Coverage up to Age 26 • if w/o insurance • Health and Wellness Workshops • $0 co-pay for Tier 1 drugs;
$0/$15/$30 – 3 Tier drug plan • $0 co-pay for diabetic supplies
and services • $0 co-pay for Tier 2 Inhaled
Corticosteroids • Annual Wellness Activity Benefits
reimbursement of $100 (S) / $150 (F) • Annual Physical Reward payments
of $25 (S) / $50 (F)
19

Focus is on the Partnership between Patient and Physician
• The primary care physician (PCP) is, or should be, the central figure in helping us receive the best possible health care outcomes
• PCPs will guide us to or provide directly preventive services at all levels
• Everyone needs a trusted PCP • Technology is enabling PCPs to do their
work more efficiently and more effectively
20

21
Staffing and Consultants

Staffing in 2003-04:
• Plan Administrator
• Secretary
• Fiscal Agent
• Health/ Claims Consultant • Legal Advisor
22
Staffing Today:
• Plan Administrator/ Ex-Officio Trustee
• Secretary/ Administrative
Assistant/ Wellness Representative
• Fiscal Agent/ Software Trainer
• Health Benefits/ Claims Analyst

23
Consultants to the Trust 2012
• Legal Consultant(s) (Dave Hoover, et al.)
• Communications Consultant (Lori Sosenko)
• Claims Auditor Consultant (Cathe MacInnes)
• Medical Consultant (Dr. Len Katz)
• Actuarial Consultants (Harbridge Consulting Group)
• Auditors (Bahgat & Laurito-Bahgat)
• Stop Loss Provider (Standard Security)
• Specific Claims Reviewer (Global Excel)
• Financial Consultant (Morgan Stanley) • Disease Management Consultants (Marsh & McLennan/ Verisk)
• Third Party Administrators for Claims - Medical (Nova/ Independent
Health and MVP) Pharmacy (Pharmacy Benefit
Dimensions/ Independent Health)
• Manning & Napier Information Service (Benefit Assistant)

24
New York State Department of Financial Services Audit
Of Our Financial Conditions from 2008-2009
FINALLY COMPLETED….

25
Summary and Conclusions (minor recommendations)
• Written notification to Department within 10 days of changes in Trustee membership and plan amendments • Providing copy of annual report to each employee-member • Examiners need to review claims and have access to claims files

What’s Next: • Additional potential schools/bargaining units joining the Trust
• New York State Community Colleges • Charter Schools
• Dental plan option for participating districts is growing • Out of Network dentists now paid as if in-network
• Researching Additional Enhancements (i.e. adjusting co-pays for certain medications and enhancing wellness benefits)
• Provide greater assistance (especially to school Benefit Administrators) with enrollment issues through audits
• Research new revenue sources and opportunities: Retiree Drug Subsidy (RDS) and Early Retiree Reinsurance Program – (ERRP)
• Greater collaboration with consultants and schools
• Option B effective January 1, 2013
26

Finances Alice B. Riley Fiscal Agent/Software Program Trainer


Investments Peter Mye Financial Consultant Morgan Stanley
NY44 Health Benefits Plan Trust General Investment Portfolio Review
Annual Meeting October 22, 2012
Peter W. Mye Senior Vice President
Morgan Stanley


AllianceBernstein.com For financial representative use only. Not for inspection by, distribution or quotation to, the general public.
Scenario 2: Lack of Fiscal Action
CBO Alternative Scenario Percent of GDP Fiscal Years
Historical analysis does not guarantee future results. Left and middle graphs as of August 22, 2012. Right graph as of September 30, 2012 *Includes capital gains and dividends Source: Congressional Budget Office
15
16
17
18
19
20
21
22
23
24
12 14 16 18 20 22 Years
Receipts
Outlays
Perc
ent Deficit
Scenario 1: Fiscal Tightening
CBO Baseline Percent of GDP Fiscal Years
15
16
17
18
19
20
21
22
23
24
12 14 16 18 20 22 Years
Perc
ent Receipts
Outlays
Deficit $320
$115
$40 $25
$95
$50
Bush Tax Cuts & Alternative Minimum Tax*
Payroll Taxes
Investment Tax Credits
Medicare Tax Increases
Spending Cuts
Extended Unemployment Compensation
Fiscal Cliff Components
The Fiscal Cliff Looms Large
41 41
USD Billions

Actuaries’ Update Monica Cecilia, Lisa Engler Harbridge Consulting Group

Solving Tomorrow’s Benefit Plan Challenges...Today
NY44 Health Benefits Plan Trust
2012 Annual Meeting
October 2012

Harbridge Consulting Group, LLC 44
Agenda
Who is Harbridge Consulting Group?
Our Services & Expertise NY44 Health Plan Health Care Reform
District Service Offerings
Questions

Harbridge Consulting Group, LLC 45
Harbridge Consulting Group, a BPAS Company
BPAS
Harbridge Consulting Group- HQ in Syracuse NY, with offices in New York, Philadelphia, East Hanover NJ and Houston – 67 employees – 25 credentialed actuaries – 30+ years of history
Community Bank Systems, Inc. owns BPAS which has 200+ employees and serves more than 1,500 clients.
BPAS includes: – Harbridge Consulting Group – Actuaries & Advisors – BPA – Daily Valuation Plans – Hand Benefits & Trust – Flex Corp
Harbridge Consulting Group, LLC 46
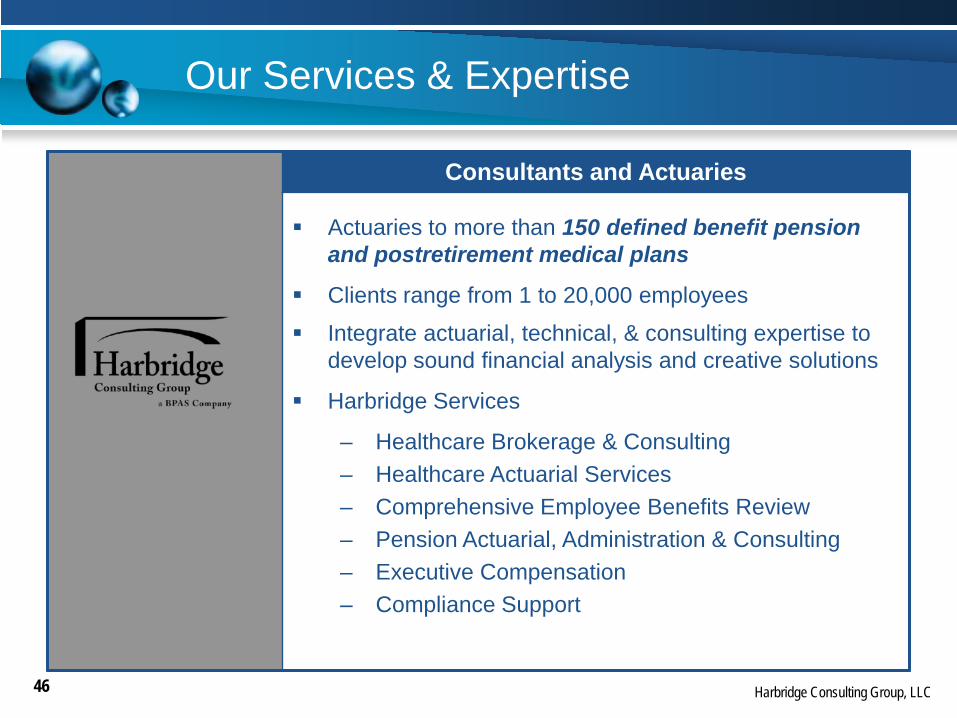
Our Services & Expertise
Consultants and Actuaries
Actuaries to more than 150 defined benefit pension and postretirement medical plans
Clients range from 1 to 20,000 employees
Integrate actuarial, technical, & consulting expertise to develop sound financial analysis and creative solutions
Harbridge Services
– Healthcare Brokerage & Consulting – Healthcare Actuarial Services – Comprehensive Employee Benefits Review – Pension Actuarial, Administration & Consulting – Executive Compensation – Compliance Support

Harbridge Consulting Group, LLC 47
Our School District Experience
A Listing of Consulting/Actuarial School District Clients • Adirondack CSD • Alexandria CSD • Amherst CSD • Arlington CSD • Beaver River CSD • Bedford Central Schools • Belleville-Henderson CSD • Bethlehem CSD • Burnt Hills-Ballston Lake CSD • Carmel Central Schools • Carthage CSD • Cayuga-Onondaga Area School
Employees‘ • City School District of Albany • Cobleskill-Richmondville CSD • Cohoes CSD • Cold Spring Harbor CSD • Copenhagen CSD • Dover CSD • Dutchess Co BOCES • East Williston UFSD • Ellenville CSD • Fallsburg CSD • General Brown CSD • Guilderland CSD • Highland CSD
• Hudson Falls CSD • Hyde Park CSD • Indian River CSD • Katonah-Lewisboro Schools • LaFargeville CSD • Liverpool CSD • Livingston Manor CSD • Lowville CSD • Lyme CSD • Millbrook CSD • NY44 Health Benefits Plan Trust • North Rockland CSD • North Salem CSD • Onteora CSD • Ossining School District • Pawling CS • Pine Plains CSD • Poughkeepsie CSD • Red Hook CSD • Rhinebeck CSD • Rondout Valley CSD • Roscoe CSD • Rotterdam-Mohonasen CSD • Sackets Harbor CSD • Saleseanum School • Saugerties CSD
• Scarsdale UFSD • Schenectady CSD • Schoharie CSD • Scotia-Glenville CSD • South Colonie CSD • South Jefferson CSD • South Lewis CSD • Spackenkill UFSD • St. Johnsville CSD • Sullivan West • Syracuse CSD • Thousand Islands CSD • Town of Webb UFSD • Valley Stream UFSD • Wallkill CSD • Wappingers CSD • Watertown CSD • Webutuck CSD

Harbridge Consulting Group, LLC 48
NY44 Health Plan
Rate Development
Determine expected cost of health plans for next year Completed annually Statistical analysis based on:
– Medical & Pharmacy claims experience – Population characteristics (age, geography) – Prevalence & severity of health risks – Number of employees & family members – Current plan design
Also Consider: – Plan changes & new plan offerings – Administrative costs – Statistical analysis of trend – Compliance with federal & state mandates

Harbridge Consulting Group, LLC 49
NY44 Health Plan
$
$10
$20
$30
$40
$50
$60
$70
$80
$90
FY 2010 FY 2011 FY 2012
Annu
al C
laim
s (M
illio
ns)
Fiscal Year
Actual vs. Expected Claims
Actual Claims
Expected Claims

Harbridge Consulting Group, LLC 50
NY44 Health Plan
$375
$400
$425
$450
$475
$500
$525
$550
FY10 FY11 FY12 FY13
Mon
thly
PER
(Sin
gle)
Fiscal Year
NY44 Trend vs. National Trend
NY44 Trend
National Trend

Harbridge Consulting Group, LLC 51
NY44 Health Plan
Claims Reserving
Determine estimated reserve required to pay claims Incurred But Not Reported (IBNR) in the prior year
Helps to ensure there are enough funds to pay claims
Statistical analysis based on: – Medical & Pharmacy claims experience – Claim payment patterns – Number of employees & family members – Distribution of population between vendors – Plan design & changes over time – Expected trend in claims costs

Harbridge Consulting Group, LLC 52
NY44 Health Plan
Other Support Services
Modeling Plan Design Changes – Licensed health pricing model
Forecasting Expected Future Costs – Actual claims & administrative costs – Projections based on rigorous statistical analysis
Compliance Support
Health Initiatives & Wellness
Vendor Management Support
GASB 45 Actuarial Valuations – Currently working with a few groups
Harbridge Consulting Group, LLC 53
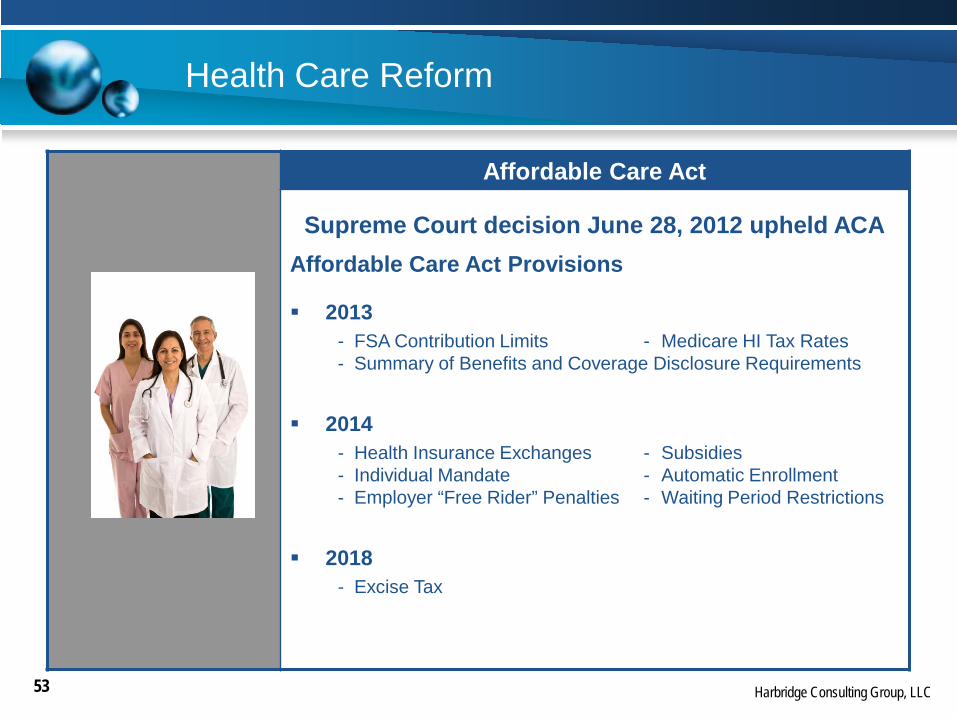
Health Care Reform
Affordable Care Act
Supreme Court decision June 28, 2012 upheld ACA Affordable Care Act Provisions
2013 - FSA Contribution Limits - Medicare HI Tax Rates - Summary of Benefits and Coverage Disclosure Requirements
2014 - Health Insurance Exchanges - Subsidies - Individual Mandate - Automatic Enrollment - Employer “Free Rider” Penalties - Waiting Period Restrictions
2018 - Excise Tax

Harbridge Consulting Group, LLC 54
District Service Offerings
Actuarial valuation services – GASB 45
Medicare Part D attestations
Employee contributions – Strategy & modeling
Pension actuarial & consulting
Forecasting & budget projections
Flexible Spending Account (FSA) administration
Compliance (ERISA, HIPAA, COBRA, ADEA)

Harbridge Consulting Group, LLC 55
Harbridge Consulting Group Engagement Team
Monica Cecilia, FSA, MAAA Senior Consultant (315) 703-8905 [email protected]
Lisa Engler, FSA, MAAA Consultant (315) 703-8907 [email protected]
Harbridge Consulting Group One Lincoln Center, 12th Floor
Syracuse, New York 13202 www.bpas.com

Legal Update Darcie Falsioni, Esq. Senior Deputy Counsel Independent Health
Patient Protection and Affordable Care Act (“PPACA”)
Grandfathered/Non-Grandfathered Plans
Presented by Darcie A. Falsioni, Esq., Independent Health
on behalf of David A. Hoover, Esq.

Impact on the NY44 Health Benefits Plan Trust:
• The Trust has been self-funded since January 1, 2008. – a self-funded plan is a “group health plan” – group health plans are subject to the provisions of the Patient
Protection and Affordable Care Act (“PPACA”)
• The Trust was operating on March 23, 2010; the date that the PPACA became law.
• On June 28, 2012, the U.S. Supreme Court held that most of the Act is constitutional.

Impact on the NY44 Health Benefits Plan Trust:
The PPACA requires group health plans to include certain benefits: – Dependent Coverage
• group health plans must provide coverage for adult dependent children up to age 26
• prior to January 1, 2014, this rule applies to grandfathered plans only if the child is not eligible for coverage under another employer-sponsored plan.
– Pre-existing Conditions • pre-existing condition exclusions for enrollees under the age
of 19, and for all enrollees in 2014, are prohibited
Impact on the NY44 Health Benefits Plan Trust:
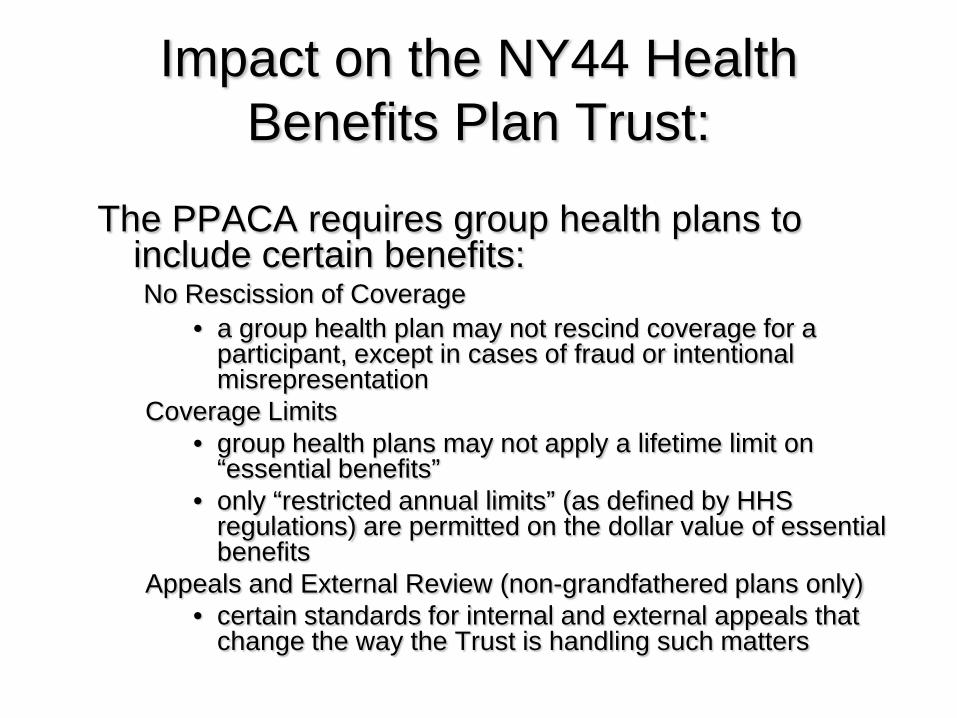
The PPACA requires group health plans to include certain benefits: No Rescission of Coverage
• a group health plan may not rescind coverage for a participant, except in cases of fraud or intentional misrepresentation
Coverage Limits • group health plans may not apply a lifetime limit on
“essential benefits” • only “restricted annual limits” (as defined by HHS
regulations) are permitted on the dollar value of essential benefits
Appeals and External Review (non-grandfathered plans only) • certain standards for internal and external appeals that
change the way the Trust is handling such matters

Impact on the NY44 Health Benefits Plan Trust:
Upcoming PPACA changes:
Preventive Services (non-grandfathered plans only) • group health plans must provide, without cost-sharing, in-network
coverage for preventive screenings, including: – well-woman visits – gestational diabetes screening – HPV DNA testing – STI and HIV screening – contraception and contraceptive counseling – breastfeeding support, supplies and counseling – domestic violence screening
• required for plan years beginning on or after August 1, 2012
Comparative Effectiveness Research (CER) Fee • plan sponsors must pay a CER fee to fund comparative clinical
effectiveness research • CER fee is $1.00 per covered person and increases to $2.00 per covered
person • begins for plan years ending on or after October 1, 2012

Impact on the NY44 Health Benefits Plan Trust:
Upcoming PPACA changes:
Form W-2 Reporting • employers must report the aggregate cost of “applicable employer-
sponsored” group health plan coverage on Form W-2 • includes both the employer and employee contributions • required for W-2s prepared for tax years beginning on or after January 1,
2012
Summary of Benefit Coverage (SBC) • a group health plan must provide a uniform SBC describing available plan
options • HHS created a model SBC to be used by all group health plans • required for the 1st open enrollment period beginning on or after
September 23, 2012

Impact on the NY44 Health Benefits Plan Trust:
Upcoming PPACA changes:
Health Flexible Spending Account (FSA) Limitations • employee contributions limited to $2,500 per plan year • does not include employer contributions • effective for plan years beginning after December 31, 2012
Coverage in Approved Clinical Trial (non-grandfathered plans only)
• a group health plan must cover routine patient costs for participation in approved clinical trials
– Applies to clinical trials for treatment of cancer or other life-threatening disease or condition
• required for plan years beginning on or after January 1, 2014

Grandfathered and Non-grandfathered Plans
• Grandfathered plans do not have to comply with certain
parts of the PPACA. – grandfathered plans can voluntarily allow for coverage required under PPACA for
non-grandfathered plans • Voluntary coverage will not jeopardize grandfathered status
• Certain actions may result in the loss of
grandfathered status by a plan. – employer cannot decrease its contribution rate towards the cost of any tier of
coverage for any class of similarly situated individuals by more than 5% below the contribution rate on March 23, 2010

Grandfathered and Non-grandfathered Plans
• There have been some units where there has
been decrease in the employer’s share of the contribution rate and a corresponding increase in the employees’ share of that rate that exceeds 5%.
Grandfathered and Non-grandfathered Plans
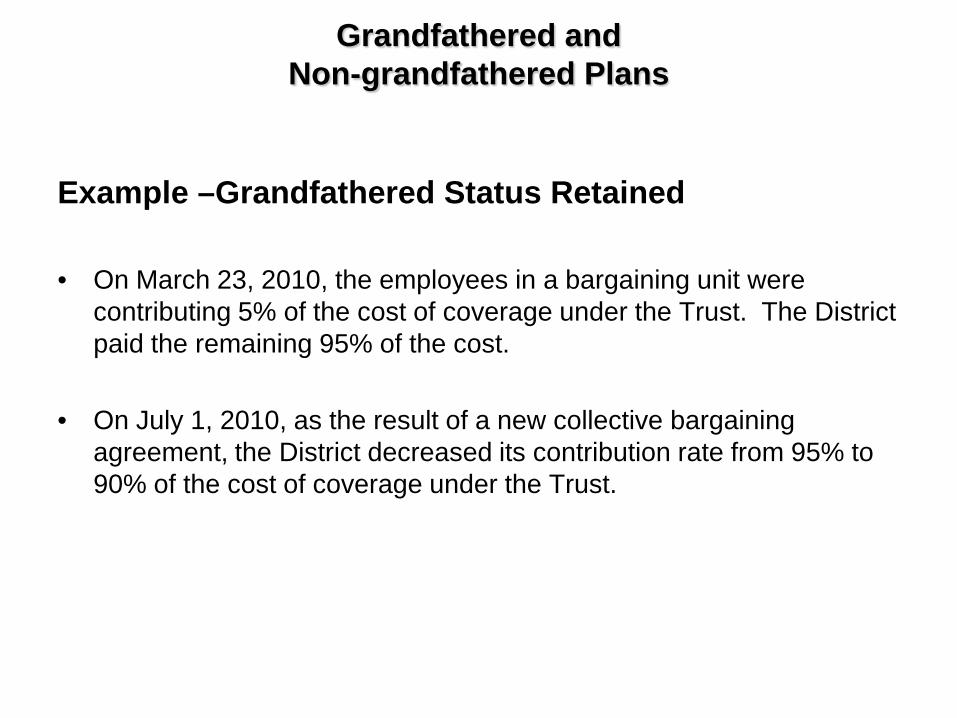
Example –Grandfathered Status Retained • On March 23, 2010, the employees in a bargaining unit were
contributing 5% of the cost of coverage under the Trust. The District paid the remaining 95% of the cost.
• On July 1, 2010, as the result of a new collective bargaining
agreement, the District decreased its contribution rate from 95% to 90% of the cost of coverage under the Trust.

Grandfathered and Non-grandfathered Plans
Example –Grandfathered Status Retained (cont.)
• Because the cost of the Trust plan has increased from 2009-10 to
2010-11, the out of pocket cost to the individual employee may have increased by more than 5% over the amount the employee was paying on March 23, 2010.
• However, the District will not have to move to the non-
grandfathered Trust plan because the District did not decrease its contribution rate by more than 5 percentage points below the contribution rate in effect on March 23, 2010.
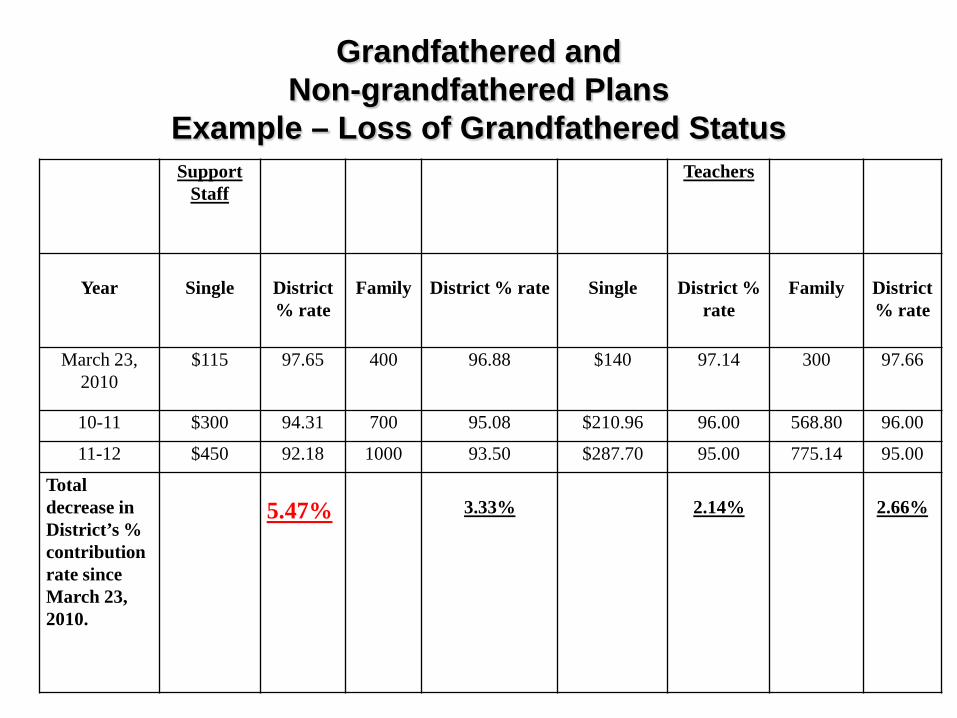
Support Staff
Teachers
Year
Single
District % rate
Family
District % rate
Single
District %
rate
Family
District % rate
March 23, 2010
$115 97.65 400 96.88 $140 97.14 300 97.66
10-11 $300 94.31 700 95.08 $210.96 96.00 568.80 96.00
11-12 $450 92.18 1000 93.50 $287.70 95.00 775.14 95.00
Total decrease in District’s % contribution rate since March 23, 2010.
5.47%
3.33%
2.14%
2.66%
Grandfathered and Non-grandfathered Plans
Example – Loss of Grandfathered Status

Grandfathered and Non-grandfathered Plans
Example – Loss of Grandfathered Status • This group (including employees with single and those with family
coverage) is a class of similarly situated employees under the regulations.
– District’s contribution rate for single coverage has decreased by more than 5% below the contribution rate in effect as of March 23, 2010 (97.65% - 92.18% = 5.47% ), the group has lost its grandfathered status and must move to the Trust’s non-grandfathered plan.
• The fact that the decrease in the employer contribution rate only exceeds 5% for single enrollees does not change the outcome.
• Even though the District’s contribution rate decreased by more than 5% for only single coverage, grandfathered status is lost for the class of similarly situated employees, i.e. all the employees covered by that collective bargaining agreement.

Grandfathered and Non-grandfathered Plans
– Effective July 1, 2011, the Trust established a separate plan. The second plan is not grandfathered (1NG).
– Districts or units that decrease the employer contribution by more than 5% must move to Plan 1NG.

Grandfathered and Non-grandfathered Plans
The only current coverage changes that are affected by the loss of grandfathered status are:
• Coverage to age 26 could no longer be denied for an adult child because the child is eligible to enroll in another eligible employer sponsored health plan (e.g. COBRA).
• The current $1,000 annual limit on durable medical
equipment (“DME”) is removed. The 50% DME copayment would remain.
Appeals, External Review and Preventive Services are unaffected by a change in grandfathered status, as both plans currently follow the same requirements.
Third Party Administrators for Claims Payments Joseph Wild Director of Sales - Labor MVP Health Care

©2012 MVP Health Care, Inc.
NY44 HEALTH BENEFIT PLAN TRUST Annual Meeting 2012

©2012 MVP Health Care, Inc. 74
YOUR MVP TEAM
NY44 HEALTH BENEFIT PLAN TRUST
Joe Wild, Director Labor
Laura Wander, Sr. Sales Executive - Labor
Amber Wallace, Account Manager - Labor

©2012 MVP Health Care, Inc. 75
MVP Health Care: Who We Are
30 Years Strong. Regional. Innovative. Not-for-Profit.
•Nationally recognized, not-for-profit health insurer, with headquarters in upstate New York and regional offices throughout New York, Vermont and New Hampshire - serving the region for more than 30 years.
•Providing health insurance solutions for 25,700 employers, serving 650,000 members throughout New York, Vermont and New Hampshire and covering over 60 Self insured clients (130,000 members) and 100,000 Medicare retirees nationally.
•More than 500,000 doctors, specialists, and hospitals from coast to coast.
•Powered by the ideas and energy of more than 1,700 regional employees.
•Providing innovative, breakthrough products with integrated wellness solutions.
3

©2012 MVP Health Care, Inc. 76
REGIONAL & NATIONAL PROVIDER EXCELLENCE
NY44 HEALTH BENEFIT PLAN TRUST
Network Strength
19,000+ providers regionally
More than 150 contracted facilities regionally
Competitive regional discounts
A national network with more than 500,000 doctors, specialists and hospitals
5,000+ facilities nationally
NCQA qualified network
Access to Centers of Excellence for specialty care

©2012 MVP Health Care, Inc. 77
MVP MID HUDSON PROVIDER NETWORK
The provider network in the Mid Hudson Region Consists of -
4,949 Physicians that are Primary Care Providers and/or Specialty Care
Total number of practice locations in the Hudson Valley for these providers is 15,752
NY44 HEALTH BENEFIT PLAN TRUST

©2012 MVP Health Care, Inc. 78
MVP MID HUDSON PROVIDER NETWORK
Since July 1, 2012, the MVP Mid Hudson Provider Network has grown by 90 new physicians in Westchester and Rockland Counties. These are physicians that have completed the credentialing process as of September 26, 2012.
Total number of practice locations for these 90 new physicians is 176 between these two counties.
NY44 HEALTH BENEFIT PLAN TRUST
©2012 MVP Health Care, Inc. 79
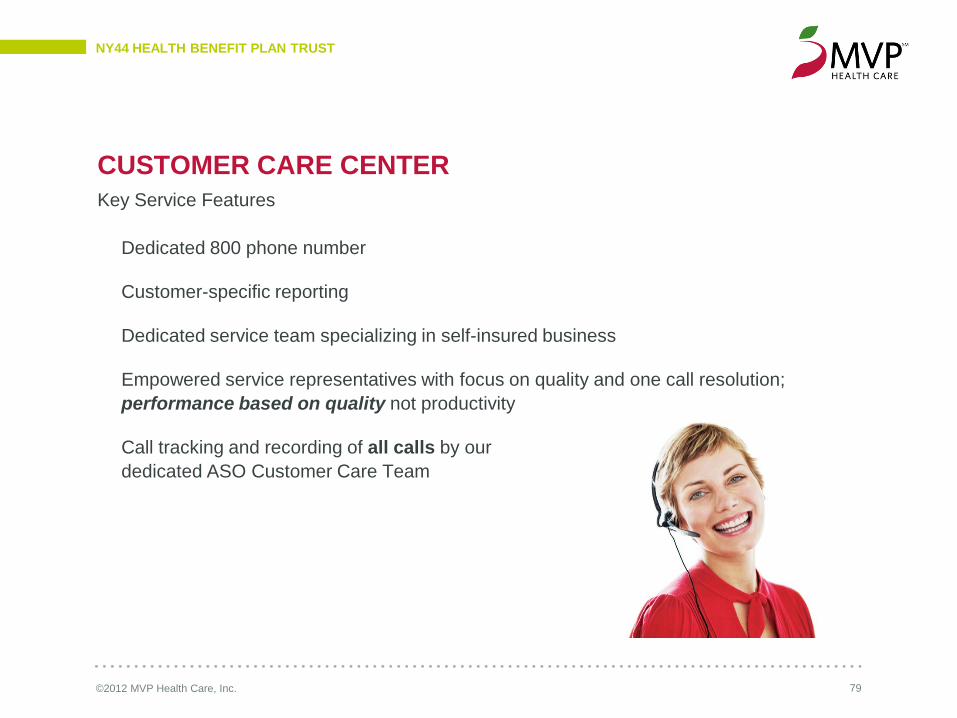
CUSTOMER CARE CENTER
Dedicated 800 phone number
Customer-specific reporting
Dedicated service team specializing in self-insured business
Empowered service representatives with focus on quality and one call resolution; performance based on quality not productivity
Call tracking and recording of all calls by our dedicated ASO Customer Care Team
NY44 HEALTH BENEFIT PLAN TRUST
Key Service Features

©2012 MVP Health Care, Inc. 80
CUSTOMER CARE CENTER
Clarify/confirm benefits
Confirm provider network status
Confirm eligibility status
Assist with claims and EOB questions
ID card reissue
Education – COB, claims submission process
Benefit authorization confirmation
Update member data
NY44 HEALTH BENEFIT PLAN TRUST
Top Categories

©2012 MVP Health Care, Inc. 81
CASE MANAGEMENT
Case Managers provide assistance to health plan members and/or their caregivers as they navigate complex medical needs.
Clinicians assist with discharge planning and provide care coordination for high- utilization, high-cost and/or catastrophic cases.
Social work services help connect health plan members to community resources and services.
NY44 HEALTH BENEFIT PLAN TRUST
CONDITION HEALTH MANAGEMENT
Clinicians provide individualized disease specific education, health coaching, guidance and care coordination aimed at improving a member’s self-management skills.
Clinical health coaches motivate health plan members to make lifestyle changes that improve their condition focusing on individual member accountability.

©2012 MVP Health Care, Inc. 82
MVP’S CASE MANAGEMENT AND CONDITION HEALTH MANAGEMENT TEAM
A team of highly trained and experienced nurses, respiratory therapists, social workers and other health care professionals supported by skilled analysts and administrative staff.
Case Managers are CCM certified by the Commission for Case Management (CCMC) and/or Wellcoaches® for health coaching
Clinicians also have specialty certifications in oncology, asthma, diabetes, mental health and occupational health.
NY44 HEALTH BENEFIT PLAN TRUST

©2012 MVP Health Care, Inc. 83
MVP’S CONDITION HEALTH MANAGEMENT PROGRAMS
Utilizes sophisticated predictive model to help focus clinical support.
Individuals receive active support based on predicted opportunity.
All individuals within the population are monitored and are eligible for active support
regardless of disease or diagnosis.
Multiple clinical risk factors are considered in targeting clinical outreach.
Programs include: Asthma Dialysis Cancer (Oncology) Heart Events (heart attack or blockages) Chronic Obstructive Pulmonary Heart Failure Disorder (COPD) Low Back Pain Depression Diabetes
NY44 HEALTH BENEFIT PLAN TRUST

©2012 MVP Health Care, Inc. 84
PROGRAM CANDIDATE IDENTIFICATION
MVP systematically identifies health plan enrollees who qualify for PHM programs using the following:
Identification Source Data collected through the Utilization Management (UM) process Claims and encounter data Laboratory results
MVP Disease Management Hierarchy The DM Hierarchy is a proprietary meta-data set that pulls together various individual identification data sources into one comprehensive, member-centric reporting tool. This creates a unique member profile that assesses the presence and severity level of various conditions, as well as identifying co-morbidities.
NY44 HEALTH BENEFIT PLAN TRUST

©2012 MVP Health Care, Inc. 85
MVP’S CLAIMS OPERATIONS
11,332 claims were processed from July, 2011 thru July, 2012.
The 21 day turnaround time for clean claims processed is 96.01%.
The 30 day turnaround time for clean claims processed is 97.44%.
The Financial Accuracy results for claims processed is 99.69%.
The Overall Accuracy results for claims processed is 98.05%.
NY44 HEALTH BENEFIT PLAN TRUST

Third Party Administrators for Claims Payments Ted Butler Vice President, Sales Pharmacy Benefit Dimensions

• Who we are:
Wholly owned subsidiary of Independent Health Corporation since 2005
Listed in the top 20 in the nation in size for PBM’s that manage medical benefit – Drug Benefit News
In WNY - Managing pharmacy benefits for nearly 40% of the population
Outside of WNY - Serving members in all 50 states
- National pharmacy network of 58,000 pharmacies including all national and regional pharmacy chains
Fully integrated with our sister companies, Reliance Rx and Nova Healthcare Administrators

• Our Success: Average growth since inception: 25% annually 50,000 new members in 2012 98% retention of existing customers, year after year
• Our Commitment to You: Partner with NY44 medical providers - IH in WNY and MVP outside of WNY Fully transparent, pass-through pricing model NYSASBO - business associate and annual sponsor NYSSBA - conference attendee
• Our Values: Integrity in all relationships and transactions Knowledge leadership in Pharmacy Benefit Management Exceed expectations on all commitments

Claims Update Tom Pomidoro Claims Analyst

NY44 Health Benefits Plan Trust
Claim History
July 1, 2008 to June 30, 2012

Claims Experience Credibility
“NY44 Health Benefits Plan Trust participant (member) pool is large enough for its experience to be considered statistically reliable, therefore, we consider the claim experience (pool) periods to be 100% credible.”1 1 Harbridge Consulting Group, May 2012

Claims Experience Projected
Actual

Claims Experience Using the incurred claims credible experience and the number of covered enrollees, an average cost per enrollee per month was developed. The periods used are:
July 1, 2008 – December 31, 2008
January 1, 2009 – December 31, 2009 January 1, 2010 – December 31, 2010 January 1, 2011 – December 31, 2011
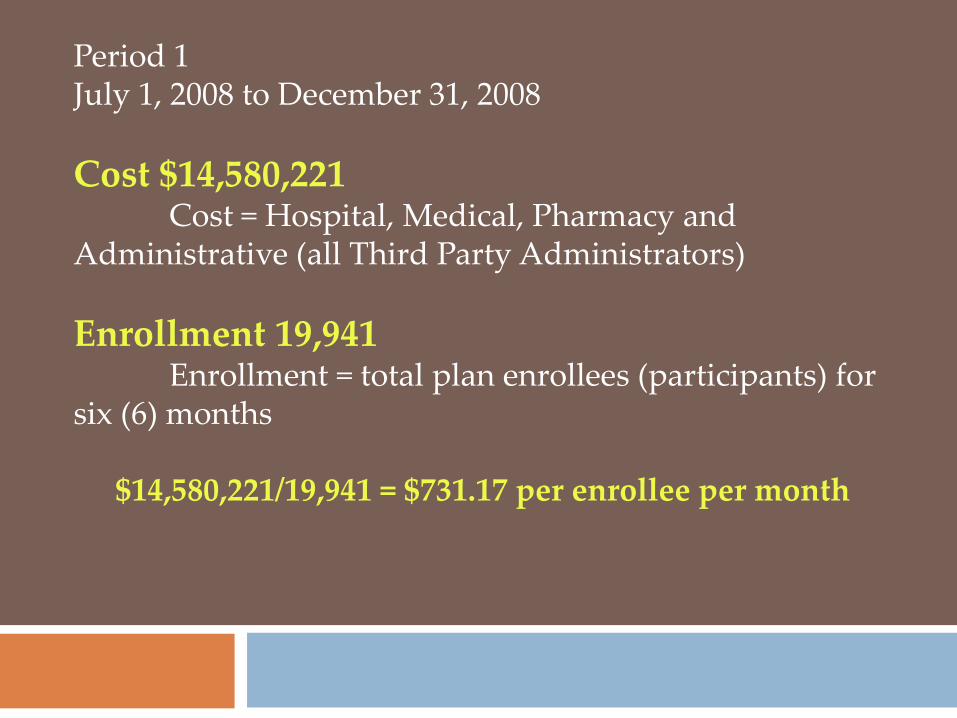
Period 1 July 1, 2008 to December 31, 2008 Cost $14,580,221 Cost = Hospital, Medical, Pharmacy and Administrative (all Third Party Administrators) Enrollment 19,941 Enrollment = total plan enrollees (participants) for six (6) months
$14,580,221/19,941 = $731.17 per enrollee per month

Period 2 January 1, 2009 to December 31, 2009 Cost $45,840,741 Enrollment 61,308 Enrollment = total plan enrollees (participants) for twelve (12) months
$45,840,741/61,308 = $747.71 per enrollee per month

Period 3 January 1, 2010 to December 31, 2010 Cost $67,192,016 Enrollment 79,191 Enrollment = total plan enrollees (participants) for twelve (12) months
$67,192,016/79,191 = $848.48 per enrollee per month

Period 4 January 1, 2011 to December 31, 2011 Cost $84,193,617.26 Enrollment 94,112 Enrollment = total plan enrollees (participants) for twelve (12) months
$84,193,617/94,112 = $894.61 per enrollee per month

The 2011 per enrollee per month cost is 22.4% over the 2008 per employee per month cost
The contribution rate increased by 9.5% in 2009, 9% in 2010 and 7.9% in 2011 for a total rate increase of 26.4%
The additional 4% that has been added to the contribution rate over the per enrollee per month cost since July 1, 2008 has been used to develop the medical plan reserves. As of June 30, 2012, the Trust is fully funded.

Large Claims From July 1, 2011 to June 30, 2012
There were 8,015 enrollees as of June 30, 2012 Since July 1, 2011, 50 enrollees have used $8,271,273 of claims dollars, which is 11.4% of the total claims paid of $94,324,901

NY44 Claims Costs Independent Health/ MVP
January 1, 2011 to December 31, 2011
25.2%
46.8%
28.0% Medical
Hospital
Pharmacy
$23,574,213 $21,216,791
$39,402,613
Total $84,193,617

NY44 Health Benefits Plan Claims Audit
We are in the process of scheduling a claim/ enrollment audit in each member school We will audit employee files for compliance of the Trust’s Summary Plan Description (SPD), as well as an audit of District enrollments Audits have been completed for Kadimah School, Cheektowaga-Sloan UFSD, Hamburg CSD and Iroquois CSD

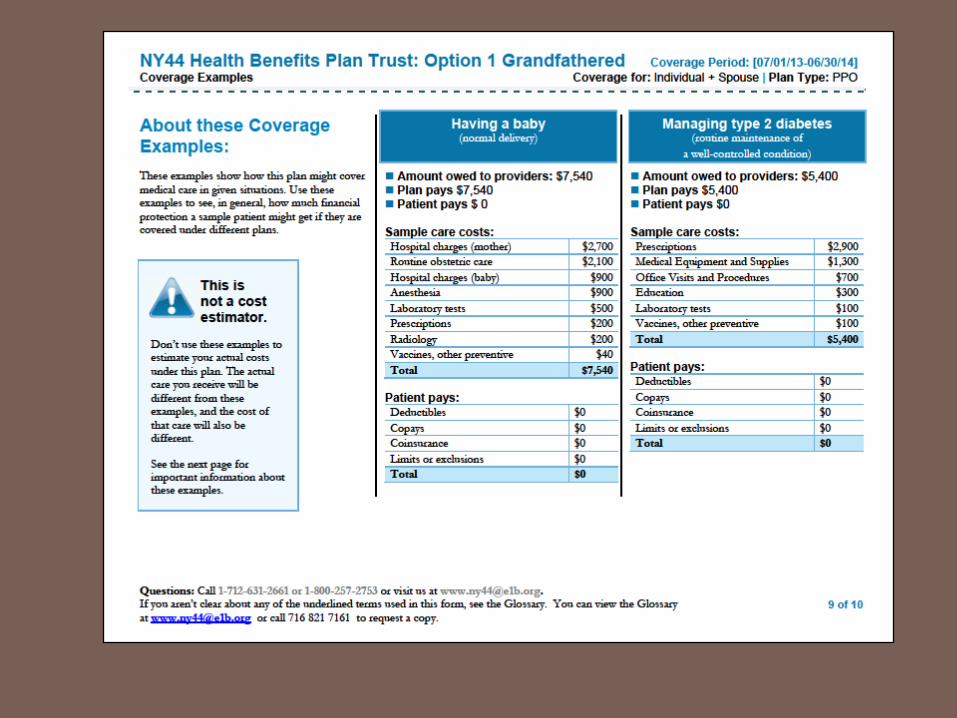
Summary of Benefits and Coverage (SBC)
Effective July 1, 2013
For more information please go to
dol.gov/ebsa/healthreform


Health Care Update Leonard A. Katz, MD Medical Consultant

The Future is Now --- are you ready?
You are critical to success!

Major Areas of Strength of current system
• High tech medicine (hospital, procedures, in-office, etc.)
• Research, particularly basic research • Development of new drugs • Emergency/trauma/battlefield care • Management of complex medical cases

Area of Unchallenged “Leadership”
American Health Care is the most expensive in the world using any measure!
US compared to Canada and England
per capita costs 2010: US = $8,362 Canada = $5,222 UK = $3,503
US total cost = almost $2.6 trillion or $2,600,000,000,000 or 17.3% of GDP

Public Health Measures 2008
US UK Canada Japan
• Life expectancy : 77.8 80.0 81.7 81.4 • Infant mortality/1,000: 6.4 5.0 4.6 2.8
• WHO rates US life expectancy 47th – below Bosnia and
Herzegovina above Cyprus; below all first world nations.

Other Rankings
• -- DALE (disability adjusted life expectance): 24th
• -- WHO ranking 2,011 (complex measures): 37th
• Commonwealth Fund (based on successful treatment of potentially fatal disease among wealthy countries): 15
TR Reid, The Healing of America, 2010
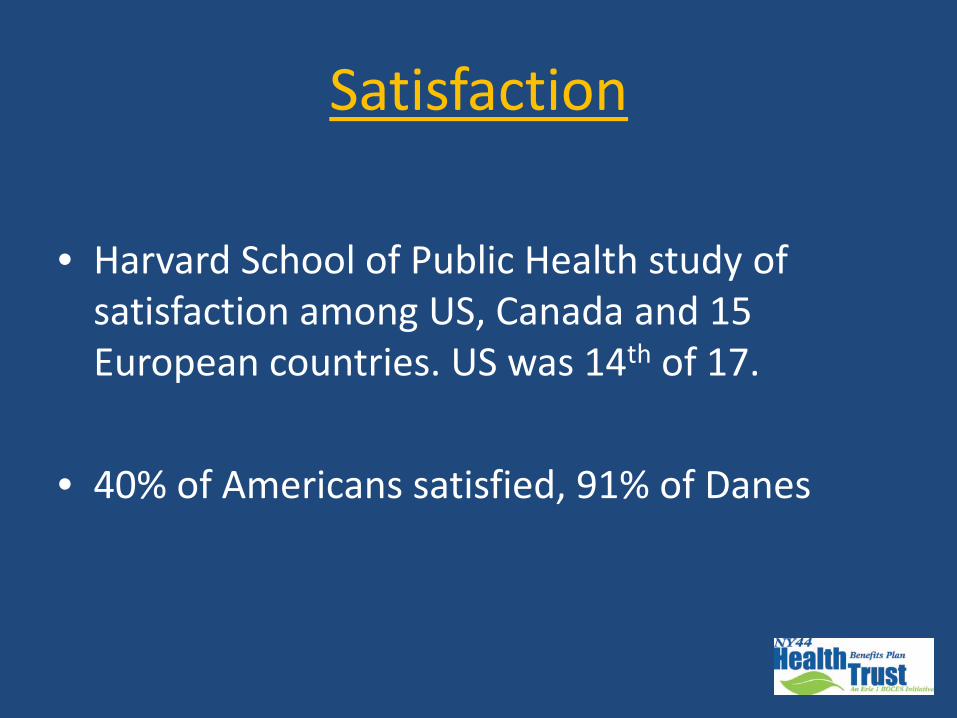
Satisfaction
• Harvard School of Public Health study of
satisfaction among US, Canada and 15 European countries. US was 14th of 17.
• 40% of Americans satisfied, 91% of Danes

How can there be a problem?
• Physicians are smart, very smart! and very hard working!
• We have the best technology in the world • We have the best science • We spend more money than any country
How can there possibly be a problem???

Cost Drivers…now
• Unnecessary care – up to 30% of all care, up to $750 billion:
-- unnecessary tests and duplication of tests and procedures. -- inefficiency – multiple visits, multiple consultations, time to look things up, etc. • Fear of litigation. • High costs of drugs/tests/treatments : many
thousands of dollars; many not proven • Some stratospheric costs.

Change is Now!
• Rapid appearance of innovations in delivery of
care, e.g, IHA’s Primary Connection, BMG’s affiliation with Cleveland Clinic (Sept. 2012), Kaleida and BlueCross/Blue Shield (Sept. 2012)
• The traditional office visit is changing and will continue to do so; where/how will we receive care?
• Chronic disease care is emerging as vastly different from acute care. CMS coverage – new!

“Standardization”
Atul Gawande. Big Med, New Yorker August 13-20, 2012
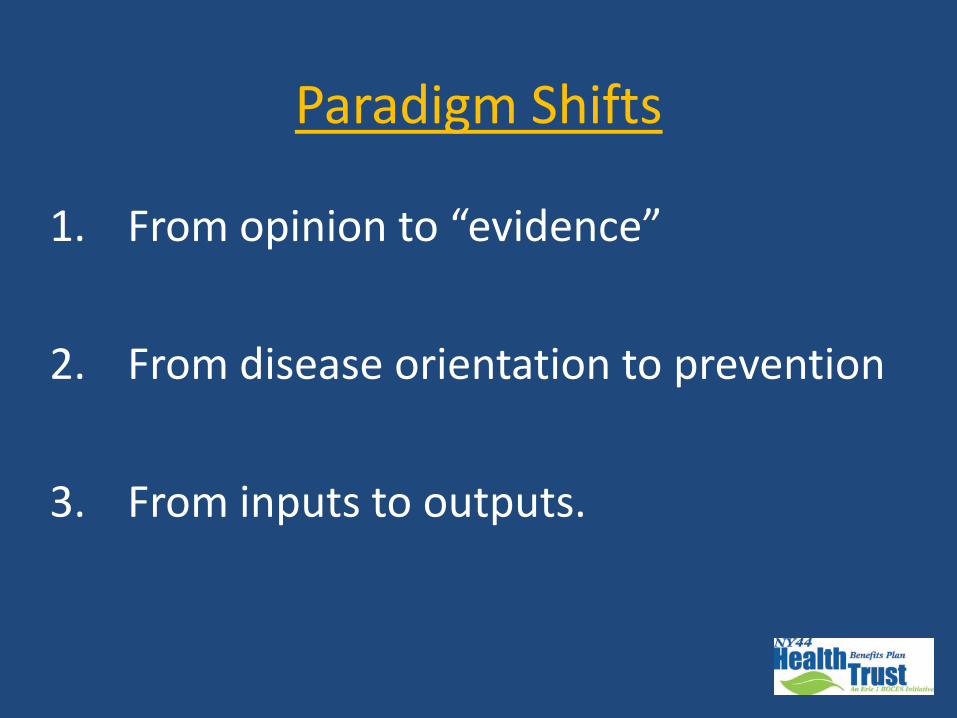
Paradigm Shifts
1. From opinion to “evidence”
2. From disease orientation to prevention
3. From inputs to outputs.

Physicians will remain essential (phew!)
• Personalized medicine requires your doctor.
• Compassionate care requires your doctor.
• Your doctor will be needed to understand “evidence” and interpret complex data.

Big challenge for today
• Personal health habits • Estimated that more than 50% of health care
services and costs are driven by personal behaviors – smoking, diet, alcohol, lack of exercise, obesity, drugs, etc.
• Changing human behaviors is difficult but….. BIG BENEFIT! (Physicians’ and Nurses’ Health studies.)

Early Diagnosis of disease is not always best!!
• The Pap Smear is the best cancer prevention test we have. The American Cancer Society recently recommended AGAINST an annual Pap Smear. What???? Why????
• How about the PSA test?

“Overdiagnosed; making people sick in the pursuit of health”
Gilbert Welsh, MD, et al, Dartmouth
very, very important book

Why you??
• Personal habits are associated with good health and longevity.
• Medical care by some estimates accounts for only 10% of reduced mortality.
• You can know as much as your physician.

How can you be an informed consumer of medical services?
• Turn to best sources. Many are now available on the Web. (Mayo Clinic, Web MD, etc)
• Follow important developments; beware of hype and unsubstantiated claims (those claims may be valid but…..).
• Be familiar with recommendations of: Choosing Wisely -- Foundation of the American Board of Internal Medicine, 2012.

“Choosing Wisely” (written for MD and patients) Amer Board of Internal Med Foundation
A few of the recommendations: 1. AAFP – Do not order EKG annually. 2. ACP -- Don’t obtain imaging studies for
simple low back pain. 3. AGA -- do not repeat colonoscopy for 10
years after negative exam 4. ACR – do not get brain imaging for
uncomplicated headache

Choosing Wisely (con’d)
5. ASNC – Don’t perform cardiac imaging for patients at low risk 6. AAAA – Don’t prescribe antibiotics for uncomplicated rhinosinusitis 7. ACP – Do not perform stress testing without cardiac symptoms
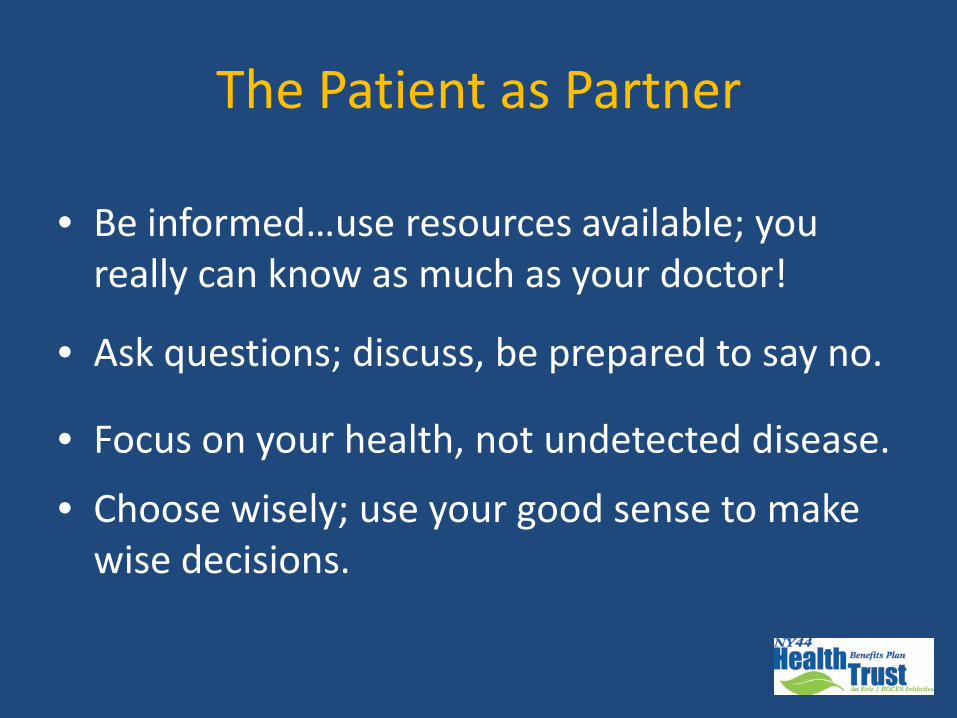
The Patient as Partner
• Be informed…use resources available; you really can know as much as your doctor!
• Ask questions; discuss, be prepared to say no.
• Focus on your health, not undetected disease.
• Choose wisely; use your good sense to make wise decisions.

Pharmacy Update Martin Burruano Pharmacy Consultant PBD/Independent Health

NY44 Pharmacy Update
2012
Presented By: Martin Burruano

Objectives
To provide an update on the pharmacy landscape by focusing on:
- Year in Review
- Managing Costs
- Generics
- Specialty Meds

Year in Review
• FDA approved – 29 new molecular entities – 18 biologics – 27 new indications for existing drugs
• First new… – Oral treatment for Hepatitis C – Oral therapy to prevent spread of HIV – Oral therapy to treat obesity in over 10 years

Year in Review
• Generic availability exploded – Patent “Cliff” – 43 new generics available in 2011 – 2012
• Lipitor • Seroquel • Avapro • Lexapro • Plavix • Singulair • Diovan • Lunesta • Geodon • Tricor

Year in Review
• Increased complexity
– Final outcome of Health Care Reform
– Women’s wellness mandate
– Challenging economic climate
• Record inflation for brands
– 4.6% overall for prescription drugs
– 27% for just brand drugs over the past 3 years

Year in Review

Year in Review
• More Americans are living with chronic conditions than ever before
– 75% of every healthcare dollar
• Categories that drove cost and trend – Diabetes (16.7%) – Respiratory (15.1%) – Rheumatological (17.4%) – Neurological (14.7%) – Oral Oncology (7.0%)
• Specialty Drugs <1% of prescription, but 21% of total drug cost

What is being done to help control drug costs? • Patient safety programs • Utilization management • Half-tablet incentive programs • Physician and member education • Generic programs • Benefit design • Specialty pharmacy
“Ensuring the right drug, to the right person, at the
right time”

Utilization Management Drug Safety
Drug Utilization Review Activities • Drug/drug interaction • Therapeutic duplication • Pregnancy contraindications • Narcotic abuse • Acetaminophen overdose prevention • Maximum daily dose • Drug to be used with caution in the elderly • Antibiotic quantity limitation
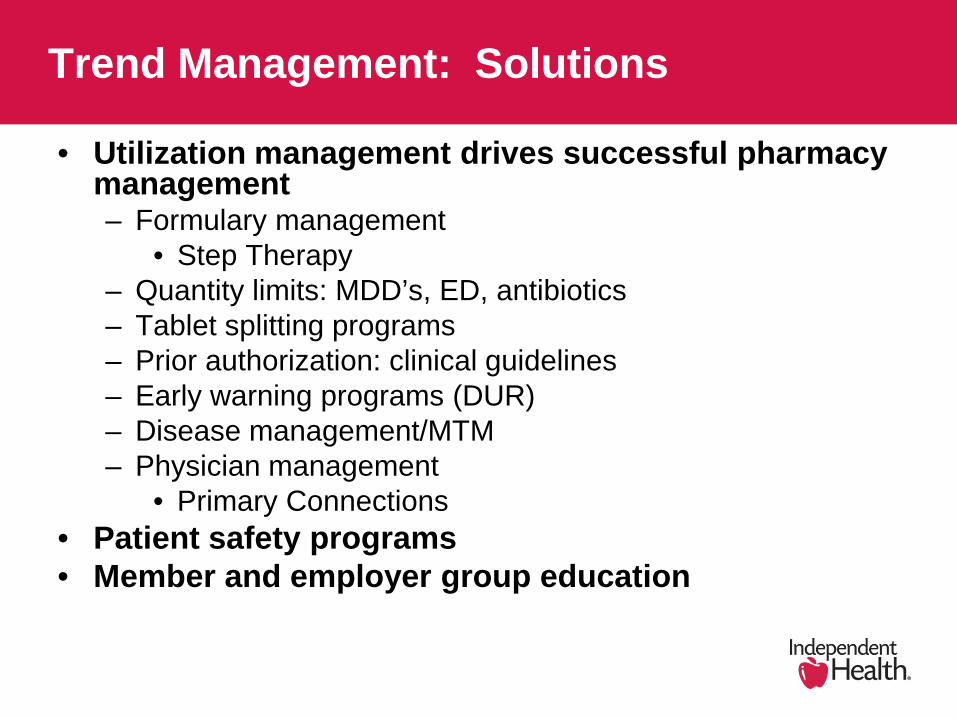
Trend Management: Solutions
• Utilization management drives successful pharmacy management – Formulary management
• Step Therapy – Quantity limits: MDD’s, ED, antibiotics – Tablet splitting programs – Prior authorization: clinical guidelines – Early warning programs (DUR) – Disease management/MTM – Physician management
• Primary Connections • Patient safety programs • Member and employer group education

Primary Connections
• Unique, innovative approach to health care delivery • Utilizes a strong collaboration of primary care physician
practices and other health care providers • The Primary Connection empowers primary care
physicians to expand their influence to deliver higher-performance, patient-centered care
• Outcomes – Increased efficiency – Higher quality

Generics

Generics
• The answer to controlling health costs • 90% of people who start on a generic stay on a generic • Safe
– All generics were once a brand name – Most with > 10 years clinical experience
• Effective – The generic has often been the gold standard of therapy
for years – Stood the test of time – Not a marketing hype
• Every 1% increase in generic utilization saves up to $2m in plan pharmacy costs
Generics
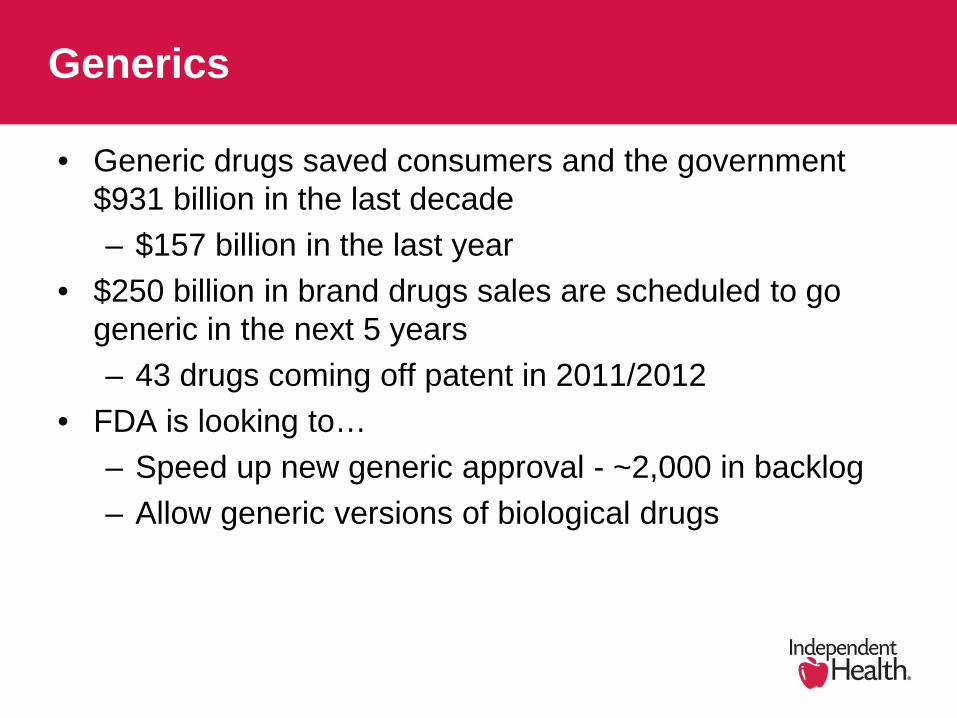
• Generic drugs saved consumers and the government $931 billion in the last decade – $157 billion in the last year
• $250 billion in brand drugs sales are scheduled to go generic in the next 5 years – 43 drugs coming off patent in 2011/2012
• FDA is looking to… – Speed up new generic approval - ~2,000 in backlog – Allow generic versions of biological drugs

Generic Utilization
• 3-Tier design drives generic use • $0 copay on tier 1
• 74.22% generic utilization rate through 3Q12
74.22%
24.13%
13.60% 0.29%
Generic SSB MSB Compound

Generic Trend
Trend: Niagara Falls (Niagara County) prescribers had a lower generic utilization rate (66.12%) than the rest of the plan (72.07%)
• Member education – 840 letters sent to patients on a tier-3 drug – Tier-1 and tier-2 alternatives
• Physician education – 649 letters sent to prescribers – List of patients on tier-3 drugs with alternatives – Face-to-face pharmacist education
• Generic utilization opportunities • Physician tip sheets for generic alternatives

Generic Trend
Outcome: increase in generic utilization: For Niagara Falls = 66% to 71.74% For all of NY44 = 72% to 74.22%
149
Physician education intervention
72.07% 71.54%
70.45%
72.10%
73.57% 74.36%
74.22%
68.00%
69.00%
70.00%
71.00%
72.00%
73.00%
74.00%
75.00%
1Q11 2Q11 3Q11 4Q11 1Q12 2Q12 3Q12

Top 2011-2012 Generic Launches
2011 • October: Zyprexa (olanzapine); $1.97 billion. Used for treatment of schizophrenia
and bipolar disorder.
• November: Lipitor (atorvastatin) ; $6.05 billion. Used for treating cholesterol.
2012 • March: Lexapro (escitalopram); $2.56 billion. Used for treating depression. • March: Seroquel (quetiapine); $3.48 billion. This is an antipsychotic medication.
• May: Plavix (clopidogrel); $4.56 billion. Used to prevent unwanted blood clots to
avoid heart attacks and strokes.
• July: Tricor (fenofibrate); $1.35 billion. Helps reduce cholesterol and triglycerides (fatty acids) in the blood.
• August: Singulair (montelukast); $3.47 billion. Used for asthma and allergies. • August: Actos (pioglitazone); $2.78 billion. This is an oral diabetic medication.
• September: Diovan (valsartan); $1.47 billion. See below. • September: Diovan HCT (valsartin/hydrochlorothiazide); $1.38 billion. These drugs
are used for the treatment of hypertension.

Specialty Medications
• The challenge
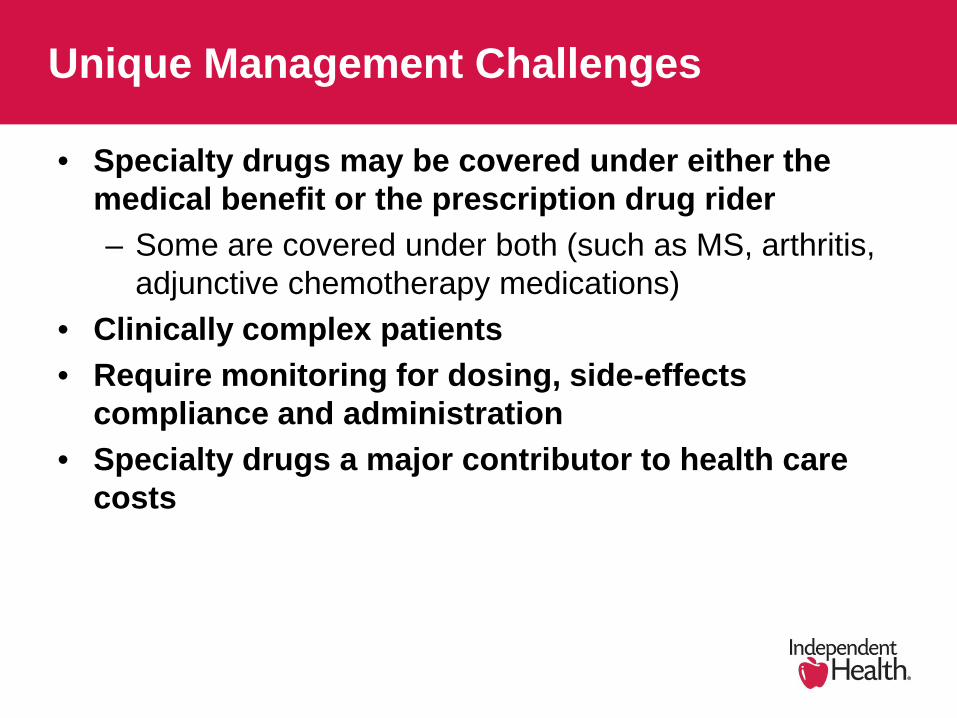
Unique Management Challenges
• Specialty drugs may be covered under either the medical benefit or the prescription drug rider – Some are covered under both (such as MS, arthritis,
adjunctive chemotherapy medications) • Clinically complex patients • Require monitoring for dosing, side-effects
compliance and administration • Specialty drugs a major contributor to health care
costs

What are Specialty Medications?
• Limited indications • Complex administration, monitoring • Safety and use concerns • Expensive: $6,000 - $350,000 per year/per person!
– Generic: <$200/yr – Brands: $2,100/yr
Specialty drugs a major contributor to health care costs.
Biotech products that target patients with complex therapies

Top Indications for Specialty Meds
• Rare, genetic conditions • Multiple Sclerosis • Rheumatoid Arthritis • Psoriasis • Asthma • Hemophilia • Crohn’s Disease • Cancer
Biotech products that target patients with complex therapies

Paying for Innovation
88%
12%
79%
21%
YTD 2006 2012 Estimated
Specialty as a percent of prescription drug spend

Average Yearly Cost of Specialty Medications
Drug Condition $/Person/Year
Enbrel♦ RA, Psoriasis $23,000
Humira♦ RA, Crohn’s $27,000
Cimzia (SQ) Crohn’s disease $25,000
Avonex♦ MS $43,000
Rebif♦ MS $42,000
Copaxone♦ MS $49,000
Nutropin Growth Hormone Deficiency $33,000
Sutent Renal Cancer $76,000
Tarceva♦ (oral) Lung/Pancreatic Cancer $53,000
Nexavar♦ (oral) Renal Cancer $70,000
Zolinza♦ (oral) Lymphoma $108,000
Elaprase (IV) Hunters Disease $300,000
Soliris (IV) PNH $389,000
♦ Covered under pharmacy benefit
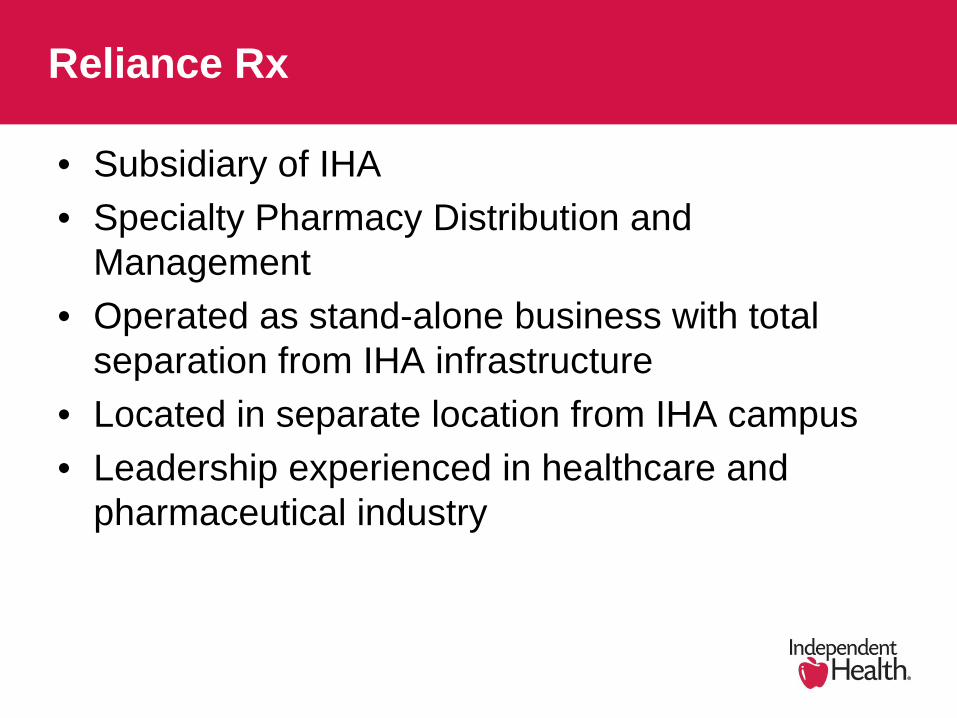
Reliance Rx
• Subsidiary of IHA • Specialty Pharmacy Distribution and
Management • Operated as stand-alone business with total
separation from IHA infrastructure • Located in separate location from IHA campus • Leadership experienced in healthcare and
pharmaceutical industry
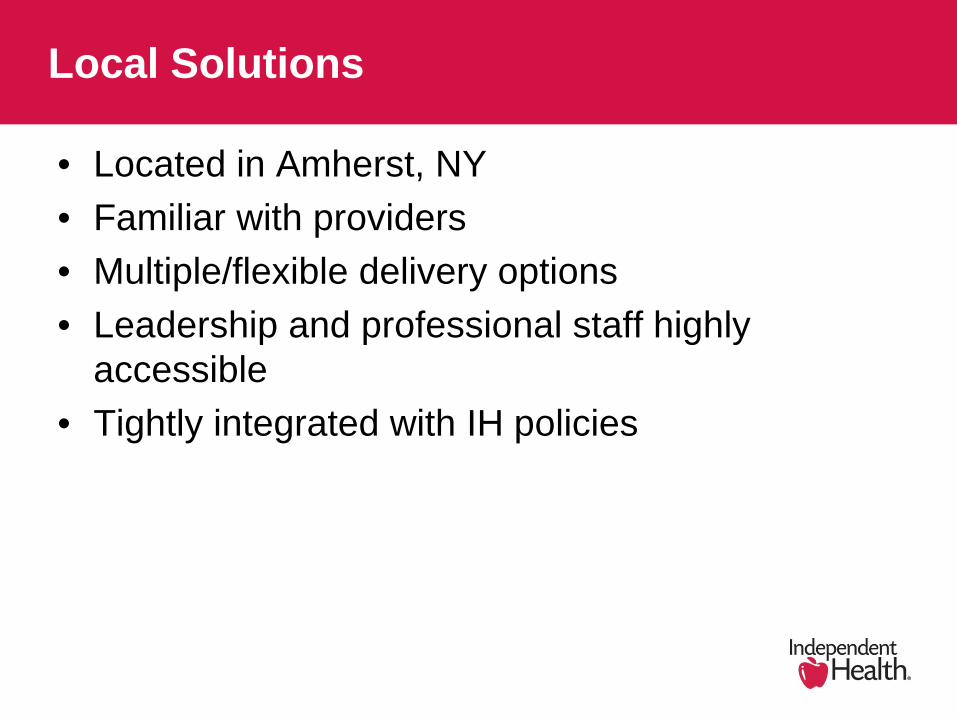
Local Solutions
• Located in Amherst, NY • Familiar with providers • Multiple/flexible delivery options • Leadership and professional staff highly
accessible • Tightly integrated with IH policies

Value to IHA Customers
• Controlling more of the supply chain allows IH to better understand and manage the increasing cost of the products
• The transparency of all financial relationships in the supply chain allows IH to make more fully-informed product decisions with manufacturers
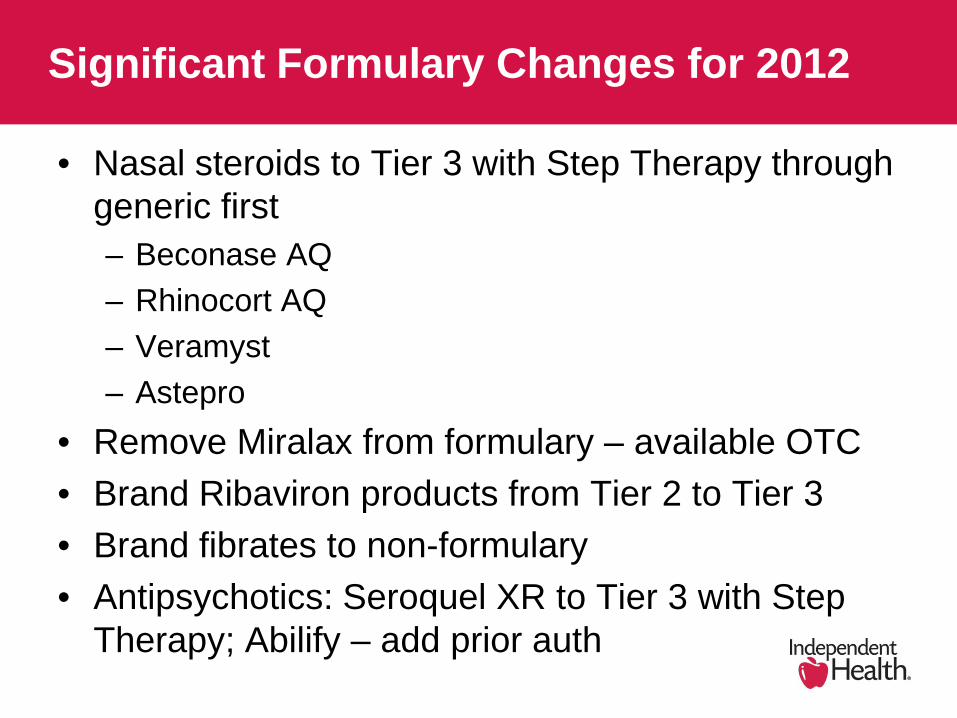
Significant Formulary Changes for 2012
• Nasal steroids to Tier 3 with Step Therapy through generic first – Beconase AQ – Rhinocort AQ – Veramyst – Astepro
• Remove Miralax from formulary – available OTC • Brand Ribaviron products from Tier 2 to Tier 3 • Brand fibrates to non-formulary • Antipsychotics: Seroquel XR to Tier 3 with Step
Therapy; Abilify – add prior auth

In Summary
• Pharmaceutical use and expenditures will continue to rise
• Effective management crosses multiple dimensions which include strategies to contain pharmacy costs, such as: – Benefit Design – Unit-cost management – generic drugs play a
significant role – Utilization management – Provider/member education

Option “B” Darleen Michalak, Ph.D. Tom Pomidoro, Claims Analyst

163
Why Option B? • Assist financially challenged schools with additional cost containment • Maintain certain benefits with $0
co-payments in critical areas

164
Option B

165

166

167

168

169
Option B Rates 1/1/2013
Option A Option B % Change
Contribution Rates 2012-13 1/1/2013-6/30/2014
Active East Central NY * Monthly Annually Monthly Annually
Single $451.50 $5,418.00 $429.00 $5,148.00 -5.25%
Family $1,226.00 $14,712.00 $1,165.00 $13,980.00 -5.24%
*+$7 PM/PM Administrative Fee
*+$7 PM/PM Administrative Fee
Active Mid-Hudson Region * Monthly Annually Monthly Annually
Single $545.50 $6,546.00 $518.25 $6,219.00 -5.26%
Family $1,454.00 $17,448.00 $1,381.25 $16,575.00 -5.27%
*+$7 PM/PM Administrative Fee *+$7 PM/PM Administrative Fee

Wellness: New Initiatives for 2012-13 Jeni Kapalczynski Wellness Coordinator

The NY44 Living Healthy
Wellness Program
July 1, 2012 to June 30, 2013
Jeni Kapalczynski, Wellness Coordinator 716-821-7161
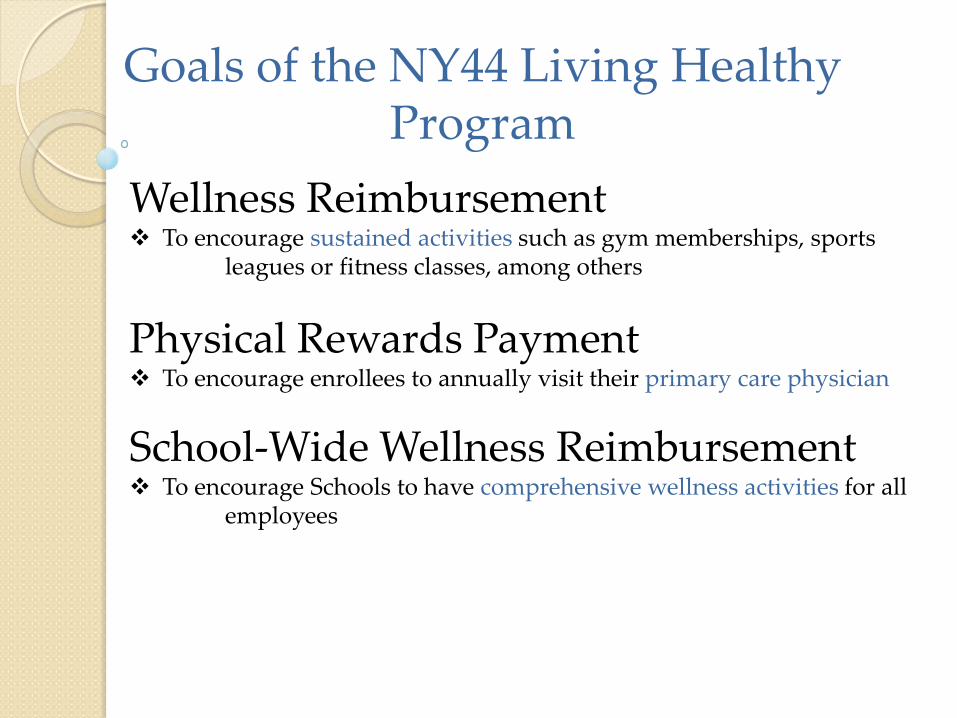
Goals of the NY44 Living Healthy Program
Wellness Reimbursement To encourage sustained activities such as gym memberships, sports leagues or fitness classes, among others
Physical Rewards Payment To encourage enrollees to annually visit their primary care physician
School-Wide Wellness Reimbursement To encourage Schools to have comprehensive wellness activities for all employees
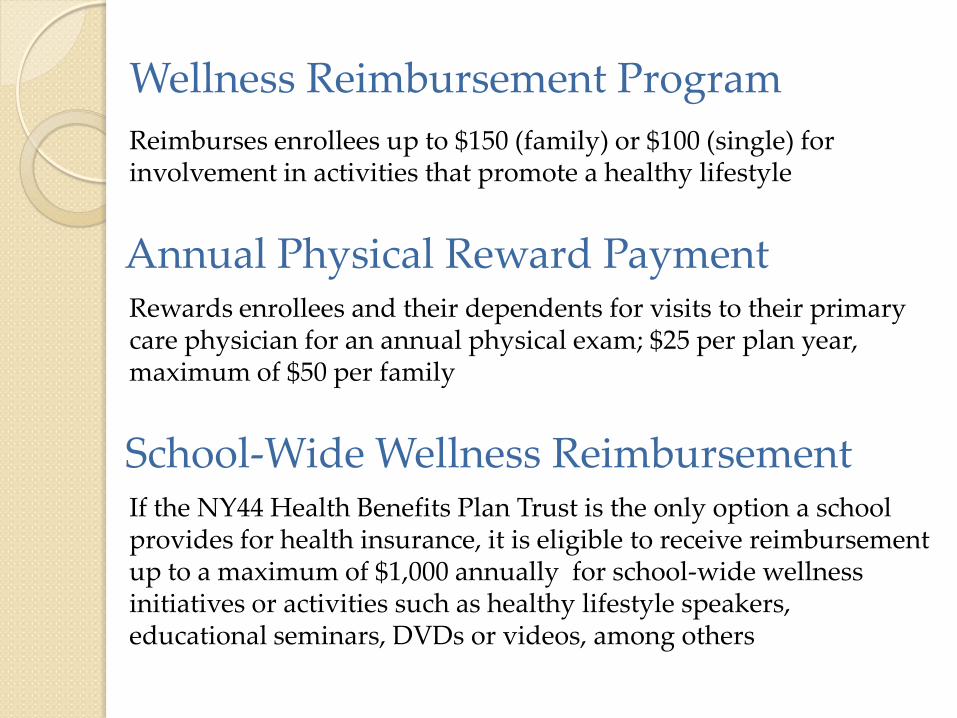
Wellness Reimbursement Program Reimburses enrollees up to $150 (family) or $100 (single) for
involvement in activities that promote a healthy lifestyle
Annual Physical Reward Payment Rewards enrollees and their dependents for visits to their primary care physician for an annual physical exam; $25 per plan year, maximum of $50 per family
School-Wide Wellness Reimbursement If the NY44 Health Benefits Plan Trust is the only option a school provides for health insurance, it is eligible to receive reimbursement up to a maximum of $1,000 annually for school-wide wellness initiatives or activities such as healthy lifestyle speakers, educational seminars, DVDs or videos, among others

NY44 Living Healthy Program Usage
For plan year ending June 30, 2012, 36.5% of active enrollees took advantage of the NY44 Living Healthy reimbursement program; 20% took advantage of the NY44 Living Healthy Annual Physical Exam Reward program
Of the 36.5% of enrollees that participated in the Wellness Reimbursement program, 54% were reimbursed for gym memberships
It is the goal of the NY44 to increase participation in the NY44 Living Healthy program. Please let your school’s enrollees know that questions can be answered by contacting the NY44 Health Trust office


Website, Newsletter Lori Sosenko Public Relations Consultant


Best Practices Linking School Websites to the NY44 Site

Best Practices Linking School Websites to the NY44 Site


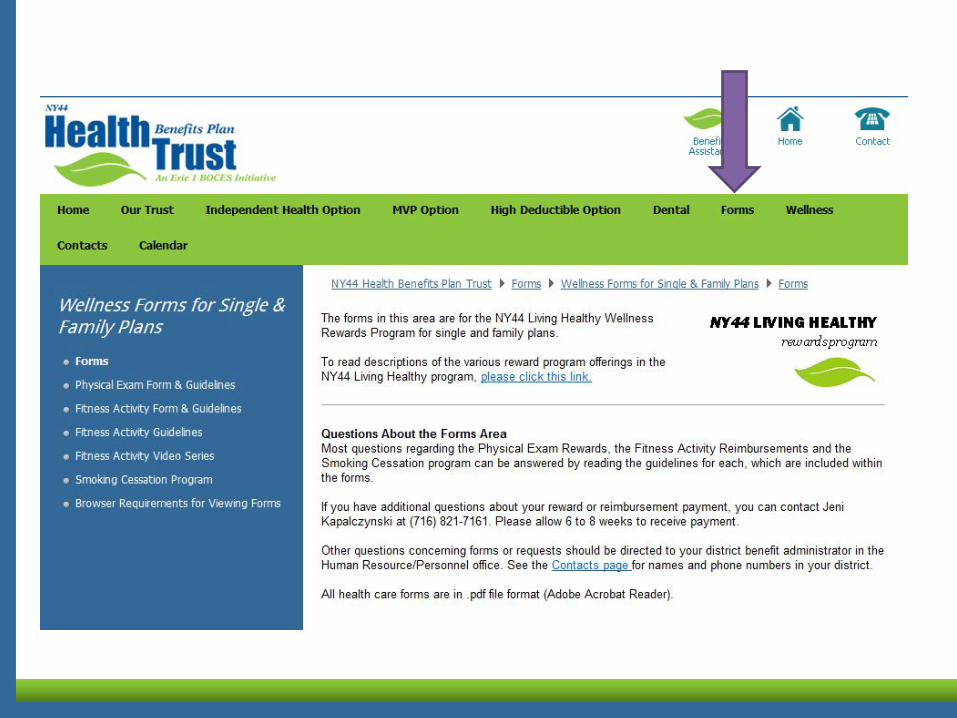

WELLNESS •Physical Exam Reward •Fitness Activity Reimbursement

CONTACTS

NEWSLETTER

What’s New: Newsletter • Better methods of communicating important Plan/wellness info. •New format for 2013 • First issue under new format will be Spring 2013 (April) • Published twice a year; spring, fall • Mailed to all enrollees at home • Continue to be posted online

Question and Answer Session

Adjournment Darleen Michalak, Ph.D. Plan Administrator/ Ex Officio Trustee