annual meeting and investor daycontent.stockpr.com/neogenomics/files/pages/neogenomics...pro forma...
TRANSCRIPT

Annual Meeting and Investor DayMay 25, 2017

Meeting Agenda – May 25th
2
8:00 – 8:30am Annual Shareholders Meeting
Analyst/Investor Day Presentations8:30 – 9:15am CEO Review
9:15 – 10:00am Pathologist Perspective10:00 – 10:15am Break10:15 – 11:00am Pharma Services
11:00 – 12:00am R&D and New Test DevelopmentNoon - 1:00pm Lunch/Review of Governmental Affairs
12:10pm – 1:30pm- Lab Tours – leaving every 20 minutes

Annual ShareholderMeeting May 25, 2017

Investor/Analyst DayPresentations May 25, 2017

Meeting Agenda – May 25th
5
8:00 – 8:30am Annual Shareholders Meeting
Analyst/Investor Day Presentations8:30 – 9:15am CEO Review
9:15 – 10:00am Pathologist Perspective10:00 – 10:15am Break10:15 – 11:00am Pharma Services
11:00 – 12:00am R&D and New Test DevelopmentNoon - 1:00pm Lunch/Review of Governmental Affairs
12:10pm – 1:30pm- Lab Tours – leaving every 20 minutes

Forward-looking StatementsThis presentation contains statements which constitute forward-looking statements within themeaning of Section 27A of the Securities Act, as amended; Section 21E of the Securities ExchangeAct of 1934; and the Private Securities Litigation Reform Act of 1995. The words “may”, “would”,“could”, “will”, “expect”, “estimate”, “anticipate”, “believe”, “intend”, “plan”, “goal”, and similarexpressions and variations thereof are intended to specifically identify forward-lookingstatements. All statements that are not statements of historical fact are forward-lookingstatements.
Investors and prospective investors are cautioned that any such forward-looking statements arenot guarantees of future performance and involve risks and uncertainties, and that actual resultsmay differ materially from those projected in the forward-looking statements as a result of variousfactors. The risks that might cause such differences are identified in our filings with the Securitiesand Exchange Commission. We undertake no obligation to publicly update or revise the forwardlooking statements made in this presentation to reflect events or circumstances after the date ofthis presentation or to reflect the occurrence of unanticipated events.
6
CEO Summary Douglas VanOortChairman & CEO

NeoGenomics Vision
8
By providing uncompromising quality,
exceptional service and innovative solutions,
we will be the World’s leading cancer testing and
information company.

NeoGenomics - Facts
9
• # 1 or 2 largest somatic cancer testing Lab in America
• Approximately 650,000 tests will be performed in 2017
• Approx. 160,000 SF of space, 1,000 employees, 50 Physicians and PhDs
• Most advanced and comprehensive cancer testing menu in America
• Outstanding franchise with Hospitals/Pathologists
• Unique and Growing business with Pharma clients
• Large market, fragmented industry, and very positive demographic trends

Drive for Growth
Clinical Genetic Testing Annual Revenue Clinical Genetic Tests Performed($, 000s)
* Base NEO represents organic revenue and test volume growth from legacy business and excludes the impacts from the PathLogic and Clarient acquisitions.
10
$558 $1,885$6,476
$11,505$20,015
$29,469$34,371
$43,484$59,866
$66,467$82,194
$188,374
$214,708
2004
2005
2006
2007
2008
2009
2010
2011
2012
2013
2014
2015
2016
Pro Forma Clarient 2015 Genetic Test RevenueNEO Clinical Genetic Testing Revenue
1,152 4,082 12,838
20,998 32,539
45,675 57,332
76,288 114,606
137,317 177,279
490,450
563,132
2004
2005
2006
2007
2008
2009
2010
2011
2012
2013
2014
2015
2016
Pro Forma Clarient 2015 Clinical Genetic TestsNEO Clincial Genetic Tests Performed
Confidential
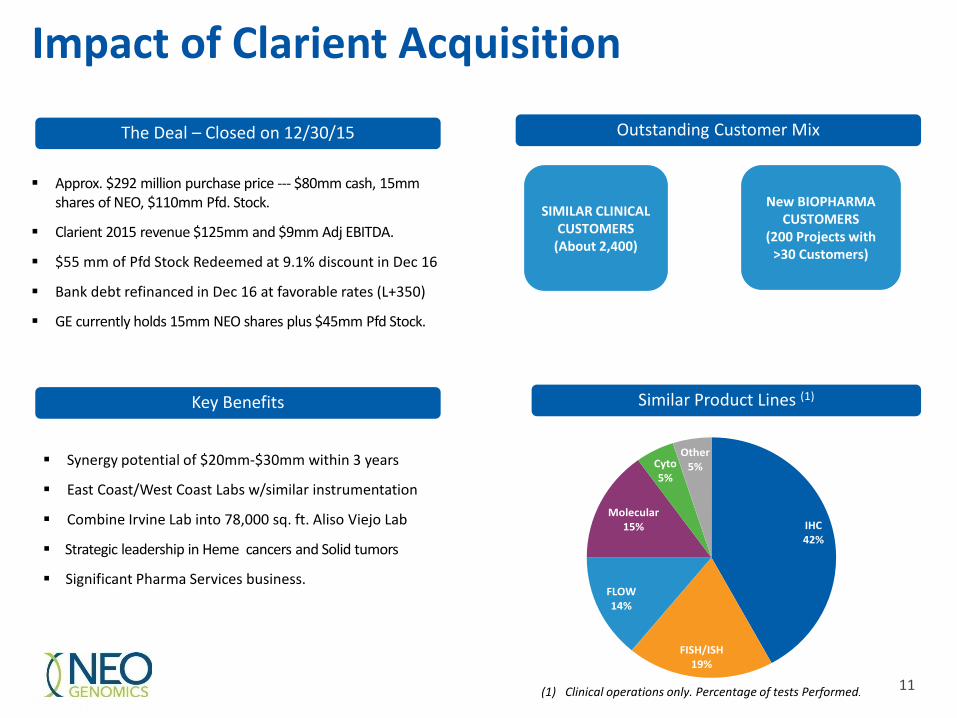
Impact of Clarient Acquisition
11
Key Benefits
Outstanding Customer Mix
Similar Product Lines (1)
Synergy potential of $20mm-$30mm within 3 years
East Coast/West Coast Labs w/similar instrumentation
Combine Irvine Lab into 78,000 sq. ft. Aliso Viejo Lab
Strategic leadership in Heme cancers and Solid tumors
Significant Pharma Services business.
IHC42%
FISH/ISH19%
FLOW14%
Molecular15%
Cyto5%
Other5%
(1) Clinical operations only. Percentage of tests Performed.
SIMILAR CLINICAL CUSTOMERS
(About 2,400)
New BIOPHARMA CUSTOMERS
(200 Projects with >30 Customers)
11
The Deal – Closed on 12/30/15
Approx. $292 million purchase price --- $80mm cash, 15mm shares of NEO, $110mm Pfd. Stock.
Clarient 2015 revenue $125mm and $9mm Adj EBITDA.
$55 mm of Pfd Stock Redeemed at 9.1% discount in Dec 16
Bank debt refinanced in Dec 16 at favorable rates (L+350)
GE currently holds 15mm NEO shares plus $45mm Pfd Stock.

Post Acquisition – Focus on Client Retention
$20.7 $23.2 $25.0 $23.0 $24.4 $25.1 $26.6 $30.3 $32.4 $31.8
$35.9
$61.7
$0.7
$29.4 $30.7
$28.9 $24.6
$0
$10
$20
$30
$40
$50
$60
$70
Q2 14 Q3 14 Q4 14 Q1 15 Q2 15 Q3 15 Q4 15 Q1 16 Q2 16 Q3 16 Q4 16 Q1 17
Quarterly Revenue(millions)
Clarient Rev
Neo Rev
Revenue up 29% over 6 quarters pre-acquisition
Revenue flat during Integration
12

Integration Complete
13
After 15 months, as of March 31, 2017, Integration is 100% complete.
• Sales force completely integrated after 2 months
• All “back - office” systems and processes integrated after 6 months
• LIS reprogrammed to incorporate Best Practices after 8 months
• Corporate culture and incentive programs fully integrated within 9-12 months
• All clients serviced from common LIS and Billing system after 12 months
• Irvine Lab completely consolidated into Aliso Viejo Lab after 15 months
After 16 months, Client Retention is nearly 100%.
New NeoGenomics
14
Same historically successful attributes :• Growth orientation• Leadership in Innovation• Entrepreneurialism• Exceptional Quality/Service• Deep/comprehensive test menu• Low-cost testing processes• Strong culture
• Scale from doubling our volume• Improved Profitability

Pursuit of Growth - Again
15
Growth Goals:• Mid-teens organic clinical volume growth
• 20%+ organic Pharma revenue growth
• 25-35% incremental Adjusted EBITDA on revenue growth
Driven by:• Market share gains
• Demographics and medical advances
• Innovation in test development
• Increased efficiencies
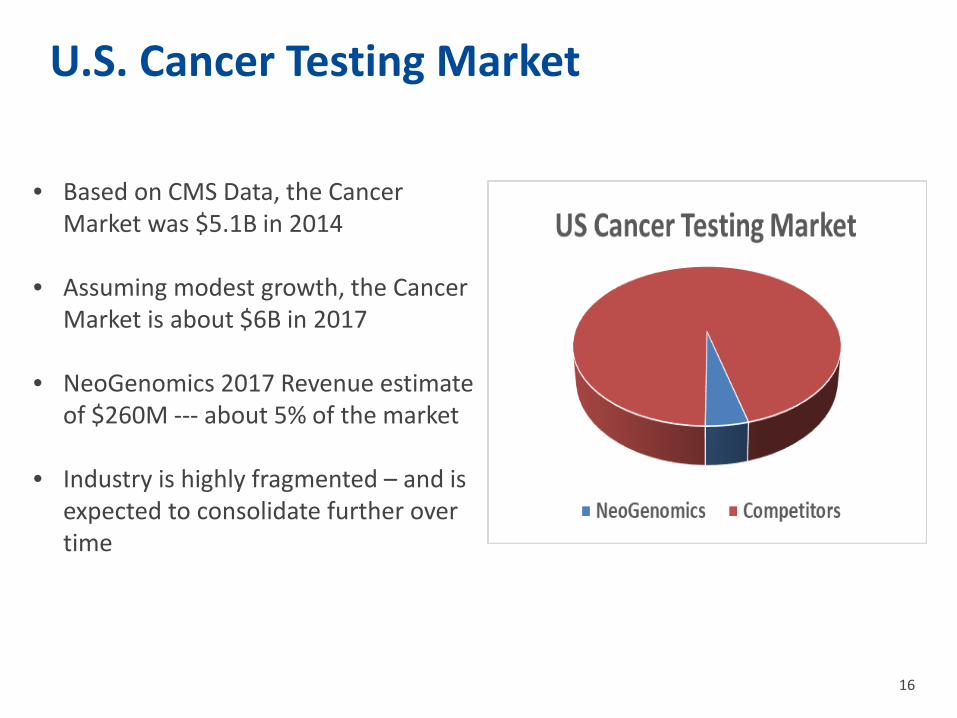
U.S. Cancer Testing Market
16
• Based on CMS Data, the Cancer Market was $5.1B in 2014
• Assuming modest growth, the Cancer Market is about $6B in 2017
• NeoGenomics 2017 Revenue estimate of $260M --- about 5% of the market
• Industry is highly fragmented – and is expected to consolidate further over time
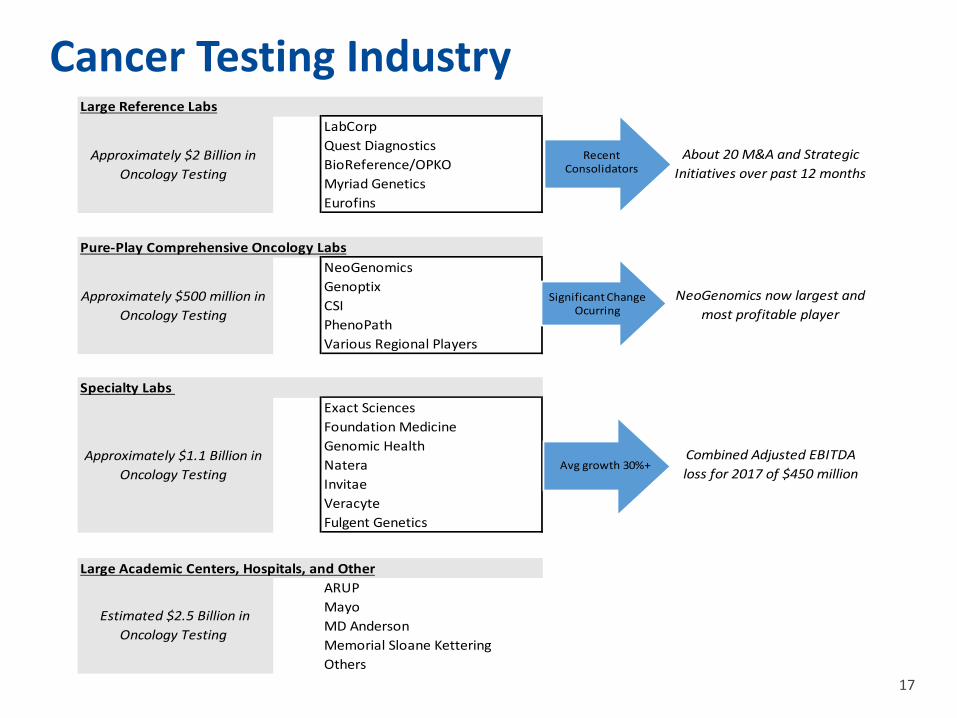
Cancer Testing Industry
17
Large Reference LabsLabCorpQuest DiagnosticsBioReference/OPKOMyriad GeneticsEurofins
Pure-Play Comprehensive Oncology LabsNeoGenomicsGenoptixCSIPhenoPathVarious Regional Players
Specialty Labs Exact SciencesFoundation MedicineGenomic HealthNatera InvitaeVeracyteFulgent Genetics
Large Academic Centers, Hospitals, and OtherARUPMayoMD AndersonMemorial Sloane KetteringOthers
Estimated $2.5 Billion in Oncology Testing
Approximately $1.1 Billion in Oncology Testing
Approximately $2 Billion in Oncology Testing
About 20 M&A and Strategic Initiatives over past 12 months
Approximately $500 million in Oncology Testing
Combined Adjusted EBITDA loss for 2017 of $450 million
NeoGenomics now largest and most profitable player
Recent Consolidators
Avg growth 30%+
Significant Change Ocurring

Market Demand
Source: National Institutes of Health (NIH)
18
• Aging Population – incidence increases with age
• Increased Prevalence – better treatments lead to more survivors and monitoring
• Scientific advances – driving targeted therapeutics
• Increased cost of drugs –more careful triage

Demographic Tailwinds
Shifting Demographics Incidence of Cancer by Age
0.0
20.0
40.0
60.0
80.0
100.0
120.0
Age 60-64 Age 65-74 Age 75-84 Age 85+
1.0%2.7%
5.1%
13.8%
24.4%26.2%
18.8%
7.9%
< 20 20-34 35-44 45-54 55-64 65-74 74-84 > 84
Source: United States Census Bureau Source: National Cancer Institute
19

Scientific Advances
20
Therapeutic Area Drug Examples Example Companion or
Complimentary Tests
Immuno-OncologyKeytruda, Opdivo,
and many in development
PD-L1, MSI, MMR, Tumor Mutation Burden (TMB)
NSCLC Anti-EGFR, ALK inhibitors, etc.
EGFR, ALK, ROS1, BRAF V600E, MET, RET, NTRAK, etc.
Ovarian and Prostate PARP Inhibitors BRCA, PTEN, ERG, MMR,
Breast and Gastric HerceptinHER2/neu IHC & FISH tests,
BRCA, and numerous molecular tests
Melanoma Vemurafenib(Zelboraf)
BRAF, C-KIT, numerous FISH tests
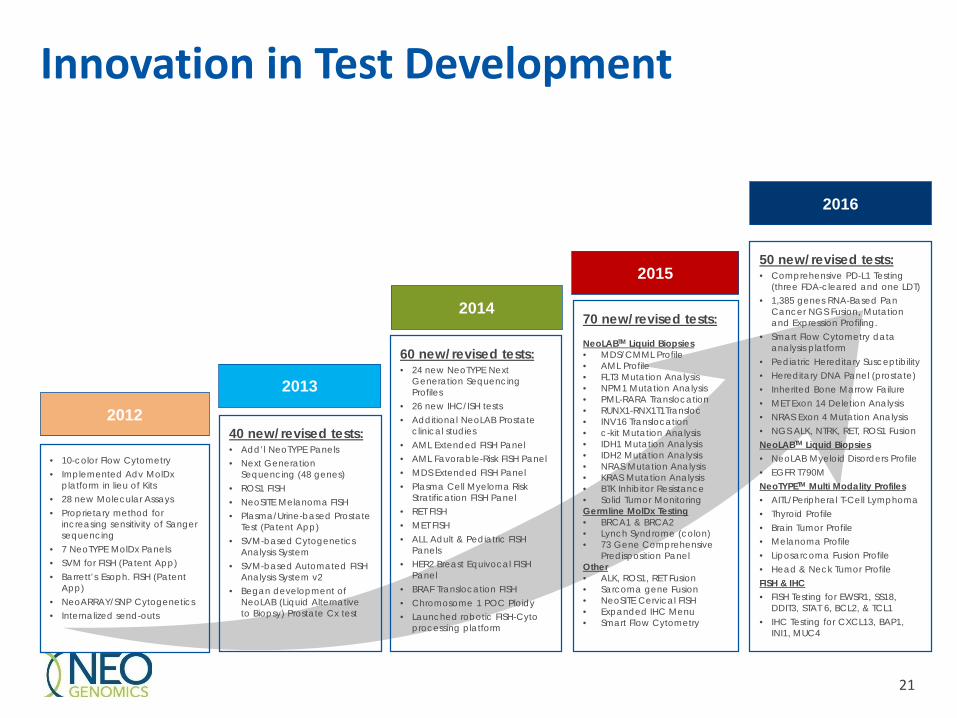
Innovation in Test Development
70 new/revised tests: NeoLABTM Liquid Biopsies• MDS/CMML Profile• AML Profile • FLT3 Mutation Analysis• NPM1 Mutation Analysis• PML-RARA Translocation• RUNX1-RNX1T1Transloc• INV16 Translocation• c-kit Mutation Analysis• IDH1 Mutation Analysis• IDH2 Mutation Analysis• NRAS Mutation Analysis• KRAS Mutation Analysis• BTK Inhibitor Resistance• Solid Tumor MonitoringGermline MolDx Testing • BRCA1 & BRCA2• Lynch Syndrome (colon)• 73 Gene Comprehensive
Predisposition PanelOther • ALK, ROS1, RET Fusion• Sarcoma gene Fusion• NeoSITE Cervical FISH• Expanded IHC Menu• Smart Flow Cytometry
• 10-color Flow Cytometry • Implemented Adv MolDx
platform in lieu of Kits• 28 new Molecular Assays• Proprietary method for
increasing sensitivity of Sanger sequencing
• 7 NeoTYPE MolDx Panels• SVM for FISH (Patent App)• Barrett’s Esoph. FISH (Patent
App)• NeoARRAY/SNP Cytogenetics• Internalized send-outs
40 new/revised tests:• Add’l NeoTYPE Panels• Next Generation
Sequencing (48 genes)• ROS1 FISH• NeoSITE Melanoma FISH• Plasma/Urine-based Prostate
Test (Patent App)• SVM-based Cytogenetics
Analysis System• SVM-based Automated FISH
Analysis System v2• Began development of
NeoLAB (Liquid Alternative to Biopsy) Prostate Cx test
60 new/revised tests:• 24 new NeoTYPE Next
Generation Sequencing Profiles
• 26 new IHC/ISH tests• Additional NeoLAB Prostate
clinical studies• AML Extended FISH Panel• AML Favorable-Risk FISH Panel• MDS Extended FISH Panel• Plasma Cell Myeloma Risk
Stratification FISH Panel• RET FISH• MET FISH• ALL Adult & Pediatric FISH
Panels• HER2 Breast Equivocal FISH
Panel• BRAF Translocation FISH• Chromosome 1 POC Ploidy• Launched robotic FISH-Cyto
processing platform
50 new/revised tests:• Comprehensive PD-L1 Testing
(three FDA-cleared and one LDT)• 1,385 genes RNA-Based Pan
Cancer NGS Fusion, Mutation and Expression Profiling.
• Smart Flow Cytometry data analysis platform
• Pediatric Hereditary Susceptibility• Hereditary DNA Panel (prostate)• Inherited Bone Marrow Failure • MET Exon 14 Deletion Analysis• NRAS Exon 4 Mutation Analysis• NGS ALK, NTRK, RET, ROS1 FusionNeoLABTM Liquid Biopsies• NeoLAB Myeloid Disorders Profile• EGFR T790MNeoTYPETM Multi Modality Profiles• AITL/Peripheral T-Cell Lymphoma• Thyroid Profile• Brain Tumor Profile• Melanoma Profile• Liposarcoma Fusion Profile• Head & Neck Tumor ProfileFISH & IHC• FISH Testing for EWSR1, SS18,
DDIT3, STAT 6, BCL2, & TCL1• IHC Testing for CXCL13, BAP1,
INI1, MUC4
2012
2013
2014
2015
2016
21
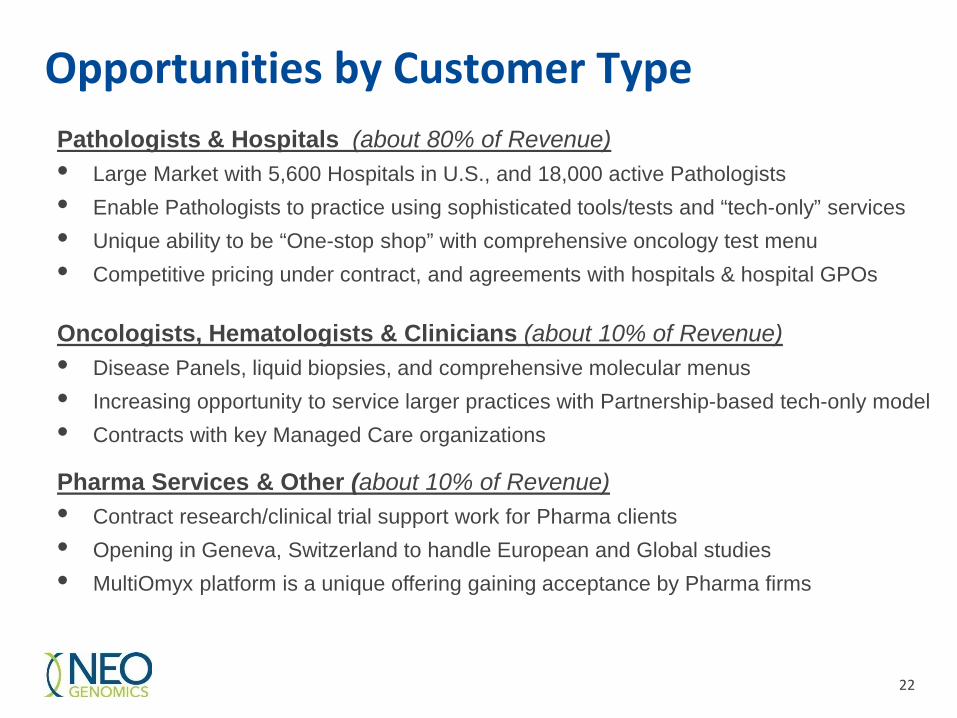
Opportunities by Customer TypePathologists & Hospitals (about 80% of Revenue)• Large Market with 5,600 Hospitals in U.S., and 18,000 active Pathologists• Enable Pathologists to practice using sophisticated tools/tests and “tech-only” services • Unique ability to be “One-stop shop” with comprehensive oncology test menu• Competitive pricing under contract, and agreements with hospitals & hospital GPOs
Oncologists, Hematologists & Clinicians (about 10% of Revenue)• Disease Panels, liquid biopsies, and comprehensive molecular menus• Increasing opportunity to service larger practices with Partnership-based tech-only model• Contracts with key Managed Care organizations
Pharma Services & Other (about 10% of Revenue)• Contract research/clinical trial support work for Pharma clients• Opening in Geneva, Switzerland to handle European and Global studies• MultiOmyx platform is a unique offering gaining acceptance by Pharma firms
22

Cross Selling to Pathologists & Hospitals
23
“Old Clarient Clients”Great reputation – Solid Tumors
– FISH – great solid tumor FISH franchise, good capacity
– Flow Cytometry – excellent program, expandable capacity
– Cytogenetics – good product and service
– Digital Imaging and IHC –outstanding and unique product, steady volume
“Old NEO Clients”Great reputation - Heme Cancers
– FISH – outstanding hemeFISHfranchise, good capacity
– Flow Cytometry – Outstanding program, expandable capacity
– Cytogenetics – outstanding product and service
– Molecular – unique product, fast growing volume
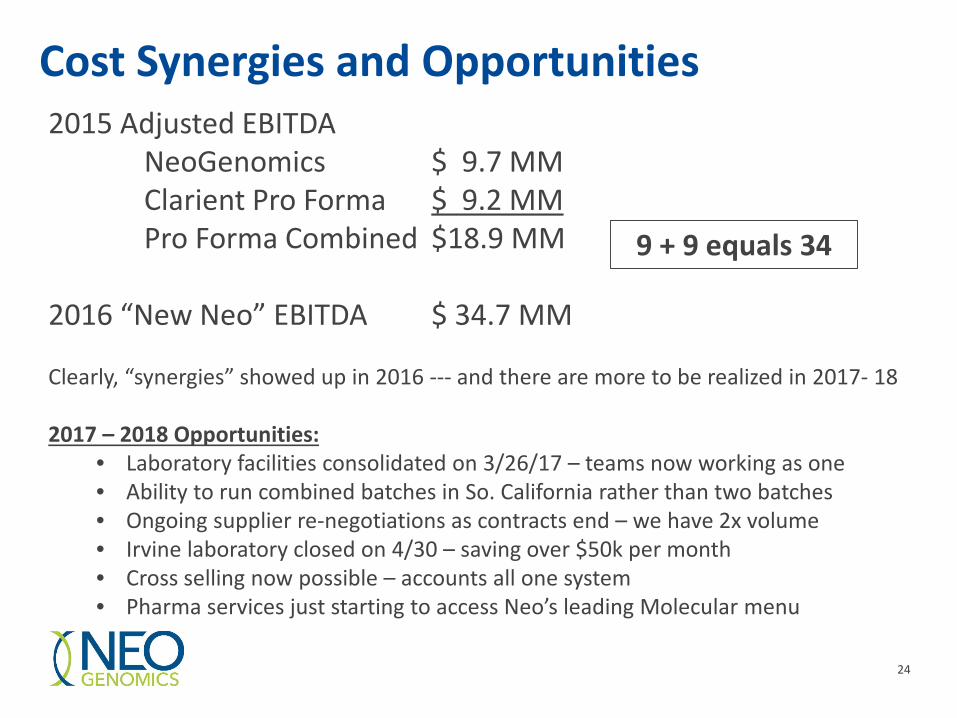
Cost Synergies and Opportunities
24
2015 Adjusted EBITDANeoGenomics $ 9.7 MMClarient Pro Forma $ 9.2 MMPro Forma Combined $18.9 MM
2016 “New Neo” EBITDA $ 34.7 MM
Clearly, “synergies” showed up in 2016 --- and there are more to be realized in 2017- 18
2017 – 2018 Opportunities:• Laboratory facilities consolidated on 3/26/17 – teams now working as one• Ability to run combined batches in So. California rather than two batches• Ongoing supplier re-negotiations as contracts end – we have 2x volume• Irvine laboratory closed on 4/30 – saving over $50k per month• Cross selling now possible – accounts all one system• Pharma services just starting to access Neo’s leading Molecular menu
9 + 9 equals 34
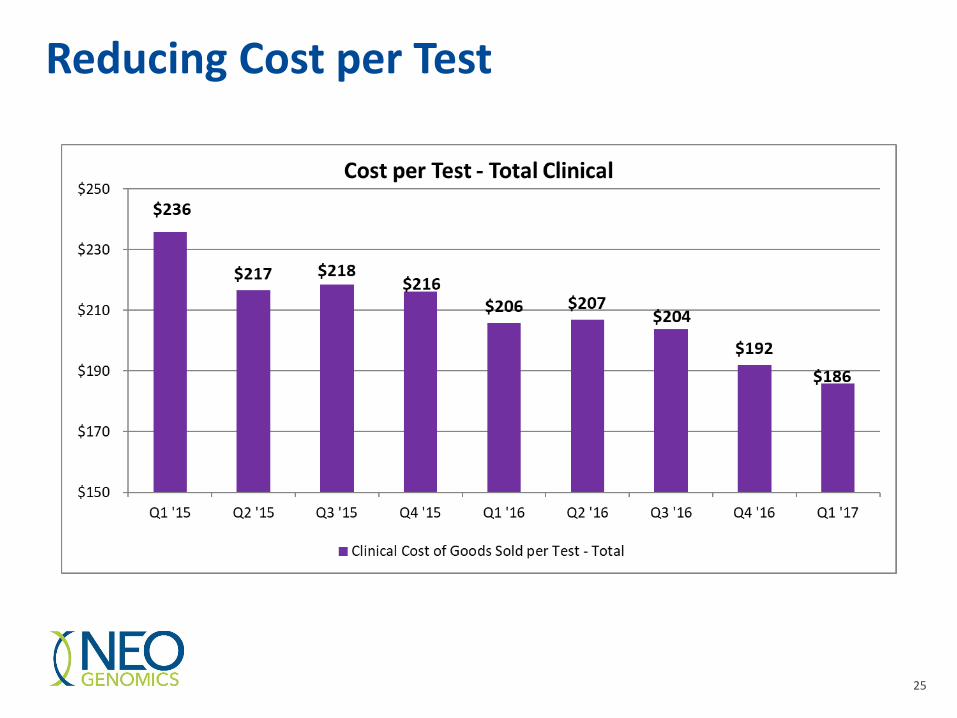
Reducing Cost per Test
25

Improving Productivity
* To facilitate comparison, all data is for Clinical Genetic Testing and excludes the impact from the PathLogic acquisition and Pharma Services.(1) Productivity calculated as the average number of lab tests completed per month per laboratory FTE.
45.9%
44.7% 44.8%
47.7% 48.0%
46.1%
47.2%
-40.9%
65.6%
-50%
-40%
-30%
-20%
-10%
0%
10%
20%
30%
40%
50%
60%
70%
35%
40%
45%
50%
55%
2010 2011 2012 2013 2014 2015 2016
Gross Margin % From Clinical Genetic Testing Cum Change in Avg Rev/ Clinical Genetic Test Since 2009
Cum Change in Productivity Since 2009
Cum
Chan
ge in
Avg
Rev
/Tes
t & P
rodu
ctiv
ity
(1)
26
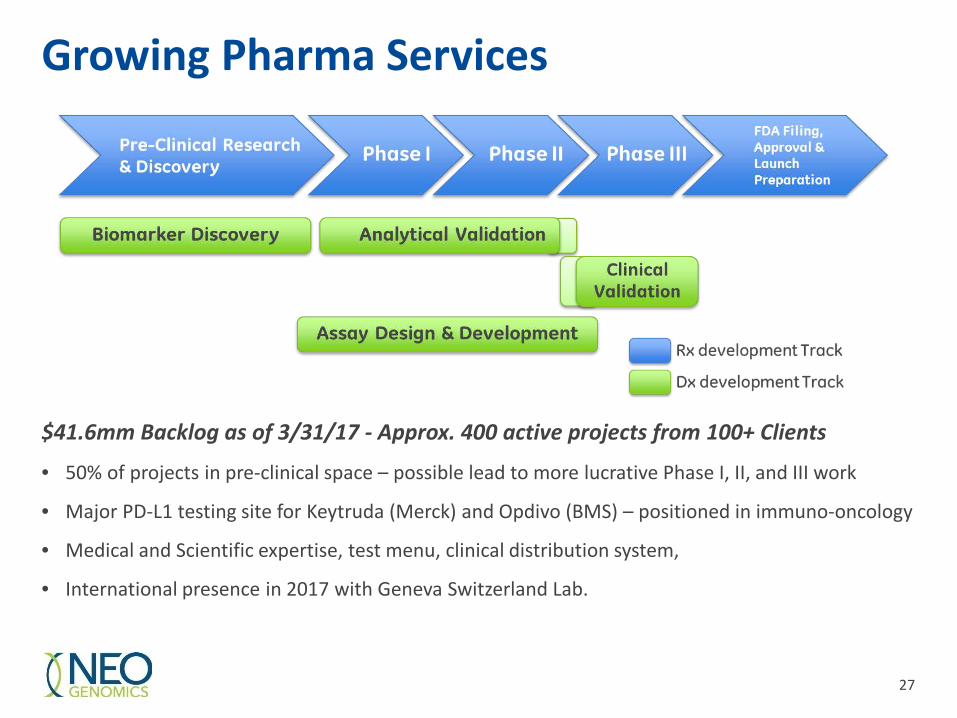
Growing Pharma Services
$41.6mm Backlog as of 3/31/17 - Approx. 400 active projects from 100+ Clients
• 50% of projects in pre-clinical space – possible lead to more lucrative Phase I, II, and III work
• Major PD-L1 testing site for Keytruda (Merck) and Opdivo (BMS) – positioned in immuno-oncology
• Medical and Scientific expertise, test menu, clinical distribution system,
• International presence in 2017 with Geneva Switzerland Lab.
27

Confidential 28
Acquisition Strategy
NEO Focus – Upper right hand quadrant
Synergistic Deals
High
HighLow Market Growth
Tech
nolo
gies
NextGen SeqDigital
Companion DxPathology
OncologyFISH Clinical Trials
Flow
Cytogenetics
TraditionalAnatomic Path.
BioInformatics
28
Requirements• Synergy• Scale• Added Capability

29
NEO Stock Price
May 2012$1.67
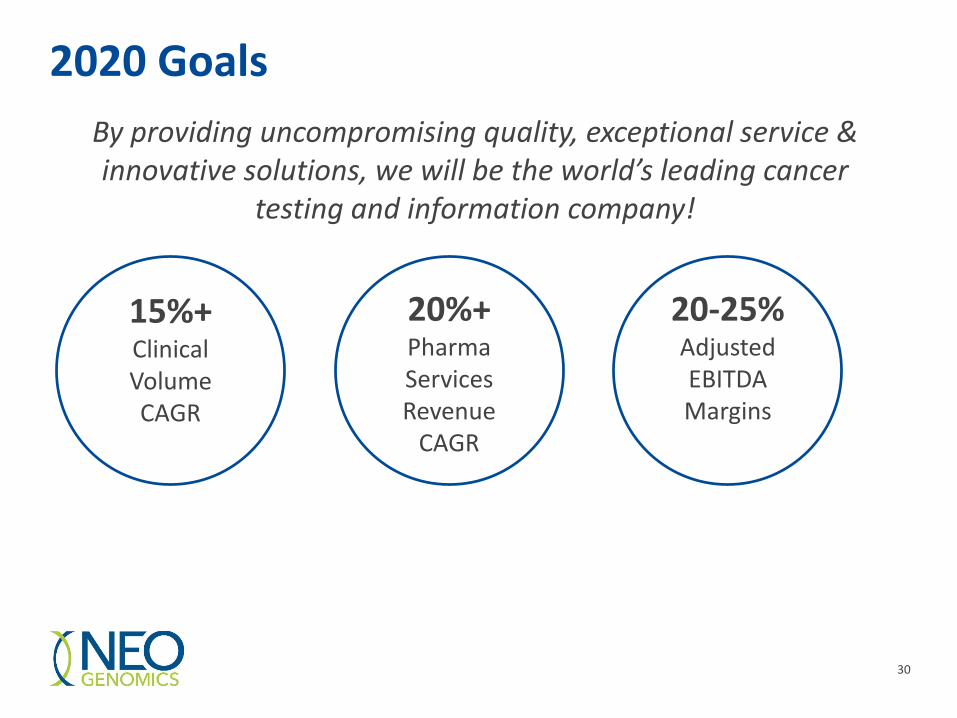
2020 GoalsBy providing uncompromising quality, exceptional service & innovative solutions, we will be the world’s leading cancer
testing and information company!
15%+ Clinical Volume CAGR
20%+ Pharma ServicesRevenue
CAGR
20-25% Adjusted EBITDA Margins
30

Key Takeaways
31
Unique and leading pure-play Oncology Company
History of strong performance
Significant opportunities for growth
Realization of cost synergies expected to accelerate
Strategic opportunities highly likely over the next 36 mos
Well positioned for continued Industry Leadership

Questions and Answers
32