annual industry report 2020
TRANSCRIPT

2020ANNUAL INDUSTRY REPORT

CORPORATE ANNUAL REPORT BROCHURE | 2
Table of Contents
01.COVID-19 and the Endurance Industry...............................9
1.1 Participation Rates....................10-131.2 Repeat Participation..................14-151.3 Distribution of Races.................16-171.4 Race Churn................................18-191.5 COVID-19 and Timers.................20-21
Intro and Methodology........3-5Data Set...............................6-8
02.Virtual Trends ...................23
2.1 Virtual is Real............................24-252.2 Demographics of Virtual............26-272.3 Size of Virtual Events.....................282.4 Length of Virtual Events.................29
03.Registration Trends............31
3.1 When Runners Register..............32-33 3.2 Registration Times.........................343.3 Pricing Trends...........................35-363.4 Pricing Strategies...........................373.5 Demographic Trends..................38-393.6 Giveaways.................................40-413.7 Store Items/Add-Ons......................423.8 Mobile Adoption........................43-45
04.Promotion Trends..............47
4.1 Coupons.........................................484.2 Referrals....................................49-504.3 Groups/Teams................................514.4 Email Marketing.........................52-534.5 Web Analytics............................54-564.6 RaceInsights...................................57
05.
06.
GiveTrends.........................59
5.1. Donations.................................60-615.2 Fundraising................................62-635.3 Facebook Fundraiser Integration.................................64-65
RaceDay.............................67
6.1. RaceDay Registrations...................686.2 CheckIn App Usage.........................696.3 Scored Results Notifications.........706.4 The Race Director...........................716.5 RaceJoy GPS Tracking...............72-73Timer Survey Data................................746.6 Timing Business........................75-766.7 Market Competition........................776.8 Role in the Industry....................78-796.9 Timing Technology....................80-816.10 Timing Business in 2021..........82-83
2

CORPORATE ANNUAL REPORT BROCHURE | 3
Tens of millions of people participate in endurance events in the United States each year, and across the country people dedicate their lives and earn their livelihoods from the creation of those events. Despite the size of the industry, there is no singular aggregator of data for the events, and insight into the state of the market has remained elusive.
We mine RunSignup’s data annually to generate a transparent look at our slice of the endurance market. While our tech-nology or business model may impact the results, our sample size is estimated to be around 20-30% of the US market, making it a robust source for information. Anywhere we believe the specifics of our platform may make our results dif-ferent from the broader market, that is indicated in the description. With our comprehensive data source, we are able to identify trends in the industry and provide recommendations to keep endurance events competitive in a crowded market. In this report, we quantify and explore:
• The impact of COVID-19 on the endurance industry• The rise of virtual races• Patterns in registration• The success of various promotion strategies• Trends in peer-to-peer fundraising through events• The impact of RaceDay technology
Intro and Methodology
Throughout this report, our statistics come from RunSignup’s registration and results data. The sample includes races with more than 2 people registered, including both imported and paid registrations. In order to aggregate the data for publication in early 2020, the dates shown are not a direct calendar year; rather, they cover December 1 (of the prior year) through November 30 of the stated year. Additionally survey data from January 2021 is included. For more information about the survey day see section 6.
3
CORPORATE ANNUAL REPORT BROCHURE | 4
a year like no otherI t goes without saying that th is repor t is unl ike any other. For the f ive previous i terat ions, we focused on grad-ual shif ts (a 0.1% par t ic ipat ion decl ine or a 1% growth) and incremental movements (year ly increases in mobi le adopt ion) . In contrast , the 2020 repor t shows wi ld swings and unprecedented volat i l i ty .
We v iew the remarkable nature of th is year ’s data as a valuable resource, documenting the react ion of the indus-try to cr is is . The survival of endurance events in the midst of event shutdowns is credited ent i re ly to the extraor -dinary innovat ion of the thousands of event professionals who re- imagined the world of racing.
The evolut ion of the industry came in four over lapping but d ist inct phases. F i rst came chaos and cancel lat ions, as race organizat ions scrambled to f ind off ic ia l guidance whi le f ie ld ing a barrage of par t ic ipant quest ions about refunds. Races that could not postpone chose to go vir tual , creat ing l ightweight repl icas of their t radit ional events with medals and results , but no race course or after-par ty . Over t ime, we saw innovation in those re-placement events , with whimsical ly themed vir tual races and extended v i r tual chal lenges designed for pandem-ic restr ict ions instead of despite them. By summer, t imers had star ted to re-think race day , creat ing modif ied in-person exper iences with star t l ine waves, social ly d istant packet-pickups, and self -suff ic ient race courses.
The shif t ing landscape of 2020 is v is ib le in every piece of data and informed every interpretat ion that we made. And whi le we look forward to more gradual recovery th is year, we recognize that 2021 (and even 2022) wi l l not s imply return to a 2019 world. Timing businesses have closed, establ ished races have canceled for good, and par t ic ipant ’s t ra in ing rout ines have changed. The r ipples created wi l l last wel l into the future.
4

CORPORATE ANNUAL REPORT BROCHURE | 5
2020 also brought new ways of th inking about events. Vir tual races were introduced years ago but they were a mystery to most race par t ic ipants. Today, the v i r tual race is as ubiquitous as your local Turkey Trot . Whi le many athletes are eager to get back to tradit ional races, a subset of par t ic ipants are never giv ing up the f lexibi l i ty of s leeping in and racing at their le isure.
I t is l ike ly that there is some vir tual fat igue, as seen in the Running USA 2020 Global Running Survey ’s 1 f inding that 66% of runners are somewhat or very unl ikely to par t ic ipate v i r tual ly in 2021. However, v i r tual racing and v i r tual chal lenges have also brought a new cohor t of athletes into the fold. The demographic prof i les we found for v i r tual runners dif fer f rom those of t radit ional in-person race attendees. Vir tual par t ic ipants tend to be old-er and more l ikely to be women, and the low repeat par t ic ipat ion seen in 2020 indicates that many of th is year ’s v i r tual race par t ic ipants were brand new to the event (and possibly to the spor t) . In-person events wi l l resume their dominant posit ion in the market , but v i r tual chal lenges, special ty v i r tual races, and v i r tual components to tradit ional races wi l l st ick around for years to come.
Ready or not , i t ’s 2021. Restr ict ions remain and uncer tainty is constant , but the industry is far more prepared today than i t was in March of 2020. We ant icipate a year with star ts and stops, but also groundbreaking events and increasing stabi l i ty .
For the best chance at success, races should take their v i r tual race exper t ise into 2021 along with their new protocols for safe in-person events. Hybrid events with both vir tual and in-person elements have the greatest chance at prosperi ty . With the fal l race schedule guaranteed to be crowded once again with postponed events, the spr ing and summer races that move quickly to get pandemic-proof hybrid events on their local schedule wi l l have an advantage in captur ing par t ic ipants.
We look forward to growth and oppor tunity in next year ’s repor t .
1 Running USA 2020 Global Running Survey
a new year
5

CORPORATE ANNUAL REPORT BROCHURE | 6
Data Set
RACE TYPE # RACES 2016 # RACES 2017 # RACES 2018 # RACES 2019 # RACES 2020
Overall 28,194 35,376 42,738 49,671 46,893
5K and less 15,802 19,588 23,731 27,716 24,407
10K and less 2,645 3,295 4,022 4,671 5,046
Half Marathon and less 1,515 2,033 2,571 2,974 3,572
Marathon and less 626 796 1,036 1,233 1,640
Ultra 546 677 853 1,073 2,256
Triathlon 663 913 1,205 1,343 956
Unknown 6,397 8,074 9,320 10,661 9,016
These numbers represent a l l races and registrat ions on RunSignup between 2016 and 2020, with a year def ined as 12/1 of the previous year through 11/30 of the stated year. Because the platform has seen growth in the form of increased market share on our s i te , these cannot be taken as a representat ion of growth across the industry . For a breakdown of year-over-year par t ic ipat ion growth or decl ine between the same cohor t of races, see sect ion 1.1 (page 10) . This char t should be used simply to gain a better understanding of the extent of the data that we analyzed.
We welcome quest ions and fur ther feedback. Please direct comments to [email protected] (Johanna Goode)
Races on Runsignup
6

CORPORATE ANNUAL REPORT BROCHURE | 7
RACE TYPE # PARTICIPANTS 2016
# PARTICIPANTS 2017
# PARTICIPANTS 2018
# PARTICIPANTS 2019
# PARTICIPANTS 2020
Overall 4,941,400 5,249,820 6,177,666 7,312,022 4,713,380
5K and less 2,637,683 3,063,399 3,715,467 4,580,738 2,677,195
10K and less 584,040 719,224 826,018 912,394 498,424
Half Marathon and less 595,663 707,912 798,872 873,443 564,017
Marathon and less 137,248 141,807 182,903 192,854 151,629
Ultra 46,739 64,990 78,893 109,810 290,792
Triathlon 63,762 78,615 94,842 106,087 36,554
Unknown 876,265 473,873 480,671 536,696 494,769
Registrations on Runsignup
Because there is no s ingle aggregator of race data in the US, there is not a precise determinat ion of the s ize of the market . However, f rom our best analysis of data from Running USA (repor ted 18.1 mi l l ion registrat ions in 2018) , October race calendars , RunningInTheUSA, and worldwide endurance industry est imates from Eventbr i te , we est imate that the pre-COVID US market was in the range of 22-30 mi l l ion registrat ions.
We estimate that RunSignup data represents
at least 20-30% of the US race registration market
7
CORPORATE ANNUAL REPORT BROCHURE | 8
We have been positively surprised by the post-COVID turnout, [of] 80% of a normal year. It’s encouraging as we look ahead to 2021 and beyond that we can bounce back rapidly.
- Healthy Kids Running Series
8
CORPORATE ANNUAL REPORT BROCHURE | 9
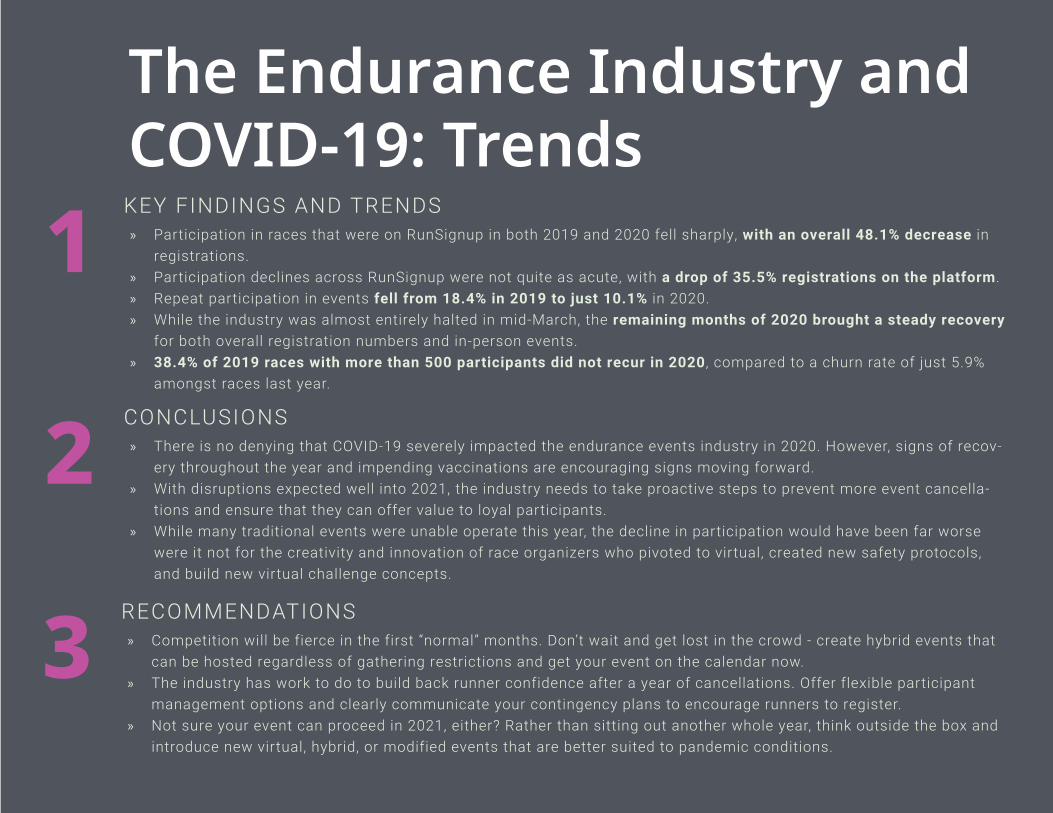
The Endurance Industry and COVID-19: Trends
1 » Participation in races that were on RunSignup in both 2019 and 2020 fell sharply, with an overall 48.1% decrease in registrations.
» Participation declines across RunSignup were not quite as acute, with a drop of 35.5% registrations on the platform. » Repeat participation in events fell from 18.4% in 2019 to just 10.1% in 2020. » While the industry was almost entirely halted in mid-March, the remaining months of 2020 brought a steady recovery
for both overall registration numbers and in-person events. » 38.4% of 2019 races with more than 500 participants did not recur in 2020 , compared to a churn rate of just 5.9%
amongst races last year.
KEY FINDINGS AND TRENDS
2 » There is no denying that COVID-19 severely impacted the endurance events industry in 2020. However, signs of recov-ery throughout the year and impending vaccinations are encouraging signs moving forward.
» With disruptions expected well into 2021, the industry needs to take proactive steps to prevent more event cancella-tions and ensure that they can offer value to loyal participants.
» While many traditional events were unable operate this year, the decline in participation would have been far worse were it not for the creativity and innovation of race organizers who pivoted to virtual, created new safety protocols, and build new virtual challenge concepts.
CONCLUSIONS
3 » Competition will be fierce in the first “normal” months. Don’t wait and get lost in the crowd - create hybrid events that can be hosted regardless of gathering restrictions and get your event on the calendar now.
» The industry has work to do to build back runner confidence after a year of cancellations. Offer flexible participant management options and clearly communicate your contingency plans to encourage runners to register.
» Not sure your event can proceed in 2021, either? Rather than sitting out another whole year, think outside the box and introduce new virtual, hybrid, or modified events that are better suited to pandemic conditions.
RECOMMENDATIONS
9

CORPORATE ANNUAL REPORT BROCHURE | 10
1.1 Participation Rates
RACE TYPE # RACES2019
# RACES2020
# PARTICIPANTS2019
# PARTICIPANTS2020 GROWTH
Overall 28,950 25,023 4,813,812 2,498,274 -48.1%
5K and less 15,332 13,114 2,902,235 1,433,766 -50.6%
10K and less 2,817 2,704 623,496 324,201 -48.0%
Half Marathon and less 1,967 2,084 652,785 400,095 -38.71%
Marathon and less 735 827 140,707 82,056 -41.68%
Ultra 698 777 76,572 49,337 -35.57%
Triathlon 785 606 64,156 22,360 -65.15%
Unknown 6,616 4,911 353,861 186,459 -47.31
The number of races l isted in 2019 vs. 2020 var ies due to races adding (or removing) events to exist ing races.
Year-over-year participant drop of 48.1%The headl ine here is that races that did take place in both 2019 and 2020 had an average drop in par t ic ipat ion of 48.%. For some, that decl ine was the result of a change from an in-person event to a v i r tual one; for others par t ic ipant caps were adjusted to comply with local restr ict ions on gather ings.
Shor ter d istances where runners were typical ly register later and were less l ikely to have committed to tra in ing programs took the biggest h i t on par t ic ipat ion. However, no distance was spared - across the industry , races that d id recur saw massive decl ines in par t ic ipat ion.
I t is impor tant to note that the industry a whole did not necessar i ly see a decl ine of 48.1%. As the overal l numbers from RunSignup indicate (next page) , total par t ic ipat ion in events on the p latform fel l 35.5%. Most of that d iscrepancy can be attr ibuted to new events on the platform that were bui l t specif ical ly for the pandemic - such as v i r tual chal lenges and themed vir tual races.
Addit ional ly , some of that gap is due to events that changed platform to take advantage of Run-Signup’s purpose-bui l t tools for v i r tual events.
10

CORPORATE ANNUAL REPORT BROCHURE | 11
In contrast to the data on the previous page showing the par t ic ipa-t ion decl ine within races that hosted races on RunSignup in 2019 and 2020, th is data represents the registrat ion totals across al l of RunSignup ( i t ’s the same as page 4-5) . Here , you also see s ignif i -cant decl ine - but you also see the impact of innovat ive new events that br idged the gap whi le t radit ional events struggled.
An impor tant point is that the seemingly huge increase in par t ic i -pat ion in Ultramarathons is decept ive - many of those “races” were actual ly v i r tual chal lenges that covered ul tra distances over long per iods of t ime.
RACE TYPE2019 TOTAL RUNSIGNUP REGISTRATIONS
2020 TOTAL RUNSIGNUP REGISTRATIONS
% CHANGE
Overall 7,312,022 4,713,380 -35.5%
5K and less 4,580,738 2,677,195 -41.7%
10K and less 912,395 498,424 -45.4%
Half Marathon and less 873,443 564,017 -35.4%
Marathon and less 192,854 151,629 -21.4%
Ultra 109,810 209,792 164.8%
Triathlon 106,087 36,554 -65.5%
Unknown 536,696 494,769 -7.8%
Overall Participation on RunSignup Declines 35.5%
2019 and 2020 Participant Totals for Renewed Events Only11

CORPORATE ANNUAL REPORT BROCHURE | 12
To some extent , every number in th is repor t ref lects the global pandemic and associated restr ict ions. But to get an overhead v iew of the rhythm of the year, we drew a comparison between our weekly t ransact ions in 2019 and those in 2020, star t ing in February.
With the RunSignup platform in growth mode and gain-ing market share , our t ransact ions were up ear ly in the year and the expectat ion was for that t rend to cont in-ue. As you can see, the impact of COVID-19 in March was immediate and steep, as races canceled en masse. From there , races began to get more creat ive and pivot to v i r tual , leading to a gradual c l imb back to 50% trans-act ions by mid-May and a more stable summer and fal l .
While the general theme of the year was a slow recovery from the March crash, the exception to that was November - AKA, Turkey Trot Month. With so many large turkey trots taking the year off and more race cancellations due to national virus spikes, the November numbers fell far short of normal.
Pandemic Economic Impact% of Change from 2019 to 2020
Weekly Transactions 2019 vs 2020
12

CORPORATE ANNUAL REPORT BROCHURE | 13
Shifting Event Types
The shift to virtual will be covered in depth in later sections, but it’s important to understand the role it played in recovery. In late May, when we first began to isolate event types, a full 57% of race registrations were for virtual races, with 23% for in-person events and 20% for virtual chal-lenges. Over time, those percentages have shifted. In-person participation crept up as races found new ways to host their events safely, peaking at just shy of 50% of participants by late November.
TakeawaysThe 48.1% decline in year-over-year registrations is an anomaly and participation will bounce back. When events do open back up, competition will be fierce between legacy events and new events. Be ambitious and get your event on the calendar ASAP.
Creativity is key. Overall partic-ipation on the platform did not fall by as much, dropping to 33% of 2019 levels. That difference is credited to the many race direc-tors who thought outside the box and created new concepts to compensate for lost participation in traditional events.
Longer distances that typically have fewer, but more dedicated participants had stronger re-tention than those shorter than a 10K. Use training programs, social media, and longer virtual challenges to engage your par-ticipants more deeply and keep them invested in your event.
Percent of Registrations for Virtual, Challenge, and In-Person 2
1
3
13

CORPORATE ANNUAL REPORT BROCHURE | 14
1.2 Repeat ParticipationOn average, just 10.1% of par t ic ipants were repeats from the previous year, a s ignif icant drop from steady 17-18% repeat par t ic ipat ion in previous years. The trend is seen across distances, and is l ikely the result of so many races conver t ing to v i r tual , a format that doesn’t a lways appeal to the same competi tors you see on a tradit ional race day. Looking ahead to 2021, i t wi l l be impor tant to re-engage lost par t ic ipants from 2020.
RACE TYPE # 2019 REGISTRATIONS
#2020 REPEATS
% REPEATS
Overall 4,241,596 426,537 10.1%
5K and less 2,560,497 252,405 9.9%
10K and less 558,322 66,618 11.9%
Half Marathon and less 615,551 70,532 11.5%
Marathon and less 129,956 9,316 7.2%
Ultra 73,793 5963 8.1%
Triathlon 58,052 2,529 4.4%
Unknown 245,425 19,174 7.8%
2020 Repeat Registrations 10.1%OF 2019 PARTICIPANTS
RETURNED TO THE EVENT IN 2020
14

CORPORATE ANNUAL REPORT BROCHURE | 15
TakeawaysMake an extra effort to reach 2019 participants who missed your 2020 event. Loyalty programs and reserved entries can help bring traditional participants back into the fold.
If your event caps are strict in 2021, reward your most loyal sup-porters with first dibs on in-person slots.
RACE TYPE REPEAT % 2016
REPEAT % 2017
REPEAT % 2018
REPEAT % 2019
REPEAT % 2020
Overall 15.4% 17.3% 18.5% 18.4% 10.1%
5K and less 16.2% 16.7% 17.9% 18.4% 9.9%
10K and less 23.2% 24.6% 24.0% 21.7% 11.9%
Half Marathon and less 19.9% 18.5% 20.3% 19.7% 11.5%
Marathon and less 10.1% 11.5% 14.3% 14.4% 7.2%
Ultra 8.3% 13.6% 13.5% 14.0% 8.1%
Triathlon 3.9% 10.2% 12.4% 13.1% 4.4%
Unknown 3% 10% 12% 13% 7.8%
*As with the overal l par t ic ipat ion data , the repeat par t ic ipat ion in Ultramarathons here is misleading because many new Chal lenge Events were c lassif ied as more than 26 mi les.
Don’t neglect your new partici-pants, though. Many of them came specifically for the virtual expe-rience - make sure you offer it in 2021 (and beyond) to expand your pool of participants.
11.9% REPEAT 10K RUNNERS IN 2020 vs
21.7% REPEAT 10K RUNNERS IN 2019
2
1
3
15

CORPORATE ANNUAL REPORT BROCHURE | 16
1.3 Distribution of Races
MONTH 2016 % OF TOTAL
2017 % OF TOTAL
2018 % OF TOTAL
2019 % OF TOTAL
2020 % OF TOTAL
January 3.2% 3.2% 3.2% 2.8% 3.8%
February 4.2% 3.7% 3.7% 3.6% 5.3%
March 5.7% 6.2% 7.2% 7.7% 6.9%
April 11.9% 11.9% 11.4% 9.9% 8.3%
May 11.0% 10.6% 10.2% 10.6% 8.4%
June 9.8% 9.8% 10.4% 10.7% 7.9%
July 7.9% 7.9% 7.6% 7.2% 7.7%
August 8.1% 7.9% 7.7% 8.3% 9.0%
September 12.9% 13.5% 14.5% 13.9% 13.8%
October 14.1% 13.5% 12.0% 12.0% 15.0%
November 8.5% 8.7% 8.9% 9.9% 9.6%
December 2.7% 3.1% 3.2% 3.3% 4.2%
Whi le September and October remained the stron-gest racing months of the year, the pandemic f lat -tened the distr ibut ion of races throughout the spr ing and summer and created an not iceable spike in Sep-tember and October.
These changes are more the result of spr ing and summer races that e i ther postponed to fa l l or s imply canceled than a long-term shift away from races in the f i rst half of the year.
Races by Month
15%OF 2020 RACES TOOK PLACE IN
OCTOBER
16
CORPORATE ANNUAL REPORT BROCHURE | 17
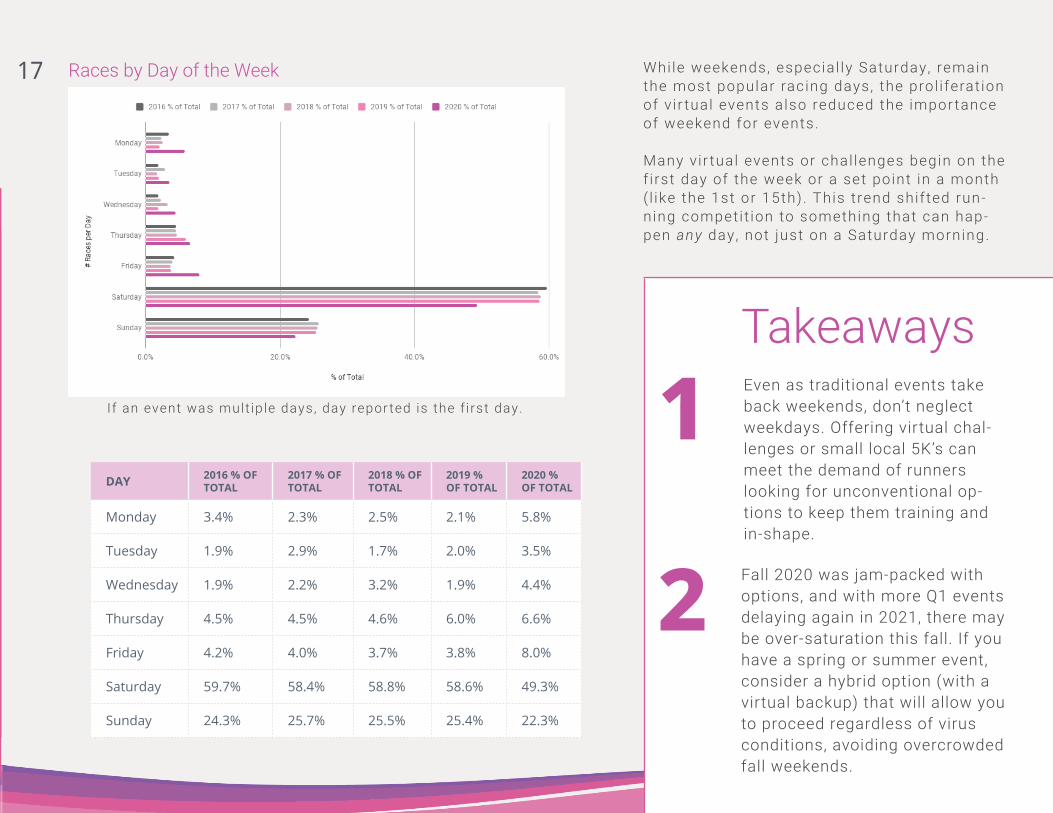
While weekends, especial ly Saturday, remain the most popular racing days, the prol i ferat ion of v i r tual events also reduced the impor tance of weekend for events.
Many v i r tual events or chal lenges begin on the f i rst day of the week or a set point in a month ( l ike the 1st or 15th) . This t rend shif ted run-ning competi t ion to something that can hap-pen any day , not just on a Saturday morning.
DAY 2016 % OF TOTAL
2017 % OF TOTAL
2018 % OF TOTAL
2019 % OF TOTAL
2020 % OF TOTAL
Monday 3.4% 2.3% 2.5% 2.1% 5.8%
Tuesday 1.9% 2.9% 1.7% 2.0% 3.5%
Wednesday 1.9% 2.2% 3.2% 1.9% 4.4%
Thursday 4.5% 4.5% 4.6% 6.0% 6.6%
Friday 4.2% 4.0% 3.7% 3.8% 8.0%
Saturday 59.7% 58.4% 58.8% 58.6% 49.3%
Sunday 24.3% 25.7% 25.5% 25.4% 22.3%
TakeawaysEven as traditional events take back weekends, don’t neglect weekdays. Offering virtual chal-lenges or small local 5K’s can meet the demand of runners looking for unconventional op-tions to keep them training and in-shape.
Fall 2020 was jam-packed with options, and with more Q1 events delaying again in 2021, there may be over-saturation this fall. If you have a spring or summer event, consider a hybrid option (with a virtual backup) that will allow you to proceed regardless of virus conditions, avoiding overcrowded fall weekends.
Races by Day of the Week
If an event was mult ip le days, day repor ted is the f i rst day.
2
1
17

CORPORATE ANNUAL REPORT BROCHURE | 18
1.4 Race ChurnAt RunSignup we internal ly t rack both races that do not recur and those that recur but change platforms. This a l lows us evaluate the health of the industry and determine i f there are emerging competi tors with strengths we need to match. Competi tor churn has remained low throughout the last three years with the except ion of a race ser ies that acquired a company with their own registrat ion platform.
This data only represents only races over 500 par t ic ipants that use our platform from year to year. Due to the manual na-ture of tabulat ing this repor t , i t does not evaluate races under 500 par t ic ipants.
Churn Status2018 Churn
2018 %
2019 Churn
2019 %
2020 Churn
2020 %
2018-2020 Total
New Races 710 834 1027 3,859
Renewed 1,321 88.5% 1,731 91.1% 807 56.0% 2,571
No Race 114 7.6% 113 5.9% 553 38.4% 780
EnMotive 6 0.4% 3 0.2% 38 2.6% 47
Race Roster 4 0.3% 16 0.8% 8 0.6% 28
ItsYourRace 5 0.3% 3 0.2% 1 0.4% 9
Active 0 0.0% 2 0.1% 6 0.4% 8
CT/Athlinks 6 0.4% 1 0.1% 1 0.1% 8
Events.com 2 0.1% 3 0.2% 2 0.1% 7
onecause 0 0.0% 6 0.3% 0 0.0% 6
RaceWire 5 0.3% 1 0.1% 0 0.0% 6
Custom 0 0.0% 0 0.0% 5 0.4% 5
EventBrite 1 0.1% 0 0.0% 3 0.2% 4
Churn Status2018 Churn 2018 % 2019
Churn2019 %
2020 Churn
2020 %
2018-2020 Total
elitefeats 0 0.0% 2 0.1% 2 0.1% 4
Red Podium 2 0.1% 0 0.0% 2 0.1% 4
BlackBaud 4 0.3% 0 0.0% 0 0.0% 4
GetMeRegistered 1 0.1% 0 0.0% 2 0.1% 3
Classy 2 0.1% 0 0.0% 1 0.1% 3
RaceEntry 2 0.1% 0 0.0% 1 0.1% 3
Vertical Runner 1 0.1% 2 0.1% 0 0.0% 3
RacesOnline 2 0.1% 1 0.1% 0 0.0% 3
Shopify 3 0.2% 0 0.0% 0 0.1% 3
ImAthlete 0 0.0% 1 0.1% 1 0.1% 2
Lightbox 1 0.1% 1 0.1% 0 0.0% 2
Haku 2 0.1% 0 0.0% 0 0.0% 2
Other 9 0.6% 7 0.4% 8 0.6% 24
18

CORPORATE ANNUAL REPORT BROCHURE | 19
The meaningful number here is that 38.4% of 2019 races over 500 par t ic ipants did not take place in 2020, up from just 5.9% a year ago. Because this is a year ly average and races happened as-normal for the f i rst three months (12/19-2/20) , the “ real ” churn throughout the pandemic was sl ight ly worse than the 38%. For example , in Apr i l , a fu l l 47% of races did not take place.
The br ight( ish) s ide? Smal ler races that are not included in th is repor t were less l ikely to be impacted by Coronavirus restr ict ions.
TakeawaysThe high rate of cancellation this year has created a sense of mis-trust amongst endurance partic-ipants. To build back trust, offer flexible participant management options, and clearly communi-cate your contingency plan in the event that your permit is pulled.
Races succeed when they build tradition, and a year (or two) off can be hard to come back from. Especially if you were forced to cancel in 2020, it’s important to have a presence in 2021. Get your-self back on the calendar by set-ting up your events to be flexible, with virtual and in-person options.
If you continue to be hamstrung by gathering restrictions, con-sider a smaller race or a hybrid race with a small in-person com-ponent. This rewards your most loyal participants while demon-strating your safety plan to local officials.
38.4%OF 2019 RACES OVER 500 DID
NOT HOLD A RACE IN 2020
A YEAR AGO, JUST
5.9%OF RACES DID NOT RECUR 2
1
3
19

CORPORATE ANNUAL REPORT BROCHURE | 20
1.5 COVID-19 and TimersThe data for th is sect ion is pul led from our 2020 Timer Survey. For more information about the purpose and meth-odology of that survey, see sect ion 6.
We asked US t iming companies to share their exper ience deal ing with COVID-19 in 2020, including their immediate response, assistance they received to br idge the gap, and their current status. Whi le most businesses indicate that they have been severely impacted but are surviv ing, i t is wor th not ing that t iming businesses that have closed their doors are less l ikely to have responded to th is survey.
How Has COVID-19 Impact Your Timing Business?
80.8% OF TIMERS INDICATED A
SIGNIFICANT IMPACT TO THEIR BUSINESS, BUT ARE HANGING ON
RESPONSE %
Devastated - Have or Will Close 1.4%
Significant negative impact, but hanging on 80.8%
Some impact, but doing fine 14.4%
Surprisingly, didn’t impact revenue 1.4%
Actually did better in 2020 2.1%
20

CORPORATE ANNUAL REPORT BROCHURE | 21
TakeawaysCOVID-19 hit the timing industry hard. If you need a partner to help you navigate the challeng-es of a COVID-19 race, consider reaching out to your timer for assistance with services beyond timing. They have the exper-tise to help, and keeping them in business is a win-win for the industry.
Like the industry as a whole, timers survived by pivoting their approach to racing. They learned to produce virtual races, offered RaceJoy, delivered virtual results, and helped guide virtual and hy-brid events. To succeed in 2021, timers will need to continue ex-panding their capabilities.
How did your timing business respond to COVID-19?
Did your company receive COVID-19 related financial assistance (PPP, EIDL, Bridge Loan, etc.)?
How did t iming companies survive 2020? The most common solut ions included adjust ing types of serv ices (such as adding v i r tual re-sults or swag fulf i l lment) and taking a break whi le events were paused.
Addit ional ly , 44.4% responded that they were able to get some sor t of f inancial assistance (PPP, EIDL, br idge loan, etc. ) to deal with some of the shor tfal ls of 2020.
2
1
21
CORPORATE ANNUAL REPORT BROCHURE | 22
We’ve actually seen some new runners or members of the community get into running as a result of virtual events. These might be individuals that never got into running or racing because they didn’t feel like they could compete.
- RaceRise
22

CORPORATE ANNUAL REPORT BROCHURE | 23
Virtual Trends
1 KEY FINDINGS AND TRENDS
2 CONCLUSIONS
3 RECOMMENDATIONS
» Virtual events exploded in 2020, but they weren’t brand new. There were 1,355 virtual races on RunSignup in 2019 , 2.8% of all races on the platform
» The demographics of virtual racers differ from those of traditional race attendees. 56% of virtual challenge partici-pants and 53% of virtual racers over the age of 40, compared to just 46% for in-person event attendees.
» Women are ubiquitous in virtual events, making up 64% of participants in 2020 virtual evens and a whopping 72% of participants in 2019.
» 78% of virtual races and challenges are smaller than 100 participants , mirroring the size of typical in-person events. » Virtual races and challenges have longer windows for participation, with 50% of virtual races lasting between 8 and 30
days, and 68% of virtual challenges extending to more than 30 days.
» Virtual runners are not from the same pool of participants who show up on race day. While there is overlap, many of your virtual participants prefer the virtual experience to an in-person one.
» Virtual races require the same professional production and marketing efforts as “real” races. » Keeping virtual races and challenges running for weeks or months creates long-term overhead, but flexibility and
length of participation are also important defining features of virtual events.
» Offer a virtual race in conjunction with your traditional race forever. While some of your virtual participants in 2020 likely joined because it was their only option, some runners prefer virtual. Don’t leave them out in the cold.
» Understand your reach and marketing options when determining your expectations for a virtual event. You’re working with the same contact list and the same skills for digital marketing.
» Do your prep work for virtual events by setting up email reminders, challenge milestones and notifications, and social media prompts in advance.
23
CORPORATE ANNUAL REPORT BROCHURE | 24
DAY 2016 # RACES 2016% 2017 #
RACES 2017% 2018 # RACES 2018% 2019 #
RACES 2019 % 2020 # RACES 2020 %
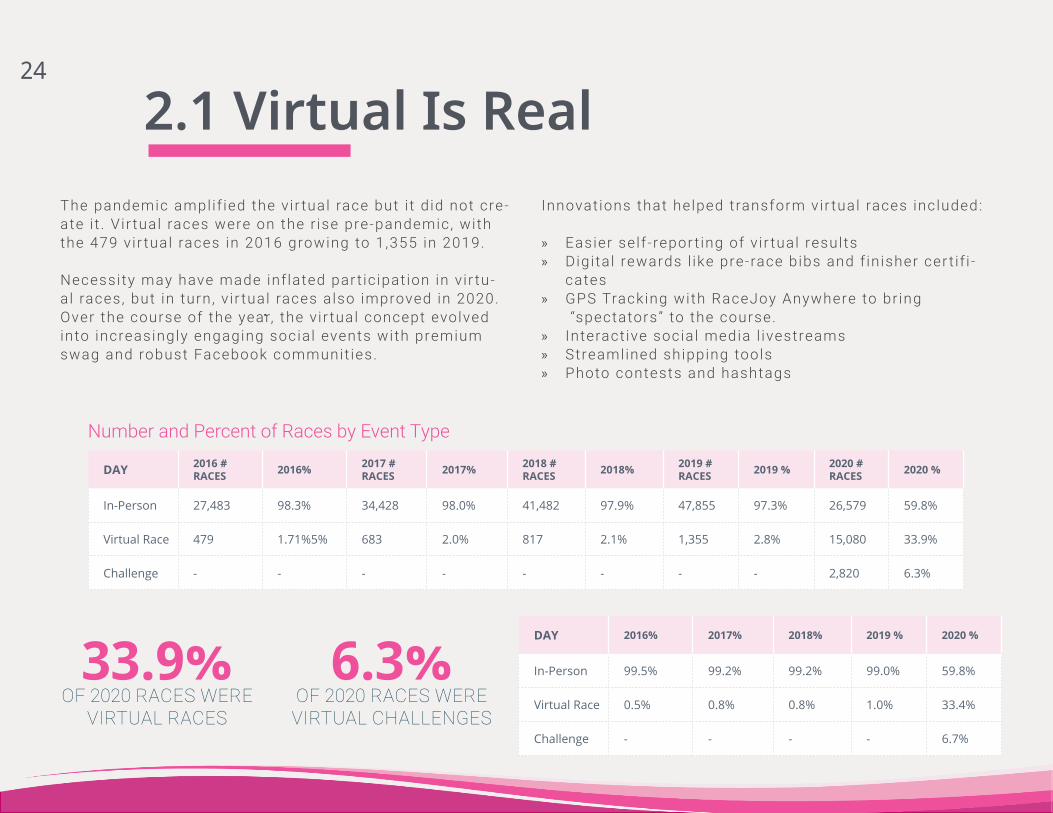
In-Person 27,483 98.3% 34,428 98.0% 41,482 97.9% 47,855 97.3% 26,579 59.8%
Virtual Race 479 1.71%5% 683 2.0% 817 2.1% 1,355 2.8% 15,080 33.9%
Challenge - - - - - - - - 2,820 6.3%
2.1 Virtual Is RealThe pandemic ampl i f ied the v i r tual race but i t d id not cre-ate i t . V i r tual races were on the r ise pre-pandemic, with the 479 v i r tual races in 2016 growing to 1 ,355 in 2019.
Necessity may have made inf lated par t ic ipat ion in v i r tu-al races, but in turn , v i r tual races also improved in 2020. Over the course of the year, the v i r tual concept evolved into increasingly engaging social events with premium swag and robust Facebook communit ies.
33.9% OF 2020 RACES WERE
VIRTUAL RACES
6.3% OF 2020 RACES WERE
VIRTUAL CHALLENGES
DAY 2016% 2017% 2018% 2019 % 2020 %
In-Person 99.5% 99.2% 99.2% 99.0% 59.8%
Virtual Race 0.5% 0.8% 0.8% 1.0% 33.4%
Challenge - - - - 6.7%
Number and Percent of Races by Event Type
Innovat ions that helped transform vir tual races included:
» Easier self - repor t ing of v i r tual results » Digita l rewards l ike pre-race bibs and f in isher cer t i f i -
cates » GPS Tracking with RaceJoy Anywhere to br ing
“spectators” to the course. » Interact ive social media l ivestreams » Streamlined shipping tools » Photo contests and hashtags
24

CORPORATE ANNUAL REPORT BROCHURE | 25
TakeawaysVirtual races improved and grew in 2020. Moving forward, it won’t be enough to offer a virtual race that is merely a medal in the mail - put the same thought and attention into your virtual event that you do for a live one.
The pandemic greatly accelerated a trend that already existed. While the share of event participation that is virtual will fall again, some portion of the new virtual runners who were captured this year will stick around. Make sure you have options to keep them involved.
Virtual challenges are built to last. Even when events return to nor-mal, challenges are perfect vehi-cles for more engagement, aid in training and provide a sense of accomplishment in daily life. Get creative and get people moving.
1
2
3
Vir tual chal lenges made up the f inal 6 .4% of races and 6.7% of par t ic i -pants in 2020. Whi le i t ’s the smal lest category , i t ’s a lso the newest , and potent ia l ly one with long-term appl icat ions.
A v i r tual chal lenge is a f lex ible event that g ives par t ic ipants a goal to reach over t ime ( l ike running the distance of their state or cycl ing the e levat ion equivalent of Mount Ki l imanjaro) . Par t ic ipants can log each act iv i ty they complete ( l ike dai ly mi les or number of push-ups) . The chal lenge winner is typical ly the f i rst par t ic ipant to reach the goal - even i f there running t ime is s lower.
Percent of Registrations by Event Type
Benefits of vir tual chal lenges
» Engaging suppor ters over an extended per iod of t ime bui lds loyalty
» Chal lenges compl iment tradi -t ional race events rather than competing with them
» Limit less possibi l i t ies
Examples of vir tual chal lenges
» Team competi t ion to run the length of the country
» Fitness chal lenge to complete 30 minutes of exercise every day for a month
» Triathlon chal lenge to run 100 mi les , b ike 300 mi les , and swim 10 mi les
25

CORPORATE ANNUAL REPORT BROCHURE | 26
2.2 Demographics of Virtual
GENDER 2019 In-Person
2019 Virtual
2020 In-Person
2020 Virtual
2020 Challenge
M 43.0% 25.1% 44.1% 33.8% 32.6%
F 55.6% 72.2% 54.5% 63.58% 65.3%
N/A 1.4% 2.7% 1.4% 2.7% 2.1%
Vir tual par t ic ipat ion is dominated by females, with 64% of v i r tual race par t ic ipants and 65% of v i r tual chal lenge par t ic i -pants ident i fy ing as female. In pre-pandemic t imes, that gap was even wider - in 2019, a fu l l 72% of v i r tual race par t ic i -pants were female. Whi le the sample is s ignif icant ly larger in 2020, the c i rcumstances are also except ional and i t remains to be seen i f the v i r tual wor ld can hold onto some of the male par t ic ipants they reached this year.
2020 Participation by Event Type
Virtual Race Participation by Gender
Vir tual Par t ic ipants are a lso more l ikely to not select a gender. In addit ion to more events seeking to accommodate transgender and nonbinary par t ic ipants , v i r tual events often forego tradit ional awards, making them ideal for gender less par t ic ipat ion.
26
CORPORATE ANNUAL REPORT BROCHURE | 27
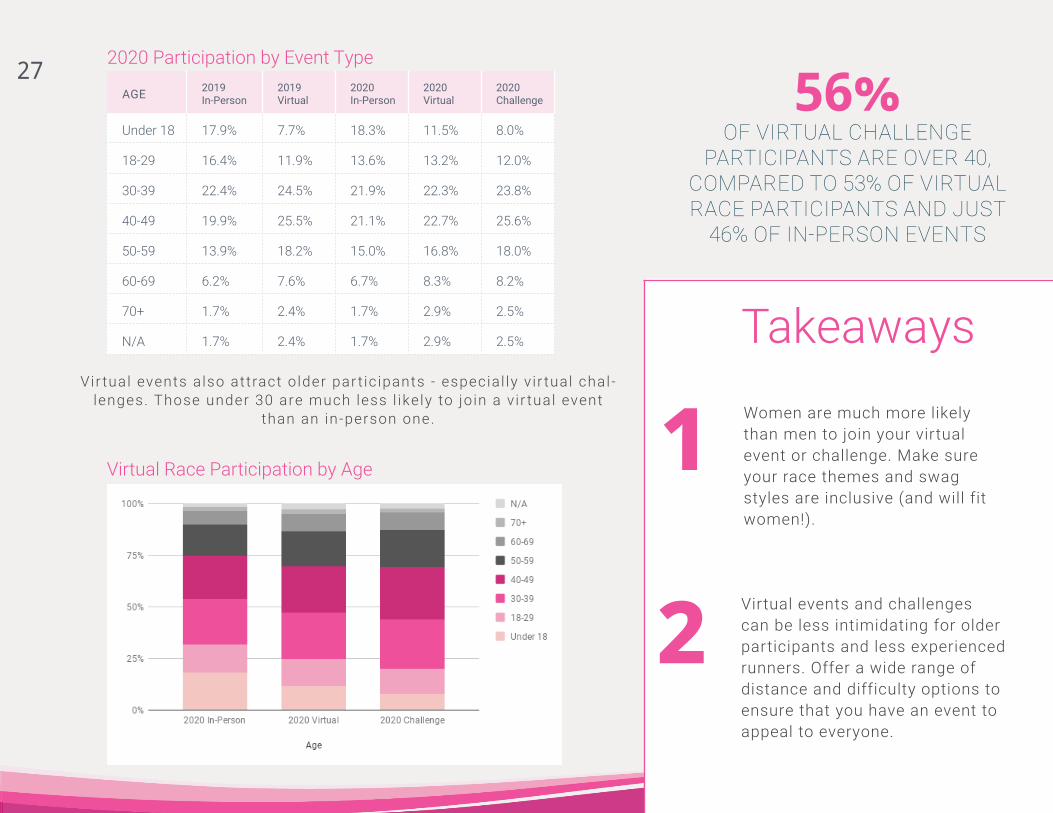
TakeawaysWomen are much more likely than men to join your virtual event or challenge. Make sure your race themes and swag styles are inclusive (and will fit women!).
Virtual events and challenges can be less intimidating for older participants and less experienced runners. Offer a wide range of distance and difficulty options to ensure that you have an event to appeal to everyone.
AGE 2019 In-Person
2019 Virtual
2020 In-Person
2020 Virtual
2020 Challenge
Under 18 17.9% 7.7% 18.3% 11.5% 8.0%
18-29 16.4% 11.9% 13.6% 13.2% 12.0%
30-39 22.4% 24.5% 21.9% 22.3% 23.8%
40-49 19.9% 25.5% 21.1% 22.7% 25.6%
50-59 13.9% 18.2% 15.0% 16.8% 18.0%
60-69 6.2% 7.6% 6.7% 8.3% 8.2%
70+ 1.7% 2.4% 1.7% 2.9% 2.5%
N/A 1.7% 2.4% 1.7% 2.9% 2.5%
Virtual Race Participation by Age
2020 Participation by Event Type
Vir tual events also attract o lder par t ic ipants - especial ly v i r tual chal -lenges. Those under 30 are much less l ikely to jo in a v i r tual event
than an in-person one.
56%OF VIRTUAL CHALLENGE
PARTICIPANTS ARE OVER 40, COMPARED TO 53% OF VIRTUAL RACE PARTICIPANTS AND JUST
46% OF IN-PERSON EVENTS
2
1
27

CORPORATE ANNUAL REPORT BROCHURE | 28
2.3 Size of Virtual Events
# OF PARTICIPANTS
2016 % EVENTS
2017 % EVENTS
2018 % EVENTS
2019 % EVENTS
2020 % EVENTS
1-100 88.3% 88.1% 92.2% 92.4% 78.3%
101-500 10.2% 9.8% 6.8% 6.4% 18.3%
501-1,000 1.0% 1.3% 0.7% 0.7% 2.2%
1,001-5,000 0.4% 0.7% 0.2% 0.4% 1.1%
5,001-10,000 0.0% 0.0% 0.0% 0.0% 0.1%
10,000+ 0.0% 0.0% 0.0% 0.0% 0.1%
# OF PARTICIPANTS
% 2020 CHALLENGES
1-100 77.7%
101-500 17.9%
501-1,000 2.8%
1,001-5,000 1.4%
5,001-10,000 0.2%
10,000+ 0.1%
TakeawayMost in-person endurance events are small events - and so are most virtual races. While there are ex-ceptions in both realms, a good rule of thumb is to remember that your virtual races rely on the same participant email lists and market-ing tools as your traditional events. If you want to expand your pool of participants, you have to increase your investment in marketing.
2020 Size of Event by Event Type
% of Virtual Events by SizeThe number of par t ic ipants in v i r tual events ref lects the number of par t ic ipants seen in most t radit ional events , as wel l .
Whi le there are out l iers ( the largest v i r tual events in 2020 exceeded 20,000 par-t ic ipants) , the vast major i ty attract fewer than 500 par-t ic ipants.
1
28

CORPORATE ANNUAL REPORT BROCHURE | 29
2.4 Length of Virtual Events
Length of Virtual Race
Length of Virtual Challenge
67.8%OF VIRTUAL CHALLENGES ARE MORE THAN
30 DAYS
TakeawaysFlexibility is a major draw for participating in a virtual race in-stead of a traditional one. Even if it’s parallel to an in-person event, offer virtual participants at least 1-2 weeks to allow them to work within their schedules.
Virtual challenges can engage your supporters for an entire sea-son and build loyalty - but make sure you’re committed to staying engaged for the entire duration, too.
Flexibi l i ty of par t ic ipat ion is a key feature of v i r tual racing, whereas extended engagement is the def in ing element of a v i r tual chal lenge.
2
1
29

CORPORATE ANNUAL REPORT BROCHURE | 30
We loved having the opportunity for people around the country to participate. We hope to do a hybrid version in 2021 - allowing a virtual race option in addition to in-person.
- Joshua’s Great Things Virtual Race
30

CORPORATE ANNUAL REPORT BROCHURE | 31
Registration Trends
1 KEY FINDINGS AND TRENDS
2 CONCLUSIONS
3 RECOMMENDATIONS
» 26.1% of registrations took place on Race Week , and an increase from 24.2% in 2019. » Prices fell across all distances in 2010, including an 18.2% decline in price for half marathons. » On average, races incorporated fewer price increases - leading to just 14.6% of registrations occuring within the 3
days before a price increase or registration closing. In 2019 the same period accounted for 27% of registrations. » The impact of virtual events can be seen in the demographic data, with participants trending older and more female. » Mobile is first, with 72.9% of website views and 55.1% of transactions taking place on a mobile device or tablet.
» The trend towards last minute registrations was exacerbated by the uncertainty of 2020, and is likely to continue well into 2021.
» Virtual and in-person participants are often different, and races struggled to get their annual participants to join re-formatted events in 2020.
» While there may be increased pricing pressure in 2021, much of the shift in price can be attributed to the lower over-head, and thus lower pricing, for virtual races.
» The impact of virtual events on overall demographics indicates that there are older participants (particularly women), who are interested in endurance events, but weren’t finding what they needed in a traditional event.
» Prepare for continued uncertainty with flexible participant management options and hybrid race options. » Re-engage your traditional participants by prioritizing them for any in-person race slots and incentives to register. » To expand your pool of participants, maintain both in-person and virtual elements for your races for years to come. » If your pricing returns to normal (or increases in 2021 due to the overhead costs of pandemic protocols) be transpar-
ent and communicate with your participants about the value of your event and what you’re doing to keep them safe. » Make your registration process as simple as possible and limit superfluous registration questions to accommodate
participants attempting to register on their phones.
31

CORPORATE ANNUAL REPORT BROCHURE | 32
3.1 When Runners Register
The dreaded runner procrast inat ion did worsen in 2020, a l though perhaps not as dramatical ly expected consider ing the loss of industry con-f idence from race cancel lat ions. A ful l 26% of registrat ions came dur ing race week, up 24% in 2019. On the f l ip s ide, there was also an increase in registrat ions more than 90 days before race day, l ike ly the result of opt imism that events that far away would be operat ing under improved con-dit ions.
WHEN DO RUNNERS SIGNUP? 2016 2017 2018 2019 2020
Race Week 21.5% 25.0% 24.3% 24.2% 26.1%
8-14 Days 11.7% 13.4% 13.1% 12.5% 12.9%
15-30 Days 18.2% 20.7% 20.7% 20.6% 20.0%
30-60 Days 17.6% 18.1% 18.9% 19.1% 17.0%
60-90 Days 10.0% 8.8% 9.1% 9.0% 7.7%
More than 90 Days 10.0% 8.3% 8.3% 9.0% 12.4%
When Do Runners Register
26%OF 2020 REGISTRATIONS
WERE ON RACE WEEK
32

CORPORATE ANNUAL REPORT BROCHURE | 33
TakeawaysWant runners to register earli-er? Give them the confidence to do so by providing a plan for refunds, deferrals, transfers, or other options in case pandemic restrictions change.
Prepare for uncertainty. Late registrations and unconvention-al registration patterns are still likely. Work with vendors for later order dates or consider offering a discount for a swag-less event if you run out of stock.
2020 REGISTRATIONS 5K 10K HALF MARATHON
Race Week 26%% 22% 12% 22%
8-14 Days 14% 12% 7% 10%
15-30 Days 22% 20% 13% 16%
31-60 Days 18% 20% 16% 15%
61-90 Days 8% 9$ 11% 9%
91-120 Days 4% 4% 6% 5%
More than 120 9% 14% 34% 22%
Despite the upheaval in 2020, the registration curve remains recogniz-able. While events with long training cycles, such as half and full mara-thons still saw significant registrations more than 120 before the race, 5K’s and 10k’s struggled to get attention more than 2 months in advance.
When Runners Register by Event Distance
Participants respond well to in-centives and time-sensitive deals. To get back on track in 2021, consider a coupon code or special swag for early registrants.
2
1
3
33

CORPORATE ANNUAL REPORT BROCHURE | 34
3.2 Registration Times
SIGNUP HOURS 2016 2017 2018 2019 2020
Midnight - 6AM 2.4% 2.0% 2.0% 2.0% 2 2.8% 2
6AM - 9AM 8.3% 9.7% 9.8% 10.2% 10.0%
9AM - Noon 18.9% 20.5% 20.9% 20.9% 21.1%
Noon - 3PM 17.9% 18.6% 19.0% 18.9% 19.4%
3PM - 6PM 16.2% 16.5% 16.5% 16.6% 17.3%
6PM - 9PM 18.0% 17.6% 17.5% 17.9% 17.9%
9PM - Midnight 18.2% 15.0% 14.2% 13.6% 11.6%
Registrat ion is st i l l 24-hour affair, with com-puter (and mobi le) access readi ly avai lable. The only shif t in 2020 is a s l ight move towards registrat ions between 12-6pm, possible as a result of more work-from-home and less r ig id schedules.
TakeawayIf you want to maximize eyes, aim for work hours for email blasts. Don’t stress if the time doesn’t work out perfectly, though - registrations come at all times of the day (and night).
What Time Do Runners Register?
58%OF REGISTRATIONS WERE
BETWEEN 9AM-6PM
1
34

CORPORATE ANNUAL REPORT BROCHURE | 35
3.3 Pricing TrendsRace pr ices in 2020 fe l l compared to pre-v ious years , with longer distances seeing the greatest decl ines. The switch to so many v i r tual events is l ikely the culpr i t here , with runners tradit ional ly less l ike-ly to pay as high a premium for a v i r tual exper ience.
The upside? In many cases, pr ices were reduced because overhead also fe l l when permits , road closures, and por ta-pott ies were no longer necessary. This a lso cre-ates a f lattening of cost across distances, s ince a v i r tual marathon has the same overhead costs as a v i r tual 5K.
RACE TYPE 2016 AVG PRICE
2017 AVG PRICE
2018 AVG PRICE
2019 AVG PRICE
2020 AVG PRICE INCREASE
5K $25.75 $26.38 $26.48 $28.22 $26.44 -6.3%
10K $31.78 $33.10 $34.91 $36.24 $31.39 -13.4%
Half Marathon $61.21 $64.46 $67.58 $64.35 $52.66 -18.2%
Marathon $85.93 $84.13 $94.11 $92.45 $71.13 -23.1%
Ultra $102.10 $112.38 $107.70 $109.44 $67.33 -38.5%
Triathlon $87.42 $89.18 $89.69 $90.39 $87.58 -3.1%
RACE TYPE 2016 2017 2018 2019 2020 % INCREASE
5K 0.7 0.8 0.8 1 0.7 -30%
10K 1 1.2 1.3 1.4 0.8 -42.9%
Half Marathon 1.7 1.9 2 2.1 1.2 -42.9%
Marathon 1.5 1.8 2.1 2.2 1.2 -45.5%
Ultra 1.3 1.6 1.5 1.5 0.6 -60%
Triathlon 1.9 2.0 2.1 2.2 1.5 -31.8%
HALF MARATHON PRICES FELL
18.2% IN 2020
35

CORPORATE ANNUAL REPORT BROCHURE | 36
TakeawaysPrices will likely rise again in 2021, especially with increased costs for PPE and lower participant caps. Do your homework to understand what price you need to charge to be profitable.
Treat runners with respect. If your prices increase due to increased costs, communicate how much you are adding for them and why it costs so much (this year). Alterna-tively, offer a swag-less option for the budget-conscious runner.
Virtual races have a built-in price cap, regardless of the distance. As virtual races take up a small-er share of overall events, expect to see average prices creep back towards 2019 levels.
Average Difference Between Minimum and Maximum PriceRACE TYPE 2016 2017 2018 2019 2020 % INCREASE
5K $7.99 $8.36 $8.38 $10.51 $10.81 2.9%
10K $9.40 $9.78 $10.52 $11.58 $10.73 -7.3%
Half Marathon $19.97 $23.02 $23.93 $24.04 $20.30 -15.6%
Marathon $27.41 $29.52 $36.31 $37.17 $26.81 -27.9%
Ultra $30.42 $32.12 $41.16 $39.32 $25.16 -36.0%
Triathlon $34.12 $27.52 $30.52 $28.70 $27.15 -3.3%
It wasn’t just average pr ices that fe l l . Races also saw fewer pr ice increases over the course of registrat ion, with no event category averaging more than 1.5 pr ice increases.
Uncer tainty about restr ict ions led to shor ter registrat ion per i -ods, more v i r tual events , and gun-shy par t ic ipants , a l l of which contr ibuted to more stable pr ic ing.
Along with fewer pr ice increases, the difference between the low and high pr ice for races also came down. This change is seen the most c lear ly with distances over a half marathon, where long registrat ion per iods and higher pr ices usual ly create a s ignif icant d i f ference between pr ices.
$26.81 SEPARATED THE LOW AND HIGH PRICE FOR A MARATHON IN 2020
1
2
3
36

CORPORATE ANNUAL REPORT BROCHURE | 37
3.4 Pricing StrategiesTime-based cal ls to act ion are tradit ional ly one of the strongest strategies to encourage registrat ions. This t rend changed in 2020, too, with the percent of registrat ions occurr ing 3 or less days pr ior to a pr ice increase or registra -t ion c lose fal l ing from 27% in 2019 to just 14.6% in 2020. Wor th not ing: the number of pr ice increases per race also fe l l dur ing the pandemic, so there are were fewer oppor tunit ies for t ime-based cal ls to act ion.
% OF SIGNUPS 3 DAYS PRIOR TO PRICE INCREASE/REGISTRATION CLOSE
2016 % OF TOTAL
2017 % OF TOTAL
2018 % OF TOTAL
2019 % OF TOTAL
2020 % OF TOTAL
3 Days or Less 23.0% 27.8% 27.1% 27.0% 14.6%
More than 3 Days 77.0% 72.2% 72.9% 73.0% 85.4%
TakeawaysGiven the steadiness of this data point over time, 2020 looks like an anomaly because of the con-ditions of the pandemic. Don’t de-emphasize your time-base calls to action just yet.
Consider the impact of time-based calls to action when deciding if you will have price increases this year - it’s about motivating registrations as well as overall revenue.
% of SignUps 3 Days Prior to Price Increases or Registration Close
1
2
37
CORPORATE ANNUAL REPORT BROCHURE | 38
3.5 Demographic Trends
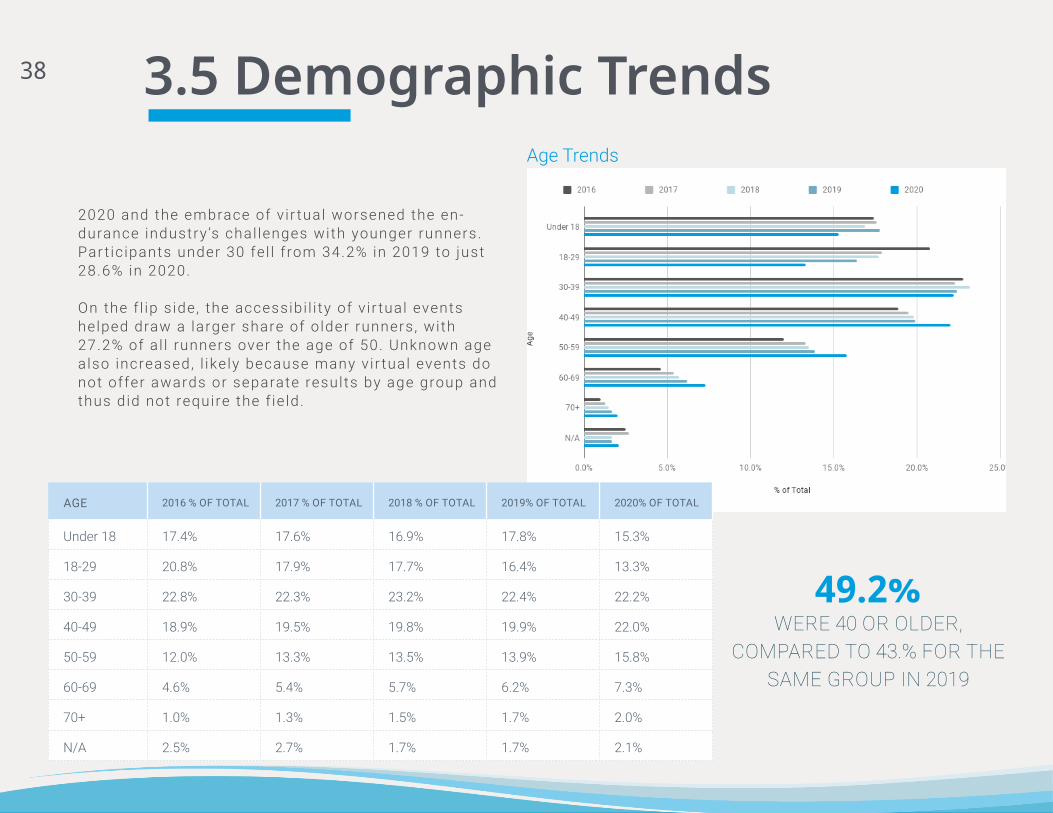
2020 and the embrace of v i r tual worsened the en-durance industry ’s chal lenges with younger runners. Par t ic ipants under 30 fe l l f rom 34.2% in 2019 to just 28.6% in 2020.
On the f l ip s ide, the accessibi l i ty of v i r tual events helped draw a larger share of o lder runners , with 27.2% of a l l runners over the age of 50. Unknown age also increased, l ike ly because many v i r tual events do not offer awards or separate results by age group and thus did not require the f ie ld.
Age Trends
AGE 2016 % OF TOTAL 2017 % OF TOTAL 2018 % OF TOTAL 2019% OF TOTAL 2020% OF TOTAL
Under 18 17.4% 17.6% 16.9% 17.8% 15.3%
18-29 20.8% 17.9% 17.7% 16.4% 13.3%
30-39 22.8% 22.3% 23.2% 22.4% 22.2%
40-49 18.9% 19.5% 19.8% 19.9% 22.0%
50-59 12.0% 13.3% 13.5% 13.9% 15.8%
60-69 4.6% 5.4% 5.7% 6.2% 7.3%
70+ 1.0% 1.3% 1.5% 1.7% 2.0%
N/A 2.5% 2.7% 1.7% 1.7% 2.1%
49.2% WERE 40 OR OLDER,
COMPARED TO 43.% FOR THE SAME GROUP IN 2019
38

CORPORATE ANNUAL REPORT BROCHURE | 39
GENDER 2016 % OF TOTAL
2017 % OF TOTAL
2018 % OF TOTAL
2019 % OF TOTAL
2020 % OF TOTAL
M 39.8% 41.3% 42.5% 42.8% 39.8%
F 59.0% 56.7% 56.5% 55.8% 58.3%
N/A 1.1% 2.0% 1.0% 1.4% 1.9%
Gender Trends
2020 reversed the trend of a narrowing gender gap in running, with women increasing their share of par t ic ipat ion back to 2016 levels - a fu l l 58.3%. As noted in sect ion 2.2 , women are s ignif icant ly more l ikely to jo in v i r tual events and chal lenges, and with so many v i r tual events , that was enough to impact the overal l numbers s ignif icant ly .
TakeawaysTo expand your potential pool of participants, take some les-sons from virtual and make your in-person events more acces-sible. Multiple distances, long cutoff times, and training pro-grams can help bring some of those new virtual athletes into the “real” event world.
Feature women in your advertis-ing images, and reward their par-ticipation by offering gender-spe-cific giveaways.
58.3% IDENTIFIED AS
FEMALE
1
2
39

CORPORATE ANNUAL REPORT BROCHURE | 40
3.6 Giveaways
YEAR UNISEX FEMALE OPTION
2016 96.2% 3.8%
2017 89.0% 11.0%
2018 91.5% 8.5%
2019 94.4% 5.6%
2020 95.5% 4.1%
Despite women increasing their share of par t ic ipat ion in 2020, the number of races providing a gender-specif ic f i t for their g ive-away decl ined to just 4.1%. Some of th is may be dr iven by the smal ler event s izes in 2020, leading to less f lexibi l i ty to offer mult ip le sty les at a reasonable cost .
% of Races offering Female Size Options
4.1% OF RACES OFFERED GENDER-SPECIFIC GIVEAWAY SIZES
40

CORPORATE ANNUAL REPORT BROCHURE | 41
TakeawaysSwag is a huge driver of participa-tion for virtual events. It may be more expensive to offer premium swag in women’s sizes, but doing so can help attract more participants to your event.
If you have kept the same formula for ordering giveaways for years, consider adjusting your estimates this year - especially if you include a virtual option.
On average, giveaway sizing got larger in 2020. While the shift may have been accelerated by the proliferation of virtual races, it’s a continuation of a trend that started several years ago, not the result of a single change
Unisex Size Breakdown Female Size Breakdown
27.9% OF UNISEX SHIRTS
WERE LARGES
1
2
41

CORPORATE ANNUAL REPORT BROCHURE | 42
3.7 Store/Add-On
TakeawayVirtual races are often known for their fun themes, funny taglines, and creative design. Capitalize on your branding by offering pre-mium swag either via add-on or store items.ADD-ONS
2019ADD-ONS 2020
STORE 2019
STORE 2020
Percent of Registrations with Merchandise 15.8% 21.6% 1.2% 2.2%
Percent of Revenue from Merchandise 3.2% 4.8% 0.9% 1.7%
Average Amount Paid for Merchandise $8.27 $7.88 $28.96 $27.13
Average Race Revenue from Merchandise $1,224,72 $834.67 $1,056.29 $1,188.20
With registrat ion dol lars down, innovat ive race organizers found a l i t t le more revenue in the margins by increasing their merchandise sales. The percent of revenue from add-on and store sales increased from 4.1% in 2019 to 6.3% in 2020.
Revenue from Race Store & Add-Ons 6.3% OF REVENUE WAS FROM
ADD-ONS AND STORE ITEMS
While add-ons are often slight upgrades (I.E., a tech shirt vs a tee), store items tend to be high quality items (like a jacket) that appeal even to those not partic-ipating in the event. Both can be valuable sources of extra income.
12
42
CORPORATE ANNUAL REPORT BROCHURE | 43
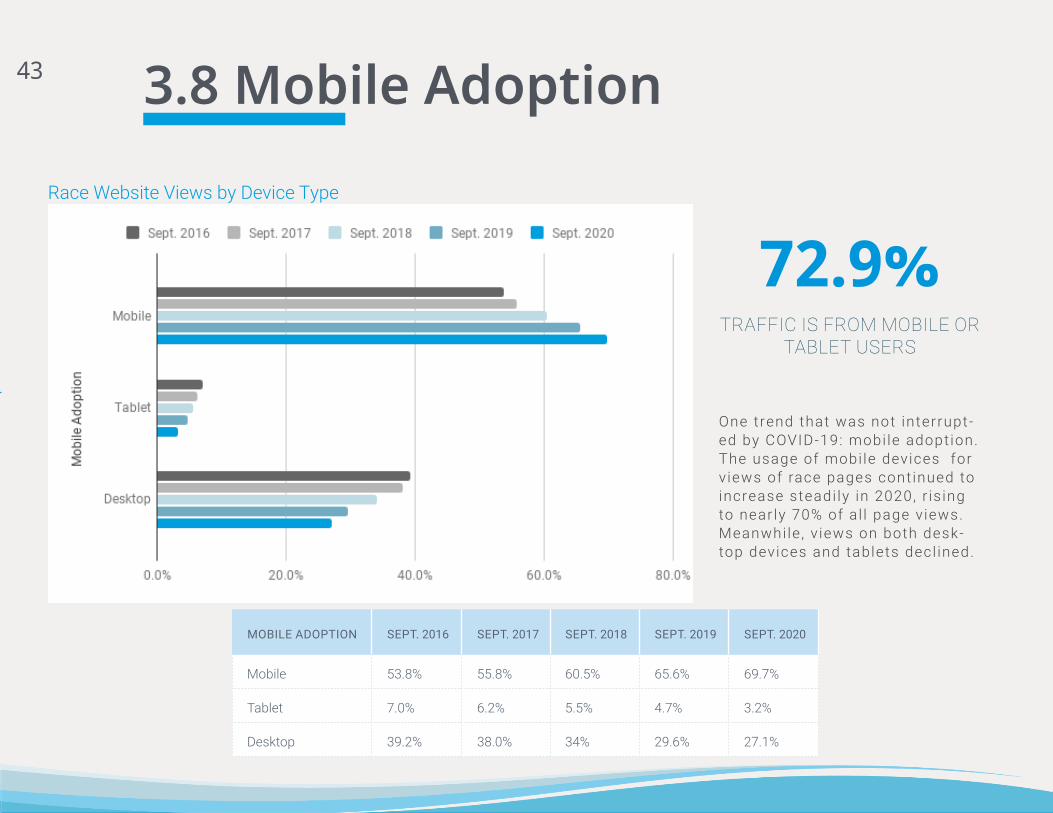
3.8 Mobile Adoption
One trend that was not interrupt-ed by COVID-19: mobi le adopt ion. The usage of mobi le devices for v iews of race pages cont inued to increase steadi ly in 2020, r is ing to near ly 70% of a l l page v iews. Meanwhi le , v iews on both desk-top devices and tablets decl ined.
MOBILE ADOPTION SEPT. 2016 SEPT. 2017 SEPT. 2018 SEPT. 2019 SEPT. 2020
Mobile 53.8% 55.8% 60.5% 65.6% 69.7%
Tablet 7.0% 6.2% 5.5% 4.7% 3.2%
Desktop 39.2% 38.0% 34% 29.6% 27.1%
Race Website Views by Device Type
72.9%TRAFFIC IS FROM MOBILE OR
TABLET USERS
43

CORPORATE ANNUAL REPORT BROCHURE | 44
I t ’s not just page v iews that take place on mobi le anymore, e i ther. As people become more accustomed to making transact ions on their phones (and payment information is more easi ly stored) , mobi le devices are a lso becoming more common for complet -ing actual t ransact ions. Mobi le t ransact ions have increased from just 30.7% in 2016 to 52.3% in 2020, whi le desktop and table transact ions have decl ined.
% OF TRANSACTIONS ON DEVICE SEPT. 2016 SEPT. 2017 SEPT. 2018 SEPT. 2019 SEPT. 2020
Mobile 30.7% 33.5% 38.1% 41.5% 52.3%
Tablet 7.0% 6.5% 6.1% 5.3% 2.8%
Desktop 62.2% 60.0% 55.8% 53.2% 45.0%
Transactions by Device Type
52.3%TRANSACTIONS TAKE PLACE ON A
MOBILE DEVICE
44

CORPORATE ANNUAL REPORT BROCHURE | 45
TakeawaysMobile doesn’t just matter, it’s first. RunSignup race websites are designed to be mobile friend-ly, but you still need to review your content on mobile when you make changes.
With more than half of your transactions taking place on a mobile device, a simple regis-tration process is increasingly important. Limit your participant fields and additional questions to necessary information to prevent incomplete registrations.
Apple cont inued i t ’s dominat ion of the mobi le market , with Apple making up 76% of mobi le devices accessing RunSig-nup. The div is ion between Apple and Android devices has remained re lat ively steady over the last four years.
DEVICE TYPE SEPT. 2016
SEPT. 2017
SEPT. 2018
SEPT. 2019
SEPT. 2020
Apple 70% 74% 74% 76% 76%
Android 28% 26% 26% 23% 23%
Apple vs. Android
Data about mobi le adopt ion and device usage is gathered v ia Google Analyt ics , and is l imited to September data each year (one of the busiest months for registrat ion) .
While Apple is the clear leader, nearly a quarter of all mobile us-ers are accessing your site from an Android device. Make sure your team has access to both op-tions and can test your website and registration across device types.
1
2
3
45

CORPORATE ANNUAL REPORT BROCHURE | 46
Our virtual team challenge really drove a sense of community amongst team members. This helped address one of the missing components of virtual races - that feeling of being with other people to enjoy running and walking.
- SportsBackers
46
CORPORATE ANNUAL REPORT BROCHURE | 47
Promotion Trends1 KEY FINDINGS AND TRENDS
2 CONCLUSIONS
3 RECOMMENDATIONS
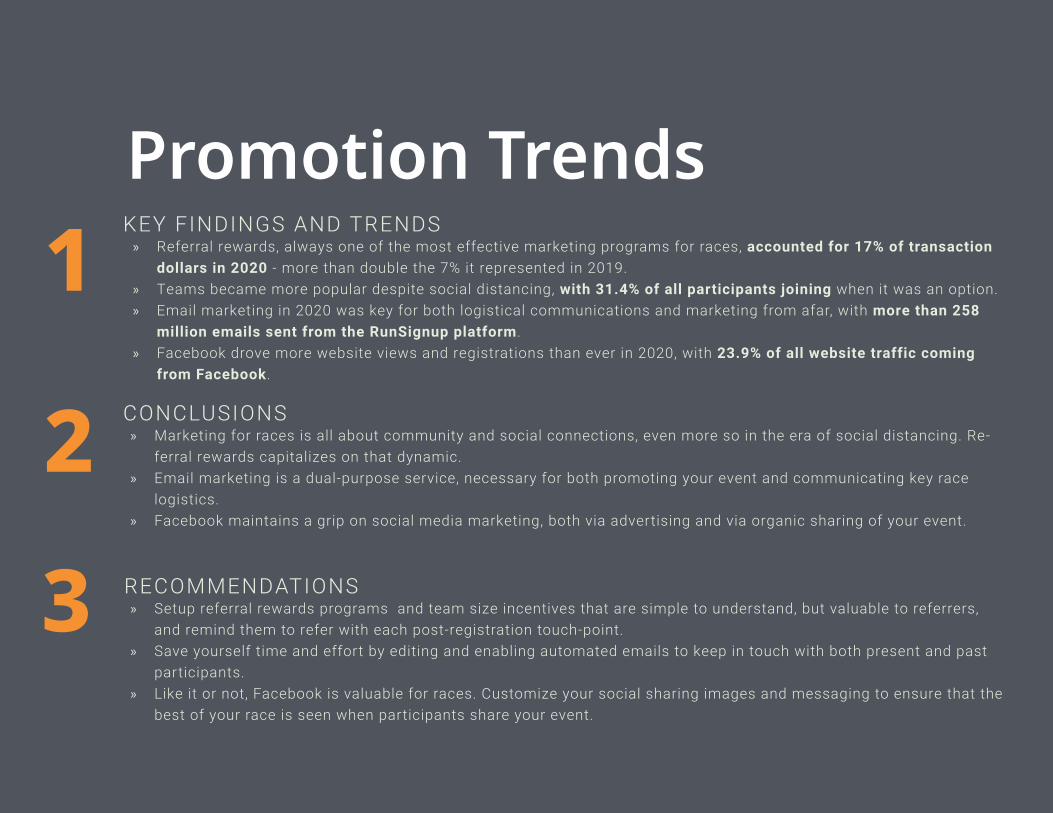
» Referral rewards, always one of the most effective marketing programs for races, accounted for 17% of transaction dollars in 2020 - more than double the 7% it represented in 2019.
» Teams became more popular despite social distancing, with 31.4% of all participants joining when it was an option. » Email marketing in 2020 was key for both logistical communications and marketing from afar, with more than 258
million emails sent from the RunSignup platform. » Facebook drove more website views and registrations than ever in 2020, with 23.9% of all website traffic coming
from Facebook.
» Marketing for races is all about community and social connections, even more so in the era of social distancing. Re-ferral rewards capitalizes on that dynamic.
» Email marketing is a dual-purpose service, necessary for both promoting your event and communicating key race logistics.
» Facebook maintains a grip on social media marketing, both via advertising and via organic sharing of your event.
» Setup referral rewards programs and team size incentives that are simple to understand, but valuable to referrers, and remind them to refer with each post-registration touch-point.
» Save yourself time and effort by editing and enabling automated emails to keep in touch with both present and past participants.
» Like it or not, Facebook is valuable for races. Customize your social sharing images and messaging to ensure that the best of your race is seen when participants share your event.
47

CORPORATE ANNUAL REPORT BROCHURE | 48
4.1 Coupons
COUPONS% OF REGS USING COUPONS
ROI AVERAGE DISCOUNT
TOTAL DISCOUNTS
NET REVENUE FROM COUPONS
2016 4% 310% $12.04 $2,907,418 $9,012,947
2017 7.8% 340% $15.69 $3,684,319 $12,526,890
2018 7.5% 369.0% $10.92 $3,559,383 $13,132,704
2019 8.0% 294% $13.88 $5,696,303 $16,748,501
2020 5.5% 368.3% $10.71 $2,117.844 $7,800,917
TakeawaysUncertainty and lower price points reduced the usage of cou-pons in 2020, but we expect to see them rebound some in 2021 as events look for ways to moti-vate participants to return.
The industry may have been over-discounting events, with the ROI of coupons dropping in 2019 and rising again with the reduction in coupon usage. Be intentional about the situations in which you offer coupons.
Coupon Performance
2020 saw the trend of increasing coupon usage reversed, with just 5.5% of registrat ions using coupons. Along with the reduct ion in pr ices and pr ice increases, th is is l ikely attr ibuted to the disrupt ion of normal registrat ion patterns. Addit ional ly , the lower pr ices in 2020 left less room for fur ther d iscount ing.
Whi le fewer registrants used coupons, both the amount of d iscount given and the ROI of coupons increased.
1
2
48

CORPORATE ANNUAL REPORT BROCHURE | 49
4.2 Referral RewardsREFERRAL REWARDS RESULTS 2019 2020 % CHANGE
No. Referral Codes 315,631 436,761 43.41%
No. Race Page Views 2,134,756 12,853,014 519.54%
No. Completed Registration Transactions 109,490 232,034 121.75%
No. Completed Registrations 135,486 269,548 108.17%
Completed Registration Amounts $6,642,972.09 $12,123,526.60 92.00%
No. Referral Refunds 10,560 21,937 116.53%
Estimated Referral Refund Amounts $136,934.87 $233,854.27 76.46%
Estimated ROI $6,506,037.22, (4.751%) $11,889,672.33 (5,084%) 92.33%
Estimated CPA $1.01 $0.87 -14.71%
Referral Rewards were ta i lor -made for the 2020 digi ta l race environment. Eff icacy of an already highly effect ive market ing tool more than doubled, with a ful l 17% of t ransact ions attr ibuted to referrals when they are enabled, up from 7% in pre-pandemic years.
17%OF REGISTRATION DOLLARS
ARE FROM REFERRALS WHEN REFERRAL REWARDS
ARE ENABLED
Referral Rewards Results - # of RegistrationsValue of Registrations vs. Cost of Refund Rewards
49

CORPORATE ANNUAL REPORT BROCHURE | 50
TakeawaysReferrals work because people trust recommendations from family and friends. To maximize referrals, offer both an in-per-son and a virtual option for your race, expanding the pool of peo-ple that can be referred to your event and allowing people to par-ticipate “together” from around the country.
The sweet spot for a referral pro-gram is somewhere in the middle: a high enough reward to motivate sharing the event ($15 or more), and a threshold that is difficult, but not impossible, to attain (3-5 referrals).
# REFERRALS FOR REFUND
# REFUNDS #REGISTRATIONSAVERAGE REFUND AMOUNT
ESTIMATED ROI
ESTIMATED CPA
1 7,610 132,691 $4.11 1,234% $0.24
2 804 84,111 $6.25 1,740% $0.06
3 2,560 237,505 $11.70 1,159% $0.13
4 536 84,805 $15.81 1,298% $0.10
5 5,125 777,937 $22.74 1,162% $0.15
6-9 501 115,229 $23.59 1,503% $0.10
10 109 38,225 $31.51 1,876% $0.09
11-14 125 9,302 $39.64 2,038% $0.53
15-19 45 17,757 $18.15 4,327% $0.05
20-24 26 78,745 $15.00 7,099% $0.00
25-29 1 559 $10.00 16,820% $0.02
30+ 21 652 $35.23 17,103% $1.13
$.87COST PER ACQUISITION FOR EACH NEW REGIS-TRATION VIA REFERRAL
REWARD REFUNDS
Configurations for referral rewards vary widely depending on the type of event and the cost of the initial registration. Most races elect 1,3, or 5 as their threshold for referral reward refunds. Higher thresholds tend to be more efficient, with CPA’s of $0.13-$0.15 for 3 and 5 referrals despite the higher average refund amounts of $11.70 and $22.74.
In comparison, offering a small refund of $4.11 for just one referral leads to a higher CPA of $0.24.
1
2
50
CORPORATE ANNUAL REPORT BROCHURE | 51
4.3 Groups/Teams
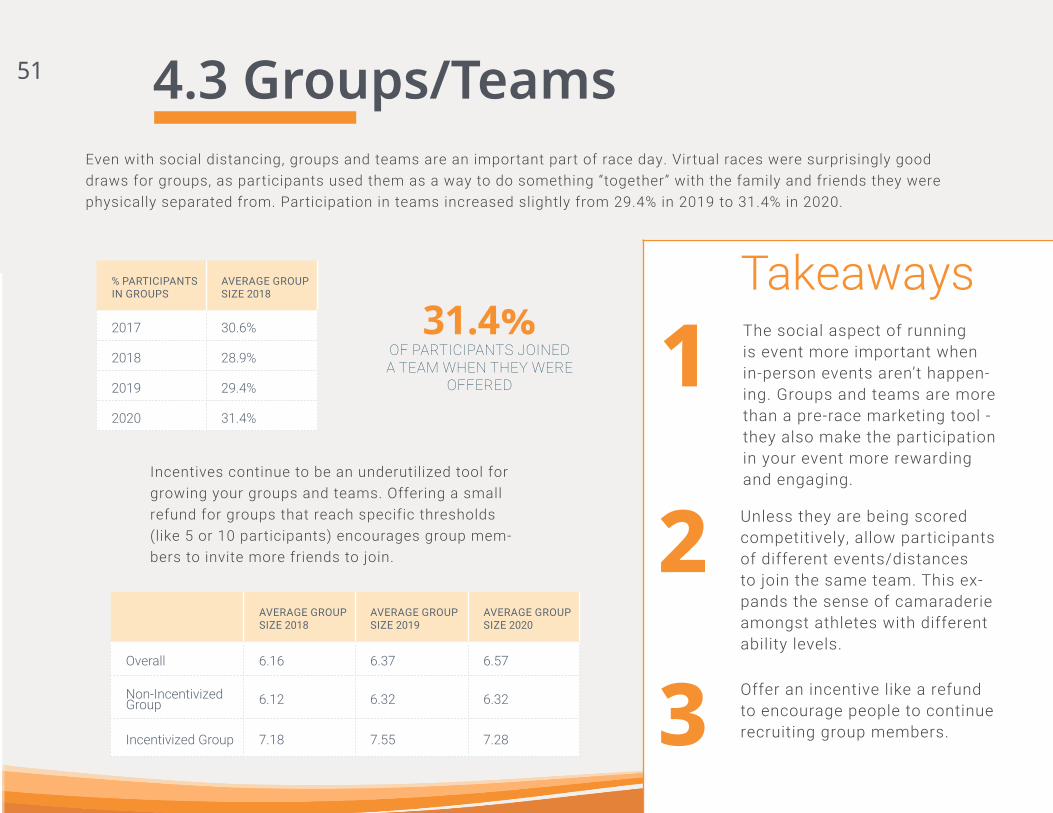
TakeawaysThe social aspect of running is event more important when in-person events aren’t happen-ing. Groups and teams are more than a pre-race marketing tool - they also make the participation in your event more rewarding and engaging.
Unless they are being scored competitively, allow participants of different events/distances to join the same team. This ex-pands the sense of camaraderie amongst athletes with different ability levels.
AVERAGE GROUP SIZE 2018
AVERAGE GROUP SIZE 2019
AVERAGE GROUP SIZE 2020
Overall 6.16 6.37 6.57
Non-Incentivized Group 6.12 6.32 6.32
Incentivized Group 7.18 7.55 7.28
Even with social distancing, groups and teams are an important part of race day. Virtual races were surprisingly good draws for groups, as participants used them as a way to do something “together” with the family and friends they were physically separated from. Participation in teams increased slightly from 29.4% in 2019 to 31.4% in 2020.
Incentives continue to be an underutilized tool for growing your groups and teams. Offering a small refund for groups that reach specific thresholds (like 5 or 10 participants) encourages group mem-bers to invite more friends to join.
% PARTICIPANTS IN GROUPS
AVERAGE GROUP SIZE 2018
2017 30.6%
2018 28.9%
2019 29.4%
2020 31.4%
31.4%OF PARTICIPANTS JOINED A TEAM WHEN THEY WERE
OFFERED
Offer an incentive like a refund to encourage people to continue recruiting group members.
1
2
3
51

CORPORATE ANNUAL REPORT BROCHURE | 52
4.4 Email Marketing
Automated emai ls s impl i fy the emai l market ing process, a l low-ing race organizers to s imply modify pre-def ined emai ls . Automated emai l opt ions include:
» Incomplete Registrat ions emai ls remind suppor ters who be-gin , but do not complete , the registrat ion process to return
» Price increase emai ls automate the pr ice increase reminders sent to current and previous par t ic ipants
» RaceJoy emai ls educate par t ic ipants on best pract ices for using the runner t racking app
» Registrat ion fol low-up emai ls can be customized by race or-ganizers to highl ight and re inforce key programs l ike referral rewards and fundrais ing goals.
RunSignup’s integrated emai l market ing platform provides a free and easy way for event organizers to reach their suppor ters - current and former par -t ic ipants , volunteers , fundraisers , and custom l ists of contacts. Over the last three years , usage of the emai l market ing platform has r isen from 7.9 mi l l ion sent emai ls per month in ear ly 2018 to more than 34 mi l l ion per month in late 2020. Whi le some of that increase is t ied to more races using the platform, the surge this year h ighl ights the impor tance of f ree emai l market ing. Emai l was used to both promote events from a distance and to communicate par t ic i -pant management opt ions and new protocols amidst a chaot ic year.
# of Races with Automated Emails Enabled
Total Emails Sent via Email Marketing (in Millions)
52

CORPORATE ANNUAL REPORT BROCHURE | 53
TakeawaysEmail marketing remains a pow-erful communication tool for races, both for marketing and for critical communications about race day. Make every email count with consistent messaging and timely reminders.
Automated emails save time and reduce stress by allowing email marketing to be a “set it and forget it” proposition. Customize automated emails ahead of time instead of trying to remember manual sends at every important juncture.
Races are most l ikely to enable automated emai ls for incomplete regis-trat ions (13,409 races enabled them in 2020) , but pr ice increase emai ls accounted for more registrat ions, 65,000+ in 2020.
Whi le manual ly sent emai ls st i l l lead to more registrat ions, automated emai ls ensure that there is no money left on the table , providing remind-ers about pr ice changes, fo l lowing up on incomplete registrat ions, and for t i fy ing impor tant messages about your event .
Many races opt to use manual emai ls sends for reminders about pr ice increases, instead.
# of Registrations from Emails
258+ MillionFREE EMAILS WERE SENT BY RACE
ORGANIZERS IN 2020
Don’t leave money on the table. Incomplete registration emails won’t significantly increase your participation, but they will reduce confusion from registrants who did not realize they didn’t finish the process, and they provide an extra nudge for those who are on the fence about joining.
1
2
3
53

CORPORATE ANNUAL REPORT BROCHURE | 54
4.5 Web Analytics
SEPT 2016 SEPT 2017 SEPT 2018 SEPT 2019 SEPT 2020
Sessions 2,866,000 3,421,377 4,636,812 6,238,604 7,168,916
$ Transactions $ 12.8M $13,253,653 $17,848,933 $23,070,206 $19,119.072
Note: the low attr ibut ion to emai l as a source of t raff ic is l ikely due to incorrect source tracking between Google Analyt ics and different emai l c l ients.
For example , a l ink in an emai l on a mobi le phone opens the browser with a direct l ink and is counted as such. The 5.3% of v is i ts f rom emai l repor ted by RaceInsights (sec-t ion 4.6) is l ikely more accurate , but even with RaceInsights , there are a number of l inks from an emai l to a race’s pr ivate do-main that we cannot t rack.
Website Sources
Traffic Volume Represented
The data in th is sect ion is compi led from our Google Analyt ics data for September of each year, and provides an overview of how par t ic ipants f ind race websites. This is the same data used to evaluate mobi le adopt ion in sect ion 3.8. The f i rst char t (below) shows the volume of t raff ic and transact ion dol lars processed as repor ted to Google Analyt ics. Google does not capture every session or v is i t ; rather, the repor ts are based on the volume below.
54

CORPORATE ANNUAL REPORT BROCHURE | 55
Referral Sources for races are usual ly race calendars l ike RunningintheUSA.com, websites for races, t imers , or race ser ies ( l ike phi ladelphiamarathon.com). The inf luence of referral sources decl ined in 2020, l ike ly due to a reduct ion of events in general and thus less re l iance on local and nat ional event calendars.
Organic Search is a l ink from Google that is not a paid ad. The high ranking of RunSignup race websites , and the increasing number of races using those websites as their main website , cont inues to be impor tant as organic search dr ives the largest share of t raff ic . Organic search also fe l l in 2020, l ike ly as fewer people were par t ic ipat -ing in (or searching for) events. Paid Search, on the other hand, is a minor dr iver of website t raff ic and usual ly ut i l ized only by larger, h igh-budget events.
Direct Traff ic, or typing in the exact URL, increased share of t raff ic in 2020. Some of th is is l ikely incorrect at -t r ibut ion of t raff ic dr iven by emai ls , whi le some of the increase indicates more intent ional par t ic ipat ion in 2020, with suppor ters checking for the updated plans from their favor i te races.
Social sources increased in impor tance in 2020 and are covered in detai l on the next page.
SOURCE SEPT. 2016
SEPT. 2017
SEPT. 2018
SEPT. 2019
SEPT. 2020
Referral 47% 42.3% 35.8% 26.9% 19.4%
Organic Search 21% 24.4% 28.3% 29.8% 17.1%
Direct 16% 17.6% 20.0% 24.6% 35.5%
Social 15% 14.6% 13.8% 16.6% 24.9%
Email 0.2% 0.5% 0.6% 0.7% 1.0%
Paid Search 0.1% 0.1% 0.4% 0.3% 0.5%
19.4%PERCENT WEBSITE TRAFFIC FROM REFERRAL SOURCES
17.1%PERCENT WEBSITE TRAFFIC
FROM ORGANIC SEARCH
24.9%PERCENT WEBSITE TRAFFIC
FROM SOCIAL SOURCES
55

CORPORATE ANNUAL REPORT BROCHURE | 56
SOCIAL VALUE SEPT 2016 SEPT 2017 SEPT 2018 SEPT 2019 SEPT 2020
Contributed Social Conversions 7.5% 9.0% 8.9% 8.6% 17.7%
Last Interaction Social Conversions 4.1% 4.5% 4.6% 4.4% 9.6%
Social Interact ions are how Google Analyt ics def ines the connect ion be-tween social media and conversions. Contr ibuted social conversions are interact ions that were fol lowed by a conversion, but not immediately , whereas a last interact ion social conversion led direct ly to the conversion.
Social media interact ion not only drove more website v iews this year, i t a lso drove more conversions.
SOCIAL SOURCE SEPT. 2017 SEPT. 2018 SEPT. 2019 SEPT. 2020
Facebook 93.4% 93.7% 95.3% 96.0%
Instagram 3.8% 1.8% 2.5% 1.6%
Instagram Stories n/a 2.0% 0.9% 1.2%
Twitter 1.7% 1.5% 0.7% 0.8%
Other 1.1% 1.0% 0.6% 0.4%
TakeawaysLike it or not, Facebook is a huge driver of website traffic. Make sure your social sharing images are updated and customize the message that shows when your supporters share their registra-tion.
Prioritize marketing programs that capitalize on social connections, like referral rewards and incentives for teams. You’ll reach more peo-ple on Facebook if you give your supporters a specific reason to share your content.
Google groups social into a s ingle source type, but for races, Facebook is c lear ly the k ing of social , making up 96% of a l l social sources. The next most valuable source, Instagram, drove just 2.8% of social t raff ic and 0.7% of a l l website t raff ic .
Make sure your website is opti-mized for search engines. If you aren’t using a RunSignup race website, test your Google ranking by searching for your race and consider a professional SEO audit.
1
2
3
56
CORPORATE ANNUAL REPORT BROCHURE | 57
Takeaways
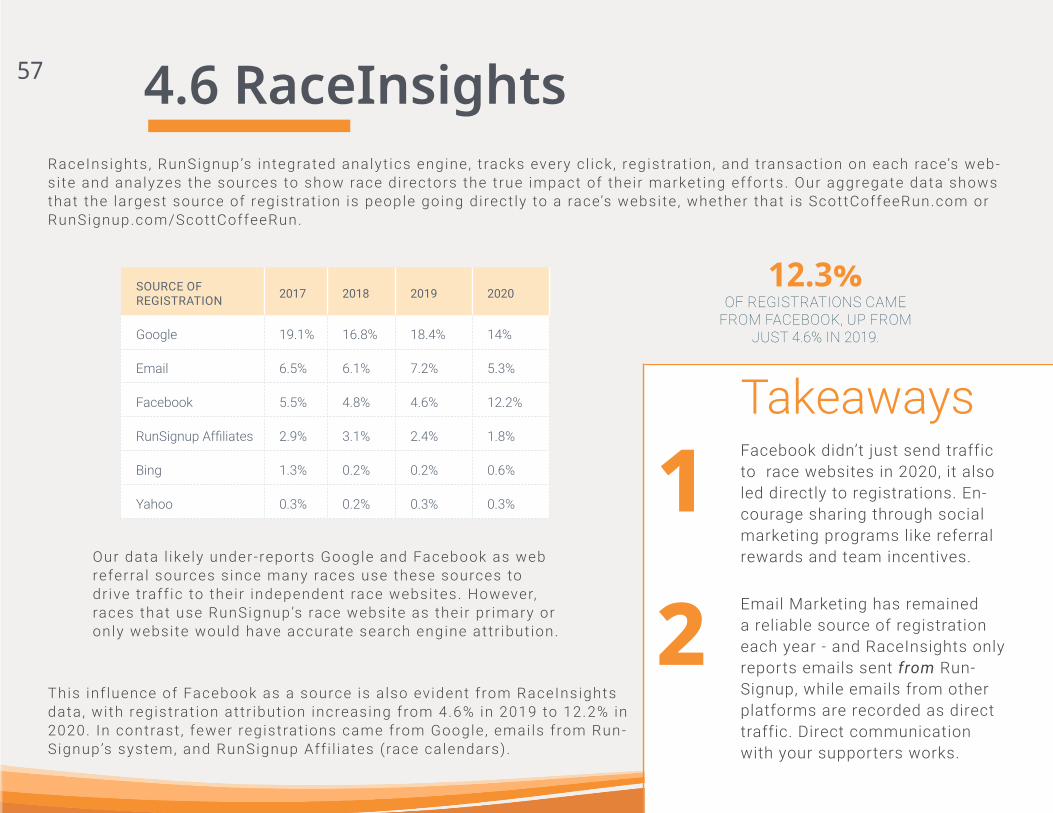
Email Marketing has remained a reliable source of registration each year - and RaceInsights only reports emails sent from Run-Signup, while emails from other platforms are recorded as direct traffic. Direct communication with your supporters works.
4.6 RaceInsights
SOURCE OF REGISTRATION 2017 2018 2019 2020
Google 19.1% 16.8% 18.4% 14%
Email 6.5% 6.1% 7.2% 5.3%
Facebook 5.5% 4.8% 4.6% 12.2%
RunSignup Affiliates 2.9% 3.1% 2.4% 1.8%
Bing 1.3% 0.2% 0.2% 0.6%
Yahoo 0.3% 0.2% 0.3% 0.3%
RaceInsights , RunSignup’s integrated analyt ics engine, t racks every c l ick , registrat ion, and transact ion on each race’s web-si te and analyzes the sources to show race directors the true impact of their market ing effor ts. Our aggregate data shows that the largest source of registrat ion is people going direct ly to a race’s website , whether that is ScottCoffeeRun.com or RunSignup.com/ScottCoffeeRun.
Our data l ikely under-repor ts Google and Facebook as web referral sources s ince many races use these sources to dr ive traff ic to their independent race websites. However, races that use RunSignup’s race website as their pr imary or only website would have accurate search engine attr ibut ion.
This inf luence of Facebook as a source is a lso evident from RaceInsights data , with registrat ion attr ibut ion increasing from 4.6% in 2019 to 12.2% in 2020. In contrast , fewer registrat ions came from Google , emai ls f rom Run-Signup’s system, and RunSignup Aff i l iates (race calendars) .
Facebook didn’t just send traffic to race websites in 2020, it also led directly to registrations. En-courage sharing through social marketing programs like referral rewards and team incentives.
12.3%OF REGISTRATIONS CAME
FROM FACEBOOK, UP FROM JUST 4.6% IN 2019.
12
57

CORPORATE ANNUAL REPORT BROCHURE | 58
The pandemic required us to re-evaluate all of our fundraising campaigns for the year. It became clear that our success would be directly impacted by our ability to innovate and use more flexible technology.
- Paterson Music Project
58

CORPORATE ANNUAL REPORT BROCHURE | 59
GiveTrends1 KEY FINDINGS AND TRENDS
2 CONCLUSIONS
3 RECOMMENDATIONS
» $6,581,143 in donations came from small-dollar donors , or those contributing $25 or less, making up 23% of the donations on the platform.
» Enabling fundraising increased the average amount raised by a race from $969 (for simple donations only) to $5,733 (for races with donations and fundraising).
» Adding a check box donation option nearly tripled the average amount raised by a race compared to simple donations, taking the average to $3,037.
» Enabling the free Facebook Fundraising Integration increases the likelihood of a fundraiser reaching their goal, with 49% reaching their goal compared to 30% for races without Facebook enabled.
» Donations of all amounts matter. To maximize donations, provide options for the $10 donor and the $1,000 donor. » Setting fundraisers up for success requires more effort than flipping a switch to accept donations, but that work pays
off in increased donation dollars. » Adding Facebook Fundraising to your RunSignup Fundraising makes it easier for fundraisers to reach a wide range of
friends and family.
» Supporters want to contribute to your event. Make it easy by offering options for donation levels, and sharing the im-pact of every donation with your donors (whether the donation is $1,000 or $10).
» If you’re cautious about asking for money during a crisis, consider a free, no frills event, and encourage donations in place of registrations fees.
» To maximize fundraising efforts, nonprofits with a dedicated supporter base should enable fundraising and incentiv-ize participants to reach out to their friends and family to contribute.
» Enable the free Facebook Fundraising integration to make it easier for your participants to reach their fundraising goals (and yours).
59

CORPORATE ANNUAL REPORT BROCHURE | 60
5.1 DonationsWe took a look at both the average number of donat ions made on our platform and the value of those donat ions across 2020. Whi le total donat ions on RunSignup grew in 2020, the range of range of indiv idual donat ions remained re lat ively stable. A donat ion of less than $10 may seem insignif icant , but people are more l ikely to contr ibute at that level , and al l those smal l donat ions added up to $2,192,794 and 7.9% of a l l donat ion dol lars. On the other hand, only 1.1% of donat ions were over $250, yet , they combined to make up 20% of the total donat ion dol lars and a total of $5,735,564 to nonprof i ts .
DONATION AMOUNT NUMBER OF DONATIONS
% OF TOTAL DONATIONS
<$10 386,250 47.8%
$10-25 195,920 24.2%
$26-50 127,754 15.8%
$51-100 71,150 8.8%
$101-250 19,045 2.4%
$251-500 6,269 0.8%
$501-1,000 1,728 0.2%
$1,000+ 562 0.1%
Number of Donations
60

CORPORATE ANNUAL REPORT BROCHURE | 61
Value all donors. A single $10 donation may not seem like a lot, but if you give people the option to donate at a level they’re com-fortable with even the smallest donations can add up to signifi-cant funds for your nonprofit.
Asking for money during a cri-sis can be more uncomfortable. Encourage giving large amounts with a soft ask by sharing the benefits of each donation and providing opportunities to make large donations.
Takeaways
DONATION AMOUNT VALUE OF DONA-TIONS
% OF TOTAL DONATION DOLLARS
<$10 $2,192,794 7.6%
$10-25 4,388,349 15.3%
$26-50 5,876,121 20.4%
$51-100 6,813,814 23.7%
$101-250 $3,759,947 13.1%
$251-500 2,754,573 9.6%
$501-1,000 1,582,197 5.5%
$1,000+ 1,398,795 4.9%
Value of Donations
$6,581,143IN DONATIONS CAME FROM SMALL-DOLLAR
DONORS ($25 OR LESS). THAT WAS
22.9% OF THE TOTAL AMOUNT COLLECTED IN 2020.
2
1
61

CORPORATE ANNUAL REPORT BROCHURE | 62
5.2 Fundraising
There are 3 basic ways to ra ise more on RunSignup: » Basic check box on the checkout page (with a pre-set donat ion amount) » Simple donat ions dur ing registrat ion » Fundrais ing (where par t ic ipants ra ise money from their own community)
Across the 14,700+ races that par t ic ipated in some type of donat ion col lect ion, those that engaged fundraisers earned signif icant ly more for their cause.
However, whi le races with e i ther donat ions only or donat ions with a check box opt ion increased their average total donat ions, races with fundrais ing raised just shy of their average total in 2019. With the f inancial pressures of 2020, i t is l ike-ly that suppor ters who were eager to suppor t their favor i te causes and donate themselves, but were less comfor table asking for donat ions from others.
Whi le fundrais ing is the way to go i f you have an engaged group of suppor ters , checkout page donat ions may be the most underrated way to ra ise money s im-ply . Only a smal l percentage of races enabled the check box, yet races that d id ra ised markedly more money on average than those that only turned on s imple donat ions.
AVERAGE TOTAL RAISED BY EACH EVENT % OF ALL TRANSACTIONS (INCLUDING REGISTRATIONS)
TYPE OF DONATIONS 2016 2017 2018 2019 2020 2016 2017 2018 2019 2020
Donations Only $536 $527 $581 $670 $969 3.0% 3.5% 3.8% 4.0% 6.4%
Donations & Fundraisers $3,115 $4,156 $4,745 $5,907 $5,733 4.7% 6.3% 6.6% 7.7% 11.4%
Checkout Page & Donations $1,314 $1,244 $1,903 $3,186 $3,037 0.5% 0.5% 0.8% 1.6% 2.4%
$5,733AVERAGE AMOUNT RAISED BY EVENTS WITH FUNDRAISING
$3,307 AVERAGE AMOUNT RAISED BY
EVENTS WITH SIMPLE DONATIONS AND A CHECK BOX OPTION
62

CORPORATE ANNUAL REPORT BROCHURE | 63
TakeawaysIt can be hard to ask for money during a crisis, but supporters want to you reach your finan-cial goals. If donations are the priority, consider a free or low cost event with low overhead, allowing supporters to dedicate their money to the cause, not the swag.
Enabling donations is a good start, but to maximize the rev-enue for your nonprofit, either engage your most enthusiastic supporters as fundraisers or turn on the check box option for quick and easy donations.
Despite the f inancial hardships of 2020, donat ions held steady or increased by every metr ic avai lable , including percent of total t ransact ions on the s i te , average donat ions per race, and average number of donat ions by race.
NUMBER OF RACES NUMBER OF DONATIONS PER RACE
2018 2019 2020 2018 2019 2020
Donations Only 9,537 10,505 10,404 24 27 43
Donations & Fundraisers 2,068 2,288 3,116 91 111 107
Checkout Page & Donations 649 867 1,260 102 127 172
Average Donation Totals 1
2
63

CORPORATE ANNUAL REPORT BROCHURE | 64
5.3 Facebook Fundraising
2019% DONATIONS
2020% DONATIONS
Facebook 6.4% 15.0%
GiveSignup | RunSignup 93.6% 85.0%
We introduced the free GiveSignup | RunSignup – Facebook Fundraiser integrat ion in July 2019 and nonprof i ts have raised more than $1.1 Mi l l ion on Facebook through connected fundraisers. To look at the impact that the free Facebook Fundraiser integrat ion is having dur ing the pandemic, we compare aggregate data from July – December 2019 and July – December 2020.
In 2019, 5.88% of fundraisers created a connected Facebook Fundraiser (when the event enabled the free integrat ion) . This increased to 6.93% of connected fundraisers in 2020. We see a growing de-mand for the Facebook Fundraiser integrat ion from users because they want to reach their goals – and asking for donat ions v ia Facebook makes that easy.
The table shows the growth in the number of donat ions made to fundraisers that happen on Face-book, f rom 6.4% in 2019 to 15% in 2020. This means that nonprof i ts are saving more money (Face-book covers the processing fees for donat ions made on Facebook) and saving t ime (the integrat ion automatical ly pul ls in the amount ra ised on Facebook to the indiv idual fundraiser ’s page and associ -ated team page) .
48.7%FUNDRAISERS REACHED THEIR GOAL WHEN RUNSIGNUP AND FACEBOOK FUNDRAISING
WERE ENABLED, WHILE JUST
29.7%REACHED THEIR GOAL WITH A RUNSIGNUP
FUNDRAISER ALONE
64
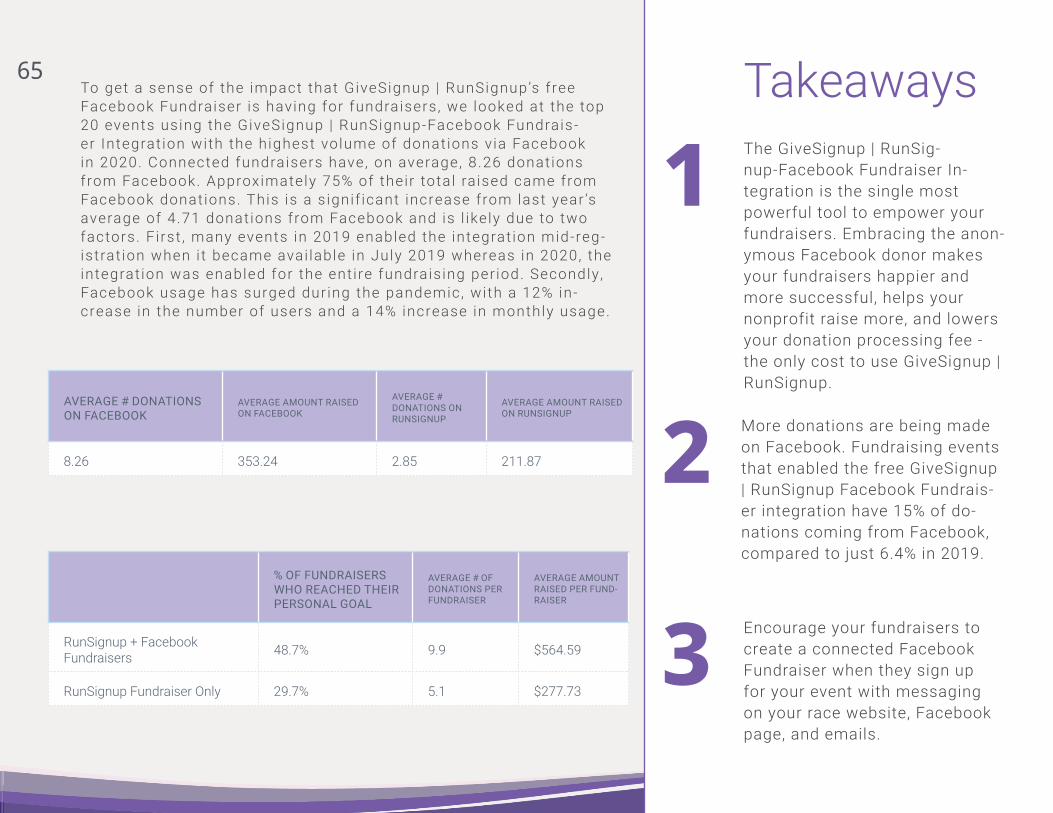
CORPORATE ANNUAL REPORT BROCHURE | 65
TakeawaysThe GiveSignup | RunSig-nup-Facebook Fundraiser In-tegration is the single most powerful tool to empower your fundraisers. Embracing the anon-ymous Facebook donor makes your fundraisers happier and more successful, helps your nonprofit raise more, and lowers your donation processing fee - the only cost to use GiveSignup | RunSignup.
More donations are being made on Facebook. Fundraising events that enabled the free GiveSignup | RunSignup Facebook Fundrais-er integration have 15% of do-nations coming from Facebook, compared to just 6.4% in 2019.
To get a sense of the impact that GiveSignup | RunSignup’s free Facebook Fundraiser is having for fundraisers , we looked at the top 20 events using the GiveSignup | RunSignup-Facebook Fundrais-er Integrat ion with the highest volume of donat ions v ia Facebook in 2020. Connected fundraisers have, on average, 8 .26 donat ions from Facebook. Approximately 75% of their total ra ised came from Facebook donat ions. This is a s ignif icant increase from last year ’s average of 4.71 donat ions from Facebook and is l ikely due to two factors. F i rst , many events in 2019 enabled the integrat ion mid-reg-istrat ion when i t became avai lable in July 2019 whereas in 2020, the integrat ion was enabled for the ent i re fundrais ing per iod. Secondly , Facebook usage has surged dur ing the pandemic, with a 12% in-crease in the number of users and a 14% increase in monthly usage.
AVERAGE # DONATIONS ON FACEBOOK
AVERAGE AMOUNT RAISED ON FACEBOOK
AVERAGE # DONATIONS ON RUNSIGNUP
AVERAGE AMOUNT RAISED ON RUNSIGNUP
8.26 353.24 2.85 211.87
% OF FUNDRAISERS WHO REACHED THEIR PERSONAL GOAL
AVERAGE # OF DONATIONS PER FUNDRAISER
AVERAGE AMOUNT RAISED PER FUND-RAISER
RunSignup + Facebook Fundraisers 48.7% 9.9 $564.59
RunSignup Fundraiser Only 29.7% 5.1 $277.73
Encourage your fundraisers to create a connected Facebook Fundraiser when they sign up for your event with messaging on your race website, Facebook page, and emails.
1
2
3
Takeaways65

CORPORATE ANNUAL REPORT BROCHURE | 66
We’ve held 3 in-person events, progressing from 300 up to 900 participants. With COVID protocols in place, participants are happy to be out racing and are adopting safety protocols without hesitation.
- Run Toledo
66

CORPORATE ANNUAL REPORT BROCHURE | 67
RaceDay Trends1 KEY FINDINGS AND TRENDS
2 CONCLUSIONS
3 RECOMMENDATIONS
» Innovative timers stayed competitive by offering virtual race services and swag fulfillment, with 88% of timers saying that they offer services beyond timing.
» Timers are proactive about the 2021 race season, with 70% reporting they have reached out to their race directors to plan, and 87% indicating they either have hosted an in-person race, or are working on one for the coming months.
» RaceJoy had a record-breaking year, increasing the races offering the app by 168% and the tracked participants by more than 50%.
» With the interruption of in-person events, CheckIn App usage dropped from 17% of participants checked in 2019 to 7% in 2020.
» Some race day technology saw light use in 2020, but it will have renewed importance heading into 2021. » RaceJoy expanded it’s value in 2020 by offering solutions for both virtual runners and race organizers looking for new
safety mechanisms for modified races. » Timing businesses are small, competitive operations, and timers who offer a complete compliment of services were
best equipped to manage the standstill of in-person events. » The majority of timers are being proactive by expanding services and getting ahead of the competition, while a small
percentage continue to “wait and see” how things will play out.
» Now is the time to get up to speed on the latest technology. As in-person races return, technology will play a valuable role in keeping participants, volunteers, and staff safe.
» Offer RaceJoy to bring your virtual and in-person participants together through a shared audio experience, while pro-viding a hands-off safety tool to your race course.
» Expand your services to expand your market share. A diverse set of services both increases your revenue and gener-ates stability for your business by creating races who rely on your expertise.
» Timers should act now to help their races with hybrid options. The first races on the calendar will have an advantage!
67

CORPORATE ANNUAL REPORT BROCHURE | 68
6.1 RaceDay Registrations
YEAR # RACEDAY REGISTRATIONS
# RACE WEEK REGISTRATIONS
%OF RACE WEEK REGISTRATIONS ON RACEDAY
% TOTAL REGISTRATIONS THAT HAPPEN ON RACEDAY
2017 85,064 922,426 9.22% 2.45%
2018 98,772 1,093,761 9.03% 2.15%
2019 121,011 1,328,006 9.11% 2.14%
2020 118,418 1,003,326 11.80% 2.95%
TakeawayMaximize participation by pro-viding options to register on race day. To reduce touch-points on-site, leave online registration open and encourage people to register on their personal phones rather than using kiosks or paper that must be handled.
As we saw in sect ion 3.1 , registrat ion procrast inat ion only worsened in 2020, with just shy of 3% of a l l registrat ions tak-ing place on RaceDay. Addit ional ly , those register ing on race week were more l ikely to wait unt i l the very end this year, with 11.8% of race week registrat ions coming on the last day compared to 9.1% in 2019.
11.8%OF RACE WEEK REGISTRATIONS
CAME ON RACE DAY
While some of these registrat ions may have been for v i r tual races, we expect to see hesitancy to register as in-person races return amidst cont inued uncer tainty
1
68
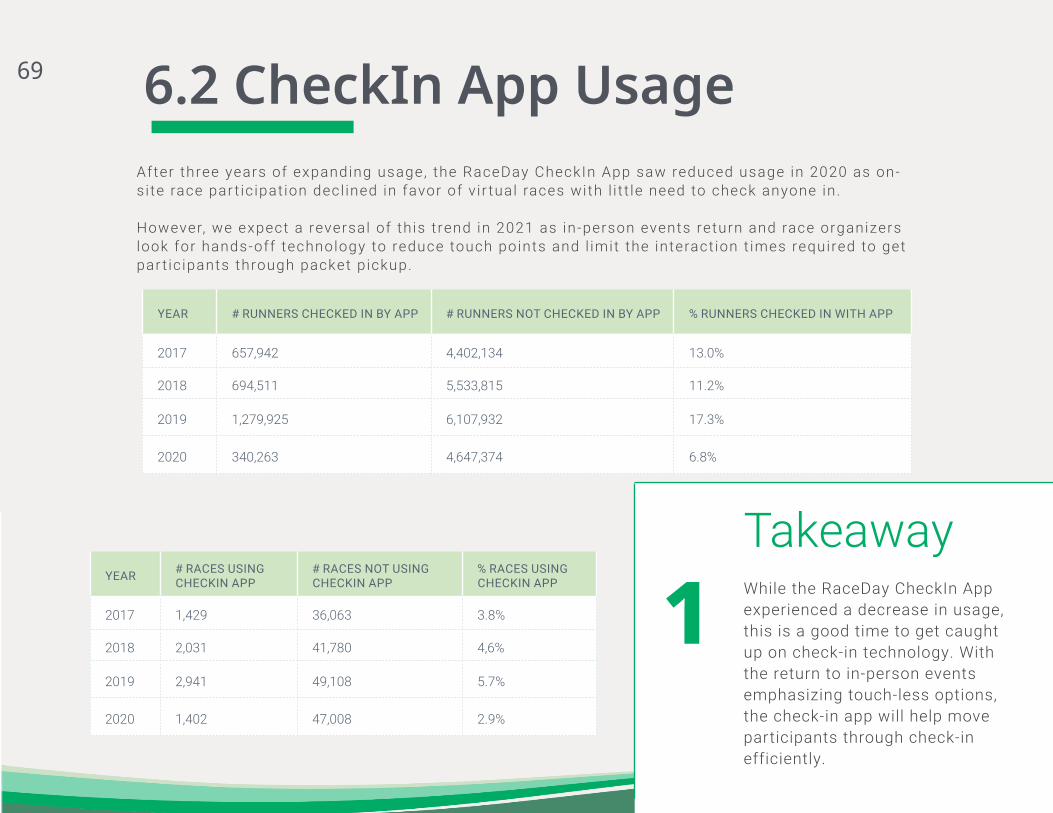
CORPORATE ANNUAL REPORT BROCHURE | 69
After three years of expanding usage, the RaceDay CheckIn App saw reduced usage in 2020 as on-si te race par t ic ipat ion decl ined in favor of v i r tual races with l i t t le need to check anyone in .
However, we expect a reversal of th is t rend in 2021 as in-person events return and race organizers look for hands-off technology to reduce touch points and l imit the interact ion t imes required to get par t ic ipants through packet p ickup.
YEAR # RUNNERS CHECKED IN BY APP # RUNNERS NOT CHECKED IN BY APP % RUNNERS CHECKED IN WITH APP
2017 657,942 4,402,134 13.0%
2018 694,511 5,533,815 11.2%
2019 1,279,925 6,107,932 17.3%
2020 340,263 4,647,374 6.8%
YEAR # RACES USING CHECKIN APP
# RACES NOT USING CHECKIN APP
% RACES USING CHECKIN APP
2017 1,429 36,063 3.8%
2018 2,031 41,780 4,6%
2019 2,941 49,108 5.7%
2020 1,402 47,008 2.9%
6.2 CheckIn App Usage
TakeawayWhile the RaceDay CheckIn App experienced a decrease in usage, this is a good time to get caught up on check-in technology. With the return to in-person events emphasizing touch-less options, the check-in app will help move participants through check-in efficiently.
1
69

CORPORATE ANNUAL REPORT BROCHURE | 70
6.3 Scored Results Notifications
TakeawayConsider multiple technologies to enhance your race day in the absence of crowds and post-race parties. Results notifications are an easy way to both congratulate your participants and prompt friends and family to reach out with their own kudos.
Number of Races vs. Number of Notifications Sent
NUMBER OF NOTIFICATIONS
2017 # OF RACES
2018 # OF RACES
2019 # OF RACES
2020 # OF RACES
10,000+ 3 5 5 3
5,000-9,999 18 28 42 20
1,000-4,999 221 335 468 244
500-999 292 424 543 330
100-499 1,107 1,239 1,415 1,097
1-99 818 774 759 1,408
Whi le the number of races offer ing scored results not i f i -cat ions for on-si te races stayed pretty steady from 2019 to 2020 (3 ,102 in 2020 compared to 3 ,232 in 2019) , the makeup of those races shif ted. In 2020, the races offer ing results not i f icat ions were much more l ikely to be smal l races than in previous years , a response to both fewer large races happening, and a need to provide a remote spectator exper ience.
In 2021, the impor tance of technology - whether that ’s not i f icat ions or GPS tracking - wi l l escalate as races look to expand their f ie ld of competi tors whi le providing safe ways for spectators to stay engaged from home.
1
70

CORPORATE ANNUAL REPORT BROCHURE | 71
In 2020, The Race Director scor ing software was used to score 5 ,078 races and 1 ,452,755 par t ic ipants , a consider -able decl ine from the 15,340 races and 6 ,438,967 par t ic ipants scored by the software in 2019. However, the data is hard to interpret ; not only did in-person race par t ic ipat ion fal l , the way in which the data is current ly repor ted also cannot di f ferent iate v i r tual par t ic ipants from in-person par t ic ipants when both were opt ions in the race. We have a new API serv ice rol l ing out in 2021 for both The Race Director and RaceDay Scor ing that should make the data in th is sect ion more complete.
6.4 The Race Director
Number of Races by Registration Integration
TakeawayVirtual races reduced the need for traditional scoring software, with participants self-reporting their results for many events. Looking to 2021, we expect the need for next generation soft-ware to increase to deal with complicated starts, longer race times, and more remote timing.
2017 2018 2018 2020
Total Races 15,040 15,403 15,340 5,078
Total Participants 5,952,791 4,996,330 6,438,967 1,452,755
Average Race Size 396 324 429 286
1
71
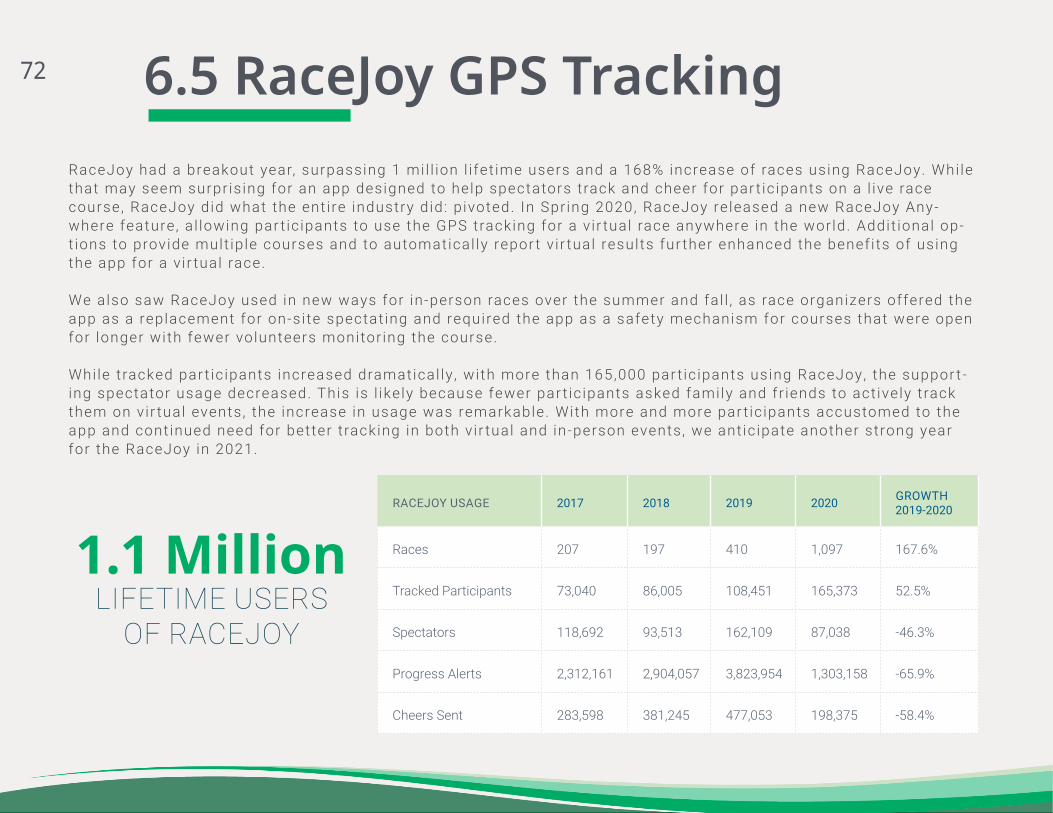
CORPORATE ANNUAL REPORT BROCHURE | 72
6.5 RaceJoy GPS Tracking
RACEJOY USAGE 2017 2018 2019 2020 GROWTH 2019-2020
Races 207 197 410 1,097 167.6%
Tracked Participants 73,040 86,005 108,451 165,373 52.5%
Spectators 118,692 93,513 162,109 87,038 -46.3%
Progress Alerts 2,312,161 2,904,057 3,823,954 1,303,158 -65.9%
Cheers Sent 283,598 381,245 477,053 198,375 -58.4%
RaceJoy had a breakout year, surpassing 1 mi l l ion l i fet ime users and a 168% increase of races using RaceJoy. Whi le that may seem surpr is ing for an app designed to help spectators track and cheer for par t ic ipants on a l ive race course, RaceJoy did what the ent i re industry did : p ivoted. In Spr ing 2020, RaceJoy re leased a new RaceJoy Any-where feature , a l lowing par t ic ipants to use the GPS tracking for a v i r tual race anywhere in the world. Addit ional op-t ions to provide mult ip le courses and to automatical ly repor t v i r tual results fur ther enhanced the benef i ts of using the app for a v i r tual race.
We also saw RaceJoy used in new ways for in-person races over the summer and fal l , as race organizers offered the app as a replacement for on-si te spectat ing and required the app as a safety mechanism for courses that were open for longer with fewer volunteers monitor ing the course.
Whi le t racked par t ic ipants increased dramatical ly , with more than 165,000 par t ic ipants using RaceJoy, the suppor t -ing spectator usage decreased. This is l ikely because fewer par t ic ipants asked family and fr iends to act ively t rack them on v i r tual events , the increase in usage was remarkable. With more and more par t ic ipants accustomed to the app and cont inued need for better t racking in both v i r tual and in-person events , we ant ic ipate another strong year for the RaceJoy in 2021.
1.1 MillionLIFETIME USERS
OF RACEJOY
72

CORPORATE ANNUAL REPORT BROCHURE | 73
RaceJoy Usage
TakeawayRaceJoy isn’t just for in-person events. Offer the app to your virtual participants along with a customized audio experience to create a virtual event that feels real - and encourage them to share the information with friends and family to add the fun of spectator engagement to their day.
For an on-site event, RaceJoy is about more than just spectat-ing. Race organizers can enable off-course alerts to keep people on track and use the monitor-ing system to ensure the safety of participants with fewer on-course volunteers.
RaceJoy Usage
167.6%GROWTH IN RACES
OFFERING RACEJOY
1
2
73
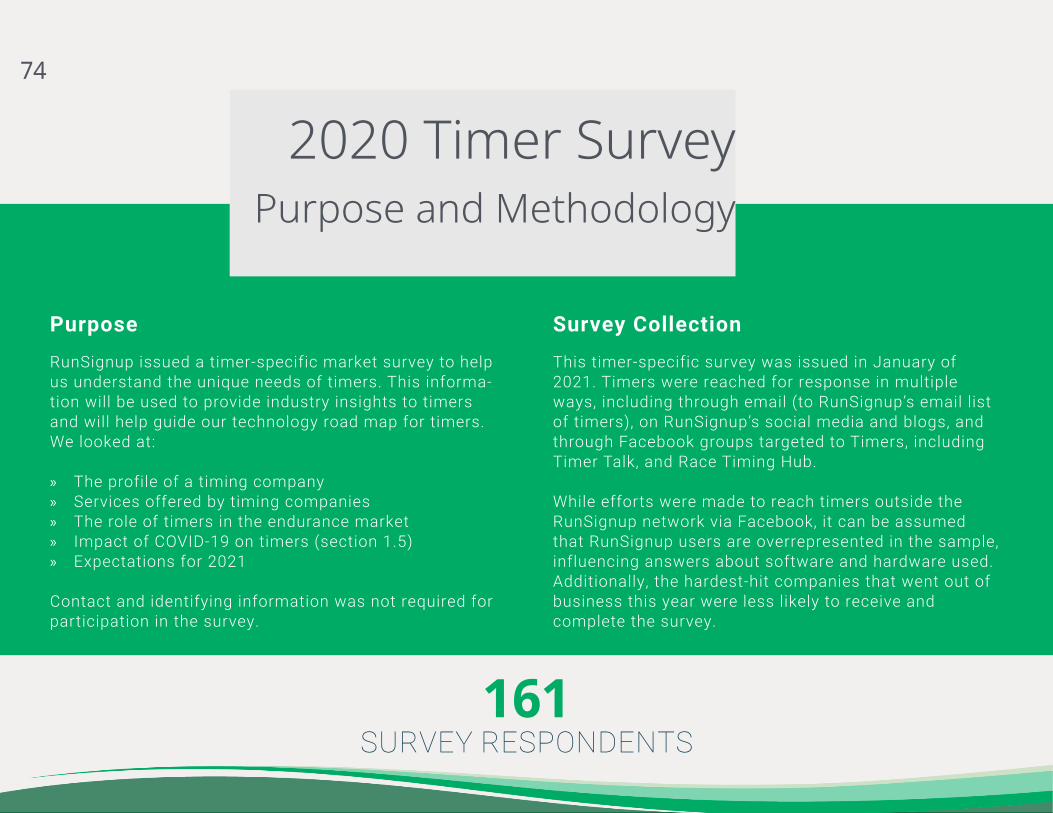
CORPORATE ANNUAL REPORT BROCHURE | 74
Purpose
RunSignup issued a timer-specific market survey to help us understand the unique needs of timers. This informa-tion will be used to provide industry insights to timers and will help guide our technology road map for timers. We looked at:
» The profile of a timing company » Services offered by timing companies » The role of timers in the endurance market » Impact of COVID-19 on timers (section 1.5) » Expectations for 2021
Contact and identifying information was not required for participation in the survey.
2020 Timer Survey Purpose and Methodology
Survey Collection
This timer-specific survey was issued in January of 2021. Timers were reached for response in multiple ways, including through email (to RunSignup’s email list of timers), on RunSignup’s social media and blogs, and through Facebook groups targeted to Timers, including Timer Talk, and Race Timing Hub.
While efforts were made to reach timers outside the RunSignup network via Facebook, it can be assumed that RunSignup users are overrepresented in the sample, influencing answers about software and hardware used. Additionally, the hardest-hit companies that went out of business this year were less likely to receive and complete the survey.
161SURVEY RESPONDENTS
74

CORPORATE ANNUAL REPORT BROCHURE | 75
6.6 The Timing BusinessThis set of quest ions establ ishes the scope of t iming businesses by looking at ownership roles , number of employ-ees, number of events t imed, and job status. There is a wide range in the number of races t imed by each company in a year, with the largest group (38.8%) indicat ing between 11-50 events in a normal year. The vast major i ty of respond-ing t imers (88.2%) hold at least shared ownership of their business, yet a s ignif icant number of them (56.9%) also maintain another job (ful l or par t - t ime).
ROLE 2019 2020
Head Honcho 53.9% 64.6%
Co-Head Honcho (with Spouse) 9.8% 9.9%
Owner with Non-Spouse Partner 18.1% 13.7%
Work for Someone Else 18.1% 11.8%
JOB STATUS 2019 2020
Another Full-Time Job 46.5% 43.8%
Another Part-Time Job 12.2% 8.1%
Timing Service is Only Job 41.3% 43.1%
Got another job because of COVID-19 n/a 5.0%
Do you have another “Real” Job?
Role within Timing Company
75

CORPORATE ANNUAL REPORT BROCHURE | 76
TakeawaysRace timing is a labor of love, with hands-on owners, small teams, and frequently, a need to supplement income with an out-side revenue source.
There is no “one size” for a tim-ing company, with scalability that allows 10% to time just 1-10 events while 11.3% time more than 150 events in a year.
Number of Employees Working for Your Timing Company
Number of Events Timed in a Normal Year
25.5%TIME BETWEEN 51 AND 100 RACES IN A NORMAL YEAR
12
76

CORPORATE ANNUAL REPORT BROCHURE | 77
6.7 Market Competition
TakeawayOne thing 2020 didn’t change? The importance of relationships and value-add services for a competitive timing business. Maintain connections with your races - even the ones that con-vert to virtual or cancel - to stay competitive for years to come.
The percept ion of competi t ion amongst t imers stayed consistent f rom 2019 to 2020, with the median response of 5 when asked to rank competi t ion on a scale of 1( least) to 10 (most) . The top strategies for deal ing with competi t ion also re-mained the same: re lat ionship-bui ld ing, offer ing extra-value services ( l ike bibs or t racking) , and technology self -educat ion.
On a Scale of 1-10, How Much Competition do You Face?
How Do You Make Your Business Competitive?
1
77

CORPORATE ANNUAL REPORT BROCHURE | 78
6.8 Role in the IndustryOffer ing services beyond t iming keeps t iming companies competi t ive , with 88.8% of t iming companies providing ad-dit ional serv ices. Whi le race direct ing remains the most common service provided, th is year ’s l ist shows increases in t imers offer ing v i r tual results and other serv ices for v i r tual races, such as swag order ing and fulf i l lment.
88.8%OF TIMERS OFFER SERVICES BEYOND
TIMING
Do You Provide Services Beyond Timing?
What Other Services Do You Provide?
78
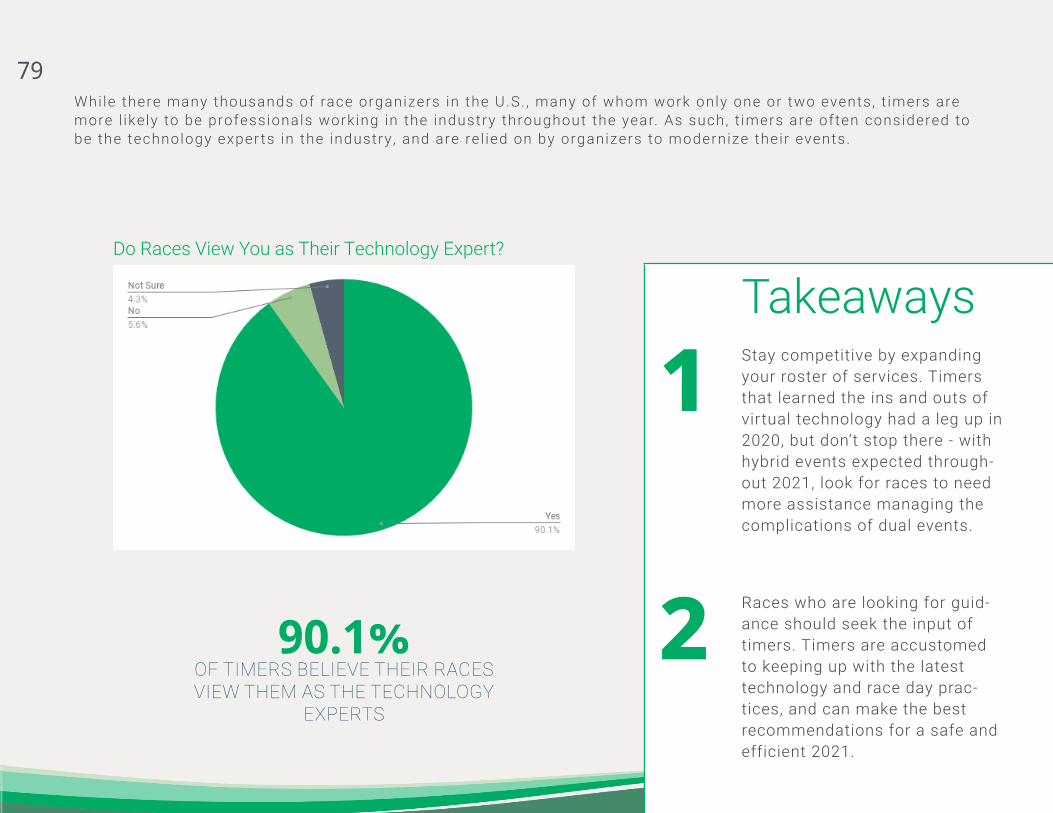
CORPORATE ANNUAL REPORT BROCHURE | 79
TakeawaysStay competitive by expanding your roster of services. Timers that learned the ins and outs of virtual technology had a leg up in 2020, but don’t stop there - with hybrid events expected through-out 2021, look for races to need more assistance managing the complications of dual events.
Races who are looking for guid-ance should seek the input of timers. Timers are accustomed to keeping up with the latest technology and race day prac-tices, and can make the best recommendations for a safe and efficient 2021.
Do Races View You as Their Technology Expert?
90.1%OF TIMERS BELIEVE THEIR RACES VIEW THEM AS THE TECHNOLOGY
EXPERTS
While there many thousands of race organizers in the U.S. , many of whom work only one or two events , t imers are more l ikely to be professionals working in the industry throughout the year. As such, t imers are often considered to be the technology exper ts in the industry , and are re l ied on by organizers to modernize their events.
1
2
79
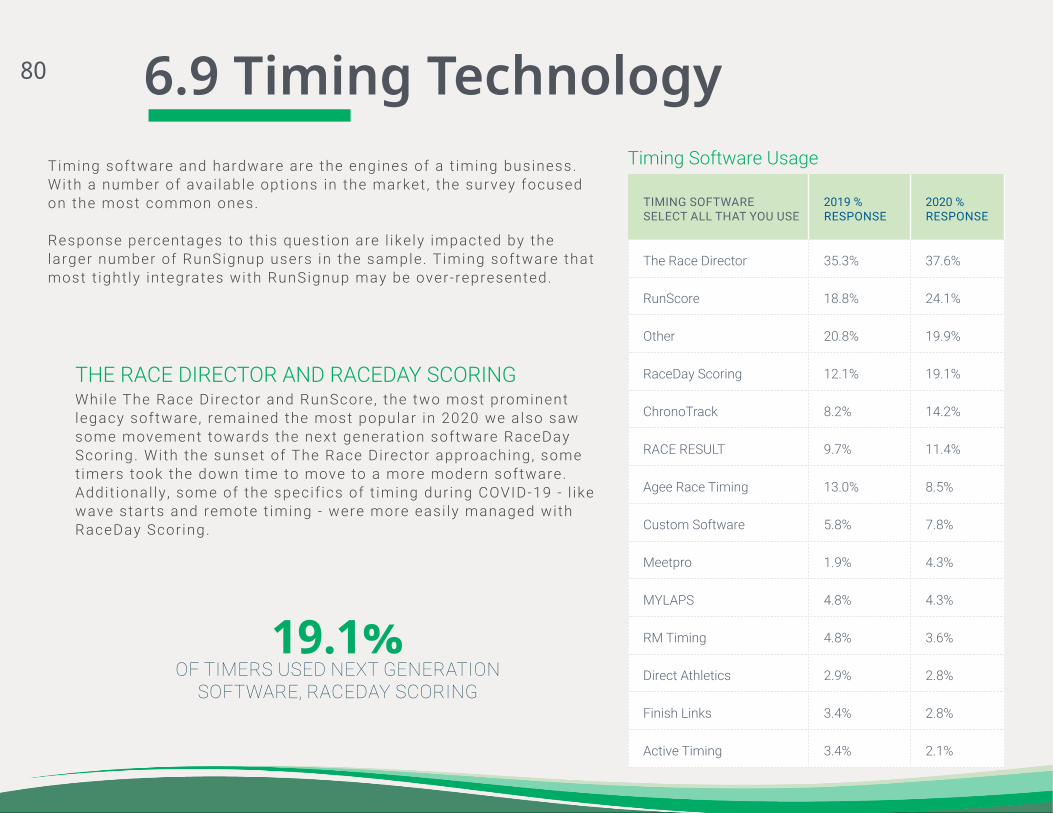
CORPORATE ANNUAL REPORT BROCHURE | 80
6.9 Timing Technology
TIMING SOFTWARE SELECT ALL THAT YOU USE
2019 % RESPONSE
2020 % RESPONSE
The Race Director 35.3% 37.6%
RunScore 18.8% 24.1%
Other 20.8% 19.9%
RaceDay Scoring 12.1% 19.1%
ChronoTrack 8.2% 14.2%
RACE RESULT 9.7% 11.4%
Agee Race Timing 13.0% 8.5%
Custom Software 5.8% 7.8%
Meetpro 1.9% 4.3%
MYLAPS 4.8% 4.3%
RM Timing 4.8% 3.6%
Direct Athletics 2.9% 2.8%
Finish Links 3.4% 2.8%
Active Timing 3.4% 2.1%
Timing software and hardware are the engines of a t iming business. With a number of avai lable opt ions in the market , the survey focused on the most common ones.
Response percentages to th is quest ion are l ikely impacted by the larger number of RunSignup users in the sample. Timing software that most t ight ly integrates with RunSignup may be over-represented.
Whi le The Race Director and RunScore, the two most prominent legacy software, remained the most popular in 2020 we also saw some movement towards the next generat ion software RaceDay Scor ing. With the sunset of The Race Director approaching, some t imers took the down t ime to move to a more modern software. Addit ional ly , some of the specif ics of t iming dur ing COVID-19 - l ike wave star ts and remote t iming - were more easi ly managed with RaceDay Scor ing.
THE RACE DIRECTOR AND RACEDAY SCORING
19.1%OF TIMERS USED NEXT GENERATION
SOFTWARE, RACEDAY SCORING
Timing Software Usage
80

CORPORATE ANNUAL REPORT BROCHURE | 81
TakeawayDon’t lock yourself into legacy timing options forever. Look for timing hardware that is open and flexible, and allows you to upgrade your software solution seamlessly without interrupting your integrations.
To evaluate t iming hardware usage we looked at two different sets of data. The f i rst is f rom the survey data we have used throughout th is sect ion. The second is pul led from information about the hardware used for races scored with The Race Director software.
This set of data also has some bias - IPICO, RFID, and MYLAPS t imers are more l ikely to use The Race Director, whereas ChronoTrack t imers often use RunScore or CTLive. However, including i t does al low us to v iew a larger sample of the market .
HARDWARE SOURCE
TIMING HARDWARE SELECT ALL THAT YOU USE
2019% RESPONSE
2020% RESPONSE
IPICO 18.9% 27.0%
MYLAPS 23.1% 23.9%
ChronoTrack 13.2% 21.1%
Other 13.2% 19.7%
RACE RESULT 15.6% 16.9%
FinishLynx 18.9% 15.5%
RFID 18.9% 15.5%
Trident 8.05 6.3%
Jaguar 5.25 3.5%
J-Chip 0.9% 2.0%
Survey Hardware Data
TIMING HARDWARE # RACES #
PARTICIPANTS
J-Chip 1 1,235
Winning Time 2 493
Trident 321 71,060
RACE RESULT 332 116,631
ChronoTrack 616 252,887
None 587 134,741
MYLAPS 926 254,487
RFID 1,052 304,183
IPICO 1,242 316,038
The Race Director Hardware Data
IPICO HARDWARE WAS USED BY
27%OF SURVEY RESPONDENTS AND
24.4%OF RACES SCORED BY THE RACE
DIRECTOR
1
81

CORPORATE ANNUAL REPORT BROCHURE | 82
6.10 The Timing Industry in 2021As we discussed in Sect ion 1.5 , the t iming industry was hi t hard in 2020, with 96.4% repor t ing a negat ive impact , the major i ty of whom saw a s ignif icant neg-at ive impact on their business. Looking to 2021, th is sect ion reviews how the t iming companies plan to rebound.
A s ignif icant major i ty of t iming companies plan to hold onto their current business or increase market share. Accordingly , near ly 70% of t imers have already dis-cussed 2021 with their race directors.
69.6%OF TIMERS HAVE ALREADY
DISCUSSED 2021 WITH THEIR RACE DIRECTORS
Have you contacted your race directors about 2021?
What are your plans for 2021?
82

CORPORATE ANNUAL REPORT BROCHURE | 83
Are you providing services for on-site races?
On a scale of 1-10, how much guidance are you providing races regarding safe COVID-19 events? Answers show % of respondents with that answer.
TakeawaysThe time to move is now. Most timers have already begun work-ing with their race directors on a plan for 2021, and many are hop-ing to pick up market share this year. Don’t get left behind waiting for races to contact you.
Expand your knowledge base. Races expect timers to help them navigate the challenges of events during COVID-19, includ-ing safe on-site events.
Timers are moving forward with their p lans for 2021, with a ful l 87% repor t ing that their are a l -ready putt ing on or p lanning for in-person events in the coming months.
Along with that , t imers cont inue to provide guidance in the industry , with 87.4% rat ing the amount of guidance they are providing at a 5 or h igher on a scale of 10.
87%OF TIMERS HAVE PUT ON AN
IN-PERSON RACE OR ARE PLAN-NING FOR ONE IN THE COMING
MONTHS
1
2
83