annual general meeting presentation - listed...
TRANSCRIPT
Annual General Meeting Presentation
27 April 2010
Important Notice
This presentation may contain forward-looking statements which can be identified by the contextof the statement and generally arise when the Company is discussing its beliefs, estimates orexpectations. Such statements may include comments on industry, business or market trends,projections, forecasts, and plans and objectives of management for future operations andoperating and financial performance, as well as any related assumptions. Readers of thispresentation should understand that these statements are not historical facts or guarantees offuture performance but instead represent only the Company’s belief at the time the statementswere made regarding future events, which are subject to significant risks, uncertainties and otherfactors, many of which are outside of the Company’s control. Actual results and outcomes maydiffer materially from what is expressed or implied in such forward-looking statements. TheCompany cautions readers not to place undue reliance on any forward-looking statementsincluded in this presentation, which speak only as of the date made; and should any of the eventsanticipated by the forward-looking statements transpire or occur, the Company makes noassurances on what benefits, if any, the Company will derive therefrom.
For further information, contact:
Mr Michio Tanamoto
Tel: (65) 6224 5120
2
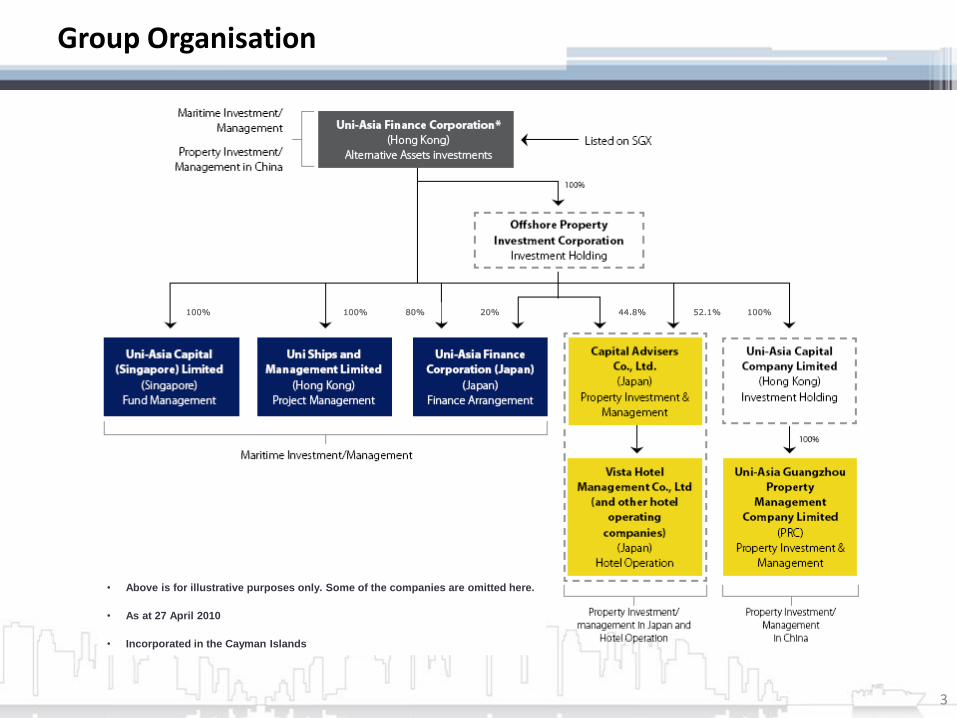
Group Organisation
3
• Above is for illustrative purposes only. Some of the companies are omitted here.
• As at 27 April 2010
• Incorporated in the Cayman Islands
52.1%44.8% 100%20%80%100%100%
Review of FY 2009
4

Financial Highlights for FY 2009
5
Total Income Net profit / (loss)
Total Assets
Total Equity
Total CashTotal Debt / Total Equity
US$ ’000
US$ ’000US$ ’000
US$ ’000
US$ ’000
9,439
11,433
12,416
(3,664)
(15,683)
6
Financial Highlights for FY 2009
US $ ’mil
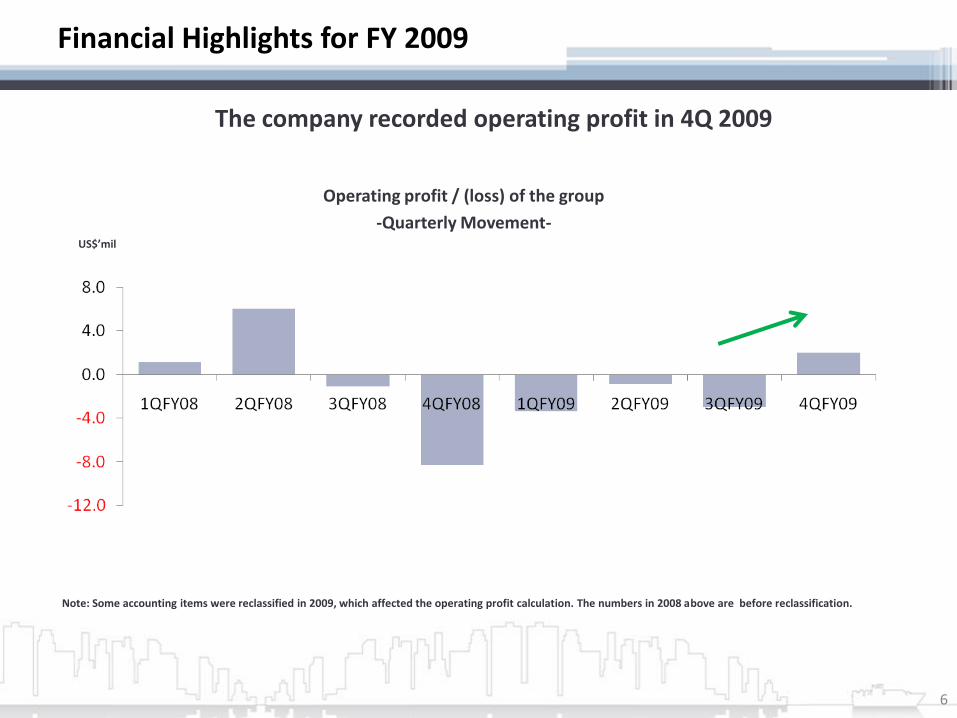
The company recorded operating profit in 4Q 2009
Note: Some accounting items were reclassified in 2009, which affected the operating profit calculation. The numbers in 2008 above are before reclassification.
US$’mil
Operating profit / (loss) of the group
-Quarterly Movement-
Financial Highlights for FY 2009
7
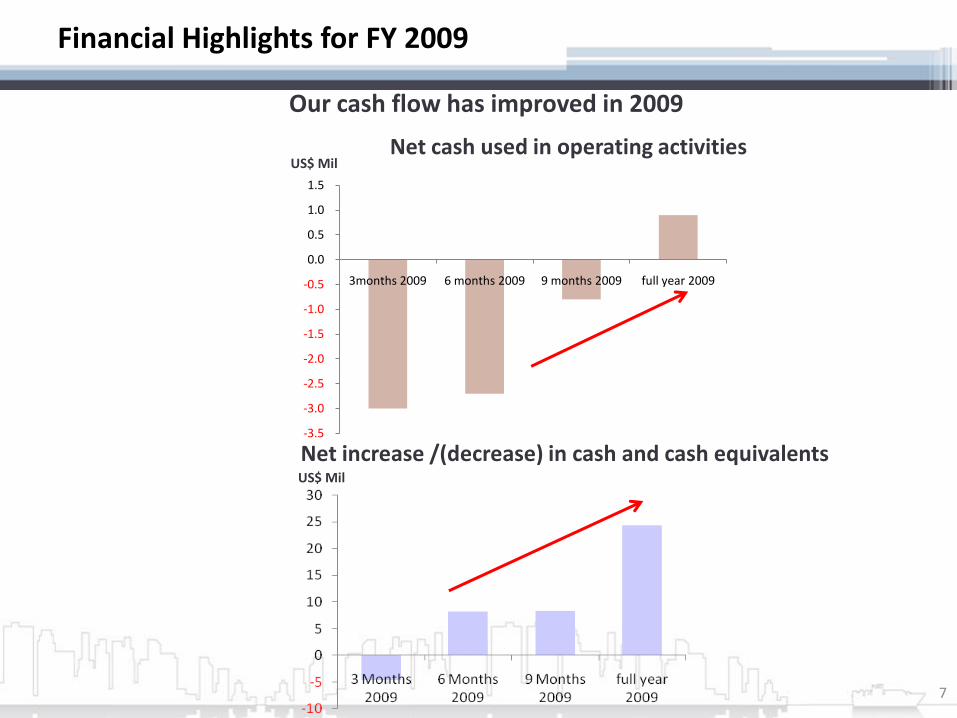
Our cash flow has improved in 2009
US$ Mil
US$ Mil
Net cash used in operating activities
Net increase /(decrease) in cash and cash equivalents-3.5
-3.0
-2.5
-2.0
-1.5
-1.0
-0.5
0.0
0.5
1.0
1.5
3months 2009 6 months 2009 9 months 2009 full year 2009
Financial Highlights for FY 2009
8
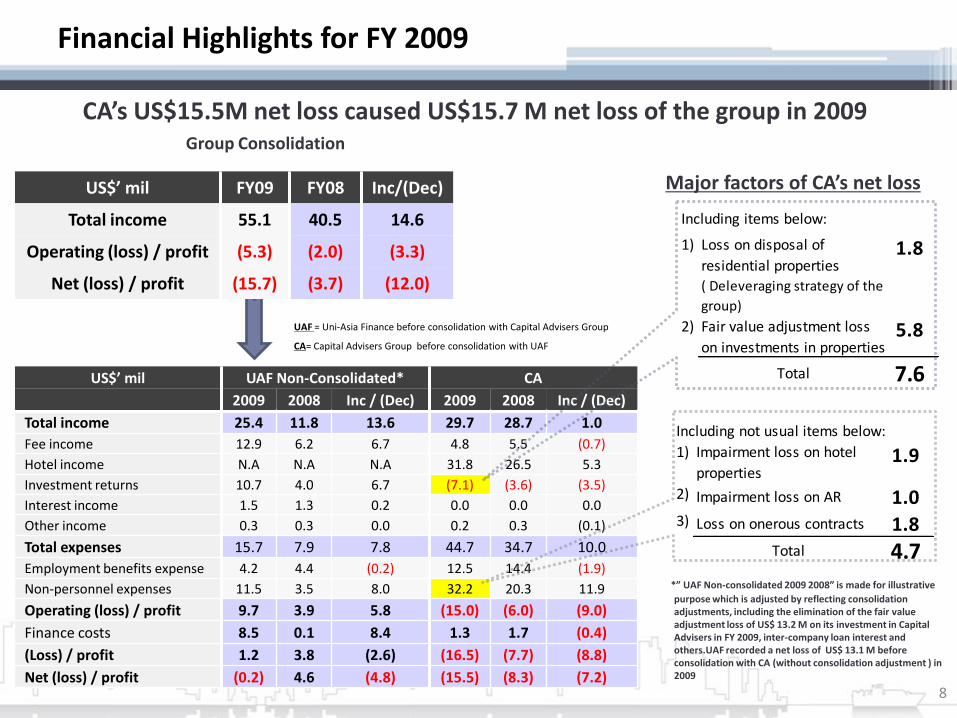
CA’s US$15.5M net loss caused US$15.7 M net loss of the group in 2009
UAF = Uni-Asia Finance before consolidation with Capital Advisers Group
CA= Capital Advisers Group before consolidation with UAF
*” UAF Non-consolidated 2009 2008” is made for illustrative
purpose which is adjusted by reflecting consolidation adjustments, including the elimination of the fair value adjustment loss of US$ 13.2 M on its investment in Capital Advisers in FY 2009, inter-company loan interest and others.UAF recorded a net loss of US$ 13.1 M before consolidation with CA (without consolidation adjustment ) in 2009
Group Consolidation
Including items below:
1) Loss on disposal of
residential properties1.8
( Deleveraging strategy of the
group)
2) Fair value adjustment loss
on investments in properties5.8
Total 7.6
Major factors of CA’s net loss
US$’ mil UAF Non-Consolidated* CA
2009 2008 Inc / (Dec) 2009 2008 Inc / (Dec)
Total income 25.4 11.8 13.6 29.7 28.7 1.0
Fee income 12.9 6.2 6.7 4.8 5.5 (0.7)
Hotel income N.A N.A N.A 31.8 26.5 5.3
Investment returns 10.7 4.0 6.7 (7.1) (3.6) (3.5)
Interest income 1.5 1.3 0.2 0.0 0.0 0.0
Other income 0.3 0.3 0.0 0.2 0.3 (0.1)
Total expenses 15.7 7.9 7.8 44.7 34.7 10.0
Employment benefits expense 4.2 4.4 (0.2) 12.5 14.4 (1.9)
Non-personnel expenses 11.5 3.5 8.0 32.2 20.3 11.9
Operating (loss) / profit 9.7 3.9 5.8 (15.0) (6.0) (9.0)
Finance costs 8.5 0.1 8.4 1.3 1.7 (0.4)
(Loss) / profit 1.2 3.8 (2.6) (16.5) (7.7) (8.8)
Net (loss) / profit (0.2) 4.6 (4.8) (15.5) (8.3) (7.2)
Including not usual items below:
1) Impairment loss on hotel
properties1.9
2) Impairment loss on AR 1.03) Loss on onerous contracts 1.8
Total 4.7
US$’ mil FY09 FY08 Inc/(Dec)
Total income 55.1 40.5 14.6
Operating (loss) / profit (5.3) (2.0) (3.3)
Net (loss) / profit (15.7) (3.7) (12.0)
9
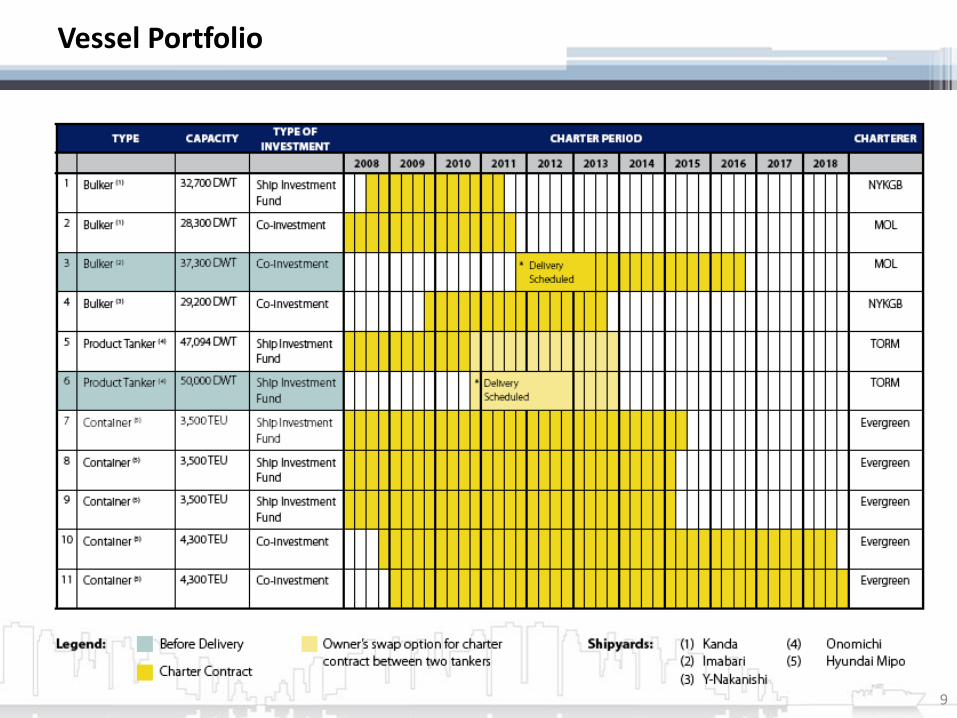
Vessel Portfolio
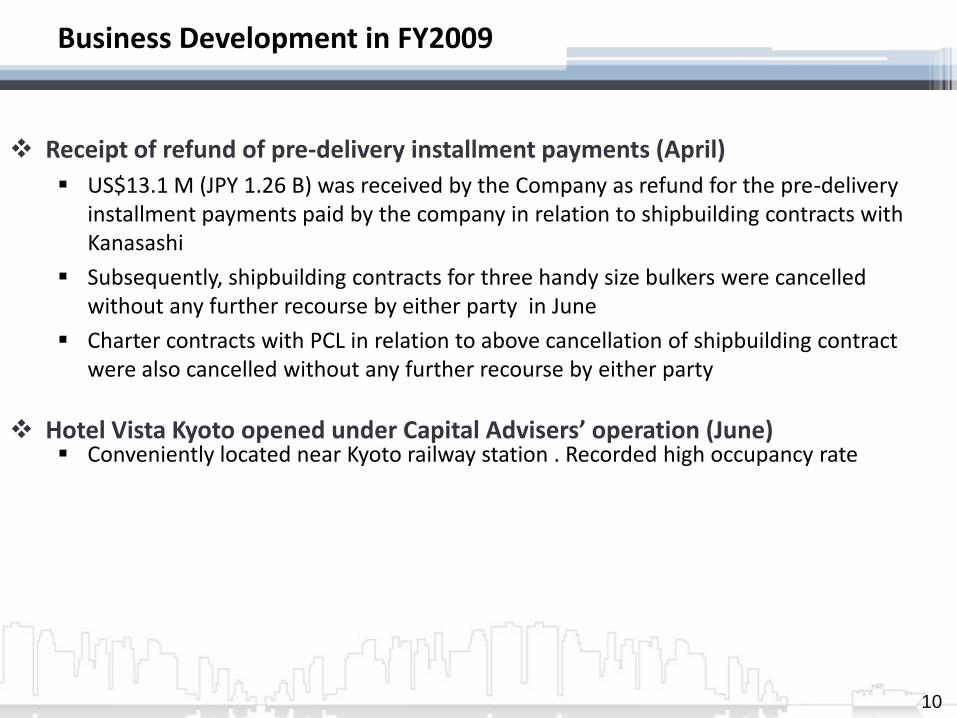
Business Development in FY2009
Receipt of refund of pre-delivery installment payments (April)
US$13.1 M (JPY 1.26 B) was received by the Company as refund for the pre-delivery installment payments paid by the company in relation to shipbuilding contracts with Kanasashi
Subsequently, shipbuilding contracts for three handy size bulkers were cancelled without any further recourse by either party in June
Charter contracts with PCL in relation to above cancellation of shipbuilding contract were also cancelled without any further recourse by either party
Hotel Vista Kyoto opened under Capital Advisers’ operation (June) Conveniently located near Kyoto railway station . Recorded high occupancy rate
10
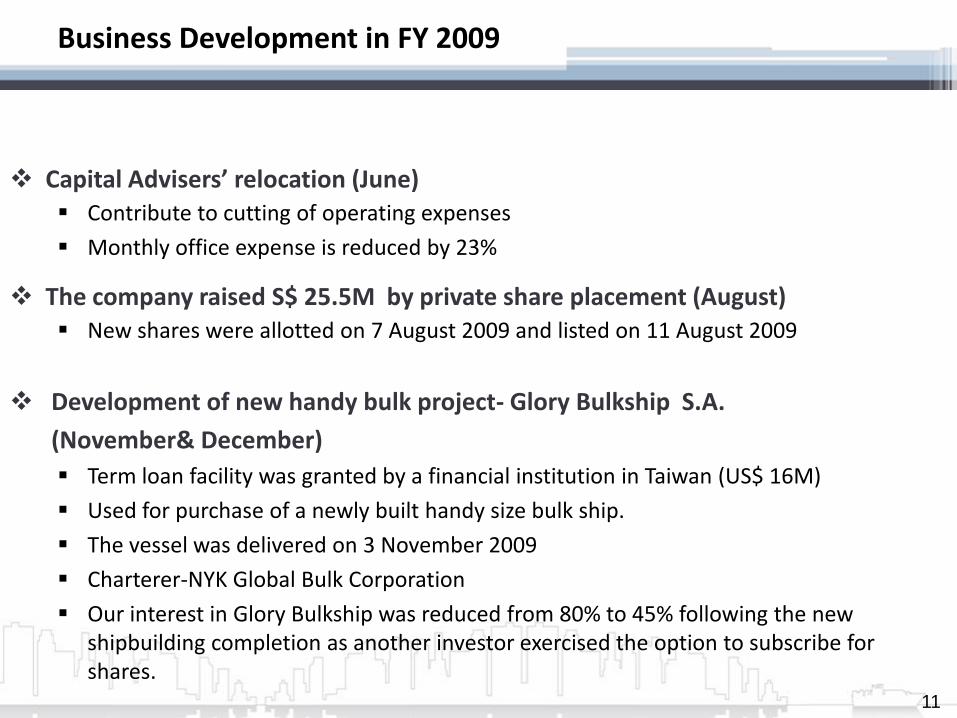
Business Development in FY 2009
Capital Advisers’ relocation (June) Contribute to cutting of operating expenses
Monthly office expense is reduced by 23%
The company raised S$ 25.5M by private share placement (August) New shares were allotted on 7 August 2009 and listed on 11 August 2009
Development of new handy bulk project- Glory Bulkship S.A.
(November& December)
Term loan facility was granted by a financial institution in Taiwan (US$ 16M)
Used for purchase of a newly built handy size bulk ship.
The vessel was delivered on 3 November 2009
Charterer-NYK Global Bulk Corporation
Our interest in Glory Bulkship was reduced from 80% to 45% following the new shipbuilding completion as another investor exercised the option to subscribe for shares.
11

Business Development in FY 2009
Development of containership project-Prosperity Containership S.A.
(January & December)
The vessel was delivered in January 2009
Charterer: Evergreen Group
Wholly owned subsidiary which owns the vessel has changed to co-investment after another investor’s participation in December 2009.
12
Quick Review of 1Q FY 2010 Results (announced on 26 April 2010)
13
1Q FY 2010 Results
14
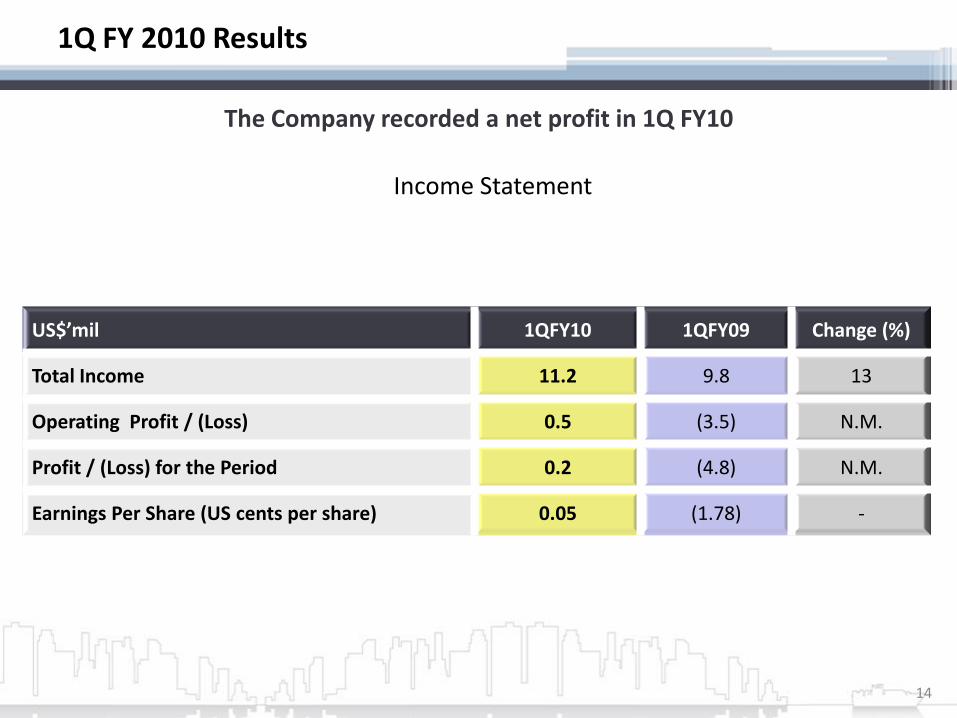
The Company recorded a net profit in 1Q FY10
Income Statement
US$’mil 1QFY10 1QFY09 Change (%)
Total Income 11.2 9.8 13
Operating Profit / (Loss) 0.5 (3.5) N.M.
Profit / (Loss) for the Period 0.2 (4.8) N.M.
Earnings Per Share (US cents per share) 0.05 (1.78) -
1Q FY 2010 Results
15
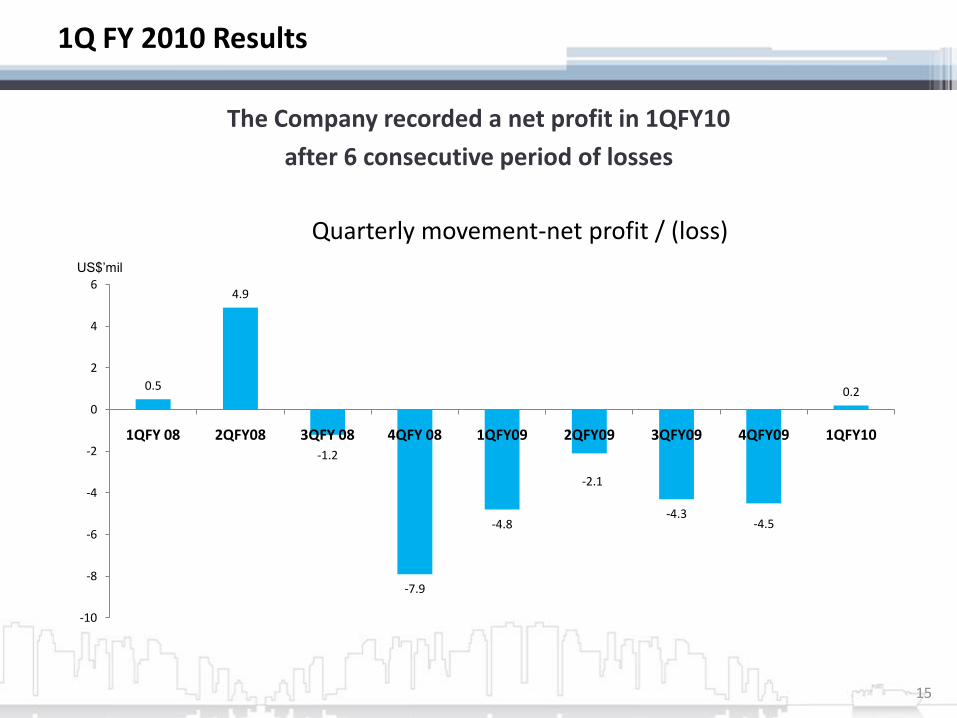
The Company recorded a net profit in 1QFY10
after 6 consecutive period of losses
0.5
4.9
-1.2
-7.9
-4.8
-2.1
-4.3-4.5
0.2
-10
-8
-6
-4
-2
0
2
4
6
1QFY 08 2QFY08 3QFY 08 4QFY 08 1QFY09 2QFY09 3QFY09 4QFY09 1QFY10
US$’mil
Quarterly movement-net profit / (loss)
1Q FY 2010 Results
16
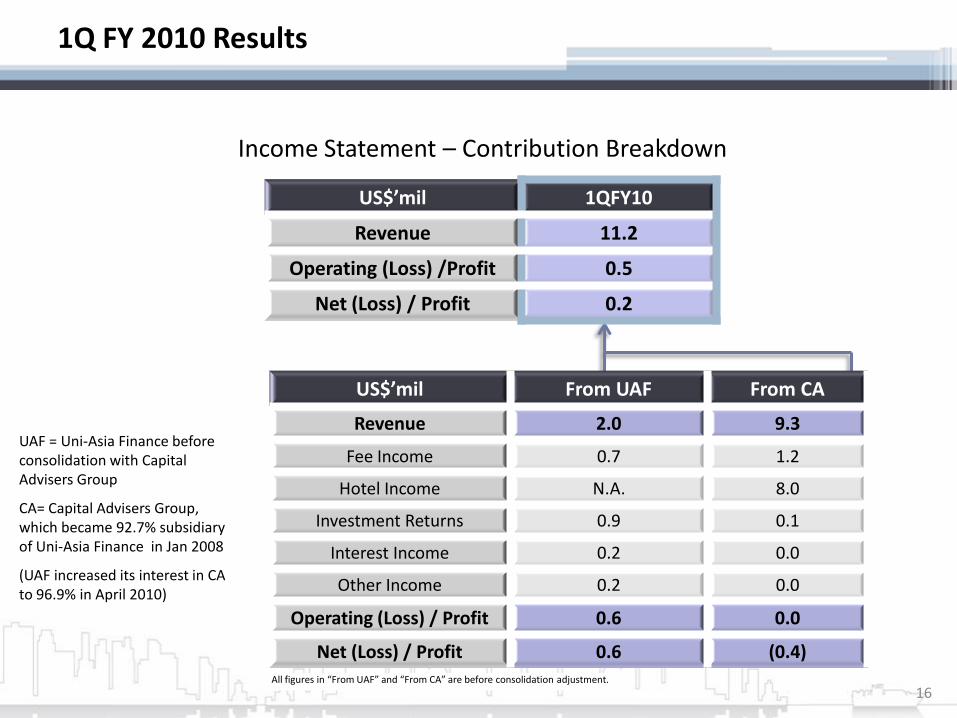
Income Statement – Contribution Breakdown
US$’mil 1QFY10
Revenue 11.2
Operating (Loss) /Profit 0.5
Net (Loss) / Profit 0.2
US$’mil From UAF From CA
Revenue 2.0 9.3
Fee Income 0.7 1.2
Hotel Income N.A. 8.0
Investment Returns 0.9 0.1
Interest Income 0.2 0.0
Other Income 0.2 0.0
Operating (Loss) / Profit 0.6 0.0
Net (Loss) / Profit 0.6 (0.4)All figures in “From UAF” and “From CA” are before consolidation adjustment.
UAF = Uni-Asia Finance before consolidation with Capital Advisers Group
CA= Capital Advisers Group, which became 92.7% subsidiary of Uni-Asia Finance in Jan 2008
(UAF increased its interest in CA to 96.9% in April 2010)
Our Strategy for FY 2010
17
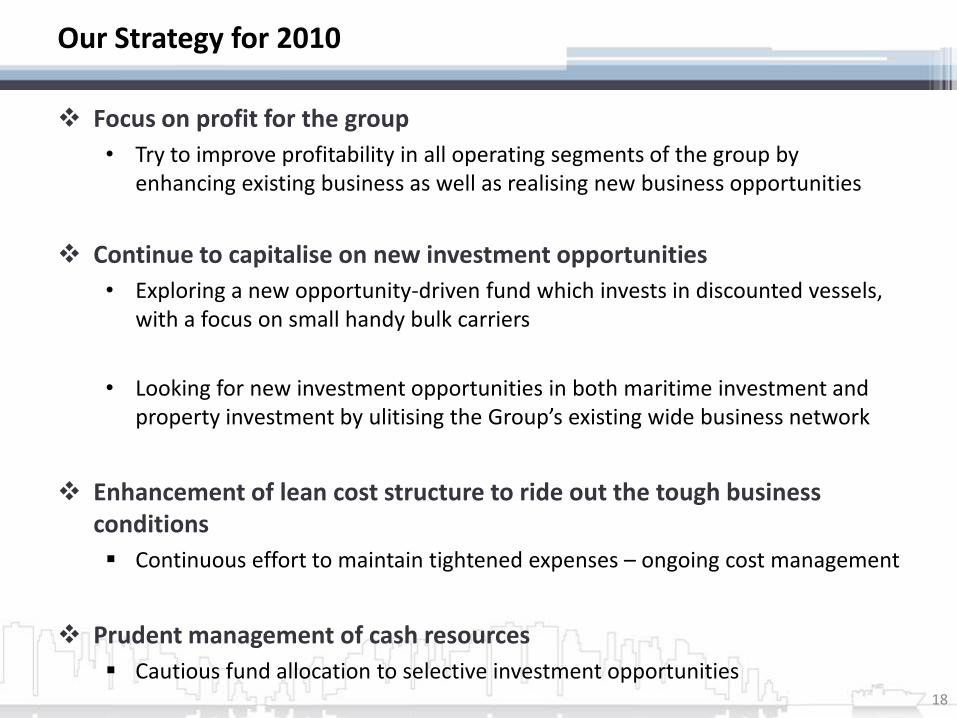
Our Strategy for 2010
Focus on profit for the group
• Try to improve profitability in all operating segments of the group by enhancing existing business as well as realising new business opportunities
Continue to capitalise on new investment opportunities
• Exploring a new opportunity-driven fund which invests in discounted vessels, with a focus on small handy bulk carriers
• Looking for new investment opportunities in both maritime investment and property investment by ulitising the Group’s existing wide business network
Enhancement of lean cost structure to ride out the tough business conditions
Continuous effort to maintain tightened expenses – ongoing cost management
Prudent management of cash resources
Cautious fund allocation to selective investment opportunities 18
Governance and Transparency
19
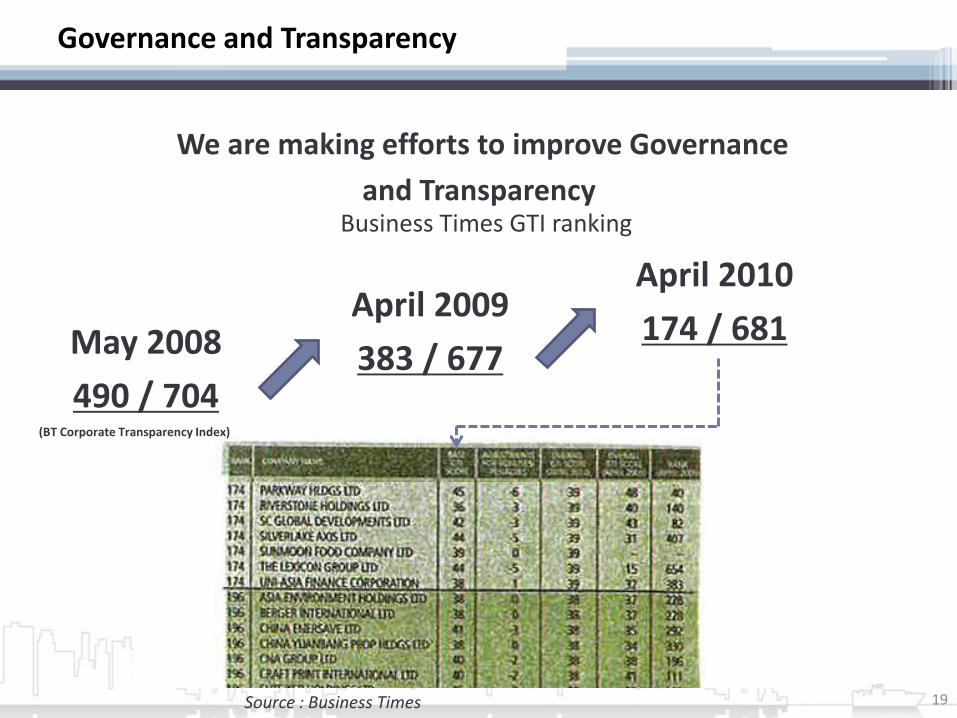
We are making efforts to improve Governance
and Transparency Business Times GTI ranking
May 2008
490 / 704
April 2009
383 / 677
April 2010
174 / 681
Source : Business Times
(BT Corporate Transparency Index)
Thank you