annual general - cmilimited.com.au
TRANSCRIPT

CMI LIMITED ANNUAL REPORT 2016 a

ANNUAL GENERAL MEETING
The Annual General Meeting of CMI Limited will be held at The Westin Sydney Hotel, 1 Martin Place, Sydney NSW 2000 on Wednesday, 23 November 2016 at 10.00am (Sydney time).
The business of the meeting is outlined in the formal Notice and Proxy Form.
FINANCIAL CALENDAR
Financial year end 30 June 2016
ASX announcement of results and dividend 18 August 2016
Annual General Meeting 23 November 2016

CMI LIMITED ANNUAL REPORT 2016 1
02
71
03
72
04
69INDEPENDENT
DIRECTOR’S REVIEW
CORPORATE DIRECTORY
FINANCE REVIEW
CMI LOCATIONS
ELECTRICAL OPERATIONAL REVIEW
SHAREHOLDER INFORMATION
CONTENTS
05 07DIRECTORS AND
SENIOR MANAGEMENTFINANCIAL REPORT

CMI LIMITED ANNUAL REPORT 20162
The 2016 financial year was another year of competitive trading conditions.
Following the sale of the TJM Products business in the prior year, the 2016 year continued to be one of consolidation with a focus on costs and stock levels in the remaining business, CMI Electrical.
The mining industry, in particular underground coal mining, remains slow, while competition in electrical cables and margin cutting by competitors remains extremely aggressive.
In December there was a return of capital of $10.5 million to shareholders.
The company remains in an extremely strong position with $27 million cash on hand. We continue to investigate other business opportunities that will add shareholder value.
ResultsThe company achieved revenues of $40.8 million in the 2016 financial year with pre-tax profit of $4.8 million which is a 16.2% reduction on the prior year excluding one-off contributions from the divestment of TJM and the resolution of the CMI Industrial loan.
Revenue from continuing operations was down 6% compared with the previous year. Trading conditions continue to be difficult with earnings also impacted by a change in sales mix. Corporate overhead reductions and an increase in interest received mitigated part of the reduction in operational earnings. The Board declared an interim fully franked dividend of 3 cents in February 2016 and a final and fully franked dividend of 3 cents per share in August 2016, giving a total of 6 cents fully franked for the year, maintaining the 60% approximate payout ratio.
Sales of the Minto products continue to make a solid contribution to earnings with margins generally holding. We continue to look at the development of new Minto products along with opportunities to reduce the cost of production.
Continued low coal prices, a reduction of activity in the coal mining industry and a lack of capital investment in new coal mines has continued to impact sales from the division’s mining product range. At the same time construction and infrastructure projects also remain slow. Overall revenues are 6% down.
The Board’s view is that the outlook for the business in the medium term remains at continued flat levels with expected improvement in the market over the next few years. The company produces quality mining products and as soon as there is a turnaround in sentiment to commence new coal projects or, renewed activity in the existing coal mining industry, the company remains in a good position to exploit that growth.
The Board is continuing to focus on the quantity of stock held and costs. With a number of premises’ leases falling due for renewal over the next 12 months, the Board will explore the opportunities to cut leasing overheads. The Board continues to look for appropriate acquisition opportunities to grow this division.
The coming yearContinued subdued economic conditions in the resources sector will make for another difficult year with no clear market improvement expected before late 2017. The Board with its review of costs will be endeavouring to maintain current sales and profits despite margin squeeze from competitors.
Board and managementIn December 2015 the executive chairman Andrew Buckley resigned and then Jeff Forbes resigned as a non-executive director in February 2016. In February 2016 the Board appointed Craig Green as an independent non-executive director and then in March 2016 appointed Steve Miotti as another independent non-executive director. Sharyn Williams continued in her role as CFO and company secretary and Jeff Heslington in his role as General Manager.
A long term performance rights plan is in place to encourage retention and stability and reward performance of our senior executives along with a short term incentive program. Appropriate performance hurdles have been applied on an executive basis, including operational revenue growth, profitability, safety, total shareholder return, earnings per share and tenure.
AcknowledgementsI acknowledge the contribution of the Board members both past and present, and particularly the CFO for her continuing focus on cost control along with the general manager of CMI Electrical and his team to the company during the year. The Board also acknowledges and thanks Messrs Buckley and Forbes for their contribution to CMI.
On behalf of the Board I express our appreciation to the management and staff of the company during what was another difficult year.
C. Green Independent Director
INDEPENDENT DIRECTOR’S REVIEW

CMI LIMITED ANNUAL REPORT 2016 3
The Group reported a Net Profit after Tax of $3.45m for the financial year ended 2016, a decrease of 37% on the prior year. This result was driven largely by:
• decreased earnings as a result of lower overall revenues from the mining, industrial and construction sectors;
• increased pressure on product margins;
• the prior year including $1.34m from the resolution of the CMI Industrial loan and the gain on the divestment of the TJM division.
The company balance sheet remains conservatively geared with nil borrowing and net cash at 30 June 2016 of $26.7m.
The Group generated positive operating cashflows of $6.3m, paid $3.1m in dividends, returned $10.5m to shareholders and continued to invest into the development of products. During the year the working capital requirements of the group decreased.
The Directors are pleased to declare a final dividend of $0.03 per share in respect of Ordinary shares for the year ended 30 June 2016. The dividend is payable on 8 September 2016 to shareholders registered on the Record Date of 25 August 2016.
Open B
al
Operat
ional
Int. R
eceiv
ed
Sale of
opera
tions
Tax & In
t Exp
Capita
l Retu
rn
Dividen
ds Paid
Capex
Close B
al
20.0
25.0
$ m
illio
n
30.0
35.0
5.0
10.0
0
15.0
40.0
Cash Generation FY1645.0
34.2
6.4
0.7
0.5 0.2
10.5
3.1 0.3
26.7
2010
2011
2012
2013
2014
2015
2016
$’000
Group Revenue
ElectricalTJM
H1H2
H1H2
20,000
0
40,000
80,000
60,000
100,000
120,000
2010
2011
2012
2013
2014
2015
2016
$’000
Group EBIT(Before Net Interest, Impairment)
0
10,000
5,000
15,000
20,000
June2013
June2014
June2015
$’000
June2016
Divisional Working Capital
15,000
10,000
5,000
0
20,000
30,000
25,000
35,000
40,000
FINANCE REVIEW
CMI LIMITED ANNUAL REPORT 20164
ELECTRICAL OPERATIONAL REVIEW
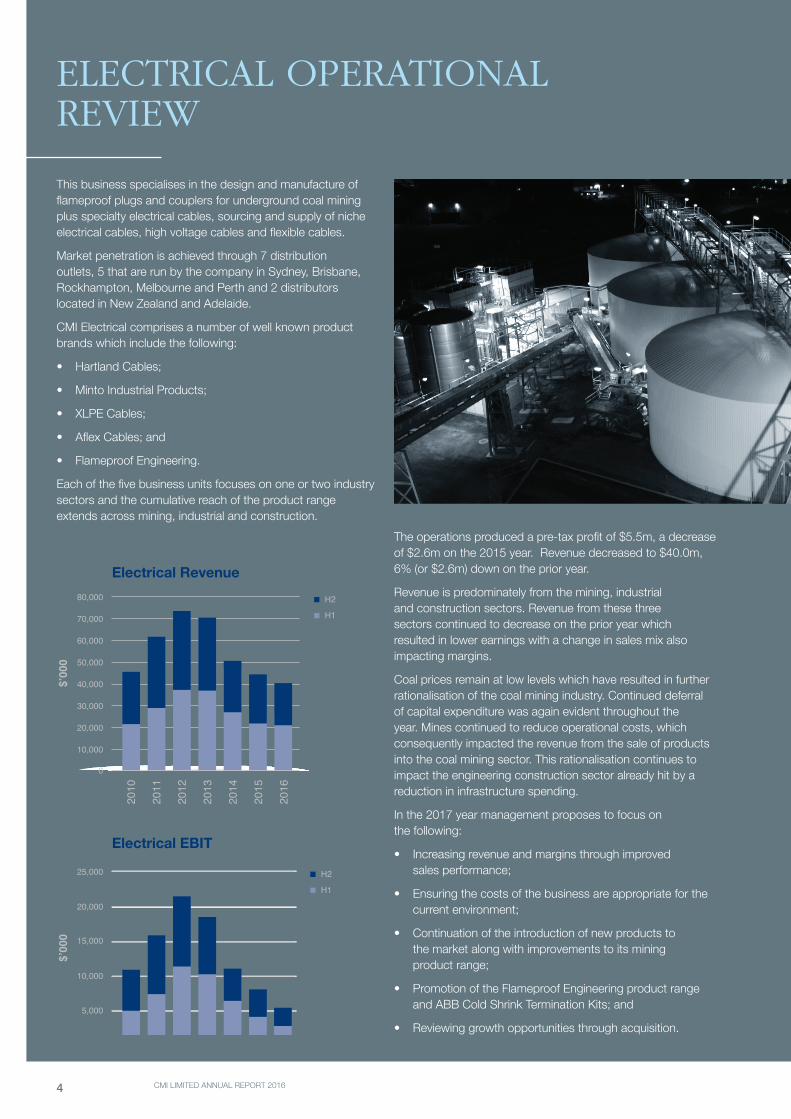
This business specialises in the design and manufacture of flameproof plugs and couplers for underground coal mining plus specialty electrical cables, sourcing and supply of niche electrical cables, high voltage cables and flexible cables.
Market penetration is achieved through 7 distribution outlets, 5 that are run by the company in Sydney, Brisbane, Rockhampton, Melbourne and Perth and 2 distributors located in New Zealand and Adelaide.
CMI Electrical comprises a number of well known product brands which include the following:
• Hartland Cables;
• Minto Industrial Products;
• XLPE Cables;
• Aflex Cables; and
• Flameproof Engineering.
Each of the five business units focuses on one or two industry sectors and the cumulative reach of the product range extends across mining, industrial and construction.
The operations produced a pre-tax profit of $5.5m, a decrease of $2.6m on the 2015 year. Revenue decreased to $40.0m, 6% (or $2.6m) down on the prior year.
Revenue is predominately from the mining, industrial and construction sectors. Revenue from these three sectors continued to decrease on the prior year which resulted in lower earnings with a change in sales mix also impacting margins.
Coal prices remain at low levels which have resulted in further rationalisation of the coal mining industry. Continued deferral of capital expenditure was again evident throughout the year. Mines continued to reduce operational costs, which consequently impacted the revenue from the sale of products into the coal mining sector. This rationalisation continues to impact the engineering construction sector already hit by a reduction in infrastructure spending.
In the 2017 year management proposes to focus on the following:
• Increasing revenue and margins through improved sales performance;
• Ensuring the costs of the business are appropriate for the current environment;
• Continuation of the introduction of new products to the market along with improvements to its mining product range;
• Promotion of the Flameproof Engineering product range and ABB Cold Shrink Termination Kits; and
• Reviewing growth opportunities through acquisition.
2010
2011
2012
2013
2014
2015
2016
$’000
H1
Electrical Revenue
Electrical EBIT
H2
2010
2011
2012
2013
2014
2015
2016
$’000
10,000
0
20,000
30,000
40,000
50,000
60,000
70,000
80,000
5,000
0
10,000
15,000
20,000
25,000
H1
H2

CMI LIMITED ANNUAL REPORT 2016 5
DIRECTORS AND SENIOR MANAGEMENT
Leanne CatelanNon-Executive Director Member Audit Committee Member Remuneration Committee
Leanne Catelan joined the Board in August 2011 as a non-executive director.
Ms Catelan has commercial and management experience within both private and public company structures, including more than 8 years in the Information Technology Industry. Ms Catelan also has experience in the Sports Management Industry, including contract and endorsement negotiations both domestically and internationally. Ms Catelan is a member of the Australian Institute of Company Directors.
Craig GreenNon-Executive Director Member Audit Committee Member Remuneration Committee
Craig Green joined the Board in February 2016 as an independent non-executive director.
Mr Green is a solicitor with more than 35 years’ experience in banking and property law. Mr Green as a lawyer acts primarily for banks and other financial institutions on a range of property, commercial, business and residential transactions.
He has a comprehensive understanding of both sides of large financial and business transactions.
As former Managing Partner of a mid tier national law firm and currently a section leader of a top 10 national law firm, Mr Green has extensive management, marketing and business development experience.
Craig is a former director, Life Member and Fellow of the Mortgage and Finance Association of Australia and member of the Australian Institute of Company Directors.
Steve MiottiNon-Executive Director Member Audit Committee Member Remuneration Committee
Steve Miotti joined the Board in March 2016 as an independent non-executive director.
Steve is a special counsel who has practiced law for over 25 years.
During his years of practice he has developed extensive experience and expertise in the legal practices areas relating to Corporate Advisory, Property, Wills and Estate Planning and Sports Law.
Steve has been a member of a number of committees including the Intellectual Property Sub Committee of the Queensland Law Society and was Chairman of the Appeals Committee for Soccer Queensland.
Sharyn WilliamsChief Financial Officer Company Secretary
Sharyn Williams joined CMI Limited in July 2007 and was appointed Company Secretary and Chief Financial Officer in April 2008.
Ms Williams is an accomplished corporate executive with a strong understanding of a wide variety of industries and operations across multiple geographies.
Ms Williams holds a Masters of Business Administration, Bachelor degrees in Business and Education, is a member of CPA Australia, a Chartered Company Secretary, a Fellow of the Governance Institute and a Graduate Member of the Australian Institute of Company Directors.
Jeff HeslingtonGeneral Manager – Electrical Components Division
Jeff Heslington joined CMI’s Hartland Cables business in 1999. Since then he has focused on strengthening the Electrical Components Division’s product range, including new design development.
Jeff, who is based in Sydney, was appointed General Manager of the Electrical Components Division in 2002. He has over 30 years’ experience in the electrical industry having worked for a range of companies including MM Cables where he was heavily involved in exports and government contracts.
CMI LIMITED ANNUAL REPORT 20166
THE COMPANY REMAINS IN AN
EXTREMELY STRONG POSITION
WITH $27 MILLION CASH ON
HAND. WE CONTINUE TO
INVESTIGATE OTHER BUSINESS
OPPORTUNITIES THAT WILL ADD
SHAREHOLDER VALUE.

CMI LIMITED ANNUAL REPORT 2016 7
08
26
20
27 28
21
25DIRECTORS’ REPORT
STATEMENT OF CHANGES IN EQUITY
INDEPENDENCE DECLARATION BY AUDITORS
CASH FLOW STATEMENT NOTES TO THE CONSOLIDATED
FINANCIAL STATEMENTS
INDEPENDENT AUDITOR’S REPORT
STATEMENT OF FINANCIAL POSITION
FINANCIAL REPORT
23 24DIRECTORS’
DECLARATIONSTATEMENT OF
COMPREHENSIVE INCOME

CMI LIMITED ANNUAL REPORT 20168
DIRECTORS’ REPORT
The directors of CMI Limited submit herewith the annual financial report for the financial year ended 30 June 2016. In order to comply with the provisions of the Corporations Act 2001, the directors report as follows:
The name and particulars of the directors of the company during or since the end of the financial year are:
Name Particulars
Leanne Catelan Non-Executive Director – Appointed 30 August 2011Ms Catelan has commercial and management experience within both private and public company structures, including more than 8 years in the Information Technology Industry. Ms Catelan also has experience in the Sports Management Industry, including contract and endorsement negotiations both domestically and internationally. Leanne is a member of the Australian Institute of Company Directors.During the financial year she attended 10 of the 10 directors’ meetings held, 3 of the 3 audit committee meetings held and 2 of the 2 remuneration committee meetings held.
Craig Green(Independent)
Non-Executive Director – Appointed 18 February 2016Mr Green is a solicitor with more than 35 years’ experience in banking and property law. Mr Green as a lawyer acts primarily for banks and other financial institutions on a range of property, commercial, business and residential transactions. He has a comprehensive understanding of both sides of large financial and business transactions. As former Managing Partner of a mid tier national law firm and currently a section leader of a top 10 national law firm, Mr Green has extensive management, marketing and business development experience.Craig is a former director, Life Member and Fellow of the Mortgage and Finance Association of Australia and member of the Australian Institute of Company Directors.During the financial year he attended 5 of the 5 directors’ meetings he was eligible to attend and 2 of the 2 audit committee meetings he was eligible to attend.
Steven Miotti(Independent)
Non-Executive Director – Appointed 1 March 2016Mr Miotti is a special counsel who has practiced law for over 25 years. During his years of practice he has developed extensive experience and expertise in the legal practices areas relating to Corporate Advisory, Property, Wills and Estate Planning and Sports Law. Steve has been a member of a number of committees including the Intellectual Property Sub Committee of the Queensland Law Society and was Chairman of the Appeals Committee for Soccer Queensland.During the financial year he attended 4 of the 4 directors’ meetings he was eligible to attend and 1 of the 1 audit committee meetings he was eligible to attend.
Jeffrey Forbes(Independent)
Non-Executive Director; Chairman Audit Committee – Appointed 10 April 2014, ceased 29 February 2016Mr Forbes was an Executive Director, CFO and Company Secretary of Cardno Limited, an ASX200 listed company. Prior to joining Cardno, he worked in the mining and resources sector for over 30 years and has extensive listed company experience as an executive director, non-executive director and company secretary as well as strong global financial management and merger and acquisition experience.Jeff has a Bachelor of Commerce, is a Graduate Member of the Australian Institute of Company Directors and a Member of the AusIMM.During the past three years he has also served as a director of the following listed companies: Cardno Limited (appointed 27 January 2016); PWR Holdings Limited (appointed 7 August 2015); Affinity Education Group Limited (appointed 6 November 2013, ceased 15 December 2015); Exoma Energy Limited (appointed 1 July 2014, ceased 27 February 2015 and Talon Petroleum Limited (appointed 4 April 2013, ceased 3 November 2014).During the financial year he attended 6 of the 6 directors’ meetings he was eligible to attend, 2 of the 2 audit committee meetings he was eligible to attend and 2 of the 2 remuneration committee meetings held.

CMI LIMITED ANNUAL REPORT 2016 9
DIRECTORS’ REPORT
Andrew Buckley Executive Chairman; Chairman Remuneration Committee – Appointed 10 April 2014, ceased 31 December 2015Mr Buckley was CEO and Managing Director of Cardno Limited, an ASX200 listed company for 17 years. In addition to managing the company, he spent a considerable amount of time interacting with the investment community, including giving presentations and roadshows, and hosting discussions with industry analysts and shareholders. Mr Buckley has experience in engineering and environmental services to many different industries including oil and gas, mining, private sector development and international development assistance. Mr Buckley also has international experience in North and South America, Africa, UK and Europe. He holds a Bachelor of Engineering (Hons), is a Fellow of the AICD and the Institution Of Engineers Australia.During the past three years he has also served as a director of the following listed company: Cardno Limited (appointed: 24 February 2004, ceased: 1 March 2014).During the financial year he attended 5 of the 5 directors’ meetings he was eligible to attend and 1 of the 1 remuneration committee meetings he was eligible to attend.
Details of directors’ shareholdings as at the date of this report:
Name
Fully PaidOrdinary
Shares
Partly PaidOrdinary
Shares
Employee Performance Share Rights
DirectorShare Options
Leanne Catelan as:
Le Rae Pty Ltd as trustee for the Catcorp Trust (formerly The M&L Trust)
12,420,484 - - -
LJ Catelan Superannuation Fund Pty Ltd as trustee for the Leanne Catelan Superannuation Fund
1,409,316 - - -
Craig Green as:
Opencote Pty Ltd ACN 062 058 566 ATF the Craig Green Superannuation Fund.
10,000 - - -
Steven Miotti: - - - -
Details of Key Management Personnel’s shareholdings as at the date of this report:
Name
Fully PaidOrdinary
Shares
Partly PaidOrdinary
Shares
Employee Performance Share Rights
Jeff L. Heslington - - -
Sharyn R. Williams 3,622 - 270,395
COMPANY SECRETARYSharyn R. WilliamsMs Williams joined CMI Limited in July 2007 and was appointed Chief Financial Officer and Company Secretary in April 2008. She holds a Masters of Business Administration, Bachelor degrees in Business and Education, is a member of CPA Australia, a Fellow member of the Governance Institute, a Chartered Company Secretary and a Graduate Member of the Australian Institute of Company Directors.

CMI LIMITED ANNUAL REPORT 201610
DIRECTORS’ REPORT
PRINCIPAL ACTIVITIESThe consolidated entity’s principal activities in the course of the financial year were the manufacture and marketing of specialist cabling and electrical products for a range of industry sectors.
As at 30 June 2016 the group consists of the Electrical business following the disposal of the TJM division during the prior period.
REVIEW OF OPERATIONSGroup Revenue and ProfitConsolidated revenue for the year from continuing operations was $40.810 million (2015: continuing $43.069 million, discontinuing $21.854 million). Interest revenue for the year was $779 thousand (2015: $413 thousand).
The consolidated entity’s profit before tax was $4.830 million from continuing operations (2015: continuing $7.087 million, discontinuing $0.103 million) and the profit after tax was $3.446 million from continuing operations (2015: continuing $5.151 million, discontinuing $0.299 million). The prior year result includes one-off contributions from the resolution of the CMI Industrial loan receivable of $0.869 million and the finalisation of the TJM divestment which contributed a net gain on disposal of approximately $0.467 million.
The Electrical operations produced a pre-tax profit of $5.463 million, a decrease of $2.612 million on the prior year. Revenue decreased to $40.031 million, 6% (or $2.644 million) down on the prior year.
Revenue is predominately from the Mining, Industrial and Construction sectors. Revenue from these three sectors continued to decrease on the prior year. The decreased sales revenue from these three sectors resulted in lower earnings with a change in sales mix also impacting margins.
Coal prices remain at low levels which have resulted in further rationalisation of the coal mining industry. Continued deferral of capital expenditure was again evident throughout the year. Mines continued to reduce operational costs in both expenditure and labour, which consequently impacted the revenue from the sale of products into the coal mining sector. This rationalisation continues to impact the engineering construction sector already hit by a reduction in infrastructure spending.
The business continues to work on the introduction of new products along with improvements to its existing proprietary product range.
Financial PositionThe group’s working capital position at 30 June 2016 totalled $42.073 million (2015: $51.022 million) consisting of cash of $26.742 million (2015: $34.174 million), receivables of $8.387 million (2015: $9.930 million), inventories of $11.027 million (2015: $12.233 million) and trade payables of $4.083 million (2015: $5.315 million).The group had nil borrowings at 30 June 2015 and 2016.
During the period the group’s cash position decreased by $7.432 million (2015: increased by $27.493 million) with operating cashflows generated of $6.274 million (2015: $9.601 million), investing activities consuming $0.039 million (2015: $20.083 million) and financing activities absorbing $13.667 million (2015: $2.191 million).
The group’s property, plant and equipment assets at 30 June 2016 totalled $0.469 million (2015: $0.568 million) following additions during the period of $27 thousand (2015: $0.379 million), disposals of $7 thousand (2015: $4.531 million) and depreciation expense of $126 thousand (2015: $589 thousand).
The group’s intangible assets, excluding goodwill, at 30 June 2016 totalled $1.969 million (2015: $2.051 million) following additions during the period of $0.276 million (2015: $1.206 million), net disposals of $nil (2015: $2.814 million) and amortisation expense of $357 thousand (2015: $704 thousand).
Shares on issueCMI Limited had 34,852,634 shares on issue at 30 June 2016 (2015: 34,552,634). 300,000 shares were issued during the period (2015: nil) raising $nil (2015: $nil). The share issue is related to the exercise of performance share rights granted in December 2014. CMI Limited has a CMI Limited Performance Right Plan. Under this plan 38,169 share performance rights were issued in the period (2015: 966,847) with nil vested at 30 June 2016 (2015: 300,000). There are 270,395 performance rights remaining at 30 June 2016 (2015: 1,132,226). During the year a capital return of $0.30 per ordinary share was completed, totalling approximately $10.5m. The Australian Taxation Office has issued class ruling CR 2016/4 in relation to the ‘Capital Return’ paid to shareholders on 22 December 2015.
EmployeesThe group employed approximately 55 people at 30 June 2016, a decrease of 11% from the number employed at 30 June 2015. During the year CMI Limited reviewed its staffing and locations to ensure it has the right resources in the right locations to fulfil customer needs. The group has a Performance Rights Plan to incentivise and retain executives and a Paid Parental Leave Scheme as part of the group’s diversity program. Investment continues in the training and development of the group’s human resources.
The General Manager, Jeff Heslington, gave notice on the 18 March 2016 to the Board of his resignation after 16 years’ service. The Board continues discussions with Mr Heslington with respect to his role moving forward. As part of the Board strategy to move the corporate head office to Sydney, the Board gave 12 months’ notice in April 2016 to the CFO.
CMI LIMITED ANNUAL REPORT 2016 11
DIRECTORS’ REPORT
Health and SafetyThe health and safety of CMI’s team members is a priority of the business. The Board and Management are committed to continuous improvement in the implementation, monitoring and correction of the safety system across all workplaces.
Strategy, Prospects and RisksThe group’s operational business strategy is focused on the organic growth of the core business, both domestically and internationally, and the expansion of the current business operations by acquisition if suitable growth opportunities arise. Revenue growth will be driven through increased product ranges and increased distribution channels. The group’s strong financial position and cash position provides the opportunity to support its growth strategy and also look at alternatives to create shareholder value. The Board is considering all options to deliver value to shareholders including potential acquisitions, a broader range of strategic alternatives to create value and/or capital management initiatives.
The Board maintained the dividend payout ratio of approximately 60% and intends to maintain a prudent dividend payout ratio in the future, payable twice per annum.
The risks identified for the group include:
• Exposure to the domestic resource industry impacting revenues and margin;
• The group is a net importer of product and the reducing strength of the Australian dollar poses a risk to the profitability of the group;
• The group has a number of key third party suppliers and interruption to the supply from these suppliers could pose a risk to the business;
• The group is a supplier and designer of products and failure of these products or product designs to meet a specified level of quality or conformance poses a risk to the business;
• Succession and transition following the departure of key management personnel;
• Warranties and indemnities given relating to the TJM divestment;
• Acquisition selection and execution related risks.
The company manages risk by identifying risks and mitigating them through a combination of internal controls and external insurance.
The Independent Director’s Review, Finance Review and Operational Review on pages 2 to 4 provide further details. The Corporate Governance Statement for CMI Limited can be found on the Company’s website at http://www.cmilimited.com.au/Investor-Centre/?page=Corporate-Governance.
FUTURE DEVELOPMENTSInformation on the strategy, prospects and risks of the group is included in the Review of Operations on pages 10 to 11 and the Independent Director’s Review, Finance Review and Operational Review on pages 2 to 4 of this annual report.
SUBSEQUENT EVENTSIn respect of the financial year ended 30 June 2016, the directors recommend the payment of a final dividend to the holders of fully paid ordinary shares of $0.03 per share. The dividend is payable on 8 September 2016 to shareholders registered on the Record Date of 25 August 2016.
There has not been any other matter or circumstance, in the financial statements or notes thereto, that has arisen since the end of the financial year, that has significantly affected, or may significantly affect, the operations of the consolidated entity, the results of those operations, or the state of affairs of the consolidated entity in future financial years.
ENVIRONMENTAL REGULATIONSThe operations are not subject to any particular or significant environmental regulations. The impact on the business is regularly reviewed to ensure it complies with the following areas of environmental regulation: air, water, noise, hazardous chemicals and contaminated land waste.
Appropriate licenses have been obtained where necessary and procedures implemented to ensure that the consolidated entity operates under the conditions imposed by the license or regulation. The operation has an Environmental Management System at the Meadowbank operations and is certified to ISO 14001:2004. During the year, no areas of non-compliance were identified.
INDEMNIFICATION OF OFFICERS AND AUDITORSDuring the financial year, the company paid a premium in respect of a contract insuring the directors of the company (as named above), the company secretary and all executive officers of the company and of any related body corporate against a liability incurred as such a director, secretary or executive officer to the extent permitted by the Corporations Act 2001. The contract of insurance prohibits disclosure of the nature of the liability and the amount of the premium.
To the extent permitted by law, the Company has agreed to indemnify its Directors against a liability incurred as such a director to the extent permitted by the Corporations Act 2001. No payment has been made in relation to that indemnity during or since the financial year.
To the extent permitted by law, the Company has agreed to indemnify its auditors, Ernst & Young, as part of the terms of its audit engagement agreement against claims by third parties

CMI LIMITED ANNUAL REPORT 201612
DIRECTORS’ REPORT
arising from the audit (for an unspecified amount). No payment has been made in relation to that indemnity during or since the financial year.
The company has not otherwise, during or since the financial year, indemnified or agreed to indemnify an officer or auditor of the company or of any related body corporate against an incurred liability as such an officer or auditor.
REMUNERATION REPORT (AUDITED)The remuneration report is set out under the following main headings:
A Principles used to determine the nature and amount of remuneration
B Service agreements
C Details of remuneration
D Share-based compensation
E Key management personnel equity holdings
F Performance history
G Dividends
H Share Price
I Shares Issued
A Principles Used to Determine the Nature and Amount of Remuneration
This remuneration report for the year ended 30 June 2016 outlines the remuneration arrangements of the Group in accordance with the requirements of the Corporations Act 2001 (the Act) and its regulations. This information has been audited as required by section 308(3C) of the Act.
The remuneration report details the remuneration arrangements for key management personnel (KMP) who are defined as those persons having authority and responsibility for planning, directing and controlling the major activities of the Group, directly or indirectly, including any director (whether executive or otherwise) of the Group.
For the purposes of this report, the term “executive” includes the Executive Chairman, executive directors, senior executives, general managers and company secretaries of the Group and the term “director” refers to non-executive directors only.
The remuneration committee reviews the remuneration packages of all directors and executives on an annual basis and makes recommendations to the Board. Remuneration packages are reviewed and determined with due regard to current market rates and are benchmarked against comparable industry salaries, adjusted by a performance factor to reflect changes in the performance of the company.
The objective of the company’s remuneration reward framework is to ensure reward for performance is competitive
and appropriate for the results delivered. The framework aligns reward with achievement of strategic and financial objectives and the creation of wealth for shareholders.
In order to retain and attract executives of sufficient calibre to facilitate the efficient and effective management of the company’s operations, the remuneration committee seeks the advice of external advisers such as accounting, legal and recruitment advisers, in connection with the structure of remuneration packages. Remuneration consultants are not engaged to provide remuneration recommendations.
Over the past 5 years the Group’s earnings before depreciation, interest and tax has declined from $13.187m in 2012 to $5.335m in 2016 (refer to Section F Performance History). This has had an impact on shareholder wealth with the share price reducing from $1.91 in 2012 to $0.895 at 30 June 2016. In order to attract and retain appropriate executive talent to navigate the Group through difficult trading conditions and restore shareholder wealth, the Directors implemented appropriate share based compensation schemes for executives. These schemes, detailed in Section D, included vesting conditions linked to growth in earnings per share and total shareholder returns. The cost of share-based payments relating to these schemes had the effect of increasing executive remuneration between 2012 and 2015 however executive remuneration has decreased substantially in 2016. The Remuneration Committee monitors the relationship between company performance and remuneration and makes appropriate adjustments through both short and long term incentive schemes.
In accordance with the company’s constitution, the total remuneration payable to non-executive directors is not to exceed $390,000 per annum as approved by the shareholders at a general meeting.
Remuneration packages contain the following key elements:
a. Short-term employee benefits – salary/fees, bonuses and non-monetary benefits including the provision of motor vehicles and accommodation;
b. Post-employment benefits – including superannuation;
c. Share-based payment – shares issued during the financial year and share performance rights granted following approval by shareholders on 30 November 2012 and renewed on 25 November 2015 under the Performance Rights Plan, and
d. Long-term benefits – including long service leave.
Short-term employee benefits – directors and key management personnel listed in Section C below are offered a competitive remuneration that comprises the components of base pay and benefits. Base pay for executives is reviewed annually to ensure the executive’s pay is competitive with the market. An executive’s pay is also reviewed on promotion. Specific key management personnel are paid cash bonuses based on performance criteria set at the beginning of the

CMI LIMITED ANNUAL REPORT 2016 13
DIRECTORS’ REPORT
financial year. The performance criteria used to determine the amount of compensation consist of a number of key performance indicators covering both financial and non-financial measures of performance. Typically included measures include revenue, earnings, safety, financial management and leadership. These measures were chosen as they represent the key drivers for the short-term success of the business and provide a framework for delivering long term value.
Management can earn between 0% and 20% of base salary as a performance-related cash bonus based on achieving budgeted financial and other performance-related targets. Typically included measures include revenue, earnings, safety and financial management.
In the 2016 financial year, Andrew Buckley received a performance-related bonus totalling $42 thousand calculated on achieving budgeted financial and performance related targets in the 2016 financial year.
In the 2015 financial year, Andrew Buckley, Stephen O’Brien and Sharyn Williams received performance-related bonuses totalling $562 thousand calculated on achieving budgeted financial and performance related targets in the 2015 financial year with $450 thousand of these bonuses relating to TJM becoming value accretive for the Group as reflected in the increase in earnings between FY14 and FY15 in Section F below.
Other benefits – executives receive benefits including long service leave and superannuation as required by the laws in the various jurisdictions in which the company operates. In certain circumstances, additional benefits (e.g. travel, car parking and accommodation) may also be provided.
Share-based payment – The Company has an ownership-based remuneration scheme for employees. In accordance with the provisions of the scheme, the Board may invite, on terms and conditions the Board determines, employees to apply for share performance rights. Participation in the ownership-based remuneration scheme is determined by the Board. Performance right vesting is linked to performance measures relating to, depending on position, increase in total shareholder return, earnings per share growth, revenue increases, profit maintenance and continuing employment conditions. The exercise price of the share performance rights is determined by the Board.
Further details of the employee incentive scheme are disclosed in the Remuneration Report Section D Share-based compensation and Note 23 to the financial statements.
B Service AgreementsDirectors and executives are employed through contracts for service which contain the following key conditions:
• Reviewed annually on or about 1 July; and
• Require a one to twelve month notice period and have no minimum contract term.
Key Management Personnel Notice Period
J.L. Heslington (General Manager – Electrical Components Division)
6 months (notice period has commenced)
S.R. Williams (Chief Financial Officer/ Company Secretary)
12 months (notice period has commenced)
C Details of RemunerationThe directors of the company and the consolidated entity are detailed below as are the two (2015: three) key management personnel for the year ended 30 June 2016:
KEY MANAGEMENT PERSONNEL
Directors
L.J. Catelan (appointed 30 August 2011)
C.D. Green (appointed 18 February 2016)
S.F. Miotti (appointed 1 March 2016)
Other:
J.L. Heslington (General Manager – Electrical Components Division)
S.R. Williams (Chief Financial Officer/Company Secretary)
The key management personnel of the group for the year ended 30 June 2015 were:
Directors
A.D. Buckley (Executive Chairman, appointed 10 April 2014, ceased 31 December 2015)
J.I. Forbes (appointed 10 April 2014, ceased 29 February 2016)
L.J. Catelan (appointed 30 August 2011)
Other:
J.L. Heslington (General Manager – Electrical Components Division)
S.D. O’Brien (General Manager – TJM Products Division, ceased 2 March 2015)
S.R. Williams (Chief Financial Officer/Company Secretary)
CMI LIMITED ANNUAL REPORT 201614
DIRECTORS’ REPORT
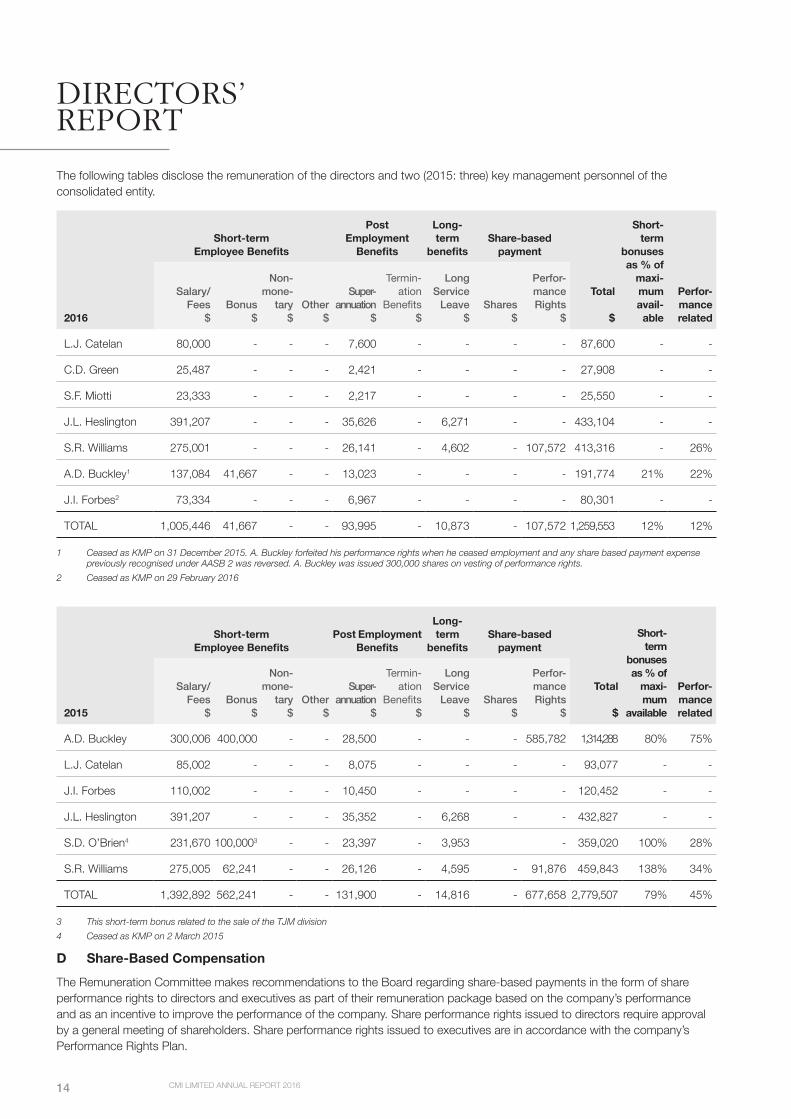
The following tables disclose the remuneration of the directors and two (2015: three) key management personnel of the consolidated entity.
2016
Short-term Employee Benefits
Post Employment
Benefits
Long-term
benefitsShare-based
payment
Total
$
Short-term
bonuses as % of
maxi-mum avail-able
Perfor-mance related
Salary/Fees
$Bonus
$
Non-mone-
tary$
Other$
Super-annuation
$
Termin-ation
Benefits$
Long Service
Leave $
Shares$
Perfor-mance Rights
$
L.J. Catelan 80,000 - - - 7,600 - - - - 87,600 - -
C.D. Green 25,487 - - - 2,421 - - - - 27,908 - -
S.F. Miotti 23,333 - - - 2,217 - - - - 25,550 - -
J.L. Heslington 391,207 - - - 35,626 - 6,271 - - 433,104 - -
S.R. Williams 275,001 - - - 26,141 - 4,602 - 107,572 413,316 - 26%
A.D. Buckley1 137,084 41,667 - - 13,023 - - - - 191,774 21% 22%
J.I. Forbes2 73,334 - - - 6,967 - - - - 80,301 - -
TOTAL 1,005,446 41,667 - - 93,995 - 10,873 - 107,572 1,259,553 12% 12%
1 Ceased as KMP on 31 December 2015. A. Buckley forfeited his performance rights when he ceased employment and any share based payment expense previously recognised under AASB 2 was reversed. A. Buckley was issued 300,000 shares on vesting of performance rights.
2 Ceased as KMP on 29 February 2016
2015
Short-term Employee Benefits
Post Employment Benefits
Long-term
benefitsShare-based
payment
Total
$
Short-term
bonuses as % of
maxi-mum
available
Perfor-mance related
Salary/Fees
$Bonus
$
Non-mone-
tary$
Other$
Super-annuation
$
Termin-ation
Benefits$
Long Service
Leave $
Shares$
Perfor-mance Rights
$
A.D. Buckley 300,006 400,000 - - 28,500 - - - 585,782 1,314,288 80% 75%
L.J. Catelan 85,002 - - - 8,075 - - - - 93,077 - -
J.I. Forbes 110,002 - - - 10,450 - - - - 120,452 - -
J.L. Heslington 391,207 - - - 35,352 - 6,268 - - 432,827 - -
S.D. O’Brien4 231,670 100,0003 - - 23,397 - 3,953 - 359,020 100% 28%
S.R. Williams 275,005 62,241 - - 26,126 - 4,595 - 91,876 459,843 138% 34%
TOTAL 1,392,892 562,241 - - 131,900 - 14,816 - 677,658 2,779,507 79% 45%
3 This short-term bonus related to the sale of the TJM division4 Ceased as KMP on 2 March 2015
D Share-Based CompensationThe Remuneration Committee makes recommendations to the Board regarding share-based payments in the form of share performance rights to directors and executives as part of their remuneration package based on the company’s performance and as an incentive to improve the performance of the company. Share performance rights issued to directors require approval by a general meeting of shareholders. Share performance rights issued to executives are in accordance with the company’s Performance Rights Plan.

CMI LIMITED ANNUAL REPORT 2016 15
DIRECTORS’ REPORT
All share performance rights carry no voting rights, do not entitle the holder to dividends and each share performance right converts into one ordinary share of CMI Limited on exercise. No amounts are paid or payable by the recipient on receipt of the right.
SHARE PERFORMANCE RIGHTS GRANTED TO KEY MANAGEMENT PERSONNEL
There have been 38,169 (2015: 966,847) share performance rights issued in the current financial year. The invitation for 43,282 performance share rights extended to the General Manager – Electrical under the Company’s Performance Rights Plan expired during the period.
2016
Balance at
01/07/15No.
Granted as
compens-ation
No.Exercised
No.
Net other change
No.
Balanceat
30/06/16No.
Balance vested at 30/06/16
No.
Vested but not
exercise-ableNo.
Vested and
exercis-ableNo.
Rights vested during
yearNo.
A.D. Buckley1 900,000 - (300,000) (600,000) - - - - -
S.R. Williams 232,226 38,169 - - 270,395 - - - -
TOTAL 1,132,226 38,169 (300,000) (600,000) 270,395 - - - -
2015
Balance at
01/07/14No.
Granted as
compens-ation
No.
Exercised
No.
Net other change
No.
Balanceat
30/06/15No.
Balance vested at 30/06/15
No.
Vested but not
exercise-ableNo.
Vested and
exercis-ableNo.
Rights vested during
yearNo.
A.D. Buckley - 900,000 - - 900,000 300,000 - 300,000 300,000
S.R. Williams 200,000 32,226 - - 232,226 - - - -
S.D. O’Brien2 250,000 34,621 - (284,621) - - - - -
TOTAL 450,000 966,847 - (284,621) 1,132,226 300,000 - 300,000 300,000
1 Asat30June2016,MrA.D.BuckleywasnolongeranemployeeoftheCMILimitedgroupeffective31December2015
2 Asat30June2015,MrS.D.O’BrienwasnolongeranemployeeoftheCMILimitedgroupeffective2March2015
The Board considered the Capital Return to be a Capital Event under the Company’s Performance Rights Plan because it diminished the value of the Performance Rights that have been issued but not exercised before the ‘ex’ date of the Capital Return. The formula, approved by shareholders on 25 November 2015, to account for this diminution in value, would result in 338,034 ordinary shares issued if the number of performance rights on issue at the end of the period were to vest in the future. The number of performance rights issued is unchanged as a result of the Capital Event.
The following share performance rights were on issue at 30 June 2016:
IndividualIssuing
Entity
Number of Shares
Under Option
Class of Share
Exercise Price
Expiry Date of Perfor-
mance Rights
% Remun-eration
consisting of perfor-
mance rights
during year
S.R. Williams CMI Limited 200,000 Ordinary $0.00 23/01/2018 20%
S.R. Williams CMI Limited 32,226 Ordinary $0.00 16/12/2019 3%
S.R. Williams CMI Limited 38,169 Ordinary $0.00 25/11/2020 3%

CMI LIMITED ANNUAL REPORT 201616
DIRECTORS’ REPORT
The fair value of the performance rights at grant date is outlined in the following table:
Performance Rights Series
Performance Rights Series
Performance Rights Series
Grant Date 25/11/2015 16/12/2014 23/01/2013
Total Value of Rights $49,926 $36,384 $288,000
The vesting conditions attached to the performance rights on issue and inputs to the valuation model are below:
Inputs into the model Performance Rights Series
Grant Date 25/11/2015 16/12/2014 23/01/2013
Share Price $1.47 $1.30 $2.20
Volatility of Share Price N/a N/a 40.0%
Risk Free Rate N/a N/a 2.67%
Dividend yield 4.10% 4.60% 0.00%
Value per Right $1.31 $1.14 $1.44
Rights Outstanding 38,169 32,226 200,000
Total Value of Rights $49,926 $36,834 $288,000
Expiry Date 25/11/20 16/12/19 23/01/18
Review Date 30 June 2018 30 June 2017 30 June 2016
Vesting Conditions The right issued will vest if CMI achieves the following earnings per share (EPS) growth rates at each of the Review Dates: • 10% EPS growth per annum before any
Performance Rights can vest;
• Pro rata vesting of Performance Rights from 10% to 15% EPS growth per annum; and
• 15% EPS growth per annum for the full quantity of Performance Rights to vest.
The EPS growth rate hurdles will be calculated on a cumulative basis at each Review Date having regard to the basic EPS of 10.29 cents for the year ended 30 June 2014 and 11.91 cents for the year ended 30 June 2015.
The right issued will vest if the Company achieves a TSR of 25% over the period from issue to 30 June 2016.
Service Condition Employed with CMI until 30 September 2018
Employed with CMI until 30 September 2017
Employed with CMI until 30 June 2016
Status Unvested Unvested Unvested1
1 The TSR performance hurdle was not met in relation to the 200,000 performance rights with an expiry date of 23/01/2018. The performance rights can be converted at the discretion of the Directors’ up until the expiry date.
THE PERCENTAGE OF REMUNERATION CONSISTING OF PERFORMANCE RIGHTS DURING THE YEAR
The percentage of remuneration consisting of performance rights for directors and key management personnel during the year was 9% (2015: 24%).

CMI LIMITED ANNUAL REPORT 2016 17
DIRECTORS’ REPORT
E Key management personnel equity holdingsFULLY PAID ORDINARY SHARES ISSUED BY CMI LIMITED
2016
Balance at 01/07/15
No.
Granted as compen-
sationNo.
Received on exercise
of optionsNo.
Net other change
No.
Balance at 30/06/16
No.
Balance held
nominallyNo.
L.J. Catelan 13,150,701 - - 679,099 13,829,800 -
C.D. Green - - - 10,000 10,000 -
S.F. Miotti - - - - - -
S.R. Williams 3,622 - - - 3,622 -
J.L. Heslington - - - - - -
A.D. Buckley2 226,964 300,000 - (526,964) - -
J.I. Forbes 5,000 - - (5,000) - -
TOTAL 13,386,287 300,000 - 157,135 13,843,422 -
2015
Balance at 01/07/14
No.
Granted as compen-
sation
No.
Received on exercise
of optionsNo.
Net other change
No.
Balance at 30/06/15
No.
Balance held
nominallyNo.
L.J. Catelan 13,150,701 - - - 13,150,701 -
S.R. Williams 3,622 - - - 3,622 -
J.L. Heslington - - - - - -
A.D. Buckley 50,000 - - 176,964 226,964 -
J.I. Forbes 5,000 - - - 5,000 -
S.D. O’Brien1 - - - - - -
TOTAL 13,209,323 - - 176,964 13,386,287 -
1 Asat30June2015,MrS.D.O’BrienwasnolongeranemployeeoftheCMILimitedgroupeffective2March2015
2 Asat30June2016,MrA.D.BuckleywasnolongeranemployeeoftheCMILimitedgroupeffective31December2015
CMI LIMITED ANNUAL REPORT 201618
DIRECTORS’ REPORT
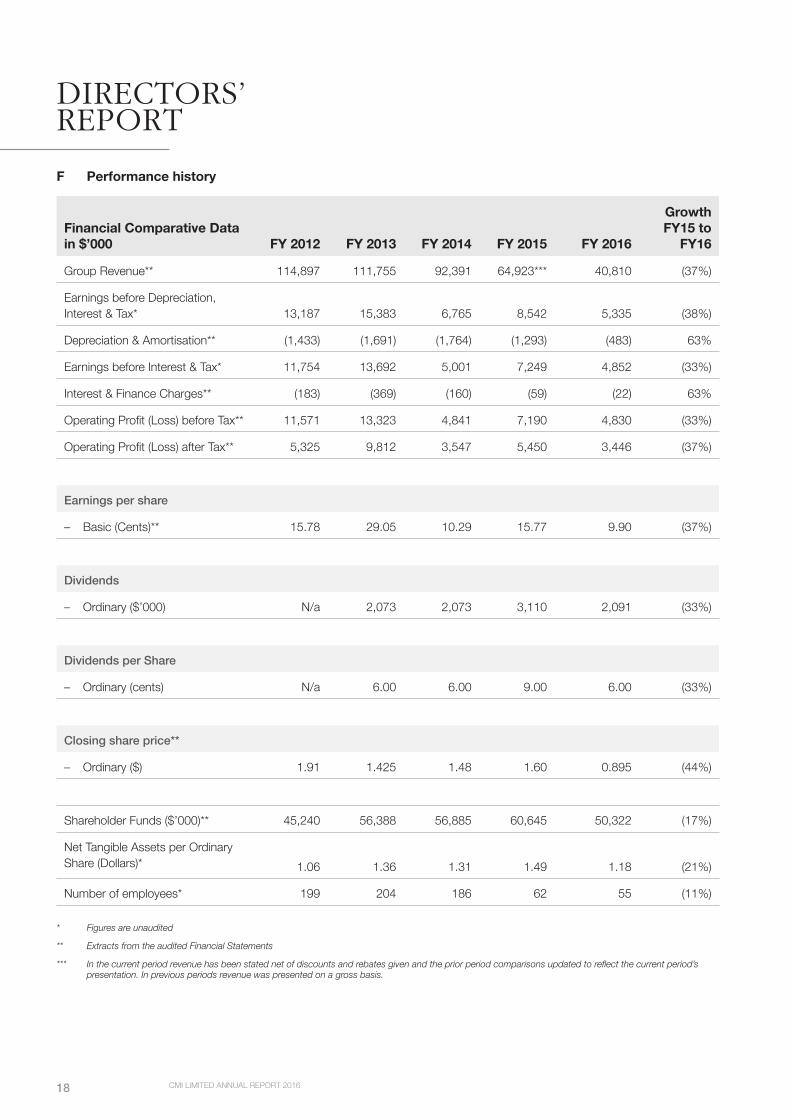
F Performance history
Financial Comparative Data in $’000 FY 2012 FY 2013 FY 2014 FY 2015 FY 2016
GrowthFY15 to
FY16
Group Revenue** 114,897 111,755 92,391 64,923*** 40,810 (37%)
Earnings before Depreciation, Interest & Tax* 13,187 15,383 6,765 8,542 5,335 (38%)
Depreciation & Amortisation** (1,433) (1,691) (1,764) (1,293) (483) 63%
Earnings before Interest & Tax* 11,754 13,692 5,001 7,249 4,852 (33%)
Interest & Finance Charges** (183) (369) (160) (59) (22) 63%
Operating Profit (Loss) before Tax** 11,571 13,323 4,841 7,190 4,830 (33%)
Operating Profit (Loss) after Tax** 5,325 9,812 3,547 5,450 3,446 (37%)
Earnings per share
– Basic (Cents)** 15.78 29.05 10.29 15.77 9.90 (37%)
Dividends
– Ordinary ($’000) N/a 2,073 2,073 3,110 2,091 (33%)
Dividends per Share
– Ordinary (cents) N/a 6.00 6.00 9.00 6.00 (33%)
Closing share price**
– Ordinary ($) 1.91 1.425 1.48 1.60 0.895 (44%)
Shareholder Funds ($’000)** 45,240 56,388 56,885 60,645 50,322 (17%)
Net Tangible Assets per Ordinary Share (Dollars)* 1.06 1.36 1.31 1.49 1.18 (21%)
Number of employees* 199 204 186 62 55 (11%)
* Figures are unaudited
** Extracts from the audited Financial Statements
*** Inthecurrentperiodrevenuehasbeenstatednetofdiscountsandrebatesgivenandthepriorperiodcomparisonsupdatedtoreflectthecurrentperiod’spresentation. In previous periods revenue was presented on a gross basis.

CMI LIMITED ANNUAL REPORT 2016 19
DIRECTORS’ REPORT
G DividendsAll dividends stated below are whole numbers and are not rounded to the nearest thousand dollars.
In respect of the financial year ended 30 June 2016, the directors recommend the payment of a final dividend to the holders of fully paid ordinary shares of $0.03 per share. The dividend is payable on 8 September 2016 to shareholders registered on the Record Date of 25 August 2016. The interim dividend of $0.03 per share was paid on 14 March 2016.
In respect of the financial year ended 30 June 2015, the directors recommended the payment of a final dividend to the holders of fully paid ordinary shares of $0.06 per share. The dividend was paid on 18 September 2015 to shareholders registered on the Record Date of 4 September 2015. The interim dividend of $0.03 per share was paid on 23 March 2015.
H Share priceThe closing market share price per ordinary share at market close on 30 June 2016 was $0.895 (30 June 2015: $1.60).
I Shares issuedThere were 300,000 ordinary shares issued, relating to exercised share performance rights or options, during the year (2015: Nil).
NON-AUDIT SERVICESThe directors are satisfied that the provision of non-audit services, during the year, by the auditor (or by another person or firm on the auditor’s behalf) is compatible with the general standard of independence for auditors imposed by the Corporations Act 2001. Details of amounts paid or payable for non-audit services provided during the year by the auditor are outlined in Note 25 to the financial statements.
INDEPENDENCE DECLARATION BY AUDITORSThe auditor’s independence declaration is included on page 20.
ROUNDING OFF OF AMOUNTSThe company is a company of the kind referred to in ASIC Class Order 2016/191, dated 24 March 2016, and in accordance with that Class Order amounts in the Directors’ Report and the Financial Report have been rounded off to the nearest thousand dollars, unless otherwise stated.
Signed in accordance with a resolution of the directors made pursuant to section 298(2) of the Corporations Act 2001.
On behalf of the Directors
C. Green Independent Director
BRISBANE Dated: 18 August 2016

CMI LIMITED ANNUAL REPORT 201620
AUDITOR’S INDEPENDENCE DECLARATION TO THE DIRECTORS OF CMI LIMITED
A member firm of Ernst & Young Global LimitedLiability limited by a scheme approved under Professional Standards Legislation
Ernst & Young111 Eagle StreetBrisbane QLD 4000 AustraliaGPO Box 7878 Brisbane QLD 4001
Tel: +61 7 3011 3333Fax: +61 7 3011 3100ey.com/au
Auditor’s Independence Declaration to the Directors of CMI Limited
As lead auditor for the audit of CMI Limited for the financial year ended 30 June 2016, I declare to thebest of my knowledge and belief, there have been:
a) no contraventions of the auditor independence requirements of the Corporations Act 2001 inrelation to the audit; and
b) no contraventions of any applicable code of professional conduct in relation to the audit.
This declaration is in respect of CMI Limited and the entities it controlled during the financial year.
Ernst & Young
Alison de GrootPartner18 August 2016

CMI LIMITED ANNUAL REPORT 2016 21
INDEPENDENT AUDITOR’S REPORT TO THE MEMBERS OF CMI LIMITED
A member firm of Ernst & Young Global LimitedLiability limited by a scheme approved under Professional Standards Legislation
Ernst & Young111 Eagle StreetBrisbane QLD 4000 AustraliaGPO Box 7878 Brisbane QLD 4001
Tel: +61 7 3011 3333Fax: +61 7 3011 3100ey.com/au
Independent auditor's report to the members of CMI Limited
Report on the financial report
We have audited the accompanying financial report of CMI Limited, which comprises the consolidatedstatement of financial position as at 30 June 2016, the consolidated statement of comprehensiveincome, the consolidated statement of changes in equity and the consolidated statement of cash flowsfor the year then ended, notes comprising a summary of significant accounting policies and otherexplanatory information, and the directors' declaration of the consolidated entity comprising thecompany and the entities it controlled at the year's end or from time to time during the financial year.
Directors' responsibility for the financial report
The directors of the company are responsible for the preparation of the financial report that gives atrue and fair view in accordance with Australian Accounting Standards and the Corporations Act 2001and for such internal controls as the directors determine are necessary to enable the preparation ofthe financial report that is free from material misstatement, whether due to fraud or error. In Note 1,the directors also state, in accordance with Accounting Standard AASB 101 Presentation of FinancialStatements, that the financial statements comply with International Financial Reporting Standards.
Auditor's responsibility
Our responsibility is to express an opinion on the financial report based on our audit. We conductedour audit in accordance with Australian Auditing Standards. Those standards require that we complywith relevant ethical requirements relating to audit engagements and plan and perform the audit toobtain reasonable assurance about whether the financial report is free from material misstatement.
An audit involves performing procedures to obtain audit evidence about the amounts and disclosuresin the financial report. The procedures selected depend on the auditor's judgment, including theassessment of the risks of material misstatement of the financial report, whether due to fraud orerror. In making those risk assessments, the auditor considers internal controls relevant to the entity'spreparation and fair presentation of the financial report in order to design audit procedures that areappropriate in the circumstances, but not for the purpose of expressing an opinion on theeffectiveness of the entity's internal controls. An audit also includes evaluating the appropriateness ofaccounting policies used and the reasonableness of accounting estimates made by the directors, aswell as evaluating the overall presentation of the financial report.
We believe that the audit evidence we have obtained is sufficient and appropriate to provide a basisfor our audit opinion.
Independence
In conducting our audit we have complied with the independence requirements of the CorporationsAct 2001. We have given to the directors of the company a written Auditor’s IndependenceDeclaration, a copy of which is included in the directors’ report.

CMI LIMITED ANNUAL REPORT 201622
INDEPENDENT AUDITOR’S REPORT TO THE MEMBERS OF CMI LIMITED
A member firm of Ernst & Young Global LimitedLiability limited by a scheme approved under Professional Standards Legislation
OpinionIn our opinion:
a. the financial report of CMI Limited is in accordance with the Corporations Act 2001,including:i giving a true and fair view of the consolidated entity's financial position as at 30 June
2016 and of its performance for the year ended on that date; andii complying with Australian Accounting Standards and the Corporations Regulations
2001; andb. the financial report also complies with International Financial Reporting Standards as
disclosed in Note 1.
Report on the remuneration report
We have audited the Remuneration Report included in the directors' report for the year ended 30June 2016. The directors of the company are responsible for the preparation and presentation of theRemuneration Report in accordance with section 300A of the Corporations Act 2001. Ourresponsibility is to express an opinion on the Remuneration Report, based on our audit conducted inaccordance with Australian Auditing Standards.
OpinionIn our opinion, the Remuneration Report of CMI Limited for the year ended 30 June 2016, complieswith section 300A of the Corporations Act 2001.
Ernst & Young
Alison de GrootPartnerBrisbane18 August 2016

CMI LIMITED ANNUAL REPORT 2016 23
DIRECTORS’ DECLARATIONFOR THE FINANCIAL YEAR ENDED 30 JUNE 2016
In accordance with a resolution of the directors of CMI Limited, I state that:
In the opinion of the directors:
(a) the financial statements and notes of the consolidated entity are in accordance with the Corporations Act 2001, including:
(i) giving a true and fair view of the consolidated entity’s financial position as at 30 June 2016 and of its performance for the year ended on that date; and
(ii) complying with Australian Accounting Standards (including the Australian Accounting Interpretations) and the Corporations Regulations 2001;
(b) the financial statements and notes also comply with International Financial Reporting Standards as disclosed in Note 1; and
(c) there are reasonable grounds to believe that the company will be able to pay its debts as and when they become due and payable.
(d) this declaration has been made after receiving the declarations required to be made to the Directors in accordance with section 295A of the Corporations Act 2001 for the financial year ending 30 June 2016.
(e) as at the date of this declaration, there are reasonable grounds to believe that the members of the Closed Group identified in Note 28 will be able to meet any obligations or liabilities to which they are or may become subject, by virtue of the Deed of Cross-Guarantee.
On behalf of the Board
C. Green Independent Director
BRISBANE 18 August 2016

CMI LIMITED ANNUAL REPORT 201624
CONSOLIDATED STATEMENT OF COMPREHENSIVE INCOMEFOR THE FINANCIAL YEAR ENDED 30 JUNE 2016
Continuing Operations NOTE2016$’000
2015$’000
Revenue 2(a) 40,810 43,069Other income 2(a) 74 149Changes in inventories (1,206) (2,452)Raw materials expense (24,344) (23,254)Employee benefits expense (5,687) (6,966)Repairs, maintenance and consumables expense (252) (250)Occupancy expense (1,970) (1,858)Travel and communication expense (311) (278)Freight and cartage expense (645) (682)Depreciation and amortisation expense (483) (185)Finance costs (22) (58)Reversal of Impairment expense 7 - 869Other expenses (1,134) (1,017)Profit from continuing operations before income tax expense 3(a) 4,830 7,087
Income tax 3 (1,384) (1,936)
Profit/(Loss) from continuing operations after income tax expense 3,446 5,151
Discontinued OperationsProfit/(Loss) from discontinued operations net of income tax 14(b) - 299
Profit/(Loss) for the year 3,446 5,450
Other comprehensive incomeItems that may be reclassified subsequently to profit or loss:Foreign currency translation - 454Transfer on disposal - (669)
Other comprehensive income for the year, net of tax - (215)
TOTAL COMPREHENSIVE INCOME FOR THE YEAR 3,446 5,235
Profit/(Loss) for the year is attributable to the owners of the parent 3,446 5,450
Total comprehensive income for the year is attributable to the owners of the parent 3,446 5,235
Earnings Per Share:From continuing and discontinuing operations: Basic (cents per share) 21 9.90 15.77Diluted (cents per share) 21 9.83 15.46
From continuing operations: Basic (cents per share) 21 9.90 14.91Diluted (cents per share) 21 9.83 14.61
Notes to the financial statements are included on pages 28 to 68.

CMI LIMITED ANNUAL REPORT 2016 25
NOTE2016$’000
2015$’000
CURRENT ASSETSCash and cash equivalents 29(a) 26,742 34,174Trade and other receivables 4 8,387 9,930Inventories 5 11,027 12,233Current tax assets 3(b) - 253
TOTAL CURRENT ASSETS 46,156 56,590
NON-CURRENT ASSETSProperty, plant and equipment 8 469 568Goodwill 9(a) 7,192 7,192Other intangible assets 10 1,969 2,051Deferred tax assets 3(c) 76 395
TOTAL NON-CURRENT ASSETS 9,706 10,206
TOTAL ASSETS 55,862 66,796
CURRENT LIABILITIESTrade and other payables 11 4,083 5,315Current tax liabilities 3(b) 566 -Provisions 13 853 727
TOTAL CURRENT LIABILITIES 5,502 6,042
NON-CURRENT LIABILITIESProvisions 15 38 109
TOTAL NON-CURRENT LIABILITIES 38 109
TOTAL LIABILITIES 5,540 6,151
NET ASSETS 50,322 60,645
EQUITYIssued capital 18 28,520 38,555Reserves 19 6,685 7,282Retained earnings 20 15,117 14,808
TOTAL EQUITY 50,322 60,645
Notes to the financial statements are included on pages 28 to 68.
CONSOLIDATED STATEMENT OF FINANCIAL POSITIONAS AT 30 JUNE 2016

CMI LIMITED ANNUAL REPORT 201626
CONSOLIDATED STATEMENT OF CHANGES IN EQUITYFOR THE FINANCIAL YEAR ENDED 30 JUNE 2016
Issued Capital
$’000Reserves
$’000
Retained Earnings
$’000
Total Equity$’000
At 1 July 2014 38,555 6,900 11,430 56,885
Profit/(Loss) for the period - - 5,450 5,450
Foreign exchange differences on discontinued operation - 454 - 454
Transfer on disposal of discontinued operation - (669) - (669)
Total comprehensive income for the year - (215) 5,450 5,235
Transactions with owners in their capacity as owners - - - -
Cash Dividends - - (2,072) (2,072)
Share-based payments - 597 - 597
Balance at 1 July 2015 38,555 7,282 14,808 60,645
Profit/(Loss) for the period - - 3,446 3,446
Total comprehensive income for the year - - 3,446 3,446
Transactions with owners in their capacity as owners
Cash Dividends - - (3,137) (3,137)
Return of capital (10,455) - - (10,455)
Return of capital costs (75) - - (75)
Exercise of performance rights 495 (495) - -
Share-based payments - (102) - (102)
At 30 June 2016 28,520 6,685 15,117 50,322
Notes to the financial statements are included on pages 28 to 68.

CMI LIMITED ANNUAL REPORT 2016 27
NOTE
2016$’000
Inflow(Outflow)
2015$’000
Inflow(Outflow)
Cash flows from operating activities:
Receipts from customers (inclusive of GST) 48,708 78,854
Payments to suppliers (inclusive of GST) and employees (42,193) (69,231)
Interest paid (22) (58)
Income tax (paid)/refunded (219) 36
Net cash provided by/(used in) operating activities 29(b) 6,274 9,601
Cash flows from investing activities:
Interest received 779 413
Payments for other intangible assets (276) (1,206)
Payments for plant and equipment (27) (333)
Proceeds from sale of plant and equipment - 99
(Payments associated with)/Proceeds from disposal of business 14(c) (515) 21,110
Net cash (used in)/provided by investing activities (39) 20,083
Cash flows from financing activities:
Dividends paid (3,137) (2,072)
Payment for capital return (10,530) -
Payment of finance liabilities - (119)
Net cash provided by/(used in) financing activities (13,667) (2,191)
Net increase/(decrease) in cash and cash equivalents held (7,432) 27,493
Cash and cash equivalents at the beginning of the financial year 34,174 6,681
Cash and cash equivalents at the end of the financial year 29(a) 26,742 34,174
Notes to the financial statements are included on pages 28 to 68.
CONSOLIDATED CASH FLOW STATEMENTFOR THE FINANCIAL YEAR ENDED 30 JUNE 2016

CMI LIMITED ANNUAL REPORT 201628
NOTES TO THE CONSOLIDATED FINANCIAL STATEMENTSFOR THE FINANCIAL YEAR ENDED 30 JUNE 2016
1. SUMMARY OF ACCOUNTING POLICIES
Statement of ComplianceThe financial report is a general purpose financial report which has been prepared in accordance with the Corporations Act 2001, Australian Accounting Standards and Interpretations, and complies with other requirements of the law. The financial report includes the consolidated financial statements of the Group. Compliance with the Australian Accounting Standards ensures that the financial statements and notes of the financial report also complies with International Financial Reporting Standards (‘IFRS’). The entity is a for-profit entity for the purposes of preparing the financial statements.
The financial statements were authorised for issue by the directors on 18 August 2016.
Basis of PreparationThe financial report has been prepared on the basis of historical cost. Cost is based on the fair values of the consideration given in exchange for assets. All amounts are presented in Australian dollars, unless otherwise noted.
The company is a company of the kind referred to in ASIC Class Order 2016/191, dated 24 March 2016, and in accordance with that Class Order amounts in the Directors’ Report and the Financial Report have been rounded off to the nearest thousand dollars, unless otherwise stated.
In the application of CMI Limited (“Group”) accounting policies, management is required to make judgements, estimates and assumptions about carrying values of assets and liabilities that are not readily apparent from other sources. The estimates and associated assumptions are based on historical experience and various other factors that are believed to be reasonable under the circumstance, the results of which form the basis of making the judgements. Actual results may differ from these estimates. The estimates and underlying assumptions are reviewed on an ongoing basis. Revisions to accounting estimates are recognised in the period in which the estimate is revised if the revision only affects that period, or in the period of the revision and future periods if the revision affects both current and future periods.
Judgements made by management in the application of the Group’s accounting policies that have significant effects on the financial statements and estimates with a significant risk of material adjustments in the next year are disclosed, where applicable, in the relevant notes to the financial statements.
Accounting policies are selected and applied in a manner which ensures that the resulting financial information satisfies the concepts of relevance and reliability, thereby ensuring that the substance of the underlying transactions or other events is reported.
The following significant accounting policies have been adopted in the preparation and presentation of the
financial report.
Prior period comparatives have been adjusted where required to meet current year presentation format. The results of discontinued operations are presented separately on the face of the Statement of Comprehensive Income, and the assets and liabilities are presented separately on the face of the Statement of Financial Position.
The financial report has been prepared on a going concern basis.
Significant Accounting PoliciesA) BORROWINGS
Borrowings are recorded initially at fair value, net of transaction costs. Subsequent to initial recognition, borrowings are measured at amortised cost with any difference between the initial recognised amount and the redemption value being recognised in profit and loss over the period of the borrowing using the effective interest rate method.
B) BORROWING COSTS
Borrowing costs directly attributable to qualifying assets are capitalised and amortised over the life of the asset. All other borrowing costs are expensed when incurred.
C) CASH AND CASH EQUIVALENTS
Cash and cash equivalents comprise cash on hand, cash in banks and investments in money market instruments, net of outstanding bank overdrafts. Bank overdrafts are shown within borrowings in current liabilities in the Statement of Financial Position.
D) EMPLOYEE BENEFITS
Provision is made for benefits accruing to employees in respect of wages and salaries, annual leave and long service leave when it is probable that settlement will be required and they are capable of being measured reliably.
Provisions made in respect of employee benefits expected to be settled within 12 months, are measured at their nominal values using the remuneration rate expected to apply at the time of settlement.
Provisions made in respect of employee benefits which are not expected to be settled within 12 months are measured as the present value of the estimated future cash outflows to be made by the consolidated entity in respect of services provided by employees up to the reporting date.
Contributions to defined contribution superannuation plans are expensed when incurred.
E) FINANCIAL ASSETS AND LIABILITIES
Subsequent to initial recognition, investments in subsidiaries are measured at cost.
Other financial assets are classified into the following specified categories: financial assets at fair value through profit or

CMI LIMITED ANNUAL REPORT 2016 29
loss, held-to-maturity investments, available-for-sale financial assets, investments in subsidiaries and loans and receivables. The classification depends on the nature and purpose of the financial assets and is determined at the time of the initial recognition.
The fair values of financial assets that are actively traded in organised financial markets are determined by reference to quoted market bid prices at the close of business on the reporting date. For financial assets with no active market, fair values are determined using valuation techniques. Such techniques include: using recent arm’s length market transactions; reference to the current market value of another instrument that is substantially the same; discounted cash flow analysis; and option pricing models, making as much use of available and supportable market data as possible and keeping judgemental inputs to a minimum.
Financial assets at fair value through profit or loss
Financial assets are classified as financial assets at fair value through profit or loss where the financial asset:
• has been acquired principally for the purpose of selling in the near future;
• is a part of an identified portfolio of financial instruments that the Group manages together and has a recent actual pattern of short-term profit-taking; or
• is a derivative instrument that is not designated and effective as a hedging instrument.
Financial assets at fair value through profit or loss are stated at fair value, with any resultant gain or loss recognised in profit or loss. The net gain or loss recognised in profit or loss incorporates any dividend or interest earned on the financial asset.
Financial liabilities at fair value through profit or loss
Financial liabilities at fair value through the profit and loss include financial liabilities held for trading and financial liabilities designated upon initial recognition as at fair value through profit and loss.
Financial liabilities are classified as held for trading if they are acquired or incurred for the purpose of selling or repurchasing in the near term. This category also includes derivative financial instruments entered into by the Group that are not designated as hedging instruments in hedge relationships as defined by AASB 139. Separated embedded derivatives are also classified as held for trading unless they are designated as effective hedging instruments.
Gains or losses on liabilities held for trading are recognised in the Statement of Profit and Loss.
Financial liabilities designated upon initial recognition at fair value through profit and loss are designated at the initial date of recognition, and only if the criteria in AASB 139 are satisfied.
Derecognition
A financial asset (or, where applicable, a part of a financial asset or part of a group of similar financial assets) is primarily derecognised (i.e., removed from the group’s consolidated Statement of Financial Position) when:
• The rights to receive cash flows from the asset have expired, or
• The Group has transferred its rights to receive cash flows from the asset or has assumed an obligation to pay the received cash flows in full without material delay to a third party under a ’pass-through’ arrangement; and either (a) the Group has transferred substantially all the risks and rewards of the asset, or (b) the Group has neither transferred nor retained substantially all the risks and rewards of the asset, but has transferred control of the asset.
When the Group has transferred its rights to receive cash flows from an asset or has entered into a pass through arrangement, it evaluates if and to what extent it has retained the risks and rewards of ownership. When it has neither transferred nor retained substantially all of the risks and rewards of the asset, nor transferred control of the asset, the Group continues to recognise the transferred asset to the extent of the Group’s continuing involvement. In that case, the Group also recognises an associated liability. The transferred asset and the associated liability are measured on a basis that reflects the rights and obligations that the Group has retained.
Continuing involvement that takes the form of a guarantee over the transferred asset is measured at the lower of the original carrying amount of the asset and the maximum amount of consideration that the Group could be required to repay.
A financial liability is derecognised when the obligation under the liability is discharged or cancelled, or expires. When an existing financial liability is replaced by another from the same lender on substantially different terms, or the terms of an existing liability are substantially modified, such an exchange or modification is treated as the derecognition of the original liability and the recognition of a new liability. The difference in the respective carrying amounts is recognised in the Statement of Profit and Loss.
Loans and receivables
Trade receivables, loans and other receivables are recorded at amortised cost using the effective interest rate method less impairment. Gains and losses are recognised in profit or loss when the loans and receivables are derecognised or impaired. These are included in current assets, except for those with maturities greater than 12 months after balance date, which are classified as non-current.
CMI LIMITED ANNUAL REPORT 201630
NOTES TO THE CONSOLIDATED FINANCIAL STATEMENTSFOR THE FINANCIAL YEAR ENDED 30 JUNE 2016
F) FINANCIAL INSTRUMENTS ISSUED BY THE COMPANY
Debt and Equity Instruments
Debt and equity instruments are classified as either liabilities or as equity in accordance with the substance of the contractual arrangement.
Compound Instruments
The component parts of compound instruments are classified separately as liabilities and equity in accordance with the substance of the contractual arrangement. At the date of issue, the fair value of the liability component is estimated using the prevailing market interest rate for a similar non-convertible debt. The equity component initially brought to account is determined by deducting the amount of the liability component from the amount of the compound instrument as a whole.
Transaction Costs on the Issue of Equity Instruments
Transaction costs arising on the issue of equity instruments are recognised directly in equity as a reduction of the proceeds of the equity instruments to which the costs relate. Transaction costs are the costs that are incurred directly in connection with the issue of those equity instruments and which would not have been incurred had those instruments not been issued.
Interest and Dividends
Interest and dividends are classified as expenses or as distributions of profit consistent with the Statement of Financial Position classification of the related debt or equity instruments.
G) FOREIGN CURRENCY
Foreign currency transactions
All foreign currency transactions during the year are brought to account using the exchange rate in effect at the date of the transaction. Foreign currency monetary items at reporting date are translated at the exchange rate existing at that date. Non-monetary assets and liabilities carried at fair value that are denominated in foreign currencies are translated at the rates prevailing at the date when the fair value was determined.
Exchange differences are recognised in net profit or loss in the period in which they arise.
H) GOODS AND SERVICES TAX
Revenues, expenses and assets are recognised net of the amount of goods and services tax (GST), except:
where the amount of GST incurred is not recoverable from the taxation authority, it is recognised as part of the cost of acquisition of an asset or as part of an item of expense; or
for receivables and payables which are recognised inclusive of GST.
The net amount of GST recoverable from, or payable to, the taxation authority is included as part of receivables or payables.
Cash flows are included in the Statement of Cash Flows on a gross basis. The GST component of cash flows arising from investing and financing activities which is recoverable from, or payable to, the taxation authority is classified as operating cash flows.
I) GOODWILL
Goodwill, representing the excess of the cost of acquisition over the fair value of the identifiable assets, liabilities and contingent liabilities acquired, is recognised as an asset and not amortised, but tested for impairment annually and whenever there is an indication that the goodwill may be impaired. Any impairment is recognised immediately in profit and loss and is not subsequently reversed. Refer to Note 1(j).
J) IMPAIRMENT OF ASSETS
At each reporting date, the consolidated entity reviews the carrying amounts of its tangible and intangible assets to determine whether there is any indication that those assets have suffered an impairment loss. If any such indication exists, the recoverable amount of the asset is estimated in order to determine the extent of the impairment loss (if any). Where the asset does not generate cash flows that are independent from other assets, the consolidated entity estimates the recoverable amount of the cash-generating unit to which the asset belongs.
Goodwill, intangible assets with indefinite useful lives and intangible assets not yet available for use are tested for impairment annually and whenever there is an indication that the asset may be impaired. An impairment of goodwill is not subsequently reversed. Recoverable amount is the higher of fair value less costs to sell and value in use. In assessing value in use, the estimated future cash flows are discounted to their present value using a pre-tax discount rate that reflects current market assessments of the time value of money and the risks specific to the asset for which the estimates of future cash flows have not been adjusted.
If the recoverable amount of an asset (or cash-generating unit) is estimated to be less than its carrying amount, the carrying amount of the asset (cash-generating unit) is reduced to its recoverable amount. An impairment loss is recognised in profit or loss immediately, unless the relevant asset is carried at fair value, in which case the impairment loss is treated as a revaluation decrease.
Where an impairment loss subsequently reverses, the carrying amount of the asset (cash-generating unit) is increased to the revised estimate of its recoverable amount, but only to the extent that the increased carrying amount does not exceed the carrying amount that would have been determined had no impairment loss been recognised for the asset (cash-generating unit) in prior years. A reversal of an impairment loss is recognised in profit or loss immediately, unless the relevant asset is carried at fair value, in which case the reversal of the impairment loss is treated as a revaluation increase.

CMI LIMITED ANNUAL REPORT 2016 31
Impairment losses recognised for goodwill are not subsequently reversed.
K) INCOME TAX
Current Tax
Current tax is calculated by reference to the amount of income taxes payable or recoverable in respect of the taxable profit or tax loss for the period. It is calculated using tax rates and tax laws that have been enacted or substantively enacted by reporting date. Current tax for current and prior periods is recognised as a liability (or asset) to the extent that it is unpaid (or refundable).
Deferred Tax
Deferred tax is accounted for using the balance sheet liability method in respect of temporary differences arising from differences between the carrying amount of assets and liabilities in the financial statements and the corresponding tax base of those items.
In principle, deferred tax liabilities are recognised for all taxable temporary differences. Deferred tax assets are recognised to the extent that it is probable that sufficient taxable amounts will be available against which deductible temporary differences or unused tax losses and tax offsets can be utilised. However, deferred tax assets and liabilities are not recognised if the temporary differences giving rise to them arise from the initial recognition of assets and liabilities (other than as a result of a business combination) which affects neither taxable income nor accounting profit. Furthermore, a deferred tax liability is not recognised in relation to taxable temporary differences arising from goodwill.
Deferred tax liabilities are recognised for taxable temporary differences arising on investments in subsidiaries, branches, associates and joint ventures except where the consolidated entity is able to control the reversal of the temporary differences and it is probable that the temporary differences will not reverse in the foreseeable future. Deferred tax assets arising from deductible temporary differences associated with these investments and interests are only recognised to the extent that it is probable that there will be sufficient taxable profits against which to utilise the benefits of the temporary differences and they are expected to reverse in the foreseeable future.
Deferred tax assets and liabilities are measured at the tax rates that are expected to apply to the period(s) when the asset and liability give rise to them are realised or settled, based on tax rates (and tax laws) that have been enacted or substantively enacted by the reporting date. The measurement of deferred tax liabilities and assets reflects the tax consequences that would follow from the manner in which the consolidated entity expects, at the reporting date, to recover or settle the carrying amount of its assets and liabilities.
Deferred tax assets and liabilities are offset when they relate to income taxes levied by the same taxation authority and the consolidated entity intends to settle its current tax assets and liabilities on a net basis.
Current and Deferred Tax for the Period
Current and deferred tax is recognised as an expense or income in the Statement of Comprehensive Income, except when it relates to items credited or debited directly to equity, in which case the deferred tax is also recognised directly in equity, or where it arises from the initial accounting for a business combination, in which case it is taken into account in the determination of goodwill or excess.
Tax Consolidation
The Company and all its wholly-owned Australian resident entities are part of a tax consolidated group under Australian taxation law. CMI Limited is the head entity in the tax consolidated group.
Entities within the tax consolidated group have entered into a tax funding agreement with the head entity. Under the terms of the tax funding agreement, CMI Limited and each of the entities in the tax consolidated group has agreed to pay a tax equivalent payment to or from the head entity, based on the current tax liability or current tax asset of the entity.
The current and deferred tax assets and liabilities of the parent entity are not reduced by the amounts owing from or to subsidiary entities in accordance with the tax funding agreement as these amounts are recognised as inter-company receivables and payables.
Entities within the tax consolidated group have adopted the stand alone approach to measuring current and deferred tax amounts.
L) INTANGIBLE ASSETS (EXCLUDING GOODWILL)
Research and Development Costs
Expenditure on research activities is recognised as an expense in the period in which it is incurred. Where no internally-generated intangible asset can be recognised, development expenditure is recognised as an expense in the period as incurred.
An intangible asset arising from development (or from the development phase of an internal project) is recognised if, and only if, all of the following are demonstrated:
the technical feasibility of completing the intangible asset so that it will be available for use or sale;
• the intention to complete the intangible asset and use or sell it;
• the ability to use or sell the intangible asset;
• how the intangible asset will generate probable future economic benefits;

CMI LIMITED ANNUAL REPORT 201632
NOTES TO THE CONSOLIDATED FINANCIAL STATEMENTSFOR THE FINANCIAL YEAR ENDED 30 JUNE 2016
• the availability of adequate technical, financial and other resources to complete the development and to use or sell the intangible asset; and
• the ability to measure reliably the expenditure attributable to the intangible asset during its development.
Internally-generated intangible assets are stated at cost less accumulated amortisation and impairment, and are amortised on a straight-line basis over the period in which the corresponding benefits are expected to arise, commencing when the product is first available to the market.
The unamortised balance of development costs deferred in previous periods is reviewed regularly and at each reporting date, to ensure the criterion for deferral continues to be met. Where such costs are no longer considered recoverable, they are written-off as an expense in profit or loss.
M) INVENTORIES
Inventories are valued at the lower of cost and net realisable value. Costs, including an appropriate portion of fixed and variable overhead expenses, are assigned to inventory on hand by the method most appropriate to each particular class of inventory, with the majority being valued on a weighted average basis (and the remainder at standard cost). Net realisable value represents the estimated selling price less all estimated costs of completion and costs to be incurred in marketing, selling and distribution.
N) LEASED ASSETS
Leases are classified as finance leases whenever the terms of the lease transfer substantially all the risks and rewards of ownership to the lessee. All other leases are classified as operating leases.
Assets held under finance leases are initially recognised at their fair value or, if lower, at amounts equal to the present value of the minimum lease payments, each determined at the inception of the lease. The corresponding liability to the lessor is included in the Statement of Financial Position as a finance lease obligation.
Lease payments are apportioned between finance charges and reduction of the lease obligation so as to achieve a constant rate of interest on the remaining balance of the liability. Finance charges are charged directly to income, unless they are directly attributable to qualifying assets, in which case they are capitalised in accordance with the consolidated entity’s general policy on borrowing costs. Refer to Note 1(b).
Finance leased assets are amortised on a straight-line basis over the estimated useful life of the asset.
Operating lease payments are recognised as an expense on a straight-line basis over the lease term, except where another systematic basis is more representative of the time pattern in which economic benefits from the leased asset are consumed.
O) PAYABLES
Trade payables and other accounts payable are recognised when the consolidated entity becomes obliged to make future payments resulting from the purchase of goods and services.
P) PRINCIPLES OF CONSOLIDATION
The Consolidated Financial Statements comprise the financial statements of the group and its subsidiaries as at 30 June 2016. Control is achieved when the Group is exposed, or has rights, to variable returns from its involvement with the investee and has the ability to affect those returns through its power over the investee. Specifically, the Group controls an investee if an only if the Group has:
• Power over the investee (i.e. existing rights that give it the current ability to direct the relevant activities of the investee)
• Exposure, or rights, to variable returns from its involvement with the investee, and
• The ability to use its power over the investee to affect its returns.
On acquisition, the assets, liabilities and contingent liabilities of a subsidiary are measured at their fair values at the date of acquisition. Any excess of the cost of acquisition over the fair values of the identifiable net assets acquired is recognised as goodwill. If, after reassessment, the fair values of the identifiable net assets acquired exceeds the cost of acquisition, the deficiency is credited to profit and loss in the period of acquisition.
The Consolidated Financial Statements include the information and results of each subsidiary from the date on which the company obtains control and until such time as the company ceases to control such entity. In preparing the consolidated financial statements, all intercompany balances and transactions, and unrealised profits arising within the consolidated entity are eliminated in full.
Q) PROPERTY, PLANT AND EQUIPMENT
Land and buildings, plant and equipment, leasehold improvements and equipment under finance lease are stated at cost less accumulated depreciation and impairment. Cost includes expenditure that is directly attributable to the acquisition of the item.
Depreciation is provided on property, plant and equipment, including freehold buildings but excluding land. Depreciation is calculated on a straight-line basis so as to write off the net cost of each asset during its expected useful life to its estimated residual value. Leasehold improvements are depreciated over the period of the lease or estimated useful life, whichever is the shorter, using the straight-line method. The estimated useful lives, residual values and depreciation method are reviewed at the end of each annual reporting period.

CMI LIMITED ANNUAL REPORT 2016 33
The following estimated useful lives are used in the calculation of depreciation:
• Buildings 25 – 50 years
• Plant and equipment 3 – 20 years
• Equipment under finance leases 3 – 5 years
R) PROVISIONS
Provisions are recognised when the consolidated entity has a present obligation, the future sacrifice of economic benefits is probable, and the amount of the provision can be measured reliably.
The amount recognised as a provision is the best estimate of the consideration required to settle the present obligation at reporting date, taking into account the risks and uncertainties surrounding the obligation. Where a provision is measured using the cash flows estimated to settle the present obligation, its carrying amount is the present value of those cash flows.
When some or all of the economic benefits required to settle a provision are expected to be recovered from a third party, the receivable is recognised as an asset if it is virtually certain that recovery will be received and the amount of the receivable can be measured reliably.
Dividends
A provision is recognised for dividends when they have been declared, determined or publicly recommended by the directors on or before reporting date and not paid.
S) REVENUE RECOGNITION
Sale of goods and disposal of assets
Revenue from the sale of goods is recognised when the consolidated entity has transferred to the buyer the significant risks and rewards of ownership of the goods.
Interest received
Interest received is accrued on a time basis, by reference to the principal outstanding and at the effective interest rate applicable.
Dividends received
Dividend income is recorded in the Statement of Comprehensive Income on an accruals basis when the Group’s right to receive the dividend is established.
T) TOOLING
Material items of expenditure, relating to tooling, are capitalised into plant and equipment to the extent that there will be future economic benefits.
The capitalised costs are amortised over the expected period (not exceeding 15 years) in which the corresponding benefits are expected to arise. The amortised balance of costs capitalised is reviewed regularly and at each reporting date, to ensure the criterion for capitalisation continues to be met.
Where such costs are no longer considered recoverable, they are recognised in profit or loss.
U) SHARE-BASED PAYMENTS
Employees (including senior executives) of the Group receive remuneration in the form of share-based payments, whereby employees render services as consideration for equity instruments (equity-settled transactions).
Equity-settled transactions
The cost of equity-settled transactions is recognised, together with a corresponding increase in other capital reserves in equity, over the period in which the performance and/or service conditions are fulfilled. The cumulative expense recognised for equity-settled transactions at each reporting date until the vesting date reflects the extent to which the vesting period has expired and the Group’s best estimate of the number of equity instruments that will ultimately vest. The income statement expense or credit for a period represents the movement in cumulative expense recognised as at the beginning and end of that period and is recognised in employee benefits expense (Note 2).
No expense is recognised for awards that do not ultimately vest, except for equity-settled transactions for which vesting is conditional upon a market or non-vesting condition. These are treated as vesting irrespective of whether or not the market or non-vesting condition is satisfied, provided that all other performance and/or service conditions are satisfied.
When the terms of an equity-settled award are modified, the minimum expense recognised is the expense had the terms had not been modified, if the original terms of the award are met. An additional expense is recognised for any modification that increases the total fair value of the share-based payment transaction, or is otherwise beneficial to the employee as measured at the date of modification. When an equity-settled award is cancelled, it is treated as if it vested on the date of cancellation, and any expense not yet recognised for the award is recognised immediately. This includes any award where non-vesting conditions within the control of either the entity or the employee are not met. However, if a new award is substituted for the cancelled award, and designated as a replacement award on the date that it is granted, the cancelled and new awards are treated as if they were a modification of the original award, as described in the previous paragraph.
The dilutive effect of outstanding options is reflected as additional share dilution in the computation of diluted earnings per share (further details are given in Note 21).
Cash-settled transactions
The cost of cash-settled transactions is measured initially at fair value at the grant date using a binomial model. This fair value is expensed over the period until the vesting date with recognition of a corresponding liability. The liability is remeasured to fair value at each reporting date up to and including the settlement date.
CMI LIMITED ANNUAL REPORT 201634
NOTES TO THE CONSOLIDATED FINANCIAL STATEMENTSFOR THE FINANCIAL YEAR ENDED 30 JUNE 2016
V) NEW ACCOUNTING STANDARDS AND INTERPRETATIONS
(i) Changes in accounting policy and disclosures
The accounting policies adopted are consistent with those of the previous financial year except as follows:
The Group has adopted the following new and amended Australian Accounting Standards and AASB Interpretations as of 1 July 2015:
• AASB 2013-9 Amendments to Australian Accounting Standards – Conceptual Framework, Materiality and Financial Instruments
• AASB 2015-3 Amendments to Australian Accounting Standards arising from withdrawal of AASB 1031 Materiality
The adoptions of the new and amended standards are not deemed to have an impact on the financial statements or performance of the Group.
(ii) Accounting Standards and Interpretations issued but not yet effective
Certain Australian Accounting Standards and Interpretations have been recently issued or amended but are not yet effective and have not been adopted by the Group for the annual reporting period ended 30 June 2016.
The standards have been considered and the company does not expect any material financial impact.
The impact of the amended Standard AASB 15 – Revenue from Contracts with Customers, and AASB 9 - Financial Instruments are still being assessed in terms of any material financial effect on the financial statements presented. The Company does not expect to early adopt these standards. Leases previously treated as operating leases will be recognised as assets and liabilities under AASB 16 – Leases.
W) FINANCIAL GUARANTEE CONTRACTS – REFER NOTE 30
Financial guarantee contracts issued by the Group are those contracts that require a payment to be made to reimburse the holder for a loss it incurs because the specified debtor fails to make a payment when due in accordance with the terms of a debt instrument. Financial guarantee contracts are recognised initially as a liability at fair value, adjusted for transaction costs that are directly attributable to the issuance of the guarantee. Subsequently, the liability is measured at the higher of the best estimate of the expenditure required to settle the present obligation at the reporting date and the amount recognised less cumulative amortisation.
X) BUSINESS COMBINATIONS
Business Combinations are accounted for using the acquisition method. The consideration transferred in a business combination shall be measured at fair value, which
shall be calculated as the sum of the acquisition-date fair values of the assets transferred by the acquirer, the liabilities incurred by the acquirer to former owners of the acquiree and the equity issued by the acquirer, and the amount of any non-controlling interest in the acquiree. For each business combination, the acquirer measures the non-controlling interest in the acquire either at fair value or at the proportionate share of the acquiree’s identifiable net assets. Acquisition-related costs are expensed as incurred.
When the Group acquires a business, it assesses the financial assets and liabilities assumed for appropriate classification and designation in accordance with the contractual terms, economic conditions, the Group’s operating or accounting policies and other pertinent conditions as at the acquisition date. This includes the separation of embedded derivatives in host contracts by the acquiree.
If the business combination is achieved in stages, the acquisition date fair value of the acquirer’s previously held equity interest in the acquiree is remeasured at fair value as at the acquisition date through profit or loss.
Any contingent consideration to be transferred by the acquirer will be recognised at fair value at the acquisition date. Subsequent changes to the fair value of the contingent consideration which is deemed to be an asset or liability will be recognised in accordance with AASB 139 either in profit or loss or in other comprehensive income. If the contingent consideration is classified as equity, it shall not be remeasured.
Y) OPERATING SEGMENTS
An operating segment is a component of an entity that engages in business activities from which it may earn revenues and incur expenses (including revenues and expenses relating to transactions with other components of the same entity), whose operating results are regularly reviewed by the entity’s chief operating decision maker to make decisions about resources to be allocated to the segment and assess its performance and for which discrete financial information is available. This includes start up operations which are yet to earn revenues. Management will also consider other factors in determining operating segments such as the existence of a line manager and the level of segment information presented to the board of directors.
Operating segments have been identified based on information provided to the chief operating decision makers – being the executive management team.
The Group aggregates two or more operating segments when they have similar economic characteristics, and the segments are similar in each of the following respects:
• Nature of the products and services,
• Nature of the production processes,
• Type or class of customer for the product and services,

CMI LIMITED ANNUAL REPORT 2016 35
• Methods used to distribute the products or provide the services, and if applicable
• Nature of the regulatory environment.
Operating segments that meet the quantitative criteria as prescribed by AASB 8 are reported separately. However, an operating segment that does not meet the quantitative criteria is still reported separately where information about the segment would be useful to users of the financial statements.
Z) SIGNIFICANT ACCOUNTING JUDGEMENTS, ESTIMATES AND ASSUMPTIONS
The preparation of the financial statements requires management to make judgements, estimates and assumptions that affect the reported amounts in the financial statements. Management continually evaluates its judgements and estimates in relation to assets, liabilities, contingent liabilities, revenue and expenses. Management bases its judgements and estimates on historical experience and on other various factors it believes to be reasonable under the circumstances, the result of which form the basis of the carrying values of assets and liabilities that are not readily apparent from other sources.
Management has identified the following significant accounting policies for which significant judgements, estimates and assumptions are made. Actual results may differ from these estimates under different assumptions and conditions and may materially affect financial results or the financial position reported in future periods.
Further details of the nature of these assumptions and conditions may be found in the relevant notes to the financial statements.
Recovery of deferred tax assets
Deferred tax assets are recognised for deductible temporary differences as management considers that it is probable that future taxable profits will be available to utilise those temporary differences. Significant management judgement is required to determine the amount of deferred tax assets that can be recognised, based upon the likely timing and the level of future profits over the next two years together with future tax planning strategies.
Taxation
The Group’s accounting policy for taxation requires management’s judgement as to the types of arrangements considered to be a tax on income in contrast to an operating cost. Judgement is also required in assessing whether deferred tax assets and certain deferred tax liabilities are recognised on the Statement of Financial Position. Deferred tax assets, including those arising from unrecouped tax losses, capital losses and temporary differences, are recognised only where it is considered more likely than not that they will be recovered, which is dependent on the generation of sufficient future taxable profits.
Deferred tax liabilities arising from temporary differences in investments, caused principally by retained earnings held in foreign tax jurisdictions, are recognised unless repatriation of retained earnings can be controlled and are not expected to occur in the foreseeable future.
Assumptions about the generation of future taxable profits and repatriation of retained earnings depend on management’s estimates of future cash flows. These depend on estimates of future production and sales volumes, operating costs, restoration costs, capital expenditure, dividends and other capital management transactions. Judgements are also required about the application of income tax legislation.
These judgements and assumptions are subject to risk and uncertainty, hence there is a possibility that changes in circumstances will alter expectations, which may impact the amount of deferred tax assets and deferred tax liabilities recognised on the Statement of Financial Position and the amount of other tax losses and temporary differences not yet recognised. In such circumstances, some or all of the carrying amounts of recognised deferred tax assets and liabilities may require adjustment, resulting in a corresponding credit or charge to the Statement of Comprehensive Income.
Impairment of receivable assets
The Group assesses impairment of all assets at each reporting date by evaluating objective evidence specific to the Group and to the particular receivable asset that may lead to impairment. These include the financial condition of the debtor; contract breaches by the debtor; concessions granted to the debtor; or decreases in national or economic conditions that correlate with defaults. If an impairment trigger exists the recoverable amount of the asset is determined. This expense is recognised in the Statement of Comprehensive Income in the line item “Impairment expense” and reversals of this expense are recognised in the line item “Reversal of impairment expense”.
Impairment of goodwill and intangibles with indefinite useful lives
The Group determines whether goodwill and intangibles with indefinite useful lives are impaired at least on an annual basis. This requires an estimation of the recoverable amount of the cash-generating units, using value in use discounted cash flow methodology, to which the goodwill and intangibles with indefinite useful lives are allocated. The recoverable amount of the cash-generating unit is determined based on a value in use calculation which uses cash flow projections based on financial budgets approved by management covering a five year period with a terminal value, and a pre-tax discount rate of 18.571% p.a. (2015: 12.057% p.a.).The basis for these estimates is past experience of management. Management considered it prudent to increase the pre-tax discount rate based on industry and market conditions.

CMI LIMITED ANNUAL REPORT 201636
NOTES TO THE CONSOLIDATED FINANCIAL STATEMENTSFOR THE FINANCIAL YEAR ENDED 30 JUNE 2016
Share-based payments
The Group measures the cost of equity-settled transactions with employees by reference to the fair value of the equity instruments at the date at which they are granted. Estimating fair value for share-based payment transactions requires determination of the most appropriate valuation model, which is dependent on the terms and conditions of the grant. This estimate also requires determination of the most appropriate inputs to the valuation model including the expected life of the share option, volatility and dividend yield and making assumptions about them. The assumptions and models used for estimating fair value for share-based payment transactions are disclosed in Note 23.
Inventory obsolescence
The policy provides for inventory that has not been sold within 18 months for finished goods or utilised for 2 years for work in progress and raw materials. There is an element of judgement required from management when assessing the obsolescence of items that meet these criteria.
Amortisation of intangible assets arising from development expenditure
Management have estimated that products under development will have a useful life of 5 years in the market. This is based on analysis of historic product life cycles.
AA) FAIR VALUE MEASUREMENT
The Group measures financial instruments, such as derivatives and non-financial assets at fair value at each balance sheet date.
Fair value is the price that would be received to sell an asset or paid to transfer a liability in an orderly transaction between market participants at the measurement date. The fair value measurement is based on the presumption that the transaction to sell the asset or transfer the liability takes place either:
• In the principal market for the asset or liability, or;
• In the absence of a principal market, in the most advantageous market for the asset or liability, the principal or the most advantageous market must be accessible to by the Group.
The fair value of an asset or liability is measured using the assumptions that market participants would use when pricing the asset or liability, assuming that market participants act in their economic best interest.
The Group uses valuation techniques that are appropriate in the circumstances and for which sufficient data are available to measure fair value, maximising the use of relevant observable inputs and minimising the use of unobservable inputs.
All assets and liabilities for which fair value is measured or disclosed in the financial statements are categorised within the fair value hierarchy, described as follows, based on the lowest level input that is significant to the fair value measurement as a whole:
• Level 1 – Quoted (unadjusted) market prices in active markets for identical assets and liabilities
• Level 2 – Valuation techniques for which the lowest level input that is significant to the fair value measurement is directly or indirectly observable
• Level 3 – Valuation techniques for which the lowest level input that is significant to the fair value measurement is unobservable.
For assets and liabilities that are recognised in the financial statements on a recurring basis, the Group determines whether transfers have occurred between levels in the hierarchy by re-assessing categorisation (based on the lowest level input that is significant to the fair value measurement as a whole) at the end of the reporting period.
AB) NON-CURRENT ASSETS AND DISPOSAL GROUP HELD FOR SALE AND DISCONTINUED OPERATIONS - REFER NOTE 14
Non-current assets and disposal groups are classified as held for sale and measured at the lower of their carrying amount and fair value less costs to sell if their carrying amount will be recovered principally through a sale transaction. They are not depreciated or amortised. For an asset or disposal group to be classified as held for sale, it must be available for immediate sale in its present condition and its sale must be highly probable.
An impairment loss is recognised for any initial or subsequent write-down of the asset (or disposal group) to fair value less costs to sell. A gain is recognised for any subsequent increases in fair value, less costs to sell, of an asset (or disposal group), but not in excess of any cumulative impairment loss previously recognised. A gain or loss not previously recognised by the date of the sale of the non-current asset (or disposal group) is recognised at the date of derecognition.
A discontinued operation is a component of the entity that has been disposed of or is classified as held for sale and that represents a separate major line of business or geographical area of operations, is part of a single coordinated plan to dispose of such a line of business or area of operations, or is a subsidiary acquired exclusively with a view to resale.

CMI LIMITED ANNUAL REPORT 2016 37
2. PROFIT FROM OPERATIONS(a) Revenue and Other Income from continuing operations
2016$’000
2015$’000
Revenue from operations consisted of the following items:
Revenue from the sales of goods1 40,031 42,675
Interest - other persons 779 394
40,810 43,069
1 Inthecurrentperiodrevenuehasbeenstatednetofdiscountsandrebatesgivenandthepriorperiodcomparisonsupdatedtoreflectthecurrentperiod’spresentation. In previous periods revenue was presented on a gross basis with discounts and rebates included in Freight & cartage expenses. The directors believethispresentationprovidesmorerelevantinformationfortheusersofthefinancialstatements.
Other Income from operations consisted of the following items:
Research and development government grant 28 118
Other Items 46 31
74 149

CMI LIMITED ANNUAL REPORT 201638
NOTES TO THE CONSOLIDATED FINANCIAL STATEMENTSFOR THE FINANCIAL YEAR ENDED 30 JUNE 2016
2. PROFIT FROM OPERATIONS (CONTINUED)(b) Profit before income tax – continuing operations Profit before income tax has been arrived at after crediting/(charging) the following gains and losses from continuing operations:
2016 $’000
2015 $’000
Gain/(loss) on disposal of property, plant and equipment - (11)
Net foreign exchange gains/(losses) 20 234
20 223
Gains attributable to continuing operations 20 234
Losses attributable to continuing operations - (11)
20 223
Cost of sales 27,630 27,312
Legal expenses 73 304
Finance Costs:
Interest – other entities 22 58
Depreciation or amortisation of:
Property, plant & equipment 126 128
Leased assets - -
Other intangibles 357 57
483 185
Net bad and doubtful debts 19 25
Operating lease expense 1,514 1,470
Research and development costs charged directly to the net income: Amortisation expenseReversal of prior period impairment expense: Loan receivable – Note 7
357
-
57
(869)
Employee benefit expense: Post-employment benefits: Defined contribution plans Share-based payments: Equity settled share-based payments Termination benefits Other employee benefits
390
(102)118
5,281
397
597-
5,972
5,687 6,966

CMI LIMITED ANNUAL REPORT 2016 39
3. INCOME TAXES(a) Income tax recognised in profit or loss
2016 $’000
2015 $’000
Tax expense/(benefit) comprises:
Current tax expense 1,048 1,648
(Over)/Underprovision of income tax in previous year 18 142
Deferred tax expense relating to the origination and reversal of temporary differences 318 146
Total tax expense/(benefit) attributable to continuing operations 1,384 1,936
The prima facie income tax on pre-tax accounting profit from operations reconciles to the income tax expense in the financial statements as follows:
Profit/(loss) from continuing operations 4,830 7,087
Profit/(loss) from discontinued operations - 103
Total Profit/(loss) before income tax 4,830 7,190
Income tax calculated at 30% 1,449 2,157
Add/(Deduct)
Reversal of impairment losses on receivable - (261)
Other items (83) (298)
(Over)/Under provision of income tax in previous year 18 142
65 (417)
Aggregate income tax expense 1,384 1,740
Aggregate income tax is attributable to:
Continuing operations 1,384 1,936
Discontinued operations - (196)
1,384 1,740
The tax rate used in the above reconciliation is the corporate tax rate of 30% payable by Australian corporate entities on taxable profits under Australian tax law. There has been no change in the corporate tax rate when compared with the previous reporting period.

CMI LIMITED ANNUAL REPORT 201640
NOTES TO THE CONSOLIDATED FINANCIAL STATEMENTSFOR THE FINANCIAL YEAR ENDED 30 JUNE 2016
3. INCOME TAXES (CONTINUED)(b) Current tax assets and liabilities
2016 $’000
2015 $’000
Current tax assets:
Income tax refund receivable - 253
Current tax payables:
Income tax payable attributable to:
Parent entity (1,114) -
Entities in the tax consolidated group 1,680 -
566 -
(c) Deferred tax balancesTaxable and deductible temporary differences arise from the following:
2016
Opening balance
$’000
Charged to income
$’000
Charged to equity $’000
Discontinued Operations
$’000
Closing balance
$’000
Gross deferred tax liabilities:
Intangible assets (615) 24 - - (591)
(615) 24 - - (591)
Gross deferred tax assets:
Receivables 18 (10) - - 8
Inventories 139 13 - - 152
Property, plant and equipment 26 19 - - 45
Provisions 251 16 - - 267
Accruals/Borrowings 253 (161) - - 92
Other 323 (220) - - 103
1,010 (343) - - 667
Net deferred tax balances 395 (319) - - 76
Disclosed in the accounts pursuant to the set-off provisions as:
Deferred tax assets – continuing operations 667
Deferred tax liabilities – continuing operations (591)
76

CMI LIMITED ANNUAL REPORT 2016 41
3. INCOME TAXES (CONTINUED)(c) Deferred tax balances (continued)
2015
Opening balance
$’000
Charged to income
$’000
Charged to equity$’000
Dis-continued
Operations$’000
Closing balance
$’000
Gross deferred tax liabilities:
Intangible assets (1,073) (96) - 554 (615)
(1,073) (96) - 554 (615)
Gross deferred tax assets:
Receivables 138 34 - (154) 18
Inventories 341 (214) - 12 139
Property, plant and equipment (233) (76) - 335 26
Provisions 487 22 - (258) 251
Accruals/Borrowings 275 - - (22) 253
Other 139 184 - - 323
1,147 (50) - (87) 1,010
Net deferred tax balances 74 (146) - 467 395
Disclosed in the accounts pursuant to the set-off provisions as:
Deferred tax assets –continuing operations 1,010
Deferred tax liabilities – continuing operations (615)
395
TAX CONSOLIDATION SYSTEM
Legislation to allow groups, comprising a parent entity and its Australian resident wholly-owned entities, to elect to consolidate and be treated as a single entity for income tax purposes was substantively enacted on 21 October 2002.
The company and its wholly-owned Australian resident entities are eligible to consolidate for tax purposes under this legislation and have elected to be taxed as a single entity from 1 July 2002. The head entity within the tax consolidated group for the purposes of the tax consolidated system is CMI Limited. During the prior year the divested subsidiary TJM Products Pty Ltd left the consolidated tax group.
Entities within the tax consolidated group have entered into a tax funding agreement with the head entity. Under the terms of this agreement, CMI Limited and each of the entities in the tax consolidated group has agreed to pay a tax equivalent payment to or from the head entity, based on the net accounting profit or loss of the entity and the current rate. Such amounts are reflected in amounts receivable from or payable to other entities in the tax consolidated group.
Entities within the tax consolidated group have adopted the stand alone approach to measuring current and deferred tax amounts.

CMI LIMITED ANNUAL REPORT 201642
NOTES TO THE CONSOLIDATED FINANCIAL STATEMENTSFOR THE FINANCIAL YEAR ENDED 30 JUNE 2016
4. CURRENT TRADE AND OTHER RECEIVABLES
2016 $’000
2015 $’000
Trade receivables 8,105 9,783
Allowance for doubtful debts (24) (58)
8,081 9,725
Other 306 205
8,387 9,930
(a) Allowance for doubtful debtsTrade receivables are non-interest bearing and are generally on 30-90 day terms. An allowance for doubtful debts is recognised when there is objective evidence that an individual trade receivable is impaired. An allowance for doubtful debts of $24 thousand (2015: $58 thousand) has been recognised by the consolidated entity.
Movements in the allowance for doubtful debts were as follows:
At 1 July 58 465
Charge for the year 19 119
Disposed of with business - (526)
Amounts written off (53) -
24 58
At 30 June, the ageing analysis of trade receivables is as follows:
Total
0-30days
within credit terms
31-60days
within credit terms
31-60days
PDNI*
61-90days
within credit terms
61-90days
PDNI*
+91days
within credit terms
+91days
PDNI*
+91DaysCI**
2016
Consolidated 8,105 4,064 2,745 - 829 207 212 24 24
2015
Consolidated 9,783 4,894 2,735 - 1,457 115 133 391 58
* Past due not impaired (‘PDNI’)
** Considered impaired (‘CI’)
Receivables past due but not considered impaired are: Consolidated $231 thousand (2015: $506 thousand). Payment terms on these amounts have not been re-negotiated however in most cases credit has been stopped until full payment is made. Each operating unit has been in direct contact with the relevant debtor and is satisfied that payment will be received in full.
Other balances within trade and other receivables do not contain impaired assets and are not past due. It is expected that these other balances will be received when due.
(b) Fair value and credit riskDue to the short-term nature of these receivables, their carrying value is assumed to approximate their fair value.The maximum exposure to credit risk is the fair value of receivables. Collateral is not held as security, nor is it the consolidated entity’s policy to transfer (on-sell) receivables to special purpose entities.

CMI LIMITED ANNUAL REPORT 2016 43
4. CURRENT TRADE AND OTHER RECEIVABLES (CONTINUED)(c) Foreign exchange and interest rate riskDetail regarding foreign exchange and interest rate risk exposure is disclosed in Note 31.
5. CURRENT INVENTORIES
2016 $’000
2015 $’000
At Cost
Raw materials and stores 1,345 1,497
Work in progress 299 246
Finished goods 9,383 10,490
11,027 12,233
Raw materials with a cost of $72 thousand (2015: $nil), work in progress with a cost of $nil (2015: $nil) and finished goods with a cost of $431 thousand (2015: $465 thousand) have been provided for obsolescence and the inventories have been carried at a net realisable value of $nil.
6. PARENT ENTITY INFORMATION
Information relating to CMI Limited:2016 $’000
2015 $’000
Current assets 26,614 34,261
Total assets 48,116 35,043
Current liabilities 892 1,488
Total liabilities 892 11,125
Issued capital 28,520 38,555
Retained earnings 12,020 (21,919)
Employee Equity-settled Benefits Reserve (118) 479
Class A Share Reserve 6,802 6,802
Total shareholders’ equity 47,224 23,918
Profit/(Loss) of the parent entity 37,076 3,251
Total comprehensive income of the parent entity 37,076 3,251
Details of any guarantees entered into by the parent entity in relation to the debts of its subsidiaries * Guarantees arising from the deed of cross-guarantee with other entities in the wholly-
owned group (i) 4,648 4,842
Details of any contingent liabilities of the parent entity * Guarantees issued to bank in respect of overseas purchases, supply contract
performance and lease of premises (ii)191 191
Details of any contractual commitments by the parent entity for the acquisition of property, plant or equipment.
N/A N/A

CMI LIMITED ANNUAL REPORT 201644
NOTES TO THE CONSOLIDATED FINANCIAL STATEMENTSFOR THE FINANCIAL YEAR ENDED 30 JUNE 2016
6. PARENT ENTITY INFORMATION (CONTINUED)During the year CMI Operations Pty Ltd paid a $35 million dividend to the parent entity CMI Limited.
(i) The company has entered into a deed of cross-guarantee with certain wholly-owned subsidiaries. The amount disclosed as a contingent liability represents total liabilities of the group of companies party to that class order less the liabilities of the parent entity. Pursuant to Class Order 98/1418, CMI Limited and CMI Operations Pty Ltd have entered into a deed of cross-guarantee. The effect of the deed is that CMI Limited has guaranteed to pay any deficiency in the event of winding up of any controlled entity or if they do not meet their obligations under the terms of overdrafts, loans, leases or other liabilities subject to the guarantee. The controlled entities have also given a similar guarantee in the event that CMI Limited is wound up or if it does not meet its obligations under the terms of overdrafts, loans, leases or other liabilities subject to the guarantee. The deed of cross-guarantee will continue to operate indefinitely. The fair value of these guarantees has not been recognised, since the parent entity has not incurred any obligation under the deed of cross-guarantee. TJM Products Pty Ltd ceased being a member of the group on 2 March 2015.
(ii) A number of contingent liabilities arise as a result of guarantees made directly to financing organisations in respect of overseas purchases, lease of premises and payment of business. The amount disclosed represents the aggregate amount of such guarantees. The extent to which an outflow of funds will be required is dependent on the satisfaction of the obligations under the terms of the overseas purchases, leases and loans subject to the guarantees. The fair value of these guarantees has not been recognised as they are not considered material. The contingent liabilities are not recognised in the accounts as it is not probable that an outflow of resources embodying economic benefits will be required to settle the obligation.
7. OTHER NON-CURRENT FINANCIAL ASSETS
2016 $’000
2015 $’000
Loan Receivable - -
Provision for Impairment - -
- -
Associated with the sale of the engineering business was a loan provided by CMI Limited to the purchaser to purchase the business with a $17 million face value. The loan was not repaid on 16 October 2011. Administrators and Receivers were appointed to CMI Industrial Pty Ltd on 26 April 2012. An amount of $869 thousand was received during the prior year from the administrator. These amounts were recognised as a reversal of impairment expense at 30 June 2015. There is no expectation of receiving any further funds from the liquidation of CMI Industrial Pty Ltd.

CMI LIMITED ANNUAL REPORT 2016 45
8. PROPERTY, PLANT AND EQUIPMENT
Plant and Equipment
$’000
Equipment under finance
lease $’000
TOTAL $’000
Gross Carrying Amount
Balance at 1 July 2014 (at cost) 10,831 230 11,061
Additions 379 - 379
Disposals (168) - (168)
Disposal on business sale (8,691) - (8,691)
Transfers 230 (230) -
Net foreign currency exchange differences 247 - 247
Balance at 1 July 2015 (at cost) 2,828 - 2,828
Additions 27 - 27
Disposals (7) - (7)
Balance at 30 June 2016 (at cost) 2,848 - 2,848
Accumulated Depreciation / Amortisation / Impairment
Balance at 1 July 2014 (5,879) (25) (5,904)
Disposals 63 - 63
Disposal on business sale 4,265 4,265
Transfers (25) 25 -
Depreciation expense (i) (589) - (589)
Net foreign currency exchange differences (95) - (95)
Balance at 1 July 2015 (2,260) - (2,260)
Disposals 7 - 7
Depreciation expense (i) (126) - (126)
Balance at 30 June 2016 (2,379) - (2,379)
Net Book Value
As at 30 June 2015 568 - 568
As at 30 June 2016 469 - 469
(i) Aggregate depreciation allocated during the year is recognised as an expense and depreciation from continuing operations is disclosed in Note 2 to the financial statements.
There are no restrictions to title for the property, plant and equipment.
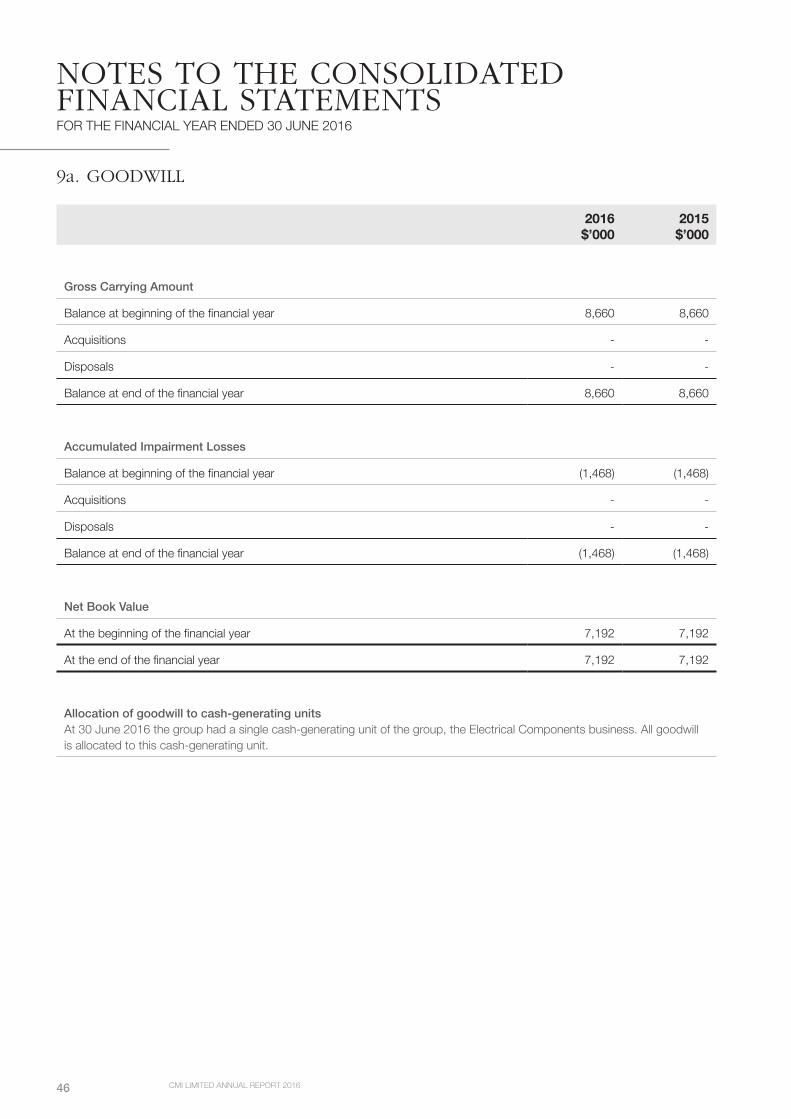
CMI LIMITED ANNUAL REPORT 201646
NOTES TO THE CONSOLIDATED FINANCIAL STATEMENTSFOR THE FINANCIAL YEAR ENDED 30 JUNE 2016
9a. GOODWILL
2016 $’000
2015 $’000
Gross Carrying Amount
Balance at beginning of the financial year 8,660 8,660
Acquisitions - -
Disposals - -
Balance at end of the financial year 8,660 8,660
Accumulated Impairment Losses
Balance at beginning of the financial year (1,468) (1,468)
Acquisitions - -
Disposals - -
Balance at end of the financial year (1,468) (1,468)
Net Book Value
At the beginning of the financial year 7,192 7,192
At the end of the financial year 7,192 7,192
Allocation of goodwill to cash-generating unitsAt 30 June 2016 the group had a single cash-generating unit of the group, the Electrical Components business. All goodwill is allocated to this cash-generating unit.

CMI LIMITED ANNUAL REPORT 2016 47
9b. IMPAIRMENT TESTINGElectrical ComponentsThe cash-generating unit has no indefinite life intangible assets. The recoverable amount of the cash-generating unit is determined based on a value in use calculation which uses cash flow projections based on financial budgets approved by management covering a five year period with a terminal value, and a pre-tax discount rate of 18.6% p.a. (2015: 12.1% p.a.). The increase in the pre-tax discount rate is due to management’s assessment of industry and market conditions. The key assumptions used in the value in use calculations for the cash-generating unit are as follows:
Key assumption How Determined
Budgeted EBITDA Budgeted EBITDA, which is based on past experience with adjustments for the following:• An overall reduction of EBITDA in the 30 June 2017 financial year due to market conditions
experienced in 2016; a reduction in margins as a result of expected product sales mix; and higher occupancy costs partially offset by a reduction in salary costs due to senior management staff changes expected.
• The forecast sales mix appropriately reflects the underlying plans of the business, including management’s view of an eventual return to investment in underground coal mining and the resulting impact on demand for CMI product sold to customers in this industry.
Budgeted CAPEX Budgeted CAPEX is based on past experience and includes the ongoing capital expenditure required to continue to maintain the existing fixed assets. Management expects increases of 3% (2015: 3%) per year to be reasonable allowance for increase in CAPEX costs based on CPI.
Budgeted Working Capital
Management expects to sustain the working capital ratio currently held over the forecast period, however the working capital is expected to grow in line with business growth.
Forward growth rate 3% - 7% (2015: 3%) based on management and the Board’s assessment of the market outlook.
Terminal growth rate 1% (2015: 3%) based on management’s assessment of the market outlook.
Pre-tax discount rate 18.6% (2015: 12.1%) based on the risk-free rate adjusted for a market risk premium and is comparable with discount rates used by other market participants.
Sensitivity to changes in cash-generating unit assumptionsThe CGU’s recoverable amount exceeds its carrying amount by $4.9 million.
Other than as disclosed below, management believe that no reasonably possible change in any of the above key assumptions would cause the carrying value of the cash-generating unit to exceed its recoverable amount.
Holding all other assumptions constant, if the growth rate through FY18 to FY21 declined to below negative 0.5% this would result in impairment where the recoverable amount would equal the carrying value of the CGU.
Holding all other assumptions constant, if the terminal growth rate declined to below negative 3% this would result in impairment where the recoverable amount would equal the carrying value of the CGU.
Holding all other assumptions constant, if the discount rate increased to above 22.0% (pre-tax), this would result in impairment where the recoverable amount would equal the carrying value of the CGU.

CMI LIMITED ANNUAL REPORT 201648
NOTES TO THE CONSOLIDATED FINANCIAL STATEMENTSFOR THE FINANCIAL YEAR ENDED 30 JUNE 2016
10. OTHER INTANGIBLE ASSETS
Capitalised Development
$’000Brandnames
$’000Other $’000
Total $’000
Gross carrying amount
Balance at 1 July 2014 14,157 5,692 1,528 21,377
Additions through internal developments 1,119 - - 1,119
Disposal on business sale (12,735) (5,692) (1,613) (20,040)
Acquisitions - - 87 87
Net foreign currency exchange differences 14 - - 14
Balance at 1 July 2015 2,555 - 2 2,557
Additions through internal developments 276 - - 276
Disposals (14) - - (14)
Balance at 30 June 2016 2,817 - 2 2,819
Accumulated amortisation and impairment
Balance at 1 July 2014 (10,484) (5,692) (852) (17,028)
Amortisation expense (i) (560) - (144) (704)
Disposal on business sale 10,540 5,692 994 17,226
Balance at 1 July 2015 (504) - (2) (506)
Amortisation expense (i) (357) - - (357 )
Disposals 13 - - 13
Balance at 30 June 2016 (848) - (2) (850)
Net Book Value
As at 30 June 2015 2,051 - - 2,051
As at 30 June 2016 1,969 - - 1,969
(i) Amortisation expense is included in the line item ‘Depreciation and amortisation expense’ in the Statement of Comprehensive Income.

CMI LIMITED ANNUAL REPORT 2016 49
11. CURRENT TRADE AND OTHER PAYABLES
2016 $’000
2015 $’000
Trade payables 2,495 2,602
Other creditors & accruals 1,588 2,713
4,083 5,315
(a) Fair valueDue to the short-term nature of these payables, their carrying value is assumed to approximate their fair value.
(b) Financial guarantees The consolidated entity has provided guarantees as outlined in Note 30. The fair value of these guarantees has not been recognised as they are not considered material.
(c) Terms of payablesTrade payables are non-interest bearing and are generally on 30-60 day terms.
12. CURRENT BORROWINGS
Unsecured
At amortised cost:
Other loans from other entities - -
- -
Secured
At amortised cost:
Bank Overdraft (i) - -
Finance Lease Liabilities (ii) - -
- -
- -
i) Secured by a fixed and floating charge over the assets and undertaking of the consolidated entity.
ii) Secured over the assets leased (2016 & 2015: $nil); part of a $2.00 million lease facility (2015: $2.00 million) – refer Note 29(c).

CMI LIMITED ANNUAL REPORT 201650
NOTES TO THE CONSOLIDATED FINANCIAL STATEMENTSFOR THE FINANCIAL YEAR ENDED 30 JUNE 2016
12. CURRENT BORROWINGS (CONTINUED)(a) Assets pledged as securityThe carrying amounts of assets pledged as security for undrawn financing facilities as detailed in Note 29(c) are:
2016 $’000
2015 $’000
Bills of exchange - Fixed and Floating 55,862 66,796
Leased asset charges - -
Total assets pledged as security 55,862 66,796
The specific terms and conditions related to the above pledges include repayment requirements, security undertakings and quarterly reporting on bank covenants relating to financial charges cover, capital adequacy, operating leverage and dividend payout ratio. The interest terms of the facility are based on a margin above the bank’s buying rate for bills at the time of drawing and a facility fee calculated on the facility limit.
(b) Set-off assets and liabilitiesThe Consolidated entity has no set off rights apart from cash as detailed in Note 29(a).
(c) Defaults and breachesThe terms and conditions of the groups banking facilities include events of default. During the year the consolidated entity was not in default of these terms and conditions.
13. CURRENT PROVISIONS
Employee benefits (Note 16) 853 727
853 727
14. DISCONTINUED OPERATIONS(a) Details of discontinued operations During the prior year the board of CMI conducted a strategic review of the TJM business and its position in the broader CMI group. The purpose of the review was to determine whether the value proposition to CMI shareholders was more enhanced by retaining the TJM division or through a sell down of the business.
The Board’s view was that synergies with CMI’s Electrical business were limited and that greater value may be realised for CMI shareholders by divesting the TJM business and re-employing these funds more effectively.
During the prior year CMI Limited sold 100% of the shares in TJM Products Pty Ltd. At 30 June 2014, CMI Limited was a party to a deed of cross-guarantee with this subsidiary pursuant to ASIC Class Order 98/1418. This cross-guarantee expired on divestment when the share sale was settled on 2 March 2015.

CMI LIMITED ANNUAL REPORT 2016 51
14. DISCONTINUED OPERATIONS (CONTINUED)(b) Financial performance of discontinued operations The results of the discontinued operations for the prior year until disposal are presented below:
2015 $’000
Revenue and Other Income 22,050
Expenses (22,769)
Operating income/(loss) (719)
Gain on disposal 467
Net foreign exchange gains/(losses) 355
Finance costs -
Profit/(Loss) before tax from discontinued operations 103
Income Tax 196
Profit/(Loss) from discontinued operations 299
(c) Cashflow information
Net cash flow from operating activities 419
Net cash flow from investing activities (1,591)
Net cash flow from financing activities (118)
Proceeds from sale 22,200
Cash included in carrying value of TJM at completion (636)
Costs funded (454)
Proceeds from sale of investment 21,110
(d) Gain on saleThe gain on disposal of the TJM Products division is presented below:
Sale price as per Share Sale Agreement 22,200
Balance sheet completion adjustment (515)*
Carrying value of TJM at settlement (20,958)
Realisation of foreign currency translation reserve 669
Costs incurred (929)
Gain on disposal of subsidiary 467
* Accrued at 30 June 2015, paid in the current period.
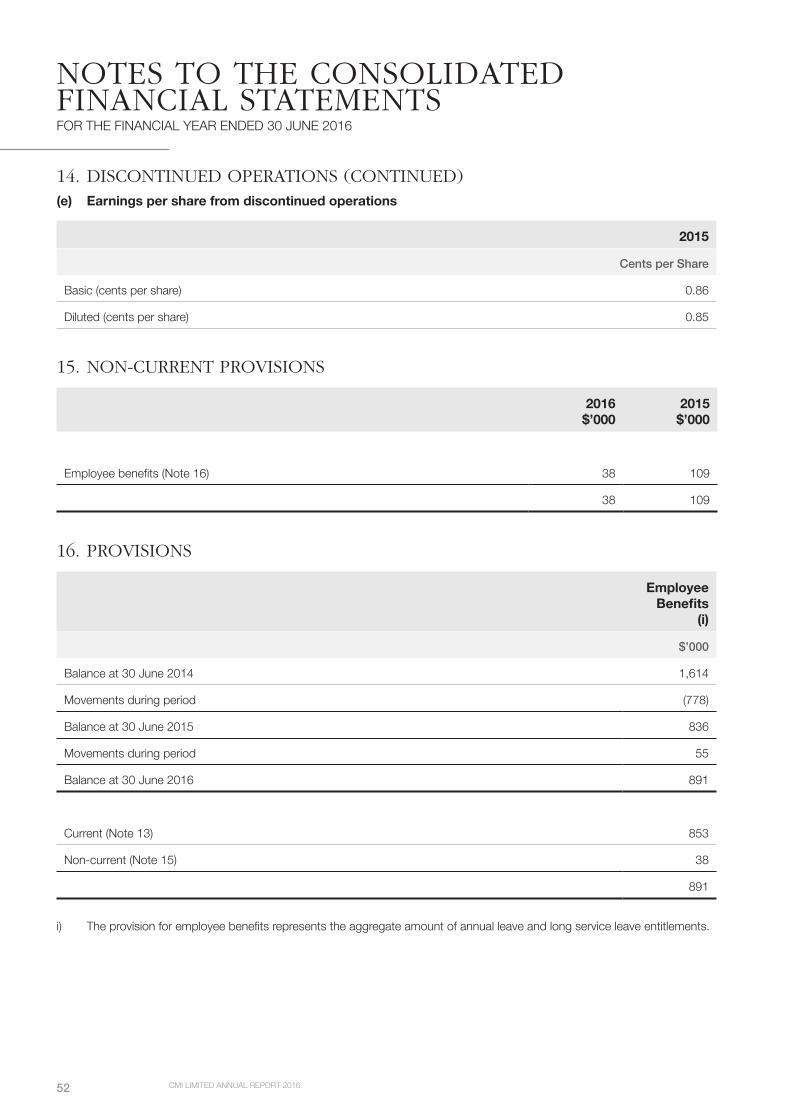
CMI LIMITED ANNUAL REPORT 201652
NOTES TO THE CONSOLIDATED FINANCIAL STATEMENTSFOR THE FINANCIAL YEAR ENDED 30 JUNE 2016
14. DISCONTINUED OPERATIONS (CONTINUED)(e) Earnings per share from discontinued operations
2015
Cents per Share
Basic (cents per share) 0.86
Diluted (cents per share) 0.85
15. NON-CURRENT PROVISIONS
2016 $’000
2015 $’000
Employee benefits (Note 16) 38 109
38 109
16. PROVISIONS
Employee Benefits
(i)
$’000
Balance at 30 June 2014 1,614
Movements during period (778)
Balance at 30 June 2015 836
Movements during period 55
Balance at 30 June 2016 891
Current (Note 13) 853
Non-current (Note 15) 38
891
i) The provision for employee benefits represents the aggregate amount of annual leave and long service leave entitlements.

CMI LIMITED ANNUAL REPORT 2016 53
17. LEASESOperating LeasesLEASING ARRANGEMENTS
Operating leases relate to property, plant and equipment with lease terms of between 1 to 13 years. All leases are non-cancellable, operate under normal commercial terms and conditions, and are payable on a monthly or quarterly basis. The consolidated entity does not have an option to purchase the leased asset at the expiry of the lease period.
2016 $’000
2015 $’000
Non-cancellable operating leases
Not later than 1 year 1,376 1,497
Later than 1 year but not later than 5 years 267 1,053
Later than 5 years - -
1,643 2,550
18. ISSUED CAPITAL
2016 $’000
2015 $’000
34,852,634 (2015: 34,552,634) fully paid ordinary shares 28,520 38,555
28,520 38,555
2016 2015
No ’000 $’000 No ’000 $’000
Fully Paid Ordinary Shares
Balance at beginning of financial year 34,553 38,555 34,553 38,555
Issue of shares 300 495 - -
Capital return - (10,456) - -
Transaction costs - (74) - -
Balance at end of financial year 34,853 28,520 34,553 38,555
Fully paid ordinary shares carry one vote per share and carry the right to dividends.

CMI LIMITED ANNUAL REPORT 201654
NOTES TO THE CONSOLIDATED FINANCIAL STATEMENTSFOR THE FINANCIAL YEAR ENDED 30 JUNE 2016
19. RESERVESa) Reserves Comprise:
2016 $’000
2015 $’000
Class A share reserve 6,802 6,802
Employee Equity-settled Benefits Reserve (117) 480
Foreign Currency Translation Reserve - -
6,685 7,282
b) Movements in Reserves
2016 $’000
2015 $’000
Foreign Currency Translation Reserve
Balance at beginning of financial year - 215
Translation of foreign operations - 454
Disposal of business - (669)
Balance at end of financial year - -
In the prior year, exchange differences relating to the translation from China RMB and USD, being the functional currency of the consolidated entity’s foreign controlled entity in the People’s Republic of China and United States of America, into Australian dollars were brought to account by entries made directly to the foreign currency translation reserve.
Employee Equity-settled Benefits Reserve
Balance at beginning of financial year 480 (117)
Share-based payment 108 679
Share-based payment – reversal of expense (210) (82)
Exercise of performance rights (495) -
Balance at end of financial year (117) 480
The employee equity-settled benefits reserve arises on the issue of performance rights to key management personnel. Further information about share-based payments to employees is included in Note 23 to the financial statements.
Class A Share Reserve
Balance at beginning of financial year 6,802 6,802
Balance at end of financial year 6,802 6,802
The Class A share reserve arises on the cancellation of all 28,005,311 Class A shares on issue on 12 June 2012.

CMI LIMITED ANNUAL REPORT 2016 55
20. RETAINED EARNINGS
2016 $’000
2015 $’000
Balance at beginning of financial year 14,808 11,430
Net profit/(loss) attributable to members of the parent entity 3,446 5,450
Dividends provided for or paid (3,137) (2,072)
Balance at end of financial year 15,117 14,808
21. EARNINGS PER SHARE – CONTINUING OPERATIONS
2016 2015
Cents per Share
Cents per Share
Basic earnings per share 9.90 14.91
Diluted earnings per share 9.83 14.61
Basic Earnings per Share
The earnings and weighted average number of ordinary shares used in the calculation of basic earnings per share are as follows:
2016 $’000
2015 $’000
Earnings (i) 3,446 5,151
No. ’000
No. ’000
Weighted average number of ordinary shares (ii) 34,806 34,553
(i) Earnings used in the calculation of basic earnings per share reconciles to net profit/(loss) in the Statement of Comprehensive Income as follows:
2016 $’000
2015 $’000
Net profit/(loss) from continuing operations 3,446 5,151
Earnings used in the calculation of basic EPS 3,446 5,151

CMI LIMITED ANNUAL REPORT 201656
NOTES TO THE CONSOLIDATED FINANCIAL STATEMENTSFOR THE FINANCIAL YEAR ENDED 30 JUNE 2016
21. EARNINGS PER SHARE – CONTINUING OPERATIONS (CONTINUED)(ii) Options and performance rights are considered to be potential ordinary shares and are therefore excluded from the
weighted average number of ordinary shares used in the calculation of basic earnings per share. Where dilutive, potential ordinary shares are included in the calculation of diluted earnings per share (refer below).
Diluted Earnings per Share
The earnings and weighted average number of ordinary and potential ordinary shares used in the calculation of diluted earnings per share are as follows:
2016 $’000
2015 $’000
Earnings (i) 3,446 5,151
No. ’000
No. ’000
Weighted average number of ordinary and potential ordinary shares (ii) 35,062 35,256
(i) Earnings used in the calculation of diluted earnings per share reconciles to net profit/(loss) in the Statement of Comprehensive Income as follows:
2016 $’000
2015 $’000
Net profit/(loss) from continuing operations 3,446 5,151
Earnings used in the calculation of diluted EPS 3,446 5,151
(ii) Weighted average number of ordinary shares and potential ordinary shares used in the calculation of diluted earnings per share reconciles to the weighted average number of ordinary shares used in the calculation of basic earnings per share as follows:
No. ’000
No. ’000
Weighted average number of ordinary shares used in the calculation of basic EPS (ii) 34,806 34,553
Performance Rights (iii) 256 703
Weighted average number of ordinary shares and potential ordinary shares used in the calculation of diluted EPS 35,062 35,256
(iii) Performance rights are included on the basis that they are dilutive.
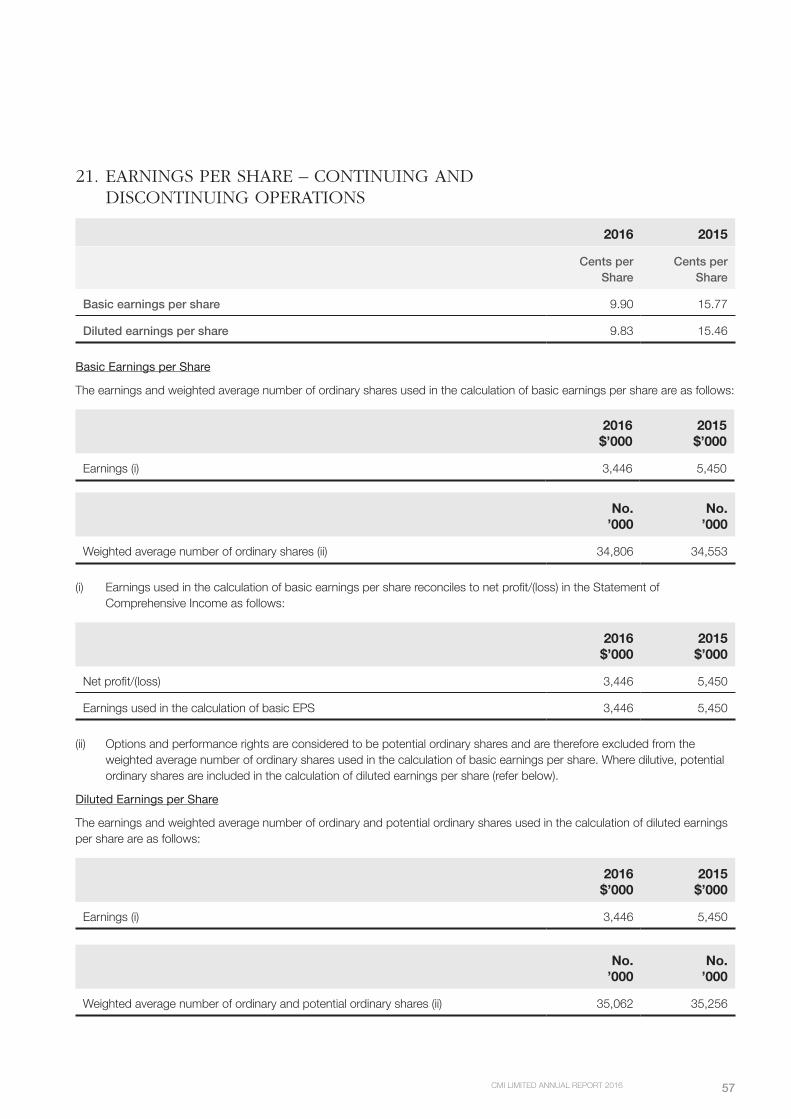
CMI LIMITED ANNUAL REPORT 2016 57
21. EARNINGS PER SHARE – CONTINUING AND DISCONTINUING OPERATIONS
2016 2015
Cents per Share
Cents per Share
Basic earnings per share 9.90 15.77
Diluted earnings per share 9.83 15.46
Basic Earnings per Share
The earnings and weighted average number of ordinary shares used in the calculation of basic earnings per share are as follows:
2016 $’000
2015 $’000
Earnings (i) 3,446 5,450
No. ’000
No. ’000
Weighted average number of ordinary shares (ii) 34,806 34,553
(i) Earnings used in the calculation of basic earnings per share reconciles to net profit/(loss) in the Statement of Comprehensive Income as follows:
2016 $’000
2015 $’000
Net profit/(loss) 3,446 5,450
Earnings used in the calculation of basic EPS 3,446 5,450
(ii) Options and performance rights are considered to be potential ordinary shares and are therefore excluded from the weighted average number of ordinary shares used in the calculation of basic earnings per share. Where dilutive, potential ordinary shares are included in the calculation of diluted earnings per share (refer below).
Diluted Earnings per Share
The earnings and weighted average number of ordinary and potential ordinary shares used in the calculation of diluted earnings per share are as follows:
2016 $’000
2015 $’000
Earnings (i) 3,446 5,450
No. ’000
No. ’000
Weighted average number of ordinary and potential ordinary shares (ii) 35,062 35,256

CMI LIMITED ANNUAL REPORT 201658
NOTES TO THE CONSOLIDATED FINANCIAL STATEMENTSFOR THE FINANCIAL YEAR ENDED 30 JUNE 2016
21. EARNINGS PER SHARE – CONTINUING AND DISCONTINUING OPERATIONS (CONTINUED)
(i) Earnings used in the calculation of diluted earnings per share reconciles to net profit/(loss) in the Statement of Comprehensive Income as follows:
2016 $’000
2015 $’000
Net profit/(loss) 3,446 5,450
Earnings used in the calculation of diluted EPS 3,446 5,450
(ii) Weighted average number of ordinary shares and potential ordinary shares used in the calculation of diluted earnings per share reconciles to the weighted average number of ordinary shares used in the calculation of basic earnings per share as follows:
No. ’000
No. ’000
Weighted average number of ordinary shares used in the calculation of basic EPS (ii) 34,806 34,553
Performance Rights (iii) 256 703
Weighted average number of ordinary shares and potential ordinary shares used in the calculation of diluted EPS 35,062 35,256
(iii) Performance rights are included on the basis that they are dilutive.
22. DIVIDENDS
2016 2016 2015 2015
Cents per Share
Total$’000
Cents per Share
Total$’000
Recognised Amounts
Fully Paid Ordinary Shares:
Final dividend 2015 – franked to 30% tax rate 6.00 2,091
Interim dividend 2016 – franked to 30% tax rate 3.00 1,046 - -
Final dividend 2014 – franked to 30% tax rate - - 3.00 1,036
Interim dividend 2015 – franked to 30% tax rate - - 3.00 1,036
3,137 2,072
Unrecognised Amounts
Fully Paid Ordinary Shares:
Final dividend 2016 – franked to 30% tax rate 3.00 1,046 6.00 2,073
1,046 2,073

CMI LIMITED ANNUAL REPORT 2016 59
22. DIVIDENDS (CONTINUED)On the basis that directors will continue to publicly recommend dividends in respect of ordinary shares subsequent to reporting date, in future financial reports the amount disclosed as “recognised” will be the final dividend in respect of the prior financial year, and the interim dividend in respect of the current financial year.
The consolidated entity’s adjusted franking account balance at 30 June 2016 on a tax paid basis is $21,662 thousand (2015: $22,787 thousand). The impact on the consolidated entity’s franking account balance of dividends not recognised is $448 thousand (2015: $888 thousand).
23. EMPLOYEE INCENTIVE SCHEMEThe company has an ownership-based remuneration scheme for employees. In accordance with the provisions of the scheme, as approved by shareholders at a general meeting, the Board may invite, on terms and conditions the Board determines, employees to apply for performance rights. The exercise price of the share performance rights is determined by the Board. All share performance rights carry no voting rights and do not entitle the holder to dividends.
The Board considered the Capital Return to be a Capital Event under the Company’s Performance Rights Plan because it diminished the value of the Performance Rights that have been issued but not exercised before the ‘ex’ date of the Capital Return. The formula, approved by shareholders, adjusts the number of shares that will be allocated on the exercise of each performance right to account for this diminution in value. This would result in 338,034 ordinary shares issued if the number of performance rights on issue at the end of the period were to vest in the future. The number of performance rights outstanding as at 30 June 2016 is unchanged as a result of the Capital Event.
Employee incentive scheme 2016 2015
Number of Rights
Weighted Average
Exercise PriceNumber of
Rights
Weighted Average
Exercise Price
Balance at beginning of financial year (i) 1,132,226 - 450,000 -
Granted during the financial year (ii) 38,169 - 966,847 -
Exercised during the financial year (iii) (300,000) - - -
Forfeited during the financial year (600,000) - (284,621) -
Balance at end of the financial year (iv) 270,395 - 1,132,226 -
(i) Balance at beginning of the financial year
2016 Rights– Series No. Grant dateExpiry/
Exercise dateExercise Price
$
Performance Rights 200,000 23/01/13 23/01/18 Nil
Performance Rights 932,226 16/12/14 16/12/19 Nil
2015 Rights – Series No. Grant date Expiry/Exercise date
Exercise Price $
Performance Rights 200,000 23/01/13 23/01/18 Nil
Performance Rights 250,000 25/02/13 25/02/18 Nil

CMI LIMITED ANNUAL REPORT 201660
NOTES TO THE CONSOLIDATED FINANCIAL STATEMENTSFOR THE FINANCIAL YEAR ENDED 30 JUNE 2016
23. EMPLOYEE INCENTIVE SCHEME (CONTINUED)(ii) Granted during the financial yearThere were 38,169 performance share rights issued during the period (2015: 966,847).
2016Option – Series No. Grant date
Expiry/Exercise
date
Exercise Price
$Performance Rights 38,169 25/11/15 25/11/20 -
2015Option – Series No. Grant date
Expiry/Exercise
date
Exercise Price
$Performance Rights 966,847 16/12/14 16/12/19 -
On the basis of the assessments, for the 12 months ended 30 June 2016, the Group has recognised a total share-based payment transactions expense of ($102,154) in the Statement of Comprehensive Income (2015: $595,951) which includes the reversal of expense previously recognised on performance rights which were forfeited during the year.
Inputs into the model Performance Rights Series
Grant Date 25/11/2015 16/12/2014 23/01/2013
Share Price $1.47 $1.30 $2.20
Volatility of Share Price N/a N/a 40.0%
Risk Free Rate N/a N/a 2.67%
Dividend yield 4.10% 4.60% 0.00%
Value per Right $1.31 $1.14 $1.44
Rights Outstanding 38,169 32,226 200,000
Total Value of Rights $49,926 $36,834 $288,000
Expiry Date 25/11/20 16/12/19 23/01/18
Review Date 30 June 2018 30 June 2017 30 June 2016
Vesting Conditions The right issued will vest if CMI achieves the following earnings per share (‘EPS’) growth rates at each of the Review Dates: • 10% EPS growth per annum before any Performance
Rights can vest; • Pro rata vesting of Performance Rights from 10% to 15%
EPS growth per annum; and • 15% EPS growth per annum for the full quantity of
Performance Rights to vest. The EPS growth rate hurdles will be calculated on a cumulative basis at each Review Date having regard to the basic EPS of 10.29 cents for the year ended 30 June 2014 and an adjusted basic EPS of 11.91 cents for the year ended 30 June 2015.
The right issued will vest if the Company achieves a TSR of 25% over the period from issue to 30 June 2016.
Service Condition Employed with CMI until 30 September 2018.
Employed with CMI until 30 September 2017.
Employed with CMI until 30 June 2016.
Status Unvested Unvested Unvested1
1 The TSR performance hurdle was not met in relation to the 200,000 performance rights with an expiry date of 23/01/2018. The performance rights can be converted at the discretion of the Directors’ up until the expiry date.

CMI LIMITED ANNUAL REPORT 2016 61
23. EMPLOYEE INCENTIVE SCHEME (CONTINUED)(iii) Exercised during the financial yearDuring the year, 300,000 Fully Paid Ordinary Shares were issued (2015: nil) resulting in the Issued Capital of CMI Limited being 34,852,634 Fully Paid Ordinary Shares at 30 June 2016 (2015: 34,552,634). This share issue related to vested performance rights issued in the year ended 30 June 2015.
2016Rights– Series
No. of options
exercised Grant date
Exercise date
Expiry date
Exercise Price
$
No. of shares issued
Fair value
received$
Fair value of shares at date
of issue$
Performance Rights 300,000 16/12/14 26/08/15 16/12/19 Nil 300,000 Nil 495,000
The fair value of the shares at the date of issue was based on the market value at that date.
(iv) Balance at end of the financial year
2016Rights – Series No.
Vested No.
Unvested No.
Grant date
ExpiryDate
Exercise Price
$
Performance Rights 200,000 - 200,000 23/01/13 23/01/18 Nil
Performance Rights 32,226 - 632,226 16/12/14 16/12/19 Nil
Performance Rights 38,169 - 38,169 25/11/15 25/11/20 Nil
2015Rights – Series No.
Vested No.
Unvested No.
Grant date
ExpiryDate
Exercise Price
$
Performance Rights 200,000 - 200,000 23/01/13 23/01/18 Nil
Performance Rights 932,226 300,000 632,226 16/12/14 16/12/19 Nil
24. KEY MANAGEMENT PERSONNEL COMPENSATIONThe aggregate compensation of the key management personnel of the consolidated entity is set out below:
CONSOLIDATED
2016 $
2015 $
Short-term employee benefits 1,047,113 1,955,133
Post-employment benefits 93,995 131,900
Other long-term benefits 10,873 14,816
Termination benefits - -
Share-based payment 107,572 677,658
1,259,553 2,779,507

CMI LIMITED ANNUAL REPORT 201662
NOTES TO THE CONSOLIDATED FINANCIAL STATEMENTSFOR THE FINANCIAL YEAR ENDED 30 JUNE 2016
25. REMUNERATION OF AUDITORS(a) Auditor of the Parent Entity
2016$’000
2015$’000
Auditing the financial report of CMI Limited (including half year review) 126,250 179,780
Other services in relation to the entity and any other entity in the consolidated group• Tax compliance
• Tax consulting services
77,12669,820
103,313-
273,196 283,093
The auditor of CMI Limited is Ernst & Young (2015: Ernst & Young).
26. OPERATING SEGMENTIn prior periods, for management purposes, the consolidated entity was organised into two major operating divisions – electrical components and 4WD components Australia, USA and China. These divisions were the basis on which the consolidated entity reported its primary segment information. The 4WD components division, TJM, was divested on 2 March 2015 resulting in the group having only one operating segment at 30 June 2015. The financial statements continue to reflect the single operating segment of electrical components which operates in Australia.
27. RELATED PARTY DISCLOSURESa) Parent entitiesThe parent entity in the consolidated entity is CMI Limited
b) Equity interest in subsidiariesDetails of the percentage of ordinary shares held in subsidiaries are disclosed in Note 28 to the financial statements.
c) Transactions with other related partiesThere were nil transactions with related parties during the financial year.
28. SUBSIDIARIES AND ASSOCIATES
Name of EntityCountry of
Incorporation
Ownership Interest
2016 %
2015 %
Parent Entity:
CMI Limited Australia
Subsidiaries and associates
CMI Operations Pty Ltd Australia (i) 100 100
(i) This wholly-owned subsidiary has entered into a deed of cross-guarantee with CMI Limited pursuant to ASIC Class Order 98/1418 and is relieved from the requirement to prepare an audited financial report.
The parties to the deed of cross-guarantee are the same entities that comprise the consolidated group. Refer to the consolidated Statement of Comprehensive Income and Statement of Financial Position.
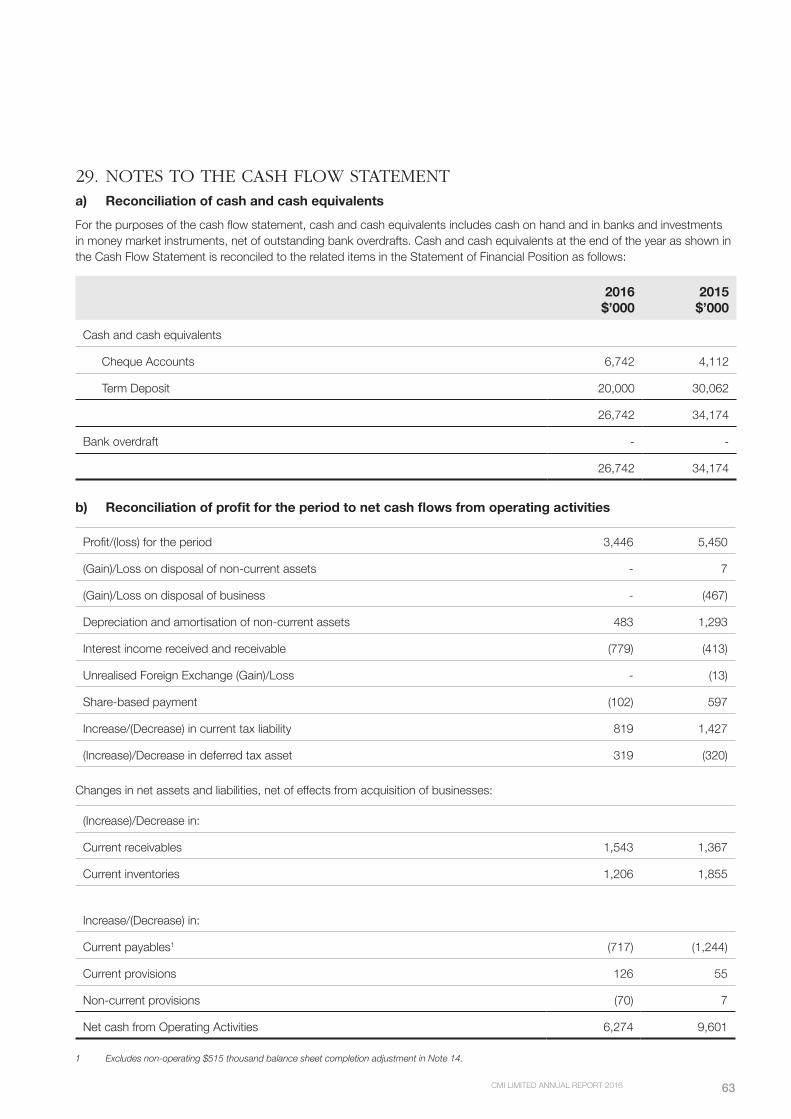
CMI LIMITED ANNUAL REPORT 2016 63
29. NOTES TO THE CASH FLOW STATEMENTa) Reconciliation of cash and cash equivalentsFor the purposes of the cash flow statement, cash and cash equivalents includes cash on hand and in banks and investments in money market instruments, net of outstanding bank overdrafts. Cash and cash equivalents at the end of the year as shown in the Cash Flow Statement is reconciled to the related items in the Statement of Financial Position as follows:
2016$’000
2015$’000
Cash and cash equivalents
Cheque Accounts 6,742 4,112
Term Deposit 20,000 30,062
26,742 34,174
Bank overdraft - -
26,742 34,174
b) Reconciliation of profit for the period to net cash flows from operating activities
Profit/(loss) for the period 3,446 5,450
(Gain)/Loss on disposal of non-current assets - 7
(Gain)/Loss on disposal of business - (467)
Depreciation and amortisation of non-current assets 483 1,293
Interest income received and receivable (779) (413)
Unrealised Foreign Exchange (Gain)/Loss - (13)
Share-based payment (102) 597
Increase/(Decrease) in current tax liability 819 1,427
(Increase)/Decrease in deferred tax asset 319 (320)
Changes in net assets and liabilities, net of effects from acquisition of businesses:
(Increase)/Decrease in:
Current receivables 1,543 1,367
Current inventories 1,206 1,855
Increase/(Decrease) in:
Current payables1 (717) (1,244)
Current provisions 126 55
Non-current provisions (70) 7
Net cash from Operating Activities 6,274 9,601
1 Excludes non-operating $515 thousand balance sheet completion adjustment in Note 14.

CMI LIMITED ANNUAL REPORT 201664
NOTES TO THE CONSOLIDATED FINANCIAL STATEMENTSFOR THE FINANCIAL YEAR ENDED 30 JUNE 2016
29. NOTES TO THE CASH FLOW STATEMENT (CONTINUED)c) Financing FacilitiesThe consolidated entity has the following finance facilities available:
(i) A Business Overdraft Facility with National Australia Bank Limited, reviewed annually
2016$’000
2015$’000
Amount Used - -
Amount Unused 2,500 2,500
2,500 2,500
(ii) A Finance Lease Facility with National Australia Bank Limited, reviewed annually
Amount Used - -
Amount Unused 2,000 2,000
2,000 2,000
30. CONTINGENT LIABILITY/ASSETContingent Liabilities (a)
Guarantees issued to bank in respect of lease of premises and supply contract performance(i) 253 571
Letters of credit in respect of overseas purchases (i) - 56
Guarantees arising from the deed of cross-guarantee with other entities in the wholly-owned group (ii) - -
253 627
Contingent assets - -
Contingent Liabilities(A) DISPOSAL OF TJM PRODUCTS DIVISION
CMI Limited has given certain warranties and indemnities to the purchaser of TJM that are contained and specified in the share sale agreement. These indemnities relate to potential and yet unknown liabilities that could be attributable to CMI before the business was sold to the purchaser. These are standard terms and conditions in the market sale of a business with various expiry dates up to 5 years from completion.
(i) A number of contingent liabilities arise as a result of guarantees made directly to financing organisations in respect of overseas purchases, lease of premises and supply contract performance. The amount disclosed represents the aggregate amount of such guarantees. The extent to which an outflow of funds will be required is dependent on the satisfaction of the obligations under the terms of the overseas purchases, leases and loans subject to the guarantees. The fair value of these guarantees has not been recognised as they are not considered material. The contingent liabilities are not recognised in the accounts as it is not probable that an outflow of resources embodying economic benefits will be required to settle the obligation.

CMI LIMITED ANNUAL REPORT 2016 65
30. CONTINGENT LIABILITY/ASSET (CONTINUED)Contingent Liabilities (continued)(A) DISPOSAL OF TJM PRODUCTS DIVISION (CONTINUED)
(ii) As detailed in Note 28, the company has entered into a deed of cross-guarantee with certain wholly-owned subsidiaries. The extent to which an outflow of funds will be required is dependent on the future operations of the entities that are party to the deed of cross-guarantee being more or less favourable than currently expected. The deed of cross-guarantee will continue to operate indefinitely. The fair value of these guarantees has not been recognised as they are not considered material.
31. FINANCIAL RISK MANAGEMENT OBJECTIVES AND POLICIESThe consolidated entity’s principal financial instruments comprise receivables, sundry receivables, payables, sundry payables, bank loans and overdrafts and cash. The consolidated entity does not enter into or trade financial instruments, including derivative financial instruments, for speculative purposes.
The consolidated entity’s activities expose it primarily to the financial risks of credit, changes in foreign currency exchange rates and interest rates.
Primary responsibility for identification and control of financial risks rests with the Board. The Board reviews and agrees policies for managing each of the risks identified below, including the setting of limits for trading derivatives, hedging foreign currency and interest rate risk, credit allowances, and future cash flow forecast projections.
Risk Exposures and ResponsesINTEREST RATE RISK
The consolidated entity’s exposure to market interest rates relates primarily to the consolidated entity’s long-term debt and overdraft obligations. The level of debt is disclosed in Note 12.
At balance date, the consolidated entity had the following mix of financial assets and liabilities exposed to Australian Variable interest rate risk that are not designated in cash flow hedges:
2016$’000
2015$’000
Financial Assets
Cash and cash equivalents 26,742 34,174
26,742 34,174
Financial Liabilities
Bank overdrafts - -
Net exposure 26,742 34,174
The consolidated entity’s policy is to manage its finance costs using a mix of fixed and variable rate debt. There is no set ratio for fixed and variable exposures.
The consolidated entity constantly analyses its interest rate exposure. Within this analysis consideration is given to potential renewals of existing positions, alternative financing, alternative hedging positions and the mix of fixed and variable interest rates.
The following sensitivity analysis is based on the interest rate risk exposures in existence at the reporting date. At 30 June 2016, if interest rates had moved, as illustrated in the table below, with all other variables held constant, post tax profit would have been affected as follows:

CMI LIMITED ANNUAL REPORT 201666
NOTES TO THE CONSOLIDATED FINANCIAL STATEMENTSFOR THE FINANCIAL YEAR ENDED 30 JUNE 2016
31. FINANCIAL RISK MANAGEMENT OBJECTIVES AND POLICIES (CONTINUED)
Post Tax Profit Higher/(Lower)
Judgements of reasonably possible movements2016
$’0002015
$’000
Consolidated
+1% (100 basis points) 187 239
-.5% (50 basis points) (94) (120)
The movements in profit are due to higher/lower interest earned from cash balances. There is no effect on equity, apart from retained earnings, for the sensitivity analysis. The Group has no interest bearing debt.
FOREIGN CURRENCY RISK
The consolidated entity also has minimal transactional currency exposures. Such exposure arises from sales or purchases by an operating entity in currencies other than the functional currency.
The consolidated entity’s continuing sales are denominated in the unit’s functional currency and approximately 98% of continuing costs are denominated in the unit’s functional currency.
The consolidated entity does not have a defined policy on foreign currency derivatives; however the Board assesses the risk of individual transactions as they are made for the requirement to use currency derivative instruments.
PRICE RISK
The consolidated entity’s exposure to commodity and equity securities price risk is minimal. As a result of this no derivative instruments are used.
CREDIT RISK
Credit risk arises from the financial assets of the consolidated entity, which comprise cash and cash equivalents and trade and other receivables. The consolidated entity’s exposure to credit risk arises from potential default of the counter party, with a maximum exposure equal to the carrying amount of these instruments. Exposure at balance date is addressed in each applicable note.
The consolidated entity trades only with recognised, creditworthy third parties, and as such collateral is not requested nor is it the consolidated entity’s policy to securitise its trade and other receivables. The consolidated entity does not hold any credit derivatives to offset its credit exposure.
It is the consolidated entity’s policy that all customers who wish to trade on credit terms are subject to credit verification procedures including an assessment of their independent credit rating, financial position, past experience and industry reputation. Risk limits are set for each individual customer in accordance with parameters set by the Board. These risk limits are regularly monitored. In certain instances credit insurance is purchased to mitigate the risk if the debtor defaults.
In addition, receivable balances are monitored on an ongoing basis with the result that the consolidated entity’s exposure to bad debts is reduced. There are no significant concentrations of credit risk within the consolidated entity.
LIQUIDITY RISK
The consolidated entity’s objective is to maintain a balance between continuity of funding and flexibility through the use of bank overdrafts, bank loans, finance leases and committed available credit lines. The consolidated entity’s policy does not state a fixed % of borrowings should mature in any 12 month period.

CMI LIMITED ANNUAL REPORT 2016 67
31. FINANCIAL RISK MANAGEMENT OBJECTIVES AND POLICIES (CONTINUED)The table below reflects all contractually fixed pay-offs and receivables for settlement, repayments and interest resulting from recognised financial liabilities, as of 30 June 2016. Cash flows for financial liabilities without fixed amount or timing are based on the conditions existing at 30 June 2016. The remaining contractual maturities of the consolidated entity’s financial liabilities which reflect trade payables, are:
2016$’000
2015$’000
0-12 months 4,083 5,315
1-5 years - -
Over 5 years - -
4,083 5,315
CAPITAL MANAGEMENT
When managing capital, management’s objective is to ensure the entity continues as a going concern as well as to maintain optimal returns to shareholders and benefits for other stakeholders. Management also aims to maintain a capital structure that ensures the lowest cost of capital available to the entity.
As the market is constantly changing, management may change the capital structure of the company, change the amount of dividends to be paid to shareholders, return capital to shareholders, issue new shares or sell assets to reduce debt. During 2016, the Board paid dividends of $3.137 million (2015: 2.072 million) and returned $10.456 million (2015: nil) of capital to shareholders.
At 30 June 2016 the Board has no current plans to issue further shares on the market besides those shares to be issued to satisfy vested performance rights.
Management monitor capital through the gearing ratio (net debt/total capital). The gearing ratios based on continuing operations at 30 June 2016 and 2015 were as follows:
2016$’000
2015$’000
Total borrowings - -
Add trade and other payables 4,083 5,315
Less cash and cash equivalents 26,742 34,174
Net debt (22,659) (28,859)
Total equity 50,322 60,645
Total capital and net debt (27,663) (31,786)
Gearing ratio 0% 0%
The group is not subject to any externally imposed capital requirements.

CMI LIMITED ANNUAL REPORT 201668
NOTES TO THE CONSOLIDATED FINANCIAL STATEMENTSFOR THE FINANCIAL YEAR ENDED 30 JUNE 2016
32. ADDITIONAL COMPANY INFORMATIONCMI Limited is a listed public company, incorporated and operating in Australia.
CMI Limited’s registered office and principal place of business is:
485A Zillmere Road Zillmere, Qld, 4034 Tel: (07) 3863 0667
33. SUBSEQUENT EVENTSIn respect of the financial year ended 30 June 2016, the directors recommend the payment of a final dividend to the holders of fully paid ordinary shares of $0.03 per share. The dividend is payable on 8 September 2016 to shareholders registered on the Record Date of 25 August 2016.
There has not been any other matter or circumstance, in the financial statements or notes thereto, that has arisen since the end of the financial year, that has significantly affected, or may significantly affect, the operations of the consolidated entity, the results of those operations, or the state of affairs of the consolidated entity in future financial years.

CMI LIMITED ANNUAL REPORT 2016 69
SHAREHOLDER INFORMATION AS AT 1 AUGUST 2016
The following additional information is required by the Australian Stock Exchange Limited.
1. ORDINARY SHAREHOLDER INFORMATIONThe following information with respect to 34,852,634 fully paid ordinary shares on issue reflects the Share Register at that date.
a) There were 980 holders of fully paid ordinary shares. All fully paid ordinary shares of the company carry one vote per share on poll, or one vote per member on a show of hands.
b) Distribution of shareholders:
Number1 – 1,000 shares 2271,001 – 5,000 shares 3415,001 – 10,000 shares 15810,001 – 100,000 shares 229100,001 – and over 25Total 980
c) The number of shareholdings held in less than a marketable parcel – 141.
d) Twenty largest shareholders:
Rank Investor Balance Capital1 LE RAE PTY LTD <CATCORP A/C> 12,420,484 35.64%
2 J P MORGAN NOMINEES AUSTRALIA LIMITED 4,507,653 12.93%
3 HSBC CUSTODY NOMINEES (AUSTRALIA) LIMITED 1,367,987 3.93%
4 ALMARGEM PTY LIMITED <THE MELLETT FAMILY A/C> 1,128,358 3.24%
5 LJ CATELAN SUPERANNUATION FUND PTY LTD 730,217 2.10%
6 CITICORP NOMINEES PTY LIMITED <COLONIAL FIRST STATE INV A/C> 663,233 1.90%
7 NATIONAL NOMINEES LIMITED 641,306 1.84%
8 MR PHILIP GORDON GREENHAM 630,000 1.81%
9 BNP PARIBAS NOMS PTY LTD <DRP> 543,165 1.56%
10 NORFOLK ENCHANTS PTY LTD <TROJAN RETIREMENT FUND A/C> 503,473 1.44%
11 LJ CATELAN SUPERANNUATION FUND PTY LTD <LJ CATELAN SUPER A/C> 451,608 1.30%
12 LEROPELA PTY LTD <TORRINGTON SUPER FUND A/C> 355,000 1.02%
13 ABN AMRO CLEARING SYDNEY NOMINEES PTY LTD <CUSTODIAN A/C> 341,267 0.98%
14 THE IRISH BUFFETT PTY LTD 301,100 0.86%
15 AUSTRALIAN EXECUTOR TRUSTEES LIMITED <NO 1 ACCOUNT> 294,402 0.84%
16 BUCKLAND (QLD) PTY LTD <THE BUCKLEY FAMILY A/C> 277,969 0.80%
17 MRS VERA KALABRIC 275,494 0.79%
18 JH NOMINEES AUSTRALIA PTY LTD <HARRY FAMILY SUPER FUND A/C> 252,444 0.72%
19 L J CATELAN SUPERANNUATION FUND PTY LTD <LJ CATELAN S/F A/C> 227,491 0.65%
20 FW HOLST & CO PTY LTD <FH A/C> 201,558 0.58%
TOTAL FOR TOP 20: 26,114,209 74.93%

CMI LIMITED ANNUAL REPORT 201670
SHAREHOLDER INFORMATION AS AT 1 AUGUST 2016
e) The names of substantial shareholders are:
Shareholder Number Percentage
LE RAE PTY LTD AND ASSOCIATED ENTITIES 13,829,800 39.68%
SCHRODER INVESTMENT MANAGEMENT AUSTRALIA LIMITED1 3,248,166 9.32%
ACORN CAPITAL LIMITED2 1,969,634 5.65%
1 Holding as at date of most recent substantial shareholder notice on 9 March 2016
2 Holding as at date of most recent substantial shareholder notice on 7 March 2016
2. STOCK EXCHANGE LISTINGQuotation has been granted for all fully paid Ordinary shares of the company on all Member Exchanges of the Australia Stock Exchange Limited.
3. THERE IS NO CONTINGENT LIABILITY REQUIRED FOR TERMINATION BENEFITS UNDER SERVICE AGREEMENTS WITH DIRECTORS
4. AN AUDIT COMMITTEE WAS IN EXISTENCE DURING THE YEAR
5. OPTIONS / PERFORMANCE RIGHTS270,395 performance rights are held by 1 right holder. Performance rights do not carry a right to vote.
6. ON MARKET BUY BACKThere is no current on-market buy-back.

CMI LIMITED ANNUAL REPORT 2016 71
CORPORATE DIRECTORY
REGISTERED OFFICE(Head Office)485A Zillmere Road Zillmere QLD 4034
T: 07 3863 0667F: 07 3863 0795E: [email protected]
www.cmilimited.com.au
ACN: 050 542 553
DIRECTORSLeanne Catelan Craig Green Steven Miotti
SECRETARYSharyn Williams
AUDITORErnst & YoungLevel 51111 Eagle StreetBrisbane QLD 4000
BANKERSNational Australia Bank LimitedLevel 20, 100 Creek StreetBrisbane QLD 4000
SHARE REGISTRYLink Market Services LimitedLocked Bag A14Sydney South NSW 1235
Telephone: 02 8280 7454Facsimile: 02 9287 0309
LAWYERSAllens LinklatersLevel 26 480 Queen Street Brisbane QLD 4000
ASX CODECMI – Ordinary shares

CMI LIMITED ANNUAL REPORT 201672
OFFICE LOCATIONS
CMI LIMITED – HEAD OFFICE485A Zillmere Road Zillmere QLD 4034
T: 07 3863 0667F: 07 3863 0795E: [email protected]
CMI ELECTRICAL PRODUCTS – HEAD OFFICE18-20 Railway RoadMeadowbank NSW 2114
T: 02 9807 6155F: 02 9808 2033El: [email protected]
QLD – Brisbane485A Zillmere RoadZillmere QLD 4034
T: 07 3863 0749F: 07 3863 0795E: [email protected]
QLD – Rockhampton76 Hollingsworth StreetNorth Rockhampton QLD 4701
T: 07 4921 0978F: 07 4921 0981E: [email protected]
VIC – Melbourne3-5 Dissik StreetCheltenham VIC 3192
T: 03 9532 1233F: 03 9553 3502E: [email protected]
WA – Perth36 Division StreetWelshpool WA 6106
T: 08 9358 1788F: 08 9358 1733E: [email protected]

CMI LIMITED ANNUAL REPORT 2016 73
