annual financial statements 2017 - aspen … group’s external auditor since the company’s...
TRANSCRIPT

ANNUAL FINANCIAL STATEMENTS 2017
Asp
en P
harm
acare Ho
ldin
gs Limited
Annual Financial Statem
ents 2017

Certificate of the Company Secretary
ContentsIFC Certificate of the Company Secretary
1 Audit & Risk Committee report
7 Statement of responsibility by the Board of Directors
8 Directors’ Report
12 Independent auditors’ report to the shareholders of Aspen Pharmacare Holdings Limited
18 Group statement of financial position
19 Group statement of comprehensive income
20 Group statement of changes in equity
21 Group statement of cash flows
22 Notes to the Group statement of cash flows
25 Group segmental analysis
30 Notes to the Group Annual Financial Statements
85 Residual accounting policies
95 Company Annual Financial Statements
118 Illustrative constant exchange rate report – Annexure 1
124 Shareholders’ statistics (unaudited)
126 Administration
127 Abbreviations
In my capacity as the Company Secretary & Group Governance Officer, I hereby confirm, in terms of the Companies Act, that for the year
ended 30 June 2017, the Company has lodged with the Companies and Intellectual Property Commission all such returns as are required of
a public company in terms of this Act, and that all such returns are, to the best of my knowledge and belief true, correct and up to date.
Riaan VersterCompany Secretary & Group Governance Officer
Johannesburg30 October 2017
All company names have been abbreviated throughout the Annual Financial Statements and appear on pages 127 and 128.
Aspen Pharmacare Holdings Limited Annual Financial Statements 2017
Aspen Pharmacare Holdings Limited Annual Financial Statements 2017
1
Audit & Risk Committee report
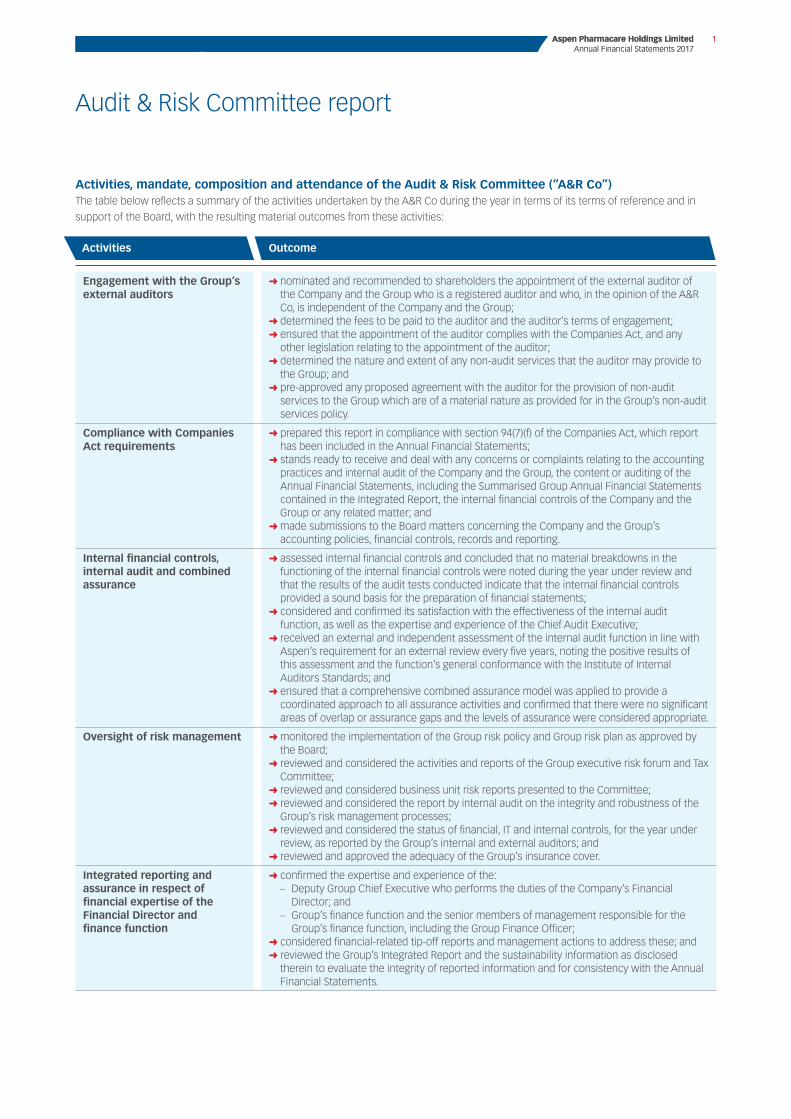
Activities, mandate, composition and attendance of the Audit & Risk Committee (“A&R Co”) The table below reflects a summary of the activities undertaken by the A&R Co during the year in terms of its terms of reference and in
support of the Board, with the resulting material outcomes from these activities:
Activities Outcome
Engagement with the Group’s external auditors
➜➜ nominated and recommended to shareholders the appointment of the external auditor of the Company and the Group who is a registered auditor and who, in the opinion of the A&R Co, is independent of the Company and the Group;➜➜ determined the fees to be paid to the auditor and the auditor’s terms of engagement;➜➜ ensured that the appointment of the auditor complies with the Companies Act, and any other legislation relating to the appointment of the auditor;➜➜ determined the nature and extent of any non-audit services that the auditor may provide to the Group; and➜➜ pre-approved any proposed agreement with the auditor for the provision of non-audit services to the Group which are of a material nature as provided for in the Group’s non-audit services policy.
Compliance with Companies Act requirements
➜➜ prepared this report in compliance with section 94(7)(f) of the Companies Act, which report has been included in the Annual Financial Statements;➜➜ stands ready to receive and deal with any concerns or complaints relating to the accounting practices and internal audit of the Company and the Group, the content or auditing of the Annual Financial Statements, including the Summarised Group Annual Financial Statements contained in the Integrated Report, the internal financial controls of the Company and the Group or any related matter; and➜➜ made submissions to the Board matters concerning the Company and the Group’s accounting policies, financial controls, records and reporting.
Internal financial controls, internal audit and combined assurance
➜➜ assessed internal financial controls and concluded that no material breakdowns in the functioning of the internal financial controls were noted during the year under review and that the results of the audit tests conducted indicate that the internal financial controls provided a sound basis for the preparation of financial statements;➜➜ considered and confirmed its satisfaction with the effectiveness of the internal audit function, as well as the expertise and experience of the Chief Audit Executive;➜➜ received an external and independent assessment of the internal audit function in line with Aspen’s requirement for an external review every five years, noting the positive results of this assessment and the function’s general conformance with the Institute of Internal Auditors Standards; and➜➜ ensured that a comprehensive combined assurance model was applied to provide a coordinated approach to all assurance activities and confirmed that there were no significant areas of overlap or assurance gaps and the levels of assurance were considered appropriate.
Oversight of risk management ➜➜ monitored the implementation of the Group risk policy and Group risk plan as approved by the Board;➜➜ reviewed and considered the activities and reports of the Group executive risk forum and Tax Committee;➜➜ reviewed and considered business unit risk reports presented to the Committee;➜➜ reviewed and considered the report by internal audit on the integrity and robustness of the Group’s risk management processes;➜➜ reviewed and considered the status of financial, IT and internal controls, for the year under review, as reported by the Group’s internal and external auditors; and➜➜ reviewed and approved the adequacy of the Group’s insurance cover.
Integrated reporting and assurance in respect of financial expertise of the Financial Director and finance function
➜➜ confirmed the expertise and experience of the: ➜– Deputy Group Chief Executive who performs the duties of the Company’s Financial
Director; and ➜– Group’s finance function and the senior members of management responsible for the
Group’s finance function, including the Group Finance Officer;➜➜ considered financial-related tip-off reports and management actions to address these; and➜➜ reviewed the Group’s Integrated Report and the sustainability information as disclosed therein to evaluate the integrity of reported information and for consistency with the Annual Financial Statements.
Aspen Pharmacare Holdings Limited Annual Financial Statements 2017
1

2 Aspen Pharmacare Holdings Limited Annual Financial Statements 2017
Audit & Risk Committee report continued
Audit & Risk Committee Terms of ReferenceThe A&R Co has adopted formal Terms of
Reference as incorporated in the Board
Charter which have been approved by the
Board of Directors. The Terms of Reference
are reviewed as necessary. The
Committee has conducted its affairs in
compliance with these Terms of Reference
and has discharged its responsibilities
contained therein.
Committee members and attendance at meetingsThe A&R Co is constituted as a statutory
committee in terms of the provisions of
section 94 of the Companies Act and has
an independent role with accountability to
both the Board and shareholders. The A&R
Co consists of five independent, non-
executive directors elected by
shareholders at the annual general
meeting, on the recommendation of the
Board. The Board elects the Chairman of
the A&R Co.
The Deputy Group Chief Executive, Group
Finance Officer, Chief Audit Executive,
Company Secretary & Group Governance
Officer, Group Risk & Sustainability Manager
and representatives of the internal and
external auditors attend meetings by
invitation. All directors have a standing
invitation to attend the Committee’s
meetings. From time to time other
executives and directors of the Group
attend meetings of the A&R Co as
requested. The Committee has unrestricted
access to the external and internal auditors.
In accordance with the Terms of
Reference, the Committee meets at least
four times annually, but more often if
necessary. During the year under review,
the Committee met eight times. The
minutes of these meetings are made
available to all directors by means of a
database of documents they can access
online. The Chairman of the Committee
provides the Board with a verbal report of
the Committee’s activities at each Board
meeting.
The Chairman of the Committee
represents the A&R Co at the annual
general meeting each year.
The Company Secretary & Group
Governance Officer is also the secretary
of the Committee.
The Remuneration & Nomination
Committee (“R&N Co”), through its
nomination process, ensures that members
are sufficiently qualified and experienced in
matters such as financial and sustainability
reporting, internal financial controls,
external and internal audit processes,
corporate law, risk management, financial
sustainability issues, IT governance as it
relates to integrated reporting and
governance processes.
The following table of attendance at A&R Co meetings reflects the Committee’s meetings held during the year and the attendance of these
meetings by its members during the year:
A&R Co
7 September 2016
13 September 2016
19 October 2016
24 October 2016
2 December 2016
28 February 2017
7 March2017
19 June 2017
Roy Andersen ü ü ü ü ü ü ü ü
John Buchanan (Chairman) ü ü ü ü ü ü ü ü
Maureen Manyama ü ü ü ü ü ü ü ü
Babalwa Ngonyama Apology ü ü ü ü ü ü ü
Sindi Zilwa ü ü ü ü ü ü ü ü
The overall average attendance for the A&R Co meetings held during the year was 97,5%.

Aspen Pharmacare Holdings Limited Annual Financial Statements 2017
3
Roles and responsibilitiesThe A&R Co has an independent role with
accountability to both the Board and our
shareholders. The Committee does not
assume the functions of management,
which remain the responsibility of the
executive directors, officers and other
senior members of management.
The Committee is, inter alia, responsible
for assisting the Board in discharging its
duties in respect of the safeguarding of
assets, accounting systems and practices,
internal control processes and the
preparation of the Group and Company
Annual Financial Statements in line with
the relevant financial reporting standards
as applicable from time to time.
External auditorThe Committee has satisfied itself that the
external auditor, PricewaterhouseCoopers
Inc., was independent of the Group, as
required by the Companies Act, which
includes consideration of compliance with
criteria relating to independence or
conflicts of interest as prescribed by the
Independent Regulatory Board for
Auditors. Requisite assurance was sought
and provided by the auditor that internal
governance processes within the audit
firm support and demonstrate its claim
to independence.
The A&R Co has also satisfied itself with
the quality of the external audit work
being performed by
PricewaterhouseCoopers Inc. and that the
firm and relevant designated auditor are
accredited with the JSE list of auditors and
the Independent Regulatory Body of
Auditors and hold the requisite
certifications and registrations. In line with
changes to the JSE Listings Requirements
the Committee will, in recommending the
appointment of a proposed external
auditor, call for and request:
➜➜ the decision letter and findings report of
the inspection report issued in respect
of the firm by the Independent
Regulatory Board for Auditors (“IRBA”)
of South Africa on both the proposed
external audit firm and the designated
individual director;
➜➜ a summary of the proposed external
audit firm monitoring procedures; and
➜➜ the outcome and summary of any legal
or disciplinary proceedings which may
have been instituted by the IRBA
against the proposed external audit firm
and designated individual auditor.
PricewaterhouseCoopers Inc. has been
the Group’s external auditor since the
Company’s listing on the JSE in 1998.
Tanya Rae was appointed as the
Company’s designated auditor for the
June 2013 financial year and is set to step
down after completion of the audit of the
financial year ended 30 June 2017 in terms
of the five-year designated auditor
rotation provisions contained in the
Companies Act. The A&R Co has agreed to
recommend to shareholders the
appointment of Craig West of
PricewaterhouseCoopers Inc. as the
designated auditor, responsible for
performing the functions of auditor, for the
2018 financial year to replace Tanya Rae.
SizweNtsalubaGobodo Inc. has again been
appointed to share in the auditing of the
Company’s South African subsidiaries in
the forthcoming year.
The Committee, in consultation with
executive management, agreed to the
engagement letter, terms, audit plan and
budgeted audit fees for the financial year
ended 30 June 2017.
There is a formal procedure that governs
the process whereby the external auditor
is considered for non-audit services. The
Committee approved the terms of the
service agreement for the provision of
non-audit services by the external auditor,
and approved the nature and extent of
non-audit services that the external
auditor provided in terms of the agreed
pre-approval policy. During the year an
amount of R2 167 189 was paid to
PricewaterhouseCoopers Inc. in respect of
non-audit services, which is approximately
9% of the external audit fee paid for
the year.
The external auditors are invited to and
attend all A&R Co meetings and are
required to meet independently with the
A&R Co at least annually. Findings by the
external auditors arising from their annual
statutory audit are tabled and presented
at an A&R Co meeting following the audit.
The Committee endorses action plans for
management to mitigate noted concerns.
The external auditor has expressed an
unqualified opinion on the Annual
Financial Statements for the year ended
30 June 2017.
Internal financial controlsThe key internal financial controls in
operation for all significant operating
businesses within the Group are
documented in formalised financial
internal control frameworks and these
frameworks are maintained and updated
by financial management during the
course of the year or as part of the
year-end process.
Based on the results of the formal
documented review of the design,
implementation and effectiveness of the
Group’s systems of internal financial
controls conducted by Group internal
audit, supported by approved outsourced
internal audit service providers during the
2017 financial year and, in addition,
considering information and explanations
given by management and discussions
with the external auditor on the results of
their audits, no material breakdowns in
the functioning of the internal financial
controls were noted during the year under
review.
The results of the audit tests conducted
indicate that the internal financial controls
provide a sound basis for the preparation
of financial statements.
Expertise and experience of the Financial Director and the finance functionThe A&R Co has considered and is
satisfied with the expertise and
experience of the Deputy Group Chief
Executive who performs the duties of the
Company’s Financial Director.
Aspen Pharmacare Holdings Limited Annual Financial Statements 2017
3

4 Aspen Pharmacare Holdings Limited Annual Financial Statements 2017
Audit & Risk Committee report continued
Furthermore, the Committee has
considered, and has satisfied itself of the
appropriateness of the expertise and
adequacy of resources of the Group’s
finance function and experience of the
senior members of management
responsible for the Group’s finance
function, including the Group Finance
Officer.
Annual Financial StatementsThe A&R Co assists the Board with all
financial reporting and reviews the Annual
Financial Statements as well as trading
statements, preliminary results
announcements and interim financial
information.
The A&R Co has reviewed the Annual
Financial Statements of the Company and
the Group and is satisfied that they
comply with International Financial
Reporting Standards.
The following significant matters were considered by the A&R Co in relation to these annual financial statements:
Matter Outcomes
Carrying value of goodwill and intangible
assets and the indefinite useful life
assumption
➜➜ Management’s assertions in respect of the indefinite useful life assumption and impairment assessments of certain key brands and intangible assets, individual brand plans, market performance and peer comparatives were considered➜➜ The A&R Co was satisfied that there were no material inconsistencies or concerns in this respect
Group tax positions ➜➜ The Group operates in a complex multinational tax environment and there are open tax and transfer pricing matters with tax authorities. Judgement is required in assessing the level of provisions required in respect of uncertain tax positions➜➜ The A&R Co considered the level of tax provisioning to be acceptable in the context of the Group financial statements taken as a whole
Accounting for new business combinations
and acquisition related-contingent liabilities
➜➜ A number of significant transactions were concluded by the Group during the year and judgement is required in determining the appropriate accounting treatment, valuation of intangible assets and disclosures in respect of business combinations➜➜ The accounting treatment, valuation of intangible assets and disclosure of the business combinations in the Annual Financial Statements were deemed to be appropriate
Going concernThe A&R Co reviewed a documented
assessment by management of the going
concern premise of the Group before
concluding to the Board that the Group is
a going concern and will remain so for the
foreseeable future.
Duties assigned by the BoardThe duties and responsibilities of the
members of the Committee are set out in
the A&R Co Terms of Reference included
in the Board Charter, which is approved by
the Board.
The A&R Co fulfils an oversight role
regarding the Group’s Integrated Report
and the reporting process, including the
system of internal financial controls. It is
responsible for ensuring that the internal
audit function is independent and has the
necessary resources, standing and
authority within the Group to enable it to
discharge its duties. Furthermore, the A&R
Co oversees cooperation between the
internal and external auditors.
During the year, the Committee met with
the external auditors and with the Chief
Audit Executive without management
being present. No matters that required
attention arose from these meetings.
The Committee also receives regular
feedback from our Group Tax Committee
which is charged with ensuring all Group
companies implement the Group’s tax
philosophy and policies. The Group Tax
Committee comprises the Deputy Group
CEO, Group Finance Officer, the Head of
Treasury and Group Tax Executive, who
meet on a regular basis to discuss the
status of the Group’s tax affairs. Significant
matters are immediately brought to the
attention of the A&R Co.
The Committee ensures that a combined
assurance model is applied to provide a
coordinated approach to all assurance
activities. No significant areas of overlap
or assurance gaps have been identified
and the levels of assurance are
considered appropriate.
The A&R Co is satisfied that it has
complied with its legal, regulatory and
other responsibilities.

Aspen Pharmacare Holdings Limited Annual Financial Statements 2017
5
Internal auditThe A&R Co is responsible for overseeing
Internal Audit and has considered and
approved the internal audit charter and
internal audit’s annual risk-based audit
plan.
Internal audit reports centrally with
responsibility for reviewing and providing
assurance on the adequacy of the internal
control environment across all of the
Group’s significant operations. Various
financial internal control audits were
outsourced to an auditing firm, ensuring
that specialist resources are utilised for
financial internal control assessments. The
internal audit plan follows a three-year
cycle and is revised regularly in
accordance with the risk profiles as
discussed and tabled at the A&R Co
meetings with any changes to the internal
audit plan being approved by the
Committee.
Each internal audit conducted is followed
up by a detailed report to operational and
senior management, including
recommendations on aspects requiring
improvement. The Chief Audit Executive is
responsible for reporting the findings of
the internal audit work against the agreed
internal audit plan to the A&R Co at each
Committee meeting. Copies of the
detailed reports are also provided to the
A&R Co together with an overall summary
of the audit result for each audit.
The Chief Audit Executive has direct
access to the A&R Co, primarily through
its chairman, and attends A&R Co
meetings by invitation.
The A&R Co is responsible for the
appointment and removal of the Chief
Audit Executive. The Committee is also
responsible for the assessment of the
performance of the Chief Audit Executive
and the internal audit function. The
Committee has considered and is satisfied
with the effectiveness of the internal audit
function. The A&R Co has also considered
and is satisfied with the expertise and
experience of the Chief Audit Executive.
An external and independent assessment
of the internal audit function was
performed during the year under review in
line with our requirement for an external
review every five years. The assessment
indicated positive results and the
function’s general conformance with the
Institute of Internal Auditors Standards.
Combined AssuranceWe apply a combined assurance approach
to validate the effectiveness of controls
related to key risk responses and
mitigation activities and thereby
corroborate management’s self-
assessment of the effectiveness of
existing risk responses. This provides the
Board with a corroborated evaluation of
the risk responses and mitigation controls
through a combination of the following
five lines of assurance:
➜➜ The organisation’s line functions that
own and manage risks – first line of
assurance;
➜➜ Specialist functions that facilitate and
oversee risk management and
compliance – second line of assurance;
➜➜ Internal assurance providers – third line
of assurance;
➜➜ Independent external assurance
providers – fourth line of assurance;
and
➜➜ Governing body and committees – fifth
line of assurance.
The required level of combined assurance
is determined by the effectiveness of the
risk response activities and the impact of
such risk to the Group.
Whistle-blowingOur whistle-blowing arrangements are
approved and monitored by the A&R Co
and the Social & Ethics Committee (“S&E
Co”). The Group Ethics Committee (a
management committee consisting of
four senior functional executives) receives
and deals with any concerns or
complaints, whether from within or
outside Aspen, through an independent
specialised tip-offs call centre and tables
this information and the results of
follow-ups at each S&E Co meeting.
Financial-related tip-offs are then also
tabled at the A&R Co meetings.
Both committees are satisfied that
instances of whistle-blowing were
appropriately dealt with.
Integrated and sustainability reportingThe A&R Co considered the Group’s
Integrated Report and the sustainability
information as disclosed therein to
evaluate the integrity of reported
information and for consistency with
the Annual Financial Statements. The
A&R Co has reviewed the sustainability
information.
During the 2017 financial year, the A&R Co
considered the results of the sustainability
audits conducted by Environmental
Resources Management and limited
assurance engagements performed on
selected key performance indicators by
Environmental Resources Management,
PricewaterhouseCoopers Inc., as the
Group’s external auditors, and Internal
Audit.
The Committee is satisfied that the
sustainability information, as presented in
the 2017 Integrated Report online, is
reliable, consistent and fairly presented.
Aspen Pharmacare Holdings Limited Annual Financial Statements 2017
5

6 Aspen Pharmacare Holdings Limited Annual Financial Statements 2017
Audit & Risk Committee report continued
At year end, the Board was satisfied with
the status and effectiveness of risk
governance in the Group and adequacy of
mitigation plans for material risks. Internal
Audit found the implemented risk
management process to be effective and
has made recommendations for
improvement which will be implemented
as part of the continuous improvement
process.
Recommendation of the Integrated Report and related sustainability information for approval by the BoardAt its meeting held on 25 October 2017,
the A&R Co reviewed and recommended
the Integrated Report and related
sustainability information, as well as the
Annual Financial Statements for approval
by the Board of Directors.
John BuchananA&R Co Chairman
Evaluations of material risks and of the
effectiveness of the risk management
process were conducted during the year
by the Group Executive Risk Forum and
the findings of these evaluations were
reported to the A&R Co. Following a
comprehensive review of risks and
mitigating controls at the A&R Co meeting,
the Committee formulated an overall
conclusion and submitted a formal risk
review report to the Board. The
Committee’s report included an opinion
on the overall status of material residual,
reputational and uncertain risks with
reference to the adequacy of related
mitigating controls and to the approved
risk appetite. The report also presented an
opinion on the effectiveness of the risk
management process implemented in the
Group, supported by the internal audit
report.
In arriving at its opinion, the A&R Co
undertook the following activities:
➜➜ monitored the implementation of the
Group risk policy and Group risk plan as
approved by the Board;
➜➜ reviewed and considered the activities
and reports of the Group executive risk
forum;
➜➜ reviewed and considered business unit
risk reports presented to the
Committee;
➜➜ reviewed and considered the report by
Internal Audit on the integrity and
robustness of the Group’s risk
management processes;
➜➜ reviewed and considered the status of
financial, IT and internal controls, for the
year under review, as reported by the
Group’s internal and external auditors;
and
➜➜ reviewed and approved the adequacy
of the Group’s insurance cover, after
having considered the claims for the
prior year, a summary of the proposed
insurance arrangements for the ensuing
year and the insurable, but uninsured
risks.
Risk managementOversight of the Group’s risk management
function has been assigned to the A&R Co.
The Board considers risk management to
be a key process in the responsible
pursuit of strategic objectives and in the
effective management of related material
issues across the Group. Our management
culture is underpinned by effective risk
identification and mitigation activities
which are applied, on a day-to-day basis,
through a system of internal controls,
monitoring mechanisms and relevant
stakeholder engagement activities. In
accordance with the Group’s risk
philosophy, business activities and
business plans are aligned to the Group’s
governance, economic, environmental and
social aspirations.
The Board of Directors is responsible for
the governance of risk across the Group,
for setting the risk appetite and for
monitoring the effectiveness of our risk
management processes. This
responsibility is delegated to the A&R Co.
The Group’s integrated risk management
model considers strategic, operational,
financial and compliance risks.
Reputational risks and uncertain risks,
which are inherent to our business and
to the pharmaceutical industry in general,
are also identified, monitored, recorded
and appropriately managed. Risk
indicators and risk appetite are reviewed
and approved by the Board on an annual
basis or more frequently where required.
The boards of directors of our subsidiary
companies are responsible for oversight
of the risk management processes
implemented at the relevant business
units and for monitoring the effectiveness
of the implemented risk management
systems to ensure business continuity.

Aspen Pharmacare Holdings Limited Annual Financial Statements 2017
7
Statement of responsibility by the Board of Directors
The directors are responsible for the preparation, integrity and fair presentation of the Annual Financial Statements for the year ended 30 June 2017 (“Annual Financial Statements”) of Aspen Pharmacare Holdings Limited and its subsidiaries.
The directors consider that in preparing the Annual Financial Statements they have used the most appropriate accounting policies, consistently applied and supported by reasonable and prudent judgements and estimates, and that all International Financial Reporting Standards (“IFRS”) that they consider to be applicable have been followed. The directors are satisfied that the information contained in the Annual Financial Statements fairly presents the results of operations for the year and the financial position of the Group at year end. The directors further acknowledge that they are responsible for the content of the Integrated Report and its supplementary documents, as well as its consistency with the Annual Financial Statements.
The directors have responsibility for ensuring that accounting records are kept. The accounting records should disclose with reasonable accuracy the financial position of the Group to enable the directors to ensure that the Annual Financial Statements comply with the relevant legislation.
The preparation of the Annual Financial Statements in conformity with IFRS requires management to make estimates and assumptions that affect the reported amounts of assets and liabilities at the date of the Annual Financial Statements and the reported expenses during the reporting period. Actual results could differ from those estimates.
Aspen Pharmacare Holdings Limited and its subsidiaries operated in a well-established control environment, which is well documented and regularly reviewed. This incorporates risk management and internal control procedures, which are designed to provide reasonable, but not absolute, assurance that assets are safeguarded and the risks facing the business are being controlled.
The going concern basis has been adopted in preparing the Annual Financial Statements. The directors have no reason to believe that the Group or any company within the Group will not be going concerns in the foreseeable future, based on forecasts, available cash resources and facilities. These Annual Financial Statements support the viability of the Company and the Group.
The Code of Conduct has been adhered to in all material respects.
The Group’s external auditors, PricewaterhouseCoopers Incorporated, audited the Annual Financial Statements, and their report is presented on page 12.
The Annual Financial Statements were prepared under the supervision of Deputy Group Chief Executive, Gus Attridge CA(SA) and approved by the Board of Directors on 25 October 2017 and are signed on its behalf.
A signed copy of these Annual Financial Statements is available for inspection at the Company’s registered office.
Kuseni DlaminiChairman
Gus AttridgeDeputy Group Chief Executive
Johannesburg 30 October 2017
Aspen Pharmacare Holdings Limited Annual Financial Statements 2017
7

8 Aspen Pharmacare Holdings Limited Annual Financial Statements 2017
Directors’ Report
The directors have pleasure in presenting their report of the Group and the Company for the year ended 30 June 2017.
Nature of businessAspen is a global supplier and manufacturer of specialty, branded and generic pharmaceuticals, with an extensive basket of products that provide treatment for a broad spectrum of acute and chronic conditions experienced through all stages of life. The Group continues to increase the number of lives benefiting from its products, reaching more than 150 countries.
Financial results and review of operationsThe financial results of the Group are set out on pages 18 to 94 and of the Company on pages 95 to 117 of the Annual Financial Statements. The segmental analysis is included on pages 25 to 29.
The consolidated earnings attributable to equity holders of the Company amounted to R5,1 billion for the year, compared with R4,3 billion for the previous year, an increase of 18%. Headline earnings per share (“HEPS”) increased by 46% from 889,0 cents to 1 299,5 cents.
The financial results are more fully described in the Annual Financial Statements.
Share capitalThere was no change to the authorised ordinary share capital of Aspen during the year. The following changes to the issued share capital were effected during the year:
Number of shares
(Million)
Share capital(Billion)
Ordinary sharesOpening balance 456,4 2,1Capital distribution – –Shares issued – share schemes – –
456,4 2,1
Further details of the authorised and issued share capital of the Company are given in note 11 of the Group Annual Financial Statements and note 12 of the Company Annual Financial Statements.
The unissued ordinary shares are under the control of the directors of the Company until the next annual general meeting.
Directorate and SecretaryNo changes took place in the directorate during the year. Maureen Manyama was appointed as a member of the S&E Co with effect from 11 August 2016.
The names of the directors in office at the date of this report are set out on pages 96 to 99 of the Integrated Report. The Company Secretary & Group Governance Officer is Riaan Verster. His business and postal addresses appear on page 126 of this report.
In terms of the Company’s Memorandum of Incorporation, Roy Andersen, John Buchanan, Kuseni Dlamini, Chris Mortimer and Maureen Manyama retire by rotation, and being eligible offer themselves for re-election.
The Group Chief Executive and the Deputy Group Chief Executive are employed on indefinite term service contracts subject to a six-month notice period by either party.
Details of directors’ interests in the Company’s issued shares are shown on page 114 of the Integrated Report and directors’ remuneration details are set out in note 22 of the Group Annual Financial Statements.
No changes have taken place in the interests of the directors in the shares of the Company since 30 June 2017 and the date of this report.

Aspen Pharmacare Holdings Limited Annual Financial Statements 2017
9
Group share trading policyIt is Group policy that all directors and their associates should not deal in shares or otherwise transact in the securities of the Company for the periods from half year end and year end to 24 hours after publication of the half year end and year end results or when the Company is trading under a cautionary announcement.
TransactionsThe following notable transactions were effected during the 2017 financial year:
Acquisition of rights to commercialise AstraZeneca’s Global Anaesthetics PortfolioIn August 2016, Aspen Global Incorporated Inc (“AGI”) signed an agreement with AstraZeneca AB and AstraZeneca UK (“AstraZeneca”) whereby AGI agreed to acquire the exclusive rights to commercialise AstraZeneca’s Global (excluding the USA) Anaesthetics Portfolio (“the AZ Transaction”). AstraZeneca’s Anaesthetics Portfolio comprises seven established medicines, namely Diprivan (general anaesthesia), EMLA (topical anaesthetic) and five local anaesthetics (Xylocaine/Xylocard/Xyloproct, Marcaine, Naropin, Carbocaine and Citanest) (“the AZ Portfolio”). The products in the AZ Portfolio are sold in more than 100 countries worldwide including China, Japan, Australia and Brazil. These products generated revenue of USD592 million in the year ended 31 December 2015. In terms of the concluded agreement, the consideration payable by AGI for the commercialisation rights was USD520 million and double-digit percentage royalties on sales of the AZ Portfolio.
Additionally, AGI will make sales-related payments of up to USD250 million based on sales in the 24 months after 1 September 2016. AGI and AstraZeneca also signed a supply agreement whereby AstraZeneca will supply the AZ Portfolio to AGI. This supply agreement has an initial period of 10 years. This transaction became effective on 1 September 2016.
Transactions with GlaxoSmithKlineOn 12 September 2016 Aspen announced that various Group subsidiaries had concluded three separate transactions with GlaxoSmithKline (“GSK”) companies as follows:
Acquisitions of a portfolio of anaesthetic productsAGI signed an agreement with GSK whereby AGI will acquire a portfolio of anaesthetic products globally (with the exception of certain territories, primarily North America) (“the Anaesthetics Transaction”). GSK’s Anaesthetics Portfolio comprises five established medicines, namely Ultiva (general anaesthesia) and four muscle relaxants (Nimbex, Mivacron, Tracrium and Anectine) (“the GSK Portfolio”). The products in the GSK Portfolio are sold in more than 100 countries worldwide including Japan, Brazil, Korea, Germany and Italy. In terms of the concluded agreement, as consideration for the GSK Portfolio, AGI will pay an initial amount of GBP180 million and milestone payments of up to GBP100 million based on the results of the portfolio in the 36 months after 1 March 2017. AGI and GSK have also signed a supply agreement whereby GSK will supply the products to AGI for four years. The GSK Portfolio is expected to generate revenue of approximately GBP70 million in the year ended 31 December 2016. This transaction closed on 28 February 2017.
Exercise of option to acquire Fraxiparine and Arixtra in countries retained by GSKAs part of its acquisition of the thrombosis products Fraxiparine and Arixtra from GSK in 2014, AGI also acquired an option to acquire the same products in certain countries to which GSK retained the rights, most notably China. AGI has exercised its option to acquire Fraxiparine and Arixtra in these countries for a consideration of GBP45 million. This transaction closed on 31 December 2016.
Cancellation of the collaboration with GSK in sub-Saharan AfricaPharmacare and GSK agreed to cancel the rights of Pharmacare to collaborate in the sub-Saharan Africa (“SSA”) business of GSK (“the SSA Collaboration”). These rights were acquired as part of a basket of transactions with GSK in 2009. GSK paid Pharmacare GBP45 million as consideration for the cancellation. The SSA Collaboration generated approximately R2,6 billion of gross revenue in the 2016 financial year. This transaction closed on 31 December 2016.
Amendment to Memorandum of IncorporationAt a general meeting of the Company held on 15 August 2016 shareholders approved a resolution to amend clauses 17 (Fraction of Shares) and 24 (Proxy Representation) of the Company’s Memorandum of Incorporation – further details regarding these changes can be obtained from the Company Secretary & Group Governance Officer at [email protected].
Aspen Pharmacare Holdings Limited Annual Financial Statements 2017
9

10 Aspen Pharmacare Holdings Limited Annual Financial Statements 2017
Directors’ Report continued
Dividend to shareholdersTaking into account the earnings and cash flow performance for the year ended 30 June 2017, existing debt service commitments, future proposed investments and funding options, notice was given that the Board declared a dividend of 287 cents per ordinary share to shareholders recorded in the share register of the Company at the close of business on 6 October 2017 (2016: capital distribution of 248 cents per share).
A dividend withholding tax of 20% is applicable to shareholders who are not exempt. The Company income tax number is 9325178714. The issued share capital of the Company is 456 435 185 ordinary shares. The dividend was paid from income reserves. Shareholders were advised to seek their own tax advice on the consequences associated with the dividend.
The directors are of the opinion that the Company will satisfy the solvency and liquidity requirements of sections 4 and 46 of the Companies Act, 2008.
Future distributions will be decided on a year-to-year basis.
In compliance with IAS 10 – Events After Balance Sheet Date, the dividend will only be accounted for in the financial statements for the year ending 30 June 2018.
The salient dates in respect of the dividend were as follows:
Last day to trade cum dividend Tuesday, 3 October 2017Shares commence trading ex dividend Wednesday, 4 October 2017Record date Friday, 6 October 2017Payment date Monday, 9 October 2017
Going concernThese Annual Financial Statements have been prepared on the going concern basis. Based on the Group’s reserves, positive cash flows and cash balances, the availability of unutilised funding facilities and the budgets for the period to June 2018, the Board believes that the Group and the Company have adequate resources to continue in operation for the next 12 months.
Special resolutionsAt the annual general meeting of Aspen shareholders convened on 7 December 2016, the following special resolutions were passed by the Company:➜➜ approval of remuneration for non-executive directors for the year ended 30 June 2017 and for the period 1 July 2017 to the date of the 2017 annual general meeting;➜➜ a general authority was granted for the Company and any of its subsidiaries to provide direct or indirect financial assistance to a related or inter-related company. This authority is valid until the Company’s next annual general meeting, or until revoked at a special general meeting of shareholders; and➜➜ a general authority was granted for the Company to acquire shares in the Company from time to time, up to 20% of the Company’s issued share capital.
More information on these resolutions can be obtained from the Company Secretary & Group Governance Officer at [email protected].
The following special resolutions were passed by the South African subsidiaries of the Company during the year:➜➜ a general authority was granted to Fine Chemicals Corporation (Pty) Limited (“FCC”) to provide direct or indirect financial assistance to a related or inter-related company to Pharmacare. This authority is valid until Pharmacare’s next annual general meeting, or until revoked at a special general meeting of shareholders;➜➜ a general authority was granted to FCC to provide direct or indirect financial assistance to a related or inter-related company to FCC. This authority is valid until FCC’s next annual general meeting, or until revoked at a special general meeting of shareholders;➜➜ a general authority was granted to Aspen Finance to provide direct or indirect financial assistance to a related or inter-related company. This authority is valid until Aspen Finance’s next annual general meeting, or until revoked at a special general meeting of shareholders; and➜➜ the remuneration payable to the non-executive directors of Aspen Finance was approved.

Aspen Pharmacare Holdings Limited Annual Financial Statements 2017
11
AuditorsThe Audit and Risk Committee and Board have recommended that PricewaterhouseCoopers Inc. be reappointed as auditors of the Group and the Company in terms of the resolution to be proposed at the annual general meeting in accordance with the Companies Act.
The directors further confirm that the A&R Co has addressed the specific responsibility required by it in terms of the Companies Act and that membership of the A&R Co will be proposed to shareholders by ordinary activities of the A&R Co are contained within the A&R Co Report available online at http://www.aspenpharma.com/results-and-reports/.
Investments in subsidiaries and structured entitiesThe financial information in respect of the Group and the Company’s interests in its material operating subsidiaries and structured entities is set out in note 25 of the Company Annual Financial Statements.
ContractsNone of the directors and officers of the Company had an interest in any contract of significance during the financial year, save as disclosed in note 29 of the Group Annual Financial Statements and note 22 of the Company Annual Financial Statements.
BorrowingsBorrowings at year end (net of cash and cash equivalents) amounted to R37,1 billion (2016: R32,7 billion) are made up as follows:
2016R’billion
Non-current borrowings 28,9 32,7Current borrowings 18,9 10,9Cash and cash equivalents (10,7) (10,9)
37,1 32,7
The level of borrowings is authorised in terms of the Company’s and its subsidiaries’ Memoranda of Incorporation and have been authorised in terms of the required Board approvals.
A detailed list of borrowings is set out in note 13 of the Group Annual Financial Statements and note 13 of the Company Annual Financial Statements.
Subsequent eventsIn September 2017, AGI concluded an agreement with AstraZeneca AB and AstraZeneca UK (“AstraZeneca”) in terms of which AGI is to acquire the residual rights to the AZ anaesthetics (“the Transaction”) for which it acquired the commercialisation rights via an agreement entered into in June 2016, as announced to shareholders on 9 June 2016. The terms of the concluded agreement provide that AGI will pay USD555 million as consideration for the remaining rights to the intellectual property and manufacturing know-how related to the AZ Anaesthetics. Additionally, AGI will make performance-related payments of up to USD211 million based on sales and gross profit in the period to 30 November 2019. The Transaction was subject to customary closing conditions and the completion of subsidiary agreements to the satisfaction of all parties. It is anticipated that the Transaction will complete during the final quarter of 2017.
2017 R’billion
Aspen Pharmacare Holdings Limited Annual Financial Statements 2017
11
12 Aspen Pharmacare Holdings Limited Annual Financial Statements 2017
Independent auditor’s report to the shareholders of Aspen Pharmacare Holdings Limited
Report on the audit of the consolidated and separate financial statementsOur opinionIn our opinion, the consolidated and separate financial statements present fairly, in all material respects the consolidated and separate financial position of Aspen Pharmacare Holdings Limited (“the Company”) and its subsidiaries (together “the Group”) as at 30 June 2017, and its consolidated and separate financial performance and its consolidated and separate cash flows for the year then ended in accordance with International Financial Reporting Standards and the requirements of the Companies Act of South Africa.
What we have auditedAspen Pharmacare Holdings Limited’s consolidated and separate financial statements, set out on pages 18 to 117, comprise:➜➜ the Group and Company statements of financial position as at 30 June 2017;➜➜ the Group and Company statements of comprehensive income for the year then ended;➜➜ the Group and Company statements of changes in equity for the year then ended;➜➜ the Group and Company statements of cash flows for the year then ended; and➜➜ the notes to the Group and Company financial statements, which include a summary of significant accounting policies.
Basis for opinionWe conducted our audit in accordance with International Standards on Auditing (“ISA”). Our responsibilities under those standards are further described in the Auditor’s responsibilities for the audit of the consolidated and separate financial statements section of our report.
We believe that the audit evidence we have obtained is sufficient and appropriate to provide a basis for our opinion.
IndependenceWe are independent of the Group in accordance with the Independent Regulatory Board for Auditors Code of Professional Conduct for Registered Auditors (“IRBA Code”) and other independence requirements applicable to performing audits of financial statements in South Africa. We have fulfilled our other ethical responsibilities in accordance with the IRBA Code and in accordance with other ethical requirements applicable to performing audits in South Africa. The IRBA Code is consistent with the International Ethics Standards Board for Accountants Code of Ethics for Professional Accountants (Parts A and B).
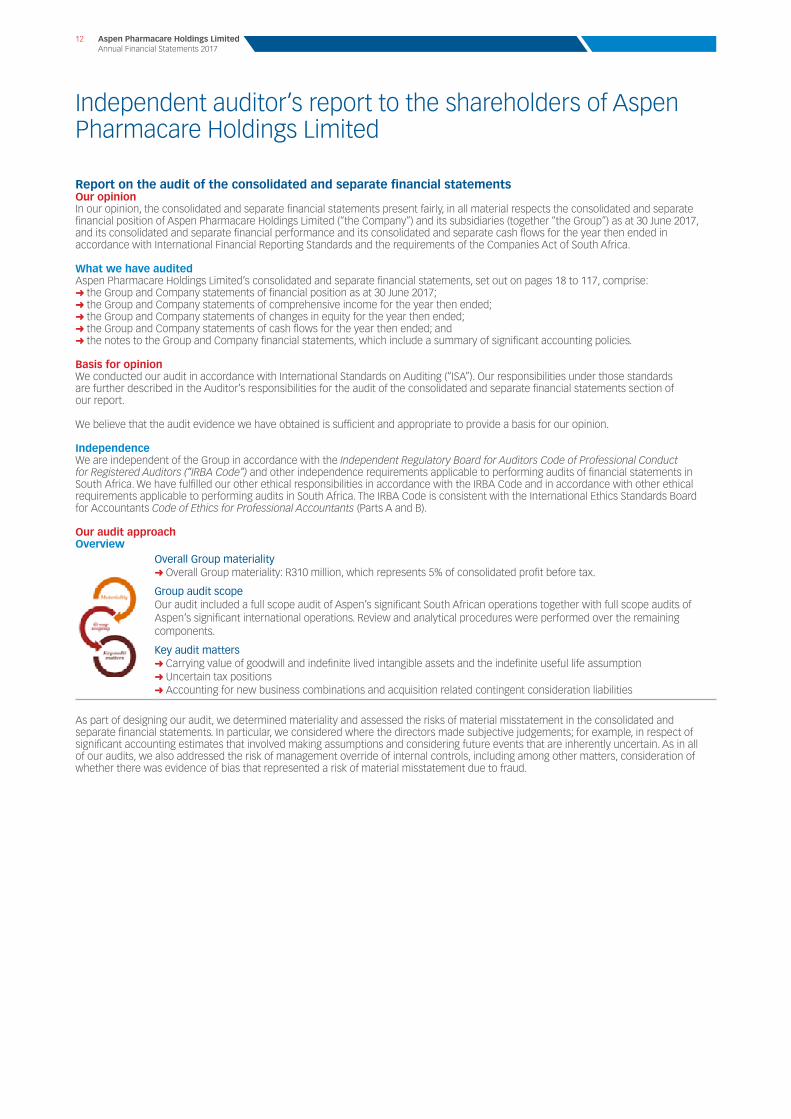
Our audit approachOverview
Overall Group materiality➜➜ Overall Group materiality: R310 million, which represents 5% of consolidated profit before tax.
Group audit scopeOur audit included a full scope audit of Aspen’s significant South African operations together with full scope audits of Aspen’s significant international operations. Review and analytical procedures were performed over the remaining components.
Key audit matters➜➜ Carrying value of goodwill and indefinite lived intangible assets and the indefinite useful life assumption➜➜ Uncertain tax positions➜➜ Accounting for new business combinations and acquisition related contingent consideration liabilities
As part of designing our audit, we determined materiality and assessed the risks of material misstatement in the consolidated and separate financial statements. In particular, we considered where the directors made subjective judgements; for example, in respect of significant accounting estimates that involved making assumptions and considering future events that are inherently uncertain. As in all of our audits, we also addressed the risk of management override of internal controls, including among other matters, consideration of whether there was evidence of bias that represented a risk of material misstatement due to fraud.

Aspen Pharmacare Holdings Limited Annual Financial Statements 2017
13
MaterialityThe scope of our audit was influenced by our application of materiality. An audit is designed to obtain reasonable assurance whether the financial statements are free from material misstatement. Misstatements may arise due to fraud or error. They are considered material if, individually or in aggregate, they could reasonably be expected to influence the economic decisions of users taken on the basis of the consolidated financial statements.
Based on our professional judgement, we determined certain quantitative thresholds for materiality, including the overall Group materiality for the consolidated financial statements as a whole as set out in the table below. These, together with qualitative considerations, helped us to determine the scope of our group audit and the nature, timing and extent of our audit procedures and to evaluate the effect of misstatements, both individually and in aggregate on the consolidated financial statements as a whole.
Overall Group materiality: R310 million
How we determined it: 5% of consolidated profit before tax
Rationale for the materiality benchmark applied:
We chose consolidated profit before tax as the benchmark because, in our view, it is the benchmark against which the performance of the Group is most commonly measured by users, and is a generally accepted benchmark. We chose 5% which is consistent with quantitative materiality thresholds used for profit-oriented companies in this sector.
How we tailored our Group audit scopeWe tailored the scope of our audit in order to perform sufficient work to enable us to provide an opinion on the consolidated financial statements as a whole, taking into account the structure of the Group, the accounting processes and controls, and the industry in which the Group operates.
Our scoping assessment included consideration of financially significant operations, based on the indicators such as the contribution to consolidated assets, consolidated revenue and consolidated profit before tax. Based on this assessment, we identified 14 financially significant components. The financially significant components of the Group were subject to full scope audits of their financial reporting information submitted to the Company, which in aggregate account for a majority of the consolidated revenue, consolidated profit before tax and consolidated total assets of the Group.
In establishing the overall approach to the Group audit, we determined the type of work that needed to be performed by us, as the Group engagement team, or component auditors from other PwC network firms or other audit firms operating under our instruction. Where the work was performed by component auditors, we determined the level of involvement we needed to have in the audit work at those components to be able to conclude whether sufficient appropriate audit evidence had been obtained as a basis for our opinion on the consolidated financial statements as a whole.
The Group engagement team met with the component auditors of the most significant audit components and engaged with the remaining component auditors by discussing pertinent matters and reviewing reporting documents submitted to us as the Group engagement team. In order to obtain sufficient audit evidence in respect of non-significant components, the Group engagement team performed analytical review procedures on their financial information. These components have been assessed to be financially inconsequential to the Group.
Key audit mattersKey audit matters are those matters that, in our professional judgement, were of most significance in our audit of the consolidated and separate financial statements of the current period. These matters were addressed in the context of our audit of the consolidated and separate financial statements as a whole, and in forming our opinion thereon, and we do not provide a separate opinion on these matters.
Aspen Pharmacare Holdings Limited Annual Financial Statements 2017
13

14 Aspen Pharmacare Holdings Limited Annual Financial Statements 2017
Independent auditor’s report to the shareholders of Aspen Pharmacare Holdings Limited continued
Key audit matter How our audit addressed the key audit matter
Carrying value of goodwill and indefinite lived intangible assets and the indefinite useful life assumptionThis key audit matter relates to the audit of the consolidated financial statements.
Refer to note 1: Intangible assets and note 3: Goodwill.
Management has determined that R52,4 billion of the carrying value of intangible assets as at 30 June 2017 relates to intangible assets with indefinite useful lives, which require annual impairment assessments.
We determined this area to be a matter of most significance to the audit due to the size of the goodwill (R5,9 billion) and intangible assets balance (R60,0 billion) as at 30 June 2017, and the risk of impairment of the goodwill and intangible assets included in the cash generating units (“CGUs”) of the Group.
Management’s assessment of the value-in-use of the Group’s CGUs is determined using estimated future cash flows. The impairment reviews performed by the Group contain a number of significant judgements and estimates including revenue growth, profit margins, cash conversion, terminal values and discount rates. Changes in these assumptions could lead to an impairment to the carrying value of goodwill and intangible assets.
A significant portion of the goodwill balance is made up of goodwill that relates to the Sigma business – Australasia (R4,1 billion). Although management determined that there is sufficient headroom between the value-in-use of the CGUs and their carrying value, it remains an area of significant judgement.
During the current year, impairment charges of R0,3 billion were recognised in relation to the GSK classic brands distributed in Australia and R0,1 billion was recognised in relation to the South African commercial business.
The indefinite life assumption of intangible assets is subjective and is based on a number of judgements made by management. Changes in circumstances may necessitate management to reassess the indefinite life assumption. Management base their assumptions in this regard on industry practice, detailed assessments of individual intangible assets and past history. The factors taken into account by management when making this classification is set out in note 1: Intangible assets – Significant judgements and estimates.
We obtained the Group’s impairment analyses and tested the reasonableness of key assumptions, including revenue growth, profit margins, cash conversion, terminal values and discount rates.
Our audit procedures included comparing key assumptions to industry and economic forecasts. We found management’s key assumptions to be in line with industry and economic forecasts. We utilised our valuation expertise to assess the reasonability of the discount rates used by testing the assumptions against market data and widely applied foreign risk premias. In addition, we independently performed sensitivity calculations on the impairment assessments, to determine the degree by which the key assumptions needed to change in order to trigger an additional impairment charge.
We considered whether management had identified the relevant CGUs with reference to individual intangible assets, and found that this is the lowest level at which management monitors goodwill and intangible assets with indefinite useful lives for internal purposes.
We compared the future cash flow forecasts to the Board approved budgets and found them to be consistent.
We compared the current year actual results with the forecasts utilised in the prior year impairment calculations and did not identify significant variances.
We focused our audit effort on the indefinite lived intangible assets relating to the ELIZ Products CGU, GSK Thrombosis Business CGU, GSK OTC brands CGU, Specialist Global Brands CGU and the MSD Business CGU, as these amount to more than 58% or R30,5 billion of the total indefinite lived intangible assets and pose the highest risk of material impairment charges and the indefinite live assumption being incorrectly applied in the Group.
We challenged management’s assertion on the indefinite useful life assumption of the intangible assets by considering the individual brand plans, comparing key assumptions to market performance and comparing key assumptions to the industry and its peers. We found the indefinite useful life assumption as used by management to be in line with industry practices, as well as with the individual brand plans.

Aspen Pharmacare Holdings Limited Annual Financial Statements 2017
15
Key audit matter How our audit addressed the key audit matter
Uncertain tax positionsThis key audit matter relates to the audit of the consolidated and separate financial statements.
Refer to note 25: – Tax.
The Group operates in a complex multinational tax environment and there were open tax and transfer pricing matters with South African and other international tax authorities during the year. Management judgement is required in assessing the carrying amount of provisions required in respect of uncertain tax positions, and we therefore determined this to be a matter of most significance to the audit.
A transfer pricing assessment was raised against Aspen Pharmacare Holdings Limited in respect of the 2011 fiscal year in November 2015. The South African Revenue Service had included all the profits generated by Aspen Global Incorporated during that fiscal year in Aspen Holdings’ taxable income, which resulted in additional taxes, interest and penalties being levied. Aspen Pharmacare Holdings Limited filed an objection to the assessment with the South African Revenue Service. Subsequent to the assessment being received and the objection filed, management had continuously engaged with the South African Revenue Service in order to negotiate a resolution to this matter. On 16 October 2017, management received notification that the South African Revenue Service had withdrawn this assessment.
Using our specialist international tax and transfer pricing knowledge, we evaluated and challenged management’s judgements in respect of estimates of tax exposures and contingencies in order to assess the adequacy of the Group’s tax provisions. This included obtaining and evaluating third party tax opinions that the Group used to assess the appropriateness of any assumptions made and the legal basis of the claims. In understanding and evaluating management’s judgements, we considered the status of recent and current tax authority audits and enquiries, the outcome of previous claims, judgemental positions taken in tax returns and current year estimates and developments in the tax environment. In addition, we inspected the South African Revenue Service’s notification of withdrawal of the transfer pricing assessment and assessed the accounting treatment and disclosure relating to this matter in the consolidated and separate financial statements in context thereof.
Aspen Pharmacare Holdings Limited Annual Financial Statements 2017
15

16 Aspen Pharmacare Holdings Limited Annual Financial Statements 2017
Independent auditor’s report to the shareholders of Aspen Pharmacare Holdings Limited continued
Key audit matter How our audit addressed the key audit matter
Accounting for new business combinations and acquisition related contingent consideration liabilities
This key audit matter relates to the audit of the consolidated and separate financial statements.
Refer to note E to the Group Statement of Cash Flows: Acquisition of subsidiaries and businesses and note 14.1: Other non-current financial liabilities.
In the current financial year, the Group completed the following significant transactions:➜➜ Acquisition of GlaxoSmithKline’s thrombosis portfolio (Arixtra and Fraxiparine) in certain territories;➜➜ Acquisition of GlaxoSmithKline’s anaesthetics portfolio in certain territories; and➜➜ Acquisition of the commercialisation rights of AstraZeneca’s anaesthetics portfolio in certain territories.
In the AstraZeneca transaction, the Group acquired the commercialisation rights without also obtaining the full rights to the intellectual property.
Management judgement was required in determining whether the transactions were acquisitions of businesses or assets – this determination could have a significant effect on the accounting treatment of the transactions. Management determined all three transactions to be acquisitions of businesses as defined in International Financial Reporting Standard 3 Business Combinations (“IFRS 3”).
In an acquisition of a business, IFRS 3 requires the recognition of identifiable assets, liabilities and contingent liabilities in a business combination at fair value at the date of acquisition, with the excess of the acquisition cost over the identified fair values recognised as goodwill. In an acquisition of assets, assets are recognised at the fair value of the consideration paid.
The identification and measurement of identifiable assets in these transactions required a significant amount of management estimation, particularly in relation to the identification and measurement of intangible assets.
The acquisition of the anaesthetics portfolio from GlaxoSmithKline and AstraZeneca resulted in the recognition and measurement of material acquisition-related contingent consideration liabilities (GlaxoSmithKline GBP99,5 million and AstraZeneca $250 million), which necessitate management judgement and estimates at each year end date in order to assess the fair value of the remaining consideration payable. Such management judgement and estimates include projections of future sales of products, the potential impact of competitor products and the delivery of anticipated synergies.
We determined the accounting for these new business combinations and the related contingent consideration liabilities to be a matter of most significance to the audit due to the size of the recognised assets and liabilities and due to the significant management judgement that was required in the classification of the transactions as acquisitions of businesses or assets, the identification and measurement of the identifiable intangible assets and the measurement of the contingent consideration liabilities. Note E to the Group Statement of Cash Flows: Acquisition of subsidiaries and businesses and note 14.1: Other non-current financial liabilities set out the key management assumptions with regard to the transactions.
We evaluated the underlying acquisition agreements for these transactions and engaged with our accounting specialists, and found that these transactions resulted in inputs, processes and outputs that qualify them to be accounted for as the acquisition of businesses as defined in IFRS 3.
We focused our testing of the identifiable assets and the contingent consideration liabilities on the key assumptions made by management. Our audit procedures included the following:➜➜ we engaged with our valuation experts to assist with:➜– critically evaluating whether the model used by
management to calculate the fair value of the assets acquired, contingent consideration and goodwill raised complies with the requirements of IFRS 3; and
➜– evaluating the reasonability of the discount rates used by testing the assumptions against market data and widely applied foreign risk premias.
➜➜ we obtained management’s calculations and subjected the key assumptions to our own independently calculated sensitivity analyses;➜➜ we compared the projected cash flows, including the assumptions relating to revenue growth rates and operating margins, to historical performance; and➜➜ we compared the projections for the Group’s acquired products to third party expectations of growth and considered the potential upside and downside impact of products launched and expected to be launched by the Group’s competitors.
We found the assumptions to be comparable to historical performance and the Group’s expected future outlook.
Other informationThe directors are responsible for the other information. The other information comprises the information contained in the Integrated Report 2017 and the Annual Financial Statements 2017, which includes the Directors’ Report, the Audit and Risk Committee’s Report and the Company Secretary’s Certificate as required by the Companies Act of South Africa, Illustrative constant exchange report – Annexure 1, Shareholder Statistics, Administration, Abbreviations, the Unabridged Corporate Governance Report for the 2017 financial year and the Social and Ethics Committee Report for the 2017 financial year. Other information does not include the consolidated and separate financial statements and our auditor’s report thereon.
Our opinion on the consolidated and separate financial statements does not cover the other information and we do not express an audit opinion or any form of assurance conclusion thereon.
In connection with our audit of the consolidated and separate financial statements, our responsibility is to read the other information identified above and, in doing so, consider whether the other information is materially inconsistent with the consolidated and separate financial statements or our knowledge obtained in the audit, or otherwise appears to be materially misstated.

Aspen Pharmacare Holdings Limited Annual Financial Statements 2017
17
If, based on the work we have performed on the other information, we conclude that there is a material misstatement of this other information, we are required to report that fact. We have nothing to report in this regard.
Responsibilities of the directors for the consolidated and separate financial statementsThe directors are responsible for the preparation and fair presentation of the consolidated and separate financial statements in accordance with International Financial Reporting Standards and the requirements of the Companies Act of South Africa, and for such internal control as the directors determine is necessary to enable the preparation of consolidated and separate financial statements that are free from material misstatement, whether due to fraud or error.
In preparing the consolidated and separate financial statements, the directors are responsible for assessing the Group’s and the Company’s ability to continue as a going concern, disclosing, as applicable, matters related to going concern and using the going concern basis of accounting unless the directors either intend to liquidate the Group or Company or to cease operations, or has no realistic alternative but to do so.
Auditor’s responsibilities for the audit of the consolidated and separate financial statementsOur objectives are to obtain reasonable assurance about whether the consolidated and separate financial statements as a whole are free from material misstatement, whether due to fraud or error, and to issue an auditor’s report that includes our opinion. Reasonable assurance is a high level of assurance, but is not a guarantee that an audit conducted in accordance with ISA will always detect a material misstatement when it exists. Misstatements can arise from fraud or error and are considered material if, individually or in the aggregate, they could reasonably be expected to influence the economic decisions of users taken on the basis of these consolidated and separate financial statements.
As part of an audit in accordance with ISAs, we exercise professional judgement and maintain professional scepticism throughout the audit. We also:➜➜ identify and assess the risks of material misstatement of the consolidated and separate financial statements, whether due to fraud or error, design and perform audit procedures responsive to those risks, and obtain audit evidence that is sufficient and appropriate to provide a basis for our opinion. The risk of not detecting a material misstatement resulting from fraud is higher than for one resulting from error, as fraud may involve collusion, forgery, intentional omissions, misrepresentations, or the override of internal control;➜➜ obtain an understanding of internal control relevant to the audit in order to design audit procedures that are appropriate in the circumstances, but not for the purpose of expressing an opinion on the effectiveness of the Group’s and Company’s internal control;➜➜ evaluate the appropriateness of accounting policies used and the reasonableness of accounting estimates and related disclosures made by the directors;➜➜ conclude on the appropriateness of the directors’ use of the going concern basis of accounting and, based on the audit evidence obtained, whether a material uncertainty exists related to events or conditions that may cast significant doubt on the Group’s and Company’s ability to continue as a going concern. If we conclude that a material uncertainty exists, we are required to draw attention in our auditor’s report to the related disclosures in the consolidated and separate financial statements or, if such disclosures are inadequate, to modify our opinion. Our conclusions are based on the audit evidence obtained up to the date of our auditor’s report. However, future events or conditions may cause the Group and/or the Company to cease to continue as a going concern;➜➜ evaluate the overall presentation, structure and content of the consolidated and separate financial statements, including the disclosures, and whether the consolidated and separate financial statements represent the underlying transactions and events in a manner that achieves fair presentation; and➜➜ obtain sufficient appropriate audit evidence regarding the financial information of the entities or business activities within the Group to express an opinion on the consolidated financial statements. We are responsible for the direction, supervision and performance of the group audit. We remain solely responsible for our audit opinion. `
We communicate with the directors regarding, among other matters, the planned scope and timing of the audit and significant audit findings, including any significant deficiencies in internal control that we identify during our audit.
We also provide the directors with a statement that we have complied with relevant ethical requirements regarding independence, and to communicate with them all relationships and other matters that may reasonably be thought to bear on our independence and, where applicable, related safeguards.
From the matters communicated with the directors, we determine those matters that were of most significance in the audit of the consolidated and separate financial statements of the current period and are therefore the key audit matters. We describe these matters in our auditor’s report unless law or regulation precludes public disclosure about the matter or when, in extremely rare circumstances, we determine that a matter should not be communicated in our report because the adverse consequences of doing so would reasonably be expected to outweigh the public interest benefits of such communication.
Report on other legal and regulatory requirementsIn terms of the IRBA Rule published in Government Gazette Number 39475 dated 4 December 2015, we report that PricewaterhouseCoopers Inc. has been the auditor of Aspen Pharmacare Holdings Limited for 20 years.
PricewaterhouseCoopers Inc.Director: T. RaeRegistered Auditor2 Eglin Road, Sunninghill30 October 2017
Aspen Pharmacare Holdings Limited Annual Financial Statements 2017
17

18 Aspen Pharmacare Holdings Limited Annual Financial Statements 2017
at 30 June 2017
Group statement of financial position
Notes2016
R’billion
AssetsNon-current assetsIntangible assets 1 60,0 49,1 Property, plant and equipment 2 9,7 9,7 Goodwill 3 5,9 6,0 Deferred tax assets 4 1,0 1,1 Contingent environmental indemnification assets 5 0,7 0,8 Other non-current assets 6 0,9 0,4
Total non-current assets 78,2 67,1
Current assetsInventories 7 13,6 14,4 Receivables and other current assets 8 13,6 11,8 Cash and cash equivalents 9 10,7 10,9
Total operating current assets 37,9 37,1 Assets classified as held-for-sale 10 0,2 0,1
Total current assets 38,1 37,2
Total assets 116,3 104,3
Shareholders’ equityRetained income 32,3 28,4 Non-distributable reserves 8,8 12,1 Share capital (net of treasury shares) 11 1,9 1,9 Share-based compensation reserve 12 0,1 0,1
Total shareholders’ equity 43,1 42,5
LiabilitiesNon-current liabilitiesBorrowings 13 28,9 32,7 Other non-current liabilities 14 4,5 2,5 Unfavourable and onerous contracts 15 1,6 2,2 Deferred tax liabilities 4 2,1 1,8 Contingent environmental liabilities 5 0,7 0,8 Retirement and other employee benefit obligations 16 0,6 0,7
Total non-current liabilities 38,4 40,7
Current liabilitiesBorrowings 13 18,9 10,9 Trade and other payables 17 10,3 8,3 Other current liabilities 18 5,3 1,5 Unfavourable and onerous contracts 15 0,3 0,4
Total current liabilities 34,8 21,1
Total liabilities 73,2 61,8
Total equity and liabilities 116,3 104,3
2017R’billion

for the year ended 30 June 2017
Aspen Pharmacare Holdings Limited Annual Financial Statements 2017
19
Group statement of comprehensive income
Notes2016
R’billion
Revenue 19 41,2 35,6 Cost of sales (21,3) (17,7)
Gross profit 19,9 17,9 Selling and distribution expenses (6,7) (6,0)Administrative expenses (2,8) (2,6)Other operating income 0,3 1,9 Other operating expenses (2,4) (2,2)
Operating profit 20 8,3 9,0 Investment income 23 0,3 0,3 Financing costs 24 (2,4) (3,2)
Profit before tax 6,2 6,1 Tax 25 (1,1) (1,8)
Profit for the year 5,1 4,3
Other comprehensive income, net of tax*Net gains from cash flow hedging in respect of business acquisitions 0,2 –Currency translation (losses)/gains (3,5) 5,2 Remeasurement of retirement and other employee benefit obligations – (0,1)
Total comprehensive income# 1,8 9,4
Earnings per shareBasic earnings per share (cents) 26 1 123,4 945,4
Diluted earnings per share (cents) 26 1 123,4 945,2
* Remeasurement of retirement and other employee benefit obligations will not be reclassified to profit and loss. All other items in other comprehensive income may be reclassified to profit and loss.
# Total comprehensive income is disclosed net of profit attributable to non-controlling interests which are not material.
2017R’billion
Aspen Pharmacare Holdings Limited Annual Financial Statements 2017
19

for the year ended 30 June 2017
20 Aspen Pharmacare Holdings Limited Annual Financial Statements 2017
Group statement of changes in equity
Non-distributable reservesShare
capital (net of
treasury shares)shares
R’billion
HedgingreserveR’billion
Foreigncurrency
translationreserveR’billion
Share-based
compensationreserve
R’billion
Retainedincome
R’billion Total*
R’billion
Balance at 30 June 2015 3,0 0,3 6,3 – 24,5 34,1 Total comprehensive income – – 5,5 – 3,9 9,4
Profit for the year – – – – 4,3 4,3 Other comprehensive income – – 5,5 – (0,4) 5,1
Capital distribution paid (1,0) – – – – (1,0)Treasury shares purchased (0,1) – – – – (0,1)Share-based payment expenses – – – 0,1 – 0,1
Balance at 30 June 2016 1,9 0,3 11,8 0,1 28,4 42,5 Total comprehensive income – 0,2 (3,5) – 5,1 1,8
Profit for the year – – – – 5,1 5,1 Other comprehensive income – 0,2 (3,5) – – (3,3)
Dividends paid – – – – (1,2) (1,2)
Balance at 30 June 2017 1,9 0,5 8,3 0,1 32,3 43,1
* Total shareholders’ equity is disclosed net of profit attributable to non-controlling interests which are not material.
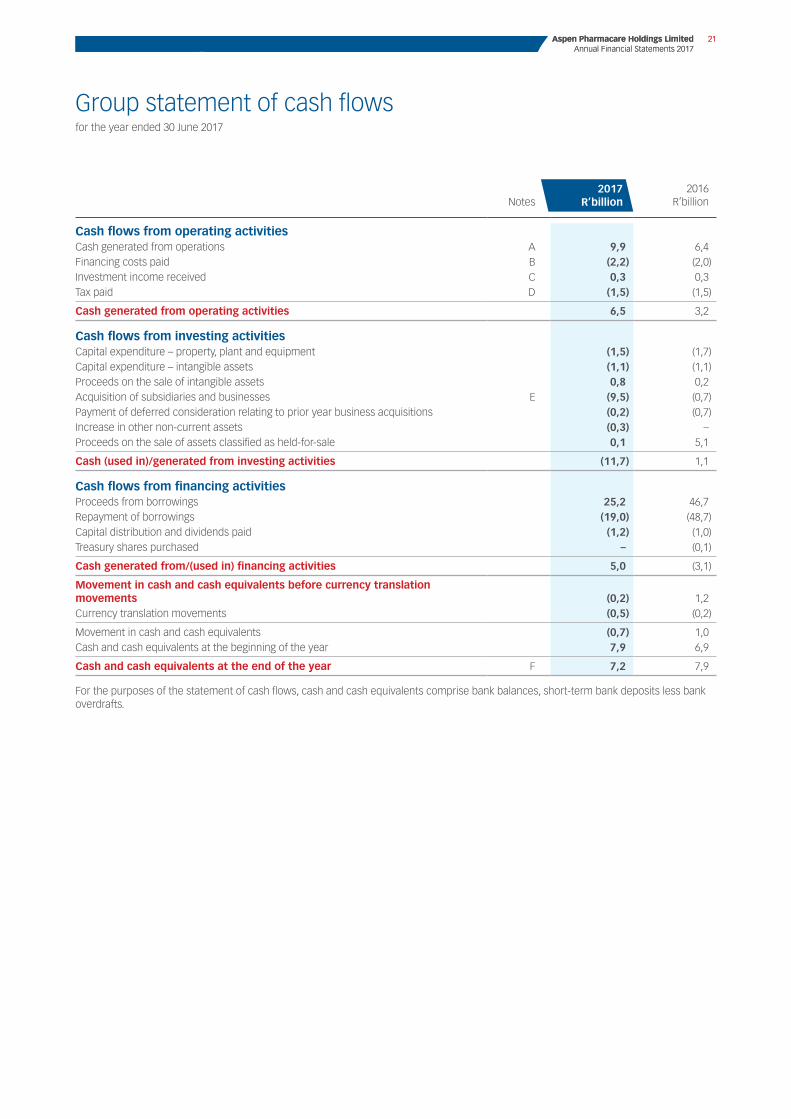
for the year ended 30 June 2017
Aspen Pharmacare Holdings Limited Annual Financial Statements 2017
21
Group statement of cash flows
Notes2016
R’billion
Cash flows from operating activitiesCash generated from operations A 9,9 6,4 Financing costs paid B (2,2) (2,0)Investment income received C 0,3 0,3 Tax paid D (1,5) (1,5)
Cash generated from operating activities 6,5 3,2
Cash flows from investing activitiesCapital expenditure – property, plant and equipment (1,5) (1,7)Capital expenditure – intangible assets (1,1) (1,1)Proceeds on the sale of intangible assets 0,8 0,2 Acquisition of subsidiaries and businesses E (9,5) (0,7)Payment of deferred consideration relating to prior year business acquisitions (0,2) (0,7)Increase in other non-current assets (0,3) –Proceeds on the sale of assets classified as held-for-sale 0,1 5,1
Cash (used in)/generated from investing activities (11,7) 1,1
Cash flows from financing activitiesProceeds from borrowings 25,2 46,7 Repayment of borrowings (19,0) (48,7)Capital distribution and dividends paid (1,2) (1,0)Treasury shares purchased – (0,1)
Cash generated from/(used in) financing activities 5,0 (3,1)
Movement in cash and cash equivalents before currency translation movements (0,2) 1,2 Currency translation movements (0,5) (0,2)
Movement in cash and cash equivalents (0,7) 1,0 Cash and cash equivalents at the beginning of the year 7,9 6,9
Cash and cash equivalents at the end of the year F 7,2 7,9
For the purposes of the statement of cash flows, cash and cash equivalents comprise bank balances, short-term bank deposits less bank overdrafts.
2017R’billion
Aspen Pharmacare Holdings Limited Annual Financial Statements 2017
21

for the year ended 30 June 2017
22 Aspen Pharmacare Holdings Limited Annual Financial Statements 2017
Notes to the Group statements of cash flows
2016R’billion
A. Cash generated from operationsOperating profit 8,3 9,0 Amortisation of intangible assets 0,6 0,6 Depreciation of property, plant and equipment 0,7 0,6 Net impairment charges 1,5 1,6 Loss on the sale of intangible assets 0,1 – Profit on sale of assets classified as held-for-sale – (1,6)Share-based payment expense – employees – 0,1 Deferred revenue (0,1) –Withholding taxes – (0,1)Loss on the sale of subsidiary 0,1 –Unfavourable and onerous contracts (0,3) (0,4)Other non-cash items (0,1) –
Cash operating profit 10,8 9,8 Working capital movements (0,9) (3,4)
Increase in inventories (1,1) (3,6)Increase in trade and other receivables (2,7) –Increase in trade and other payables 2,9 0,2
9,9 6,4
B. Financing costs paidInterest expense (1,8) (1,8)Net foreign exchange losses (0,2) – Borrowing costs capitalised to property, plant and equipment (0,2) (0,2)
(2,2) (2,0)
C. Investment income receivedInterest received 0,3 0,3
0,3 0,3
D. Tax paidAmounts payable at the beginning of the year (0,7) (0,6)Tax charged to the statement of comprehensive income (1,2) (1,8)Currency translation movements – 0,2 Amounts owing at the end of the year 0,6 0,9 Amounts receivable at the end of the year (0,2) (0,2)
(1,5) (1,5)
2017R’billion

Aspen Pharmacare Holdings Limited Annual Financial Statements 2017
23
E. Acquisition of subsidiaries and businessesJune 2017Set out below is the provisional accounting for the following business combinations (final accounting for AstraZeneca Anaesthetics Portfolio):
AstraZeneca Anaesthetics PortfolioWith effect from 1 September 2016, AGI acquired the exclusive rights to commercialise the Anaesthetics Portfolio of AstraZeneca globally (excluding the USA). As consideration for the commercialisation rights, AGI paid USD410 million with a further payment of USD110 million due on 1 July 2017. Additionally, AGI will make sales-related payments of up to USD250 million based on sales in the 24 months after 1 September 2016.
Post-acquisition revenue included in the statement of comprehensive income was R6,5 billion. The estimation of post-acquisition operating profits is impracticable and not reasonably determinable due to the immediate integration of the business into the existing operations of the Group.
Fraxiparine and Arixtra in China, Pakistan and IndiaAs part of its acquisition of the thrombosis products, Fraxiparine and Arixtra, from GSK in 2014, AGI also acquired an option to purchase the same products in certain countries to which GSK retained the rights, most notably China. AGI has exercised its option and, with effect from 1 January 2017, acquired Fraxiparine and Arixtra in these countries for a consideration of GBP45 million.
Post-acquisition revenue included in the statement of comprehensive income was R0,3 billion. The estimation of post-acquisition operating profits is impracticable and not reasonably determinable due to the immediate integration of the business into the existing operations of the Group.
The accounting for this business combination is provisional as the final model for the valuation is still being finalised. This is expected to be concluded by the time the 2018 interim results are released.
GSK Anaesthetics PortfolioWith effect from 1 March 2017, AGI acquired a portfolio of anaesthetics globally (excluding the USA) from GSK. As consideration for the commercialisation rights, AGI paid GBP180 million with further potential milestone payments of up to GBP100 million, based on the results of the acquired portfolio in the 36 months after 1 March 2017.
Post-acquisition revenue included in the statement of comprehensive income was R0,6 billion. The estimation of post-acquisition operating profits is impracticable and not reasonably determinable due to the immediate integration of the business into the existing operations of the Group.
The accounting for this business combination is provisional as the final model for the valuation is still being finalised. This is expected to be concluded by the time the 2018 interim results are released.
AstraZeneca Anaesthetics
PortfolioR’billion
Fraxiparine and Arixtra in
China, Pakistan
and IndiaR’billion
GSK Anaesthetics
PortfolioR’billion
TotalR’billion
Fair value of assets and liabilities acquired Intangible assets 11,1 0,7 4,4 16,2 Deferred tax liabilities (0,3) – (0,1) (0,4)
Fair value of net assets acquired 10,8 0,7 4,3 15,8 Goodwill acquired 0,3 – 0,1 0,4 Net gains from cash flow hedging in respect of business acquisition – – (0,2) (0,2)Deferred and contingent consideration (5,0) – (1,5) (6,5)
Cash outflow on acquisition 6,1 0,7 2,7 9,5
Aspen Pharmacare Holdings Limited Annual Financial Statements 2017
23

for the year ended 30 June 2017
24 Aspen Pharmacare Holdings Limited Annual Financial Statements 2017
Notes to the Group statements of cash flows continued
2016Set out below is the provisional accounting for the following June 2016 business combinations:
Norgine SAOn 21 May 2015, Pharmacare Limited reached an agreement to acquire 100% of the issued share capital of Norgine (Pty) Limited in South Africa (“Norgine SA”) for a consideration of EUR29 million. Norgine SA commercialises a portfolio of branded gastro-intestinal products in South Africa and surrounding territories. The approval of this transaction by the South African Competition Authorities was obtained on 25 August 2015. This transaction was completed on 30 September 2015.
Post-acquisition revenue included in the statement of comprehensive income was R0,1 billion. The estimation of post-acquisition operating profits is impracticable and not reasonably determinable due to the immediate integration of the business into the existing operations of the Group.
HPC businessAGI entered into an agreement with McGuff Pharmaceuticals Inc. (“McGuff”) for the exclusive supply of the finished dose form of Hydroxyprogesterone Caproate (“HPC”) in the United States. AGI acquired the related intellectual property and the approved Abbreviated New Drug Application for an upfront consideration of USD15 million. Milestone payments of between USD21 million and USD28 million are payable over the five-year supply term and are partially contingent on future sales performance.
Norgine SAR’billion
HPC businessR’billion
TotalR’billion
Fair value of assets and liabilities acquired Intangible assets 0,5 0,6 1,1 Trade and other receivables 0,1 – 0,1
Trade and other payables (0,1) – (0,1)Purchase consideration paid 0,5 0,6 1,1 Deferred consideration – (0,4) (0,4)
Cash outflow on acquisition 0,5 0,2 0,7
2016R’billion
F. Cash and cash equivalentsBank balances 10,0 7,9 Short-term bank deposits 0,6 3,0
Cash-in-transit 0,1 –Cash and cash equivalents per the statement of financial position 10,7 10,9 Less: bank overdrafts^ (3,5) (3,0)
Cash and cash equivalents per the statement of cash flows 7,2 7,9
^ Banks overdrafts are included within current borrowings in the statement of financial position.
2017R’billion

Aspen Pharmacare Holdings Limited Annual Financial Statements 2017
25
for the year ended 30 June 2017
Group segmental analysis
June 2017
Therapeutic Focused Brands
R’billion
Other Pharmaceuticals
R’billion
Total Pharmaceuticals
R’billion Nutritionals
R’billion Total
R’billion
Revenue 17,4 20,6 38,0 3,2 41,2 Cost of sales (8,4) (11,1) (19,5) (1,8) (21,3)
Gross profit 9,0 9,5 18,5 1,4 19,9 Selling and distribution expenses (5,9) (0,8) (6,7)
Contribution profit 12,6 0,6 13,2 Administrative expenses (2,8)Net other operating income 0,3 Depreciation 0,7
Normalised EBITDA* 11,4 Adjusted for:Depreciation (0,7)Amortisation (0,6)Loss on sale of assets (0,2)Net impairment of assets (0,7)Restructuring costs (0,4)Transaction costs (0,3)Product litigation costs (0,2)
Operating profit 8,3
Gross profit (%) 51,6 46,3 48,7 43,2 48,3Selling and distribution expenses (%) 15,5 26,1 16,3Contribution profit (%) 33,2 17,1 32,0Administrative expenses (%) 6,7Normalised EBITDA (%) 27,7
Restated June 2016
Therapeutic Focused Brands
R’billion
Other Pharmaceuticals
R’billion
Total Pharmaceuticals
R’billion Nutritionals
R’billion Total
R’billion
Revenue 11,6 20,5 32,1 3,5 35,6 Cost of sales (4,6) (11,3) (15,9) (1,8) (17,7)
Gross profit 7,0 9,2 16,2 1,7 17,9 Selling and distribution expenses (5,1) (0,9) (6,0)Contribution profit 11,1 0,8 11,9 Administrative expenses (2,6)Net other operating income 0,2 Depreciation 0,6
Normalised EBITDA* 10,1 Adjusted for:Depreciation (0,6)Amortisation (0,6)Profit on sale of assets 1,6 Net impairment of assets (0,9)Restructuring costs (0,3)Transaction costs (0,3)
Operating profit 9,0
Gross profit (%) 60,7 44,6 50,4 49,3 50,3Selling and distribution expenses (%) 15,9 24,8 16,7Contribution profit (%) 34,6 24,6 33,6Administrative expenses (%) 7,4
Normalised EBITDA (%) 28,4
* Normalised EBITDA represents operating profit before depreciation and amortisation adjusted for specific non-trading items as defined in the Group’s accounting policy.
Aspen Pharmacare Holdings Limited Annual Financial Statements 2017
25

26 Aspen Pharmacare Holdings Limited Annual Financial Statements 2017
for the year ended 30 June 2017
Group segmental analysis continued
% change
Therapeutic Focused Brands
%
Other Pharmaceuticals
%
Total Pharmaceuticals
%Nutritionals
%Total
%
Revenue 50 1 19 (8) 16Cost of sales 85 (2) 23 3 21
Gross profit 28 4 14 (20) 11Selling and distribution expenses 16 (4) 13
Contribution profit 14 (36) 10Administrative expenses 6Net other operating income >100Depreciation 8
Normalised EBITDA* 13
* Normalised EBITDA represents operating profit before depreciation and amortisation adjusted for specific non-trading items as defined in the Group’s accounting policy.
Segmental reportingFollowing recent acquisitions the Group has revised the reportable segments to reflect its current operating model and achieve alignment with the change in the way in which the business is managed and reported on by the chief operating decision-maker (“CODM”). The regional business reportable segments of International, South Africa, Asia Pacific and sub-Saharan Africa have been replaced by the Pharmaceutical and Nutritional business segments.
The Pharmaceutical business segment has been further split into the Therapeutic Focused Brands and Other Pharmaceuticals reportable segments.
Therapeutic Focused Brands consist of focused brands in the portfolios comprising Aspen’s three major pharmaceutical therapeutic areas, being Anaesthetics, Thrombosis and High Potency & Cytotoxic. Other Pharmaceuticals comprises revenue from the balance of the Commercial Pharmaceutical Brands as well as manufacturing revenue relating to both APIs and finished dose form products.
The entity-wide revenue disclosure has therefore been revised to reflect the three therapeutic areas which constitute the Therapeutic Focused Brands with the balance of the Commercial Pharmaceutical Brands being recorded as Other Commercial Pharmaceutical Brands. The regions have been further refined to split Europe CIS into Developed Europe and Developing Europe & CIS segments. The Asia Pacific region has been split into the following segments:➜➜ Australasia;➜➜ China;➜➜ Japan; and➜➜ Other Asia.
The hyperinflationary economy is no longer separately reported due to immateriality.
The GSK Aspen Healthcare for Africa Collaboration which was a material component of the sub-Saharan Africa region was terminated with effect from 31 December 2016 and as a consequence, the sub-Saharan Africa region is no longer a material region. On this basis the South African and sub-Saharan African regions have been consolidated into a single sub-Saharan Africa region.
The financial information of the Group’s reportable segments is reported to the CODM for purposes of allocating resources to the segment and assessing its performance.
Each of the reportable segments is managed by a segment manager.

for the year ended 30 June 2017
Aspen Pharmacare Holdings Limited Annual Financial Statements 2017
27
Group revenue segmental analysis
RestatedJune 2016
R’billion%
change
Commercial Pharmaceuticals by customer geography 31,4 25,4 24Sub-Saharan Africa 7,4 7,1 4Developed Europe 6,8 6,1 11Australasia 4,8 4,7 3Latin America 2,7 2,0 35Developing Europe & CIS 2,6 2,3 10Japan 1,9 0,7 >100China 1,8 – >100Other Asia 1,2 0,9 41MENA 1,1 0,9 27USA & Canada 1,1 0,7 58
Manufacturing revenue by geography of manufactureManufacturing revenue – finished dose form 2,2 2,3 (6)Australasia 0,5 0,5 (2)Developed Europe 0,7 0,9 (31)Sub-Saharan Africa 1,0 0,9 19Manufacturing revenue – active pharmaceutical ingredients 4,4 4,4 1Developed Europe 4,0 4,0 0Sub-Saharan Africa 0,4 0,4 9
Total manufacturing revenue 6,6 6,7 (1)
Total Pharmaceuticals 38,0 32,1 19
Nutritionals by customer geography 3,2 3,5 (8)Australasia 0,8 1,0 (23)Sub-Saharan Africa 1,0 1,0 3Latin America 1,4 1,5 (5)
Total revenue 41,2 35,6 16
Summary of regionsSub-Saharan Africa 9,8 9,4 6Developed Europe 11,5 11,0 4Australasia 6,1 6,2 (2)Latin America 4,1 3,4 18Developing Europe & CIS 2,6 2,4 10Japan 1,9 0,7 >100China 1,8 – >100Other Asia 1,2 0,9 41MENA 1,1 0,9 27USA & Canada 1,1 0,7 58
Total revenue 41,2 35,6 16
June 2017R’billion
Aspen Pharmacare Holdings Limited Annual Financial Statements 2017
27

for the year ended 30 June 2017
28 Aspen Pharmacare Holdings Limited Annual Financial Statements 2017
Group revenue segmental analysis continued
Commercial Pharmaceuticals therapeutic area analysis
June 2017
Anaesthetic BrandsR’billion
Thrombosis BrandsR’billion
High Potency &
Cytotoxic BrandsR’billion
Therapeutic Focused
BrandsR’billion
Other Commercial
Pharmaceutical Brands
R’billionTotal
R’billion
By customer geographyCommercial PharmaceuticalsSub-Saharan Africa 0,1 – 0,1 0,2 7,2 7,4 Developed Europe 1,7 3,2 1,5 6,4 0,4 6,8 Australasia 0,6 – 0,5 1,1 3,7 4,8 Latin America 0,6 0,1 0,8 1,5 1,2 2,7 Developing Europe & CIS 0,3 1,7 0,5 2,5 0,1 2,6 Japan 1,3 – 0,4 1,7 0,2 1,9 China 1,5 0,3 – 1,8 – 1,8 Other Asia 0,4 0,2 0,3 0,9 0,3 1,2 MENA 0,2 0,2 0,3 0,7 0,4 1,1 USA & Canada 0,3 – 0,3 0,6 0,5 1,1
Total Commercial Pharmaceuticals 7,0 5,7 4,7 17,4 14,0 31,4
Restated June 2016
Anaesthetic BrandsR’billion
Thrombosis BrandsR’billion
High Potency &
Cytotoxic BrandsR’billion
Therapeutic Focused
BrandsR’billion
Other Commercial
Pharmaceutical Brands
R’billionTotal
R’billion
By customer geographyCommercial PharmaceuticalsSub-Saharan Africa 0,1 – 0,1 0,2 6,9 7,1 Developed Europe – 4,0 1,8 5,8 0,4 6,2 Australasia – – 0,5 0,5 4,2 4,7 Latin America – 0,1 0,7 0,8 1,1 1,9 Developing Europe & CIS – 1,9 0,4 2,3 – 2,3 Japan – 0,1 0,5 0,6 0,1 0,7 Other Asia – 0,2 0,3 0,5 0,4 0,9 MENA – 0,1 0,3 0,4 0,5 0,9 USA & Canada – 0,1 0,4 0,5 0,2 0,7
Total Commercial Pharmaceuticals 0,1 6,5 5,0 11,6 13,8 25,4

Aspen Pharmacare Holdings Limited Annual Financial Statements 2017
29
Variance
Anaesthetic Brands
%
Thrombosis Brands
%
High Potency &
Cytotoxic Brands
%
Therapeutic Focused
Brands%
Other Commercial
Pharmaceutical Brands
%Total
%
By customer geographyCommercial PharmaceuticalsSub-Saharan Africa 35 38 29 33 3 4Developed Europe >100 (21) (19) 9 20 10Australasia >100 5 (2) >100 (12) 3Latin America >100 36 16 94 4 40Developing Europe & CIS >100 (8) 17 11 3 10Japan >100 (34) (17) >100 66 >100China >100 >100 30 >100 – >100Other Asia >100 (3) (8) 87 (13) 41MENA >100 17 (3) 57 (2) 27USA & Canada >100 (84) (25) 14 >100 58
Total Commercial Pharmaceuticals >100 (12) (7) 50 2 24
Aspen Pharmacare Holdings Limited Annual Financial Statements 2017
29

for the year ended 30 June 2017
30 Aspen Pharmacare Holdings Limited Annual Financial Statements 2017
Notes to the Group Annual Financial Statements
1. Intangible assetsAccounting policy
Recognition and measurementIntangible assets are stated at historical cost less accumulated amortisation and accumulated impairment losses. Intangible assets are not revalued.
CostExpenditure on acquired patents, trademarks, dossiers, licences and know-how is capitalised. Expenditure incurred to extend the term of the patents or trademarks is capitalised. All other expenditure is charged to the statement of comprehensive income when incurred.
Development costs directly attributable to the production of new or substantially improved products or processes controlled by the Group are capitalised (until the date of commercial production) if the costs can be measured reliably, the products and processes are technically feasible, future economic benefits are probable, and the Group intends to and has sufficient resources to complete development and to use or sell the asset. All the remaining development costs are charged to the statement of comprehensive income. Research expenditure is charged to the statement of comprehensive income when incurred.
The amounts that are recognised as intangible assets consist of all direct costs relating to the intellectual property and also include the cost of intellectual property development employees and an appropriate portion of relevant overheads. Other development costs that do not meet these criteria are recognised as an expense as incurred. Development costs previously recognised as an expense are not recognised as an asset in a subsequent period.
Rights acquired to co-market or manufacture certain third-party products are capitalised to intangible assets.
Acquired computer software licences are capitalised on the basis of the costs incurred to acquire and bring to use the specific software.
Costs associated with developing or maintaining computer software programs are recognised as an expense as incurred. Costs that are directly associated with the production of identifiable and unique software products controlled by the Group, and that will probably generate economic benefits exceeding costs beyond one year, are recognised as intangible assets if they meet the following criteria: ➜➜ the costs can be measured reliably;➜➜ the software is technically feasible;➜➜ future economic benefits are probable; ➜➜ the Group intends to and has sufficient resources to complete development; and➜➜ the Group intends to use or sell the asset.
An indefinite useful life intangible asset is an intangible asset where there is no foreseeable limit to the period over which the asset is expected to generate future economic benefits for the Group.
Accumulated amortisationIntangible assets are recognised at cost and amortised on a straight-line basis over their estimated remaining useful lives. Estimated useful lives are reviewed annually.
Amortisation is included in other operating expenses in the statement of comprehensive income.
Development costs are amortised from the commencement of the commercial sale of the product to which they relate, being the date at which all regulatory requirements necessary to commercialise the product are met.
Product participation and other contractual rights are amortised on a straight-line basis over the terms of the relevant agreements.

Aspen Pharmacare Holdings Limited Annual Financial Statements 2017
31
1. Intangible assets continuedAccounting policy continued
ImpairmentAn impairment assessment is performed on indefinite useful life intangible assets annually, or more frequently if there are indicators that the balance might be impaired. Finite useful life intangible assets are reviewed annually, but only assessed for impairment when there are indicators that the balance might be impaired. Impairment testing is performed by comparing the recoverable amount to the carrying value of the intangible asset.
The recoverable amounts of the intangible assets are determined as the higher of value-in-use and fair value less costs to sell.
Value-in-useKey assumptions relating to this valuation include the discount rate and cash flows used to determine the value-in-use. Future cash flows are estimated based on the most recent budgets and forecasts approved by management covering a period of up to 10 years and are extrapolated over the useful life of the asset to reflect the long-term plans for the Group using the estimated growth rate for the specific business or product. The estimated future cash flows and discount rates used are pre-tax based on assessment of the current risks applicable to the specific asset and/or entity and country in which it operates or the product is sold.
Management determines the expected performance of the assets based on the following:➜➜ an assessment of existing products against past performance and market conditions;➜➜ an assessment of existing products against existing market conditions; and➜➜ the pipeline of products under development, applying past experiences of launch successes and existing market conditions.
The growth rate used to extrapolate cash flow projections beyond the period covered by the budgets and forecasts take into account the long-term average rates of the industry in which the cash generating unit is operating. Estimations are based on a number of key assumptions such as volume, price and product mix which will create a basis for future growth and gross margin. These assumptions are set in relation to historic figures and external reports on market growth. If necessary, these cash flows are then adjusted to take into account any changes in assumptions or operating conditions that have been identified subsequent to the preparation of the budgets and forecasts.
The weighted average cost of capital is derived from a pricing model based on credit risk and the cost of the debt. The variables used in the model are established on the basis of management judgement and current market conditions. Management judgement is also applied in estimating the future cash flows of the cash generating units. These values are sensitive to the cash flows projected for the periods for which detailed forecasts are not available and to the assumptions regarding the long-term sustainability of the cash flows thereafter.
Intangible assets that have been impaired in past financial years are reviewed for possible reversal of impairment at each reporting date.
Aspen Pharmacare Holdings Limited Annual Financial Statements 2017
31

Notes to the Group Annual Financial Statements continued
for the year ended 30 June 2017
32 Aspen Pharmacare Holdings Limited Annual Financial Statements 2017
1. Intangible assets continuedSignificant judgements and estimates
Indefinite useful life intangible assetsSignificant judgement is needed by management when determining the classification of intangible assets as finite or indefinite useful life assets. The following factors are taken into account when this classification is made:➜➜ historical product sales, volume and profitability trends as well as the expected uses for the asset further evident from budgets, future growth and plans to invest in each of the assets over the long term are taken into account when this is being assessed; ➜➜ estimates of useful lives of similar assets – historical trends, market sentiment and/or the impact of any competitive activity;➜➜ the strategy (2018 budget, specific marketing plans, specific enhancement plans and the identification of new markets) for obtaining maximum economic benefit from the asset;➜➜ rates of technical, technological or commercial obsolescence in the industry are slow and evident in the fact that most of the reinvestment in technology is mainly expansion rather than replacement due to obsolescence;➜➜ the stability of the industry and economy in which the asset will be deployed;➜➜ the willingness and ability of the entity to commit resources to maintain the performance of the asset;➜➜ the period of the entity’s control over the asset and any legal or other restriction on its ability to use the asset; ➜➜ redundancy of a similar medication due to changes in market preferences; and➜➜ development of new drugs treating the same disease.
Indefinite useful life intangible assets constitutes 87% of total intangible assets (2016: 82% of total intangible assets).
Amortisation rates and residual valuesThe Group amortises its assets over their estimated useful lives. The estimation of the useful lives of assets is based on historic performance as well as expectations about future use and therefore requires a significant degree of judgement to be applied by management. The actual lives of these assets can vary depending on a variety of factors, including technological innovation, product life cycles and maintenance programmes.
Significant judgement is applied by management when determining the residual values for intangible assets which only arise in the event of contractual obligations in terms of which a termination consideration is payable to the Group, management will apply a residual value to the intangible asset.
The estimated remaining useful life information for 2017 was as follows:Intellectual property Up to 12 yearsProduct participation and other contractual rights Up to 42 yearsComputer software Up to 9 years

Aspen Pharmacare Holdings Limited Annual Financial Statements 2017
33
1. Intangible assets continuedReconciliation of balance
Intellectual property
R’billion
Development costs
R’billion
Product participation
and othercontractual
rightsR’billion
Computer softwareR’billion
TotalR’billion
2017Carrying valueCost 60,6 1,5 1,7 1,4 65,2 Accumulated amortisation (2,8) (0,2) (0,3) (0,5) (3,8)Accumulated impairment losses (1,3) (0,1) – – (1,4)
56,5 1,2 1,4 0,9 60,0
Movement in intangible assetsCarrying value at the beginning of the year 44,9 1,1 2,3 0,8 49,1 Acquisition of subsidiaries and businesses 16,2 – – – 16,2 Additions 0,4 0,3 – 0,4 1,1 Disposals – (0,1) (0,8) – (0,9)Amortisation (0,4) – (0,1) (0,1) (0,6)Impairment losses (0,3) (0,1) – – (0,4)Currency translation movements (4,3) – – (0,2) (4,5)
56,5 1,2 1,4 0,9 60,0
2016Carrying valueCost 48,9 1,3 2,6 1,2 54,0 Accumulated amortisation (2,7) (0,2) (0,3) (0,4) (3,6)Accumulated impairment losses (1,3) – – – (1,3)
44,9 1,1 2,3 0,8 49,1
Movement in intangible assetsCarrying value at the beginning of the year 36,6 1,0 2,4 0,5 40,5 Acquisition of subsidiaries and businesses 1,1 – – – 1,1 Additions 0,2 0,4 0,2 0,3 1,1 Disposals (0,1) (0,1) – – (0,2)Amortisation (0,4) (0,1) – (0,1) (0,6)Reclassification between categories 0,5 (0,1) (0,4) – – Impairment losses (0,8) (0,1) – – (0,9)Currency translation movements 7,8 0,1 0,1 0,1 8,1
44,9 1,1 2,3 0,8 49,1
All intangible assets were acquired from third parties, except for development costs that are both internally generated and outsourced to third-party development companies.
Aspen Pharmacare Holdings Limited Annual Financial Statements 2017
33

Notes to the Group Annual Financial Statements continued
for the year ended 30 June 2017
34 Aspen Pharmacare Holdings Limited Annual Financial Statements 2017
1. Intangible assets continuedIndefinite useful life intangible assets
2016R’billion
Split of balance (1) ELIZ Products 4,8 5,3 (2) Specialist Global Brands 4,0 4,5 (3) GSK OTC Brands 3,3 3,6 (4) GSK Classic Brands 2,1 2,5 (5) Mono-Embolex Business 1,9 2,1 (6) MSD Business 8,0 8,8 (7) GSK Thrombosis Business 10,4 10,6 (8) AstraZeneca Anaesthetic Portfolio 10,1 – (9) GSK Anaesthetic Portfolio 4,8 – (10) Other Brands 2,9 2,9
52,4 40,3
The key brands for the above mentioned indefinite life intangible assets are as follows:(1) Eltroxin, Lanoxin, Imuran and Zyloric.(2) Alkeran, Leukeran, Purinethol, Kemadrin, Lanvis, Myleran, Septrin and Trandate.(3) Phillips Milk of Magnesia, Dequadin, Solpadeine, Cartia, Zantac and Borstol.(4) Imigran, Lamictal, Mesasil and Zofran.(5) Mono-Embolex.(6) Deca Durabolin, Desogrestrel, Dexmathasone, Meticorten, Metrigen, Orgaran, Ovestin, Testosterone and Thyrax.(7) Arixtra and Fraxiparine.(8) Diprivan, EMLA, Marcaine, Naropin, Carbocaine, Citanest and Xylocaine.(9) Ultiva, Nimbex, Mivacron, Tracrium and Anectine.
Impairment of intangible assetsKey assumptions on impairment tests for significant indefinite useful life intangible assets were as follows
ELIZ Products 4,8 10 years Ranging between(3) and 3
Average of 73 0 Ranging between 9 and 11
Specialist Global Brands
4,0 10 years Ranging between1 and 7
Average of 84 0 Ranging between 8 and 10
GSK OTC Brands 3,3 5 – 10 years Ranging between 0 and 14
Average of 71 Ranging between1 and 5
Ranging between 9 and 24
GSK Classic Brands
2,1 5 – 10 years (2) and 6 Average of 68 0 10
Mono-Embolex Business
1,9 10 years Ranging between 1 and 3
Average of 41 0 7
MSD Business 8,0 5 years Ranging between (13) and 62
Average of 75 1 Ranging between8 and 15
GSK Thrombosis Business
10,4 5 years Ranging between(0) and 2
Average of 46 0 11
AstraZeneca Anaesthetic Portfolio
10,1 8 years Ranging between(6) and 14
Average of 37 (1) 16
GSK Anaesthetic Portfolio
4,8 9 years Ranging between1 and 3
Average of 62 Ranging between(5) and 0
13
* Growth rate used to extrapolate cash flows beyond period covered by abovementioned budgets and forecasts.
2017R’billion
Carrying value of
intangible assets
(R’billion)
Period covered by
forecasts and budgets
Growth in revenue (% per annum)
Gross profit (% per annum)
Growth (% per annum)*
Pre-tax discount rate
applied to cash flows (% per
annum)

Aspen Pharmacare Holdings Limited Annual Financial Statements 2017
35
1. Intangible assets continuedImpairment of intangible assets continuedHere management has used a forecast period greater than five years to better reflect the impact of a gradual slowing in growth over the medium term. Based on the calculations the appropriate impairments were recognised for these indefinite useful life intangible assets. There are no reasonable possible changes in any key assumption which would cause the carrying value of the remaining indefinite useful life intangible assets to exceed its value-in-use.
Key assumptions on impairment tests for significant indefinite useful life intangible assets were as follows in 2016:Carrying value of
intangible assets
(R’billion)
Period covered by
forecasts and budgets
Growth in revenue (% per annum)
Gross profit (% per annum)
Growth (% per annum)*
Pre-tax discount rate
applied to cash flows (% per
annum)
ELIZ Products 5,3 10 years Ranging between(3) and 3
Average of 73 0 Ranging between 9 and 11
Specialist Global Brands
4,5 10 years Ranging between1 and 7
Average of 84 0 Ranging between 8 and 10
GSK OTC Brands 3,6 10 years Ranging between 2 and 10
Average of 72 1 Ranging between 9 and 24
GSK Classic Brands
2,5 10 years Ranging between 0 and 8
Average of 68 Ranging between(5) and 1
9
Mono-Embolex Business
2,1 10 years Ranging between 1 and 3
Average of 41 0 7
MSD Business 8,8 10 years Ranging between (13) and 14
Average of 67 1 12
GSK Thrombosis Business
10,6 10 years Ranging between(1) and 10
Average of 47 1 12
* Growth rate used to extrapolate cash flows beyond period covered by abovementioned budgets and forecasts.
➜–2016
R’billion
Impairment of intangible assets (included in other operating expenses)Impairment of intangible assets can be split as follows:(1) Brands in AGI 0,3 0,5 (2) Brands in Brazil – 0,4 (3) Development costs in South Africa 0,1 –
0,4 0,9
(1) This related mainly to certain GSK Classic Brands owned by AGI and distributed in Australia in terms of which the outlook on revenue evolution and profitability has declined (2016: certain brands in the Specialist Global Brands, OTC Brands and GSK Classic Brands categories). The carrying value of intangible assets was determined based on value-in-use calculations. The key assumptions detailed above were used.
(2) The impairment in the prior year related primarily to certain OTC products for which the outlook on profitability and revenue evolution had declined.
(3) The impairment relates to product development projects which were no longer technically or commercially feasible and were fully written off.
2017R’billion
Aspen Pharmacare Holdings Limited Annual Financial Statements 2017
35

Notes to the Group Annual Financial Statements continued
for the year ended 30 June 2017
36 Aspen Pharmacare Holdings Limited Annual Financial Statements 2017
1. Intangible assets continued2016
R’billion
CommitmentsCapital commitments, include all projects for which specific Board approval has been obtained up to the reporting date. Capital expenditure will be financed from funds generated out of normal business operations and existing borrowing facilities. Projects still under investigation for which specific Board approval have not yet been obtained are excluded from the following:Authorised and contracted for 0,1 0,4 Authorised but not yet contracted for 0,4 0,5
0,5 0,9
Other disclosuresNo intangible assets have been pledged as security for borrowings
2. Property, plant and equipmentAccounting policy
Recognition and measurementProperty, plant and equipment is stated at historical cost less accumulated depreciation and accumulated impairment losses.
CostHistorical cost includes expenditure that is directly attributable to the acquisition of the items.
The cost of self-constructed assets includes expenditure on materials, direct labour and an allocated proportion of project overheads. Costs capitalised for work-in-progress in respect of activities to develop, expand or enhance items of property, plant and equipment are classified as part of assets under capital work-in-progress. Subsequent costs are included in the asset’s carrying value, or recognised as a separate asset, only when it is probable that the future economic benefits associated with the item will flow to the Group and the cost of the item can be measured reliably. All other repairs and maintenance are charged to the statement of comprehensive income in the period in which they are incurred.
Gains or losses on disposals of property, plant and equipment are determined by comparing proceeds with the carrying value and are included in operating profit in the statement of comprehensive income.
Costs directly attributable to major development projects of property, plant and equipment are capitalised to the asset.
Leases of property, plant and equipment where the Group has substantially all the risks and rewards of ownership are classified as finance leases. Finance leases are capitalised at the inception of the lease at the lower of the fair value of the leased assets or the present value of the minimum lease payments.
DepreciationProperty, plant and equipment is depreciated to its estimated residual value on a straight-line basis over its expected useful life. The assets’ residual values and useful lives are reviewed, and adjusted if appropriate, at each year-end date. The property, plant and equipment acquired under finance leases are depreciated over the shorter of the useful life of the asset or the lease term.
Land and buildings comprise mainly factories and office buildings. Owned land is not depreciated. Leasehold improvements are depreciated over the lesser of the period of the lease and the useful life of the asset.
ImpairmentThe Group reviews the carrying value of its property, plant and equipment annually and if events occur which call into question the carrying value of the assets to determine whether there is any indication of impairment. If any such indication exists, the recoverable amount of the asset is estimated, being the higher of the asset’s fair value less cost to sell and value-in-use. In assessing value-in-use the estimated future cash flows are discounted to their present value using a pre-tax discount rate that reflects current market assessments of the time value of money and the risks specific to the asset. For the purposes of assessing impairment, assets are grouped at the lowest level for which there are separately identifiable cash flows (cash generating units). Where the carrying value exceeds the estimated recoverable amount, such assets are written down to their recoverable amount.
Operating leasesLeases where a significant portion of risks and rewards of ownership is retained by the lessor are classified as operating leases. Operating lease costs (net of any incentives from the lessor) are charged against operating profit on a straight-line basis over the period of the lease.
2017R’billion

Aspen Pharmacare Holdings Limited Annual Financial Statements 2017
37
2. Property, plant and equipment continuedSignificant judgements and estimates
Depreciation and residual valuesThe Group depreciates its assets over their estimated useful lives. The estimation of the useful lives of assets is based on historic performance as well as expectations about future use and therefore requires a significant degree of judgement to be applied by management. The actual lives of these assets can vary depending on a variety of factors, including technological innovation, product life cycles and maintenance programmes. These depreciation rates represent management’s current best estimate of the useful lives of these assets.
Significant judgement is applied by management when determining the residual values for property, plant and equipment. In the event of contractual obligations in terms of which a termination consideration is payable to the Group, management will apply a residual value to the asset. When determining the residual value the following factors are taken into account:➜➜ external residual value information (if available); and ➜➜ internal technical assessments for complex plant and machinery.
The Group has reviewed the residual values and useful lives of the assets. No material adjustment resulted from such review in the current year.
Depreciation ratesThe estimated remaining useful life information for 2017 was as follows:Buildings (including leasehold improvements) Up to 50 yearsPlant and equipment Up to 25 yearsComputer equipment Up to 10 yearsOffice equipment and furniture Up to 10 years
Reconciliation of balance
Land and buildingsR’billion
Plant and equipment
R’billion
Other tangible
assets@
R’billion
Capital work-in-progressR’billion
TotalR’billion
2017Carrying valueCost 4,5 5,1 0,9 3,3 13,7 Accumulated depreciation (0,9) (2,3) (0,5) – (3,7)Accumulated impairment losses – – – (0,3) (0,3)
3,5 2,8 0,4 3,0 9,7
Movement in property, plant and equipmentCarrying value at the beginning of the year 3,2 2,8 0,4 3,3 9,7 Additions 0,1 0,3 0,1 1,0 1,5 Borrowing costs capitalised – – – 0,2 0,2* Depreciation (0,2) (0,4) (0,1) – (0,7)Reclassification between categories 0,6 0,3 – (0,9) – Reclassification to assets classified as held-for-sale – – – (0,2) (0,2)Impairment losses – – – (0,3) (0,3)Currency translation movements (0,2) (0,2) – (0,1) (0,5)
3,5 2,8 0,4 3,0 9,7# @ Other tangible assets comprise computer equipment, office equipment and furniture.* Borrowing costs capitalised represent financing costs arising on the construction of qualifying assets. The average effective interest rate for the
year was 8,5% (2016: 7,7%).# Included in the total are leased assets amounting to R52,7 million (2016: R52,2 million).
Aspen Pharmacare Holdings Limited Annual Financial Statements 2017
37
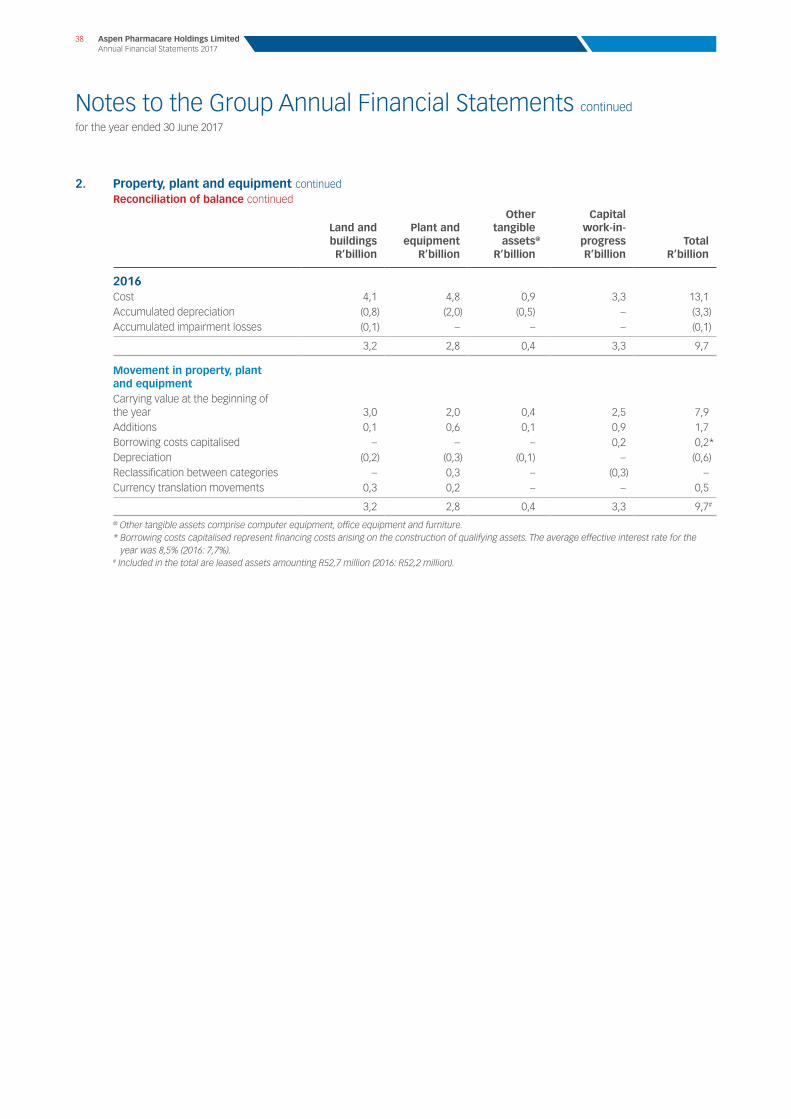
Notes to the Group Annual Financial Statements continued
for the year ended 30 June 2017
38 Aspen Pharmacare Holdings Limited Annual Financial Statements 2017
2. Property, plant and equipment continuedReconciliation of balance continued
Land and buildingsR’billion
Plant and equipment
R’billion
Other tangible
assets@
R’billion
Capital work-in-progressR’billion
TotalR’billion
2016Cost 4,1 4,8 0,9 3,3 13,1Accumulated depreciation (0,8) (2,0) (0,5) – (3,3)Accumulated impairment losses (0,1) – – – (0,1)
3,2 2,8 0,4 3,3 9,7
Movement in property, plant and equipmentCarrying value at the beginning of the year 3,0 2,0 0,4 2,5 7,9 Additions 0,1 0,6 0,1 0,9 1,7 Borrowing costs capitalised – – – 0,2 0,2* Depreciation (0,2) (0,3) (0,1) – (0,6)Reclassification between categories – 0,3 – (0,3) – Currency translation movements 0,3 0,2 – – 0,5
3,2 2,8 0,4 3,3 9,7# @ Other tangible assets comprise computer equipment, office equipment and furniture.* Borrowing costs capitalised represent financing costs arising on the construction of qualifying assets. The average effective interest rate for the
year was 8,5% (2016: 7,7%).# Included in the total are leased assets amounting R52,7 million (2016: R52,2 million).
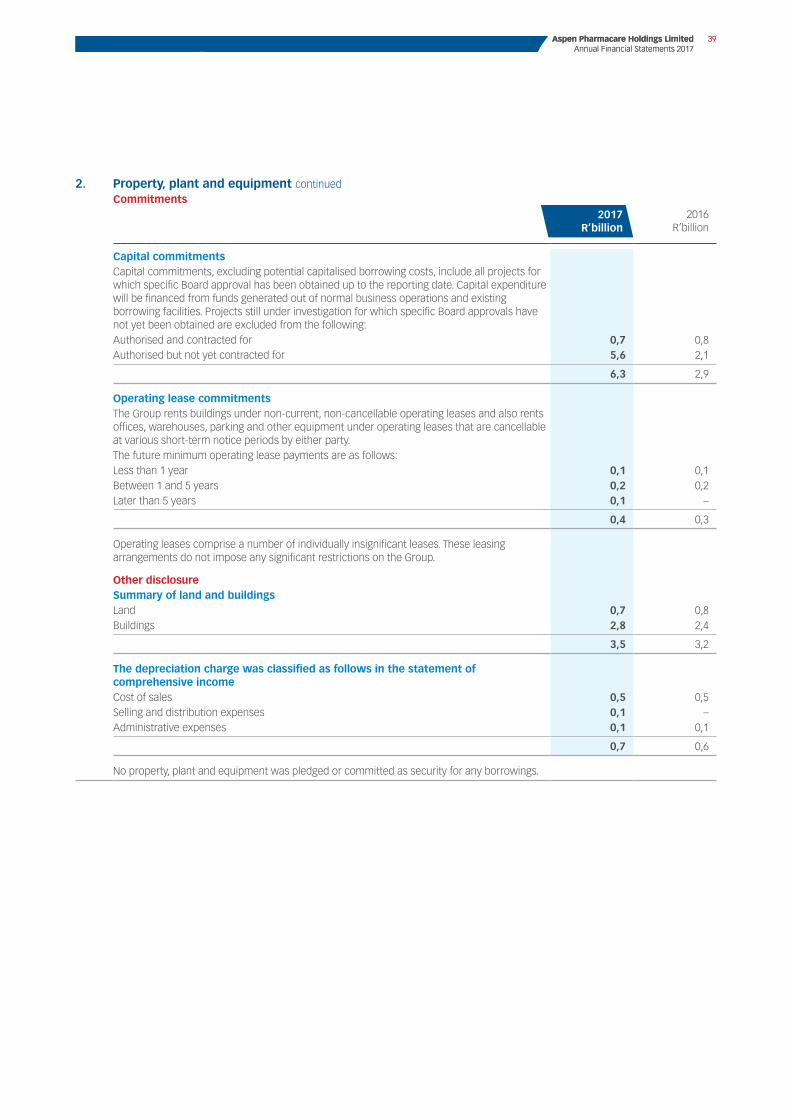
Aspen Pharmacare Holdings Limited Annual Financial Statements 2017
39
2. Property, plant and equipment continuedCommitments
2016R’billion
Capital commitmentsCapital commitments, excluding potential capitalised borrowing costs, include all projects for which specific Board approval has been obtained up to the reporting date. Capital expenditure will be financed from funds generated out of normal business operations and existing borrowing facilities. Projects still under investigation for which specific Board approvals have not yet been obtained are excluded from the following:Authorised and contracted for 0,7 0,8 Authorised but not yet contracted for 5,6 2,1
6,3 2,9
Operating lease commitmentsThe Group rents buildings under non-current, non-cancellable operating leases and also rents offices, warehouses, parking and other equipment under operating leases that are cancellable at various short-term notice periods by either party.The future minimum operating lease payments are as follows:Less than 1 year 0,1 0,1 Between 1 and 5 years 0,2 0,2 Later than 5 years 0,1 –
0,4 0,3
Operating leases comprise a number of individually insignificant leases. These leasing arrangements do not impose any significant restrictions on the Group.
Other disclosureSummary of land and buildingsLand 0,7 0,8 Buildings 2,8 2,4
3,5 3,2
The depreciation charge was classified as follows in the statement of comprehensive incomeCost of sales 0,5 0,5 Selling and distribution expenses 0,1 – Administrative expenses 0,1 0,1
0,7 0,6
No property, plant and equipment was pledged or committed as security for any borrowings.
2017R’billion
Aspen Pharmacare Holdings Limited Annual Financial Statements 2017
39

Notes to the Group Annual Financial Statements continued
for the year ended 30 June 2017
40 Aspen Pharmacare Holdings Limited Annual Financial Statements 2017
3. GoodwillAccounting policy
Recognition and measurementGoodwill on the acquisition of subsidiaries or businesses is capitalised and shown separately on the face of the statement of financial position and carried at cost less accumulated impairment losses.
CostGoodwill is initially measured as the excess of the aggregate of the consideration transferred, the acquisition date fair value of previously held equity interests and the fair value of non-controlling interests over the net identifiable assets acquired and liabilities assumed. If the cost of the acquisition is less than the fair value of the net assets of the subsidiary acquired, the difference is recognised directly in the statement of comprehensive income.
The profit or loss realised on disposal or termination of an entity is calculated after taking into account the carrying value of any related goodwill.
ImpairmentFor the purposes of impairment testing, goodwill is allocated to the smallest cash generating unit. Each of those cash generating units represents the smallest identifiable group of assets that generates cash inflows that are largely independent of the cash inflows from other assets or groups of assets. The allocation is made to those cash generating units or groups of cash generating units that are expected to benefit from the business combination in which the goodwill arose. Impairment assessments are performed annually, or more frequently if there are indicators that the balance might be impaired. Impairment testing is performed by comparing the value-in-use of the cash generating unit to the carrying value. Impairment testing is only performed on cash generating units that are considered to be significant in comparison to the total carrying value of goodwill.
Value-in-useKey assumptions include the discount rate and cash flows used to determine the value-in-use. Future cash flows are estimated based on the most recent budgets and forecasts approved by management covering periods between five and eight years and are extrapolated over the useful life of the asset to reflect the long-term plans for the Group using the estimated growth rate for the specific business or product. The estimated future cash flows and discount rates used are pre-tax based on an assessment of the current risks applicable to the specific entity and country in which it operates.
Management determines the expected performance of the assets based on the following:➜➜ an assessment of existing products against past performance and market conditions;➜➜ an assessment of existing products against existing market conditions; and➜➜ the pipeline of products under development, applying past experiences of launch success and existing market conditions.
The growth rate used to extrapolate cash flow projections beyond the period covered by the budgets and forecasts takes into account the long-term average rates of the industry in which the cash generating unit is operating. Estimations are based on a number of key assumptions such as volume, price and product mix which will create a basis for future growth and gross margin. These assumptions are set in relation to historic figures and external reports on market growth. If necessary, these cash flows are then adjusted to take into account any changes in assumptions or operating conditions that have been identified subsequent to the preparation of the budgets.
The weighted average cost of capital rate is derived from a pricing model based on credit risk and the cost of the debt. The variables used in the model are established on the basis of management judgement and current market conditions. Management judgement is also applied in estimating the future cash flows of the cash generating units. These values are sensitive to the cash flows projected for the periods for which detailed forecasts are not available and to the assumptions regarding the long-term sustainability of the cash flows thereafter.
Impairment losses recognised for goodwill are not reversed in subsequent financial years.
Reconciliation of balance2016
R’billion
Carrying value at the beginning of the year 6,0 5,0 Acquisition of subsidiaries and businesses 0,4 –Disposal of subsidiary (0,1) –Currency translation movements (0,4) 1,0
5,9 6,0
Split of balance Sigma business – Australasia 4,1 4,5AstraZeneca Anaesthetics Portfolio 0,3 – MSD business 0,4 0,3Other 1,1 1,3
5,9 6,0
2017R’billion

Aspen Pharmacare Holdings Limited Annual Financial Statements 2017
41
3. Goodwill continuedImpairment of goodwillKey assumptions on the impairment tests for goodwill were as follows in 2017:
Sigma Business 4,1 5 years Ranging between(3) and 2
57 Ranging betweenAUD3 million and
AUD12 million
3 10
AstraZeneca Anaesthetic Portfolio
0,3 8 years Ranging between(6) and 14
Average of 37 Nil Ranging between(5) and 0
16
MSD Business 0,4 5 years Ranging between (13) and 62
Average of 75 Nil Ranging between0 and 1
Ranging between8 and 15
Key assumptions on the impairment tests for goodwill were as follows in 2016:
Carrying value of goodwill (R’billion)
Period covered
by forecasts
and budgets
Growth in turnover
(% per annum)
Gross profit
(% per annum)
Capital expenditure (per annum)
Growth (% per annum)*
Pre-tax discount
rate appliedto cash
flows (% per
annum)
Sigma business 4,5 5 years Ranging between(2) and 5
54 Ranging betweenAUD3 million and
AUD12 million
3 10
MSD business 0,3 10 years Ranging between (13) and 14
Average of 67 Nil 1 12
* Growth rate used to extrapolate cash flows beyond period covered by abovementioned budgets and forecasts.
Management has used a forecast period greater than five years to better reflect the impact of a gradual slowing in growth over the medium term.
Based on the calculations no impairments were recognised. There are no reasonable possible changes in any key assumption which would cause the carrying value of goodwill to exceed its value-in-use.
4. Deferred taxAccounting policy
Recognition and measurementDeferred tax is provided in full, using the liability method, at currently enacted or substantively enacted tax rates in operation at year end, that are expected to apply when the related deferred tax asset is realised or the deferred tax liability is settled. Full provision is made for all temporary differences between the tax base of an asset or liability and its statement of financial position carrying value. No deferred tax asset or liability is recognised in those circumstances, other than a business combination, where the initial recognition of an asset or liability has no impact on accounting profit or taxable income.
Deferred tax assets are recognised to the extent that it is probable that future taxable profit will be available against which the temporary differences can be utilised.
Deferred tax is charged or credited to other comprehensive income or directly to equity if the tax relates to items that are credited or charged, in the same or a different period, to other comprehensive income or directly to equity respectively.
Deferred tax is provided on temporary differences arising on investments in subsidiaries, except where the timing of the reversal of the temporary difference is controlled by the Group and it is probable that the temporary difference will not reverse in the foreseeable future.
Deferred tax assets and liabilities are offset when there is a legally enforceable right to offset current tax assets against current tax liabilities and when the deferred tax assets and liabilities relate to taxes levied by the same tax authority on either the same taxable entity or different taxable entities where there is an intention to settle the balances on a net basis.
Deferred tax is calculated in full on temporary differences under the liability method using a principal tax rate of 28% (2016: 28%).
Carrying value of
goodwill (R’billion)
Period covered
by forecasts
and budgets
Growth in turnover
(% per annum)
Gross profit
(% per annum)
Capital expenditure (per annum)
Growth (% per annum)*
Pre-tax discount
rate appliedto cash
flows (% per
annum)
Aspen Pharmacare Holdings Limited Annual Financial Statements 2017
41

Notes to the Group Annual Financial Statements continued
for the year ended 30 June 2017
42 Aspen Pharmacare Holdings Limited Annual Financial Statements 2017
4. Deferred tax continuedReconciliation of balance
2016R’billion
Deferred tax liabilities – opening balance 1,8 1,7 Deferred tax assets – opening balance (1,1) (1,1)
Net deferred tax liabilities – opening balance 0,7 0,6 Statement of comprehensive income debit – included in tax (0,1) –
Acquisition of subsidiaries and businesses 0,4 – Currency translation movements 0,1 0,1
1,1 0,7
Split of balanceDeferred tax liabilities 2,1 1,8 Deferred tax assets (1,0) (1,1)
1,1 0,7
Deferred tax balance comprisesProperty, plant and equipment 0,2 0,4 Intangible assets 0,5 0,7 Investments in joint venture and subsidiaries 1,3 0,8 Inventories (0,1) (0,2)Trade and other receivables – (0,1)Net deferred tax assets not able to be recognised – 0,2 Unfavourable and onerous contracts (0,4) (0,5)Retirement and other employee benefit obligations (0,1) (0,1)Trade and other payables (0,2) (0,4)Tax losses (0,3) (0,4)Other 0,2 0,3
1,1 0,7
The statement of comprehensive income debit comprisesProperty, plant and equipment – 0,1 Intangible assets – 0,1 Trade and other receivables (0,2) (0,1)Net deferred tax assets not able to be recognised (0,1) 0,2 Unfavourable and onerous contracts 0,2 –Retirement and other employee benefit obligations – 0,1 Tax losses – (0,1)Other – (0,3)
(0,1) –
2017R’billion

Aspen Pharmacare Holdings Limited Annual Financial Statements 2017
43
5. Contingent environmental liabilities and indemnification assetsAccounting policy
Recognition and measurementThe contingent environmental indemnification assets and contingent environmental liabilities relate to environmental remediation required at the Moleneind site at Oss, in the Netherlands. The remediation is being managed, undertaken and funded by MSD. However, as owner of the site, Aspen Oss has inherited a legal obligation for the remediation for which it has been indemnified by MSD. Consequently, Aspen has recognised contingent liabilities and corresponding contingent indemnification assets based on an independent estimate of the remediation cost. In view of MSD’s involvement in the remediation process, the balances have been referred to as contingent as the settlement of the liabilities and the realisation of the indemnification assets are not expected to have any cash flow implications for the Group.
Liabilities for environmental restoration are recognised when the Group has a legal or a constructive obligation, as a result of a past event, and it is probable that there may be an outflow of resources embodying economic benefits to settle the obligation and the obligation can be measured reliably. The environmental liabilities are measured at the present value of the expenditures expected to be required to settle the obligation using a pre-tax rate that reflects current market assessments of the time value of money and the risks specific to the obligation.
Reconciliation of balance2016
R’billion
Carrying value at the beginning of the year 0,8 0,7 Currency translation movements (0,1) 0,1
0,7 0,8
6. Other non-current assetsAccounting policy
Recognition and measurementOther non-current receivablesOther non-current receivables are initially recognised at fair value and subsequently measured at amortised cost, less impairments, using the effective interest rate method. No fair value adjustment is made for the effect of time value of money where receivables have a short-term profile.
A provision for impairment of other non-current receivables is established when there is objective evidence that the Group will not be able to collect all amounts due as a result of one or more events that occurred after the initial recognition (a “loss event”) and that loss event has an impact on the estimated future cash flows of the assets that can be reliably estimated.
Investment in joint ventureInvestments in joint arrangements are classified as either joint operations or joint ventures. The classification depends on the contractual rights and obligations of each investor, rather than the legal structure of the joint arrangement. The Group has interests in joint ventures which are accounted for using the equity method, after initially being recognised at cost in the statement of financial position.
Available-for-sale financial assetsAvailable-for-sale financial assets are non-derivatives that are either designated in this category or not classified in any other categories. They are included in non-current assets unless management intends to dispose of the investment within 12 months from the statement of financial position date. Available-for-sale financial assets are carried at fair value and changes in the fair value are recognised in other comprehensive income. When securities classified as available-for-sale are sold or impaired, the accumulated fair value adjustments recognised in equity are included in the statement of comprehensive income.
Purchases and sales of investments are recognised on the trade date, which is the date that the Group commits to purchase or sell the asset. Investments are initially recognised at fair value plus transaction costs for all financial assets not carried at fair value through profit and loss. Financial assets carried at fair value through profit and loss are initially recognised at fair value and transaction costs are expensed in the statement of comprehensive income. Investments are derecognised when the rights to receive cash flows from the investments have expired or the Group has transferred substantially all risks and rewards of ownership.
2017R’billion
Aspen Pharmacare Holdings Limited Annual Financial Statements 2017
43

Notes to the Group Annual Financial Statements continued
for the year ended 30 June 2017
44 Aspen Pharmacare Holdings Limited Annual Financial Statements 2017
6. Other non-current assets continuedAccounting policy continued
At each statement of financial position date the Group assesses whether there is objective evidence that a financial asset or a group of financial assets is impaired. In the case of equity securities classified as available-for-sale, a significant or prolonged decline in the fair value of the security below its cost is considered an indicator that the securities are impaired. The impairment loss, being the difference between the acquisition cost and the current fair value, less any impairment loss previously recognised in profit or loss, is removed from equity and recognised in the statement of comprehensive income. Impairment losses on available-for-sale financial assets recognised in the statement of comprehensive income are not reversed in subsequent financial years.
Financial assetsEnterprise development loans and export advance to API supplier are classified as “Loans and receivables” in terms of IAS 39 – Financial Instruments: Recognition and Measurement. Loans and receivables are non-derivative financial assets with fixed or determinable payments that are not quoted in an active market. These are included in non-current assets as they all have maturities more than 12 months from year end. The Group determines the classification of its financial assets at initial recognition when the Group becomes party to the contractual provisions of the instrument.
Split of balance
Notes2016
R’billion2016
R’billion
Other non-current receivables 6.1 0,6 0,2 Investments in joint ventures 6.2 0,2 0,1 Available-for-sale financial assets 6.3 0,1 0,1
0,9 0,4
6.1 Other non-current receivablesSummary of balanceEmployee benefits – reimbursive rights 0,2 0,2 Exports advance to API supplier 0,3 –Enterprise development loans 0,1 –
0,6 0,2
Split of balance Financial instruments 0,4 –Non-financial instruments 0,2 0,2
0,6 0,2
Employee benefits – reimbursive rightsAs part of the GSK Thrombosis business acquisition in 2014, Aspen acquired certain non-current employee-related liabilities (which have been included in retirement and other employee benefit obligations on the statement of financial position). As part of the agreement, GSK is responsible for pre-acquisition liabilities. The value of the non-current employee-related liabilities acquired are based on independent valuations and as such an equal and opposite asset was recognised. GSK will reimburse Aspen as and when the liabilities are paid out to employees who qualify for the benefits. Management considers the credit risk associated with these non-current receivables to be low.
Exports advance to API supplierThe export advance was made to a supplier of active pharmaceutical ingredients and is to be settled through the provision of a certain level of inventory annually over the course of a 10-year supply agreement. Management considers the credit risk associated with these non-current receivables to be low.
Enterprise development loansVarious agreements have been entered into with several BBBEE beneficiaries whereby loan funding has been advanced by Aspen. These loans have various terms ranging from three to five years and all the loans are scheduled for repayment at the end of their respective terms. The loans bear interest at the South African prime rate plus margins ranging from minus 2% to plus 1% (2016: South African prime rate plus margins ranging from minus 2% to plus 1%).
All the loans are secured by either immovable property, specified movable assets or cession of specified book debts. Management considers the credit risk associated with these non-current receivables to be low.
2017R’billion
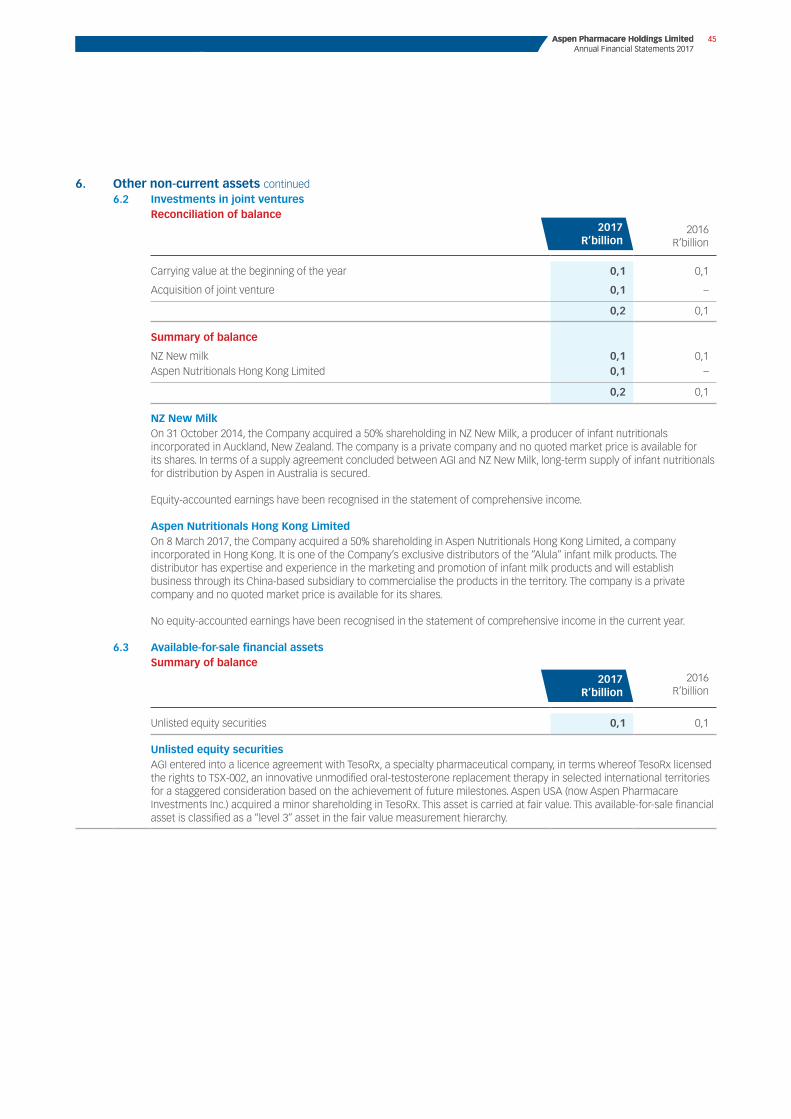
Aspen Pharmacare Holdings Limited Annual Financial Statements 2017
45
6. Other non-current assets continued6.2 Investments in joint ventures
Reconciliation of balance2016
R’billion
Carrying value at the beginning of the year 0,1 0,1
Acquisition of joint venture 0,1 –
0,2 0,1
Summary of balance
NZ New milk 0,1 0,1 Aspen Nutritionals Hong Kong Limited 0,1 –
0,2 0,1
NZ New MilkOn 31 October 2014, the Company acquired a 50% shareholding in NZ New Milk, a producer of infant nutritionals incorporated in Auckland, New Zealand. The company is a private company and no quoted market price is available for its shares. In terms of a supply agreement concluded between AGI and NZ New Milk, long-term supply of infant nutritionals for distribution by Aspen in Australia is secured.
Equity-accounted earnings have been recognised in the statement of comprehensive income.
Aspen Nutritionals Hong Kong LimitedOn 8 March 2017, the Company acquired a 50% shareholding in Aspen Nutritionals Hong Kong Limited, a company incorporated in Hong Kong. It is one of the Company’s exclusive distributors of the “Alula” infant milk products. The distributor has expertise and experience in the marketing and promotion of infant milk products and will establish business through its China-based subsidiary to commercialise the products in the territory. The company is a private company and no quoted market price is available for its shares.
No equity-accounted earnings have been recognised in the statement of comprehensive income in the current year.
6.3 Available-for-sale financial assetsSummary of balance
2016R’billion
Unlisted equity securities 0,1 0,1
Unlisted equity securitiesAGI entered into a licence agreement with TesoRx, a specialty pharmaceutical company, in terms whereof TesoRx licensed the rights to TSX-002, an innovative unmodified oral-testosterone replacement therapy in selected international territories for a staggered consideration based on the achievement of future milestones. Aspen USA (now Aspen Pharmacare Investments Inc.) acquired a minor shareholding in TesoRx. This asset is carried at fair value. This available-for-sale financial asset is classified as a “level 3” asset in the fair value measurement hierarchy.
2017R’billion
2017R’billion
Aspen Pharmacare Holdings Limited Annual Financial Statements 2017
45
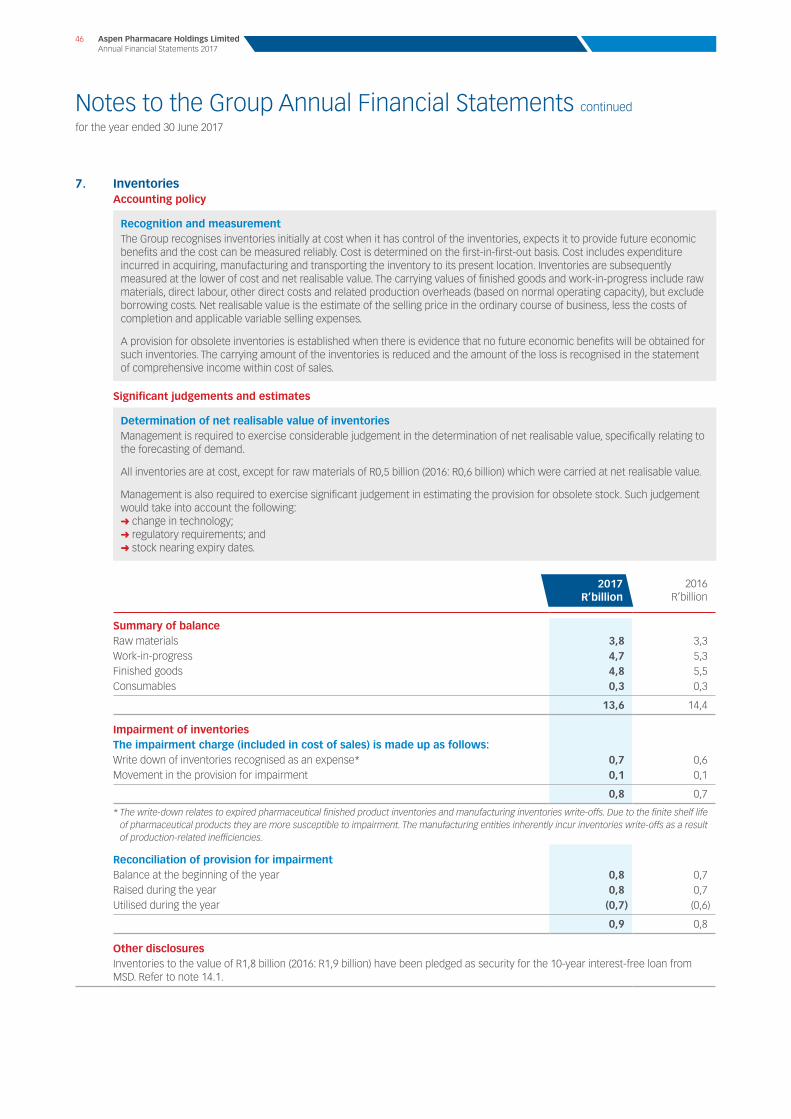
Notes to the Group Annual Financial Statements continued
for the year ended 30 June 2017
46 Aspen Pharmacare Holdings Limited Annual Financial Statements 2017
7. InventoriesAccounting policy
Recognition and measurementThe Group recognises inventories initially at cost when it has control of the inventories, expects it to provide future economic benefits and the cost can be measured reliably. Cost is determined on the first-in-first-out basis. Cost includes expenditure incurred in acquiring, manufacturing and transporting the inventory to its present location. Inventories are subsequently measured at the lower of cost and net realisable value. The carrying values of finished goods and work-in-progress include raw materials, direct labour, other direct costs and related production overheads (based on normal operating capacity), but exclude borrowing costs. Net realisable value is the estimate of the selling price in the ordinary course of business, less the costs of completion and applicable variable selling expenses.
A provision for obsolete inventories is established when there is evidence that no future economic benefits will be obtained for such inventories. The carrying amount of the inventories is reduced and the amount of the loss is recognised in the statement of comprehensive income within cost of sales.
Significant judgements and estimates
Determination of net realisable value of inventoriesManagement is required to exercise considerable judgement in the determination of net realisable value, specifically relating to the forecasting of demand.
All inventories are at cost, except for raw materials of R0,5 billion (2016: R0,6 billion) which were carried at net realisable value.
Management is also required to exercise significant judgement in estimating the provision for obsolete stock. Such judgement would take into account the following:➜➜ change in technology;➜➜ regulatory requirements; and➜➜ stock nearing expiry dates.
2016R’billion
Summary of balanceRaw materials 3,8 3,3 Work-in-progress 4,7 5,3 Finished goods 4,8 5,5 Consumables 0,3 0,3
13,6 14,4
Impairment of inventoriesThe impairment charge (included in cost of sales) is made up as follows:Write down of inventories recognised as an expense* 0,7 0,6 Movement in the provision for impairment 0,1 0,1
0,8 0,7
* The write-down relates to expired pharmaceutical finished product inventories and manufacturing inventories write-offs. Due to the finite shelf life of pharmaceutical products they are more susceptible to impairment. The manufacturing entities inherently incur inventories write-offs as a result of production-related inefficiencies.
Reconciliation of provision for impairmentBalance at the beginning of the year 0,8 0,7 Raised during the year 0,8 0,7 Utilised during the year (0,7) (0,6)
0,9 0,8
Other disclosuresInventories to the value of R1,8 billion (2016: R1,9 billion) have been pledged as security for the 10-year interest-free loan from MSD. Refer to note 14.1.
2017R’billion
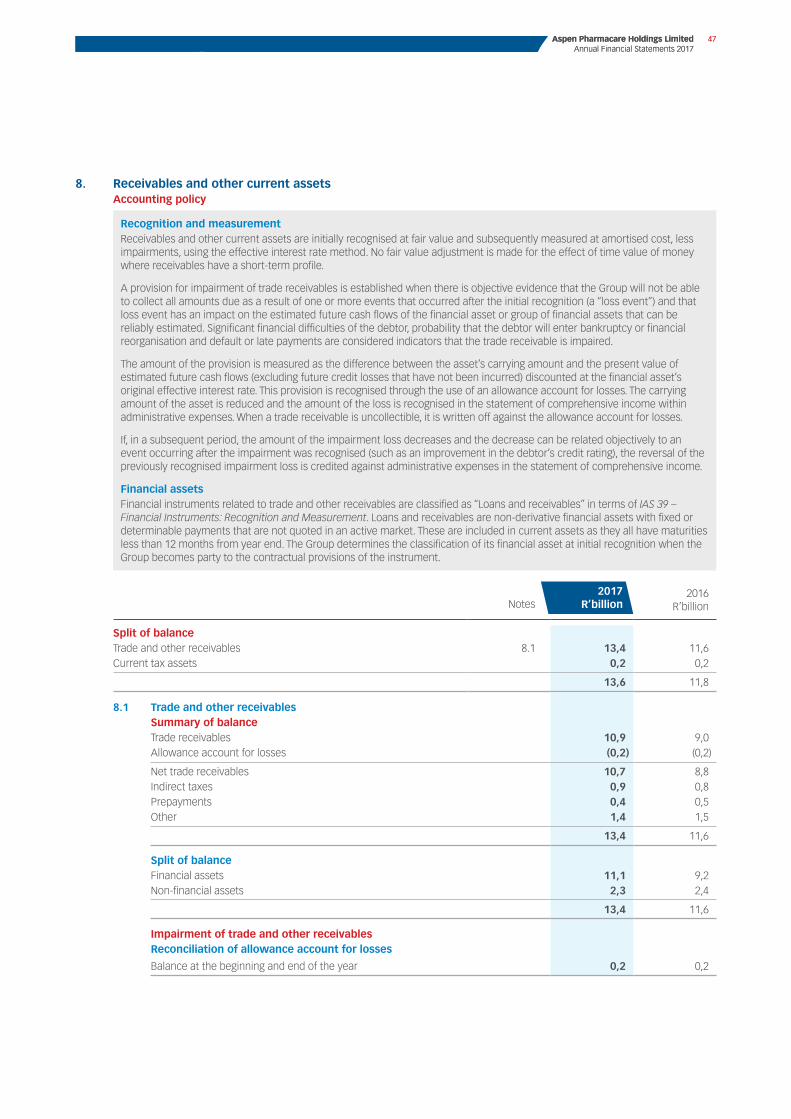
Aspen Pharmacare Holdings Limited Annual Financial Statements 2017
47
8. Receivables and other current assetsAccounting policy
Recognition and measurementReceivables and other current assets are initially recognised at fair value and subsequently measured at amortised cost, less impairments, using the effective interest rate method. No fair value adjustment is made for the effect of time value of money where receivables have a short-term profile.
A provision for impairment of trade receivables is established when there is objective evidence that the Group will not be able to collect all amounts due as a result of one or more events that occurred after the initial recognition (a “loss event”) and that loss event has an impact on the estimated future cash flows of the financial asset or group of financial assets that can be reliably estimated. Significant financial difficulties of the debtor, probability that the debtor will enter bankruptcy or financial reorganisation and default or late payments are considered indicators that the trade receivable is impaired.
The amount of the provision is measured as the difference between the asset’s carrying amount and the present value of estimated future cash flows (excluding future credit losses that have not been incurred) discounted at the financial asset’s original effective interest rate. This provision is recognised through the use of an allowance account for losses. The carrying amount of the asset is reduced and the amount of the loss is recognised in the statement of comprehensive income within administrative expenses. When a trade receivable is uncollectible, it is written off against the allowance account for losses.
If, in a subsequent period, the amount of the impairment loss decreases and the decrease can be related objectively to an event occurring after the impairment was recognised (such as an improvement in the debtor’s credit rating), the reversal of the previously recognised impairment loss is credited against administrative expenses in the statement of comprehensive income.
Financial assetsFinancial instruments related to trade and other receivables are classified as “Loans and receivables” in terms of IAS 39 – Financial Instruments: Recognition and Measurement. Loans and receivables are non-derivative financial assets with fixed or determinable payments that are not quoted in an active market. These are included in current assets as they all have maturities less than 12 months from year end. The Group determines the classification of its financial asset at initial recognition when the Group becomes party to the contractual provisions of the instrument.
Notes2016
R’billion
Split of balanceTrade and other receivables 8.1 13,4 11,6 Current tax assets 0,2 0,2
13,6 11,8
8.1 Trade and other receivablesSummary of balanceTrade receivables 10,9 9,0 Allowance account for losses (0,2) (0,2)
Net trade receivables 10,7 8,8 Indirect taxes 0,9 0,8 Prepayments 0,4 0,5 Other 1,4 1,5
13,4 11,6
Split of balanceFinancial assets 11,1 9,2 Non-financial assets 2,3 2,4
13,4 11,6
Impairment of trade and other receivablesReconciliation of allowance account for losses
Balance at the beginning and end of the year 0,2 0,2
2017R’billion
Aspen Pharmacare Holdings Limited Annual Financial Statements 2017
47

Notes to the Group Annual Financial Statements continued
for the year ended 30 June 2017
48 Aspen Pharmacare Holdings Limited Annual Financial Statements 2017
8. Receivables and other current assets continuedOther disclosuresAge analysis of trade and other receivables (financial instruments only)
2016
Gross R’billion
Allowance account for
lossesR’billion
Fully performing 9,9 – 6,9 – Past due by 1 to 60 days 0,8 – 1,6 – Past due by 61 to 90 days 0,2 – 0,2 – Past due by 91 to 120 days 0,1 – 0,3 – Past due by more than 120 days 0,3 (0,2) 0,4 (0,2)
11,3 (0,2) 9,4 (0,2)
Credit riskThe Group has policies in place to ensure that sales of products are made to customers with a solid credit history. Ongoing credit evaluations on the financial condition of customers are performed and where appropriate credit guarantee insurance cover is purchased. Balances to the value of R2,0 billion (2016: R1,6 billion) were covered by credit guarantee insurance. Trade receivables consist primarily of a large, widespread customer base. The granting of credit is controlled by application and account limits. Trade and other receivables are carefully monitored for impairment. One debtors balance (2016: one debtors balance) constitutes a significant concentration of credit risk to an amount of R1,5 billion (2016: R1,6 billion). This balance constitutes 13,5% (2016: 17,3%) of the total gross trade receivables, relates to a customer with a longstanding relationship with the Group and there have been no defaults on payments. There are no other single customers representing more than 10% of total gross trade receivables for the years ended 30 June 2017 and 2016.
The Group has made allowance for specific trade debtors which have clearly indicated financial difficulty and the likelihood of repayment has become impaired. Amounts past their due dates which are not provided for are considered to be recoverable. More than 95% of the trade receivables balance relates to customers that have a longstanding history with the Group and there has been no default on payments.
Impairment losses are recorded in the allowance account for losses until the Group is satisfied that no recovery of the amount owing is possible, at which point the amount is considered irrecoverable and is written off against the financial asset.
2016R’billion
Currency analysis of trade and other receivables (financial instruments only)Australian Dollar 0,7 0,8 Brazilian Real 0,3 0,2 Canadian Dollar – 0,2 Euro 1,8 2,4 Mexican Peso 0,3 0,3 Pound Sterling 0,6 0,3 South African Rand 2,5 2,3 Russian Ruble 0,3 0,3 US Dollar 3,4 1,4 Other currencies 1,2 1,0
11,1 9,2
GeneralThe Group holds no collateral over any trade and other receivables.
Trade and other receivables are predominantly non-interest bearing.
2017
GrossR’billion
Allowance account for
lossesR’billion
2017R’billion

Aspen Pharmacare Holdings Limited Annual Financial Statements 2017
49
9. Cash and cash equivalentsAccounting policy
Recognition and measurementCash and cash equivalents are initially measured at fair value and subsequently carried at amortised cost. For the purposes of the statement of financial position, cash and cash equivalents comprise bank balances and short-term bank deposits. For the purposes of the statement of cash flows, cash and cash equivalents comprise bank balances, short-term bank deposits less bank overdrafts. Bank overdrafts are shown within borrowings in current liabilities on the statement of financial position. Bank overdrafts are repayable on demand.
Financial assetsCash and cash equivalents are classified as “Loans and receivables” in terms of IAS 39 – Financial Instruments: Recognition and Measurement. Loans and receivables are non-derivative financial assets with fixed or determinable payments that are not quoted in an active market. These are included in current assets as they all have maturities less than 12 months from year end. The Group determines the classification of its financial assets at initial recognition when the Group becomes party to the contractual provisions of the instrument.
2016R’billion
Summary of balanceBank balances 10,2 7,9 Short-term bank deposits 0,5 3,0
10,7 10,9
Other disclosuresCredit riskTreasury counterparties consist of a diversified group of prime financial institutions. Cash balances are placed with different financial institutions to minimise risk. The Group does not expect any treasury counterparties to fail to meet their obligations, given their high credit ratings. As at 30 June 2017, more than 94% of the Group’s cash and cash equivalents were held with institutions with an international credit rating of BB+ or better.
Currency analysis of cash and cash equivalentsAustralian Dollar 1,2 1,3 Euro 3,2 2,2 South African Rand 4,0 3,1 US Dollar 1,2 3,5 Other currencies 1,1 0,8
10,7 10,9
GeneralThe maturity profile of all cash and cash equivalents balances is less than three months.
The average effective interest rate on interest-bearing cash and cash equivalents is 3,2% (2016: 2,9%).
2017R’billion
Aspen Pharmacare Holdings Limited Annual Financial Statements 2017
49

Notes to the Group Annual Financial Statements continued
for the year ended 30 June 2017
50 Aspen Pharmacare Holdings Limited Annual Financial Statements 2017
10. Assets classified as held-for-saleAccounting policy
Recognition and measurementAssets (or disposal groups) are classified as held-for-sale if the carrying amount will be recovered principally through sale rather than through continuing use. This condition is regarded as met only when the sale is highly probable, the assets (or disposal groups) are available for immediate sale in its present condition and management is committed to the sale which should be expected to qualify for recognition as a completed sale within one year from the date of the classification.
Immediately prior to being classified as held-for-sale the carrying amount of assets and liabilities are measured in accordance with the applicable standard. After classification as held-for-sale it is measured at the lower of the carrying value and fair value less costs to sell. An impairment loss is recognised in the statement of comprehensive income for any initial and subsequent write down of the asset and disposal group to fair value less costs to sell. A gain for any subsequent increase in fair value less costs to sell is recognised in the statement of comprehensive income to the extent that it is not in excess of the cumulative impairment loss previously recognised.
2016R’billion
Reconciliation of balanceBalance at the beginning of the year 0,1 2,9 Disposals (0,1) (3,6)Reclassification from assets 0,2 0,4
Property, plant and equipment 0,2 – Inventories – 0,3 Trade and other receivables – 0,1
Currency translation movements – 0,4
0,2 0,1
Split of balanceProperty, plant and equipment – Steriles manufacture facility South Africa* 0,2 – Divestment of a portfolio of products in South Africa to Litha – 0,1
0,2 0,1
* In the current year certain property, plant and equipment was impaired in the Steriles manufacturing facility in South Africa due to the strategic repurposing of that facility for alternative product manufacture which requires different manufacturing equipment. The impaired property, plant and equipment has been valued at an estimated net realisable value and reclassified to assets held-for-sale.
No gains or losses on remeasurement were recognised in the statement of comprehensive income in the current financial year.
2017R’billion

Aspen Pharmacare Holdings Limited Annual Financial Statements 2017
51
11. Share capital (net of treasury shares)Accounting policy
Share capitalIssued share capital is stated in the statement of changes in equity at the amount of the proceeds received less directly attributable issue costs.
Treasury sharesShares in the Company held by Group subsidiaries and unvested restricted shares held for employee participants in the Group’s share plan are classified as treasury shares. The cost price of these shares, together with related transaction costs, is deducted from equity. The issued and weighted average number of shares is reduced by the treasury shares for the purposes of the basic, headline earnings and normalised headline earnings per share calculations. Dividends received on treasury shares are eliminated on consolidation except to the extent that they are paid to participants in the share plan.
When treasury shares held for participants in the share plan vest in such participants, the shares will no longer be classified as treasury shares, their cost will no longer be deducted from equity and their number will be taken into account for the purposes of basic, headline earnings and normalised headline earnings per share calculations.
Split of balance
Notes2016
R’billion
Share capital 11.1 2,1 2,1 Treasury shares 11.2 (0,2) (0,2)
1,9 1,9
11.1 Share capitalAuthorised717 600 000 (2016: 717 600 000) ordinary shares of no par value – – Issued456 435 185 (2016: 456 351 337) ordinary shares of no par value 2,1 2,1
Reconciliation of shares
Million Million
Shares in issue at the beginning of the year 456,4 456,3Shares issued – share schemes – 0,1
Shares in issue at the end of the year 456,4 456,4
The unissued shares have been placed under the control of the directors until the forthcoming annual general meeting.
All shares are fully paid up, and no amounts are outstanding in terms of shares issued during the year.
11.2 Treasury shares
2016R’billion
Treasury shares held410 239 (2016: 499 746) ordinary shares of no par value (0,2) (0,2)
Reconciliation of shares
Million
Number of shares at the beginning of the year 0,5 0,3 Shares purchased – 0,3 Deferred incentive bonus shares exercised (0,1) (0,1)
Number of shares at the end of the year 0,4 0,5
2017R’billion
Million
2017R’billion
Million
Aspen Pharmacare Holdings Limited Annual Financial Statements 2017
51

for the year ended 30 June 2017
52 Aspen Pharmacare Holdings Limited Annual Financial Statements 2017
Notes to the Group Annual Financial Statements
12. Share-based compensation reserveAccounting policy
The Group has equity-settled and cash-settled share-based compensation plans.
Share options, share appreciation rights, deferred incentive bonuses and phantom shares are granted to management and key employees. The schemes in operation are classified as equity-settled share-based compensation plans, except for the South African Management Deferred Incentive Bonus Scheme which is a compound financial instrument with both an equity and cash-settled portion as well as the Aspen International Phantom Share Scheme, which is a cash-settled scheme, under which the entity receives services from employees in exchange for cash based on changes in the Aspen share price.
When instruments are exercised, the proceeds received net of any directly attributable transaction costs are credited to share capital.
The Aspen share incentive trusts regulate the operation of the share incentive schemes and are consolidated into the Annual Financial Statements.
Equity-settled schemes The equity-settled schemes (Aspen Share Incentive Scheme, Aspen Share Appreciation Plan and South African Management Deferred Incentive Bonus Scheme) allow certain employees the option or rights to acquire ordinary shares in Aspen Pharmacare Holdings Limited. Such equity-settled share-based payments are measured at fair value at the date of the grant. The fair value determined at grant date of the equity-settled share-based payment is charged as employee costs, with a corresponding increase in equity, on a straight-line basis over the period that the employee becomes unconditionally entitled to the options, rights or shares, based on management’s estimate of the shares that will vest and adjusted for the effect of non-market vesting conditions. These share options, rights and equity portion of the deferred incentive bonus are not subsequently revalued.
Fair value is determined using the binomial pricing model where applicable. The expected life used in the models has been adjusted, based on management’s best estimate, for the effect of non-transferability, exercise restrictions and behavioural considerations such as volatility, dividend yield and the vesting period. The fair value takes into account the terms and conditions on which the incentives are granted and the extent to which the employees have rendered services to the reporting date.
Cash-settled schemes For cash-settled share awards, the services received from employees are measured at fair value and recognised in the statement of comprehensive income as an expense over the vesting period with recognition of a corresponding liability in trade and other payables. The fair value of the liability is remeasured at each reporting date and at the date of settlement, with changes in fair value recognised in the statement of comprehensive income.
Compound financial instrument share schemeThe Group has entered into a share-based payment agreement whereby the employee has the right to choose either settlement in cash or settlement in equity. The entity has thus granted a compound financial instrument, which includes a debt component and an equity component.
On measurement date management has measured the fair value of the debt component first. Thereafter, the fair value of the equity instrument was measured, taking into consideration the fact that the employee forfeits the right to receive cash in order to obtain the shares.
The services received from the employees in respect of each component (debt and equity) shall be accounted for separately at each reporting date. The debt component will be accounted for as a cash-settled share-based payment arrangement. The debt component shall therefore be measured at fair value at each reporting date, with changes in fair value recognised in the statement of comprehensive income over the period that the employee provides services to the Group.
Summary of schemesThe Group currently operates the following share-based payment schemes:
Legacy share schemesThe following share scheme was still operational during the year, in terms of awards previously made.
Aspen Share Appreciation PlanThe plan was adopted by shareholders in October 2005, and the last awards were made in 2013. In terms of the plan, share appreciation rights were awarded to key management to receive shares in the Company equivalent to an amount calculated by reference to the increase in value of the rights between the date of the grant and the date of exercise of the rights. Rights vested on the third anniversary of the award date and expired on the fifth anniversary of that date. Upon exercise, the appropriate number of shares would be listed and awarded to the participant. A single employee held share appreciation rights and has recently exercised these rights. This scheme has therefore terminated.

Aspen Pharmacare Holdings Limited Annual Financial Statements 2017
53
12. Share-based compensation reserve continuedSummary of schemes continuedThe Aspen South African Management Deferred Incentive Bonus Scheme
Nature and purpose of the scheme
Determination of value of awards Vesting
Medium-term component of the scheme
The scheme is designed to acknowledge performance and reward individuals for achievement of both the relevant Aspen business which employs the individual and the individual’s performance for the trading period immediately preceding the date that the award is made. While it has the same performance measures as the annual cash incentive, it introduces a retention element through the three-year deferral to ensure that critical executive and professional skills are retained and that there is congruence between the interests of executive and managerial employees and shareholders.
Alignment between shareholder and employee interests has been successful as most eligible employees have historically elected to receive the value of the award in Aspen shares (2017: 96%, 2016: 97% and 2015: 99%).
The award value varies according to the level of seniority of the executive or manager and is determined according to the achievement of the same performance targets which apply to the annual cash incentive.
The maximum award does not exceed 33% of the total remuneration cost in any instance, except for executive directors’ awards which are capped at a maximum of 41,25% of their total remuneration cost.
To encourage the holding of shares within the company, an enhancement of 10% is given to employees who elect to receive the award in shares.
Awards are deferred for three years, and eligible employees are given the choice at the date of the award to receive the deferred bonus in cash or Aspen shares.
To the extent that an employee elects to receive shares pursuant to the award, share awards are acquired and held by the Aspen Share Incentive Trust (in respect of awards made up until 2015) and an unrelated intermediary (in respect of awards made from 2016 onwards ) to enable Aspen to settle its future obligation to participating employees upon vesting. No shares are issued in terms of this scheme and it has no dilutive effect.
Should the employee retire within the three-year period, the vesting of the awards will be accelerated to the date of retirement.
Employees who resign or who are dismissed for any reason other than retirement, retrenchment or medical incapacity forfeit unvested awards.
Long-term component of the scheme
The Aspen South African Management Deferred Incentive Bonus Scheme is aimed at the retention of a limited number of key senior executives.
The value of the awards granted to employees in terms of this component of the scheme is on an ad hoc basis and at the discretion of the R&N Co.
These awards vest after a period of 10 years and may only be settled in shares.
Awards made in terms of this component of the scheme will not be accelerated in the event that a recipient retires within the 10-year period and before the age of 65, unless the express approval of the R&N Co has been obtained for such acceleration.

Notes to the Group Annual Financial Statements continued
for the year ended 30 June 2017
54 Aspen Pharmacare Holdings Limited Annual Financial Statements 2017
12. Share-based compensation reserve continuedSummary of schemes continuedThe Aspen International Phantom Share Scheme
Nature and purpose of the scheme
Determination of value of awards Vesting
Medium-term component of the scheme
In order to incentivise the management of Aspen’s non-South African businesses in the medium term, a phantom share scheme exists for selected employees.
The scheme has been designed to incentivise managers for the medium term, align their goals with those of the Aspen Group and to match their reward to movements in the Aspen share price.
Due to regulatory restrictions in respect of transfer and ownership of Aspen shares to offshore employees, the scheme is operated on a phantom basis, which is designed to give an employee the same economic benefit as ownership of shares.
Awards are linked to performance of the employee, the business and growth in the Aspen share price.
The value of awards that can be awarded annually in terms of this component of the scheme is capped, with this cap varying according to the level of seniority of the executive or manager and territory of employment.
The phantom shares entitle eligible employees to receive a cash amount which is linked to the Aspen share price.
Awards vest after a period of three years and are paid out in cash to the employee by the Aspen business employing him or her.
Should the employee retire within the three-year period, the medium-term incentive will be accelerated to the date of retirement.
Employees who resign or who are dismissed for any reason other than retirement, retrenchment or medical incapacity forfeit unvested awards.
Long-term component of the scheme
The Aspen International Phantom Share Scheme is aimed at ensuring the retention of a limited number of key offshore senior executives.
The value of the awards granted to employees in terms of this component of the scheme is on an ad hoc basis and are determined at the discretion of the R&N Co.
These awards vest after a period of 10 years and are settled in cash. Awards made in terms of this component of the scheme will not be accelerated in the event that a recipient retires within the 10-year period and before the age of 65, unless the express approval of the R&N Co has been obtained for such acceleration.

Aspen Pharmacare Holdings Limited Annual Financial Statements 2017
55
12. Share-based compensation reserve continuedReconciliation of schemesAspen South African Management Deferred Incentive Bonus Scheme
Award price
(R) Expiry date
Shares outstanding on 30 June
2016‘000#
Awardedduring
the year‘000
Released during the
year‘000
Lapsed/cancelled
during the year‘000*
Shares outstanding on 30 June
2017‘000#
Fair value at award
dateR
Share price at award
dateR
264,13 Oct 2016 88 – 88 – – 224,50 262,50 338,44 Oct 2017 72 – 2 5 65 290,90 336,50 300,62 Oct 2018 114 – 2 8 104 365,00 286,51 326,70 May 2026 214 – – – 214 365,00 317,50 305,86 Oct 2019 – 105 1 – 104 373,26 310,00
488 105^ 93 13 487
The fair value was determined by reference to the share price on the award date.# The total number of shares were not vested at 30 June 2017 and 30 June 2016.* Lapsed or cancelled shares, held by the Aspen Share Incentive Scheme Trust, are re-allocated to future grants.^ During the year the Group bought 105 927 shares (2016: 331 348 shares) that will be held in the respective Aspen Group employee company until
vesting date. These shares are accounted for as treasury shares in the Group Annual Financial Statements.
Aspen International Phantom Share Scheme
Award price
(R) Expiry date
Phantomshares
outstanding on 30 June 2016
‘000#
Awarded during
the year‘000
Exercisedduring
the year‘000
Lapsed/cancelled
during the year‘000
Phantomshares
outstanding on 30 June
2017‘000#
236,67 Oct 2016 45 – 45 – – 326,84 Oct 2017 65 – 5 – 60 299,44 Oct 2018 96 – 4 – 92 326,70 May 2026 48 – – – 48 316,00 Oct 2019 – 95 – – 95
254 95 54 – 295 # The total number of shares were not vested at 30 June 2017 or 30 June 2016.
The fair value was determined by reference to the share price on the grant date. The closing share price on measurement date was R287,10 (2016: R362,28).
The liability included in trade and other payables on the statement of financial position relating to the Aspen International Phantom Share Scheme is R65,7 million (2016: R79,6 million).

Notes to the Group Annual Financial Statements continued
for the year ended 30 June 2017
56 Aspen Pharmacare Holdings Limited Annual Financial Statements 2017
13. BorrowingsAccounting policy
Recognition and measurementBorrowings are recognised initially at fair value, net of transaction costs incurred. Borrowings are subsequently stated at amortised cost using the effective interest rate method, any difference between the proceeds (net of transaction costs) and the redemption value is recognised in the statement of comprehensive income over the period of the borrowings.
Fees paid on the establishment of selected loan facilities are recognised as transaction costs of the loan to the extent that it is probable that some or all of the facility will be drawn down. In this case, the fee is deferred until the draw-down occurs. To the extent there is no evidence that it is probable that some or all of the facility will be drawn down, the fee is capitalised as a prepayment against the loan for liquidity services and amortised over the period of the facility to which it relates.
The Group presents separately current and non-current borrowings on the face of the statement of financial position. A liability is classified as current unless the Group has an unconditional right to defer settlement of the liability for at least 12 months after year end.
General and specific borrowing costs that are directly attributable to the acquisition, construction or production of a qualifying asset are capitalised during the period of time that is required to complete and prepare the asset for its intended use or sale. Qualifying assets are assets that necessarily take a substantial period of time to get ready for their intended use or sale. All other borrowing costs are expensed in the statement of comprehensive income in the period in which they are incurred.
Financial liabilities at amortised costBorrowings are classified as “Liabilities at amortised cost” in terms of IAS 39 – Financial Instruments: Recognition and Measurement. Financial liabilities are recognised on the transaction date when the Group becomes a party to the contract and thus has a contractual obligation and are derecognised when these contractual obligations are discharged, cancelled or expired.
Currency analysis and maturity profile of total borrowings
2017Within 1 year
R’billion
Between 1 – 5 years
R’billionTotal
R’billion
2016
Within 1 year
R’billion
Between 1 – 5 years
R’billionTotal
R’billion
Bank overdraftsRand 3,5 – 3,5 3,0 – 3,0
3,5 – 3,5 3,0 – 3,0
Unsecured loans(1) Euro syndicated term loan 11,6 19,4 31,0 – 23,5 23,5
Euro – other 0,3 – 0,3 0,2 – 0,2 Euro – capital raising fees (0,1) (0,1) (0,2) – (0,3) (0,3)US Dollar – other – – – 2,6 – 2,6
(2) Australian Dollar syndicated revolving loan – 4,0 4,0 – 4,5 4,5
(3) Rand syndicated term loan – 5,6 5,6 – 5,0 5,0 (4) Rand – other 3,6 – 3,6 5,1 – 5,1
15,4 28,9 44,3 7,9 32,7 40,6
Total borrowings 18,9 28,9 47,8 10,9 32,7 43,6

Aspen Pharmacare Holdings Limited Annual Financial Statements 2017
57
13. Borrowings continuedCurrency analysis and maturity profile of total borrowings continued(1) Euro syndicated term loan
The loan comprises
AmountEUR’billion Date obtained Term Interest terms
Facility A1 loan 0,8 June 2016 Two years repayable June 2018
Three-month EURIBOR + margin of 2,0% repayable quarterly
Facility A2 loan 0,3 June 2016 Two years repayable August 2018
Three-month EURIBOR + margin of 2,0% repayable quarterly
Facility B1 loan 0,3 June 2016 Three years repayable June 2019
Three-month EURIBOR + margin of 2,2% repayable quarterly
Facility B2 loan 0,1 June 2016 Three years repayable August 2019
Three-month EURIBOR + margin of 2,2% repayable quarterly
Facility C1 loan 0,4 June 2016 Four years repayable June 2020
Three-month EURIBOR + margin of 2,4% repayable quarterly
Facility C2 loan 0,2 June 2016 Four years repayable June 2020
Three-month EURIBOR + margin of 2,4% repayable quarterly
The repayment profile is set out below:
Facility A1 loan
EUR’billion
Facility A2 loan
EUR’billion
Facility B1 loan
EUR’billion
Facility B2 loan
EUR’billion
Facility C1 loan
EUR’billion
Facility C2 loan
EUR’billionTotal
EUR’billion
Year ending 30 June 2018
0,8 – – – – – 0,8
Year ending 30 June 2019
– 0,3 0,3 – – – 0,6
Year ending 30 June 2020
– – – 0,1 0,4 0,2 0,7
0,8 0,3 0,3 0,1 0,4 0,2 2,1
(2) Australian Dollar syndicated revolving loan
The loan comprises
AmountAUD’billion Date obtained Term Interest terms
Facility G loan 0,4 June 2016 Four years repayable June 2020
Three-month BBSY + margin of 2,0% repayable quarterly
(3) Rand syndicated term loan
The loan comprises
AmountR’billion Date obtained Term Interest terms
Facility D loan Pharmacare
3,0 June 2016 Three years repayable June 2019
Three-month JIBAR + margin of 1,9% repayable quarterly
Revolving facility E loan – Pharmacare
0,6 June 2016 Four years repayable June 2020
Three-month JIBAR + margin of 1,9%
Facility F loan – Pharmacare
1,7 June 2016 Five years repayable June 2021
Three-month JIBAR + margin of 2,2% repayable quarterly
Facility F loan – Aspen Holdings
0,3 June 2016 Five years repayable June 2021
Three-month JIBAR + margin of 2,2% repayable quarterly

Notes to the Group Annual Financial Statements continued
for the year ended 30 June 2017
58 Aspen Pharmacare Holdings Limited Annual Financial Statements 2017
13. Borrowings continuedCurrency analysis and maturity profile of total borrowings continued(3) Rand syndicated term loan continued
The repayment profile is set out below:
Facility D loan – Pharmacare
R’billion
Facility E loan – Pharmacare
R’billion
Facility F loan – Pharmacare
R’billion
Facility F loan – Aspen Holdings
R’billionTotal
R’billion
Year ending 30 June 2019
3,0 – – – 3,0
Year ending 30 June 2020
– 0,6 – – 0,6
Year ending 30 June 2021
– – 1,7 0,3 2,0
3,0 0,6 1,7 0,3 5,6
(4) Rand – other
The loan comprises
AmountR’billion Date obtained Term Interest terms
Various term loans 1,4 Various Ranging between three and six months
SAFEX + margin of 1,4%
Various term loans 1,2 Various Ranging between three and six months
Three-month JIBAR + margins ranging between 1,4%
and 1,5% repayable quarterly
Various overnight loans
0,4 Various On demand Overnight call rates ranging between 8,0% and 8,3%
Various overnight loans
0,6 Various On demand South African prime overdraft rate less rates ranging between
1,0% and 2,7%

Aspen Pharmacare Holdings Limited Annual Financial Statements 2017
59
13. Borrowings continued(4) Rand – other continued
Interest rate profile of total borrowings
2017
TotalR’billion
Interest rate
%
Average effective
interest rate
%
2016
TotalR’billion
Interest rate
%
Average effective
interest rate
%
Bank overdrafts – floating rate (linked to South African prime overdraft rate)
3,5 Rates ranging between prime and
prime less 3,0
7,5 3,0 Rates ranging between prime and
prime less 3,0
6,9
Unsecured loans – floating rate
44,3 40,8
Linked to three-month LIBOR
– – – 2,6 + margins ranging between +1,0 and 1,7
2,1
Linked to three-month BBSY
4,0 + margin of 2,0 3,8 4,5 + margin of 2,0 4,8
Linked to SAFEX 1,4 + margin of 1,4 8,2 1,4 + margins ranging between 1,1 and 1,4
7,6
Linked to three-month JIBAR
6,8 + margins ranging between 1,9 and 2,2
8,5 6,7 + margins ranging between 1,0 and 2,2
8,4
Linked to South African prime overdraft rate
0,6 Less margins ranging between
1,0 and 2,7
7,9 0,5 Less margins ranging between 1,0 and 2,7
7,0
Linked to overnight call rate
0,4 Overnight call rates ranging between
8,0 and 8,3
8,0 1,5 Overnight call rates ranging between
7,7 and 9,0
7,4
Linked to three-month EURIBOR
31,3 + margins ranging between 1,0 and 2,4
2,1 23,7 + margins ranging between 1,0 and 2,4
2,1
Capital raising fees# (0,2) – – (0,3) – –
Total borrowings 47,8 43,6
# Capital raising fees relate to the unsecured loans above but have been shown separately as they are non-interest bearing.
Definitions➜➜ JIBAR – Johannesburg Inter-bank Acceptance Rate➜➜ SAFEX – South African Futures Exchange➜➜ EURIBOR – Euro Inter-bank Offer Rate➜➜ LIBOR – London Inter-bank Offer Rate➜➜ BBSY – Bank Bill Swap Yield
Other disclosuresDefault and breachesThere were no defaults or breaches of the contractual terms of the borrowings during the year.
The Group had the following undrawn borrowing facilities at year end:➜➜ South African facilities of R4,1 billion;➜➜ a Euro denominated facility of EUR0,4 billion; and➜➜ an Australian Dollar denominated facility of AUD45,0 million.
These facilities may only be drawn to the extent that any banking covenants are not likely to be breached for the ensuing 12-month period.
All facilities negotiated are reviewed annually.

Notes to the Group Annual Financial Statements continued
for the year ended 30 June 2017
60 Aspen Pharmacare Holdings Limited Annual Financial Statements 2017
14. Other non-current liabilitiesAccounting policy
Recognition and measurementOther non-current financial liabilitiesOther non-current financial liabilities are recognised initially at fair value and expected future payments are discounted to present value using an appropriate market-related discount rate. The liabilities are subsequently measured at amortised cost using the effective interest rate method. The amount expected to be settled within 12 months from year-end date is shown as current and the amounts expected to be settled 12 months after year-end date is shown as non-current on the statement of financial position.
The difference between the total capital repayments and the present value of the liabilities will be released to financing costs in the statement of comprehensive income over the terms on the liabilities.
Deferred revenueThe Group recognises, as deferred revenue, contributions by third parties to the cost of specific capital expenditure projects as well as the rights for the commercialisation of selected Aspen products to GSK. Deferred revenue is recognised at the fair value of the consideration received in advance. Upon completion of a relevant capital expenditure project the related deferred revenue is released to the statement of comprehensive income over the remaining term of the supply contract with the contributing third party. The commercialisation rights will be released to the statement of comprehensive income over the term of the contract. The amount expected to be realised within 12 months from year-end date is shown as current and the amounts expected to be realised 12 months after year-end date is shown as non-current on the statement of financial position.
Environmental liabilitiesEnvironmental liabilities are recognised when the Group has a legal or a constructive obligation, as a result of a past event, and it is probable that there may be an outflow of resources embodying economic benefits to settle the obligation and the obligation can be measured reliably.
Financial liabilitiesOther non-current financial liabilities are classified as “Liabilities at amortised cost” in terms of IAS 39 – Financial Instruments: Recognition and Measurement. Financial liabilities are recognised on the transaction date when the group becomes a party to the contract and thus has a contractual obligation and are derecognised when these contractual obligations are discharged, cancelled or expired.
Summary of balance
Notes2017
R’billion2016
R’billion
Other non-current financial liabilities 14.1 4,4 2,3 Deferred revenue 14.2 – 0,1 Environmental liabilities 14.3 0,1 0,1
4,5 2,5

Aspen Pharmacare Holdings Limited Annual Financial Statements 2017
61
14. Other non-current liabilities continued14.1 Other non-current financial liabilities
2016R’billion
Reconciliation of balanceBalance at the beginning of the year 2,5 2,1 HPC business – 0,2 AstraZeneca Anaesthetics Portfolio 5,0 – GSK Anaesthetics Portfolio 1,5 – Repayments (0,2) (0,2)Notional interest 0,3 0,2 Currency translation movements (0,3) 0,2
8,8 2,5
Split of balanceNon-current 4,4 2,3 Current 4,4 0,2
8,8 2,5
Split of balance10-year interest-free loan 1,8 1,8 Deferred consideration payable to AstraZeneca 4,7 – Deferred consideration payable to GSK 1,7 – Deferred consideration payable to MSD 0,4 0,6 Deferred consideration payable to McGuff 0,2 0,2
8,8 2,7
10-year interest-free loanAs part of a historical business combination, Aspen acquired inventories to the value of R3,3 billion, a portion of which was funded by way of a 10-year interest-free loan from MSD. The discount rate used in valuing this loan was 8%. This loan was obtained in October 2013 and is repayable at the end of the 10-year period.
Deferred consideration payable to AstraZenecaAs part of the anaesthetics business combination in the current year, Aspen Global concluded a transaction with AstraZeneca in terms of which they paid USD410 million with a further payment of USD110 million due on 1 July 2017. Additionally, AGI will make sales -related payments of up to USD250 million based on sales in the 24 months following completion.
In order for these amounts to not be payable, sales would need to be 15% lower than expected at the time of the acquisition.
After year end USD150 million became payable as sales targets for the first 12 months were reached.
The discount rate used in present valuing the deferred consideration was 3,5%.
The repayment profile is set out below:2016
USD’million
Year ending 30 June 2018 260,0 – Year ending 30 June 2019 100,0 –
360,0 –
Deferred consideration payable to GSKAs part of the anaesthetics business combination in the current year, Aspen Global concluded a transaction with GSK in terms of which they paid GBP180 million with further potential milestone payments of up to GBP100 million based on the gross profitability of the acquired portfolio in the 36 months following completion. Based on the expected performance of the acquired portfolio over the 36 month period, the deferred consideration recognised is 100% of the total possible consideration. Should the gross profit of the acquired portfolio be 10% below that expected, the deferred consideration payable would reduce to GBP77,2.
The discount rate used in present valuing the deferred consideration was 3,5%.
2017R’billion
2017USD’million

Notes to the Group Annual Financial Statements continued
for the year ended 30 June 2017
62 Aspen Pharmacare Holdings Limited Annual Financial Statements 2017
14. Other non-current liabilities continued14.1 Other non-current financial liabilities continued
The repayment profile is set out below:2016
GBP’million
Year ending 30 June 2018 42,3 – Year ending 30 June 2019 42,3 – Year ending 30 June 2020 15,0 –
99,5 –
Deferred consideration payable to MSDThe total purchase consideration for the MSD business was USD600 million. In total, USD533 million of the consideration was paid on 2 January 2014. In the current year R0,2 billion (2016: R0,2 billion) has been repaid.
The repayment profile is set out below:2016
USD’million
Year ended 30 June 2017 – 13,5 Year ending 30 June 2018 13,5 13,5 Year ending 30 June 2019 13,5 13,5
27,0 40,5
Deferred consideration payable to McGuffAs part of the HPC business combination in the prior year, Aspen Global concluded a transaction with McGuff in terms of which it agreed to pay milestone payments for the HPC business. The amount is partially dependent on future sales performance.
The discount rate used in valuing the deferred consideration was 3%.
The repayment profile is set out below:Year ending 30 June 2018 4,0 4,0 Year ending 30 June 2019 5,0 5,0 Year ending 30 June 2020 3,0 3,0 Year ending 30 June 2022 3,0 3,0 Year ending 30 June 2023 1,0 1,0
16,0 16,0
2017GBP’million
2017USD’million

Aspen Pharmacare Holdings Limited Annual Financial Statements 2017
63
14. Other non-current liabilities continued14.2 Deferred revenue
2016R’billion
Reconciliation of balanceBalance at the beginning of the year 0,5 0,4 Recognised in the statement of comprehensive income (0,1) –Currency translation movements (0,1) 0,1
0,3 0,5
Split of balanceNon-current – 0,1 Current 0,3 0,4
0,3 0,5
Split of balanceCapital expenditure projects 0,3 0,4 Rights for the commercialisation of selected Aspen products payable to GSK – 0,1
0,3 0,5
14.3 Environmental liabilitiesReconciliation of balanceBalance at the beginning and end of the year 0,1 0,1
The environmental liabilities relate to the estimated cost of remediating soil contamination at the Boxtel site in the Netherlands. The remediation at Boxtel will be managed and funded by the Group and the amount of EUR5,5 million is based on an estimate by an independent expert.
2017R’billion

Notes to the Group Annual Financial Statements continued
for the year ended 30 June 2017
64 Aspen Pharmacare Holdings Limited Annual Financial Statements 2017
15. Unfavourable and onerous contractsAccounting policy
Recognition and measurementAn unfavourable and onerous contract is recognised when the expected benefits to be derived by the Group from a contract are lower than the unavoidable costs of meeting its obligations under the contract. The Group has entered into binding legal agreements for the supply of products to vendors at below market value and/or cost to manufacture. The estimated costs required to settle the obligation are discounted to present value using appropriate market-related discount rates.
An unfavourable contract is principally based on the difference between the market price and the contract selling price.
Certain supply contracts for the third-party manufacture of products in Aspen Oss and in Aspen NDB have been classified as either unfavourable or onerous. These liabilities will be released to revenue over the term of the contracts in terms of IAS 18 – Revenue.
Reconciliation of balance2016
R’billion
Balance at the beginning of the year 2,6 2,4 Release to the statement of comprehensive income (0,3) (0,4)Currency translation movements (0,4) 0,6
1,9 2,6
Split of balanceNon-current 1,6 2,2 Current 0,3 0,4
1,9 2,6
2017R’billion
Aspen Pharmacare Holdings Limited Annual Financial Statements 2017
65
16. Retirement and other employee benefit obligationsAccounting policy
Pension benefitsThe Group operates or contributes to defined contribution plans and defined benefit plans for its employees in certain countries in which it operates.
Defined contribution plans – pensionA defined contribution plan is a provident fund under which the Group pays fixed contributions into a separate entity (a fund) and will have no legal or constructive obligation to pay further contributions if the fund does not hold sufficient assets to pay all employees relating to employee service in the current and prior financial years. For defined contribution plans, the Group pays contributions to publicly or privately held pension insurance plans on a mandatory, contractual or voluntary basis. Once the contributions have been paid, the Group has no further payment obligations. The payments made to provident funds are expensed as incurred and are included in staff costs. Refer to notes 22 and 18 of the Group Annual Financial Statements.
Defined benefit plans – pensionA defined benefit plan is a pension plan that is not a defined contribution plan. It defines the amount of pension benefits that an employee will receive on retirement, usually dependent on one or more factors such as age, years of service and compensation.
The Group’s net obligation in respect of defined benefit pension plans is actuarially calculated separately for each plan by deducting the fair value of plan assets from the present value of the gross obligation for retirement benefit obligations. The gross obligation is determined by estimating the future benefit attributable to employees in return for services rendered to date.
This future benefit is discounted to determine its present value, using discount rates based on government bonds, that have maturity dates approximating the terms of the Group’s obligations and which are denominated in the currency in which the benefits are expected to be paid. Independent actuaries perform the calculation annually using the projected unit credit method.
Past service costs are recognised immediately in the statement of comprehensive income.
Actuarial gains and losses arising from experience adjustments and changes to actuarial assumptions are recognised in other comprehensive income as remeasurements in the period in which they arise.
Other non-current employee benefitsSome Group companies provide other non-current benefits to their employees. The entitlement to these benefits is usually conditional on the employee remaining in service up to a given age or the completion of a minimum service period. The expected costs of these benefits are accrued over the period of employment using the same accounting methodology as used for defined benefit pension plans. Actuarial gains and losses arising from experience adjustments and changes in actuarial assumptions are charged or credited to equity in other comprehensive income in the period in which they arise. These obligations are valued annually by independent qualified actuaries.
Defined benefit plans – post-retirement medical aid obligationsIn terms of Group policy, post-retirement medical aid benefits are not provided for any employees, with the exception of certain South African employees who joined the Group before 28 February 2000. The Group has honoured its contractual commitment in respect of post-retirement medical aid obligations to these employees and pensioners employed before the change in policy.
The present value of the expected future post-retirement medical aid obligation is quantified to the extent that service has been rendered, and is reflected on the statement of financial position as a liability. Valuations of these obligations are carried out by independent actuaries on an annual basis using the projected unit credit method. Post-retirement medical aid obligations are accounted for using the same accounting methodologies as described for the defined benefit plans – pension.

Notes to the Group Annual Financial Statements continued
for the year ended 30 June 2017
66 Aspen Pharmacare Holdings Limited Annual Financial Statements 2017
16. Retirement and other employee benefit obligations continuedThe Group operates or contributes to defined contribution plans, defined benefit plans and other long-term plans in certain countries in which it operates.
Defined contribution plansContributions by the Group and in some cases the employees are made to funds set up in South Africa, Australia, Malaysia, Taiwan, Ireland, the Netherlands, Brazil, Tanzania, Kenya and Uganda while no contributions are made to plans established in other geographic areas.
Total contributions paid to the various funds by the Group amounted to R0,4 billion for the current financial year (2016: R0,3 billion). The Group has no further payment obligations once the contributions have been paid. The payments made are expensed as incurred in the statement of comprehensive income and are included in staff costs.
Defined benefit plansContributions by the Group and in some cases by the employees are made for funds set up in South Africa, Germany, the Philippines, Mexico, France, Tanzania and Kenya while no contributions are made for plans established in other geographic areas.
Provisions for pension and medical aid obligations are established for benefits payable in the form of retirement, disability, surviving dependent pensions and medical benefits. The benefits offered vary according to the legal, fiscal and economic conditions of each country.
Long-term employee benefitsContributions by the Group are made to funds set up in Germany and France while no contributions are made to plans established in other geographic areas.
Principal actuarial assumptionsLast
actuarialvaluation
done
Full/interim
valuation
Valuation method adopted Discount rate
Medicalinflation rate
Salary increase
rate
France June 2017 Full Projected unit credit 2,0% (2016: 1,4%) N/A 2,0% (2016: 2,0%)
Germany June 2017 Full Projected unit credit 1,8% (2016: 1,8%) N/A 2,5% (2016: 3,0%)Kenya June 2017 Full Projected unit credit 12,5% (2016: 14,3%) N/A 12,0% (2016: 12,0%)Mexico June 2017 Full Projected unit credit 7,4% (2016: 6,6%) N/A 5,0% (2016: 5,0%)The Philippines June 2017 Full Projected unit credit 5,3% (2016: 4,8%) N/A 6,0% (2016: 7,0%)South Africa June 2017 Full Projected unit credit 9,8% (2016: 9,9%) 8,5% (2016: 8,8%) N/ATanzania June 2017 Full Projected unit credit 18,9% (2016: 18,9%) N/A 9,0% (2016: 9,0%)
These plans have been assessed by independent qualified actuaries and have been found to be in a sound financial position.
Weighted average assumptions used in performing actuarial valuations determined in consultation with independent actuaries.
Assumptions regarding future mortality experience are set out based on advice, published statistics and experience in each territory.

Aspen Pharmacare Holdings Limited Annual Financial Statements 2017
67
16. Retirement and other employee benefit obligations continued2016
R’billion
Amounts recognised in the statement of financial positionPresent value of retirement and other employee benefit obligations 0,6* 0,7* Deferred tax (0,1) (0,1)
0,5 0,6
* Included in this amount is an obligation of R0,2 billion (2016: R0,2 billion) for which the Group has a reimbursive right. Refer to note 6.1 for more detail.
Retirement and other employee benefit obligations compriseUnfunded present value of retirement and other employee benefit obligations 0,7 0,8 Fair value of plan assets (0,1) (0,1)
0,6 0,7
The movement in the liability recognised in the statement of financial position is as follows:At the beginning of the year 0,8 0,4 Current service costs (included in staff costs – cost of sales) – 0,1 Remeasurements recognised in other comprehensive income – actuarial losses from changes in financial assumptions – 0,1 Currency translation movements (0,1) 0,2
0,7 0,8
Fair value of plan assetsThe fair value of plan assets of R0,1 billion (2016: R0,1 billion) are invested in European government bonds.
The pension fund assets are measured at fair value at valuation date. The fair value of cash and other assets has been determined by performing market valuations and other valuation techniques at the end of each reporting period.
Sensitivity analysisThe effect of a 1% change in the assumed discount rate, medical inflation rate and salary increase rate would not have a significant effect on the amounts reported for retirement and other employee benefit obligations.
Five-year summary
At 30 June 2017
R’billion2016
R’billion 2015
R’billion 2014
R’billion 2013
R’billion
Present value of retirement and other employee benefit obligations 0,7 0,8 0,5 0,6 0,2Fair value of plan assets (0,1) (0,1) (0,1) (0,1) (0,1)
Deficit 0,6 0,7 0,4 0,5 0,1
Key risks associated with retirement and other employee benefit obligations(1) Inflation risk: the risk that future inflation is higher than expected.(2) Medical inflation risk: the risk that future contributions to the medical aid scheme increase faster than assumed.(3) Longevity: the risk that continuation members live longer than expected and hence the subsidy is payable for longer than
expected.(4) Investment risk: the risk that the return earned by the assets is lower than expected and hence the assets are insufficient.(5) Salary risk: the risk that future salaries are higher than expected.
2017R’billion

Notes to the Group Annual Financial Statements continued
for the year ended 30 June 2017
68 Aspen Pharmacare Holdings Limited Annual Financial Statements 2017
17. Trade and other payablesAccounting policy
Recognition and measurementTrade and other payables are recognised when the Group has a legal or a constructive obligation, as a result of a past event, and it is probable that there may be an outflow of resources embodying economic benefits to settle the obligation and the obligation can be measured reliably.
Financial liabilitiesFinancial instruments related to trade and other payables are classified as “Liabilities at amortised cost” in terms of IAS 39 – Financial Instruments: Recognition and Measurement. Financial liabilities are recognised on the transaction date when the Group becomes a party to the contract and thus has a contractual obligation and are derecognised when these contractual obligations are discharged, cancelled or expired.
Summary of balance2016
R’billion
Trade payables 5,2 3,5 Accrued expenses 1,7 1,7 Indirect taxes 0,6 0,3 Leave pay 0,4 0,4 Bonuses 0,2 0,2 HPC business – 0,2 Other 2,2 2,0
10,3 8,3
Split of balanceFinancial liabilities 7,8 6,2 Non-financial liabilities 2,5 2,1
10,3 8,3
Other disclosures2016
R’billion
Currency analysis of trade and other payables (financial instruments only)Australian Dollar 0,7 0,6 Euro 3,0 2,1 Mexican Peso 0,2 0,1 Pound Sterling 0,3 0,2 South African Rand 1,3 1,4 US Dollar 1,7 1,4 Other currencies 0,6 0,4
7,8 6,2
All trade and other payables are predominantly non-interest bearing.
No individual vendor represents more than 10% of the Group’s trade payables.
2017R’billion
2017R’billion

Aspen Pharmacare Holdings Limited Annual Financial Statements 2017
69
18. Other current liabilitiesAccounting policy
Financial liabilities at amortised costThis category of financial liabilities comprises other financial liabilities and deferred payables. These financial liabilities are initially recognised at fair value plus transaction costs, and are subsequently measured at amortised cost using the effective interest rate method.
Notes2017
R’billion2016
R’billion
Split of balanceCurrent tax liabilities 0,6 0,9 Deferred revenue 14.2 0,3 0,4 Other current financial liabilities 14.1 4,4 0,2 Deferred payables 18.1 – –
5,3 1,5
18.1 Deferred payablesReconciliation of balanceBalance at the beginning of the year – 0,4 Repayments – (0,5)Currency translation movements – 0,1
– –
As part the GSK Thrombosis business combination, AGI concluded a transaction with MSD by which they agreed to pay a deferred consideration for Arixtra. The total amount was repaid in the prior year.

Notes to the Group Annual Financial Statements continued
for the year ended 30 June 2017
70 Aspen Pharmacare Holdings Limited Annual Financial Statements 2017
19. RevenueAccounting policy
Recognition and measurementRevenue comprises the fair value of the consideration received or receivable for the sale of goods in the ordinary course of the Group’s activities. Revenue, net of trade discounts, distribution fees paid to independent wholesalers and excluding value added tax, comprises the total invoice value of goods, co-marketing fees and royalties. In the determination of revenue, all intra-group transactions are excluded.
Sales are recorded when significant risks and rewards of ownership of the goods are transferred to the buyer based on the date goods are delivered to customers, the amount of revenue can be measured reliably and it is probable that future economic benefits will flow to the entity. Revenue arising from co-marketing and royalty agreements is recognised on the accrual basis in accordance with the substance of the relevant agreements.
Summary of balance2016
R’billion
Sale of goods 40,8 35,0 Co-marketing fees 0,1 0,2 Unfavourable and onerous contracts release (refer to note 15) 0,3 0,4
41,2 35,6
20. Operating profitOperating profit has been arrived at after creditingProfit on the sale of assets classified as held-for-sale – 1,6 After chargingAuditors’ remuneration 0,1 0,1 Net impairment charges 1,5 1,6
Impairment of intangible assets (included in other operating expenses) 0,4 0,9 Impairment charge – inventories (included in cost of sales) 0,8 0,7 Impairment of property, plant and equipment (included in other operating expenses) 0,3 –
Loss on the sale of subsidiary 0,1 – Loss on the sale of intangible assets 0,1 – Repairs and maintenance expenditure on property, plant and equipment 0,5 0,5 Operating lease rentals – land and buildings 0,1 0,1 Restructuring costs 0,4 0,3 Transaction costs 0,3 0,3 Product litigation costs 0,2 –
2017R’billion

Aspen Pharmacare Holdings Limited Annual Financial Statements 2017
71
21. Expenses by nature
Cost of salesR’billion
Selling and distribution
expensesR’billion
Administrativeexpenses
R’billion
Other operatingexpenses
R’billionTotal
R’billion
2017Cost of material and production-related variances 14,7 – – – 14,7 Personnel costs and other staff-related costs 3,7 2,3 1,5 – 7,5 Depreciation and amortisation 0,5 0,1 0,1 0,6 1,3 Advertising and marketing expenses – 1,2 – – 1,2 Transport and warehousing costs 0,1 1,0 – – 1,1 Impairment charges 0,8 – – 0,7 1,5 Legal and consulting fees 0,4 0,2 0,3 – 0,9 Property costs 0,5 – – – 0,5 Repairs and maintenance expenditure on property, plant and equipment 0,5 – – – 0,5 Transaction costs – – – 0,3 0,3 Restructuring costs – – – 0,4 0,4 Product litigation costs – – – 0,3 0,2 Other 0,1 1,9 0,9 0,4 3,1
21,3 6,7 2,8 2,4 33,2
2016Cost of material and production-related variances 10,4 – – – 10,4 Personnel costs and other staff-related costs 4,0 2,3 1,3 – 7,6 Depreciation and amortisation 0,5 0,1 0,1 0,6 1,3 Advertising and marketing expenses – 1,2 – – 1,2 Transport and warehousing costs 0,1 1,0 – – 1,1 Impairment charges 0,7 – – 0,9 1,6 Legal and consulting fees 0,4 0,2 0,3 – 0,9 Property costs 0,5 – – – 0,5 Repairs and maintenance expenditure on property, plant and equipment 0,5 – – – 0,5 Transaction costs – – – 0,3 0,3 Restructuring costs – – – 0,3 0,3 Other 0,6 1,2 0,9 0,1 2,8
17,7 6,0 2,6 2,2 28,5

Notes to the Group Annual Financial Statements continued
for the year ended 30 June 2017
72 Aspen Pharmacare Holdings Limited Annual Financial Statements 2017
22. Directors and employeesAccounting policy
Directors and prescribed officers’ emolumentsThe directors and prescribed officers’ emoluments represent the emoluments paid to, or receivable by, directors and prescribed officers in their capacity as director, prescribed officer or any other capacity. All amounts in respect of the financial year reported on are presented, including bonuses not accrued for in the Group Annual Financial Statements. This disclosure is provided in terms of the JSE Listings Requirements. A legal opinion obtained by the Company has confirmed that there are no individuals who can be considered as prescribed officers of the Company.
2016R’million
Directors’ emolumentsNon-executive directors – feesRoy Andersen 0,6 0,6 John Buchanan 0,8 0,8 Judy Dlamini – 0,4 Kuseni Dlamini 1,0 0,7 Maureen Manyama 0,6 0,5 Chris Mortimer 0,4 0,3 Babalwa Ngonyama 0,5 0,1 David Redfern 0,3 0,3 Sindi Zilwa 0,7 0,5
Total (A) 4,9 4,2
Executive directorsGus Attridge 13,5 14,1
Remuneration 5,6 5,2 Retirement and medical aid benefits 0,9 0,9 Performance bonus 4,7 5,8 Share-based payment expense 2,3 2,2
Stephen Saad 16,5 17,5 Remuneration 6,8 6,4 Retirement and medical aid benefits 1,1 1,1 Performance bonus 5,7 7,4 Share-based payment expense 2,9 2,6
Total (B) 30,0 31,6
Total emoluments paid by the Company (A+B) 34,9 35,8
2016R’billion
Staff costsWages and salaries 6,1 6,3 Defined contribution plan expenses 0,4 0,3 Defined benefit plan expenses – 0,1 Share-based payment expense – 0,1 Other Company contributions 0,5 0,5
7,0 7,3 Amount included in cost of sales 3,7 4,0
Wages and salaries 3,1 3,5 Benefits 0,6 0,5
Amount included in selling and distribution expenses 2,0 2,1 Wages and salaries 1,8 1,8 Benefits 0,2 0,3
Amount included in administrative expenses 1,3 1,2 Wages and salaries 1,2 1,0 Benefits 0,1 0,2
Total number of employees at year end 10 204 10 513 Full-time employees 9 454 9 184 Part-time employees 750 1 329
2017R’million
2017R’billion

Aspen Pharmacare Holdings Limited Annual Financial Statements 2017
73
23. Investment incomeAccounting policy
Recognition and measurementInvestment income comprises interest received on bank balances and short-term deposits and is recognised as it accrues in the statement of comprehensive income, using the effective interest method.
2016R’billion
Interest on bank balances and short-term deposits 0,3 0,3
24. Financing costsAccounting policy
Recognition and measurementFinancing costs comprise interest paid on borrowings, unwinding of notional interest on discounted liabilities, changes in the fair value of financial assets and liabilities at fair value through profit or loss, foreign exchange gains or losses and any gains or losses on hedging instruments that are recognised in statement of comprehensive income. All borrowing costs are recognised in the statement of comprehensive income using the effective interest method, unless the borrowing costs are directly attributable to the acquisition, construction or production of qualifying assets, in which case the directly attributable borrowing costs are capitalised.
2016R’billion
Interest paid – bank overdraft and borrowings 1,9 1,8 Non-current borrowings 0,2 0,8 Bank overdrafts and current borrowings 1,6 1,0 Other 0,1 –
Capital raising fees released – transactions 0,1 0,3 Notional interest on financial instruments 0,3 0,2 Net foreign exchange losses 0,2 – Foreign exchange gains on acquisitions (0,1) – Net monetary adjustments and currency devaluations relating to hyperinflationary economies – 0,9
2,4 3,2
Financing costs above exclude financing costs of R0,2 billion which have been capitalised during 2017 to capital work-in-progress (2016: R0,2 billion). Refer to note 2 for detail.
2017R’billion
2017R’billion

Notes to the Group Annual Financial Statements continued
for the year ended 30 June 2017
74 Aspen Pharmacare Holdings Limited Annual Financial Statements 2017
25. TaxAccounting policy
The current and deferred tax charge is computed on the basis of reported income before tax for the year under the laws and regulations of the countries in which the respective Group companies are registered, using substantively enacted tax rates in the countries where the Group companies operate and generate taxable income. Tax comprises current tax, deferred tax, capital gains tax and dividend and withholding taxes.
Current taxThe current tax charge is the expected tax payable on taxable income for the year, and any adjustments to tax payable in respect of prior years. Management periodically evaluates positions taken in tax returns with respect to situations in which applicable tax regulation is subject to interpretation. It establishes provisions where appropriate on the basis of amounts expected to be paid to the tax authorities.
Current tax is charged or credited to other comprehensive income or directly to equity if the tax relates to items that are credited or charged, in the same or a different period, to other comprehensive income or directly to equity respectively.
Dividend and withholding taxes
Dividend withholding tax is payable by Aspen Pharmacare Holdings Limited’s shareholders on any dividend that is paid by the Company, at the applicable rate. The amount is not attributable to the Company and is therefore not reflected in taxes paid by the Company. If a withholding tax is payable by any Company in the Group, the withholding tax is recognised as part of the tax charge in the statement of comprehensive income.
Significant judgements and estimates
Recognition of deferred tax assets in respect of assessed lossesDeferred tax assets have been recognised for the carry forward amount of unused tax losses relating to the Group’s operations where, among other things, tax losses can be carried forward indefinitely and there is evidence that it is probable that sufficient taxable profits will be available in the future to utilise all tax losses carried forward. In determining whether a business will have future taxable profits to utilise against assessed losses, management will take into account budgets as well as updated forecasts for future periods. Deferred tax assets are not recognised for carry forward of unused tax losses when it cannot be demonstrated that it is probable that taxable profits will be available against which the deductible temporary difference can be utilised.
Summary of balance2016
R’billion
South African tax 0,1 0,9 Foreign tax 1,1 0,9 Deferred tax (0,1) –
Total tax charge 1,1 1,8
The Group submits its tax returns and advance payments as they fall due and, other than a few returns that only become due for submission in December 2017, all of the 2016 tax returns have been submitted by the relevant Group company.
Disputed income tax matterThe Aspen Group was subject to an international tax and transfer pricing audit by the South African Revenue Service (“SARS”) and Aspen Pharmacare Holdings Limited received a revised assessment in relation to its 2011 fiscal year as a consequence of this audit. Aspen, with the assistance of its legal and tax advisers, entered into discussions with SARS, which has resulted in the assessment being reversed by SARS on 16 October 2017.
2017R’billion

Aspen Pharmacare Holdings Limited Annual Financial Statements 2017
75
25. Tax continuedReconciliation of effective tax rate
2016%
South African current tax rate 28,0 28,0 Increase in rate due to:
Disallowed expenditure 5,6 9,7 Tax losses not recognised 1,4 2,6 Withholding and other taxes 0,5 1,5 Other – 0,4
Decrease in rate due to:Prior year adjustments 0,1 (0,5)Different rates of tax (16,0) (10,2)Exempt income (1,6) (2,2)
Effective tax rate 18,0 29,3
The Group has tax losses which mainly arose in Argentina, Brazil, Canada, Costa Rica and Mexico of R1,1 billion (2016: R0,6 billion) that are available indefinitely for offsetting against future taxable profits of the companies in which the losses arose. Deferred tax assets have not been recognised in respect of these losses as the relevant businesses have been in a break-even or loss-making position and it is not anticipated that this situation will reverse in the foreseeable future.
26. Earnings per shareAccounting policy
Basic earnings per shareBasic earnings per share is calculated by dividing the profit attributable to equity holders of the parent by the weighted average number of ordinary shares in issue during the year, excluding ordinary shares purchased by a subsidiary of Aspen and held as treasury shares.
Weighted average number of shares in issue is calculated as the number of shares in issue at the beginning of the year, increased by shares issued during the year, weighted on a time basis for the period during which they have participated in the profit of the Group. Shares which are held by a subsidiary company as treasury shares have been adjusted on a time basis in determining the weighted average number of shares in issue.
Diluted earnings per shareThe diluted earnings per share is calculated by adjusting the weighted average number of ordinary shares outstanding to assume conversion of all dilutive potential ordinary shares. The Company had two categories of dilutive potential ordinary shares, namely share options and share appreciation rights. A calculation is performed to determine the number of shares that could have been acquired at fair value based on the monetary value of the subscription rights attached to the outstanding share options and appreciation rights. Fair value is calculated as the average share price for the year for share options. The closing price is used for share appreciation rights, as these are classified as contingently issuable shares in terms of IAS 33 – Earnings Per Share. The number of shares calculated as above is compared with the number of shares that would have been issued assuming the exercise of the share options.
The difference is added to the denominator as an issue of ordinary shares for no consideration. No dilutive adjustments have been made to earnings.
Headline earnings per shareThe calculation of headline earnings per share is based on the profit attributable to equity holders of the parent, after excluding all items of a non-trading nature, divided by the weighted average number of ordinary shares in issue during the year. The presentation of headline earnings is not an IFRS requirement, but is required by JSE Listings Requirements and Circular 2 of 2013.
Normalised headline earnings per shareNormalised headline earnings are headline earnings adjusted for specific non-trading items, being transaction costs and other acquisition and disposal-related gains or losses, restructuring costs, settlement of product related litigation costs, net monetary adjustments and currency devaluations relating to hyperinflationary economies and significant once-off tax provision charges or credits arising from the resolution of prior year tax matters.
2017%

Notes to the Group Annual Financial Statements continued
for the year ended 30 June 2017
76 Aspen Pharmacare Holdings Limited Annual Financial Statements 2017
26. Earnings per share continuedReconciliation of earnings
2016R’billion
Profit attributable to equity holders of the parent 5,1 4,3 Impairment of property, plant and equipment 0,2 –Gross amount 0,3 –
Tax effect (0,1) – Impairment of intangible assets 0,4 0,9
Loss on the sale of intangible assets 0,1 –
Profit on sale of assets classified as held-for-sale – (1,2)Loss on the sale of subsidiary 0,1 –
Headline earnings 5,9 4,0 Restructuring costs 0,4 0,3 Transaction costs 0,3 0,6 Foreign exchange gain on acquisitions (0,1) – Product litigation costs 0,2 – Net monetary adjustments and currency devaluations relating to hyperinflationary economies – 0,9
Normalised headline earnings* 6,7 5,8
*All adjustments to profit attributable to equity holders of the parent have been disclosed net of tax.
2016million
SharesWeighted average number of shares in issue 456,4 456,4 Adjustment for share options and share appreciation rights – 0,1
Weighted average number of shares for diluted earnings per share 456,4 456,5
Performance per share
2017cents
2016cents
Basic earnings per share 1 123,4 945,4 Headline earnings per share 1 299,5 889,0 Normalised headline earnings per share 1 463,2 1 263,7 Diluted earnings per share 1 123,4 945,2 Diluted headline earnings per share 1 299,5 888,8 Diluted normalised headline earnings per share 1 463,2 1 263,4
27. Cash dividend and capital distributionAccounting policy
Ordinary dividends are only accounted for in the Annual Financial Statements in the year in which the dividends are approved by the Board of Directors.
A dividend of 287 cents per share was declared after year end (2016: dividend of 248 cents per share).
The dividend of 287 cents per share will be accounted for in the statement of changes in equity for the year ending 30 June 2018, in accordance with IAS 10 – Events after Balance Sheet Date. The dividend of 248,0 cents per share was declared after the year ended 30 June 2016. This dividend has been accounted for in the statement of changes in equity for the year ended 30 June 2017, in accordance with IAS 10 – Events after Balance Sheet Date.
2017R’billion
2017million

Aspen Pharmacare Holdings Limited Annual Financial Statements 2017
77
28. Financial risk management28.1 Introduction
The Group does not trade in financial instruments, but in the ordinary course of business operations, the Group is exposed to a variety of financial risks arising from the use of financial instruments. These risks include:➜➜ market risk (comprising interest rate risk and foreign currency risk);➜➜ liquidity risk;➜➜ credit risk; and➜➜ capital risk.
The Audit & Risk Committee is responsible for the establishment and oversight of the Group’s risk management framework. This framework is formally documented, and stipulates the responsibilities and processes for monitoring and managing the risks to which the Group is exposed.
The Group Treasury Committee monitors treasury relevant risks (i.e. liquidity, foreign exchange, interest rate, covenants, counterparty, etc.) affecting the Group, on a periodic basis, and provides guidance to local management in managing these risks. Local management is empowered, within the relevant approvals frameworks, to make decisions regarding how to manage these risks, as well as taking ownership for the implementation of any related action. The Group Treasury Committee reports to the Audit & Risk Committee.
Risk management and measurement relating to each of these risks is discussed under the headings below. The Group’s objective in using derivative financial instruments for hedging purposes is to reduce the uncertainty over future cash flows arising from foreign currency and interest rate exposures.
28.2 Financial instruments by categoryThe carrying value of financial instruments by category is as follows
Loans and
receivablesR’billion
At fair value through other
comprehensive incomeR’billion
At amortised cost
R’billionTotal
R’billion
June 2017Financial assetsOther non-current receivables 0,4 – – 0,4 Available-for-sale financial assets – 0,1 – 0,1 Trade and other receivables 11,1 – – 11,1 Cash and cash equivalents 10,7 – – 10,7
Total financial assets 22,2 0,1 – 22,3
Financial liabilitiesUnsecured loans – – 44,3 44,3 Bank overdrafts – – 3,5 3,5 Other financial liabilities – – 8,8 8,8 Trade and other payables – – 7,8 7,8
Total financial liabilities – – 64,4 64,4
June 2016Financial assetsAvailable-for-sale financial assets – 0,1 – 0,1 Trade and other receivables 9,2 – – 9,2Cash and cash equivalents 10,9 – – 10,9
Total financial assets 20,1 0,1 – 20,2
Financial liabilitiesUnsecured loans – – 40,6 40,6 Bank overdrafts – – 3,0 3,0Deferred payables – – 2,5 2,5Other financial liabilities – – 2,5 2,5 Trade and other payables – – 6,2 6,2
Total financial liabilities – – 52,3 52,3

Notes to the Group Annual Financial Statements continued
for the year ended 30 June 2017
78 Aspen Pharmacare Holdings Limited Annual Financial Statements 2017
28. Financial risk management continued28.3 Market risk management
Market risk is the risk that the fair value or future cash flows of a financial instrument will fluctuate due to changes in market prices. The market risks that the Group is primarily exposed to include foreign currency risk and interest rate risk. Market risk is managed by identifying and quantifying risks on the basis of current and future expectations and ensuring that all trading occurs within defined parameters. This involves the review and implementation of methodologies to reduce risk exposure. The reporting on the state of the risk and risk practices to executive management is part of this process. The processes set up to measure, monitor and mitigate these market risks are described below. There has been no change to the Group’s exposure to market risk or the manner in which it manages and measures the risk since the previous period.
28.4 Foreign currency risk The Group’s transactions are predominantly entered into in the respective functional currency of the individual operations. However, the Group’s operations utilise various foreign currencies (currencies other than the operations functional currencies) in respect of sales, purchases and borrowings and consequently the Group is exposed to exchange rate fluctuations that have an impact on cash flows. These operations are exposed to foreign currency risk in connection with contracted payments in currencies not in their individual functional currency. The translation of foreign operations to the presentation currency of the Group (translation risk), as well as economic risk, is not taken into account when considering foreign currency risk. The Aspen Board defines the Group’s appetite for economic risk.
Foreign currency risks are managed through the Group’s financing policies and selective use of forward exchange contracts.
Forward exchange contracts are utilised to reduce foreign currency exposure arising from imports and exports. All forward exchange contracts are supported by underlying commitments or transactions which have already occurred.
At 30 June 2017 and 2016 the Group had forward exchange contracts denominated in various currencies in respect of firm commitments and no hedge accounting was applied.
The tables below reflects the fair values of outstanding forward exchange contracts at year end:
Foreign amount
billion
Forward cover value
R’billion
Marked to market value
R’billion
June 2017Imports*Euro –# 0,4 0,4 US Dollar –# 0,1 0,1
0,5 0,5
Exports*Australian Dollar –# (0,3) (0,3)
Pound Sterling –# (0,2) (0,2)
Canadian Dollar (0,1) (0,6) (0,6)
US Dollar (0,1) (1,7) (1,7)
Russian Ruble (0,8) (0,2) (0,2)
Mexican Peso (0,3) (0,2) (0,2)
(3,2) (3,2)
June 2016Imports*Australian Dollar –# 0,4 0,4 Euro –# 0,6 0,6 US Dollar 0,1 1,8 1,8
2,8 2,8
Exports*Pound Sterling –# (0,2) (0,2)Russian Ruble (0,6) (0,1) (0,1)
(0,3) (0,3)
* Includes forward exchange contracts that represent imports and exports being managed on a net basis.# Foreign amounts are less than 0,1 billion.
DefinitionsMarked to market value – foreign notional amount translated at the market forward rate at 30 June.
Forward cover value – foreign notional amount translated at the contracted rate.

Aspen Pharmacare Holdings Limited Annual Financial Statements 2017
79
28. Financial risk management continued28.4 Foreign currency risk continued
The maturity profiles of the forward exchange contracts at year end (including those contracts for which the underlying transactions were recorded but payment not reflected by year end) are summarised as follows
Marked to market value
2016R’billion
2016R’billion
Within 3 months (2,9) 1,7 Between 3 and 6 months – 0,7 Between 6 and 12 months 0,2 0,1
2,7 2,5
Sensitivity analysisThe Group has used a sensitivity analysis technique that measures the estimated change to the statement of comprehensive income of an instantaneous 10% strengthening or weakening in the Rand against all other currencies, from the rate applicable at 30 June, for each class of financial instrument with all other variables remaining constant. This analysis is for illustrative purposes only, as in practice, market rates rarely change in isolation.
The Group is mainly exposed to fluctuations in foreign exchange rates in respect of the Rand, US Dollar, Euro, Brazilian Real, Mexican Peso, Chinese Yuan Renminbi, Polish Zloty, Japanese Yen, Russian Ruble, Pound Sterling and Australian Dollar. The analysis considers the impact of changes in foreign exchange rates on the statement of comprehensive income, excluding currency translation movements resulting from the translation of Group entities that have a functional currency different from the presentation currency, into the Group’s presentation currency (and recognised in the foreign currency translation reserve), which amounted to a direct debit to other comprehensive income of R3,5 billion at 30 June 2017 (2016: credit of R5,2 billion).
The analysis has been performed on the basis of the change occurring at the start of the reporting period and assumes that all other variables, in particular interest rates, remain constant and was performed on the same basis for 2016.
A change in the foreign exchange rates to which the Group is exposed at the reporting date would have increased/(decreased) profit before tax by the amounts shown below.
Change in exchange
rateWeakening in
functional currency
%2017
R’billion2016
R’billion
Denominated:Functional currencyRand:US Dollar 10 (0,2) 0,2 Rand:Euro 10 – 0,1 US Dollar:Euro 10 0,2 0,1 Other exposures 10 0,1 (0,2)
0,1 0,2
A 10% strengthening in the Rand against the above currencies at 30 June would have an equal and opposite effect on profit before tax, on the basis that all other variables remain constant.
The following significant exchange rates against the Rand applied at year-end:
Spot rate Average rate
2017 2016 2017 2016
Euro 14,945 16,364 14,840 16,115 Australian Dollar 10,053 10,998 10,261 10,607 US Dollar 13,096 14,774 13,612 14,575 Japanese Yen 0,117 0,144 0,125 0,126 Chinese Yuan Renminbi 1,931 2,222 1,999 2,258 Mexican Peso 0,732 0,796 0,700 0,837 Brazilian Real 3,974 4,603 4,198 3,950 Pound Sterling 17,018 19,580 17,271 21,381 Russian Ruble 0,221 0,230 0,224 0,216 Polish Zloty 3,533 3,722 3,440 3,747
2017R’billion

Notes to the Group Annual Financial Statements continued
for the year ended 30 June 2017
80 Aspen Pharmacare Holdings Limited Annual Financial Statements 2017
28. Financial risk management continued
28.5 Interest rate riskExposure to interest rate risk on financial assets and liabilities is monitored on a continuous and proactive basis. The debt of the Group is structured on a combination of floating and fixed interest rates. The benefits of fixing or capping interest rates on the Group’s various financing activities are considered on a case-by-case and project-by-project basis, taking the specific and overall risk profile into consideration.
At the reporting date, the interest rate profile of the Group’s interest-bearing financial instruments was as follows:
Carrying value
2016R’billion
2016R’billion
Variable rate instrumentsOther non-current receivables (0,1) (0,1)Cash and cash equivalents (6,5) (5,8)Borrowings 45,6 23,8
Variable rate exposure 39,0 17,9
Fixed rate instrumentsCash and cash equivalents – (0,4)Borrowings 2,4 15,2
Fixed rate exposure 2,4 14,8
Interest rate swapsThe following pay fixed rate, receive floating rate interest rate derivative contracts (“IRS”) were in place as at 30 June 2017:
Outstanding contract
amountR’billion
Fixedinterest rate
%Expiry
date
Rand syndicated term loan – Facility C loan – Pharmacare 0,8 6,3 (three-month JIBAR) 29 September 2017Rand syndicated term loan – Facility B loan – Aspen Holdings 0,3 6,3 (three-month JIBAR) 29 September 2017Rand syndicated term loan – Facility D loan – Pharmacare 1,0 7,7 (three-month JIBAR) 31 December 2018
Rand syndicated term loan – Facility F loan – Aspen Holdings 0,3 7,8 (three-month JIBAR) 28 June 2017
With respect to the IRS related to the Facility B and C syndicated term loan, the interest rate swaps were designated in a cash flow hedge relationship up to 30 June 2017, on which date the hedged items were refinanced. The nature of the risks that were hedged (interest rate risk) was the variability of the quarterly interest payments on the hedged items, attributable to movements in the three-month JIBAR rate. Gains and losses recognised in the hedging reserve in equity at 30 June 2017 were released to the statement of comprehensive income as interest (finance costs) as the hedged items were no longer in existence. All remeasurements for the remaining term of the swaps will be recognised directly in the statement of comprehensive income.
With respect to the IRS related to the Facility D and F syndicated term loan, the interest rate swaps were designated in a cash flow hedge relationship. The nature of the risks that were hedged (interest rate risk) was the variability of the quarterly interest payments on the hedged items, attributable to movements in the three-month JIBAR rate. Gains and losses recognised in the hedging reserve in equity at 30 June 2017 will be continuously released to the statement of comprehensive income as interest (finance costs) on the loans are recognised in the statement of comprehensive income.
The maturity profile of the gross contract amounts at 30 June 2017 are between one and five years.
2017R’billion
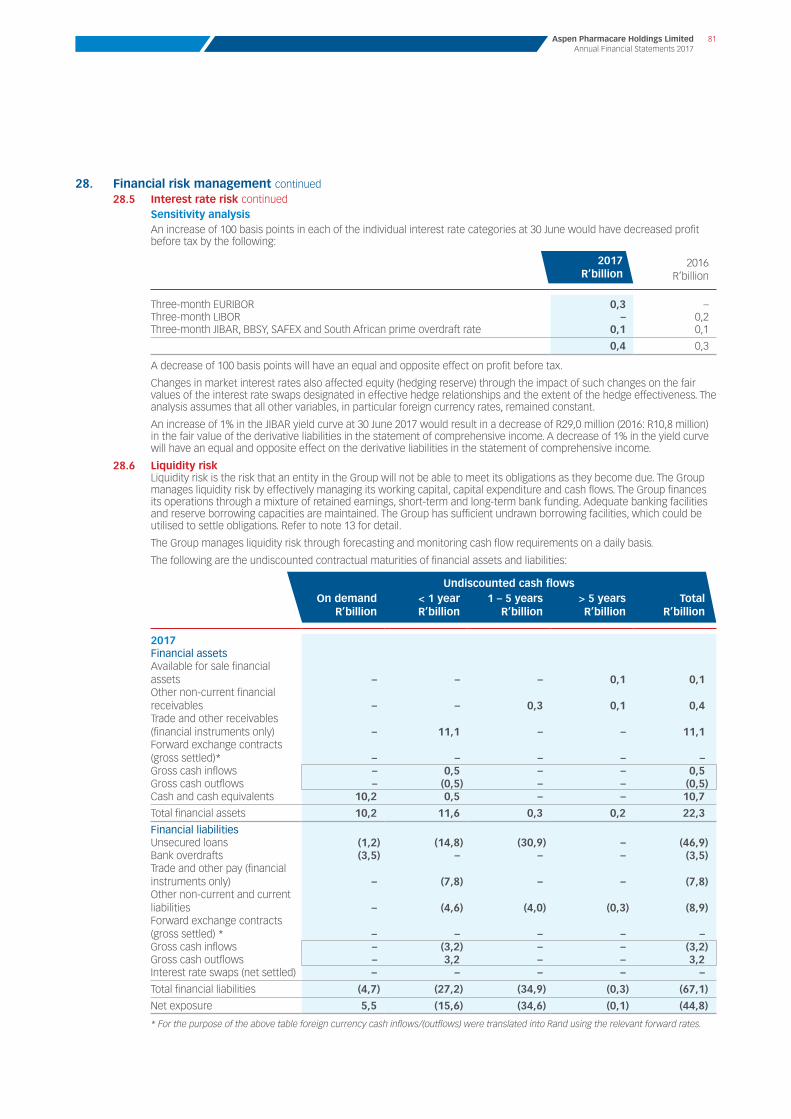
Aspen Pharmacare Holdings Limited Annual Financial Statements 2017
81
28. Financial risk management continued28.5 Interest rate risk continued
Sensitivity analysisAn increase of 100 basis points in each of the individual interest rate categories at 30 June would have decreased profit before tax by the following:
2016R’billion
2016R’billion
Three-month EURIBOR 0,3 –Three-month LIBOR – 0,2Three-month JIBAR, BBSY, SAFEX and South African prime overdraft rate 0,1 0,1
0,4 0,3
A decrease of 100 basis points will have an equal and opposite effect on profit before tax.
Changes in market interest rates also affected equity (hedging reserve) through the impact of such changes on the fair values of the interest rate swaps designated in effective hedge relationships and the extent of the hedge effectiveness. The analysis assumes that all other variables, in particular foreign currency rates, remained constant.
An increase of 1% in the JIBAR yield curve at 30 June 2017 would result in a decrease of R29,0 million (2016: R10,8 million) in the fair value of the derivative liabilities in the statement of comprehensive income. A decrease of 1% in the yield curve will have an equal and opposite effect on the derivative liabilities in the statement of comprehensive income.
28.6 Liquidity riskLiquidity risk is the risk that an entity in the Group will not be able to meet its obligations as they become due. The Group manages liquidity risk by effectively managing its working capital, capital expenditure and cash flows. The Group finances its operations through a mixture of retained earnings, short-term and long-term bank funding. Adequate banking facilities and reserve borrowing capacities are maintained. The Group has sufficient undrawn borrowing facilities, which could be utilised to settle obligations. Refer to note 13 for detail.
The Group manages liquidity risk through forecasting and monitoring cash flow requirements on a daily basis.
The following are the undiscounted contractual maturities of financial assets and liabilities:
2017Financial assetsAvailable for sale financial assets – – – 0,1 0,1 Other non-current financial receivables – – 0,3 0,1 0,4 Trade and other receivables (financial instruments only) – 11,1 – – 11,1 Forward exchange contracts (gross settled)* – – – – –Gross cash inflows – 0,5 – – 0,5 Gross cash outflows – (0,5) – – (0,5)Cash and cash equivalents 10,2 0,5 – – 10,7
Total financial assets 10,2 11,6 0,3 0,2 22,3
Financial liabilitiesUnsecured loans (1,2) (14,8) (30,9) – (46,9)Bank overdrafts (3,5) – – – (3,5)Trade and other pay (financial instruments only) – (7,8) – – (7,8)Other non-current and current liabilities – (4,6) (4,0) (0,3) (8,9)Forward exchange contracts (gross settled) * – – – – –Gross cash inflows – (3,2) – – (3,2)Gross cash outflows – 3,2 – – 3,2 Interest rate swaps (net settled) – – – – –
Total financial liabilities (4,7) (27,2) (34,9) (0,3) (67,1)
Net exposure 5,5 (15,6) (34,6) (0,1) (44,8)
* For the purpose of the above table foreign currency cash inflows/(outflows) were translated into Rand using the relevant forward rates.
2017R’billion
Undiscounted cash flowsOn demand
R’billion< 1 yearR’billion
1 – 5 yearsR’billion
> 5 yearsR’billion
TotalR’billion

Notes to the Group Annual Financial Statements continued
for the year ended 30 June 2017
82 Aspen Pharmacare Holdings Limited Annual Financial Statements 2017
28. Financial risk management continued28.6 Liquidity risk continued
Undiscounted cash flows
On demandR’billion
< 1 yearR’billion
1 – 5 yearsR’billion
> 5 yearsR’billion
TotalR’billion
June 2016Financial assetsAvailable-for-sale financial assets – – – 0,1 0,1 Trade and other receivables (financial instruments only) – 9,2 – – 9,2 Forward exchange contracts (gross settled)* – – – – –
Gross cash inflows – 2,8 – – 2,8 Gross cash outflows – (2,8) – – (2,8)
Cash and cash equivalents 7,9 3,0 – – 10,9
Total financial assets 7,9 12,2 – 0,1 20,2
Financial liabilitiesUnsecured loans (2,2) (7,0) (35,7) – (44,9)Bank overdrafts (3,0) – – – (3,0)Other non-current and current liabilities – (0,2) (0,4) – (0,6)Trade and other payables (financial instruments only) – (6,2) – – (6,2)Forward exchange contracts (gross settled)* – – – – –
Gross cash inflows – (0,3) – – (0,3)Gross cash outflows – 0,3 – – 0,3
Total financial liabilities (5,2) (13,4) (36,1) – (54,7)
Net exposure 2,7 (1,2) (36,1) 0,1 (34,5)
* For the purpose of the above table foreign currency cash inflows/(outflows) were translated into Rand using the relevant forward rates.

Aspen Pharmacare Holdings Limited Annual Financial Statements 2017
83
28. Financial risk management continued28.7 Credit risk
Credit risk, or the risk of financial loss due to counterparties to financial instruments not meeting their contractual obligations, is managed by the application of credit approvals, limits and monitoring procedures. Counterparty credit limits are in place and are reviewed and approved by the respective subsidiary boards.
Credit risk primarily arises from trade and other receivables, other non-current receivables, derivative financial instruments and cash and cash equivalents. The Group’s maximum exposure to credit risk is represented by the carrying amount of these financial assets, with the exception of trade receivables covered by credit guarantee insurance. Refer to the respective notes for more detail on how the Group manages credit risks for these financial assets.
28.8 Capital riskThe Group’s objectives when managing capital are to safeguard the Group’s ability to continue as a going concern in order to provide sustainable returns for shareholders, benefits for other stakeholders and to maintain an optimal capital structure to reduce the cost of capital.
The capital structure of the Group consists of borrowings, other financial liabilities, deferred payables and equity attributable to holders of the parent, comprising share capital, treasury shares, non-distributable reserves and retained income.
The Board’s policy is to maintain a strong capital base so as to maintain investor, creditor and market confidence, and to sustain future development of the business. The Board reviews this capital structure on a semi-annual basis. As part of the review, the Board considers the cost of capital and the risks associated with each class of capital. Based on recommendations by the Board, the Group may seek to adjust the composition of its capital structure depending on circumstances existing at the time of each review.
There were no changes to the Group’s approach to capital management during the year. The gearing ratio has increased since the prior year from 43% to 47%.
In terms of the Group’s funding arrangements with its lenders, the Group was subject to the following financial covenants in the year:➜➜ the capacity to increase debt (net of cash and cash equivalents) is restricted to 3,5 times Group earnings before interest, tax, depreciation, non-recurring items and amortisation. This restriction may be increased to 4,0 times under certain circumstances at the option of the Group; and➜➜ the Group’s net finance charges must be covered by the Group’s earnings before interest, tax, depreciation, non-recurring items and amortisation by at least 3,5 times.
As at 30 June 2017, all the above covenants were complied with.

Notes to the Group Annual Financial Statements continued
for the year ended 30 June 2017
84 Aspen Pharmacare Holdings Limited Annual Financial Statements 2017
29. Related-party transactionsTransactions with shareholdersThe Group did not enter into any transactions with direct beneficial shareholders during the current year, except as described in the Directors’ Report and note 22.
Intra-group transactions and balancesDuring the year, various companies in the Group entered into service, lending, financial guarantee, and transactions relating to buying and selling of goods with one another, on an arm’s length basis. These intra-group transactions have been eliminated on consolidation. Refer to note 25 of the Company Annual Financial Statements for a list of material operating subsidiaries and structured entities. None of the balances are secured.
Transactions and balances with directorsAll directors have given general declarations of interest in terms of section 75 of the Companies Act. These declarations indicate that various members of the Board hold various other directorships in South African entities with whom transactions are conducted by the Group in terms of a customer/supplier relationship. These transactions have been concluded on terms and conditions that are no more favourable than those entered into with third parties in arm’s length transactions, and are all unsecured.
Chris Mortimer, a non-executive director of Aspen, is a full-time practising attorney and managing partner at Chris Mortimer & Associates which provides legal services to the Group. During the year, total legal fees expensed in the statement of comprehensive income was R6,9 million (2016: R4,2 million). There was R1,3 million outstanding at year end (2016: R1,3 million).
Directors and prescribed officers’ remuneration are disclosed in note 22.
Transactions with key management personnelKey management personnel consist of directors of key Group companies.
The key management personnel compensation consists of:2016
R’billion
Short-term employee benefits 132,0 113,3 Post-employment benefits 8,0 7,4 Share-based payment expense 23,3 16,4
Total key management remuneration paid 163,3 137,1
Number of employees included above 25 32
Other than disclosed above, and in the Directors’ Report, no significant related-party transactions were entered into during the year under review.
30. Contingent liabilitiesGuarantees to financial institutionsThe Group has several guarantees for indebtedness of subsidiaries to financial institutions which amount to R55,1 billion (2016: R40,6 billion). The guarantees are entered into on an arm’s length basis. The guarantees relate mainly to the syndicated term loans as well as cross-guarantees provided between Group companies for each other’s indebtedness.
Potential disputed matter – European commissionThe European Commission (“the Commission”) has instituted an investigation of Aspen Pharmacare Holdings Limited and certain of its indirect wholly-owned subsidiaries under Article 102 of the Treaty on the Functioning of the European Union (“Article 102”) in respect of the molecules (i) Chlorambucil; (ii) Melphalan; (iii) Mercaptopurine; (iv) Thioguanine; and (v) Busulfan, for (a) alleged setting of unfair and excessive pricing in the form of significant price increases; (b) alleged unfair/abusive negotiating practices; (c) alleged stock allocation strategies designed to reduce supply; and (d) alleged practices hindering parallel trade in the European Economic Area (excluding Italy).
The Commission has confirmed that at this stage it has “no firm conclusions” on whether Aspen Pharmacare Holdings Limited and/or its indirect wholly owned subsidiaries have undertaken any infringement of Article 102 as it requires to complete its investigation. The Commission’s decision whether to formally open a case is likely only to be made during the first quarter of 2019 after conclusion of its investigation.
The outcome of the Commission matter is unknown and uncertain at this stage and therefore no liability has been raised in the statement of financial position.
Other contingent liabilitiesThe Group has a number of individually insignificant contingent liabilities amounting to R0,1 billion (2016: R0,1 billion).
2017R’billion

for the year ended 30 June 2017
Aspen Pharmacare Holdings Limited Annual Financial Statements 2017
85
Residual accounting policies
General informationAspen Pharmacare Holdings Limited is the holding company of the Group and is domiciled and incorporated in the Republic of South Africa.
The principal accounting policies applied in the preparation of these Annual Financial Statements are set in each of the respective notes. Any accounting policies that are general in nature, and/or are applicable to more than one specific note, have been disclosed below.
Except as otherwise disclosed, these policies are consistent in all material respects with those applied in previous years.
Basis of preparation of financial resultsThe Annual Financial Statements have been prepared in accordance with International Financial Reporting Standards (“IFRS”) as issued by the International Accounting Standards Board (“IASB”) and comply with the SAICA Financial Reporting Guides as issued by the Accounting Practices Committee, financial pronouncements as issued by the Financial Reporting Standards Council (“FRSC”), the JSE Listings Requirements and the requirements of the South African Companies Act, No 71 of 2008. The Annual Financial Statements have been prepared on the historical cost basis, except for certain financial instruments that have been measured at fair value. The results, cash flows and financial position of a subsidiary that operates in a hyperinflationary economy have been expressed in terms of the measuring unit current at the reporting date. The methods used to measure fair value and the adjustments made to account for these subsidiaries are discussed further in the accounting policies and in the respective notes.
The Annual Financial Statements are prepared on the going concern basis. These accounting policies are applied throughout the Group. The preparation of Annual Financial Statements in conformity with IFRS requires the use of estimates and assumptions that affect the reported amounts of assets and liabilities and disclosure of contingent assets and liabilities at the date of the Annual Financial Statements and the reported amounts of revenues and expenses during the reporting period. Although these estimates are based on management’s best knowledge of current events and actions, actual results may ultimately differ from those estimates. The preparation of Annual Financial Statements in conformity with IFRS also requires management to exercise its judgement in the process of applying the Group’s accounting policies. The areas involving a higher degree of judgement or complexity, or areas where assumptions and estimates are significant to the Annual Financial Statements are disclosed in each of the respective notes.
Group accountingThe Annual Financial Statements reflect the financial results of the Group. All financial results are consolidated with similar items on a line-by-line basis. A listing of the Group’s material operating subsidiaries and structured entities are set out in note 25 of the Company Annual Financial Statements.
SubsidiariesThe financial results of subsidiaries (including structured entities, at this stage limited to the share trusts) are fully consolidated from the date on which control is transferred to the Group and are no longer consolidated from the date that control ceases.
Investments in subsidiaries are accounted for at cost less any accumulated impairment losses in the Company Annual Financial Statements. None of the investments in subsidiaries are listed.
When the end date of the reporting period of the parent is different to that of the subsidiary, the subsidiary prepares, for consolidation purposes, additional Annual Financial Statements as of the same date as the Annual Financial Statements of the parent.
Accounting policies of subsidiaries have been changed where necessary to ensure consistency with the policies adopted by the Group.
Inter-company transactions and balancesInter-company transactions, balances and unrealised gains and losses on transactions between Group companies are eliminated on consolidation. To the extent that a loss on a transaction provides evidence of a reduction in the net realisable value of current assets or an impairment loss of a non-current assets, that loss is charged to the statement of comprehensive income.
Residual accounting policies continued
for the year ended 30 June 2017
86 Aspen Pharmacare Holdings Limited Annual Financial Statements 2017
Changes in ownership in subsidiariesTransactions with non-controlling interests that do not result in loss of control are accounted for as equity transactions – that is, as transactions with the owners in their capacity as owners. The difference between fair value of any consideration paid and the relevant share acquired of the carrying value of net assets of the subsidiary is recorded in equity. Gains or losses on disposals to non-controlling interests are also recorded in equity.
Disposal of subsidiariesWhen the Group ceases to have control any retained interest in the entity is remeasured to its fair value at the date when control is lost, with the change in carrying value recognised in the statement of comprehensive income. The fair value is the initial carrying value for the purposes of subsequently accounting for the retained interest as an associate, joint venture or financial asset. In addition, any amounts previously recognised in other comprehensive income in respect of that entity are accounted for as if the Group had directly disposed of the related assets or liabilities. This may mean that amounts previously recognised in other comprehensive income are reclassified to profit or loss.
Business combinations and goodwillThe acquisition method of accounting is used when a business is acquired. A business may comprise an entity, group of entities or an unincorporated operation including its operating assets and associated liabilities.
The cost of an acquisition is measured as the fair value of the assets given up, equity instruments issued, or liabilities incurred or assumed at the date of exchange. Costs attributable to the acquisition are charged to the statement of comprehensive income. Identifiable assets acquired and liabilities and contingent liabilities assumed in a business combination are measured initially at their fair values at the acquisition date, irrespective of the extent of any non-controlling interests. Goodwill is initially measured as the excess of the aggregate of the consideration transferred, the acquisition date fair value of previously held equity interests and the fair value of non-controlling interest over the net identifiable assets acquired and liabilities assumed. If the cost of the acquisition is less than the fair value of the net assets of the subsidiary acquired, the difference is recognised directly in the statement of comprehensive income. Non-controlling interests at acquisition date is determined as the non-controlling shareholders’ proportionate share of the fair value of the net assets of the subsidiary acquired.
Deferred tax liabilities are not recognised if they arise from the initial recognition of goodwill. Deferred tax is not accounted for if it arises from the initial recognition of an asset or liability in a transaction other than a business combination that at the time of the transaction affects neither accounting nor taxable profit or loss.
The profit or loss realised on disposal or termination of an entity is calculated after taking into account the carrying value of any related goodwill.
At the date of the acquisition, acquired deferred tax assets may not be fully recognised under IFRS. Adjustments to the initial recognition of acquired deferred tax assets under IFRS, subsequent to the acquisition date, are recognised in the statement of comprehensive income unless the adjustment qualifies as a measurement period adjustment in which case it is recognised as an adjustment to goodwill.
Contingent consideration in a business combination is included in the cost of a business combination at fair value on the date of acquisition. The classification of the arrangement into debt or equity will dictate the subsequent accounting. If the arrangement is classified as debt the amount will have to be remeasured at each reporting period to fair value with changes being recognised in the statement of comprehensive income. If the arrangement is classified as equity, then remeasurement is not allowed. Existing contingent consideration arrangements are, however, grandfathered under the standard that was in existence at the time of acquisition, being IFRS 3 – Business Combinations.
When the accounting for a business combination can only be determined provisionally at the date of reporting, provisional values are used. These provisional values are adjusted once the initial accounting has been completed, which must be within 12 months from the date of acquisition, by retrospectively adjusting the fair values of the net assets acquired and goodwill.
Foreign currency translationFunctional and presentation currencyItems included in the Annual Financial Statements of each entity in the Group are measured using the functional currency of the primary economic environment in which that entity operates. The Annual Financial Statements are presented in Rand, which is the functional and presentation currency of Aspen Pharmacare Holdings Limited.

Aspen Pharmacare Holdings Limited Annual Financial Statements 2017
87
Foreign currency transactions (except for hyperinflationary economies)Income and expenditure transactions are translated into the functional currency of the entity at the rate of exchange ruling at the transaction date. To the extent that transactions occur regularly throughout the year, they are translated at the average rate of exchange for the year since this is deemed to provide a reasonable approximation of the actual exchange rates prevailing at the dates on which those transactions occurred.
Monetary assets and liabilities denominated in foreign currencies are translated into the functional currency of the entity at the rates of exchange ruling at year end. Foreign exchange gains or losses resulting from the translation and settlement of monetary assets and liabilities are recognised in the statement of comprehensive income, except when deferred in other comprehensive income as qualifying cash flow hedges.
Currency translation differences on non-monetary financial assets and liabilities such as derivative financial instruments are recognised in the statement of comprehensive income as part of the fair value gain or loss.
Foreign operations (except for hyperinflationary economies)The results and financial position of all entities that have a functional currency different from the presentation currency of their parent entity are translated into the presentation currency. The basis for the translation is as follows:➜➜ income and expenditure of foreign operations are translated into the Group’s presentation currency at the average exchange rate for the year, unless this average is not a reasonable approximation of the cumulative effect of the rates prevailing on the transaction dates, in which case income and expenditure transactions are translated at the rates on the dates of the transactions;➜➜ assets and liabilities, including fair value adjustments and goodwill arising on acquisition, are translated at the closing rate at year end; and➜➜ exchange differences arising on translation are recognised as currency translation movements in other comprehensive income and deferred in equity in the foreign currency translation reserve.
On consolidation, currency translation movements arising from translation of results and financial position of entities that have a functional currency different from that of the presentation currency of the parent is recognised in other comprehensive income. On consolidation, differences arising from the translation of the net investment in foreign operations, as well as borrowings and other currency instruments designated as hedges of such investments (if effective), are recognised in other comprehensive income and deferred in equity.
On disposal of part or all of the foreign operation, the proportionate share of the related cumulative gains and losses previously recognised in other comprehensive income and accumulated in the foreign currency translation reserve in equity is reclassified from equity to the statement of comprehensive income (as a reclassification adjustment) when the gain or loss on disposal is recognised.
Hyperinflationary economiesThe results and financial position of a subsidiary of the Group which is accounted for as an entity operating in a hyperinflationary economy and has a functional currency different from the presentation currency of the Group are translated into the presentation currency at rates ruling at the reporting date. As the presentation currency of the Group is that of a non-hyperinflationary economy, comparative amounts have not been adjusted for changes in the price level or exchange rates in the current year.
The financial statements of an entity whose functional currency is the currency of a hyperinflationary economy is adjusted in terms of the measuring unit current at the end of the reporting period.
Items in the statement of financial position not already expressed in terms of the measuring unit current at the reporting period, such as non-monetary items carried at cost or cost less depreciation, are restated by applying a general price index. The restated cost, or cost less depreciation, of each item is determined by applying to its historical cost and accumulated depreciation the change in a general price index from the date of acquisition to the end of the reporting period. The restated amount of a non-monetary item is reduced when it exceeds its recoverable amount.
Corresponding figures for the previous reporting period are restated by applying a general price index and the current closing rate so that financial statements are presented in terms of the measuring unit current at the end of the reporting period. This hyperinflation foreign currency translation adjustment is recognised directly in other comprehensive income as a currency translation movement.
All items recognised in the statement of comprehensive income are restated by applying the change in the general price from the dates when the items of income and expenses were initially recognised. Gains or losses on the net monetary position are recognised in the statement of comprehensive income as a monetary adjustment.

Residual accounting policies continued
for the year ended 30 June 2017
88 Aspen Pharmacare Holdings Limited Annual Financial Statements 2017
Financial instrumentsAccounting for derivative financial instruments and hedging activitiesThe Group’s criteria for a derivative instrument to be designated as a hedging instrument require that:➜➜ the hedge transaction is expected to be highly effective in achieving offsetting changes in fair value or cash flows attributable to the hedged risk;➜➜ the effectiveness of the hedge can be reliably measured throughout the duration of the hedge;➜➜ there is adequate documentation of the hedging relationship at the inception of the hedge; and➜➜ for cash flow hedges, the forecast transaction that is the subject of the hedge must be highly probable.
The Group designates certain derivatives as one of the following on the date the derivative contract is entered into:➜➜ a hedge of the exposure to changes in fair value of a recognised asset or liability or a firm commitment (fair value hedge); ➜➜ a hedge of the exposure to variability in cash flows that is attributable to a particular risk associated with a recognised asset or liability or a highly probable forecast transaction (cash flow hedge); or➜➜ net investment hedge.
At the inception of the transaction the Group documents the relationship between hedging instruments and hedged items, as well as its risk management objective and strategy for undertaking various hedge transactions. The Group also documents its assessment, both at the hedge inception and on an ongoing basis, of whether the derivatives that are used in hedging transactions are highly effective in offsetting changes in fair values or cash flows of hedged items.
Movements in the hedging reserve are accounted for in other comprehensive income. The full fair value of a hedging derivative is classified as a non-current asset or liability when the remaining hedged item is more than 12 months and as a current asset or liability when the remaining maturity of the hedged item is less than 12 months. Trading derivatives are classified as a current asset or liability.
Certain derivative transactions, while providing effective economic hedges under the Group’s risk management policies, do not qualify for hedge accounting. Changes in the fair value of any derivative instruments that do not qualify for hedge accounting are recognised immediately in the statement of comprehensive income within financing costs.
Fair value hedgesChanges in the fair value of derivatives that are designated and qualify as fair value hedges are recorded in the statement of comprehensive income as financing costs, along with any changes in fair value of the hedged asset or liability that is attributable to the hedged risk. If the hedge no longer meets the criteria for hedge accounting, the adjustment to the carrying value of a hedged item for which the effective interest rate method is used is amortised in the statement of comprehensive income over the period to maturity.
Cash flow hedgesThe effective portion of changes in the fair value of derivatives that are designated and qualify as cash flow hedges are recognised in other comprehensive income. The ineffective portion is recognised immediately in the statement of comprehensive income within financing costs. Where the forecast transaction or firm commitment results in the recognition of a non-financial asset or a non-financial liability, the gains or losses previously recognised in other comprehensive income and deferred in equity are reclassified from equity and included in the initial cost or other carrying amount of the asset or liability. Otherwise, amounts recognised in other comprehensive income and deferred in equity are reclassified to the statement of comprehensive income as gains or losses in the same financial years during which the hedged firm commitment or forecast transaction affects the statement of comprehensive income.
When a hedging instrument expires or is sold, or when a hedge no longer meets the criteria for hedge accounting, any cumulative gain or loss recognised in other comprehensive income and deferred in equity at that time remains in equity and is recognised when the forecast transaction is recognised in the statement of comprehensive income. When the forecast transaction is no longer expected to occur, the cumulative gain or loss recognised in other comprehensive income and deferred in equity is reclassified from equity to the statement of comprehensive income as a reclassification adjustment.

Aspen Pharmacare Holdings Limited Annual Financial Statements 2017
89
Net investment hedgeHedges of net investments in foreign operations are accounted for similarly to cash flow hedges.
Any gain or loss on the hedging instrument relating to the effective portion of the hedge is recognised in other comprehensive income. The gain or loss relating to the ineffective portion is recognised in the statement of comprehensive income. Gains and losses recognised in other comprehensive income and accumulated in equity are reclassified to the statement of comprehensive income when the foreign operation is partly disposed of or sold.
Fair value estimationThe fair value of publicly traded derivatives is based on quoted market prices at year end. The fair value of interest rate swaps is calculated as the present value of estimated future cash flows. The fair value of forward exchange contracts is determined using forward exchange market rates at year end.
Financial instruments that are measured at fair value in the statement of financial position are classified into the following levels of the fair value measurement hierarchy:➜➜ quoted prices (unadjusted) in active markets for identical assets or liabilities (level 1);➜➜ inputs other than quoted prices included within level 1 that are observable for the assets or liabilities, either directly, as prices, or indirectly, derived from prices (level 2); and➜➜ inputs for the assets or liabilities that are not based on observable market data, unobservable inputs (level 3).
Quoted market prices or dealer quotes for the specific or similar instruments are used for non-current debt. The fair values of non-current financial assets for disclosure purposes are estimated by discounting the future contractual cash flows at the interest rates available to the Group at year end. Other techniques, such as option pricing models and estimated discounted value of future cash flows, are used to determine fair value of the remaining financial instruments.
In assessing the fair value of non-traded derivatives and other financial instruments, the Group makes assumptions that are based on market conditions existing at each year end.
The carrying values of the following financial assets and financial liabilities approximate their fair values:➜➜ trade and other financial receivables;➜➜ cash and cash equivalents;➜➜ other non-current receivables;➜➜ amounts due to Group companies;➜➜ amounts due by Group companies;➜➜ trade and other financial payables;➜➜ other non-current financial liabilities;➜➜ other current financial liabilities;➜➜ current borrowings; and➜➜ non-current borrowings.
Information on the fair value of financial instruments is included in the respective notes.

Residual accounting policies continued
for the year ended 30 June 2017
90 Aspen Pharmacare Holdings Limited Annual Financial Statements 2017
Comparative figuresComparative figures are reclassified or restated as necessary to afford a proper and more meaningful comparison of results as set out in the affected notes to the Annual Financial Statements.
Reclassifications and presentationThe Annual Financial Statements have been rounded and disclosed in R’billion to assist financial analysis. Certain amounts have been combined and/or reclassified in the Annual Financial Statements due to either their similarity in nature or not being individually material to disclose separately.
All percentage change variances have been calculated using unrounded numbers to record accurate variance trends.
Accounting policies specific to the CompanyAll the accounting policies disclosed in the Group Annual Financial Statements are applicable to the Company Annual Financial Statements. The following additional accounting policies are applicable to the Company Annual Financial Statements:
RevenueThe revenue accounting policy for the Company is consistent with that of the Group with the exception of dividends received from subsidiaries which is included in revenue.
Amounts due by Group companiesAmounts due by Group companies are classified as “Loans and receivables” in terms of IAS 39 – Financial Instruments: Recognition and Measurement. Loans and receivables are non-derivative financial assets with fixed or determinable payments that are not quoted in an active market. These are included in current assets as they all have maturities less than 12 months from year end. The Group determines the classification of its financial asset at initial recognition when the Group becomes party to the contractual provisions of the instrument.
Amounts due to Group companiesAmounts due to Group companies are classified as “Liabilities at amortised cost” in terms of IAS 39 – Financial Instruments: Recognition and Measurement. Financial liabilities are recognised on the transaction date when the group becomes a party to the contract and thus has a contractual obligation and are derecognised when these contractual obligations are discharged, cancelled or expired.
Constant exchange rate report The presentation currency of the Group is Rand.
In addition to that the Group has presented selected line items from the consolidated statement of comprehensive income and certain trading profit metrics on a constant exchange rate basis in a supplementary unaudited annexure. Refer to page 118.

Aspen Pharmacare Holdings Limited Annual Financial Statements 2017
91
New standards, amendments and interpretationsThe following standards, amendments and interpretations were effective for the first time in the year ended 30 June 2017:
Standards, amendments and interpretations Description Effective date Effect on the Group
Amendments to IFRS 10 – Consolidated Financial Statements and IAS 28 – Investments in Associates and Joint Ventures on applying the consolidation exemption
The amendments clarify the application of the consolidation exemption for investment entities and their subsidiaries.
Financial years beginning on or after 1 January 2016.
The Group applied this amendment from the financial year ended 30 June 2017. No material impact on the Group.
Amendment to IFRS 11 – Joint Arrangements on acquisition of an interest in a joint operation
This amendment adds new guidance on how to account for the acquisition of an interest in a joint operation that constitutes a business. The amendments specify the appropriate accounting treatment for such acquisitions.
Financial years beginning on or after 1 January 2016.
The Group applied this amendment from the financial year ended 30 June 2017. No material impact on the Group.
Amendments to IAS 1 – Presentation of Financial Statements disclosure initiative
In December 2014 the IASB issued amendments to clarify guidance in IAS 1 on materiality and aggregation, the presentation of subtotals, the structure of financial statements and the disclosure of accounting policies.
Financial years beginning on or after 1 January 2016.
The Group applied this amendment from the financial year ended 30 June 2017. No material impact to the Group.
Amendment to IAS 16 – Property, Plant and Equipment and IAS 38 – Intangible Assets, on depreciation and amortisation.
In this amendment the IASB has clarified that the use of revenue based methods to calculate the depreciation of an asset is not appropriate because revenue generated by an activity that includes the use of an asset generally reflects factors other than the consumption of the economic benefits embodied in the asset. The IASB has also clarified that revenue is generally presumed to be an inappropriate basis for measuring the consumption of the economic benefits embodied in an intangible asset.
Financial years beginning on or after 1 January 2016.
Not applicable to the Group’s Annual Financial Statements.
IFRS 14 – Regulatory Deferral Accounts
The IASB has issued IFRS 14, an interim standard on the accounting for certain balances that arise from rate-regulated activities.
Rate regulation is a framework where the price that an entity charges to its customers for goods and services is subject to oversight and/or approval by an authorised body.
Financial years beginning on or after 1 January 2016.
Not applicable to the Group’s Annual Financial Statements.
Amendments to IAS 16 – Property, Plant and Equipment and IAS 41 – Agriculture on bearer plants
In this amendment to IAS 16 the IASB has scoped in bearer plants, but not the produce on bearer plants and explained that a bearer plant not yet in the location and condition necessary to bear produce is treated as a self-constructed asset. In this amendment to IAS 41, the IASB has adjusted the definition of a bearer plant include examples of non-bearer plants and remove current examples of bearer plants from IAS 41.
Financial years beginning on or after 1 January 2016.
Not applicable to the Group’s Annual Financial Statements.
Amendments to IAS 27 – Separate Financial Statements on equity accounting
In this amendment the IASB has restored the option to use the equity method to account for investments in subsidiaries, joint ventures and associates in an entity’s separate financial statements.
Financial years beginning on or after 1 January 2016.
The Group applied this amendment from the financial year ended 30 June 2017. No material impact to the Group.

for the year ended 30 June 2017
92 Aspen Pharmacare Holdings Limited Annual Financial Statements 2017
Residual accounting policies continued
New standards, amendments and interpretations continuedThe following accounting standards, amendments and interpretations are not mandatory for the year ended 30 June 2017 and have been published prior to the date of signature of this report:
Standards, amendments and interpretations Description Effective date Effect on the Group
IFRS 9 – Financial Instruments (2009 and 2010)➜➜ Financial liabilities;➜➜ Derecognition of financial instruments;➜➜ Financial assets; and➜➜ General hedge accounting.
This standard replaces the guidance in IAS 39. It includes requirements on the classification and measurement of financial assets and liabilities, it also includes an expected credit losses model that replaces the current incurred loss impairment model.
Financial years beginning on or after 1 January 2018.
The Group will apply this amendment from the financial year ending 30 June 2019. No material impact expected to the Group.
Amendments to IFRS 10 – Consolidated Financial Statements and IAS 28 – Investments in associates and Joint Ventures on sale or contribution of assets
The postponement applies to changes introduced by the IASB in 2014 through narrow-scope amendments to IFRS 10 – Consolidated Financial Statements and IAS 28 – Investments in Associates and Joint Ventures. Those changes affect how an entity should determine any gain or loss it recognises when assets are sold or contributed between the entity and an associate or joint venture in which it invests. The changes do not affect other aspects of how entities account for their investments in associates and joint ventures.
The reason for making the decision to postpone the effective date is that the IASB is planning a broader review that may result in the simplification of accounting for such transactions and of other aspects of accounting for associates and joint ventures.
Financial years beginning on or after 1 January 2017 (postponed).
The Group will apply this amendment when it becomes effective. No material impact expected to the Group.
IFRS 15 – Revenue from Contracts with Customers
The FASB and IASB issued their long awaited converged standard on revenue recognition on 29 May 2014. It is a single, comprehensive revenue recognition model for all contracts with customers to achieve greater consistency in the recognition and presentation of revenue. Revenue is recognised based on the satisfaction of performance obligations, which occurs when control of good or service transfers to a customer.
Financial years beginning on or after 1 January 2018.
The Group will apply this standard from the financial year ending 30 June 2019. No material impact expected to the Group.
Amendment to IFRS 9 – Financial Instruments, on general hedge accounting
The IASB has amended IFRS 9 to align hedge accounting more closely with an entity’s risk management. The revised standard also establishes a more principles-based approach to hedge accounting and addresses inconsistencies and weaknesses in the current model in IAS 39.
Early adoption of the above requirements has specific transitional rules that need to be followed. Entities can elect to apply IFRS 9 for any of the following:➜➜ The own credit risk requirements for financial liabilities;➜➜ Classification and measurement (“C&M”) requirements for financial assets;➜➜ C&M requirements for financial assets and financial liabilities; and➜➜ The full current version of IFRS 9 (that is, C&M requirements for financial assets and financial liabilities and hedge accounting).
The transitional provisions described above are likely to change once the IASB completes all phases of IFRS 9.
Financial years beginning on or after 1 January 2018.
The Group will apply this amendment from the financial year ending 30 June 2019. No material impact expected to the Group.

Aspen Pharmacare Holdings Limited Annual Financial Statements 2017
93
New standards, amendments and interpretations continued
Standards, amendments and interpretations Description Effective date Effect on the Group
Amendment to IAS 12 – Income Taxes
Recognition of deferred tax assets for unrealised losses.
The amendments were issued to clarify the requirements for recognising deferred tax assets on unrealised losses. The amendments clarify the accounting for deferred tax where an asset is measured at fair value and that fair value is below the asset’s tax base. They also clarify certain other aspects of accounting for deferred tax assets.
The amendments clarify the existing guidance under IAS 12. They do not change the underlying principles for the recognition of deferred tax assets.
Financial years beginning on or after 1 January 2017.
The Group will apply this amendment from the financial year ending 30 June 2018. No material impact expected to the Group.
Amendment to IAS 7 – Cash Flow Statements
In January 2017, the IASB issued an amendment to IAS 7 introducing an additional disclosure that will enable users of financial statements to evaluate changes in liabilities arising from financing activities.
The amendment responds to requests from investors for information that helps them better understand changes in an entity’s debt. The amendment will affect every entity preparing IFRS financial statements. However, the information required should be readily available. Preparers should consider how best to present the additional information to explain the changes in liabilities arising from financing activities.
Financial years beginning on or after 1 January 2017.
The Group will apply this amendment from the financial year ending 30 June 2018. No material impact expected to the Group.
IFRS 16 – Leases This standard replaces the current guidance in IAS 17 and is a far reaching change in accounting by lessees in particular.
Under IAS 17, lessees were required to make a distinction between a finance lease (on statement of financial position) and an operating lease (off statement of financial position). IFRS 16 now requires lessees to recognise a lease liability reflecting future lease payments and a “right-of-use asset” for virtually all lease contracts. The IASB has included an optional exemption for certain short-term leases and leases of low-value assets, however, this exemption can only be applied by lessees.
For lessors, the accounting stays almost the same. However, as the IASB has updated the guidance on the definition of a lease (as well as the guidance on the combination and separation of contracts), lessors will also be affected by the new standard.
At the very least, the new accounting model for lessees is expected to impact negotiations between lessors and lessees. Under IFRS 16, a contract is, or contains, a lease if the contract conveys the right to control the use of an identified asset for a period of time in exchange for consideration.
IFRS 16 supersedes IAS 17 – Leases, IFRIC 4 – Determining Whether an Arrangement Contains a Lease, SIC 15 – Operating Leases – Incentives and SIC 27 – Evaluating the Substance of Transactions Involving the Legal Form of a Lease.
Financial years beginning on or after 1 January 2019.
The Group will apply this amendment from the financial year ending 30 June 2020. No material impact expected to the Group.

for the year ended 30 June 2017
94 Aspen Pharmacare Holdings Limited Annual Financial Statements 2017
Residual accounting policies continued
New standards, amendments and interpretations continued
Standards, amendments and interpretations Description Effective date Effect on the Group
Amendments to IFRS 2 – Share-based Payments
Clarifying how to account for certain types of share-based payment transactions.
This amendment clarifies the measurement basis for cash-settled, share-based payments and the accounting for modifications that change an award from cash-settled to equity-settled. It also introduces an exception to the principles in IFRS 2 that will require an award to be treated as if it was wholly equity-settled, where an employer is obliged to withhold an amount for the employee’s tax obligation associated with a share-based payment and pay that amount to the tax authority.
Financial years beginning on or after 1 January 2018.
The Group will apply this amendment from the financial year ending 30 June 2019. No material impact expected to the Group.
Amendment to IFRS 15 – Revenue from Contracts with Customers
The IASB has amended IFRS 15 to clarify the guidance, but there were no major changes to the standard itself. The amendments comprise clarifications of the guidance on identifying performance obligations, accounting for licences of intellectual property and the principal versus agent assessment (gross versus net revenue presentation). New and amended illustrative examples have been added for each of these areas of guidance. The IASB has also included additional practical expedients related to transition to the new revenue standard.
Financial years beginning on or after 1 January 2018.
The Group will apply this amendment from the financial year ending 30 June 2019. No material impact expected to the Group.
IAS 40 – Investment Property
Transfers of investment property
These amendments clarify that to transfer to, or from, investment properties there must be a change in use. To conclude if a property has changed use there should be an assessment of whether the property meets the definition. This change must be supported by evidence.
Financial years beginning on or after 1 January 2018.
The Group will apply this amendment from the financial year ending 30 June 2019. Not applicable to the Group.
IFRS 4 – Insurance Contracts
Regarding the implementation of IFRS 9 – Financial Instruments
These amendments introduce two approaches: an overlay approach and a deferral approach. The amended standard will: ➜➜ Give all companies that issue insurance contracts the option to recognise in other comprehensive income, rather than profit or loss, the volatility that could arise when IFRS 9 is applied before the new insurance contracts standard is issued; and➜➜ Give companies whose activities are predominantly connected with insurance an optional exemption from applying IFRS 9 until 2021. The entities that defer the application of IFRS 9 will continue to apply the existing financial instruments standard – IAS 39.
Financial years beginning on or after 1 January 2018.
The Group will apply this amendment from the financial year ending 30 June 2019. Not applicable to the Group.
IFRIC 22 – Foreign Currency Transactions and Advance Consideration
This IFRIC addresses foreign currency transactions or parts of transactions where there is consideration that is denominated or priced in a foreign currency. The interpretation provides guidance for when a single payment/receipt is made as well as for situations where multiple payment/receipts are made. The guidance aims to reduce diversity in practice.
Financial years beginning on or after 1 January 2018.
The Group will apply this amendment from the financial year ending 30 June 2019. Not applicable to the Group.
Improvements to IFRSThis is a collection of amendments to IFRS. These amendments are the result of conclusions the International Standards Board reached on proposals made in its annual improvements project. The annual improvements project provides a vehicle for making non-urgent but necessary amendments to IFRS. Some amendments involve consequential amendments to other IFRS.
The following improvements were issued in September 2014 and were effective for the financial year ended 30 June 2017:➜➜ IFRS 5 – Non-current Assets Held-for-Sale and Discontinued Operations;➜➜ IFRS 7 – Financial Instruments: Disclosures;➜➜ IAS 19 – Employee Benefits; and➜➜ IAS 34 – Interim Financial Reporting.
The following improvements were issued in December 2016 and are effective for financial years beginning on or after 1 January 2017:➜➜ IFRS 1 – First Time Adoption of IFRS;➜➜ IFRS 12 – Disclosure of Interests in Other Entities; and➜➜ IAS 28 – Investments in Associates and Joint Ventures.
Aspen Pharmacare Holdings Limited Annual Financial Statements 2017
95
at 30 June 2017
Company Annual Financial Statements
Contents96 Company statement of financial position
97 Company statement of comprehensive income
98 Company statement of changes in equity
99 Company statement of cash flows
100 Notes to the Company statement of cash flows
101 Notes to the Company Annual Financial Statements

96 Aspen Pharmacare Holdings Limited Annual Financial Statements 2017
Company statement of financial position
Notes2016
R’million
AssetsNon-current assetsInvestments in subsidiaries 1 17 582,1 17 569,2 Intangible assets 2 591,6 437,8 Property, plant and equipment 3 167,6 177,8 Investment in joint venture 4 61,5 61,5 Deferred tax assets 6 5,8 – Available-for-sale financial assets (non-current) 7 22,1 –
Total non-current assets 18 430,7 18 246,3
Current assetsAmounts due by Group companies 1 431,5 383,3 Cash and cash equivalents 8 957,0 320,3 Receivables and prepayments 9 24,4 43,7 Derivative financial instruments 10 0,6 3,5
Total current assets 1 413,5 750,8
Total assets 19 844,2 18 997,1
Shareholders’ equityRetained income 14 361,9 13 834,7 Share capital 12 3 224,7 3 205,1 Non-distributable reserves 141,9 146,5 Share-based compensation reserve 80,0 69,1
Total shareholders’ equity 17 808,5 17 255,4
LiabilitiesNon-current liabilitiesBorrowings 13 249,2 249,1 Deferred tax liabilities 6 – 0,3
Total non-current liabilities 249,2 249,4
Current liabilitiesBorrowings 14 1 201,9 1 046,7 Amounts due to Group companies 1 414,8 357,0 Other payables 14 149,4 82,4 Current tax liabilities 20,4 6,2
Total current liabilities 1 786,5 1 492,3
Total liabilities 2 035,7 1 741,7
Total equity and liabilities 19 844,2 18 997,1
2017R’million
at 30 June 2017

for the year ended 30 June 2017
Aspen Pharmacare Holdings Limited Annual Financial Statements 2017
97
Company statement of comprehensive income
Notes2016
R’million
Revenue 15 2 391,9 2 470,8Administrative expenses (502,8) (451,7)Other operating income 1,0 11,5Other operating expenses (104,9) (31,4)
Operating profit 16 1 785,2 1 999,2 Investment income 19 25,3 54,7 Financing costs 20 (72,4) (105,1)
Profit before tax 1 738,1 1 948,8 Tax 21 (79,0) (75,3)
Profit for the year 1 659,1 1 873,5
Other comprehensive income, net of tax*Cash flow hedges realised 10 (3,1) (4,2)
Total comprehensive income 1 656,0 1 869,3
* All items in other comprehensive income may be reclassified to profit and loss.
2017R’million

for the year ended 30 June 2017
98 Aspen Pharmacare Holdings Limited Annual Financial Statements 2017
Company statement of changes in equity
Balance at 30 June 2015 4 190,5 150,7 – 48,2 11 961,2 16 350,6 Total comprehensive income – (4,2) – – 1 873,5 1 869,3
Profit for the year – – – – 1 873,5 1 873,5 Other comprehensive income – (4,2) – – – (4,2)
Issue of ordinary share capital – share schemes 0,9 – – – – 0,9 Capital distribution (986,3) – – – – (986,3)Share-based payment expenses – – – 31,1 – 31,1 Deferred incentive bonus shares exercised – – – (10,2) – (10,2)
Balance at 30 June 2016 3 205,1 146,5 – 69,1 13 834,7 17 255,4 Total comprehensive income – (3,1) – – 1 659,1 1 656,0
Profit for the year – – – – 1 659,1 1 659,1 Other comprehensive income – (3,1) – – – (3,1)
Issue of ordinary share capital – share schemes 19,6 – – – – 19,6 Capital distribution – – – – (1 131,9) (1 131,9)Share-based payment expenses – – – 25,2 – 25,2 Revaluation on available-for-sale financial assets – – (1,5) – – (1,5)Deferred incentive bonus shares exercised – – – (14,3) – (14,3)
Balance at 30 June 2017 3 224,7 143,4 (1,5) 80,0 14 361,9 17 808,5
Non-distributable reserve
Share capital
R’million
Hedgingreserve
R’million
Revaluation reserveR’million
Share-based compensation
reserve R’million
Retained income
R’million Total
R’million

for the year ended 30 June 2017
Aspen Pharmacare Holdings Limited Annual Financial Statements 2017
99
Company statement of cash flows
Notes2016
R’million
Cash flows from operating activitiesCash generated from operations A 1 945,6 1 883,2 Financing costs paid B (72,5) (107,4)Interest received 25,3 54,7 Tax paid C (67,1) (135,1)
Cash generated from operating activities 1 831,3 1 695,4
Cash flows from investing activitiesCapital expenditure – property, plant and equipment (5,3) (53,0)Proceeds from the sale of property, plant and equipment – 1,0 Capital expenditure – intangible assets (215,9) (7,8)Proceeds on the sale of assets classified as held-for-sale – 33,9 Acquisition of subsidiaries and businesses (2,3) (371,4)Acquisition of available-for-sale financial assets (23,6) – Net cash outflows – amounts due by Group companies (48,2) (86,0)
Cash used in investing activities (295,3) (483,3)
Cash flows from financing activitiesProceeds from borrowings – 250,0 Repayment of borrowings (15,0) (250,9)Proceeds from issue of ordinary share capital 19,6 0,9 Capital distribution paid (1 131,9) (986,3)Net cash inflows/(outflows) – amounts due from Group companies 57,8 (437,6)
Cash used in financing activities (1 069,5) (1 423,9)
Cash and cash equivalentsMovement in cash and cash equivalents 466,5 (211,8)Cash and cash equivalents at the beginning of the year (686,4) (474,6)
Cash and cash equivalents at the end of the year D (219,9) (686,4)
For the purposes of the statement of cash flows, cash and cash equivalents comprise bank balances less bank overdrafts.
2017R’million
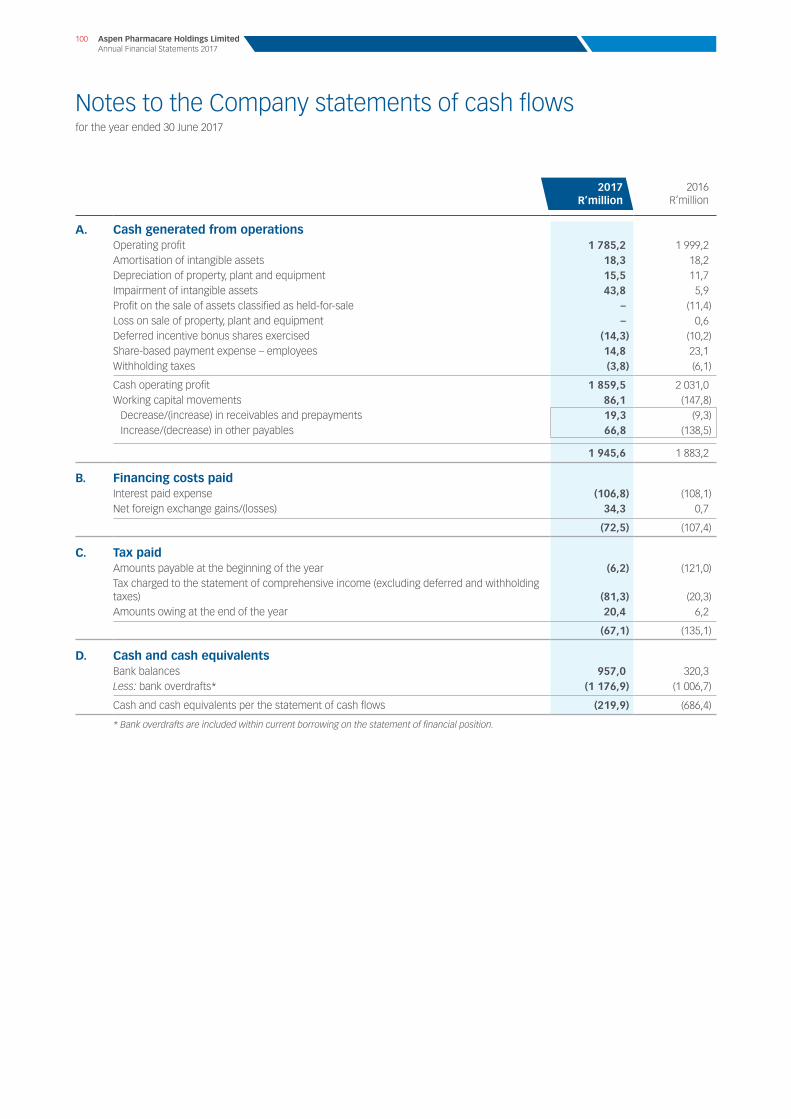
for the year ended 30 June 2017
100 Aspen Pharmacare Holdings Limited Annual Financial Statements 2017
Notes to the Company statements of cash flows
2016R’million
A. Cash generated from operationsOperating profit 1 785,2 1 999,2 Amortisation of intangible assets 18,3 18,2 Depreciation of property, plant and equipment 15,5 11,7 Impairment of intangible assets 43,8 5,9 Profit on the sale of assets classified as held-for-sale – (11,4)Loss on sale of property, plant and equipment – 0,6 Deferred incentive bonus shares exercised (14,3) (10,2)Share-based payment expense – employees 14,8 23,1 Withholding taxes (3,8) (6,1)
Cash operating profit 1 859,5 2 031,0 Working capital movements 86,1 (147,8)
Decrease/(increase) in receivables and prepayments 19,3 (9,3)Increase/(decrease) in other payables 66,8 (138,5)
1 945,6 1 883,2
B. Financing costs paidInterest paid expense (106,8) (108,1)Net foreign exchange gains/(losses) 34,3 0,7
(72,5) (107,4)
C. Tax paidAmounts payable at the beginning of the year (6,2) (121,0)Tax charged to the statement of comprehensive income (excluding deferred and withholding taxes) (81,3) (20,3)Amounts owing at the end of the year 20,4 6,2
(67,1) (135,1)
D. Cash and cash equivalentsBank balances 957,0 320,3 Less: bank overdrafts* (1 176,9) (1 006,7)
Cash and cash equivalents per the statement of cash flows (219,9) (686,4)
* Bank overdrafts are included within current borrowing on the statement of financial position.
2017R’million

for the year ended 30 June 2017
Aspen Pharmacare Holdings Limited Annual Financial Statements 2017
101
Notes to the Company Annual Financial Statements
1. Investments in subsidiaries2016
R’million
Summary of balanceReflected as non-current assets Investments at cost less accumulated impairment losses 17 582,1 17 569,2
Reflected as current assets Amounts due by Group companies# 431,5 383,3
Reflected as current liabilities Amounts due to Group companies# (414,8) (357,0)
17 598,8 17 595,5 # The intra-group facilities all bear interest at varying rates depending on whether or not the amounts are treated as a shareholder loan, is financing
that has been provided or arises from the ad hoc recovery of expenditure/provision of services. Interest is not levied on current payables and receivables unless the credit days are exceeded, in which case interest is levied on the amounts that remain overdue.
For further details of interests in material operating subsidiaries please refer to note 25.
2. Intangible assetsReconciliation of balance
Intellectual property R’million
Product participation
and other contractual
rights R’million
Computer software R’million
TotalR’million
2017Carrying valueCost 1 148,2 42,8 228,8 1 419,8 Accumulated amortisation (738,7) (42,8) (30,1) (811,6)Accumulated impairment losses (16,6) – – (16,6)
392,9 – 198,7 591,6
Movement in intangible assetsCarrying value at the beginning of the year 399,5 – 38,3 437,8 Additions 45,1 – 170,8 215,9Amortisation (7,9) – (10,4) (18,3)Impairment losses (43,8) – – (43,8)
392,9 – 198,7 591,6
2016Carrying valueCost 1 146,6 57,8 58,0 1 262,4 Accumulated amortisation (730,7) (57,8) (19,7) (808,2)Accumulated impairment losses (16,4) – – (16,4)
399,5 – 38,3 437,9
Movement in intangible assetsCarrying value at the beginning of the year 430,7 – 45,9 476,6 Additions 1,4 – 6,4 7,8Amortisation (8,9) – (9,3) (18,2)Impairment losses (1,2) – (4,7) (5,9)Reclassification to assets classified as held-for-sale (22,5) – – (22,5)
399,5 – 38,3 437,8
All intangible assets were acquired from third parties.
2017R’million

for the year ended 30 June 2017
102 Aspen Pharmacare Holdings Limited Annual Financial Statements 2017
Notes to the Company Annual Financial Statements continued
2. Intangible assets continuedIndefinite useful life intangible assets
2016R’million
Split of balanceGSK OTC Brands 269,2 269,2Other 110,5 109,5
379,7 378,7
Impairment of intangible assetsKey assumptions on impairment tests for the GSK OTC Brands were as follows:➜➜ period covered by the forecasts and budgets of 10 years (2016: 10 years);➜➜ growth in revenue per annum of between 0% and 14% (2016: 2% and 10%);➜➜ gross profit percentage per annum of 71% (2016: 72%);➜➜ growth rate to extrapolate cash flows beyond period covered by mentioned forecasts and budgets of 1% and 5% (2016: 1%); and➜➜ annual pre-tax discount rate applied to cash flows of between 9% and 24% (2016: 9% and 24%).
Management has used a forecast period greater than five years to better reflect the impact of a gradual slowing in growth over the medium term.
Based on the above calculations no impairments were recognised for the indefinite useful life intangible assets. There are no reasonable possible change in any key assumptions which would cause the carrying value of indefinite useful life intangible assets to exceed its value-in-use.
CommitmentsCapital commitments include all projects for which specific Board approval has been obtained up to the reporting date. Capital expenditure will be financed from funds generated out of normal business operations and existing borrowing facilities. Projects still under investigation for which specific Board approvals have not yet been obtained are excluded from the following
2016R’million
Authorised and contracted for – 33,4Authorised but not yet contracted for 46,5 10,6
46,5 44,0
Other disclosureNo intangible assets were pledged or committed as security for borrowings.
2017R’million
2017R’million

Aspen Pharmacare Holdings Limited Annual Financial Statements 2017
103
3. Property, plant and equipmentReconciliation of balance
Buildings R’million
Plant and equipment
R’million
Other tangible
assets@
R’millionTotal
R’million
2017Carrying valueCost 152,2 0,3 44,3 196,8 Accumulated depreciation (6,3) (0,3) (22,6) (29,2)
145,9 – 21,7 167,6
Movement in property, plant and equipmentCarrying value at the beginning of the year 148,0 0,1 29,7 177,8Additions 1,3 – 4,0 5,3Depreciation (3,4) (0,1) (12,0) (15,5)#
145,9 – 21,7 167,6*
2016Carrying valueCost 151,0 0,3 39,0 190,3 Accumulated depreciation (3,0) (0,2) (9,3) (12,5)
148,0 0,1 29,7 177,8
Movement in property, plant and equipmentCarrying value at the beginning of the year 126,9 0,1 11,1 138,1 Additions 24,1 – 28,9 53,0 Disposals – – (1,6) (1,6)Depreciation (3,0) – (8,7) (11,7)#
148,0 0,1 29,7 177,8*@ Other tangible assets comprise computer equipment, office equipment and furniture.* Included in the total are leased assets amounting R10,2 million (2016: R14,7 million).# Depreciation charge is included in administrative expenses on the statement of comprehensive income.

for the year ended 30 June 2017
104 Aspen Pharmacare Holdings Limited Annual Financial Statements 2017
Notes to the Company Annual Financial Statements continued
3. Property, plant and equipment continuedCommitmentsCapital commitmentsCapital commitments include all projects for which specific Board approval has been obtained up to the reporting date. Capital expenditure will be financed from funds generated out of normal business operations and existing borrowing facilities. Projects still under investigation for which specific Board approvals have not yet been obtained are excluded from the following
2016R’million
Authorised and contracted for – 10,9 Authorised but not yet contracted for 19,9 7,4
19,9 18,3
Operating lease commitmentsThe Company rents buildings under non-current, non-cancellable operating leases and also rents office equipment and furniture under operating leases that are cancellable at various short-term notice periods by either party.Minimum future lease payments – operating leasesLand and buildings 0,8 2,3 Office equipment and furniture 1,2 0,1
Operating lease commitments 2,0 2,4
The future minimum operating lease payments are as followsLess than one year 1,7 0,8 Between one and five years 0,2 1,6
2,0 2,4
These leasing arrangements do not impose any significant restrictions on the Company.
Other disclosure
No property, plant and equipment was pledged or committed as security for any borrowings.
4. Investment in joint ventureReconciliation of balance
Carrying value at the beginning and end of the year 61,5 61,5
This investment represents 50% shareholding New Zealand New Milk, a producer of infant nutritionals incorporated in Auckland, New Zealand. New Zealand New Milk is a private company and no quoted market price is available for its shares.
5. Other non-current receivablesReconciliation of balanceCarrying value at the beginning and end of the year – 25,0 Current portion moved to other receivables – (25,0)
– –
In the previous year, agreements were entered into with two BBBEE beneficiaries whereby enterprise development loans have been advanced by the Company. The outstanding loans bore interest at the South African prime rate plus margin of 1%.
These loans are due to be repaid at the end of the previous year, were repaid in the current year.
These loans were secured by a second bond over specified movable assets to a value of R10,0 million as well as a cession of specified book debts. Management considers the credit risk associated with these receivables to be low. These balances were denominated in Rand.
2017R’million

Aspen Pharmacare Holdings Limited Annual Financial Statements 2017
105
6. Deferred taxReconciliation of balance
2016R’million
Deferred tax liabilities/(assets) – opening balance 0,3 (48,6)Statement of comprehensive income charge/(credit) – included in tax 2,3 30,1 Statement of comprehensive income charge/(credit) – prior year adjustment (8,4) 18,8
(5,8) 0,3
Split of balanceDeferred tax liabilities – 0,3 Deferred tax assets (5,8) –
(5,8) 0,3
Deferred tax balance comprisesProperty, plant and equipment 6,1 6,8 Intangible assets 2,4 6,4 Receivables and prepayments 2,0 1,8 Other payables (16,3) (14,7)
(5,8) 0,3
The statement of comprehensive income charge/(credit) comprisesProperty, plant and equipment (0,7) 6,7 Intangible assets (3,6) 9,3 Receivables and prepayments 0,2 1,7 Tax claims in respect of share schemes – – Other payables (2,0) 31,2 Other – –
(6,1) 48,9
7. Available-for-sale financial assetsAcquisition of shares in Aspen Pharmacare Holdings Limited* 23,6 – Revaluation to fair value – charged to equity (1,5)
At the end of the year 22,1 –
The Aspen Pharmacare Holdings Limited shares are fair valued by reference to the stock exchange quoted bid prices. These shares are classified as “level 1” assets in the fair value measurement hierarchy.
* Shares are purchased and held by the Company until vesting of deferred incentive bonus takes place.
8. Cash and cash equivalentsSummary of balance
Bank balances 957,0 320,3
Other disclosureThe average effective interest rate on cash and cash equivalents is 7,5% (2016: 6,9%).
The total amount of cash and cash equivalents is exposed to credit risk, and are held with highly reputable banks. The Company does not expect any treasury counterparties to fail to meet their obligations, given their high credit ratings.
All cash and cash equivalents are denominated in Rand.
The maturity profile of bank balances is less than one month.
2017R’million

for the year ended 30 June 2017
106 Aspen Pharmacare Holdings Limited Annual Financial Statements 2017
Notes to the Company Annual Financial Statements continued
9. Receivables and prepaymentsSummary of balance
2016R’million
Enterprise development loans – 25,0 Prepayments 16,6 15,9 Other 7,8 2,8
24,4 43,7
Split of balanceFinancial assets 7,8 27,8 Non-financial assets 16,6 15,9
24,4 43,7
Other disclosureThe Company holds no collateral over any receivables and prepayments.
Receivables and prepayments are non-interest bearing, except for enterprise development loans which bore interest at the South African prime overdraft rate plus a margin of 1% in the prior year.
All receivables and prepayments classified as financial instruments are fully performing and are denominated in Rand.
The credit quality of receivables and prepayments is considered to be satisfactory.
10. Derivative financial instrumentsReconciliation of balanceBalance at the beginning of the year 3,5 4,2 Fair value gains on interest rates swaps (included in finance costs) 0,2 3,5 Fair value losses on interest rate swaps (included in other comprehensive income) (3,1) (4,2)
0,6 3,5
Derivatives consist of interest rate swaps.
The fair value of interest rate swaps is calculated as the present value of estimated future cash flows discounted using the appropriate yield curve.
The interest rate swaps were classified as “level 2” assets in the fair value measurement hierarchy.
11. Assets classified as held-for-saleReconciliation of balanceReclassification from intangible assets – 22,5 Disposals – (22,5)
– –
In the previous, Pharmacare and Brimpharm (Pty) Limited concluded a set of agreements with Litha in terms of which these companies divested the portfolio products for a consideration of a R1,7 billion. The portfolio of products comprise injectables and established brands. The approval of this transaction by the South African competition authorities on 4 August 2015. This transaction completed on 1 October 2015.
12. Share capitalSummary of balance
2016R’million
Authorised717 600 000 (2016: 717 600 000) ordinary shares with no par value – – Issued
456 435 185 (2016: 456 351 337) ordinary shares with no par value 3 224,7 3 205,1
2016million
Shares in issue at the beginning of the year 456,4 456,3 Shares issued – share schemes – 0,1
Shares in issue at the end of the year 456,4 456,4
The unissued shares have been placed under the control of the directors until the forthcoming annual general meeting.
All shares are fully paid up, and no amounts are outstanding in terms of shares issued during the year.
2017R’million
2017R’million
2017million

Aspen Pharmacare Holdings Limited Annual Financial Statements 2017
107
13. BorrowingsCurrency analysis and maturity profile of total borrowings
2017
Within 1 year
R’million
Between 1 – 5
years R’million
Total R’million
2016
Within 1 year
R’million
Between 1 – 5 years
R’millionTotal
R’million
Bank overdraftsRand 1 176,9 – 1 176,9 1 006,7 – 1 006,7 Unsecured loansRand syndicated term loan – Facility F – 250,0 250,0 – 250,0 250,0 Rand other 25,0 – 25,0 40,0 – 40,0 Capital raising fees – (0,8) (0,8) – (0,9) (0,9)
Total borrowings 1 201,9 249,2 1 451,1 1 046,7 249,1 1 295,8
Interest rate profile of total borrowings20162017
Total R’million
Interest rate
%
Average effective interest
rate %
TotalR’million
Interest rate
%
Average effective interest
rate%
Bank overdrafts – linked to South African prime overdraft rate 1 176,9
less margin of 3,0% 6,9 1 006,7
less margin of 3,0% 6,9
Unsecured loans – linked to three-month JIBAR 250,0
+ margin of 2,2% 9,3 250,0
+ margin of 2,2% 9,5
Unsecured loans – linked to overnight call rate 25,0
Overnight call 8.0 40,0
Overnightcall 7,8
Capital raising fee# (0,8) (0,9)
Total borrowings 1 451,1 1 295,8
# Capital raising fees relate to the unsecured loans above but have been shown separately as they are non-interest bearing.
Other disclosuresThere were no undrawn borrowing facilities available at year-end.
There were no defaults or breaches of the contractual terms of the borrowings during the year.
2016R’million
14. Other payablesSummary of balanceAccrued expenses 23,2 10,6Leave pay 9,5 7,9Bonuses 45,7 39,7Other 71,0 24,2
149,4 82,4
Split of balanceFinancial liabilities 106,7 30,4Non-financial liabilities 42,7 52,0
149,4 82,4
Other disclosuresCurrency analysis of trade and other payables (financial instruments only)Euro – 0,7South African Rand 106,7 29,7
106,7 30,4
All other payables (financial instruments only) are predominantly non-interest bearing.
2017R’million

for the year ended 30 June 2017
108 Aspen Pharmacare Holdings Limited Annual Financial Statements 2017
Notes to the Company Annual Financial Statements
2016R’million
15. RevenueSummary of balanceRoyalties 220,4 278,0 Administrative fees received from subsidiaries 432,7 331,4Dividends received from subsidiaries 1 738,8 1 861,4
2 391,9 2 470,8
16. Operating profit Operating profit has been arrived at after creditingProfit on the sale of assets classified as held-for-sale – (11,4)After chargingAuditors’ remuneration 7,8 7,1
Audit fees 7,8 6,9 Current year 4,9 4,9 Prior year under provision 2,9 2,0
Other services – 0,2 Impairment of intangible assets (included in other operating expenses) 43,8 5,9 Transaction costs 1,5 1,4 Operating lease rentals – land and buildings 0,7 0,7 Operating lease rentals – office equipment and furniture 0,1 0,1 Loss on the sale of property, plant and equipment – 0,6
17. Expenses by natureDepreciation of property, plant and equipment 15,5 11,7 Amortisation of intangible assets 18,3 18,2 Impairment of intangible assets 43,8 5,9 Personnel costs and other staff-related costs 293,4 274,4 Property costs 3,9 3,7 Transaction costs 1,5 1,4 Legal and consulting fees 21,7 24,1 Insurance local policy 22,7 16,6 Information technology costs 92,9 74,5 Other 94,0 52,6
607,7 483,1
Classified asAdministrative expenses 502,8 451,7 Other operating expenses 104,9 31,4
607,7 483,1
18. Directors and employeesStaff costsWages and salaries 203,5 201,4 Defined contribution plans 22,0 19,7 Share-based payment expense – deferred incentive bonus 14,8 23,1
Cash portion 0,2 1,1 Equity portion 14,6 22,0
Other employee contributions 4,2 4,4
244,5 248,6
2017R’million

Aspen Pharmacare Holdings Limited Annual Financial Statements 2017
109
2016R’million
19. Investment incomeSummary of balanceInterest received on bank balances 20,1 48,6 Interest received from Group companies 2,6 2,7 Interest received – Other 2,6 3,4
25,3 54,7
20. Financing costsSummary of balanceInterest paid on borrowings 106,8 108,1 Capital raising fees released 0,2 1,2 Net foreign exchange gains (34,3) (0,7)Fair value gain on derivative financial instruments (0,2) (3,5)
72,4 105,1
21. TaxSummary of balanceSouth African tax 81,3 20,2 Foreign tax 3,8 6,1
Deferred tax (6,1) 48,9
Total tax charge 79,0 75,3
The Company submits its tax returns and advance payments as they fall due and the 2016 tax returns have been submitted by the Company.
Disputed income tax matter
The Aspen Group was subject to an international tax and transfer pricing audit by the South African Revenue Service (“SARS”) and Aspen Pharmacare Holdings Limited received a revised assessment in relation to its 2011 fiscal year as a consequence of this audit. Aspen, with the assistance of its legal and tax advisers, entered into discussions with SARS, which has resulted in the assessment being reversed by SARS on 16 October 2017.
Reconciliation of effective tax rate2016
%
South African current tax rate 28,0 28,0 Increase in rate due to
Disallowed expenditure 2,4 1,6 Withholding and other taxes 0,2 0,3 Prior year adjustments 1,2 1,0 Other 0,7 –
Decrease in rate due toExempt income (28,0) (27,0)
Effective tax rate 4,5 3,9
2017R’million
2017%

Notes to the Company Annual Financial Statements continued
for the year ended 30 June 2017
110 Aspen Pharmacare Holdings Limited Annual Financial Statements 2017
22. Related-party transactionsTransactions with shareholdersThe Company did not enter into any transactions with direct beneficial shareholders during the current year, except as described in the Directors’ Report and note 22 of the Group’s Annual Financial Statements.
Intra-group transactions and balancesDuring the year, the Company entered into arm’s length transactions with other companies in the Group.
Refer to note 25 for a list of the material operating subsidiaries and structured entities.
None of the balances are secured.
2016R’million
The following intra-group transactions took place between Aspen Holdings and Group companies during the current yearRoyalties received 220,4 278,0 Pharmacare Limited 217,6 277,5 Other subsidiaries 2,8 0,5 Administration fees received 432,7 331,4 Aspen Global Incorporated 93,0 81,2 Aspen Europe GmbH 12,0 10,2 Aspen Healthcare FZ LLC 21,3 15,9 Aspen Notre Dame de Bondeville SAS 20,4 18,5 Aspen Oss B.V. 34,2 26,5 Aspen Pharma Ireland Limited 14,5 7,5 Pharmacare Limited 90,8 71,9 Other subsidiaries 146,5 99,7 Interest received on shareholders’ loans – Beta Healthcare International Limited 2,6 2,7 Dividends received (and paid to the Company) 1 738,8 1 861,4 Aspen Global Incorporated 1 735,8 818,1 Brimpharm SA (Pty) Limited – 131,0 Aspen Pharmacare Nigeria Limited 3,0 4,9 Pharmacare Limited – 900,0 Other subsidiaries – 7,4
The following intra-group balances were outstanding between Aspen Holdings and Group companies at year endAmounts reflected as current assets 431,5 383,3 Aspen Global Incorporated 30,0 48,5 The Aspen Share Incentive Scheme Trust 87,3 101,5 Shelys Pharmaceuticals International Limited 112,0 112,0 Other subsidiaries 202,2 121,3 Amounts reflected as current liabilities 414,8 357,0 Pharmacare Limited 318,6 280,6 Aspen Port Elizabeth (Pty) Limited 27,1 27,1 Aspen International Distribution (Pty) Limited 29,1 29,1 Other subsidiaries 40,0 20,2
2017R’million

Aspen Pharmacare Holdings Limited Annual Financial Statements 2017
111
22. Related-party transactions continuedTransactions and balances with directorsAll directors have given general declarations of interest in terms of section 75 of the Companies Act of 2008.
These declarations indicate that various members of the Board hold various other directorships in South African entities with whom transactions are conducted by the Company in terms of a customer/supplier relationship.
These transactions have been concluded on terms and conditions that are no more favourable than those entered into with third parties in arm’s length transactions, and are all unsecured.
Chris Mortimer, a non-executive director of Aspen, is a full-time practising attorney and managing partner at Chris Mortimer & Associates which provides legal services to the Company. During the year total legal fees expensed in the statement of comprehensive income for services provided by Chris Mortimer & Associates was Rnil (2016: R0,4 million), and no balance was outstanding at year end (2016: Rnil).
Transactions with key management personnelKey management personnel consist of directors (including executive directors).
Key management personnel compensation consists of
2016R’million
Short-term employee benefits 49,3 45,8Post-employment benefits 4,5 4,0Share-based payment expense 15,5 14,6
Total key management remuneration paid 69,3 64,4
Number of employees included above 14 14
Other than disclosed above, and in the Directors’ Report, no significant related-party transactions were entered into during the year under review.
2017R’million

Notes to the Company Annual Financial Statements continued
for the year ended 30 June 2017
112 Aspen Pharmacare Holdings Limited Annual Financial Statements 2017
23. Financial risk management23.1 Introduction
The Company does not trade in financial instruments, but in the ordinary course of business operations, the Company is exposed to a variety of financial risks arising from the use of financial instruments. These risks include:➜➜ market risk (comprising interest rate risk and foreign currency risk);➜➜ liquidity risk;➜➜ credit risk; and➜➜ capital risk.
The Audit & Risk Committee is responsible for the establishment and oversight of a risk management framework which is applicable to the Company. This framework is formally documented, and stipulates the responsibilities and processes for monitoring and managing the risks to which the Company is exposed.
The Company measures and monitors treasury relevant risks (i.e. liquidity, foreign exchange, interest rate, covenants, counterparty, etc.) affecting it, and reports on these risks to the Group Treasury Committee on a periodic basis. The Group Treasury Committee provides the Company guidance with respect to managing these risks. However, the Company’s management is empowered, within the relevant approvals frameworks, to make decisions regarding how to manage these risks, as well as taking ownership for the implementation of any related action. The Group Treasury Committee reports to the Audit & Risk Committee.
Risk management and measurement relating to each of these risks is discussed under the headings below.
23.2 Financial instruments by categoryThe carrying value of financial instruments by category is as follows
Loans and receivables
R’million
At fair value through
profit or lossR’million
At amortised
costR’million
TotalR’million
June 2017Financial assetsReceivables and prepayments 7,8 – – 7,8Cash and cash equivalents 957,0 – – 957,0Amounts due by Group companies 431,5 – – 431,5Interest rate swaps (net settled) – 0,6 – 0,6
Total financial assets 1 396,3 0,6 – 1 396,9
Financial liabilitiesUnsecured loans – – 274,2 274,2Bank overdrafts – – 1 176,9 1,176,9Other payables – – 106,7 106,7Amounts due to Group companies – – 414,8 414,8
Total financial liabilities – – 1 972,6 1 972,6
June 2016Financial assetsReceivables and prepayments 27,8 – – 27,8Cash and cash equivalents 320,3 – – 320,3Amounts due by Group companies 383,3 – – 383,3 Interest rate swaps (net settled) – 3,5 – 3,5
Total financial assets 731,4 3,5 – 734,9
Financial liabilitiesUnsecured loans – – 289,1 289,1Bank overdrafts – – 1 006,7 1 006,7Other payables – – 30,4 30,4Amounts due to Group companies – – 357,0 357,0
Total financial liabilities – – 1 368,2 1 368,2

Aspen Pharmacare Holdings Limited Annual Financial Statements 2017
113
23. Financial risk management continued23.3 Market risk management
Market risk is the risk that the fair value or future cash flows of a financial instrument will fluctuate due to changes in market prices. The market risks that the Company is primarily exposed to include foreign currency risk and interest rate risk. Market risk is managed by identifying and quantifying risks on the basis of current and future expectations and ensuring that all trading occurs within defined parameters. This involves the review and implementation of methodologies to reduce risk exposure. The reporting on the state of the risk and risk practices to executive management is part of this process. The processes set up to measure, monitor and mitigate these market risks are described below. There has been no change to the Company’s exposure to market risk or the manner in which it manages and measures the risk since the previous period.
23.4 Foreign currency risk The Company’s transactions are predominantly entered into in Rand. However, the Company’s operations utilise various foreign currencies (currencies other than the operations functional currencies) in respect of expenses incurred. Consequently the Company is exposed to exchange rate fluctuations that have an impact on cash flows. These operations are exposed to foreign currency risk in connection with contracted payments in currencies other than Rand.
Foreign currency risks are managed through the Company’s financing policies and selective use of forward exchange contracts.
At 30 June 2017 and 30 June 2016, the Company had no outstanding forward exchange contracts.
Sensitivity analysisThe Company had used a sensitivity analysis technique that measured the estimated change to the statement of comprehensive income of an instantaneous 10% strengthening or weakening in the Rand against all other currencies, from the rate applicable at 30 June, for each class of financial instrument with all other variables remaining constant. This analysis is for illustrative purposes only, as in practice, market rates rarely change in isolation.
The Company is mainly exposed to fluctuations in foreign exchange rates in respect of the Euro. The analysis considered the impact of changes in foreign exchange rates on the statement of comprehensive income.
The analysis had been performed on the basis of the change occurring at the start of the reporting period and assumed that all other variables, in particular interest rates, remain constant and was performed on the same basis for 2016.
A 10% weakening in the Rand against the foreign exchange rates to which the Company is exposed at the reporting date, would have increased profit before tax by R7,6 million (2016: R0,1 million).
A 10% strengthening in the Rand against the foreign exchange rates would have the equal and opposite effect on profit before tax, on the basis that all other variables remain constant.
23.5 Interest rate riskThe Company’s interest rate risk arises from interest on bank overdrafts, borrowings, cash and cash equivalents and other non-current receivables. Exposure to interest rate risk is monitored on a continuous and proactive basis.
Carrying value
2016R’million
Variable rate instrumentsTrade and other receivables (4,0) (25,0)Cash and cash equivalents (957,0) (320,3)Borrowings 1 201,9 1 296,7
Variable rate exposure 240,9 951,4
2017R’million

Notes to the Company Annual Financial Statements continued
for the year ended 30 June 2017
114 Aspen Pharmacare Holdings Limited Annual Financial Statements 2017
23. Financial risk management continued23.5 Interest rate risk continued
Interest rate swapsThe following pay fixed rate, receive floating rate interest rate derivative contract was in place:
Outstanding contract amount
R’million
Fixed interest
rate%
Expiry date
Rand syndicated term loan Facility F 250,0 7,1% (three-month
JIBAR)
30 June 2021
The interest rate swap is designated in a cash flow hedging relationship. The nature of the risks that are hedged (interest rate risk) is the variability of the quarterly interest payments on the hedged items, attributable to movements in the three-month JIBAR rate. All remeasurements for the remaining term of the swap will be recognised directly in the statement of comprehensive income.
The maturity profile of the gross contract amount at 30 June 2017 is four years.
Sensitivity analysisThe Company is exposed mainly to fluctuations in the following market interest rates: South African prime overdraft rate and three-month JIBAR. Changes in market interest rates affect the interest income and expense of floating rate financial instruments.
An increase of 1% in interest rates at 30 June would have decreased profit before tax by R8,1 million and R3,8 million in 2017 and 2016 respectively. A decrease of 1% will have an equal and opposite effect on profit before tax.
An increase of 1% in the yield curve at 30 June 2017 would result in a decrease of Rnil (2016: R2,7 million) in the fair value of the derivative liabilities in the statement of comprehensive income. A decrease of 1% in the yield curve will have an equal and opposite effect on the derivative liabilities in the statement of comprehensive income.
23.6 Liquidity riskLiquidity risk is the risk that an entity will not be able to meet its obligations as they become due. The Company manages liquidity risk by effectively managing its working capital, capital expenditure and cash flows. The Company finances its operations through a mixture of retained income, bank funding and financing from Group companies. Adequate banking facilities and reserve borrowing capacities are maintained. The Company manages liquidity risk through forecasting and monitoring cash flow requirements on a daily basis.

Aspen Pharmacare Holdings Limited Annual Financial Statements 2017
115
23. Financial risk management continued23.6 Liquidity risk continued
The following are the undiscounted contractual maturities of financial assets and liabilities
Undiscounted cash flows
On demandR’million
< One yearR’million
One to five years
R’millionTotal
R’million
June 2017Financial assetsReceivables and prepayments (financial instruments only) – 7,8 – 7,8Cash and cash equivalents 957,0 – – 957,0Amounts due by Group companies 431,5 – – 431,5 Interest rate swaps (net settled) – 0,6 – 0,6
Total financial assets 1 388,5 8,4 – 1 396,9
Financial liabilitiesUnsecured loans – (49,0) (343,0) (390,2)Bank overdrafts (1 176,9) – – (1 176,9)Other payables (financial instruments only) – (106,9) – (106,9)Amounts due to Group companies (414,8) – – (414,8)
Total financial liabilities (1 591,7) (155,7) (343,0) (2 090,4)
Net exposure (203,2) (147,3) (343,0) (693,5)
June 2016Financial assetsReceivables and prepayments (financial instruments only) – 27,8 – 27,8Cash and cash equivalents 320,3 – – 320,3Amounts due by Group companies 383,3 – 383,3Interest rate swaps (net settled) – 3,5 – 3,5
Total financial assets 703,6 31,3 – 734,9
Financial liabilitiesUnsecured loans – 61,7 (345,0) (406,7)Bank overdrafts (1 006,7) – – (1 006,7)Other payables (financial instruments only) – (30,4) – (30,4)Amounts due to Group companies (357,0) – – (357,0)
Total financial liabilities (357,0) (290,1) (345,0) (1 800,8)
Net exposure 26,3 (60,8) (345,0) (1 065,9)

Notes to the Company Annual Financial Statements continued
for the year ended 30 June 2017
116 Aspen Pharmacare Holdings Limited Annual Financial Statements 2017
23. Financial risk management continued23.7 Credit risk
Credit risk, or the risk of financial loss due to counterparties to financial instruments not meeting their contractual obligations, is managed by monitoring procedures.
Credit risk primarily arises from receivables and prepayments, other non-current receivables, derivative financial instruments and cash and cash equivalents. The Company’s maximum exposure to credit risk is represented by the carrying values of these financial assets. Refer to the respective notes for more detail on how the Company manages credit risks for these financial assets.
23.8 Capital riskThe Company’s objectives when managing capital are to safeguard the Company’s ability to continue as a going concern in order to provide sustainable returns for shareholders, benefits for other stakeholders and to maintain an optimal capital structure to reduce the cost of capital.
The capital structure of the Company consists of borrowings and equity attributable to holders of the parent comprising share capital, non-distributable reserves and retained income.
The Board’s policy is to maintain a strong capital base so as to maintain investor, creditor and market confidence, and to sustain future development of the business. The Board reviews the capital structure on a quarterly basis. As part of the review, the Board considers the cost of capital and the risks associated with each class of capital. Based on recommendations of the Board, the Company will balance overall capital structure through payments of dividends (including capital distributions), new shares issued as well as the issue of new borrowings or the redemption of existing borrowings.
There were no changes to the Company’s approach to capital management during the year.
24. Contingent liabilitiesGuarantees to financial institutionsThe Company has several guarantees for indebtedness of subsidiaries to financial institutions which amount to R55,6 billion (2016: R40,6 billion). The guarantees relate mainly to the syndicated term loans as well as cross guarantees provided between Group companies for each other’s indebtedness. The guarantees are entered into on an arm’s length basis. The primary reason for the increase in the value of the guarantees provided is the change in the guarantor structure in respect of the syndicated term loan, whereby all obligators have a joint and several liability for all outstanding commitments from the obligators to lenders under the syndicated term loan agreement. The obligators referred to above comprise:➜➜ Aspen Pharmacare Holdings Limited;➜➜ Pharmacare Limited;➜➜ Aspen Finance (Pty) Limited;➜➜ Aspen Global Incorporated; and➜➜ Aspen Asia Pacific (Pty) Limited

Aspen Pharmacare Holdings Limited Annual Financial Statements 2017
117
25. Material operating subsidiaries and structured entitiesCountry of incorporation Company Currency
Issued capital
Effective Group holding Investment
‘0002016
%2017
R’million2016
R’million
SubsidiariesDirectGermany Aspen Bad Oldesloe GmbH EUR 50 100 100 685,1 685,1 Mauritius Aspen Global Incorporated EUR 908 529 100 100 8 654,3 8 654,3 France Aspen Notre Dame de Bondeville SAS EUR 266 311 100 100 3 780,1 3 780,1 The Netherlands Aspen Oss B.V. EUR 53 000 100 100 1 389,4 1 389,4 Kenya Beta Healthcare International Limited KES 30 000 100 100 7,1 4,8 South Africa Fine Chemicals Corporation
(Pty) Limited ZAR –# 100 100 329,7 329,7
South Africa Pharmacare Limited ZAR 1 395 100 100 2 068,4 2 057,8 South Africa Aspen Finance (Pty) Limited EUR 22 000 100 100 370,0 370,0Various Various ∆ ∆ ∆ ∆ 298,0 298,0IndirectUnited Arab Emirates Aspen Healthcare FZ LLC USD 82 100 100 – –Russia Aspen Health LLC RUB 615 400 100 100 – –Australia Aspen Nutritionals Australia
Pty LimitedAUD –# 100 100 – –
Brazil Aspen Pharma – Indústria Farmacêutica Limitada
BRL 385 066 100 100 – –
Ireland Aspen Pharma Ireland Limited EUR 42 001 100 100 – –Australia Aspen Pharma (Pty) Limited AUD 11 862 100 100 – –Australia Aspen Pharmacare Australia
Pty LimitedAUD 167 373 100 100 – –
Tanzania Shelys Pharmaceuticals Limited TZS 6 723 843 100 100 – –Mexico Wyeth, S de R. L. de C.V. MXN 1 944 870 100 100 – –Various Various ∆ ∆ ∆ ∆ – –Trusts (structured entities)^South Africa Aspen Share Appreciation Plan ZAR N/A 100 100 – –South Africa Aspen Share Incentive Scheme ZAR N/A 100 100 – –
Total investments in subsidiaries 17 582,1 17 569,2# Less than 1 000.^ These trusts are structured entities which are consolidated into the Group Annual Financial Statements and are not subject to any other risk exposure.∆ These direct and indirect holdings are made up of various subsidiaries incorporated in multiple territories.
Detailed information is only given in respect of the Company’s material operating subsidiaries. The Company maintains a register of all subsidiaries and structured entities available for inspection at the registered office of Aspen Holdings.
DefinitionsAUD: Australian Dollar MXN: Mexican PesoBRL: Brazilian Real TZS: Tanzanian ShillingEUR: Euro USD: US DollarKES: Kenyan Shilling ZAR: South African RandRUB: Russian Ruble
2017%

118 Aspen Pharmacare Holdings Limited Annual Financial Statements 2017
Illustrative constant exchange rate report – Annexure 1
Illustrative constant exchange rate report on selected financial dataThe Group has presented selected line items from the consolidated statement of comprehensive income and certain trading profit metrics on a constant exchange rate basis in the tables below.
The pro forma constant exchange rate information is presented to demonstrate the impact of fluctuations in currency exchange rates on the Group’s reported results. The constant exchange rate report is the responsibility of the Group’s Board of Directors and is presented for illustrative purposes only. Due to the nature of this information, it may not fairly present the Group’s financial position, changes in equity and results of operations or cash flows. The pro forma information has been compiled in terms of the JSE Listings Requirements and the Revised Guide on Pro Forma information by SAICA and the accounting policies of the Group as at 30 June 2017. The illustrative constant exchange rate report on selected financial data has been derived from the audited financial information and has been reported on by Aspen’s auditors in an assurance report, which is available for inspection at the Company’s registered office.
The Group’s financial performance is impacted by numerous currencies which underlie the reported trading results, where even within geographic segments, the Group trades in multiple currencies (“source currencies”). The constant exchange rate restatement has been calculated by adjusting the prior year’s reported results at the current year’s reported average exchange rates. Restating the prior year’s numbers provides illustrative comparability with the current year’s reported performance by adjusting the estimated effect of source currency movements.
The listing of average exchange rates against the Rand for the currencies contributing materially to the impact of exchange rate movements are set out below:
2016 average
rates
EUR – Euro 14,840 16,115 USD – US Dollar 13,612 14,575 AUD – Australia Dollar 10,261 10,607 JPY – Japanese Yen 0,125 0,126 CNY – Chinese Yuan Renminbi 1,999 2,258 MXN – Mexican Peso 0,700 0,837 BRL – Brazilian Real 4,198 3,950 GBP – British Pound 17,271 21,381 RUB – Russian Ruble 0,224 0,216
PLN – Polish Zloty 3,440 3,747
Revenue, other income, cost of sales and expensesFor purposes of the constant exchange rate report the prior year’s source currency revenue, cost of sales and expenses have been restated from the prior year’s relevant average exchange rate to the current year’s relevant reported average exchange rate.
Net interest paidNet interest paid is directly linked to the source currency of the borrowing on which it is levied and is restated from the prior year’s relevant reported average exchange rate to the current year’s relevant reported average exchange rate.
TaxThe tax charge for purposes of the constant currency report has been recomputed by applying the actual effective tax rate to the restated profit before tax for the relevant legal entity.
2017average
rates

Aspen Pharmacare Holdings Limited Annual Financial Statements 2017
119
Reported June 2016
(At 2016average
rates)R’billion
Change at reported
exchange rates
Illustrative constant
exchange rates (June 2016 at 2017 average
rates)R’billion
Change atconstant
exchange rates
Revenue 41,2 35,6 16% 33,8 22%Gross profit 19,9 17,9 11% 17,2 16%Normalised EBITDA 11,4 10,1 13% 9,7 18%Operating profit 8,3 9,0 (7%) 8,6 (4%)Normalised headline earnings 6,7 5,8 16% 5,5 21%
Earnings per share (cents) 1 123,4 945,4 19% 904,1 24%Headline earnings per share (cents) 1 299,5 889,0 46% 847,6 53%Normalised headline earnings per share (cents) 1 463,2 1 263,7 16% 1 210,9 21%
Reported June 2016
(At 2016 average
rates)%
Currency mixRevenueEUR – Euro 26 30ZAR – South African Rand 20 21AUD – Australia Dollar 14 17USD – US Dollar 11 10JPY – Japanese Yen 5 2CNY – Chinese Yuan Renminbi 4 –MXN – Mexican Peso 3 4BRL – Brazilian Real 3 2GBP – British Pound 2 2RUB – Russian Ruble 2 2PLN – Polish Zloty 1 1Other currencies 9 9Total 100 100Gross profitEUR – Euro 28 26ZAR – South African Rand 22 27AUD – Australia Dollar 18 22USD – US Dollar (11) (3)JPY – Japanese Yen 8 3CNY – Chinese Yuan Renminbi 7 –MXN – Mexican Peso 2 4BRL – Brazilian Real 4 3GBP – British Pound 2 –RUB – Russian Ruble 3 3PLN – Polish Zloty 2 3Other currencies 15 12Total 100 100
ReportedJune 2017
(At 2017average
rates)R’billion
ReportedJune 2017
(At 2017average
rates)%

120 Aspen Pharmacare Holdings Limited Annual Financial Statements 2017
Illustrative constant exchange rate report – Annexure 1 continued
Reported June 2016
(At 2016 average
rates)%
Normalised EBITDAEUR – Euro 36 26ZAR – South African Rand 23 30AUD – Australia Dollar 20 26USD – US Dollar (26) (12)JPY – Japanese Yen 11 3CNY – Chinese Yuan Renminbi 9 –MXN – Mexican Peso – 2BRL – Brazilian Real 4 2GBP – British Pound – 1RUB – Russian Ruble 4 4PLN – Polish Zloty 3 4Other currencies 16 14Total 100 100
ReportedJune 2017
(At 2017average
rates)%

Aspen Pharmacare Holdings Limited Annual Financial Statements 2017
121
Reported June 2016
(At 2016 average
rates)R’billion
Illustrative constant
exchange rate June 2016 (June 2016
at 2017 average rates)
R’billion
Change at constant exchange
rates
Commercial pharmaceuticals by customer geography 31,4 25,4 24,2 30%Sub-Saharan Africa 7,4 7,1 7,0 6%Developed Europe 6,8 6,1 5,7 21%Australasia 4,8 4,7 4,5 7%Latin America 2,7 2,0 1,9 46%Developing Europe & CIS 2,6 2,3 2,3 16%Japan 1,9 0,7 0,6 >100%China 1,8 – – >100%Other Asia 1,2 0,9 0,9 50%MENA 1,1 0,9 0,7 36%USA & Canada 1,1 0,7 0,6 69%
Manufacturing revenue by geography of manufactureManufacturing revenue – finished dose form 2,2 2,3 2,2 –Sub-Saharan Africa 1,0 0,5 0,8 27%Developed Europe 0,7 0,9 0,9 (25%)Australasia 0,5 0,9 0,5 –Manufacturing revenue – active pharmaceutical ingredients 4,4 4,4 4,1 9%Developed Europe 4,0 4,0 3,7 9%Sub-Saharan Africa 0,4 0,4 0,4 12%
Total manufacturing revenue 6,6 6,7 6,3 6%
Total pharmaceuticals 38,0 32,1 30,5 25%
Nutritionals by customer geography 3,2 3,5 3,3 (3%)Latin America 1,4 1,5 1,4 5%Sub-Saharan Africa 1,0 1,0 0,9 4%Australasia 0,8 1,0 1,0 (21%)
Total revenue 41,2 35,6 33,8 22%
Summary of regionsSub-Saharan Africa 9,8 9,4 9,1 8%Developed Europe 11,5 11,0 10,3 13%Australasia 6,1 6,2 6,0 1%Latin America 4,1 3,4 3,3 29%Developing Europe & CIS 2,6 2,4 2,3 16%Japan 1,9 0,7 0,6 >100%China 1,8 – – >100%Other Asia 1,2 0,9 0,9 50%MENA 1,1 0,9 0,7 36%USA & Canada 1,1 0,7 0,6 69%
Total revenue 41,2 35,6 33,8 22%
ReportedJune 2017
(At 2017average
rates)R’billion

122 Aspen Pharmacare Holdings Limited Annual Financial Statements 2017
Illustrative constant exchange rate report – Annexure 1 continued
Commercial pharmaceuticals therapeutic area analysis
Reported June 2017 (At 2017 average rates)
AnaestheticBrands
R’billion
Thrombosis Brands
R’billion
High Potency& Cytotoxic
BrandsR’billion
Therapeutic Focused
BrandsR’billion
Other Commercial
Pharmaceutical Brands
R’billionTotal
R’billion
By customer geographyCommercial PharmaceuticalsSub-Saharan Africa 0,1 – 0,1 0,2 7,2 7,4 Developed Europe 1,7 3,2 1,5 6,4 0,4 6,8 Australasia 0,6 – 0,5 1,1 3,7 4,8 Latin America 0,6 0,1 0,8 1,5 1,2 2,7 Developing Europe & CIS 0,3 1,7 0,5 2,5 0,1 2,6 Japan 1,3 – 0,4 1,7 0,2 1,9 China 1,5 0,3 – 1,8 – 1,8 Other Asia 0,4 0,2 0,3 0,9 0,3 1,2 MENA 0,2 0,2 0,3 0,7 0,4 1,1 USA & Canada 0,3 – 0,3 0,6 0,5 1,1
Total Commercial Pharmaceuticals 7,0 5,7 4,7 17,4 14,0 31,4
Reported June 2016 (At 2016 average rates)
Anaesthetic BrandsR’billion
Thrombosis Brands
R’billion
High Potency& Cytotoxic
BrandsR’billion
Therapeutic Focused
BrandsR’billion
Other Commercial
Pharmaceutical Brands
R’billionTotal
R’billion
By customer geographyCommercial PharmaceuticalsSub-Saharan Africa 0,1 – 0,1 0,2 6,9 7,1 Developed Europe – 4,0 1,8 5,8 0,4 6,2 Australasia – – 0,5 0,5 4,2 4,7 Latin America – 0,1 0,7 0,8 1,1 1,9 Developing Europe & CIS – 1,9 0,4 2,3 – 2,3 Japan – 0,1 0,5 0,6 0,1 0,7 Other Asia – 0,2 0,3 0,5 0,4 0,9 MENA – 0,1 0,3 0,4 0,5 0,9 USA & Canada – 0,1 0,4 0,5 0,2 0,7
Total Commercial Pharmaceuticals 0,1 6,5 5,0 11,6 13,8 25,4

Aspen Pharmacare Holdings Limited Annual Financial Statements 2017
123
Commercial pharmaceuticals therapeutic area analysis continued
Illustrative constant exchange rate June 2016 (June 2016 at 2017 average rates)
Anaesthetic BrandsR’billion
Thrombosis Brands
R’billion
High Potency& Cytotoxic
BrandsR’billion
Therapeutic Focused
BrandsR’billion
Other Commercial
Pharmaceutical Brands
R’billionTotal
R’billion
By customer geographyCommercial PharmaceuticalsSub-Saharan Africa 0,1 – 0,1 0,2 6,8 7,0 Developed Europe – 3,7 1,6 5,3 0,4 5,7 Australasia – – 0,5 0,5 4,0 4,5 Latin America – 0,1 0,7 0,8 1,1 1,9 Developing Europe & CIS – 1,8 0,4 2,2 0,1 2,3 Japan – – 0,5 0,5 0,1 0,6 Other Asia – 0,2 0,3 0,5 0,4 0,9 MENA – 0,1 0,2 0,3 0,4 0,7 USA & Canada – 0,1 0,4 0,5 0,1 0,6
Total Commercial Pharmaceuticals 0,1 6,0 4,7 10,8 13,4 24,2
% change constant exchange rates
Anaesthetic Brands
Thrombosis Brands
High Potency& Cytotoxic
Brands
Therapeutic Focused
Brands
Other Commercial
Pharmaceutical Brands Total
By customer geographyCommercial PharmaceuticalsSub-Saharan Africa 35% 35% 29% 33% 5% 6%Developed Europe >100% (14%) (9%) 20% 36% 21%Australasia >100% 9% 2% >100% (9%) 7%Latin America >100% 44% 25% >100% 6% 46%Developing Europe & CIS >100% (2%) 20% 17% 13% 16%Japan >100% (33%) (16%) >100% 67% >100%China >100% >100% 39% >100% >100% >100%Other Asia >100% 4% (3%) 98% (7%) 50%MENA >100% 25% 4% 69% 5% 36%USA & Canada >100% (83%) (20%) 22% >100% 69%
Total Commercial Pharmaceuticals >100% (5%) 0% 61% 4% 30%

124 Aspen Pharmacare Holdings Limited Annual Financial Statements 2017
Shareholder statistics (unaudited)
Analysis of shareholders at 30 June 2017Number of
shareholders% of
shareholdersNumber of
shares% of total
shareholding
Ordinary sharesSize of holding1 – 2 500 52 828 92,62 19 688 412 4,312 501 – 12 500 2 934 5,14 15 380 950 3,3712 501 – 25 000 460 0,81 8 103 268 1,7825 001 – 50 000 314 0,55 11 157 585 2,4450 001 and over 504 0,88 402 104 970 88,10
57 040 100,00 456 435 185 100,00
Major shareholdersInstitutional shareholdersAccording to the register of shareholders at 30 June 2017, the following are the top 10 registered institutional shareholders:
Number of shares
% of total shareholding
Institutional shareholderPublic Investment Corporation 43 851 608 9,61Foord Asset Management 20 294 923 4,45Coronation Asset Management 17 348 582 3,80Genesis Investment Management 16 541 699 3,62Harding Loevner Management 15 550 932 3,41BlackRock Inc. 14 177 070 3,11GIC Asset Management (Pte) Limited 13 602 696 2,98The Vangard Group Inc. 12 890 154 2,82Investec Securities (Pty) Limited 11 132 096 2,44Old Mutual Plc. 10 376 886 2,27
175 766 646 38,51
Top 10 beneficial shareholdersAccording to the register of shareholders at 30 June 2017, the following are the top 10 registered beneficial shareholders. The shareholdings of all directors are disclosed on page 114 of the Remuneration Report.
Number of shares
% of total shareholding
ShareholderSaad, SB 55 358 711 12,13Government Employees Pension Fund 54 132 089 11,86Attridge, MG 18 883 422 4,14Government of Singapore Investment Corporation 14 042 593 3,08Ceppwawu Investments (Pty) Limited 10 053 368 2,20Old Mutual Life Assurance Co Limited 6 982 054 1,53Vanguard Emerging Markets Stock Index Fd 6 722 385 1,47Foord Balanced Fund 6 051 884 1,33Saudi Arabian Monetary Agency 5 793 823 1,27Investment Solutions Limited 5 628 067 1,23
183 648 396 40,24
Shareholders’ spreadAs required by paragraph 8.63 and terms of paragraph of 4.25 of the JSE Listings Requirements, the spread of the ordinary shareholding at close of business 30 June 2017 was as follows:
Number of shareholders
Number of shares
% of total shareholding
Non-public shareholders 13 128 960 779 28,25 Directors of the Company and directors of material subsidiaries 11 74 418 451 16,30Government Employees Pension Fund 1 54 132 089 11,86Employee share trusts – treasury shares 1 410 239 0,09
Public shareholders 57 027 327 474 406 71,75
Total shareholding 57 040 456 435 185 100,00

Aspen Pharmacare Holdings Limited Annual Financial Statements 2017
125
● South Africa● USA● Singapore● UK● Ireland● Various other
2017
Bene�cial shareholders – country
66%
16%
3%3%
11%1%
● South Africa● USA● Singapore● UK● Ireland● Various other
2017
Institutional shareholders – country
53%
25%
11%
4%
5%2%
Top 10 bene�cial shareholders% shareholding
Investment Solutions
Saudi Arabian Monetary Agency
Foord
Vanguard
Old Mutual Life Assurance Company
Limited
Ceppwawu Investments (Pty)
Limited
Attridge, MG
Government of Singapore Investment
Corporation
Government Employees Pension
Fund
Saad, SB
■ 2016 ■ 2017
0,87
1,18
1,23
1,27
2,00
1,33
2,13
1,53
2,20
2,20
2,37
3,08
4,14
4,14
11,16
11,86
12,13
12,13
0,99
1,47
Top 10 institutional shareholders% shareholding
Old Mutual Investment Group
Investec Securities
Vanguard
BlackRock
Genesis Investment Management
Harding Loevner Management
Coronation Asset Management
Government of Singapore Investment
Corporation
Foord Asset Management
Public Investment Corporation
1,02
1,25
2,27
2,44
2,33
2,82
2,99
3,11
1,80
3,41
2,96
3,62
1,14
3,80
4,25
4,45
9,98
9,61
2,29
2,98
■ 2016 ■ 2017
The geographical split of Beneficial and Institutional Shareholders above is based on shareholders who own more that 25 000 Aspen shares.
Percentages for Top 10 Beneficial Shareholders and Top 10 Institutional Shareholders reflected above are as a percentage of the total issued
share capital of the Company.

126 Aspen Pharmacare Holdings Limited Annual Financial Statements 2017
Administration
Company Secretary & Group Governance OfficerRiaan Verster
BProc, LLB, LLM (Labour Law)
Registered office and postal address Building Number 8, Healthcare Park, Woodlands Drive, Woodmead
PO Box 1587, Gallo Manor, 2052
Telephone +27 11 239 6100
Telefax +27 11 239 6144
Registration number1985/002935/06
Share codeAPN ISIN: ZAE 000066692
Website addresswww.aspenpharma.com
AuditorsPricewaterhouseCoopers Inc.
SponsorsInvestec Bank Limited
Transfer secretariesTerbium Financial Services (Pty) Limited
31 Beacon Road, Florida North, 1709, Johannesburg
PO Box 61272, Marshalltown, 2107
Telephone 0860 104191
Email [email protected]

Aspen Pharmacare Holdings Limited Annual Financial Statements 2017
127
Abbreviations
AGI Aspen Global Incorporated, a subsidiary incorporated in Mauritius
Notre Dame de Bondeville
Aspen Notre Dame de Bondeville S.A.S., a wholly owned subsidiary incorporated in France
Annual Financial Statements
The Group and Company Annual Financial Statements for the year ended 30 June 2017
API Active pharmaceutical ingredient
A&R Co Audit & Risk Committee
ARV Anti-retroviral
Aspen and/or Group
Aspen Pharmacare Holdings Limited and/or its subsidiaries as set out in note 25 to the Company financial statements, as the context demands
Aspen Holdings or the Company
Aspen Pharmacare Holdings Limited
Aspen API Aspen API Incorporated, a wholly owned subsidiary of AGI incorporated in the United States
Aspen Australia Aspen Australia comprises Aspen Asia Pacific (Pty) Limited (a wholly owned subsidiary of AGI) and its subsidiaries, including Aspen Pharmacare Australia (Pty) Limited, Aspen Pharma (Pty) Limited, Orphan Holdings (Pty) Limited, Orphan Australia (Pty) Limited, Aspen Lennon (Pty) Limited and Aspen Products (Pty) Limited
Aspen BO Aspen Bad Oldesloe GmbH, a wholly owned subsidiary incorporated in Germany
Aspen Brazil Aspen Pharma – Indústria Farmacêutica Limitada, a wholly owned subsidiary of PharmaLatina Holdings incorporated in Brazil
Aspen Europe Aspen Europe GmbH, a wholly owned subsidiary of AGI incorporated in Germany
Aspen Japan Aspen Japan KK, a wholly owned subsidiary of AGI incorporated in Japan
Aspen Mexico Aspen Mexico comprises Aspen Labs S.A. de C.V, Aspen Pharma Mexicana S. de R.L. C.V, Solara S.A. de C.V., Aspen Servicios S. de R.L. de C.V., PN North America S. de R.L. de C.V., Wyeth Ilaclari S. de R.L. de C.V., Wyeth S. de R.L. de C.V., Marcas WN S.A. de C.V.
Aspen Nigeria Aspen Pharmacare Nigeria Limited, a subsidiary incorporated in Nigeria
Aspen Oss Aspen Oss B.V., a subsidiary incorporated in the Netherlands
Aspen Venezuela Aspen Venezuela C.A. and Aspen Venezuela S.A.
AstraZeneca AstraZeneca AB and AstraZeneca UK
BBBEE Broad-Based Black Economic Empowerment
BBBEE Codes The Department of Trade and Industry’s BBBEE Codes of Good Practice
CAGR Compound annual growth rate
CDP Carbon disclosure project
CER Constant exchange rate
CGMP Current good manufacturing practice
CHP Combined heat and power
CIS The Commonwealth of Independent States, comprising Russia and the former Soviet Republics
Classic brands A portfolio of 25 established prescription-branded products acquired from GSK
DIFR Disabling incident frequency ratio
EBITA Operating profit before amortisation adjusted for specific non-trading items as set out in the segmental analysis contained in the Annual Financial Statements
ERM Environmental Resources Management (Pty) Limited
FCC Fine Chemicals Corporation (Pty) Limited
FDF Finished dose form
Global brands Branded products owned by Aspen Global and distributed into multiple territories
GMP Good Manufacturing Practice
GRI Global Reporting Initiative
GSK GlaxoSmithKline Plc
HEPS Headline earnings per share
HCP Healthcare professional
HPC Hydroxyprogesterone Caproate
IFRS International Financial Reporting Standards
IMS IMS Health (Pty) Limited, a leading provider of healthcare and pharmaceutical market intelligence
Internal Audit The Aspen Group Internal Audit function

128 Aspen Pharmacare Holdings Limited Annual Financial Statements 2017
Abbreviations continued
IP Intellectual property
ISO 14001 International standard for environmental management systems
JSE JSE Limited, licensed as an exchange under the Security Services Act, No 36 of 2004
Kama Kama Industries Limited, a subsidiary incorporated in Ghana
King III King Report on Corporate Governance for South Africa 2009
King IV King Report on Corporate Governance for South Africa 2016
KPAs Key performance areas
KPIs Key performance indicators
Litha Litha Pharma (Pty) Limited
LWDFR Lost work day frequency ratio
Mandela Day The Nelson Mandela International Day
MENA Middle East and North Africa
MSD Merck Sharpe & Dohme
NHEPS Normalised headline earnings per share
NZNM New Zealand New Milk Limited
OECD Organisation for Economic Cooperation and Development
OHSAS 18001 International standard for occupational health and safety management
OTC Over the counter
Pharmacare Pharmacare Limited
PHEF The South African Public Healthcare Enhancement Fund
PPE Property, plant and equipment
PwC PricewaterhouseCoopers Incorporated
R&N Co Remuneration & Nomination Committee
S&E Co Social & Ethics Committee
SED Socio-economic development
SEP Single exit pricing
SHE Safety, health and environment
Shelys Shelys Pharmaceuticals Limited, incorporated in Tanzania
Shelys Africa Comprises Shelys Africa Limited, Shelys Pharmaceuticals Limited, Shelys Pharmaceuticals International Limited, Beta Healthcare Kenya Limited and Beta Healthcare (Uganda) Limited
SKU Stock keeping unit
SRI The JSE’s Socially Responsible Index
SSA Sub-Saharan Africa
Supplementary Documents
The Unabridged Corporate Governance Report including the reports of the A&R and S&E Committees, the Sustainability Data Supplement and the Annual Financial Statements
TesoRx TesoRx Pharma LLC
The SSA Collaboration
The GSK Aspen Healthcare for Africa Collaboration
The Companies Act
The South African Companies Act, No 71 of 2008
UN Global Compact
United Nations Global Compact
WHO World Health Organisation
USA United States of America
AUD Australian Dollar
EUR Euro
GBP British Pound
R/ZAR South African Rand
USD United States Dollar

DisclaimerWe may make statements that are not historical facts and relate to analyses and other information based on forecasts of future results and estimates of amounts not yet determinable. These are forward looking statements as defined in the U.S. Private Securities Litigation Reform Act of 1995. Words such as “prospects”, “believe”, “anticipate”, “expect”, “intend”, “seek”, “will”, “plan”, “indicate”, “could”, “may”, “endeavour” and “project” and similar expressions are intended to identify such forward looking statements, but are not the exclusive means of identifying such statements. By their very nature, forward looking statements involve inherent risks and uncertainties, both general and specific, and there are risks that predictions, forecasts, projections and other forward looking statements will not be achieved. If one or more of these risks materialise, or should underlying assumptions prove incorrect, actual results may be very different from those anticipated. The factors that could cause our actual results to differ materially from the plans, objectives, expectations, estimates and intentions expressed in such forward looking statements are discussed in each year’s Annual Report. Forward looking statements apply only as of the date on which they are made, and we do not undertake other than in terms of the Listings Requirements of the JSE Limited, any obligation to update or revise any of them, whether as a result of new information, future events or otherwise.

www.aspenpharma.com
Aspen Holdings Head OfficeDurban, South AfricaAspen Place9 Rydall Vale ParkDouglas Saunders DriveLa Lucia RidgeTel: +27 31 580-8600
Asp
en P
harm
acare Ho
ldin
gs Limited
Annual Financial Statem
ents 2017