annual financial report 2019 - mcc
TRANSCRIPT
1
Annual Financial Report 2019

2
Contents
Introduction 4
Composition of the Corporate Bodies 5
Report on Operations
2019 in brief
Economic data and performance indicators 8
Equity data and performance indicators 9
The macroeconomic scenario and the lending system 10
Results for the year 11
Economic results 11
Financial aggregates 16
The business 24
Operating structure 30
Corporate Governance 32
Non-financial disclosure 43
Other information 58
Significant subsequent events 58
Business outlook 59
Proposed allocation of net income for the period 60
Accounting statements
Balance Sheet 62
Income Statement 63
Statement of comprehensive income 64
Statement of changes in shareholders' equity 65
Statement of Cash Flows 67
Notes to the Financial Statements
Part A – Accounting policies 70
Part B – Information on the balance sheet 114
Part C – Information on the income statement 154

3
Part D – Comprehensive Income 175
Part E – Information on risks and relative hedging policies 178
Part F – Information on capital 231
Part H – Transactions with related parties 236
Part L – Segment reporting 243
Part M – Leasing information 245
Country-by-country reporting (Art. 89 Directive 2013/36/EU) 247
Attestation of the separate financial statements
under the terms of Article 81-ter of CONSOB Regulation
11971 of 14 May 1999, as amended 249

4
Introduction
The Financial Statements of Mediocredito Centrale, in application of Italian Legislative
Decree 38 of 28 February 2005 and of Italian Legislative Decree 136 of 18 August 2015,
have been drawn up according to the IAS/IFRS accounting standards issued by the
International Accounting Standards Board (IASB) and the related interpretation documents
of the International Financial Reporting Interpretations Committee (IFRIC), endorsed by
the European Commission, as established by Community Regulation no. 1606 of 19 July
2002.
The financial statements at 31 December 2019 have been prepared on the basis of the
“Instructions for Drafting the Financial Statements of Banks” issued by the Bank of Italy
with its provision of 22 December 2005, with which Circular no. 262/05 was issued, and
subsequent updates.
These instructions establish the format of the Financial Statements and the related
preparation methods, as well as the content of the Notes to the Financial Statements.
The Separate Financial Statements are made up of the Balance Sheet, the Income
Statement, the Statement of Comprehensive Income, the Statement of Changes in
Shareholders’ Equity, the Statement of Cash Flows and the Notes to the Financial
Statements, and they are also accompanied by a Report on Operations outlining, on the
economic results achieved and on the Bank’s equity and financial situation.
In support of the comments on the results for the period, the Report on Operations
presents and illustrates the reclassified income statement and balance sheet.
On the Bank’s website (at: www.mcc.it) the financial reports and the press releases
published in the period are available, together with other financial documentation.

5
Composition of the Corporate Bodies
Board of Directors
Chairperson Massimiliano Cesare
Chief Executive Officer Bernardo Mattarella
Director Pasquale Ambrogio
Director Leonarda Sansone
Director Gabriella Forte
Board of Statutory Auditors
Chairperson Paolo Palombelli
Regular Auditor Carlo Ferocino
Regular Auditor Marcella Galvani
Alternate Auditor Roberto Micolitti
Alternate Auditor Sofia Paternostro
* * *
Auditing Firm PricewaterhouseCoopers S.p.A.
Financial Reporting Manager Elena De Gennaro

6
Report on Operations

7
2019 in brief

8
Economic data and performance indicators
31.1
25.0
56.154.7
Titolo asse
48.847.4
22.031.2
44.136.4
12.211.3
Net interest income
Net fees and commissions
Net banking and insurance income
Operating profit/(loss)
Net operating profit/(loss)
-6.9 -21
Reclassified income statement (millions of euro)Changes
Amount %
-1.4 -3
0.2 0
-1.4 -3
9.2 41
-7.7 -18
0.9 -7
88.388.5
24.129.1
20.2
22.5
Gross profit from continuing operations
Net income for the period
5.0 21
2.3 -11
of which: interest income
of which: interest expense
63.5
61.8
36.128.3
8.38.4
Cost/Income (net of expense recoveries)
Net gains(losses)/Average shareholders' equity (ROE)
Net interest income/Net banking and insurance income
Net fees and commissions/Net banking and insurance income
Profitability indicators (%)
1.00.9
Net income/Total assets
44.7
46.4
31.12.2019
31.12.2018
9
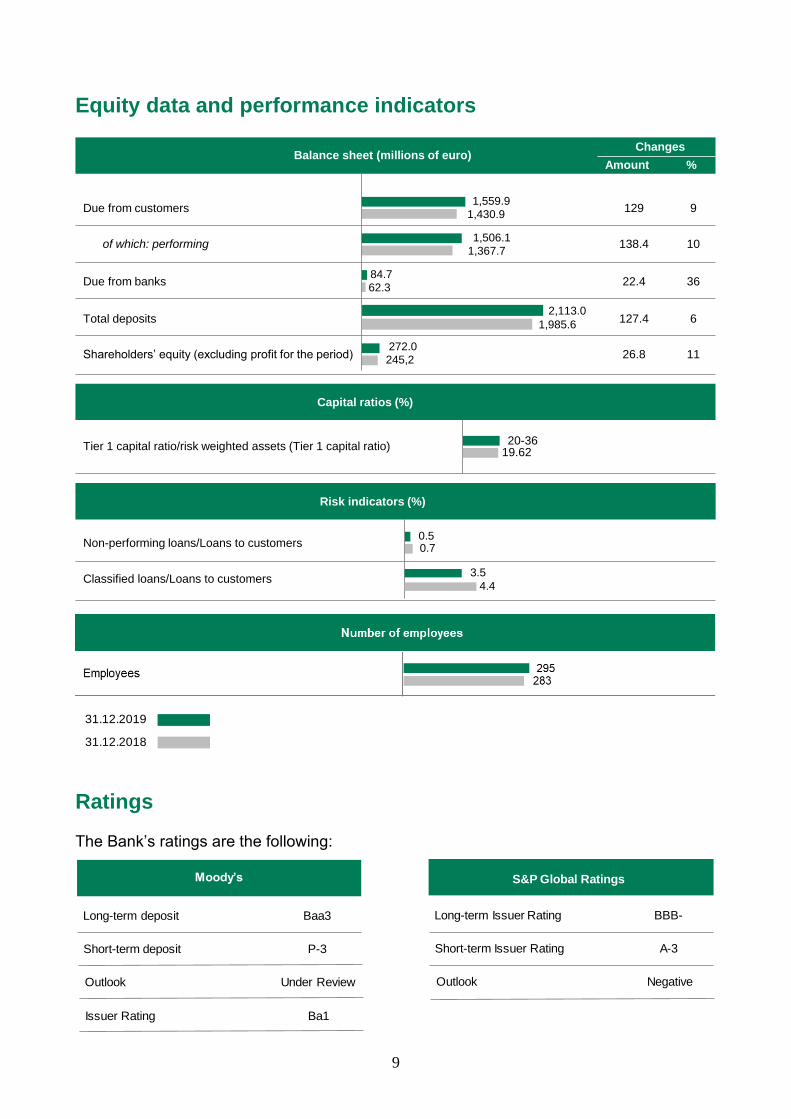
Equity data and performance indicators
Balance sheet (millions of euro)
1,430.9
1,559.9
62.384.7
1,367.71,506.1
245,2272.0
Due from customers
of which: performing
Due from banks
Total deposits
Shareholders’ equity (excluding profit for the period)
129 9
138.4 10
22.4 36
127.4 6
26.8 11
1,985.6
2,113.0
Changes
Amount %
Tier 1 capital ratio/risk weighted assets (Tier 1 capital ratio)
Capital ratios (%)
19.6220-36
0.70.5
Non-performing loans/Loans to customers
Classified loans/Loans to customers
Risk indicators (%)
4.4
3.5
31.12.2019
31.12.2018
Ratings
The Bank’s ratings are the following:
Moody’s
Long-term deposit Baa3
Short-term deposit P-3
Outlook Under Review
Issuer Rating Ba1
S&P Global Ratings
Long-term Issuer Rating BBB-
Short-term Issuer Rating A-3
Outlook Negative

10
The macroeconomic scenario and the lending system
Uncertainties continue in Italy also due to the slowing seen both in Europe and generally.
Signals coming from indicators are contradictory.
In fact, on one hand the conditions on the financial and lending markets have improved
and investor confidence has improved, as can be seen by the significant purchases of
public securities by non-residents and the considerable drop in the relative returns and
interest differentials with regards to the Bund.
Nonetheless, preliminary ISTAT estimates indicate a 0.3% decrease in GDP with respect
to the 4th quarter of 2018, also due to unfavourable changes in the most erratic
components of final demand, held up by a positive change in household spending and in
inventories, mitigating the foreign component which saw a decisive drop.
Bank of Italy projections published in January’s economic bulletin suggest limited growth
after the lack of change seen in 2019, but much higher in the coming two years.
Much will depend on international trade disputes, geopolitical tensions, future economic
relationships between the European Union and the United Kingdom as well as possible
impacts on the Chinese economy deriving from the spread of the coronavirus, given its
status as one of the main motors driving global growth.
In terms of financial markets, the return differential between Italian 10-year government
securities and the corresponding German bonds is still nearly two times that seen in Spain
and Portugal, at 140 basis points.
The reduction in the rate applied to bank deposits in the Eurosystem was transferred to
short-term market returns and a recovery of net purchases of financial assets put
downward pressure on long-term returns.
In the banking sector, credit quality continues to improve while the inflow of new impaired
loans remains constant.
Profitability has increased with respect to the same period the previous year, and as noted
in a recent interview with the Governor of the Bank of Italy, net of extraordinary
components, ROE rose on average from 5.8% to 6.6% during the first nine months of
2019.

11
In a situation of modest revenue growth, with net interest income continuing to make a
small contribution, with fee components contributing more, in order to maintain expected
profitability, which Prometeia estimates suggest will not be likely to exceed 5% in 2022,
reductions in operating expenses and in the cost of risk will be the determining factors in
maintaining expected profitability, thanks to controlling credit quality and a lower need for
extraordinary writedowns on impaired items.
Results for the year
Economic results
Net profit in 2019, totalling 22.5 million, +11% with respect to 2018 and well in line with the
budget approved by the Board of Directors on 14 February 2019, outlines the Bank’s
trends through:
a) net banking and insurance income substantially in line with the previous year,
totalling 88.5 million (88.3 million at 31.12.2018), showing a decrease in net interest
income despite development of lending, given the continuing spread levels applied
to customers with ever lower margins for segments with greater creditworthiness, a
decrease in commissions generated by the Guarantee Fund due to operational
slowdowns after the Reform took effect on 15 March, mitigated by the greater
contribution made by profits deriving from management of the securities portfolio
(8.8 at 31.12.2019 compared to 0.3 at 31.12.2018), thanks to the temporary
reduction in the third quarter of 2019 of the differential between Italian and German
ten-year securities;
b) the normalisation of credit risk adjustments, mainly attributable to the impaired
portfolio, compared to the “extraordinary” figure recorded in 2018. On a net basis,
the impact of the impaired portfolio fell again from 4.7% to 3.7%, while the coverage
rate rose to 60%, compared to 53.3% at the end of 2018. These adjustments
include the valuation done relative to the € 12 million subscription on 20.12.2019 of
a subordinate bond loan (Banca Carige 2019-2029, fixed rate Tier II, with a total
nominal value of 200 million), issued as part of a complex transaction to strengthen
the capital for the Ligurian bank, which saw the departure of the government
appointed commissioner on 31 January 2020;
12
c) tax benefits, in terms of a lower tax load (3.2 million vs. 3.9 at 31.12.2018) due to
the so-called Patent Box, following the Revenue Agency's acceptance of the
request for subsidised income taxation for 2015-2019.
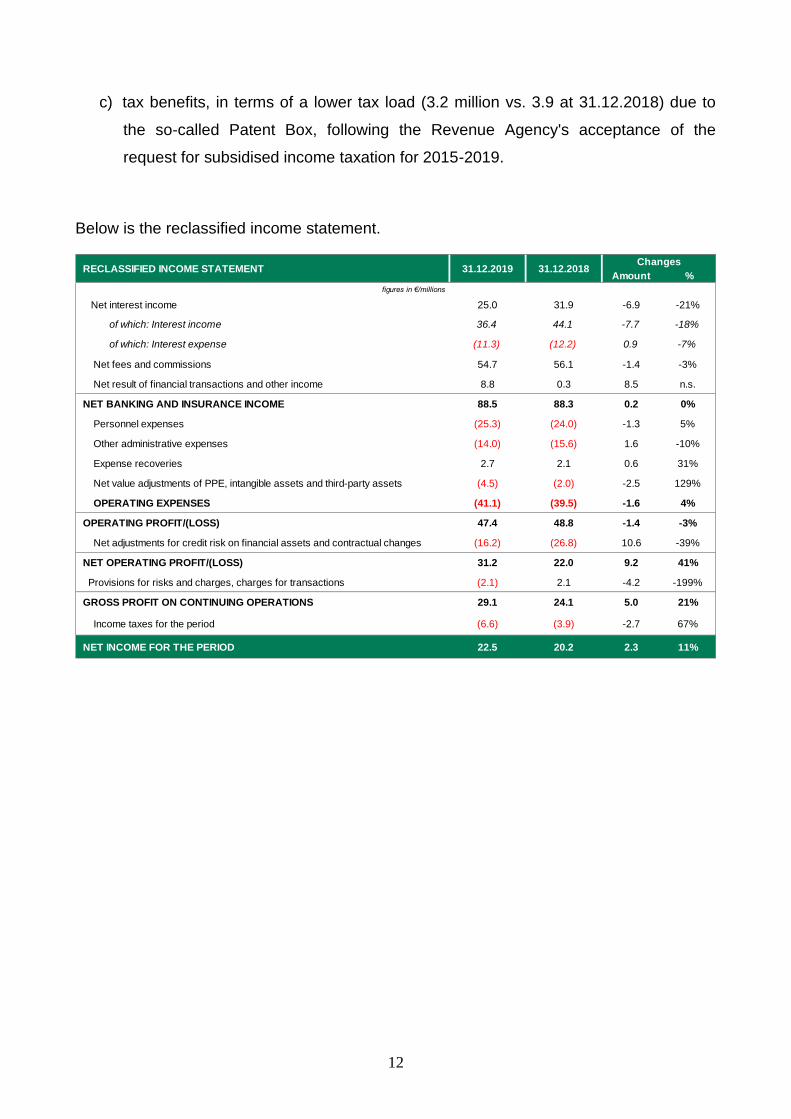
Below is the reclassified income statement.
Amount %
figures in €/millions
Net interest income 25.0 31.9 -6.9 -21%
of which: Interest income 36.4 44.1 -7.7 -18%
of which: Interest expense (11.3) (12.2) 0.9 -7%
Net fees and commissions 54.7 56.1 -1.4 -3%
Net result of financial transactions and other income 8.8 0.3 8.5 n.s.
NET BANKING AND INSURANCE INCOME 88.5 88.3 0.2 0%
Personnel expenses (25.3) (24.0) -1.3 5%
Other administrative expenses (14.0) (15.6) 1.6 -10%
Expense recoveries 2.7 2.1 0.6 31%
Net value adjustments of PPE, intangible assets and third-party assets (4.5) (2.0) -2.5 129%
OPERATING EXPENSES (41.1) (39.5) -1.6 4%
OPERATING PROFIT/(LOSS) 47.4 48.8 -1.4 -3%
Net adjustments for credit risk on financial assets and contractual changes (16.2) (26.8) 10.6 -39%
NET OPERATING PROFIT/(LOSS) 31.2 22.0 9.2 41%
Provisions for risks and charges, charges for transactions (2.1) 2.1 -4.2 -199%
GROSS PROFIT ON CONTINUING OPERATIONS 29.1 24.1 5.0 21%
Income taxes for the period (6.6) (3.9) -2.7 67%
NET INCOME FOR THE PERIOD 22.5 20.2 2.3 11%
RECLASSIFIED INCOME STATEMENT 31.12.2019 31.12.2018Changes

13
Net banking and insurance income
Amount %
figures in €/millions
Net interest income 25.0 31.9 -6.9 -21%
of which: Interest income 36.4 44.1 -7.7 -18%
of which: Interest expense (11.3) (12.2) 0.9 -7%
Net fees and commissions 54.7 56.1 -1.4 -3%
Net result of financial transactions and other income 8.8 0.3 8.5 n.s.
Total 88.5 88.3 0.2 0%
NET BANKING AND INSURANCE INCOME 31/12/2019 31/12/2018Changes
Net banking and insurance income shows:
• a lower contribution from net interest income (-21%), due to the continuation of the
smaller spread applied to customers, not yet compensated for by new disbursements;
• a decrease in net fees and commissions (-2.6% with respect to 2018) due to the
slowdown in operations by the National Guarantee Fund in the months immediately
before the reform decree took effect on 15 March 2019, which among other things
introduced a business creditworthiness evaluation model, with the possibility of defining
probability of default for the final beneficiary, restructuring guarantee measures
inversely to borrower riskiness, and the introduction of specific rules for transactions
against investments. During 2019, the National Guarantee Fund saw a slight decrease
of -3.4% in terms of requests granted, guaranteeing a volume of loans totalling 19.4
billion (+0.9% over 2018), of which 5,346.9 million to companies in southern Italy (-
1.4% with respect to 2018);
• profits from disposal of financial assets totalling 9 million (0.3 million at 31.12.2018) due
to the release and subsequent reinvestment of the bank’s portfolio of securities,
benefiting from the decrease in the spread between the BTP and Bund seen in the third
quarter of the year.
14
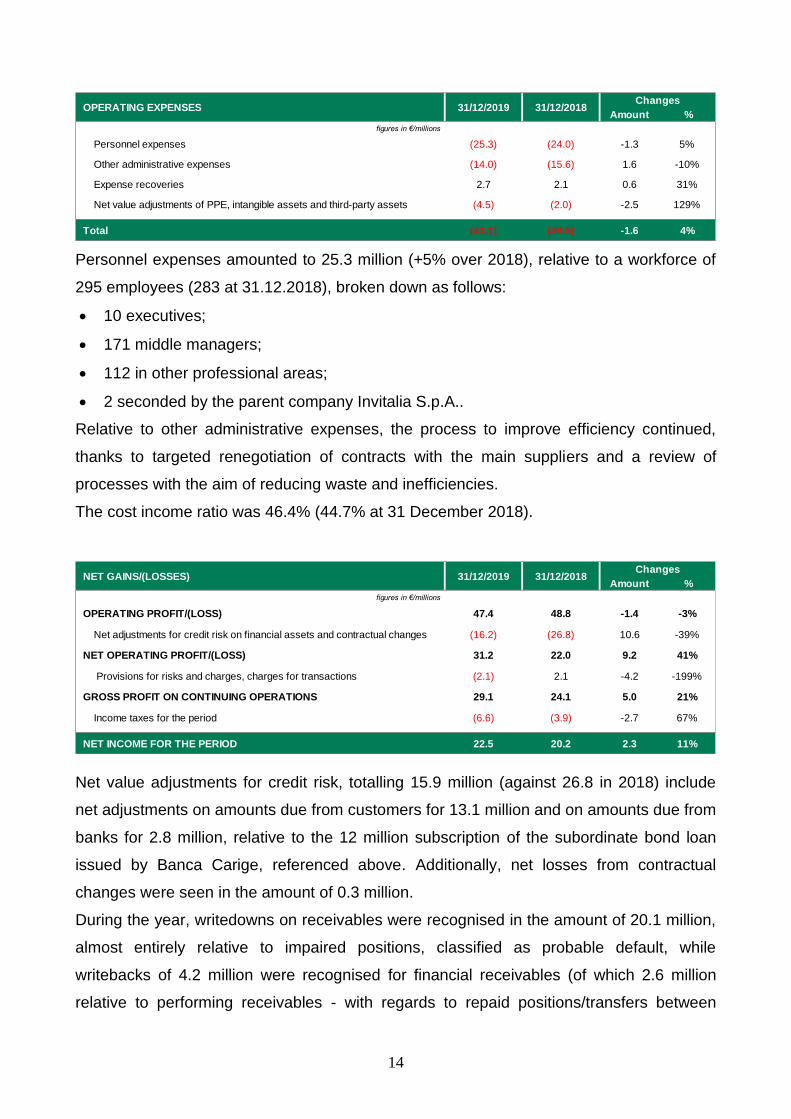
Amount %
figures in €/millions
Personnel expenses (25.3) (24.0) -1.3 5%
Other administrative expenses (14.0) (15.6) 1.6 -10%
Expense recoveries 2.7 2.1 0.6 31%
Net value adjustments of PPE, intangible assets and third-party assets (4.5) (2.0) -2.5 129%
Total (41.1) (39.5) -1.6 4%
OPERATING EXPENSES 31/12/2019 31/12/2018Changes
Personnel expenses amounted to 25.3 million (+5% over 2018), relative to a workforce of
295 employees (283 at 31.12.2018), broken down as follows:
• 10 executives;
• 171 middle managers;
• 112 in other professional areas;
• 2 seconded by the parent company Invitalia S.p.A..
Relative to other administrative expenses, the process to improve efficiency continued,
thanks to targeted renegotiation of contracts with the main suppliers and a review of
processes with the aim of reducing waste and inefficiencies.
The cost income ratio was 46.4% (44.7% at 31 December 2018).
Amount %
figures in €/millions
OPERATING PROFIT/(LOSS) 47.4 48.8 -1.4 -3%
Net adjustments for credit risk on financial assets and contractual changes (16.2) (26.8) 10.6 -39%
NET OPERATING PROFIT/(LOSS) 31.2 22.0 9.2 41%
Provisions for risks and charges, charges for transactions (2.1) 2.1 -4.2 -199%
GROSS PROFIT ON CONTINUING OPERATIONS 29.1 24.1 5.0 21%
Income taxes for the period (6.6) (3.9) -2.7 67%
NET INCOME FOR THE PERIOD 22.5 20.2 2.3 11%
NET GAINS/(LOSSES) 31/12/2019 31/12/2018Changes
Net value adjustments for credit risk, totalling 15.9 million (against 26.8 in 2018) include
net adjustments on amounts due from customers for 13.1 million and on amounts due from
banks for 2.8 million, relative to the 12 million subscription of the subordinate bond loan
issued by Banca Carige, referenced above. Additionally, net losses from contractual
changes were seen in the amount of 0.3 million.
During the year, writedowns on receivables were recognised in the amount of 20.1 million,
almost entirely relative to impaired positions, classified as probable default, while
writebacks of 4.2 million were recognised for financial receivables (of which 2.6 million
relative to performing receivables - with regards to repaid positions/transfers between

15
stages, and 1.6 million of writebacks relative to impaired receivables - of which 0.3 due to
amounts collected).
Net provisions for risks and charges of 2.1 million include:
a) net writedowns of 1.1 million relative to valuation of commitments to disburse loans;
b) provisioning of around 1 million relative to the provision for redundancies, following
the resolution made by the Board of Directors on 20 February 2020.
16
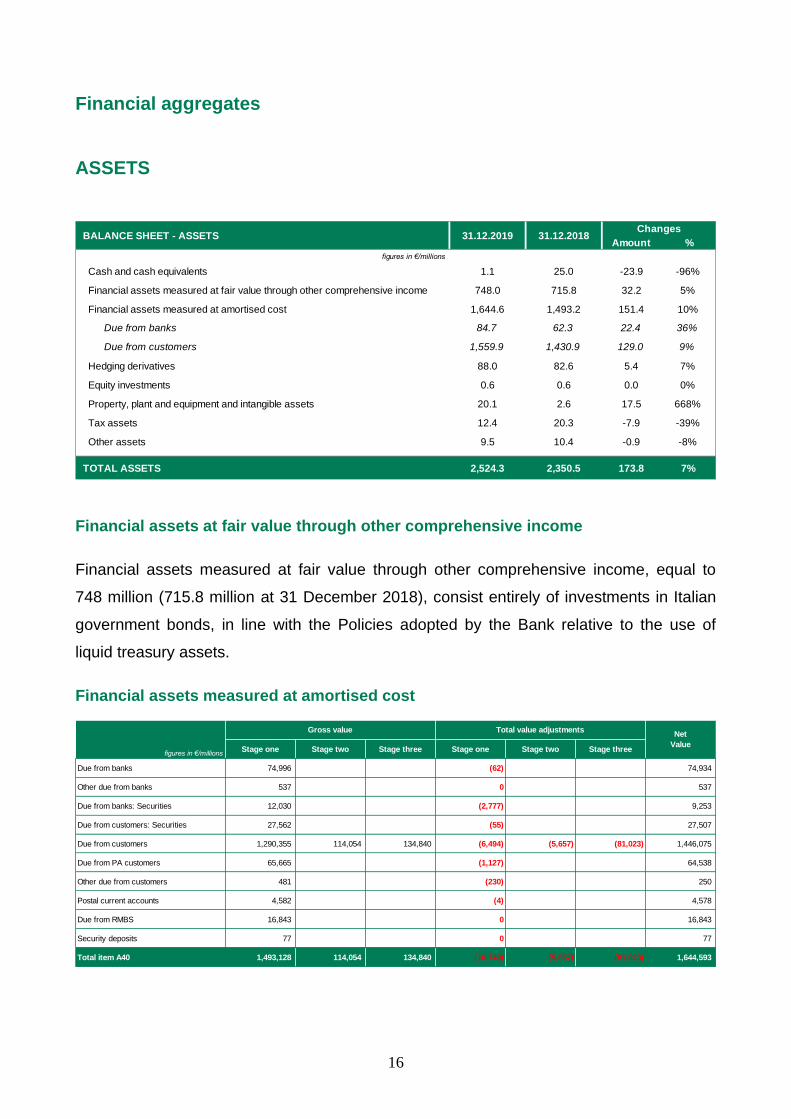
Financial aggregates
ASSETS
Amount %
figures in €/millions
Cash and cash equivalents 1.1 25.0 -23.9 -96%
Financial assets measured at fair value through other comprehensive income 748.0 715.8 32.2 5%
Financial assets measured at amortised cost 1,644.6 1,493.2 151.4 10%
Due from banks 84.7 62.3 22.4 36%
Due from customers 1,559.9 1,430.9 129.0 9%
Hedging derivatives 88.0 82.6 5.4 7%
Equity investments 0.6 0.6 0.0 0%
Property, plant and equipment and intangible assets 20.1 2.6 17.5 668%
Tax assets 12.4 20.3 -7.9 -39%
Other assets 9.5 10.4 -0.9 -8%
TOTAL ASSETS 2,524.3 2,350.5 173.8 7%
BALANCE SHEET - ASSETS 31.12.2019 31.12.2018Changes
Financial assets at fair value through other comprehensive income
Financial assets measured at fair value through other comprehensive income, equal to
748 million (715.8 million at 31 December 2018), consist entirely of investments in Italian
government bonds, in line with the Policies adopted by the Bank relative to the use of
liquid treasury assets.
Financial assets measured at amortised cost
Stage one Stage two Stage three Stage one Stage two Stage three
Due from banks 74,996 (62) 74,934
Other due from banks 537 0 537
Due from banks: Securities 12,030 (2,777) 9,253
Due from customers: Securities 27,562 (55) 27,507
Due from customers 1,290,355 114,054 134,840 (6,494) (5,657) (81,023) 1,446,075
Due from PA customers 65,665 (1,127) 64,538
Other due from customers 481 (230) 250
Postal current accounts 4,582 (4) 4,578
Due from RMBS 16,843 0 16,843
Security deposits 77 0 77
Total item A40 1,493,128 114,054 134,840 (10,749) (5,657) (81,023) 1,644,593
figures in €/millions
Gross value Total value adjustmentsNet
Value

17
Due from banks
Amounts due from banks amounted to 84.7 million, compared to 62.3 million at 31
December 2018. The item consists of liquidity held in bank current accounts totalling 65.3
million (56.3 million at 31 December 2018), obligatory reserves of 9.6 million (5.5 million at
31 December 2018) and other receivables totalling 0.5 million (0.7 million at 31 December
2018). This sub-item also includes the Tier II subordinate bond loan issued by Banca
Carige S.p.A. and subscribed for 9.3 million by the Bank (net of credit risk adjustments).
Due from customers
This item, of 1,559.9 million (1,430.9 million at 31 December 2018) is made up of:
• loans to customers in the amount of 1,473.6 million (1,336.2 million at 31.12.2018),
consisting of gross loans for 1,566.8 million, of which performing, stage 1 and 2 equal
to 1,432 million (1,421.8 million at 31.12.2018) and adjustment provisions of 93.3
million, of which 81 million relative to impaired loans and 12.3 for performing loans
(85.6 million at 31.12.2018). Loans to customers include bonds subscribed during the
year, mainly through the basket bond mechanism, based on the issue of an ABS
guaranteed by a pool of minibonds, for € 27.5 million (gross value 27.6 million and
adjustment provisions for 0.1 million).
Non Performing Loans (with a gross value of 134.8 million and adjustment provisions of
81.0 million) of 53.8 million (against 63.2 million in 2018), accounting for 3.7% of total
financial receivables (against 4.7% in 2018). In particular, loans classified as Bad loans
totalled 7.6 million (0.5% of loans to customers), with a coverage rate of 73.3%. Loans
classified as Unlikely to pay totalled 46.2 million (3.1% of loans to customers), with a
coverage rate of 56.6%. There were no impaired past-due exposures.
The impact of the item "due from customers" relative to the total on a net basis is 3.4%
(from 4.4% at 31 December 2018).
• trade receivables due from public administrations for management of subsidised funds
of 64.5 million (against 66.6 million at 31 December 2018);
• current accounts open with Poste Italiane of 4.6 million (5.6 million at 31 December
2018);
• receivables claimed from the special purpose vehicle company MCC RMBS srl of 16.8
million (22.4 million at 31 December 2018), for collections recorded by the same during
18
the 4th quarter of 2019 as part of the securitisation transaction involving the Bank’s
mortgage loan portfolio, completed pursuant to Italian Law 130/99 during 2016.
• Security deposits and other net receivables total € 0.4 million.
Other asset items
The item “hedging derivatives” at 31 December 2019 was equal to 88.0 million, and
showed the fair value of derivatives established to hedge against interest rate risk relative
to Bank bond issues.
Equity investments total 0.6 million and derive from the 2017 subscription of 558,140
shares of the Istituto della Enciclopedia Italiana fondata da Giovanni Treccani, equal to
0.89% of the Institute's share capital.
Property, plant and equipment and intangible assets amount to € 20.2 million (2.6 million
at 31 December 2018) and include 1.9 million for investments in software, 0.4 million for
PPE relative to furniture, fixtures and hardware functional to the Bank’s operations and
17.9 million for rights of use relative to leases of properties (17.8 million) and long-term
rentals of vehicles (0.1 million), recognised in accordance with the new accounting
standard IFRS 16.
Tax assets came to 12.4 million (20.3 million at 31 December 2018), consisting entirely of
deferred tax assets (of which 8.2 million for adjustments on loans, 2.8 million for
allocations to provisions for risks and charges, 1.3 million for negative fair value changes
recognised in the securities valuation reserves and 0.1 million for other items).
Other assets total 9.5 million, substantially in line with respect to 31 December 2018 (10.3
million). The main figures included in the item at 31 December 2019 are costs incurred on
third-party assets (2.7 million), tax receivables (4.2 million), prepaid expenses (0.7 million),
receivables due from the parent company (0.4 million) and other receivables to be invoiced
and other items (1.5 million).

19
LIABILITIES
Amount %
figures in €/millions
Financial liabilities measured at amortised cost 2,113.0 1,985.6 127.4 6%
Due to banks 494.4 892.8 -398.4 -45%
Due to customers 1,161.4 796.1 365.3 46%
Securities issued 457.2 296.7 160.5 54%
Value adjustments of financial liabilities with macro-hedging 78.2 73.8 4.4 6%
Tax liabilities 1.0 0.1 0.9 795%
Other liabilities 24.0 15.8 8.2 51%
Employee severance benefits 3.1 3.2 -0.1 -1%
Provisions for risks and charges 8.3 6.6 1.7 26%
Reserves 67.5 40.7 26.8 66%
Share capital 204.5 204.5 0.0 0%
Net income for the period 22.5 20.2 2.3 11%
TOTAL LIABILITIES AND SHAREHOLDERS' EQUITY 2,524.3 2,350.5 173.8 7%
BALANCE SHEET - LIABILITIES 31.12.2019 31.12.2018Changes
Financial liabilities measured at amortised cost came to € 2,113.0 million (1,985.6 million
at 31 December 2018).
Amounts due to banks at 494.4 million, compared to 892.8 million at 31 December 2018,
can be broken down as follows:
Amount %
figures in €/millions
Open market transactions with ECB 320.5 396.8 (76.3) -19%
Time deposits guaranteeing hedging derivatives 86.5 87.3 (0.8) -1%
Time deposits and interbank loans from Italian banks 0.0 180.0 (180.0) -100%
Repurchase agreements 42.0 199.0 (157.0) -79%
EIB Funds 41.5 25.0 16.5 66%
Other items (amounts to be returned for pool operations) 3.8 4.6 (0.8) -18%
Total 494.4 892.8 (398.4) -45%
ChangesDUE TO BANKS 31.12.201831.12.2019
Amounts due to customers at 1,161.4 million, compared to 796.1 million at 31 December
2018 can be broken down as follows:
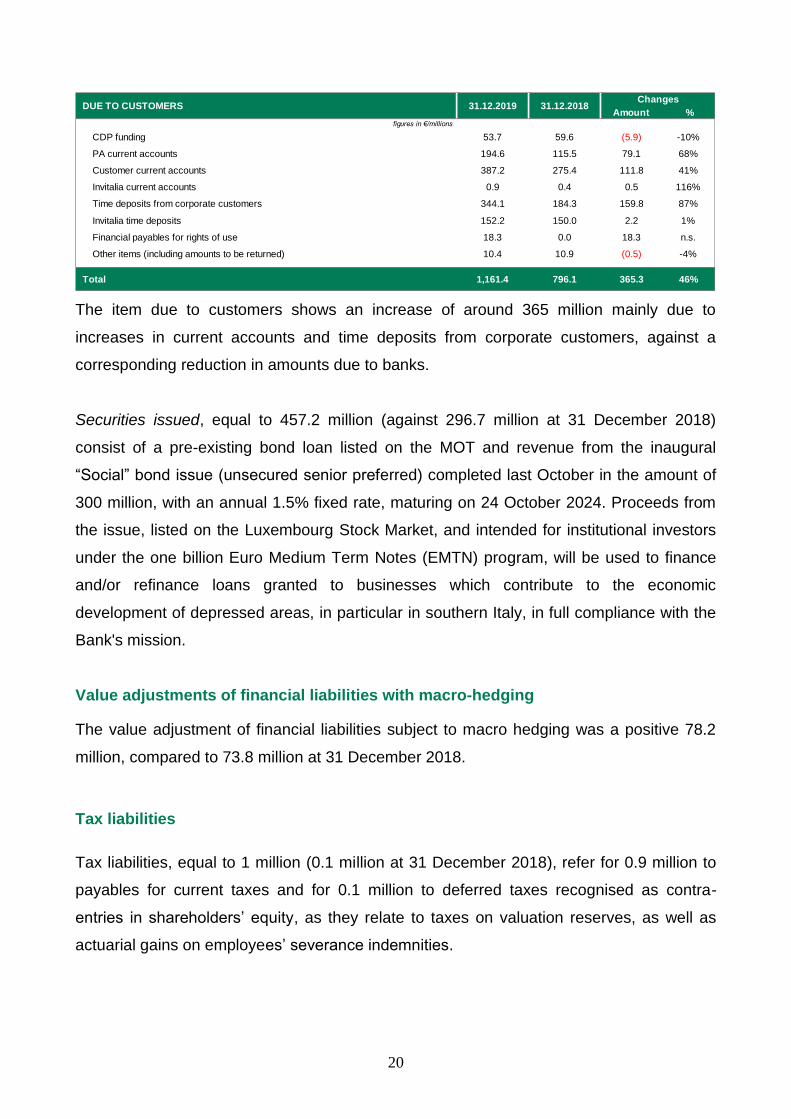
20
Amount %figures in €/millions
CDP funding 53.7 59.6 (5.9) -10%
PA current accounts 194.6 115.5 79.1 68%
Customer current accounts 387.2 275.4 111.8 41%
Invitalia current accounts 0.9 0.4 0.5 116%
Time deposits from corporate customers 344.1 184.3 159.8 87%
Invitalia time deposits 152.2 150.0 2.2 1%
Financial payables for rights of use 18.3 0.0 18.3 n.s.
Other items (including amounts to be returned) 10.4 10.9 (0.5) -4%
Total 1,161.4 796.1 365.3 46%
ChangesDUE TO CUSTOMERS 31.12.201831.12.2019
The item due to customers shows an increase of around 365 million mainly due to
increases in current accounts and time deposits from corporate customers, against a
corresponding reduction in amounts due to banks.
Securities issued, equal to 457.2 million (against 296.7 million at 31 December 2018)
consist of a pre-existing bond loan listed on the MOT and revenue from the inaugural
“Social” bond issue (unsecured senior preferred) completed last October in the amount of
300 million, with an annual 1.5% fixed rate, maturing on 24 October 2024. Proceeds from
the issue, listed on the Luxembourg Stock Market, and intended for institutional investors
under the one billion Euro Medium Term Notes (EMTN) program, will be used to finance
and/or refinance loans granted to businesses which contribute to the economic
development of depressed areas, in particular in southern Italy, in full compliance with the
Bank's mission.
Value adjustments of financial liabilities with macro-hedging
The value adjustment of financial liabilities subject to macro hedging was a positive 78.2
million, compared to 73.8 million at 31 December 2018.
Tax liabilities
Tax liabilities, equal to 1 million (0.1 million at 31 December 2018), refer for 0.9 million to
payables for current taxes and for 0.1 million to deferred taxes recognised as contra-
entries in shareholders’ equity, as they relate to taxes on valuation reserves, as well as
actuarial gains on employees’ severance indemnities.

21
Other liabilities
Other liabilities of 24 million (15.8 million at 31 December 2018) consisted of 7.6 million in
operating payables due to suppliers, 7.9 million of payables due to public administrations,
2.6 million of payables to employees and social security institutions, 2.4 million in tax
payables, 1.8 million of payables due to the parent company Invitalia and 1.6 million in
other items. The increase is mainly due to greater concentration of amounts due to
suppliers near the end of the financial year.
Equity
Shareholders’ equity at 31 December 2019 was made up of the share capital -
represented by 40,901,738 ordinary shares with a face value of € 5 each, for a total
amount of 204.5 million, the legal reserve and other reserves for a total amount of 71.4
million, negative valuation reserves for 3.9 million and the profit for the period amounting to
22.5 million.
Shareholders’ equity at 31 December 2019 including profit for the period amounts to 294.5
million (See the Notes - Part B - Section 12).
The Bank holds no shares of its own either directly or through trust companies or
intermediaries.
At 31 December 2019 own funds, determined on the basis of the current rules issued by
the Bank of Italy, were 279.7 million (242.9 million at 31 December 2018) capable of
guaranteeing a level of capitalisation for the Bank more than sufficient with respect to
expected risks and the target level of capitalisation, outlined in the Risk Appetite
Framework (RAF) (see the Notes, Part E).
The capital absorptions and thus the capital requirements are determined on the basis of
the following approaches:
• Credit Risk: Standardised Approach;
• Counterparty Risk: Standardised Approach applied to exposures calculated with the
Current Value Method;
• Operational Risk: Basic Approach;
• Credit Valuation Adjustment Risk: Standardised Approach.
In the absence of a trading book, no absorption is calculated for market risk.

22
The overall total of risk-weighted assets (credit, counterparty, market and operational
risks) amounted to 1,374 million compared to 1,238 million at 31 December 2018.
The CET1, Tier1 and Total Capital Ratios are 20.36%.
Total prudential requirements, calculated with the Basel III approaches, amount to 109.9
million.
CET1, Tier1 and Total Capital ratios are all in line with both the Bank of Italy indications
relative to SREP and the RAF established by the Board of Directors (15.5%).
Capital ratio
Binding
requirement
(TSCR)
Total requirement
(OCR)
Capital
Guidance1
(P2G)
CET1 Ratio 5.54% 8.04% 8.54%
T1 Ratio 7.39% 9.89% 10.39%
TCR 9.86% 12.36% 12.86%
1 In order to ensure that binding measures are respected even in the case of a deterioration in the economic and financial situation, in consideration of exposure to
risks under stress conditions, in the same provision the Regulatory Authority identified the guiding capital levels (capital guidance), which constitute the Regulatory
Authority's expectations relative to additional capital resources which the Bank must hold.

23
With reference to the RAF (Risk Appetite Framework) the risk targets identified by the
Bank are presented below:
Objective Metric Threshold
Capital adequacy
Total Capital Ratio (TCR) ≥ 15.5%
Leverage Ratio (LR) ≥ 6%
Loan portfolio quality Net NPL Ratio (NPL) ≤ 6%
Profitability ROE ≥ 6%
Operating efficiency Cost/Income ≤ 55%
Banking Book interest
rate
∆ Economic value/Own funds ≤/ 10%
∆ Net interest income ≤ 5.5€/mln
Liquidity
Liquidity Coverage Ratio ≥ 140%
Stable funding/Illiquid assets ≥ 100%
Asset encumbrance Tied assets/Total Assets ≤ 55%
24
The business
During 2019, in full compliance with that established in the Business Plan, the Bank’s
commercial activities were mainly focussed on small and medium enterprises in southern
Italy, through a well-developed array of products, with lending also carried out in synergy
with other local players.
Activities to support the commercial development of SME was carried out both by Level II
bank activities, making use of local partnerships with banks, financial companies and loan
consortia, with previously signed agreements, and in B2C mode through the use of the
web portal.
To support the Level II Bank role:
• new memorandums of understanding were signed with loan consortia, associations
and professional organisations;
• the Basket Bond and Tranched Cover mechanisms were used to satisfy
medium/long-term funding requirements for businesses, maintaining good asset
quality.
The portfolio of offerings was enhanced, which includes:
Credit products managed through the Portal
• Chirofast (Fast Unsecured): simple, fast and effective variable rate loan with a
Fund guarantee and a term:
o from 18 to 60 months for inventories and other financial needs;
o from 18 to 84 months for investments in property, plant and equipment
and in intangible assets;
• Chiro PMI (Unsecured SME): variable rate loan supported by a Fund guarantee,
with a term:
o from 18 to 60 months for inventories and other financial needs;
o from 18 to 84 months for investments in property, plant and equipment
and in intangible assets;
• Chiro Nuove Imprese (New Business Unsecured): loan supported by a Fund
guarantee, for small and medium enterprises with a maximum of two financial
statements filed and/or for innovative start-ups, to support the start of business and
initial growth stages, with a term:

25
o from 18 to 60 months for inventories and other financial needs (in the
case of innovative start-ups or when supported by loan consortia
guarantees);
o from 18 to 84 months for investments in property, plant and equipment
and in intangible assets;
Credit products for large companies
• Medium/long-term loans: unsecured or secured loans with excellent flexibility to
satisfy even highly structured requirements:
o from 18 to 60 months for inventories and other financial needs;
o from 18 to 84 months for investments in property, plant and equipment
and in intangible assets;
• Factoring: financing for trade receivables in several technical forms:
o With recourse;
o Without recourse;
o Reverse;
• Subsidy advance: Unsecured loan for businesses benefiting from subsidy
measures. Allows a company to more efficiently make use of sums needed for
investment, without waiting for the subsidies to be disbursed
• Unsecured loans: loans dedicated to SMEs, large companies and midcaps,
available:
o on demand: up to 18 months for commercial commitments;
o with set maturity: short or medium/long-term;
The maturity can be undetermined if the guaranteed counterparty is a public
entity;
• Advances on invoices: loan which provides an advance on trade payables, prior
to their effective availability and maturity, which the company has due from debtors.
Essentially, viewed structurally, the Bank's operations, downstream from implementations
completed and in progress, involve:
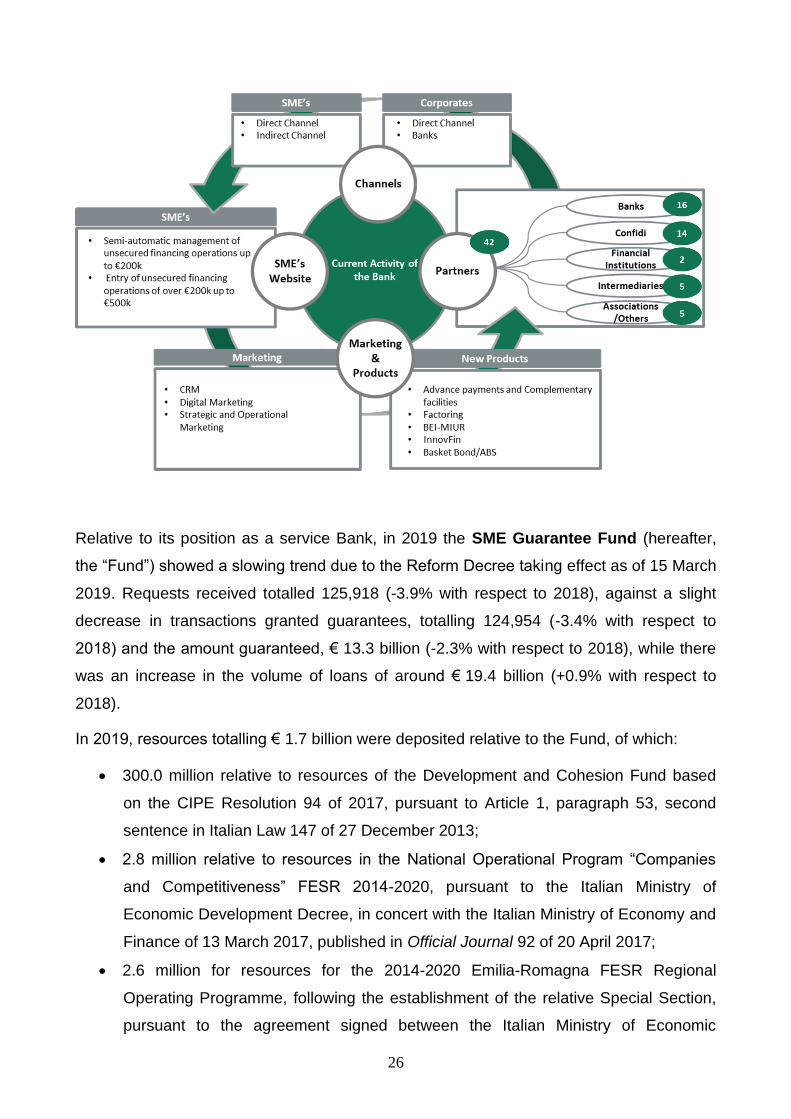
26
Relative to its position as a service Bank, in 2019 the SME Guarantee Fund (hereafter,
the “Fund”) showed a slowing trend due to the Reform Decree taking effect as of 15 March
2019. Requests received totalled 125,918 (-3.9% with respect to 2018), against a slight
decrease in transactions granted guarantees, totalling 124,954 (-3.4% with respect to
2018) and the amount guaranteed, € 13.3 billion (-2.3% with respect to 2018), while there
was an increase in the volume of loans of around € 19.4 billion (+0.9% with respect to
2018).
In 2019, resources totalling € 1.7 billion were deposited relative to the Fund, of which:
• 300.0 million relative to resources of the Development and Cohesion Fund based
on the CIPE Resolution 94 of 2017, pursuant to Article 1, paragraph 53, second
sentence in Italian Law 147 of 27 December 2013;
• 2.8 million relative to resources in the National Operational Program “Companies
and Competitiveness” FESR 2014-2020, pursuant to the Italian Ministry of
Economic Development Decree, in concert with the Italian Ministry of Economy and
Finance of 13 March 2017, published in Official Journal 92 of 20 April 2017;
• 2.6 million for resources for the 2014-2020 Emilia-Romagna FESR Regional
Operating Programme, following the establishment of the relative Special Section,
pursuant to the agreement signed between the Italian Ministry of Economic
27
Development, the Italian Ministry of the Economy and Finance and the Region on
11 February 2019;
• 3.2 million relative to resources of the Fund Reserve to support micro-enterprises;
• 30.0 million relative to resources of the Development and Cohesion Fund based on
the CIPE Resolution 49 of 2018, pursuant to Article 1, paragraph 53, second
sentence in Italian Law 147 of 27 December 2013;
• 435.0 million pursuant to article 22 of Italian Decree Law 119 of 23/10/2018;
• 3.0 million relative to resources of the Fund Reserve for sequestered and
confiscated businesses;
• 25.7 million for resources for the 2014-2020 Sicily FESR Regional Operating
Programme, following the establishment of the relative Special Section, pursuant to
the agreement signed between the Italian Ministry of Economic Development, the
Italian Ministry of the Economy and Finance and the Region on 20 July 2018;
• 34.0 million for resources for the special section Remain in the South;
• 150.0 million to establish the section to support mid-cap companies;
• 6.0 million for resources for the 2014-2020 Piedmont FESR Regional Operating
Programme, following the establishment of the relative Special Section, pursuant to
the agreement signed between the Italian Ministry of Economic Development, the
Italian Ministry of the Economy and Finance and the Region on 1 July 2019;
• 1.3 million for resources for the 2014-2020 Veneto FESR Regional Operating
Programme, following the establishment of the relative Special Section, pursuant to
the agreement signed between the Italian Ministry of Economic Development, the
Italian Ministry of the Economy and Finance and the Region on 05 October 2018;
• 670.0 million pursuant to article 41 of Italian Decree Law 124 of 26 October 2019;
The main significant events involving the instrument during the year were:
• publication of the operating provisions, which took effect as of 15 March 2019,
pursuant to the Italian Ministry of Economic Development Decree, after hearing
from the Italian Ministry of Economy and Finance of 12 February 2019, regarding
approval of the conditions for admission and general provisions relation to the "New
methods of evaluating businesses for access to the SME Guarantee Fund and
establishment of guarantee measures" and the Ministry of Economic Development
Decree of 12 February 2019, after hearing from the Ministry of Economy and

28
Finance, regarding approval of admissions conditions and general provisions for
financial transactions with tripartite risk.
• the start of operations for the "Special Section, Calabria Region", following the
deposit of € 1.3 million relative to resources for the FESR Regional Operating
Programme 2014-2020 for Calabria;
• the start of operations for the "Special Section, Emilia-Romagna Region", following
the deposit of € 1.3 million relative to resources for the FESR Regional Operating
Programme 2014-2020 for Emilia-Romagna;
• the update of methods used for the Special Section, Sicily Region, increasing
ordinary coverage measures up to 80% with direct guarantees and up to 90% with
reinsurance and counter-guarantees, as well as extending it to transactions with
tripartite risk and to regional loan portfolios;
• the update of methods used for the Special Section, Friuli Venezia Giulia Region,
increasing ordinary coverage measures up to 80% with direct guarantees,
reinsurance and counter guarantees;
• the update of methods used for the Special Section, Veneto Region, increasing
ordinary coverage measures up to 70% with direct guarantees, and up to 90% with
reinsurance and counter guarantees;
• the signing of a guarantee contract with Cassa Depositi e Prestiti under the terms of
the Thematic Investment Platform to Support Italian SMEs - EFSI, Juncker Plan.
The contract involves a counter-guarantee by CDP equal to 80% of a portfolio of
new guarantees granted by the Fund up to a maximum of € 3.8 billion in loans, with
a 6.06% cap;
• the update of methods used for the Special Section, Campania Region;
• publication of general provisions for the granting of Fund guarantees on loan
portfolios, to implement the provisions contained in the Ministry of Economic
Development decree, in concert with the Ministry of Economy and Finance of 21
June 2019, published in the Official Journal no. 217 of 16 September 2019.
In 2019, pursuant to article 1 of Law 147 of 27 December 2013, published in Official
Journal 302 of 27 December 2013, aimed at supporting growth and strengthening the
capital solidity of loan consortia, resources totalling € 50.0 million were deposited relative
to the Fund, in favour of 58 loan consortia.
Additionally, management of various incentives and subsidised financial instruments

29
continued on the account of the government and certain Regions. Of these, the main
instrument managed is the Sustainable Growth Fund (FCS) managed by MCC on the
account of the Italian Ministry for Economic Development, as the head bank of a
temporary consortium consisting of 8 banks and the National Research Council. The Fund
supports investments in R&D and provides cofinancing with PON I&C 2014/2020
resources.
On 22 January 2019 the first come first served tender was launched for the presentation of
research and innovation projects in the Agrifood and Intelligent Factory sectors. Projects
are currently being evaluated and some decrees have already been issued. In 2019
concession decrees were issued for 50 projects, for investments totalling € 110 million and
subsidies granted of € 70 million.
During 2019 assessment and decrees by the Ministry of Economic Development regarding
projects presented for various tenders previously issued by the Administration starting in
2014 continued: Digital Agenda and Sustainable Industry (FRI), Horizon 2020 PON,
Innovation Agreements and Framework Agreements, Large Projects PON. In 2019 award
decrees were issued for 60 projects, for investments totalling over € 626 million and
subsidies granted of € 325 million.
The Ministry of Economic Development issued a decree on 2/8/2019 which refinances
subsidy projects throughout Italy to support companies investing in large research and
development projects in the areas of “Digital Agenda” and “Sustainable Industry”.
Additionally, subsidies for projects to reconvert production processes relative to the
circular economy were also established. This measure is financed with the resources of
the rotating fund for support of companies and the Fund for Sustainable Growth. The
allocation totalled € 329 million.
Preliminary assessment of project proposals continued in 2019, relative to tenders for
Innovation Agreements for research and development projects (Ministerial Decree
24/5/2017 and Ministerial Decree 5/3/2018); specifically, for the Agrifood, Intelligent
Factory and Life Science tender, the initial financial resources were increased to over
€ 535 million, in order to ensure the widest coverage of proposals presented.
On 15/10/2019 a Ministry of Economic Development decree was published which governs
the methods and terms for presentation of requests for subsidies to support experimental
industrial research and development projects. These are projects that fall under the scope
of the National Strategic Plan and the innovation agreements for the Space Economy. The

30
decree identifies the methods used to implement the subsidy project already defined by
Ministerial Decree 2/3/2018, through which financial resources of € 100 million were
allocated.
Disbursement activities were fully operational for the following tenders, issued by the
administration: Horizon 2020, Digital Agenda and Sustainable Industry, Horizon 2020
PON, Large Projects PON, Framework Agreements, Digital Agenda and Sustainable
Industry (FRI) and Euro Trans Bio Tenders. Disbursements carried out during 2019
involved 574 projects for a total of over € 216 million.
Additionally, through a temporary consortia with FISG S.r.l., the Bank was the successful
tenderer for the arranger service in favour of Campania Development, as part of
structuring a Minibond issue by SMEs operating in Campania, supported by public
guarantees in the form of cash collateral, as a basket bond, subscribed by a special
purpose vehicle in turn financed through the issuing of ABS notes subscribed by
institutional investors.
Operating structure
Human Resources
As of 31 December 2019, Bank staff included 295 employees (including 6 seconded to
Invitalia by MCC and 2 seconded to MCC by Invitalia), of which 11 executives2, 172 middle
managers3 and 112 non-managerial personnel. Additionally, as of 31 December 2019, the
Bank had 9 interns, 11 temporary workers and a long-term freelance worker.
During 2019, 40 new employees were hired, of which 1 executive (initially seconded
through 31 December 2018), 10 middle managers (including 1 seconded by the
shareholder) and 29 non-managerial employees; 28 employees left the company (5
executives - including 2 seconded executives, 4 middle managers and 19 non-managerial
personnel).
Organisational solutions and operating projects implemented
During 2019 activities to implement the Business Plan continued. With reference to credit
offerings these included:
2 Of which an executive seconded by the parent company 3 Of which a middle manager seconded by the parent company

31
• extension of the “Credit Portal” platform to support both channels for the origination
and assessment of loans for small and medium enterprises (SME). At present, the
Credit Portal makes it possible for the bank to offer digital lending both directly and
through partners (lending consortia, local banks, trade associations and other
brokers) and allows for real time verification of transaction feasibility on the basis of
information provided through public databases. During the year, phases involving
the investigation of loans were also automated, making use of information coming
from external providers (e.g. Credit Bureaus, Central Credit Register, specialised
providers) with analysis algorithms that generate “alerts” and “insights” to support
creditworthiness analysis by the investigator;
• adaptation of credit granting processes, to consolidate credit offerings developed by
transactions:
o Tranched Cover, carried out synergistically with Banca Monte dei Paschi di
Siena, reserved for companies operating in integrated logistics with operating
headquarters in southern Italy;
o supported by the "InnoVFin SME Guarantee” provided by the European
Investment Fund;
o presented by companies with legality ratings;
• the revision of the operating model to develop factoring;
• implementation of a compliant conservation system for digital documents relative to
accounting and contractual documents.
In the Subsidised area, the main actions involved:
• adjustment of the digital platforms supporting the Guarantee Fund, made necessary
by the reform of the tool as of 15 March 2019, which required the implementation of:
- online rating calculation for beneficiary companies, on the basis of data
collected, making use of information from external databases, credit bureaus
and central credit registers;
- functions dedicated to beneficiary companies to allow them to directly take part
in document control stages, to provide evidence and observe their ceiling;
• activation of mass demand acquisition functions for the Fund, through a dedicated
FEA protocol (Advanced Electronic Flow);

32
• extension of the functions of the “FCS” application platform (Sustainable Growth
Fund) to manage new agreements and tenders on the account of the Ministry for
Economic Development.
Corporate Governance
This paragraph also serves as the Report on Corporate Governance and Ownership
Structures which describes the main features of the risk management and internal audit
system linked to the financial reporting process (Art. 123-bis, paragraph 2, letter b) of the
Consolidated Law on Finance).
The governance model adopted by the Bank is the “traditional” one, featuring the classic
two-part system of the Board of Directors and the Board of Statutory Auditors; independent
auditing of the accounts is entrusted to an external auditing firm.
The Shareholders’ Meeting is held periodically to decide on the matters reserved for the
same by law and by the supervisory regulations.
More specifically, the Ordinary Shareholders’ Meeting approves the Financial Statements
and the allocation of the profits, appoints the Directors and the Statutory Auditors and can
also revoke the same; on proposal of the Board of Statutory Auditors, it confers and
revokes the mandate of the auditing firm; it approves the remuneration policies and
decides on the responsibilities of the Directors and of the Auditors, and it resolves on all
other matters attributed to its competence by law or by the Articles of Association.
The Extraordinary Shareholders’ Meeting passes resolutions on amendments to the
Articles of Association (except those necessary for adapting the same to provisions of law,
and those concerning mergers in the cases contemplated by Arts 2505 and 2505-bis of the
Italian Civil Code and the reduction of share capital in the event of withdrawal for the
shareholder), on the appointment and replacement of liquidators and the powers vested on
the same and on every other matter attributed to its competence by law.
Given the administration and control system adopted by the Bank, the Board of Directors
has responsibility for strategic supervision.

33
The Board of Directors, made up of 5 members (of which at least one fourth4 holding the
requisites of independence required by the laws in force), is vested with all powers for the
ordinary and extraordinary administration to achieve the company purpose, except for
matters which the law and/or supervisory provisions reserve for the Shareholders’
Meeting. Additionally, it is the body granted priority for ensuring that Shareholders' Meeting
resolutions are promptly and accurately carried out.
During the period, the Board of Directors met 18 times.
The Board of Directors elects a Chairperson from among its members, unless already
appointed by the Shareholders’ Meeting, and it may appoint a Deputy Chairperson solely
to act in lieu of the Chairperson in the case of his or her temporary absence or
impediment. Should the Deputy Chairperson also be absent or unable to fulfil his or her
duties, he or she shall be replaced by the most senior member of the Board of Directors
or, in the event of equal length of service, by the eldest member. At present, no Deputy
Chairperson has been appointed.
The Chairperson legally represents the Bank and takes the chair at the Shareholders’
Meeting, and convokes and chairs Board of Directors’ meetings, during which they guide,
coordinate and moderate discussions.
The Board of Directors appoints a Chief Executive Officer and may appoint a General
Manager, both of which must possess the requirements established under the current
regulations.
The Board of Directors may delegate powers to the Chief Executive Officer and, based on
a proposal by them, to the General Manager (if appointed), determining the limits of the
delegation, the powers and rights that it deems opportune, within the limits imposed by law
and the Articles of Association.
In any case, the Chief Executive Officer has the power to submit loan proposals which
must be decided by a Board of Directors’ resolution.
The Board of Directors may confer special delegated powers, on the granting of loans and
on current management to Management Committees, executives, officials and other
employees, determining the limitations, terms and conditions. The decisions taken by the
recipients of delegated powers must be brought to the attention of the Board according to
the methods and with the frequency, at least quarterly, determined by the latter.
4 Circular 285/2013 specifies that when this ratio is not a whole number, it is rounded up when the first decimal is
equal to or less than 5. Otherwise, it is rounded up.

34
The Chief Executive Officer is the person responsible for managing the Bank and ensures
that the same is performed in accordance with the legislation, the Articles of Association
and the guidelines approved by the Board of Directors.
Observing the organisational framework approved by the Board of Directors, the Chief
Executive Officer sets up the Bank’s Organisational Structure defining the tasks and
responsibilities of the single Organisational Units and the related interconnections. The
Chief Executive Officer is also vested with the legal representation of the Company.
The Board of Statutory Auditors, appointed by the Shareholders’ Meeting, is composed of
3 regular auditors, from whom the Shareholders’ Meeting elects the Chairperson, and 2
alternate auditors.
Given the administration and control system adopted, the Board of Statutory Auditors
serves as the Bank's audit body. The Board of Statutory Auditors, in particular, presides
over compliance with the law, regulations and provisions of the Articles of Association and
the adequacy of the Bank’s management and accounting procedures, the risk
management and control system and the functionality of the system of internal controls as
a whole, promoting actions to correct the shortcomings and irregularities found. In order to
properly fulfil its duties, the Board of Statutory Auditors is granted the widest powers
allowed under the regulatory provisions and regulations in effect and makes use of the
internal audit structures and departments, from which it receives appropriate periodic
reports, to carry out and guide its audits and required investigations.
In addition, the Board of Statutory Auditors performs its activity coordinating its work with
the Auditing Firm appointed for independent auditing of the accounts. In this regard, the
Board of Statutory Auditors, after informing the Board of Directors, proposes to the
Shareholders’ Meeting to confer the independent auditing appointment, assessing the
independence of the Firm proposed and supervising over time the activities performed by
the latter. Despite the attribution of the appointment to an auditing firm, the Board of
Statutory Auditors conserves the tasks connected with assessing the adequacy and
functioning of the accounting system.
During the financial year, the Board of Statutory Auditors met 16 times.
Under the terms of the Articles of Association, the independent auditing of the Bank’s
accounts must be carried out by an Auditing Firm listed on the specific register, appointed
by the Shareholders’ Meeting.

35
On 26 April 2012, on a grounded proposal of the Board of Auditors, the Shareholders'
Meeting resolved to confer the mandate for independent auditing of the accounts for the
financial years 2012-2020 on the auditing firm PricewaterhouseCoopers S.p.A.
In order to favour and improve the functioning of the organisational processes aimed at
delegation, coordination of departments, integration and shared decision-making, the
following Management Committees operate within the Bank. The main responsibilities of
each of these are listed below:
• Credit Committee: this supervises the loan granting and management process. It
exercises the delegated powers conferred by the Board of Directors in relation to
granting credit, non-performing loans, probable defaults and past due/over-the-limit
exposures within the limits established by the Board of Directors. It examines the
results of loan analysis and monitoring prepared and presented to the Committee
by the Bank’s competent units, for subsequent presentation by the Chief Executive
Officer to the Board of Directors;
• Commercial Committee: exercises the delegated powers granted by the Board of
Directors with regards to the granting of credit, relative to the business segments
and limits established by the Board of Directors; supervises the credit granting
process in compliance with the criteria defined by the relevant internal departments,
in order to achieve volume, profit and risk containment objectives;
• Pricing Committee: exercises the delegated powers granted to it by the Board of
Directors in regards to definition of prices (spread and conditions) applied to lending
products;
• Business Monitoring Committee: has the objective of systematically monitoring
business development progress, in terms of production volumes and margins for
initiatives; it also approves initiatives used to implement the Business Plan on the
basis of the limited business plans proposed by the commercial departments; it
assesses partnership/convention proposals proposed by commercial structures;
• Internal Controls and Risks Committee: this has an advisory and propositional role.
It assists the Chief Executive Officer and the other corporate bodies in the
integrated management of the overall risks to which the Bank is exposed, and of the
overall internal control system.
There are also Subsidy Committees for managing public actions and funds, in order to
ensure segregation between management of public initiatives and funds and other banking

36
activities, also on the basis of what is defined in the agreements signed by the Bank. The
members of these Committees—who cannot be Bank employees—are chosen on the
basis of the specifications contained in the single agreements and, unless otherwise
contemplated by law or by the relevant agreements, are appointed by the Chief Executive
Officer based on proposals made by the structures responsible for managing Public Funds
(and where applicable, designated by client administrations).
The Subsidy Committees - whose functions are established by the relative regulations and
Agreements - resolve on proposals to admit/reject individual transactions, on revocations,
renunciations, transactions and anything else necessary for the implementation or
termination of a subsidy agreement, as well as on the filing of lawsuits; following the
relative schedule, they approve reports and accounts relative to available funds,
commitments, insolvencies and disputes, demonstrational prospectuses and the relative
report on the amount of commissions and reimbursements due to the Manager; they
define guidelines and operating methods with respect to subsidies, also with regards to the
relations between the Bank as manager, the intermediaries and beneficiary businesses.
Internal control system
“Internal Control System” means the set of rules, functions, structures, resources,
processes and procedures that aim to ensure, observing healthy and prudent
management, that the following objectives are achieved:
1. checking implementation of corporate strategies and policies;
2. containing risk within the limits indicated in the reference framework for determining
the Bank's risk propensity;
3. safeguarding the value of assets and protecting against losses;
4. effectiveness and efficiency of corporate processes;
5. reliability and security of corporate information and IT procedures;
6. preventing the risk that the company will be involved, even involuntarily, in illegal
activities;
7. compliance of operations with the provisions of laws and regulations, including
supervisory rules, and with internal policies, regulations and procedures.
The Internal Control System plays a central role in the corporate organisation and is
strategically significant because:

37
• it represents a fundamental element of knowledge for the corporate bodies, so as to
ensure full awareness of the situation and effective monitoring of company risks and
their interactions;
• it orients the changes of the strategic approaches and corporate policies and makes
it possible to adapt the organisational context in a coherent manner;
• it oversees the functions of the management systems and observance of the
prudential supervisory requirements;
• it favours the diffusion of a correct culture in terms of risks, legality and corporate
values.
The Internal Control System must:
• ensure the completeness, adequacy, functioning (in terms of efficiency and
effectiveness) and reliability of the risk-management process, and its consistency
with the Risk Appetite Framework (RAF);
• provide for control activities spread over every operating segment and hierarchical
level;
• guarantee that the anomalies encountered are promptly brought to the attention of
the Bank’s appropriate organisational levels (to the Corporate Bodies, if significant)
capable of quickly activating the opportune corrective actions.
The Board of Directors, in exercising its duty of strategic supervision, defines the
architecture of the Internal Control System in terms, for example, of principles and
guidelines, organisational oversight, tasks and responsibilities, resources and powers,
information flows and integration of risk management and conflict of interest processes, in
observance of the laws and supervisory regulations, and the Articles of Association.
Annually the Board of Directors, also taking into account the results of the activity of the
Board of Statutory Auditors and supported by the internal audit unit, assesses the
completeness, adequacy, functioning and reliability of the Internal Control System.
The control activities in the Bank are carried out at all hierarchical levels and in all
departments of the organisational structure. All company structures are engaged, each for
their specific level of responsibility and assigned duties, in controlling the processes and
operating activities they are responsible for. The results of the controls then flow into an
articulated system of reporting and information flows, the final destination being the
Supervisory Authority and the governance, management and control bodies, on the basis

38
of the frequency and the contents established by external and internal regulations and
according to the responsibilities of each body.
In application of the principle of proportionality, the Bank has structured its Internal Control
System based on its size and the complexity of its operations, the nature of its activities
and the associated risks to which the Bank is exposed. The Bank's Internal Control
System includes the following levels:
• First level: these include all control activities which the individual business/operating
units carry out on their own processes in order to identify, assess, manage and
monitor their associated risks, in relation to which they identify and implement
specific actions aimed at ensuring the processes are properly completed. They are
carried out by the same business/operating functions (e.g. hierarchical, systematic
and sample controls), or to the extent possible, are incorporated in IT procedures
and are considered an integral part of every company process.
• Second level: these are performed by the risk control function (which includes both
the risk control and validation departments) and by the compliance and anti-money
laundering function, with the aim of monitoring company risks to ensure the
prudential conduction of business, reliability of information and compliance with eh
law and internal procedures;
• Third level: assigned to the internal audit department, which ensures constant,
independent and objective assessment of the functioning of the overall Internal
Control System.
The Compliance and Anti-Money Laundering Area includes the compliance department
and the anti-money laundering department. Their responsibilities are based on specific
provisions contained in laws and supervisory regulations and are implemented through
internal regulation documents, approved by the Board of Directors.
The Manager of the Area is appointed manager of the compliance department as well as
the company's anti-money laundering manager and reports to the Chief Executive Officer.
In any case, he or she has direct access to the Board of Directors and to the Board of
Statutory Auditors and communicates with them without restrictions or intermediation.
The Compliance model adopted by the Bank assigns the Compliance department the task
of directly monitoring non-compliance risk with reference to the relevant regulations
governing bank and brokering activities, management of conflicts of interest, transparency
with customers and, more generally, consumer protection regulations. It is also

39
responsible for identifying specialised safeguards within the Bank in order to manage non-
compliance risk for the regulatory areas which apply (e.g. workplace safety, taxes). In any
case, the Compliance department continues to be responsible, for these areas as well, for
at least the definition of methods used to assess non-compliance risks, to identify the
relative procedures and to verify the adequacy of these procedures in preventing non-
compliance risks, as well as assessing the adequacy of these safeguards in managing the
overall non-compliance risks.
The Risk Management Department plays the role of risk control unit - as defined by the
current regulatory rules - and performs the tasks assigned to this unit in the guidance
documents, and in the policies and guidelines approved by the Board of Directors, in
particular with reference to the Risk Control Department Regulations.
The manager of the department is also the Risk Control Department Manager and reports
to the Chief Executive Officer. In any case, they have direct access to the Board of
Directors and the Board of Statutory Auditors and can communicate with them without
restrictions or intermediaries.
The Internal Audit Department plays the role of internal audit unit, as defined by the
current regulatory rules and performs the tasks assigned to this unit in the guidance
documents, in the policies and guidelines and approved by the Board of Directors, in
particular with reference to the Internal Audit Process Regulations.
The Manager of the Department is appointed Manager of the internal audit unit.
The manager of the internal audit unit reports to the Board of Directors; he or she has
direct access to the Board of Statutory Auditors and communicates with them without
restrictions or intermediation. The link between the manager of the internal audit unit and
the Chief Executive Officer is in any case ensured through adequate information flows and
participation, as a member, in any management committees in the field of internal controls
and risks.
The managers of the control units hold suitable requisites of professionalism, are
appointed and revoked by the Board of Directors, after consulting the Board of Statutory
Auditors, and do not have direct responsibility for operating areas subject to audit.

40
The Bank’s System of Controls also includes the Board of Auditors, the Oversight
Committee pursuant to Italian Legislative Decree 231/2001(henceforth also the “231 OC”)
and the independent auditing firm.
The main objective of the 231 OC is to prevent the crimes contemplated by Legislative
Decree 231/2001 by verifying the adequacy and effectiveness of the Organisational and
Management Model adopted by the Bank pursuant to the Decree.
The Committee operates according to regulations approved by the Board of Directors and
has a budget for expenses and wide powers of control and inspection at all levels.
The 231 OC, a specifically established collegial body, currently consists of the
Chairperson, an independent external professional, and two other members, specifically
the managers of the Bank's Internal Audit and Risk Management departments (which, in
the context of the company, have no operational tasks, ensuring full independence).
Alternatively, as established in current norms, the Bank's 231 OC functions may be
performed by the Board of Statutory Auditors.
The Auditing Firm, for the duties assigned to the same by law, liaises - for the purpose of
exchanging information and/or data - with the Board of Directors, the Board of Auditors,
the Internal Audit Department and the other corporate control bodies and/or units.
Lastly, as regards coordination and operational management of the internal control model
required by Law 262/05 on Investor Protection (Art. 154-bis of the Consolidated Law on
Finance), the Manager of the Administration, Control and Finance Department, in his/her
capacity as Financial Reporting Manager, must prepare—and effectively put into
practice—adequate administrative and accounting procedures for preparing the
Company’s financial statements as well as every other communication of a financial nature
made available to the market.
The Bank’s Financial Reporting Manager—jointly with the Chief Executive Officer—must
also, in a specific report on the Company’s annual and six-monthly financial statements,
certify:
• adequacy and effective application of the administrative and accounting procedures;
• compliance with the applicable international accounting standards recognised in the
European Community pursuant to Regulation (EC) no. 1606/2002 of the European
Parliament and of the Council of 19 July 2002;

41
• correspondence with the entries in the accounting ledgers and documents;
• the true and correct representation of the shareholder’s equity, and economic and
financial situation of the bank;
• the inclusion in the report on operations of a reliable analysis of performance and of
the operating result, together with a description of the main risks and uncertainties
to which the Bank is exposed.
In order to comply with the provisions of law, the Bank has adopted an Internal Control
System which involves the application of a common methodological framework based on:
• use of a uniform model based on internationally-recognised methodological
standards (CoSO and Cobit);
• constant updating of the Model, with attribution of specific responsibilities to the
subjects involved;
• generalised communication of the model through training programmes.
Specifically for the model adopted:
• documentation must be validated and the execution of the controls on the part of
the respective competent managers must be confirmed;
• every administrative/accounting procedure and every control must be documented,
assessed, tested and validated and a single manager appointed as responsible for
executing the activities contemplated therein;
• an internal confirmation flow (to the Bank’s Financial Reporting Manager) has been
defined as well as an external confirmation flow (to the Parent Company’s Financial
Reporting Manager and to the market) in relation to the Internal Control System for
financial disclosure.
The Bank adopts a Regulation for the Financial Reporting Manager in which - in line with
the provisions of Art. 154-bis of the Consolidated Law on Finance and in accordance with
Art. 24 of the Articles of Association - the following are defined:
• appointment procedures, requisites, duties, powers and resources of the Financial
Reporting Manager;
• relations with the Bank’s governing bodies and control bodies;

42
• the information flows from and to the other control structures and the Financial
Reporting Manager of the parent company, within the sphere of the information
required for preparing the consolidated financial statements.
Additionally, the Guidelines - Financial Information Internal Control System (hereinafter
“FIICS”) have been approved which govern—in compliance with the provisions of art. 154-
bis of the CLF—the criteria and methods, and identify the roles and responsibilities:
• for establishing and maintaining over time the Bank’s Financial Information Internal
Control System;
• for assessing its adequacy and effective operation.
The provisions of the FIICS are part of the Bank’s overall internal control system and are in
keeping with the current legislative prescriptions. Additionally, provision 1079 “Procedure
for compliance 262/05” governs operating activities and methodological tools use to
institute and maintain over the time the Bank’s Financial Information Internal Control
System (FIICS), as well as for assessing its adequacy and operational effectiveness, in
respect of the roles and responsibilities defined in the FIICS.
On the basis of the internal regulations, during the year the planned updating of the
administrative procedures was carried out, to comply with Italian Law 262/05. The roles
involved, the activities and responsibilities relating to the steps of the macro processes
were also identified.
During 2019, the Financial Reporting Manager issued the attestations and declarations
required, maintaining, in the context of her activity, all the contacts and relations with the
other external and internal control bodies, namely the Board of Statutory Auditors, the
Auditing Firm, the Oversight Committee, the Internal Controls and Risks Committee, the
internal audit, compliance and money-laundering units, and with the Parent Company’s
Reporting Manager.
On the occasion of the presentation of the Company’s annual separate financial
statements and the six-monthly financial report, the Financial Reporting Manager submits
to the Board of Directors a report on the Financial Information Internal Control System, as
well as the text of the certification to the Market, to be signed jointly with the Managing
Director to guarantee compliance with the requirements imposed by law.
43
Non-financial disclosure
Legislative changes and Sustainability
On 25 January 2016, Legislative Decree 254/2016 (O.J. 10.1.2017) came into force. This
implements the European Directive on information of a non-financial nature that certain
businesses are required to publish. The Bank5, to which the law does not apply obligatorily
owing to its size, has decided in any case to supplement the information of a non-financial
nature in the Report on Operations, taking the opportunity to present to the market and to
the main stakeholders the total value generated by the business, also through the relative
social and environmental impacts, as useful elements for strengthening its business and
better overseeing its risks and impacts.
The Report provides a brief description which illustrates the interconnection between
corporate objectives, activities and results achieved with respect to certain specific areas
that the Bank is managing as priorities: the actions and activities carried out for achieving
these objectives are therefore illustrated, assessing the results obtained also with
reference to the improvement actions carried out and identified as necessary for the near
future.
The Report takes as a reference a number of indicators typical of sustainability reporting,
taken from the GRI (Global Reporting Initiative) Guidelines, and provides significant
qualitative and quantitative elements in relation to the goals and policies defined and their
impact on the Bank’s main stakeholders: employees; businesses and private customers,
the Public Administration, relations with which are managed by the Bank in a manner and
according to processes governed by specific agreements, treated separately from the
banking activities, with a separate decision-making, organisational, administrative and
accounting framework.
Mission and corporate model, values and principles, compliance and
control processes
Mediocredito Centrale S.p.A. is a bank which operates mainly in lending and in managing
public subsidies and services in line with its statutory mission.
5 Therefore, the Bank did not assign any compliance audit either to the independent auditing firm nor to any other authorise subject.

44
The Bank is 100% controlled by Invitalia S.p.A. , which in turn is fully held by the Ministry
of Economy and Finance.
A series of principles and values guide the actions of subjects who operate within the
Bank, at every level, formalised in the Code of Ethics and in the Suppliers’ and Partners’
Code of Conduct, and available to all employees on the corporate Intranet.
The Code of Ethics - an integral part of the Organisation, Management and Control Model
adopted by the Bank pursuant to Legislative Decree 231/2001 - is the result of shared
work by the Bank’s departments and specifies activities, rights and duties in relation to the
various stakeholders, as well as the principles of conduct that guide the behaviour of
employees in daily activities.
The Bank has continued to implement its Organisation Management and Control Model,
which is supported by a system based on specific operating protocols and on a formalised
system of controls, under the responsibility of operational management, the results of
which are periodically reported to the Oversight Committee.
In this framework, the Bank’s internal control system can functionally provide for constant
and effective monitoring which can detect, govern and control the risks linked to the
activities carried out and the effective application of the principles outlined in the Code of
Ethics adopted.
During 2019, the Operating Protocols were updated, in order to implement the
organisational changes which had occurred, as well as to insert the more recent changes
made to national regulations.
The Bank supports continuous improvement of its organisational and process safeguards,
contributing to the spread of a culture of control at all levels of the organisation and
directing improvement initiatives to the areas of attention which come to light thanks to the
monitoring activity.
The guiding principles of the Bank’s activity consequently include special attention to
compliance and to control of the risks linked to the specific business, the responsibility for
which is given not only to the company departments appointed for the purpose at
governance level, but also to each employee. This aspect is an integral part of the
corporate culture, to make its people increasingly participants in and responsible with
reference to the corporate project: and this must entail constant attention to conformity and
control of risks, observance of the internal and external regulations, but also continuous
monitoring of reputational areas which are extremely significant, in relation to the Bank’s
core business.

45
Given the Bank’s special nature, also within the sphere of the internal controls, special
importance is attributed to safeguarding correct relations with its reference market,
especially the Public Administrations, to preventing fraud risks, and to protecting customer
data. Specific oversight has also been defined for managing reputational risk associated in
particular with the lending process.
Governing Body
The composition of the Board of Directors provides for a balance between genders (a
minimum of one third are women); the average age is 53.2.
People
Care and development for people is at the centre of MCC’s growth strategies, with
management aimed at the personal and professional development of all employees.
Through this view, management decisions and initiatives are implemented using
methodologies and criteria which focus on equity and paying attention to the
characteristics and well-being of every individual, while also taking advantage of diversity.
Total employees, broken down by contract and gender
31.12.2019 31.12.2018
TYPE OF CONTRACT F M TOTAL F M TOTAL
Temporary contract - 2 2 - 1 1
Permanent 139 154 293 135 147 282
Total 139 156 295 135 148 283
Full-time 113 155 268 108 147 255
Part-time 26 1 27 27 1 28
Total 139 155 295 135 148 283
The corporate population is balanced in terms of gender, with 53% men and 47% women.
In terms of diversity and inclusion, MCC works to implement management policies and
develop its people with a focus on equity. Taking advantage of diversity is the foundation
of organisational management and development, with ad hoc initiatives to develop those
with merit and make it easier to find work/life balance, in order to create a more favourable
working environment.

46
Meetings with Unions with regards to various company projects continued in a constant
manner, with the aim of shared solutions that respect the different needs of the parties.
Five agreements were signed during the year, within which ample space was dedicated to
welfare solutions, including innovative initiatives to improve work/life balance, paying
attention to people.
In particular:
1. Working hours and behavioural norms: with an eye to creating work/life balance,
MCC restructured weekly working hours, increasing flex hours. The agreement
allows for workers to begin work earlier (at 8:00 instead of 8:30), extended flexibility
by 30 minutes, as well as allowing for early departure at 4:30 pm from Monday
through Thursday and at 1:30 pm on Friday. Additionally, it is possible to take lunch
breaks at the company offices, spaces which have been specifically furnished for this
purpose.
2. New measures to promote work/life balance for employees: the agreement
establishes that recipients of the company bonus may choose between three
different bonus possibilities:
• Only the welfare component;
• Monetary + welfare component;
• Only monetary component.
Additionally, to further improve work/life balance, the monetary portion of the
company bonus can be used to increase free time -- workers can fully or partially
make use of the monetary component to obtain time off work (known as “welfare
hours”).
3. Smart working: rules were established and experiments with new methods of working
involving only a certain number of organisational units began. The new methods offer
the possibility for workers to provide their services in locations other than company
offices. The goal of the project is to improve the quality of life for employees while
increasing motivation.
4. Smart working agile agreement addendum: the scope of experimentation for the new
working methods was subsequently extended.
5. “Solidarity” smart working: the possibility of smart working was reserved for certain
workers for whom daily commuting was extremely difficult or who had specific
personal requirements. Experiments will begin in 2020, limited to a small number of
workers, and will last for 6 months.

47
35% of employees are members of the union.
With reference to corporate welfare, given the enthusiasm seen in previous years, in
2019 the Bank again took part in the national initiative “Bimbi in ufficio con mamma e
papà”, [Bring your children to work], to allow employees’ children from 3 to 12 years of age
to get to know the place where their parents work. During the day, children were involved
in games, experiments and interactive laboratories dealing with the issues of sustainable
development, renewable energy and waste recycling.
In 2019, MCC further strengthened its training, in part thanks to the use of incentives
made available by funds (FBA and Fondir) to finance company/individual training plans.
The annual training plan was the result of careful analysis of training requirements. As
established in the Code of Ethics, all employees undertake to develop their own skills, and
to accept responsibility for their own growth projects in order to contribute to the improved
performance of the organisation. A bottom-up recognition method was introduced in 2019,
through the use of focus groups consisting of a representative sample of workers. Training
projects, provided in various ways (remote, classroom, etc.), focussed on developing
technical/specialist, managerial and behavioural skills. With an eye to supporting
excellence, the Bank also promoted the initiative “knowing to excel”, reimbursing workers
who participated in training courses such as a master, university course or specialisation.
Annual training hours per employee, by category and gender
Gender 31.12.2019 31.12.2018
M 3,934 4,204
F 4,565 2,984
Professional categories
Executives 177 515
Middle managers 4,958 4,592
Non-managerial personnel 3,363 2,081
Total 8,498 7,188
Annual training hours by type
Training type 31.12.2019 31.12.2018
Classroom training 5,442 6,498
Remote learning 3,056 690
Total 8,498 7,188

48
The assessment system adopted by MCC involves comparison of the contribution
provided by every worker in the context of their role with the Bank's expectations, including
assessment of their skills and actions within the company. The assessment forms contain
qualitative and quantitative performance indicators, representing work performance. The
process ends with assessment by the manager and a meeting with the worker, with the
aim of sharing the assessment as well as professional development objectives. The
meeting represents an additional opportunity for interaction between manager and
employee.
In order to maximise the effectiveness of evaluation systems, also with an eye to
managerial self-development, an upward feedback mechanism was introduced, which
brings the bank’s appraisal systems closer to the ideal of comprehensive feedback.
The selection procedure begins with a careful search for any internal candidates, to make
the most of interested and motivated employees and create opportunities and room for
growth. Through job postings employees can apply for positions open both within MCC
and the Invitalia Group, concretely supporting the professional development goals of all
while strengthening infra-group mobility.
In its research, MCC makes use of the main online recruitment channels, as well as a
dedicated section of the company's institutional website “work with us”, which publishes
open positions and can collect spontaneous job applications.
Additionally, MCC works with the most important Italian universities, participating in career
days, in order to select young talent and offer the opportunity for training to interns,
introducing them to the world of work.
In its internal communication the Bank is careful to develop a shared culture based on
corporate values and to support a sense of belonging for its employees. Corporate tools
such as the Intranet and the social network Yammer were strengthened/activated, which
makes it possible to openly communicate and interact, to share and collect ideas,
facilitating the circulation of information at all levels of the organisation.
Team building activities were introduced to maximise contacts between co-workers who
are not organisationally contiguous.

49
Structured listening accompanies these tools, which supports management and company
departments with regards to any issue or specific requirement. In this light, related
initiatives were increased during the year (feedback, focus groups).
Additionally, MCC participated in “Dynamo Team Challenge 2019”, a fund raising initiative
for Dynamo Camp Onlus, the first recreational therapy camp in Italy, which hosts children
and teenagers affected by serious pathologies with the aim of offering them treatment and
therapy, also supporting a fundraising event organised by Invitalia with the “Ultrabroad
Band” concert. Additionally a work to school project “AllenaMenti” was begun which
included 16 students from the Vivona high school in Rome and 20 co-workers in a 40 hour
training course, allowing students to learn about the world of work, presenting the
corporate model, business and professional positions of Mediocredito Centrale.
Health and Safety
In 2019, MCC carried out a Correlated Work Stress assessment, with the assistance of
external consultants. This assessment, used to analyse the well-being of workers, was in-
depth and included two stages with the involvement of not only the relevant company
employees but also a sample of workers, divided into homogeneous groups.
Social responsibility and core business
In implementation of that established in article 3 of the Bylaws, in the context of its
business the Bank acts with the prevalent purpose of supporting the Southern economy,
as established in article 2, paragraph 162 of Italian Law 191 of 23 December 2009.
In order to measure and monitor its ability to achieve its mission, the Bank has identified a
panel of indicators, both qualitative and quantitative.
These indicators are divided into two categories:
• The Lending Business indicators make it possible to measure the Bank’s support
for the economy of the South through its lending business;

50
• The Actions for Development indicators make it possible to measure the Bank’s
ability to support the economy of the South, which may also include financial
resources that are not its own or study, promotion and social support activities.
Lending Business indicators are subject to quarterly monitoring and the results are
presented to the Chief Executive Officer and all of the relevant operating departments,
which identify possible corrective actions for commercial development.
All indicators are subject to half-yearly monitoring and the results are presented to the
Board of Directors and the Board of Statutory Auditors, which assess the Bank’s effective
degree of orientation in achieving its statutory mission over the medium term.
Lending Business indicators
AC.1 - Loans to the South out of total Loans (amount)
This is the percentage ratio between existing loans classified by the Bank as in “loans to
the South” relative to total existing loans to customers (businesses, households, Public
Administrations).
At 31 December 2019, the percentage of loans to the South with respect to total loans to
customers was 51.3% (a total of 800.3 million), of which 38.3% relative to subjects residing
in or with their head offices in the South (equal to 597.5 million).
AC.2 - Businesses based in the South out of total businesses (number)
This is the percentage ratio between the number of business customers based in the
South and the total number of business customers and makes it possible to monitor the
prevalence of business customers with registered offices in the South.
At 31 December 2019, the percentage of the Bank’s business customers with registered
offices in the South was 58.2%.

51
AC.3 - Offices in the South
This is the percentage ratio between the offices in the South and total offices and makes it
possible to monitor the compliance of the Bank’s commercial policy with the statutory
mission.
At 31 December 2019, the Bank had offices in Naples, Bari, Pescara, Catania and Milan,
which contribute to supporting the Bank’s presence in these areas, in line with its statutory
mission. The ratio between offices open in the South and total existing offices is 80.0%.
AC.4 - Business loan files for the South
This is the percentage ratio between loan applications classifiable as “loans to the South”
received during the year of reference from businesses and total applications received from
businesses during the same period.
At 31 December 2019, 59.77% of loan applications received are classifiable as “loans to
the South”, regardless of the end result.
Development Action indicators
IS.1 - Loans and grants to the South connected with the activity of Manager on
behalf of the Public Administrations
This measures the loans and grants destined for businesses in the South connected with
the Bank’s activity as Manager on behalf of the Public Administrations responsible for the
related subsidies. While always acting in accordance with public law and with the
instructions of the responsible Bodies, the Bank makes a substantial contribution to the
development of the South through the management of public subsidies.
At 31 December 2019, loans and grants to the South connected with the activity of
Manager on behalf of the Public Administrations amounted to:
• 14.7 billion of existing bank loans activated thanks to the guarantees given in
relation to the Guarantee Fund for SMEs (equal to 13.4 billion at 31 December
2018, +9.7%);

52
• 1.45 billion of subsidised loans and grants through management of the Sustainable
Growth Fund, destined for investments in the South (for 1.33 billion, +9%
compared to 2018);
• 1.55 billion of subsidised loans and contributions managed in relation to other
National and Regional Funds (e.g. FAR and PON of the Ministry of Education,
Universities and Research, FIT of the Ministry of Economic Development).
IS.2 - Initiatives for mobilising and disbursing new resources to the South
This measures (i) the resources assigned to Southern companies by third parties (e.g. the
Regions, basket bonds, EIF, CDP, other banks, etc.) co-financed with the Bank, (ii)
initiatives to channel and disburse new resources to companies and public administrations
in the South.
At 31 December 2019, resources assigned to companies in the South through third parties
in co-lending agreements with the Bank (e.g. Regions, basket bonds, EIF, IEB, Ministry of
Education, CDP, other banks, etc.) amounted to around 175 million.
Initiatives are also under way to channel and disburse other resources to companies and
the public administration of southern Italy in addition to the € 1.10 billion and € 0.37 billion
under management for the, respectively, 2007-2013 and 2014-2020 programs (national
and regional structured funds for the Guarantee Fund, agreements with other
intermediaries etc.), as well as the € 1.45 billion for research and development under the
referenced 2014-2020 program.
In particular, note the initiative promoted by the Campania Region, “Campania Bond
Guarantee”, relative to which the Bank, through a temporary consortium with FISG, was
awarded the tender issued by Sviluppo Campania to identify the arranger of the operation.
The contract was signed with Sviluppo Campania on 1 August 2019. For the Basket Bond,
the guarantee resources allocated by the Region totalled € 37 million.
IS.3 - Study, promotion and social support initiatives
This measures the resources directed by the Bank to support (i) new young and women’s
business initiatives, increases in size and internationalisation, research and innovation and
cultural and economic progress, (ii) social initiatives in the South, (iii) the performance of
studies aimed at supporting economic, social and employment growth in the South and

53
their diffusion to businesses and Public Administrations and (iv) study activities and
implementation of subsidy actions in favour of the South in support of Public
Administrations.
During the year various initiatives were carried out for the purposes of research, promotion
and social support. In particular:
• participation in meetings to promote subsidy projects in favour of companies in
southern Italy, to described the operations of the SME Guarantee Fund and provide
information about the reform for the Fund, also taking advantage of events
organised by the Ministry of Economic Development relative to initiatives known as
“Italy that works - Reform and tools to support businesses”, “Wikibusiness - at the
heart of development” and “Synergy for development - projects to support
businesses in Sicily”;
• participation in a series of meetings to launch a new subsidy tool “Campania Bond
Guarantee”;
• participation in a cycle of informational days known as “Remain in the South Days”,
organised by Invitalia, to prevent Bank loans associated with the Remain in the
South subsidy;
• participation in many other public appointments relative to the Guarantee Fund
(general operation, reform or specific aspects such as mini bonds and innovative
businesses), the Sustainable Growth Fund and Bank loans to southern Italian
businesses and the SME Portal.
• In particular, the Chief Executive Officer spoke at various meetings on the issue of
southern Italy and economic and social growth. Below we note the main meetings
held this year:
▪ Rome - presentation of the OECD report: Impactful finance - one route
to sustainable development (16 May 2019);
▪ Genoa - ASVIS event: Regions, cities and territories for sustainable
development (3 June 2019).

54
▪ 4 July 2019, Confindustria Benevento: Guarantee Fund, instruments
for SME in southern Italy;
▪ 22 July 2019 Confindustria Bari: “Let’s give credit to Italy” convention;
▪ 10 September 2019 Campania Development; Innovative finance for
growth;
▪ 2 November 2019 Mamma Seeds: Sustainable agriculture models
(Sicily)
▪ 29 November 2019: Confindustria Napoli: “Let’s give credit to Italy”
convention;
▪ 6 December 2019: “Social Impact Investments International
Conference” (social bond).
• As part of social support activities, of note is the sponsorship of the Christmas
Charity Gala organised by the Uniti del Cuore 2019 committee, to promote the
activities of associations operating in the Scampia neighbourhood of Naples, as well
as development projects to help local children;
• Cooperative agreements with universities and training entities in the area also
continued this year, with the aim of offering alternating work/study opportunities and
to help guide professional decisions, by offering direct knowledge of the working
world through internship opportunities at its offices;
▪ Participation at Career Day, on 4 May 2019, at Università Luiss Guido
Carli Rome;
▪ Renewal of cooperative agreements to promote internships with the
following universities: La Sapienza, Tor Vergata, Luiss Guido Carli and
RomaTre;
▪ Renewal of participation in the Lazio Region's "Garanzia Giovani”
program, intended to identify internships for new graduates and the
unemployed;

55
▪ Renewal of cooperation with the Centro per l’Impiego “Porta Futuro” in
Rome to favour work supply/demand balancing;
▪ During the first half of 2019 the “Alternating School/Work” project was
carried out, hosting 16 students from the Classical High School F. Vivona
in Rome;
▪ Renewal of cooperative agreements with the IPE specialisation schools
and with STOA’ (both in Naples) to identify promising new graduates;
▪ Strengthening the cooperation with Ateneo Universitario “Tor Vergata” in
Rome through the execution of initiatives aimed at inserting the most
worthy new graduates in the working world.
Environmental impact
In 2019, the internal communication campaign dedicated to environmental issues, energy
savings and sustainable mobility continued through specific projects, with the conviction
that environmental sustainability is not just a value to be defended but an action to be
spread.
In this context, we note:
- the promotion of usage of public transport through an increase in the contribution
from the Bank for the purchase of public transport passes;
- the careful management of the company fleet using selection criteria and usage
standards which respect the environment;
- the agreement with ECooltra (electric scooter sharing);
- the Bank’s continuous commitment to digitalise documents, with consequent use of
alternative conservation
The “Beyond” project began, through which the Bank intends to implement initiatives
primarily aimed at 3 areas: paperless, plastic free and water saving. To that end, we note:
- the initiative #refillati through which the Bank introduced usage of reusable water
bottles;
- establishing default front/back printing on all multi-function printers;
- the introduction of green stationery;

56
- the adoption of a “sustainability” communication campaign (e.g. best practices).
Analysis of the economic and financial situation represented as added
value
With regard to the Bank's 2019 results, the added value is shown in the following
Statement for Determination and Distribution of Added Value, a tool useful for giving an
overall view of the financial and non-financial performance of the organisation.
In 2019, "total economic value generated" saw a 16.8% increase with respect to 2018,
mainly due to profits from disposal and lower writedowns on loans. "Economic value
distributed" increased with respect to the previous year (11.9%), substantially due to the
increase in income taxes for the year.

57
Statement for determination and distribution of added value (values in thousands of €) 2019 2018
10. Interest and similar income 40,847 50,764 20. Interest and similar expense (-) (15,799) (18,859) 40. Fee and commission income 55,020 56,541 50. Fee and commission expense (net of expenses for external networks - e.g. agents, financial advisors) (-)
(365) (431)
80. Net gains/(losses) on trading activities 0 90. Net gains/(losses) on hedging activities (105) 9 100. Gains/(losses) on disposal or repurchase of: 9,038 867
a) financial assets measured at amortised cost 867 b) financial assets measured at fair value through other comprehensive income 9,038 0 c) financial liabilities 0
110. Net gains/(losses) of other financial assets and liabilities measured at fair value through profit and loss
(0.526) (0)
a) financial assets and liabilities measured at fair value b) other financial assets obligatorily measured at fair value (0.526) (0)
130. Net value adjustments for credit risk: (15,927) (26,774) a) financial assets measured at amortised cost (15,905) (26,786) b) financial assets measured at fair value through other comprehensive income (22) 13
140. Gains/losses from contractual changes without derecognition (288) 200. Other operating expense/income (net of expenses for external networks - e.g. agents, financial advisors)
713 462
250. Gains/(losses) on disposal of investments 12
A. TOTAL ECONOMIC VALUE GENERATED 73,132 62,591
160.b Other administrative expenses (after indirect taxes and donations/gifts) (‐) (13,782) (15,361)
ECONOMIC VALUE DISTRIBUTED TO SUPPLIERS (13,782) (15,361) 160.a Personnel expenses (including expenses for external networks – e.g. agents, financial advisers) (‐)
(25,271) (24,043)
ECONOMIC VALUE DISTRIBUTED TO EMPLOYEES AND COLLABORATORS (25,271) (24,043)
160.b Other administrative expenses: indirect taxes (‐) (251) (216)
270. Income taxes for the period (portion relative to current taxes, changes in current taxes from previous financial years and the reduction in current taxes for the year) (7,490) (2,203)
ECONOMIC VALUE DISTR. CENTRAL AND PERIPHERAL ADMINISTRATION (7,741) (2,419) 160.b Other administrative expenses: donations and gifts (-) (4) ECONOMIC VALUE DISTRIBUTED TO COMMUNITY AND ENVIRONMENT 0 (4)
B. TOTAL ECONOMIC VALUE DISTRIBUTED (46,794) (41,827)
170. Net provisions for risks and charges (2,053) 2,067 a) commitments and guarantees given (1,131.09) 726.03 b) net other provisions (922) 1,341
180. Net value adjustments on property, plant and equipment * (1,719.43) (285.14) 190. Net value adjustments on intangible assets (923) (598) 270. Income taxes for the period (for the portion relative to the change in deferred tax assets and the change in deferred tax receivables)
877 (1,746)
300. Profit destined to be carried forward ** (22,519) (20,201)
C. TOTAL ECONOMIC VALUE RETAINED (26,338) (20,764)
(*) Includes right of use (RoU) on properties and vehicles (**) See proposed allocation of profit for the period

58
Other information
Other information
This Report on the Financial Statements mainly develops aspects regarding the
performance of the Bank’s business, the performance indicators and the disclosure
required on Corporate Governance, also as regards financial information (pursuant to Art.
123-bis, Section two, letter b, of the Consolidated Law on Finance) and the system of
internal controls, including the requirements of Law 262/05 on investor protection, on the
basis of the provisions of Art 154-bis of the Consolidated Law on Finance.
All the other information required can be found in the Notes to the Financial Statements.
In particular, the information on risks and uncertainties is given in the Notes to the
Financial Statements, specifically in part A where the going concern information is
provided; risks and uncertainties linked to the use of estimates are considered in part B
(Section 10.6 Provisions for Risks and Charges); and part E illustrates in detail the
information on financial and operational risks.
The Notes to the Financial Statements also give information on relations with the Parent
Company and the Group companies, in part H, Transactions with related parties.
Significant subsequent events
On 14 February 2020, Law 5 of 7 February 2020 was published in the Official Journal no.
37, converting into law, with amendments, Decree Law 142 of 16 December 2019,
containing urgent measures to support the credit system in southern Italy and to create an
investment bank, assigning to the Agenzia Nazionale per l’attrazione investimenti e lo
sviluppo d’impresa S.p.A. – Invitalia, capital grants, up to a total maximum of € 900 million
for 2020, entirely intended to strengthen equity through capital grants in favour of Banca
del Mezzogiorno – Mediocredito Centrale S.p.A. so that it can promote, using market logic,
criteria and conditions, the development of financial and investment activities, including to
support businesses and employment in southern Italy, to be accomplished through
financial transactions, including the acquisition of equity investments in banking and
financial companies.
As of the date the financial statements were approved, COVID-19 (also known as
Coronavirus), which originated in China, was spreading throughout Italy.
59
Given the exceptional situation seeing rapid developments, and considering the two
activity lines around which MCC's business operates, it is foreseeable that companies and
especially SME, the Bank’s target customers, will be affected by the possible long-term
duration of the epidemic. In this sense, it will be fundamental to consider possible
extraordinary support projects, both national and EU-wide, political, economic and
financial. These are currently being discussed, as well as the implementation of adequate
and targeted actions to, if necessary, support and calm the markets while assisting
enterprises lacking liquidity (especially SME). Also in terms of the possible worsening of
the creditworthiness of borrower companies or companies who will be borrowing, as well
as the system to which the Bank belongs, only in the coming weeks will it be possible to
assess possible impacts, also in the light of regulatory and legislative actions which may
be issued.
Therefore, at present the impacts on Bank business associated with the disease cannot
yet be foreseen.
The Bank guarantees compliance with the provisions issued by the relevant authorities,
prioritising the requirements to protect its staff and institutional needs for continuation
provision of services.
Business outlook
On 31 December the MCC Board of Directors resolved to sign a framework agreement
with Banca Popolare di Bari (BPB) and the Interbank Deposit Protection Fund (FITD)
which identifies the essential steps through which Banca Popolare di Bari can be
restructured and recapitalised in the coming months, with total funds involved not to
exceed € 1.4 billion.
The project involving Banca Popolare di Bari, as outlined in the framework agreement, is
subordinate to the fulfilment of a series of conditions. These include, beyond the
necessary authorisations from the relevant supervisory authorities, the adoption of the
relative implementation decrees to ensure adequate capital for MCC, as well as a lack of
any indications received from the European Commission contrary to the transaction, in
terms of the rules for government aid.
With the goal of favouring the successful completion of the operation, MCC will determine
the amount of its contribution as a function of the expected remuneration of invested
capital, in line with normal investment conditions and anchored to market parameters and
logic, with the preparation of a business plan by BPB and in-depth assessment to be

60
carried out in coming months, also with reference to the results coming from past
management.
MCC’s actions will be consistent with the methods and aims indicated in Law 5 of 7
February 2020, converted to law, with amendments, from Decree Law 142 of 16
December 2019, containing “urgent measures to support the credit system in southern
Italy and to create an investment bank”, thanks to which MCC will be strengthened to allow
it to promote, through market logic, criteria and conditions, the development of financial
and investment business, also to support companies in southern Italy, in part to be carried
out through acquisition of equity investments in banks.
Proposed allocation of net income for the period
We present to the Shareholder the following proposal for allocation of net income for the
period, amounting to € 22,518,990.13:
- € 1,125,949.51 to the legal reserve;
- € 21,393,040.62 to the extraordinary reserve.

61
Accounting statements
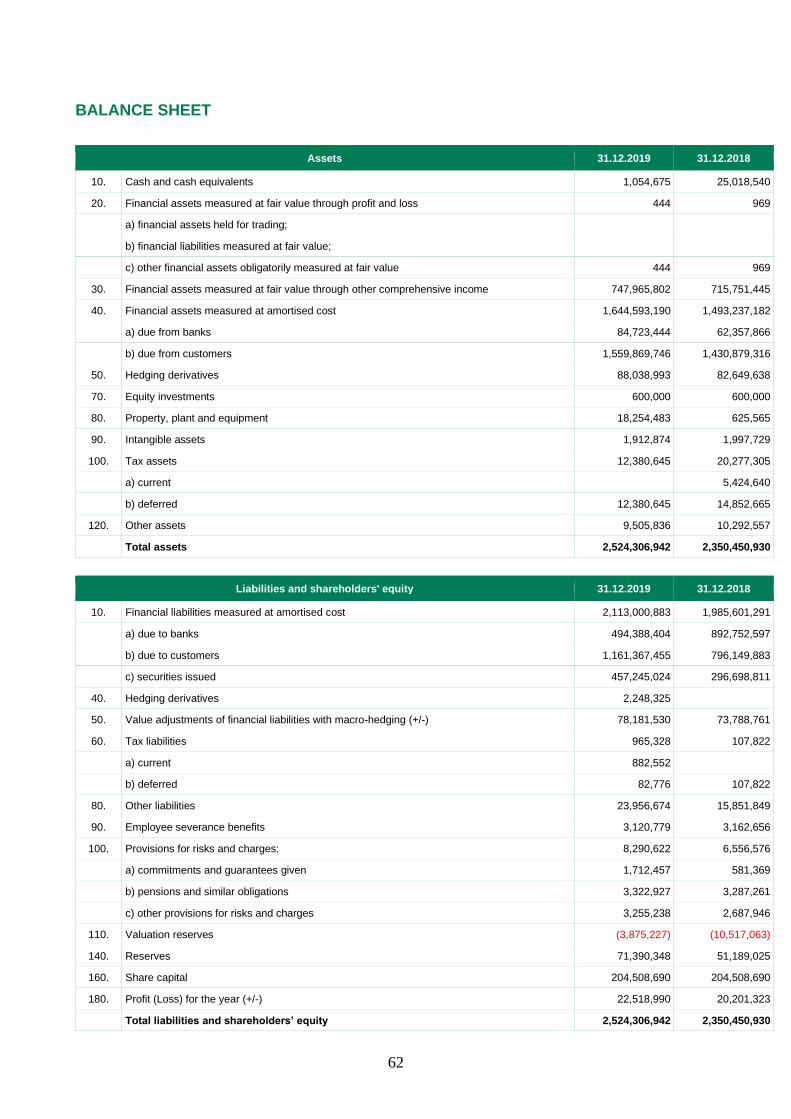
62
BALANCE SHEET
Assets 31.12.2019 31.12.2018
10. Cash and cash equivalents 1,054,675 25,018,540
20. Financial assets measured at fair value through profit and loss 444 969
a) financial assets held for trading;
b) financial liabilities measured at fair value;
c) other financial assets obligatorily measured at fair value 444 969
30. Financial assets measured at fair value through other comprehensive income 747,965,802 715,751,445
40. Financial assets measured at amortised cost 1,644,593,190 1,493,237,182
a) due from banks 84,723,444 62,357,866
b) due from customers 1,559,869,746 1,430,879,316
50. Hedging derivatives 88,038,993 82,649,638
70. Equity investments 600,000 600,000
80. Property, plant and equipment 18,254,483 625,565
90. Intangible assets 1,912,874 1,997,729
100. Tax assets 12,380,645 20,277,305
a) current 5,424,640
b) deferred 12,380,645 14,852,665
120. Other assets 9,505,836 10,292,557
Total assets 2,524,306,942 2,350,450,930
Liabilities and shareholders' equity 31.12.2019 31.12.2018
10. Financial liabilities measured at amortised cost 2,113,000,883 1,985,601,291
a) due to banks 494,388,404 892,752,597
b) due to customers 1,161,367,455 796,149,883
c) securities issued 457,245,024 296,698,811
40. Hedging derivatives 2,248,325
50. Value adjustments of financial liabilities with macro-hedging (+/-) 78,181,530 73,788,761
60. Tax liabilities 965,328 107,822
a) current 882,552
b) deferred 82,776 107,822
80. Other liabilities 23,956,674 15,851,849
90. Employee severance benefits 3,120,779 3,162,656
100. Provisions for risks and charges: 8,290,622 6,556,576
a) commitments and guarantees given 1,712,457 581,369
b) pensions and similar obligations 3,322,927 3,287,261
c) other provisions for risks and charges 3,255,238 2,687,946
110. Valuation reserves (3,875,227) (10,517,063)
140. Reserves 71,390,348 51,189,025
160. Share capital 204,508,690 204,508,690
180. Profit (Loss) for the year (+/-) 22,518,990 20,201,323
Total liabilities and shareholders’ equity 2,524,306,942 2,350,450,930

63
INCOME STATEMENT
Item 31.12.2019 31.12.2018
10. Interest and similar income 40,846,875 50,763,914
of which interest income calculated using the effective interest method
20. Interest and similar expenses (15,798,963) (18,859,233)
30. Net interest income 25,047,912 31,904,681
40. Fee and commission income 55,019,586 56,540,913
50. Fee and commission expense (364,830) (432,266)
60. Net fees and commissions 54,654,756 56,108,647
80. Net gains/(losses) on trading activities
90. Net gains/(losses) on hedging activities (104,910) 8,626
100. Gains/(losses) on disposal or repurchase of: 9,038,390 867,427
a) financial assets measured at amortised cost 867,427
b) financial assets measured at fair value through other comprehensive income 9,038,390
c) financial liabilities
110. Net gains/(losses) of other financial assets and liabilities measured at fair value through profit and loss (526) (214)
a) financial assets and liabilities measured at fair value
b) other financial assets obligatorily measured at fair value (526) (214)
120. Net banking and insurance income 88,635,622 88,889,167
130. Net value adjustments for credit risk: (15,927,139) (26,773,908)
a) financial assets measured at amortised cost (15,905,251) (26,786,433)
b) financial assets measured at fair value through other comprehensive income (21,888) 12,525
140. Gains/losses from contractual changes without derecognition (288,398)
150. Net gains/(losses) on financial operations 72,420,085 62,115,259
160. Administrative expenses: (39,305,160) (39,622,747)
a) personnel expenses (25,271,491) (24,041,270)
b) other administrative expenses (14,033,669) (15,581,477)
170. Net provisions for risks and charges (2,053,352) 2,066,544
a) commitments and guarantees given (1,131,087) 726,030
b) net other provisions (922,265) 1,340,514
180. Net value adjustments on property, plant and equipment (1,719,432) (285,142)
190. Net value adjustments on intangible assets (923,298) (597,711)
200. Other operating income/expenses 712,710 462,186
210. Operating expenses (43,288,532) (37,976,870)
250. Gains/(losses) on disposal of investments 12,000
260. Profit (Loss) from continuing operations before tax 29,131,553 24,150,389
270. Income taxes for the period on continuing operations (6,612,563) (3,949,066)
280. Profit (Loss) from continuing operations after tax 22,518,990 20,201,323
300. Profit (Loss) for the year 22,518,990 20,201,323
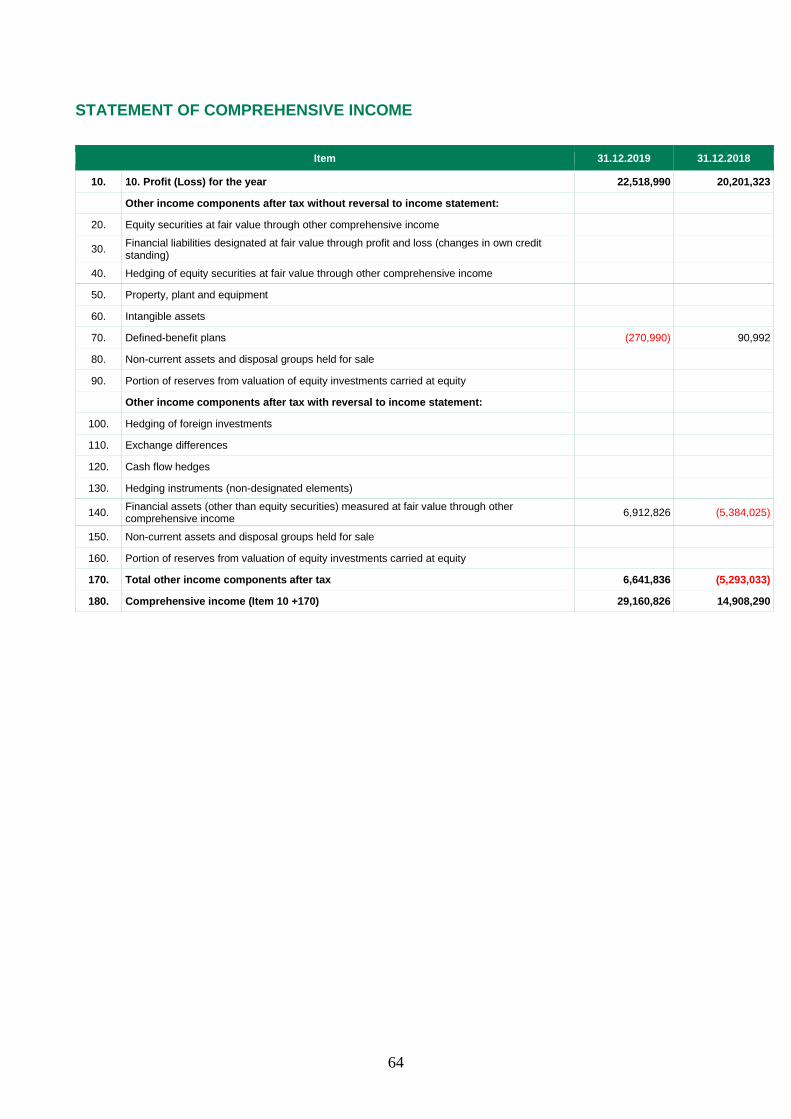
64
STATEMENT OF COMPREHENSIVE INCOME
Item 31.12.2019 31.12.2018
10. 10. Profit (Loss) for the year 22,518,990 20,201,323
Other income components after tax without reversal to income statement:
20. Equity securities at fair value through other comprehensive income
30. Financial liabilities designated at fair value through profit and loss (changes in own credit standing)
40. Hedging of equity securities at fair value through other comprehensive income
50. Property, plant and equipment
60. Intangible assets
70. Defined-benefit plans (270,990) 90,992
80. Non-current assets and disposal groups held for sale
90. Portion of reserves from valuation of equity investments carried at equity
Other income components after tax with reversal to income statement:
100. Hedging of foreign investments
110. Exchange differences
120. Cash flow hedges
130. Hedging instruments (non-designated elements)
140. Financial assets (other than equity securities) measured at fair value through other comprehensive income 6,912,826 (5,384,025)
150. Non-current assets and disposal groups held for sale
160. Portion of reserves from valuation of equity investments carried at equity
170. Total other income components after tax 6,641,836 (5,293,033)
180. Comprehensive income (Item 10 +170) 29,160,826 14,908,290

65
STATEMENT OF CHANGES IN SHAREHOLDERS' EQUITY - YEAR 2019
Allocation of previous
year’s results Changes during the period Shareholders’ equity at
Bala
nc
e a
t 3
1.1
2.2
018
Ch
an
ges
in
op
en
ing
bala
nce
Bala
nc
e a
t 0
1.0
1.2
019
Reserv
es
Div
ide
nd
s a
nd
oth
er
allo
ca
tio
ns
Ch
an
ges
in
res
erv
es
Sh
are
ho
lders
’ e
qu
ity
tran
sa
cti
on
s -
Is
su
e o
f n
ew
sh
are
s
Sh
are
ho
lders
’ e
qu
ity
tran
sa
cti
on
s -
Pu
rch
ase
of
trea
su
ry s
hare
s
Sh
are
ho
lders
’ e
qu
ity
tran
sa
cti
on
s -
Extr
ao
rdin
ary
dis
trib
uti
on
of
div
iden
ds
Sh
are
ho
lders
’ e
qu
ity
tran
sa
cti
on
s -
Ch
an
ges
in e
qu
ity i
ns
tru
me
nts
Sh
are
ho
lders
’ e
qu
ity
tran
sa
cti
on
s -
Deri
va
tiv
es
on
tre
as
ury
sh
are
s
Sh
are
ho
lders
’ e
qu
ity
tran
sa
cti
on
s -
Sto
ck
op
tio
ns
Co
mp
reh
en
siv
e i
nc
om
e
year
to 3
1.1
2.2
019
31.1
2.2
019
Share capital 204,508,690 204,508,690 204,508,690
a) ordinary shares 204,508,690 204,508,690 204,508,690
b) other shares
Share premium reserve
Reserves 51,189,025 51,189,025 20,201,323 71,390,348
a) of profits 51,189,025 51,189,025 20,201,323 71,390,348
b) other
Valuation reserves (10,517,063) (10,517,063) 6,641,836 (3,875,227)
Equity instruments
Own shares
Profit (Loss) for the year 20,201,323 20,201,323 (20,201,323) 22,518,990 22,518,990
Shareholders’ equity 265,381,975 265,381,975 29,160,826 294,542,801

66
STATEMENT OF CHANGES IN SHAREHOLDERS' EQUITY - YEAR 2018
Allocation of previous
year’s results Changes during the period Shareholders’ equity at
Bala
nc
e a
t 3
1.1
2.2
017
Ch
an
ges
in
op
en
ing
bala
nce
Bala
nc
e a
t 0
1.0
1.2
018
Reserv
es
Div
ide
nd
s a
nd
oth
er
allo
ca
tio
ns
Ch
an
ges
in
res
erv
es
Sh
are
ho
lders
’ e
qu
ity
tran
sa
cti
on
s -
Is
su
e o
f
new
sh
are
s
Sh
are
ho
lders
’ e
qu
ity
tran
sa
cti
on
s -
Pu
rch
ase
of
trea
su
ry s
hare
s
Sh
are
ho
lders
’ e
qu
ity
tran
sa
cti
on
s -
Extr
ao
rdin
ary
dis
trib
uti
on
of
div
iden
ds
Sh
are
ho
lde
rs’
eq
uit
y
tran
sa
cti
on
s -
Ch
an
ges
in e
qu
ity i
ns
tru
me
nts
Sh
are
ho
lders
’ e
qu
ity
tran
sa
cti
on
s -
Deri
va
tiv
es
on
tre
as
ury
sh
are
s
Sh
are
ho
lders
’ e
qu
ity
tran
sa
cti
on
s -
Sto
ck
op
tio
ns
Co
mp
reh
en
siv
e i
nc
om
e
peri
od
en
ded
31
.12
.2018
31.1
2.2
018
Share capital 204,508,690 204,508,690 204,508,690
a) ordinary shares 204,508,690 204,508,690 204,508,690
b) other shares
Share premium reserve
Reserves 36,330,245 (5,494,449) 30,835,796 20,353,228 51,189,024
a) of profits 36,330,245 (5,494,449) 30,835,796 20,353,228 51,189,024
b) other
Valuation reserves (5,611,236) 387,206 (5,224,030) (5,293,033) (10,517,063)
Equity instruments
Own shares
Profit (Loss) for the year 20,353,228 20,353,228 (20,353,228) 20,201,323 20,201,323
Shareholders’ equity 255,580,927 (5,107,243) 250,473,684 14,908,290 265,381,974
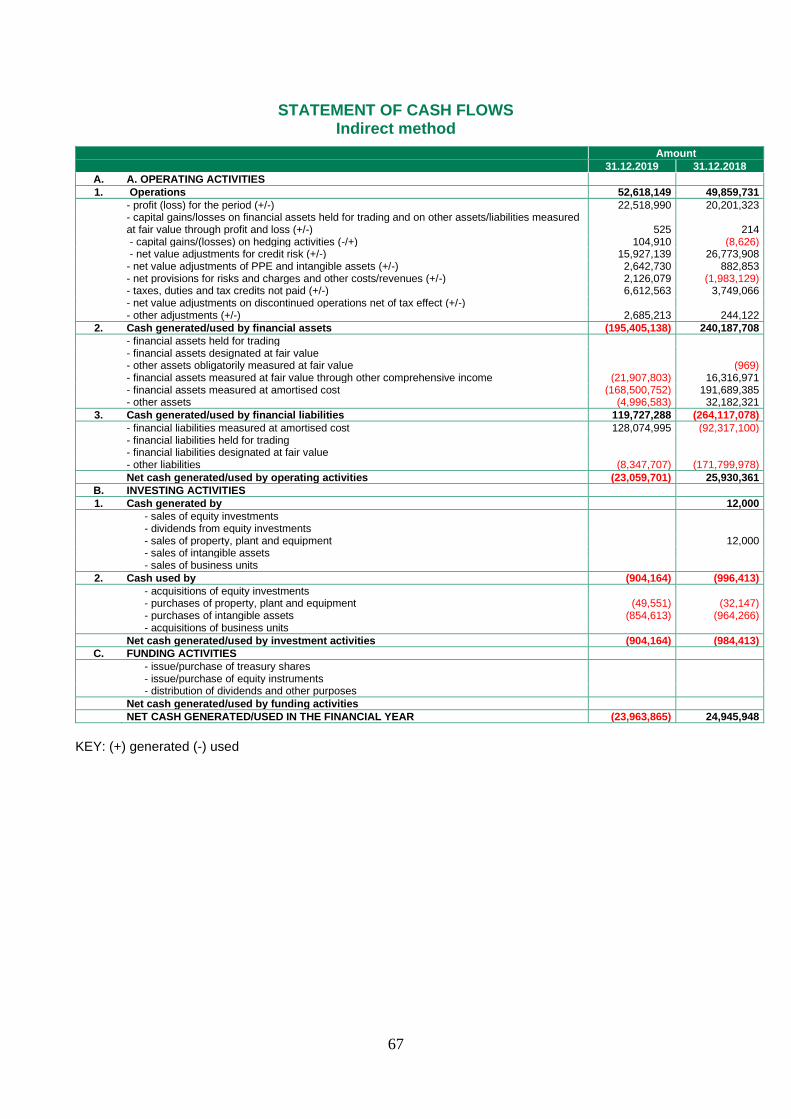
67
STATEMENT OF CASH FLOWS Indirect method
Amount
31.12.2019 31.12.2018
A. A. OPERATING ACTIVITIES
1. Operations 52,618,149 49,859,731
- profit (loss) for the period (+/-) 22,518,990 20,201,323
- capital gains/losses on financial assets held for trading and on other assets/liabilities measured at fair value through profit and loss (+/-) 525 214
- capital gains/(losses) on hedging activities (-/+) 104,910 (8,626) - net value adjustments for credit risk (+/-) 15,927,139 26,773,908 - net value adjustments of PPE and intangible assets (+/-) 2,642,730 882,853 - net provisions for risks and charges and other costs/revenues (+/-) 2,126,079 (1,983,129) - taxes, duties and tax credits not paid (+/-) 6,612,563 3,749,066 - net value adjustments on discontinued operations net of tax effect (+/-) - other adjustments (+/-) 2,685,213 244,122
2. Cash generated/used by financial assets (195,405,138) 240,187,708
- financial assets held for trading - financial assets designated at fair value - other assets obligatorily measured at fair value (969) - financial assets measured at fair value through other comprehensive income (21,907,803) 16,316,971 - financial assets measured at amortised cost (168,500,752) 191,689,385 - other assets (4,996,583) 32,182,321
3. Cash generated/used by financial liabilities 119,727,288 (264,117,078)
- financial liabilities measured at amortised cost 128,074,995 (92,317,100) - financial liabilities held for trading - financial liabilities designated at fair value - other liabilities (8,347,707) (171,799,978)
Net cash generated/used by operating activities (23,059,701) 25,930,361
B. INVESTING ACTIVITIES
1. Cash generated by 12,000
- sales of equity investments - dividends from equity investments - sales of property, plant and equipment 12,000 - sales of intangible assets - sales of business units
2. Cash used by (904,164) (996,413)
- acquisitions of equity investments - purchases of property, plant and equipment (49,551) (32,147) - purchases of intangible assets (854,613) (964,266) - acquisitions of business units
Net cash generated/used by investment activities (904,164) (984,413)
C. FUNDING ACTIVITIES
- issue/purchase of treasury shares - issue/purchase of equity instruments - distribution of dividends and other purposes
Net cash generated/used by funding activities
NET CASH GENERATED/USED IN THE FINANCIAL YEAR (23,963,865) 24,945,948
KEY: (+) generated (-) used

68
RECONCILIATION
Amount
Accounting item 31.12.2019 31.12.2018
Cash and cash equivalents at start of period 25,018,540 72,592
Total net cash generated/used in the period (23,963,865) 24,945,948
Cash and cash equivalents: effect of currency fluctuation
Cash and cash equivalents at end of period 1,054,675 25,018,540

69
Notes to the Financial Statements

70
Part A – Accounting policies

71
A1. General information
Section 1 - Declaration of compliance with International Financial Reporting
Standards
The Financial Statements at 31 December 2019, independently audited by the
company PricewaterhouseCoopers S.p.A. have been drawn up according to the
IAS/IFRS accounting standards issued by the International Accounting Standards
Board (IASB) and the related interpretations of the International Financial Reporting
Interpretations Committee (IFRIC) and endorsed by the European Commission, as
provided for in European Union Regulation no. 1606 of 19 July 2002 up to the date of
approval of the Draft Financial Statements by the Board of Directors.
The Financial Statements at 31 December 2019 have been prepared on the basis of
the instructions for preparing Financial Statements issued by the Bank of Italy,
exercising the powers established by art. 9 of Legislative Decree 38/2005 and article
43 of Legislative Decree 136/2015, with the Provision of 22 December 2005, with
which Circular no. 262/05 was issued, as well as the subsequent amendments, the
most recent on 30 November 2018. These instructions establish the format of the
Financial Statements and the related preparation methods, as well as the content of
the Notes to the Financial Statements. In support of the comments on the results of
the period, the Report on Operations presents and illustrates the reclassified Income
Statement and Balance Sheet.
Section 2 - Basis of preparation
The present Financial Statements are made up of the Balance Sheet, the Income
Statement, the Statement of Comprehensive Income, the Statement of Changes in
Shareholders’ Equity, the Statement of Cash Flows (prepared applying the “indirect
method”) and the Notes to the Financial Statements, and they are accompanied by a
Report on Operations, on the economic results achieved and on the Bank’s financial
situation.
No exceptions were made to application of the IAS/IFRS accounting standards.
The figures in the Financial Statements correspond to the company’s accounting
entries which, in turn reflect the business events that occurred during the period.
The Financial Statements have been prepared to present a true and fair view of the
Bank’s financial situation, results of operations in the period and cash flows. The
72
Financial Statements have been prepared with a going concern assumption because
there is a reasonable expectation that the company will continue with its operating
activity in the foreseeable future (IAS 1 para. 23), in observance of the accruals
concept (IAS 1 para. 25 and 26) and of consistent presentation and classification of
the accounting items (IAS 1 para. 27). Assets and liabilities, and revenues and costs
have not been offset unless offsetting is required or permitted by a standard or an
interpretation (IAS 1, para. 32). These criteria did not change from the previous year.
The Financial Statements have been prepared using the euro as accounting
currency, while the amounts in the Notes to the Financial Statements are expressed
in thousands of euro and those in the Report on Operations in millions of euro.
Section 3 - Subsequent events
Subsequent to the Financial Statements reporting date no events occurred that
would lead to adjustments in the Bank’s economic results, equity and financial
situation, in accordance with IAS 10, paragraph 10.
With particular reference to the spread of COVID-19, initially in China, and
subsequently in other countries, including Italy, this event does not involve
adjustments to balance sheet figures, pursuant to IAS 10, paragraph 21, given that
the existence of an international emergency was declared by the World Health
Organisation only as of the end of January 2020.
Section 4 - Other aspects
Going concern information
While preparing the financial statements, directors must assess the entity’s ability to
continue to operate as a going concern. The Financial Statements must be drawn up
on a going concern basis, unless management intends to liquidate or wind up the
company or has no other realistic alternatives. If management, when making its
assessments, is aware of significant uncertainties in relation to events or conditions
that could lead to serious doubts on the company’s ability to continue as a going
concern, these uncertainties must be disclosed. If the Financial Statements are not
drawn up assuming that the business is a going concern, this fact must be indicated,
together with the criteria on the basis of which the statements have been drawn up
and the reason for which the company is no longer considered a going concern.

73
Considering the risks and uncertainties linked to the present macro economic context
and on the basis of the best information available when these financial statements
were being prepared (see the Report on Operations - “Significant subsequent events”
and “Business outlook”), it is reasonable to expect the Bank to continue to exist and
to operate in the foreseeable future; furthermore its capital and financial structure and
business performance do not demonstrate any symptoms which could determine
significant uncertainties on the specific point and, consequently, the financial
statements have been drawn up considering the company as a going concern.
Risks and uncertainties linked to the use of estimates
Preparation of the Financial Statements also requires use of estimates and
assumptions which may have influence the values recognised in the Balance Sheet
and Income Statement, as well as information relative to contingent assets and
liabilities.
Estimates and the relative hypotheses are based on the use of available
management data and subject assessments based on historic experience.
By their nature, the estimates and assumptions used may change from year to year
and, therefore, it is possible that in subsequent years the actual values shown in the
Financial Statements may differ, even significantly, as a result of a change in the
subjective evaluations used.
The main cases which involve the most use of subjective valuations by company
management are:
- quantification of losses due to reduction in the value of loans, securities, equity
investments and, in general, other financial assets;
- quantification of provisions for risks and charges (determined on the estimate of
the outgoings necessary to fulfil the obligations for which it is considered probable
that resources will have to be used);
- quantification of employees’ severance indemnity provisions, of the company
pension fund and of the other employee benefits (determined on the estimate of
the present value of the obligations referred to the probable outgoings which are
discounted considering financial aspects—interest rates—estimated trend of
remuneration, turnover rates and demographic data);
- deferred tax assets (the recognition of items related to deferred tax assets is
based on the assessment that in coming years the Bank will produce taxable
74
income of amounts such as to have the reasonable certainty that the future taxes
to be paid on the said income will enable full absorption of the deferred tax
assets);
- use of assessment models to determinate the fair value related to financial
instruments not quoted on active markets.
It follows, therefore, that risk assessment is mainly linked both to the evolution of the
national and international socio-economic context (including effects linked to COVID-
19), and to the performance of the financial markets, which can have consequences
on the trend in bank rates, price fluctuations, actuarial bases and, more in general,
counterparties’ creditworthiness.
New accounting standards and interpretations and those coming into force
shortly
Accounting standards and interpretations applied since 1 January 2019
As required under IAS 8 - Accounting policies, changes in accounting estimates and
errors - we list here new international accounting standards or amendments to
already applicable accounting standards for which application became obligatory as
of 1 January 2019:
• IFRS 16 – Leasing, adopted with Regulation EU 1986/2017. The standard intends
to improve accounting recognition of leasing contracts. IFRS 16 (Leases) replaces
the accounting standard IAS 17, as well as IFRIC Interpretations 4 (Determining
whether an Arrangement contains a Lease), SIC 15 (Operating Leases –
Incentives) and SIC 27 (Evaluating the Substance of Transactions Involving the
Legal Form of a Lease). The standard provides a new definition of a lease and
introduces a criteria based on control (right of use) over an asset to distinguish
leasing contracts from service contracts, identifying the following as discriminating
factors: identification of the asset, the right to replacement of the same, the right
to substantially obtain all economic benefits deriving from use of the asset and the
right to direct the use of the asset underlying the contract. The objective is to
guarantee greater consistency between financial statements due to different
accounting measures used between operating and financial leasing. The standard
establishes a single model for recognising and measuring leasing contracts for
the lessee, which involves the recognition of the asset involved in the lease (even

75
if operating) in the assets, with a contraentry as a financial payable, also offering
the possibility of not recognising as leases contracts relative to low-value assets
and leases with contractual durations of 12 months or less. The new standard
does not involve significant changes for lessors.
• Amendments to IFRS 9 - Financial instruments - Prepayment features with
negative compensation, adopted with Regulation EU 498/2018. The amendments
made are aimed at clarifying classification of certain financial assets which can be
redeemed in advance when IFRS 9 applies.
• Interpretation IFRIC 23 - Uncertainty about treatments relative to income taxes,
adopted with Regulation EU 1595/2018, the objective is to specify how to reflect
uncertainties when recognising income taxes.
• Annual Improvements to IFRSs 2015 - 2017 Cycle adopted with Regulation EU
412/2019; the amendments involve:
- Amendments to IFRS 3 - Business combinations: clarifies that when a party to
a joint control agreement acquires control over a jointly controlled asset, the
transaction is a business combination carried out in multiple stages.
- Amendments to IFRS 11 - Joint arrangements: clarifies that a party investing
in a jointly controlled asset without having joint control, in the case in which
they acquire joint control they must redetermine the fair value of the previously
held interest.
- Amendments to IAS 12 - Income taxes: establishes that an entity must
recognise the tax effects of dividends, as defined under IFRS 9, for the
purposes of income taxes at the time the liability to be paid relative to the
dividend is recognised.
- Amendments to IAS 23 - Borrowing costs: establishes that, to the degree that
an entity generically acquires debt and uses financing to obtain an asset that
justifies capitalisation, the entity must determine the amount of capitalised
borrowing costs, applying a capitalisation rate to the costs sustained for the
asset. This capitalisation rate must correspond with the weighted average of
borrowing costs applicable to all of the entity’s loans in existence during the
year. However, the entity must exclude from the calculation borrowing costs
applicable to the loans specifically obtained to acquire an asset which justifies
capitalisation until substantially all transactions necessary to prepare the asset
for the planned usage or sale have been completed.

76
• Amendments to IAS 28 – Investments in associates and joint ventures - Long-
term Interests in Associates and Joint Ventures, adopted with Regulation EU
237/2019. These amendments clarify that an entity which does not apply the
equity method to financial instruments relative to associated companies or joint
ventures must apply IFRS 9 to long-term interests, without taking account of any
value adjustments made to the same.
• Amendments to IAS 19 – Employee benefits - Plan Amendment, Curtailment or
Settlement: adopted with Regulation EU 402/2019. The objective of the
amendments is to clarify that after amendment, curtailment or settlement of a
defined benefit plan, the entity must apply hypotheses updated through
redetermination of the net liability (asset) for defined benefits for the remainder of
the reference period.
Accounting standards and interpretations coming into force shortly
As of the date these financial statements were approved, the following
standards/interpretations had been issued by the IASB and approved by the
European Union, for adoption as of 1 January 2020:
• Amendments to the Conceptual Framework;
• Amendments to IAS 1 and IAS 8: Definition of Material.
• Amendments to IFRS 9, IAS 39 and IFRS 7: Interest Benchmark Reform
The following standards/interpretations are still awaiting approval by the European
Union:
• Amendments to IFRS 3 Business combination;
• IFRS 17 – Insurance contracts.
The consequences that these standards, amendments and interpretations coming
into force shortly may have on the financial disclosure are being examined and
assessed.
The transition to international accounting standard IFRS 16
Regulatory provisions

77
The new accounting standard IFRS 16, issued by the IASB in January 2016 and
approved by the European Commission through Regulation 1986/2017, as of 1
January 2019, replaced IAS 17 Leasing, IFRIC 4 Determining Whether an
Arrangement Contains a Lease, SIC 15 Operating Leases - Incentives and SIC 27
Evaluating the Substance of Transactions in the Legal Form of a Lease, and governs
requirements for recognising leasing contracts.
The new standard requires determination of whether a contract is or contains a
lease, based on the concept of control over the use of an identified asset for a given
period of time. It follows that rental, leasing or free rent contracts also fall within the
scope of the new rules.
In light of the above, significant changes were introduced in terms of recognising
leasing transactions in the financial statements of the lessee/user, involving the
introduction of a single accounting model, based on the right of use. More
specifically, the main change consists in overcoming the distinction between
operating and financial leases according to IAS 17: all leasing contracts must be
recognised in the same manner, as an asset and as a liability. The accounting model
involves recognition of the right of use relative to the leased asset in the Balance
Sheet Assets, while the payables due for the leasing yet to be paid are recognised in
the Liabilities. The method of recognising components in the income statement has
also changed. While under IAS 17 leasing fees were recognised under Administrative
Expenses, under IAS 16, charges relative to amortisation/depreciation of the right of
use and interest expense on the payable are recognised under the relevant items.
On the other hand, outside of greater disclosure requirements, there are no
substantial changes with regards to leasing accounting for the lessor, as the
distinction between operating and financial leases continues.
As of 1 January 2019, the effects on the financial statement with regards to the
application of IFRS 16 for the lessee - assuming profitability and final cash flows are
the same - involve an increase in the assets recorded in the financial statements
(leased assets) an increase in the liabilities (payable with regards to the leased
asset), a decrease in administrative expenses (leasing fees) and a simultaneous
increase in financial expense (payment of the recognised payable) and
amortisation/depreciation (relative to rights of use). With reference to the income
statement, considering the entire duration of the contracts the economic impact does
78
not change over the total horizon of the lease, whether applying the previous IAS 17
or the new IFRS 16, but the division occurs differently over the time period.
During 2018, together with the Group to which it belongs, the Bank began a specific
project to implement IFRS 16 - Leasing in order to investigate and determine the
associated qualitative and quantitative impacts. In terms of procedure, the IT
outsourcer provided a specific application module to determine values under IFRS
16.
Scope of contracts - lessee
The Standard applies to all types of contracts which contain a lease, that is contracts
which give the lessee the right to control usage of an identified asset for a given
period of time (period of use) in exchange for a fee. The logic of the Standard is that
"control" over an asset requires the asset be identified, for example if explicitly
specified within the contract, or implicitly specified at the moment it becomes
available for use by the customer. An asset is not specified if the supplier has the
substantial right to replace it or if the supplier is essentially able to substitute the
asset with an alternative asset throughout the period of use and receives economic
benefits from making use of this right.
Once it has been established that an identified asset underlies the contract, it must
be determined whether the entity has the right to control it, as it simultaneously has
both the right to obtain substantially all economic benefits deriving from use of the
asset and the right to decide on the use of the identified asset.
For the Bank, analysis of the contracts falling under the scope of the standard
involved those in the following categories: (i) real estate, (ii) vehicles. Real estate
leasing contracts represented the most significant area of impact in that these
contracts represent 99.7% of the value of rights of use. In general, real estate leasing
contracts have terms exceeding 12 months and generally include renewal and
termination options which can be exercised by either the lessor or lessee based on
the rules of the law or specific contractual provisions. Generally, these contracts do
not include a purchase option at the end of the lease or significant restoration costs
for the Bank.
Contracts regarding other types of leasing involve vehicles. These are long-term
leasing contracts for the company fleet, made available to certain employees. They

79
have a multi-year term, without renewal options. These contracts generally do not
include an option to purchase the asset.
The Bank's choices
The Bank decided to carry out First-Time Adoption (FTA) of IFRS 16 using the
modified retrospective approach, which offers the option, to recognise the cumulative
effects of applying the Standard as of the date of FTA and not to restate comparative
amounts in the financial statements where IFRS 16 is applied for the first time.
Therefore, amounts from accounting schedules relative to financial year 2019 are not
comparable with reference to the amounts for rights of use and corresponding
leasing payables. At first-time application, the Bank adopted some of the practical
expedients provided under the standard in paragraph C10 and subsequent. More
specifically, contracts with remaining terms of 12 months or less were excluded
("short-term contracts"). Also, when applied in its entirety, the Bank has decided not
to apply the new standard to contracts with a total term of 12 months or less or to low
value contracts, that is contracts where the value of the underlying asset, when new,
is € 5,000 or less.
Contractual term
The term of a lease is determined by the non-annullable period during which the
Bank has the right to use the underlying asset, also considering: (i) periods covered
by options to extend the lease, if the lessee is reasonably certain to exercise the
option; and (ii) periods covered by options to terminate the lease, if the lessee is
reasonably certain it will not exercise this option.
Discount rate
With regards to the discount rate, on the basis of IFRS 16 requirements, the Bank
uses the marginal loan rate, that is the rate that would be applied to disburse a loan
with a similar duration and guarantees.
The effects of first-time application (FTA) of IFRS 16
The adjustment of the opening financial statements following application of IFRS 16
using a modified retrospective approach led to an increase in assets, following the
recognition of new rights of use totalling € 12,024 thousand, and an increase in

80
financial liabilities (payable due to the lessor) of the same amount. Therefore, first-
time application of the standard did not give rise to impacts on shareholders' equity
since, given the choice to adopt the modified approach (option B), asset and liability
values coincide at first time application.
IFRS 16 provides a practical expedient for first time application which allows the
Bank to not redetermine the scope of application, but instead apply the standard
solely to leasing contracts identified on the basis of the requirements of IAS 17 and
IFRS 4 (paragraph C3a of IFRS 16). More specifically, at FTA, the Bank used the
practical expedient in paragraph C3 referenced above. For all operating leases
classified as such under IAS 17, it recognised liabilities determined as future
discounted fees as well as rights of use in the same amount (known as modified B).
Below are the individual financial statement items affected by the change to the
opening balances.
Assets 31.12.2018 Impact of IFRS 16 01.01.2019
80. Property, plant and equipment 625,565 12,023,911 12,649,476
Total assets 2,350,450,930 12,023,911 2,362,474,841
Liabilities and shareholders' equity 31.12.2018 Impact of IFRS 16 01.01.2019
10. Financial liabilities measured at amortised cost 1,985,601,291 12,023,911 1,997,625,202
Total liabilities and shareholders’ equity 2,350,450,930 12,023,911 2,362,474,841

81
A.2 FINANCIAL STATEMENT ITEMS
1. Financial assets measured at fair value through profit and loss (FVTPL)
Classification criteria
This category includes financial assets other than those classified among financial
assets measured at fair value through other comprehensive income and among
financial assets measured at amortised cost. In particular, the item includes:
- financial assets held for trading;
- financial assets which must be measured at fair value, represented by financial
assets which do not meet the requirements for measurement at amortised cost or
fair value through other comprehensive income. These are financial assets for
which the contractual terms do not involve solely payments of principal and
interest (meaning the SPPI test is not passed), or which are not held within the
scope of a business model whose objective is to hold an asset in order to collect
contractual cash flows (Hold to Collect business model) or whose objective is
achieved both through the collection of contractual cash flows and through the
sale of financial assets (Hold to Collect and Sell business model);
- financial assets designated at fair value, that is financial assets measured in this
way at the time of initial recognition and when the requirements are met. An entity
may irrevocably designated a financial asset as measured at fair value through
profit and loss at the time of initial recognition if, and only if, by doing so a
measurement inconsistency is eliminated or significantly reduced (fair value
option).
Reclassifications to other categories of financial assets is not permitted unless the
entity changes its business model to manage financial assets. In these cases, which
are expected to be very infrequent, financial assets can be reclassified to one of the
other two categories included under IFRS 9 (financial assets measured at amortised
cost and financial assets measured at fair value through other comprehensive
income). The transfer value is represented by the fair value at the time of
reclassification and the effects of the reclassification operate prospectively starting
from the date of reclassification. In this case, the effective interest rate for the
reclassified financial asset is determined on the basis of its fair value on the
reclassification date and this date is also considered to be the initial recognition date
82
for allocation within the various credit stages (stage assignment) for impairment
purposes.
Recognition criteria
Financial assets are initially recognised at the settlement date for debt and equity
securities, on the disbursement date for loans and the subscription date for derivative
contracts.
Financial assets are initially recognised at their fair value without considering
transaction costs or income directly attributable to the instruments.
Measurement criteria
After initial recognition, financial assets measured at fair value through profit and loss
are measured at fair value. The effects of applying this measurement criteria are
recognised in the Income Statement.
Market listings are used to determine the fair value of financial instruments listed on
an active market. In the absence of an active market, commonly used estimate
methods and models are adopted, which take all risk factors associated with the
instruments into account and are based on data which can be obtained on the
market, including: prices for listed instruments with similar characteristics,
calculations of discounted cash flows, models to determine options prices, values
taken from recent comparable transactions, etc. For equity securities and derivatives
relative to equity securities, not listed on an active market, the cost criteria is used as
an estimate of fair value only to a residual extent and limited to a few circumstances,
specifically in the case that all the previously referenced measurement methods
cannot be applied, or in the presence of a wide range of possible fair value
measurements, in which cost represents the least significant estimate.
Cancellation criteria
Financial assets measured at fair value through profit and loss are cancelled from the
financial statements when the right to receive cash flows expires or in the case of
disposal, only if the disposal involved substantial transfer of all risks and benefits
associated with the assets in question. On the other hand, if a significant portion of
the risks and benefits relative to the financial assets transferred remain, they continue

83
to be recognised in the Financial Statements, even if legal ownership of the same
has effectively been transferred.
In the case it is not possible to ascertain substantial transfer of risks and benefits, the
financial assets are eliminated from the Financial Statements if no type of control
over the same has been retained. Otherwise, even partial retention of control means
that the asset must continue to be recognised in the Financial Statements in an
amount equal to the residual involvement, measured by the exposure to changes in
value to the asset transferred and changes in the cash flows of the same.
2. Financial assets measured at fair value through other comprehensive
income (FVOCI)
Classification criteria
This item includes financial assets which meet both of the following conditions:
- financial assets are held based on a business model whose objective is achieved
both through the collection of contractually established cash flows and through
sale (Hold to Collect and Sell business model), and
- the contractual terms of the financial asset establish, at certain dates, cash flows
solely representing payment of principal and interest on the amount of capital to
be repaid (SPPI test passed).
In addition, this item includes equity instruments, not held for trading purposes, for
which at the time of initial recognition the option to designate them at fair value
through other comprehensive income was exercised.
Reclassifications to other categories of financial assets is not permitted unless the
entity changes its business model to manage financial assets. In these cases, which
are expected to be very infrequent, financial assets can be reclassified to one of the
other two categories included under IFRS 9 (financial assets measured at amortised
cost or financial assets measured at fair value through profit and loss). The transfer
value is represented by the fair value at the time of reclassification and the effects of
the reclassification operate prospectively starting from the date of reclassification. In
the case of reclassification from the category in question to that of amortised cost, the
cumulative profit (loss) recognised in the valuation reserve is used to adjust the fair
value of the financial asset at the date of reclassification. On the other hand, in the
case of reclassification to the category of fair value through profit and loss, the

84
cumulative profit (loss) previously recognised in the valuation reserve is reclassified
from shareholders’ equity to profit (loss) for the year.
Recognition criteria
Financial assets are initially recognised at the settlement date for debt and equity
securities and on the disbursement date for loans. They are initially recognised at
their fair value inclusive of transaction costs or income directly attributable to the
instruments.
Measurement criteria
After initial recognition, assets measured at fair value through other comprehensive
income are measured at fair value, with recognition in the Income Statement of
impacts deriving from application of the amortised cost and the effects of impairment,
while other profits or losses deriving from a change in fair value are recognised in a
specific shareholders’ equity reserve, without passing through the income statement,
until the financial asset is eliminated. At the time of disposal, whether total or partial,
the cumulative profit or loss in the valuation reserve is entirely or partially posted to
the Income Statement.
When the decision is made to classify equity instruments in this category, they are
measured at fair value and the amounts recognised in a contraentry to shareholders’
equity (Statement of comprehensive income) do not need to subsequently be
transferred to the income statement, even in the case of disposal. The only
component relative to the equity securities in question subject to recognition in the
income statement is any associated dividends.
Financial assets measured at fair value through other comprehensive income are
subject to verification of a significant increase in credit risk (impairment) as
established under IFRS 9, with consequent recognition of a value adjustment in the
income statement to cover expected losses. More specifically, for instruments
classified in stage 1 (that is financial assets at the time of origination, when not
impaired, and instruments which have not seen a significant increase in credit risk
with respect to initial recognition) expected losses after one year are recognised on
the initial recognition date and at each subsequent reporting date. On the other hand,
for instruments classified in stage 2 (performing assets, but with a significant increase
85
in credit risk with respect to initial recognition) and in stage 3 (impaired exposures)
expected loss is recognised for the entire residual life of the financial instrument.
Cancellation criteria
Financial assets measured at fair value through other comprehensive income are
cancelled from the financial statements when the right to receive cash flows expires
or in the case of disposal, only if the disposal involved substantial transfer of all risks
and benefits associated with the assets in question. On the other hand, if a significant
portion of the risks and benefits relative to the financial assets transferred remain,
they continue to be recognised in the Financial Statements, even if legal ownership
of the same has effectively been transferred.
In the case it is not possible to ascertain substantial transfer of risks and benefits, the
financial assets are eliminated from the Financial Statements if no type of control
over the same has been retained. Otherwise, even partial retention of control means
that the asset must continue to be recognised in the Financial Statements in an
amount equal to the residual involvement, measured by the exposure to changes in
value to the asset transferred and changes in the cash flows of the same.
3. Financial assets measured at amortised cost
Classification criteria
This category includes financial assets (in particular loans and debt securities) which
meet both of the following conditions:
- financial assets are held based on a business model whose objective is achieved
through the collection of contractually established cash flows (Hold to Collect
business model), and
- the contractual terms of the financial asset establish, at certain dates, cash flows
solely representing payment of principal and interest on the amount of capital to
be repaid (SPPI test passed).
More specifically, this item includes:
- loans to banks in various technical forms which meet the requirements indicated
in the previous paragraph;
- loans to customers in various technical forms which meet the requirements
indicated in the previous paragraph;

86
- debt securities which meet the requirements indicated in the previous paragraph.
This category also includes operating receivables associated with the provision of
financial activities and services (for example, to manage public subsidy funds or for
servicing activities).
Reclassifications to other categories of financial assets is not permitted unless the
entity changes its business model to manage financial assets. In these cases, which
are expected to be very infrequent, financial assets can be reclassified to one of the
other two categories included under IFRS 9 (financial assets measured at fair value
through other comprehensive income or financial assets measured at fair value
through profit and loss). The transfer value is represented by the fair value at the time
of reclassification and the effects of the reclassification operate prospectively starting
from the date of reclassification. Profits or losses resulting from the difference
between the amortised cost of the financial asset and the relative fair value are
recognised in the income statement in the case of reclassification between the
financial asset measured at fair value through profit and loss and shareholders'
equity, in the specific valuation reserve, in the case of reclassification between
financial assets at fair value through other comprehensive income.
Recognition criteria
Financial assets are initially recognised at the settlement date for debt securities and
on the date of disbursement in the case of loans. They are initially recognised at their
fair value inclusive of transaction costs or income directly attributable to the
instruments.
In particular, with regard to loans, the disbursement date normally coincides with the
date the contract was signed. If they do not coincide, a commitment to grant the
funds is recognised on the date when the contract is signed; the commitment then
ends when the instrument is disbursed. The loan/receivable is posted at its fair value,
equal to the amount disbursed, or the subscription price, including costs/income
directly attributable to the individual loan and which can be defined from the
beginning of the transaction, even if settled subsequently. Costs which, even if they
have the aforementioned characteristics, are subject to reimbursement by the debtor
counterparty or can be classified as normal internal administrative costs are
excluded.

87
Measurement criteria
Subsequent to initial recognition, the financial assets in question are measured at
amortised cost with the effective interest-rate method. In these terms, the asset is
recognised in the financial statements for an amount equal to the initial recognition
value minus repayments of principal, plus or minus cumulative amortisation and
adjusted for any provision to cover losses. The effective interest rate is the rate equal
to the present value of the future cash flows of the asset, in terms of both principal
and interest, of the amount disbursed inclusive of the costs/income attributable to
said financial asset. This method of recognition, using a financial logic, makes it
possible to distribute the economic effect of costs/income directly attributable to a
financial asset throughout its expected residual life.
The amortised cost method is not used for assets - measured at historic cost - which
have a short enough duration to make the effects of apply discounting negligible, nor
for those without a defined maturity date and for those payable on demand.
Calculation of expected loss values from impairment is closely connected to the
classification of the instruments in question in one of three stages established under
IFRS 9. Specifically, stage 1 includes performing assets for which no significant
increase in credit risk has been seen, stage 2 includes financial assets which are
performing but have seen a significant increase in credit risk and stage 3 includes
impaired financial assets (past due, unlikely to pay and non-performing).
Value adjustment are then recognised in the income statement:
- at initial recognition, in an amount equal to the expected loss after 12 months;
- when the asset is measured subsequently, when the credit risk has not
significantly increased with respect to initial recognition, in relation to changes in
the amount of value adjustments for expected losses after 12 months (stage 1);
- when the asset is measured subsequently, when the credit risk has significantly
increased with respect to initial recognition (transfer to stage 2), in relation to the
recognition of value adjustments for expected losses relative to the entire
residual life contractually established for the asset;
- when the asset is measured subsequently, when—after a significant increase in
credit risk has been seen with respect to initial recognition—the significance of
the increase no longer exists, in relation to the adjustment of cumulative value
adjustments in order to take into account the passage from lifetime expected
losses to losses over twelve months (return to stage 1).

88
When the financial assets in question are performing, the are subject to
measurement, aimed at determining value adjustments to be recognised in the
Financial Statements, at the level of the individual loan, as a function of the risk
represented by probability of default (PD), loss given default (LGD) and exposure at
default (EAD), with the aim of taking into account the provisions of accounting
standard IFRS 9.
If, in addition to a significant increase in credit risk, objective evidence of a loss of
value is also determined (transfer to stage 3), then the amount of the loss is
measured as the difference between the book value of the asset - classified as
impaired, in the same way as all other relationships held with the same counterparty -
and the current value of estimated future cash flows, discounted at the original
effective interest rate. The amount of the loss, to be recognised in the Income
Statement, is determined on the basis of an analytical measurement process or
determined for homogeneous categories and, therefore, analytically attributed to
each position and takes into account, as detailed in the section on "Impairment of
financial assets", forward looking information and possible alternative collection
scenarios.
The scope of impaired assets includes financial instruments classified as non-
performing, probable default or past-due/over-the-limit for more than 90 days, based
on Bank of Italy rules, in line with IAS/IFRS and European regulations.
Expected cash flows take into account expected collection times and the presumable
value in use of any collateral.
When the reasons for the impairment no longer exist following an event occur
subsequent to the recognition of the reduction in value, writebacks are carried out,
recognised in the Income Statement. Writebacks cannot exceed the amortised cost
which the financial instrument would have had in the absence of previous
adjustments.
Writebacks connected with the passing of time are posted as net interest income.
In some cases, during the life of the financial assets in question and, in particular,
those of loans, the original contractual conditions are subject to later modification by
the parties to the contract. When, during the course of the life of an instrument, the
contractual clauses are subject to change, it must be verified whether the original
asset must continue to be recognised in the Financial Statements or whether,
89
instead, the original instrument should be derecognised and a new financial
instrument recognised in its place.
In general, changes to a financial asset lead to its derecognition and the recognition
of a new asset, when the changes are substantial. Assessment of whether a change
is substantial must include consideration of both qualitative and quantitative
elements.
Cancellation criteria
Financial assets are cancelled from the financial statements when the right to receive
cash flows expires or in the case of disposal, only if the disposal involved substantial
transfer of all risks and benefits associated with the assets in question. On the other
hand, if a significant portion of the risks and benefits relative to the financial assets
transferred remain, they continue to be recognised in the Financial Statements, even
if legal ownership of the same has effectively been transferred.
In the case it is not possible to ascertain substantial transfer of risks and benefits, the
financial assets are eliminated from the Financial Statements if no type of control
over the same has been retained. Otherwise, even partial retention of control means
that the asset must continue to be recognised in the Financial Statements in an
amount equal to the residual involvement, measured by the exposure to changes in
value to the asset transferred and changes in the cash flows of the same.
4. Hedging
The Bank makes use of the possibility, established when IFRS 9 was introduced, to
continue to fully apply the provisions of the previous accounting standard IAS 39 with
regards to hedge accounting, for all types of hedges (in the carved out version
approved by the European Commission).
Classification criteria - type of hedge
Risk hedging transactions are carried out to deal with risks connected to changes in
market value or in future cash flows relating to a certain element or groups of
elements which could have potential effects on the income statement. The type of
hedging used by the Bank is fair value hedging, with the aim of hedging exposure
against changes in fair value (attributable to the various kinds of risks) of assets and
liabilities posted on the balance sheet, or portions of the same, groups of

90
assets/liabilities, irrevocable commitments and portfolios of financial assets and
liabilities, as allowed by IAS 39 endorsed by the European Commission.
Recognition criteria
Hedging derivatives, like all derivatives, are initially recognised and subsequently
carried at fair value.
Measurement criteria
In the case of fair value hedging, the change in the fair value of the item hedged is
offset with the change in the fair value of the hedging instrument. This offsetting is
recognised by booking the changes in value to the income statement of both the item
hedged (as regards the changes produced by the underlying risk factor), and the
hedging instrument. Any difference, representing the partial ineffectiveness of the
hedge, consequently constitutes its net economic effect. The derivative instrument is
designated as a hedging instrument if there is official documentation regarding the
relationship between the instrument hedged and the hedging instrument, and if it is
effective from the start of the hedging and throughout the life of the hedge. Hedging
effectiveness depends on the degree to which the changes in fair value of the
instrument hedged are offset by those of the hedging instrument. Consequently, the
effectiveness is measured by comparing these changes, taking into account the
Bank’s intended goal at the time the hedge was put in place. A hedge is effective
when the changes in the fair value of the hedging instrument almost completely
neutralise, within the limits established by the 80–125% range, the changes in the
hedged instrument, resulting from the risk element being hedged (Dollar offset
method). Effectiveness is assessed at every annual or interim reporting date. If it is
found that the hedging is not effective, as of that moment the hedging transaction is
no longer entered in the accounts as such and the derivative contract is reclassified
under instruments held for trading, and the financial instrument hedged is
subsequently measured according to its accounting classification. Under IAS 39, fair
value hedging can cover not only a single financial asset or liability but also a
monetary amount resulting from a number of financial assets and liabilities (or parts
of the same), so that a series of derivative contracts can be used to reduce the
changes in the fair value of the hedged instruments consequent to changes in market
91
interest rates (macro hedging). Net amounts resulting from asset or liability
imbalances cannot be covered by macro hedging.
As in the case of fair value micro hedging, macro hedging is considered highly
effective if, both at the start and during its life, the changes in the fair value of the
monetary amount hedged are offset by changes in the fair value of the hedging
derivatives and if the effective results fall within a range specified by IAS 39. In
accordance with the instructions issued by the Bank of Italy for preparation of banks’
financial statements, value adjustments on macro hedged financial assets/liabilities
are posted under item 60 of the Assets and item 50 of the Liabilities, with a contra
item under item 90 of the Income Statement.
5. Equity investments
Classification, recognition and measurement criteria
This item includes equity investments in controlled companies (over which direct or
indirect control is exercised); in joint ventures (for which a joint control agreement
exists) and in associated companies (over which significant influence is exercised,
but not classifiable as one of the two previous categories).
Equity investments are recognised at the purchase or subscription cost. If there is
evidence that the value of an equity investment may have decreased, the
recoverable value of the investment is then estimated, taking into account the current
value of future cash flows which may be generated by the investment, including the
final disposal value of the investment.
The original value is restored in subsequent years if the reason for the value
adjustments made no longer exists.
Economic results relative to measurement and gains/losses on disposal are
recognised in a specific item in the income statement.
Dividends are recognised in the financial year in which they are resolved.
Cancellation criteria
Equity investments are derecognised when they are disposed of, when all associated
risks and benefits are substantially transferred or when the contractual rights of the
financial flows that derive from them expire.

92
6. Property, plant and equipment
Classification criteria
Property, plant and equipment includes plant, office machinery, furniture, computers,
printers, fittings and equipment of any type. These are instrumental assets with
several years of useful life used to carry out the company’s business. In application of
the new accounting standard IFRS 16, “property, plant and equipment” also includes
rights of use acquired through leases and relative to the use of property, plant and
equipment for lessees.
Recognition criteria
Property, plant and equipment items are initially recognised at cost, inclusive of any
directly attributable transaction costs. The cost is increased by any expenses
incurred subsequently to improve these assets, replace a part or perform non-routine
maintenance activities resulting in an increase in their future economic benefits.
Routine maintenance expenses are recognised directly in the income statement.
Based on IFRS 16, leases are recognised on the basis of a right of use model based
on which, at the start date, the lessee has a financial obligation to make the
payments due to the lessor to compensate for the right to use the underlying asset
for the duration of the lease. When the asset is made available to the lessee for use
(start date), the lessee recognises both the liability and the asset, consisting of the
right of use.
Measurement criteria
Property, plant and equipment items are carried at cost, minus any depreciation or
impairment. Property, plant and equipment depreciate, on the basis of the estimated
expected useful life, as follows:
Fittings and equipment 15%
Furniture 12%
Office machines 20%
Depreciation is calculated at the reporting date and recognised in the income
statement. In the case of impairment, assets are written down and the amount of the
impairment is recognised in the income statement.

93
With reference to assets consisting of the right of use, recognised on the basis of
IFRS 16, these are measured by using the cost model based on IAS 16 Property,
plant and equipment. In this case, the assets are subsequently
depreciated throughout the duration of the leasing contract and subject to an
impairment test if indications of impairment arise.
Cancellation criteria
The carrying amount of an item of property, plant and equipment must be
derecognised in case of disposal, or when no future economic benefit is expected
from its use. Gains and losses arising from the difference between the price collected
from the sale of an asset and the carrying amount of such an asset are recognised in
a specific item of the income statement.
7. Intangible assets
Classification criteria
Intangible assets, essentially represented by software, are recognised only if it
probable that the future economic benefits attributed to the assets will arise and if the
cost of the assets can be reliably determined. There are no intangible assets
generated internally.
Recognition criteria
At initial recognition, intangible assets are recognised at cost, adjusted for any
accessory charges.
Measurement criteria
After initial recognition, intangible assets with a finite useful life are posted at cost net
of total amortisation and any impairment. The amortisation charge on intangible
assets with a finite useful life (normally three years) is posted on the income
statement at the reporting date and tests are performed for any impairment to be
recognised in the income statement. The Bank has no intangible assets with an
indefinite lifetime.
Cancellation criteria

94
Intangible assets are derecognised at the moment of their disposal or when no future
economic benefits are expected.
8. Other Assets
Other assets essentially include items awaiting processing and items not classifiable
under other items in the balance sheet, among which we note receivables associated
with supplies of non-financial goods and services, and tax items different from those
recognised under the specific item.
9. Current and deferred taxes
Income taxes are accounted for as cost on an accrual basis, in conformity to the
methods for recognising the costs and revenues which have generated them.
Therefore, they represent the balance of current and deferred taxes relating to the
income of the period. Deferred taxes are calculated by applying the balance sheet
liability method, bearing in mind the fiscal effect connected with temporary
differences between the carrying value of assets and liabilities and their fiscal value,
which lead to taxable or deductible amounts in future periods. For such purposes,
taxable temporary differences are those which in future periods will determine taxable
amounts and deductible temporary differences those which in future periods will
determine deductible amounts.
Deferred taxes are calculated by applying tax rates established under current laws to
temporary taxable difference for which there is an effective probability that taxes will
be paid and to temporary deductible differences for which there is reasonable
certainty of future taxable amounts at the time the relative tax deductibility will arise
(probability test). Prepaid and deferred taxes relative to the same tax and maturing
during the same period are offset.
When deferred tax assets and liabilities refer to components that impacted the
income statement, the contra entry is represented by income taxes.
In cases in which prepaid and deferred taxes refer to transactions which directly
affected shareholders’ equity without impacting the income statement (such as
adjustments from first time application of IAS/IFRS, measurements of financial
instruments recognised at fair value through other comprehensive income or
contracts deriving from cash flow hedges), these are recognised as a contra entry to

95
shareholders’ equity, relative to specific reserves when appropriate (e.g. valuation
reserves).
In December 2017, the Bank complied with the parent company’s request to exercise
the option to adhere to national tax consolidation for the 2018-2020 period
(introduced by Legislative Decree 344 of 12 December 2003).
The exercising of this option, which is neutral for the Bank with respect to its prior
status, allows the following for Group’s tax burden:
• immediate total or partial use of tax losses during the period for companies
participating in consolidation, decreasing the taxable income of other consolidated
companies;
• the introduction of an IRES credit and debit compensation mechanism among the
companies participating in tax consolidation;
• excluding taxation of dividends distributed between the companies participating in
the tax consolidation within the same financial year.
10. Provisions for risks and charges
Provisions for retirement and similar benefits
Retirement funds are established in implementation of company agreements and can
be classified as defined benefit plans. The liability for these plans and the relative
social security cost for current provisions of labour are determined on the basis of
actuarial hypotheses which involve projections of future payments on the basis of
analysis of historic statistics and the demographic curve, and financial discounting of
said flows on the basis of a market interest rate.
Actuarial gains and losses (variations in the current value of the obligation deriving
from changes to actuarial hypotheses and adjustments based on past experience)
are recognised in the statement of comprehensive income.
Provisions for risks and charges against commitments and guarantees issued
The sub-item of provisions for risks and charges in question includes provisions for
credit risk recognised against commitments to disburse funds and to guarantees
given which fall within the scope of application of the impairment rules pursuant to
IFRS 9. As a basic principle, for these cases the same methods of allocation are
used with reference to the three credit risk stages and to calculation of expected

96
losses, indicated with reference to financial assets measured at amortised cost or at
fair value through other comprehensive income.
Other provisions
Other provisions for risks and charges include allocations for legal obligations or
associated with employment relations, or to disputes, including tax disputes,
originating from a past event for which the disbursement of financial resources is
likely in order to fulfil the said obligation, as long as the relevant amount can be
reliably estimated.
Consequently, a provision is only recognised if and only if:
- there is an obligation in course (legal or implicit) as the result of a past event;
- it is probably that in order to fulfil the obligation it will be necessary to make use of
resources aimed at producing economic benefits; and
- a reliable estimate can be made of the amount deriving from fulfilment of the
obligation.
The amount recognised for the provision represents the best estimate of the sum
required to comply with the obligation existing at the reporting date and reflects risks
and uncertainties which inevitably are associated with multiple events and
circumstances. When the time factor is significant, provisions are discounted using
current market rates. The provision and increases due to the time factor are
recognised in the Income Statement.
The provision is reversed when it becomes improbable that resources aimed at
producing economic benefits will be used to fulfil the obligation or when the obligation
is eliminated.
11. Financial liabilities measured at amortised cost
Classification criteria
Amounts due to banks, amounts due to customers and securities issued represent
the various forms of inter-bank funding and funding from customers, as well as
repurchase agreements with repurchase obligation on maturity and funding via bonds
and other funding instruments issued, net of any redeemed amounts.
These also include payables recognised by the company in its role as the lessee
relative to leasing contracts.

97
Recognition criteria
Such financial liabilities are first recognised on the date on which the related contract
is signed, which normally coincides with the moment of the receipt of the sums
collected or the issue of the debt securities.
Initial recognition takes place at the fair value of the liabilities, usually equal to the
amount collected or to the issue price, increased by any additional costs/income
directly attributable to the individual deposit or issue transactions. Internal
administrative costs are excluded.
Measurement criteria
After initial recognition, these financial assets are measured at the amortised cost,
using the effective interest rate method.
However, short term liabilities, for which the time factor is negligible, are an
exception. They are entered at the amount collected.
Leasing payables are revalued when there is a lease modification (e.g. a change to
the scope of the contract), if this is not recognised/considered as a separate contract.
Cancellation criteria
Financial liabilities are derecognised when they have matured or been discharged.
Derecognition also takes place when previously issued debt securities are
repurchased. The difference between the carrying amount of a liability and the
amount paid for purchase is booked to the Income Statement.
12. Financial liabilities held for trading
Recognition criteria
The financial instruments in question are recognised on the subscription date or issue
date at a value equal to the fair value of the instrument, without considering any
transaction costs or income directly attributable to the instruments themselves.
Measurement criteria
All liabilities held for trading are measured at fair value with recognition of the result
of said measurement in the Income Statement.
98
Cancellation criteria
Financial liabilities held for trading are derecognised from the Financial Statements
when the contractual rights over relative cash flows expire or when the financial
liability is transferred, including the substantial transfer of all risks and benefits
deriving from ownership of the same.
13. Financial liabilities designated at fair value
Classification criteria
This item includes financial liabilities measured at fair value with a contra entry in the
income statement, on the basis of the option granted to companies (fair value option)
under IFRS 9 and in compliance with the cases established under the reference
regulations.
Recognition criteria
Recognition of these liabilities is done on the issue date in a degree equal to their fair
value, including the value of any embedded derivative and net of placement fees
paid.
Measurement criteria
These liabilities are measured at fair value and the result is recognised in accordance
with the following rules established under IFRS 9:
- changes in fair value attributable to changes in own credit standing must be
recognised in the statement of comprehensive income (shareholders’ equity) and
are not subject to reversal to the income statement even when the liability
matures;
- the remaining fair value changes must be recognised in the Income Statement.
Cancellation criteria
Financial liabilities measured at fair value are derecognised from the Financial
Statements when the contractual rights over relative cash flows expire or when the
financial liability is transferred, including the substantial transfer of all risks and
benefits deriving from ownership of the same.

99
15. Other information
Revenue recognition
Revenues can be recognised:
- at a specific time, when the entity fulfils obligations by transferring the asset or
service promised to the customer, or
- over time, as the entity gradually fulfils obligations by transferring the asset or
service promised to the customer.
An asset is transferred when, or over the course of the period during which, the
customer acquires control over it. In particular:
- interest is recognised pro rata temporis according to the contractual interest rate
or to the effective interest rate in case of application of the amortised cost;
- fees for revenues from services, including commissions for the management of
public subsidies, are stated, on the basis of the existence of contractual
agreements, in the period in which the services were provided;
- fees considered in the amortised cost for the purpose of determining the effective
interest rate are included in interest;
- revenues or costs deriving from the sale of financial instruments, resulting from
the difference between the amount paid or collected on the transaction and the
fair value of the instrument, are posted on the income statement when the
transaction is recognised.
Recognition of costs
Costs are recognised on the income statement whenever there is a decrease in
future economic benefits entailing a decline in assets or an increase in liabilities.
Financial expenses are interest and other expenses incurred in connection with
amounts borrowed and are recognised as a cost in the year in which they are
incurred.
Expenditure on third-party assets
Costs incurred on third parties’ assets (tangible and intangible) are capitalised in
consideration of the fact that, for the term during which the Bank uses the same, it
has control of the assets and can obtain future economic benefits. The said costs,

100
classified as other assets, as provided for in the Bank of Italy instructions, are
amortised according to the contractual terms.
Offsetting financial assets and liabilities
On the basis of the indications of IAS 32 asset and liability items are offset in the
accounts if the following requisites are fulfilled:
- possession of the contractual right exercisable for offsetting the amounts
recognised in receivables and payables;
- the intention to settle the items net, or to realise the asset and at the same time
extinguish the liabilities.
In accordance with the provisions of IFRS 7, more detailed information is provided in
the tables of the Notes to the Financial Statements included in Part B - Other
information. In particular, the carrying amounts affected by the standard before and
after the effects of the offset and the measurement of the associated real guarantees
are recognised.
Classification criteria for financial assets
Classification of financial assets into the three categories established under the
standard depend on two classification criteria, or drivers: the business model under
which the financial instruments are managed and the contractual characteristics of
the cash flows deriving from financial assets (SPPI test).
Financial assets are classified based on the combination obtained from these two
drivers, in accordance with that indicated below:
- Financial assets measured at amortised cost: assets which pass the SPPI test
and fall under the Hold to collect (HTC) business model;
- Financial assets measured at fair value through other comprehensive income
(FVOCI): assets which pass the SPPI test and fall under the Hold to collect and
sell (HTCS) business model;
- Financial assets measured at fair value through profit and loss (FVTPL): this is a
residual category, which includes financial instruments which cannot be classified
within the previous categories on the basis of the results of the business model
test or due to failure of the SPPI test.
101
SPPI test
For a financial asset to be classified at amortised cost or FVOCI, in addition to
business model analysis, it is necessary that the contractual terms of the asset
establish cash flows on certain dates which consist solely of payments of principal
and interest (SPPI). This analysis must be done, in particular, on loans and debt
securities.
The SPPI test must be performed on each individual financial instrument, at the time
it is recognised in the Financial Statements. After initial recognition, and as long as it
is recognised in the Financial Statements, the asset is not subjected to new
assessments in terms of the SPPI test. When a financial instrument is derecognised
and when a new financial asset is recognised, it is necessary to carry out the SPPI
test on the new asset.
For the purposes of applying the SPPI test, IFRS 9 provides the following definitions:
- Principal: the fair value of the financial asset at the time of initial recognition. This
value may change during the life of the financial instrument, for example as an
effect of payments of principal;
- Interest: the payment for the time value of money and the credit risk associated
with the capital, existing at a particular moment in time. It may also include
remuneration for other base risks and costs associated with lending activity and a
profit margin.
When assessing whether cash flows from a financial asset can be defined as SPPI,
IFRS 9 refers to the general concept of a basic lending arrangement which is
independent of the legal form of the business. When the contractual clauses
introduce exposure to risks or volatility of cash flows not in line with the definition of a
basic lending arrangement, the contractual cash flows do not meet the definition of
SPPI. Application of the classification driver based on contractual cash flows will
occasionally require a subjective decision and, therefore, the definition of internal
policies for application.
In the case of a modified time value of money, or when the interest rate is periodically
redetermined on the basis of the average of given short or medium/long-term rates,
the company must assess, using both quantitative and qualitative elements, whether
the contractual cash flows still meet the definition of SPPI (benchmark cash flows
test). When the test indicates that the (non-discounted) contractual cash flows are
significantly different with respect to the cash flows deriving from a benchmark

102
instrument (also non-discounted), or without the time value element modified,
contractual cash flows cannot be said to meet the definition of SPPI.
As established under IFRS 9, a given characteristic of contractual cash flows does
not influence classification of a financial asset if it can only have a minimal effect on
the contractual cash flows of the financial asset (in each financial year and
cumulatively). Similarly, if a characteristic of the cash flows is not realistic, (not
genuine), or influences the contractual cash flows of the instrument only when an
event occurs which is extremely rare, very unusual or very improbable, it does not
influence classification of the financial asset.
Business model
With regards to the business model, IFRS 9 identifies three cases regarding the
methods used to manage cash flows and sales of financial assets:
- Hold to Collect (HTC): this is a business model in which the objective is achieved
by receiving contractual cash flows from financial assets included in their relative
portfolios. The insertion of a portfolio of financial assets in this business model
does not necessary mean it is impossible to sell these instruments, even if it is
necessary to consider the frequency, value and schedule of sales in previous
years, the reasons for the sales and expectations regarding future sales;
- Hold to Collect and Sell (HTCS): this is a mixed business model, in which the
objective is achieved by receiving contractual cash flows from the financial assets
in the portfolio and also through sales activities, which are an integral part of the
strategy. Both activities (collection of cash flows and sales) are indispensable for
achieving the objective of the business model. Therefore, sales are more frequent
and significant with respect to an HTC business model and are an integral part of
the strategies pursued;
- Other/Trading: this is a residual category which includes both financial assets held
for trading purposes and financial assets managed using a business model which
is different to the previous categories (Hold to Collect and Hold to Collect and
Sell). In general, this classification is applied to a portfolio of financial asset for
which management and performance are measured on a fair value basis.
The business model reflects the methods with which the financial assets are
managed to generate cash flows to benefit the entity and is defined by top
management with appropriate involvement of business structures. It should be
103
determined considering the method used to manage the financial assets and, as
consequence, the degree to which cash flows in the portfolio derive from the receipt
of contractual cash flows, from sales or financial assets or from both activities.
Method of determining amortised cost
Amortised cost is one of the possible measurements of a financial asset or liability.
This assessment is done for financial assets measured at amortised cost (item 40,
assets), for those measured at fair value through other comprehensive income (item
30, assets) prior to fair value adjustment, and for financial liabilities measured at
amortised cost (item 10, liabilities). Amortised cost must be calculated using the
effective interest rate method, a method that involves distributing interest received or
paid, and transaction costs and revenues, along the duration of the financial
instrument. The amortised cost makes it possible to allocate all the costs and
revenues generated by a financial instrument along the entire expected life of the
said instrument. The costs and revenues to be allocated along the expected life of
the said financial instrument include the transaction costs (revenues) which are the
marginal costs (revenues) directly attributable to the issue/acquisition of a financial
instrument. Marginal means the costs (revenues) that would not have been produced
if the entity had not acquired or issued the financial instrument. With particular
reference to receivables, the commissions payable to the distribution channels and
fees payable for participation in pooled loans are considered costs attributable to the
financial instrument; while the revenues considered in calculating the amortised cost
are up-front commissions, and those for participation in pooling operations. For
securities issued and other funding transactions the placing commissions are
considered in calculating the amortised cost, as well as legal expenses necessary for
preparing placement. The effective interest rate is the rate that reduces to zero the
present value, at the time of the measurement, of the total cash flow (the future
payments or collections envisaged along the expected life of the financial instrument)
of the financial instrument. The calculation of the effective interest rate must include
all the economic components paid or received which are an integral part of the same,
the transaction costs, and all the other premiums or discounts. Determination of the
amortised cost is different according to whether the financial instruments considered
are at fixed rate or variable rate and—in this latter case—according to whether the
variability of the rate is known in advance (fixed rate for time bands) or otherwise. For

104
financial instruments at fixed rate or at fixed rate for time bands (with the rate that
varies after a certain period in fixed mode), the future cash flows must be quantified
on the basis of the known interest rate (single or variable) during the life of the
instrument. For instruments at variable rate, the variability of which is not known in
advance (for example because it is linked to an index), the cash flows must be
determined on the basis of the last known rate, and at each rate revision date the
new effective rate of return is recalculated. Measurement at amortised cost does not
apply for assets/liabilities whose short duration leads the economic effect of the
discounting to be considered negligible, nor for receivables with no definite maturity
or on demand.
Method of determining impairment
Pursuant to IFRS 9, at every reporting date financial assets not measured at fair
value through profit and loss are subject to assessment, in order to determine
whether there is evidence which suggests that the recognition value of the assets in
question is not entirely recoverable. Similar analysis is also done for commitments to
disburse funds and for guarantees given which fall within the scope subject to
impairment under IFRS 9. If this evidence exists (i.e. “evidence of impairment”), the
financial assets in question—together with all other remaining assets pertaining to the
same counterparty—are considered impaired and placed in stage 3. Against these
exposures, represented by financial assets classified in the categories of non-
performing, probable default and past-due over 90 days, pursuant to the provisions of
Bank of Italy Circular 262/2005, value adjustments must be recognised in an amount
equal to expected losses over a time horizon equal to their entire residual life.
For financial assets for which no evidence of impairment is found (non-impaired
financial assets), it is instead necessary to determine whether there are indicators
that the credit risk of an individual operation has significantly increased with respect
to initial recognition. From a staging and measurement point of view, the
consequences of this verification are the following:
- when these indicators exist, the financial asset is placed in stage 2. In this case,
in line with the dictates of international accounting standards and even in the
absence of a manifest loss of value, the measurement involves recognition of
value adjustments equal to expected lifetime losses. These adjustments are
subject to review at each subsequent reporting date, in order to periodically verify

105
their congruence with respect to constantly updated loss estimates and to take
into account—if the indications of significantly increased credit risk no longer
exist—the change in the time horizon for calculating expected losses;
- when these indicators do not exist, the financial asset is placed in stage 1. In this
case, in line with international accounting standards and even in the absence of a
manifest loss of value, the measurement involves recognition of expected losses
over the next twelve months for the specific financial instrument. These
adjustments are subject to review at each subsequent reporting date, both in
order to periodically verify their congruence with respect to constantly updated
loss estimates and to take into account—if indications of significantly increased
credit risk present themselves—the change in the time horizon for calculating
expected losses.
Taking into account the fact that at each reporting date the Bank must recognise in
the Income Statement the amount of the change in expected lifetime losses as an
impairment gain or loss, the model adopted by the Bank to calculate value
adjustments on financial assets at the individual transaction level is the following:
where:
• = value adjustment calculated at the reporting date;
• N = residual life of the relationship (contractual maturity minus reporting
date);
• = value of EAD in the immediate future ;
• = marginal probability of default in ;
• = value of LGD in the immediate future ;
• = discounting rate equal to IRR.
With reference to financial assets classified in stage 1, the formula outlined above is
calculated only to 1 year (n equal to or less than 12 months), while for financial
assets classified in stage 2, instants ti indicated in the formula are consistent with the
frequency of cash flows established in the case of multi-period EAD or annually, in
the case of an amortisation plan with a single payment at maturity (bullet).

106
The degree of specificity used to determine impairment is individual relationships for
the loan portfolio, while for the securities portfolio, reference should be made to
individual tranches remaining. In the cases that multiple tranches6 of the same
security are purchased at different times, it is possible that different initial acquisition
conditions are seen (different ratings at issue or different issuer ratings) and therefore
it is expedient to consider each tranche acquired as an individual financial instrument,
even if they are from the same security. This leads to the need to assess impairment
of credit standing at the level of each individual tranche acquired, and the possibility
of classifying different tranches from the same security in different stages.
Probability of default (PD)
While awaiting consolidation of a portfolio able to provide robust evidence of internal
risk, the Bank estimates PD at one year for its exposures with the help of an external
ratings model. In particular, PDs are estimated for each ratings class on the basis of
a recalibration process which uses the PDs for the model and a multiplier, provided
by the external provider, in order to determine Bank level PDs from system level PDs.
Input data are subject to quality control and when appropriate are normalised to
guarantee monotonicity of PDs with respect to ratings. Positions without ratings are
placed in ratings classes with an average PD, unless analysis and monitoring
indicates a risk profile that is significantly higher than the average.
To guarantee proper application of the accounting standard, PDs are subject to the
following processing, broken down into the following steps:
1) PIT adjustment
Prudentially and considering the volatility of default rates observed on the loan
portfolio, when appropriate 1Y PD from the model are recalibrated using a
Bayesian approach on the basis of an average decay rate observed on the
portfolio (Central Tendency – CT). This parameter is updated periodically, on the
basis of risk trends observed internally, in order to estimate PDs which represent
the riskiness of the portfolio as accurately as possible;
2) Forward-looking correction
6 In this document, the term “tranche” means a lot of a given ISIN acquired at a specific moment in time.

107
The PD curves obtained in this way are subject to forward-looking correction,
generally for the first 3 years, on the basis of multipliers estimated using satellite
models.
3) Calculation of multiperiod cumulative PDs
Multiperiod PDs are derived from1Y PD using a Markovian approach, using the
transition matrices provided by the same provider.
For the Private segment and in particular for residential mortgages, the multiperiod
PDs are derived using a negative exponential distribution (described below), as
this is deemed most appropriate for estimating the PD curve for this
product/segment, with respect to the Markovian approach:
In particular, the first three years of the yield curve are obtained using parameter λ
derived from PD PIT, while for subsequent years, an λ derived from PD TTC is
used.
4) Determination of conditional marginal PDs
Starting from the yield curve of cumulative PDs, the yield curve for marginal and
conditional PDs is determined.
Loss Given Default (LGD)
Considering the lack of availability of internal loss rates after default, assignment of
loss given default (LGD) to individual positions is done by making use of regulatory
values or those derived from benchmarks, considered flat for the entire duration of
the loan and suitably updated, evaluating the appropriateness of using prudential
margins.
In relation to the type of collateral associated with a loan product, the loans portfolio
has been broken down into the following segments:
1) Unsecured / Other loans;
2) Loan with guarantee from the Central SME Guarantee Fund (FdG);
3) Non-residential mortgage;
4) Residential mortgage;
5) Salary-backed loan (CQS);
6) Factoring.

108
Exposure at Default (EAD)
For on balance positions, the Bank uses cash flows resulting from the effective
amortisation plans for loans as exposure at default. In particular, for the first year7
(positions in stage 1 and stage 2), the respective carrying amount of the exposure is
used, while for subsequent years (stage 2), the residual debt for the capital
component of the exposure is considered, as in the IAS plan.
For off-balance sheet positions, exposure at default is determined in compliance with
Regulation 575/2013, under article 111, Part Three, chapter 2, section 1.
Separate accounting
Management of Public Funds and provision of services related to them is governed
by contracts signed with the Public Administrations. Management of the related
resources is recorded in separate accounts, reported annually to the Public
Administrations.
A.3 DISCLOSURE ON TRANSFERS BETWEEN FINANCIAL ASSET
PORTFOLIOS
The Bank has not carried out any reclassifications between portfolios measured at
fair value and those measured at amortised cost.
A.4 DISCLOSURE ON FAIR VALUE
Qualitative information
Fair value represents the price at which an asset can be exchanged, or a liability
extinguished, between aware and willing parties, in an orderly transaction in a free
market context. Substantially fair value is a criterion that presupposes that the entity
is carrying on its business normally with no intention to liquidate its assets or to carry
out transactions at unfavourable conditions. For financial instruments the fair value is
determined according to a hierarchy of criteria in relation to the type and quality of the
information used. More specifically three different input levels are identified according
to whether the prices for the measurements:
7 For stage 1 positions with residual life of less than one year, expected loss at one year is rendered proportional to the number of months to maturity.
109
- are represented by prices for identical assets and liabilities on active markets to
which the entity has access;
- or are observable directly or indirectly;
- or, lastly, not observable.
A.4.1 Fair value levels 2 and 3: measurement techniques and inputs used
Fair value of derivative instruments
The determination of the fair value of derivatives is based on level 2 input, since they
are instruments not quoted on active markets; in particular, the determination of the
fair value is based on the spot interest rates curve and on the forward values and the
volatility of the monetary market rates. Derivatives in the portfolio, all used for
hedging purposes, have the following properties:
IRS (receive fixed rate, pay Euribor 6 months) for hedging liabilities.
These positions are measured on the basis of the income method; this involves the
application of the discounted cash-flow method, which contemplates:
- an estimate of the uncertain future interest flows, indexed to the 6-month Euribor
parameter, determining the forward values of the parameter implicit in the specific
curve of the spot rates at the date of reference;
- the discounting of certain future interest flows and future interest flows estimated
as indicated above, in order to take into account the time value of money.
In terms of assessing counterpart risk, the derivative contracts in question are backed by
CSA (Credit Support Annex), with collateral consisting of cash and daily margining:
counterparty risk on these positions is considered negligible and therefore no CVA/DVA
(Credit Value Adjustment / Debt Value Adjustment) is applied;
Following this approach, the market factors which affect determination of the fair
value of derivatives are attributable to risk-free interest rates, EUR IRS interest rates,
to the forward values of the 6-month EurLibor.
Input data for measurement models:
The curve of the discount factors used in determining the fair value is taken from a
zero coupon rates curve using as a convention the ACT/365 day count and the
compound capitalisation system. In turn, the zero-coupon rate curve is obtained
through bootstrap and linear interpolation of the EUR OIS rate curve identified on the
market (source: Reuters), as the derivatives are cash collateral, with daily margining

110
and remuneration at the EONIA rate. The forward values of the 6-month EurLibor
parameter are calculated on the basis of a zero-coupon rates curve obtained by
bootstrap and linear interpolation starting from Futures and Forward Rate Agreement
contracts (for securities maturing within 12 months) and from the EUR IRS rates (for
subsequent maturities).
A.4.3 Fair value hierarchy
With regard to the breakdown of portfolios according to fair value hierarchies, there
are three separate levels:
- the fair value of the financial instrument is level 1 in the case of instruments listed
on active markets which allow reliable use of market prices for their
measurement;
- the fair value of the financial instrument is level 2 in the case of instruments not
listed on active markets, whose fair value can, in any case, be determined by
means of valuation models based on market prices;
- the fair value of the financial instrument is level 3 in the case of instruments not
listed on active markets whose fair value cannot be determined by means of
valuation models based on market prices.
To be precise, at present the Bank has the following financial instruments carried at
fair value:
- financial assets measured at fair value through other comprehensive income
represented by Italian government securities listed on a regulated market, which
are level 1 since the fair value posted on the financial statements is acquired from
active market prices and is available on a price list under a regulatory authority;
these prices represent actual market transactions which take place regularly in
normal trading;
- hedging derivatives, which are level 2 since, although there is no official listing on
an active market, active markets exist for the parts of which they are composed
and, therefore, the fair value is determined on the basis of the pertinent market
prices of their components.
Therefore any transfers between the various fair value levels occur in practice only
when the markets of reference of which the quotations are adopted in determining
the related fair value are closed, or if the quotations give prices for the financial

111
instruments to be measured, which are no longer deemed significant due to the
absence of trading or scarce market liquidity. In such cases, full information is given
on the date of the event and the related reasons, describing the measurement
models adopted (mark to model) in line with the generally accepted methods.

112
Quantitative information
A.4.5 Fair value hierarchy
A.4.5.1 Assets and liabilities carried at fair value on a recurrent basis:
breakdown by fair value level
The following table shows the breakdown of the financial portfolios on the basis of
the aforementioned fair value levels.
Total 31.12.2019 Total 31.12.2018
Assets/financial liabilities carried at fair value L1 L2 L3 L1 L2 L3
1. Financial assets measured at fair value through profit and loss 1
a) financial assets held for trading
b) financial liabilities designated at fair value
c) other financial assets obligatorily measured at fair value 0 1
2. Financial assets measured at fair value through other comprehensive income 747,966 715,751
3. Hedging derivatives 88,039 82,650
4. Property, plant and equipment
5. Intangible assets
Total 747,966 88,039 715,751 82,650 1
1. Financial liabilities held for trading
2. Financial liabilities designated at fair value
3. Hedging derivatives 2,248
Total 2,248
Key: L1 = Level 1 L2 = Level 2 L3 = Level 3

113
A.4.5.4 Assets/liabilities not measured at fair value or measured at fair value on a non-
recurring basis: breakdown by fair value level
31.12.2019 31.12.2018
Assets/liabilities not carried at fair value or carried at fair value on a non-recurrent basis CA L1 L2 L3 CA L1 L2 L3
1. Financial assets measured at amortised cost 1,644,593 1,788,007 1,493,390 1,629,590
2. Property, plant and equipment held for investment
3. Non-current assets and disposal groups held for sale
Total 1,644,593 1,788,007 1,493,390 1,629,590
1. Financial liabilities measured at amortised cost 2,113,001 528,363 1,653,067 1,985,601 347,871 1,682,026
2. Liabilities associated with assets held for sale
Total 2,113,001 528,363 1,653,067 1,985,601 347,871 1,682,026
Key: CA = Carrying Amount L1 = Level 1 L2 = Level 2 L3 = Level 3
114
Part B – Information on the balance sheet

115
Assets
Section 1 - Cash and cash equivalents - Item 10
1.1 Cash and cash equivalents: breakdown
Total 31.12.2019 Total 31.12.2018
a) Cash on hand 1 2
b) Demand deposits with Central Banks 1,054 25,017
Total 1,055 25,019
The decrease with respect to the previous year derives from the non-recurring nature of the
balance at 31.12.2018, the date on which 25 million used on 2.1.2019 for settlement of ECB
auctions was accredited.
Section 2 - Financial assets measured at fair value through profit and loss - Item 20
2.5 Other financial assets obligatorily measured at fair value: breakdown by type
Total 31.12.2019 Total 31.12.2018
Item/Amount L1 L2 L3 L1 L2 L3
1. Debt securities
1.1 Structured securities
1.2 Other debt securities
2. Equity securities 1
3. Units in collective investment undertakings
4. Loans
4.1 Repurchase agreements
4.2 Other
Total 1
Key: L1 = Level 1 L2 = Level 2 L3 = Level 3
The item includes the portion due to the Bank of securities subscribed through the FITD Voluntary
Scheme following the interventions carried out by the same. These securities are measured at the
fair value identified by KPMG Advisory SpA, which was appointed by the Voluntary Scheme.

116
2.6 Other financial assets obligatorily measured at fair value: breakdown by debtor/issuer
Item/Amount Total 31.12.2019 Total 31.12.2018
1. Equity securities 1
of which: banks
of which: other financial companies 1
of which: non-financial companies
2. Debt securities
a) Central Banks
b) Public administrations
c) Banks
d) Other financial companies
of which: insurance companies
e) Non-financial companies
3. Units in collective investment undertakings
4. Loans
a) Central Banks
b) Public administrations
c) Banks
d) Other financial companies
of which: insurance companies
e) Non-financial companies
f) Households
Total 1

117
Section 3 - Financial assets measured at fair value through other comprehensive income - Item 30
3.1 - Financial assets measured at fair value through other comprehensive income: breakdown
Total 31.12.2019 Total 31.12.2018
Item/Amount L1 L2 L3 L1 L2 L3
1. Debt securities 747,966 715,751
1.1 Structured securities
1.2 Other debt securities 747,966 715,751
2. Equity securities
3. Loans
Total 747,966 715,751
Key: L1 = Level 1 L2 = Level 2 L3 = Level 3
The portfolio consists solely of Italian government securities (BTP) with a residual life of 2.8 years.
The item includes the cumulative fair value change at 31 December 2019, negative for 4.5 million,
reduced to 3 million net of the tax effect, mainly determined by the trend in the sovereign spread.

118
3.2 Financial assets measured at fair value through other comprehensive income: breakdown by debtor/issuer
Item/Amount Total 31.12.2019 Total 31.12.2018
1. Debt securities 747,966 715,751
a) Central Banks
b) Public administrations 747,966 715,751
c) Banks
d) Other financial companies
of which: insurance companies
e) Non-financial companies
2. Equity securities
a) Banks
b) Other issuers:
- other financial companies
of which: insurance companies
- non-financial companies
- other
3. Loans
a) Central Banks
b) Public administrations
c) Banks
d) Other financial companies
of which: insurance companies
e) Non-financial companies
f) Households
Total 747,966 715,751

119
3.3 Financial assets measured at fair value through other comprehensive income: gross value and total value adjustments
Gross value Total value adjustments
Stage one of which:
instruments with low
credit risk Stage two Stage three Stage one Stage two Stage three
Total partial
write-offs*
Debt securities 748,554 748,554 (588)
Loans
Total 31.12.2019 748,554 748,554 (588)
Total 31.12.2018 716,317 716,317 (566)
of which: acquired or originated impaired financial assets
* Values to be shown for informational purposes
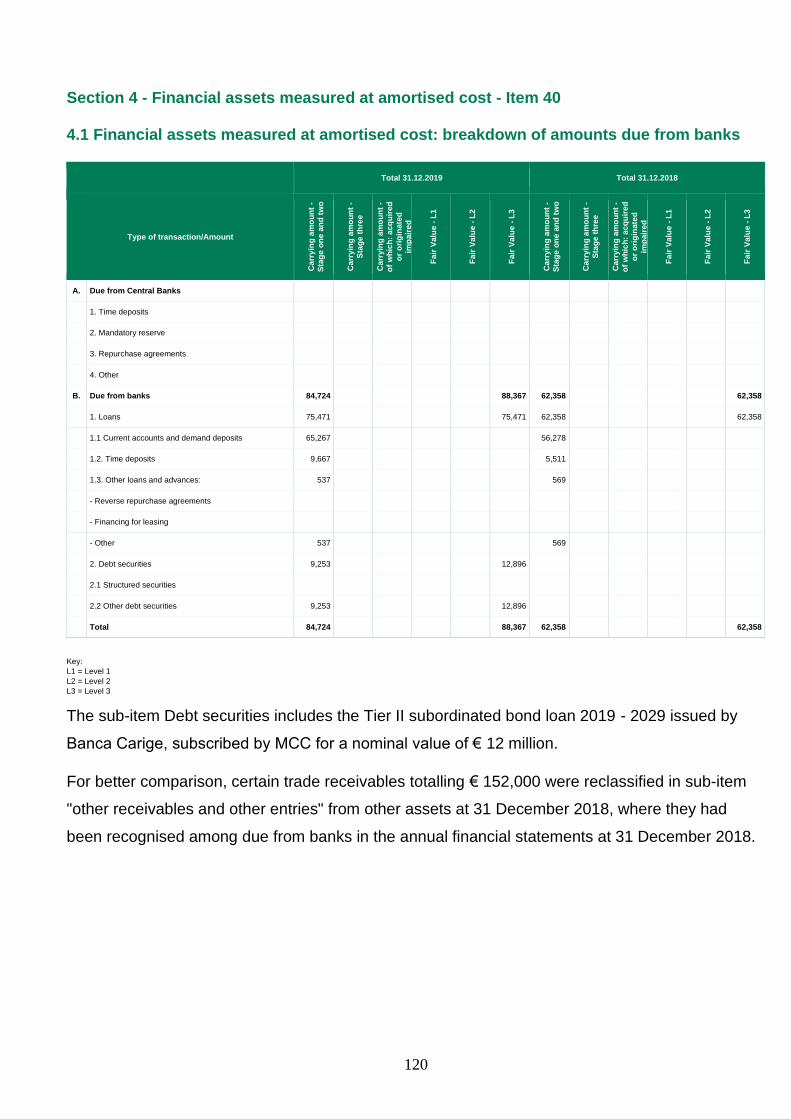
120
Section 4 - Financial assets measured at amortised cost - Item 40
4.1 Financial assets measured at amortised cost: breakdown of amounts due from banks
Total 31.12.2019 Total 31.12.2018
Type of transaction/Amount
Carr
yin
g a
mo
un
t -
Sta
ge
on
e a
nd
tw
o
Carr
yin
g a
mo
un
t -
Sta
ge
th
ree
Carr
yin
g a
mo
un
t -
of
wh
ich
: a
cq
uir
ed
or
ori
gin
ate
d
imp
air
ed
Fa
ir V
alu
e -
L1
Fa
ir V
alu
e -
L2
Fa
ir V
alu
e -
L3
Carr
yin
g a
mo
un
t -
Sta
ge
on
e a
nd
tw
o
Carr
yin
g a
mo
un
t -
Sta
ge
th
ree
Carr
yin
g a
mo
un
t -
of
wh
ich
: a
cq
uir
ed
or
ori
gin
ate
d
imp
air
ed
Fa
ir V
alu
e -
L1
Fa
ir V
alu
e -
L2
Fa
ir V
alu
e -
L3
A. Due from Central Banks
1. Time deposits
2. Mandatory reserve
3. Repurchase agreements
4. Other
B. Due from banks 84,724 88,367 62,358 62,358
1. Loans 75,471 75,471 62,358 62,358
1.1 Current accounts and demand deposits 65,267 56,278
1.2. Time deposits 9,667 5,511
1.3. Other loans and advances: 537 569
- Reverse repurchase agreements
- Financing for leasing
- Other 537 569
2. Debt securities 9,253 12,896
2.1 Structured securities
2.2 Other debt securities 9,253 12,896
Total 84,724 88,367 62,358 62,358
Key: L1 = Level 1 L2 = Level 2 L3 = Level 3
The sub-item Debt securities includes the Tier II subordinated bond loan 2019 - 2029 issued by
Banca Carige, subscribed by MCC for a nominal value of € 12 million.
For better comparison, certain trade receivables totalling € 152,000 were reclassified in sub-item
"other receivables and other entries" from other assets at 31 December 2018, where they had
been recognised among due from banks in the annual financial statements at 31 December 2018.

121
4.2 Financial assets measured at amortised cost: breakdown of amounts due from customers
Total 31.12.2019 Total 31.12.2018
Type of transaction/Amount
Carr
yin
g a
mo
un
t -
Sta
ge
on
e a
nd
tw
o
Carr
yin
g a
mo
un
t -
Sta
ge
th
ree
Carr
yin
g a
mo
un
t -
of
wh
ich
: a
cq
uir
ed
or
ori
gin
ate
d
imp
air
ed
Fa
ir V
alu
e -
L1
Fa
ir V
alu
e -
L2
Fa
ir V
alu
e -
L3
Carr
yin
g a
mo
un
t -
Sta
ge
on
e a
nd
tw
o
Carr
yin
g a
mo
un
t -
Sta
ge
th
ree
Carr
yin
g a
mo
un
t -
of
wh
ich
: a
cq
uir
ed
or
ori
gin
ate
d
imp
air
ed
Fa
ir V
alu
e -
L1
Fa
ir V
alu
e -
L2
Fa
ir V
alu
e -
L3
1. Loans 1,478,545 53,817 1,670,566 1,367,681 63,198 1,567,080
1.1. Current accounts 4,578 5,559
1.2. Reverse repurchase agreements
1.3. Mortgage loans 1,252,008 53,817 1,221,798 63,198
1.4. Credit cards, personal loans and salary-backed loans 3,503 2,666
1.5. Financing for leasing
1.6. Factoring 59,873 141
1.7. Other loans 158,583 137,517
2 Debt securities 27,507 29,074
2.1. Structured securities
2.2. Other debt securities 27,507 29,074
Total 1,506,052 53,817 1,699,640 1,367,681 63,198 1,567,080
Key: L1 = Level 1 L2 = Level 2 L3 = Level 3
For the breakdown and change in the item with respect to 2018, please see the Report on
Operations - Financial aggregates.
In particular, the item "Other loans" indicated above, equal to 158,583 thousand, includes:
• Subsidies granted of 76,830 thousand;
• Receivables from the vehicle company of 16,843 thousand;
• Receivables from Public Administrations, for fees earned and to be collected for
services rendered in managing public subsidies of 64,538 thousand;
• Receivables for advances on invoices of 10,000;
• Other receivables of 362,000.

122
4.3 Financial assets measured at amortised cost: breakdown of amounts due from customers by debtor/issuer
Total 31.12.2019 Total 31.12.2018
Type of transaction/Amount Stage one and two Stage three
of which: acquired or originated impaired assets
Stage one and two Stage three
of which: acquired or originated impaired assets
1. Debt securities 27,507
a) Public administrations
b) Other financial companies 26,529
of which: insurance companies
c) Non-financial companies 978
2. Loans to: 1,478,545 53,817 1,367,681 63,198
a) Public administrations 64,555 66,562
b) Other financial companies 68,895 54,004
of which: insurance companies
c) Non-financial companies 986,751 48,979 853,715 58,665
d) Households 358,344 4,838 393,400 4,533
Total 1,506,052 53,817 1,367,681 63,198
The item Debt securities - Other financial companies includes ABS securities issued by
securitisation vehicles, as part of basket bond transactions.
4.4 Financial assets measured at amortised cost: gross value and total value adjustments
Gross value Total value adjustments
Stage one of which:
instruments with low
credit risk Stage two Stage
three Stage one Stage two Stage three
Total partial write-offs*
Debt securities 39,592 (2,832)
Loans 1,453,536 114,054 134,840 (7,917) (5,657) (81,023)
Total 31.12.2019 1,493,128 114,054 134,840 (10,749) (5,657) (81,023)
Total 31.12.2018 1,291,784 154,661 135,311 (8,269) (7,984) (72,113)
(*) Values to be shown for informational purposes

123
Section 5 - Hedging derivatives - Item 50
5.1 - Hedging derivatives: breakdown according to type of hedge and level
FV 31.12.2019 FV 31.12.2018
L1 L2 L3 NV 31.12.2019 L1 L2 L3 NV
31.12.2018
A. Financial derivatives 88,039 151,421 82,650 288,583
1) Fair value 88,039 151,421 82,650 288,583
2) Cash flows
3) Foreign investments
B. Credit derivatives
1) Fair value
2) Cash flows
Total 88,039 151,421 82,650 288,583
Key: NV=notional value L1 = Level 1 L2 = Level 2 L3 = Level 3
Hedging derivatives are all related to funding obtained with bond issues.
5.2 Hedging derivatives: breakdown according to portfolios hedged and type of hedge
Fair value - specific Fair value Cash flows
Transaction/type of hedge
de
bt
se
cu
riti
es
an
d
inte
res
t ra
tes
eq
uit
y s
ecu
riti
es
an
d s
ha
re i
nd
ex
es
cu
rre
nc
ies
an
d
go
ld
loa
ns a
nd
rec
eiv
ab
les
co
mm
od
itie
s
oth
er
Ma
cro
Mic
ro
Ma
cro
Fo
reig
n
Inv
es
tmen
ts
1. Financial assets measured at fair value through other comprehensive income
2. Financial assets measured at amortised cost
3. Portfolio
4. Other transactions
Total assets
1. Financial liabilities
2. Portfolio 88,039
Total liabilities 88,039
1. Expected transactions
2. Portfolio of financial assets and liabilities

124
Section 7 - Equity investments - Item 70
7.1 Equity investments: information on equity investment relationships
Name Registered office Operating office Stake held % Available votes
A. Fully held companies 0 0
B. Jointly controlled companies 0 0
C. Companies subject to significant influence 0 0
Istituto della Enciclopedia Italiana fondata da Giovanni Treccani S.p.A.
Rome, Piazza dell'Enciclopedia 4
Rome, Piazza dell'Enciclopedia 4 0.890
7.4 Insignificant equity investments: accounting information
Name
Ca
rry
ing
am
ou
nt
of
eq
uit
y
inv
es
tmen
ts
To
tal
as
sets
To
tal
liab
ilit
ies
To
tal
rev
en
ue
s
Pro
fit
(Lo
ss)
fro
m
co
nti
nu
ing
op
era
tio
ns
aft
er
tax
Pro
fit
(Lo
ss)
fro
m
ce
as
ed
op
era
tio
ns
aft
er
tax
Pro
fit
(Lo
ss)
for
the
yea
r (1
)
Oth
er
inc
om
e
co
mp
on
en
ts a
fte
r
tax
(2)
Co
mp
reh
en
siv
e
inc
om
e (
3)=
(1)+
(2)
A. Fully held companies
B. Jointly controlled companies
C. Companies subject to significant influence
Istituto della Enciclopedia Italiana fondata da Giovanni Treccani S.p.A. 600 149,660 82,391 53,390 (1,663) 282 282
The figures shown in the table refer to the most recently approved financial statements
(31.12.2018): on the basis of the information available, there is no evidence of impairment.
7.5 Equity investments: annual change
Total 31.12.2019 Total 31.12.2018
A. Opening balance 600 600 B. Increases
B.1 Purchases
B.2 Write-backs
B.3 Revaluations
B.4 Other changes
C. Decreases
C1. Sales
C.2 Value adjustments
C.3 Impairment
C.4 Other changes D. Closing balance 600 600 E. Total revaluations
F. Total adjustments

125
Section 8 - Property, plant and equipment - Item 80
8.1 Property, plant and equipment for business use: breakdown of assets carried at cost
Asset/Amount Total 31.12.2019 Total 31.12.2018
1. Owned assets 400 626
a) land
b) buildings
c) furniture and fixtures 190 292
d) electronic equipment 181 245
e) other 29 89
2. Rights of use acquired with leasing 17,854
a) land
b) buildings 17,677
c) furniture and fixtures
d) electronic equipment
e) other 177
Total 18,254 626
The item is made up of the furniture, fixtures and equipment needed for the Bank’s operations.
Rights of use, recognised on the basis of the new accounting standard IFRS 16, mainly refer to
real estate leasing contracts, including that for the Bank's registered offices, and to leasing
contracts for company vehicles provided to employees for free use.
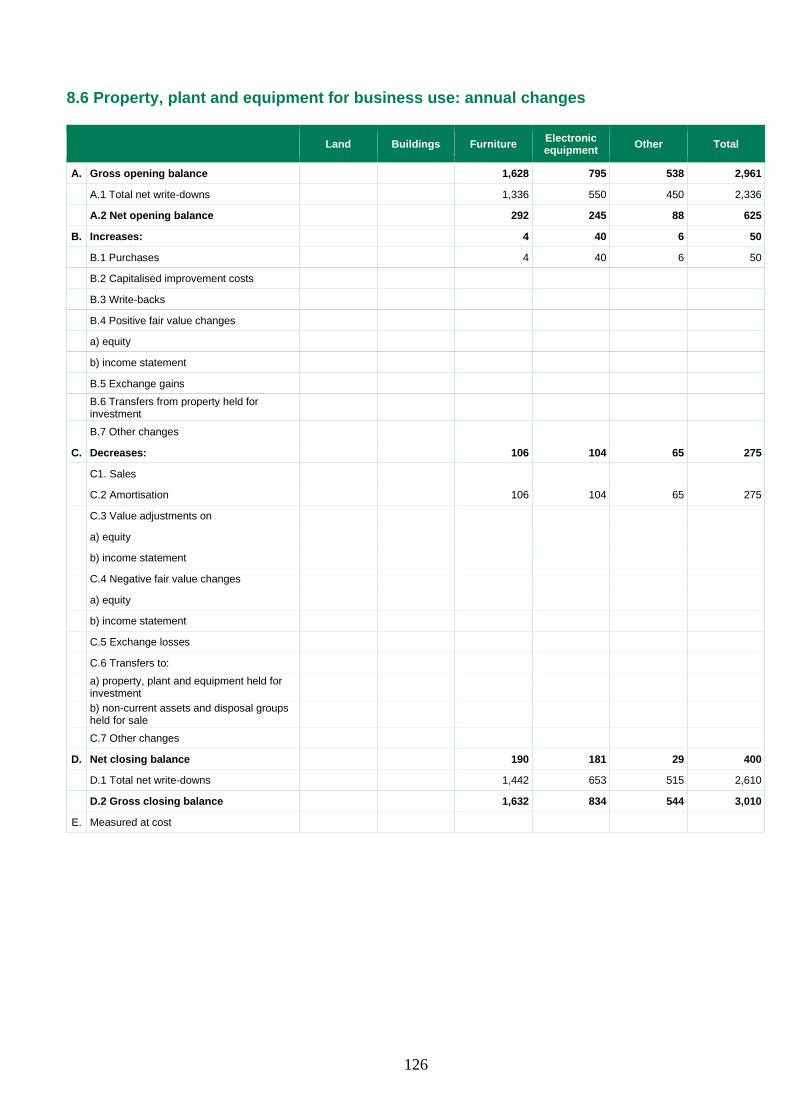
126
8.6 Property, plant and equipment for business use: annual changes
Land Buildings Furniture Electronic equipment Other Total
A. Gross opening balance 1,628 795 538 2,961
A.1 Total net write-downs 1,336 550 450 2,336
A.2 Net opening balance 292 245 88 625
B. Increases: 4 40 6 50
B.1 Purchases 4 40 6 50
B.2 Capitalised improvement costs
B.3 Write-backs
B.4 Positive fair value changes
a) equity
b) income statement
B.5 Exchange gains
B.6 Transfers from property held for investment
B.7 Other changes
C. Decreases: 106 104 65 275
C1. Sales
C.2 Amortisation 106 104 65 275
C.3 Value adjustments on
a) equity
b) income statement
C.4 Negative fair value changes
a) equity
b) income statement
C.5 Exchange losses
C.6 Transfers to:
a) property, plant and equipment held for investment
b) non-current assets and disposal groups held for sale
C.7 Other changes
D. Net closing balance 190 181 29 400
D.1 Total net write-downs 1,442 653 515 2,610
D.2 Gross closing balance 1,632 834 544 3,010
E. Measured at cost
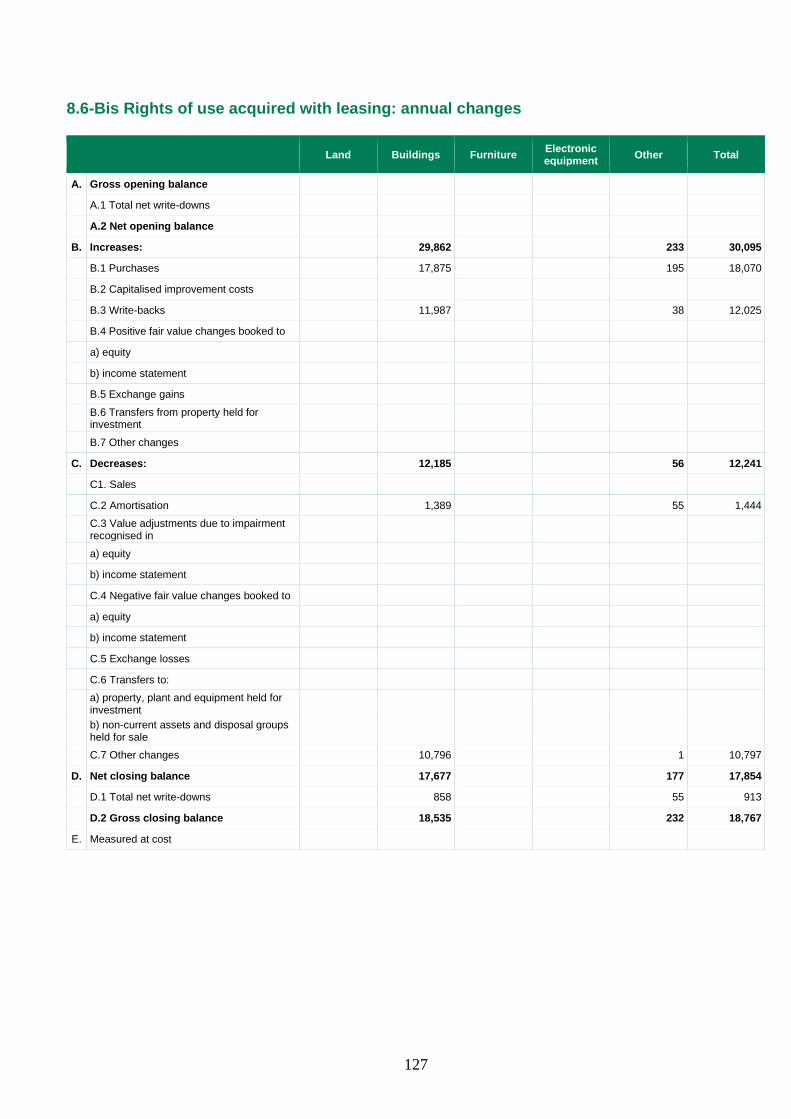
127
8.6-Bis Rights of use acquired with leasing: annual changes
Land Buildings Furniture Electronic equipment Other Total
A. Gross opening balance
A.1 Total net write-downs
A.2 Net opening balance
B. Increases: 29,862 233 30,095
B.1 Purchases 17,875 195 18,070
B.2 Capitalised improvement costs
B.3 Write-backs 11,987 38 12,025
B.4 Positive fair value changes booked to
a) equity
b) income statement
B.5 Exchange gains
B.6 Transfers from property held for investment
B.7 Other changes
C. Decreases: 12,185 56 12,241
C1. Sales
C.2 Amortisation 1,389 55 1,444
C.3 Value adjustments due to impairment recognised in
a) equity
b) income statement
C.4 Negative fair value changes booked to
a) equity
b) income statement
C.5 Exchange losses
C.6 Transfers to:
a) property, plant and equipment held for investment
b) non-current assets and disposal groups held for sale
C.7 Other changes 10,796 1 10,797
D. Net closing balance 17,677 177 17,854
D.1 Total net write-downs 858 55 913
D.2 Gross closing balance 18,535 232 18,767
E. Measured at cost

128
Section 9 - Intangible assets - Item 90
9.1 Intangible assets: breakdown by type
Total 31.12.2019 Total 31.12.2018
Asset/Amount Finite life Indefinite life Finite life Indefinite life
A.1 Goodwill
A.2 Other intangible assets 1,913 1,998
A.2.1 Assets carried at cost: 1,913 1,998
a) Intangible assets generated internally
b) Other assets 1,913 1,998
A.2.2 Assets carried at fair value:
a) Intangible assets generated internally
b) Other assets
Total 1,913 1,998
The item comprises exclusively software. To develop and manage its software, the Bank
uses an IT consortium, which means it has a limited need to invest in the same.

129
9.2 Intangible assets: annual changes
Other intangible assets:
generated internally Other intangible assets:
other
Goodwill FIN INDEF FIN INDEF Total
A. Opening balance 5,271 5,271
A.1 Total net write-downs 3,273 3,273
A.2 Net opening balance 1,998 1,998
B. Increases 855 855
B.1 Purchases 855 855
B.2 Increases in internal intangible assets
B.3 Write-backs
B.4 Positive fair value changes:
- in equity
- in income statement
B.5 Exchange gains
B.6 Other changes
C. Decreases 940 940
C1. Sales
C.2 Value adjustments 923 923
- Amortisation 923 923
- Impairment:
+ equity
+ income statement
C.3 Negative fair value changes:
- in equity
- in income statement
C.3 Transfer to non-current assets held for sale
C.5 Exchange losses
C.6 Other changes 17 17
D. Net closing balance 1,913 1,913
D.1 Total net value adjustments 1,967 1,967
E. Gross closing balance 3,880 3,880
F. Measured at cost
Key: FIN = finite life INDEF = indefinite life

130
Section 10 – Tax assets and liabilities – Asset Item 100 and Liability Item 60
10.1 Deferred tax assets: breakdown
Amount
Asset/Amount 31.12.2019 31.12.2018
1. Deferred tax assets
Write-downs of loans 8,179 7,736
Other financial instruments 1,314 4,753
Property, plant and equipment and intangible assets 17 17
Provisions for risks and charges 2,783 2,273
Other assets/liabilities 87 74
Total 12,381 14,853
Deferred tax assets totalled 12,381 thousand, a contraentry of 10,328 thousand was recognised in
the income statement and a contraentry of 2,053 thousand in equity.
10.2 Deferred tax liabilities: breakdown
Amount
Asset/Amount 31.12.2019 31.12.2018
1. Deferred tax liabilities
Other financial instruments 23 14
Other assets/liabilities 60 94
Total 83 108
Deferred tax liabilities are all recognised as a contra entry in equity.
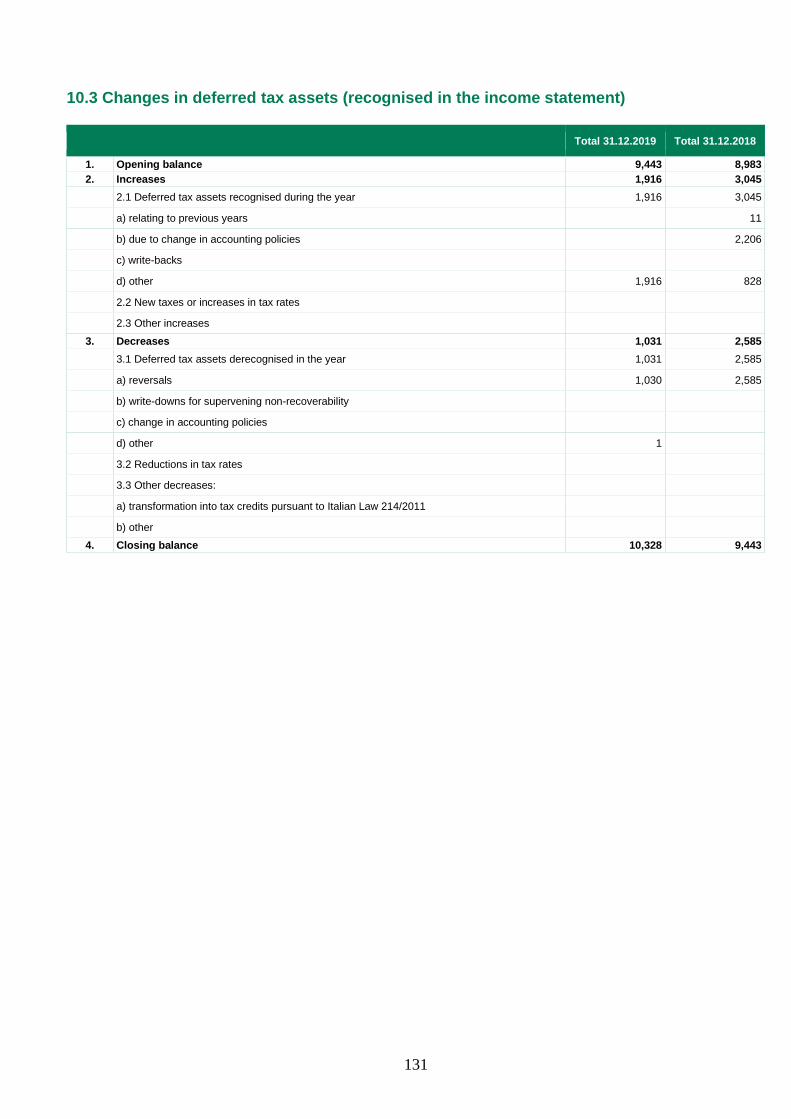
131
10.3 Changes in deferred tax assets (recognised in the income statement)
Total 31.12.2019 Total 31.12.2018
1. Opening balance 9,443 8,983 2. Increases 1,916 3,045
2.1 Deferred tax assets recognised during the year 1,916 3,045
a) relating to previous years 11
b) due to change in accounting policies 2,206
c) write-backs
d) other 1,916 828
2.2 New taxes or increases in tax rates
2.3 Other increases 3. Decreases 1,031 2,585
3.1 Deferred tax assets derecognised in the year 1,031 2,585
a) reversals 1,030 2,585
b) write-downs for supervening non-recoverability
c) change in accounting policies
d) other 1
3.2 Reductions in tax rates
3.3 Other decreases:
a) transformation into tax credits pursuant to Italian Law 214/2011
b) other 4. Closing balance 10,328 9,443

132
10.3-bis Changes in prepaid taxes pursuant to Italian Law 214/2011
Total 31.12.2019 Total 31.12.2018
1. Opening balance 5,436 5,436
2. Increases
3. Decreases
3.1 Reversals
3.2 Transformation into tax credits
a) deriving from losses for the year
b) deriving from tax losses
3.3 Other decreases
4. Closing balance 5,436 5,436
Deductibility of impairment and losses on loans
The regime pursuant to Law 83 of 27 June 2015, converted with Law 132 of 6 August 2015,
introduced changes in relation to the deductibility of impairment and losses on loans of
financial and credit institutions.
In particular, in financial year 2016 impairment and losses on loans to customers recognised
in the financial statements and losses incurred following sales for a consideration are fully
deductible, for IRES and IRAP purposes, in the year in which they are recognised, while
impairment not deducted at 31 December 2015 can be deducted by 31.12.2025 based on
specific annual rates.
As a consequence, deferred tax assets pursuant to the table above will no longer increase as
a result of the full deductibility of write-downs on loans. The current amount will be
progressively recovered in tax returns through to financial year 2025.
Italian Law 216/2016 ensured the compatibility of DTAs (Deferred Tax Assets) with the
European rules on State aid. In particular the possibility of converting qualified DTAs (related
to: write-downs of loans, goodwill and other intangible assets) into tax credits was introduced
for banks but only exercising an option that provides for payment of an annual fee. The Bank
made use of the option, and therefore continues to not deduct DTAs from calculation of Own
Funds.
The deduction of the 2019 portion was deferred by the 2020 Budget Law (no. 160 of
27/12/2019) with the following methods:
- At constant rates for the tax period in effect at 31/12/2022 and the three subsequent
ones with regards to the 12% portion established under Decree Law 83/2015;
- For the tax period in effect at 31/12/2028 relative to the 10% portion established under
Law 145/2018 (FTA IFRS9).

133
10.5 Changes in deferred tax assets (with contra entry in shareholders’ equity)
Total 31.12.2019 Total 31.12.2018
1. Opening balance 5,410 3,009
2. Increases 90 2,492
2.1 Deferred tax assets recognised during the year 90 2,492
a) relating to previous years
b) due to change in accounting policies
c) other 90 2,492
2.2 New taxes or increases in tax rates
2.3 Other increases
3. Decreases 3,446 91
3.1 Deferred tax assets derecognised in the year 3,446 91
a) reversals 3,439 91
b) write-downs for supervening non-recoverability
c) due to change in accounting policies
d) other 7
3.2 Reductions in tax rates
3.3 Other decreases
4. Closing balance 2,054 5,410
10.6 Changes in deferred tax liabilities (recognised in shareholders’ equity)
Total 31.12.2019 Total 31.12.2018
1. Opening balance 108 125
2. Increases 9
2.1 Deferred tax liabilities recognised in the year 9
a) relating to previous years
b) due to change in accounting policies
c) other 9
2.2 New taxes or increases in tax rates
2.3 Other increases
3. Decreases 34 17
3.1 Deferred tax liabilities derecognised during the year 34 17
a) reversals 34 17
b) due to change in accounting policies
c) other
3.2 Reductions in tax rates
3.3 Other decreases
4. Closing balance 83 108
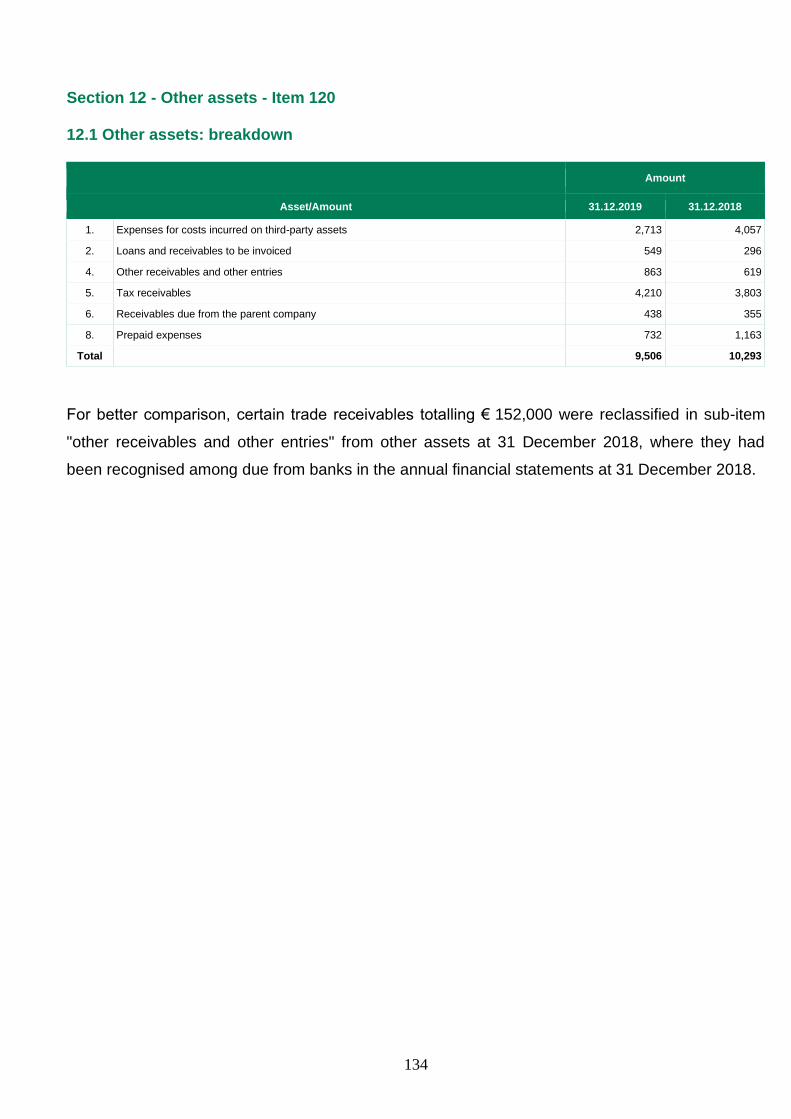
134
Section 12 - Other assets - Item 120
12.1 Other assets: breakdown
Amount
Asset/Amount 31.12.2019 31.12.2018
1. Expenses for costs incurred on third-party assets 2,713 4,057
2. Loans and receivables to be invoiced 549 296
4. Other receivables and other entries 863 619
5. Tax receivables 4,210 3,803
6. Receivables due from the parent company 438 355
8. Prepaid expenses 732 1,163
Total 9,506 10,293
For better comparison, certain trade receivables totalling € 152,000 were reclassified in sub-item
"other receivables and other entries" from other assets at 31 December 2018, where they had
been recognised among due from banks in the annual financial statements at 31 December 2018.

135
Liabilities
Section 1 - Financial liabilities measured at amortised cost - Item 10
1.1 Financial liabilities measured at amortised cost: breakdown of amounts due to banks
Total 31.12.2019 Total 31.12.2018
Type of transaction/Amount Carrying amount
Fair Value - L1
Fair Value - L2
Fair Value - L3
Carrying amount
Fair Value - L1
Fair Value - L2
Fair Value - L3
1. Due to central banks 320,504 396,822
2. Due to banks 173,884 495,931
2.1 Current accounts and demand deposits 0 0
2.2 Time deposits
2.3 Loans and advances 83,573 404,013
2.3.1 Repurchase agreements 42,044 199,002
2.3.2 Other 41,529 205,011
2.4 Payables for commitments to repurchase own equity instruments
2.5 Payables for leasing
2.6 Other payables 90,311 91,918
Total 494,388 489,064 892,753 888,194
Key: L1 = Level 1 L2 = Level 2 L3 = Level 3
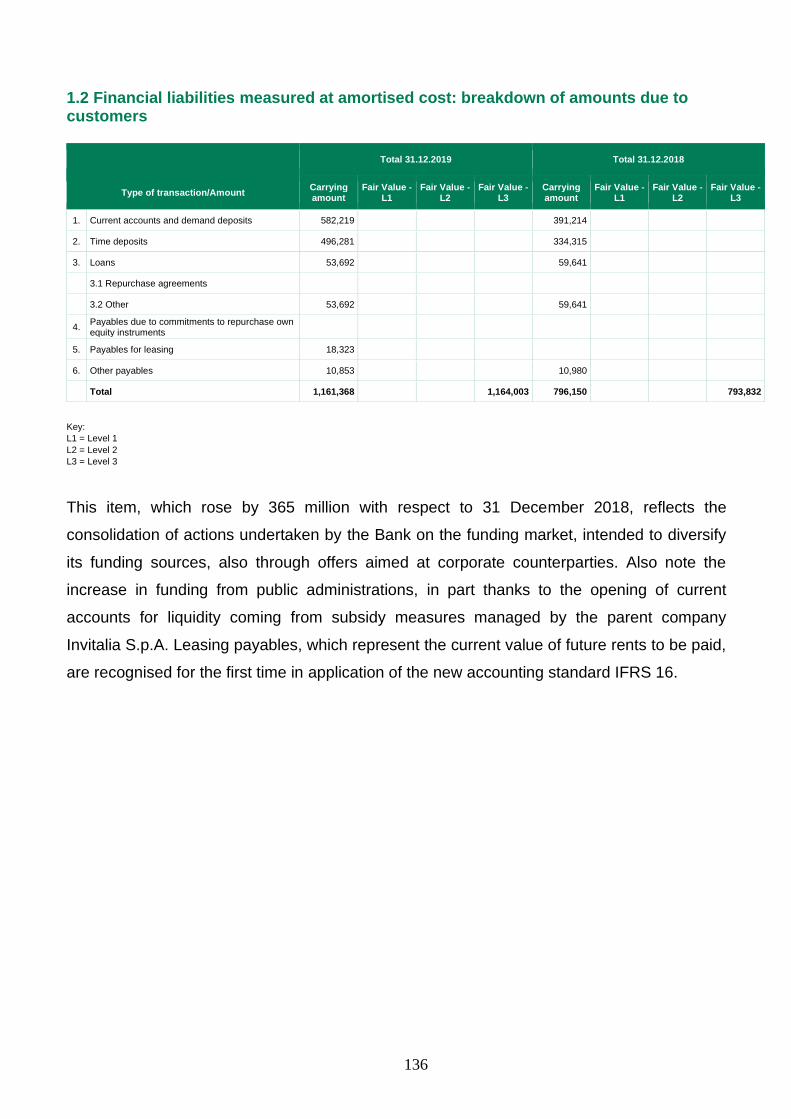
136
1.2 Financial liabilities measured at amortised cost: breakdown of amounts due to customers
Total 31.12.2019 Total 31.12.2018
Type of transaction/Amount Carrying amount
Fair Value - L1
Fair Value - L2
Fair Value - L3
Carrying amount
Fair Value - L1
Fair Value - L2
Fair Value - L3
1. Current accounts and demand deposits 582,219 391,214
2. Time deposits 496,281 334,315
3. Loans 53,692 59,641
3.1 Repurchase agreements
3.2 Other 53,692 59,641
4. Payables due to commitments to repurchase own equity instruments
5. Payables for leasing 18,323
6. Other payables 10,853 10,980
Total 1,161,368 1,164,003 796,150 793,832
Key: L1 = Level 1 L2 = Level 2 L3 = Level 3
This item, which rose by 365 million with respect to 31 December 2018, reflects the
consolidation of actions undertaken by the Bank on the funding market, intended to diversify
its funding sources, also through offers aimed at corporate counterparties. Also note the
increase in funding from public administrations, in part thanks to the opening of current
accounts for liquidity coming from subsidy measures managed by the parent company
Invitalia S.p.A. Leasing payables, which represent the current value of future rents to be paid,
are recognised for the first time in application of the new accounting standard IFRS 16.

137
1.3 Financial liabilities measured at amortised cost: breakdown of securities issued
Total 31.12.2019 Total 31.12.2018
Type of transaction/Amount Carrying amount
Fair Value - L1
Fair Value - L2
Fair Value - L3
Carrying amount
Fair Value - L1
Fair Value - L2
Fair Value - L3
A. Securities
1. bonds 457,245 528,363 296,699 347,871
1.1 structured
1.2 other 457,245 528,363 296,699 347,871
2. other securities
2.1 structured
2.2 other
Total 457,245 528,363 296,699 347,871
Key: L1 = Level 1 L2 = Level 2 L3 = Level 3
Securities issued consist of:
- € 158.5 million relative to a residual bond loan listed on the MOT, issued on 9 February 1998
and maturing on 10 February 2028;
- € 298.7 million relative to a “social” bond loan (unsecured senior preferred), listed on the
Luxembourg Stock Exchange, for a total amount of € 300 million (excluding transaction costs),
with an annual fixed rate of 1.5%, issued on 24 October 2019 and maturing on 24 October
2024.
1.6 Payables for leasing
Below is the analysis of leasing payables, broken down by expiration dates (IFRS 16, paragraph
58):
Up to 3 months (*)
From over 3 months to 6
months
From over 6 months to 1
year
From over 1 year to 5
years
From over 5 years to 10
years More than 10 years Total
Payables for leasing 342 180 377 3,915 6,768 6,741 18,323
(*) Includes accrued expenses of € 178,000.

138
Section 4 - Hedging derivatives - Item 40
4.1 Hedging derivatives: breakdown by type of hedge and hierarchical level
NV
31.12.2019 Fair value 31.12.2019 NV 31.12.2018 Fair value 31.12.2018
L1 L2 L3 L1 L2 L3
A. Financial derivatives 300,000 2,248
1) Fair value 300,000 2,248
2) Cash flows
3) Foreign investments
B. Credit derivatives
1) Fair value
2) Cash flows
Total 300,000 2,248 Key: NV: notional value L1 = Level 1 L2 = Level 2 L3 = Level 3
4.2 Hedging derivatives: breakdown according to portfolios hedged and type of hedge
Fair value - specific Fair value Cash flows
Transaction/type of hedge
de
bt
se
cu
riti
es
an
d
inte
res
t ra
tes
eq
uit
y s
ecu
riti
es
an
d s
ha
re i
nd
ex
es
cu
rre
nc
ies
an
d
go
ld
loa
ns a
nd
rec
eiv
ab
les
co
mm
od
itie
s
oth
er
Ma
cro
Mic
ro
Ma
cro
Fo
reig
n
inv
es
tmen
ts
1. Financial assets measured at fair value through other comprehensive income
2. Financial assets measured at amortised cost
3. Portfolio
4. Other transactions
Total assets
1. Financial liabilities
2. Portfolio 2,248
Total liabilities 2,248
1. Expected transactions
2. Portfolio of financial assets and liabilities

139
Section 5 - Value adjustments of financial liabilities with macro hedging - item 50
5.1 Value adjustments of hedged financial liabilities: breakdown by portfolios hedged
Value adjustment of hedged liabilities/Amount Total 31.12.2019 Total 31.12.2018
1. Positive adjustment of financial liabilities 80,341 73,789
2. Negative adjustment of financial liabilities (2,160)
Total 78,181 73,789
This item reflects the changes in discount rates with respect to the previous year, in addition to
changes in the underlying financial liabilities.
Section 6 - Tax liabilities - Item 60
See section 10 of the assets.

140
Section 8 - Other Liabilities - Item 80
8.1 Other liabilities: breakdown
Amount
Asset/Amount 31.12.2019 31.12.2018
1. Due to the parent company 635 586
2. Due to the parent company for tax consolidation 1,134
3. Social security charges 935 893
4. Trade payables 1,364 1,360
5. Payables for invoices to be received 6,279 3,855
6. Payables to personnel 1,692 1,492
7. Security deposits 30
8. Payables to public administrations 7,924 5,164
7. Sundry payables 1,482 315
9. Tax payables for indirect taxes 2,377 2,096
10. Accrued expense and deferred income 105 91
Total 23,957 15,852
The increase is mainly due to greater concentration of orders to suppliers near the end of the
financial year. Additionally, in application of the tax consolidation agreement with the parent
company, IRES payables are classified in this item.

141
Section 9 - Employee severance benefits - Item 90
9.1 Employee severance indemnity: annual changes
Total 31.12.2019 Total 31.12.2018
A. Opening balance 3,163 3,260 B. Increases 150 96
B.1 Provisions in the year 27 33
B.2 Other changes 123 63 C. Decreases 192 193
C.1 Payments made 192 193
C.2 Other changes D. Closing balance 3,121 3,163
Total 3,121 3,163
9.2 Other Information
The Bank’s provisions for employee severance benefits from 1 January 2007 are no longer
increased by the annual amount set aside for the participants, because on the basis of the
employees’ choice the same are put into a special Treasury fund set up by the INPS or into a
complementary pension fund.
As the indemnity represents a post-employment benefit, it is recognised on the basis of its
actuarial value taking into account the appraisal carried out by an independent expert. The
costs of the period are posted under personnel costs and actuarial gains and losses are
posted as a contra item in equity. At 31 December 2019 the cumulative actuarial gains
recognised in equity amounted to 308,000, while the related deferred taxation recognised as
a reduction amounted to 85,000. During the period, actuarial gains decreased by 123,000.
Specifically, the negative fair value changes refer for 7,000 to changes associated with
collective measurements (new entries, resignations, etc.), compensated for by a change in
the opposite direction of 130,000 relative to financial and demographic assumptions.

142
Section 10 - Provisions for risks and charges - Item 100
10.1 Provisions for risks and charges: breakdown
Item/Amount Total 31.12.2019 Total 31.12.2018
1. Provisions for credit risks relative to financial commitments and guarantees issued 1,712 581
2. Provisions for other commitments and guarantees given
3. Company pension funds 3,323 3,287
4. Other provisions for risks and charges 3,256 2,688
4.1 legal and tax disputes 234 234
4.2 personnel expenses 2,734 2,030
4.3 other 288 424
Total 8,291 6,556
10.2 Provisions for risks and charges: annual changes
Provisions for other
commitments and guarantees given
Pension funds Other provisions
for risks and charges
Total
A. Opening balance 3,287 2,688 5,975
B. Increases 308 2,328 2,636
B.1 Provisions in the year 37 2,328 2,365
B.2 Changes due to passage of time
B.3 Changes due to changes in discount rate
B.4 Other changes 271 271
C. Decreases 272 1,760 2,032
C.1 Use during the year 272 1,568 1,840
C.2 Changes due to changes in discount rate
C.3 Other changes 192 192
D. Closing balance 3,323 3,256 6,579
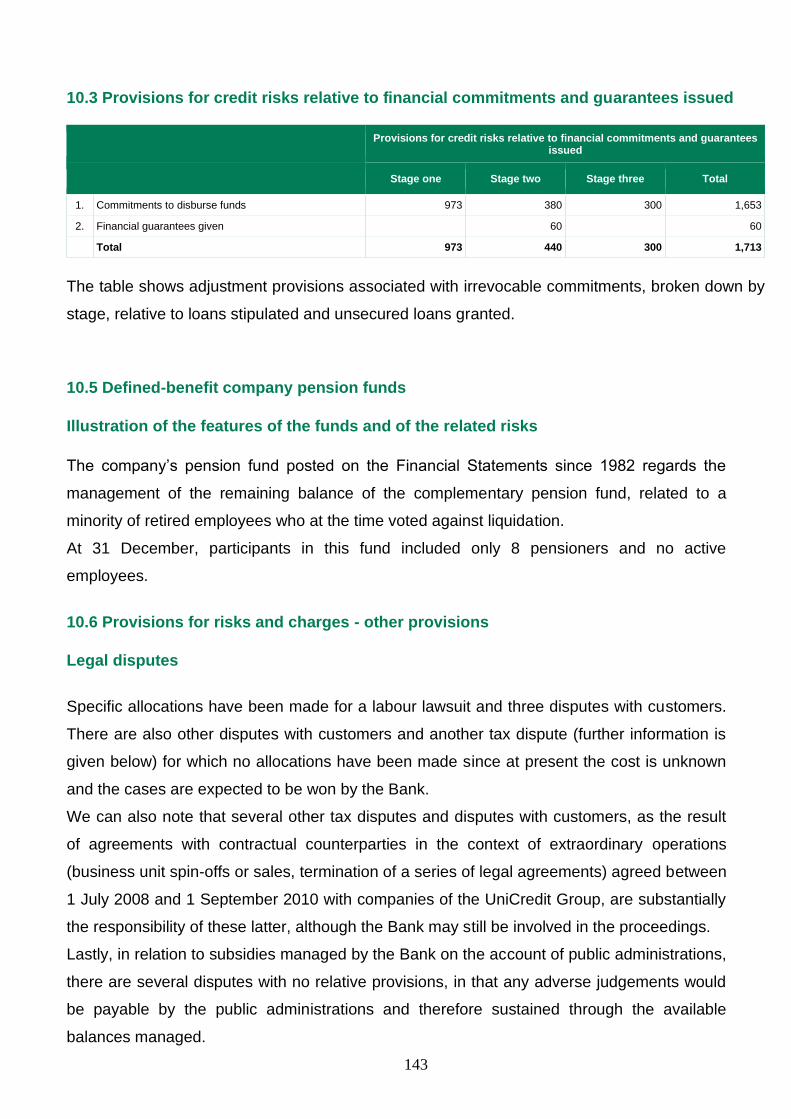
143
10.3 Provisions for credit risks relative to financial commitments and guarantees issued
Provisions for credit risks relative to financial commitments and guarantees
issued
Stage one Stage two Stage three Total
1. Commitments to disburse funds 973 380 300 1,653
2. Financial guarantees given 60 60
Total 973 440 300 1,713
The table shows adjustment provisions associated with irrevocable commitments, broken down by
stage, relative to loans stipulated and unsecured loans granted.
10.5 Defined-benefit company pension funds
Illustration of the features of the funds and of the related risks
The company’s pension fund posted on the Financial Statements since 1982 regards the
management of the remaining balance of the complementary pension fund, related to a
minority of retired employees who at the time voted against liquidation.
At 31 December, participants in this fund included only 8 pensioners and no active
employees.
10.6 Provisions for risks and charges - other provisions
Legal disputes
Specific allocations have been made for a labour lawsuit and three disputes with customers.
There are also other disputes with customers and another tax dispute (further information is
given below) for which no allocations have been made since at present the cost is unknown
and the cases are expected to be won by the Bank.
We can also note that several other tax disputes and disputes with customers, as the result
of agreements with contractual counterparties in the context of extraordinary operations
(business unit spin-offs or sales, termination of a series of legal agreements) agreed between
1 July 2008 and 1 September 2010 with companies of the UniCredit Group, are substantially
the responsibility of these latter, although the Bank may still be involved in the proceedings.
Lastly, in relation to subsidies managed by the Bank on the account of public administrations,
there are several disputes with no relative provisions, in that any adverse judgements would
be payable by the public administrations and therefore sustained through the available
balances managed.
144
Notification of IRES assessment for financial year 2008
In December 2011, on conclusion of a general inspection by the Revenues Agency regarding
the year 2008, the Bank was served a Report of Findings which challenged the deductibility
of the costs incurred in 2008—for a total of € 19.6 million—for transactions concluded for
current and potential disputes with the Parmalat Group. In relation to this dispute, following
observations sent by the Bank on 29 February 2012, no notification of assessment has been
received from the Revenues Agency. The said Report of Findings also assessed the Bank as
having a taxable income of € 16.2 million, pursuant to art. 37 bis of Italian Presidential
Decree 600/73, resulting from a reorganisation operation of the credit recovery sector, gained
from the sale on the part of the Bank and other companies of the UniCredit Group of non-
performing positions in the factoring and loans segment to a subsidiary of the then parent
company UniCredit S.p.A.
Following the Report of Findings in 2012 the Lazio Regional Head Office of the Revenues
Agency charged the Bank and UniCredit S.p.A., pursuant to art. 37 bis, for deducting losses
resulting from the sale of the non performing positions. An appeal lodged against this charge
by UniCredit SpA and the Bank was accepted by the Rome Provincial Tax Commission on 2
October 2014. In May 2015, the Revenues Agency lodged an appeal. The hearing for
discussion was held on 10 May 2016 with judgement filed on 13 June with a positive result as
in the first instance. On 13 January 2017, the Revenues Agency lodged an appeal with the
Court of Cassation. UniCredit, as the consolidating entity, presented a request for facilitated
settlement pursuant to article 6 of Decree Law 119 of 23 October 2018, relative to the
judgement originally made by the bank jointly with MCC, as well as a request to suspend the
judgement until 31 December 2020, formulated pursuant to paragraph 10 of the
aforementioned article 6. In this regard, as for the previous year, the Bank decided not to set
aside any provisions for risks and charges, as these are expenses, obligations and
responsibilities referable to the Corporate Business Unit, already demerged to UCCB SpA
(now UniCredit SpA) on 01 September 2010 and, therefore, of exclusive pertinence to the
former parent company UniCredit S.p.A.

145
Personnel expenses
The provision includes direct and indirect charges relative to production bonuses/incentives
which on the basis of subsequent resolutions or trade union agreements will have to be paid
to personnel, as well as the allocation for restructuring charges, equal to 1.3 million, initially
approved by the Board of Directors in 2017 and most recently in February 2020, following
regulatory changes relative to the pension situation aimed at guaranteeing the redefinition of
the organisational structure.
Other
The item includes Provisions for liabilities attributable essentially to operational risks deriving
from the management of public subsidies (238,000), to the estimated value of liabilities
related to irrevocable commitments—assumed between 2007 and 2008—following changes
in market conditions, in terms of cost of funding (49,000).

146
Section 12 - Capital - Items 110, 130, 140, 150, 160, 170 and 180
12.1 “Share capital” and “Treasury shares”: breakdown
Paid-up share capital € 204,508,690 represented by 40,901,738 ordinary shares with a value of €
5 each.
12.2 Share capital - Number of shares: annual changes
Items/Types Ordinary Other
A. Shares outstanding at start of period 40,901,738
- fully paid up 40,901,738
- not fully paid up
A.1 Own shares (-)
A.2 Shares outstanding: opening balance
B. Increases
B.1 New issues
- against payment:
- business combinations
- bond conversion
- exercise of warrants
- other
- free of charge:
- to employees
- to directors
- other
B.2 Sale of own shares
B.3 Other changes
C. Decreases
C.1 Cancellation
C.2 Purchase of own shares
C.3 Disposal of companies
C.4 Other changes
D. Shares outstanding: closing balance 40,901,738
D.1 Own shares (+)
D.2 Shares at end of the year 40,901,738
- fully paid up 40,901,738
- not fully paid up
12.3 Share capital: other information
Share capital is subscribed by the sole shareholder Invitalia S.p.A. for an amount of €
204,508,690 made up of 40,901,738 shares of € 5 each.

147
12.4 Profit reserves: other information
Amount
Item/Amount 31.12.2019 31.12.2018
1. Legal reserve 25,461 24,451
2. Extraordinary reserve 66,881 47,689
3. UniCredit Infrastrutture merger surplus reserve 826 826
4. Negative reserve for sales to companies in the UniCredit group (16,355) (16,355)
5. Positive reserve for sales to companies in the UniCredit group 72 72
6. FTA IFRS 9 reserve (5,494) (5,494)
Total 71,390 51,189
1. The legal reserve, made up of net income, can be used to cover losses.
2. The extraordinary reserve, composed of profit reserves, can be used to cover losses, for
capital increases and for shareholder distributions.
3. The reserve from the merger of UniCredit Infrastrutture can be used to cover losses, for capital
increases and for shareholder distributions. The reserve is made up of paid-up share capital of
€ 695,000 and, for the remainder, the income reserves of the company taken over in 2008.
4. The negative reserve includes capital losses incurred in 2008 subsequent to the sale of the
non-performing positions to the company Aspra Finance, within the sphere of the overall
restructuring of the non-performing loan department of the UniCredit Group.
5. The positive reserve derives from the sale, in 2010, of the Information Technology branch to
the company UGIS belonging to the UniCredit Group.
6. The FTA IFRS 9 was established following initial application of the new international
accounting standard relative to recognition of financial assets.
12.6 Other information
Amount
Item/Amount 31.12.2019
1. Actuarial gains on Employees’ Severance Indemnity Provision 224
2. Actuarial losses on Company pension funds (1,485)
3. Negative reserve for financial assets measured at fair value through other comprehensive income (2,614)
Total (3,875)
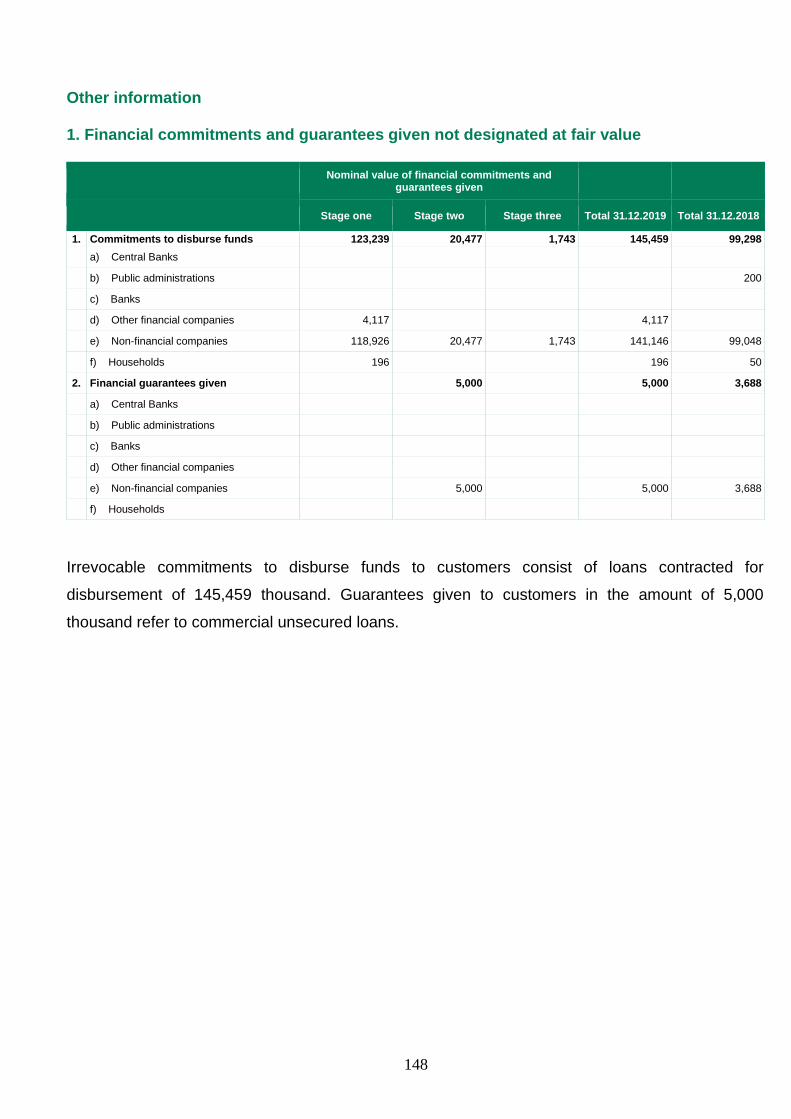
148
Other information
1. Financial commitments and guarantees given not designated at fair value
Nominal value of financial commitments and
guarantees given
Stage one Stage two Stage three Total 31.12.2019 Total 31.12.2018
1. Commitments to disburse funds 123,239 20,477 1,743 145,459 99,298
a) Central Banks
b) Public administrations 200
c) Banks
d) Other financial companies 4,117 4,117
e) Non-financial companies 118,926 20,477 1,743 141,146 99,048
f) Households 196 196 50
2. Financial guarantees given 5,000 5,000 3,688
a) Central Banks
b) Public administrations
c) Banks
d) Other financial companies
e) Non-financial companies 5,000 5,000 3,688
f) Households
Irrevocable commitments to disburse funds to customers consist of loans contracted for
disbursement of 145,459 thousand. Guarantees given to customers in the amount of 5,000
thousand refer to commercial unsecured loans.

149
2. Other commitments and guarantees given
Nominal value
Total 31.12.2019 Total 31.12.2018
1. Other guarantees given 9 3
of which: impaired
a) Central Banks
b) Public administrations
c) Banks 9 3
d) Other financial companies
e) Non-financial companies
f) Households
2. Other commitments
of which: impaired
a) Central Banks
b) Public administrations
c) Banks
d) Other financial companies
e) Non-financial companies
f) Households

150
3. Assets lodged as guarantee for own liabilities and commitments
Portfolios Amount 31.12.2019
Amount 31.12.2018
1. Financial assets measured at fair value through profit and loss
2. Financial assets measured at fair value through other comprehensive income 101,098 436,532 3. Financial assets measured at amortised cost 599,631 454,971
4. Property, plant and equipment
of which: inventory
Specifically, the item includes:
− Financial assets measured at fair value through other comprehensive income:
✓ 42,123 thousand relative to repurchase agreements (recognised under item P10,
see Section 1.-1.1 of the Liabilities);
✓ 54,297 thousand relative to Eurosystem financing transactions with the ECB
(recognised under item P10, see Section 1.-1.1 of the Liabilities);
✓ 2,507 thousand relative to guarantees given to public administrations for activities
carried out on their account to disburse subsidies to companies;
✓ 2,171 thousand relative to commitments associated with the internal social security
fund (recognised under item P100, see Section 10.-10.1, point 3);
− Financial assets measured at amortised cost:
✓ 359,348 thousand relative to lending contracts transferred as a guarantee to the
ECB, in the context of Eurosystem refinancing transactions;
✓ 142,411 thousand in favour of the ECB relative to the nominal value of an ABS
security, subscribed following the securitisation of a portfolio of residential
mortgages in 2016, valued by the ECB at 129,998 thousand;
✓ 58,935 thousand relative to loan transactions given to guarantee CDP funding;
✓ 38,860 thousand relative to loan transactions given to guarantee BEI funding;
✓ 77,000 relative to time deposits associated with Bank operations.

151
4. Management and intermediation services for customer accounts
Type of services Amount
1. Execution of orders on behalf of customers
a) purchases
1. settled
2. not settled
b) sales
1. settled
2. not settled
2. Individual portfolio management
a) individual
b) collective 3. Securities custody and administration 862,330
a) third-party securities deposited: connected with the role of depositary bank (excluding portfolio management)
1. securities issued by the bank which prepares the Financial Statements
2. other securities
b) third-party securities deposited (excluding portfolio management): other
1. securities issued by the bank which prepares the Financial Statements
2. other securities
c) third-party securities deposited with third parties
d) securities owned by bank deposited with third parties 862,330 4. Other transactions 6,550,241
With reference to point 4. Other transactions from the table above, below are the
balances at 31 December 2019 for the main funds managed by MCC using separate
accounting on the basis of specific agreements with the national government and the
regions:
Other transactions Amount
Guarantee fund Law 23/12/1996 662 c/o Mediocredito Centrale 6,377,667
of which deposited with the Treasury of the State 6,365,578
Sustainable Growth Fund Decree Law 22/06/12 83, article 23, paragraph 2 95,519
Fund Law 23/12/00 art. 106 c/o Mediocredito Centrale 32,499
of which deposited with the Treasury of the State 32,252
Fund Law 23/12/1997 454 c/o Mediocredito Centrale 1,453
Fund of funds for national research and innovation operating program 2014-2020 558
Management of Single Fund Marche Region portion 8,509
Management of Single Fund Liguria Region portion 8,757
Law 488 RTI (MCC/BDS/IRFIS) MAP (now Ministry of Education) 7,428
Other provisions 17,851
Total 6,550,241

152
5. Financial assets offset in the financial statements or subject to offsetting
framework agreements or similar agreements.
Related amounts not
subject to netting in the financial statements
Technical type Gross
amount of financial assets (a)
Amount of financial liabilities offset in financial
statements (b)
Net amount of financial
assets recognised in financial statements
(c=a-b)
Financial instruments
(d)
Cash deposits
received as collateral (e)
Net amount 31.12.2019 (f=c-d-e)
Net amount 31.12.2018
1. Derivatives 85,791 85,791 85,791 390
2. Repurchase agreements
3. Securities lending
4. Other
Total 31.12.2019 85,791 85,791 85,791
Total 31.12.2018 82,650 82,650 82,260 390
The amounts in the table refer to hedging derivative contracts taken out with a bank
counterparty for which a credit support annex (CSA) was drawn up. The contract
contemplates making a deposit, in this case exclusively in cash, to guarantee the loan
resulting from the fair value of the derivatives, the value of which is adjusted according to
changes in the fair value of the said contracts. The contract stipulated according to the
ISDA standard allows, in the case of default by either party, offsetting of the positions in
derivatives and the use of the deposit constituted as guarantee.
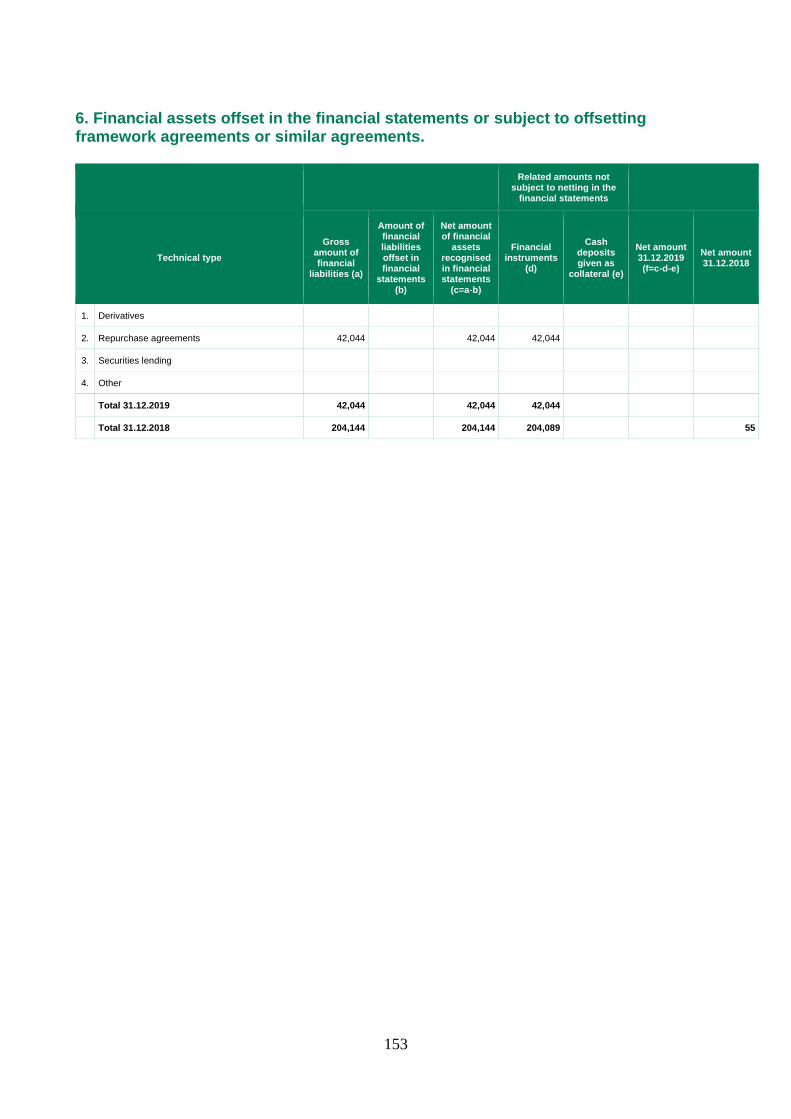
153
6. Financial assets offset in the financial statements or subject to offsetting framework agreements or similar agreements.
Related amounts not
subject to netting in the financial statements
Technical type Gross
amount of financial
liabilities (a)
Amount of financial liabilities offset in financial
statements (b)
Net amount of financial
assets recognised in financial statements
(c=a-b)
Financial instruments
(d)
Cash deposits given as
collateral (e)
Net amount 31.12.2019 (f=c-d-e)
Net amount 31.12.2018
1. Derivatives
2. Repurchase agreements 42,044 42,044 42,044
3. Securities lending
4. Other
Total 31.12.2019 42,044 42,044 42,044
Total 31.12.2018 204,144 204,144 204,089 55

154
Part C – Information on the income statement

155
Section 1 - Interest - Items 10 and 20
1.1 Interest and similar income: breakdown
Items/Technical types Debt securities Loans Other transactions
Total 31.12.2019
Total 31.12.2018
1. Financial assets measured at fair value through profit and loss:
1.1 Financial assets held for trading
1.2 Financial assets designated at fair value
1.3 Other financial assets obligatorily measured at fair value 0
2. Financial assets measured at fair value through other comprehensive income 802 802 843
3. Financial assets measured at amortised cost: 350 28,474 28,824 34,089
3.1 Due from banks 30 5 5 3
3.2 Due from customers 320 28,469 28,819 34,086
4. Hedging derivatives 8,589 8,589 13,276
5. Other assets 39 39 43
6. Financial liabilities 2,592 2,513
Total 1,152 28,474 8,628 40,846 50,764
of which: interest income on impaired financial assets 1,641 1,641
This item, mainly consisting of interest on the customer loan portfolio, showed a decrease
with respect to the previous year, despite loan stock increasing to 1,560 million at 31
December 2019 (from 1,431 million at 31 December 2018), as an effect of pricing
renegotiations on already existing transactions with customers and the continual erosion of
spreads on new disbursements.

156
1.3 Interest and similar expenses: breakdown
Items/Technical types Payables Securities Other transactions
Total 31.12.2019
Total 31.12.2018
1. Financial liabilities measured at amortised cost (5,052) (10,350) (15,402) (18,632)
1.1 Due to central banks
1.2 Due to banks (806) (806) (3,208)
1.3 Due to customers (4,246) (4,246) (2,118)
1.4 Securities issued (10,350) (10,350) (13,306)
2. Financial liabilities held for trading
3. Financial liabilities designated at fair value
4. Other liabilities and provisions
5. Hedging derivatives
6. Financial assets (398) (227)
Total (5,052) (10,350) (15,800) (18,859)
of which: interest payable on leasing payables (601) (601)
1.4 Interest expense and similar income: other information
1.4.2 Interest expense on financial leasing transactions
Interest expense relative to leasing payables totals € 601,000, of which 600,000 relative to
real estate leases and 1,000 relative to vehicle leases.
1.5 Spreads relating to hedging transactions
Item/Amount Total 31.12.2019 Total 31.12.2018
A. Positive spreads relating to hedging transactions 8,589 13,276
B. Negative spreads relating to hedging transactions
C. Balance (A-B) 8,589 13,276

157
Section 2 - Fees and commissions - Items 40 and 50
2.1 Fee and commission income: breakdown
Type of service/Amount Total 31.12.2019 Total 31.12.2018
a) guarantees given 23 22
b) credit derivatives
c) management, broking and consultancy services:
1. financial instrument trading
2. foreign currency trading
3. individual portfolio management
4. custody and administration of securities
5. depositary bank
6. securities placement
7. receiving and transmitting orders
8. advisory services
8.1 on investments
8.2 on financial structure
9. distribution of third-party services
9.1. portfolio management
9.1.1. individual
9.1.2. collective
9.2 insurance products
9.3 other products
d) collection and payment services 201 222
e) servicing activities for securitisations 48 59
f) services for factoring transactions 100 5
g) tax collection services
h) management of multilateral trading facilities
i) holding and managing current accounts
j) other services 54,648 56,233
Total 55,020 56,541
The item “other services” includes commissions for the management of public subsidy
funds, of which the SME Guarantee Fund the largest, equal to € 51.4 million (53 million at
31.12.2018).
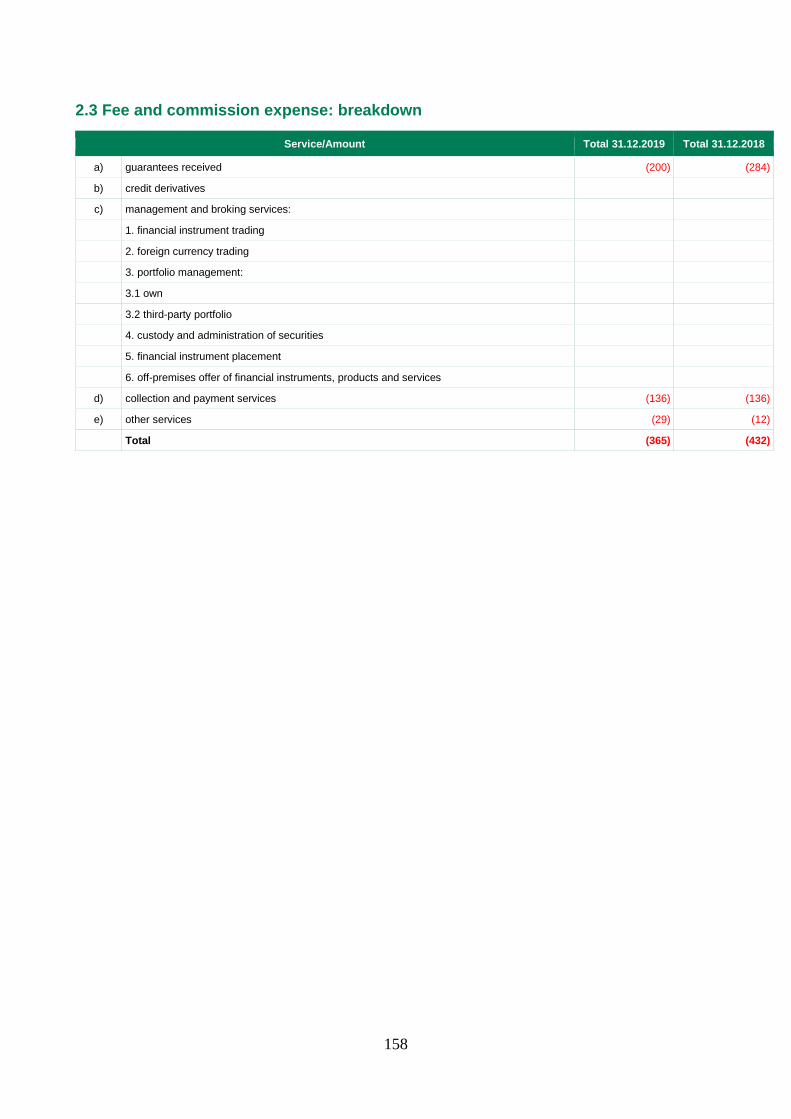
158
2.3 Fee and commission expense: breakdown
Service/Amount Total 31.12.2019 Total 31.12.2018
a) guarantees received (200) (284)
b) credit derivatives
c) management and broking services:
1. financial instrument trading
2. foreign currency trading
3. portfolio management:
3.1 own
3.2 third-party portfolio
4. custody and administration of securities
5. financial instrument placement
6. off-premises offer of financial instruments, products and services
d) collection and payment services (136) (136)
e) other services (29) (12)
Total (365) (432)

159
Section 5 - Net gains/(losses) on hedging activities - Item 90
5.1 Net gains/(losses) on hedging activities: breakdown
Income component/Amount Total 31.12.2019 Total 31.12.2018
A. Income related to:
A.1 Fair value hedges 7,032
A.2 Hedged financial assets (fair value)
A.3 Hedged financial liabilities (fair value) 2,636 7,204
A.4 Cash flow hedges
A.5 Assets and liabilities in foreign currencies
Total hedging income (A) 9,668 7,204
B. Expenses related to:
B.1 Fair value hedges (2,744) (7,196)
B.2 Hedged financial assets (fair value)
B.3 Hedged financial liabilities (fair value) (7,029)
B.4 Cash flow hedges
B.5 Assets and liabilities in foreign currencies
Total expense on hedging activities (B) (9,773) (7,196)
C. Net gains/(losses) on hedging activities (A - B) (105) 8
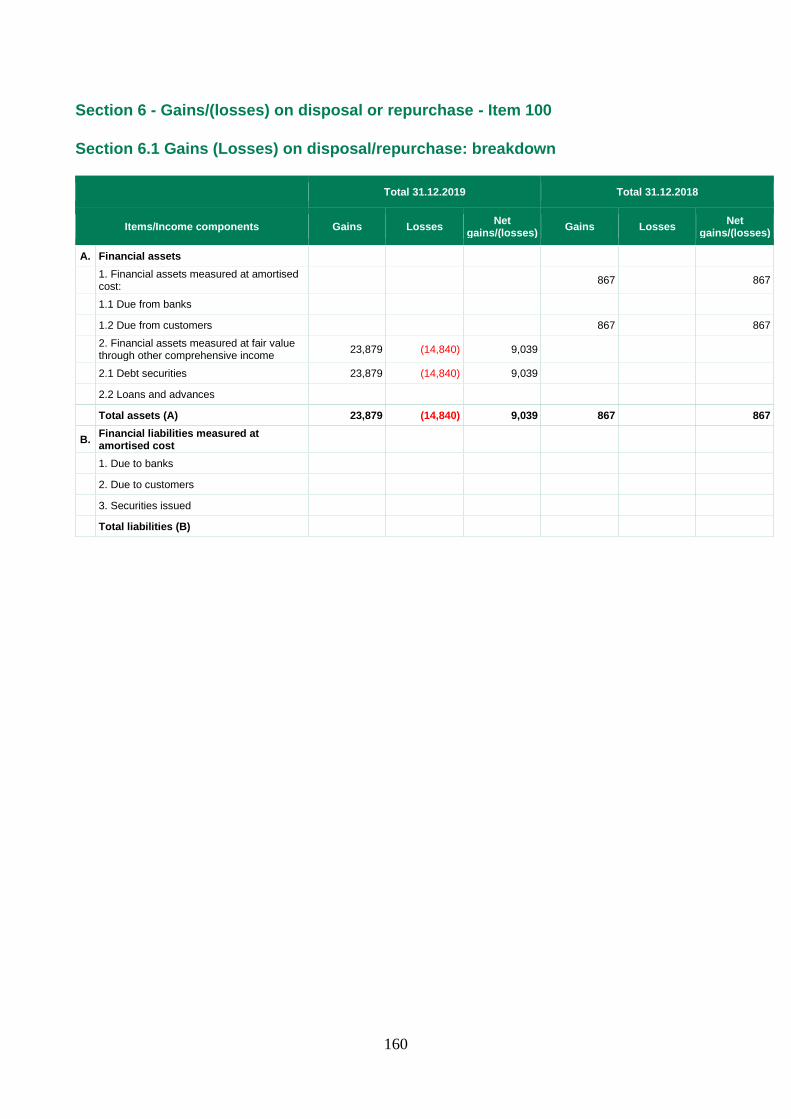
160
Section 6 - Gains/(losses) on disposal or repurchase - Item 100
Section 6.1 Gains (Losses) on disposal/repurchase: breakdown
Total 31.12.2019 Total 31.12.2018
Items/Income components Gains Losses Net gains/(losses) Gains Losses Net
gains/(losses)
A. Financial assets
1. Financial assets measured at amortised cost: 867 867
1.1 Due from banks
1.2 Due from customers 867 867
2. Financial assets measured at fair value through other comprehensive income 23,879 (14,840) 9,039
2.1 Debt securities 23,879 (14,840) 9,039
2.2 Loans and advances
Total assets (A) 23,879 (14,840) 9,039 867 867
B. Financial liabilities measured at amortised cost
1. Due to banks
2. Due to customers
3. Securities issued
Total liabilities (B)

161
Section 7 - Net gains/(losses) of other financial assets and liabilities measured at
fair value through profit and loss - Item 110
7.2 Net value change in other financial assets and liabilities measured at fair value
through profit and loss: breakdown of other financial assets obligatorily measured
at fair value
Transactions/Income components Capital gains (A) Disposal gains (B)
Capital losses (C)
Disposal losses (D)
Net gains/(losses) [(A+B)-(C+D)]
1. Financial assets (1) (1)
1.1 Debt securities (1) (1)
1.2 Equity securities
1.3 Units in collective investment undertakings
1.4 Loans and advances
2. Financial assets in other currencies: exchange differences
Total (1) (1)

162
Section 8 – Net value adjustments for credit risk – item 130
8.1 Net value adjustments for credit risk relative to financial assets measured at amortised cost: breakdown
Writedowns (1) Writebacks (2)
Transactions/Income components Stage one and two
Stage three - write-off
Stage three - Other
Stage one and two Stage three Total
31.12.2019 Total
31.12.2018
A. Due from banks (2,790) 3 (2,787) 47
- loans (13) 3 (10) 47
- debt securities (2,777) (2,777)
Of which: acquired or originated impaired loans B. Due from customers: (1,513) (83) (15,700) 2,571 1,606 (13,118) (26,833)
- loans (1,458) (83) (15,700) 2,571 1,606 (13,063) (26,833)
- debt securities (55) (55)
Of which: acquired or originated impaired loans C. Total (4,304) (83) (15,700) 2,574 1,606 (15,906) (26,786)
Net value adjustments for credit risk, totalling 15.9 million (against 26.8 in 2018) include
net adjustments on amounts due from customers for 13.1 million and adjustments on
amounts due from banks for 2.8 million, relative to the 12 million subscription of the larger
equity strengthening fixed rate Tier II 2019-2029 subordinate bond loan issued by the
Ligurian bank Banca Carige.
During the year, writedowns were recognised for 20.1 million, almost entirely relative to
impaired positions, while writebacks on loans totalling 4.2 million were recognised (of
which 2.6 million on performing receivables and 1.6 million in writebacks on impaired
receivables, of which 0.3 due to amounts collected).

163
8.2 Net value adjustments for credit risk relative to financial assets measured at fair
value through other comprehensive income: breakdown
Writedowns (1) Writebacks (2)
Transactions/Income components Stage one and two
Stage three - write-off
Stage three - Other
Stage one and two Stage three Total
31.12.2019 Total
31.12.2018
A. Debt securities (586) 564 (22) 13
B. Loans
- to customers
- to banks
of which: acquired or originated impaired financial assets
Total (586) 564 (22) 13

164
Section 9 - Gains/losses from contractual changes without derecognition - Item 140
9.1 Gains (losses) from contractual changes: breakdown
Losses from contractual changes without derecognition totalled € 293,000, while profits
totalled € 5,000.

165
Section 10 - Administrative expenses - Item 160
10.1 Personnel expenses: breakdown
Type of expense/Amount Total 31.12.2019 Total 31.12.2018
1) Employees (24,671) (23,139)
a) wages and salaries (17,310) (16,421)
b) social security contributions (4,636) (4,386)
c) severance benefits (969) (920)
d) pensions
e) allocation to employee severance benefit provision (36) (48)
f) provisions for pension fund and similar obligations: (37) (36)
- defined contribution
- defined benefit (37) (36)
g) payments to external pension funds: (375) (356)
- defined contribution (375) (356)
- defined benefit
h) costs deriving from payment agreements based on own equity instruments
i) other employee benefits (1,308) (972)
2) Other personnel in service (163)
3) Directors and statutory auditors (323) (330)
4) Retired personnel
5) Recovery of expenses for employees seconded to other companies 428 348
6) Refunds of expenses for third-party employees seconded to the company (542) (920)
Total (25,271) (24,041)
The increase in the item derives from the increase in Bank employees, mainly in the
network, in the sales department and in the guarantee instrument department.

166
10.2 Average number of employees by category
Item/Amount Total 31.12.2019 Total 31.12.2018
Employees: 290 284
a) executives 12 10
b) middle managers 161 160
c) other employees 117 114
Other personnel 12 11
The figures shown in the table were prepared using the average FTE criteria
10.3 Defined benefit company pension funds: costs and revenues
During 2019, the fund managed by the Bank paid out 272,000 in complementary
pensions, in line with 2018. On the basis of the actuarial appraisal, in line with the
accounting policies already presented, additional provisions of 37,000 became
necessary (36,000 in 2018), while actuarial losses, of 271,000 (gains of 165,000 in
2018), are posted as a contraentry under Shareholders’ Equity.
10.4 Other employee benefits
31.12.2019 31.12.2018
a) injury policies (178) (197)
b) health policies (311) (309)
c) early retirement incentives
d) meal vouchers (260) (261)
e) other benefits (559) (205)
TOTAL (1,308) (972)

167
10.5 Other administrative expenses: breakdown
Type of expense/Amount 31.12.2019 31.12.2018
1. Indirect taxes and duties (251) (216)
2. Sundry costs and expenses (13,782) (15,365)
a) advertising, marketing and communication expenses (90) (27)
- entertainment expenses (6) (12)
- advertising expenses (56) (3)
- sponsorship expenses (28) (12)
b) expenses related to credit risk (1,011) (884)
- legal expenses for recovery of receivables (105) (77)
- commercial information, inspections and other expenses (906) (807)
c) indirect labour costs (357) (344)
- travel and motor vehicle rental costs (346) (331)
- other personnel expenses (11) (13)
d) Information and communication technology expenses (4,151) (4,823)
- telephone and data transmission expenses (167) (225)
- ICT service (3,984) (4,567)
- maintenance and repair of ICT equipment (1) (1)
e) consulting and professional services (4,107) (3,176)
- Technical and specialist advisory services (35) (48)
- other professional services (1,547) (1,520)
- legal and notarial expenses (2,524) (1,608)
f) expenses related to properties (1,105) (3,042)
- security (226) (265)
- cleaning services (198) (218)
- Maintenance of furniture and fixtures, plant and equipment (4) (4)
- Maintenance of premises (178) (187)
- rental expenses for rented premises (332) (2,221)
- utilities (169) (149)
g) other overheads (2,962) (3,069)
- insurance (184) (201)
- postal expenses (106) (107)
- printing and stationery (27) (42)
- duties, subscriptions and contributions to trade associations and guarantee funds (188) (251)
- contribution to the Resolution Fund (1,476) (1,390)
- administrative and logistical services (340) (402)
- charity (4)
- other (641) (672)
Total (14,034) (15,581)
The decrease in rents payable, of 1.9 million, derives from adoption of the new accounting
standard IFRS 16 relative to leases. Charges relative to real estate leases, previously
recognised among other administrative expenses, are now broken down as follows:

168
- € 600,000 as interest expense
- € 1,389 thousand as depreciation of rights of use.
Below is remuneration (net of VAT) for the activities performed by the auditing firm.
During the year, companies associated with the auditing firm did not carry out any
consulting work.
Item/Amount Total 31.12.2019 Total 31.12.2018
Fees to the auditing firm PricewaterhouseCoopers S.p.A.:
- auditing activities provided for in art. 155 paragraph 1 letter a) of the CLF (33) (32)
- limited auditing of the interim Financial Statements (34) (30)
- auditing of the annual Financial Statements (80) (79)
Total auditing services (147) (141)
- other services associated with auditing (60) (47)
Total other services (60) (47)
Total (207) (188)
Services correlated with the 2019 audit refer to the issuing of comfort letters as part of the
social bond issue.
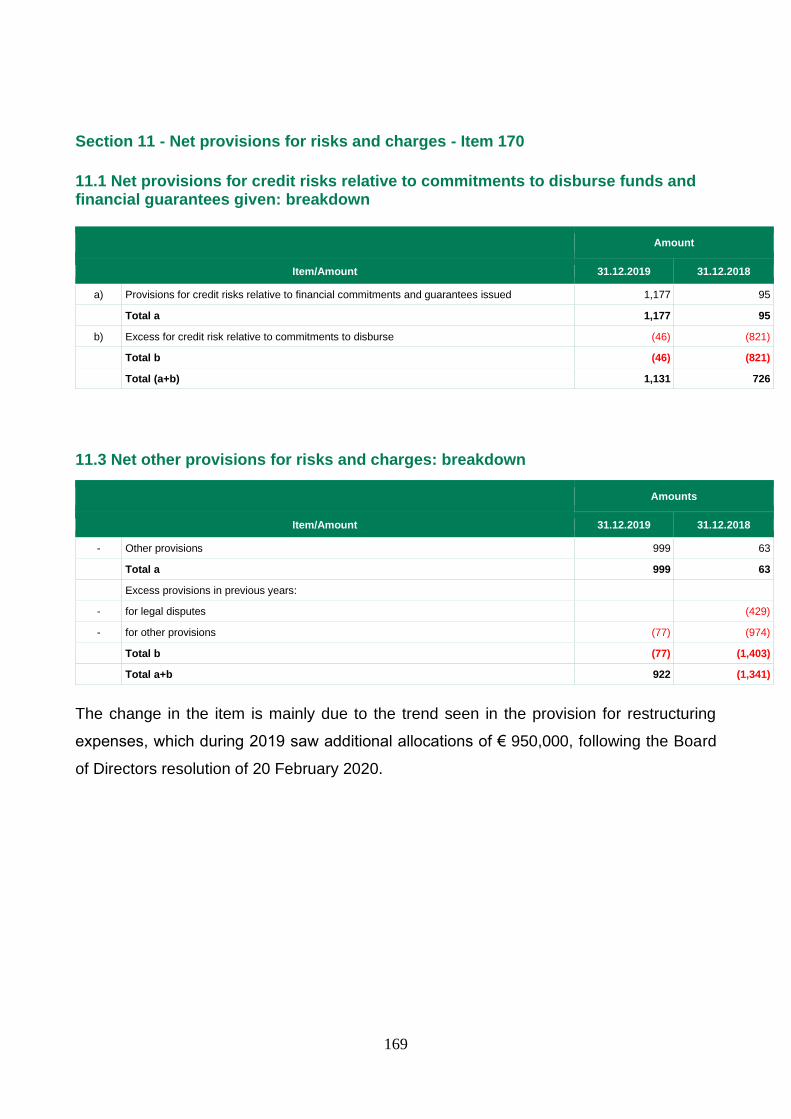
169
Section 11 - Net provisions for risks and charges - Item 170
11.1 Net provisions for credit risks relative to commitments to disburse funds and financial guarantees given: breakdown
Amount
Item/Amount 31.12.2019 31.12.2018
a) Provisions for credit risks relative to financial commitments and guarantees issued 1,177 95
Total a 1,177 95
b) Excess for credit risk relative to commitments to disburse (46) (821)
Total b (46) (821)
Total (a+b) 1,131 726
11.3 Net other provisions for risks and charges: breakdown
Amounts
Item/Amount 31.12.2019 31.12.2018
- Other provisions 999 63
Total a 999 63
Excess provisions in previous years:
- for legal disputes (429)
- for other provisions (77) (974)
Total b (77) (1,403)
Total a+b 922 (1,341)
The change in the item is mainly due to the trend seen in the provision for restructuring
expenses, which during 2019 saw additional allocations of € 950,000, following the Board
of Directors resolution of 20 February 2020.

170
Section 12 - Net value adjustments on property, plant and equipment - Item 180
12.1 Net value adjustments on property, plant and equipment: breakdown
Asset/Income component Amortisation (a) Impairment losses (b) Write-backs (c) Net adjustments
(a+b-c)
A. Property, plant and equipment
1. For business use (1,719) (1,719)
- owned (275) (275)
- rights of use acquired with leasing (1,444) (1,444)
2. Held for investment purposes
- owned
- rights of use acquired with leasing
3. Inventories
Total (1,719) (1,719)
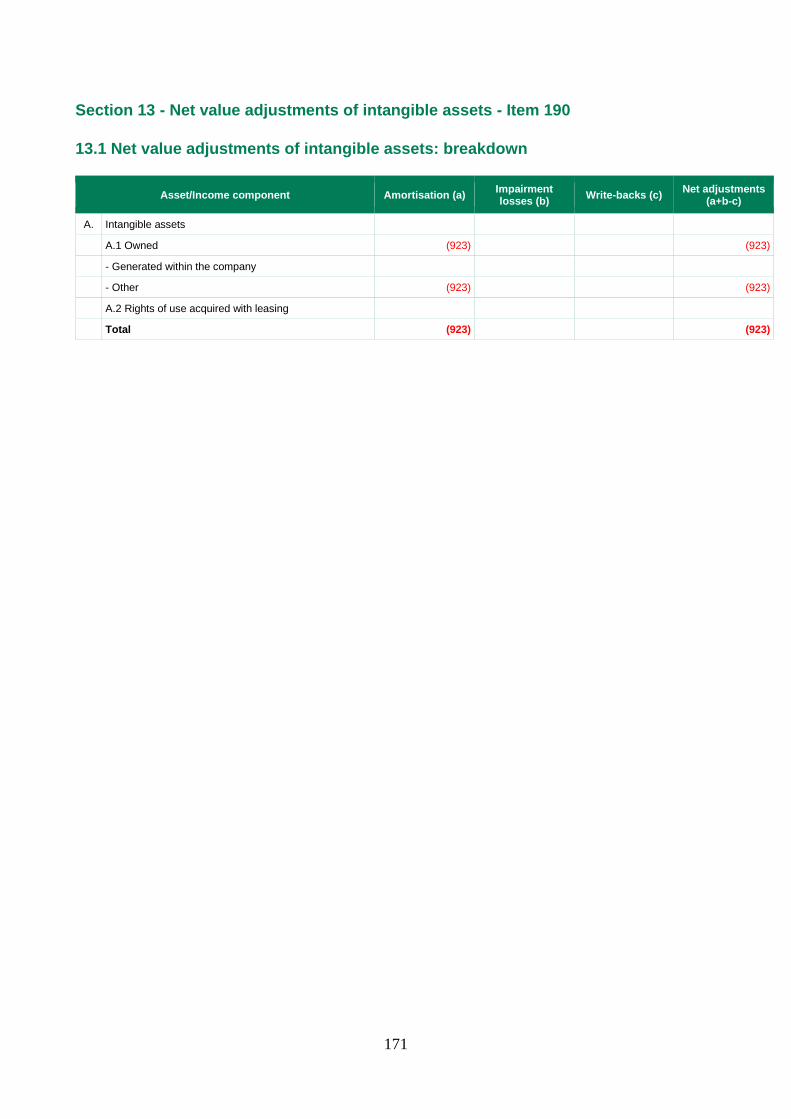
171
Section 13 - Net value adjustments of intangible assets - Item 190
13.1 Net value adjustments of intangible assets: breakdown
Asset/Income component Amortisation (a) Impairment losses (b) Write-backs (c) Net adjustments
(a+b-c)
A. Intangible assets
A.1 Owned (923) (923)
- Generated within the company
- Other (923) (923)
A.2 Rights of use acquired with leasing
Total (923) (923)
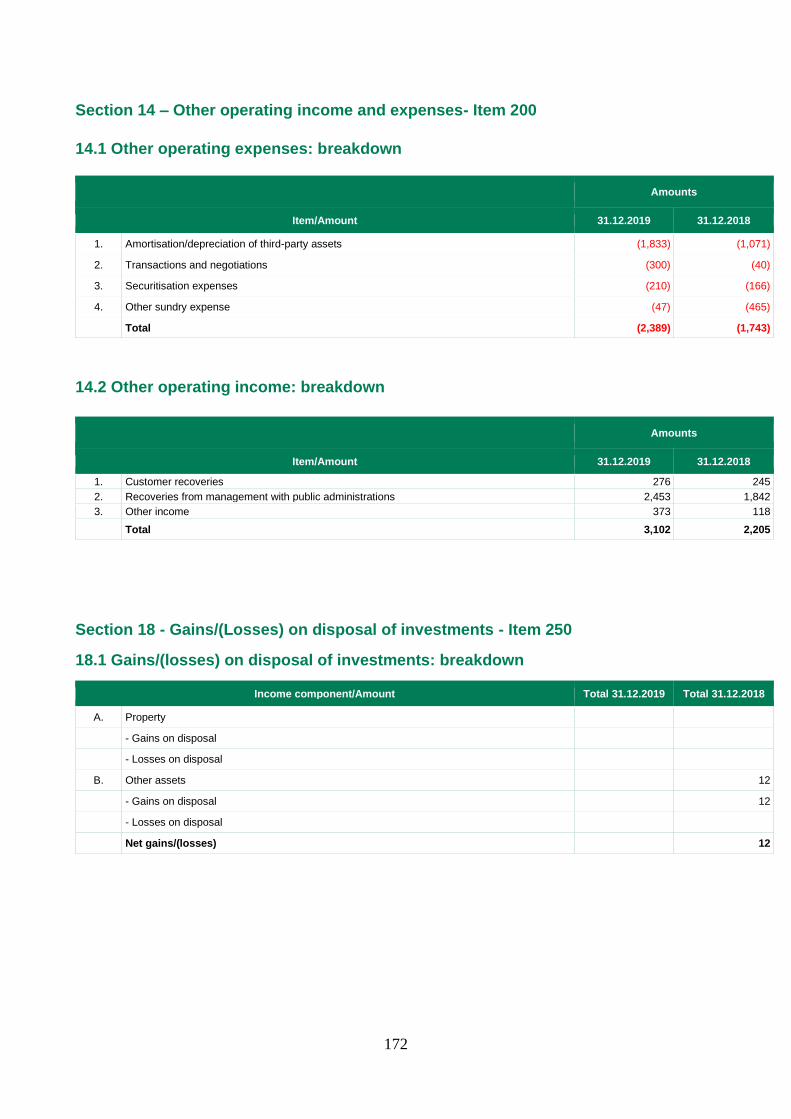
172
Section 14 – Other operating income and expenses- Item 200
14.1 Other operating expenses: breakdown
Amounts
Item/Amount 31.12.2019 31.12.2018
1. Amortisation/depreciation of third-party assets (1,833) (1,071)
2. Transactions and negotiations (300) (40)
3. Securitisation expenses (210) (166)
4. Other sundry expense (47) (465)
Total (2,389) (1,743)
14.2 Other operating income: breakdown
Amounts
Item/Amount 31.12.2019 31.12.2018
1. Customer recoveries 276 245 2. Recoveries from management with public administrations 2,453 1,842 3. Other income 373 118
Total 3,102 2,205
Section 18 - Gains/(Losses) on disposal of investments - Item 250
18.1 Gains/(losses) on disposal of investments: breakdown
Income component/Amount Total 31.12.2019 Total 31.12.2018
A. Property
- Gains on disposal
- Losses on disposal
B. Other assets 12
- Gains on disposal 12
- Losses on disposal
Net gains/(losses) 12

173
Section 19 - Income taxes for the period on continuing operations - Item 270
19.1 Income taxes for the period on continuing operations: breakdown
Income component/Amount Total 31.12.2019 Total 31.12.2018
1. Current taxes (-) (7,449) (2,114)
2. Changes in current taxes for previous years (+/-) (41) (89)
3. Reduction of current taxes for the year (+)
3.bis Reduction of current taxes of the year for tax credits pursuant to Italian Law 214/2011 (+)
4. Changes in deferred tax assets (+/-) 877 (1,746)
5. Changes in deferred tax liabilities (+/-)
6. Taxes pertaining to the year (-) (-1+/-2+3+3bis+/-4+/-5) (6,613) (3,949)
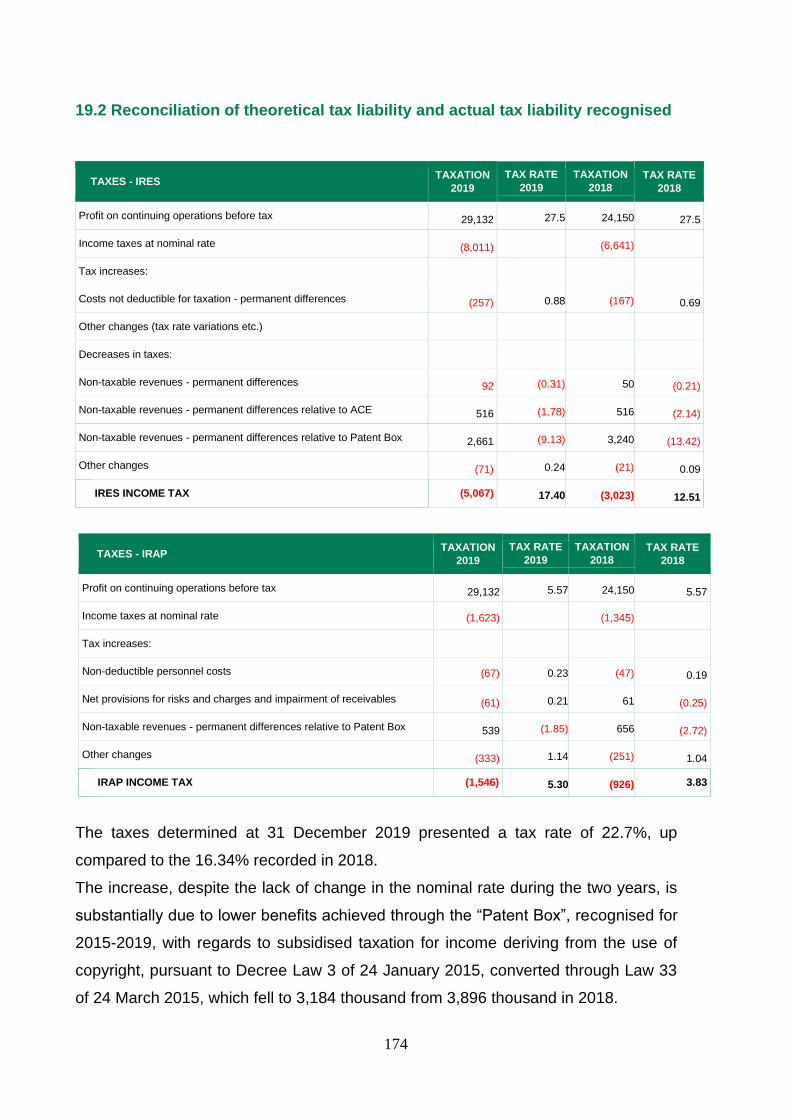
174
19.2 Reconciliation of theoretical tax liability and actual tax liability recognised
TAXES - IRES TAXATION
2019
TAX RATE
2019
TAXATION
2018
TAX RATE
2018
Profit on continuing operations before tax 29,132 27.5 24,150 27.5
Income taxes at nominal rate (8,011) (6,641)
Tax increases:
Costs not deductible for taxation - permanent differences (257) 0.88 (167) 0.69
Other changes (tax rate variations etc.)
Decreases in taxes:
Non-taxable revenues - permanent differences 92 (0.31) 50 (0.21)
Non-taxable revenues - permanent differences relative to ACE 516 (1.78) 516 (2.14)
Non-taxable revenues - permanent differences relative to Patent Box 2,661 (9.13) 3,240 (13.42)
Other changes (71) 0.24 (21) 0.09
IRES INCOME TAX (5,067) 17.40 (3,023) 12.51
TAXES - IRAP TAXATION
2019 TAX RATE
2019
TAXATION
2018
TAX RATE
2018
Profit on continuing operations before tax 29,132 5.57 24,150 5.57
Income taxes at nominal rate (1,623) (1,345)
Tax increases:
Non-deductible personnel costs (67) 0.23 (47) 0.19
Net provisions for risks and charges and impairment of receivables (61) 0.21
)
61 (0.25)
Non-taxable revenues - permanent differences relative to Patent Box 539 (1.85) 656 (2.72)
Other changes (333) 1.14 (251) 1.04
IRAP INCOME TAX (1,546) 5.30 (926) 3.83
The taxes determined at 31 December 2019 presented a tax rate of 22.7%, up
compared to the 16.34% recorded in 2018.
The increase, despite the lack of change in the nominal rate during the two years, is
substantially due to lower benefits achieved through the “Patent Box”, recognised for
2015-2019, with regards to subsidised taxation for income deriving from the use of
copyright, pursuant to Decree Law 3 of 24 January 2015, converted through Law 33
of 24 March 2015, which fell to 3,184 thousand from 3,896 thousand in 2018.

175
Part D – Comprehensive Income
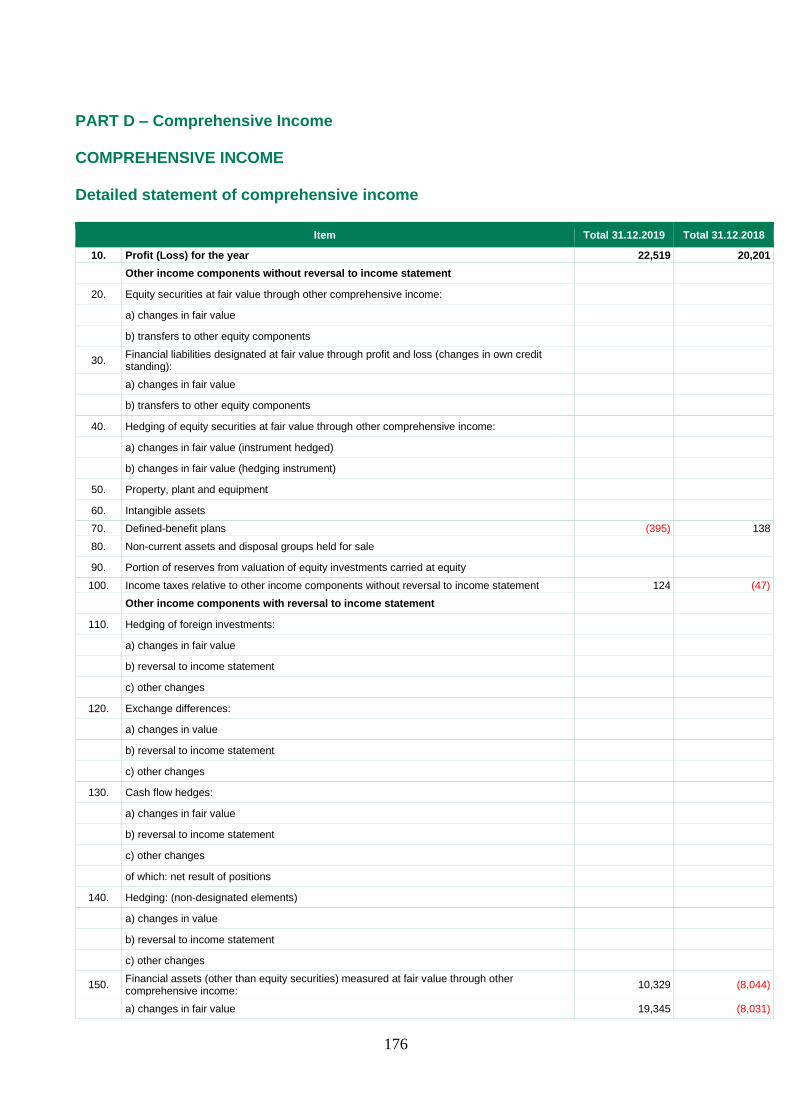
176
PART D – Comprehensive Income
COMPREHENSIVE INCOME
Detailed statement of comprehensive income
Item Total 31.12.2019 Total 31.12.2018
10. Profit (Loss) for the year 22,519 20,201
Other income components without reversal to income statement
20. Equity securities at fair value through other comprehensive income:
a) changes in fair value
b) transfers to other equity components
30. Financial liabilities designated at fair value through profit and loss (changes in own credit standing):
a) changes in fair value
b) transfers to other equity components
40. Hedging of equity securities at fair value through other comprehensive income:
a) changes in fair value (instrument hedged)
b) changes in fair value (hedging instrument)
50. Property, plant and equipment
60. Intangible assets 70. Defined-benefit plans (395) 138 80. Non-current assets and disposal groups held for sale
90. Portion of reserves from valuation of equity investments carried at equity 100. Income taxes relative to other income components without reversal to income statement 124 (47)
Other income components with reversal to income statement
110. Hedging of foreign investments:
a) changes in fair value
b) reversal to income statement
c) other changes
120. Exchange differences:
a) changes in value
b) reversal to income statement
c) other changes
130. Cash flow hedges:
a) changes in fair value
b) reversal to income statement
c) other changes
of which: net result of positions
140. Hedging: (non-designated elements)
a) changes in value
b) reversal to income statement
c) other changes
150. Financial assets (other than equity securities) measured at fair value through other comprehensive income: 10,329 (8,044)
a) changes in fair value 19,345 (8,031)

177
b) reversal to income statement (9,016) (13)
- adjustments for credit risk 22 (12)
- gains/losses on disposal (9,038) (1)
c) other changes
160. Non-current assets and disposal groups held for sale:
a) changes in fair value
b) reversal to income statement
c) other changes
170. Portion of reserves from valuation of equity investments carried at equity:
a) changes in fair value
b) reversal to income statement
- write-downs for impairment
- gains/losses on disposal
c) other changes 180. Income taxes relative to other income components with reversal to income statement (3,416) 2,660 190. Total other income components 6,642 (5,293) 200. Comprehensive income (Item 10 +190) 29,161 14,908

178
Part E – Information on risks and relative hedging policies

179
Introduction
In the overall Internal Control and Risks System, definition of the Risk Appetite
Framework (RAF) is assigned to the Board of Directors. The RAF is subject to
revision at least once a year and identifies the Bank’s risk objectives, which are
implemented and monitored through the operational limits system and control
indicators. Below are the risk/return objectives defined for financial year 2019:
Objective Metric Threshold
Capital adequacy
Total Capital Ratio (TCR) ≥ 15.5%
Leverage Ratio (LR) ≥ 6%
Loan portfolio quality Net NPL Ratio (NPL) ≤ 6%
Profitability ROE ≤ 55%
Operating efficiency Cost/Income ≥ 6%
Banking Book interest
rate
∆ Economic value/Own funds ≤ 10%
∆ Net interest income ≤ 5.5€/mln
Liquidity
Liquidity Coverage Ratio ≥ 140%
Stable funding/Illiquid assets ≥ 100%
Asset encumbrance Tied assets/Total Assets ≤ 55%
This risk objective system is subject to periodic review based on the results of the
Supervisory Review and Evaluation Process (SREP) and the Bank’s update risk
appetite framework, always in line with the strategic objectives established in the
Business Plan, the Bank’s business model and the methodologies used in the
internal capital adequacy assessment process (ICAAP).
Constant monitoring of the risk/return profile, using the methods, methodologies and
processes defined and updated promptly in the company regulations, is supervised
by organisational structures inspired by the criteria of separation and autonomy. The
departments are structured as follows:
180
• first level controls, provided by the same operating structures that assume the
risks;
• second level controls, carried out by the Risk Management Department and
the Compliance and Anti-Money Laundering Department;
• third level audits and controls, performed by the Internal Audit Department;
• overall coordination and supervision, assigned to the Internal Controls and
Risks Committee.
Through specific regulations, the Board of Directors governs the requirements and
methods used by the Risk Management Department to ensure its responsibilities are
effectively carried out, outlined in detail in the Disclosure to the Public document (see
herein).
The Bank’s remuneration and incentive policy system is annually approved by the
Shareholders’ Meeting in accordance with the international and national regulations.
The information regarding capital adequacy, risk exposure, the general features of
the systems used to identify, measure and manage these risks, and the information
on remuneration policies, are made public in a dedicated document (Disclosure to
the Public – Pillar III, which also contains the Bank's Remuneration Policy) on the
Bank’s website: www.mcc.it, within the terms laid down for publication of the
Financial Statements, in line with the Prudential Supervisory Rules (See Bank of Italy
Circular 285/2013, Part One, Title III, Chapter 2, “Disclosure to the Public State by
State”).
The Bank pays special attention to sharing a risk culture and works so that this
concept permeates all processes, both through periodic updates of documents
prepared for reporting, self-assessment and planning purposes (Tableau de bord,
ICAAP/ ILAAP, Risk Appetite Framework), and through initiatives dedicated to further
researching specific issues.
Additionally, the Bank guarantees that the risk culture is diffused throughout the
organisation through training courses provided to its employees, with the aim of
ensuring proper application of assessment models and risk safeguards.
The approach of the Risk Management Department is constantly focussed on
integrated risk management, considering both the macroeconomic situation and the
Bank's business profile.

181
SECTION 1 - CREDIT RISK
Qualitative information
1. General aspects
This risk is that of incurring losses due to the borrower’s inability to fulfil the
obligations assumed towards the Bank. The notion of credit risk is very extensive and
may also include:
• counterparty risk, i.e. the risk that the counterparty to a transaction in certain
financial instruments will default, before settling the transaction;
• concentration risk, i.e. the possibility of the credit risk arising with significant
impact because of exposure to counterparties, groups of connected
counterparties and counterparties of the same economic sector which practise
the same business, or which belong to the same geographical area.
• spread risk, i.e. the possibility that the risk premium, or spread, requested by
capital markets increases, while credit standing remains unchanged. For
example, this increase may be due to a liquidity crisis on the markets or an
increase in investor risk aversion8.
The management provides guidance for the Bank’s credit development activities and
risk strategies, periodically subject to the approval of the Board of Directors at the
annual budget meeting and on the occasion of the examination of the risk policies
and of the connected system of limits. Through this latter the Bank identifies the main
determinants of the risk subject to monitoring; the Bank articulates this instrument in
keeping with the effective evolution of operations and subjects it to regular revision,
as laid down in the Regulation on the Risk Management process.
At 31 December 2019, the empirical results of operations show the main loan
exposures regarding primarily:
• bank risk, with reference to:
o demand and time deposits;
o loans related to transactions in derivatives which generate counterparty
risk. For these cases the Bank is compliant with the EMIR Regulation;
• customer risk, which can be broken down into:
8 With reference to the Bank's securities portfolio, consisting exclusively of government securities from EMU countries, this risk became significant following the application of Accounting Standard IFRS 9, as of 1 January 2018, which determined the end of the regime which sterilised unrealised losses relative to these assets.

182
o businesses: with reference to loans to customers, joint stock
companies, limited companies and single member firms, and to other
public and private entities, in compliance with the principle of
prevalence; the Bank continues to be committed to supporting the
development of businesses, also in synergy with the area of incentives
managed by the Invitalia Group, the reference shareholder;
o households, through its most prevalent form, residential mortgages: to
that end, the Bank has stopped operations relative to this segment9, in
line with the strategic guidelines that indicate focussing business on
companies;
• other risks: this category mainly includes risk relative to the Italian
government, represented by positions in Government Securities and the risk
related to the Central Administrations, in the form of fees received for
performing the subsidy activity.
Additionally, the Bank fully holds the tranches underlying the securitisation of
residential mortgages carried out in 2016 (see SECTION 4 - LIQUIDITY RISK risk),
through the special purpose vehicle (SPV) MCC- RMBS srl); on the basis of this
structure, the operation does not give rise to securitisation risk and does not change
the risk profile of the portfolio. For all other details, please see Section 4 – Liquidity
risk.
At 31 December there were no securitisation transactions originated with the goal of
transferring credit risk. Nonetheless, during 2019 the Bank began two tranched cover
transactions with the portfolio guaranteed by the Central Guarantee Fund to cover
the initial losses10, with the aim of providing business loans. At 31 December 2019,
these transactions did not indicate risk deriving from securitisations as these are
simple standard transactions, in which the risk taken on and the mitigation guarantee
are clear. These transactions fall under the operating methods identified by the Bank
for achieving its mission to provide support for the economy. Therefore, it is expected
that these instruments will be used more frequently in the near future.
9 Therefore, the portfolio of private mortgages is substantially in run-off status. 10 One transaction serves as a direct guarantee and the other as a counterguarantee through the participation of a loan consortia.

183
Credit risk management policies
2.1 Organisational aspects
As regards risk management, the Bank’s organisational system provides for clear
separation between business departments which offer and propose new loans, and
departments which assess the risk profile of such loans.
Operational monitoring of credit relationships with customers is carried out by
operational departments, according to a specific company regulation: they establish
effective and immediate interaction with the borrowing customers, right from the
appearance of the first signs of difficulty, such as late execution of repayments or
requests for contractual waivers.
In particular, over the last few years the Bank has strengthened its credit monitoring
and management platform through the use of specific IT tools that support its
operations, and through the adoption of related models to intercept/identify
customers at risk of potential impairment, in order to guarantee timely monitoring of
positions on the basis of personalised alert thresholds and to ensure second and
third level controls.
In the event a borrower’s risk profile deteriorates, the Credit Department becomes
responsible for managing the account. In particular the Credit Monitoring Area
monitors performing portfolios, proposing a change in classification, as a function of
the powers assigned to it by the Board of Directors. Subsequently, responsibility for
managing classified positions and further changes in classification are assigned to
the Anomalous Credit Management Area.
2.2 Management, measurement and control systems
Credit risk control and measurement activities are the responsibility of the Risk
Management Department, both at the individual and the portfolio level; the
Department has the task of monitoring:
• in relation to single exposures, correct execution of the performance
monitoring in terms of consistency of the classifications, congruity of
provisions and correctness of the recovery process;
• with reference to the portfolio, the trend of overall exposure to this risk, in
keeping with the targets defined in the RAF.
This activity comes within the scope of the Internal Control System as a second-level
audit.
184
From a regulatory point of view, credit risk is estimated on the basis of the standard
methods contemplated by the prudential supervisory instructions applicable to both
how the exposures are managed and any guarantees backing the positions.
At management level, according to what is laid down in the Lending Policies and in
line with the definition of the operating limits, scoring systems are used to assess the
customer risk, these are used in support of the inquiry phase for the prior definition of
the levels of anomaly considered sustainable.
Score methodologies are also used
• to periodically establish acceptance/refusal thresholds, which are integrated
as part of the wider investigation process managed by specifically dedicated
resources;
• to estimate expected returns from each loan, taking into account the risk
component and the costs of all components in the production process.
With regard to counterparty risk, within the sphere of the standardised methods,
definition of credit equivalents is estimated by the current value method,
recommended by the Prudential Supervisory regulations. In addition, with reference
to derivatives, an additional capital requirement is calculated against the risk of
unexpected losses generated by oscillations of the fair value deriving from changes
in the creditworthiness of counterparties (Credit Value Adjustment - CVA).
The Bank has issued specific guidelines aimed at limiting counterparty risk exposure
by requiring collateral for derivative instruments. A Credit Support Annex (CSA) is
required, usually with collateral in cash or in EMU government bonds and daily
marginalisation. Additionally, the same guidelines, with reference to exposures
through repurchase agreements, establish the stipulation of General Master
Repurchase Agreements (GMRA) with at least weekly marginalisation, as a
mitigation technique.
With reference to concentration risk, besides verifying systematic observance of the
rules on “large exposures” (see Part II, Chapter 10 of Bank of Italy Circular 285/2013
and Arts 387 ff. of Regulation (EU) 575/2013) and on “risk activities with associated
subjects” (see Title V of Circular 263 of 2006), the Bank monitors the concentration
level of exposures in respect of the component:
• single borrower (or “single name”): through the method known as Granularity
Adjustment (GA) envisaged by the prudential supervisory regulations (see
Bank of Italy Circ. 285, Part One, TITLE III - Chapter 1 - Annex B);

185
• geo-sectoral: through methods based on practices prevalently adopted by the
banking system and approved by the Supervisory Body.
With regards to Credit Policies, in line with the rules for Large Exposures, internal
exposure limits allowed based on counterparty rating have been established.
2.3 Expected loss measurement methods
Following the introduction of accounting standard IFRS 9, management of credit risk
is closely correlated to the recognition and measurement of expected losses. Based
on the account standard, assets and loans falling within a well-defined area11 are
divided into three stages. This classification is based on transfer criteria associated
with the credit quality of the element in question, which impact the methods used to
recognise value adjustments, differentiated by the time horizon of reference and the
recognition of interest income. Therefore, the Bank has implemented instruments
which, in line with the dictates of the standard, allow it to automatically measure
significant increases in credit risk. These instruments are differentiated with respect
to the reference portfolio.
With regards to the securities portfolio, the Bank uses the following measurement
methods:
• for securities with an investment grade rating at the reporting date, a low-credit
risk exemption is applied (LCRE)12;
• for securities which have a speculative rating at the reporting date, the trend of
the counterparty's credit rating between the acquisition/subscription date and
the reporting date is considered, measured by the change in the ratings class.
Significant impairment which leads to classification in stage 2 is identified by
downgrading of at least 2 notches on the ratings scale. On the other hand, if
11 The scope of accounting standard IFRS 9 is as follows:
1. financial assets classified in the Hold to Collect portfolio, measured at amortised cost; 2. financial assets classified in the Hold to Collect and Sell portfolio, measured at fair value through other
comprehensive income; 3. loan commitments (not if at Fair Value through Profit and Loss); 4. guarantees (not if at Fair Value through Profit and Loss; 5. trade receivables.
12 In application of the Low Credit Risk Exemption (LCRE), these can be assigned to stage 1 as of the reporting date, without the need to verify any significant decreases in credit standing, on the basis of the following requirements established in the Standard as representing low credit risk:
1. the financial instrument has a low risk of default;
2. the debtor has a strong capacity to satisfy its obligations over the short term;
3. any unfavourable changes in economic conditions over the medium/long term will not necessarily reduce the debtor's ability to fulfil its obligations.

186
an objective loss occurs (credit event), the exposure is classified in stage 3. In
the lack of significant impairment of the position, classification in stage 1 is
envisaged, as in the Standard.
For the loan portfolio, these instruments use:
• information deriving from scoring models, comparing the measurements
obtained at the origination date with periodic updates to the same;
• information about payment trends (30 days past-due exceeded);
• presence of forbearance measures relative to performing positions;
• information coming from internal early warning systems (customers on the
watchlist).
The information used by the Bank to recognise expected losses for loans classified in
stage 1 or stage 2 can be presented as follows:
• customer probability of default (PD), obtained from an external rating model;
this information is subject to adjustments dictated by the accounting standard,
specifically:
o a point in time (PIT) adjustment which, prudentially and considering
volatility of default rates observed in the loan portfolio, consists of
recalibration using a Bayesian approach on the basis of the average
decay rate observed on the own portfolio;
o a forward looking correction over the first three years of the curve, to
include macroeconomic market forecasts;
o a Through the Cycle13 calibration, using PDs and transition matrices
determined as the average of observed values over the last 8 years.
• loss given default (LGD), obtained by making use of regulatory values or those
derived from market benchmark values, considering the statistical number of
positions in the portfolio and the limited depth of historical series to measure
internal recovery rates. These values are updated appropriately, when
necessary using margins of prudence and segmenting on the basis of the type
of guarantees associated with the loans;
• exposure at default (EAD), differentiated between on and off balance sheet
exposures;
• residual life of the relationship;
13 Through a hybrid Markovian approach.
187
• discounting rate, equal to the internal return rate of the position.
2.4 Credit risk mitigation techniques
An essential component for proper monitoring of credit risk is adequate management
of credit risk mitigation techniques and tools, both during the acquisition stage and
during subsequent monitoring of the value and efficacy of the guarantees. The Bank
has therefore adopted an internal procedure supported, when appropriate, by
suitable IT tools for monitoring the guarantees acquired.
The legal validity of the guarantees received is checked on acquisition by the
operational departments, which are responsible, before disbursement, for checking
their certainty and effectiveness; the guarantees acquired are normally valid for the
entire duration of the loans and advances granted.
The purpose of the collateral or personal guarantees is to back the loan and not to
replace the borrower’s capacity to honour their obligations (creditworthiness).
Creditworthiness is assessed by the departments responsible for credit inquiries14
mainly on the basis of the examination of the sources from which the repayment will
be made (customer - transaction) and only secondarily the guarantees, considering
both the present and future situation of the borrowing company and of any group it
belongs to.
The use of credit risk mitigation systems to calculate capital absorptions, according
to the standard approach, is governed by internal guidelines and by a specific
operating procedure; this governs the method of assessing and monitoring their
eligibility as tools for mitigating credit risk and the related capital absorption.
In the Disclosure to the Public a specific section dedicated to risk mitigation
techniques is provided for, with qualitative and quantitative information. This
document is made available on the Bank’s website in compliance with the provisions
of the Prudential Supervisory regulations (see Part One, Title III - Chapter 2 and Part
Two, Chapter 13 of Circular 285/2013).
The internal guidelines have the following objectives:
• to foster correct management of the loan and of the connected guarantees;
14 The departments are identified on the basis of the type of counterpart, loan and channel of origin. As cited in paragraph “General aspects”, the Bank’s strengthened commitment to supporting the development of southern Italy is also implemented through fully taking advantage of subsidies. For some segments the process designed for this purpose uses digital tools for customer contact and collection of information needed for credit inquiries and automated pre-screening models.

188
• to maximise the risk mitigation effect afforded by the protective instruments;
• to optimise the capital requirements according to the Basel recommendations
(Credit Risk Mitigation);
• to define the general rules for the eligibility, valuation, monitoring and
management of the collateral and of the personal guarantees.
The main types of guarantees suitable and used by the Bank for Credit Risk
Mitigation are:
• Real guarantees – Mortgages on residential or non-residential properties and,
marginally, a real financial guarantee in the form of cash collateral;
• Personal sureties – Central Guarantee Fund (backed by the State guarantee).
When the regulatory requisites are met, mortgages contribute to cutting down the
capital requirement as a result of their more favourable weighting, equal to 35% for
residential properties and 50% for non-residential properties, under opportune LTV
(Loan to Value) constraints.
The Central Guarantee Fund benefits from zero weighting as a result of the counter-
guarantee of the Italian State.
The Bank also introduced a pledge on a current account held with the institution as a
new form of guarantee.
Finally, we note the presence of:
• cash collateral, used to cover a position in derivatives with a leading Italian
banking counterparty. From the contractual viewpoint, this guarantee is
governed by an ISDA standard CSA;
• cash collateral, used to cover repurchase agreements stipulated with leading
international banking counterparts. From the contractual viewpoint, this
guarantee is governed by a General Master Repurchase Agreement (GMRA).
3. Impaired credit exposures
Starting on 1 January 2018, the criteria and logic used to determine performing loans
are in line with the instructions contained in International Accounting Standard IFRS
9 - Financial instruments, which introduced a more long-term model for recognising
expected losses, in order to improve disclosures about financial instruments due to
issues which arose during the financial crisis. This model means moving from the

189
incurred loss concept used under the previous standard (IAS 39) to an expected loss
estimate methodology.
Among the main changes introduced by the new accounting standard, worthy of note
is the allocation of credit exposures into 3 stages, distinct risk segments, each of
which corresponds to different logics used to estimate allocations for credit losses. In
particular:
• stage 1 includes performing positions which at the reporting date have not
seen any significant deterioration with respect to the origination or acquisition
date;
• stage 2 includes performing positions for which the credit quality as of the
reporting date has worsened significantly with respect to the origination or
acquisition date;
• stage 3 contains impaired financial assets with clear evidence of losses as of
the reporting date.
With reference to performing positions, those in stages 1 and 2, estimation of
potential credit losses must be performed:
• for stage 1, over a one-year time horizon, determining the corresponding
expected 1-year credit loss;
• for stage 2, over the lifetime of the asset, determining all possible losses that
could be suffered through the expected life of the financial asset, weighted
according to the relative probability of default.
In compliance with this approach, performing loans and securities are measured
using the Expected Loss criteria (expected credit loss - ECL) using the best available
estimates of probability of default (PD) and loss given default (LGD). To that end,
while awaiting consolidation of the elements for more solid estimation of customer
riskiness (PD) and the maturation of an adequate loss given default series (LGD) for
its own portfolio, the Bank makes use of reference benchmarks or regulatory values,
accompanied by appropriate estimate and calibration logics structured around a
general criterion of prudence, to estimate the risk parameters that best represent the
riskiness of its own portfolio. Values connected with calculation of expected losses
are subject to updating and progressive refinement, with the dual objective of:
• better representing the risk profile of a credit portfolio which is substantially
undergoing development and continuous change;

190
• adopting a general criteria of prudential measurement, while awaiting
consolidation of the historic series of internal risk data.
More details on the determination of provisions made relative to performing loans are
provided in paragraph 2.3 Expected loss measurement methods.
Regulation EU 630/2019 took effect on 26 April 2019, requiring banks to record
provisioning carried out relative to non-performing exposures, relative to
disbursements which occurred after 26 April 2019, based on calendar provisioning,
taking into account the ageing of the exposure and the type, establishing for a
schedule that differentiates based on whether the transaction is secured or
unsecured. In particular, for unsecured non-performing exposures, a three year
calendar is used, while for guaranteed exposures a longer calendar is used, nine
years for exposures with real estate guarantees and seven years for other types of
guarantees. Calendar provisioning introduces a binding Pillar I requirement for all
banks. The Bank will make use of application solutions, in order to ensure
compliance with the new regulatory provisions on loan provisioning. Preliminary
assessment had already begun by an external supplier at the end of the year in
question.
3.1 Management strategies and policies
Activities to monitor the trend of single cases and connected valuation are carried out
by the Anomalous Credit Management Area, on the basis of criteria subject to
systematic monitoring.
In line with legislative developments, the Risk Management Department carries out
checks on the correct execution of performance monitoring, with particular reference
to impaired loans.
In consideration of the characteristics of its own portfolio, the external situation and
its own management capacities, the Bank has selected the internal management
approach for impaired loans.
To that end, it periodically prepares and updates the operating management plan for
impaired loans for the short term (roughly a year) and medium/long-term (three
years), sending it to the regulatory authorities for informational purposes. Objectives
are established with reference to levels of Non – Performing Loans (NPL), before
and after value adjustments, in absolute vales and as a percentage of total credit

191
exposures relative to customers, providing details of incoming and outgoing flows
from the non-performing administrative categories and of the methods used to
decrease the stock of impaired loans.
The NPL management strategy is integrated with the RAF, the ICAAP budget
processes and the Bank's remuneration and incentive policies.
The Bank's Board of Directors, based on a proposal from the Chief Executive Officer:
• annually defines and updates the NPL operating management plan;
• assesses and monitors, at least quarterly, progress made with respect to the
objectives set in the plan;
• updates the Credit Regulations which establish criteria for classification,
measurement and management of NPLs;
• identifies the units responsible for classifying, measuring and managing NPLs
and defines their management objectives;
• verifies that the selected organisational structure is adequate to limiting the
margin of management discretion for individuals involved in the process of
classifying, measuring and managing NPLs, in the case of conflicts of interest;
• approves the objective systems used to select counterparties in the case of
outsourcing and monitors the results;
• ensures adequate internal controls over the NPL management processes.
In general, in relation to the methods of classifying impaired receivables, in addition
to the criteria defined by the Supervisory Authority (for non-performing loans,
probable defaults, past-due and/or over-the-limit impaired exposures), it verifies
events which affect loan customers, such as:
• significant difficulties of the borrower;
• serious breaches of contract;
• high probability of bankruptcy;
• granting of concessions which would not otherwise be granted, in view of the
borrower’s financial difficulties.
The classes that make up the “non-performing portfolio” are the following:
• Impaired Past-due and/or Over-the-limit exposures,
• Unlikely to pay,
• Bad loans.

192
The accounting status represents the customer’s overall position, as it is presented in
the financial statements, and reported in the Bank of Italy’s Accounts Matrix. It refers
the customer as a whole; it therefore does not refer to the single credit lines granted
or the single existing exposures. It follows that, in the case of customers that have
several loan products, the reclassification assessment is done considering total debt
exposure, with consequent verification and application of the uniform classification
for all the credit lines used, paying particular attention to analysing all the positions of
the subject in the databases.
In the context of each class forborne exposures are highlighted. These exposures
are classified, as the case may be, as Bad Loans, Unlikely to pay or Impaired Past-
due and/or Over-the-limit exposures and they do not form a separate category of
impaired assets.
The concept of forbearance refers to single loan contracts; only lending relationships
held with customers that have been granted concessions must therefore be
reclassified as forborne.
The minimum provisioning percentages for losses are outlined below:
1) Bad loans: write-downs are differentiated on the basis of the portfolio they
belong to.
• Exposures to Private Customers: analytic, with a minimum of 35%;
• Unsecured exposures to businesses: analytic, with the following
minimums:
o 60% in cases of going concerns;
o 90% in cases of non-going concerns;
o through to the successful enforcement and liquidation of
guarantees; 20% minimum without time limits for positions
guaranteed by the Central Guarantee Fund, SACE, IEB, ISMEA,
EIF at 80%, with an increase in the coverage percentage if these
guarantees are issued to a lesser degree and in any case up to the
maximum of the non-guaranteed percentage, with the exception of
adjustments associated with any problems which may arise in the
case of enforcement.
• Mortgage exposures to Businesses: analytic, with the following minimums:
o 40% in cases of going concerns;
o 50% in cases of non-going concerns.
193
2) Unlikely to pay: write-downs are differentiated on the basis of the portfolio
they belong to:
• Exposures with private customers: analytic, with the following minimums:
o 15% if past-due / over-the-limit from 0 to 2 years;
o 20% if past-due / over-the-limit for more than 2 years;
• Unsecured exposures with businesses: analytic, with the following
minimums:
o 20% if past-due / over-the-limit from 0 to 2 years;
o 40% if past-due / over-the-limit for more than 2 years;
o 20% minimum without time limits for positions guaranteed by the
Central Guarantee Fund, SACE, IEB, ISMEA, EIF at 80%, with an
increase in the coverage percentage if these guarantees are issued
to a lesser degree and in any case up to the maximum of the non-
guaranteed percentage.
• Mortgage exposures with businesses: analytic, with the following
minimums:
o 15% if past-due / over-the-limit from 0 to 2 years;
o 30% if past-due / over-the-limit for more than 2 years.
3) Past due/over-the-limit: write-downs are differentiated on the basis of the
portfolio they belong to:
• Exposures to private customers: minimum:
o 10% if past-due/over-the-limit
• Unsecured exposures to businesses: minimum:
o 10% if past-due / over-the-limit for up to 180 days;
o 20% if past-due / over-the-limit for more than 180 days;
• Mortgage exposures to businesses: minimum:
o 10% if past-due / over-the-limit for up to 180 days;
o 15% if past-due / over-the-limit for more than 180 days.
The Bank has also established criteria for making exceptions to the above write-
down percentages for:
• Impaired exposures subject to repayment plans: loss provision
percentages assessed case by case, to take into account the diversity of

194
risk of impaired exposures that have a past due amount being regularised
by the debtor;
• Exposures classified as probable defaults that do not have unpaid
instalments: loss provision percentages assessed case by case, to take
into account the diversity of risk of exposures classified as Probable
Defaults which, although they show anomalies such as to require the
classification, are being regularly repaid;
• Exposures classified as probable defaults subject to debt restructuring
plans pursuant to art. 67. III c., letter D (certified recovery plan) or pursuant
to art. 182 bis (restructuring agreement) of the Italian Bankruptcy Law: loss
provision percentages assessed case by case, in keeping with the official
documents of the debt restructuring agreements;
• Exposures to subjects in an arrangement procedure other than bankruptcy:
loss provision percentages assessed case by case, in keeping with the
official documents of the arrangement procedures.
These criteria for determining the write-downs and the related provisions are subject
to benchmarking and continually reviewed and updated in order to always guarantee
an adequate representation of the Bank's risk profiles.
Interest on arrears is included in the item Interest income of the Income Statement
only if effectively collected, since the part not collected is entirely written down.
3.2 Write-offs
Write-offs of uncollectable accounting items and consequent recognition of losses
may occur in the following cases:
1. uncollectability of the receivable, based on certain and precise elements,
understood as:
• debtor cannot be contacted or is destitute;
• no amounts collected from enforcement of real estate and movable
goods;
• negative foreclosures;
• bankruptcy procedures concluded without full compensation for the
Bank, if there are no other guarantees which can be usefully enforced;

195
• for loans of limited amount, when it can be demonstrated that legal and
administrative costs to begin or continue legal action to recover the
credit exceed probable amounts recovered;
• statute of limitations reached;
• in any case for unsuccessful use the legal actions available to the
creditor, the significance of which must be directly proportional to the
amount of the credit.
2. renunciation of the loan, based on:
• unilateral withdrawal of the loan;
• residual amount against settlement agreements;
3. credit disposals.
In relation to various cases in which write-offs are possible, it is necessary, also for
tax reasons, to keep all documents able to demonstrate the validity of the decision
made, by way of example documents indicating the activities carried out and the date
on which collection attempts ended, even if unsuccessful. The amount to be written
off is based on the gross accounting balance at the customer level and must be fully
written down.
Additionally, under certain circumstances it is necessary to recognise partial
impairment of gross loans in order to adjust them to the Bank's effective collection
rights. These circumstances may arise, for example, in the case of provisions not
committed, in the context of bankruptcy proceedings, on the basis of which a lower
receivable is recognised than that in the books. In these cases, it is necessary to
recognise impairment based on a resolution by the decision making body, identified
on the basis of the current delegations of powers (indicating the loan allowed as the
"amount offered").
Note that portions of loans subject to write-off must already be entirely provisioned
and that approved partial write-offs are included when calculating total losses in the
case of settlements following the write-off.
Transactions written off during 2019 totalled 33 positions, for a total amount of
around € 4,550 thousand. These were positions classified as non-performing, fully
written down during the course of the year or in previous years, for which the
continuation of credit collection activities was deemed to be useless and
uneconomical, as well as non-performing positions for which a settlement and write-

196
off agreement was signed with the debtor. Among the positions subject to
cancellation, we note the without recourse disposal of a transaction classified as non-
performing, which during the year generated a writeback of around € 47,000.
During the same period, no transactions were cancelled with enforcement
procedures still under way.
3.3 Acquired or originated impaired financial assets
As part of the operation relative to the restructuring agreement pursuant to article
182-bis L.S. with regards to the debt of the Trevi Finanziaria Industriale Group, to
which the Bank adhered in August 2019, the Bank granted new temporary financing
to the group’s two operating companies, Soilmec and Trevi Spa, for a total of € 2.4
million, of which € 779,000 disbursed at 31 December 2019, maturing in 2023 with
partial coverage by the SACE surety guarantee at 15.5%. The two positions were
classified as unlikely to pay with provisioning equal to 20% of the disbursed amount,
net of the portion guaranteed by SACE.
4. Financial assets subject to commercial renegotiation and forborne
exposures
On the basis of that established in the EBA Implementing Technical Standard (ITS),
forbearance measures are defined as a "measure of tolerance" granted to a debtor
by a bank, when the former finds itself, or is about to find itself, in difficulty to fulfil
their financial commitments15. An exposure which has been granted a measure of
tolerance by the bank must be classified among impaired forborne exposures or
among other forborne exposures, regardless of whether the measure creates a loss
for the bank.
One of the following measures of tolerance is considered forbearance:
• a change in the contractual terms and conditions which the debtor would not
be able to comply with, entirely or partially, in consideration of the financial
difficulties they find themselves in, aimed at making the debt more sustainable
for the debtor and which would not be granted if the debtor was not having
financial difficulties;
15 European Banking Authority, EBA FINAL draft Implementing Technical Standards on Supervisory reporting on forbearance and non-performing exposures under article 99(4) of Regulation (EU) No 575/2013,

197
• a total or partial refinancing of a problematic loan, which would not be granted
if the debtor was not having financial difficulties.
The following are considered evidence of forbearance measures:
• a change to contractual terms favourable to the debtor (forbearance in
absolute terms);
• a change in the contractual terms which involves applying more favourable
terms and conditions with respect to those which the bank applies to
customers with the debtor's same risk profile (forbearance in relative terms);
• the exercising of contractual clauses the application of which is left to the
debtor's discretion in the case the bank
i. approves the exercising of said clauses;
ii. becomes aware the debtor is having financial difficulties.
Agreements reached between a debtor and a pool of creditor banks based on which
existing credit lines are temporarily frozen while awaiting formal restructuring are not
classified as forborne. In any case, these agreements do not interrupt the count of
past-due days recognised for the purposes of classifying exposures as “past-due
and/or over the limit”.
In the case of restructuring transactions carried out by a pool of banks, those which
do not adhere to the restructuring agreement must determine whether the conditions
are met to classify their exposure among either non-performing or unlikely to pay.
Exposures relative to debtors who have proposed a composition with creditors, in the
“blank” form, are classified among forborne impaired, when the composition
agreement is transformed into a Debt Restructuring Agreement pursuant to Article
182-bis of the Italian Bankruptcy Law. Also in the case that the composition
agreement with business continuity is approved the exposure is recognised among
forborne impaired exposures, with the exception of the above case of disposal of the
operating company or disposal to one or more companies (even if newly established)
not part of the debtor's economic group. In this case, the exposure is reclassified
among performing assets.
If the forbearance measure regards exposures with entities classified as “performing”
or as performing past due and/or over the limit exposures, the requirement of debtor
financial/economic difficulties is presumed to be met if the forbearance measure
involves a pool of intermediaries.
The existence of financial difficulty for the debtor is presumed to exist when:

198
• in the three months prior to the granting of the forbearance measure a past-
due exceeding 30 days was recognised;
• new financing is provided by the Bank in the presence of other existing
exposures past due by at least 30 days;
• the Bank has approved the use of contractual clauses which can be exercised
at the debtor's discretion, for positions past due by at least 30 days or which
would have been past due by at least 30 days if these clauses had not been
exercised.
Additionally, the following cases must be considered as forbearance measures and
the relative exposures must be classified as “impaired forborne exposures”, as
debtor financial difficulties are presumed to already have been ascertained:
a) exposures for which the forbearance measure occurred after classification in a
non-performing category, or if this classification would have occurred if not for
the forbearance measure;
b) the exposure has been written off, even partially;
c) the Bank approved the exercising of contractual clauses which can be used at
the discretion of the debtor for entities classified as non-performing, or which
would have been classified as such if these clauses had not been exercised;
d) after the granting of a new loan by the Bank, the debtor entirely or partially
regularised other existing loans with the Bank classified as non-performing, or
which would have been classified in this category if the payments had not
been made.

199
Quantitative information
A. Credit quality
A.1 Impaired and non-impaired loan exposures: amounts, value adjustments,
trend and economic distribution
A.1.1 Distribution of loan exposures by portfolio and credit quality (carrying
amount)
Portfolio/quality Non-performing
Probable defaults
Past-due exposures
Non-impaired past-due
exposures
Other non-impaired
exposures Total
1. Financial assets measured at amortised cost 7,620 46,197 28,000 1,562,777 1,644,594
2. Financial assets measured at fair value through other comprehensive income 747,966 747,966
3. Financial assets designated at fair value
4. Other financial assets obligatorily measured at fair value
5. Financial assets held for sale
Total 31.12.2019 7,620 46,197 28,000 2,310,743 2,392,560
Total 31.12.2018 9,937 52,999 262 22,722 2,123,221 2,209,141
A.1.2 Distribution of financial assets by portfolio and credit quality (gross and
net amounts)
Impaired Non-impaired Total
Portfolio/quality Gross exposure
Total value adjustments
Net exposure
Total partial
write-offs (*)
Gross exposure
Total value adjustments
Net exposure
(net exposure)
1. Financial assets measured at amortised cost 134,840 81,023 53,817 1,607,182 16,405 1,590,777 1,644,594
2. Financial assets measured at fair value through other comprehensive income 748,554 588 747,966 747,966
3. Financial assets designated at fair value
4. Other financial assets obligatorily measured at fair value
5. Financial assets held for sale
Total 31.12.2019 134,840 81,023 53,817 2,355,736 16,993 2,338,743 2,392,560
Total 31.12.2018 135,311 72,113 63,198 2,162,762 16,819 2,145,943 2,209,141
Gross exposure towards non-impaired customers includes receivables accrued for
services rendered due from Public Administrations for € 66,665 thousand, against
portfolio value adjustments of € 1,127 thousand.

200
A.1.2 bis Distribution of financial assets by portfolio and credit quality (gross
and net amounts)
Assets of evident low credit quality Other assets
Portfolio/quality Cumulative capital losses Net exposure Net exposure
1. Financial assets held for trading
2. Hedging derivatives 88,039
Total 31.12.2019 88,039
Total 31.12.2018 82,650
The item Hedging derivatives refers to derivatives for managing interest rate risk on
bond issues. These derivatives are entered into with leading banking counterparties;
in line with the corporate policy, the contracts provide for payment of deposits to
guarantee the fair value of the contract and the counterparty risk is negligible.
A.1.3 Distribution of financial assets by past-due range (carrying amount)
Stage one Stage two Stage three
Portfolios/risk stages
Fro
m 1
da
y t
o
30 d
ays
Fro
m o
ver
30
da
ys t
o 9
0
da
ys
Over
90 d
ays
Up
to
30 d
ays
Fro
m o
ver
30
da
ys t
o 9
0
da
ys
Over
90 d
ays
Up
to
30 d
ays
Fro
m o
ver
30
da
ys t
o 9
0
da
ys
Over
90 d
ays
1. Financial assets measured at amortised cost
22,758 322 602 3,158 1,159 24 280 40,880
2. Financial assets measured at fair value through other comprehensive income
3. Financial assets held for sale
TOTAL 31.12.2019 22,758 322 602 3,158 1,159 24 280 40,880
TOTAL 31.12.2018 11,167 1,819 3,635 3,027 3,174 128 840 52,211
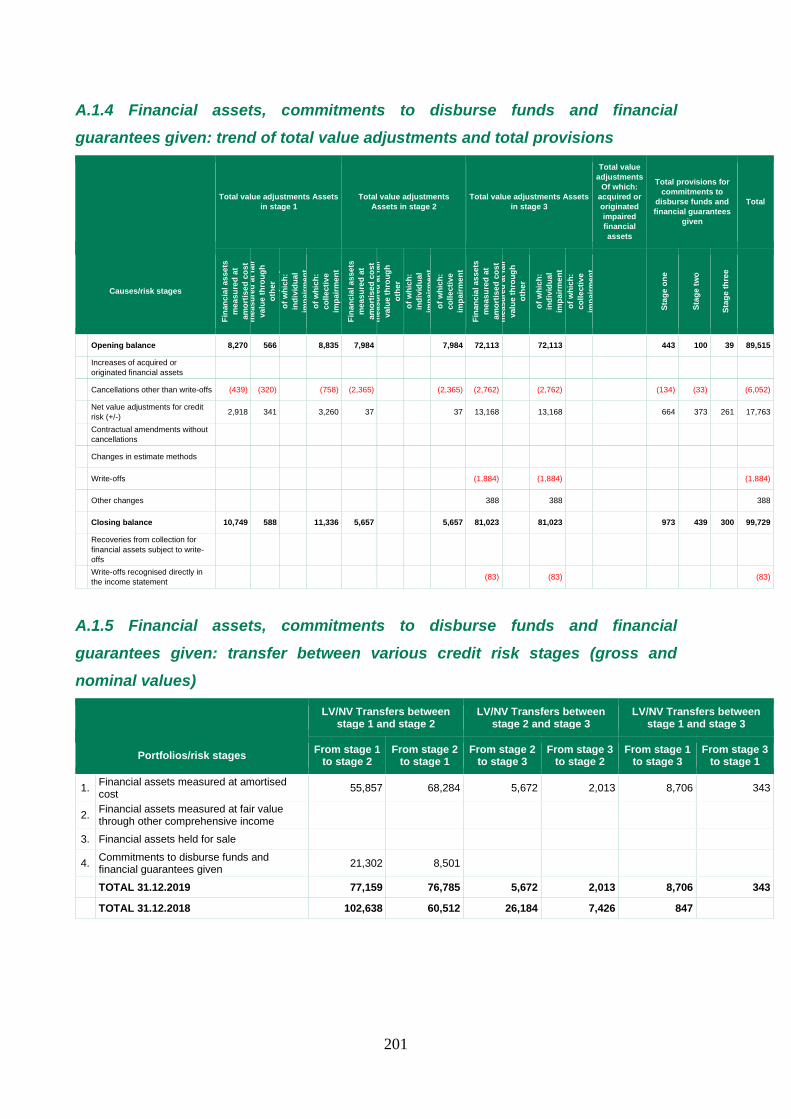
201
A.1.4 Financial assets, commitments to disburse funds and financial
guarantees given: trend of total value adjustments and total provisions
Total value adjustments Assets
in stage 1 Total value adjustments
Assets in stage 2 Total value adjustments Assets
in stage 3
Total value
adjustments
Of which:
acquired or
originated
impaired
financial
assets
Total provisions for
commitments to
disburse funds and
financial guarantees
given
Total
Causes/risk stages
Fin
an
cia
l a
ss
ets
me
as
ure
d a
t
am
ort
ise
d c
os
t F
inan
cia
l a
ss
ets
me
as
ure
d a
t fa
ir
va
lue
th
rou
gh
oth
er
co
mp
reh
en
siv
e
inc
om
e
of
wh
ich
:
ind
ivid
ua
l
imp
air
me
nt
of
wh
ich
:
co
lle
cti
ve
imp
air
me
nt
Fin
an
cia
l a
ss
ets
me
as
ure
d a
t
am
ort
ise
d c
os
t F
inan
cia
l a
ss
ets
me
as
ure
d a
t fa
ir
va
lue
th
rou
gh
oth
er
co
mp
reh
en
siv
e
inc
om
e
of
wh
ich
:
ind
ivid
ua
l
imp
air
me
nt
of
wh
ich
:
co
lle
cti
ve
imp
air
me
nt
Fin
an
cia
l a
ss
ets
me
as
ure
d a
t
am
ort
ise
d c
os
t F
inan
cia
l a
ss
ets
me
as
ure
d a
t fa
ir
va
lue
th
rou
gh
oth
er
co
mp
reh
en
siv
e
inc
om
e
of
wh
ich
:
ind
ivid
ua
l
imp
air
me
nt
of
wh
ich
:
co
lle
cti
ve
imp
air
me
nt
Sta
ge
on
e
Sta
ge
tw
o
Sta
ge
th
ree
Opening balance 8,270 566 8,835 7,984 7,984 72,113 72,113 443 100 39 89,515
Increases of acquired or
originated financial assets
Cancellations other than write-offs (439) (320) (758) (2,365) (2,365) (2,762) (2,762) (134) (33) (6,052)
Net value adjustments for credit
risk (+/-) 2,918 341 3,260 37 37 13,168 13,168 664 373 261 17,763
Contractual amendments without
cancellations
Changes in estimate methods
Write-offs (1,884) (1,884) (1,884)
Other changes 388 388 388
Closing balance 10,749 588 11,336 5,657 5,657 81,023 81,023 973 439 300 99,729
Recoveries from collection for
financial assets subject to write-
offs
Write-offs recognised directly in
the income statement (83) (83) (83)
A.1.5 Financial assets, commitments to disburse funds and financial
guarantees given: transfer between various credit risk stages (gross and
nominal values)
LV/NV Transfers between
stage 1 and stage 2 LV/NV Transfers between
stage 2 and stage 3 LV/NV Transfers between
stage 1 and stage 3
Portfolios/risk stages From stage 1 to stage 2
From stage 2 to stage 1
From stage 2 to stage 3
From stage 3 to stage 2
From stage 1 to stage 3
From stage 3 to stage 1
1. Financial assets measured at amortised cost 55,857 68,284 5,672 2,013 8,706 343
2. Financial assets measured at fair value through other comprehensive income
3. Financial assets held for sale
4. Commitments to disburse funds and financial guarantees given 21,302 8,501
TOTAL 31.12.2019 77,159 76,785 5,672 2,013 8,706 343
TOTAL 31.12.2018 102,638 60,512 26,184 7,426 847

202
A.1.6 On-balance sheet and off-balance sheet loan exposures to banks: gross
and net amounts
Gross exposure
Type of exposure/Amounts Impaired Non-impaired Total value
adjustments and total provisions
Net exposure Total partial write-offs*
A. ON-BALANCE SHEET LOAN EXPOSURES
a) Bad loans
- of which: forborne exposures
b) Unlikely to pay
- of which: forborne exposures
c) Impaired past-due exposures
- of which: forborne exposures
d) Non-impaired past-due exposures 0
- of which: forborne exposures
e) Other non-impaired exposures 87,563 2,839 84,724
- of which: forborne exposures
TOTAL A 87,563 2,839 84,724
B. OFF-BALANCE SHEET LOAN EXPOSURES
a) Impaired
b) Non-impaired 85,800 85,800
TOTAL B 85,800 85,800
TOTAL A+B 173,363 2,839 170,524 * Values to be shown for informational purposes

203
A.1.7 On-balance sheet and off-balance sheet loan exposures to customers:
gross and net amounts
Gross exposure
Type of exposure/Amounts Impaired Non-impaired Total value
adjustments and total provisions
Net exposure Total partial write-offs*
A. ON-BALANCE SHEET LOAN EXPOSURES
a) Bad loans 28,515 20,894 7,621
- of which: forborne exposures 2,804 1,293 1,511
b) Unlikely to pay 106,325 60,129 46,196
- of which: forborne exposures 73,923 46,697 27,226
c) Impaired past-due exposures
- of which: forborne exposures
d) Non-impaired past-due exposures 28,997 997 28,000
- of which: forborne exposures 437 21 416
e) Other non-impaired exposures 2,239,176 13,157 2,226,019
- of which: forborne exposures 6,726 374 6,352
TOTAL A 134,840 2,268,173 95,177 2,307,836
B. OFF-BALANCE SHEET LOAN EXPOSURES
a) Impaired 1,743 300 1,443
b) Non-impaired 148,717 1,413 147,304
TOTAL B 1,743 148,717 1,713 148,747
TOTAL A+B 136,583 2,416,890 96,890 2,456,583 * Values to be shown for informational purposes

204
A.1.9 On-balance sheet exposures to customers: trend in gross impaired
exposures
Reasons/Categories Bad loans Unlikely to pay Past-due exposures
A. Gross opening exposure 23,604 111,396 311
- of which: exposures disposed of but not derecognised B. Increases 14,725 17,637 3
B.1 transfers from performing exposures 514 15,186
B.2 inflows from acquired or originated impaired financial assets
B.3 transfers from other categories of impaired exposures 13,667 262
B.4 contractual amendments without cancellations 1
B.5 other increases 544 2,188 3 C. Decreases 9,814 22,708 314
C.1 outflows to performing exposures 2,531 43
C.2 write-offs 1,884
C.3 collections 1,644 5,922 6
C.4 proceeds from disposals 3,510
C.5 losses on disposals
C.6 transfers to other categories of impaired exposures 13,667 262
C.7 contractual amendments without cancellations 184
C.8 other decreases 2,776 404 3 D. Gross closing exposure 28,515 106,325 0
- of which: exposures disposed of but not derecognised
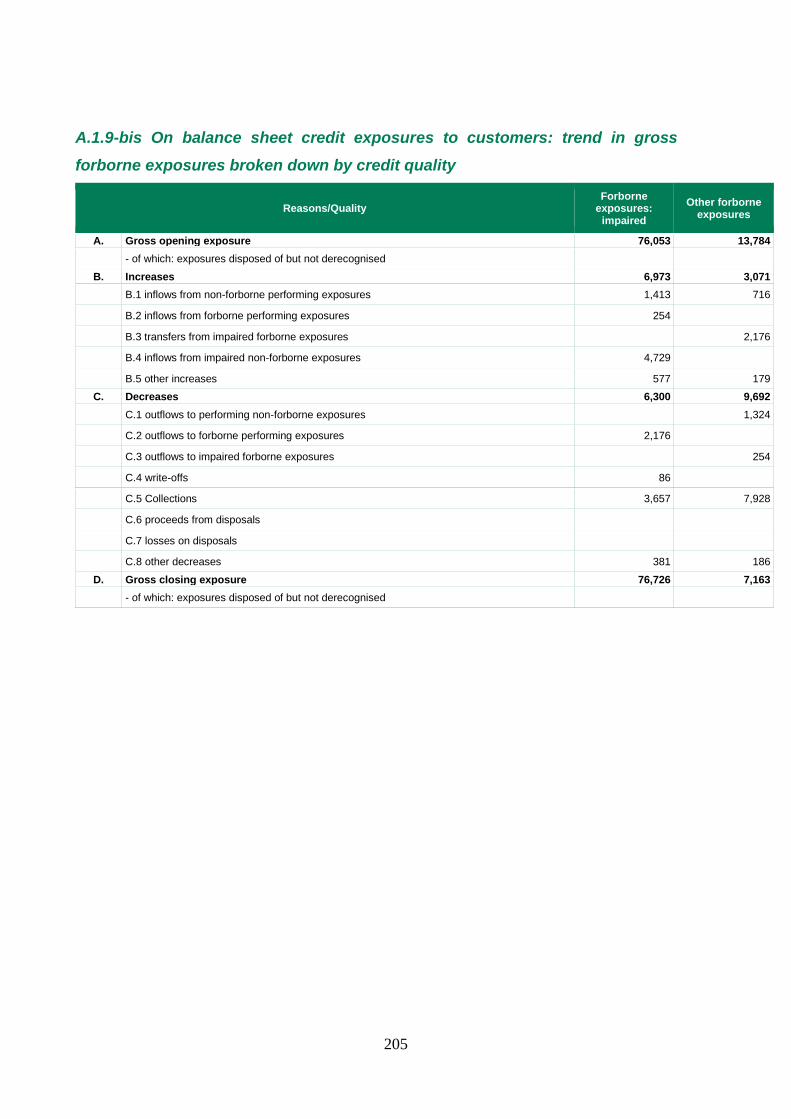
205
A.1.9-bis On balance sheet credit exposures to customers: trend in gross
forborne exposures broken down by credit quality
Reasons/Quality Forborne
exposures: impaired
Other forborne exposures
A. Gross opening exposure 76,053 13,784
- of which: exposures disposed of but not derecognised B. Increases 6,973 3,071
B.1 inflows from non-forborne performing exposures 1,413 716
B.2 inflows from forborne performing exposures 254
B.3 transfers from impaired forborne exposures 2,176
B.4 inflows from impaired non-forborne exposures 4,729
B.5 other increases 577 179 C. Decreases 6,300 9,692
C.1 outflows to performing non-forborne exposures 1,324
C.2 outflows to forborne performing exposures 2,176
C.3 outflows to impaired forborne exposures 254
C.4 write-offs 86
C.5 Collections 3,657 7,928
C.6 proceeds from disposals
C.7 losses on disposals
C.8 other decreases 381 186 D. Gross closing exposure 76,726 7,163
- of which: exposures disposed of but not derecognised

206
A.1.11 On-balance sheet impaired loan exposures to customers: trend in total
value adjustments
Bad loans Unlikely to pay Past-due exposures
Reasons/Categories Total - of which: forborne
exposures Total
- of which: forborne
exposures Total
- of which: forborne
exposures
A. Total opening write-downs 13,667 1,043 58,397 39,677 49 5
- of which: exposures disposed of but not derecognised
B. B. Increases 12,430 370 15,670 9,262
B.1 writedowns for acquired or originated impaired financial assets
B.2 other write-downs 967 38 15,626 8,484
B.3 losses on disposals
B.4 transfers from other categories of impaired exposures 11,075 325 44 5
B.5 contractual amendments without cancellations
B.6 other increases 388 7 773 C. Decreases 5,202 119 13,939 2,242 49 5
C.1. write-backs following valuation 349 30 2,776 1,916 0
C2. write-backs following collection 207 3 88 1 5
C.3 gains on disposal
C.4 write-offs 1,884 86
C.5 transfers to other categories of impaired exposures 11,075 325 44 5
C.6 contractual amendments without cancellations
C.7 other decreases 2,762
D. Total closing write-downs 20,895 1,294 60,128 46,697
- of which: exposures disposed of but not derecognised
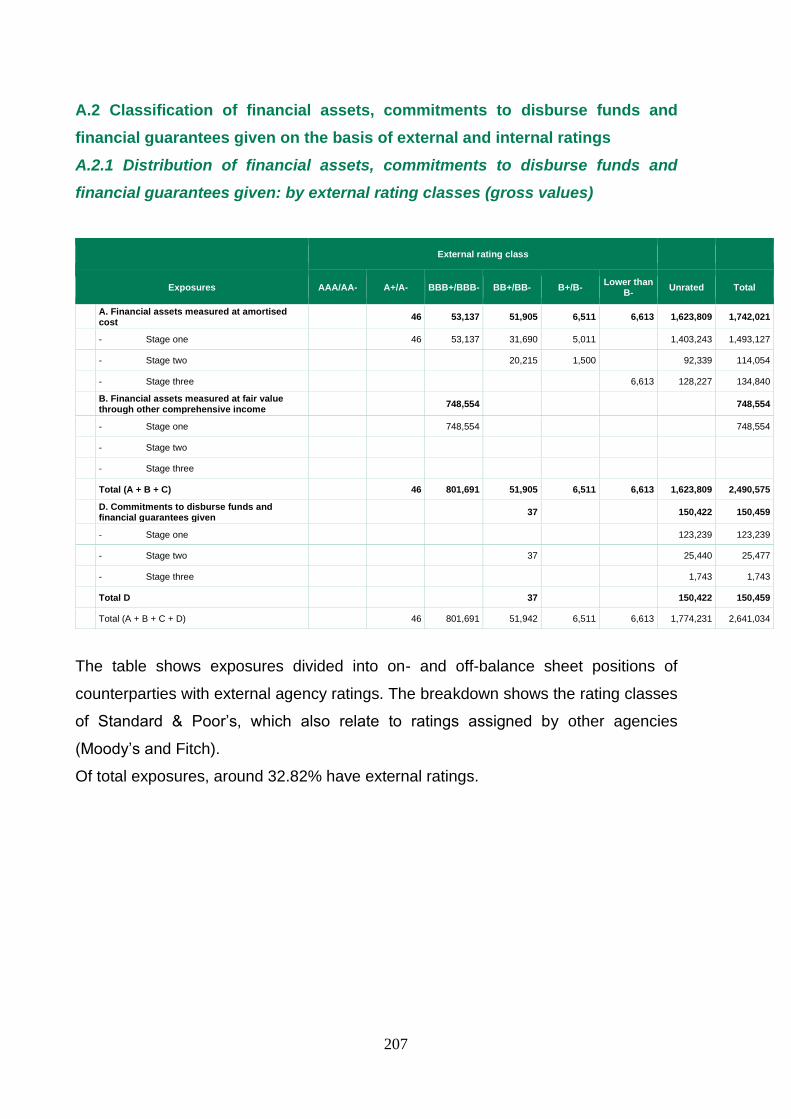
207
A.2 Classification of financial assets, commitments to disburse funds and
financial guarantees given on the basis of external and internal ratings
A.2.1 Distribution of financial assets, commitments to disburse funds and
financial guarantees given: by external rating classes (gross values)
External rating class
Exposures AAA/AA- A+/A- BBB+/BBB- BB+/BB- B+/B- Lower than B- Unrated Total
A. Financial assets measured at amortised cost 46 53,137 51,905 6,511 6,613 1,623,809 1,742,021
- Stage one 46 53,137 31,690 5,011 1,403,243 1,493,127
- Stage two 20,215 1,500 92,339 114,054
- Stage three 6,613 128,227 134,840
B. Financial assets measured at fair value through other comprehensive income 748,554 748,554
- Stage one 748,554 748,554
- Stage two
- Stage three
Total (A + B + C) 46 801,691 51,905 6,511 6,613 1,623,809 2,490,575
D. Commitments to disburse funds and financial guarantees given 37 150,422 150,459
- Stage one 123,239 123,239
- Stage two 37 25,440 25,477
- Stage three 1,743 1,743
Total D 37 150,422 150,459
Total (A + B + C + D) 46 801,691 51,942 6,511 6,613 1,774,231 2,641,034
The table shows exposures divided into on- and off-balance sheet positions of
counterparties with external agency ratings. The breakdown shows the rating classes
of Standard & Poor’s, which also relate to ratings assigned by other agencies
(Moody’s and Fitch).
Of total exposures, around 32.82% have external ratings.
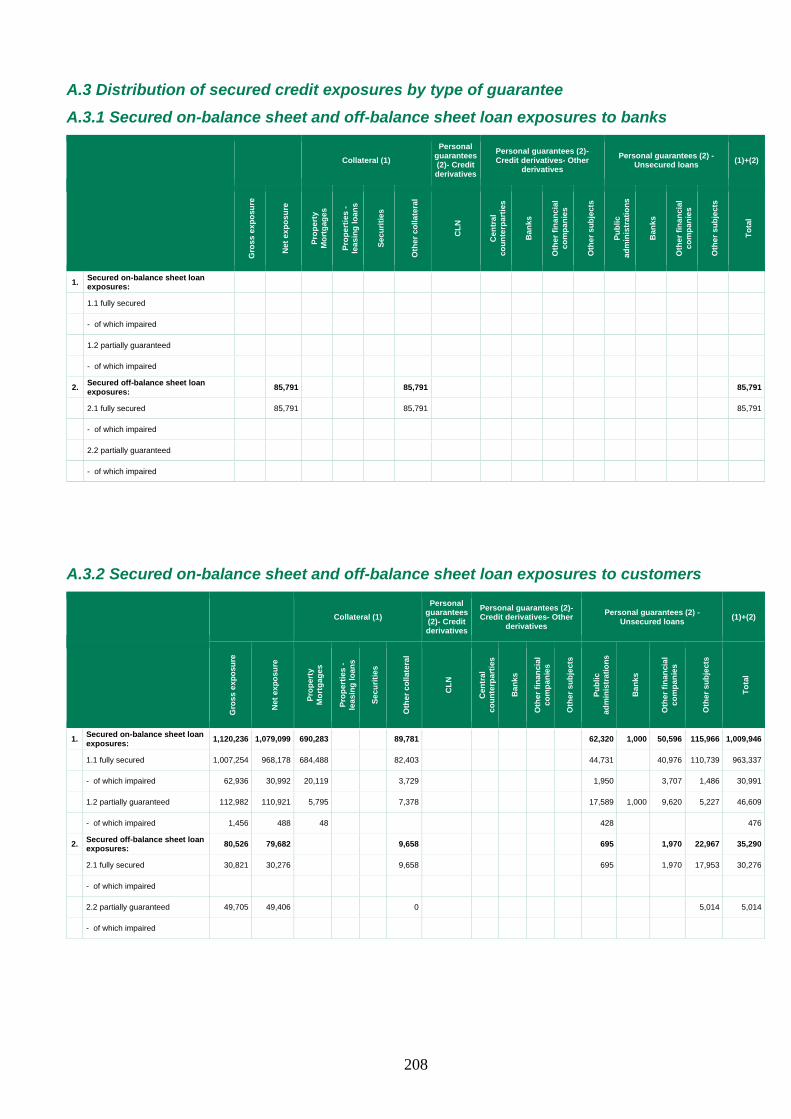
208
A.3 Distribution of secured credit exposures by type of guarantee
A.3.1 Secured on-balance sheet and off-balance sheet loan exposures to banks
Collateral (1) Personal
guarantees (2)- Credit derivatives
Personal guarantees (2)- Credit derivatives- Other
derivatives Personal guarantees (2) -
Unsecured loans (1)+(2)
Gro
ss
ex
po
su
re
Net
ex
po
su
re
Pro
pe
rty
Mo
rtg
ag
es
Pro
pe
rtie
s -
lea
sin
g l
oa
ns
Se
cu
riti
es
Oth
er
co
lla
tera
l
CL
N
Cen
tra
l
co
un
terp
art
ies
Ban
ks
Oth
er
fin
an
cia
l
co
mp
an
ies
Oth
er
su
bje
cts
Pu
bli
c
ad
min
istr
ati
on
s
Ban
ks
Oth
er
fin
an
cia
l
co
mp
an
ies
Oth
er
su
bje
cts
To
tal
1. Secured on-balance sheet loan exposures:
1.1 fully secured
- of which impaired
1.2 partially guaranteed
- of which impaired
2. Secured off-balance sheet loan exposures: 85,791 85,791 85,791
2.1 fully secured 85,791 85,791 85,791
- of which impaired
2.2 partially guaranteed
- of which impaired
A.3.2 Secured on-balance sheet and off-balance sheet loan exposures to customers
Collateral (1) Personal
guarantees (2)- Credit derivatives
Personal guarantees (2)- Credit derivatives- Other
derivatives Personal guarantees (2) -
Unsecured loans (1)+(2)
Gro
ss
ex
po
su
re
Net
ex
po
su
re
Pro
pe
rty
Mo
rtg
ag
es
Pro
pe
rtie
s -
lea
sin
g l
oa
ns
Se
cu
riti
es
Oth
er
co
lla
tera
l
CL
N
Cen
tra
l
co
un
terp
art
ies
Ban
ks
Oth
er
fin
an
cia
l
co
mp
an
ies
Oth
er
su
bje
cts
Pu
bli
c
ad
min
istr
ati
on
s
Ban
ks
Oth
er
fin
an
cia
l
co
mp
an
ies
Oth
er
su
bje
cts
To
tal
1. Secured on-balance sheet loan exposures: 1,120,236 1,079,099 690,283 89,781 62,320 1,000 50,596 115,966 1,009,946
1.1 fully secured 1,007,254 968,178 684,488 82,403 44,731 40,976 110,739 963,337
- of which impaired 62,936 30,992 20,119 3,729 1,950 3,707 1,486 30,991
1.2 partially guaranteed 112,982 110,921 5,795 7,378 17,589 1,000 9,620 5,227 46,609
- of which impaired 1,456 488 48 428 476
2. Secured off-balance sheet loan exposures: 80,526 79,682 9,658 695 1,970 22,967 35,290
2.1 fully secured 30,821 30,276 9,658 695 1,970 17,953 30,276
- of which impaired
2.2 partially guaranteed 49,705 49,406 0 5,014 5,014
- of which impaired

209
B. Distribution and concentration of loan exposures
B.1 On-balance sheet and off-balance sheet exposures to customers by sector
Public administrations Financial companies Financial companies (of which: insurance
companies) Non-financial
companies Households
Exposure/Counterparty
Net
ex
po
su
re
To
tal
va
lue
ad
justm
en
ts
Net
ex
po
su
re
To
tal
va
lue
ad
justm
en
ts
Net
ex
po
su
re
To
tal
va
lue
ad
justm
en
ts
Net
ex
po
su
re
To
tal
va
lue
ad
justm
en
ts
Net
ex
po
su
re
To
tal
va
lue
ad
justm
en
ts
A. On-balance sheet loan exposures
A.1 Non-performing 5,615 17,830 2,005 3,065
- of which: forborne exposures 1,427 1,175 84 118
A.2 Probable defaults 43,364 58,366 2,833 1,763
- of which: forborne exposures 26,647 46,310 579 387
A.3 Impaired past-due exposures
- of which: forborne exposures
A.4 Non-impaired exposures 812,521 1,448 95,425 997 987,729 10,217 358,344 1,492
- of which: forborne exposures 3,781 221 2,987 174
Total (A) 812,521 1,448 95,425 997 1,036,708 86,413 363,182 6,320
B. Off-balance sheet loan exposures
B.1 Impaired exposures 1,443 300
B.2 Non-impaired exposures 4,065 52 143,044 1,359 195 1
Total (B) 4,065 52 144,487 1,659 195 1
Total (A+B) 31.12.2019 812,521 1,448 99,490 1,049 1,181,195 88,072 363,377 6,321
Total (A+B) 31.12.2018 782,511 3,346 54,004 678 1,014,540 80,249 397,983 5,384

210
B.2 On-balance sheet and off-balance sheet exposures to customers by region
Operations with Italy
NORTH WEST ITALY NORTH EAST ITALY CENTRAL ITALY ITALY – SOUTH AND ISLANDS
Exposure/Geographical area Net exposure
Total value adjustments
Net exposure
Total value adjustments
Net exposure
Total value adjustments
Net exposure
Total value adjustments
A. On-balance sheet loan exposures
A.1 Bad loans 642 994 198 2,003 11,483 4,975 8,219
A.2 Unlikely to pay 2,208 1,086 26,939 33,628 7,894 18,875 9,156 6,539
A.3 Impaired past-due exposures
A.4 Non-impaired exposures 238,215 3,100 266,703 1,739 1,196,849 3,634 552,126 5,681
Total (A) 241,065 5,180 293,642 35,565 1,206,746 33,992 566,257 20,439
B. Off-balance sheet loan exposures
B.1 Impaired exposures 1,443 300
B.2 Non-impaired exposures 32,800 427 14,758 265 31,326 397 68,420 323
Total (B) 32,800 427 16,201 565 31,326 397 68,420 323
Total (A+B) 31.12.2019 273,865 5,607 309,843 36,130 1,238,072 34,389 634,677 20,762
Total (A+B) 31.12.2018 204,924 5,502 230,325 27,019 1,185,853 34,722 627,636 22,216
The above geographical distribution is based on the criteria of the concentration models
(borrowers’ province of residence) and, therefore, does not give a picture of the prevalence of
the Bank’s operations.
Furthermore, of exposures classified as Central Italy, an amount of € 748 million regards
Italian government bonds, classified as financial assets measured at fair value through other
comprehensive income, and an amount of € 64.5 million represents receivables due from
Public Administrations for commissions earned on services rendered.

211
Operations outside of Italy
ITALY OTHER EUROPEAN COUNTRIES AMERICAS ASIA REST OF WORLD
Exposure/Geographical area
Net
ex
po
su
re
To
tal
va
lue
ad
justm
en
ts
Net
ex
po
su
re
To
tal
va
lue
ad
justm
en
ts
Net
ex
po
su
re
To
tal
va
lue
ad
justm
en
ts
Net
ex
po
su
re
To
tal
va
lue
ad
justm
en
ts
Net
ex
po
su
re
To
tal
va
lue
ad
justm
en
ts
A. On-balance sheet loan exposures
A.1 Bad loans 7,620 20,894
A.2 Unlikely to pay 46,197 60,129
A.3 Impaired past-due exposures
A.4 Non-impaired exposures 2,253,893 14,154 126 0
Total (A) 2,307,710 95,177 126
B. Off-balance sheet loan exposures
B.1 Impaired exposures 1,443 300
B.2 Non-impaired exposures 147,304 1,413
Total (B) 148,747 1,713
Total (A+B) 31.12.2019 2,456,457 96,890 126
Total (A+B) 31.12.2018 2,248,738 89,461 131 168 1

212
B.3 On-balance sheet and off-balance sheet loan exposures to banks by geographical
area
Operations with Italy
NORTH WEST ITALY NORTH EAST ITALY CENTRAL ITALY ITALY – SOUTH AND ISLANDS
Exposure/Geographical area Net exposure
Total value adjustments
Net exposure
Total value adjustments
Net exposure
Total value adjustments
Net exposure
Total value adjustments
A. On-balance sheet exposures
A.1 Bad loans
A.2 Unlikely to pay
A.3 Impaired past-due exposures
A.4 Non-impaired exposures 83,894 2,839 300 1 36 0
Total (A) 83,894 2,839 300 1 36
B. Off-balance sheet exposures
B.1 Impaired exposures
B.2 Non-impaired exposures 9
Total (B) 9
Total (A+B) 31.12.2019 83,894 2,839 300 1 45
Total (A+B) 31.12.2018 17,115 14 440 2 44,491 34 3
Operations outside of Italy
ITALY OTHER EUROPEAN COUNTRIES AMERICAS ASIA REST OF WORLD
Exposure/Geographical area
Net
ex
po
su
re
To
tal
va
lue
ad
justm
en
ts
Net
ex
po
su
re
To
tal
va
lue
ad
justm
en
ts
Net
ex
po
su
re
To
tal
va
lue
ad
justm
en
ts
Net
ex
po
su
re
To
tal
va
lue
ad
justm
en
ts
Net
ex
po
su
re
To
tal
va
lue
ad
justm
en
ts
A. On-balance sheet exposures
A.1 Bad loans
A.2 Unlikely to pay
A.3 Impaired past-due exposures
A.4 Non-impaired exposures 84,230 2,839 494
Total (A) 84,230 2,839 494
B. Off-balance sheet exposures
B.1 Impaired exposures
B.2 Non-impaired exposures 9
Total (B) 9
Total (A+B) 31.12.2019 84,239 2,839 494
Total (A+B) 31.12.2018

213
B.4 Large Exposures
For application of prudential supervisory regulations regarding large exposures (see Part II,
Chapter 10 of Bank of Italy Circular 285/2013 and articles 387 and subsequent of Regulation
(EU) 575/2013), at 31 December 2019 there were 3 exposures of this kind (more than 10% of
the own funds) for a nominal amount of € 1,050,745 thousand, corresponding to a weighted
amount of € 88,623 thousand.
C. Securitisation transactions
C.2 Exposures from main “third party” securitisation transactions, broken down by
type of securitised asset and type of exposure
On-balance sheet
exposures Guarantees given Credit lines
Type of underlying asset/exposures
Carr
yin
g a
mo
un
t
Wri
te-d
ow
ns
/wri
te-b
ac
ks
Wri
te-d
ow
ns
/wri
te-b
ac
ks
Carr
yin
g a
mo
un
t
Wri
te-d
ow
ns
/wri
te-b
ac
ks
Wri
te-d
ow
ns
/wri
te-b
ac
ks
Minibond - EBB Export (code 67849) 20,042 16
Minibond - CheeseTake S.r.l. - Series 2018-2) (code 57139) 489 11
Minibond - EBB Export (Series 2) (code 53951) 5,998 5
E. Disposal transactions
Financial assets disposed of but not fully derecognised
Qualitative information
The financial assets indicated below refer to repurchase agreements recognised among
amounts due to banks and carried out to obtain short-term funding, offering securities as
collateral.

214
Quantitative information
E.1 Financial assets disposed of and fully recognised and associated financial
liabilities: carrying amount
Financial assets disposed of and fully recognised Associated financial liabilities
Carrying amount
of which: subject to
securitisation transactions
of which: subject to
sales contracts
with repurchase agreements
of which impaired
Carrying amount
of which: subject to
securitisation transactions
of which: subject to
sales contracts
with repurchase agreements
A. Financial assets held for trading
1. Debt securities
2. Equity securities
3. Loans
4. Derivatives
B. Other financial assets obligatorily measured at fair value
1. Debt securities
2. Equity securities
3. Loans
Financial assets designated at fair value
1. Debt securities
2. Loans
D. Financial assets measured at fair value through other comprehensive income 42,123 42,123 (42,044) (42,044)
1. Debt securities 42,123 42,123 (42,044) (42,044)
2. Equity securities
3. Loans
E. Financial assets measured at amortised cost
1. Debt securities
2. Loans
Total 31.12.2019 42,123 42,123 (42,044) (42,044)
Total 31.12.2018 204,200 204,200 (199,002) (199,002)
215
SECTION 2 – MARKET RISKS
2.1 - Interest-rate and price risk – regulatory trading book
At 31 December 2019, there were no positions attributable to the regulatory trading book;
therefore, the entire financial structure is composed of the “banking book”.
2.2 - Interest rate and price risk - Banking book
Qualitative information
A. Interest-rate risk and price risk: general aspects, management processes and
measurement methods
Interest-rate risk can be defined as the risk that changes in market interest rates have
unfavourable effects on assets and liabilities held for purposes other than trading, with an
impact, therefore, on profitability and/or on the Bank’s economic value. Exposure to this risk
mainly derives from the degree of maturity transformation carried out by the Bank, that is
collection of funds with short-term repricing schedules and use of assets with longer-term
revision of the rate; for this reason, quantification is based on analysing the mismatch
between repricing dates for asset and liability items.
The definition and optimisation of the Bank’s financial structure is ensured by the
Administration, Control and Finance Department in accordance with the indications laid down
by the company bodies in specific Guidelines and in line with the risk targets set by the
corporate bodies (“Risk Appetite Framework”). Interest rate risk appetite is expressed both in
terms of expected impact on net interest income (short-term view), and its impact on
economic value on the bank book (medium/long-term view). Financial management is
monitored both preventively - in order to identify the optimal financial structure in relation to
changes in market conditions - and after the fact, to ensure observance of risk objectives and
the approved system of limits. The second-level control activities are the responsibility of
organisational structures separate and independent from the operating units.
As of 31 December 2019 the most significant elements that characterise exposure to interest
rate risk are:
• medium/long-term loans relative to core lending business, consisting mainly of variable
rate loans indexed to the Euribor (84%), fixed rate loans (12%) and, to a residual
extent, mixed-rate loans (4%);
• factoring transactions;
• investments in multi-year treasury bonds, with an average duration of 2.5 as of the
reporting date;

216
• debenture bonds with fixed rate and zero coupon, with maturities distributed according
to the time development shown in table B1 below;
• ECB funding (“TLTRO II”);
• variable rate deposit liabilities indexed to the Euribor with Cassa Depositi e Prestiti;
• variable rate deposit liabilities indexed to the Euribor with the European Investment
Bank (EIB);
• short and medium-term deposit liabilities indexed to the Euribor with business
customers;
• short and medium-term deposit liabilities indexed to the Euribor with Invitalia Group
companies;
• repurchase agreements with banking counterparties;
• on demand deposits from business customers, deriving from on demand current
accounts and time deposits;
• demand deposits from Invitalia Group companies;
• demand deposits generated by technical current accounts related to management of
public subsidies.
Additionally, the following positions are part of the overall ALM structure:
• hedging derivatives for bond funding;
• deposits (assets or liabilities), indexed to EONIA, received or made as collateral for the
positive or negative market value of hedging derivative contracts and for repurchase
agreements (cash collateral).
The positions deriving from the securitisation of residential mortgage loans carried out in
2016 have no effect on the overall ALM structure and, therefore, generate no interest rate
risk, as the securities issued by the vehicle company were entirely subscribed by the Bank
itself.
The Bank adopts robust methodologies for measuring risk, able to include all relevant
elements (risk exposure drivers and risk factors) in the light of its business model.
In terms of the risk factor profile, both parallel and non-parallel changes in interest rate
curves are considered, in both a deterministic (e.g. parallel shock on the interest rate curve
equal to an increase of 200 basis points) and probabilistic view (shock to the interest rate
curve corresponding to the 99th percentile of historical distribution).
In order to ensure exposure to interest rate risk by the banking book is always in line with the
Bank’s risk appetite - as defined in the Risk Appetite Framework - the operating and risk
control departments independently carry out monthly monitoring and, relative to certain types
of transactions (e.g. changes in the portfolio of securities owned), preventive impact analysis.

217
The risk control department also carries out stress test analyse to estimate potential adverse
consequences deriving from extreme but plausible market scenarios. Stress scenarios are
identified on the basis of the situation of financial markets and forecasts made by external
sources, taking into account the vulnerabilities associated with the Bank's business model.
Relative to price risk, the Bank has only negligible exposure, in that it holds only a non-
significant number of shares.
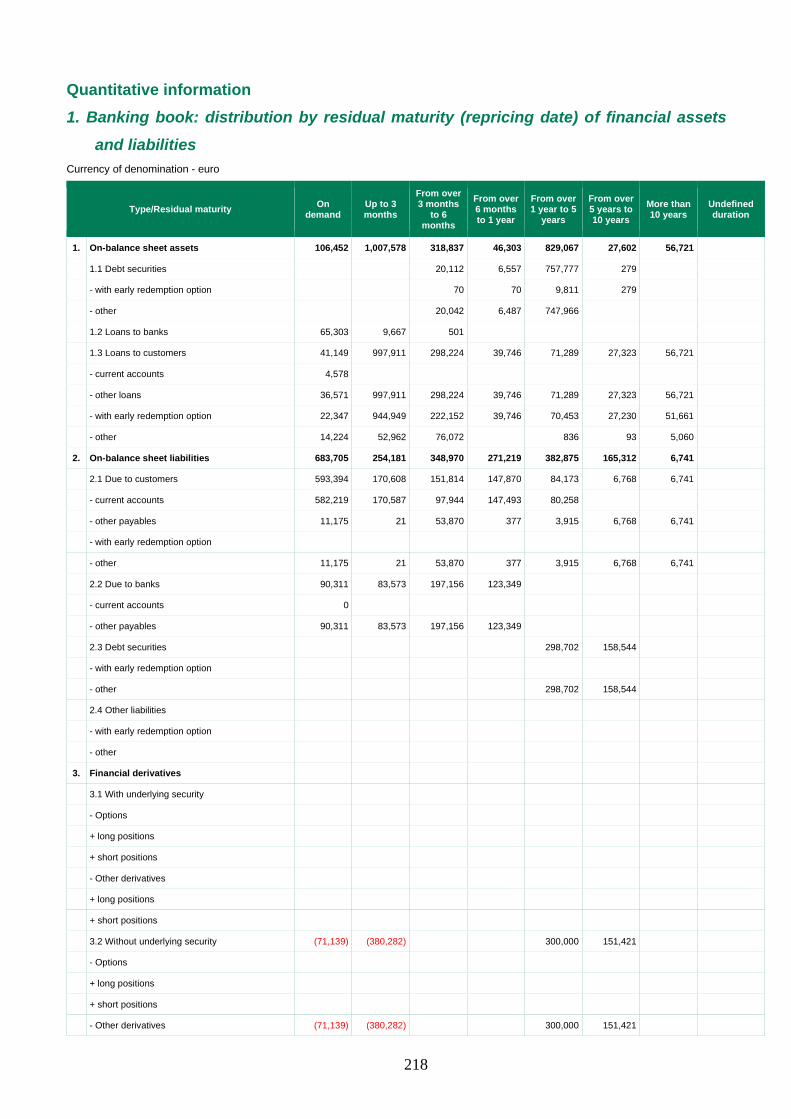
218
Quantitative information
1. Banking book: distribution by residual maturity (repricing date) of financial assets
and liabilities
Currency of denomination - euro
Type/Residual maturity On demand
Up to 3 months
From over 3 months
to 6 months
From over 6 months to 1 year
From over 1 year to 5
years
From over 5 years to 10 years
More than 10 years
Undefined duration
1. On-balance sheet assets 106,452 1,007,578 318,837 46,303 829,067 27,602 56,721
1.1 Debt securities 20,112 6,557 757,777 279
- with early redemption option 70 70 9,811 279
- other 20,042 6,487 747,966
1.2 Loans to banks 65,303 9,667 501
1.3 Loans to customers 41,149 997,911 298,224 39,746 71,289 27,323 56,721
- current accounts 4,578
- other loans 36,571 997,911 298,224 39,746 71,289 27,323 56,721
- with early redemption option 22,347 944,949 222,152 39,746 70,453 27,230 51,661
- other 14,224 52,962 76,072 836 93 5,060
2. On-balance sheet liabilities 683,705 254,181 348,970 271,219 382,875 165,312 6,741
2.1 Due to customers 593,394 170,608 151,814 147,870 84,173 6,768 6,741
- current accounts 582,219 170,587 97,944 147,493 80,258
- other payables 11,175 21 53,870 377 3,915 6,768 6,741
- with early redemption option
- other 11,175 21 53,870 377 3,915 6,768 6,741
2.2 Due to banks 90,311 83,573 197,156 123,349
- current accounts 0
- other payables 90,311 83,573 197,156 123,349
2.3 Debt securities 298,702 158,544
- with early redemption option
- other 298,702 158,544
2.4 Other liabilities
- with early redemption option
- other
3. Financial derivatives
3.1 With underlying security
- Options
+ long positions
+ short positions
- Other derivatives
+ long positions
+ short positions
3.2 Without underlying security (71,139) (380,282) 300,000 151,421
- Options
+ long positions
+ short positions
- Other derivatives (71,139) (380,282) 300,000 151,421

219
+ long positions 300,000 151,421
+ short positions 71,139 380,282
4. Other off balance sheet transactions
+ long positions 80,437 31,260 33,763
+ short positions 145,460

220
2.3 – Exchange rate risk
Qualitative information
A. Exchange-rate risk: general aspects, management procedures and measurement
methods
During financial year 2019 the Bank did not carry out transactions involving gold, nor did it
carry out foreign exchange transactions. At the end of the year, therefore, no transactions
were recognised in currencies other than the Euro which could generate exchange risk.
SECTION 3 - DERIVATIVES AND HEDGING POLICIES
3.1 - Derivatives for trading purposes
The bank does not carry out transactions involving derivatives for trading purposes.
A. Financial derivatives
3.2 – Recognised hedges
Qualitative information
A. Fair value hedging activities
In order to immunise the Bank’s economic value against the impact of changes in interest
rates on bond funding at zero coupon rates, each bond issue has been hedged by means of
an Interest Rate Swap derivative contract stipulated with a primary market counterparty.
Therefore, these positions can be classified as fair value hedges.
B. Cash flow hedges
There are no cash flow hedges.
C. Hedging of foreign investments
There are no hedges for foreign investments.
D. Hedging instruments
Each hedging instrument includes a receivable portion that precisely replicates the interest
accruing on bond issues and a payable portion indexed to the Euribor parameter plus a
spread, so as to perfectly compensate for variations in cash flows from the hedged element
due to variations in the rates.
E. Elements hedged

221
Given that the aim of the hedging transaction is to immunise the economic value of the
banking book from interest rate risk, the element hedges is not precisely the bond, but a
portion of it, represented by the component affected by the change in interest rates.
Verification of hedge effectiveness is done using the "hypothetical derivative" method,
represented by the derivative contract that would be stipulated in the (theoretical) absence of
counterpart risk. It consists in verifying that the change in the value of the hedged element
(hypothetical derivative), based on a conventional interest rate shock, is equal to the change
in the value of the hedging instrument (effective derivative). Any difference (ineffectiveness)
must be attributed entirely to the differenced between the fair market spread (hypothetical
derivative) and that effectively negotiated with the counterparty (effective derivative).

222
Quantitative information
A. Financial hedging derivatives
A.1 Financial hedging derivatives: notional values at end of period
Total 31.12.2019 Total 31.12.2018
Type of derivative Over the counter - Central
counterparties
Over the counter -Without central
counterparties - With
offsetting agreements
Over the counter -Without central
counterparties - Without offsetting
agreements
Organised markets
Over the counter - Central
counterparties
Over the counter -Without central
counterparties - With
offsetting agreements
Over the counter -Without central
counterparties - Without offsetting
agreements
Organised markets
1. Debt securities and interest rates 451,421 288,583
a) Options
b) Swaps 451,421 288,583
c) Forwards
d) Futures
e) Other
2. Equity securities and share indexes
a) Options
b) Swaps
c) Forwards
d) Futures
e) Other
3. Currencies and gold
a) Options
b) Swaps
c) Forwards
d) Futures
e) Other
4. Commodities
5. Other
Total 451,421 288,583

223
A.2 Financial hedging derivatives: positive and negative fair value – breakdown by
product
Positive and negative fair value - Total 31.12.2019
Positive and negative fair value - Total 31.12.2018
Change in value used to identify hedging ineffectiveness (*)
Type of derivative
Ov
er
the
co
un
ter
-
Cen
tra
l
co
un
terp
art
ies
Ov
er
the
co
un
ter
-
Wit
ho
ut
cen
tra
l
co
un
terp
art
ies
-
Wit
h o
ffs
ett
ing
ag
ree
me
nts
Ov
er
the
co
un
ter
-
Wit
ho
ut
cen
tra
l
co
un
terp
art
ies
-
Wit
ho
ut
off
se
ttin
g
ag
ree
me
nts
Org
an
ised
ma
rke
ts
Ov
er
the
co
un
ter
-
Cen
tra
l
co
un
terp
art
ies
Ov
er
the
co
un
ter
-
Wit
ho
ut
cen
tra
l
co
un
terp
art
ies
-
Wit
h o
ffs
ett
ing
ag
ree
me
nts
Ov
er
the
co
un
ter
-
Wit
ho
ut
cen
tra
l
co
un
terp
art
ies
-
Wit
ho
ut
off
se
ttin
g
ag
ree
me
nts
Org
an
ised
ma
rke
ts
To
tal
31
.12
.20
19
To
tal
31
.12
.20
18
1. Positive fair value 88,039 82,650
a) Options
b) Interest rate swaps 88,039 82,650
c) Cross currency swaps
d) Equity swaps
e) Forwards
f) Futures
g) Other
Total 88,039 82,650
Negative fair value (2,248)
a) Options
b) Interest rate swaps (2,248)
c) Cross currency swaps
d) Equity swaps
e) Forwards
f) Futures
g) Other
Total (2,248)
(*) The macro-hedging rules adopted by the Bank follow the dictates of IAS 39. Therefore,
the column "Change in value used to identify hedging ineffectiveness" is not completed.

224
A.3 OTC financial hedging derivatives: notional values, positive and negative fair value
by counterparty
Underlying assets Central counterparties Banks Other financial
companies Other subjects
Contracts not included in offsetting agreements
1) Debt securities and interest rates
- notional value
- positive fair value
- negative fair value
2) Equity securities and share indexes
- notional value
- positive fair value
- negative fair value
3) Currencies and gold
- notional value
- positive fair value
- negative fair value
4) Commodities
- notional value
- positive fair value
- negative fair value
5) Other
- notional value
- positive fair value
- negative fair value
Contracts included in offsetting agreements
1) Debt securities and interest rates
- notional value 451,421
- positive fair value 88,039
- negative fair value 2,248
2) Equity securities and share indexes
- notional value
- positive fair value
- negative fair value
3) Currencies and gold
- notional value
- positive fair value
- negative fair value
4) Commodities
- notional value
- positive fair value
- negative fair value
5) Other
- notional value

225
- positive fair value
- negative fair value
A.4 Residual life of OTC financial hedging derivatives: notional values
Underlying/Residual life Up to 1 year Over 1 year and up to 5 years More than 5 years Total
A.1 Financial derivatives on debt securities and interest rates 300,000 151,421 451,421
A.2 Financial derivatives on equity securities and stock indices
A.3 Financial derivatives on foreign currencies and gold
A.4 Financial derivatives on commodities
A.5 Other financial derivatives
Total 31.12.2019 300,000 151,421 451,421
Total 31.12.2018 145,702 142,881 288,583

226
3.3 – Other information on derivatives for trading and hedging
A. Financial and credit derivatives
A.1 OTC financial and credit derivatives: net fair values by counterparty
Central counterparties Banks Other financial
companies Other subjects
A. Financial derivatives
1) Debt securities and interest rates
- notional value 451,421
- positive fair value 88,039
- negative fair value 2,248
2) Equity securities and share indexes
- notional value
- positive fair value
- negative fair value
3) Currencies and gold
- notional value
- positive fair value
- negative fair value
4) Commodities
- notional value
- positive fair value
- negative fair value
5) Other
- notional value
- positive fair value
- negative fair value
B. B. Credit derivatives
1) Purchase and protection
- notional value
- positive fair value
- negative fair value
2) Sale and protection
- notional value
- positive fair value
- negative fair value
227
SECTION 4 - LIQUIDITY RISK
Qualitative information
A. Liquidity risk: general aspects, management processes and measurement methods
Liquidity risk, in general terms, means the risk of the Bank being unable to finance new loans
and/or to promptly comply with its own payment commitments. The liquidity risk governance
and management system is intended to avoid the development of certain conditions which
could give rise to this state of breach.
Exposure to liquidity risk depends initially on the specific business model (second level bank
focussed on business loans), which involves a low amount of retail deposits, at low cost and
stable over the medium/long term, which requires higher usage of transformation of
maturities and secured forms of funding in order to limit the cost of funding. Additionally,
management decisions with regards to instruments used to mitigate the risk are also
important. These include the qualitative/quantitative structure of liquidity reserves, the portion
of tied assets, and level of diversification for funding.
In relation to these aspects and risk factors which could impact expected cash flows, as part
of the International Liquidity Adequacy Assessment Process (ILAAP), the following types of
liquidity risk to which the Bank is exposed were identified:
a. contingency liquidity risk, with low significance;
b. mismatch liquidity risk, i.e. refinancing at unfavourable conditions, with high
significance;
c. market liquidity risk, i.e. risk of forced sale of securities or loans receivable at a price
lower than fair value, with low significance;
d. funding liquidity risk, i.e. risks associated with the structure of funding and
concentration of counterparties/technical forms/maturities having negative effects of
market propensity relative to the Bank's unsecured debt, with high significance;
e. asset encumbrance risk, i.e. risk associated with tied assets for guaranteed funding
operations having negative effects of market propensity relative to the Bank's
unsecured debt, with high significance.
In the face of these risks, the liquidity monitoring system is structured as follows.
• with regards to funding liquidity risk, contingency liquidity risk and market liquidity risk,
exposure to the risk is monitored jointly with the maturity ladder model, placing
expected cash flows and the counterbalancing capacity on a monthly calender and
calculating the cumulative balance for each maturity period. Scenario analysis involves
the introduction of stress hypotheses relative to non-renewal of short-term funding and

228
haircuts on liquidity reserves. Risk exposure is expressed in terms of days of survival
and, more specifically, using the Liquidity Coverage Ratio;
• exposure to funding liquidity risk is also measured in terms of deposit concentration by
technical form, counterparty and renewal date;
• exposure to mismatch liquidity risk is expressed as the percentage of illiquid assets
financed by stable deposits and, in particular, using the Net Stable Funding Ratio;
• for asset encumbrance risk, exposure to risk is expressed as the ratio between tied
assets and total assets;
• in terms of risk factors (monitoring of unfavourable events which could impact
expected cash flows), a system of early warning indicators is in effect, with the aim of
identifying events able to create liquidity stress or crises in advance.
The overall liquidity risk monitoring system involves daily checks carried out by:
• the Administration, Control and Finance Department - Treasury Area, for first level
controls assigned to the operating department that assumes the risk;
• by the Risk Management Department, for second level controls by a structure that is
separate and independent from the first.
In relation to the monitoring illustrated above, risk objectives, operating limits and attention
thresholds are defined which, in line with prudential regulations, represent the reference
measures for the implementation of the Risk Appetite Framework, Contingency Funding Plan
and Recovery Plan. In particular, in terms of escalation processes and options available in
crisis situations, specific rules are established in terms of expected cash flows over the short
term (3 months) and very short term (7 days), as well as with respect to the ratio between
liquid reserves and net outflows expected under stress conditions (Liquidity Coverage Ratio).
These indicators are also subject to prospective analysis when planning funding (funding
plan), in order to verify before the fact whether balance is maintained in line with the risk
appetite identified by the Board of Directors (Risk Appetite Framework).
The tables below show distribution according to term and currency of the assets and liabilities
at 31 December 2019.

229
Quantitative information
1. Distribution by maturity according to residual contractual term of financial assets
and liabilities
Currency of denomination: Euro
Items/Time frames
On
de
ma
nd
Fro
m o
ve
r 1
da
y t
o
7 d
ay
s
Fro
m o
ve
r 7
da
ys
to 1
5 d
ay
s
Fro
m o
ve
r 1
5 d
ay
s
to 1
mo
nth
Fro
m o
ve
r 1
mo
nth
to 3
mo
nth
s
Fro
m o
ve
r 3
mo
nth
s t
o 6
mo
nth
s
Fro
m o
ve
r 6
mo
nth
s t
o 1
ye
ar
Fro
m o
ve
r 1
ye
ar
to 5
ye
ars
Mo
re t
ha
n 5
ye
ars
Un
de
fin
ed
du
rati
on
A. On-balance sheet assets 76,997 10,901 4,079 69,233 82,595 183,737 157,924 1,296,123 494,880 9,674
A.1 Government securities 1,220 6,765 3,393 11,378 679,860
A.2 Other debt securities 248 304 642 571 38,286
A.3 Units in collective investment undertakings
A.4 Loans 76,997 10,901 2,859 69,233 75,582 180,040 145,904 615,692 456,594 9,674
- banks 65,358 501 9,674
- customers 11,639 10,901 2,859 69,233 75,582 179,539 145,904 615,692 456,594
B. On-balance sheet liabilities 683,739 42,043 1 100,555 72,877 311,583 293,654 441,536 167,609
B.1 Deposits and current accounts 582,219 100,551 70,316 98,401 148,613 80,000
- banks 0
- customers 582,219 100,551 70,316 98,401 148,613 80,000
B.2 Debt securities 4,500 300,000 151,421
B.3 Other liabilities 101,520 42,043 1 4 2,561 213,182 140,541 61,536 16,188
C. Off-balance sheet transactions (95,491) 1,786 2,685 64 26,887 64,070
C.1 Financial derivatives with exchange of principal
- long positions
- short positions
C.2 Financial derivatives without exchange of principal
- long positions
- short positions
C.3 Deposits and loans to be received
- long positions
- short positions
C.4 Irrevocable commitments to disburse funds (95,491) 1,786 2,685 64 26,887 64,070
- long positions 49,969 1,786 2,685 64 26,887 64,070
- short positions 145,460
C.5 Financial guarantees given
C.6 Financial guarantees received
C.7 Financial derivatives with exchange of principal
- long positions
- short positions
C.8 Financial derivatives without exchange of principal
- long positions
- short positions

230
SECTION 5 - OPERATIONAL RISKS
Qualitative information
A. General aspects, management processes and measurement methods
Operational risk is the risk of loss resulting from inadequate or failed internal processes,
people and systems, or from external events.
Such losses include, among others, those resulting from fraud, human error, the interruption
of operations, system non-availability, contractual default, natural disasters. Operational risk
also includes legal risk, while strategic risk and reputational risk are not included.
In consideration of the Bank's operations, exposure to operational risks is mainly associated
with business lending activities, particularly with reference to SMEs, and to operations
relative to the management of subsidised funds.
In terms of monitoring the main operational risk phenomena/events, the Bank makes use of
the Risk Self Assessment process, carried out with the contribution of all Bank structures,
coordinated by the Risk Management department. This provides a prospective assessment
of the main types of operational risks on the basis of estimates and judgements made by the
risk owner operating departments. In the organisational structure adopted by the Bank, the
unit responsible for controlling and gauging operational risks is the Risk Management
department, which makes use of the collaboration of all the structures concerned, in order to
identify the main initiatives of operational risk mitigation and to monitor their effective
implementation.
Quantitative information
In 2019 the Bank continued to acquire information on operational losses and to monitor the
events in progress, reporting quarterly to the Internal Controls and Risks Committee and to
the Company Boards on the capital requirement to cover operational risk. The amount of
provisions for operational risk at 31 December 2019 was around € 0.3 million, down with
respect to the previous year by around 0.2 million.
At 31 December 2019, the capital requirement for operational risks, calculated with the basic
approach contemplated by the Supervisory Instructions, amounted to € 13.3 million.

231
Part F – Information on capital

232
Section 1 – Capital
A. Qualitative information
The company’s Capital, broken down in detail in the following sections, is composed of share
capital, profit reserves, the valuation reserve related to the HTCS securities portfolio and the
defined-benefit plans.
It is subjected to constant monitoring carried out jointly by the Administration, Control and Finance
and Risk Management Departments, in order to check current and future adequacy, linked to
capital needs, connected with business development and in keeping with the risk appetite as
defined by the Board of Directors.
Internal capital management procedures also take into account the mandatory minimum capital
requirements set by the Supervisory Regulations (Basel III), which set two fundamental objectives:
• to strengthen banks’ ability to absorb the shocks deriving from financial and economic
stress;
• to increase transparency and disclosure to the public in relation to the risks that banks
assume.
To achieve the first objective, measures have been provided for that increase the quantity and
quality of the intermediaries capital endowment, through the application of additional reserves
compared with the minimum requirements (capital conservation reserves and countercyclical
supervisory instruments), rules on the management of liquidity risk and financial leverage (further
requirements needed to face short term liquidity risk, to maintain the long-term structural balance
and to contain financial leverage).
Additionally, implementing the EBA guidelines on the SREP, the Supervisory Authority periodically
reviews the capital requirements of individual banks in relation to their overall riskiness and the
results of the prudential control process. In particular, in relation to the three capital ratios provided
for in the legislation (CET1, Tier1 and TCR), as part of the SREP the Bank of Italy defines, for each
Bank subject to its direct supervision, the individual level of the following requirements:
• Total SREP capital ratio (TSCR) or binding requirement;
• Overall Capital Requirements (OCR) or total requirement;
• Pillar 2 guidance (P2G) or target requirement (where provided for).
Quantitative information

233
B.1 The Bank’s capital: breakdown
Item/Amount Amount 31.12.2019
Amount 31.12.2018
1. Share capital 204,509 204,509
2. Share premium reserve
3. Reserves 71,390 51,189
- of profits 71,390 51,189
a) legal 25,461 24,451
b) statutory
c) own shares
d) other 45,929 26,738
- other
3.5 Advances on dividends (-)
4. Equity instruments
5. (Own shares)
6. Valuation reserves (3,876) (10,517)
- Equity securities at fair value through other comprehensive income
Hedging of equity securities at fair value through other comprehensive income
- Financial assets (other than equity securities) measured at fair value through other comprehensive income (2,614) (9,526)
- Property, plant and equipment
- Intangible assets
- Hedging of foreign investments
- Cash flow hedges
- Hedging instruments (non-designated elements)
- Exchange differences
- Non-current assets and disposal groups held for sale
- Financial liabilities designated at fair value through profit and loss (changes in own credit standing)
- Actuarial gains (losses) on defined-benefit pension plans (1,262) (991)
- Portion of valuation reserves related to investees carried at equity
- Special revaluation laws
7. Profit (loss) for the year 22,519 20,201
Total 294,542 265,382

234
B.2 Valuation reserves for financial assets measured at fair value through other
comprehensive income: breakdown
Total 31.12.2019 Total 31.12.2018
Asset/Amount Positive reserve Negative reserve Positive reserve Negative reserve
1. Debt securities 46 (2,660) 29 (9,555)
2. Equity securities
3. Loans
Total 46 (2,660) 29 (9,555)
B.3 Valuation reserves for financial assets measured at fair value through other
comprehensive income: annual change
Debt securities Equity securities Loans
1. Opening balance (9,526)
2. Positive changes 15,755
2.1 Fair value increases 15,741
2.2 Net value adjustments for credit risk 14
2.3 Reversal to income statement of negative reserves from realisation
2.4 Transfers to other equity components (equity securities)
2.5 Other changes
3. Negative changes 8,842
3.1 Fair value decreases 2,793
3.2 Writebacks for credit risk
3.3 Reversal to income statement of positive reserves: for disposal 6,050
3.4 Transfers to other equity components (equity securities)
3.5 Other changes
4. Closing balance (2,614)
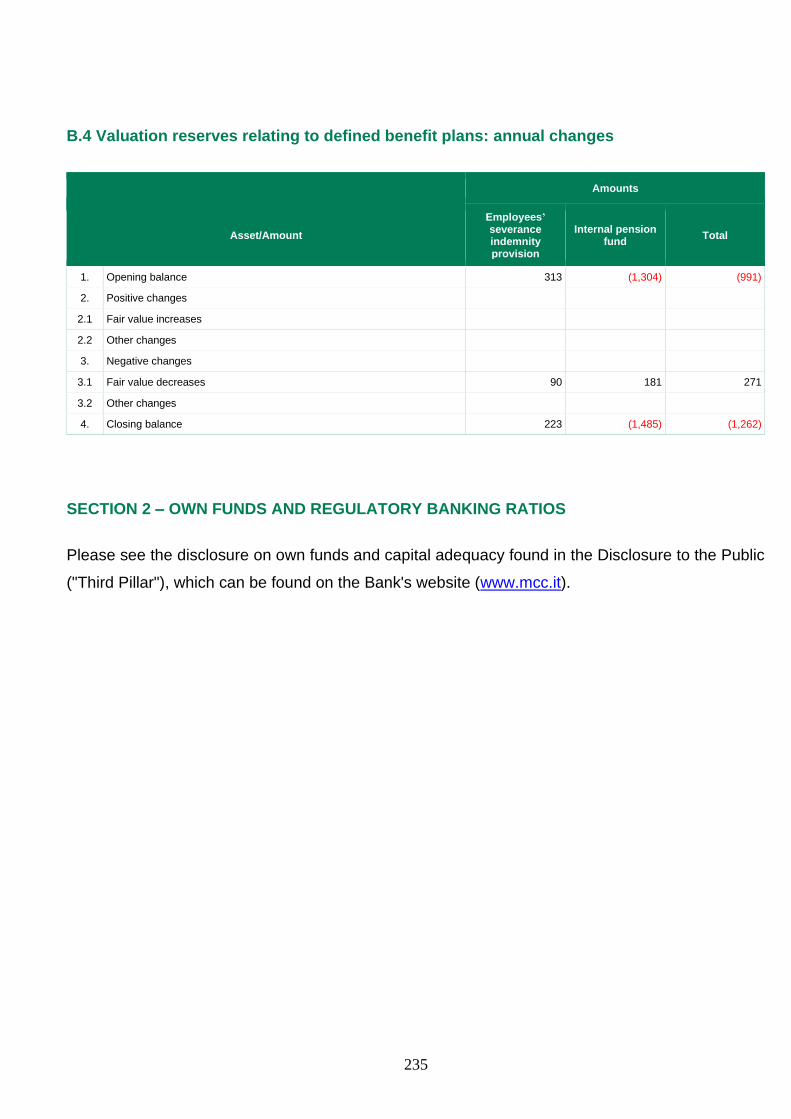
235
B.4 Valuation reserves relating to defined benefit plans: annual changes
Amounts
Asset/Amount
Employees’ severance indemnity provision
Internal pension fund Total
1. Opening balance 313 (1,304) (991)
2. Positive changes
2.1 Fair value increases
2.2 Other changes
3. Negative changes
3.1 Fair value decreases 90 181 271
3.2 Other changes
4. Closing balance 223 (1,485) (1,262)
SECTION 2 – OWN FUNDS AND REGULATORY BANKING RATIOS
Please see the disclosure on own funds and capital adequacy found in the Disclosure to the Public
("Third Pillar"), which can be found on the Bank's website (www.mcc.it).

236
Part H – Transactions with related parties

237
In relation to the provisions of IAS 24 the perimeter of related parties was identified as
including the following categories:
- the parent company, at 100%: Agenzia nazionale per l’attrazione degli investimenti
e lo sviluppo d’impresa S.p.A. (Invitalia S.p.A.);
- companies belonging to the Invitalia Group;
- companies which, directly or indirectly, hold stakes in the parent company such as
to exercise a considerable influence over the same;
- subjects who hold administrative, management and control positions - including the
Directors and Statutory Auditors of the Bank or its parent company (key
management personnel);
- companies controlled directly and/or indirectly, also jointly, by key management
personnel;
- companies subject to considerable influence on the part of key management
personnel, i.e. companies in which key management personnel directly or indirectly
hold a significant portion of the voting rights;
- the close family members of key management personnel and the entities which they
control, individually or jointly, or over which they exercise a considerable influence,
or which hold, directly or indirectly, a significant portion of the voting rights;
- Pension Funds for Bank employees.
Although the Bank applies the exemption contemplated by paragraph 25 of IAS 24 for
public entities, for the sake of standardisation in respect of the criteria adopted by the
Parent Company in the preparation of the consolidated financial statements full information
is given in the Bank’s separate financial statements on transactions with the Ministry of
Economic Development and the Ministry of the Economy and Finance and companies
controlled by said Ministries.
Information is given below concerning fees paid to key management personnel and
transactions with various types of related parties.
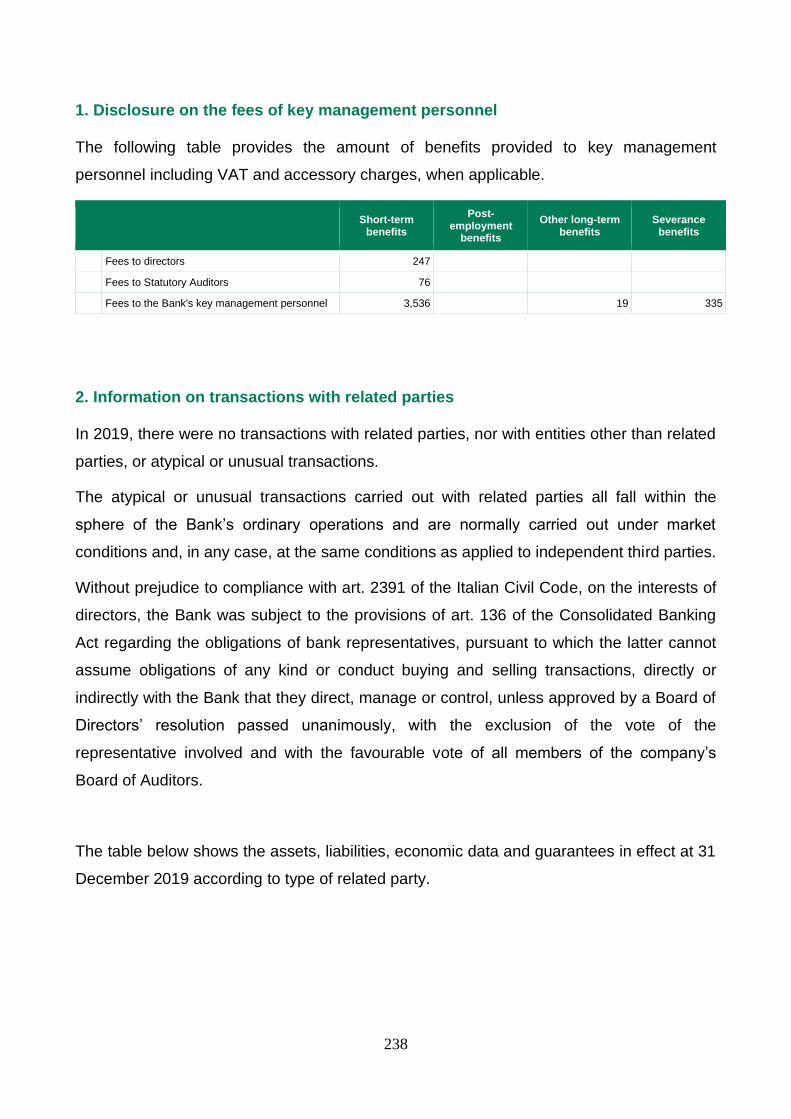
238
1. Disclosure on the fees of key management personnel
The following table provides the amount of benefits provided to key management
personnel including VAT and accessory charges, when applicable.
Short-term
benefits
Post-employment
benefits
Other long-term benefits
Severance benefits
Fees to directors 247
Fees to Statutory Auditors 76
Fees to the Bank's key management personnel 3,536 19 335
2. Information on transactions with related parties
In 2019, there were no transactions with related parties, nor with entities other than related
parties, or atypical or unusual transactions.
The atypical or unusual transactions carried out with related parties all fall within the
sphere of the Bank’s ordinary operations and are normally carried out under market
conditions and, in any case, at the same conditions as applied to independent third parties.
Without prejudice to compliance with art. 2391 of the Italian Civil Code, on the interests of
directors, the Bank was subject to the provisions of art. 136 of the Consolidated Banking
Act regarding the obligations of bank representatives, pursuant to which the latter cannot
assume obligations of any kind or conduct buying and selling transactions, directly or
indirectly with the Bank that they direct, manage or control, unless approved by a Board of
Directors’ resolution passed unanimously, with the exclusion of the vote of the
representative involved and with the favourable vote of all members of the company’s
Board of Auditors.
The table below shows the assets, liabilities, economic data and guarantees in effect at 31
December 2019 according to type of related party.

239
Assets Liabilities Income Statement Commitments
Due from Customers
Other assets
Due to customers
Other liabilities
Interest income
Interest expense
Personnel expenses
Other administrative
expenses
Commitments to disburse
funds
Agenzia nazionale per l’attrazione degli investimenti e lo sviluppo d’impresa S.p.A. (Invitalia S.p.A.)
438 85,767 1,769 534 194 66
Infratel Italia S.p.A. 69,070 215 12,000
Key Executives-Directors-Statutory Auditors
1,489 22
Assets Liabilities Income Statement Commitmen
ts
Due from Customer
s
Other asset
s
Due to customer
s
Other liabilitie
s
Interest
income
Fee and commission income
Interest expens
e
Fee and commission expense
Administrative expenses
Commitments to
disburse funds
Cassa Depositi e Prestiti S.p.A.
60,807 534
Enel S.p.A. 100,037 30
Fincantieri Cantieri Navali Italiani S.p.A.
1,184 93 10,000
Leonardo S.p.A.
37
Gruppo Poste Italiane S.p.A.
4,626 200,178 3,107 95 13 1,536
Rai Way S.p.A.
235 1
RAM Logistica Infrastrutture e Trasporti S.p.A.
7 20
Relative to the Ministry of Economy and Finance, note receivables of 47,000 relative to
expenses advanced by the Bank relative to its public subsidy management activity.
With regards to the Ministry of Economic Development, the bank holds receivables for
61,901 thousand relative to invoices issued or to be issued, relative to commissions
accrued relative to management of subsidised funds.
During 2019, the Bank received guarantees from SACE S.p.A. totalling € 7,724 thousand
and subscribed a two basket bonds with a nominal value of € 26 million, with a SACE
guarantee.

240
Amounts due from customers include without recourse factoring operations for € 8,481
thousand and 17,000 of interest income, relative to which the transferred debtors have
connections to our associated parties.
With regard to the complementary pension fund for Bank employees, contributions paid to
the Previgen pension fund totalled € 1,114 thousand.
Disclosure on the activity of management and coordination of companies
The Bank is subject to the management and coordination of the parent company Invitalia
S.p.A.
The essential information about the parent company, provided in the following summary
schedule as required by article 2497 bis of the Civil Code, was taken from the relative
annual financial statements, most recently approved at 31 December 2018.
For full and complete understanding of Invitalia S.p.A.'s equity and financial situation at 31
December 2018, as well as the results achieved by the company in the financial year
ending on said date, please read the financial statements which, accompanied by the
independent auditor’s report, are available in the form and using the methods envisaged
under the law.
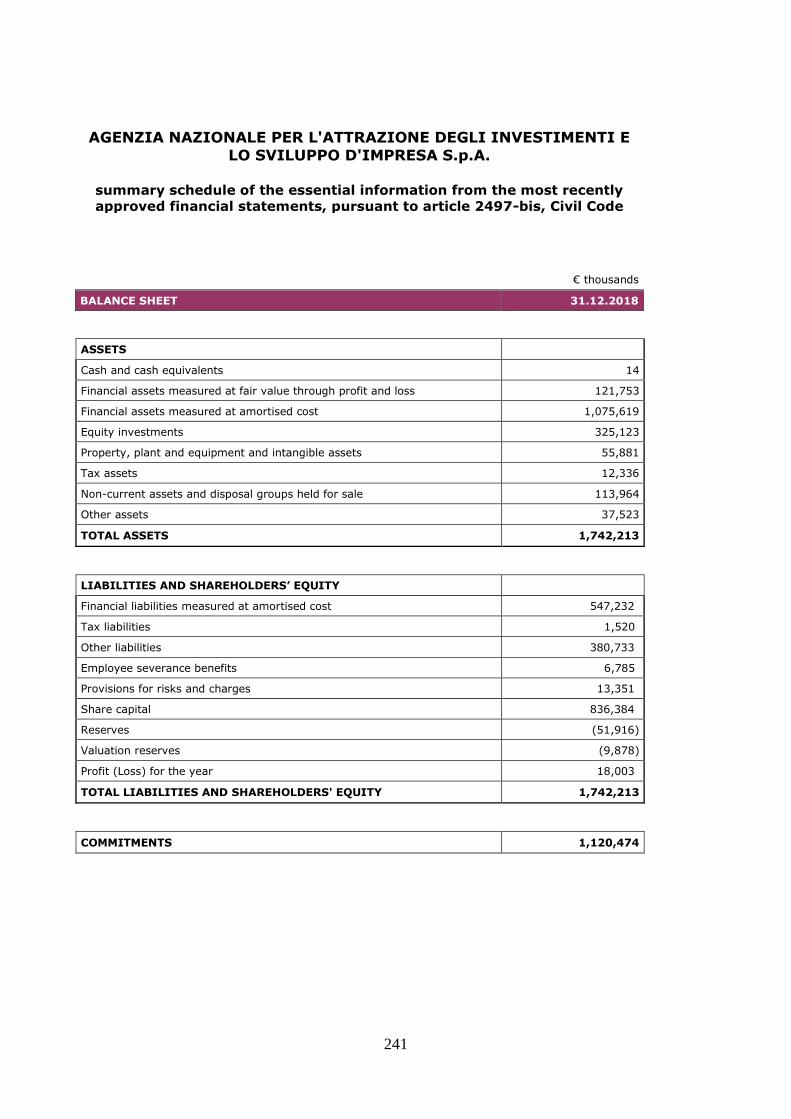
241
AGENZIA NAZIONALE PER L'ATTRAZIONE DEGLI INVESTIMENTI E
LO SVILUPPO D'IMPRESA S.p.A.
summary schedule of the essential information from the most recently
approved financial statements, pursuant to article 2497-bis, Civil Code
€ thousands
BALANCE SHEET 31.12.2018
ASSETS
Cash and cash equivalents 14
Financial assets measured at fair value through profit and loss 121,753
Financial assets measured at amortised cost 1,075,619
Equity investments 325,123
Property, plant and equipment and intangible assets 55,881
Tax assets 12,336
Non-current assets and disposal groups held for sale 113,964
Other assets 37,523
TOTAL ASSETS 1,742,213
LIABILITIES AND SHAREHOLDERS’ EQUITY
Financial liabilities measured at amortised cost 547,232
Tax liabilities 1,520
Other liabilities 380,733
Employee severance benefits 6,785
Provisions for risks and charges 13,351
Share capital 836,384
Reserves (51,916)
Valuation reserves (9,878)
Profit (Loss) for the year 18,003
TOTAL LIABILITIES AND SHAREHOLDERS' EQUITY 1,742,213
COMMITMENTS 1,120,474

242
INCOME STATEMENT 31.12.2018
ITEM
Net interest income (2,309)
Net fees and commissions 121,924
Dividends and similar income -
Net gains/(losses) on trading activities (506)
Net gains/(losses) on disposal or repurchase (16)
Net gains/(losses) of other financial assets and liabilities measured at fair value through profit and loss
399
Net value adjustments for credit risk (467)
Administrative expenses (123,410)
Net provisions for risks and charges (6,434)
Net value adjustments on property, plant and equipment (1,686)
Net value adjustments on intangible assets (2,869)
Other operating income/expense 24,576
Gains(losses) from equity investments 29,603
Income taxes for the period on continuing operations (1,993)
Profit (Loss) from discontinued operations after tax (18,811)
Profit (loss) for the period 18,003

243
Part L – Segment reporting

244
The segment reporting for the Bank is based on the elements that the management uses
to adopt its operating decisions (so-called management approach) and is therefore in
keeping with the disclosure requirements provided for in IFRS 8.
In the context of the activities related to achieving the targets set forth in the Business
Plan, the Bank’s organisational model is divided into two business segments: development
bank and service bank.
Attribution of the economic and financial results to the two business segments is based on
the accounting standards used for preparing and presenting the annual financial
statements.
For each segment subject to disclosure the result achieved is presented in terms of gross
profit from continuing operations.
Below are the main figures from the income statement and the equity aggregates, which
summarise the contributions from the two segments.
ECONOMIC RESULTS
(figures in thousands of euro)Lending
Management of
Subsidised FundsTotal Lending
Management of
Subsidised FundsTotal
NET BANKING AND INSURANCE INCOME 34,886 53,569 88,454 32,816 55,520 88,336
OPERATING PROFIT/(LOSS) 19,336 28,064 47,400 18,382 30,464 48,846
Net value adjustments on receivables and on provisions for guarantees and commitments (16,836) 621 (16,216) (27,518) 744 (26,774)
NET OPERATING PROFIT/(LOSS) 2,500 28,685 31,185 (9,136) 31,208 22,072
GROSS PROFIT ON CONTINUING OPERATIONS 737 28,394 29,132 (8,173) 32,323 24,151
Income taxes (6,613) (3,949)
NET INCOME FOR THE PERIOD 22,519 20,202
OTHER INFORMATION
(figures in thousands of euro)Lending
Management of
Subsidised FundsTotal Lending
Management of
Subsidised FundsTotal
Loan brokerage:
loans and advances to customers and banks 2,692 6,982 1,644,593 0 0 0
Management of Public Funds:
funds of third parties under management, recognised under separate accounting (*) 5,521,652 5,593,051
of which: Guarantee Fund Italian Law 662/96 5,319,080 5,310,083
___________________________________
(*) See Part B of the Notes to the Financial Statements -“Management and intermediation services for third parties”
31/12/2019 31/12/2018
31/12/2019 31/12/2018

245
Part M – Leasing information

246
Section 1 – Lessee
Qualitative information
The Bank has stipulated real estate leasing contracts in the role of lessee relative to:
- the property in Rome, Viale America 351, which holds the Bank’s registered offices;
- the properties which hold its representation offices in Milan, Pescara, Naples, Bari
and Catania.
Additionally, there are 16 long-term rental contracts for company cars, with durations of 2
or 3 years.
Leasing contracts with durations of less than 12 months or of modest value are recognised
without the recognition of a right of use, instead allocating the costs relative to the rent
under administrative expenses, using the economic accrual principle.
Quantitative information
For information about rights of use acquired through leasing, please see Part B - Section 8
- Property, plant and equipment - Item 80 of these Notes.
For information about leasing payables, please see that found in Part B - Section 1 -
Financial liabilities measured at amortised cost - Item 10 of these Notes.
For information about interest expense on leasing payables and other charges associated
with the rights of use acquired through leases, please see Part C - Section 1 - Interest -
Item 20 and Section 12 - Net value adjustments on property, plant and equipment - Item
180 of these Notes.
247
Country-by-country reporting (Art. 89 Directive 2013/36/EU)

248
Country-by-country reporting (Art. 89 Directive 2013/36/EU)
Mediocredito Centrale carries on its business exclusively in Italy.
The Bank operates two lines of activity: development bank and service bank.
At 31 December 2019 we can note the following information:

249
Certification of the Annual Financial Statements pursuant to article 81-ter of CONSOB Regulation
11971 of 14 May 1999, as amended

250
Attestation of the separate financial statements pursuant to article 81 – ter of CONSOB Regulation 11971 of 14 May 1999
as amended
1. The undersigned, Bernardo Mattarella, in his capacity as Chief Executive Officer of Mediocredito Centrale S.p.A., and Elena De Gennaro, in her capacity as Financial Reporting Manager of Mediocredito Centrale S.p.A., attest, taking into account also the provisions of article 154-bis, paragraphs 3 and 4, of Italian Legislative Decree no. 58 of 24 February 1998:
• the adequacy in relation to the characteristics of the business, and • the effective application
of the administrative and accounting procedures for preparing the separate financial statements during 2019.
2. Verification of the adequacy and effective application of the administrative and accounting procedures for preparing the financial statements at 31 December 2019 was carried out on the basis of methods defined by Mediocredito Centrale S.p.A. in keeping with the COSO and, for the IT component, COBIT models, which constitute the framework of reference for the internal reference system generally accepted at the international level16.
In consideration of the gradual implementation of processes and, taking into account the evolution of the relevant legislation on the banking sector and the industrial strategies, the design and effective operation of the Bank’s administrative and accounting procedures remain the subject of further evolution and monitoring.
3. The undersigned attest, in addition, that
3.1 the separate financial statements:
a) have been drawn up in accordance with the applicable international accounting standards recognised in the European Community pursuant to Regulation (EC) no. 1606/2002 of the European Parliament and of the Council of 19 July 2002;
b) correspond with the entries in the accounting ledgers and documents;
c) are capable of providing a true and correct representation of the issuer’s equity, economic and financial situation.
3.2 the report on operations includes a reliable analysis of performance and of the operating result, and of the issuer’s situation, together with a description of the main risks and uncertainties to which it is exposed.
Rome, 24 February 2020
The Chief Executive Officer The Financial Reporting Manager
Bernardo Mattarella Elena De Gennaro
16 The COSO Framework was prepared by the Committee of Sponsoring Organizations of the Treadway Commission, an American
organisation which has the objective of improving the quality of financial disclosure, by defining ethical standards and an effective system of corporate governance and organisation. The COBIT Framework - Control Objectives for IT and related technology is a set of rules prepared by the IT Governance Institute, an American organisation which has the objective of defining and improving corporate standards in the IT sector.

1
Report of the Board of Statutory Auditors to the Shareholders' Meeting
To the Sole Shareholder
INVITALIA S.p.A.
Relative to that specifically assigned to us, fulfilling our duties, pursuant to Articles 2403 and 2429 of
the Italian Civil Code and to Article 153 of Italian Legislative Decree 58/1998, we submit our report on
the activities performed during financial year 2019.
The Board of Statutory Auditors has viewed the financial statements at 31.12.2019 prepared by the
Directors and sent to us by them together with the Report on Operations.
In compliance with that prescribed under the regulations in effect, we submit this document to your
attention.
The current members of the Board of Statutory Auditors were appointed by the Shareholders'
Meeting held on 19 April 2018.
Report of the Board of Statutory Auditors pursuant to Article 2429 of the Italian Civil Code
During financial year 2019, the Board of Statutory Auditors fulfilled its institutional responsibilities in
compliance with the Civil Code, with Legislative Decree 385/1993 (Consolidated Law on Banking) and
Legislative Decree 58/1998 (Consolidated Law on Finance), the By-laws and provisions issued by the
supervisory and control authorities, also taking into account the behavioural standards recommended
by the National Council of Chartered Accountants and Accounting Experts.
In particular, on the basis of the activities carried out during the financial year ending on 31 December
2019, we can note the following.
The activities of the company bodies were performed in compliance with the provisions of the law
and of the By-laws which govern their functioning. Participation of members of the Board of Statutory
Auditors in Shareholders' Meetings and Board of Directors meetings can be seen in the respective
minutes.
In 2019, the Board of Directors met 18 times and the Board of Statutory Auditors met 16 times.
As regards compliance with the regulatory provisions that govern banking activity, the Board of
Statutory Auditors has no findings to note.
Observations on compliance with standards of proper administration
The Chairman and the Chief Executive Officer, as well as the managers of the audit departments and
the Financial Reporting Manager, each of which for their assigned responsibilities, periodically

2
reported to the Board of Statutory Auditors on general management trends, foreseeable
developments and transactions of significance carried out by the Bank, whether due to size or
characteristics, as well as on the safeguards implemented to guarantee compliance with the law,
regulations and internal policies and on the results of the activities performed.
On the basis of the information gathered in carrying out its responsibilities, the Board of Statutory
Auditors can reasonably report that the activities carried out by the Directors complied with
"principles of proper administration". In particular, during the financial year in question the Directors
did not carry out imprudent or reckless transactions, such as to compromise equity integrity, nor
transactions in contrast to the company purpose, nor atypical and/or unusual transactions, either with
third parties or with related parties, such as to significantly impact the Bank's equity and financial
situation.
The Board of Statutory Auditors also monitored compliance with the norms established in Regulations
EU 575/2013 and 241/2014, as well as with article 56 of Legislative Decree 385/1993, both with
regards to the maintenance of prescribed thresholds and in accordance with the guidance received as
a result of the Supervisory Review and Evaluation Process (SREP) and with the risk appetite established
in the Risk Appetite Framework (RAF).
The Board of Statutory Auditors assessed and monitored the adequacy of the risk management and
control system, verifying the effective monitoring by the assigned department of the Bank's risk
profile, and compliance with capacity, tolerance and appetite thresholds.
Relative to capital requirements, at 31.12.2019 CET1, Tier 1 and the total capital ratio (TCR) were equal
to 20.36%, showing further improvement over the figures the previous year and well over the target
threshold of 15.5% set for TCR and the RAF approved by the Board of Directors.
The Board also continued to implement the NPL Reduction Plan and further increased the coverage
level for significant exposures. The impact of the impaired portfolio relative to the value of the due
from customers item fell from 4.7% to 3.7% and the coverage rate rose to 60%, from 53.3% at the end
of 2018.
Relative to the implementation of the 2018-2020 business plan and, in particular, the development
guidelines identified, note that during 2019 the Bank, as requested by the Bank of Italy, carried out an
assessment of the actual efficacy of solutions adopted. Consequently it further modified the
governance and organisational structure of the commercial sector, eliminating the General
Commercial Department established in 2018 and redistributing the functions. In 2019 the Bank’s
commercial activities were mainly focussed on small and medium enterprises in southern Italy, carried
out through a wide array of products, with loans also made in synergy with other local players.

3
Activities to support the commercial development of SME was carried out both by Level II bank
activities, making use of local partnerships, both in B2C mode and through the use and development
of the web portal.
To that end, as noted in the Directors’ Report under “Significant subsequent events” and as reported
in the auditors’ report, it is necessary to state that “as of the date these financial statements were
approved, the disease COVID-19 ( coronavirus), which originated in China, was spreading throughout
Italy. Given the exceptional situation seeing rapid developments, and considering the two activity lines
around which MCC's business operates, it is foreseeable that companies and especially SME, the Bank’s
target customers, will be affected by the possible long-term duration of the epidemic. In this sense, it
will be fundamental to consider possible extraordinary support projects, both national and EU-wide,
political, economic and financial. These are currently being discussed, as well as the implementation
of adequate and targeted actions to, if necessary, support and calm the markets while assisting
businesses lacking liquidity (especially SME). Also in terms of the possible worsening of the
creditworthiness of borrower companies or companies who will be borrowing, as well as the system to
which the Bank belongs, only in the coming weeks will it be possible to assess possible impacts, also in
the light of regulatory and legislative actions which may be issued. Therefore, at present the impacts
on Bank business associated with the disease cannot yet be foreseen. The Bank guarantees compliance
with the provisions issued by the relevant authorities, prioritising the requirements to protect its staff
and institutional needs for continuation provision of services.”
Information on intragroup and related-party transactions and on conflicts of interest
Information about transactions with related parties was provided in the Notes to the Financial
Statements in compliance with the regulations in effect.
The Board of Statutory Auditors also monitored the overall suitability of the relevant internal
procedures in terms of risk management and conflicts of interest with related parties. Following up
on that indicated in the report the previous year, note that the Bank, with resolutions made by the
Board of Directors on 19 December 2019, after receiving a favourable opinion from the Board of
Statutory Auditors, updated its Policy for managing related party transactions, based on that
established in Bank of Italy Circular no. 263, Title V, Chap. 5, Section VI, paragraph 1 and its Policy on
conflicts of interest.
With reference to Decree Law 201/2011, converted with amendments by Law 214/2011, which
introduced a prohibition on holders of roles on bank management and control bodies from taking on
or exercising similar roles with competitor businesses (interlocking), the Board of Statutory Auditors

4
notes that no corporate representative of the Bank had issues of incompatibility in relation to said
regulations, on the basis of the annual check performed regarding positions held.
The Board of Statutory Auditors also notes that the Bank carried out its annual verification ascertaining
the independence requirements held by the Chairperson of the Board of Directors.
Exchange of information with the Oversight Committee pursuant to Legislative Decree 231/2001
After the expiration of the term of the previous Board of Statutory Auditors, the Board of Directors,
with a resolution made on 19 April 2018, assigned the Oversight Committee function pursuant to
Legislative Decree 231/2001 to an ad hoc organisation, rather than to the Board of Statutory Auditors
as had been done previously and established as a general norm by the Bank of Italy. During 2019 the
Board of Statutory Auditors met with the Oversight Committee which did not report any significant
irregularities or problems, as is confirmed in the Committee's half yearly reports, as well as the reports
issued by Internal Audit on its audits, also pursuant to Legislative Decree 231/2001.
Observations on out-sourced activities
Pursuant to Bank of Italy Circular 285, the Board of Statutory Auditors monitored externalised
departments, the IT system and the company as a going concern. On this point, we note that the
examination of organisational/procedural safeguards and the result of the tests carried out relative to
Business Continuity procedures and Disaster Recovery systems with the outsourcers Poste Italiane
and Cedacri by the Internal Audit department ended with good results for both processes. The 2019
Annual Report on controls for important outsourced operating functions is not yet available, which
contains the assessments of the adequacy of the organisational and control safeguards implemented.
It must be presented to the Regulatory Authority by 30 April 2020.
Observations on the adequacy of the organisation structure
The Board of Statutory Auditors acquired knowledge and monitored, to the extent of its
responsibilities, the adequacy and functioning of the Bank's organisational structure, also by collecting
information from the managers of the Bank's various internal departments and, to that end, has no
observations.
Observations on the adequacy of the administrative accounting structure
The Board of Statutory Auditors also acquired knowledge and monitored, relative to its
responsibilities, the adequacy and functioning of the administrative/accounting system, as well as the
reliability of the same in representing management events, through constant information received
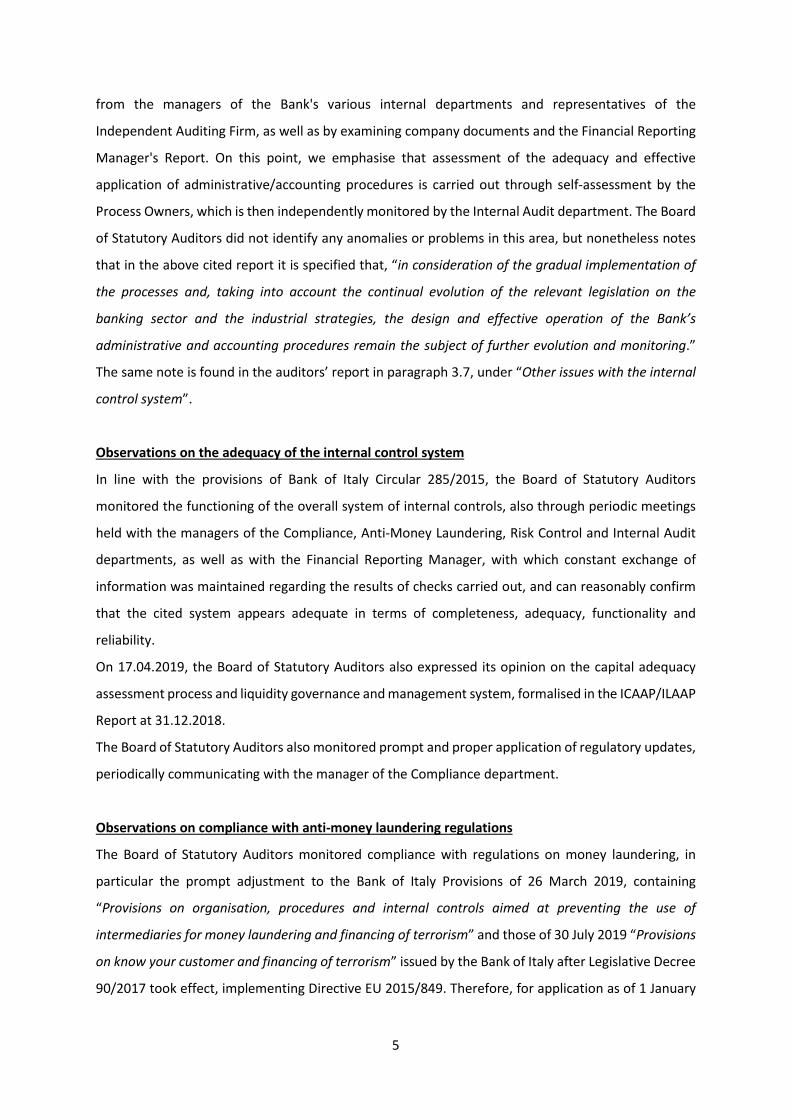
5
from the managers of the Bank's various internal departments and representatives of the
Independent Auditing Firm, as well as by examining company documents and the Financial Reporting
Manager's Report. On this point, we emphasise that assessment of the adequacy and effective
application of administrative/accounting procedures is carried out through self-assessment by the
Process Owners, which is then independently monitored by the Internal Audit department. The Board
of Statutory Auditors did not identify any anomalies or problems in this area, but nonetheless notes
that in the above cited report it is specified that, “in consideration of the gradual implementation of
the processes and, taking into account the continual evolution of the relevant legislation on the
banking sector and the industrial strategies, the design and effective operation of the Bank’s
administrative and accounting procedures remain the subject of further evolution and monitoring.”
The same note is found in the auditors’ report in paragraph 3.7, under “Other issues with the internal
control system”.
Observations on the adequacy of the internal control system
In line with the provisions of Bank of Italy Circular 285/2015, the Board of Statutory Auditors
monitored the functioning of the overall system of internal controls, also through periodic meetings
held with the managers of the Compliance, Anti-Money Laundering, Risk Control and Internal Audit
departments, as well as with the Financial Reporting Manager, with which constant exchange of
information was maintained regarding the results of checks carried out, and can reasonably confirm
that the cited system appears adequate in terms of completeness, adequacy, functionality and
reliability.
On 17.04.2019, the Board of Statutory Auditors also expressed its opinion on the capital adequacy
assessment process and liquidity governance and management system, formalised in the ICAAP/ILAAP
Report at 31.12.2018.
The Board of Statutory Auditors also monitored prompt and proper application of regulatory updates,
periodically communicating with the manager of the Compliance department.
Observations on compliance with anti-money laundering regulations
The Board of Statutory Auditors monitored compliance with regulations on money laundering, in
particular the prompt adjustment to the Bank of Italy Provisions of 26 March 2019, containing
“Provisions on organisation, procedures and internal controls aimed at preventing the use of
intermediaries for money laundering and financing of terrorism” and those of 30 July 2019 “Provisions
on know your customer and financing of terrorism” issued by the Bank of Italy after Legislative Decree
90/2017 took effect, implementing Directive EU 2015/849. Therefore, for application as of 1 January

6
2020, the new version of the “Anti-money laundering and anti-terrorism procedure (regulatory and
operating aspects)” was prepared.
Observations on remuneration policies
With assistance from the Internal Audit department, the Board of Statutory Auditors also verified,
with reference to the members of the Board of Directors and for employees, whether the
remuneration policies adopted by the Bank were in line with the policies approved by the company
bodies and the regulatory provisions.
Transition to international accounting standard IFRS 9 and IFRS 16
During 2019, the Board of Statutory Auditors also obtained information about the adoption of
accounting standard IFRS 9 from the relative company departments and, in particular from the
auditing firm. As of 1 January 2018, this standard replaced the IAS 39 impairment model based on
sustained loss, with a measurement model using expected credit losses. Analysis of the 2019 financial
statements done by PricewaterhouseCoopers SpA confirmed that the Bank has a procedural approach
in line with the accounting standard and the best practices adopted by “less significant” banks, also
taking into account the special characteristics of the Bank itself and the principle of proportionality.
In 2019, international accounting standard IFRS16 – Leasing was applied for the first time, which for
the lessee requires that leased assets, even those involving operating leases, be recognised under the
assets with a financial liability as a balancing entry. Methods for first time application are described in
paragraph 3.1 of the auditing firm’s report on the 2019 financial statements.
Observations on the Reports from the Auditing Firm and its independence
Legislative Decree 135/2016 establishes that European Regulation 537/2014 applies in its entirety to
entities of public interest. Pursuant to paragraph 2, letter a of article 6 of cited European Regulation
537/2014 and that required under paragraph 17 of Auditing Standard (ISA Italy) 260, the Board of
Statutory Auditors received the annual confirmation of independence from the Independent Auditing
Firm, which specifies that in the period between 01 January 2019 and the present date the firm
complied with the ethical principles pursuant to articles 9 and 9-bis of Legislative Decree 39/2010 and
that no situations arose that would compromise the firm's independence pursuant to Articles 10 and
17 of the same Legislative Decree 39/2010 and to Articles 4 and 5 of European Regulation 537/2014.
During 2019, as a service correlated with the audit, the auditing firm PricewaterhouseCoopers SpA
was appointed to issue comfort letters as part of the Euro Medium Term Note (EMTN) program for
the Company, for a fee of € 60,000.
7
To the extent of its responsibilities, the Board of Statutory Auditors confirms that it is not aware of
any problems with regards to the independence of the Auditing Firm, nor, as of the present date, of
any additional tasks assigned to it other than that granted by the Shareholders' Meeting.
The Board of Statutory Auditors has received the Independent Auditing Firm's Report, pursuant to
Article 11 of European Regulation 537/2014. The report specifies that, during the course of the normal
auditing of the financial statements, no problems were identified in the internal control system with
regards to the financial reporting process which, based on the professional judgement of the auditing
firm, would have been sufficiently important to bring to the attention of the Board of Statutory
Auditors in its role as the Internal Control and Audit Committee.
The same report also confirms that, again during the normal course of auditing the annual Financial
Statements, the use of the assumption of the Bank as a going concern is appropriate and that no cases
of fraud or suspected fraud were identified, nor were any non-compliances relative to laws,
regulations or statutory provisions.
Additionally, on 9 March 2020, the Board of Statutory Auditors received the report from the auditing
firm, pursuant to article 14 of Legislative Decree 39 of 27 January 2010 and Article 10 of Regulation
EU 537/2014, which specifies that the financial statements at 31 December 2019 provide a true and
accurate representation of the equity and financial situation of Banca del Mezzogiorno – Mediocredito
Centrale SpA, and of the economic results and cash flows for the year ending on said date, in
compliance with the International Financial Reporting Standards adopted by the European Union, as
well as the provisions issued implementing Article 9 of Legislative Decree 38/2005 and article 43 of
Legislative Decree 136/2015. Additionally, the same report confirms that the Report an Operations
and other specific information contained in the report on corporate governance and the stockholding
structure are in line with the annual financial statements and prepared in compliance with the law.
Other information
As of the date of this report, no complaints or reports have been received relative to Article 2408 of
the Civil Code.
During the year the Bank received 12 complaints, all of which relative to lending activities, while none
were received relative to management of public subsidies. The average response time was 19 days
(24 in 2018) and 6 complaints were accepted as they were deemed to be grounded. Also note that
with respect to complaints processed from 2015-2019, three judgements were issued against the
Bank, of which two still in course and one settled. Additionally, six mediation procedures were begun
relative to which the Bank has filed its briefs, stating the appropriateness of its actions and indicating
the reasons it did not wish to adhere to the mediation request. Additionally, 6 complaints were
8
presented to the Banking and Financial Ombudsman (ABF), of which 3 were deemed grounded and 1
rejected. Of the others, for one the issue of dispute ceased to exist and for the remaining case the
ABF’s decision has not yet been issued.
During 2019, the Board of Statutory Auditors issued the opinions as required under current law.
The Board of Statutory Auditors monitored compliance with the principle of support to the economy
of the South prevailing, as envisaged in the By-laws and Articles of Association. Ample information on
this subject is provided in the Report on Operations, to which the reader is referred.
During the year, the Board of Statutory Auditors performed the activities required under Article 19 of
Legislative Decree 39/2010, as updated by Legislative Decree 135/2016 implementing Directive EU
56/2014, through meetings with the Independent Auditing Firm, examination of the audit plan and
auditing approach used for each area of the financial statements, and of the relative risks associated
with the various audit activities. No issues emerged during these meetings worthy of note in this
Report.
***
The Board of Statutory Auditors has examined the financial statements at 31 December 2019,
approved by the Board of Directors at its meeting on 24 February 2020, and then made available.
To that end, note that the sole shareholder Invitalia SpA, with a notification sent on 5 March 2020,
expressly renounced the legal terms for the filing of the auditing firm’s report and that of the Board
of Statutory Auditors, given that between the date on which the draft financial statements were
approved and that of the first call of the Shareholders' Meeting for approval of the financial
statements at 31 December 2019 the minimum period required under article 2429 of the Civil Code
and under article 154 ter of Legislative Decree 58/98 will not pass.
As the Board of Statutory Auditors is not responsible for statutory auditing of the financial statements,
in fulfilling its duties it monitored, to the extent of its responsibilities, compliance by the Directors
with the norms of the Civil Code and the provisions issued by the Supervisory Authorities relative to
the preparation of financial statements.
As regards this, we can certify that:
• the Board of Statutory Auditors verified the consistency of the financial statements relative to
the events and information it is aware of following the execution of its duties, and has not
particular observations on the matter.
Conclusions
On the basis of all that specified in this Report, taking into account the content of the reports issued
by the Independent Auditing Firm PricewaterhouseCoopers SpA pursuant to Articles 10 and 11 of
European Regulation 537/2014 and acknowledging the certifications jointly issued by the Chief

9
Executive Officer and the Financial Reporting Manager, the Board of Statutory Auditors agrees, to the
extent of its responsibilities, with the proposal made by the Directors relative to approval of the
financial statements at 31 December 2019 and to destination of the profits for the year, of
€ 22,518,990.
Rome, 9 March 2020
The Chairman Regular Auditor Regular Auditor
(Paolo Palombelli) (Carlo Ferocino) (Marcella Galvani)

Independent auditor’s report in accordance with article 14 of Legislative Decree No. 39 of 27 January 2010 and article 10 of Regulation (EU) No. 537/2014 Mediocredito Centrale SpA Financial Statements as of 31 December 2019

Independent auditor’s report in accordance with article 14 of Legislative Decree No. 39 of 27 January 2010 and article 10 of Regulation (EU) No. 537/2014 To the Sole Shareholder of Mediocredito Centrale SpA Report on the Audit of the Financial Statements Opinion We have audited the financial statements of Mediocredito Centrale SpA (the “Company” or the “Bank”), which comprise the balance sheet as of 31 December 2019, the income statement, statement of comprehensive income, statement of changes in shareholders’ equity, statement of cash flows for the year then ended, and notes to the financial statements, including a summary of significant accounting policies. In our opinion, the financial statements give a true and fair view of the financial position of the Company as of 31 December 2019, and of the result of its operations and cash flows for the year then ended in accordance with International Financial Reporting Standards as adopted by the European Union, as well as with the regulations issued to implement article 9 of Legislative Decree No. 38/05 and article 43 of Legislative Decree No. 136/15. Basis for Opinion We conducted our audit in accordance with International Standards on Auditing (ISA Italia). Our responsibilities under those standards are further described in the Auditor’s Responsibilities for the Audit of the Financial Statements section of this report. We are independent of the Company pursuant to the regulations and standards on ethics and independence applicable to audits of financial statements under Italian law. We believe that the audit evidence we have obtained is sufficient and appropriate to provide a basis for our opinion. Key Audit Matters Key audit matters are those matters that, in our professional judgment, were of most significance in our audit of the financial statements of the current period. These matters were addressed in the context of our audit of the financial statements as a whole, and in forming our opinion thereon, and we do not provide a separate opinion on these matters.

2 of 6
Key Audit Matters Auditing procedures performed in response to key audit matters
Evaluation of loans and advances to customers for loans measured at amortised cost Notes to the financial statements Part A - Accounting policies - A.2 – Financial statements items - 3. Financial assets measured at amortised cost Part B - Information on the balance sheet – Section 4 – Financial assets measured at amortised cost – Item 40 Part C - Information on the income statement – Section 8 – Net value adjustments for credit risk – Item 130 Part E – Information on risks and relative hedging policies - 3. Impaired credit exposures Loans and advances to customers, classified within item "Financial assets measured at amortised cost”, as of 31 December 2019 amounted to Euro 1,559 million, equal to about 62 per cent of total assets. The net adjustments for the impairment of loans resulting from the income statement as of 31 December 2019 amounted to Euro 15.9 million. The adjustments to loans and advances to customers represent the best estimate expressed by the management of Mediocredito Centrale SpA, in order to reflect expected losses on the loan portfolio as at the reporting date according to the applicable accounting standards. These adjustments are calculated on an analytical basis as concerns the non-performing loans that are considered significant individually
In performing our audit we took into consideration the internal control relevant to the preparation of the financial statements in order to define appropriate audit procedures in the circumstances. Specifically, in order to address this key audit matter, we obtained an understanding and assessed the design of the key controls within the monitoring, classification and assessment of loans and the testing of the operating efficacy of such controls.
Special attention was paid, also with the support of our PwC network experts, to understanding and testing the appropriateness of the policies, procedures and models used to measure the SICR and for the Staging, to measure the ECL on both a collective and analytical basis, as well as to the methods to determine and estimate the main parameters used in the context of the defined models.
In particular, regarding loans classified as non-impaired (Stage 1 and Stage 2), in addition to verifying the correct application of the measurement criterion established, specific tests were performed in relation to the determination and application of the main estimate parameters within the models used, together with the completeness and accuracy of the data bases utilised to calculate the ECL. Moreover, we selected a sample of loans and verified their reasonable classification among non-impaired loans based on available information about the debtor’s status and other useful items of evidence, including external information. In respect of impaired loans (Stage 3), specific

3 of 6
(Stage 3) and on a collective basis as regards all the other loans grouped in uniform categories (Stage 1 and 2). As part of our audit work, we paid special attention to the evaluation of these loans taking account of the significance of their book value. From another perspective, the evaluation processes and methods are inevitably marked by a high degree of professional judgement and require complex estimations of a number of variables. The use of significant assumptions especially deserves attention in relation to the review of the Significant Increase in Credit Risk (SICR) and of the Staging, as well as in respect of the determination of the assumptions and input data behind the Espected Credit Loss models and, as regards loans assessed on an analytical basis (Stage 3), for the determination of the expected future cash flows, related recovery times, together with the realizable values of any guarantees.
analyses were conducted about the reasonableness of the assumptions behind the presumption to recover them. In particular, in order to assess the reasonableness of the directors’ conclusions over the evaluation of loans, considering their classification in the financial statements according to the categories under the applicable financial reporting and regulatory framework, we selected a sample of impaired loans that were analytically assessed and verified the reasonability of the assumptions developed on the identification and quantification of the expected future cash flows from the credit recovery activity, on the evaluation of the guarantees backing these exposures and the estimated recovery times.
Finally, we examined the completeness and adequacy of the financial statement disclosures.
Responsibilities of the Directors and the Board of Statutory Auditors for the Financial Statements The directors are responsible for the preparation of financial statements that give a true and fair view in accordance with International Financial Reporting Standards as adopted by the European Union, as well as with the regulations issued to implement article 9 of Legislative Decree No. 38/05 and article 43 of Legislative Decree 136/2015 and, in the terms prescribed by law, for such internal control as they determine is necessary to enable the preparation of financial statements that are free from material misstatement, whether due to fraud or error. The directors are responsible for assessing the Company’s ability to continue as a going concern and, in preparing the financial statements, for the appropriate application of the going concern basis of accounting, and for disclosing matters related to going concern. In preparing the financial statements, the directors use the going concern basis of accounting unless they either intend to liquidate the Company or to cease operations, or have no realistic alternative but to do so. The board of statutory auditors is responsible for overseeing, in the terms prescribed by law, the Company’s financial reporting process

4 of 6
Auditor’s Responsibilities for the Audit of the Financial Statements Our objectives are to obtain reasonable assurance about whether the financial statements as a whole are free from material misstatement, whether due to fraud or error, and to issue an auditor’s report that includes our opinion. Reasonable assurance is a high level of assurance but is not a guarantee that an audit conducted in accordance with International Standards on Auditing (ISA Italia) will always detect a material misstatement when it exists. Misstatements can arise from fraud or error and are considered material if, individually or in the aggregate, they could reasonably be expected to influence the economic decisions of users taken on the basis of the financial statements. As part of our audit conducted in accordance with International Standards on Auditing (ISA Italia), we exercised our professional judgement and maintained professional scepticism throughout the audit. Furthermore: • We identified and assessed the risks of material misstatement of the financial statements,
whether due to fraud or error; we designed and performed audit procedures responsive to those risks; we obtained audit evidence that is sufficient and appropriate to provide a basis for our opinion. The risk of not detecting a material misstatement resulting from fraud is higher than for one resulting from error, as fraud may involve collusion, forgery, intentional omissions, misrepresentations, or the override of internal control;
• We obtained an understanding of internal control relevant to the audit in order to design audit procedures that are appropriate in the circumstances, but not for the purpose of expressing an opinion on the effectiveness of the Company’s internal control;
• We evaluated the appropriateness of accounting policies used and the reasonableness of accounting estimates and related disclosures made by the directors;
• We concluded on the appropriateness of the directors’ use of the going concern basis of accounting and, based on the audit evidence obtained, whether a material uncertainty exists related to events or conditions that may cast significant doubt on the Company’s ability to continue as a going concern. If we conclude that a material uncertainty exists, we are required to draw attention in our auditor’s report to the related disclosures in the financial statements or, if such disclosures are inadequate, to modify our opinion. Our conclusions are based on the audit evidence obtained up to the date of our auditor’s report. However, future events or conditions may cause the Company to cease to continue as a going concern;
• We evaluated the overall presentation, structure and content of the financial statements, including the disclosures, and whether the financial statements represent the underlying transactions and events in a manner that achieves fair presentation.
We communicated with those charged with governance, identified at an appropriate level as required by ISA Italia, regarding, among other matters, the planned scope and timing of the audit and significant audit findings, including any significant deficiencies in internal control that we identified during our audit. We also provided those charged with governance with a statement that we complied with the regulations and standards on ethics and independence applicable under Italian law and communicated
5 of 6
with them all relationships and other matters that may reasonably be thought to bear on our independence, and where applicable, related safeguards. From the matters communicated with those charged with governance, we determined those matters that were of most significance in the audit of the financial statements of the current period and are therefore the key audit matters. We described these matters in our auditor’s report. Additional Disclosures required by Article 10 of Regulation (EU) No. 537/2014 On 26 April 2012, during the annual general meeting, the shareholders of MedioCredito Centrale SpA appointed us to perform the statutory audit of the Company’s financial statements for the years ending 31 December 2012 to 31 December 2020. We declare that we did not provide any prohibited non-audit services referred to in article 5, paragraph 1, of Regulation (EU) No.537/2014 and that we remained independent of the Company in conducting the statutory audit. We confirm that the opinion on the financial statements expressed in this report is consistent with the additional report to the board of statutory auditors, in its capacity as audit committee, prepared pursuant to article 11 of the aforementioned Regulation.
Report on Compliance with other Laws and Regulations Opinion in accordance with Article 14, paragraph 2, letter e), of Legislative Decree No. 39/10 and Article 123-bis, paragraph 4, of Legislative Decree No. 58/1998 The directors of Mediocredito Centrale SpA are responsible for preparing a report on operations and a report on the corporate governance and ownership structure of Mediocredito Centrale SpA as of 31 December 2019, including their consistency with the relevant financial statements and their compliance with the law. We have performed the procedures required under auditing standard (SA Italia) No. 720B in order to express an opinion on the consistency of the report on operations and of the specific information included in the report on corporate governance and ownership structure referred to in article 123-bis, paragraph 4, of Legislative Decree No. 58/1998, with the financial statements of Mediocredito Centrale SpA as of 31 December 2019 and on their compliance with the law, as well as to issue a statement on material misstatements, if any. In our opinion, the report on operations and the specific information included in the report on corporate governance and ownership structure mentioned above are consistent with the financial

6 of 6
statements of Mediocredito Centrale SpA as of 31 December 2019 and are prepared in compliance with the law. With reference to the statement referred to in article 14, paragraph 2, letter e), of Legislative Decree No. 39/2010, issued on the basis of our knowledge and understanding of the Company and its environment obtained in the course of the audit, we have nothing to report. Rome, 9 March 2020 PricewaterhouseCoopers SpA Signed by Fabrizio De Dominicis (Partner) This report has been translated into English from the Italian original solely for the convenience of international readers. We have not examined the translation of the financial statements referred to in this report.