annual financial report 2016 - amazon web services · annual report 2016 table of contents. key ......
TRANSCRIPT

1
Annual Financial Report 2016

2
investor.qt.io
Annual Report 2016
Table of Contents
Key Figures / Board of Directors’ Report / Financial statements / CG / Information for Shareholders
YOU CAN USE THE MENU ITEMS TO NAVIGATE THROUGH THE DOCUMENT
Qt Group in 2016 03Qt Group in brief 04President and CEO’s review 05
Market and segment review 06 Products & services 07Strategy 2017–2021 08Board of Directors’ Report 11Financial statements 2016 17
Consolidated income statement 18Consolidated statement of financial position 19Consolidated statement of cash flows 20Consolidated statement of changes in shareholders’ equity 21Notes to the Consolidated Financial Statements 22Consolidated key figures 50Calculation formulas for key figures 50Parent company income statement 51Parent company balance sheet 52Parent company cash flow statement 53Basic information on the parent company and accounting policies applied in the financial statements 54Notes to the parent company financial statements 55Signatures to the Financial Statements and the Board of Directors’ Report 59Auditor’s Report 60
Corporate Governance Statement 65Board of Directors 67Management Team 69Statement on Management Remuneration 74
Information for Shareholders 75

3
* 2015
Annual Report 2016
Net salesMEUR
32.4
Operating result% OF NET SALES
-5.4%Return on investment
-12 %Equity ratio40 %
Quarterly development of net salesMEUR
Net sales by products and servicesMEUR
1Q15 2Q15 3Q15 4Q15 1Q16 2Q16 3Q16 4Q16
10
8
6
4
2
01Q16
2014
2Q16
2015 2016
3Q16 4Q16
6
4
2
0
30
20
10
0
Qt Group in 2016Qt Group Plc (hereinafter referred to as the “company”) was formed as a result of the partial demerger of Digia Plc, which took effect on 1 May 2016. * 26.9
* 1 786 * 6,6% * 25% * 54,7% * 180
Operating resultEUR thousand
-1 736 -0.08Earnings per shareEUR
License sales and consultingSupport and maintenance
Personnel on average
209
Key Figures / Board of Directors’ Report / Financial statements / CG / Information for Shareholders

4Annual Report 2016
The company operates in the global growth market for software development tools, estimated to be worth USD 10 billion in 2016. Our products, based on Qt technology, are used for developing efficient, interactive and multi-platform interfaces and applications.
Qt technology is used in over 70 different industries, in millions of devices and applications – such as consumer electronics, vehicles, airplanes and industrial automation applications.
Qt Group has operating locations in Finland, Norway, Germany, the United States, Russia, China, Japan and South Korea. At the end of 2016, the company had 218 employees. Used by more than one million software devel-opers worldwide, Qt is a C++ based framework of librar-ies and tools that enables the development of powerful, interactive and cross-platform applications and devices. Experienced and highly competent personnel are among the company’s key strengths. Qt Group’s senior manage-ment has extensive operational experience of business management in the international markets. The company works actively to develop the competence and job satis-faction of its employees as well as their commitment to Qt
Group’s vision. At the same time, the company promotes the innovativeness and productivity of its personnel in a rapidly changing international operating environment. To provide incentives to personnel, the company has a remu-neration programme that covers all employees.
Qt Group is responsible for the development, producti-sation and licensing of software development tools based on Qt technology under commercial and open source licences. The company has approximately 100 software developers working in research and product development. The product development units are located in Berlin, Ger-many, Oslo, Norway and Oulu, Finland. Qt Group is also responsible for maintaining the operating conditions and systems for the open source Qt Project developer commu-nity. Qt’s open administration model serves as the basis for joint software development with the open source com-munity and Qt partner enterprises.
Qt Group in brief
Key Figures / Board of Directors’ Report / Financial statements / CG / Information for Shareholders

5Annual Report 2016
The year 2016 was a period of strong growth for Qt Group. Our full-year net sales increased by more than 20 per cent year-on-year. We have made progress in line with the company’s strategy and even exceeded our growth targets.
President and CEO’s review
We are not dependent on any customer segment or geo-graphical area, and during the year we signed significant contracts in many different industries around the world.
As expected, the Group’s operating result for 2016 showed a loss due to investments necessary for growth and the setting up of independent Group functions, which resulted in a larger cost structure. The operating result included non-recurring costs totalling EUR 1.8 million aris-ing from fees paid to external service providers in relation to the Digia demerger and costs associated with Digia’s share-based remuneration scheme.
During the first half of the year, we released the new versions Qt 5.6 and Qt 5.7. With the release of Qt 5.7, we changed the open source licensing terms with the aim of promoting the sale of licences to commercial operators. The effects of this change are expected to become appar-ent in the coming years. In the first half of the year, we opened a new office in Japan to boost local sales. We have also otherwise increased our sales resources, particularly in Asia. The Qt World Summit 2016, held in the autumn in San Francisco, California, was attended by more than 600 representatives of our customers and partners. The event
saw the launch of new products to facilitate the use of Qt technology in a growing range of equipment, including smart watches for example.
Investments in business development have been particularly allocated to the automotive segment. The excellent progress achieved on this front has seen the automotive industry adopt Qt as one of its basic technolo-gies for implementing digital in-vehicle entertainment and control software. The company engages in business and development activities with many of the world’s leading car manufacturers.
Our quality management system received ISO9001:2008 certification during the first half of the year.
We see very promising growth prospects for our busi-ness in the next few years. We will make significant invest-ments into developing our operations and increasing our sales resources in line with our strategy. Our target is to achieve annual net sales of EUR 100 million and operating profit of at least 15 per cent in 2021.
I want to take this opportunity to thank our custom-ers, shareholders and personnel for their cooperation.
Juha VareliusPresident and CEO, Qt Group Plc
Key Figures / Board of Directors’ Report / Financial statements / CG / Information for Shareholders

6Annual Report 2016
Market and segment review
For Qt Group, the developer market for desktop and mobile solutions is a stable market in which the company has strong brand awareness, good market share and a large customer base. The company’s Board of Directors expect this market to maintain its steady growth and continue to bring stable cash flow to the company. However, the growth prospects of this market are constrained by the limited number of software developers. In the embed-ded systems market, on the other hand, the company’s revenue model is largely based on the number of products manufactured with Qt technology, which makes it more scalable.
The Internet of Things (IoT) is revolutionising several industries and the way the devices and systems of the future are designed, with a growing number of intelligent devices that are connected to each other via networks. The user value of embedded devices is often defined in terms of the user experience, also in the industrial environment. Even if a device is used exclusively by trained profession-als in environments such as a factory or a hospital, it is
important that the use of the device corresponds to the user experience people are accustomed to from consumer devices, such as phones. This means that the need to create good user interfaces will grow as a result of the proliferation of the Internet of Things. At the same time, the need to easily and efficiently introduce the same user experience across all of the user’s devices drives a grow-ing need for platform-independent development environ-ments such as Qt. Applications need to be available on all screens and all circumstances. For software development tools, this means the need to operate in a world of various equipment and operating systems in as efficient and user-friendly a manner as possible.
Another growing trend in the software industry is the use of the open source approach in application develop-ment. The use of open source development is expanding to various segments as enterprises are unwilling to be locked into a single provider’s technology. Instead, enterprises are seeking alternatives that offer both a global ecosystem and stable future prospects. Qt technology has been avail-
able under a double licence, meaning both open source and commercial licensing, throughout Qt’s 20-year-history, and Qt technology has a strong ecosystem comprised of more than a million application developers. The development of Qt technology itself is also largely based on an open source environment and collaboration with other enterprises, organisations and individual developers, which improves the product’s development opportunities for new features while also boosting its quality and credibility.
As an open source solution, Qt provides equipment manufacturers with a genuinely independent solution for creating their own software platforms and ecosystems for external application developers. For example, the manu-facturers of cars and smart TVs can use Qt to create enter-tainment systems that can accommodate external content and applications while allowing the manufacturer to retain the user data accumulated by the car or TV set. This is an important competitive advantage for Qt against large-scale application ecosystems.
Qt Group provides technology solutions to two main market segments: the platform-independent development of desktop and mobile solutions and the development of embedded systems.
Key Figures / Board of Directors’ Report / Financial statements / CG / Information for Shareholders

7Annual Report 2016
Products & services
As a software development tool, Qt is a ready-for-sale product that meets our customers’ needs. Qt provides software developers with a cross-platform framework and related tools, including an integrated development environment (IDE). By providing these tools, the company aims to increase the productivity of its customers’ soft-ware developers. With these tools the Qt Group seeks to improve the productivity of its customer’s developers, helping them bring products faster to market. The compa-ny’s products can be divided into application development tools and hardware development tools.
Qt Group provides its customers with consulting services that give them the capacity to implement their projects as efficiently as possible and support in making the right decisions throughout all project phases. With its consulting services, Qt Group Plc aims to improve the execution of its customers’ software development pro-jects and optimise productivity. The core competence of Qt Group’s consulting services is built on experience from more than 70 different industries and a team of leading developers that provide our customers with the expertise and broad Qt competencies they lack in their own develop-ment teams or units.
Qt technology has been developed to satisfy our customers’ needs, ranging from software developer tools, a software library to support application development, and related support to various operating system and hardware platforms. The technology solution can also be managed and it can be used to give customers the opportunity to provide their own customised development environments.
Key Figures / Board of Directors’ Report / Financial statements / CG / Information for Shareholders

8Annual Report 2016
Strategy 2017-2021The company’s Board of Directors has set a long-term financial target of 100 million in annual net sales and operating profit (EBIT) of at least 15 per cent in 2021.
The Board of Directors of Qt Group looks to accelerate the company’s strong growth of recent years by investing in the strategic development areas of growing the global sales network and focusing product development on selected industries.
The company will also continue to leverage the open source ecosystem. Qt’s open source licencing terms were specified further in the Qt 5.7 version released in 2016 to clarify the requirement for a commercial licence for the development of commercial products. The Board of Directors expects this to have a positive impact on the development of net sales through an improved commercial conversion rate from 2017 onwards.
Growing the global sales networkQt Group aims to expand its sales network by increasing the number of its own operating locations as well as the number of retailers. The plan for the company’s own oper-ating locations is to cover its largest geographical markets, which are currently the United States, Germany, China, South Korea and Japan. In the sales of embedded systems in particular, sales cycles are long and they require a local
presence. Growth will also be pursued by developing the sales model and organisation with more focus on specified large customer accounts.
The company will seek to grow its network of retailers, particularly in countries with smaller business potential or where the local operating methods or markets deviate significantly from the company’s current operating meth-ods or markets. The aim is also to expand the network of retailers to technology partners that operate globally or have their own distribution networks.
The sales network will also be enhanced by increasing online distribution via the Internet. The current view of Qt Group’s Board of Directors is that the self-service based sales channel has limited significance to Qt’s business, but it enables the company to allocate its own sales resources better.
Product development in selected industriesMany of the key industries in which the company is pursu-ing growth in market share are undergoing technological transformations that involve making choices of technol-ogy platforms for the coming years. As these markets are
being divided between the market participants right now, it is essential for the company to aggressively capture market share and, most importantly, conclude significant commercial contracts with major hardware manufacturers.
Qt helps the manufacturers of embedded devices efficiently develop software, especially user interfaces, for their devices, which enables them to launch their products faster than they would without Qt. Qt also offers hardware manufacturers the opportunity to create their own plat-forms for external software, such as smart TV and in-car entertainment systems that are used for the delivery of external services.
Qt technology is ideally suited for the development of user interfaces for embedded systems and platform-inde-pendent applications. This is a competitive advantage that the company will look to develop further. The development priorities include, among other things, enhancing the effi-ciency of development tools and, as a result, customers’ development cycles, supporting new software and hard-ware technologies and introducing added functionality for purposes such as the creation of user interfaces.
Key Figures / Board of Directors’ Report / Financial statements / CG / Information for Shareholders

9Annual Report 2016
Industries as enablers of long-term growth – the automotive industry as the engine of growth
A particular strategic focus area in the development of embedded systems is investing in selected industries, such as the automotive industry, automation and digital tele-vision. By complementing the basic product offering with the introduction of customised solutions and ready-to-use integrations for specific industries, Qt can offer even more added value to the manufacturers in these indus-tries in order to increase its market share and net sales in the industries in question. The company will continue to increase its investments particularly in the automotive industry to increase its market share, support the devel-opment of technology solutions and build a sales network focused on the automotive industry.
Contracts with large manufacturers enable scalable growth and continuous revenue streams in Qt’s licens-ing-based revenue model in embedded systems. The more devices are produced with Qt technology, the larger the number of distribution licences sold. As the system development cycles in many industries—such as the auto-motive industry—are 2–3 years long, the investments being made now are geared towards boosting distribution licence revenue particularly from 2019 onwards.
Key Figures / Board of Directors’ Report / Financial statements / CG / Information for Shareholders

10Annual Report 2016
LG is using Qt in various products, in various capacities - not just on the UI level.Anupam Kaul, LG
Key Figures / Board of Directors’ Report / Financial statements / CG / Information for Shareholders

11Annual Report 2016
Board of Directors’ ReportSummary of financial year 2016
• Qt Group Plc was formed as a result of the partial demerger of Digia Plc, which took effect on 1 May 2016.
• Net sales EUR 32,395 thousand (EUR 26,934 thousand): up 20.3 per cent
• Comparable operating profit was EUR 291 (1,922) thou-sand, comparable operating margin (EBIT %) was 0.9 per cent (7.1).
• The comparable operating profit for 2015 included restructuring costs totalling EUR 136 thousand, while the comparable operating profit for 2016 includes non-recurring costs totalling EUR 2,026 thousand arising from the write-down of a loan receivable associated with the financing of the Qt Project Hosting founda-tion, fees paid to external service providers in relation to the demerger of Digia as well as costs associated with Digia’s share-based remuneration system.
• The operating result was EUR -1,736 thousand (1,786), operating margin (EBIT %) was -5.4 per cent (6.6).
• Earnings per share were EUR -0.08• The Board of Directors of Qt Group Plc proposes to the
Annual General Meeting that no dividend be paid for the fiscal year that ended on 31 December 2016.
The reporting complies with the International Financial Reporting Standards (IFRS).
Business
Qt develops and delivers the Qt development framework under commercial and open source licences. We enable the reuse of software code across all operating systems, platforms and screen types, from desktops and embedded systems to wearables and mobile devices. Qt is used by approximately one million developers worldwide and is the leading independent technology behind millions of devices and applications. Qt is the platform of choice for in-ve-hicle systems, industrial automation devices, and other business critical application manufacturers, and is used by leading global players in more than 70 industries. Qt operates in Finland, Norway, Germany, the United States, Russia, China, Japan and South Korea.
Financial year 2016
Net salesQt Group’s net sales grew by 20.3 per cent during the fiscal year (January–December) and amounted to EUR 32,395 thousand euro (EUR 26,934 thousand euro).
Profit performanceThe comparable operating profit for the fiscal year was EUR 291 (1,922) thousand, while the comparable operat-ing profit margin (EBIT %) was 0.9 (7.1) per cent. The result for the financial year includes non-recurring costs totalling EUR 2,026 thousand (EUR 136 thousand), attributable to
the write-down of a loan receivable associated with the funding of the Qt Project Hosting foundation, fees paid to external service providers in relation to the Digia demerger as well as costs arising from Digia’s share-based remuner-ation system..
Qt’s operating result for the fiscal year was EUR -1,736 thousand (EUR 1,786 thousand). The operating result was -5.4 per cent of net sales (6.6%).
The Group’s operating expenses, including materials and services, personnel expenses, depreciation and other operating expenses, amounted to EUR 34,658 thousand (EUR 26,967 thousand), up 28.5 per cent year-on-year. Personnel expenses represented 66.3 per cent (64.3%) of the operating expenses, EUR 22,990 thousand euro in total (EUR 17,348 thousand). Taking the items affecting comparability, EUR 2,026 thousand (EUR 136 thousand euro), into account, fixed costs increased by 21.6 per cent.
The Group’s net financial expenses in the fiscal year amounted to EUR 541 thousand (EUR 195 thousand) due to fees totalling EUR 510 thousand related to interest on, and fees associated with, the drawing down of a loan of EUR 6.0 million granted by Ilmarinen Mutual Pension Insurance Company.
Earnings before tax for the fiscal year totalled EUR -2,227 thousand (EUR 1,591 thousand) and the result was EUR -1,747 thousand (EUR 981 thousand). Taxes for the review period amounted to EUR 530 thousand (EUR -610 thousand).
Earnings per share were EUR -0.08 for the fiscal year.
Key Figures / Board of Directors’ Report / Financial statements / CG / Information for Shareholders

12Annual Report 2016
Financing and investmentsCash flow from operating activities was EUR -1,385 thou-sand (EUR 1,165 thousand) in the fiscal year due to growth investments and subsequent negative operating result.
Qt’s cash and cash equivalents totalled EUR 6,420 thousand (EUR 3,577 thousand) at the end of the fiscal year. A loan of EUR 6.0 million, granted by Ilmarinen Mutual Pension Insurance Company, was drawn down in two instalments in May 2016. The loan will mature in its entirety in November 2017 and the Group will pay interest on the loan semiannually.
Qt Group’s consolidated balance sheet total at the end of the fiscal year was EUR 29,443 thousand (EUR 23,869 thousand). Net cash flow from investments in the fiscal year was EUR -374 thousand (EUR -233 thousand).
The equity ratio stood at 40.0 per cent (54.7%) and gearing was 0.7 per cent (-24.8%). Interest-bearing liabil-ities amounted to EUR 6,207 thousand (EUR 1,365 thou-sand), of which short-term loans accounted for EUR 6,152 thousand (EUR 553 thousand).
The return on investment for the fiscal year was -12.0 per cent (25.0%) and return on equity was -21.1 per cent (11.0%).
Research and developmentQt’s product development expenses for the fiscal year totalled EUR 8,347 thousand (EUR 7,902 thousand) rep-resenting 25.8 per cent (29.3 per cent) of the net sales. Product development expenses are included in the result for the fiscal year in their entirety and Qt has no capitalised
product development expenses in its balance sheet. At the end of the review period, the company had 87 people (80) employed in product development.
PersonnelQt Group had an average of 209 (180) employees during the fiscal year and the number of employees at the end of the year was 220 (182).
The geographical distribution of personnel:
The Group’s personnel expenses amounted to EUR 22,990 thousand (EUR 17,348 thousand), up 32.5% from the previous year.
Personnel 1–12/2016 1–12/2015 Change,%
(on average)
Finland 64 52 23%
Rest of Europe & APAC 118 106 12%
North America 27 22 22%
Group total 209 180 16%
Key Figures / Board of Directors’ Report / Financial statements / CG / Information for Shareholders
13Annual Report 2016
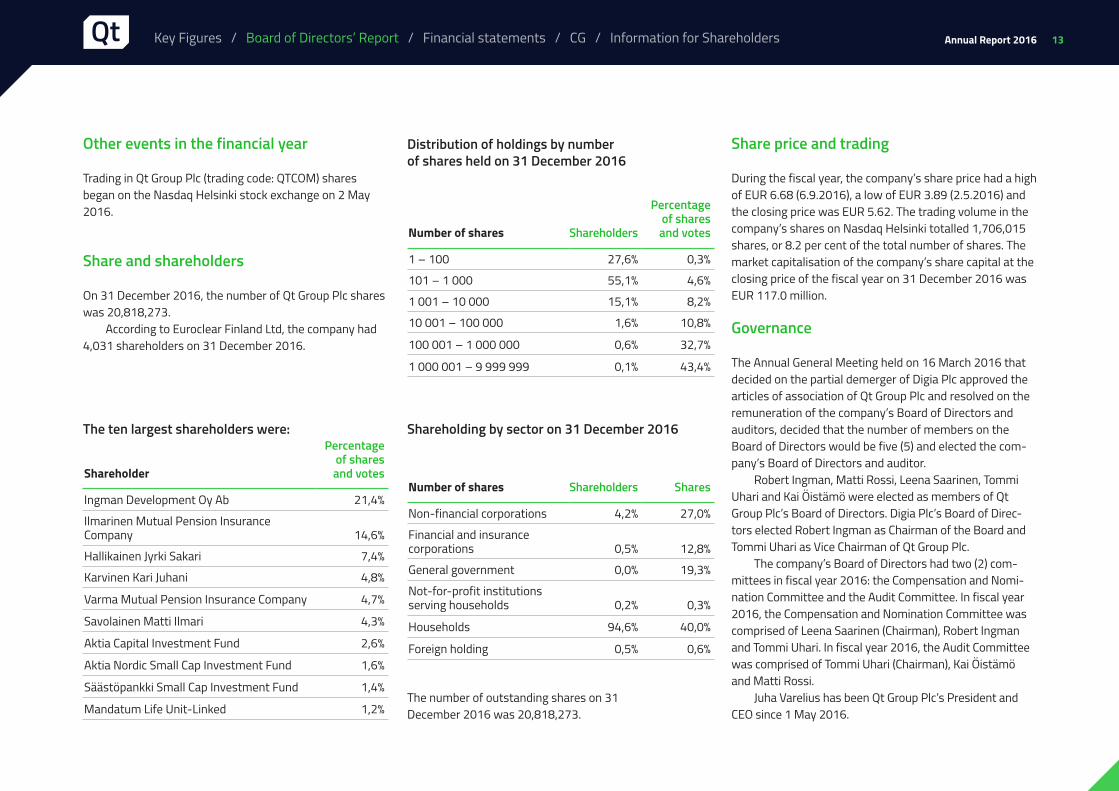
Shareholder
Percentage of shares and votes
Ingman Development Oy Ab 21,4%
Ilmarinen Mutual Pension Insurance Company 14,6%
Hallikainen Jyrki Sakari 7,4%
Karvinen Kari Juhani 4,8%
Varma Mutual Pension Insurance Company 4,7%
Savolainen Matti Ilmari 4,3%
Aktia Capital Investment Fund 2,6%
Aktia Nordic Small Cap Investment Fund 1,6%
Säästöpankki Small Cap Investment Fund 1,4%
Mandatum Life Unit-Linked 1,2%
Number of shares Shareholders
Percentage of shares and votes
1 – 100 27,6% 0,3%
101 – 1 000 55,1% 4,6%
1 001 – 10 000 15,1% 8,2%
10 001 – 100 000 1,6% 10,8%
100 001 – 1 000 000 0,6% 32,7%
1 000 001 – 9 999 999 0,1% 43,4%
Number of shares Shareholders Shares
Non-financial corporations 4,2% 27,0%
Financial and insurance corporations 0,5% 12,8%
General government 0,0% 19,3%
Not-for-profit institutions serving households 0,2% 0,3%
Households 94,6% 40,0%
Foreign holding 0,5% 0,6%
The ten largest shareholders were:
Distribution of holdings by number of shares held on 31 December 2016
Shareholding by sector on 31 December 2016
The number of outstanding shares on 31 December 2016 was 20,818,273.
Other events in the financial year
Trading in Qt Group Plc (trading code: QTCOM) shares began on the Nasdaq Helsinki stock exchange on 2 May 2016.
Share and shareholders
On 31 December 2016, the number of Qt Group Plc shares was 20,818,273.
According to Euroclear Finland Ltd, the company had 4,031 shareholders on 31 December 2016.
Share price and trading
During the fiscal year, the company’s share price had a high of EUR 6.68 (6.9.2016), a low of EUR 3.89 (2.5.2016) and the closing price was EUR 5.62. The trading volume in the company’s shares on Nasdaq Helsinki totalled 1,706,015 shares, or 8.2 per cent of the total number of shares. The market capitalisation of the company’s share capital at the closing price of the fiscal year on 31 December 2016 was EUR 117.0 million.
Governance
The Annual General Meeting held on 16 March 2016 that decided on the partial demerger of Digia Plc approved the articles of association of Qt Group Plc and resolved on the remuneration of the company’s Board of Directors and auditors, decided that the number of members on the Board of Directors would be five (5) and elected the com-pany’s Board of Directors and auditor.
Robert Ingman, Matti Rossi, Leena Saarinen, Tommi Uhari and Kai Öistämö were elected as members of Qt Group Plc’s Board of Directors. Digia Plc’s Board of Direc-tors elected Robert Ingman as Chairman of the Board and Tommi Uhari as Vice Chairman of Qt Group Plc.
The company’s Board of Directors had two (2) com-mittees in fiscal year 2016: the Compensation and Nomi-nation Committee and the Audit Committee. In fiscal year 2016, the Compensation and Nomination Committee was comprised of Leena Saarinen (Chairman), Robert Ingman and Tommi Uhari. In fiscal year 2016, the Audit Committee was comprised of Tommi Uhari (Chairman), Kai Öistämö and Matti Rossi.
Juha Varelius has been Qt Group Plc’s President and CEO since 1 May 2016.
Key Figures / Board of Directors’ Report / Financial statements / CG / Information for Shareholders
14Annual Report 2016
KPMG Oy Ab, Authorised Public Accountants, has served as the auditor of the Qt Group since 1 May 2016, with Author-ised Public Accountant Kim Järvi as the principal auditor.
AuthorisationsThe Annual General Meeting of 16 March 2016 that deci-ded on the demerger of Digia Plc granted the following authorisations to the Board of Directors of Qt Group Plc:
Authorising the Board of Directors to decide on repurchasing the company’s own shares and/or accepting them as collateralThe Annual General Meeting authorised the Board of Directors of Qt Group Plc to decide on the repurchase and/or acceptance as collateral of a maximum of 1,000,000 of the company’s own shares. This repurchase can only be executed by means of the company’s unrestricted equity. The Board shall decide on how these shares are to be purchased. The shares may be repurchased in a proportion other than that of the shares held by the current sharehol-ders. The authorisation also includes acquisition of shares through public trading organised by NASDAQ Helsinki Oy in accordance with the rules and instructions of NASDAQ Helsinki and Euroclear Finland Ltd, or through offers made to shareholders. Shares may be acquired in order to imp-rove the company’s capital structure, to finance or carry out acquisitions or other arrangements, to implement sha-re-based incentive schemes, to be transferred for other purposes, or to be cancelled. The shares shall be repurcha-sed for a price based on the fair value quoted in public tra-ding. The authorisation is valid until 16 September 2017. The Board of Directors of Qt Group Plc can take a decision based on this authorisation only after the implementation of the demerger has been registered.
Authorising the Board of Directors to decide on a share issue and the granting of special rights entitling to shares The Annual General Meeting authorised the Board of Dire-ctors of Qt Group Plc to decide on a share issue and the granting of special rights prescribed in Chapter 10, Section 1 of the Companies Act, either subject to or free of charge, in one or several instalments on the following terms: The maximum total number of shares to be issued by virtue of the authorisation is 2,000,000. The authorisation concerns both the issuance of new shares and the transfer of shares held by the company. By virtue of the authorisation, the Board of Directors is entitled to decide on share issues and the granting of special rights waiving the pre-emptive subscription rights of the shareholders (directed issue). The authorisation may be used in order to finance or carry out acquisitions or other arrangements, to implement the company's share-based incentive schemes and to imp-rove the capital structure of the company, or to be used for other purposes decided by the Board of Directors. The aut-horisation includes the Board of Directors' right to decide on all terms relating to the share issue and the granting of special rights, including the subscription price, its pay-ment not only by cash, but also entirely or partly by other assets (property given as capital contribution) or setting the subscription price off against a subscriber’s receivable, and the entry into the company's balance sheet. The aut-horisation is valid until 16 September 2017. The Board of Directors of Qt Group Plc can take a decision based on this authorisation only after the implementation of the demer-ger has been registered.
By virtue of the authorisation granted to it by the Annual General Meeting, the Board of Directors of Qt Group Plc decided at its meeting on 22 June 2016 to issue stock options to the key persons of the company or its Group companies on the following terms and conditions:
The maximum total number of stock options issued is 2,000,000, and they entitle their holders to subscribe for a maximum total of 2,000,000 new shares in the company. The stock options shall be marked with the symbol 2016. No stock option certificates shall be issued for the stock options. The stock options shall be issued gratuitously to the company’s key persons.
Each stock option entitles its holder to subscribe for one (1) new share in the company or an existing share held by the company. The share subscription price shall be credited to the company’s reserve for invested unre-stricted equity.
The share subscription period for the stock options shall be 19 December 2019–31 December 2022. A pre-condition for the share subscription is that the value of the company’s share based on the trade volume weighted average quotation on the NASDAQ OMX Helsinki Ltd is at least five euros and eighty-five cents (EUR 5.85) between 18 November 2019 and 13 December 2019.
The share subscription price for the stock options shall be the trade volume weighted average quotation of the company’s share between 1 June 2016 and 30 June 2016 and the share subscription price shall, nevertheless, always amount to at least the highest share price quoted on the closing day 22 June 2016 when the stock options have been issued and assigned to the key persons added with one euro cent (EUR 0.01). The subscription price was determined to be EUR 4.84 based on the highest share price quoted on 22 June being EUR 4.83 and the trade volume weighted average quotation between 1 June 2016 and 30 June 2016 being EUR 4.6102.
Key Figures / Board of Directors’ Report / Financial statements / CG / Information for Shareholders

15Annual Report 2016
Risks and uncertainties
The company’s short-term risks and uncertainties are related to potential significant changes in the company’s business operations, ensuring adequate financing for operations as well as the retention and recruitment of the personnel required for business development. In one of the company's key market areas in the United States, there is a risk that unexpected regulation changes may have a negative impact on the company's business in the region.
Exchange rate fluctuations, particularly between the US dollar and euro, may have a large impact on the devel-opment of Qt’s net sales. Another factor contributing to considerable fluctuation in quarterly net sales and prof-itability in particular is contract turnaround times which, in the major customer segment, are very long at up to 18 months.
The company’s business risks and mitigations for them are also described on the company website at www.qt.io.
Group structure
Qt Group Plc was formed as a result of the partial demer-ger of Digia Plc, which took effect on 1 May 2016. As such, Qt Group Plc has not constituted a separate legal group prior to the date in question. The carve-out financial infor-mation presented in these financial statements reflect the financial information of the companies that previously constituted the Digia Group’s Qt segment. The balance sheet and related key figures for 31 December 2016 are based on actual figures, while the income statement,
cash flow and comparison figures are based on financial carve-out information. There have been no changes to the carve-out calculation principles, which were described in detail in the demerger prospectus published by Digia Plc on 3 March 2016.
The business of Qt Group Plc is operated under the subsidiary The Qt Company Oy in Finland.
Future outlook
Operating environment and market outlookThe company estimates the growth prospects for its busi-ness in the next few years as very promising.
The Group’s business development efforts will par-ticularly focus on embedded systems in the automotive sector, digital TV and industrial automation. Areas targeted in product development include value-added features and tools required for building embedded systems.
Sales growth associated with embedded systems will also reflect on the earnings logic. Volume-based license revenue from these sales accumulates over the long term. Consequently, the company anticipates no major impact from embedded systems sales growth on consolidated net sales in 2017.
Outlook 2017The company will invest significantly in developing its ope-rations and increasing its sales resources in line with its strategy. The company’s Board of Directors plans to seek additional funding to finance investments in growth and maximise future growth. The company estimates that its net sales in 2017 will increase by 15–20 per cent year-on-year.
Due to investments in growth, the company’s operat-ing result will show a substantial loss in 2017.
Major events after the balance sheet date
At its meeting on 15 February 2017, the Board of Direc-tors of Qt Group decided to propose to the Annual General Meeting to be held on 14 March 2017 that the Board of Directors be authorised to decide on acquiring additional funding of approximately EUR 15 million by means of a share issue based on shareholders’ pre-emptive subscrip-tion rights.
The Board of Directors proposes to the Annual General Meeting that the Annual General Meeting authorise the Board of Directors to decide on the issuance of at most 4,500,000 new shares or treasury shares in one or more ordinary share issues.
Board of directors’ dividend proposal
The Board of Directors of Qt Group Plc proposes to the Annual General Meeting that no dividend be paid for the fiscal year that ended on 31 December 2016.
Key Figures / Board of Directors’ Report / Financial statements / CG / Information for Shareholders

16Annual Report 2016
We believe that Qt will help us further our mission, by providing the best user experience for our customers..Adam Christian, Tableau
Key Figures / Board of Directors’ Report / Financial statements / CG / Information for Shareholders

17Annual Report 2016
Financial statements2016Consolidated income statement 18
Consolidated statement of financial position 19
Consolidated statement of cash flows 20
Consolidated statement of changes in shareholders’ equity 21
Notes to the Consolidated Financial Statements 22
Consolidated key figures 50
Calculation formulas for key figures 50
Parent company income statement 51
Parent company balance sheet 52
Parent company cash flow statement 53
Basic information on the parent company and
accounting policies applied in the financial statements 54
Notes to the parent company financial statements 55
Signatures to the Financial Statements and
the Board of Directors’ Report 59
Auditor’s Report 60
Key Figures / Board of Directors’ Report / Financial statements / CG / Information for Shareholders

18Annual Report 2016
Consolidated income statement IFRS Consolidated statement of comprehensive income IFRS
EUR thousand note
carve-out1.1.–31.12.
2016
carve-out1.1.–31.12.
2015
Net sales 2 32 395 26 934
Other operating income 3 528 1 821
Materials and services 4 −2 313 −1 003
Personnel expenses 5, 18, 22 −22 990 −17 348
Depreciation, amortisation and impairment 7 −866 −954
Other operating expenses 8 −8 489 −7 662
Operating profit −1 736 1 786
Financial income 9 529 708
Financial expenses 9 −1 071 −903
Earnings before tax −2 277 1 591
Income taxes 10 530 −610
Net profit −1 747 981
Distribution of comprehensive income:
Parent company shareholders -1 747 981
EUR thousand note
carve-out1.1.–31.12.
2016
carve-out1.1.–31.12.
2015
Net profit −1 747 981
Other comprehensive income
Items which may be reclassified subsequently to profit or loss:
Translation difference 28 118
Total comprehensive income -1 720 1 099
Distribution of comprehensive income:
Parent company shareholders -1 720 1 099
Earnings per share for profit attributable to the shareholders of the parent company, EUR -0,08 -
Details are presented in Note 11. Earnings per share.
Key Figures / Board of Directors’ Report / Financial statements / CG / Information for Shareholders

19Annual Report 2016
EUR thousand note 31.12.2016carve-out
31.12.2015
Non-current assets
Goodwill 12 6 562 6 562
Other intangible assets 12 5 360 5 843
Tangible assets 13 567 416
Long-term receivables 14 952 42
Total non-current assets 13 441 12 863
Current assets
Trade and other receivables 15 7 741 5 411
Other receivables 15 1 841 2 018
Cash and cash equivalents 16 6 420 3 577
Total current assets 16 002 11 006
Total assets 29 443 23 869
Consolidated statement of financial position IFRSAssets
tuhatta euroa note 31.12.2016carve-out
31.12.2015
Shareholders’ equity
Share capital 17 500
Unrestricted shareholders’ equity reserve 17 8 720
Translation difference 17 633 605
Retained earnings 17, 18 160 8 314
Net profit −1 747
Total shareholders’ equity 8 265 8 919
Long-term liabilities
Deferred tax liabilities 14 293 195
Long-term interest-bearing liabilities 20 55 812
Other long-term liabilities 461 875
Total long-term liabilities 809 1 882
Short-term liabilities
Short-term interest-bearing liabilities 19, 20 6 152 553
Accounts payable 19 774 411
Other short-term liabilities 19 13 443 12 104
Total short-term liabilities 20 369 13 068
Total liabilities 21 178 14 950
Shareholders’ equity and liabilities 29 443 23 869
Equity and liabilities
Key Figures / Board of Directors’ Report / Financial statements / CG / Information for Shareholders

20Annual Report 2016
Consolidated statement of cash flows IFRS
EUR thousand carve-out
1.1.–31.12.2016carve-out
1.1.–31.12.2015
Earnings before tax −2 277 1 593 Adjustments to net profit
Depreciation and amortisation 695 954 Other adjustments 754 370
Change in working capital
Change in trade and other receivables −1 373 −1 036 Change in accounts payable and other liabilities 1 621 90
Interest paid −513 −196Other financial items −28 0Taxes paid −263 −610 Cash flow from operations −1 385 1 165 Purchases of tangible and intangible assets −374 −233
Cash flow from investments −374 −233 Repayments of current loans −346 −303Withdrawals of non-current loans 6 000 0Repayments of non-current loans −1 188 0Cash flow from financing 4 466 −303 Change in cash and cash equivalents 2 707 629 Cash and cash equivalents at beginning of period 3 577 2 857Net foreign exchange difference 136 91Cash and cash equivalents at end of period 6 420 3 577
Key Figures / Board of Directors’ Report / Financial statements / CG / Information for Shareholders

21Annual Report 2016
Consolidated statement of changes in shareholders’ equity IFRS
EUR thousand
Invested equity and retained earnings
equity Share capital
Unrestricted shareholders’
equity reserve Translation
differenceRetainedearnings Total equity
Shareholders’ equity 1 January 2015 7 332 0 0 487 0 7 819
Comprehensive income for the period
Net profit 981 981
Other comprehensive income 118 118
Shareholders’ equity 31 December 2015 8 313 0 0 605 0 8 918
Shareholders’ equity 1 January 2016 8 314 0 0 605 0 8 919
Comprehensive income for the period 1–4/2016
Net profit 526 526
Other comprehensive income 97 97
Demerger-related transactions 855 855
Demerger 30 April 2016 −9 694 500 8 720 474 −0
Shareholders’ equity 1 May 2016 0 500 8 720 702 474 10 396
Comprehensive income for the period 5–6/2016
Net profit −2 273 −2 273
Stock option programme 211 211
Other comprehensive income −69 −69
Shareholders’ equity 31 December 2016 0 500 8 720 633 −1 588 8 265
Shareholders’ equity information prior to the demerger (1 May 2016) are based on carve-out figures.
Key Figures / Board of Directors’ Report / Financial statements / CG / Information for Shareholders

22Annual Report 2016
Notes to the Consolidated Financial Statements IFRS
BASIC INFORMATION ON THE GROUP
Qt Group Plc develops, productises and licenses software development tools based on the Qt technology under commercial and open-source licences. Qt technology is used globally by over one million software developers. Qt is used for developing cross-platform applications and graphic user interfaces for desktops, embedded sys-tems and mobile devices. Qt technology is used in over 70 different industries, in millions of devices and applica-tions – such as consumer electronics, vehicles, airplanes and industrial automation applications. Qt has operating locations in Finland, Norway, Germany, the United States, Russia, China, Japan and South Korea. The company has over 200 employees.
The company is listed on the Nasdaq Helsinki Stock Exchange http://qt.io. The parent company’s domicile is Espoo and its registered address is Bertel Jungin aukio D3A, FI-02600 Espoo, Finland. A copy of the financial statements is available at https://investors.qt.io/fi
ACCOUNTING POLICIES APPLIED IN THE CONSOLIDATED FINANCIAL STATEMENTS
This section describes the general accounting policies applied in the consolidated financial statements and the use of management judgement and estimates. More detailed accounting policies are presented below in con-nection with each item.
Basis of preparation
Qt Group Plc was established by the partial demerger of Digia Plc on 1 May 2016, which saw Digia’s Qt business transferred to a new parent company. As such, Qt did not constitute a separate legal group prior to 1 May 2016. The balance sheet and related key figures for 31 Decem-ber 2016 are based on actual figures, while the income statement, cash flow statement and comparison figures are based on carve-out financial information. The carve-out financial information for 31 December 2015 presented herein reflect the income, expenses, assets, liabilities and cash flows of the companies that previously constituted the Digia Group’s Qt business.
The carve-out financial information for 31 December 2015 does not necessarily reflect the what the results, financial positions and cash flows of the combined busi-nesses would have been if Qt and its subsidiaries had been an independent legal corporation starting from 1 January 2015 and, as such, presented financial information for the period in question as a separate corporation.
The consolidated financial statements have been prepared in compliance with the International Financial Reporting Standards (IFRS), observing the IAS and IFRS standards, as well as SIC and IFRIC interpretations, valid on 31 December 2016.
The consolidated financial statements are drawn up for the calendar year, which is the fiscal period for the Group’s parent company and other Group companies.
The financial statements are presented in thousands of euros.
Consolidation principles
The consolidated financial statements include the parent company, Qt Group Plc, and all subsidiaries. Acquired sub-sidiaries are consolidated using the cost method, according to which the assets and liabilities of the acquired entity are measured at fair value at the time of acquisition, and the remaining difference between the acquisition price and the acquired shareholders’ equity constitutes goodwill. In accordance with the exemption permitted by IFRS 1, acquisitions prior to the IFRS transition date have not been adjusted to correspond to the IFRS principles. Their values remain unchanged from Finnish Accounting Standards. Subsidiaries acquired during the fiscal period are included in the consolidated financial statements as of the date of acquisition, while divested subsidiaries are included until the date of divestment. Intra-Group transactions, receiv-ables, liabilities, unrealised margins and internal profit distribution are eliminated in the consolidated financial statements.
All subsidiaries included in the consolidated financial statements are fully owned and the Group does not have minority interests. The Group does not have associates or joint ventures.
As of 1 January 2016, the Qt Group has applied the following new and amended standards:
Amendment to IAS 1 Presentation of Financial State-ments: Disclosure Initiative. The objective of the amend-ments is to encourage entities to exercise their judgement in presenting their financial reports. The amendments provide guidance on issues such as the application of the
Key Figures / Board of Directors’ Report / Financial statements / CG / Information for Shareholders

23Annual Report 2016
concept of materiality and the use of discretion in deter-mining the order of the notes to the financial statements. The amendments are not estimated to have a material effect on Qt Group's consolidated financial statements.
Amendments to IAS 16 Property, Plant and Equipment and IAS 38 Intangible Assets – Clarification of Acceptable Methods of Depreciation and Amortisation: The amend-ments provide clarification to IAS 16 and IAS 38. Reve-nue-based depreciation methods are not applicable to property, plant and equipment, and only rarely to intangi-ble assets. The amendments have had no effect on the Qt Group's consolidated financial statements.
Amendments to IFRS 10 Consolidated Financial State-ments, IFRS 12 Disclosure of Interests in Other Entities and IAS 28 Investments in Associates – Investment Enti-ties: Applying the Consolidation Exception: Narrow-scope amendments to IFRS 10, IFRS 12 and IAS 28 clarify the accounting requirements for investment entities. The amendments also provide for reliefs in certain conditions, which lower the expenses arising from the application of the standard. The amendments have had no effect on the Qt Group's consolidated financial statements.
Amendments to IAS 27 Separate Financial State-ments – Equity Method in Separate Financial Statements: Following the amendments, entities are able to account for investments in subsidiaries, associates and joint ventures at cost in separate financial statements. The amendments have had no effect on the Qt Group's consolidated financial statements.
Annual Improvements to IFRSs, cycle 2012–2014: In the Annual Improvements procedure, minor and less urgent changes to the standards are gathered together and carried out once a year. The changes concern four
standards. The effects of the amendments vary depending on the standard but are not material.
Foreign currency translationItems referring to the earnings and financial position of the Group’s units are recognised in the currency that is the main currency of the unit’s primary operating environ-ment (“functional currency”). The consolidated financial statements are given in euros, which is the operating and presentation currency of the parent company.
Receivables and liabilities denominated in foreign currencies have been converted into euro at the exchange rate in effect on the balance sheet date. Gains and losses arising from foreign currency transactions are recognised through profit or loss. Foreign exchange gains and losses from operations are included in the corresponding items above operating profit.
The income statements of non-Finnish consolidated companies have been converted into euro at the weighted average exchange rate for the period, and their balance sheets have been converted at the exchange rate quoted on the balance sheet date. Translation differences arising from the application of the cost method are treated as items adjusting consolidated shareholders’ equity.
Accounting principles requiring management’s judgement and key uncertainties relating to the use of estimates
Estimates and assumptions regarding the future have to be made during the preparation of the financial state-
ments, and the outcome may differ from the estimates and assumptions. Furthermore, the application of account-ing policies requires judgment. These estimates and assumptions are based on historical experience and other justifiable assumptions that are believed to be reasonable under the circumstances and that serve as a foundation for evaluating the items included in the financial statements.
Accounting principles requiring management’s judgement The Group’s goodwill is allocated entirely to one cash-gen-erating unit. According to the estimate of the Group’s man-agement, the Group does not have separate independent businesses and, under the current structure, business operations can be monitored most reliably as a single cash-generating unit. In the view of the management, the Group does not have separate itemisable asset groups whose generated cash flows would be largely independent of the cash flows generated by other asset items or asset groups. Accordingly, the Group’s management does not consider it possible to independently allocate asset items to smaller cash-generating units. Key uncertainties relating to the use of estimates Impairment testing is carried out annually to test goodwill and intangible assets with an unlimited useful life and evaluate any indications of impairment. Recoverable amounts from cash generating units are determined as calculations based on value in use. The preparation of these calculations requires the use of estimates.
License revenue is recognised based on the factual substance of the customer contract. Revenue recognition requires a binding contract and complete delivery of the
Key Figures / Board of Directors’ Report / Financial statements / CG / Information for Shareholders

24Annual Report 2016
product. License deal includes first year maintenance fee component in addition to the license component. Based on the type of license, revenue is recognised at point in time. License maintenance fees are periodised pro-rata over the agreement period. The most significant management judgement relates to license deal’s split ratio between license component and maintenance fee compo nent. Con-sulting revenue is recognized for the service as rendered.
IFRS amendments Qt Group has applied Amendment to IAS 1 Presentation of Financial Statements: Disclosure Initiative as from 1 January 2016, which had a minor effect on the notes to the financial statements.
Qt Group has not yet adopted the following new and amended standards and interpretations already issued by the IASB. The Group will adopt them as of the effective date or, if the date is other than the first day of the finan-cial year, from the beginning of the subsequent financial year.
IFRS 15 Revenue from Contracts with Customers (effective for financial years beginning on or after 1 Janu-ary 2018): The new standard replaces current IAS 18 and IAS 11 standards and related interpretations. In IFRS 15, a five-step model is applied to determine when to recognise revenue, and at what amount. Revenue is recognised when (or as) a company transfers control of goods or services to a customer either over time or at a point in time. The
standard also introduces extensive new disclosure require-ments. The impacts of IFRS 15 on Qt Group’s consolidated financial statements have been assessed as follows:
Essential concepts in IFRS 15 have been analysed on the revenue stream level. Qt Groups’s revenue streams consists of licenses, maintenance and consulting. Current revenue recognition in Qt Group is based on transfer of risks and rewards to customer. Licenses are right-to-use type of licenses and usually recognised at a point in time, if not subject to usage by the client. As such, based on pre-liminary analysis timing of their revenue recognition is not expected to change significantly. During 2017, Qt Group will continue the analysis in more detail.
IFRS 9 Financial Instruments (effective for finan-cial years beginning on or after 1 January 2018): IFRS 9 replaces the existing guidance in IAS 39. The new stand-ard includes revised guidance on the classification and measurement of financial instruments, including a new expected credit loss model for calculating impairment on financial assets, and the new general hedge accounting requirements. It also carries forward the guidance on rec-ognition and derecognition of financial instruments from IAS 39. The impacts of IFRS 9 on Qt Group's consolidated financial statements will be assessed in more detail during 2017.
IFRS 16 Leases (effective for financial years beginning on or after 1 January 2019). The new standard replaces the current IAS 17 standard and related interpretations. IFRS 16 requires the lessees to recognise the lease agree-ments on the balance sheet as right-of-use assets and
lease liabilities. The accounting model is similar to current finance lease accounting according to IAS 17. There are two exceptions available, these relate to either short term contacts in which the lease term is 12 months or less, or to low value items i.e. assets of value USD 5,000 or less. The standard will have an effect on the consolidated financial statements, and Qt Group will assess the effects of the standard during 2017.
Amendments to IAS 7 Statement of Cash Flows- Dis-closure Initiative (effective for financial years beginning on or after 1 January 2017). The changes were made to enable users of financial statements to evaluate changes in liabilities arising from financing activities, including both changes arising from cash flow and non-cash changes. The amendments have an impact on the disclosures in the consolidated financial statements.
Key Figures / Board of Directors’ Report / Financial statements / CG / Information for Shareholders

25Annual Report 2016
1. ACQUIRED AND SOLD BUSINESSES
Businesses acquired in 2016No acquisitions were made in fiscal year 2016.
Businesses acquired in 2015 The Qt Company Oy, which is part of the Qt Group, acquired The Qt Company, The Qt Company AS and The Qt Company GmbH in an internal acquisition within the Digia Group. No goodwill was created by the acquisitions.
2. NET SALES BREAKDOWN BY BUSINESS AND GEOGRAPHICAL AREA
Revenue recognition principlesLicense revenue is recognised based on the factual substance of the customer con-tract. Revenue recognition requires a binding contract and complete delivery of the product. License deal includes first year maintenance fee component in addition to the license component. Based on the type of license, revenue is recognised at point in time. License maintenance fees are periodised pro-rata over the agreement period. The most significant management judgement relates to license deal’s split ratio between license component and maintenance fee compo nent. Consulting revenue is recognized for the service as rendered.
Operating segmentsThe Group reports one business segment that provides its customers with software development tools. The Group’s highest operational decision-maker is the Presi-dent and CEO together with the Group Management Team. Due to Qt Group’s busi-ness model, nature of operations and governance structure, the reported segment covers the entire Group, and its figures are congruent with the consolidated figures.
EUR thousand 2016 2015
Licence sales and consulting 21 073 15 605
Maintenance revenue 11 322 11 329
Total net sales 32 395 26 934
EUR thousand 2016 2015
North America 13 327 11 706
Other countries 19 068 15 228
Total net sales 32 395 26 934
Net Sales
No single customer of the Group represents over 10 % of the consolidated group net sales.
Key Figures / Board of Directors’ Report / Financial statements / CG / Information for Shareholders

26Annual Report 2016
3. OTHER OPERATING INCOME
Other operating income consists of income that is not attributable to the Group’s actual business. Other operating income is primarily comprised of public grants and income from organised events.
Public grants are recognised once it is reasonably certain that they will be received and the Group meets the conditions for receiving the grant.
Public grants are recognised through profit or loss for the period during which the right to receive the grant arises. The Group’s public grants are presented in other operating income.
EUR thousand 2016 2015
Grants 0 1 158
Other income 528 663
Total 528 1 821
4. MATERIALS AND SERVICES
EUR thousand 2016 2015
Purchases during the period 34 0
External services 2 279 1 003
Total 2 313 1 003
External services are mainly comprised of outsourcing services and subcontracting.
Key Figures / Board of Directors’ Report / Financial statements / CG / Information for Shareholders

27Annual Report 2016
5. PERSONNEL EXPENSES
Employee benefits
Pension liabilitiesPension plans are categorised as defined benefit or defined contribution plans. In defined contribution plans, the Group makes fixed contributions to a pension insurance company, and the Group does not have a legal or factual obligation to make additional contributions. Payments made to defined contribution plans are recognised through profit or loss as personnel expenses for the period to which the payment applies. The Group’s pension schemes are categorised as defined contribution plans.
EUR thousand 2016 2015
Wages and salaries 18 763 14 769
Pension costs (defined contribution plans) 1 415 1 067
Share-based incentive schemes/Share-based payments 1 350 299
Other personnel expenses 1 462 1 213
Total 22 990 17 348
Group’s personnel on average 2016 2015
Finland 64 52
Europe & APAC 118 106
North America 27 22
Total 209 180
Information on share-based payments and schemes is presented in Note 18 Share-based payments.
Key Figures / Board of Directors’ Report / Financial statements / CG / Information for Shareholders

28Annual Report 2016
6. RESEARCH AND DEVELOPMENT COSTS
Research expenses are expensed through profit or loss for the period during which they occur. Development expenses are capitalised only if the Group meets the requirements of IAS 38 for the capitalisation of development expenses. Capitalised development expenses are depreciated over their useful lives. An asset is depreciated starting from when it is ready to use. An asset that is not yet ready to use is tested annually for impairment. Capitalised development expenses are measured at cost less accumulated depreciation and impairment after the initial recognition. Other development expenses are recognised as expenses. The Group did not have capitalised development costs on 31 December 2016.
Development costs previously recognised as expenses are not capital-ised in subsequent periods. Research and development costs recognised as expenses are included in personnel expenses and other operating expenses in the consolidated income statement.
EUR thousand 2016 2015
Research and development costs 8 347 7902
Total 8 347 7 902
7. DEPRECIATION, AMORTISATION AND IMPAIRMENT
EUR thousand 2016 2015
Depreciation and amortisation by asset category
Intangible assets
Software and licences 129 145
Intellectual property rights 419 564
Property, plant and equipment
Machinery and equipment 318 245
Total depreciation, amortisation and impairment 866 954
No impairment of tangible or intangible assets was recognised in the fiscal year 2016 or the comparison period in 2015. No regular amortisation is booked on goodwill. Instead, goodwill is tested for impair-ment annually and when there are indications of impairment. More information on the impairment testing of goodwill is provided in Note 12. Intangible assets.
Key Figures / Board of Directors’ Report / Financial statements / CG / Information for Shareholders

29Annual Report 2016
8. OTHER OPERATING EXPENSES
EUR thousand 2016 2015
External services 1 727 1 455
IT expenses 1 988 639
Sales and marketing 725 1 178
Costs of premises 1 333 1 005
Travel expenses 1 301 813
Other expenses 1 416 972
Other operating expenses Digia Group 0 1 601
Total 8 489 7 663
Other operating expenses include, among other things, HR and administrative expenses
Auditors’ fees
Audit * 35 0
Other statutory assignments 0 3
Tax counselling 38 30
Other services 2 61
Total 75 94
9. FINANCIAL INCOME AND EXPENSES
Financial income EUR thousand 2016 2015
Exchange rate gains 526 671
Other financial income 4 37
Total 529 708
Financial income EUR thousand 2016 2015
Interest expenses for financing loans 510 9
Interest expenses for financing loans from the Digia Group - 41
Exchange rate losses 510 750
Other financial expenses 51 103
Total 1 071 903
Interest expenses for 2016 included EUR 210 thousand of loan administration fees associated with the withdrawn loan.
*In the comparison year, it was agreed that the audit fee be charged to Digia.
The Group’s auditor for 2015 and 2016 was KPMG Oy Ab.
Key Figures / Board of Directors’ Report / Financial statements / CG / Information for Shareholders

30Annual Report 2016
10. INCOME TAXES
EUR thousand 2016 2015
Taxes for the period 222 361
Taxes for previous periods −170 30
Other items 211 186
Deferred tax −793 33
Total −530 610
Reconciliation of tax expenses with the tax rate of the Group’s home country (20%)
Earnings before tax −2 277 1 591
Taxes calculated at the parent company’s tax rate −455 318
Effect of deviating tax rates of foreign subsidiaries 102 208
Income not subject to tax -168 −1
Non-deductible expenses and other differences 66 39
Unrecognised deferred tax assets for losses during the period 0 75
Other items 96 -59
Taxes for previous periods -170 30
Total -530 610
Effective tax rate 23 % 38 %
The Group’s tax expense is comprised of the tax based on the taxable profit of each Group company for the period and change in deferred tax assets and liabilities. The tax based on the taxable income for the period is calculated using the tax rate pre-scribed or practically confirmed by the closing date of the reporting period. Deferred tax assets or liabilities are recognised for temporary differences between the taxa-tion and accounting values of assets and liabilities using the tax rate prescribed or practically confirmed by the closing date of the reporting period. Temporary differ-ences arise from, among other things, confirmed tax losses, depreciation differ-ence, provisions and adjustments to the fair values of assets and liabilities made in connection with business acquisitions. Deferred tax liabilities are recognised for the undistributed earnings of subsidiaries if the distribution of profits is probable and will result in tax consequences. Deferred tax liabilities are included in the balance sheet in full, and deferred tax assets in the amount of the estimated probable tax benefit. The tax expense in the income statement is comprised of tax based on the taxable income for the period and deferred taxes. Taxes are recognised through profit or loss, except when they are associated with business combinations or items recognised directly in shareholders’ equity or other comprehensive income. Tax assets or liabil-ities based on the taxable income for the period are presented under current items in the balance sheet, while deferred tax liabilities and assets are presented under non-current items.
Key Figures / Board of Directors’ Report / Financial statements / CG / Information for Shareholders

31Annual Report 2016
11. EARNINGS PER SHARE
2016
Net profit attributable to parent company shareholders (EUR thousand) −1 747
Weighted average number of shares during the financial period, 1,000 shares 20 818
Undiluted earnings per share (EUR/share) −0,08
Undiluted earnings per shareUndiluted earnings per share are calculated by dividing the profit for the period attributable to parent company shareholders by the weighted average number of outstanding shares.
Diluted earnings per share In calculating the diluted earnings per share, the dilution effect of all potential dilu-tive equity shares is taken into account in the weighted average number of shares. Stock options included in the incentive scheme are conditionally issued, and they are taken into account in calculating the diluted earnings per share. The options have a dilution effect when their subscription price is lower than the average market price of the share during the financial period or a shorter period of execution. The dilu-tion effect is the difference between the number of shares issued and the number of shares that would have been issued at the average market price of the shares during the period.
The company does not separately disclose the diluted earnings per share, as the dilution effect would decrease the loss per share for continuing operations.
Key Figures / Board of Directors’ Report / Financial statements / CG / Information for Shareholders

32Annual Report 2016
12. INTANGIBLE ASSETS
Intangible assets:
GoodwillGoodwill corresponds to the proportion of the acqui-sition cost of an acquired entity that exceeds the Group’s share of the net amount of the identifia-ble assets, liabilities and contingent liabilities of the business entity’s net assets on the date of acquisi-tion. Goodwill is recognised at the original cost less accumulated impairment losses. No regular amortisa-tion is booked on goodwill but it is tested annually for impairment. For this purpose, goodwill is allocated to cash generating units. The recoverable amount of the unit is tested annually or more frequently if there are indications of impairment to determine any impair-ment of its carrying amount.
Research and development costs Development expenses are capitalised only if the Group meets the requirements of IAS 38 for the capitalisation of development expenses. Capitalised development expenses are depreciated over their useful lives. Cap-italised development expenses are measured at cost less accumulated depreciation and impairment after the initial recognition. Other development expenses are rec-ognised as expenses. The Group did not have capitalised development costs on 31 December 2016.
Other intangible assetsAn intangible asset is recognised in the balance sheet at the original cost in case the cost can be determined relia-bly and it is probable that the expected economic benefit form the asset will flow to the Group. Intangible assets with a limited useful life are and recognised as expenses in the income statement by straight-line depreciation over their useful life and tested for impairment if there are indications of any impairment.
The depreciation periods of other intangible assets are 3–10 years.
Key Figures / Board of Directors’ Report / Financial statements / CG / Information for Shareholders

33Annual Report 2016
EUR thousand Goodwill Intangible
assets Total
Acquisition cost, 1 January 6 562 8 220 14 782
Translation differences and other adjustments 0 34 34
Businesses acquired 0 0 0
Businesses sold 0
Additions 48 48
Disposals 0 0
Transfers between items 0 0
Acquisition cost, 31 December 6 562 8 302 14 864
Accumulated depreciation and impairment, 1 January 0 −2 376 −2 376
Translation differences and other adjustments -17 -17
Businesses sold 0
Depreciation for the period -548 -548
Impairment 0 0
Accumulated depreciation on disposals and transfers 0 0
Accumulated depreciation and impairment, 31 December 0 2 941 2 941
Book value, 1 January 6 562 5 844 12 406
Book value, 31 December 6 562 5 361 11 923
Intangible assets 2016
Key Figures / Board of Directors’ Report / Financial statements / CG / Information for Shareholders

34Annual Report 2016
EUR thousand Goodwill
Other intangible
assets Total
Acquisition cost, 1 January 6 562 8 070 14 632
Translation differences and other adjustments 0 0 0
Businesses acquired 0 0 0
Additions 183 183
Disposals −33 −33
Transfers between items 0 0
Acquisition cost, 31 December 6 562 8 220 14 782
Accumulated depreciation and impairment, 1 January 0 −1 667 −1 667
Translation differences and other adjustments 0 0 0
Depreciation for the period −709 −709
Impairment 0 0
Accumulated depreciation on disposals and transfers 0 0
Accumulated depreciation and impairment, 31 December 0 −2 376 −2 376
Book value, 1 January 6 562 6 403 12 965
Book value, 31 December 6 562 5 844 12 406
Intangible assets2015
Key Figures / Board of Directors’ Report / Financial statements / CG / Information for Shareholders

35Annual Report 2016
Impairment testing:
On each balance sheet date, the company estimates whether there is evidence that the value of an asset may have been impaired. If there is evidence of impairment, the amount recoverable from the asset is estimated. In addition, the recoverable amount is estimated annually on the following assets regardless of whether there is an indication of impairment or not: goodwill and intangible assets with an unlimited useful life. Qt Group is the cash generating unit to which the entire tested asset is allocated in the testing.
The need for impairment is reviewed at the level of cash generating units, which refers to the lowest level of unit that is mainly independ-ent of other units and whose cash flows can be separated from other cash flows. If the carrying amount exceeds the recoverable amount, an impairment loss is recognised in the income statement. An impairment loss recognised for goodwill will not be reversed under any circumstances.
The table below shows the distribution of goodwill and values subject to testing at the end of the reporting period.
Key Figures / Board of Directors’ Report / Financial statements / CG / Information for Shareholders

36Annual Report 2016
EUR thousand
Identified intangible
assets Goodwill Other items
Total value subject
to testing
5 228 6 562 2 319 14 109
EUR thousand
Identified intangible
assets Goodwill Other items
Total value subject
to testing
5 647 6 562 1 959 14 168
Impairment testing in 2016
Impairment testing in 2015
During the 2016 financial period, identified intangible assets were depreciated by EUR 419,000.
Based on impairment testing by the management, no need for recognising impairment losses was found during the 2016 financial period.
The present values for Qt Group’s assets were cal-culated for the five-year forecast period based on the following assumptions in the testing: net sales and oper-
ating profit for 2017 according to budget, in the five-year forecast period, average annual growth in net sales of 20.2 per cent and “terminal period” growth 1 per cent thereaf-ter, operating profit 15.8 per cent and a pre-tax discount rate of 12.4 per cent.
Based on sensitivity analyses, the company’s man-agement considers it improbable that a change in the key parameters used in the testing (growth in net sales, total
expenses, interest rates) would result in a situation in which the value of the tested asset exceeded the recover-able amount. Based on the sensitivity analysis made, the amount of Qt Group’s tested assets requires an average growth of 10 per cent in the five-year forecast period, even if the costs for 2017 were allowed to grow according to the budget and moderately even after that with profitabil-ity being 6.2 per cent at the end of the forecast period.
During the 2015 financial period, identified intangible assets were depreciated by EUR 564,000.
The present values for the Qt business were cal-culated for the five-year forecast period based on the following assumptions in the testing: net sales and oper-ating profit for 2016 according to budget, in the five-year
forecast period, average annual growth in net sales 6.5 per cent and “terminal period” growth 5.5 per cent thereafter, operating profit 4.5 per cent and a pre-tax discount rate of 8.5 per cent. Post-forecast-period cash flows were extrap-olated using the same assumptions as for the forecast period.
According to the completed sensitivity analysis, the goodwill of the Qt business requires either net sales to remain at the current level with profitability at 5 per cent, or 5.5 per cent growth in net sales with profitability at 0 per cent.
Key Figures / Board of Directors’ Report / Financial statements / CG / Information for Shareholders
37Annual Report 2016
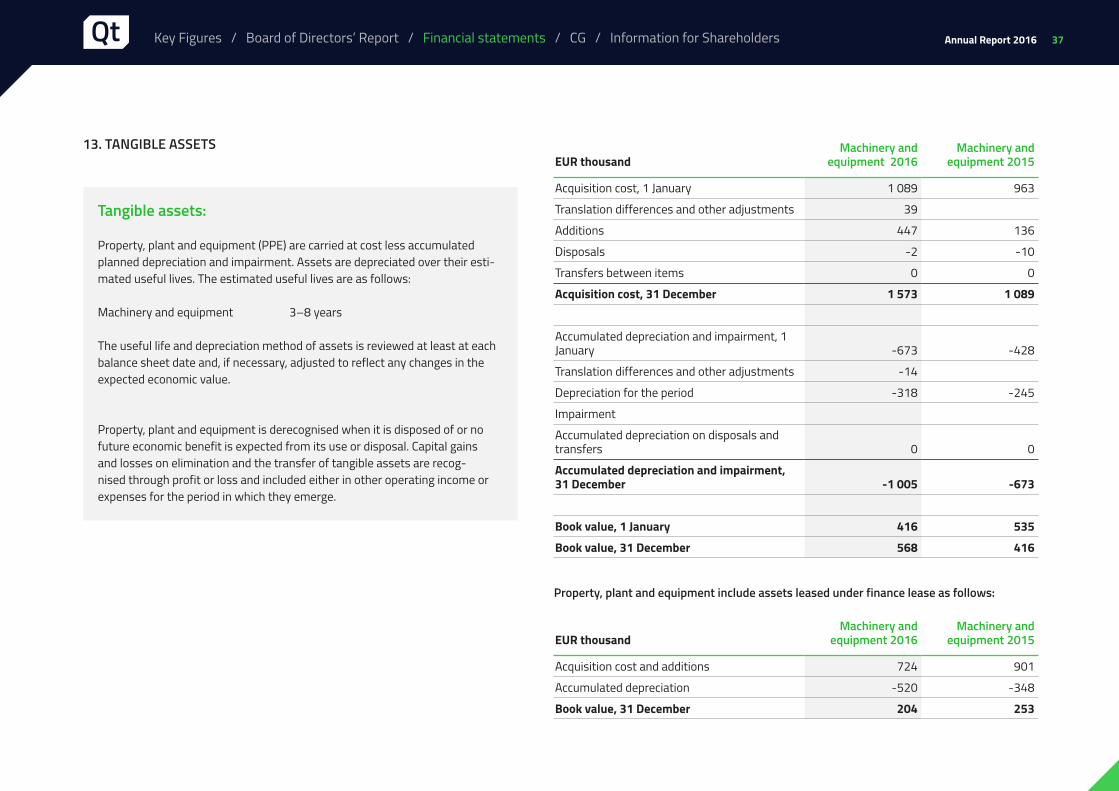
13. TANGIBLE ASSETS
Tangible assets:
Property, plant and equipment (PPE) are carried at cost less accumulated planned depreciation and impairment. Assets are depreciated over their esti-mated useful lives. The estimated useful lives are as follows: Machinery and equipment 3–8 years The useful life and depreciation method of assets is reviewed at least at each balance sheet date and, if necessary, adjusted to reflect any changes in the expected economic value. Property, plant and equipment is derecognised when it is disposed of or no future economic benefit is expected from its use or disposal. Capital gains and losses on elimination and the transfer of tangible assets are recog-nised through profit or loss and included either in other operating income or expenses for the period in which they emerge.
EUR thousand Machinery and
equipment 2016Machinery and
equipment 2015
Acquisition cost, 1 January 1 089 963
Translation differences and other adjustments 39
Additions 447 136
Disposals -2 -10
Transfers between items 0 0
Acquisition cost, 31 December 1 573 1 089
Accumulated depreciation and impairment, 1 January -673 -428
Translation differences and other adjustments -14
Depreciation for the period -318 -245
Impairment
Accumulated depreciation on disposals and transfers 0 0
Accumulated depreciation and impairment, 31 December -1 005 -673
Book value, 1 January 416 535
Book value, 31 December 568 416
EUR thousand Machinery and
equipment 2016Machinery and
equipment 2015
Acquisition cost and additions 724 901
Accumulated depreciation -520 -348
Book value, 31 December 204 253
Property, plant and equipment include assets leased under finance lease as follows:
Key Figures / Board of Directors’ Report / Financial statements / CG / Information for Shareholders

38Annual Report 2016
EUR thousand 1.1.2016Recognised
in profit or loss 31.12.2016
Deferred tax assets:
Confirmed losses 0 843 843
Other items 24 48 72
Total 24 891 915
Deferred tax liabilities:
From allocation of the fair values of acquisitions 195 58 253
Other items 0 40 40
Total 195 98 293
EUR thousand 1.1.2015Recognised
in profit or loss 31.12.2015
Deferred tax assets:
Other items - 25 24
Total 0 25 24
Deferred tax liabilities:
From allocation of the fair values of acquisitions 136 59 195
Total 136 59 195
Changes in deferred tax during 2016:
Changes in deferred tax during 2015:
14. DEFERRED TAX ASSETS AND LIABILITIES
The accounting principles relating to income taxes are presented in Note 10. Income taxes.
Key Figures / Board of Directors’ Report / Financial statements / CG / Information for Shareholders

39Annual Report 2016
15. TRADE AND OTHER RECEIVABLES
EUR thousand 2016 2015
Trade receivables 7 741 5 411
Trade receivables from Digia Group 112
Lease security deposits 108 104
Tax receivable based on net profit 0 103
Accrued income 1 043 833
VAT receivable 145 0
Other receivables 545 866
Total 9 582 7 429
EUR thousand 2016 2015
Undue trade receivables 4 247 3 974
Trade receivables 1–30 days overdue 1 265 756
Trade receivables 31–60 days overdue 416 256
Trade receivables over 60 days overdue 1 813 425
Total 7 741 5 411
The Group has recognised a bad debt accrual of EUR 167,000 in trade receivables in the 2016 financial statements (2015: EUR 160,000). The carrying amount of the trade receivables is a moderate estimate of their fair value.
Key Figures / Board of Directors’ Report / Financial statements / CG / Information for Shareholders

40Annual Report 2016
16. CASH AND CASH EQUIVALENTS 17. NOTES TO SHAREHOLDERS’ EQUITY
EUR thousand 2016 2015
Bank accounts 6 420 3 577
Total 6 420 3 577
Number of shares
Share capital (EUR thousand)
1.5.2016 20 818 273 500
31.12.2016 20 818 273 500
Cash and cash equivalents are comprised of cash assets, short-term bank deposits and other very liquid short-term investments with a period of maturity of no more than three months.
Share capital and number of sharesQt Group Plc was established in connection with the demerger of Digia Plc. The share capital of Qt Group Plc, EUR 500,000.00, was registered on the registration date of the execution of the demerger, and the number of Qt Group Plc shares ended up as 20,818,273 shares.
Translation differenceTranslation difference includes the exchange rate differences from the translation of the financial statements of foreign units.
Unrestricted shareholders’ equity reserveThe unrestricted shareholders’ equity reserve was formed in connection with the demerger on 1 May 2016.
Treasury sharesThe company did not hold any treasury shares during the 2016 financial period.
Key Figures / Board of Directors’ Report / Financial statements / CG / Information for Shareholders

41Annual Report 2016
18. SHARE-BASED PAYMENTS
Share-based incentive scheme 2016–2019 The Board of Directors of Qt Group Plc decided on 22 June 2016 to issue stock options to the key persons of the company or its Group companies. There are particularly weighty economic reasons for the Company to issue stock option rights, as the stock option rights are intended to be part of the Company’s long-term incentive and com-mitment scheme for key personnel. The maximum total number of stock options issued is 2,000,000, and they entitle their holders to subscribe for a maximum total of 2,000,000 new shares in the company. Each stock option entitles its holder to subscribe for one (1) new share in the company or an existing share held by the company. The
share subscription price shall be credited to the company’s reserve for invested unrestricted equity.
The share subscription period for the stock options shall be 19 December 2019–31 December 2022. A pre-condition for the share subscription is that the value of the company’s share based on the trade volume weighted average quotation on the NASDAQ OMX Helsinki Ltd is at least five euros and eighty-five cents (EUR 5.85) between 18 November 2019 and 13 December 2019.
The share subscription price for the stock options shall be the trade volume weighted average quotation of the company’s share between 1 June 2016 and 30 June 2016 and the share subscription price shall, nevertheless, always amount to at least the highest share price quoted on the closing day 22 June 2016 when the stock options have been issued and assigned to the key persons added with one euro cent (EUR 0.01). The share subscription price for the stock options may decline in certain special situations.
Share-based incentive scheme 2016–2019
Grant date 22.6.2016
Nature of the scheme Stock options
Target group Key personnel
Share-based remuneration, maximum number of shares 2 000 000
Subscription period 19 January 2019–31 December 2022
Vesting conditions Development of Qt Group Plc’s share price
Execution As shares
Persons (31 December 2016) 17
The Group has a share-based incentive scheme where payments are made in equity instruments. The stock option programme is a market-based incentive scheme pursuant to IFRS 2. The benefits granted through the scheme are measured at fair value on the date of their being granted and recog-nised as expenses evenly during the vesting period. The impact of these arrangements on the financial results is shown under personnel expenses with retained earnings as the counter-item.
The expense determined at the time of granting stock options is based on the Group’s estimate of the number of stock options assumed to be earned at the end of the vesting period. The Group updates the estimate of the final number of stock options on the closing date of each reporting period.
Key Figures / Board of Directors’ Report / Financial statements / CG / Information for Shareholders

42Annual Report 2016
Share-based incentive scheme 2015–2018
Grant date 12.3.2015
Nature of the scheme Shares and cash
Target group President and CEO
Share-based remuneration, maximum number of shares 985 000
Earning period begins, date 12.3.2015
Earning period ends, date 12.3.2018
Vesting conditions Development of Digia Plc’s share price
Execution Shares and cash
Share-based incentive scheme 2015–2018 The Board of Directors of Digia Plc decided on 12 March 2015 on establishing new share-based incentive schemes for the company’s President and CEO and other members of senior management. Based on the decision, there are separate schemes for Digia’s domestic business opera-tions and the Qt business.
The Qt scheme included one earning period ranging until March 2018. The reward pursuant to the scheme was tied to the development of Digia Plc’s share price by the end of said earning period. If the price of the share reaches the targets set in the scheme in full, the company’s President and other key personnel of the Qt business covered by the scheme will have the right to a reward amounting to a maximum of 985,000 Digia Plc shares at the end of the earning period. The rewards pursuant to the scheme will be paid as a combination of shares and cash so that the
cash amount will cover the taxes and other statutory fees resulting from the reward, and the rest of the reward will be paid to the recipient as shares. The Qt scheme addition-ally included a special condition under which the scheme will expire in case of a demerger of Digia and Qt. Thus, a reward was granted to the persons covered by the scheme based on the share price at the time of the demerger during 2016.
Effect of share-based incentive schemes on the net profit
EUR thousand 2016 2015
Share-based incentive scheme 2016–2019 211
Share-based incentive scheme 2015–2018 1 139 299
Total 1 350 299
Key Figures / Board of Directors’ Report / Financial statements / CG / Information for Shareholders

43Annual Report 2016
EUR thousand 2016 2015
Bank loans 6 000 0
Liabilities to Digia Group 0 414
Finance lease liabilities 152 139
Accounts payable 774 411
Advances received 8 324 6 693
Accrued charges and deferred credits 4 502 3 805
Other liabilities 617 1 608
Total 20 369 13 070
19. ACCOUNTS PAYABLE AND OTHER LIABILITIES
Accrued charges and deferred credits are primary comprised of allocations of wages and salaries and personnel expenses. The carrying amount of accounts payable is a moderate estimate of their fair value. The terms of payment of the Group’s accounts payable comply with the ordinary terms of payment of companies.
Key Figures / Board of Directors’ Report / Financial statements / CG / Information for Shareholders

44Annual Report 2016
20. FINANCIAL LIABILITIES AND FINANCIAL RISK MANAGEMENT
Financial liabilities are initially measured at fair value. Financial liabilities are subsequently measured at cost allocated using the effective rate method. Financial liabilities are included in long- and short-term liabilities. Financial liabilities are categorised as long- term liabilities when they mature in more than 12 months. Liabilities maturing in less than 12 months are categorised as short-term.
2016 2015
EUR thousand Balance
sheet values Fair valuesBalance
sheet values Fair values
Long-term
Liabilities to Digia Group - - 690 690
Finance lease liabilities 55 55 122 122
Total 55 55 812 812
Short-term
Bank loans 6 000 6 200 - -
Liabilities to Digia Group - - 414 414
Finance lease liabilities 152 152 139 139
Total 6 152 6 352 553 553
Financial liabilities
All of the financial liabilities are denominated in euros.
Key Figures / Board of Directors’ Report / Financial statements / CG / Information for Shareholders

45Annual Report 2016
EUR thousand 2017 2018 2019 Total
Bank loans 6 000 6 000
Finance lease liabilities 152 44 11 207
Total 6 152 44 11 6 207
EUR thousand 2016 2017 2018 Total
Liabilities to Digia Group 141 690 1 104
Finance lease liabilities 139 87 35 261
Total 553 777 35 1 365
Maturity of liabilities
2016
2015
Key Figures / Board of Directors’ Report / Financial statements / CG / Information for Shareholders

46Annual Report 2016
Financial risk management The Group is exposed to certain financial risks during the normal course of its business. The Group’s management regularly monitors the financial risks associated with business operations. The objective of the Group’s risk management is to minimise the adverse effects of the financial risks on the Group's earnings and balance sheet. The financial risks are mainly comprised of the credit risk and liquidity risk related to counterparties and fluctuation of market interest rates and exchange rates. The Group does not apply hedge accounting pursuant to IAS 39, and the Group has not held any derivative instruments during the financial period or the previous financial period.
Credit risk:Credit risk management and credit control are coordinated by the Group’s financial function, which acts in coopera-tion with the business units. The Group’s policy defines creditworthiness requirements for customers in order to minimise the amount of credit losses. A credit loss is rec-ognised for trade receivables when there is objective evi-dence that the receivables will not be received in full under the original terms and conditions. A sufficient provision was made for uncertain accounts receivable at the end of the fiscal period.
The maturity breakdown of trade receivables is pre-sented in Note 15 Trade and other receivables.
Foreign exchange rate risk:The existing foreign exchange rate risk is comprised of currency-denominated commercial transactions, mone-tary items on the balance sheet and net investments in foreign subsidiaries. Of the Group’s cash flows, the biggest currency exposures arise from EUR and USD. The Group has both income and expenses in both main currencies, which significantly limits the foreign exchange risk. The company monitors the development of currency exposure as the operations expand and as non-USD-denominated currency items increase, which might lead to the adoption of an active hedging policy in the company. At the end of the fiscal year, the company had no hedging instruments in force and the Group does not apply hedge accounting.
Liquidity risk: Liquidity risk is associated with the sufficiency of financ-ing required by the Group’s working capital, repayment of loans, investment expenses and growth, and maintaining its continuity. The purpose of liquidity risk management is to continuously maintain a sufficient level of liquidity. To manage the risk, the Group continuously assesses the amount of financing required by business operations so that the Group has sufficient liquid assets for financing its operations and repaying maturing loans. Interest rate risk:The Group has one bank loan with a fixed interest rate withdrawn in 2016. Thus, the Group is not exposed to interest rate risk due to changes in market interest rates.
Key Figures / Board of Directors’ Report / Financial statements / CG / Information for Shareholders
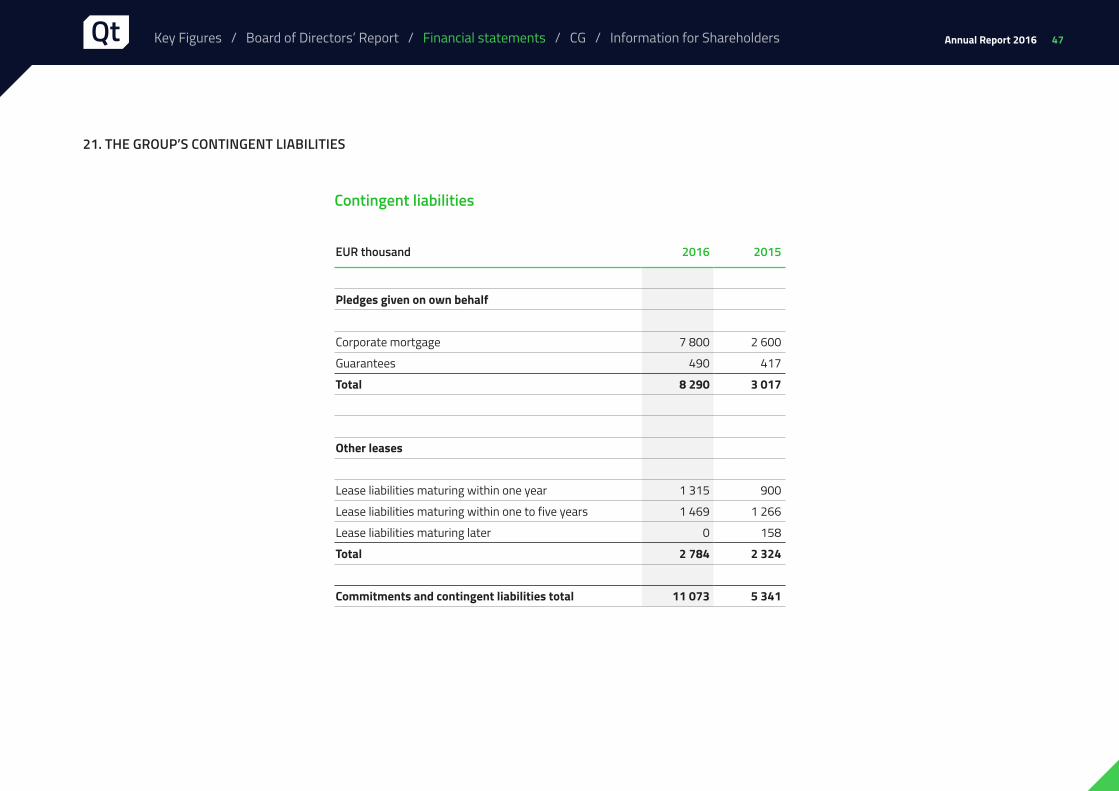
47Annual Report 2016
21. THE GROUP’S CONTINGENT LIABILITIES
Contingent liabilities
EUR thousand 2016 2015
Pledges given on own behalf
Corporate mortgage 7 800 2 600
Guarantees 490 417
Total 8 290 3 017
Other leases
Lease liabilities maturing within one year 1 315 900
Lease liabilities maturing within one to five years 1 469 1 266
Lease liabilities maturing later 0 158
Total 2 784 2 324
Commitments and contingent liabilities total 11 073 5 341
Key Figures / Board of Directors’ Report / Financial statements / CG / Information for Shareholders
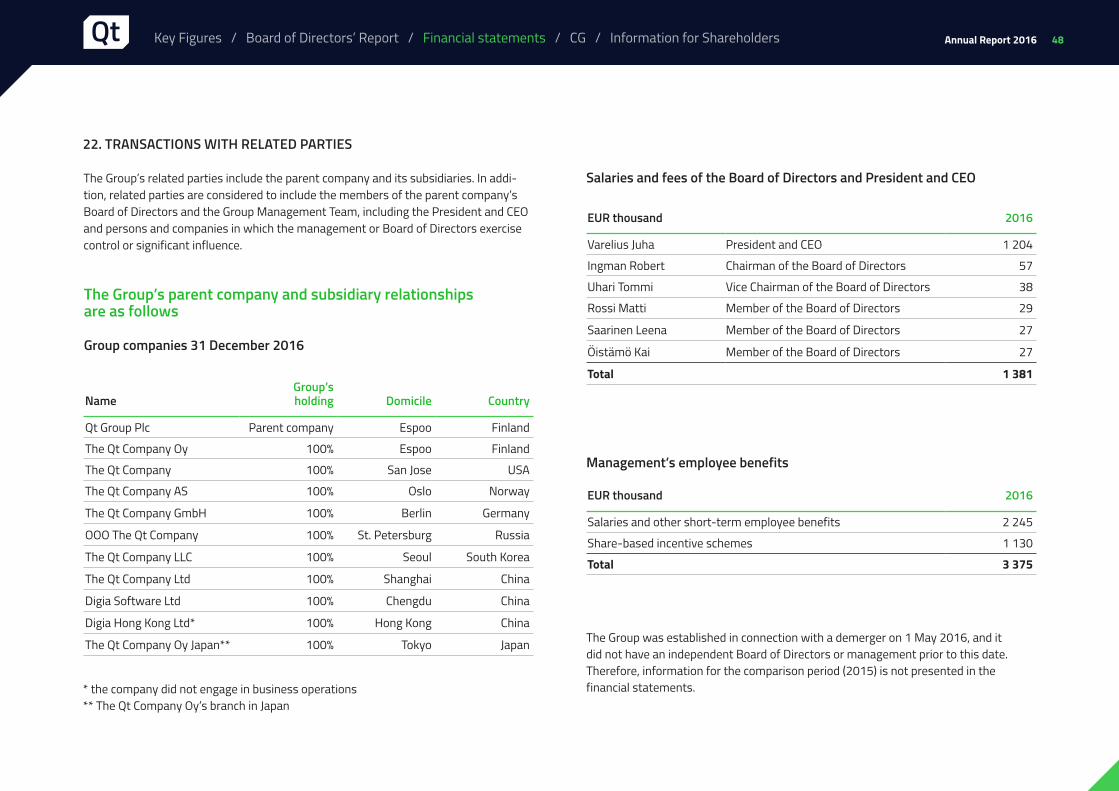
48Annual Report 2016
22. TRANSACTIONS WITH RELATED PARTIES
The Group’s related parties include the parent company and its subsidiaries. In addi-tion, related parties are considered to include the members of the parent company’s Board of Directors and the Group Management Team, including the President and CEO and persons and companies in which the management or Board of Directors exercise control or significant influence.
The Group’s parent company and subsidiary relationships are as follows
Group companies 31 December 2016
NameGroup’sholding Domicile Country
Qt Group Plc Parent company Espoo Finland
The Qt Company Oy 100% Espoo Finland
The Qt Company 100% San Jose USA
The Qt Company AS 100% Oslo Norway
The Qt Company GmbH 100% Berlin Germany
OOO The Qt Company 100% St. Petersburg Russia
The Qt Company LLC 100% Seoul South Korea
The Qt Company Ltd 100% Shanghai China
Digia Software Ltd 100% Chengdu China
Digia Hong Kong Ltd* 100% Hong Kong China
The Qt Company Oy Japan** 100% Tokyo Japan
* the company did not engage in business operations ** The Qt Company Oy’s branch in Japan
The Group was established in connection with a demerger on 1 May 2016, and it did not have an independent Board of Directors or management prior to this date. Therefore, information for the comparison period (2015) is not presented in the financial statements.
Salaries and fees of the Board of Directors and President and CEO
Management’s employee benefits
EUR thousand 2016
Varelius Juha President and CEO 1 204
Ingman Robert Chairman of the Board of Directors 57
Uhari Tommi Vice Chairman of the Board of Directors 38
Rossi Matti Member of the Board of Directors 29
Saarinen Leena Member of the Board of Directors 27
Öistämö Kai Member of the Board of Directors 27
Total 1 381
EUR thousand 2016
Salaries and other short-term employee benefits 2 245
Share-based incentive schemes 1 130
Total 3 375
Key Figures / Board of Directors’ Report / Financial statements / CG / Information for Shareholders
49Annual Report 2016
23. EVENTS AFTER THE CLOSING DATE OF THE REPORTING PERIOD
At its meeting on 15 February 2017, the Board of Directors of Qt Group decided to propose to the Annual General Meeting to be held on 14 March 2017 that the Board of Directors be authorised to decide on acquiring additional funding of approximately EUR 15 million by means of a share issue based on shareholders’ pre-emptive subscription rights. The Board of Directors proposes to the Annual General Meeting that the Annual General Meeting authorise the Board of Directors to decide on the issuance of at most 4,500,000 new shares or treasury shares in one or more ordinary share issues.
Key Figures / Board of Directors’ Report / Financial statements / CG / Information for Shareholders

50Annual Report 2016
EUR thousand carve-out
1–12/2016carve-out
1–12/2015
Net sales 32 395 26 934
Comparable operating result 291 1 922
- % of net sales 0,9 % 7,1 %
Operating profit -1 736 1 786
- % of net sales -5,4 % 6,6 %
Net profit -1 747 981
- % of net sales -5,4 % 3,6 %
Return on equity % -21,1 % 11,0 %
Return on investment % -12,0 % 25,0 %
Interest-bearing liabilities 6 207 1 364
Cash and cash equivalents 6 420 3 577
Net gearing % 0,7 % -24,8 %
Equity ratio % 40,0 % 54,7 %
Earnings per share, EUR -0,08
Consolidated key figures Calculation formulas for key figures
x 100
x 100
Profit/loss before taxes – taxes
Shareholders’ equity + minority interest (average)
Return on equity
(Profit/loss before taxes + interest and other financing costs)
Balance sheet total – non-interest bearing liabilities (average)
Return on investment:
Interest-bearing liabilities – cash, bank receivables and financial securities
Shareholders’ equity
Gearing
Shareholders’ equity + minority interest
Balance sheet total – advance payments received
Equity ratio
x 100
x 100
Key Figures / Board of Directors’ Report / Financial statements / CG / Information for Shareholders

51Annual Report 2016
Parent company income statement FAS
EUR Note 2016
Net sales
Personnel expenses 1 −1 442 815.66
Depreciation, amortisation and impairment 2 −117 155.43
Other operating expenses 3 −725 721.69
Operating profit −2 285 692.78
Financial expenses 4 −502 653.21
Earnings before tax −2 788 345.99
Income taxes 0.00
Net profit −2 788 345.99
Key Figures / Board of Directors’ Report / Financial statements / CG / Information for Shareholders

52Annual Report 2016
EUR Note 31.12.2016
Non-current assets
Intangible assets
Intangible rights 5 82 768.24
82 768.24
Investments
Holdings in group companies 6 10 256 928.24
Long-term receivables from group companies 6 2 000 000.00
12 256 928.24
Non-current assets total 12 339 696.48
Current assets
Other receivables 19 281.03
Cash in hand and at banks 337 386.82
Current assets total 356 667.85
Total assets 12 696 364.33
Parent company balance sheet FAS
EUR Note 31.12.2016
Shareholders’ equity
Share capital 7 500 000.00
Unrestricted shareholders’ equity reserve 7 8 720 208.70
Net profit 7 −2 788 345.99
6 431 862.71
Short-term liabilities
Loans from financial institutions 8 6 000 000.00
Accounts payable 42 491.19
Other liabilities 20 319.56
Accrued charges and deferred credits 9 201 690.87
6 264 501.62
Shareholders’ equity and liabilities 12 696 364.33
Key Figures / Board of Directors’ Report / Financial statements / CG / Information for Shareholders

53Annual Report 2016
EUR 2016
Net profit before tax −2 788 345.99 Adjustments to net profit 619 502.65 Change in working capital 112 577.38
Interest paid −502 347.22Interest income 0.00Other financial items 0.00Taxes paid 0.00
Cash flow from financial items and taxes −502 347.22 Cash flow from operations −2 558 613.18 Loans granted −2 000 000.00Cash flow from investments −2 000 000.00 Withdrawals of current loans 0.00Repayments of current loans −1 104 000.00Withdrawals of non-current loans 6 000 000.00Repayments of non-current loans 0.00Payments of finance lease liabilities 0.00Cash flow from financing 4 896 000.00 Change in cash and cash equivalents 337 386.82 Cash and cash equivalents at beginning of period 0.00Net foreign exchange difference 0.00Financial assets included in item classified as available for sale 0.00Cash and cash equivalents at end of period 337 386.82
Parent company cash flow statement FAS
Key Figures / Board of Directors’ Report / Financial statements / CG / Information for Shareholders

54Annual Report 2016
Basic information on the parent company and accounting policies applied in the financial statements FAS
Basic information on the company Qt Group Plc is the parent company of Qt Group, and its domicile is Espoo and its registered address is Bertel Jungin aukio D3A, FI-02600 Espoo, Finland. Qt Group Plc’s subsidiary responsible for its operations in Finland is The Qt Company Oy. Qt Group Plc was established in connec-tion with a demerger on 1 May 2016 and, therefore, infor-mation for the comparison period (2015) is not presented in the financial statements. Accounting policies applied in the financial statements The parent company’s financial statements have been prepared in accordance with the Finnish Accounting Stan-dards (FAS). The financial statements are based on original acquisition costs. Acquisition cost-based accounting is discounted to correspond to the fair value, if necessary. Pension arrangements The pension cover of the company’s personnel is provided through statutory pension insurance. Pension contribu-tions and expenses allocated to the financial period are based on confirmation received from the insurance com-pany. Pension expenses are recognised as expenses for the year during which they are incurred. Taxes Taxes recognised in the income statement include taxes based on the net profit for the financial period, adjustments to taxes for previous periods.
Tangible and intangible assets Tangible and intangible assets are recognised in the balance sheet at direct acquisition cost less planned dep-reciation. Planned depreciation is based on the following useful lives:
Intangible assets 3–5 years Acquisitions of fixed assets with a useful life of less than three years are recognised as annual expenses. Cash and cash equivalents and loans from financial institutions Cash and cash equivalents include cash assets and bank accounts. Overdraft facilities of accounts are presented in current liabilities on the balance sheet. Loans from financial institutions are included in long- and short-term liabilities on the balance sheet. Interest expenses are recognised as expenses for the period during which they are incurred. Shareholders’ equity and dividends The Board of Directors’ proposal for dividend payout is not recognised in the distributable shareholders’ equity in the financial statements before the approval of the Annual General Meeting.
Key Figures / Board of Directors’ Report / Financial statements / CG / Information for Shareholders

55Annual Report 2016
1. Information on personnel and related parties 3. Other operating expenses
4. Financial income and expenses
2. Depreciation, amortisation and impairment
EUR 2016
Wages and salaries 1 381 597.11
Pension expenses 50 705.81
Other personnel expenses 10 512.74
Total 1 442 815.66
EUR 2016
IT expenses 310 758.99
Expert services 262 594.59
Other expenses 152 368.11
Total 725 721.69
Auditors’ fees
Audit 13 181.65
Total 13 181.65
EUR 2016
Interest expenses for financing loans 502 347.22
Total 502 347.22
EUR 2016
Planned depreciation
Intangible assets 117 155.43
Total 117 155.43
The company’s personnel expenses are comprised of the salaries and fees paid to the President and CEO and the Board of Directors. More detailed information about the related parties is presented in Note 22 Transactions with related parties to the consolidated financial statements.
The company’s auditor for 2015 and 2016 was KPMG Oy Ab.
Interest expenses for 2016 included EUR 210,000 of loan administration fees associated with the withdrawn loan.
Notes to the parent company financial statements FAS
Key Figures / Board of Directors’ Report / Financial statements / CG / Information for Shareholders

56Annual Report 2016
5. Intangible assets
EUR
Intangiblerights2016
Acquisition cost, 1 May 0.00
Assets transferred in connection with the demerger 527 199.54
Acquisition cost, 31 December 527 199.54
Accumulated depreciation and impairment, 1 May 0.00
Accumulated depreciation and amortisation transferred in connection with the demerger −327 275.87
Depreciation and amortisation −117 155.42
Accumulated depreciation and impairment, 31 December −444 431.29
Book value, 1 May 0.00
Book value, 31 December 82 768.25
Intangible assets are primarily comprised of IT software received in connection with the demerger.
Key Figures / Board of Directors’ Report / Financial statements / CG / Information for Shareholders

57Annual Report 2016
6. Investments
Holdings in group companies
Itemisation of shares
Long-term receivables from group companies
EUR 2016
Acquisition cost, 1 May -
Assets transferred in connection with the demerger 10 256 928.24
Acquisition cost, 31 December 10 256 928.24
Book value, 1 May -
Book value, 31 December 10 256 928.24
Group companies Domicile Country HoldingShare
of votes
Digia Hong Kong Ltd Hong Kong China 100% 100%
The Qt Company Oy Espoo Finland 100% 100%
EUR 2016
Long-term loan receivables 2 000 000.00
Total 2 000 000.00
Key Figures / Board of Directors’ Report / Financial statements / CG / Information for Shareholders

58Annual Report 2016
7. Changes in shareholders’ equity
8. Interest-bearing liabilities
9. Accrued charges and deferred credits
10. Pledges given, contingent liabilities and other collateral
EUR 2016
Share capital, 1 May -
Share capital formed in connection with the demerger 500 000.00
Share capital, 31 December 500 000.00
Unrestricted shareholders’ equity reserve, 1 May -
Unrestricted shareholders’ equity reserve formed in connection with the demerger 8 720 208.70
Unrestricted shareholders’ equity reserve, 31 December 8 720 208.70
Net profit (loss) -2 788 345.99
Total shareholders’ equity 6 431 862.71
Calculation of distributable funds
Unrestricted shareholders’ equity reserve 8 720 208.70
Net profit (loss) -2 788 345.99
Total distributable funds 5 931 862.71
EUR 2016
Maturing during the next 12 months 6 000 000.00
Maturing later 0.00
Total 6 000 000.00
EUR 2016
Personnel expense allocations 161 010.28
Other accrued charges and deferred credits 40 680.59
Total 201 690.87
EUR 2016
Pledges given on own behalf
Corporate mortgage 7 800 000.00
Total 7 800 000.00
Board of directors’ dividend proposal Parent company’s net result showed a loss of EUR 2,788 thousand. The Board of Directors of Qt Group Plc proposes to the Annual General Meeting that no dividend be paid for the fiscal year that ended on 31 December 2016.
Key Figures / Board of Directors’ Report / Financial statements / CG / Information for Shareholders

59Annual Report 2016
Signatures to the Financial Statements and the Board of Directors’ Report
Espoo, 15 February 2017
Robert IngmanChairman of the Board of Directors
Matti RossiMember of the Board of Directors
Tommi UhariVice Chairman of the Board of Directors
Leena SaarinenMember of the Board of Directors
Kai ÖistämöMember of the Board of Directors
Juha VareliusPresident and CEO
Auditors’ noteThe report of the audit has been issued today. Espoo, 15 February 2017
KPMG Oy AbAuthorised Public Accountants Kim Järvi, Authorised Public Accountant
Key Figures / Board of Directors’ Report / Financial statements / CG / Information for Shareholders

60Annual Report 2016
Auditor’s Report
To the Annual General Meeting of Qt Group Plc
Report on the Audit of the Financial Statements
OpinionWe have audited the financial statements of Qt Group Plc (business identity code 2733394-8) for the year ended 31 December 2016. The financial statements comprise the consolidated balance sheet, income statement, statement of comprehensive income, statement of changes in equity, statement of cash flows and notes, including a summary of significant accounting policies, as well as the parent company’s balance sheet, income statement, statement of cash flows and notes for the financial period 1 May-31 December 2016.
In our opinion• the consolidated financial statements give a true and
fair view of the group’s financial performance, financial position and cash flows in accordance with International Financial Reporting Standards (IFRS) as adopted by the EU
• the financial statements give a true and fair view of the parent company’s financial performance and financial position in accordance with the laws and regulations governing the preparation of financial statements in Fin-land and comply with statutory requirements.
Basis for OpinionWe conducted our audit in accordance with good auditing practice in Finland. Our responsibilities under good audit-ing practice are further described in the Auditor’s Responsi-bilities for the Audit of the Financial Statements section of our report.
We are independent of the parent company and of the group companies in accordance with the ethical require-ments that are applicable in Finland and are relevant to our audit, and we have fulfilled our other ethical responsibili-ties in accordance with these requirements.
We believe that the audit evidence we have obtained is sufficient and appropriate to provide a basis for our opinion.
MaterialityThe scope of our audit was influenced by our application of materiality. The materiality is determined based on our professional judgement and is used to determine the nature, timing and extent of our audit procedures and to evaluate the effect of identified misstatements on the financial statements as a whole. The level of materiality we set is based on our assessment of the magnitude of misstatements that, individually or in aggregate, could reasonably be expected to have influence on the economic decisions of the users of the financial statements. We have also taken into account misstatements and/or possible misstatements that in our opinion are material for qualita-tive reasons for the users of the financial statements.
Key Audit MattersKey audit matters are those matters that, in our profes-sional judgment, were of most significance in our audit of the financial statements of the current period. These matters were addressed in the context of our audit of the financial statements as a whole, and in forming our opin-ion thereon, and we do not provide a separate opinion on these matters.
We have also addressed the risk of management override of internal controls. This includes consideration of whether there was evidence of management bias that rep-resented a risk of material misstatement due to fraud.
Key Figures / Board of Directors’ Report / Financial statements / CG / Information for Shareholders

61Annual Report 2016
The key audit matterHow the matter wasaddressed in the audit
Valuation of Goodwill – refer to Accounting Principles and Note 12 in the Consolidated Financial Statements
Revenue Recognition of and Valuation of Accounts Receivable – Refer to Accounting Principles and Notes 2 and 15 in the Consolidated Financial Statements
• Goodwill of EUR 6.6 million relates to the acquisition of the Qt business.
• Irrespective of whether there is any indication of impair-ment, goodwill acquired in a business combination is required to be tested for impairment annually. An impair-ment arises when the recoverable amount is less than the carrying value of the investment.
• The assumptions to support goodwill values (e.g. dis-count rate, profitability and growth rates) are judgmen-tal.
• Revenue recognition is one of the key areas of focus, in respect of the risk of management override and the timing of revenue for license, maintenance and consul-ting income.
• Accounts receivable include management estimate rela-ting to valuation of overdue accounts receivable.
• We have tested controls over revenue recognition, inclu-ding timing of revenue recognition, as well as performed substantive testing.
• We have assessed the recoverability of overdue accounts receivable and the related evidence as well as challenged the management’s assessment of the bad debt provi-sion.
• We have assessed the assumptions used in respect of discount rate, profitability as well as forecast growth rates and involved valuation experts to assess the appropriateness of the discount rates used which include comparison to economic and industry forecasts where appropriate as well as perform audit procedures on tech-nical appropriateness of the calculations.
• We have applied professional judgment when evaluating the forecasts by testing key assumptions, assessing the impact of the sensitivity analysis as well as reconciling those to the forecasts approved by the board of direc-tors.
• In addition, we have assessed the adequacy and appro-priateness of the notes in the financial statements on goodwill and impairment testing.
Key Figures / Board of Directors’ Report / Financial statements / CG / Information for Shareholders

62Annual Report 2016
Responsibilities of the Board of Directors and the President and CEO for the Financial StatementsThe Board of Directors and the President and CEO are responsible for the preparation of consolidated financial statements that give a true and fair view in accordance with International Financial Reporting Standards (IFRS) as adopted by the EU, and of financial statements that give a true and fair view in accordance with the laws and regu-lations governing the preparation of financial statements in Finland and comply with statutory requirements. The Board of Directors and the President and CEO are also responsible for such internal control as they determine is necessary to enable the preparation of financial state-ments that are free from material misstatement, whether due to fraud or error.
In preparing the financial statements, the Board of Directors and the President and CEO are responsible for assessing the parent company’s and the group’s ability to continue as going concern, disclosing, as applicable, mat-ters relating to going concern and using the going concern basis of accounting. The financial statements are prepared using the going concern basis of accounting unless there is an intention to liquidate the parent company or the group or cease operations, or there is no realistic alternative but to do so.
Auditor’s Responsibilities for the Audit of the Financial StatementsOur objectives are to obtain reasonable assurance on whether the financial statements as a whole are free from material misstatement, whether due to fraud or error, and to issue an auditor’s report that includes our opinion. Rea-sonable assurance is a high level of assurance, but is not
a guarantee that an audit conducted in accordance with good auditing practice will always detect a material mis-statement when it exists. Misstatements can arise from fraud or error and are considered material if, individually or in aggregate, they could reasonably be expected to influ-ence the economic decisions of users taken on the basis of the financial statements.
As part of an audit in accordance with good auditing practice, we exercise professional judgment and maintain professional scepticism throughout the audit. We also:
• Identify and assess the risks of material misstatement of the financial statements, whether due to fraud or error, design and perform audit procedures responsive to those risks, and obtain audit evidence that is sufficient and appropriate to provide a basis for our opinion. The risk of not detecting a material misstatement resulting from fraud is higher than for one resulting from error, as fraud may involve collusion, forgery, intentional omissions, misrepresentations, or the override of internal control.
• Obtain an understanding of internal control relevant to the audit in order to design audit procedures that are appropriate in the circumstances, but not for the pur-pose of expressing an opinion on the effectiveness of the parent company’s or the group’s internal control.
• Evaluate the appropriateness of accounting policies used and the reasonableness of accounting estimates and related disclosures made by management.
• Conclude on the appropriateness of the Board of Direc-tors’ and the President and CEO’s use of the going con-cern basis of accounting and based on the audit evidence obtained, whether a material uncertainty exists related to events or conditions that may cast significant doubt
on the parent company’s or the group’s ability to con-tinue as a going concern. If we conclude that a material uncertainty exists, we are required to draw attention in our auditor’s report to the related disclosures in the financial statements or, if such disclosures are inade-quate, to modify our opinion. Our conclusions are based on the audit evidence obtained up to the date of our auditor’s report. However, future events or conditions may cause the parent company or the group to cease to continue as a going concern.
• Evaluate the overall presentation, structure and content of the financial statements, including the disclosures, and whether the financial statements represent the underlying transactions and events so that the financial statements give a true and fair view.
• Obtain sufficient appropriate audit evidence regard-ing the financial information of the entities or business activities within the group to express an opinion on the consolidated financial statements. We are responsible for the direction, supervision and performance of the group audit. We remain solely responsible for our audit opinion.
Key Figures / Board of Directors’ Report / Financial statements / CG / Information for Shareholders
63Annual Report 2016
We communicate with those charged with governance regarding, among other matters, the planned scope and timing of the audit and significant audit findings, including any significant deficiencies in internal control that we iden-tify during our audit.
We also provide those charged with governance with a statement that we have complied with relevant ethical requirements regarding independence, and communicate with them all relationships and other matters that may reasonably be thought to bear on our independence, and where applicable, related safeguards.
From the matters communicated with those charged with governance, we determine those matters that were of most significance in the audit of the financial state-ments of the current period and are therefore the key audit matters. We describe these matters in our auditor’s report unless law or regulation precludes public disclosure about the matter or when, in extremely rare circumstances, we determine that a matter should not be communicated in our report because the adverse consequences of doing so would reasonably be expected to outweigh the public interest benefits of such communication.
Other Reporting Requirements
Other InformationThe Board of Directors and the President and CEO are responsible for the other information. The other informa-tion comprises information included in the report of the Board of Directors and in the Annual Report, but does not include the financial statements and our auditor’s report thereon. Our opinion on the financial statements does not cover the other information.
In connection with our audit of the financial state-ments, our responsibility is to read the other information identified above and, in doing so, consider whether the other information is materially inconsistent with the finan-cial statements or our knowledge obtained in the audit, or otherwise appears to be materially misstated. With respect to the report of the Board of Directors, our respon-sibility also includes considering whether the report of the Board of Directors has been prepared in accordance with the applicable laws and regulations.
In our opinion, the information in the report of the Board of Directors is consistent with the information in the
financial statements and the report of the Board of Direc-tors has been prepared in accordance with the applicable laws and regulations.
If, based on the work we have performed on the report of the Board of Directors, we conclude that there is a material misstatement of this other information, we are required to report that fact. We have nothing to report in this regard.
Helsinki, 15 February 2017
KPMG OY AB
Kim JärviAuthorized Public Accountant, KHT
Key Figures / Board of Directors’ Report / Financial statements / CG / Information for Shareholders

64Annual Report 2016
All solutions coming from Ulstein will be built on the same Qt architecture in the future – and with this as building blocks – more autonomous systems will be the outcome.Gunnar H. Hide, Ulstein
Key Figures / Board of Directors’ Report / Financial statements / CG / Information for Shareholders

65Annual Report 2016
General InformationThis Statement has been issued separately from the
company’s operating and financial review.Qt Group Plc’s (hereinafter referred to as the “com-
pany”) corporate governance system is based on the Com-panies Act, the Securities Markets Act, general corporate governance recommendations and the company’s Articles of Association and in-company rules and regulations on corporate governance.
The company’s corporate governance principles are integrity, accountability, fairness and transparency. This means, among other things, that:
Corporate Governance Statement
The Corporate Governance Code is available on the Finnish Securities Market Association website at www.cgfinland.fi.
Shareholders’ MeetingThe company's highest decision-making body is the Share-holders’ Meeting at which shareholders exercise their voting rights regarding company matters. Each company share entitles the holder to one vote at the Shareholders' Meeting.
The AGM will be held annually within three (3) months of the end of the financial year. An Extraordinary General Meeting will be held if the Board of Directors deems it necessary or if requested in writing by a company auditor or shareholders holding a minimum of 10 per cent (1/10) of the company's shares, for the purpose of discussing a specific issue.
The Finnish Limited Liability Companies Act and the company’s Articles of Association define the responsibili-ties and duties of the Shareholders’ Meeting. Extraordinary General Meetings decide on the matters for which they have been specifically convened.
• The company complies with the applicable laws, rules and regulations.
• The company organises, plans and manages its opera-tions, and does business abiding by the applicable
• professional requirements approved by Board members, who demonstrate due care and responsibility in perform-ing their duties.
• The company demonstrates special prudence with respect to the management of its capital and assets.
• The company's policy is to keep all market participants actively, openly and equitably informed of its business operations.
• The company’s management, administration and per-sonnel are subject to the appropriate internal and exter-nal audits and supervision.
Adherence to the Corporate Governance CodeThe company adheres to the Corporate Governance Code for Listed Finnish Companies issued by the Finnish Secu-rities Market Association, which entered into force on 1 January 2016.
Key Figures / Board of Directors’ Report / Financial statements / CG / Information for Shareholders

66Annual Report 2016
Board of Directors
Operations and dutiesElected by the Shareholders’ Meeting, the Board of Directors is in charge of company administration and the appropriate organisation of company operations. Under the Articles of Association, the Board of Directors must consist of four (4) to eight (8) members. The Compensation and Nomination Committee prepares a proposal for the Shareholders’ Meeting regarding the composition of the new Board of Directors to be appointed.
The majority of Board members must be independent of the company and a minimum of two (2) of those mem-bers must also be independent of the company's major shareholders. The President and CEO or other company employees under the President and CEO's direction may not be elected members of the Board.
The term of all Board members expires at the end of the Annual General Meeting following their election. A Board member can be re-elected without limitations on the number of successive terms. The Board of Directors elects its Chairman and Vice Chairman from amongst its members.
The Board of Directors has determined the principles regarding the diversity of the Board of Directors. Accord-ingly, the requirements of company size, market position and business industry should be duly reflected when com-posing the Board of Directors. When composing the Board of Directors, the objective is that the Board of Directors will always include necessary expertise especially in the following key areas:
• the company’s field of business,• management of a similar-sized company,• the specific nature of a publicly listed company,• accounting,• risk management, and• Board activity.
The aim for the composition of the Board of Directors is to have both genders represented. The defined diversity principles were fulfilled well in the company's Board of Directors during fiscal year 2016.
The Board has prepared and approved a written agenda for its work. In addition to Board duties prescribed by the Companies Act and other rules and regulations, the Board of Directors is responsible for issues on its agenda, observing the following guidelines:
• Good board practices require that the Board of Directors, instead of needlessly interfering in the details involved in day-to-day operations, concentrate on elaborating the company’s short- and long-term strategies.
• The Board’s general duty is to steer the company’s busi-ness with a view to maximizing shareholder value in the long term, while taking account of expectations set by various stakeholder groups; and
• Board members are required to perform on the basis of sufficient, relevant and updated information, in order to serve the company’s interests.
In addition, the Board’s agenda:• defines the Board’s annual action plan and provides a
preliminary meeting schedule and framework agenda for each meeting;
• provides guidelines for the Board’s annual self-assess-ment;
• provides guidelines for distributing notices of meetings and advance information to the Board and procedures for keeping and adopting minutes;
• defines job descriptions for the Chairman, members and secretary of the Board of Directors (the secretary is the Company’s General Counsel or, if absent, the CEO); and
• defines the framework within which the Board may set up special committees or working groups.
During the 2016 financial year, the Board convened 10 times. The meeting attendance rate was 98% on average.
The Board evaluates its activities and working meth-ods annually, employing an external consultant for this evaluation, if necessary.
Key Figures / Board of Directors’ Report / Financial statements / CG / Information for Shareholders

67Annual Report 2016
Robert Ingmanb. 1961, M.Sc. (Eng.), M.Sc. (Econ.)
Chairman of the Board of Directors of Qt Group Plc since 2016. Member of the Compensation and Nomina-tion Committee. Full-time Chairman of the Board of Ingman Group Oy Ab. His previous posts include Manag-ing Director at Arla Ingman Oy Ab (2007–2011) and Ingman Foods Oy Ab (1997–2006). Chairman of the Board of Etteplan Oyj and Halti Ltd. Vice Chairman of the Board of Digia Plc. Member of the Board of Arla Ltd, Evli Pankki Plc and M-Brain Ltd.
Matti Rossib. 1966, Doctor of Philosophy
Member of the Board of Directors of Qt Group Plc since 2016. Member of the Audit Committee. Matti Rossi is Professor of Information Sys-tems Science in the Department of Information and Service Economy at Aalto University (2010–) and Docent in Information System Develop-ment at Lappeenranta University of Technology (2003–). Previous posts include that of Professor of Informa-tion Systems at the Helsinki School of Economics (1999–2009), Visiting Professor and Visiting Associate Professor at several universities in the United States (2007–2008, 1997–1998), and Researcher at Erasmus University Rotterdam in the Netherlands (1998–1999) and the University of Jyväskylä (1985–1998). Member of the Board of Syncron Tech Oy (2007–).
Leena Saarinenb. 1960, M.Sc. (Food technology)
Member of the Board of Directors of Qt Group Plc since 2016. Chair-man of the Compensation and Nomination Committee. Currently works as a board professional, holding Board chairman or Board member roles in various compa-nies, including Helsingin Palvelut Ltd, Arcus ASA and Etteplan Oyj. Her previous posts include Managing Director at Suomen Lähikauppa Ltd (2007–2010), President and CEO at Altia Corporation (2005–2007) and various positions at Unilever (1990–2005). Member of the Direc-tors’ Institute of Finland. Member of the Advisory Board of Varma Mutual Pension Insurance Com-pany (2008–2012) and Luottokunta (2008–2011). Member of the Board at Outokumpu Plc (2003–2011) and Atria Plc (2006–2007).
Tommi Uharib. 1971, M.Sc. (Eng.)
Vice Chairman of the Board of Direc-tors of Qt Group Plc since 2016. Chairman of the Audit Committee and member of the Compensation and Nomination Committee. Cur-rently serves as Partner and Board member of Karma Ventures and holds board member and strategic advisor roles in various companies. Co-founder and CEO at Uros Ltd (2011–2015). His previous posts include management team member of ST Microelectronics (2006–2010), various managerial positions at ST’s joint ventures ST-NXP Wire-less and ST-Ericsson (2008–2010), head of ST’s Wireless Business Unit (2006–2008) and Director of Nokia Wireless and SW platforms units at Nokia (1999–2006).
Kai Öistämöb. 1964, Doctor of Technology, M.Sc. (Eng.)
Member of the Board of Directors of Qt Group Plc since 2016. Member of the Audit Committee. Currently Executive Partner at Siris Capi-tal Group, Chairman of the Board at Fastems Oy and Helvar Oy, and member of the Board at InterDig-ital and Sanoma Corporation. His previous posts include Chief Devel-opment Officer at Nokia until the autumn of 2014 and a member of the Nokia Group Executive Board in 2006–2014. Obtained his Doctorate in Technology (Signal Processing) from Tampere University of Technol-ogy in 1992.
Board of DirectorsDuring the financial year 2016, the Board of Directors of Qt Group Plc comprised the following members:
Key Figures / Board of Directors’ Report / Financial statements / CG / Information for Shareholders

68Annual Report 2016
Of the aforementioned current members of the Board, Matti Rossi, Leena Saarinen, Tommi Uhari and Kai Öistämö are independent of the company and its major sharehold-ers. Robert Ingman is independent of the company.
Committees of the Board of DirectorsThe company’s Board of Directors had two (2) committees in fiscal year 2016: the Compensation and Nomination Committee and the Audit Committee.
These committees do not hold powers of decision or execution. They assist the Board in decision-making concerning their own areas of expertise. The committees report regularly on their work to the Board, which governs and assumes collegiate responsibility for the committees’ work.
The purpose of the Compensation and Nomination Committee is to prepare and follow up compensation and remuneration schemes in order to ensure that the com-pany’s targets are met, to guarantee the objectivity of decision-making, and to see to it that the schemes are transparent and systematic. The Compensation and Nom-ination Committee also prepares a proposal for the Annual General Meeting concerning the number of members of the Board of Directors, the members of the Board of Direc-tors, the remuneration of the Chairman, Vice Chairman
and members of the Board and the remuneration of the chairmen and members of the committees of the Board of Directors. In fiscal year 2016, the Compensation and Nomination Committee was comprised of Leena Saarinen (Chairman), Robert Ingman and Tommi Uhari. The Compen-sation and Nomination Committee convened three times in fiscal year 2016 and the attendance rate was 100 per cent.
The purpose of the Audit Committee is to assist the Board of Directors in ensuring that the company’s financial reporting, accounting methods, financial statements and other reported financial information are legitimate, bal-anced, transparent and clear. In fiscal year 2016, the Audit Committee was comprised of Tommi Uhari (Chairman), Kai Öistämö and Matti Rossi. The Audit Committee convened twice in fiscal year 2016. The meeting attendance rate was 83% on average.
CEOThe company’s Chief Executive Officer is appointed by the Board of Directors. The CEO is in charge of the company’s business operations and administration in accordance with the instructions and regulations issued by the Board of Directors, and as defined by the Finnish Limited Lia-bility Companies Act. The CEO may take exceptional and far-reaching measures, in view of the nature and scope
of the company’s activities, only if so authorised by the Board of Directors. The CEO chairs the Group Management Team’s meetings. The CEO is not a member of the Board of Directors, but attends Board meetings.
The CEO’s service contract, approved by the Board of Directors, defines the key terms and conditions which govern his/her position, in writing.
Juha Varelius, (b. 1963), MBA, was the company’s CEO in fiscal year 2016.
Key Figures / Board of Directors’ Report / Financial statements / CG / Information for Shareholders

69Annual Report 2016
Juha VareliusChief Executive Officer
Qt Group Plc’s President and CEO since 1 May 2016. Varelius previously served as the President and CEO of Digia Plc from 2008 to 2016. Prior to joining Digia, Varelius worked in various senior executive positions in high technology companies in Finland and abroad. Varelius holds a master’s degree in Business Administration.
Mika HarjuahoChief Finance Officer
Qt Group Plc’s Chief Financial Officer since 1 May 2016. Prior to joining Qt, Harjuaho was CFO at Idean Enterprises Oy (2014–2016) and CFO at Basware Oyj (2007–2014). His previous positions also include Financial Director at Suunto (2001–2007), Business Controller at Ericsson AB and Oy LM Erics-son AB (1997–2000) and various positions at Suomen Unilever Oy and Unilever Nederland B.V. (1994–1997). Harjuaho holds a master's degree in Economics.
Petteri HolländerHead of Product Management
Qt Group Plc’s Senior Vice President, Product Management, since 1 May 2016. Holländer has previously served as Director of Product Management and Director of Business Devel-opment of Digia Plc and held other manage-ment positions at Digia Plc (2001–2016). Prior to joining Digia, Holländer worked at Sonera SmartTrust from 1991 to 2001, most recently as Vice President of Product Development. Holländer’s educational background includes M.Sc. degree studies in Engineering.
Management Team
Lars KnollChief Technology Officer
Qt Group Plc’s Chief Technology Officer since 1 May 2016. Knoll’s previous positions include Chief Architect and Qt Project Chief Maintainer in Nokia Corporation’s Applications & Services frameworks business area and CTO of The Qt Company Oy. Knoll has worked at and with Qt for more than 16 years, and he has served as the Chief Architect for Qt products since 2007. Knoll holds a PhD in Physics from Heidelberg University.
Key Figures / Board of Directors’ Report / Financial statements / CG / Information for Shareholders

70Annual Report 2016
Katja KumpulainenVP, Marketing
Qt Group Plc’s Vice President, Marketing, since 1 May 2016. Previously, she was the Head of Marketing at Nervogrid Oy from 2012 to 2015. Prior to that, she was the Marketing Director of Lite-On Mobile Oy (formerly Perlos) from 2007 to 2012 and held various executive, managerial and expert positions at Basware Oyj from 1995 to 2007. Kumpulainen holds an eMBA degree.
Juhapekka NiemiExecutive Vice President,Sales and Business Development
Qt Group Plc’s Executive Vice President, Sales and Business Development, since 1 May 2016. Niemi was the Director of the Qt business at Digia Plc from 2013 to 2016. Previously, Niemi held positions in Nokia Corporation’s smart-phone business in Tampere, Finland as well as a number of international executive positions in Dallas and San Diego in the United States. Niemi holds a degree in Computer Science.
Mika PälsiGeneral Counsel, Legal
Qt Group Plc’s General Counsel since 1 May 2016. He is responsible for the company’s legal affairs and stock exchange communications. Previously, Pälsi was the General Counsel of Digia Plc from 2009 to 2016, Senior Legal Counsel at Tieto Oyj from 2005 to 2009, and an attorney at Castrén & Snellman from 1999 to 2005. Pälsi is a Master of Laws trained on the bench, with Master of Laws degrees from the University of Helsinki and the University of Leicester (UK).
Tuukka TurunenDirector Qt R&D
Qt Group Plc’s Senior Vice President, Research & Development since 1 May 2016. Turu-nen previously served as Director of R&D and Director of Special Projects at Digia Plc in 2001–2016. Prior to that, he worked as a software engineer at Nokia Mobile Phones and was a lecturer and researcher at the Univer-sity of Oulu. He is a member of the Board of Directors fo the KDE Free Qt Foundation and the Chairman of the Board of Directors of the Qt Project Hosting foundation. Turunen holds a M.Sc. degree in Computer Engineering and a Licenciate of Technology degree.
Key Figures / Board of Directors’ Report / Financial statements / CG / Information for Shareholders

71Annual Report 2016
Internal Control and Risk Management Related to Financial Reporting
Control functions and control environmentThe company has a finance unit tasked with verifying monthly reports. The finance unit reports to the man-agement, the Board of Directors and the Board’s Audit Committee regarding the financial performance of the company.
The company uses a reporting system which com-piles separate subsidiaries’ reports into the consolidated financial statements. The accuracy of accounting and the financial statements is monitored by the finance unit. The company also has the necessary separate reporting and information systems for monitoring business operations and asset management.
The Group’s finance unit provides instructions for drawing up financial statements and interim financial statements, and compiles the consolidated financial state-ments. The finance unit has centralised control over the Group's funding and asset management, and is in charge of managing interest rate and currency risk.
Internal controlAs a general principle, authorisation is distributed in the company in such a way that no individual may inde-pendently perform measures unbeknown to at least one other individual. For example, the company’s bookkeeping and asset management are managed by separate persons, and two authorised persons are needed to sign on behalf of the company.
Group-level reporting and supervision are based on mon-thly income reporting led by the CFO and on updates of the latest forecasts.
The company’s operations are divided into func-tion-specific areas of responsibility, with the Senior Vice Presidents in charge of each function reporting to the President and CEO. The Senior Vice Presidents respon-sible for the company’s functions report to the Manage-ment Team on development matters, strategic and annual
planning, investments and internal organisational matters related to their areas of responsibility.
The company’s operational management and super-vision take place according to the corporate governance system described hereinabove. The Group’s administration unit is in charge of HR management and policy. The legal affairs unit provides instructions for and monitors con-tracts made by the company and ensures the legality of the Group’s operations.
Organ
Financial Control Environment
Control Function
Audit
Board of Directors
Internal ControlAudit Committee
Group Management Team
President and CEO
Management of Business Functions
Finance Unit
Annual General Meeting
Written Procedures
Key Figures / Board of Directors’ Report / Financial statements / CG / Information for Shareholders

72Annual Report 2016
CommunicationsThe Group's General Counsel is in charge of the company’s external communications and their correctness. External communications include financial reports and other stock exchange communications. The General Counsel is respon-sible for the publication of interim reports and financial statements, as well as for actions related to convening and holding Shareholders' Meetings. Most communications take place through the company’s website and using stock exchange releases.
Risk managementThe purpose of the company’s risk management process is to identify and manage risks in such a way that the com-pany is able to meet its strategic and financial targets. Risk management is a continuous process, by which the major risks are identified, listed and assessed, the key persons in charge of risk management are appointed and risks are prioritised according to an assessment scale in order to compare the effects and mutual significance of risks.
The main operational risks handled by the company's risk management function are customer risk, personnel risk, data security risk, IPR risk and goodwill risk.
The company manages customer risk by actively developing its customer portfolio structure and avoiding any potential risk positions. Personnel risks are actively assessed and managed using a goal and development discussion process for key personnel. To improve per-sonnel commitment, the company strives to improve the efficiency of internal communications systematically, using regular personnel events and increasing the visibility of management. In addition, the Group's certified qual-ity systems are regularly evaluated. Data security risk is managed through the continuous development of working
models, security practices and processes. Risks associated with shared operating models and best practices, as well as their integrated development, are managed according to plan under the supervision of the Group Management Team. Risks typical to software business, especially to international product business, relating to appropriate protection of company’s own IPRs and violation of IPRs of third parties are managed through extensive internal policies, standard contracts and appropriate follow-up and analysis. With respect to IFRS-compliant accounting poli-cies, the Group actively monitors goodwill and the related impairment tests, as part of prudent and proactive risk management practices within financial management.
In addition to operational risks, the company is sub-ject to financial risks. The company’s internal and exter-nal financing and the management of financial risks are coordinated by the finance function of the Group's parent company. This function is responsible for the Group's liquidity, sufficiency of financing, and the management of interest rate and currency risk. The Group is exposed to several financial risks during the normal course of its business. The objective of the Group’s risk management is to minimise the adverse effects of changes in the finan-cial markets on the Group's earnings. The primary types of financial risks are interest rate risk, currency risk, credit risk and funding risk. The general principles of risk man-agement are approved by the Board of Directors, and the Group's finance function is responsible for their practical implementation together with the business divisions.
Statement on Management Remuneration
This management remuneration statement sets forth a summary of the financial benefits, remuneration system
and thereto related decision-making pertaining to Board members and operative management of Qt Group Plc.
A) Description of the decision-making procedures concerning remuneration
Board of DirectorsQt Group Plc’s Compensation and Nomination Committee prepares the remuneration payable to the Board of Direc-tors and grounds for the compensation of expenses. The Shareholders’ Meeting decides on the remuneration paya-ble to the Board of Directors and grounds for the compen-sation of expenses.
President and CEO and Other ExecutivesQt Group Plc’s Compensation and Nomination Committee prepares the remuneration and other rewards and benefits payable to the President and CEO.
The Compensation and Nomination Committee also prepares, in cooperation with the President and CEO, the remunerations and other rewards and benefits paya-ble to the other executives. If necessary, outside experts and market surveys can also be used in the preparation of remunerations. The Board of Directors decides on the remunerations and other rewards and benefits payable to the President and CEO. The Board of Directors decides, based on the President and CEO’s proposal, on remunera-tions and other rewards and benefits payable to the other executives.
Digia Plc's Annual General Meeting 2016, which decided on the demerger that led to the creation of Qt Group Plc, authorised the Board of Directors on 16 March 2015 to decide on a share issue and the granting of special rights prescribed in the Companies Act, as decided by the Board of Directors, for purposes including the implemen-
Key Figures / Board of Directors’ Report / Financial statements / CG / Information for Shareholders
73Annual Report 2016
tation of share-based incentive programmes. The author-isation includes the Board of Directors' right to decide on all terms relating to the share issue and granting of special rights. The authorisation is valid for 18 months from the issue date of the authorisation, i.e. until 16 September 2017. By virtue of the said authorisation, the Board of Directors of Qt Group Plc decided at its meeting on 22 June 2016 to issue at most 2,000,000 stock options to the key personnel of the company or its Group companies.
B) Key Remuneration Principles
Remuneration of the Board of DirectorsThe 2016 Annual General Meeting of Digia Plc decided to pay monthly remuneration of EUR 2,500 to the members of Qt Group Plc’s Board of Directors, EUR 3,500 to the Vice Chairman and EUR 5,500 to the Chairman for their work on the Board. In addition, the AGM approved EUR 500 in fees per Board or committee meeting for all Board members of Qt Group Plc. Moreover, the Annual General Meeting of Digia Plc decided that standard and reasonable costs resulting from work on the Board of Directors of Qt Group Plc would be reimbursed against invoice.
The company does not grant stock options or share-based remuneration for work on the Board.
Remuneration of the President and CEO CEO Juha Varelius’ remuneration package comprises a monthly salary in accordance with his director agreement and a bonus payable on the basis of reaching the set tar-gets.
At the time of issuing this statement, the CEO was paid EUR 297,288 per year in salary and fringe benefits.
In addition to the monthly salary, the CEO is paid a bonus which is based on bonus schemes confirmed for the com-pany.
Under the company’s bonus scheme, the earning criteria for the bonus is the growth of Qt’s net sales. Upon fulfilment of the target set for net sales, the CEO is paid a bonus equal to 40 per cent of his annual base salary. Upon exceeding the said target, the bonus will increase as fol-lows: 30% of each euro that exceeds the net sales target is used for the CEO’s and other company personnel's bonus rewards including social costs. The maximum bonus for the CEO under the bonus scheme is 120 per cent of his annual base salary. However, no bonus shall be paid if the company’s operating profit is more than one million euros short of the set operating profit budget. The fulfilment of bonus criteria is evaluated and possible rewards are paid semiannually.
Under the company’s long-term incentive scheme (https://qt-investors-uploads.s3.amazonaws.com/wp-content/uploads/STOCK-OPTIONS-2016_ENG.pdf), the President and CEO was issued 550,000 stock options, each of which entitles its holder to subscribe for one (1) new share in the company or an existing share held by the company. The share subscription period for the stock options is 19 December 2019–31 December 2022 and the subscription price is EUR 4.84. A precondition for the share subscription is that the value of the company’s share based on the trade volume weighted average quotation on the NASDAQ OMX Helsinki Ltd is at least five euros and eighty-five cents (EUR 5.85) between 18 November 2019 and 13 December 2019.
The company may terminate the CEO’s service con-tract with six (6) months’ notice.
Upon such termination, he will receive remuneration for the notice period plus severance pay equaling twelve (12) months’ salary. The CEO’s retirement age is as stipulated by law, and he has no supplementary pension agreement with the company.
Remuneration of Other ExecutivesThe company’s executive management consists of the Group Management Team, which comprises the CEO and seven (7) other members.
The total remuneration package of the said executives comprises a monthly salary and the bonus payable on the basis of reaching the set targets. Annual salaries including fringe benefits for the members of the Management Team (excluding the CEO) totalled EUR 856,983 per year at the time of issuing this statement.
The earning criteria and conditions of the merit bonus for the members of the Management Team are the same as those of the CEO, but the amount of the bonus at the target level varies between 30 and 44 per cent of the indi-vidual’s annual base salary.
As with the CEO, the maximum bonus is three times the target level.
Under the company’s long-term incentive scheme, the members of the Management Team have been issued 560,000 stock options, each of which entitles its holder to subscribe for one (1) new share in the company or an existing share held by the company under terms corre-sponding to those of the CEO.
The retirement age of the executives is stipulated by law and none of the executives has a supplementary pen-sion agreement with the company.
Key Figures / Board of Directors’ Report / Financial statements / CG / Information for Shareholders

74Annual Report 2016
C) Remuneration Report*
Remuneration of the Board of DirectorsIn fiscal year 2016, the members of the Board of Directors were paid remuneration for their work on the Board and its Committees as follows:
Remuneration of the President and CEOIn fiscal year 2016, the President and CEO was paid salary and other benefits as follows:
Remuneration of Other ExecutivesIn fiscal year 2016, the other executives were paid salaries and other benefits as follows:
*Qt Group Plc was established on 1 May 2016. The amounts presented in the remuneration report comprise the salaries and bonuses paid over a period of eight (8) months, 1 May–31 December 2016.
** The share-based bonus paid to the CEO is based on Digia Plc’s share-based incentive scheme, which ended when the demerger of Digia Plc entered into effect on 1 May 2016, thereby triggering the payment of share-based bonuses in accordance with the scheme.
NameMonetary
remuneration/EURShare-based
remuneration/EURTotal/EUR
Robert Ingman 56 750 - 56 750
Matti Rossi 28 750 - 28 750
Leena Saarinen 27 000 - 27 000
Tommi Uhari 37 500 - 37 500
Kai Öistämö 27 000 - 27 000
Total 177 000 - 177 000
Name
Salary (including fringe benefits)
EURBonus
EUR
Share-based part of the bonus
EURTotalEUR
Juha Varelius 191 849 996 359 918 590** 1 188 208
Name
Salary (including fringe benefits)
EURBonus
EUR
Share-based part of the bonus
EURTotalEUR
Other executives (7 persons) 576 712 246 294 - 823 006
Key Figures / Board of Directors’ Report / Financial statements / CG / Information for Shareholders

75Annual Report 2016
Qt Group Plc’s investor communications produce reliable and up-to-date information on the company’s business operations in a timely and equal manner for all interested parties. The company’s annual reports, interim reports, stock exchange releases and press releases are available in Finnish and English at https://investors.qt.io.
To subscribe to stock exchange releases, please send your e-mail contact information to [email protected].
The Annual General Meeting will be held on 14 March 2017 in Helsinki (venue: Kansallissali, Aleksanterinkatu 44A) at 10:00 a.m. More information on registering for the AGM and the AGM documents are available at investors.qt.io.
Financial calendar 2017
Q1/2017 Interim Statement 27 AprilQ2/2017 Half-Year Report 10 AugustQ3/2017 Interim Statement 23 October
Information forShareholders
Basic information on the shareListed (2016) on Nasdaq Helsinki LtdTrading code: QTCOMNumber of shares: 20,818,273
IR ContactMika Harjuaho, CFOTel. +358 9 8861 8040E-mail: [email protected]
Head officeQt Group Plc (The Qt Company)Bertel Jungin aukio D3A02600 Espoo, Finland
Key Figures / Board of Directors’ Report / Financial statements / CG / Information for Shareholders

76
Qt Group Oyj (The Qt Company) / Bertel Jungin aukio D3A, 02600 Espoo / +358 9 8861 8040 / [email protected] / www.qt.io