annual employment report 2008 ndsu career center’s annual employment report is a profile of a ......
TRANSCRIPT

NORTH DAKOTA STATE UNIVERSITY, FARGO
ANNUAL EMPLOYMENT REPORT2008
CAREER CENTER
Each year, more than 2,000 students graduate from North Dakota State University. They go on to pursue higher education degrees or enter the job market they have spent years preparing for through education. But how many students get jobs in the field of their degree? What is the current entry-level salary for these students? How many enter post-baccalaureate school? This report answers those questions and more.
The NDSU Career Center’s Annual Employment Report is a profile of a graduating class. Whether you are considering attending NDSU, preparing to enter the job market or looking for recent trends in entry-level employment, this report provides a snapshot of all students in every undergraduate major on campus who graduated in the past year.
Since 1995, the Career Center has been publishing an annual employment report to inform the public what happens to graduates once they leave NDSU’s community of academic discourse for the world at large.
ANNUAL EMPLOYMENT REPORT2008
ANNUAl EmplOYmENT REpORT HIGHlIGHTS Data for this report was collected through mail surveys, follow-up telephone calls and academic departments/faculty. The Career Center surveyed graduates of baccalaureate degrees from NDSU for terms ending in August 2007, December 2007 and May 2008. This report is based on responses from 1,182 graduates (68.5% of the reported 1,726 undergraduates).
Of the 1,182 respondents:• 897 (75.9%) reported “Employed.”
• 225 (19.0%) reported “Post Baccalaureate & Professional” education.
• 60 (5.1%) reported still “Active in Job Search.”
CAREER EVENTSThe NDSU Career Center sponsors career events throughout the school year to connect employers with students and alumni seeking full-time positions, part-time jobs and internships.
August Part-Time Jobs Fair
September Meet the Firms (Accounting)Engineering & Tech Expo
October Agriculture Career FairTri-College Graduate School Day (Students connect with representatives from regional and national post-baccalaureate schools.)
November Tri-College Career & Internship Fair (Business & Liberal Arts majors)
February Spring Career Fair (all majors)
March Design Expo (Architecture & Landscape Architecture)
April ND Education Connection
INTERNSHIp/COOpERATIVE EDUCATIONThe Internship/Cooperative Education program is a structured, paid work experience for academic credit affording students an opportunity to gain relevant, professional experience in the career they have chosen to pursue upon graduation. Students accept work assignments locally, regionally and nationally and the work can be full or part time during the summer and/or academic semester.
Of the 897 employed respondents:• 794 (88.5%) reported: “Employed Related to their studies.”
• 51 (5.7%) reported: “Employed in part-time positions.”
• The average annual “related” reported salary of respondents was $40,000. The highest reported salary was $80,000.
• Graduates reported accepting employment in 44 states and nine foreign countries.
• 455 respondents (50.7%) reported accepting employment in North Dakota.
• 248 respondents (27.6%) reported accepting employment in Minnesota.
• 449 respondents reported their “original home state” as North Dakota, of which 297 reported accepting employment in North Dakota (66.1% retention).
• Of this year’s employed graduates from the College of Agriculture, Food Systems, and Natural Resources, 14.0% have chosen to farm or ranch.

Gradua
tesM
ale
Fem
ale
Min
ority
Post
Bacc
alaur
eate
& P
rofes
siona
l
Enter
ing J
ob M
arket
Unable
to Su
rvey
Emplo
yed R
elated
to M
ajor/M
inor
Emplo
yed U
nrela
ted to
Majo
r/Min
or
Activ
e in J
ob Se
arch
Perce
nt E
mplo
yed
Salar
y Ran
ge ($
1,000
s)
A
vERAG
E - H
IGH
COllEGE OF AGRICUlTURE, FOOD SYSTEmS, AND NATURAl RESOURCESAgribusiness 3 1 2 0 0 0 3 3 0 0 100% 33-36Agricultural Economics 20 17 3 0 7 1 12 12 0 0 100% 41-44Agricultural Systems Management 11 11 0 0 1 0 10 8 2 0 100% 39-41Agriculture, General 4 4 0 0 0 0 4 4 0 0 100% 47-48Animal and Range Sciences 29 13 16 0 8 5 16 15 1 0 100% 25-42Biotechnology 17 7 10 13 7 5 5 4 1 0 100% n/aCrop and Weed Sciences 21 16 5 0 5 2 14 13 0 1 93% 37-40Economics 10 9 1 1 5 2 3 3 0 0 100% 35-39Equine Studies 6 0 6 0 1 0 5 5 0 0 100% 24-27Food Safety 1 1 0 0 0 1 0 0 0 0 n/a n/aFood Science 5 1 4 0 1 0 4 4 0 0 100% 41-45Horticulture 10 2 8 0 0 1 9 8 1 0 100% 27-40Microbiology 15 8 7 1 3 7 5 5 0 0 100% 40-50Natural Resources Management 6 6 0 0 2 0 4 4 0 0 100% 30-38Soil Science 1 1 0 0 0 1 0 0 0 0 n/a n/aSports and Urban Turfgrass Management 11 11 0 0 3 0 8 8 0 0 100% 32-38Veterinary Technology 19 0 19 1 6 0 13 12 0 1 92% 23-27
College Totals 189 108 81 16 49 25 115 108 5 2 98% 33-50Footnotes: Undergraduate degree programs not listed had no graduates during the time period of this report. N/A = Not available or restricted for confidentiality reasons.
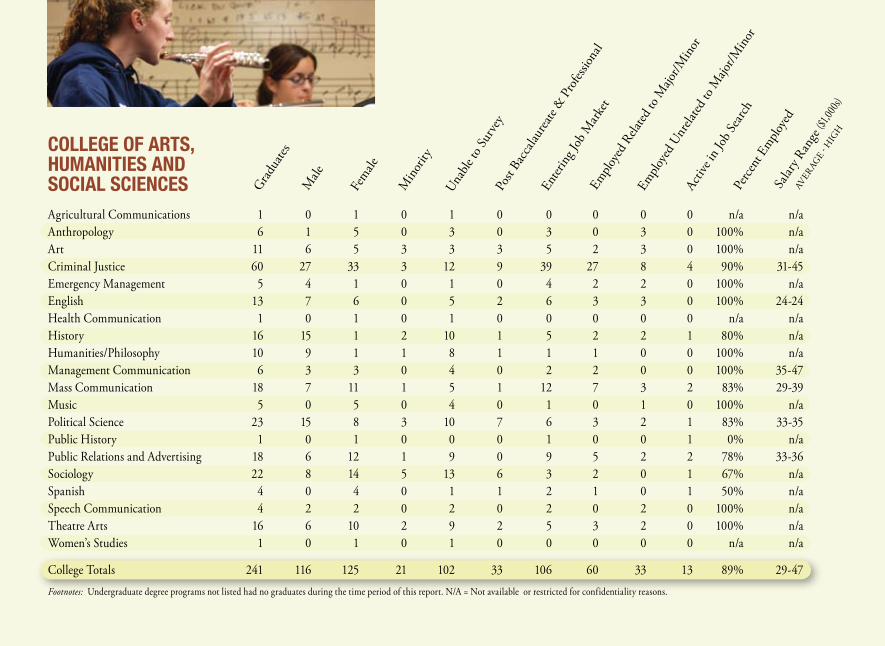
COllEGE OF ARTS, HUmANITIES AND SOCIAl SCIENCESAgricultural Communications 1 0 1 0 1 0 0 0 0 0 n/a n/aAnthropology 6 1 5 0 3 0 3 0 3 0 100% n/aArt 11 6 5 3 3 3 5 2 3 0 100% n/aCriminal Justice 60 27 33 3 12 9 39 27 8 4 90% 31-45Emergency Management 5 4 1 0 1 0 4 2 2 0 100% n/aEnglish 13 7 6 0 5 2 6 3 3 0 100% 24-24Health Communication 1 0 1 0 1 0 0 0 0 0 n/a n/aHistory 16 15 1 2 10 1 5 2 2 1 80% n/aHumanities/Philosophy 10 9 1 1 8 1 1 1 0 0 100% n/aManagement Communication 6 3 3 0 4 0 2 2 0 0 100% 35-47Mass Communication 18 7 11 1 5 1 12 7 3 2 83% 29-39Music 5 0 5 0 4 0 1 0 1 0 100% n/aPolitical Science 23 15 8 3 10 7 6 3 2 1 83% 33-35Public History 1 0 1 0 0 0 1 0 0 1 0% n/aPublic Relations and Advertising 18 6 12 1 9 0 9 5 2 2 78% 33-36Sociology 22 8 14 5 13 6 3 2 0 1 67% n/aSpanish 4 0 4 0 1 1 2 1 0 1 50% n/aSpeech Communication 4 2 2 0 2 0 2 0 2 0 100% n/aTheatre Arts 16 6 10 2 9 2 5 3 2 0 100% n/aWomen’s Studies 1 0 1 0 1 0 0 0 0 0 n/a n/a
College Totals 241 116 125 21 102 33 106 60 33 13 89% 29-47
Gradua
tesM
ale
Fem
ale
Min
ority
Post
Bacc
alaur
eate
& P
rofes
siona
l
Enter
ing J
ob M
arket
Unable
to Su
rvey
Emplo
yed R
elated
to M
ajor/M
inor
Emplo
yed U
nrela
ted to
Majo
r/Min
or
Activ
e in J
ob Se
arch
Perce
nt E
mplo
yed
Salar
y Ran
ge ($
1,000
s)
A
vERAG
E - H
IGH
Footnotes: Undergraduate degree programs not listed had no graduates during the time period of this report. N/A = Not available or restricted for confidentiality reasons.

Gradua
tesM
ale
Fem
ale
Min
ority
Post
Bacc
alaur
eate
& P
rofes
siona
l
Enter
ing J
ob M
arket
Unable
to Su
rvey
Emplo
yed R
elated
to M
ajor/M
inor
Emplo
yed U
nrela
ted to
Majo
r/Min
or
Activ
e in J
ob Se
arch
Perce
nt E
mplo
yed
Salar
y Ran
ge ($
1,000
s)
A
vERAG
E - H
IGH
COllEGE OF BUSINESSAccountancy 14 7 7 2 2 0 12 11 0 1 92% 44-48Accounting 24 10 14 0 4 1 19 18 1 0 100% 39-50Business Administration 152 94 58 4 45 2 105 87 11 7 93% 32-55Management Information Systems 26 23 3 2 7 1 18 18 0 0 100% 47-75
College Totals 216 134 82 8 58 4 154 134 12 8 95% 37-75
Agricultural and Biosystems Engineering 6 6 0 0 1 0 5 5 0 0 100% 57-60Architecture 2 2 0 0 0 0 2 2 0 0 100% n/aCivil Engineering 69 56 13 2 20 1 48 46 0 2 96% 46-68Computer Engineering 11 9 2 5 8 0 3 3 0 0 100% 43-62Construction Engineering 14 14 0 1 1 0 13 11 0 2 92% 52-70Construction Management 40 36 4 0 2 0 38 37 0 1 97% 50-66Electrical Engineering 68 63 5 12 16 6 46 45 0 1 98% 51-60Environmental Design 56 39 17 2 2 51 3 2 1 0 100% n/aIndustrial Engineering and Management 16 15 1 0 2 0 14 13 0 1 93% 52-59Landscape Architecture 18 14 4 0 6 0 12 8 1 3 75% 35-43Manufacturing Engineering 6 5 1 0 1 0 5 5 0 0 100% 48-53Mechanical Engineering 61 58 3 0 10 4 47 45 0 2 96% 53-64
College Totals 367 317 50 22 69 62 236 222 2 12 95% 49-70
COllEGE OF ENGINEERING AND ARCHITECTURE
Footnotes: Undergraduate degree programs not listed had no graduates during the time period of this report. N/A = Not available or restricted for confidentiality reasons.

Apparel and Textiles 33 0 33 1 10 1 22 17 5 0 100% 30-43Athletic Training 9 3 6 0 3 3 3 3 0 0 100% n/aChild Development and Family Science 81 5 76 1 30 4 47 38 7 2 96% 27-39Dietetics 19 0 19 0 5 3 11 7 2 2 82% 39-40Exercise Science 34 14 20 2 8 7 19 13 4 2 89% 34-35Facility Management 4 1 3 0 1 0 3 2 1 0 100% n/aHospitality and Tourism Management 26 9 17 2 3 0 23 20 1 2 91% 30-42Interior Design 20 0 20 1 12 0 8 6 1 1 88% 27-32Sport and Recreation Studies 8 5 3 0 3 0 5 3 1 1 80% 35-40School of Education 73 26 47 2 29 4 40 31 6 3 93% 32-40
College Totals 307 63 244 9 104 22 181 140 28 13 93% 30-43
Gradua
tesM
ale
Fem
ale
Min
ority
Post
Bacc
alaur
eate
& P
rofes
siona
l
Enter
ing J
ob M
arket
Unable
to Su
rvey
Emplo
yed R
elated
to M
ajor/M
inor
Emplo
yed U
nrela
ted to
Majo
r/Min
or
Activ
e in J
ob Se
arch
Perce
nt E
mplo
yed
Salar
y Ran
ge ($
1,000
s)
A
vERAG
E - H
IGH
COllEGE OF HUmAN DEVElOpmENT AND EDUCATION
COllEGE OF pHARmACY, NURSING, AND AllIED SCIENCES
Clinical Laboratory Science 10 2 8 0 1 0 9 9 0 0 100% 46-54Nursing 64 6 58 2 29 1 34 34 0 0 100% 49-74Pharmaceutical Sciences 92 44 48 11 69 22 1 1 0 0 100% n/aRadiologic Sciences 9 3 6 0 1 2 6 6 0 0 100% 35-40Respiratory Care 12 3 9 2 0 0 12 12 0 0 100% 39-50
College Totals 187 58 129 15 100 25 62 62 0 0 100% 44-74Footnotes: Undergraduate degree programs not listed had no graduates during the time period of this report. N/A = Not available or restricted for confidentiality reasons.

Behavioral Statistics 1 0 1 0 0 1 0 0 0 0 n/a n/aBiochemistry and Molecular Biology 8 5 3 1 3 2 3 2 1 0 100% n/aBiological Sciences 15 5 10 1 7 5 3 1 1 1 67% n/aBiotechnology 8 2 6 3 4 1 3 1 0 2 33% n/aBotany 1 0 1 0 0 1 0 0 0 0 n/a n/aChemistry 6 5 1 1 2 2 2 2 0 0 100% n/aComputer Science 34 31 3 10 16 1 17 16 1 0 100% 55-61Geology 1 1 0 0 1 0 0 0 0 0 n/a n/aMathematics 6 3 3 1 3 0 3 3 0 0 100% 46-52Natural Resources Management 2 2 0 0 0 0 2 2 0 0 100% n/aPhysics 4 4 0 0 1 0 3 3 0 0 100% 49-65Psychology 61 15 46 2 18 15 28 18 6 4 86% 27-40Statistics 2 2 0 0 0 0 2 2 0 0 100% n/aZoology 54 28 26 1 19 18 17 11 5 1 94% 44-80
College Totals 203 103 100 20 74 46 83 61 14 8 90% 40-80
Gradua
tesM
ale
Fem
ale
Min
ority
Post
Bacc
alaur
eate
& P
rofes
siona
l
Enter
ing J
ob M
arket
Unable
to Su
rvey
Emplo
yed R
elated
to M
ajor/M
inor
Emplo
yed U
nrela
ted to
Majo
r/Min
or
Activ
e in J
ob Se
arch
Perce
nt E
mplo
yed
Salar
y Ran
ge ($
1,000
s)
A
vERAG
E - H
IGH
COllEGE OF SCIENCE AND mATHEmATICS
University Studies 36 19 17 4 15 5 16 9 5 2 88% 29-31
College Totals 36 19 17 4 15 5 16 9 5 2 88% 29-31
COllEGE OF UNIVERSITY STUDIES
Footnotes: Undergraduate degree programs not listed had no graduates during the time period of this report. N/A = Not available or restricted for confidentiality reasons.

Gradua
tesM
ale
Fem
ale
Min
ority
Post
Bacc
alaur
eate
& P
rofes
siona
l
Enter
ing J
ob M
arket
Unable
to Su
rvey
Emplo
yed R
elated
to M
ajor/M
inor
Emplo
yed U
nrela
ted to
Majo
r/Min
or
Activ
e in J
ob Se
arch
Perce
nt E
mplo
yed
Salar
y Ran
ge ($
1,000
s)
A
vERAG
E - H
IGH
NORTH DAKOTA STATE UNIVERSITYCollege Totals 1,726 910 815 114 562 222 944 789 100 55 94% 40-80
Master’s and Ed. S. Degrees 305 179 126 79 172 25 108 102 2 4 96% 49-100Ph.D. Degrees 76 41 35 22 33 4 39 38 0 1 97% 49-81Architecture M.Arch. Degrees 42 29 13 1 26 0 16 16 0 0 100% n/aPharmacy Doctorate Pharm.D. Degrees 89 34 55 7 23 0 66 66 0 0 100% 93-136Advanced Nursing Practice D.N.P. Degrees 7 3 4 1 3 0 4 4 0 0 100% 74-80
College Totals 519 286 233 110 257 29 233 226 2 5 98% 63-136
NDSU GRADUATE AND pROFESSIONAl pROGRAmS

Data for the 2008 NDSU Annual Employment Report covering semesters ending August 2007, December 2007 and May 2008 was retrieved from the NDSU student database, mail and electronic surveys, follow-up telephone calls and academic departments/faculty. The data primarily includes baccalaureate graduates.
GraduatesInformation derived from the student database.
Male, FemaleInformation derived from the student database.
MinorityInformation derived from the student database.
Unable to SurveyGraduates not responding to surveys and were unable to be located or contacted.
Post Baccalaureate & ProfessionalGraduates who are pursuing post baccalaureate or professional education or additional under-graduate majors.
EmplOYmENT SUmmARY COlUmN ExplANATIONSEntering Job MarketGraduates who have entered or are ready to enter the job market.
Includes:“Employed Related to Major/Minor”“Employed Unrelated to Major/Minor”“Active in Job Search”
Does not include:“Post Baccalaureate & Professional” “Unable to Survey”
Employed Related to Major/MinorFull-time and part-time employment information collected from graduating student survey.
Employed Unrelated to Major/MinorFull-time and part-time employment information collected from graduating student survey.
Active in Job SearchInformation collected from graduating student survey indicating graduates were unemployed and were seeking employment.
Percent EmployedNumber of graduates employed (“Employed Related to Major/Minor” and “Employed Unrelated to Major/Minor”) divided by “Entering Job Market.”
Salary Range (Average - High)Only base salaries of full-time positions reported as “Employed Related to Major/Minor” were used. Commissions, bonuses, incentives and fringe benefits were not included. For privacy reasons, some salary amounts are not shown in majors with minimal data returns.

North Dakota is retaining its college-educated population in steadily increasing numbers according to the Employment Survey conducted by NDSU’s Career Center. This chart reflects NDSU graduates who report that they are from North Dakota and who achieved employment in North Dakota following graduation.
10
20
30
40
50
60
70
80
90
100
perc
enta
ge o
f Nor
th D
akot
a gr
adua
tes
empl
oyed
in N
orth
Dak
ota
growth trend
0’95 ’96 ’97 ’98 ’99 ’00 ’01 ’02 ’03 ’04 ’05 ’06 ’07 ’08 ’09 ’10 ’11 ’12
year

North Dakota State University does not discriminate on the basis of race, color, national origin, religion, sex, disability, age, vietnam Era veterans status, sexual orientation, marital status, or public assistance status. Direct inquiries to the Executive Director and Chief Diversity Officer, 205 Old Main, (701) 231-7708. This brochure is available in other formats by request.