annual demographic estimates: census ... - ivt… · or transmitted in any form, by any...
TRANSCRIPT

Catalogue no. 91-214-XIE
Annual Demographic
Estimates: Census
Metropolitan Areas, Economic
Regions and Census
Divisions, Age and Sex
2001 to 2006

How to obtain more information
Specific inquiries about this product and related statistics or services should be directed to: Demographic Division, StatisticsCanada, Ottawa, Ontario, K1A 0T6 (telephone: 1-800-263-1136).
For information on the wide range of data available from Statistics Canada, you can contact us by calling one of our toll freenumbers. You can also contact us by e-mail or by visiting our website at www.statcan.ca.
National inquiries line 1-800-263-1136National telecommunications device for the hearing impaired 1-800-363-7629Depository Services Program inquiries 1-800-700-1033Fax line for Depository Services Program 1-800-889-9734E-mail inquiries [email protected] www.statcan.ca
Information to access the product
This product, catalogue no. 91-214-XIE, is available for free in electronic format. To obtain a single issue, visit our website atwww.statcan.ca and select Publications.
Standards of service to the public
Statistics Canada is committed to serving its clients in a prompt, reliable, courteous, and fair manner. To this end, the Agencyhas developed standards of service that its employees observe in serving its clients. To obtain a copy of these service standards,please contact Statistics Canada toll free at 1-800-263-1136. The service standards are also published on www.statcan.ca underAbout us > Providing services to Canadians.
Statistics CanadaDemographic Division
Annual Demographic Estimates: Census
Metropolitan Areas, Economic Regions
and Census Divisions, Age and Sex2001 to 2006
Published by authority of the Minister responsible for Statistics Canada
© Minister of Industry, 2007
All rights reserved. The content of this electronic publication may be reproduced, inwhole or in part, and by any means, without further permission from Statistics Canada,subject to the following conditions: that it be done solely for the purposes of privatestudy, research, criticism, review or newspaper summary, and/or for non-commercialpurposes; and that Statistics Canada be fully acknowledged as follows: Source (or“Adapted from”, if appropriate): Statistics Canada, year of publication, name ofproduct, catalogue number, volume and issue numbers, reference period and page(s).Otherwise, no part of this publication may be reproduced, stored in a retrieval systemor transmitted in any form, by any means—electronic, mechanical or photocopy—orfor any purposes without prior written permission of Licensing Services, ClientServices Division, Statistics Canada, Ottawa, Ontario, Canada K1A 0T6.
January 2007
Catalogue no. 91-214-XIE
ISSN 1911-2424
Frequency: Annual
Ottawa
La version française de cette publication est disponible sur demande (no 91-214-XIFau catalogue).
Note of appreciation
Canada owes the success of its statistical system to a long standing partnership betweenStatistics Canada, the citizens of Canada, its businesses, governments and otherinstitutions. Accurate and timely statistical information could not be produced withouttheir continued cooperation and goodwill.
Annual Demographic Estimates: Census Metropolitan Areas, Economic Regions and Census Divisions, Age and Sex
User information
SymbolsThe following standard symbols are used in Statistics Canada publications:
. not available for any reference period
.. not available for a specific reference period
... not applicable
0 true zero or a value rounded to zero
0s value rounded to 0 (zero) where there is a meaningful distinction between true zero and the value that wasrounded
p preliminary
r revised
x suppressed to meet the confidentiality requirements of the Statistics Act
E use with caution
F too unreliable to be published
Notice to readers
Population estimates
Most of the components used to produce preliminary population estimates are estimated using demographic modelsor based on data sources less complete or reliable, albeit more timely, than those used for updated or final estimates.
Geography
The geographic delineation is based on the Census 2001 boundaries.
2 Statistics Canada – Catalogue no. 91-214
Annual Demographic Estimates: Census Metropolitan Areas, Economic Regions and Census Divisions, Age and Sex
Table of contentsHighlights 8
Related products 9
Section 1 Census metropolitan areas 12
1.1 Alberta’s CMAs are growing 121.2 New arrivals in Alberta came mostly from the neighbouring provinces and from Newfoundland
and Labrador 121.3 Six CMAs showed a growth rate above the Canadian average 141.4 Population growth in the other CMAs of more than one million inhabitants 141.5 Population aging slower in the CMAs than in the non-CMAs. 17
Section 2 Economic regions 47
2.1 The ten economic regions experiencing the largest increases in the past year 472.2 The five economic regions experiencing the largest decreases in the past year 47
Section 3 Census divisions 59
3.1 The ten census divisions experiencing the largest increases in the past year 593.2 The five census divisions experiencing the largest decreases in the past year (see footnote) 59
Data quality, concepts and methodology
Glossary 92Explanatory notes for the tables 97Quality of estimates 100Population estimates 108Components 112
Appendix
A Thematic maps 114B Sources and remarks 121
Charts
1.1 Population growth rates by census metropolitan areas, Canada 131.2 Population growth by the three largest, census metropolitan area, Canada 141.3 Factors of the population growth by census metropolitan area, Canada, 2005/2006 15
Statistics Canada – Catalogue no. 91-214 3
Annual Demographic Estimates: Census Metropolitan Areas, Economic Regions and Census Divisions, Age and Sex
Table of contents – continued
1.4 Factors of population growth of the six largest census metropolitan areas, Canada 161.5 Median age by census metropolitan area, July 1, 2006 181.6 Distribution of population by age group and census metropolitan area, Canada, 2006 19
Statistical tables
1.1 Annual population estimates by census metropolitan area, Canada 201.1-1 Population by sex at July 1 201.1-2 Population rate of growth from July to June 221.1-3 Population by age group and sex at July 1, 2006 231.1-4 Distribution of population by age group and sex at July 1, 2006 251.1-5 Demographic indicators, age and dependency ratio at July 1 27
1.2 Annual estimates of demographic components by census metropolitan area, Canada, from Julyto June 28
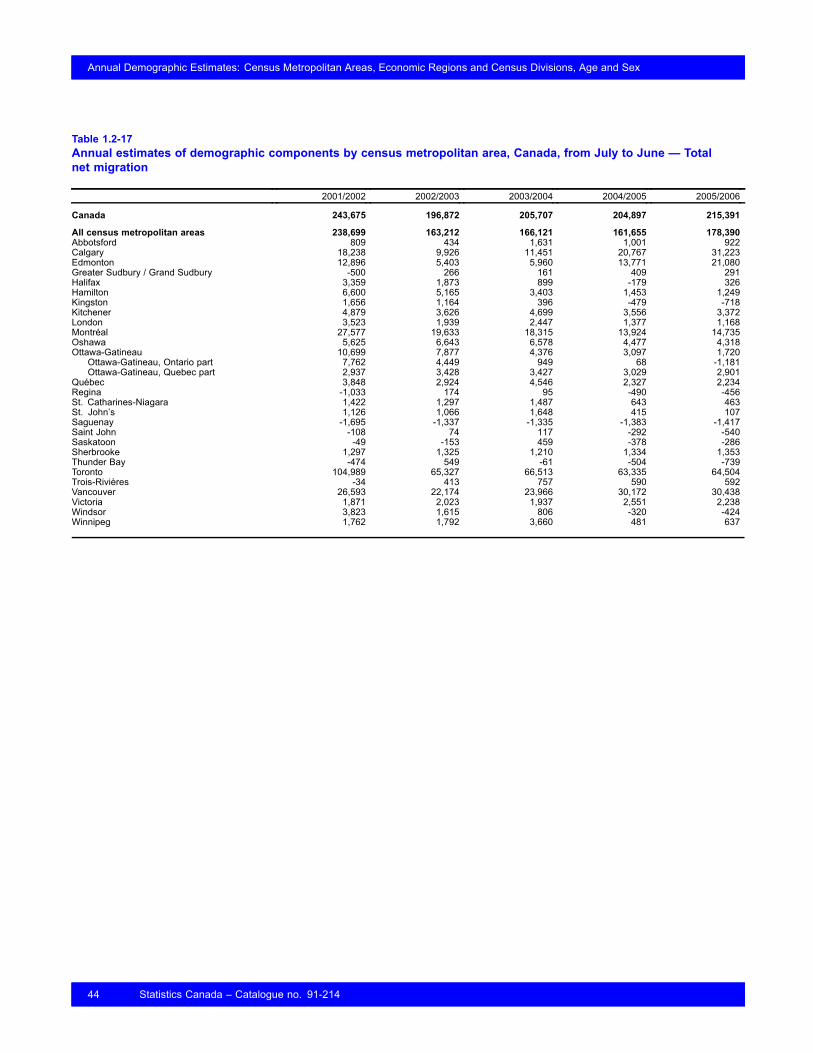
1.2-1 Births 281.2-2 Deaths 291.2-3 Immigrants 301.2-4 Emigrants 311.2-5 Returning emigrants 321.2-6 Net temporary emigrants 331.2-7 Net non-permanent residents 341.2-8 Interprovincial in-migrants 351.2-9 Interprovincial out-migrants 361.2-10 Intraprovincial in-migrants 371.2-11 Intraprovincial out-migrants 381.2-12 Total population growth 391.2-13 Natural increase 401.2-14 Net international migration 411.2-15 Net interprovincial migration 421.2-16 Net intraprovincial migration 431.2-17 Total net migration 44
1.3 Annual population estimates and demographic factors of growth by census metropolitan area,Canada, from July to June 45
1.3-1 Population estimates and factors of growth 451.3-2 Factors of growth 46
2.1 Annual population estimates by economic region, provinces and territories, Canada 49
4 Statistics Canada – Catalogue no. 91-214
Annual Demographic Estimates: Census Metropolitan Areas, Economic Regions and Census Divisions, Age and Sex
Table of contents – continued
2.1-1 Population at July 1 492.1-2 Population rate of growth from July to June 51
2.2 Demographic factors of growth from July to June by economic region, provinces and territories,Canada 53
2.2-1 Population estimates and factors of growth 532.2-2 Factors of growth 55
2.3 Demographic indicators, age and dependency ratio by economic region, provinces and territories,Canada, July 1 57
3.1 Newfoundland and Labrador census division, Canada 613.1-1 Annual population estimates at July 1 613.1-2 Population rate of growth from July to June 613.1-3 Population estimates and factors of growth from July to June 613.1-4 Factors of growth (rate) from July to June 62
3.2 Prince Edward Island census division 623.2-1 Annual population estimates at July 1 623.2-2 Population rate of growth from July to June 623.2-3 Population estimates and factors of growth from July to June 623.2-4 Factors of growth from July to June 63
3.3 Nova Scotia census division 633.3-1 Annual population estimates at July 1 633.3-2 Population rate of growth from July to June 633.3-3 Population estimates and factors of growth from July to June 643.3-4 Factors of growth from July to June 64
3.4 New Brunswick census division 653.4-1 Annual population estimates at July 1 653.4-2 Population rate of growth from July to June 653.4-3 Population estimates and factors of growth from July to June 663.4-4 Factors of growth from July to June 66
3.5 Quebec census division 673.5-1 Annual population estimates at July 1 673.5-2 Population rate of growth from July to June 693.5-3 Population estimates and factors of growth from July to June 713.5-4 Factors of growth from July to June 73
Statistics Canada – Catalogue no. 91-214 5

Annual Demographic Estimates: Census Metropolitan Areas, Economic Regions and Census Divisions, Age and Sex
Table of contents – continued
3.6 Ontario census division 753.6-1 Annual population estimates at July 1 753.6-2 Population rate of growth from July to June 763.6-3 Population estimates and factors of growth from July to June 773.6-4 Factors of growth from July to June 78
3.7 Manitoba census division 793.7-1 Annual population estimates at July 1 793.7-2 Population rate of growth from July to June 793.7-3 Population estimates and factors of growth from July to June 803.7-4 Factors of growth from July to June 81
3.8 Saskatchewan census division 813.8-1 Annual population estimates at July 1 813.8-2 Population rate of growth from July to June 823.8-3 Population estimates and factors of growth from July to June 823.8-4 Factors of growth from July to June 83
3.9 Alberta census division 833.9-1 Annual population estimates at July 1 833.9-2 Population rate of growth from July to June 843.9-3 Population estimates and factors of growth from July to June 843.9-4 Factors of growth from July to June 85
3.10 British Columbia census division 853.10-1 Annual population estimates at July 1 853.10-2 Population rate of growth from July to June 863.10-3 Population estimates and factors of growth from July to June 873.10-4 Factors of growth from July to June 88
3.11 YukonTerritory census division 883.11-1 Annual population estimates at July 1 883.11-2 Population rate of growth from July to June 883.11-3 Population estimates and factors of growth from July to June 893.11-4 Factors of growth from July to June 89
3.12 Northwest Territories census divison 893.12-1 Annual population estimates at July 1 893.12-2 Population rate of growth from July to June 893.12-3 Population estimates and factors of growth from July to June 903.12-4 Factors of growth from July to June 90
6 Statistics Canada – Catalogue no. 91-214

Annual Demographic Estimates: Census Metropolitan Areas, Economic Regions and Census Divisions, Age and Sex
Table of contents – continued
3.13 Nunavut census division 903.13-1 Annual population estimates at July 1 903.13-2 Population rate of growth from July to June 903.13-3 Population estimates and factors of growth from July to June 913.13-4 Factors of growth from July to June 91
Statistics Canada – Catalogue no. 91-214 7
Annual Demographic Estimates: Census Metropolitan Areas, Economic Regions and Census Divisions, Age and Sex
Highlights
• At July 1, 2006, 21,294,400 people lived in a census metropolitan area (CMA), an increase of 12.1‰ over theprevious year.
• The Calgary (36.1‰) and Edmonton (26.2‰) CMAs had the largest increases. In contrast, the Saguenay, SaintJohn, Kingston and Thunder Bay CMAs were the only ones that showed population decreased, ranging from 2.5‰to 6.7‰.
• With a growth rate of 36.1‰, the Calgary CMA ranked first in terms of growth. In fact, this was the largest growthrecorded in Canada by a CMA since 1986
• More than one third of the new arrivals in Edmonton came from a non-metropolitan area in Alberta.
• Over the past year, the median age for all CMAs rose by 0.2, reaching 37.8. In non-CMAs, the increase was 0.4,twice as high as in the CMAs, bringing the median age of their populations to 40.7.
• The CMAs with the highest median ages were Trois-Rivières, Victoria, Saguenay and St. Catherines – Niagara,ranging from 41.8 to 43.4. On the other hand, the CMAswith the lowest median ages were Saskatoon and Calgary,at 35.1 and 35.4, respectively. These were followed by the Edmonton and Abbotsford CMAs, with 36.0 and 36.1.
8 Statistics Canada – Catalogue no. 91-214
Annual Demographic Estimates: Census Metropolitan Areas, Economic Regions and Census Divisions, Age and Sex
Related products
Selected publications from Statistics Canada
91-002-X Quarterly Demographic Estimates
91-209-X Report on the Demographic Situation in Canada
91-213-X Annual Demographic Statistics
91-215-X Annual Demographic Estimates: Canada, Provinces and Territories
91-520-X Population Projections for Canada, Provinces and Territories
Selected CANSIM tables from Statistics Canada
051-0001 Estimates of population, by age group and sex, Canada, provinces and territories, annual
051-0002 Deaths, by sex and age group, Canada, provinces and territories, annual
051-0004 Components of population growth, Canada, provinces and territories, annual
051-0005 Estimates of population, Canada, provinces and territories, quarterly
051-0006 Immigrants to Canada, by country of last permanent residence, quarterly
051-0011 International migrants, by age group and sex, Canada, provinces, and territories, annual
051-0012 Interprovincial migrants, by age group and sex, Canada, provinces and territories, annual
051-0013 Births by sex, Canada, provinces and territories, annual
051-0017 Interprovincial migrants, Canada, provinces and territories, quarterly
051-0018 Interprovincial in-, out- and net-migrants, by province or territory, annual
051-0019 Interprovincial migrants, by province or territory of origin and destination, annual
051-0020 Number of non-permanent residents, Canada, provinces and territories, quarterly
051-0034 Total population, census divisions and census metropolitan areas, 2001 Censusboundaries, annual
051-0035 Components of population growth, census divisions and census metropolitanareas, 2001 Census boundaries, annual
051-0036 Estimates of population, by sex and age group, census divisions and census metropolitanareas, 2001 Census boundaries, annual
Statistics Canada – Catalogue no. 91-214 9

Annual Demographic Estimates: Census Metropolitan Areas, Economic Regions and Census Divisions, Age and Sex
051-0037 International migration components, Canada, provinces and territories, quarterly
051-0038 Estimates of population, by economic region, sex and age group for July 1st, 2001 Censusboundaries
051-0039 Components of population growth, by economic region, sex and age group, 2001 Censusboundaries
051-0040 Births, by economic regions and sex, 2001 Census boundaries
051-0045 Interprovincial migrants, by province or territory of origin and destination, quarterly
053-0001 Vital statistics, births, deaths and marriages, quarterly
102-0502 Deaths, by month, Canada, provinces and territories, annual
102-4502 Live births, by month, Canada, provinces and territories, annual
Selected surveys from Statistics Canada
3231 Vital Statistics - Birth Database
3233 Vital Statistics - Death Database
3601 Estimates of Total Population, Canada, Provinces and Territories
3604 Estimates of Population by Age and Sex for Canada, Provinces and Territories
3608 Estimates of Population by Age and Sex for Census Divisions, Census Metropolitan Areasand Economic Regions (Component Method)
Selected summary tables from Statistics Canada
• Births and birth rate, by provinces and territories
• Deaths and death rate, by provinces and territories
• Components of population growth, by province and territory
• Marriages by provinces and territories
• Infant mortality rates, by province and territory
• Disability-free life expectancy, by province and territory
• Induced abortions by age group
• Pregnancy outcomes by province or territory of residence
10 Statistics Canada – Catalogue no. 91-214

Annual Demographic Estimates: Census Metropolitan Areas, Economic Regions and Census Divisions, Age and Sex
• Pregnancy outcomes by age group
• Suicides and suicide rate, by sex and by age group
• Suicides, and suicide rate, by sex and by age group
• Age-standardized mortality rates by selected causes, by sex
• Selected leading causes of death, by sex
• Canada: Economic and financial data
• Population by year, by province and territory
• Population by sex and age group
• Population by sex and age group, by provinces and territories
• Induced abortions by area of residence of patients
• Induced abortions per 100 live births
• New cancer cases, by primary site of cancer, by sex
• Population of census metropolitan areas (2001 Census boundaries)
Statistics Canada – Catalogue no. 91-214 11
Annual Demographic Estimates: Census Metropolitan Areas, Economic Regions and Census Divisions, Age and Sex
Section 1
Census metropolitan areasAt July 1, 2006, 21,294,400 people lived in a censusmetropolitan area (CMA), an increase of 12.1‰ overthe previous year.
Person’s living in Canada’s CMAs represented 65% ofthe Canadian population, a slight increase compared tothe 64% recorded in 2001.
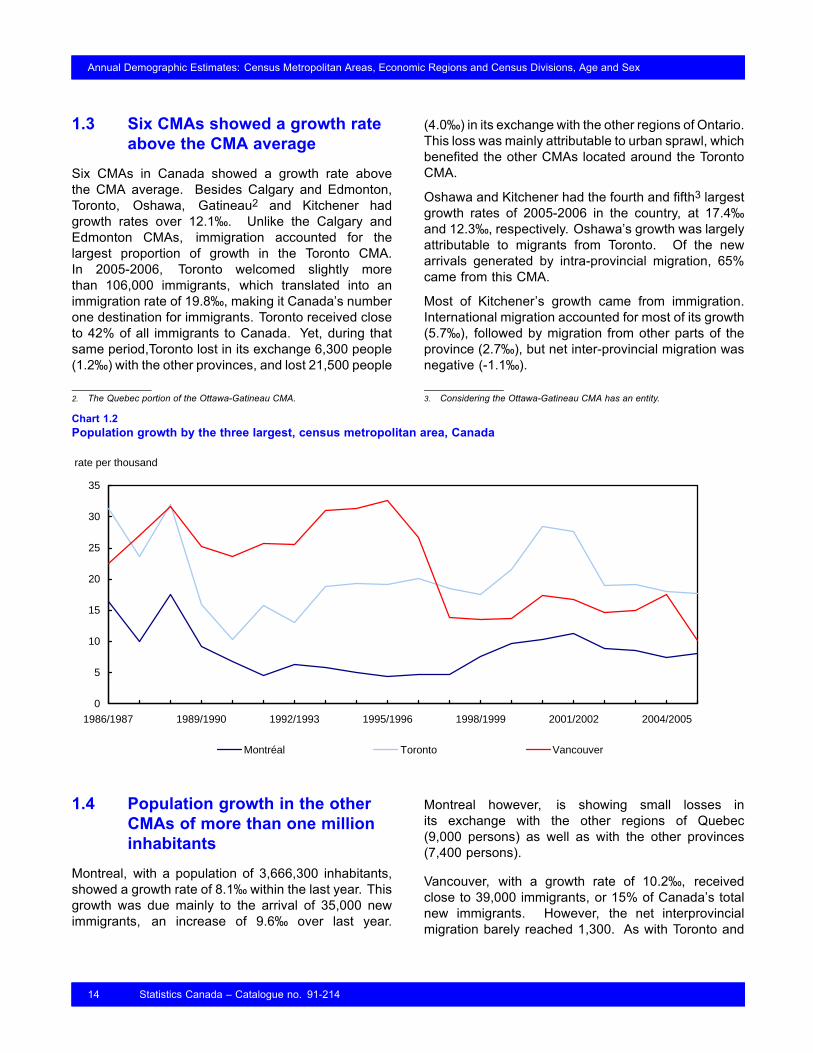
More than half of these (53.1%) lived in one of thethree largest CMAs, Toronto (5,406,300), Montréal(3,666,300) and Vancouver (2,236,100).
The Calgary (36.1‰) and Edmonton (26.2‰) CMAshad the largest increases. In contrast, the Saguenay,Saint John, Kingston and Thunder Bay CMAs were theonly ones that showed population decreased, rangingfrom 2.5‰ to 6.7‰.
The population growth in non-metropolitan censusareas was more moderate, at 6.1‰.
1.1 Alberta’s CMAs are growingOnce again, this year, the populations of Alberta’sCMAs grew the most. The strong growth in these twoCMAs resulted from the economic boom generated bymajor investments in the oil industry, which attractedlarge numbers of migrants from the other provinces,mainly Ontario (16%) and British Columbia (18%).(See chart 1.1)
With a growth rate of 36.1‰, the CalgaryCMA ranked first in terms of growth. Itrecorded 1,107,200 inhabitants, or 39,300 more thanlast year. In fact, this was the largest growth recorded
in Canada by a CMA since 1986. Among the maininter- and intra-provincial sources of growth in theCalgary CMA, 24% came from non-metropolitanareas1 in Alberta, 11% from Edmonton, 10% fromnon-metropolitan areas in British Columbia, 8% fromToronto and 8% from Vancouver.
Edmonton ranked second, and recorded its strongestgrowth since 1986, with a rate of 26.2‰. Its population,which had increased by 27,100 the year before, cameto 1,050,000. More than one third of the new arrivalsin this CMA came from a non-metropolitan area inAlberta. The remainder came from Calgary (10%) andnon-metropolitan areas in British Columbia (8%).
1.2 New arrivals in Albertacame mostly from theneighbouring provincesand from Newfoundland andLabrador
New inter-provincial migrants to Alberta camemostly from the neighbouring provinces ofSaskatchewan, British Columbia, Manitoba, and theNorthwest Territories. One exception, migrants fromNewfoundland and Labrador were also likely to moveto Alberta upon leaving their home province.
Thus, of the 22,900 people who leftSaskatchewan, 14,500 (63%) moved to Alberta. Ofthese, 53% settled in a non-CMA, 25% opted forCalgary and 22% chose Edmonton.
1. Non-metropolitan areas are areas that are not considered as censusmetropolitan areas (CMAs).
12 Statistics Canada – Catalogue no. 91-214

Annual Demographic Estimates: Census Metropolitan Areas, Economic Regions and Census Divisions, Age and Sex
Chart 1.1Population growth rates by census metropolitan areas, Canada
-10 -5 0 5 10 15 20 25 30 35 40
CalgaryEdmonton
TorontoOshawa
Ottawa-Gatineau, Quebec partKitchener
QuébecVancouverAbbotsford
MontréalTrois-Rivières
SherbrookeVictoriaLondonHalifax
HamiltonOttawa-Gatineau, Ontario part
WinnipegSaskatoon
WindsorGreater Sudbury / Grand Sudbury
St. John'sRegina
St. Catharines-NiagaraSaguenaySaint John
KingstonThunder Bay
All census metropolitan areas
2004/2005
2005/2006
rate per thousand
In the case of British Columbia, of the 46,100 peoplewho left this province, 24,800 (54%) moved to Alberta.Of these, 39% settled in a non-CMA, 36% opted forCalgary and 25% chose Edmonton.
With regard to Newfoundland and Labrador,the 4,600 people who left this province moved toAlberta (39% of total out-migrants). Of these, 60%settled in a non-CMA area in Alberta. In the caseof Manitoba, 36% of those leaving the provincechose Alberta. In contrast to those coming fromNewfoundland and Labrador, 64% opted for theCalgary or Edmonton CMA.
Of the 27 CMAs, 11 lost at least 30% of theirinter-provincial migrants to Alberta. The proportionwas highest in Saskatoon, Abbotsford and Regina,where the proportions surpassed 50%. Thus, for allother CMAs across Canada, except for Saguenay,a larger proportion of their inter-provincial migrantswho chose Alberta preferred Calgary or Edmonton toa non-CMA in this province. More than 35% of theinter-provincial migrants from Saskatoon, Abbotsfordand Regina opted for one of the two CMAs in Alberta.
Statistics Canada – Catalogue no. 91-214 13
Annual Demographic Estimates: Census Metropolitan Areas, Economic Regions and Census Divisions, Age and Sex
1.3 Six CMAs showed a growth rateabove the CMA average
Six CMAs in Canada showed a growth rate abovethe CMA average. Besides Calgary and Edmonton,Toronto, Oshawa, Gatineau2 and Kitchener hadgrowth rates over 12.1‰. Unlike the Calgary andEdmonton CMAs, immigration accounted for thelargest proportion of growth in the Toronto CMA.In 2005-2006, Toronto welcomed slightly morethan 106,000 immigrants, which translated into animmigration rate of 19.8‰, making it Canada’s numberone destination for immigrants. Toronto received closeto 42% of all immigrants to Canada. Yet, during thatsame period,Toronto lost in its exchange 6,300 people(1.2‰) with the other provinces, and lost 21,500 people
2. The Quebec portion of the Ottawa-Gatineau CMA.
(4.0‰) in its exchange with the other regions of Ontario.This loss was mainly attributable to urban sprawl, whichbenefited the other CMAs located around the TorontoCMA.
Oshawa and Kitchener had the fourth and fifth3 largestgrowth rates of 2005-2006 in the country, at 17.4‰and 12.3‰, respectively. Oshawa’s growth was largelyattributable to migrants from Toronto. Of the newarrivals generated by intra-provincial migration, 65%came from this CMA.
Most of Kitchener’s growth came from immigration.International migration accounted for most of its growth(5.7‰), followed by migration from other parts of theprovince (2.7‰), but net inter-provincial migration wasnegative (-1.1‰).
3. Considering the Ottawa-Gatineau CMA has an entity.
Chart 1.2Population growth by the three largest, census metropolitan area, Canada
0
5
10
15
20
25
30
35
1986/1987 1989/1990 1992/1993 1995/1996 1998/1999 2001/2002 2004/2005
Montréal Toronto Vancouver
rate per thousand
1.4 Population growth in the otherCMAs of more than one millioninhabitants
Montreal, with a population of 3,666,300 inhabitants,showed a growth rate of 8.1‰ within the last year. Thisgrowth was due mainly to the arrival of 35,000 newimmigrants, an increase of 9.6‰ over last year.
Montreal however, is showing small losses inits exchange with the other regions of Quebec(9,000 persons) as well as with the other provinces(7,400 persons).
Vancouver, with a growth rate of 10.2‰, receivedclose to 39,000 immigrants, or 15% of Canada’s totalnew immigrants. However, the net interprovincialmigration barely reached 1,300. As with Toronto and
14 Statistics Canada – Catalogue no. 91-214

Annual Demographic Estimates: Census Metropolitan Areas, Economic Regions and Census Divisions, Age and Sex
Montreal, urban sprawl also had an impact on theVancouver area, which lost 5,500 people to other partsof the province, a decrease of 2.5‰. Urban sprawlbenefited the Abbotsford CMA, which is located nextto Vancouver. It took in 5,200 people from Vancouver.
The population of Ottawa-Gatineau, the fourthlargest CMA in the country, grew by 6.2‰,reaching 1,158,300 inhabitants. Most of the growth
was in the Quebec part of this CMA, with a growthrate of 15‰, compared to only 3.4‰ for its Ontariopart. Ottawa was the main beneficiary of immigration,welcoming 5,500 people, although it lost at the inter-and intra-provincial levels. Gatineau benefited greatlyfrom inter- and intra-provincial migration, more thanone-third of the former originating in Ottawa. (Seecharts 1.2, 1.3 and 1.4)
Chart 1.3Factors of the population growth by census metropolitan area, Canada, 2005/2006
-15 -10 -5 0 5 10 15 20 25 30 35
AbbotsfordCalgary
EdmontonGreater Sudbury / Grand
HalifaxHamiltonKingston
KitchenerLondon
MontréalOshawa
Ottawa-Gatineau, Ontario partOttawa-Gatineau, Quebec part
QuébecRegina
St. Catharines-NiagaraSt. John'sSaguenaySaint JohnSaskatoon
SherbrookeThunder Bay
TorontoTrois-Rivières
VancouverVictoria
WindsorWinnipeg
Natural increase International migrationInterprovincial migration Intraprovincial migration
rate per thousand
Statistics Canada – Catalogue no. 91-214 15

Annual Demographic Estimates: Census Metropolitan Areas, Economic Regions and Census Divisions, Age and Sex
Chart 1.4Factors of population growth of the six largest census metropolitan areas, Canada
-20
-10
0
10
20
30
40
1987 1990 1993 1996 1999 2002 2005
rate per thousand
Calgary
-20
-10
0
10
20
30
40
1987 1990 1993 1996 1999 2002 2005
Edmonton
rate per thousand
-20
-10
0
10
20
30
40
1987 1990 1993 1996 1999 2002 2005
Ottawa-Gatineau
rate per thousand
-20
-10
0
10
20
30
40
1987 1990 1993 1996 1999 2002 2005
Total growth International migration
Interprovincial migration
rate per thousand
Toronto
-20
-10
0
10
20
30
40
1987 1990 1993 1996 1999 2002 2005
Natural growth Intraprovincial migration
Vancouver
rate per thousand
-20
-10
0
10
20
30
40
1987 1990 1993 1996 1999 2002 2005
rate per thousand
Montréal
1. Year ending June 30.
16 Statistics Canada – Catalogue no. 91-214
Annual Demographic Estimates: Census Metropolitan Areas, Economic Regions and Census Divisions, Age and Sex
1.5 Population aging slower in theCMAs than in the non-CMAs.
Canada’s population has been aging steadily over thepast few years. From 2001 to 2006, the median ageof Canada’s population rose from 37.2 to 38.8. Thisaging was observed in both CMA and non-CMA areas.However, the rise in the median age occurred faster inthe non-CMAs than in the CMAs, thereby increasing thegap between their median ages.
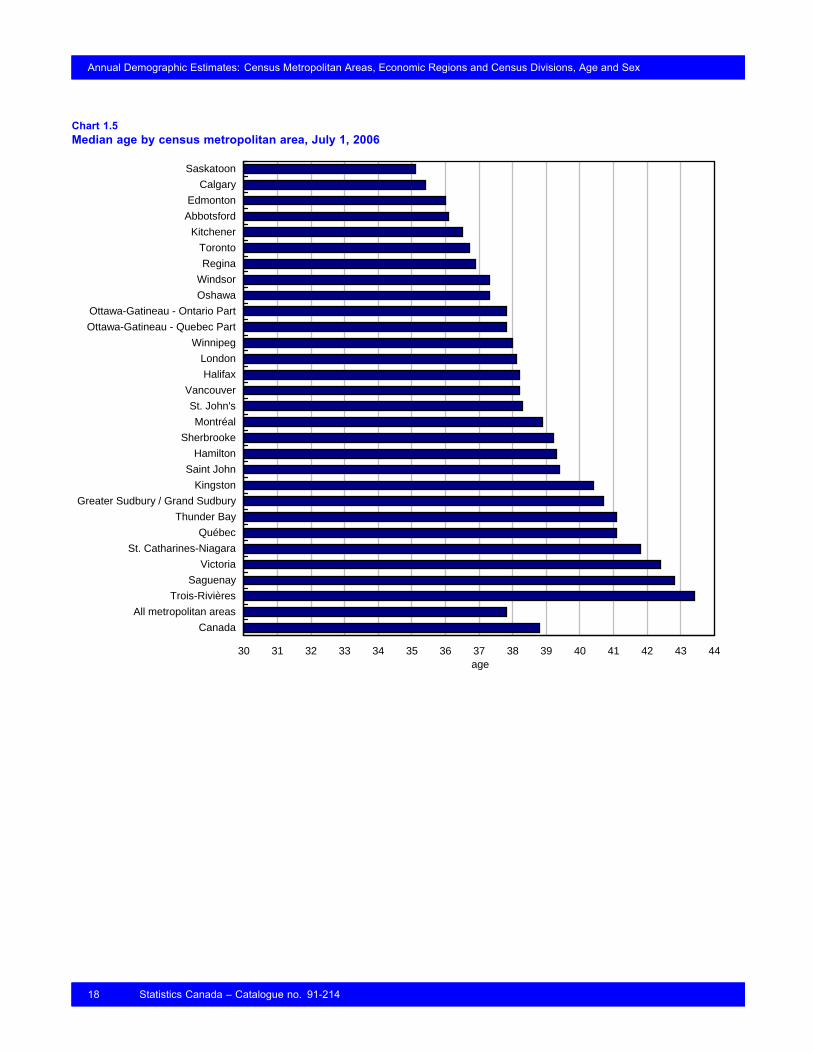
Over the past year, the median age for all CMAs roseby 0.2, reaching 37.8. In non-CMAs, the increasewas 0.4, twice as high as in the CMAs, bringing themedian age of their populations to 40.7. (See chart1.5)
The median age in non-CMAs was 2.4 years higherthan in 2001, whereas for CMAs as a whole, thisdifference was twice as small, at only 1.2. Thedifference between CMAs and non-CMAs grewsteadily, and in 2006 reached 2.9 years, comparedto 1.7 in 2001.
Nonetheless, some CMAs were affected more thanothers by population aging. Thus, the CMAs with thehighest median ages were Trois-Rivières, Victoria,Saguenay and St. Catherines – Niagara, rangingfrom 41.8 to 43.4. On the other hand, the CMAswith the lowest median ages were Saskatoon andCalgary, at 35.1 and 35.4, respectively. These werefollowed by the Edmonton and Abbotsford CMAs,with 36.0 and 36.1.
Changes in the median age also varied among CMAs.The Calgary and Edmonton CMAs’ median agesrose by less than one compared to 2001. This slightchange was attributable to the high proportion of
younger workers moving to Alberta. In comparison, theSaguenay, Trois-Rivières, Thunder Bay and KingstonCMAs saw a large increase in their median agescompared to 2001, ranging from 2.5 to 3.2 years.
Another indicator of aging is the number of inhabitantsaged 65 and over as a proportion of the totalpopulation. In 2006, 12.3% of the people living inCMAs were 65 years of age and older, whereas theproportion in non-CMAs was 14.9%. (See chart 1.6)
Although CMAs as a whole had a smaller proportionof older people than non-CMAs, some of them hadhigh proportions. For instance, the proportions ofinhabitants aged 65 and over in the Thunder Bay(15.6%), Trois-Rivières (16.8%), Victoria (17.2%) andSt. Catherines – Niagara (17.5%) CMAs were allhigher than 15%.
By comparison, the CMAs with the smallest proportionsof inhabitants aged 65 and over were Calgary (9.1%),Gatineau4 (9.9%), Edmonton (10.9%) and St. John’s(10.9%).
The fastest increases in the proportions of inhabitantsaged 65 and over were in the Sherbrooke, Québec,Trois-Rivières and Saguenay CMAs, where theyranged from 0.4 to 0.6 percentage points. Comparedto 2001, the proportion of inhabitants aged 65 and overfrom the Saguenay CMA’s was up by 2.0 percentagepoints, Trois-Rivières’ by 1.7 and Québec’s by 1.2.
In contrast, some of the CMAs in the Westseemed to age less rapidly. The proportion ofinhabitants aged 65 and over in the Calgary,Abbotsford and Winnipeg CMAs remained unchangedthroughout 2006.
4. The Quebec portion of the Ottawa-Gatineau CMA.
Statistics Canada – Catalogue no. 91-214 17
Annual Demographic Estimates: Census Metropolitan Areas, Economic Regions and Census Divisions, Age and Sex
Chart 1.5Median age by census metropolitan area, July 1, 2006
age30 31 32 33 34 35 36 37 38 39 40 41 42 43 44
Canada
All metropolitan areas
Trois-Rivières
Saguenay
Victoria
St. Catharines-Niagara
Québec
Thunder Bay
Greater Sudbury / Grand Sudbury
Kingston
Saint John
Hamilton
Sherbrooke
Montréal
St. John's
Vancouver
Halifax
London
Winnipeg
Ottawa-Gatineau - Quebec Part
Ottawa-Gatineau - Ontario Part
Oshawa
Windsor
Regina
Toronto
Kitchener
Abbotsford
Edmonton
Calgary
Saskatoon
18 Statistics Canada – Catalogue no. 91-214

Annual Demographic Estimates: Census Metropolitan Areas, Economic Regions and Census Divisions, Age and Sex
Chart 1.6Distribution of population by age group and census metropolitan area, Canada, 2006
0% 10% 20% 30% 40% 50% 60% 70% 80% 90% 100%
CanadaAll metropolitan areas
WinnipegWindsorVictoria
VancouverTrois-Rivières
TorontoThunder Bay
St. John'sSt. Catharines-Niagara
SherbrookeSaskatoonSaint JohnSaguenay
ReginaQuébec
Ottawa-Gatineau - Quebec PartOttawa-Gatineau - Ontario Part
OshawaMontréalLondon
KitchenerKingstonHamilton
HalifaxGreater Sudbury / Grand Sudbury
EdmontonCalgary
Abbotsford
0 to 17 years 18 to 24 years 25 to 64 years 65 to 74 years 75 years and over
distribution
Statistics Canada – Catalogue no. 91-214 19
Annual Demographic Estimates: Census Metropolitan Areas, Economic Regions and Census Divisions, Age and Sex
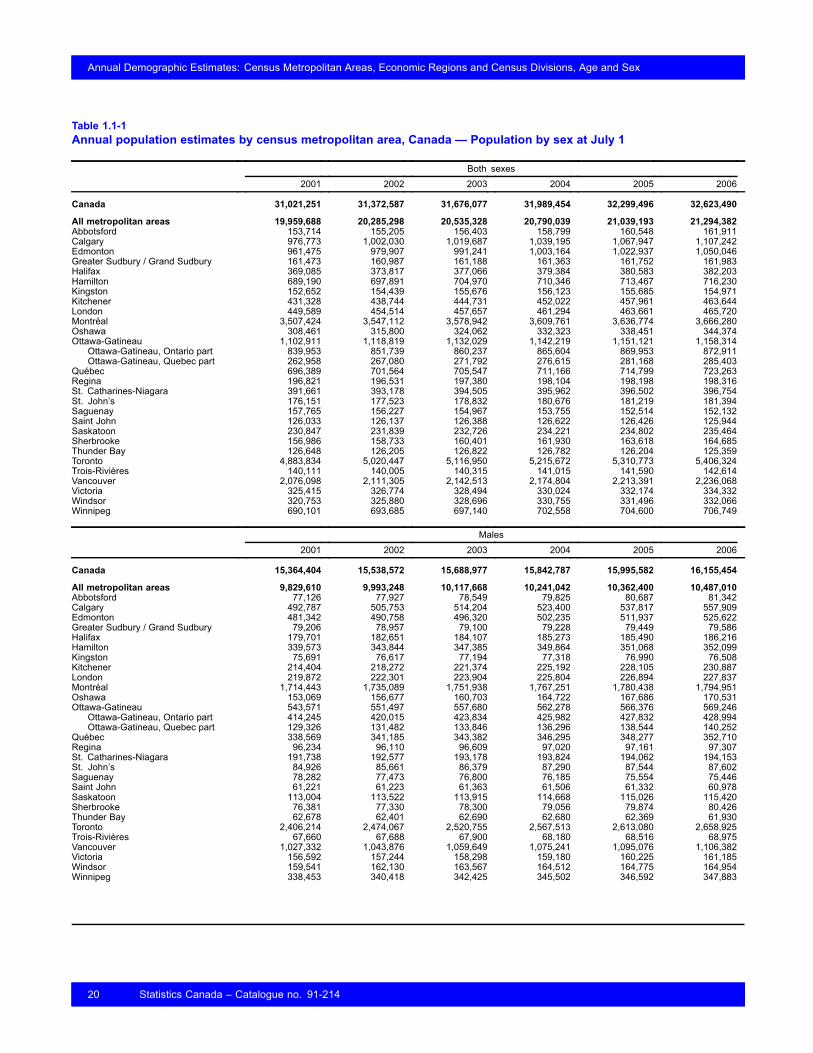
Table 1.1-1Annual population estimates by census metropolitan area, Canada — Population by sex at July 1
Both sexes2001 2002 2003 2004 2005 2006
Canada 31,021,251 31,372,587 31,676,077 31,989,454 32,299,496 32,623,490
All metropolitan areas 19,959,688 20,285,298 20,535,328 20,790,039 21,039,193 21,294,382Abbotsford 153,714 155,205 156,403 158,799 160,548 161,911Calgary 976,773 1,002,030 1,019,687 1,039,195 1,067,947 1,107,242Edmonton 961,475 979,907 991,241 1,003,164 1,022,937 1,050,046Greater Sudbury / Grand Sudbury 161,473 160,987 161,188 161,363 161,752 161,983Halifax 369,085 373,817 377,066 379,384 380,583 382,203Hamilton 689,190 697,891 704,970 710,346 713,467 716,230Kingston 152,652 154,439 155,676 156,123 155,685 154,971Kitchener 431,328 438,744 444,731 452,022 457,961 463,644London 449,589 454,514 457,657 461,294 463,661 465,720Montréal 3,507,424 3,547,112 3,578,942 3,609,761 3,636,774 3,666,280Oshawa 308,461 315,800 324,062 332,323 338,451 344,374Ottawa-Gatineau 1,102,911 1,118,819 1,132,029 1,142,219 1,151,121 1,158,314
Ottawa-Gatineau, Ontario part 839,953 851,739 860,237 865,604 869,953 872,911Ottawa-Gatineau, Quebec part 262,958 267,080 271,792 276,615 281,168 285,403
Québec 696,389 701,564 705,547 711,166 714,799 723,263Regina 196,821 196,531 197,380 198,104 198,198 198,316St. Catharines-Niagara 391,661 393,178 394,505 395,962 396,502 396,754St. John’s 176,151 177,523 178,832 180,676 181,219 181,394Saguenay 157,765 156,227 154,967 153,755 152,514 152,132Saint John 126,033 126,137 126,388 126,622 126,426 125,944Saskatoon 230,847 231,839 232,726 234,221 234,802 235,464Sherbrooke 156,986 158,733 160,401 161,930 163,618 164,685Thunder Bay 126,648 126,205 126,822 126,782 126,204 125,359Toronto 4,883,834 5,020,447 5,116,950 5,215,672 5,310,773 5,406,324Trois-Rivières 140,111 140,005 140,315 141,015 141,590 142,614Vancouver 2,076,098 2,111,305 2,142,513 2,174,804 2,213,391 2,236,068Victoria 325,415 326,774 328,494 330,024 332,174 334,332Windsor 320,753 325,880 328,696 330,755 331,496 332,066Winnipeg 690,101 693,685 697,140 702,558 704,600 706,749
Males2001 2002 2003 2004 2005 2006
Canada 15,364,404 15,538,572 15,688,977 15,842,787 15,995,582 16,155,454
All metropolitan areas 9,829,610 9,993,248 10,117,668 10,241,042 10,362,400 10,487,010Abbotsford 77,126 77,927 78,549 79,825 80,687 81,342Calgary 492,787 505,753 514,204 523,400 537,817 557,909Edmonton 481,342 490,758 496,320 502,235 511,937 525,622Greater Sudbury / Grand Sudbury 79,206 78,957 79,100 79,228 79,449 79,586Halifax 179,701 182,651 184,107 185,273 185,490 186,216Hamilton 339,573 343,844 347,385 349,864 351,068 352,099Kingston 75,691 76,617 77,194 77,318 76,990 76,508Kitchener 214,404 218,272 221,374 225,192 228,105 230,887London 219,872 222,301 223,904 225,804 226,894 227,837Montréal 1,714,443 1,735,089 1,751,938 1,767,251 1,780,438 1,794,951Oshawa 153,069 156,677 160,703 164,722 167,686 170,531Ottawa-Gatineau 543,571 551,497 557,680 562,278 566,376 569,246
Ottawa-Gatineau, Ontario part 414,245 420,015 423,834 425,982 427,832 428,994Ottawa-Gatineau, Quebec part 129,326 131,482 133,846 136,296 138,544 140,252
Québec 338,569 341,185 343,382 346,295 348,277 352,710Regina 96,234 96,110 96,609 97,020 97,161 97,307St. Catharines-Niagara 191,738 192,577 193,178 193,824 194,062 194,153St. John’s 84,926 85,661 86,379 87,290 87,544 87,602Saguenay 78,282 77,473 76,800 76,185 75,554 75,446Saint John 61,221 61,223 61,363 61,506 61,332 60,978Saskatoon 113,004 113,522 113,915 114,668 115,026 115,420Sherbrooke 76,381 77,330 78,300 79,056 79,874 80,426Thunder Bay 62,678 62,401 62,690 62,680 62,369 61,930Toronto 2,406,214 2,474,067 2,520,755 2,567,513 2,613,080 2,658,925Trois-Rivières 67,660 67,688 67,900 68,180 68,516 68,975Vancouver 1,027,332 1,043,876 1,059,649 1,075,241 1,095,076 1,106,382Victoria 156,592 157,244 158,298 159,180 160,225 161,185Windsor 159,541 162,130 163,567 164,512 164,775 164,954Winnipeg 338,453 340,418 342,425 345,502 346,592 347,883
20 Statistics Canada – Catalogue no. 91-214

Annual Demographic Estimates: Census Metropolitan Areas, Economic Regions and Census Divisions, Age and Sex
Table 1.1-1 – continued
Annual population estimates by census metropolitan area, Canada — Population by sex at July 1Females
2001 2002 2003 2004 2005 2006
Canada 15,656,847 15,834,015 15,987,100 16,146,667 16,303,914 16,468,036
All metropolitan areas 10,130,078 10,292,050 10,417,660 10,548,997 10,676,793 10,807,372Abbotsford 76,588 77,278 77,854 78,974 79,861 80,569Calgary 483,986 496,277 505,483 515,795 530,130 549,333Edmonton 480,133 489,149 494,921 500,929 511,000 524,424Greater Sudbury / Grand Sudbury 82,267 82,030 82,088 82,135 82,303 82,397Halifax 189,384 191,166 192,959 194,111 195,093 195,987Hamilton 349,617 354,047 357,585 360,482 362,399 364,131Kingston 76,961 77,822 78,482 78,805 78,695 78,463Kitchener 216,924 220,472 223,357 226,830 229,856 232,757London 229,717 232,213 233,753 235,490 236,767 237,883Montréal 1,792,981 1,812,023 1,827,004 1,842,510 1,856,336 1,871,329Oshawa 155,392 159,123 163,359 167,601 170,765 173,843Ottawa-Gatineau 559,340 567,322 574,349 579,941 584,745 589,068
Ottawa-Gatineau, Ontario part 425,708 431,724 436,403 439,622 442,121 443,917Ottawa-Gatineau, Quebec part 133,632 135,598 137,946 140,319 142,624 145,151
Québec 357,820 360,379 362,165 364,871 366,522 370,553Regina 100,587 100,421 100,771 101,084 101,037 101,009St. Catharines-Niagara 199,923 200,601 201,327 202,138 202,440 202,601St. John’s 91,225 91,862 92,453 93,386 93,675 93,792Saguenay 79,483 78,754 78,167 77,570 76,960 76,686Saint John 64,812 64,914 65,025 65,116 65,094 64,966Saskatoon 117,843 118,317 118,811 119,553 119,776 120,044Sherbrooke 80,605 81,403 82,101 82,874 83,744 84,259Thunder Bay 63,970 63,804 64,132 64,102 63,835 63,429Toronto 2,477,620 2,546,380 2,596,195 2,648,159 2,697,693 2,747,399Trois-Rivières 72,451 72,317 72,415 72,835 73,074 73,639Vancouver 1,048,766 1,067,429 1,082,864 1,099,563 1,118,315 1,129,686Victoria 168,823 169,530 170,196 170,844 171,949 173,147Windsor 161,212 163,750 165,129 166,243 166,721 167,112Winnipeg 351,648 353,267 354,715 357,056 358,008 358,866
Statistics Canada – Catalogue no. 91-214 21
Annual Demographic Estimates: Census Metropolitan Areas, Economic Regions and Census Divisions, Age and Sex
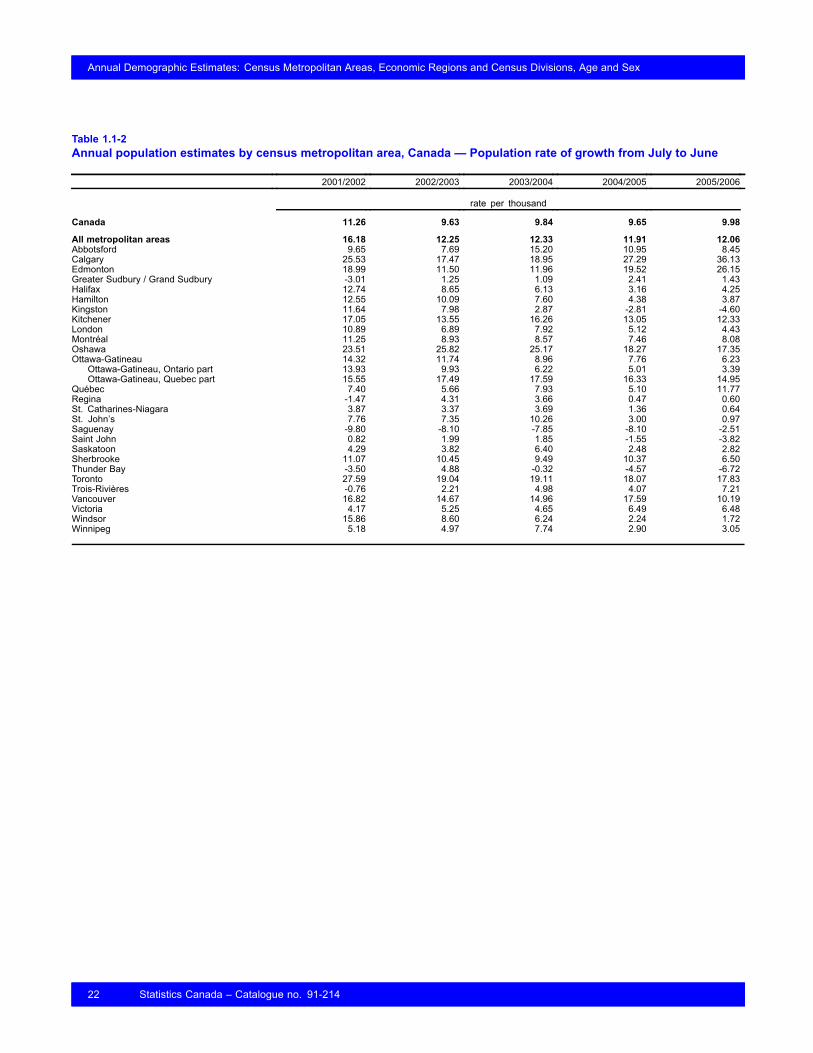
Table 1.1-2Annual population estimates by census metropolitan area, Canada — Population rate of growth from July to June
2001/2002 2002/2003 2003/2004 2004/2005 2005/2006
rate per thousand
Canada 11.26 9.63 9.84 9.65 9.98
All metropolitan areas 16.18 12.25 12.33 11.91 12.06Abbotsford 9.65 7.69 15.20 10.95 8.45Calgary 25.53 17.47 18.95 27.29 36.13Edmonton 18.99 11.50 11.96 19.52 26.15Greater Sudbury / Grand Sudbury -3.01 1.25 1.09 2.41 1.43Halifax 12.74 8.65 6.13 3.16 4.25Hamilton 12.55 10.09 7.60 4.38 3.87Kingston 11.64 7.98 2.87 -2.81 -4.60Kitchener 17.05 13.55 16.26 13.05 12.33London 10.89 6.89 7.92 5.12 4.43Montréal 11.25 8.93 8.57 7.46 8.08Oshawa 23.51 25.82 25.17 18.27 17.35Ottawa-Gatineau 14.32 11.74 8.96 7.76 6.23
Ottawa-Gatineau, Ontario part 13.93 9.93 6.22 5.01 3.39Ottawa-Gatineau, Quebec part 15.55 17.49 17.59 16.33 14.95
Québec 7.40 5.66 7.93 5.10 11.77Regina -1.47 4.31 3.66 0.47 0.60St. Catharines-Niagara 3.87 3.37 3.69 1.36 0.64St. John’s 7.76 7.35 10.26 3.00 0.97Saguenay -9.80 -8.10 -7.85 -8.10 -2.51Saint John 0.82 1.99 1.85 -1.55 -3.82Saskatoon 4.29 3.82 6.40 2.48 2.82Sherbrooke 11.07 10.45 9.49 10.37 6.50Thunder Bay -3.50 4.88 -0.32 -4.57 -6.72Toronto 27.59 19.04 19.11 18.07 17.83Trois-Rivières -0.76 2.21 4.98 4.07 7.21Vancouver 16.82 14.67 14.96 17.59 10.19Victoria 4.17 5.25 4.65 6.49 6.48Windsor 15.86 8.60 6.24 2.24 1.72Winnipeg 5.18 4.97 7.74 2.90 3.05
22 Statistics Canada – Catalogue no. 91-214
Annual Demographic Estimates: Census Metropolitan Areas, Economic Regions and Census Divisions, Age and Sex
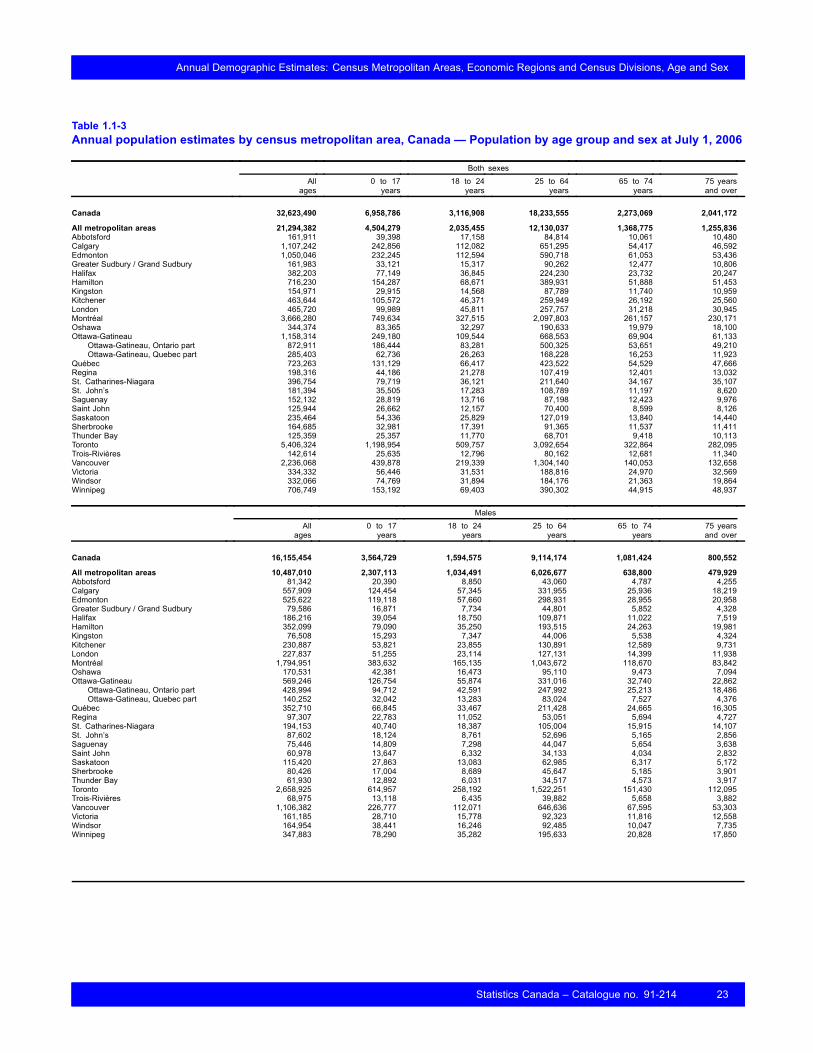
Table 1.1-3Annual population estimates by census metropolitan area, Canada — Population by age group and sex at July 1, 2006
Both sexesAll
ages0 to 17years
18 to 24years
25 to 64years
65 to 74years
75 yearsand over
Canada 32,623,490 6,958,786 3,116,908 18,233,555 2,273,069 2,041,172
All metropolitan areas 21,294,382 4,504,279 2,035,455 12,130,037 1,368,775 1,255,836Abbotsford 161,911 39,398 17,158 84,814 10,061 10,480Calgary 1,107,242 242,856 112,082 651,295 54,417 46,592Edmonton 1,050,046 232,245 112,594 590,718 61,053 53,436Greater Sudbury / Grand Sudbury 161,983 33,121 15,317 90,262 12,477 10,806Halifax 382,203 77,149 36,845 224,230 23,732 20,247Hamilton 716,230 154,287 68,671 389,931 51,888 51,453Kingston 154,971 29,915 14,568 87,789 11,740 10,959Kitchener 463,644 105,572 46,371 259,949 26,192 25,560London 465,720 99,989 45,811 257,757 31,218 30,945Montréal 3,666,280 749,634 327,515 2,097,803 261,157 230,171Oshawa 344,374 83,365 32,297 190,633 19,979 18,100Ottawa-Gatineau 1,158,314 249,180 109,544 668,553 69,904 61,133
Ottawa-Gatineau, Ontario part 872,911 186,444 83,281 500,325 53,651 49,210Ottawa-Gatineau, Quebec part 285,403 62,736 26,263 168,228 16,253 11,923
Québec 723,263 131,129 66,417 423,522 54,529 47,666Regina 198,316 44,186 21,278 107,419 12,401 13,032St. Catharines-Niagara 396,754 79,719 36,121 211,640 34,167 35,107St. John’s 181,394 35,505 17,283 108,789 11,197 8,620Saguenay 152,132 28,819 13,716 87,198 12,423 9,976Saint John 125,944 26,662 12,157 70,400 8,599 8,126Saskatoon 235,464 54,336 25,829 127,019 13,840 14,440Sherbrooke 164,685 32,981 17,391 91,365 11,537 11,411Thunder Bay 125,359 25,357 11,770 68,701 9,418 10,113Toronto 5,406,324 1,198,954 509,757 3,092,654 322,864 282,095Trois-Rivières 142,614 25,635 12,796 80,162 12,681 11,340Vancouver 2,236,068 439,878 219,339 1,304,140 140,053 132,658Victoria 334,332 56,446 31,531 188,816 24,970 32,569Windsor 332,066 74,769 31,894 184,176 21,363 19,864Winnipeg 706,749 153,192 69,403 390,302 44,915 48,937
MalesAll
ages0 to 17years
18 to 24years
25 to 64years
65 to 74years
75 yearsand over
Canada 16,155,454 3,564,729 1,594,575 9,114,174 1,081,424 800,552
All metropolitan areas 10,487,010 2,307,113 1,034,491 6,026,677 638,800 479,929Abbotsford 81,342 20,390 8,850 43,060 4,787 4,255Calgary 557,909 124,454 57,345 331,955 25,936 18,219Edmonton 525,622 119,118 57,660 298,931 28,955 20,958Greater Sudbury / Grand Sudbury 79,586 16,871 7,734 44,801 5,852 4,328Halifax 186,216 39,054 18,750 109,871 11,022 7,519Hamilton 352,099 79,090 35,250 193,515 24,263 19,981Kingston 76,508 15,293 7,347 44,006 5,538 4,324Kitchener 230,887 53,821 23,855 130,891 12,589 9,731London 227,837 51,255 23,114 127,131 14,399 11,938Montréal 1,794,951 383,632 165,135 1,043,672 118,670 83,842Oshawa 170,531 42,381 16,473 95,110 9,473 7,094Ottawa-Gatineau 569,246 126,754 55,874 331,016 32,740 22,862
Ottawa-Gatineau, Ontario part 428,994 94,712 42,591 247,992 25,213 18,486Ottawa-Gatineau, Quebec part 140,252 32,042 13,283 83,024 7,527 4,376
Québec 352,710 66,845 33,467 211,428 24,665 16,305Regina 97,307 22,783 11,052 53,051 5,694 4,727St. Catharines-Niagara 194,153 40,740 18,387 105,004 15,915 14,107St. John’s 87,602 18,124 8,761 52,696 5,165 2,856Saguenay 75,446 14,809 7,298 44,047 5,654 3,638Saint John 60,978 13,647 6,332 34,133 4,034 2,832Saskatoon 115,420 27,863 13,083 62,985 6,317 5,172Sherbrooke 80,426 17,004 8,689 45,647 5,185 3,901Thunder Bay 61,930 12,892 6,031 34,517 4,573 3,917Toronto 2,658,925 614,957 258,192 1,522,251 151,430 112,095Trois-Rivières 68,975 13,118 6,435 39,882 5,658 3,882Vancouver 1,106,382 226,777 112,071 646,636 67,595 53,303Victoria 161,185 28,710 15,778 92,323 11,816 12,558Windsor 164,954 38,441 16,246 92,485 10,047 7,735Winnipeg 347,883 78,290 35,282 195,633 20,828 17,850
Statistics Canada – Catalogue no. 91-214 23
Annual Demographic Estimates: Census Metropolitan Areas, Economic Regions and Census Divisions, Age and Sex
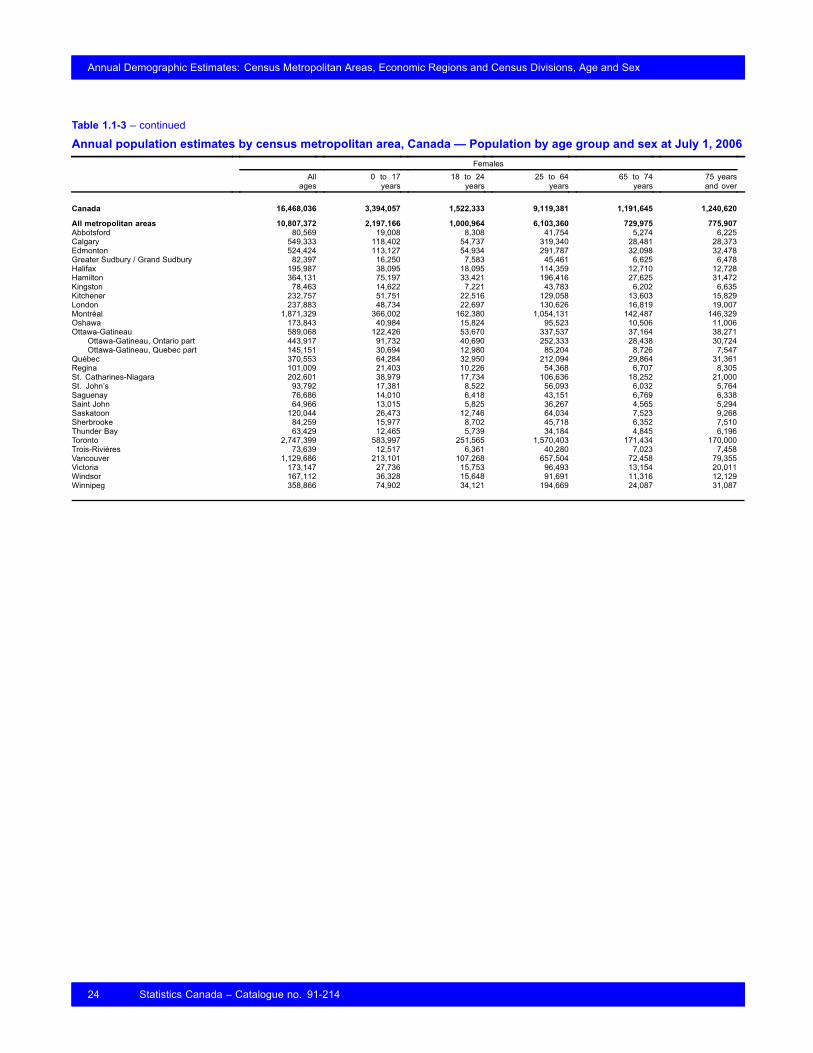
Table 1.1-3 – continued
Annual population estimates by census metropolitan area, Canada — Population by age group and sex at July 1, 2006Females
Allages
0 to 17years
18 to 24years
25 to 64years
65 to 74years
75 yearsand over
Canada 16,468,036 3,394,057 1,522,333 9,119,381 1,191,645 1,240,620
All metropolitan areas 10,807,372 2,197,166 1,000,964 6,103,360 729,975 775,907Abbotsford 80,569 19,008 8,308 41,754 5,274 6,225Calgary 549,333 118,402 54,737 319,340 28,481 28,373Edmonton 524,424 113,127 54,934 291,787 32,098 32,478Greater Sudbury / Grand Sudbury 82,397 16,250 7,583 45,461 6,625 6,478Halifax 195,987 38,095 18,095 114,359 12,710 12,728Hamilton 364,131 75,197 33,421 196,416 27,625 31,472Kingston 78,463 14,622 7,221 43,783 6,202 6,635Kitchener 232,757 51,751 22,516 129,058 13,603 15,829London 237,883 48,734 22,697 130,626 16,819 19,007Montréal 1,871,329 366,002 162,380 1,054,131 142,487 146,329Oshawa 173,843 40,984 15,824 95,523 10,506 11,006Ottawa-Gatineau 589,068 122,426 53,670 337,537 37,164 38,271
Ottawa-Gatineau, Ontario part 443,917 91,732 40,690 252,333 28,438 30,724Ottawa-Gatineau, Quebec part 145,151 30,694 12,980 85,204 8,726 7,547
Québec 370,553 64,284 32,950 212,094 29,864 31,361Regina 101,009 21,403 10,226 54,368 6,707 8,305St. Catharines-Niagara 202,601 38,979 17,734 106,636 18,252 21,000St. John’s 93,792 17,381 8,522 56,093 6,032 5,764Saguenay 76,686 14,010 6,418 43,151 6,769 6,338Saint John 64,966 13,015 5,825 36,267 4,565 5,294Saskatoon 120,044 26,473 12,746 64,034 7,523 9,268Sherbrooke 84,259 15,977 8,702 45,718 6,352 7,510Thunder Bay 63,429 12,465 5,739 34,184 4,845 6,196Toronto 2,747,399 583,997 251,565 1,570,403 171,434 170,000Trois-Rivières 73,639 12,517 6,361 40,280 7,023 7,458Vancouver 1,129,686 213,101 107,268 657,504 72,458 79,355Victoria 173,147 27,736 15,753 96,493 13,154 20,011Windsor 167,112 36,328 15,648 91,691 11,316 12,129Winnipeg 358,866 74,902 34,121 194,669 24,087 31,087
24 Statistics Canada – Catalogue no. 91-214
Annual Demographic Estimates: Census Metropolitan Areas, Economic Regions and Census Divisions, Age and Sex
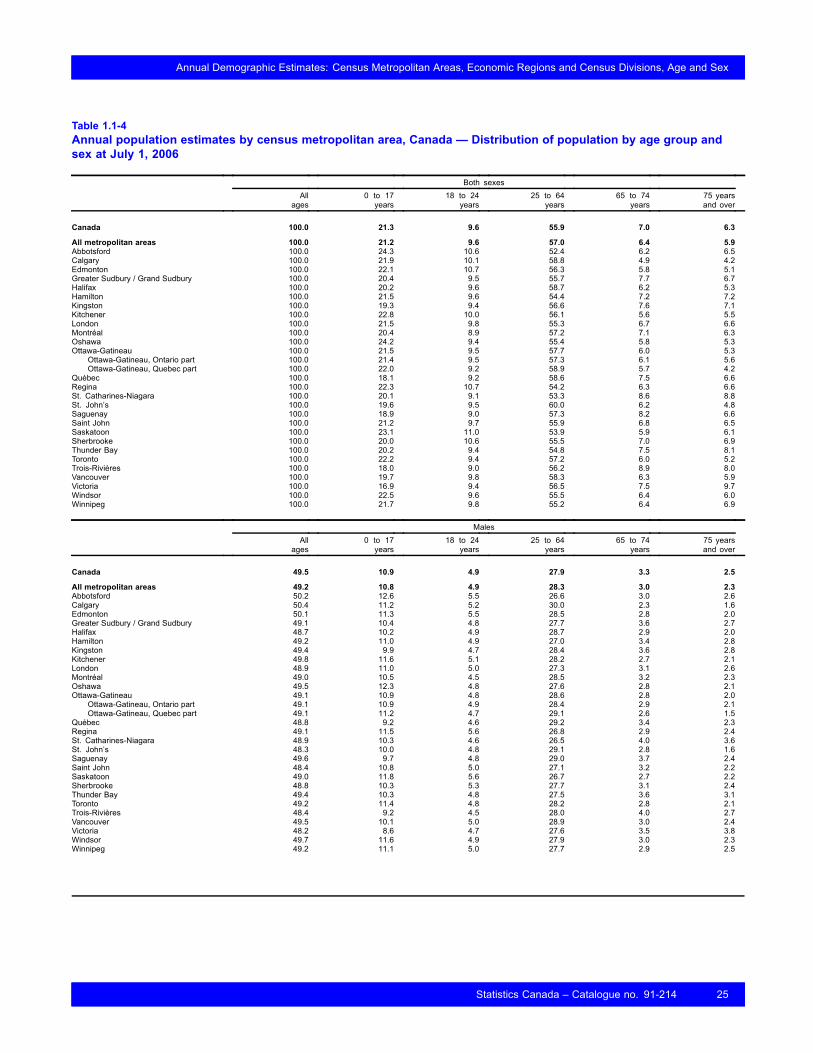
Table 1.1-4Annual population estimates by census metropolitan area, Canada — Distribution of population by age group andsex at July 1, 2006
Both sexesAll
ages0 to 17years
18 to 24years
25 to 64years
65 to 74years
75 yearsand over
Canada 100.0 21.3 9.6 55.9 7.0 6.3
All metropolitan areas 100.0 21.2 9.6 57.0 6.4 5.9Abbotsford 100.0 24.3 10.6 52.4 6.2 6.5Calgary 100.0 21.9 10.1 58.8 4.9 4.2Edmonton 100.0 22.1 10.7 56.3 5.8 5.1Greater Sudbury / Grand Sudbury 100.0 20.4 9.5 55.7 7.7 6.7Halifax 100.0 20.2 9.6 58.7 6.2 5.3Hamilton 100.0 21.5 9.6 54.4 7.2 7.2Kingston 100.0 19.3 9.4 56.6 7.6 7.1Kitchener 100.0 22.8 10.0 56.1 5.6 5.5London 100.0 21.5 9.8 55.3 6.7 6.6Montréal 100.0 20.4 8.9 57.2 7.1 6.3Oshawa 100.0 24.2 9.4 55.4 5.8 5.3Ottawa-Gatineau 100.0 21.5 9.5 57.7 6.0 5.3
Ottawa-Gatineau, Ontario part 100.0 21.4 9.5 57.3 6.1 5.6Ottawa-Gatineau, Quebec part 100.0 22.0 9.2 58.9 5.7 4.2
Québec 100.0 18.1 9.2 58.6 7.5 6.6Regina 100.0 22.3 10.7 54.2 6.3 6.6St. Catharines-Niagara 100.0 20.1 9.1 53.3 8.6 8.8St. John’s 100.0 19.6 9.5 60.0 6.2 4.8Saguenay 100.0 18.9 9.0 57.3 8.2 6.6Saint John 100.0 21.2 9.7 55.9 6.8 6.5Saskatoon 100.0 23.1 11.0 53.9 5.9 6.1Sherbrooke 100.0 20.0 10.6 55.5 7.0 6.9Thunder Bay 100.0 20.2 9.4 54.8 7.5 8.1Toronto 100.0 22.2 9.4 57.2 6.0 5.2Trois-Rivières 100.0 18.0 9.0 56.2 8.9 8.0Vancouver 100.0 19.7 9.8 58.3 6.3 5.9Victoria 100.0 16.9 9.4 56.5 7.5 9.7Windsor 100.0 22.5 9.6 55.5 6.4 6.0Winnipeg 100.0 21.7 9.8 55.2 6.4 6.9
MalesAll
ages0 to 17years
18 to 24years
25 to 64years
65 to 74years
75 yearsand over
Canada 49.5 10.9 4.9 27.9 3.3 2.5
All metropolitan areas 49.2 10.8 4.9 28.3 3.0 2.3Abbotsford 50.2 12.6 5.5 26.6 3.0 2.6Calgary 50.4 11.2 5.2 30.0 2.3 1.6Edmonton 50.1 11.3 5.5 28.5 2.8 2.0Greater Sudbury / Grand Sudbury 49.1 10.4 4.8 27.7 3.6 2.7Halifax 48.7 10.2 4.9 28.7 2.9 2.0Hamilton 49.2 11.0 4.9 27.0 3.4 2.8Kingston 49.4 9.9 4.7 28.4 3.6 2.8Kitchener 49.8 11.6 5.1 28.2 2.7 2.1London 48.9 11.0 5.0 27.3 3.1 2.6Montréal 49.0 10.5 4.5 28.5 3.2 2.3Oshawa 49.5 12.3 4.8 27.6 2.8 2.1Ottawa-Gatineau 49.1 10.9 4.8 28.6 2.8 2.0
Ottawa-Gatineau, Ontario part 49.1 10.9 4.9 28.4 2.9 2.1Ottawa-Gatineau, Quebec part 49.1 11.2 4.7 29.1 2.6 1.5
Québec 48.8 9.2 4.6 29.2 3.4 2.3Regina 49.1 11.5 5.6 26.8 2.9 2.4St. Catharines-Niagara 48.9 10.3 4.6 26.5 4.0 3.6St. John’s 48.3 10.0 4.8 29.1 2.8 1.6Saguenay 49.6 9.7 4.8 29.0 3.7 2.4Saint John 48.4 10.8 5.0 27.1 3.2 2.2Saskatoon 49.0 11.8 5.6 26.7 2.7 2.2Sherbrooke 48.8 10.3 5.3 27.7 3.1 2.4Thunder Bay 49.4 10.3 4.8 27.5 3.6 3.1Toronto 49.2 11.4 4.8 28.2 2.8 2.1Trois-Rivières 48.4 9.2 4.5 28.0 4.0 2.7Vancouver 49.5 10.1 5.0 28.9 3.0 2.4Victoria 48.2 8.6 4.7 27.6 3.5 3.8Windsor 49.7 11.6 4.9 27.9 3.0 2.3Winnipeg 49.2 11.1 5.0 27.7 2.9 2.5
Statistics Canada – Catalogue no. 91-214 25

Annual Demographic Estimates: Census Metropolitan Areas, Economic Regions and Census Divisions, Age and Sex
Table 1.1-4 – continued
Annual population estimates by census metropolitan area, Canada — Distribution of population by age group andsex at July 1, 2006
FemalesAll
ages0 to 17years
18 to 24years
25 to 64years
65 to 74years
75 yearsand over
Canada 50.5 10.4 4.7 28.0 3.7 3.8
All metropolitan areas 50.8 10.3 4.7 28.7 3.4 3.6Abbotsford 49.8 11.7 5.1 25.8 3.3 3.8Calgary 49.6 10.7 4.9 28.8 2.6 2.6Edmonton 49.9 10.8 5.2 27.8 3.1 3.1Greater Sudbury / Grand Sudbury 50.9 10.0 4.7 28.1 4.1 4.0Halifax 51.3 10.0 4.7 29.9 3.3 3.3Hamilton 50.8 10.5 4.7 27.4 3.9 4.4Kingston 50.6 9.4 4.7 28.3 4.0 4.3Kitchener 50.2 11.2 4.9 27.8 2.9 3.4London 51.1 10.5 4.9 28.0 3.6 4.1Montréal 51.0 10.0 4.4 28.8 3.9 4.0Oshawa 50.5 11.9 4.6 27.7 3.1 3.2Ottawa-Gatineau 50.9 10.6 4.6 29.1 3.2 3.3
Ottawa-Gatineau, Ontario part 50.9 10.5 4.7 28.9 3.3 3.5Ottawa-Gatineau, Quebec part 50.9 10.8 4.5 29.9 3.1 2.6
Québec 51.2 8.9 4.6 29.3 4.1 4.3Regina 50.9 10.8 5.2 27.4 3.4 4.2St. Catharines-Niagara 51.1 9.8 4.5 26.9 4.6 5.3St. John’s 51.7 9.6 4.7 30.9 3.3 3.2Saguenay 50.4 9.2 4.2 28.4 4.4 4.2Saint John 51.6 10.3 4.6 28.8 3.6 4.2Saskatoon 51.0 11.2 5.4 27.2 3.2 3.9Sherbrooke 51.2 9.7 5.3 27.8 3.9 4.6Thunder Bay 50.6 9.9 4.6 27.3 3.9 4.9Toronto 50.8 10.8 4.7 29.0 3.2 3.1Trois-Rivières 51.6 8.8 4.5 28.2 4.9 5.2Vancouver 50.5 9.5 4.8 29.4 3.2 3.5Victoria 51.8 8.3 4.7 28.9 3.9 6.0Windsor 50.3 10.9 4.7 27.6 3.4 3.7Winnipeg 50.8 10.6 4.8 27.5 3.4 4.4
26 Statistics Canada – Catalogue no. 91-214

Annual Demographic Estimates: Census Metropolitan Areas, Economic Regions and Census Divisions, Age and Sex
Table 1.1-5Annual population estimates by census metropolitan area, Canada — Demographic indicators, age and dependencyratio at July 1
2006Median
ageMean age Percentage
of 65 yearand over
Dependencyratio inpercent
Canada 38.8 38.8 13.2 59
All metropolitan areas 37.8 38.3 12.3 56
Abbotsford 36.1 37.1 12.7 67Calgary 35.4 36.2 9.1 51Edmonton 36.0 37.0 10.9 56Greater Sudbury 40.7 40.0 14.4 60Halifax 38.2 38.4 11.5 52Hamilton 39.3 39.2 14.4 63Kingston 40.4 40.2 14.6 57Kitchener 36.5 37.0 11.2 58London 38.1 38.6 13.3 60Montréal 38.9 39.1 13.4 57Oshawa 37.3 37.0 11.1 61Ottawa-Gatineau 37.8 37.9 11.3 55
Ottawa-Gatineau (Ontario part) 37.8 38.1 11.8 55Ottawa-Gatineau (Quebec part) 37.8 37.4 9.9 52
Québec 41.1 40.6 14.1 53Regina 36.9 37.9 12.8 61St. Catharines-Niagara 41.8 41.3 17.5 67St. John’s 38.3 38.4 10.9 49Saguenay 42.8 41.0 14.7 57Saint John 39.4 39.2 13.3 59Saskatoon 35.1 37.0 12.0 61Sherbrooke 39.2 39.5 13.9 57Thunder Bay 41.1 40.5 15.6 62Toronto 36.7 37.2 11.2 56Trois-Rivières 43.4 42.1 16.8 59Vancouver 38.2 38.7 12.2 52Victoria 42.4 42.3 17.2 58Windsor 37.3 37.8 12.4 60Winnipeg 38.0 38.6 13.3 60
Statistics Canada – Catalogue no. 91-214 27
Annual Demographic Estimates: Census Metropolitan Areas, Economic Regions and Census Divisions, Age and Sex
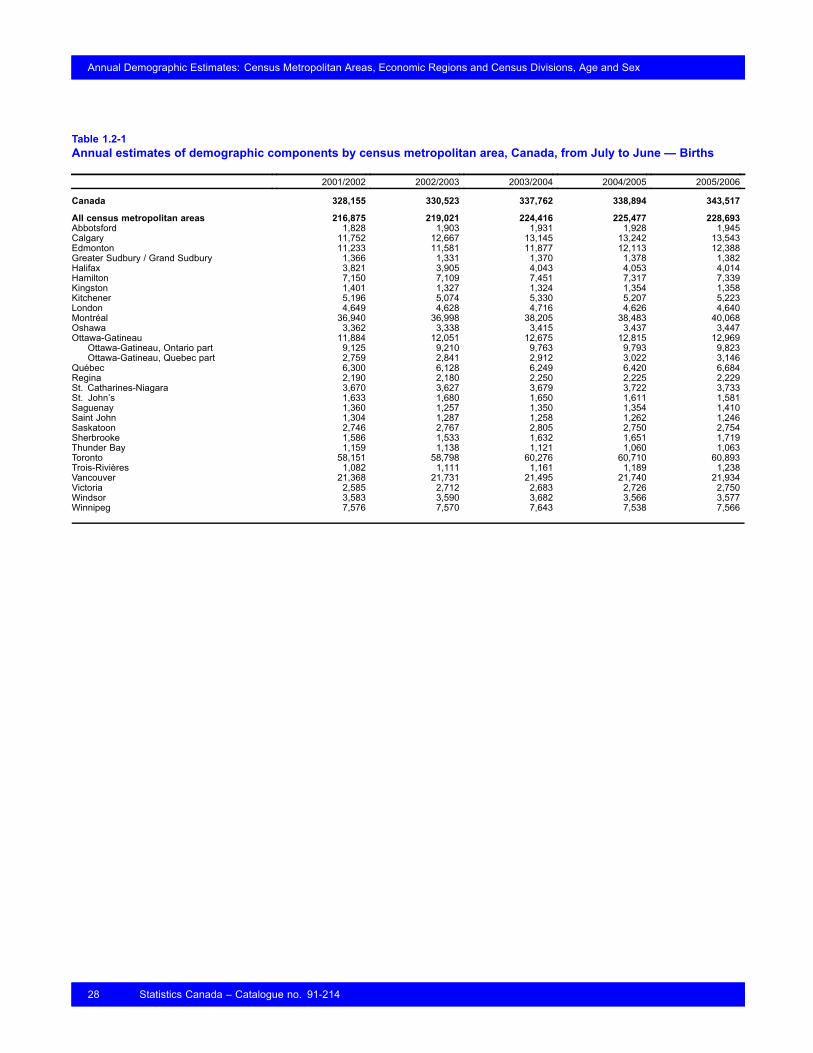
Table 1.2-1Annual estimates of demographic components by census metropolitan area, Canada, from July to June — Births
2001/2002 2002/2003 2003/2004 2004/2005 2005/2006
Canada 328,155 330,523 337,762 338,894 343,517
All census metropolitan areas 216,875 219,021 224,416 225,477 228,693Abbotsford 1,828 1,903 1,931 1,928 1,945Calgary 11,752 12,667 13,145 13,242 13,543Edmonton 11,233 11,581 11,877 12,113 12,388Greater Sudbury / Grand Sudbury 1,366 1,331 1,370 1,378 1,382Halifax 3,821 3,905 4,043 4,053 4,014Hamilton 7,150 7,109 7,451 7,317 7,339Kingston 1,401 1,327 1,324 1,354 1,358Kitchener 5,196 5,074 5,330 5,207 5,223London 4,649 4,628 4,716 4,626 4,640Montréal 36,940 36,998 38,205 38,483 40,068Oshawa 3,362 3,338 3,415 3,437 3,447Ottawa-Gatineau 11,884 12,051 12,675 12,815 12,969
Ottawa-Gatineau, Ontario part 9,125 9,210 9,763 9,793 9,823Ottawa-Gatineau, Quebec part 2,759 2,841 2,912 3,022 3,146
Québec 6,300 6,128 6,249 6,420 6,684Regina 2,190 2,180 2,250 2,225 2,229St. Catharines-Niagara 3,670 3,627 3,679 3,722 3,733St. John’s 1,633 1,680 1,650 1,611 1,581Saguenay 1,360 1,257 1,350 1,354 1,410Saint John 1,304 1,287 1,258 1,262 1,246Saskatoon 2,746 2,767 2,805 2,750 2,754Sherbrooke 1,586 1,533 1,632 1,651 1,719Thunder Bay 1,159 1,138 1,121 1,060 1,063Toronto 58,151 58,798 60,276 60,710 60,893Trois-Rivières 1,082 1,111 1,161 1,189 1,238Vancouver 21,368 21,731 21,495 21,740 21,934Victoria 2,585 2,712 2,683 2,726 2,750Windsor 3,583 3,590 3,682 3,566 3,577Winnipeg 7,576 7,570 7,643 7,538 7,566
28 Statistics Canada – Catalogue no. 91-214
Annual Demographic Estimates: Census Metropolitan Areas, Economic Regions and Census Divisions, Age and Sex
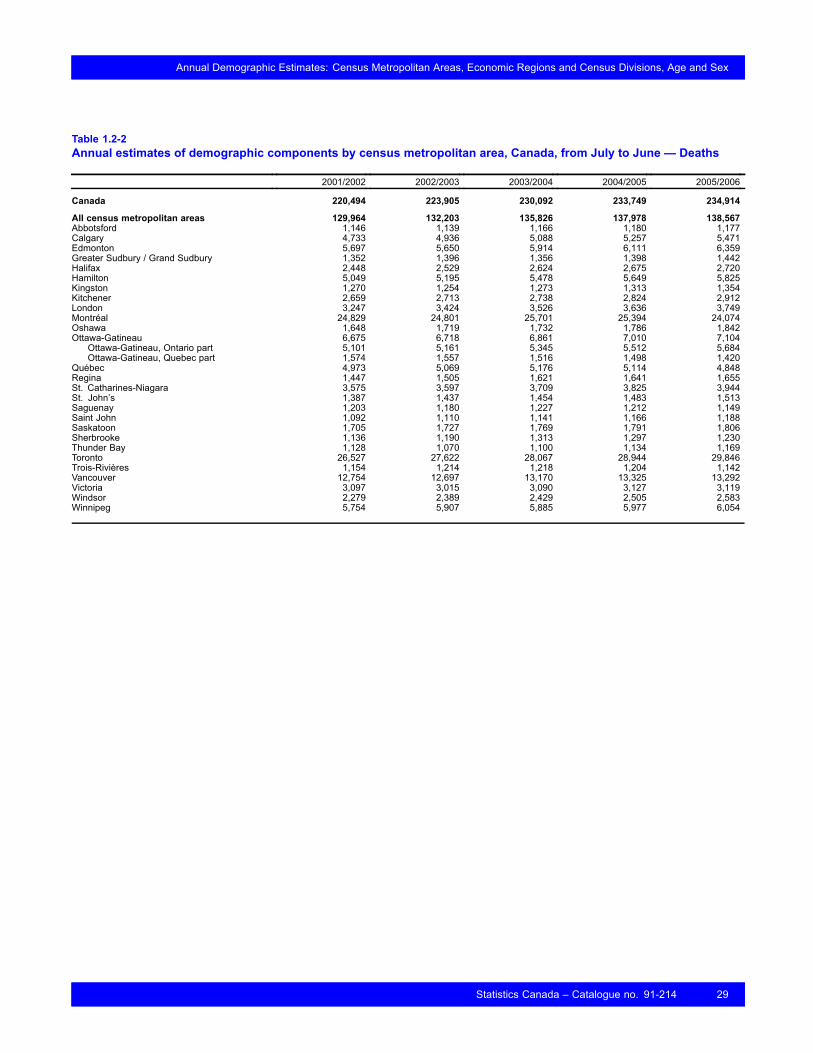
Table 1.2-2Annual estimates of demographic components by census metropolitan area, Canada, from July to June — Deaths
2001/2002 2002/2003 2003/2004 2004/2005 2005/2006
Canada 220,494 223,905 230,092 233,749 234,914
All census metropolitan areas 129,964 132,203 135,826 137,978 138,567Abbotsford 1,146 1,139 1,166 1,180 1,177Calgary 4,733 4,936 5,088 5,257 5,471Edmonton 5,697 5,650 5,914 6,111 6,359Greater Sudbury / Grand Sudbury 1,352 1,396 1,356 1,398 1,442Halifax 2,448 2,529 2,624 2,675 2,720Hamilton 5,049 5,195 5,478 5,649 5,825Kingston 1,270 1,254 1,273 1,313 1,354Kitchener 2,659 2,713 2,738 2,824 2,912London 3,247 3,424 3,526 3,636 3,749Montréal 24,829 24,801 25,701 25,394 24,074Oshawa 1,648 1,719 1,732 1,786 1,842Ottawa-Gatineau 6,675 6,718 6,861 7,010 7,104
Ottawa-Gatineau, Ontario part 5,101 5,161 5,345 5,512 5,684Ottawa-Gatineau, Quebec part 1,574 1,557 1,516 1,498 1,420
Québec 4,973 5,069 5,176 5,114 4,848Regina 1,447 1,505 1,621 1,641 1,655St. Catharines-Niagara 3,575 3,597 3,709 3,825 3,944St. John’s 1,387 1,437 1,454 1,483 1,513Saguenay 1,203 1,180 1,227 1,212 1,149Saint John 1,092 1,110 1,141 1,166 1,188Saskatoon 1,705 1,727 1,769 1,791 1,806Sherbrooke 1,136 1,190 1,313 1,297 1,230Thunder Bay 1,128 1,070 1,100 1,134 1,169Toronto 26,527 27,622 28,067 28,944 29,846Trois-Rivières 1,154 1,214 1,218 1,204 1,142Vancouver 12,754 12,697 13,170 13,325 13,292Victoria 3,097 3,015 3,090 3,127 3,119Windsor 2,279 2,389 2,429 2,505 2,583Winnipeg 5,754 5,907 5,885 5,977 6,054
Statistics Canada – Catalogue no. 91-214 29

Annual Demographic Estimates: Census Metropolitan Areas, Economic Regions and Census Divisions, Age and Sex
Table 1.2-3Annual estimates of demographic components by census metropolitan area, Canada, from July to June — Immigrants
2001/2002 2002/2003 2003/2004 2004/2005 2005/2006
Canada 256,334 199,193 239,082 244,579 254,359
All census metropolitan areas 242,589 187,237 223,954 228,321 236,675Abbotsford 1,039 1,042 1,306 1,173 1,268Calgary 9,041 8,500 10,155 9,879 11,254Edmonton 5,404 3,640 4,973 5,232 5,960Greater Sudbury / Grand Sudbury 127 189 115 146 150Halifax 1,319 1,044 1,376 1,394 1,795Hamilton 4,264 3,273 3,957 3,740 3,836Kingston 508 447 460 420 431Kitchener 3,415 2,568 3,376 3,441 3,529London 2,928 1,923 2,592 2,798 2,870Montréal 33,539 30,109 37,255 36,255 35,058Oshawa 771 678 713 755 774Ottawa-Gatineau 8,241 6,943 6,865 6,536 6,636
Ottawa-Gatineau, Ontario part 7,168 5,864 5,532 5,389 5,527Ottawa-Gatineau, Quebec part 1,073 1,079 1,333 1,147 1,109
Québec 1,691 1,083 2,017 2,243 2,169Regina 584 511 616 685 690St. Catharines-Niagara 1,074 1,062 1,075 1,144 1,173St. John’s 293 262 457 424 353Saguenay 111 163 207 227 219Saint John 135 199 172 162 260Saskatoon 953 614 837 983 990Sherbrooke 1,067 949 1,362 1,132 1,095Thunder Bay 96 161 193 151 155Toronto 123,460 86,223 102,163 103,596 106,251Trois-Rivières 152 243 428 271 262Vancouver 34,422 28,680 32,297 35,987 38,899Victoria 803 681 886 1,116 1,206Windsor 3,709 2,436 2,814 2,709 2,778Winnipeg 3,443 3,614 5,287 5,722 6,614
30 Statistics Canada – Catalogue no. 91-214
Annual Demographic Estimates: Census Metropolitan Areas, Economic Regions and Census Divisions, Age and Sex
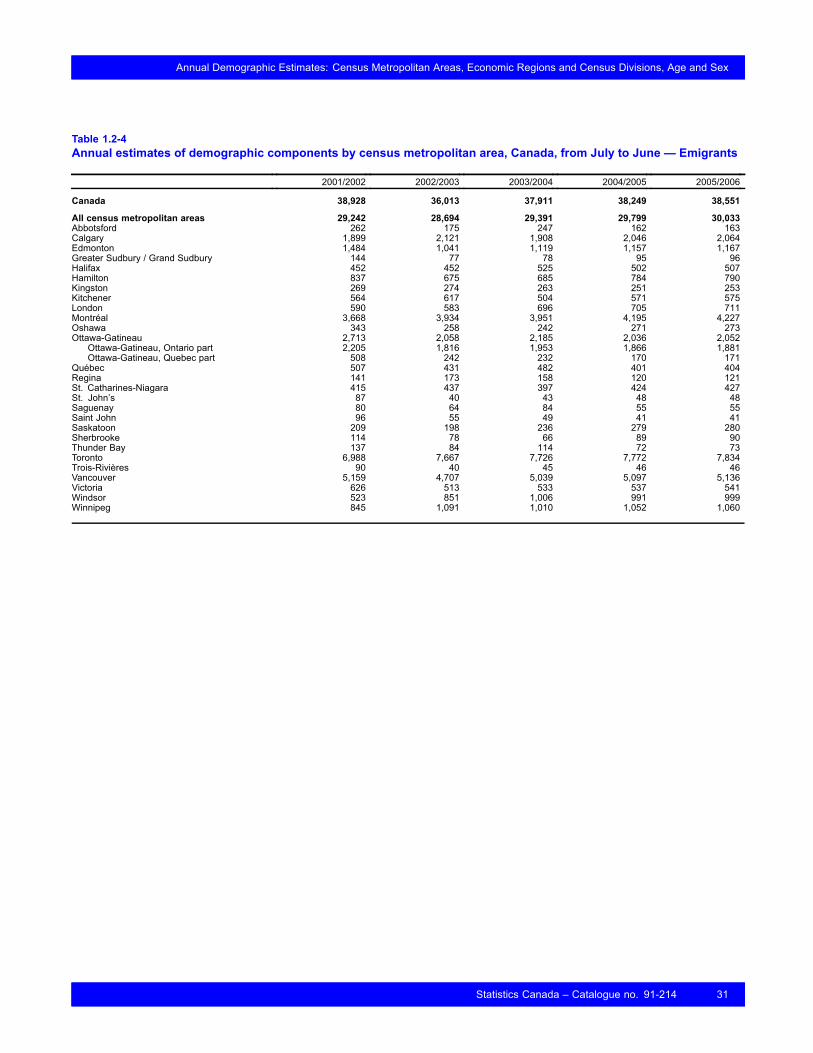
Table 1.2-4Annual estimates of demographic components by census metropolitan area, Canada, from July to June — Emigrants
2001/2002 2002/2003 2003/2004 2004/2005 2005/2006
Canada 38,928 36,013 37,911 38,249 38,551
All census metropolitan areas 29,242 28,694 29,391 29,799 30,033Abbotsford 262 175 247 162 163Calgary 1,899 2,121 1,908 2,046 2,064Edmonton 1,484 1,041 1,119 1,157 1,167Greater Sudbury / Grand Sudbury 144 77 78 95 96Halifax 452 452 525 502 507Hamilton 837 675 685 784 790Kingston 269 274 263 251 253Kitchener 564 617 504 571 575London 590 583 696 705 711Montréal 3,668 3,934 3,951 4,195 4,227Oshawa 343 258 242 271 273Ottawa-Gatineau 2,713 2,058 2,185 2,036 2,052
Ottawa-Gatineau, Ontario part 2,205 1,816 1,953 1,866 1,881Ottawa-Gatineau, Quebec part 508 242 232 170 171
Québec 507 431 482 401 404Regina 141 173 158 120 121St. Catharines-Niagara 415 437 397 424 427St. John’s 87 40 43 48 48Saguenay 80 64 84 55 55Saint John 96 55 49 41 41Saskatoon 209 198 236 279 280Sherbrooke 114 78 66 89 90Thunder Bay 137 84 114 72 73Toronto 6,988 7,667 7,726 7,772 7,834Trois-Rivières 90 40 45 46 46Vancouver 5,159 4,707 5,039 5,097 5,136Victoria 626 513 533 537 541Windsor 523 851 1,006 991 999Winnipeg 845 1,091 1,010 1,052 1,060
Statistics Canada – Catalogue no. 91-214 31
Annual Demographic Estimates: Census Metropolitan Areas, Economic Regions and Census Divisions, Age and Sex
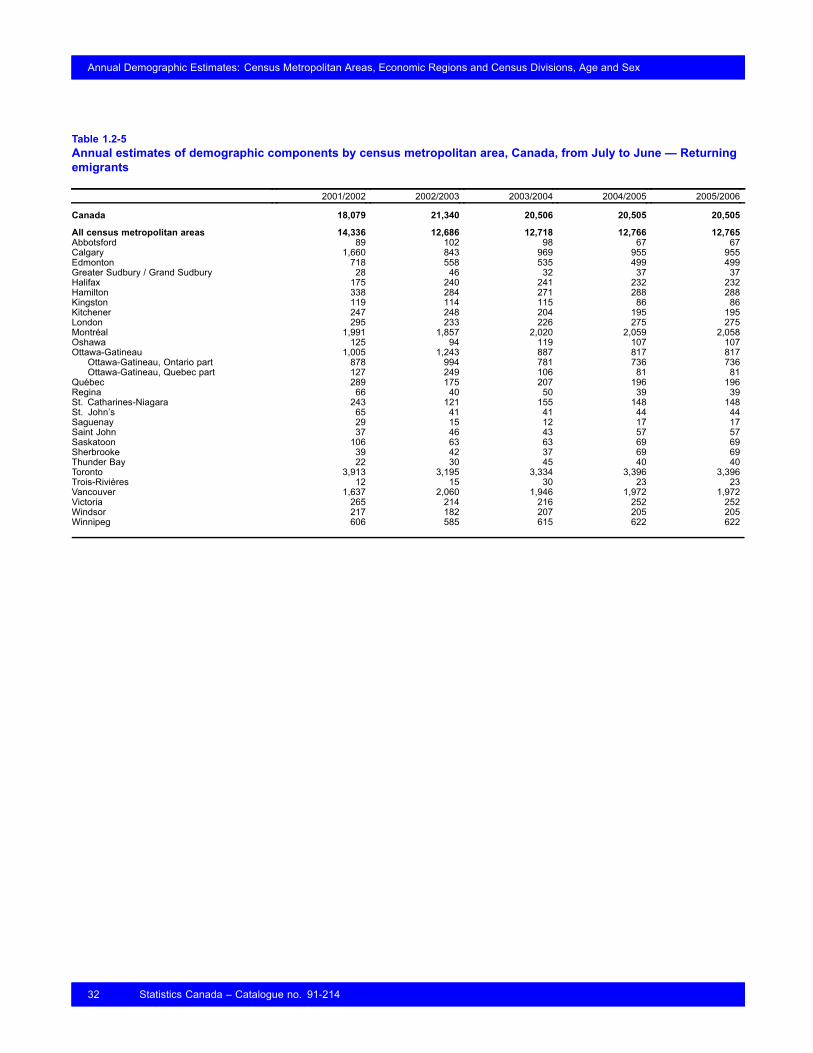
Table 1.2-5Annual estimates of demographic components by census metropolitan area, Canada, from July to June — Returningemigrants
2001/2002 2002/2003 2003/2004 2004/2005 2005/2006
Canada 18,079 21,340 20,506 20,505 20,505
All census metropolitan areas 14,336 12,686 12,718 12,766 12,765Abbotsford 89 102 98 67 67Calgary 1,660 843 969 955 955Edmonton 718 558 535 499 499Greater Sudbury / Grand Sudbury 28 46 32 37 37Halifax 175 240 241 232 232Hamilton 338 284 271 288 288Kingston 119 114 115 86 86Kitchener 247 248 204 195 195London 295 233 226 275 275Montréal 1,991 1,857 2,020 2,059 2,058Oshawa 125 94 119 107 107Ottawa-Gatineau 1,005 1,243 887 817 817
Ottawa-Gatineau, Ontario part 878 994 781 736 736Ottawa-Gatineau, Quebec part 127 249 106 81 81
Québec 289 175 207 196 196Regina 66 40 50 39 39St. Catharines-Niagara 243 121 155 148 148St. John’s 65 41 41 44 44Saguenay 29 15 12 17 17Saint John 37 46 43 57 57Saskatoon 106 63 63 69 69Sherbrooke 39 42 37 69 69Thunder Bay 22 30 45 40 40Toronto 3,913 3,195 3,334 3,396 3,396Trois-Rivières 12 15 30 23 23Vancouver 1,637 2,060 1,946 1,972 1,972Victoria 265 214 216 252 252Windsor 217 182 207 205 205Winnipeg 606 585 615 622 622
32 Statistics Canada – Catalogue no. 91-214

Annual Demographic Estimates: Census Metropolitan Areas, Economic Regions and Census Divisions, Age and Sex
Table 1.2-6Annual estimates of demographic components by census metropolitan area, Canada, from July to June — Nettemporary emigrants
2001/2002 2002/2003 2003/2004 2004/2005 2005/2006
Canada 25,560 25,561 25,562 25,562 25,562
All census metropolitan areas 19,289 20,284 20,028 20,095 20,092Abbotsford 190 153 214 139 139Calgary 1,193 1,484 1,073 1,140 1,140Edmonton 932 729 629 645 644Greater Sudbury / Grand Sudbury 95 50 50 61 61Halifax 213 220 255 242 242Hamilton 552 440 445 504 504Kingston 177 179 171 162 162Kitchener 372 402 327 367 367London 389 380 452 454 454Montréal 2,385 2,914 2,665 2,806 2,805Oshawa 226 168 157 174 174Ottawa-Gatineau 1,784 1,364 1,424 1,315 1,314
Ottawa-Gatineau, Ontario part 1,454 1,185 1,268 1,201 1,201Ottawa-Gatineau, Quebec part 330 179 156 114 113
Québec 330 319 325 268 268Regina 114 157 157 119 119St. Catharines-Niagara 274 285 258 273 273St. John’s 54 43 33 36 36Saguenay 52 47 57 37 36Saint John 40 41 33 27 27Saskatoon 168 179 235 275 275Sherbrooke 74 58 45 59 60Thunder Bay 90 55 74 46 47Toronto 4,608 5,001 5,016 5,001 5,002Trois-Rivières 58 30 30 31 31Vancouver 3,738 4,103 4,367 4,380 4,380Victoria 454 447 462 462 461Windsor 345 555 653 638 638Winnipeg 382 481 421 434 433
Statistics Canada – Catalogue no. 91-214 33

Annual Demographic Estimates: Census Metropolitan Areas, Economic Regions and Census Divisions, Age and Sex
Table 1.2-7Annual estimates of demographic components by census metropolitan area, Canada, from July to June — Netnon-permanent residents
2001/2002 2002/2003 2003/2004 2004/2005 2005/2006
Canada 33,750 37,913 9,592 3,624 4,640
All census metropolitan areas 29,524 31,956 5,361 -5,995 3,176Abbotsford 166 137 56 100 85Calgary 824 774 477 820 2,010Edmonton 632 596 366 629 1,543Greater Sudbury / Grand Sudbury 33 40 4 -19 -14Halifax 1,144 212 552 -120 456Hamilton 1,053 1,295 118 -618 -435Kingston 141 173 16 -82 -58Kitchener 388 477 43 -228 -160London 598 734 67 -351 -247Montréal 3,106 3,763 -1,181 -3,176 1,044Oshawa 116 141 13 -68 -48Ottawa-Gatineau 1,572 1,931 148 -946 -609
Ottawa-Gatineau, Ontario part 1,517 1,865 169 -890 -627Ottawa-Gatineau, Quebec part 55 66 -21 -56 18
Québec 182 221 -69 -187 61Regina 86 88 105 85 75St. Catharines-Niagara 329 405 37 -193 -136St. John’s 36 69 82 16 -30Saguenay 14 16 -5 -14 5Saint John 105 97 84 94 16Saskatoon 134 136 163 134 118Sherbrooke 75 91 -29 -77 25Thunder Bay 22 26 2 -13 -9Toronto 10,967 13,475 1,225 -6,433 -4,531Trois-Rivières 20 24 -8 -20 7Vancouver 6,336 5,356 2,288 4,186 3,299Victoria 515 427 175 310 266Windsor 380 468 42 -223 -157Winnipeg 550 784 590 399 600
34 Statistics Canada – Catalogue no. 91-214

Annual Demographic Estimates: Census Metropolitan Areas, Economic Regions and Census Divisions, Age and Sex
Table 1.2-8Annual estimates of demographic components by census metropolitan area, Canada, from July to June —Interprovincial in-migrants
2001/2002 2002/2003 2003/2004 2004/2005 2005/2006
Canada . . . . .
All census metropolitan areas 173,286 159,574 150,910 165,500 192,616Abbotsford 1,546 1,430 1,511 1,538 1,580Calgary 26,755 23,041 21,145 28,680 38,169Edmonton 20,098 16,854 15,812 21,190 28,201Greater Sudbury / Grand Sudbury 657 672 676 691 746Halifax 9,138 9,024 7,887 7,933 8,696Hamilton 2,901 2,737 2,247 2,374 2,563Kingston 2,238 2,109 1,745 1,724 1,862Kitchener 2,363 2,298 2,107 2,280 2,462London 2,370 2,144 1,964 1,940 2,095Montréal 12,477 12,080 11,717 11,231 12,661Oshawa 1,322 1,316 1,123 1,081 1,167Ottawa-Gatineau 18,411 16,526 15,913 15,793 17,291
Ottawa-Gatineau, Ontario part 13,293 11,269 10,368 10,761 11,619Ottawa-Gatineau, Quebec part 5,118 5,257 5,545 5,032 5,672
Québec 1,690 1,606 1,591 1,462 1,648Regina 2,556 2,776 2,431 2,272 2,712St. Catharines-Niagara 1,468 1,370 1,357 1,091 1,178St. John’s 2,782 2,778 2,636 2,473 3,175Saguenay 400 353 281 241 272Saint John 1,827 1,605 1,503 1,518 1,734Saskatoon 3,686 3,665 3,603 3,386 4,041Sherbrooke 363 319 286 356 401Thunder Bay 988 1,040 808 852 920Toronto 23,553 20,944 18,769 20,408 22,035Trois-Rivières 140 126 147 156 176Vancouver 18,468 18,119 18,844 20,791 21,358Victoria 5,334 5,470 5,787 5,950 6,112Windsor 1,164 1,026 965 911 984Winnipeg 8,591 8,146 8,055 7,178 8,377
Statistics Canada – Catalogue no. 91-214 35

Annual Demographic Estimates: Census Metropolitan Areas, Economic Regions and Census Divisions, Age and Sex
Table 1.2-9Annual estimates of demographic components by census metropolitan area, Canada, from July to June —Interprovincial out-migrants
2001/2002 2002/2003 2003/2004 2004/2005 2005/2006
Canada . . . . .
All census metropolitan areas 167,110 159,813 152,954 166,029 193,703Abbotsford 1,939 1,647 1,321 1,558 1,758Calgary 17,436 18,659 17,773 16,536 18,116Edmonton 13,840 15,160 14,554 13,975 15,310Greater Sudbury / Grand Sudbury 829 732 768 853 1,034Halifax 8,736 8,357 8,339 9,521 10,751Hamilton 2,802 2,597 2,752 3,146 3,812Kingston 1,686 1,622 1,762 1,936 2,346Kitchener 2,084 2,205 2,130 2,446 2,964London 2,284 2,261 2,219 2,521 3,055Montréal 16,620 15,186 14,264 16,428 20,038Oshawa 1,255 1,153 1,243 1,332 1,614Ottawa-Gatineau 15,280 15,255 15,139 15,435 18,732
Ottawa-Gatineau, Ontario part 11,152 11,564 11,637 11,775 14,268Ottawa-Gatineau, Quebec part 4,128 3,691 3,502 3,660 4,464
Québec 2,054 1,876 1,728 2,046 2,496Regina 4,805 3,958 3,606 4,248 4,648St. Catharines-Niagara 1,403 1,433 1,447 1,651 2,001St. John’s 3,506 3,090 2,926 3,561 4,454Saguenay 338 277 294 349 426Saint John 1,957 1,650 1,549 1,903 2,387Saskatoon 6,005 5,163 4,828 5,885 6,438Sherbrooke 467 375 376 405 494Thunder Bay 1,362 1,196 1,340 1,460 1,769Toronto 21,319 20,836 20,917 23,389 28,341Trois-Rivières 178 174 141 164 200Vancouver 21,839 19,585 16,502 17,811 20,098Victoria 4,672 4,223 4,021 4,037 4,555Windsor 1,153 1,094 1,146 1,435 1,739Winnipeg 11,261 10,049 9,869 11,998 14,127
36 Statistics Canada – Catalogue no. 91-214
Annual Demographic Estimates: Census Metropolitan Areas, Economic Regions and Census Divisions, Age and Sex
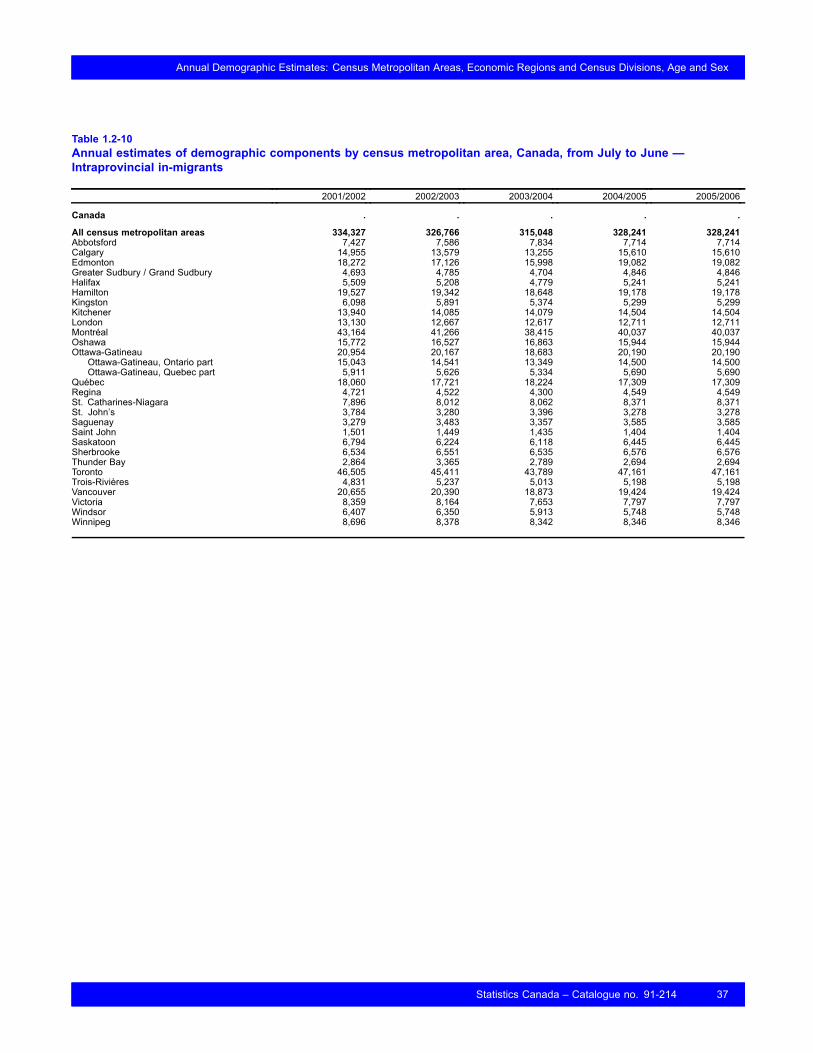
Table 1.2-10Annual estimates of demographic components by census metropolitan area, Canada, from July to June —Intraprovincial in-migrants
2001/2002 2002/2003 2003/2004 2004/2005 2005/2006
Canada . . . . .
All census metropolitan areas 334,327 326,766 315,048 328,241 328,241Abbotsford 7,427 7,586 7,834 7,714 7,714Calgary 14,955 13,579 13,255 15,610 15,610Edmonton 18,272 17,126 15,998 19,082 19,082Greater Sudbury / Grand Sudbury 4,693 4,785 4,704 4,846 4,846Halifax 5,509 5,208 4,779 5,241 5,241Hamilton 19,527 19,342 18,648 19,178 19,178Kingston 6,098 5,891 5,374 5,299 5,299Kitchener 13,940 14,085 14,079 14,504 14,504London 13,130 12,667 12,617 12,711 12,711Montréal 43,164 41,266 38,415 40,037 40,037Oshawa 15,772 16,527 16,863 15,944 15,944Ottawa-Gatineau 20,954 20,167 18,683 20,190 20,190
Ottawa-Gatineau, Ontario part 15,043 14,541 13,349 14,500 14,500Ottawa-Gatineau, Quebec part 5,911 5,626 5,334 5,690 5,690
Québec 18,060 17,721 18,224 17,309 17,309Regina 4,721 4,522 4,300 4,549 4,549St. Catharines-Niagara 7,896 8,012 8,062 8,371 8,371St. John’s 3,784 3,280 3,396 3,278 3,278Saguenay 3,279 3,483 3,357 3,585 3,585Saint John 1,501 1,449 1,435 1,404 1,404Saskatoon 6,794 6,224 6,118 6,445 6,445Sherbrooke 6,534 6,551 6,535 6,576 6,576Thunder Bay 2,864 3,365 2,789 2,694 2,694Toronto 46,505 45,411 43,789 47,161 47,161Trois-Rivières 4,831 5,237 5,013 5,198 5,198Vancouver 20,655 20,390 18,873 19,424 19,424Victoria 8,359 8,164 7,653 7,797 7,797Windsor 6,407 6,350 5,913 5,748 5,748Winnipeg 8,696 8,378 8,342 8,346 8,346
Statistics Canada – Catalogue no. 91-214 37
Annual Demographic Estimates: Census Metropolitan Areas, Economic Regions and Census Divisions, Age and Sex
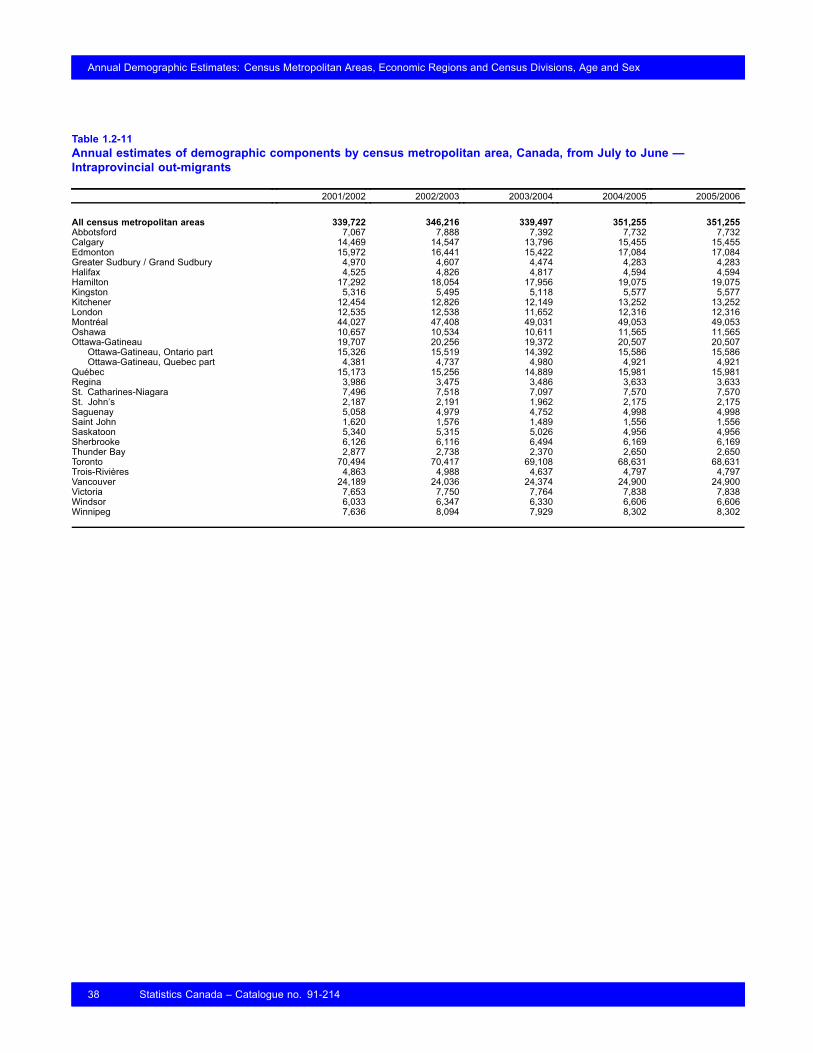
Table 1.2-11Annual estimates of demographic components by census metropolitan area, Canada, from July to June —Intraprovincial out-migrants
2001/2002 2002/2003 2003/2004 2004/2005 2005/2006
All census metropolitan areas 339,722 346,216 339,497 351,255 351,255Abbotsford 7,067 7,888 7,392 7,732 7,732Calgary 14,469 14,547 13,796 15,455 15,455Edmonton 15,972 16,441 15,422 17,084 17,084Greater Sudbury / Grand Sudbury 4,970 4,607 4,474 4,283 4,283Halifax 4,525 4,826 4,817 4,594 4,594Hamilton 17,292 18,054 17,956 19,075 19,075Kingston 5,316 5,495 5,118 5,577 5,577Kitchener 12,454 12,826 12,149 13,252 13,252London 12,535 12,538 11,652 12,316 12,316Montréal 44,027 47,408 49,031 49,053 49,053Oshawa 10,657 10,534 10,611 11,565 11,565Ottawa-Gatineau 19,707 20,256 19,372 20,507 20,507
Ottawa-Gatineau, Ontario part 15,326 15,519 14,392 15,586 15,586Ottawa-Gatineau, Quebec part 4,381 4,737 4,980 4,921 4,921
Québec 15,173 15,256 14,889 15,981 15,981Regina 3,986 3,475 3,486 3,633 3,633St. Catharines-Niagara 7,496 7,518 7,097 7,570 7,570St. John’s 2,187 2,191 1,962 2,175 2,175Saguenay 5,058 4,979 4,752 4,998 4,998Saint John 1,620 1,576 1,489 1,556 1,556Saskatoon 5,340 5,315 5,026 4,956 4,956Sherbrooke 6,126 6,116 6,494 6,169 6,169Thunder Bay 2,877 2,738 2,370 2,650 2,650Toronto 70,494 70,417 69,108 68,631 68,631Trois-Rivières 4,863 4,988 4,637 4,797 4,797Vancouver 24,189 24,036 24,374 24,900 24,900Victoria 7,653 7,750 7,764 7,838 7,838Windsor 6,033 6,347 6,330 6,606 6,606Winnipeg 7,636 8,094 7,929 8,302 8,302
38 Statistics Canada – Catalogue no. 91-214

Annual Demographic Estimates: Census Metropolitan Areas, Economic Regions and Census Divisions, Age and Sex
Table 1.2-12Annual estimates of demographic components by census metropolitan area, Canada, from July to June — Totalpopulation growth
2001/2002 2002/2003 2003/2004 2004/2005 2005/2006
Canada 351,336 303,490 313,377 310,042 323,994
All metropolitan areas 325,610 250,030 254,711 249,154 255,189Abbotsford 1,491 1,198 2,396 1,749 1,363Calgary 25,257 17,657 19,508 28,752 39,295Edmonton 18,432 11,334 11,923 19,773 27,109Greater Sudbury / Grand Sudbury -486 201 175 389 231Halifax 4,732 3,249 2,318 1,199 1,620Hamilton 8,701 7,079 5,376 3,121 2,763Kingston 1,787 1,237 447 -438 -714Kitchener 7,416 5,987 7,291 5,939 5,683London 4,925 3,143 3,637 2,367 2,059Montréal 39,688 31,830 30,819 27,013 29,506Oshawa 7,339 8,262 8,261 6,128 5,923Ottawa-Gatineau 15,908 13,210 10,190 8,902 7,193
Ottawa-Gatineau, Ontario part 11,786 8,498 5,367 4,349 2,958Ottawa-Gatineau, Quebec part 4,122 4,712 4,823 4,553 4,235
Québec 5,175 3,983 5,619 3,633 8,464Regina -290 849 724 94 118St. Catharines-Niagara 1,517 1,327 1,457 540 252St. John’s 1,372 1,309 1,844 543 175Saguenay -1,538 -1,260 -1,212 -1,241 -382Saint John 104 251 234 -196 -482Saskatoon 992 887 1,495 581 662Sherbrooke 1,747 1,668 1,529 1,688 1,067Thunder Bay -443 617 -40 -578 -845Toronto 136,613 96,503 98,722 95,101 95,551Trois-Rivières -106 310 700 575 1,024Vancouver 35,207 31,208 32,291 38,587 22,677Victoria 1,359 1,720 1,530 2,150 2,158Windsor 5,127 2,816 2,059 741 570Winnipeg 3,584 3,455 5,418 2,042 2,149
Statistics Canada – Catalogue no. 91-214 39

Annual Demographic Estimates: Census Metropolitan Areas, Economic Regions and Census Divisions, Age and Sex
Table 1.2-13Annual estimates of demographic components by census metropolitan area, Canada, from July to June — Naturalincrease
2001/2002 2002/2003 2003/2004 2004/2005 2005/2006
Canada 107,661 106,618 107,670 105,145 108,603
All census metropolitan areas 86,911 86,818 88,590 87,499 90,126Abbotsford 682 764 765 748 768Calgary 7,019 7,731 8,057 7,985 8,072Edmonton 5,536 5,931 5,963 6,002 6,029Greater Sudbury / Grand Sudbury 14 -65 14 -20 -60Halifax 1,373 1,376 1,419 1,378 1,294Hamilton 2,101 1,914 1,973 1,668 1,514Kingston 131 73 51 41 4Kitchener 2,537 2,361 2,592 2,383 2,311London 1,402 1,204 1,190 990 891Montréal 12,111 12,197 12,504 13,089 15,994Oshawa 1,714 1,619 1,683 1,651 1,605Ottawa-Gatineau 5,209 5,333 5,814 5,805 5,865
Ottawa-Gatineau, Ontario part 4,024 4,049 4,418 4,281 4,139Ottawa-Gatineau, Quebec part 1,185 1,284 1,396 1,524 1,726
Québec 1,327 1,059 1,073 1,306 1,836Regina 743 675 629 584 574St. Catharines-Niagara 95 30 -30 -103 -211St. John’s 246 243 196 128 68Saguenay 157 77 123 142 261Saint John 212 177 117 96 58Saskatoon 1,041 1,040 1,036 959 948Sherbrooke 450 343 319 354 489Thunder Bay 31 68 21 -74 -106Toronto 31,624 31,176 32,209 31,766 31,047Trois-Rivières -72 -103 -57 -15 96Vancouver 8,614 9,034 8,325 8,415 8,642Victoria -512 -303 -407 -401 -369Windsor 1,304 1,201 1,253 1,061 994Winnipeg 1,822 1,663 1,758 1,561 1,512
40 Statistics Canada – Catalogue no. 91-214
Annual Demographic Estimates: Census Metropolitan Areas, Economic Regions and Census Divisions, Age and Sex
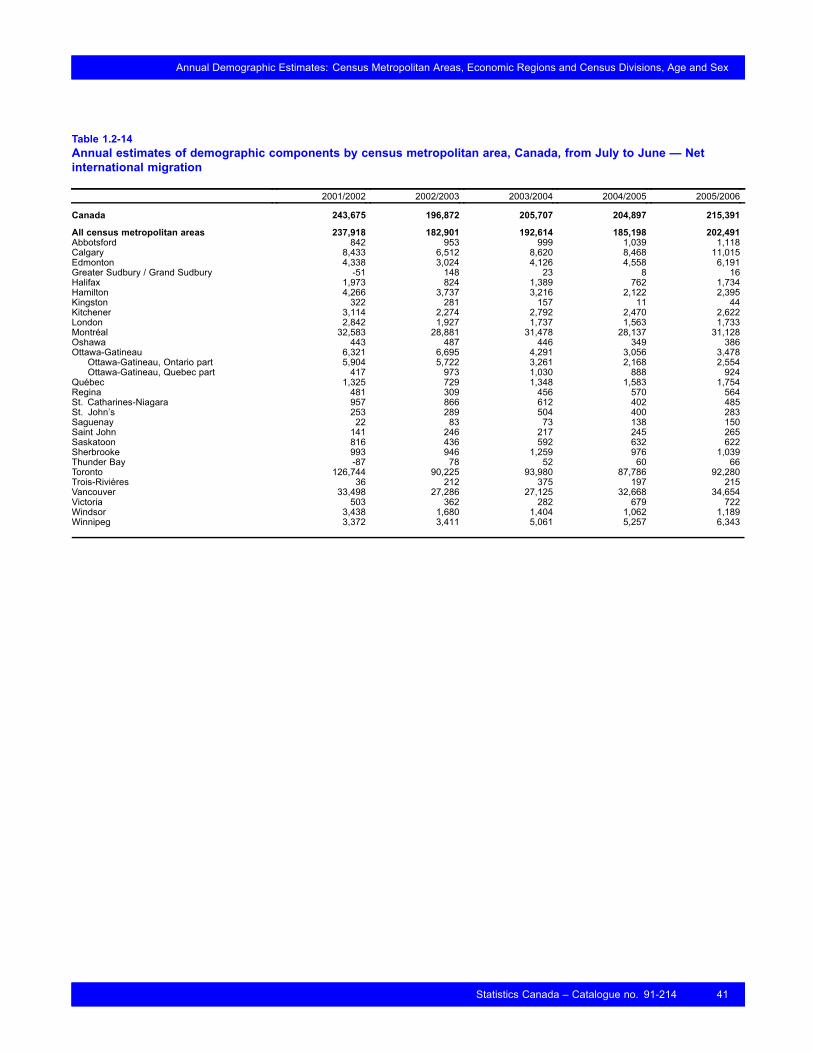
Table 1.2-14Annual estimates of demographic components by census metropolitan area, Canada, from July to June — Netinternational migration
2001/2002 2002/2003 2003/2004 2004/2005 2005/2006
Canada 243,675 196,872 205,707 204,897 215,391
All census metropolitan areas 237,918 182,901 192,614 185,198 202,491Abbotsford 842 953 999 1,039 1,118Calgary 8,433 6,512 8,620 8,468 11,015Edmonton 4,338 3,024 4,126 4,558 6,191Greater Sudbury / Grand Sudbury -51 148 23 8 16Halifax 1,973 824 1,389 762 1,734Hamilton 4,266 3,737 3,216 2,122 2,395Kingston 322 281 157 11 44Kitchener 3,114 2,274 2,792 2,470 2,622London 2,842 1,927 1,737 1,563 1,733Montréal 32,583 28,881 31,478 28,137 31,128Oshawa 443 487 446 349 386Ottawa-Gatineau 6,321 6,695 4,291 3,056 3,478
Ottawa-Gatineau, Ontario part 5,904 5,722 3,261 2,168 2,554Ottawa-Gatineau, Quebec part 417 973 1,030 888 924
Québec 1,325 729 1,348 1,583 1,754Regina 481 309 456 570 564St. Catharines-Niagara 957 866 612 402 485St. John’s 253 289 504 400 283Saguenay 22 83 73 138 150Saint John 141 246 217 245 265Saskatoon 816 436 592 632 622Sherbrooke 993 946 1,259 976 1,039Thunder Bay -87 78 52 60 66Toronto 126,744 90,225 93,980 87,786 92,280Trois-Rivières 36 212 375 197 215Vancouver 33,498 27,286 27,125 32,668 34,654Victoria 503 362 282 679 722Windsor 3,438 1,680 1,404 1,062 1,189Winnipeg 3,372 3,411 5,061 5,257 6,343
Statistics Canada – Catalogue no. 91-214 41

Annual Demographic Estimates: Census Metropolitan Areas, Economic Regions and Census Divisions, Age and Sex
Table 1.2-15Annual estimates of demographic components by census metropolitan area, Canada, from July to June — Netinterprovincial migration
2001/2002 2002/2003 2003/2004 2004/2005 2005/2006
All census metropolitan areas 6,176 -239 -2,044 -529 -1,087Abbotsford -393 -217 190 -20 -178Calgary 9,319 4,382 3,372 12,144 20,053Edmonton 6,258 1,694 1,258 7,215 12,891Greater Sudbury / Grand Sudbury -172 -60 -92 -162 -288Halifax 402 667 -452 -1,588 -2,055Hamilton 99 140 -505 -772 -1,249Kingston 552 487 -17 -212 -484Kitchener 279 93 -23 -166 -502London 86 -117 -255 -581 -960Montréal -4,143 -3,106 -2,547 -5,197 -7,377Oshawa 67 163 -120 -251 -447Ottawa-Gatineau 3,131 1,271 774 358 -1,441
Ottawa-Gatineau, Ontario part 2,141 -295 -1,269 -1,014 -2,649Ottawa-Gatineau, Quebec part 990 1,566 2,043 1,372 1,208
Québec -364 -270 -137 -584 -848Regina -2,249 -1,182 -1,175 -1,976 -1,936St. Catharines-Niagara 65 -63 -90 -560 -823St. John’s -724 -312 -290 -1,088 -1,279Saguenay 62 76 -13 -108 -154Saint John -130 -45 -46 -385 -653Saskatoon -2,319 -1,498 -1,225 -2,499 -2,397Sherbrooke -104 -56 -90 -49 -93Thunder Bay -374 -156 -532 -608 -849Toronto 2,234 108 -2,148 -2,981 -6,306Trois-Rivières -38 -48 6 -8 -24Vancouver -3,371 -1,466 2,342 2,980 1,260Victoria 662 1,247 1,766 1,913 1,557Windsor 11 -68 -181 -524 -755Winnipeg -2,670 -1,903 -1,814 -4,820 -5,750
42 Statistics Canada – Catalogue no. 91-214
Annual Demographic Estimates: Census Metropolitan Areas, Economic Regions and Census Divisions, Age and Sex
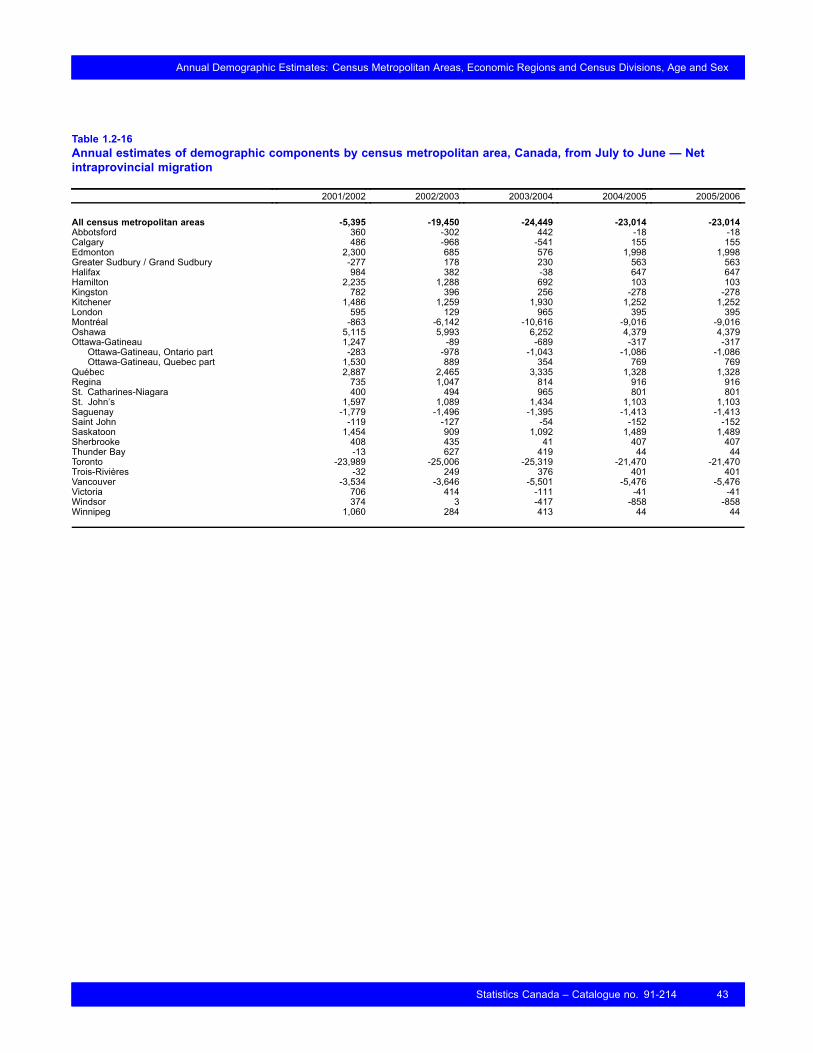
Table 1.2-16Annual estimates of demographic components by census metropolitan area, Canada, from July to June — Netintraprovincial migration
2001/2002 2002/2003 2003/2004 2004/2005 2005/2006
All census metropolitan areas -5,395 -19,450 -24,449 -23,014 -23,014Abbotsford 360 -302 442 -18 -18Calgary 486 -968 -541 155 155Edmonton 2,300 685 576 1,998 1,998Greater Sudbury / Grand Sudbury -277 178 230 563 563Halifax 984 382 -38 647 647Hamilton 2,235 1,288 692 103 103Kingston 782 396 256 -278 -278Kitchener 1,486 1,259 1,930 1,252 1,252London 595 129 965 395 395Montréal -863 -6,142 -10,616 -9,016 -9,016Oshawa 5,115 5,993 6,252 4,379 4,379Ottawa-Gatineau 1,247 -89 -689 -317 -317
Ottawa-Gatineau, Ontario part -283 -978 -1,043 -1,086 -1,086Ottawa-Gatineau, Quebec part 1,530 889 354 769 769
Québec 2,887 2,465 3,335 1,328 1,328Regina 735 1,047 814 916 916St. Catharines-Niagara 400 494 965 801 801St. John’s 1,597 1,089 1,434 1,103 1,103Saguenay -1,779 -1,496 -1,395 -1,413 -1,413Saint John -119 -127 -54 -152 -152Saskatoon 1,454 909 1,092 1,489 1,489Sherbrooke 408 435 41 407 407Thunder Bay -13 627 419 44 44Toronto -23,989 -25,006 -25,319 -21,470 -21,470Trois-Rivières -32 249 376 401 401Vancouver -3,534 -3,646 -5,501 -5,476 -5,476Victoria 706 414 -111 -41 -41Windsor 374 3 -417 -858 -858Winnipeg 1,060 284 413 44 44
Statistics Canada – Catalogue no. 91-214 43
Annual Demographic Estimates: Census Metropolitan Areas, Economic Regions and Census Divisions, Age and Sex
Table 1.2-17Annual estimates of demographic components by census metropolitan area, Canada, from July to June — Totalnet migration
2001/2002 2002/2003 2003/2004 2004/2005 2005/2006
Canada 243,675 196,872 205,707 204,897 215,391
All census metropolitan areas 238,699 163,212 166,121 161,655 178,390Abbotsford 809 434 1,631 1,001 922Calgary 18,238 9,926 11,451 20,767 31,223Edmonton 12,896 5,403 5,960 13,771 21,080Greater Sudbury / Grand Sudbury -500 266 161 409 291Halifax 3,359 1,873 899 -179 326Hamilton 6,600 5,165 3,403 1,453 1,249Kingston 1,656 1,164 396 -479 -718Kitchener 4,879 3,626 4,699 3,556 3,372London 3,523 1,939 2,447 1,377 1,168Montréal 27,577 19,633 18,315 13,924 14,735Oshawa 5,625 6,643 6,578 4,477 4,318Ottawa-Gatineau 10,699 7,877 4,376 3,097 1,720
Ottawa-Gatineau, Ontario part 7,762 4,449 949 68 -1,181Ottawa-Gatineau, Quebec part 2,937 3,428 3,427 3,029 2,901
Québec 3,848 2,924 4,546 2,327 2,234Regina -1,033 174 95 -490 -456St. Catharines-Niagara 1,422 1,297 1,487 643 463St. John’s 1,126 1,066 1,648 415 107Saguenay -1,695 -1,337 -1,335 -1,383 -1,417Saint John -108 74 117 -292 -540Saskatoon -49 -153 459 -378 -286Sherbrooke 1,297 1,325 1,210 1,334 1,353Thunder Bay -474 549 -61 -504 -739Toronto 104,989 65,327 66,513 63,335 64,504Trois-Rivières -34 413 757 590 592Vancouver 26,593 22,174 23,966 30,172 30,438Victoria 1,871 2,023 1,937 2,551 2,238Windsor 3,823 1,615 806 -320 -424Winnipeg 1,762 1,792 3,660 481 637
44 Statistics Canada – Catalogue no. 91-214
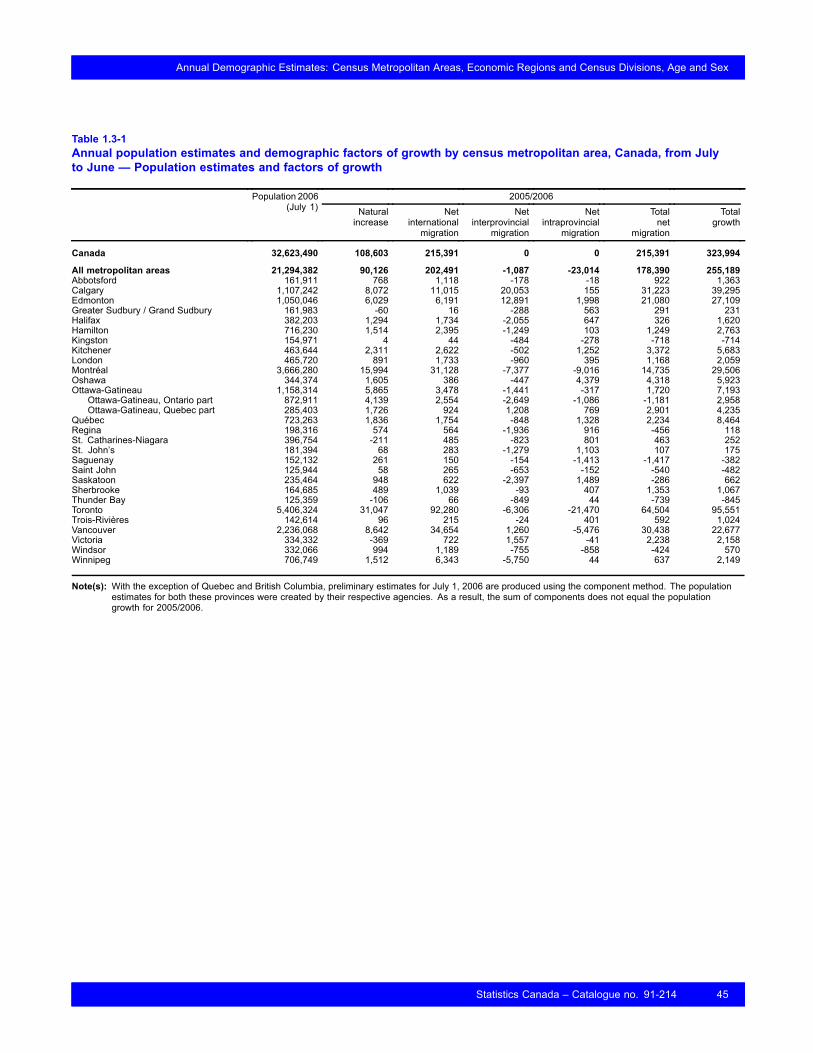
Annual Demographic Estimates: Census Metropolitan Areas, Economic Regions and Census Divisions, Age and Sex
Table 1.3-1Annual population estimates and demographic factors of growth by census metropolitan area, Canada, from Julyto June — Population estimates and factors of growth
2005/2006Population 2006(July 1) Natural
increaseNet
internationalmigration
Netinterprovincial
migration
Netintraprovincial
migration
Totalnet
migration
Totalgrowth
Canada 32,623,490 108,603 215,391 0 0 215,391 323,994
All metropolitan areas 21,294,382 90,126 202,491 -1,087 -23,014 178,390 255,189Abbotsford 161,911 768 1,118 -178 -18 922 1,363Calgary 1,107,242 8,072 11,015 20,053 155 31,223 39,295Edmonton 1,050,046 6,029 6,191 12,891 1,998 21,080 27,109Greater Sudbury / Grand Sudbury 161,983 -60 16 -288 563 291 231Halifax 382,203 1,294 1,734 -2,055 647 326 1,620Hamilton 716,230 1,514 2,395 -1,249 103 1,249 2,763Kingston 154,971 4 44 -484 -278 -718 -714Kitchener 463,644 2,311 2,622 -502 1,252 3,372 5,683London 465,720 891 1,733 -960 395 1,168 2,059Montréal 3,666,280 15,994 31,128 -7,377 -9,016 14,735 29,506Oshawa 344,374 1,605 386 -447 4,379 4,318 5,923Ottawa-Gatineau 1,158,314 5,865 3,478 -1,441 -317 1,720 7,193
Ottawa-Gatineau, Ontario part 872,911 4,139 2,554 -2,649 -1,086 -1,181 2,958Ottawa-Gatineau, Quebec part 285,403 1,726 924 1,208 769 2,901 4,235
Québec 723,263 1,836 1,754 -848 1,328 2,234 8,464Regina 198,316 574 564 -1,936 916 -456 118St. Catharines-Niagara 396,754 -211 485 -823 801 463 252St. John’s 181,394 68 283 -1,279 1,103 107 175Saguenay 152,132 261 150 -154 -1,413 -1,417 -382Saint John 125,944 58 265 -653 -152 -540 -482Saskatoon 235,464 948 622 -2,397 1,489 -286 662Sherbrooke 164,685 489 1,039 -93 407 1,353 1,067Thunder Bay 125,359 -106 66 -849 44 -739 -845Toronto 5,406,324 31,047 92,280 -6,306 -21,470 64,504 95,551Trois-Rivières 142,614 96 215 -24 401 592 1,024Vancouver 2,236,068 8,642 34,654 1,260 -5,476 30,438 22,677Victoria 334,332 -369 722 1,557 -41 2,238 2,158Windsor 332,066 994 1,189 -755 -858 -424 570Winnipeg 706,749 1,512 6,343 -5,750 44 637 2,149
Note(s): With the exception of Quebec and British Columbia, preliminary estimates for July 1, 2006 are produced using the component method. The populationestimates for both these provinces were created by their respective agencies. As a result, the sum of components does not equal the populationgrowth for 2005/2006.
Statistics Canada – Catalogue no. 91-214 45
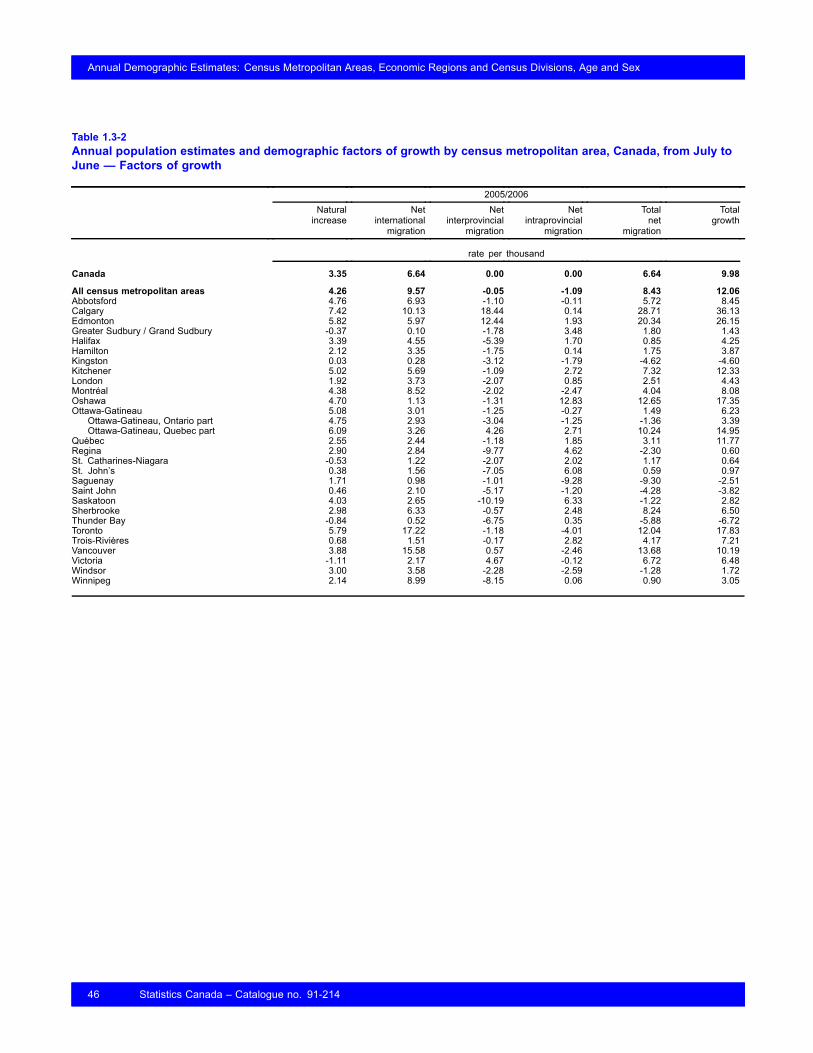
Annual Demographic Estimates: Census Metropolitan Areas, Economic Regions and Census Divisions, Age and Sex
Table 1.3-2Annual population estimates and demographic factors of growth by census metropolitan area, Canada, from July toJune — Factors of growth
2005/2006Naturalincrease
Netinternationalmigration
Netinterprovincial
migration
Netintraprovincial
migration
Totalnet
migration
Totalgrowth
rate per thousand
Canada 3.35 6.64 0.00 0.00 6.64 9.98
All census metropolitan areas 4.26 9.57 -0.05 -1.09 8.43 12.06Abbotsford 4.76 6.93 -1.10 -0.11 5.72 8.45Calgary 7.42 10.13 18.44 0.14 28.71 36.13Edmonton 5.82 5.97 12.44 1.93 20.34 26.15Greater Sudbury / Grand Sudbury -0.37 0.10 -1.78 3.48 1.80 1.43Halifax 3.39 4.55 -5.39 1.70 0.85 4.25Hamilton 2.12 3.35 -1.75 0.14 1.75 3.87Kingston 0.03 0.28 -3.12 -1.79 -4.62 -4.60Kitchener 5.02 5.69 -1.09 2.72 7.32 12.33London 1.92 3.73 -2.07 0.85 2.51 4.43Montréal 4.38 8.52 -2.02 -2.47 4.04 8.08Oshawa 4.70 1.13 -1.31 12.83 12.65 17.35Ottawa-Gatineau 5.08 3.01 -1.25 -0.27 1.49 6.23
Ottawa-Gatineau, Ontario part 4.75 2.93 -3.04 -1.25 -1.36 3.39Ottawa-Gatineau, Quebec part 6.09 3.26 4.26 2.71 10.24 14.95
Québec 2.55 2.44 -1.18 1.85 3.11 11.77Regina 2.90 2.84 -9.77 4.62 -2.30 0.60St. Catharines-Niagara -0.53 1.22 -2.07 2.02 1.17 0.64St. John’s 0.38 1.56 -7.05 6.08 0.59 0.97Saguenay 1.71 0.98 -1.01 -9.28 -9.30 -2.51Saint John 0.46 2.10 -5.17 -1.20 -4.28 -3.82Saskatoon 4.03 2.65 -10.19 6.33 -1.22 2.82Sherbrooke 2.98 6.33 -0.57 2.48 8.24 6.50Thunder Bay -0.84 0.52 -6.75 0.35 -5.88 -6.72Toronto 5.79 17.22 -1.18 -4.01 12.04 17.83Trois-Rivières 0.68 1.51 -0.17 2.82 4.17 7.21Vancouver 3.88 15.58 0.57 -2.46 13.68 10.19Victoria -1.11 2.17 4.67 -0.12 6.72 6.48Windsor 3.00 3.58 -2.28 -2.59 -1.28 1.72Winnipeg 2.14 8.99 -8.15 0.06 0.90 3.05
46 Statistics Canada – Catalogue no. 91-214

Annual Demographic Estimates: Census Metropolitan Areas, Economic Regions and Census Divisions, Age and Sex
Section 2
Economic regions
2.1 The ten economic regionsexperiencing the largestincreases in the past year
The population estimates as of July 1, 2006 indicatethat of the ten (10) economic regions (ERs) thatexperienced the largest increases in the past year, six(6) are located in Alberta, including the top-ranking five(5). The other four (4) are located in British Columbia,Nunavut and Quebec.
For seven (7) out of the eight (8) ERs located in thewestern provinces, the population growth is mainlythe result of a strong interprovincial migration thatoccurred due to the economic boom generated by theexploitation of natural resources.
The economic regions of Red Deer, Calgary and WoodBuffalo – Cold Lake, experienced a growth rate rangingfrom 37.7 ‰ to 32.8 ‰. The regions of Edmontonand Athabasca – Grande Prairie – Peace River postedgrowth in excess of 25 ‰. Finally, the regions ofNunavut (24.4 ‰), Thompson – Okanagan in BritishColumbia (22.6 ‰), Lethbridge – Medecine Hat inAlberta (22.1 ‰), Lanaudière in Québec (20.8 ‰) andNortheast in British Columbia (19.2 ‰) also showedimportant increases. (See text table 2.1)
The past year’s growth rate for these regions is muchhigher than the 10 ‰ growth rate observed for Canadaas a whole.
In Quebec, the phenomenon of urban spread combinedwith the solid performance of the economy hoistedthe Lanaudière region into the ranks of ERs postingthe strongest growth in Canada. In Nunavut andthe Norteast region of British Columbia, a high rate ofnatural increase explains this strong population growth.
2.2 The five economic regionsexperiencing the largestdecreases in the past year
The population estimates as of July 1, 2006 indicatethat the economic regions posting the largestdecreases are SouthCoast–BurinPeninsula (-20.3 ‰)and Notre Dame – CentralBonavistaBay (-17.8 ‰)in Newfoundland and Labrador, Northwest Territories(-18.2 ‰), as well as Yorkton Melville (-16.8 ‰) andSwift Current-Moose Jaw (-14.8 ‰) in Saskatchewan.Alberta’s robust economic growth, generated by theoil boom led many individuals from the NorthwestTerritories and Saskatchewan to migrate to Alberta.The population decrease evident for the two economicregions in Newfoundland and Labrador, can beexplained by interprovincial migration to Alberta. (Seetext table 2.2)
Text table 2.1Population estimates and growth rate for the ten economic regions with the higher growth, Canada, July 1 2005 toJune 30 2006
Population 2005(July 1)
Population 2006(July 1)
Growth Growthrate
number per thousand
Red Deer, Alberta 171,991 178,592 6,601 37.7Calgary, Alberta 1,150,418 1,193,570 43,152 36.8Wood Buffalo - Cold Lake, Alberta 117,803 121,730 3,927 32.8Edmonton, Alberta 1,066,019 1,094,239 28,220 26.1Athabasca - Grande Prairie - Peace River, Alberta 240,131 246,311 6,180 25.4Nunavut 30,040 30,782 742 24.4Thompson - Okanagan, British Colombia 502,544 514,042 11,498 22.6Lethbridge - Medicine Hat, Alberta 255,959 261,669 5,710 22.1Lanaudière, Quebec 425,937 434,872 8,935 20.8Northeast, British Colombia 64,954 66,214 1,260 19.2
Statistics Canada – Catalogue no. 91-214 47
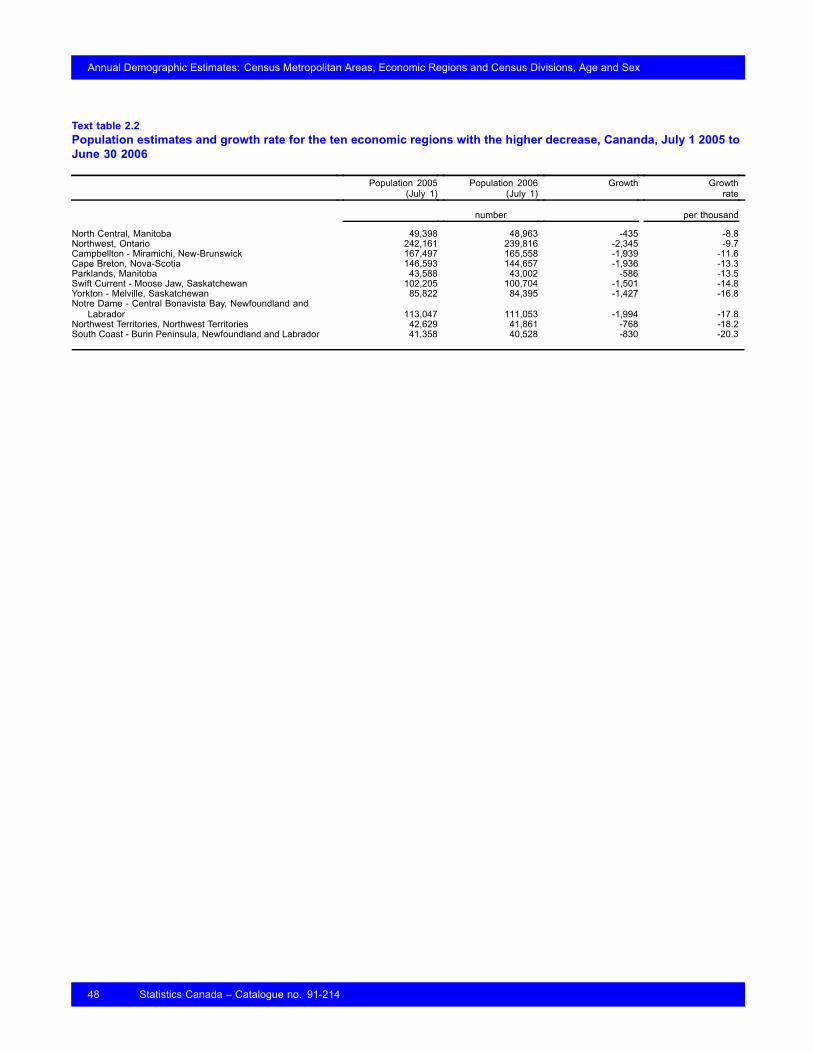
Annual Demographic Estimates: Census Metropolitan Areas, Economic Regions and Census Divisions, Age and Sex
Text table 2.2Population estimates and growth rate for the ten economic regions with the higher decrease, Cananda, July 1 2005 toJune 30 2006
Population 2005(July 1)
Population 2006(July 1)
Growth Growthrate
number per thousand
North Central, Manitoba 49,398 48,963 -435 -8.8Northwest, Ontario 242,161 239,816 -2,345 -9.7Campbellton - Miramichi, New-Brunswick 167,497 165,558 -1,939 -11.6Cape Breton, Nova-Scotia 146,593 144,657 -1,936 -13.3Parklands, Manitoba 43,588 43,002 -586 -13.5Swift Current - Moose Jaw, Saskatchewan 102,205 100,704 -1,501 -14.8Yorkton - Melville, Saskatchewan 85,822 84,395 -1,427 -16.8Notre Dame - Central Bonavista Bay, Newfoundland and
Labrador 113,047 111,053 -1,994 -17.8Northwest Territories, Northwest Territories 42,629 41,861 -768 -18.2South Coast - Burin Peninsula, Newfoundland and Labrador 41,358 40,528 -830 -20.3
48 Statistics Canada – Catalogue no. 91-214

Annual Demographic Estimates: Census Metropolitan Areas, Economic Regions and Census Divisions, Age and Sex
Table 2.1-1Annual population estimates by economic region, provinces and territories, Canada — Population at July 1
2001 2002 2003 2004 2005 2006
Newfoundland and Labrador 521,986 519,449 518,428 517,209 513,962 509,677Avalon Peninsula 247,263 248,036 249,094 250,776 250,588 249,929South Coast-Burin Peninsula 44,476 43,508 42,869 42,083 41,358 40,528West Coast-Northern Peninsula-Labrador 112,531 111,305 110,408 109,589 108,969 108,167Notre Dame-Central Bonavista Bay 117,716 116,600 116,057 114,761 113,047 111,053
Prince Edward Island 136,672 136,934 137,325 137,876 138,176 138,519
Nova Scotia 932,389 934,507 936,513 937,993 936,130 934,405Cape Breton 151,280 149,772 148,808 148,420 146,593 144,657North Shore 162,444 161,855 161,590 161,372 160,856 160,257Annapolis Valley 124,389 124,286 124,490 124,683 124,669 124,589Southern 125,191 124,777 124,559 124,134 123,429 122,699Halifax 369,085 373,817 377,066 379,384 380,583 382,203
New Brunswick 749,890 750,327 751,222 752,080 751,481 749,168Campbellton-Miramichi 174,543 172,350 170,763 169,048 167,497 165,558Moncton-Richibucto 187,985 189,783 191,589 193,500 194,721 195,633Saint John-St. Stephen 172,640 172,763 172,997 173,304 173,111 172,542Fredericton-Oromocto 128,434 129,426 130,219 131,017 131,364 131,309Edmundston-Woodstock 86,288 86,005 85,654 85,211 84,788 84,126
Quebec 7,396,990 7,445,745 7,494,690 7,548,589 7,597,768 7,651,531Gaspésie-Îles-de-la-Madeleine 98,767 97,646 96,804 96,465 96,115 95,872Bas-Saint-Laurent 204,506 202,983 202,295 202,020 201,779 201,692Capitale-Nationale 651,398 655,699 659,259 664,083 666,468 671,468Chaudière-Appalaches 390,897 391,284 392,285 393,807 395,665 397,777Estrie 291,381 293,582 296,047 298,248 300,573 302,161Centre-du-Québec 222,810 223,367 224,137 225,605 226,542 228,099Montérégie 1,312,699 1,324,608 1,339,283 1,356,269 1,371,670 1,386,963Montréal 1,851,746 1,867,278 1,872,782 1,873,805 1,872,344 1,873,971Laval 349,896 355,308 360,555 365,644 371,061 376,845Lanaudière 396,150 400,525 406,928 415,724 425,937 434,872Laurentides 472,035 480,889 490,810 500,784 510,558 518,621Outaouais 322,770 327,435 332,797 337,900 342,969 347,214Abitibi-Témiscamingue 148,934 147,189 145,999 145,170 144,618 144,835Mauricie 260,177 259,125 258,896 259,298 259,798 260,461Saguenay-Lac-Saint-Jean 283,719 281,067 278,668 276,732 274,779 274,095Côte-Nord 99,708 98,164 97,292 96,898 96,478 95,948Nord-du-Québec 39,397 39,596 39,853 40,137 40,414 40,637
Ontario 11,897,647 12,102,045 12,262,560 12,416,749 12,558,669 12,686,952Ottawa 1,166,627 1,180,542 1,192,132 1,199,189 1,205,895 1,210,083Kingston-Pembroke 441,902 445,395 447,828 450,103 450,837 450,754Muskoka-Kawarthas 353,939 356,975 360,556 362,766 364,745 366,366Toronto 5,144,442 5,286,627 5,390,872 5,496,484 5,599,652 5,698,437Kitchener-Waterloo-Barrie 1,096,011 1,116,935 1,136,177 1,156,156 1,174,019 1,190,679Hamilton-Niagara Peninsula 1,331,848 1,345,203 1,357,582 1,369,145 1,378,045 1,385,481London 609,855 615,139 619,418 624,265 628,357 631,777Windsor-Sarnia 634,212 639,971 643,508 645,785 647,055 647,633Stratford-Bruce Peninsula 297,360 298,841 300,384 300,933 300,570 299,943Northeast 574,936 571,208 569,203 568,040 567,333 565,983Northwest 246,515 245,209 244,900 243,883 242,161 239,816
Manitoba 1,151,285 1,155,584 1,161,896 1,170,475 1,174,148 1,177,765Southeast 89,073 90,365 91,905 93,814 95,446 97,155South Central 53,717 54,103 54,682 55,449 56,244 57,101Southwest 105,804 105,272 105,396 105,756 105,897 105,956North Central 48,836 48,905 49,254 49,790 49,398 48,963Winnipeg 638,905 641,792 644,941 649,074 650,157 651,331Interlake 84,645 85,083 85,875 86,684 87,488 88,275Parklands 45,441 45,026 44,452 44,124 43,588 43,002North 84,864 85,038 85,391 85,784 85,930 85,982
Saskatchewan 1,000,134 995,886 994,732 994,888 989,957 985,386Regina-Moose Mountain 276,762 275,616 276,029 276,130 275,423 274,769Swift Current-Moose Jaw 106,373 104,966 104,382 103,740 102,205 100,704Saskatoon-Biggar 291,410 291,649 291,659 292,962 292,760 292,639Yorkton-Melville 90,573 89,461 88,266 87,301 85,822 84,395Prince Albert 202,200 201,110 200,971 200,881 199,734 198,689Northern 32,816 33,084 33,425 33,874 34,013 34,190
Statistics Canada – Catalogue no. 91-214 49

Annual Demographic Estimates: Census Metropolitan Areas, Economic Regions and Census Divisions, Age and Sex
Table 2.1-1 – continued
Annual population estimates by economic region, provinces and territories, Canada — Population at July 12001 2002 2003 2004 2005 2006
Alberta 3,056,739 3,116,332 3,161,371 3,206,953 3,277,582 3,375,763Lethbridge-Medicine Hat 245,089 247,298 249,604 252,222 255,959 261,669Camrose-Drumheller 186,942 188,177 189,145 189,755 191,564 194,681Calgary 1,048,110 1,076,036 1,096,452 1,118,233 1,150,418 1,193,570Banff-Jasper-Rocky Mountain House 82,539 82,895 83,132 83,304 83,697 84,971Red Deer 156,967 160,251 163,383 166,747 171,991 178,592Edmonton 1,001,799 1,020,329 1,032,913 1,045,291 1,066,019 1,094,239Athabasca-Grande Prairie-Peace River 228,253 231,104 233,460 235,875 240,131 246,311Wood Buffalo-Cold Lake 107,040 110,242 113,282 115,526 117,803 121,730
British Columbia 4,078,447 4,115,413 4,155,370 4,203,315 4,257,833 4,310,452Vancouver Island and Coast 717,275 719,631 724,612 731,636 738,966 748,019Lower Mainland-Southwest 2,385,101 2,423,549 2,458,364 2,496,005 2,538,570 2,566,842Thompson-Okanagan 484,592 487,120 491,636 497,033 502,544 514,042Kootenay 151,227 149,578 148,431 147,562 147,387 148,712Cariboo 167,683 165,194 163,094 162,318 162,584 163,352North Coast 65,223 63,532 62,325 61,343 60,473 60,731Nechako 43,956 43,256 42,845 42,808 42,355 42,540Northeast 63,390 63,553 64,063 64,610 64,954 66,214
Yukon Territory 30,129 30,137 30,574 30,896 31,121 31,229Northwest Territories 40,822 41,489 42,231 42,798 42,629 41,861Nunavut 28,121 28,739 29,165 29,633 30,040 30,782
50 Statistics Canada – Catalogue no. 91-214
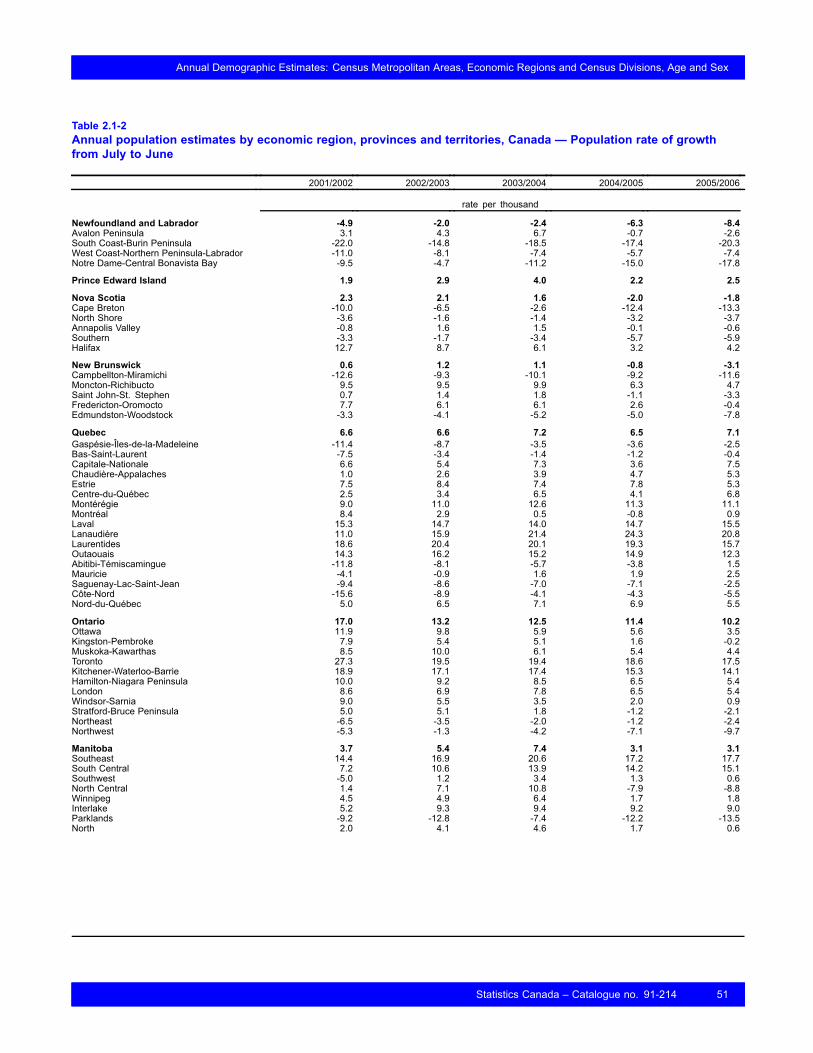
Annual Demographic Estimates: Census Metropolitan Areas, Economic Regions and Census Divisions, Age and Sex
Table 2.1-2Annual population estimates by economic region, provinces and territories, Canada — Population rate of growthfrom July to June
2001/2002 2002/2003 2003/2004 2004/2005 2005/2006
rate per thousand
Newfoundland and Labrador -4.9 -2.0 -2.4 -6.3 -8.4Avalon Peninsula 3.1 4.3 6.7 -0.7 -2.6South Coast-Burin Peninsula -22.0 -14.8 -18.5 -17.4 -20.3West Coast-Northern Peninsula-Labrador -11.0 -8.1 -7.4 -5.7 -7.4Notre Dame-Central Bonavista Bay -9.5 -4.7 -11.2 -15.0 -17.8
Prince Edward Island 1.9 2.9 4.0 2.2 2.5
Nova Scotia 2.3 2.1 1.6 -2.0 -1.8Cape Breton -10.0 -6.5 -2.6 -12.4 -13.3North Shore -3.6 -1.6 -1.4 -3.2 -3.7Annapolis Valley -0.8 1.6 1.5 -0.1 -0.6Southern -3.3 -1.7 -3.4 -5.7 -5.9Halifax 12.7 8.7 6.1 3.2 4.2
New Brunswick 0.6 1.2 1.1 -0.8 -3.1Campbellton-Miramichi -12.6 -9.3 -10.1 -9.2 -11.6Moncton-Richibucto 9.5 9.5 9.9 6.3 4.7Saint John-St. Stephen 0.7 1.4 1.8 -1.1 -3.3Fredericton-Oromocto 7.7 6.1 6.1 2.6 -0.4Edmundston-Woodstock -3.3 -4.1 -5.2 -5.0 -7.8
Quebec 6.6 6.6 7.2 6.5 7.1Gaspésie-Îles-de-la-Madeleine -11.4 -8.7 -3.5 -3.6 -2.5Bas-Saint-Laurent -7.5 -3.4 -1.4 -1.2 -0.4Capitale-Nationale 6.6 5.4 7.3 3.6 7.5Chaudière-Appalaches 1.0 2.6 3.9 4.7 5.3Estrie 7.5 8.4 7.4 7.8 5.3Centre-du-Québec 2.5 3.4 6.5 4.1 6.8Montérégie 9.0 11.0 12.6 11.3 11.1Montréal 8.4 2.9 0.5 -0.8 0.9Laval 15.3 14.7 14.0 14.7 15.5Lanaudière 11.0 15.9 21.4 24.3 20.8Laurentides 18.6 20.4 20.1 19.3 15.7Outaouais 14.3 16.2 15.2 14.9 12.3Abitibi-Témiscamingue -11.8 -8.1 -5.7 -3.8 1.5Mauricie -4.1 -0.9 1.6 1.9 2.5Saguenay-Lac-Saint-Jean -9.4 -8.6 -7.0 -7.1 -2.5Côte-Nord -15.6 -8.9 -4.1 -4.3 -5.5Nord-du-Québec 5.0 6.5 7.1 6.9 5.5
Ontario 17.0 13.2 12.5 11.4 10.2Ottawa 11.9 9.8 5.9 5.6 3.5Kingston-Pembroke 7.9 5.4 5.1 1.6 -0.2Muskoka-Kawarthas 8.5 10.0 6.1 5.4 4.4Toronto 27.3 19.5 19.4 18.6 17.5Kitchener-Waterloo-Barrie 18.9 17.1 17.4 15.3 14.1Hamilton-Niagara Peninsula 10.0 9.2 8.5 6.5 5.4London 8.6 6.9 7.8 6.5 5.4Windsor-Sarnia 9.0 5.5 3.5 2.0 0.9Stratford-Bruce Peninsula 5.0 5.1 1.8 -1.2 -2.1Northeast -6.5 -3.5 -2.0 -1.2 -2.4Northwest -5.3 -1.3 -4.2 -7.1 -9.7
Manitoba 3.7 5.4 7.4 3.1 3.1Southeast 14.4 16.9 20.6 17.2 17.7South Central 7.2 10.6 13.9 14.2 15.1Southwest -5.0 1.2 3.4 1.3 0.6North Central 1.4 7.1 10.8 -7.9 -8.8Winnipeg 4.5 4.9 6.4 1.7 1.8Interlake 5.2 9.3 9.4 9.2 9.0Parklands -9.2 -12.8 -7.4 -12.2 -13.5North 2.0 4.1 4.6 1.7 0.6
Statistics Canada – Catalogue no. 91-214 51

Annual Demographic Estimates: Census Metropolitan Areas, Economic Regions and Census Divisions, Age and Sex
Table 2.1-2 – continued
Annual population estimates by economic region, provinces and territories, Canada — Population rate of growthfrom July to June
2001/2002 2002/2003 2003/2004 2004/2005 2005/2006
rate per thousand
Saskatchewan -4.3 -1.2 0.2 -5.0 -4.6Regina-Moose Mountain -4.1 1.5 0.4 -2.6 -2.4Swift Current-Moose Jaw -13.3 -5.6 -6.2 -14.9 -14.8Saskatoon-Biggar 0.8 0.0 4.5 -0.7 -0.4Yorkton-Melville -12.4 -13.4 -11.0 -17.1 -16.8Prince Albert -5.4 -0.7 -0.4 -5.7 -5.2Northern 8.1 10.3 13.3 4.1 5.2
Alberta 19.3 14.3 14.3 21.8 29.5Lethbridge-Medicine Hat 9.0 9.3 10.4 14.7 22.1Camrose-Drumheller 6.6 5.1 3.2 9.5 16.1Calgary 26.3 18.8 19.7 28.4 36.8Banff-Jasper-Rocky Mountain House 4.3 2.9 2.1 4.7 15.1Red Deer 20.7 19.4 20.4 31.0 37.7Edmonton 18.3 12.3 11.9 19.6 26.1Athabasca-Grande Prairie-Peace River 12.4 10.1 10.3 17.9 25.4Wood Buffalo-Cold Lake 29.5 27.2 19.6 19.5 32.8
British Columbia 9.0 9.7 11.5 12.9 12.3Vancouver Island and Coast 3.3 6.9 9.6 10.0 12.2Lower Mainland-Southwest 16.0 14.3 15.2 16.9 11.1Thompson-Okanagan 5.2 9.2 10.9 11.0 22.6Kootenay -11.0 -7.7 -5.9 -1.2 8.9Cariboo -15.0 -12.8 -4.8 1.6 4.7North Coast -26.3 -19.2 -15.9 -14.3 4.3Nechako -16.1 -9.5 -0.9 -10.6 4.4Northeast 2.6 8.0 8.5 5.3 19.2
Yukon Territory 0.3 14.4 10.5 7.3 3.5Northwest Territories 16.2 17.7 13.3 -4.0 -18.2Nunavut 21.7 14.7 15.9 13.6 24.4
52 Statistics Canada – Catalogue no. 91-214
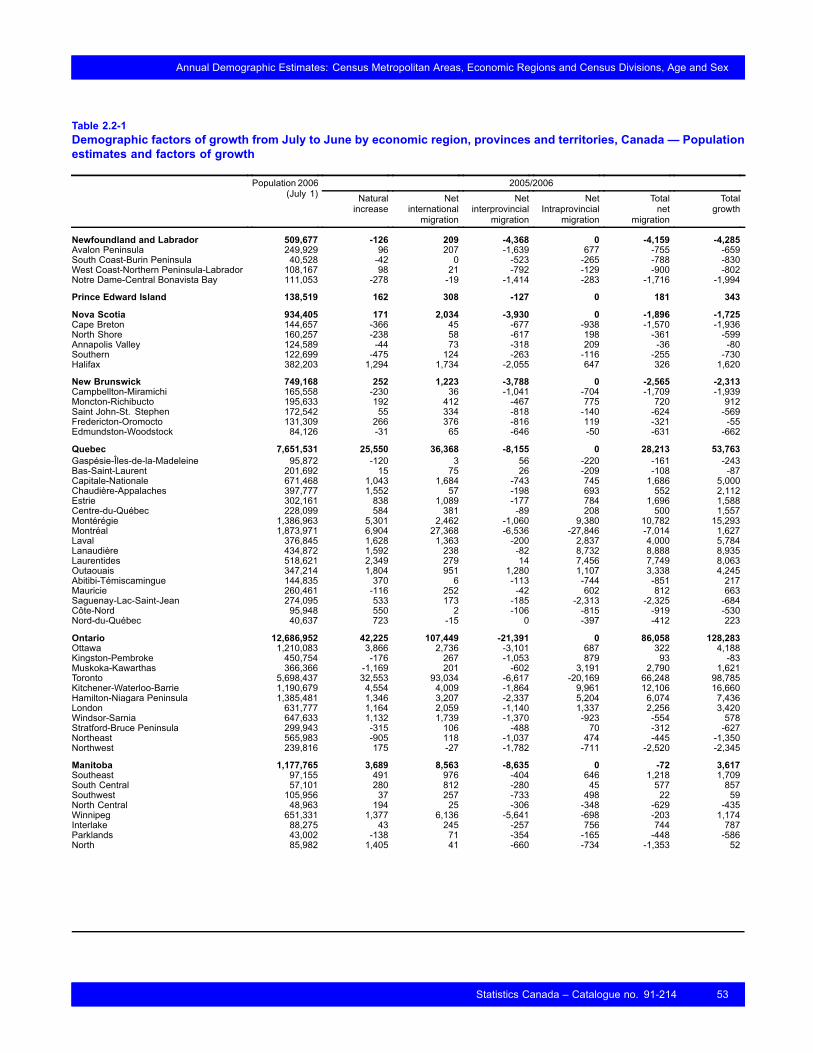
Annual Demographic Estimates: Census Metropolitan Areas, Economic Regions and Census Divisions, Age and Sex
Table 2.2-1Demographic factors of growth from July to June by economic region, provinces and territories, Canada — Populationestimates and factors of growth
2005/2006Population 2006(July 1) Natural
increaseNet
internationalmigration
Netinterprovincial
migration
NetIntraprovincial
migration
Totalnet
migration
Totalgrowth
Newfoundland and Labrador 509,677 -126 209 -4,368 0 -4,159 -4,285Avalon Peninsula 249,929 96 207 -1,639 677 -755 -659South Coast-Burin Peninsula 40,528 -42 0 -523 -265 -788 -830West Coast-Northern Peninsula-Labrador 108,167 98 21 -792 -129 -900 -802Notre Dame-Central Bonavista Bay 111,053 -278 -19 -1,414 -283 -1,716 -1,994
Prince Edward Island 138,519 162 308 -127 0 181 343
Nova Scotia 934,405 171 2,034 -3,930 0 -1,896 -1,725Cape Breton 144,657 -366 45 -677 -938 -1,570 -1,936North Shore 160,257 -238 58 -617 198 -361 -599Annapolis Valley 124,589 -44 73 -318 209 -36 -80Southern 122,699 -475 124 -263 -116 -255 -730Halifax 382,203 1,294 1,734 -2,055 647 326 1,620
New Brunswick 749,168 252 1,223 -3,788 0 -2,565 -2,313Campbellton-Miramichi 165,558 -230 36 -1,041 -704 -1,709 -1,939Moncton-Richibucto 195,633 192 412 -467 775 720 912Saint John-St. Stephen 172,542 55 334 -818 -140 -624 -569Fredericton-Oromocto 131,309 266 376 -816 119 -321 -55Edmundston-Woodstock 84,126 -31 65 -646 -50 -631 -662
Quebec 7,651,531 25,550 36,368 -8,155 0 28,213 53,763Gaspésie-Îles-de-la-Madeleine 95,872 -120 3 56 -220 -161 -243Bas-Saint-Laurent 201,692 15 75 26 -209 -108 -87Capitale-Nationale 671,468 1,043 1,684 -743 745 1,686 5,000Chaudière-Appalaches 397,777 1,552 57 -198 693 552 2,112Estrie 302,161 838 1,089 -177 784 1,696 1,588Centre-du-Québec 228,099 584 381 -89 208 500 1,557Montérégie 1,386,963 5,301 2,462 -1,060 9,380 10,782 15,293Montréal 1,873,971 6,904 27,368 -6,536 -27,846 -7,014 1,627Laval 376,845 1,628 1,363 -200 2,837 4,000 5,784Lanaudière 434,872 1,592 238 -82 8,732 8,888 8,935Laurentides 518,621 2,349 279 14 7,456 7,749 8,063Outaouais 347,214 1,804 951 1,280 1,107 3,338 4,245Abitibi-Témiscamingue 144,835 370 6 -113 -744 -851 217Mauricie 260,461 -116 252 -42 602 812 663Saguenay-Lac-Saint-Jean 274,095 533 173 -185 -2,313 -2,325 -684Côte-Nord 95,948 550 2 -106 -815 -919 -530Nord-du-Québec 40,637 723 -15 0 -397 -412 223
Ontario 12,686,952 42,225 107,449 -21,391 0 86,058 128,283Ottawa 1,210,083 3,866 2,736 -3,101 687 322 4,188Kingston-Pembroke 450,754 -176 267 -1,053 879 93 -83Muskoka-Kawarthas 366,366 -1,169 201 -602 3,191 2,790 1,621Toronto 5,698,437 32,553 93,034 -6,617 -20,169 66,248 98,785Kitchener-Waterloo-Barrie 1,190,679 4,554 4,009 -1,864 9,961 12,106 16,660Hamilton-Niagara Peninsula 1,385,481 1,346 3,207 -2,337 5,204 6,074 7,436London 631,777 1,164 2,059 -1,140 1,337 2,256 3,420Windsor-Sarnia 647,633 1,132 1,739 -1,370 -923 -554 578Stratford-Bruce Peninsula 299,943 -315 106 -488 70 -312 -627Northeast 565,983 -905 118 -1,037 474 -445 -1,350Northwest 239,816 175 -27 -1,782 -711 -2,520 -2,345
Manitoba 1,177,765 3,689 8,563 -8,635 0 -72 3,617Southeast 97,155 491 976 -404 646 1,218 1,709South Central 57,101 280 812 -280 45 577 857Southwest 105,956 37 257 -733 498 22 59North Central 48,963 194 25 -306 -348 -629 -435Winnipeg 651,331 1,377 6,136 -5,641 -698 -203 1,174Interlake 88,275 43 245 -257 756 744 787Parklands 43,002 -138 71 -354 -165 -448 -586North 85,982 1,405 41 -660 -734 -1,353 52
Statistics Canada – Catalogue no. 91-214 53
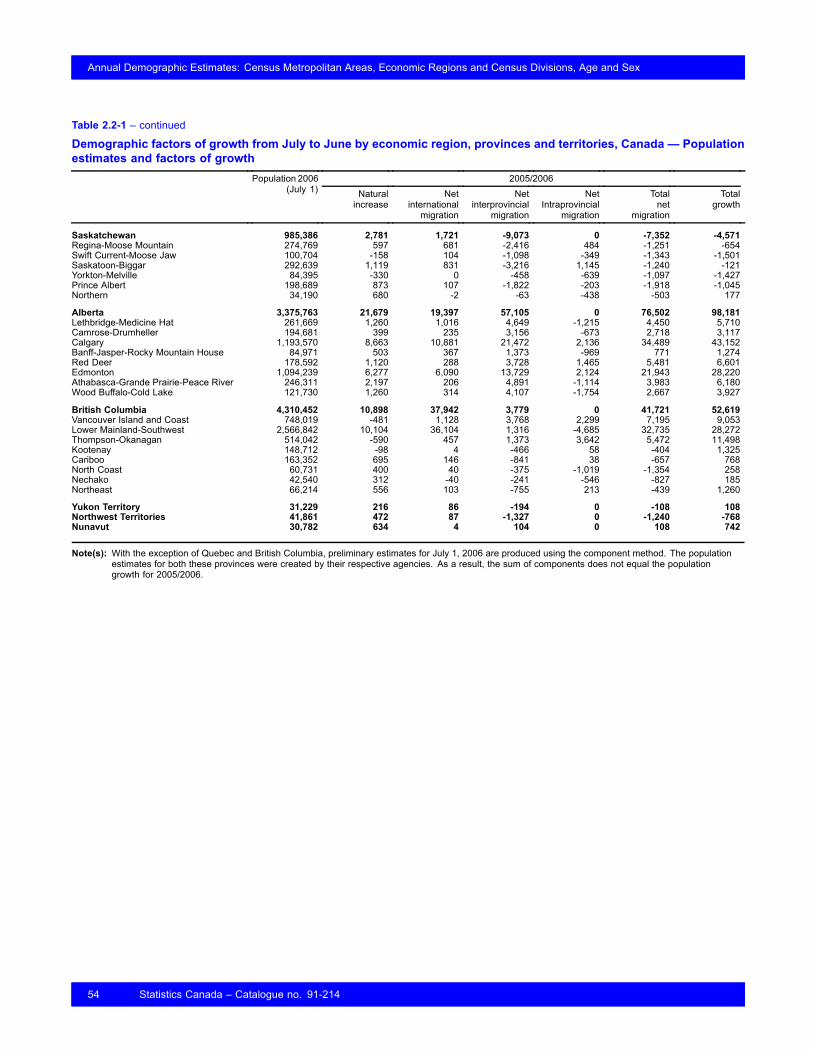
Annual Demographic Estimates: Census Metropolitan Areas, Economic Regions and Census Divisions, Age and Sex
Table 2.2-1 – continued
Demographic factors of growth from July to June by economic region, provinces and territories, Canada — Populationestimates and factors of growth
2005/2006Population 2006(July 1) Natural
increaseNet
internationalmigration
Netinterprovincial
migration
NetIntraprovincial
migration
Totalnet
migration
Totalgrowth
Saskatchewan 985,386 2,781 1,721 -9,073 0 -7,352 -4,571Regina-Moose Mountain 274,769 597 681 -2,416 484 -1,251 -654Swift Current-Moose Jaw 100,704 -158 104 -1,098 -349 -1,343 -1,501Saskatoon-Biggar 292,639 1,119 831 -3,216 1,145 -1,240 -121Yorkton-Melville 84,395 -330 0 -458 -639 -1,097 -1,427Prince Albert 198,689 873 107 -1,822 -203 -1,918 -1,045Northern 34,190 680 -2 -63 -438 -503 177
Alberta 3,375,763 21,679 19,397 57,105 0 76,502 98,181Lethbridge-Medicine Hat 261,669 1,260 1,016 4,649 -1,215 4,450 5,710Camrose-Drumheller 194,681 399 235 3,156 -673 2,718 3,117Calgary 1,193,570 8,663 10,881 21,472 2,136 34,489 43,152Banff-Jasper-Rocky Mountain House 84,971 503 367 1,373 -969 771 1,274Red Deer 178,592 1,120 288 3,728 1,465 5,481 6,601Edmonton 1,094,239 6,277 6,090 13,729 2,124 21,943 28,220Athabasca-Grande Prairie-Peace River 246,311 2,197 206 4,891 -1,114 3,983 6,180Wood Buffalo-Cold Lake 121,730 1,260 314 4,107 -1,754 2,667 3,927
British Columbia 4,310,452 10,898 37,942 3,779 0 41,721 52,619Vancouver Island and Coast 748,019 -481 1,128 3,768 2,299 7,195 9,053Lower Mainland-Southwest 2,566,842 10,104 36,104 1,316 -4,685 32,735 28,272Thompson-Okanagan 514,042 -590 457 1,373 3,642 5,472 11,498Kootenay 148,712 -98 4 -466 58 -404 1,325Cariboo 163,352 695 146 -841 38 -657 768North Coast 60,731 400 40 -375 -1,019 -1,354 258Nechako 42,540 312 -40 -241 -546 -827 185Northeast 66,214 556 103 -755 213 -439 1,260
Yukon Territory 31,229 216 86 -194 0 -108 108Northwest Territories 41,861 472 87 -1,327 0 -1,240 -768Nunavut 30,782 634 4 104 0 108 742
Note(s): With the exception of Quebec and British Columbia, preliminary estimates for July 1, 2006 are produced using the component method. The populationestimates for both these provinces were created by their respective agencies. As a result, the sum of components does not equal the populationgrowth for 2005/2006.
54 Statistics Canada – Catalogue no. 91-214

Annual Demographic Estimates: Census Metropolitan Areas, Economic Regions and Census Divisions, Age and Sex
Table 2.2-2Demographic factors of growth from July to June by economic region, provinces and territories, Canada — Factors ofgrowth
2005/2006Naturalincrease
Netinternationalmigration
Netinterprovincial
migration
Netintraprovincial
migration
Totalnet
migration
Totalgrowth
rate per thousand
Newfoundland and Labrador -0.2 0.4 -8.5 0.0 -8.1 -8.4Avalon Peninsula 0.4 0.8 -6.5 2.7 -3.0 -2.6South Coast-Burin Peninsula -1.0 0.0 -12.8 -6.5 -19.2 -20.3West Coast-Northern
Peninsula-Labrador 0.9 0.2 -7.3 -1.2 -8.3 -7.4Notre Dame-Central Bonavista Bay -2.5 -0.2 -12.6 -2.5 -15.3 -17.8
Prince Edward Island 1.2 2.2 -0.9 0.0 1.3 2.5
Nova Scotia 0.2 2.2 -4.2 0.0 -2.0 -1.8Cape Breton -2.5 0.3 -4.6 -6.4 -10.8 -13.3North Shore -1.5 0.4 -3.8 1.2 -2.2 -3.7Annapolis Valley -0.4 0.6 -2.6 1.7 -0.3 -0.6Southern -3.9 1.0 -2.1 -0.9 -2.1 -5.9Halifax 3.4 4.5 -5.4 1.7 0.9 4.2
New Brunswick 0.3 1.6 -5.0 0.0 -3.4 -3.1Campbellton-Miramichi -1.4 0.2 -6.3 -4.2 -10.3 -11.6Moncton-Richibucto 1.0 2.1 -2.4 4.0 3.7 4.7Saint John-St. Stephen 0.3 1.9 -4.7 -0.8 -3.6 -3.3Fredericton-Oromocto 2.0 2.9 -6.2 0.9 -2.4 -0.4Edmundston-Woodstock -0.4 0.8 -7.6 -0.6 -7.5 -7.8
Quebec 3.4 4.8 -1.1 0.0 3.7 7.1Gaspésie-Îles-de-la-Madeleine -1.3 0.0 0.6 -2.3 -1.7 -2.5Bas-Saint-Laurent 0.1 0.4 0.1 -1.0 -0.5 -0.4Capitale-Nationale 1.6 2.5 -1.1 1.1 2.5 7.5Chaudière-Appalaches 3.9 0.1 -0.5 1.7 1.4 5.3Estrie 2.8 3.6 -0.6 2.6 5.6 5.3Centre-du-Québec 2.6 1.7 -0.4 0.9 2.2 6.8Montérégie 3.8 1.8 -0.8 6.8 7.8 11.1Montréal 3.7 14.6 -3.5 -14.9 -3.7 0.9Laval 4.4 3.6 -0.5 7.6 10.7 15.5Lanaudière 3.7 0.6 -0.2 20.3 20.7 20.8Laurentides 4.6 0.5 0.0 14.5 15.1 15.7Outaouais 5.2 2.8 3.7 3.2 9.7 12.3Abitibi-Témiscamingue 2.6 0.0 -0.8 -5.1 -5.9 1.5Mauricie -0.4 1.0 -0.2 2.3 3.1 2.5Saguenay-Lac-Saint-Jean 1.9 0.6 -0.7 -8.4 -8.5 -2.5Côte-Nord 5.7 0.0 -1.1 -8.5 -9.6 -5.5Nord-du-Québec 17.8 -0.4 0.0 -9.8 -10.2 5.5
Ontario 3.3 8.5 -1.7 0.0 6.8 10.2Ottawa 3.2 2.3 -2.6 0.6 0.3 3.5Kingston-Pembroke -0.4 0.6 -2.3 1.9 0.2 -0.2Muskoka-Kawarthas -3.2 0.5 -1.6 8.7 7.6 4.4Toronto 5.8 16.5 -1.2 -3.6 11.7 17.5Kitchener-Waterloo-Barrie 3.9 3.4 -1.6 8.4 10.2 14.1Hamilton-Niagara Peninsula 1.0 2.3 -1.7 3.8 4.4 5.4London 1.8 3.3 -1.8 2.1 3.6 5.4Windsor-Sarnia 1.7 2.7 -2.1 -1.4 -0.9 0.9Stratford-Bruce Peninsula -1.0 0.4 -1.6 0.2 -1.0 -2.1Northeast -1.6 0.2 -1.8 0.8 -0.8 -2.4Northwest 0.7 -0.1 -7.4 -3.0 -10.5 -9.7
Manitoba 3.1 7.3 -7.3 0.0 -0.1 3.1Southeast 5.1 10.1 -4.2 6.7 12.6 17.7South Central 4.9 14.3 -4.9 0.8 10.2 15.1Southwest 0.3 2.4 -6.9 4.7 0.2 0.6North Central 3.9 0.5 -6.2 -7.1 -12.8 -8.8Winnipeg 2.1 9.4 -8.7 -1.1 -0.3 1.8Interlake 0.5 2.8 -2.9 8.6 8.5 9.0Parklands -3.2 1.6 -8.2 -3.8 -10.3 -13.5North 16.3 0.5 -7.7 -8.5 -15.7 0.6
Statistics Canada – Catalogue no. 91-214 55

Annual Demographic Estimates: Census Metropolitan Areas, Economic Regions and Census Divisions, Age and Sex
Table 2.2-2 – continued
Demographic factors of growth from July to June by economic region, provinces and territories, Canada — Factors ofgrowth
2005/2006Naturalincrease
Netinternationalmigration
Netinterprovincial
migration
Netintraprovincial
migration
Totalnet
migration
Totalgrowth
rate per thousand
Saskatchewan 2.8 1.7 -9.2 0.0 -7.4 -4.6Regina-Moose Mountain 2.2 2.5 -8.8 1.8 -4.5 -2.4Swift Current-Moose Jaw -1.6 1.0 -10.8 -3.4 -13.2 -14.8Saskatoon-Biggar 3.8 2.8 -11.0 3.9 -4.2 -0.4Yorkton-Melville -3.9 0.0 -5.4 -7.5 -12.9 -16.8Prince Albert 4.4 0.5 -9.1 -1.0 -9.6 -5.2Northern 19.9 -0.1 -1.8 -12.8 -14.8 5.2
Alberta 6.5 5.8 17.2 0.0 23.0 29.5Lethbridge-Medicine Hat 4.9 3.9 18.0 -4.7 17.2 22.1Camrose-Drumheller 2.1 1.2 16.3 -3.5 14.1 16.1Calgary 7.4 9.3 18.3 1.8 29.4 36.8Banff-Jasper-Rocky Mountain House 6.0 4.4 16.3 -11.5 9.1 15.1Red Deer 6.4 1.6 21.3 8.4 31.3 37.7Edmonton 5.8 5.6 12.7 2.0 20.3 26.1Athabasca-Grande Prairie-Peace
River 9.0 0.8 20.1 -4.6 16.4 25.4Wood Buffalo-Cold Lake 10.5 2.6 34.3 -14.6 22.3 32.8
British Columbia 2.5 8.9 0.9 0.0 9.7 12.3Vancouver Island and Coast -0.6 1.5 5.1 3.1 9.7 12.2Lower Mainland-Southwest 4.0 14.1 0.5 -1.8 12.8 11.1Thompson-Okanagan -1.2 0.9 2.7 7.2 10.8 22.6Kootenay -0.7 0.0 -3.1 0.4 -2.7 8.9Cariboo 4.3 0.9 -5.2 0.2 -4.0 4.7North Coast 6.6 0.7 -6.2 -16.8 -22.3 4.3Nechako 7.4 -0.9 -5.7 -12.9 -19.5 4.4Northeast 8.5 1.6 -11.5 3.2 -6.7 19.2
Yukon Territory 6.9 2.8 -6.2 0.0 -3.5 3.5Northwest Territories 11.2 2.1 -31.4 0.0 -29.4 -18.2Nunavut 20.8 0.1 3.4 0.0 3.6 24.4
56 Statistics Canada – Catalogue no. 91-214

Annual Demographic Estimates: Census Metropolitan Areas, Economic Regions and Census Divisions, Age and Sex
Table 2.3Demographic indicators, age and dependency ratio by economic region, provinces and territories, Canada, July 1
2006Median age Mean age Percentage of
65 yearand over
Dependencyratio inpercent
Newfoundland and Labrador 41.3 40.3 13.5 55Avalon Peninsula 39.9 39.4 12.4 52Notre Dame - Central Bonavista Bay 43.8 42.2 16.3 59South Coast - Burin Peninsula 43.7 41.6 14.1 55West Coast - Northern Peninsula - Labrador 41.2 39.9 13.0 57
Prince Edward Island 39.8 39.5 14.4 64
Nova Scotia 41.0 40.3 14.6 59Annapolis Valley 41.8 40.6 15.3 63Cape Breton 43.3 41.8 16.9 66Halifax 38.2 38.4 11.5 52North Shore 42.6 41.6 16.7 64Southern 43.8 42.6 17.6 63
New Brunswick 40.8 40.2 14.2 57Campbellton - Miramichi 43.4 41.9 15.5 57Edmundston - Woodstock 41.2 40.2 14.3 60Fredericton - Oromocto 38.5 38.9 12.8 56Moncton - Richibucto 40.6 40.4 14.3 55Saint John - St. Stephen 39.8 39.5 13.9 61
Quebec 40.4 39.9 14.1 57Abitibi - Témiscamingue 40.4 39.1 12.9 60Bas-Saint-Laurent 44.3 42.4 16.8 60Capitale-Nationale 42.1 41.4 15.3 54Centre-du-Québec 41.2 40.3 14.8 61Chaudière - Appalaches 41.2 40.2 14.2 59Côte-Nord 40.5 39.0 12.0 56Estrie 41.2 40.4 14.9 60Gaspésie - Îles-de-la-Madeleine 45.5 43.5 17.6 60Lanaudière 40.2 38.8 11.9 58Laurentides 40.2 38.9 12.2 58Laval 39.9 39.3 14.1 61Mauricie 44.6 42.9 17.7 60Montérégie 40.2 39.2 12.7 58Montréal 38.9 40.0 15.2 55Nord-du-Québec 28.7 30.5 5.2 73Outaouais 39.0 38.2 11.1 54Saguenay - Lac-Saint-Jean 42.6 40.7 14.6 58
Ontario 38.2 38.4 12.9 60Hamilton - Niagara Peninsula 39.8 39.5 14.8 64Kingston - Pembroke 41.6 40.8 16.2 64Kitchener - Waterloo - Barrie 37.8 37.8 12.3 62London 38.2 38.5 13.5 62Muskoka - Kawarthas 43.8 42.4 18.6 69Northeast 42.0 40.8 15.8 64Northwest 39.2 38.7 13.5 64Ottawa 38.9 38.8 12.9 58Stratford - Bruce Peninsula 42.0 40.8 17.1 71Toronto 36.7 37.3 11.3 56Windsor - Sarnia 38.6 38.8 13.8 63
Manitoba 37.3 38.1 13.6 67Interlake 41.9 40.2 15.0 69North 26.1 29.3 5.4 85North Central 36.6 37.0 13.1 76Parklands 43.2 42.3 20.3 84South Central 33.8 36.2 13.7 82Southeast 36.8 36.8 12.1 72Southwest 39.9 40.1 17.0 72Winnipeg 37.9 38.7 13.7 61
Statistics Canada – Catalogue no. 91-214 57

Annual Demographic Estimates: Census Metropolitan Areas, Economic Regions and Census Divisions, Age and Sex
Table 2.3 – continued
Demographic indicators, age and dependency ratio by economic region, provinces and territories, Canada, July 12006
Median age Mean age Percentage of65 yearand over
Dependencyratio inpercent
Saskatchewan 37.7 38.5 14.9 72Northern 23.0 27.7 5.0 96Prince Albert 36.7 37.7 15.1 82Regina - Moose Mountain 38.0 38.6 14.2 66Saskatoon - Biggar 36.4 37.7 13.2 65Swift Current - Moose Jaw 42.5 41.6 18.9 76Yorkton - Melville 44.4 43.1 21.9 86
Alberta 35.5 36.4 10.4 57Athabasca - Grande Prairie - Peace River 32.8 34.4 9.5 67Banff - Jasper - Rocky Mountain House 35.1 36.2 9.6 54Calgary 35.6 36.3 9.4 52Camrose - Drumheller 38.2 38.4 14.4 71Edmonton 36.0 37.0 11.0 56Lethbridge - Medicine Hat 35.7 37.2 13.2 68Red Deer 34.7 36.0 10.6 61Wood Buffalo - Cold Lake 31.9 33.1 6.3 57
British Columbia 39.8 39.7 14.0 57Cariboo 38.6 37.8 10.6 57Kootenay 43.8 41.9 16.4 62Lower Mainland - Southwest 38.2 38.7 12.4 54Nechako 36.2 36.0 9.8 64North Coast 37.0 36.6 10.0 63Northeast 33.4 34.2 7.8 59Thompson - Okanagan 43.6 42.3 18.4 67Vancouver Island and Coast 43.5 42.4 17.5 62
Yukon Territory 38.0 36.6 7.5 50Northwest Territories 30.9 31.7 4.8 59Nunavut 23.2 26.1 2.9 89
58 Statistics Canada – Catalogue no. 91-214

Annual Demographic Estimates: Census Metropolitan Areas, Economic Regions and Census Divisions, Age and Sex
Section 3
Census divisions
3.1 The ten census divisionsexperiencing the largestincreases in the past year1
Population estimates as of July 1, 2006 indicate thatthe ten (10) census divisions (CDs) experiencing thelargest increases in population growth are located inAlberta, Quebec and Ontario.
In the case of Alberta, the province attracted manymigrants from other parts of Canada mainly due to theeconomic boom fuelled by investment from soaringenergy exports. For Quebec and Ontario, the stronggrowth in some CDs is mainly due to the phenomenonof urban spread and a robust provincial economy.
Therefore, in the ten (10) CDs registering the strongestpopulation growth, the Alberta CDs increases arelargely due to interprovincial migration. In the case ofCDs from Quebec and Ontario, subprovincial migrationexplains most of the growth. The only exception is theCD of Peel, in Ontario, which instead benefited frominternational migration.
Of the five (5) census divisions that posted the largestincreases for the period 2005-2006, four (4) are locatedin Alberta. Division No. 16, which includes WoodBuffalo and Fort MacKay, experienced the strongestgrowth (47.7 ‰), putting it slightly ahead of DivisionNo. 19 (47.3 ‰), which includes Grande Prairie andPeace River. The Mirabel CD in Quebec ranks thirdwith a growth rate of 43.9 ‰, coming in ahead ofthe other two Alberta CDs, Division No. 8 (Red Deer,Lacombe and Ponoka) and Division No. 6 (Calgary)with respective rates of 37.7 ‰ and 36.8 ‰. (See texttable 3.1)
The other five (5) CDs that experienced thelargest increases are located in Quebec and
1. Each CD may contain many municipalities. The list of municipalitiesenumerated in this text is not exhaustive. They are to be used asgeographic references only.
Ontario. Of these, three (3) are located in Quebec:Les Collines-De-L’Outaouais (which includesVal-Des-Monts, La Pêche, Chelsea and Cantley) with agrowth rate of 36.4 ‰, Jacques-Cartier (Lac-Beauportand Stoneham-et-Tewkesbury) with 35.1 ‰ andVaudreuil-Soulange (Vaudreuil-Dorion, St-Lazare andPincourt) with 32.0 ‰. The other two (2) divisions arelocated in the suburbs of Toronto: Peel (Mississaugaand Brampton) with 35.4 ‰ and York (Markham,Vaughan and Richmond Hill) with 32.3 ‰.
3.2 The five census divisionsexperiencing the largestdecreases in the past year (seefootnote)
Population estimates as of July 1, 2006 indicate that thefive (5) census divisions that experienced the largestdecreases are mainly located in the prairie provincesas well as Newfoundland and Labrador. Once again,one of the factors behind this decrease was the stronggrowth of the Alberta economy, which attracted manyworkers to the province in 2005-2006. Because of theproximity of Saskatchewan and Manitoba to Alberta,the propensity of large numbers of individuals tomigrate to Alberta was greater for those provinces.However, many persons from Newfoundland andLabrador also moved to Alberta in the past year,despite the distance.
The CDs exhibiting the largest decreases included,in Saskatchewan, Division No. 3 (which includesAssiniboia and Gravelbourg) with -27.1 ‰, DivisionNo. 12 (Battleford, Vanscoy, Biggar and Rosetown)with -25.0 ‰ and Division No. 10 (Wynyard, Wadenaand Foam Lake) with -22.3 ‰. In Newfoundland andLabrador, Division No. 3 (Channel-Port aux Basques,Harbour Breton and Burgeo) with -23.0 ‰ and, inManitoba, Division No. 16 (Roblin and Russel) with-30.0 ‰ also registered sizable decreases. (See texttable 3.2)
Statistics Canada – Catalogue no. 91-214 59
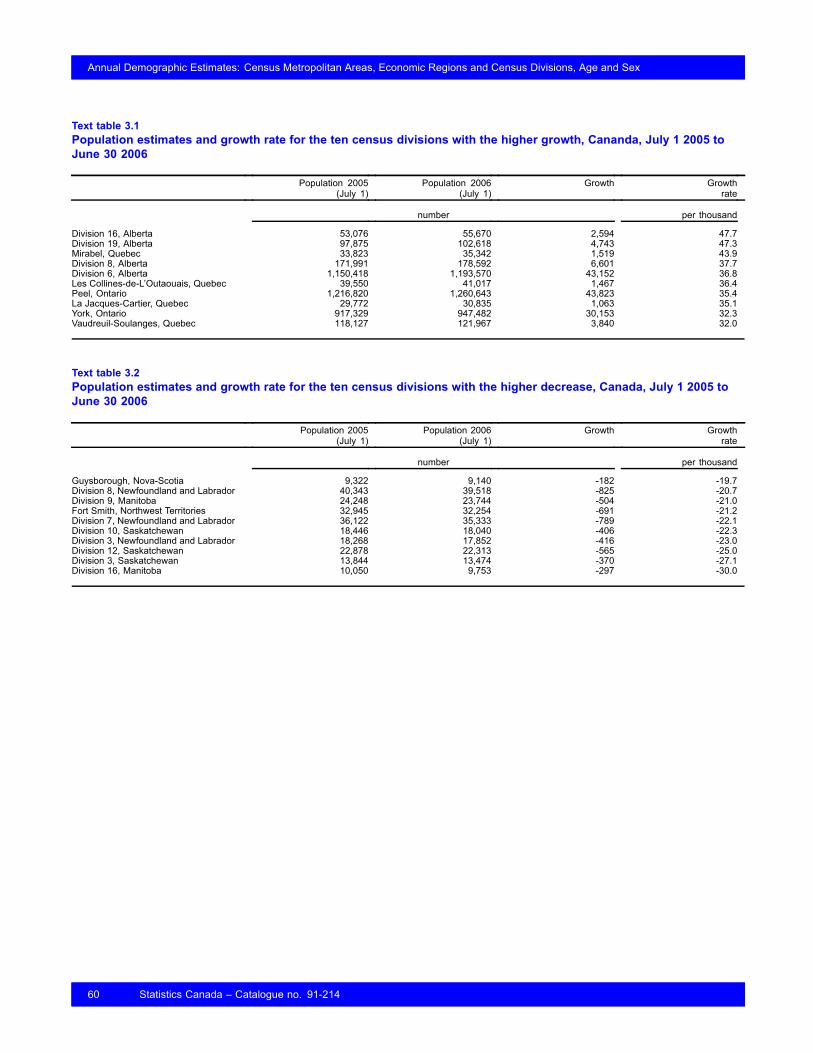
Annual Demographic Estimates: Census Metropolitan Areas, Economic Regions and Census Divisions, Age and Sex
Text table 3.1Population estimates and growth rate for the ten census divisions with the higher growth, Cananda, July 1 2005 toJune 30 2006
Population 2005(July 1)
Population 2006(July 1)
Growth Growthrate
number per thousand
Division 16, Alberta 53,076 55,670 2,594 47.7Division 19, Alberta 97,875 102,618 4,743 47.3Mirabel, Quebec 33,823 35,342 1,519 43.9Division 8, Alberta 171,991 178,592 6,601 37.7Division 6, Alberta 1,150,418 1,193,570 43,152 36.8Les Collines-de-L’Outaouais, Quebec 39,550 41,017 1,467 36.4Peel, Ontario 1,216,820 1,260,643 43,823 35.4La Jacques-Cartier, Quebec 29,772 30,835 1,063 35.1York, Ontario 917,329 947,482 30,153 32.3Vaudreuil-Soulanges, Quebec 118,127 121,967 3,840 32.0
Text table 3.2Population estimates and growth rate for the ten census divisions with the higher decrease, Canada, July 1 2005 toJune 30 2006
Population 2005(July 1)
Population 2006(July 1)
Growth Growthrate
number per thousand
Guysborough, Nova-Scotia 9,322 9,140 -182 -19.7Division 8, Newfoundland and Labrador 40,343 39,518 -825 -20.7Division 9, Manitoba 24,248 23,744 -504 -21.0Fort Smith, Northwest Territories 32,945 32,254 -691 -21.2Division 7, Newfoundland and Labrador 36,122 35,333 -789 -22.1Division 10, Saskatchewan 18,446 18,040 -406 -22.3Division 3, Newfoundland and Labrador 18,268 17,852 -416 -23.0Division 12, Saskatchewan 22,878 22,313 -565 -25.0Division 3, Saskatchewan 13,844 13,474 -370 -27.1Division 16, Manitoba 10,050 9,753 -297 -30.0
60 Statistics Canada – Catalogue no. 91-214

Annual Demographic Estimates: Census Metropolitan Areas, Economic Regions and Census Divisions, Age and Sex
Table 3.1-1Newfoundland and Labrador census division, Canada — Annual population estimates at July 1
2001 2002 2003 2004 2005 2006
Newfoundland and Labrador 521,986 519,449 518,428 517,209 513,962 509,677Division 1 247,263 248,036 249,094 250,776 250,588 249,929Division 2 24,789 24,264 23,874 23,449 23,090 22,676Division 3 19,687 19,244 18,995 18,634 18,268 17,852Division 4 22,539 22,412 22,178 21,953 21,608 21,206Division 5 41,155 40,925 40,938 41,006 41,154 41,301Division 6 36,838 36,856 36,986 36,867 36,582 36,202Division 7 37,979 37,550 37,269 36,813 36,122 35,333Division 8 42,899 42,194 41,802 41,081 40,343 39,518Division 9 20,439 19,989 19,595 19,194 18,871 18,516Division 10 28,398 27,979 27,697 27,436 27,336 27,144
Table 3.1-2Newfoundland and Labrador census division, Canada — Population rate of growth from July to June
2001/2002 2002/2003 2003/2004 2004/2005 2005/2006
rate per thousand
Newfoundland and Labrador -4.9 -2.0 -2.4 -6.3 -8.4Division 1 3.1 4.3 6.7 -0.7 -2.6Division 2 -21.4 -16.2 -18.0 -15.4 -18.1Division 3 -22.8 -13.0 -19.2 -19.8 -23.0Division 4 -5.7 -10.5 -10.2 -15.8 -18.8Division 5 -5.6 0.3 1.7 3.6 3.6Division 6 0.5 3.5 -3.2 -7.8 -10.4Division 7 -11.4 -7.5 -12.3 -18.9 -22.1Division 8 -16.6 -9.3 -17.4 -18.1 -20.7Division 9 -22.3 -19.9 -20.7 -17.0 -19.0Division 10 -14.9 -10.1 -9.5 -3.7 -7.0
Table 3.1-3Newfoundland and Labrador census division, Canada — Population estimates and factors of growth from July to June
2005/2006Population 2006(July 1) Natural
increaseNet
internationalmigration
Netinterprovincial
migration
Netintraprovincial
migration
Totalnet
migration
Totalgrowth
Newfoundland and Labrador 509,677 -126 209 -4,368 0 -4,159 -4,285Division 1 249,929 96 207 -1,639 677 -755 -659Division 2 22,676 -19 3 -275 -123 -395 -414Division 3 17,852 -23 -3 -248 -142 -393 -416Division 4 21,206 -27 19 -280 -114 -375 -402Division 5 41,301 -18 13 -28 180 165 147Division 6 36,202 -13 -7 -482 122 -367 -380Division 7 35,333 -142 -2 -461 -184 -647 -789Division 8 39,518 -123 -10 -471 -221 -702 -825Division 9 18,516 -25 6 -166 -170 -330 -355Division 10 27,144 168 -17 -318 -25 -360 -192
Note(s): With the exception of Quebec and British Columbia, preliminary estimates for July 1, 2006 are produced using the component method. The populationestimates for both these provinces were created by their respective agencies. As a result, the sum of components does not equal the populationgrowth for 2005/2006.
Statistics Canada – Catalogue no. 91-214 61

Annual Demographic Estimates: Census Metropolitan Areas, Economic Regions and Census Divisions, Age and Sex
Table 3.1-4Newfoundland and Labrador census division, Canada — Factors of growth (rate) from July to June
2005/2006Naturalincrease
Netinternationalmigration
Netinterprovincial
migration
Netintraprovincial
migration
Totalnet
migration
rate per thousand
Newfoundland and Labrador -0.2 0.4 -8.5 0.0 -8.1Division 1 0.4 0.8 -6.5 2.7 -3.0Division 2 -0.8 0.1 -12.0 -5.4 -17.3Division 3 -1.3 -0.2 -13.7 -7.9 -21.8Division 4 -1.3 0.9 -13.1 -5.3 -17.5Division 5 -0.4 0.3 -0.7 4.4 4.0Division 6 -0.4 -0.2 -13.2 3.4 -10.1Division 7 -4.0 -0.1 -12.9 -5.2 -18.1Division 8 -3.1 -0.3 -11.8 -5.5 -17.6Division 9 -1.3 0.3 -8.9 -9.1 -17.7Division 10 6.2 -0.6 -11.7 -0.9 -13.2
Table 3.2-1Prince Edward Island census division — Annual population estimates at July 1
2001 2002 2003 2004 2005 2006
Prince Edward Island 136,672 136,934 137,325 137,876 138,176 138,519Kings 19,370 19,236 19,155 19,064 19,026 18,998Prince 44,942 45,027 45,123 45,252 45,218 45,194Queens 72,360 72,671 73,047 73,560 73,932 74,327
Table 3.2-2Prince Edward Island census division — Population rate of growth from July to June
2001/2002 2002/2003 2003/2004 2004/2005 2005/2006
rate per thousands
Prince Edward Island 1.9 2.9 4.0 2.2 2.5Kings -6.9 -4.2 -4.8 -2.0 -1.5Prince 1.9 2.1 2.9 -0.8 -0.5Queens 4.3 5.2 7.0 5.0 5.3
Table 3.2-3Prince Edward Island census division — Population estimates and factors of growth from July to June
2005/2006Population 2006(July 1) Natural
increaseNet
internationalmigration
Netinterprovincial
migration
Netintraprovincial
migration
Totalnet
migration
Totalgrowth
Prince Edward Island 138,519 162 308 -127 0 181 343Kings 18,998 -23 22 15 -42 -5 -28Prince 45,194 87 64 -30 -145 -111 -24Queens 74,327 98 222 -112 187 297 395
Note(s): With the exception of Quebec and British Columbia, preliminary estimates for July 1, 2006 are produced using the component method. The populationestimates for both these provinces were created by their respective agencies. As a result, the sum of components does not equal the populationgrowth for 2005/2006.
62 Statistics Canada – Catalogue no. 91-214

Annual Demographic Estimates: Census Metropolitan Areas, Economic Regions and Census Divisions, Age and Sex
Table 3.2-4Prince Edward Island census division — Factors of growth from July to June
2005/2006Naturalgrowth
Netinternationalmigration
Netinterprovincial
migration
Netintraprovincial
migration
Totalnet
migration
rate per thousands
Prince Edward Island 1.2 2.2 -0.9 0.0 1.3Kings -1.2 1.2 0.8 -2.2 -0.3Prince 1.9 1.4 -0.7 -3.2 -2.5Queens 1.3 3.0 -1.5 2.5 4.0
Table 3.3-1Nova Scotia census division — Annual population estimates at July 1
2001 2002 2003 2004 2005 2006
Nova Scotia 932,389 934,507 936,513 937,993 936,130 934,405Annapolis 22,342 22,160 22,019 21,869 21,801 21,737Antigonish 20,101 20,059 19,981 20,028 20,078 20,136Cape Breton 112,157 111,017 110,385 110,318 108,885 107,367Colchester 50,619 50,885 51,192 51,368 51,290 51,178Cumberland 33,440 33,266 33,055 32,939 32,889 32,815Digby 20,067 19,873 19,828 19,615 19,432 19,247Guysborough 10,079 9,839 9,682 9,497 9,322 9,140Halifax 369,085 373,817 377,066 379,384 380,583 382,203Hants 41,622 41,684 41,814 42,028 42,033 41,999Inverness 20,462 20,316 20,141 20,017 19,759 19,490Kings 60,425 60,442 60,657 60,786 60,835 60,853Lunenburg 48,865 48,791 48,797 48,771 48,736 48,688Pictou 48,205 47,806 47,680 47,540 47,277 46,988Queens 12,038 11,977 11,894 11,900 11,832 11,765Richmond 10,490 10,286 10,140 10,032 9,948 9,859Shelburne 16,661 16,584 16,462 16,305 16,126 15,940Victoria 8,171 8,153 8,142 8,053 8,001 7,941Yarmouth 27,560 27,552 27,578 27,543 27,303 27,059
Table 3.3-2Nova Scotia census division — Population rate of growth from July to June
2001/2002 2002/2003 2003/2004 2004/2005 2005/2006
rate per thousand
Nova Scotia 2.3 2.1 1.6 -2.0 -1.8Annapolis -8.2 -6.4 -6.8 -3.1 -2.9Antigonish -2.1 -3.9 2.3 2.5 2.9Cape Breton -10.2 -5.7 -0.6 -13.1 -14.0Colchester 5.2 6.0 3.4 -1.5 -2.2Cumberland -5.2 -6.4 -3.5 -1.5 -2.3Digby -9.7 -2.3 -10.8 -9.4 -9.6Guysborough -24.1 -16.1 -19.3 -18.6 -19.7Halifax 12.7 8.7 6.1 3.2 4.2Hants 1.5 3.1 5.1 0.1 -0.8Inverness -7.2 -8.7 -6.2 -13.0 -13.7Kings 0.3 3.6 2.1 0.8 0.3Lunenburg -1.5 0.1 -0.5 -0.7 -1.0Pictou -8.3 -2.6 -2.9 -5.5 -6.1Queens -5.1 -7.0 0.5 -5.7 -5.7Richmond -19.6 -14.3 -10.7 -8.4 -9.0Shelburne -4.6 -7.4 -9.6 -11.0 -11.6Victoria -2.2 -1.4 -11.0 -6.5 -7.5Yarmouth -0.3 0.9 -1.3 -8.8 -9.0
Statistics Canada – Catalogue no. 91-214 63

Annual Demographic Estimates: Census Metropolitan Areas, Economic Regions and Census Divisions, Age and Sex
Table 3.3-3Nova Scotia census division — Population estimates and factors of growth from July to June
2005/2006Population 2006(July 1) Natural
increaseNet
internationalmigration
Netinterprovincial
migration
Netintraprovincial
migration
Totalnet
migration
Totalgrowth
Nova Scotia 934,405 171 2,034 -3,930 0 -1,896 -1,725Annapolis 21,737 -144 15 89 -24 80 -64Antigonish 20,136 26 42 -68 58 32 58Cape Breton 107,367 -284 21 -513 -742 -1,234 -1,518Colchester 51,178 -52 6 -266 200 -60 -112Cumberland 32,815 -74 -7 -39 46 0 -74Digby 19,247 -158 20 -3 -44 -27 -185Guysborough 9,140 -48 3 -18 -119 -134 -182Halifax 382,203 1,294 1,734 -2,055 647 326 1,620Hants 41,999 61 12 -248 141 -95 -34Inverness 19,490 -30 20 -108 -151 -239 -269Kings 60,853 39 46 -159 92 -21 18Lunenburg 48,688 -162 62 -94 146 114 -48Pictou 46,988 -90 14 -226 13 -199 -289Queens 11,765 -51 11 -28 1 -16 -67Richmond 9,859 -19 5 -17 -58 -70 -89Shelburne 15,940 -56 19 -69 -80 -130 -186Victoria 7,941 -33 -1 -39 13 -27 -60Yarmouth 27,059 -48 12 -69 -139 -196 -244
Note(s): With the exception of Quebec and British Columbia, preliminary estimates for July 1, 2006 are produced using the component method. The populationestimates for both these provinces were created by their respective agencies. As a result, the sum of components does not equal the populationgrowth for 2005/2006.
Table 3.3-4Nova Scotia census division — Factors of growth from July to June
2005/2006Naturalgrowth
Netinternationalmigration
Netinterprovincial
migration
Netintraprovincial
migration
Totalnet
migration
rate per thousand
Nova Scotia 0.2 2.2 -4.2 0.0 -2.0Annapolis -6.6 0.7 4.1 -1.1 3.7Antigonish 1.3 2.1 -3.4 2.9 1.6Cape Breton -2.6 0.2 -4.7 -6.9 -11.4Colchester -1.0 0.1 -5.2 3.9 -1.2Cumberland -2.3 -0.2 -1.2 1.4 0.0Digby -8.2 1.0 -0.2 -2.3 -1.4Guysborough -5.2 0.3 -1.9 -12.9 -14.5Halifax 3.4 4.5 -5.4 1.7 0.9Hants 1.5 0.3 -5.9 3.4 -2.3Inverness -1.5 1.0 -5.5 -7.7 -12.2Kings 0.6 0.8 -2.6 1.5 -0.3Lunenburg -3.3 1.3 -1.9 3.0 2.3Pictou -1.9 0.3 -4.8 0.3 -4.2Queens -4.3 0.9 -2.4 0.1 -1.4Richmond -1.9 0.5 -1.7 -5.9 -7.1Shelburne -3.5 1.2 -4.3 -5.0 -8.1Victoria -4.1 -0.1 -4.9 1.6 -3.4Yarmouth -1.8 0.4 -2.5 -5.1 -7.2
64 Statistics Canada – Catalogue no. 91-214
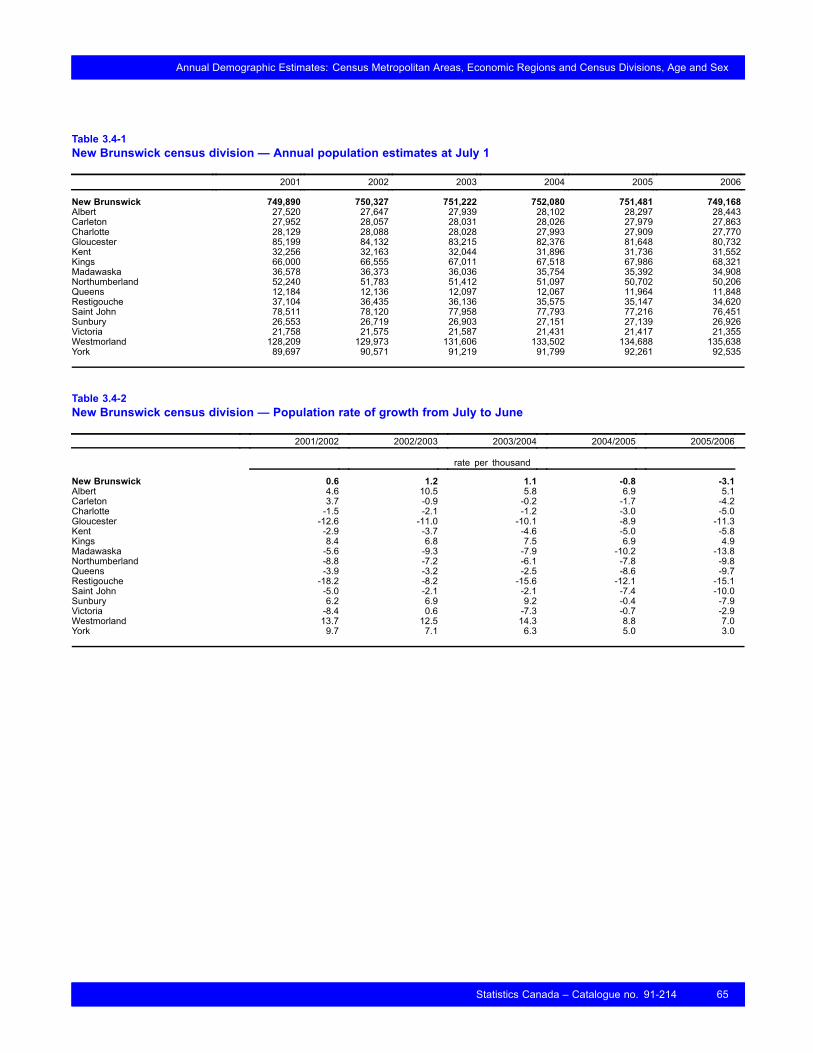
Annual Demographic Estimates: Census Metropolitan Areas, Economic Regions and Census Divisions, Age and Sex
Table 3.4-1New Brunswick census division — Annual population estimates at July 1
2001 2002 2003 2004 2005 2006
New Brunswick 749,890 750,327 751,222 752,080 751,481 749,168Albert 27,520 27,647 27,939 28,102 28,297 28,443Carleton 27,952 28,057 28,031 28,026 27,979 27,863Charlotte 28,129 28,088 28,028 27,993 27,909 27,770Gloucester 85,199 84,132 83,215 82,376 81,648 80,732Kent 32,256 32,163 32,044 31,896 31,736 31,552Kings 66,000 66,555 67,011 67,518 67,986 68,321Madawaska 36,578 36,373 36,036 35,754 35,392 34,908Northumberland 52,240 51,783 51,412 51,097 50,702 50,206Queens 12,184 12,136 12,097 12,067 11,964 11,848Restigouche 37,104 36,435 36,136 35,575 35,147 34,620Saint John 78,511 78,120 77,958 77,793 77,216 76,451Sunbury 26,553 26,719 26,903 27,151 27,139 26,926Victoria 21,758 21,575 21,587 21,431 21,417 21,355Westmorland 128,209 129,973 131,606 133,502 134,688 135,638York 89,697 90,571 91,219 91,799 92,261 92,535
Table 3.4-2New Brunswick census division — Population rate of growth from July to June
2001/2002 2002/2003 2003/2004 2004/2005 2005/2006
rate per thousand
New Brunswick 0.6 1.2 1.1 -0.8 -3.1Albert 4.6 10.5 5.8 6.9 5.1Carleton 3.7 -0.9 -0.2 -1.7 -4.2Charlotte -1.5 -2.1 -1.2 -3.0 -5.0Gloucester -12.6 -11.0 -10.1 -8.9 -11.3Kent -2.9 -3.7 -4.6 -5.0 -5.8Kings 8.4 6.8 7.5 6.9 4.9Madawaska -5.6 -9.3 -7.9 -10.2 -13.8Northumberland -8.8 -7.2 -6.1 -7.8 -9.8Queens -3.9 -3.2 -2.5 -8.6 -9.7Restigouche -18.2 -8.2 -15.6 -12.1 -15.1Saint John -5.0 -2.1 -2.1 -7.4 -10.0Sunbury 6.2 6.9 9.2 -0.4 -7.9Victoria -8.4 0.6 -7.3 -0.7 -2.9Westmorland 13.7 12.5 14.3 8.8 7.0York 9.7 7.1 6.3 5.0 3.0
Statistics Canada – Catalogue no. 91-214 65
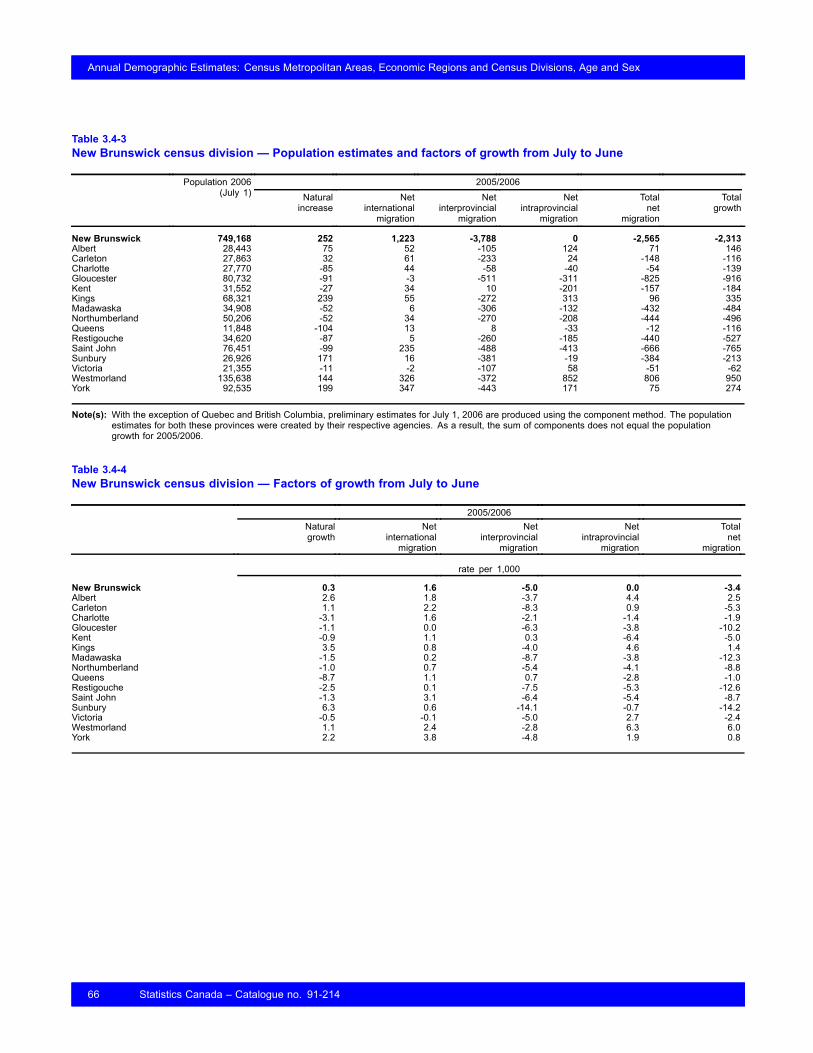
Annual Demographic Estimates: Census Metropolitan Areas, Economic Regions and Census Divisions, Age and Sex
Table 3.4-3New Brunswick census division — Population estimates and factors of growth from July to June
2005/2006Population 2006(July 1) Natural
increaseNet
internationalmigration
Netinterprovincial
migration
Netintraprovincial
migration
Totalnet
migration
Totalgrowth
New Brunswick 749,168 252 1,223 -3,788 0 -2,565 -2,313Albert 28,443 75 52 -105 124 71 146Carleton 27,863 32 61 -233 24 -148 -116Charlotte 27,770 -85 44 -58 -40 -54 -139Gloucester 80,732 -91 -3 -511 -311 -825 -916Kent 31,552 -27 34 10 -201 -157 -184Kings 68,321 239 55 -272 313 96 335Madawaska 34,908 -52 6 -306 -132 -432 -484Northumberland 50,206 -52 34 -270 -208 -444 -496Queens 11,848 -104 13 8 -33 -12 -116Restigouche 34,620 -87 5 -260 -185 -440 -527Saint John 76,451 -99 235 -488 -413 -666 -765Sunbury 26,926 171 16 -381 -19 -384 -213Victoria 21,355 -11 -2 -107 58 -51 -62Westmorland 135,638 144 326 -372 852 806 950York 92,535 199 347 -443 171 75 274
Note(s): With the exception of Quebec and British Columbia, preliminary estimates for July 1, 2006 are produced using the component method. The populationestimates for both these provinces were created by their respective agencies. As a result, the sum of components does not equal the populationgrowth for 2005/2006.
Table 3.4-4New Brunswick census division — Factors of growth from July to June
2005/2006Naturalgrowth
Netinternationalmigration
Netinterprovincial
migration
Netintraprovincial
migration
Totalnet
migration
rate per 1,000
New Brunswick 0.3 1.6 -5.0 0.0 -3.4Albert 2.6 1.8 -3.7 4.4 2.5Carleton 1.1 2.2 -8.3 0.9 -5.3Charlotte -3.1 1.6 -2.1 -1.4 -1.9Gloucester -1.1 0.0 -6.3 -3.8 -10.2Kent -0.9 1.1 0.3 -6.4 -5.0Kings 3.5 0.8 -4.0 4.6 1.4Madawaska -1.5 0.2 -8.7 -3.8 -12.3Northumberland -1.0 0.7 -5.4 -4.1 -8.8Queens -8.7 1.1 0.7 -2.8 -1.0Restigouche -2.5 0.1 -7.5 -5.3 -12.6Saint John -1.3 3.1 -6.4 -5.4 -8.7Sunbury 6.3 0.6 -14.1 -0.7 -14.2Victoria -0.5 -0.1 -5.0 2.7 -2.4Westmorland 1.1 2.4 -2.8 6.3 6.0York 2.2 3.8 -4.8 1.9 0.8
66 Statistics Canada – Catalogue no. 91-214
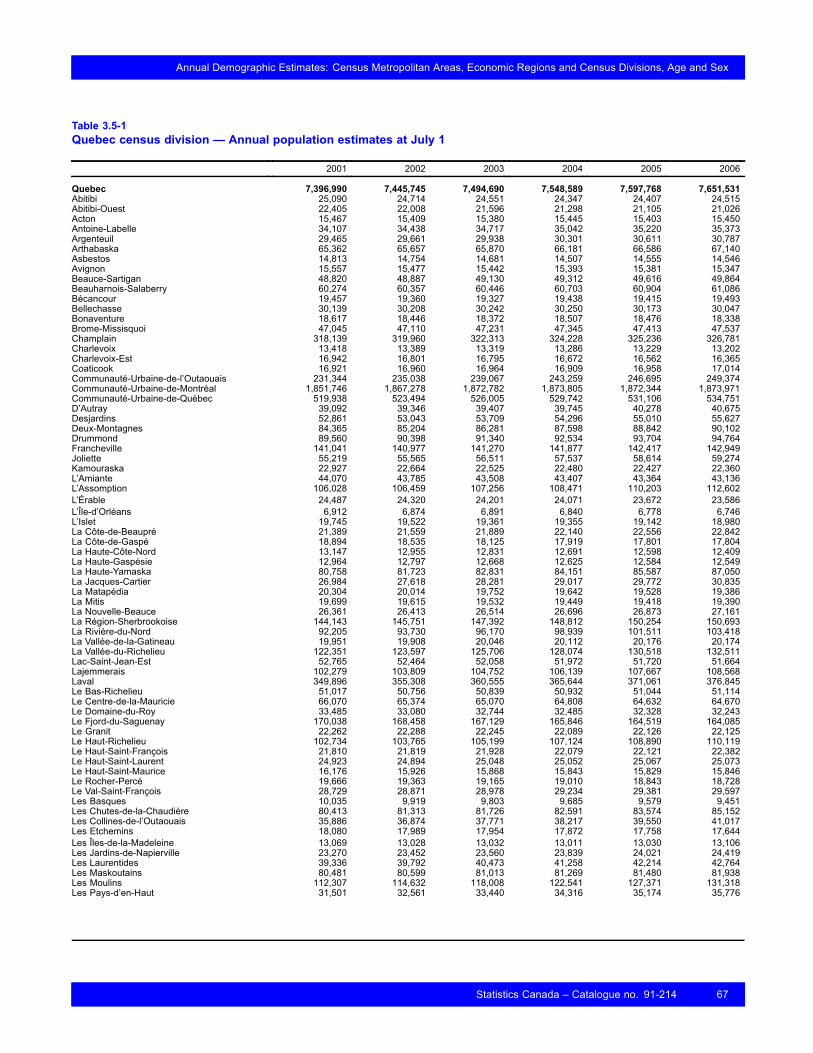
Annual Demographic Estimates: Census Metropolitan Areas, Economic Regions and Census Divisions, Age and Sex
Table 3.5-1Quebec census division — Annual population estimates at July 1
2001 2002 2003 2004 2005 2006
Quebec 7,396,990 7,445,745 7,494,690 7,548,589 7,597,768 7,651,531Abitibi 25,090 24,714 24,551 24,347 24,407 24,515Abitibi-Ouest 22,405 22,008 21,596 21,298 21,105 21,026Acton 15,467 15,409 15,380 15,445 15,403 15,450Antoine-Labelle 34,107 34,438 34,717 35,042 35,220 35,373Argenteuil 29,465 29,661 29,938 30,301 30,611 30,787Arthabaska 65,362 65,657 65,870 66,181 66,586 67,140Asbestos 14,813 14,754 14,681 14,507 14,555 14,546Avignon 15,557 15,477 15,442 15,393 15,381 15,347Beauce-Sartigan 48,820 48,887 49,130 49,312 49,616 49,864Beauharnois-Salaberry 60,274 60,357 60,446 60,703 60,904 61,086Bécancour 19,457 19,360 19,327 19,438 19,415 19,493Bellechasse 30,139 30,208 30,242 30,250 30,173 30,047Bonaventure 18,617 18,446 18,372 18,507 18,476 18,338Brome-Missisquoi 47,045 47,110 47,231 47,345 47,413 47,537Champlain 318,139 319,960 322,313 324,228 325,236 326,781Charlevoix 13,418 13,389 13,319 13,286 13,229 13,202Charlevoix-Est 16,942 16,801 16,795 16,672 16,562 16,365Coaticook 16,921 16,960 16,964 16,909 16,958 17,014Communauté-Urbaine-de-l’Outaouais 231,344 235,038 239,067 243,259 246,695 249,374Communauté-Urbaine-de-Montréal 1,851,746 1,867,278 1,872,782 1,873,805 1,872,344 1,873,971Communauté-Urbaine-de-Québec 519,938 523,494 526,005 529,742 531,106 534,751D’Autray 39,092 39,346 39,407 39,745 40,278 40,675Desjardins 52,861 53,043 53,709 54,296 55,010 55,627Deux-Montagnes 84,365 85,204 86,281 87,598 88,842 90,102Drummond 89,560 90,398 91,340 92,534 93,704 94,764Francheville 141,041 140,977 141,270 141,877 142,417 142,949Joliette 55,219 55,565 56,511 57,537 58,614 59,274Kamouraska 22,927 22,664 22,525 22,480 22,427 22,360L’Amiante 44,070 43,785 43,508 43,407 43,364 43,136L’Assomption 106,028 106,459 107,256 108,471 110,203 112,602L’Érable 24,487 24,320 24,201 24,071 23,672 23,586L’Île-d’Orléans 6,912 6,874 6,891 6,840 6,778 6,746L’Islet 19,745 19,522 19,361 19,355 19,142 18,980La Côte-de-Beaupré 21,389 21,559 21,889 22,140 22,556 22,842La Côte-de-Gaspé 18,894 18,535 18,125 17,919 17,801 17,804La Haute-Côte-Nord 13,147 12,955 12,831 12,691 12,598 12,409La Haute-Gaspésie 12,964 12,797 12,668 12,625 12,584 12,549La Haute-Yamaska 80,758 81,723 82,831 84,151 85,587 87,050La Jacques-Cartier 26,984 27,618 28,281 29,017 29,772 30,835La Matapédia 20,304 20,014 19,752 19,642 19,528 19,386La Mitis 19,699 19,615 19,532 19,449 19,418 19,390La Nouvelle-Beauce 26,361 26,413 26,514 26,696 26,873 27,161La Région-Sherbrookoise 144,143 145,751 147,392 148,812 150,254 150,693La Rivière-du-Nord 92,205 93,730 96,170 98,939 101,511 103,418La Vallée-de-la-Gatineau 19,951 19,908 20,046 20,112 20,176 20,174La Vallée-du-Richelieu 122,351 123,597 125,706 128,074 130,518 132,511Lac-Saint-Jean-Est 52,765 52,464 52,058 51,972 51,720 51,664Lajemmerais 102,279 103,809 104,752 106,139 107,667 108,568Laval 349,896 355,308 360,555 365,644 371,061 376,845Le Bas-Richelieu 51,017 50,756 50,839 50,932 51,044 51,114Le Centre-de-la-Mauricie 66,070 65,374 65,070 64,808 64,632 64,670Le Domaine-du-Roy 33,485 33,080 32,744 32,485 32,328 32,243Le Fjord-du-Saguenay 170,038 168,458 167,129 165,846 164,519 164,085Le Granit 22,262 22,288 22,245 22,089 22,126 22,125Le Haut-Richelieu 102,734 103,765 105,199 107,124 108,890 110,119Le Haut-Saint-François 21,810 21,819 21,928 22,079 22,121 22,382Le Haut-Saint-Laurent 24,923 24,894 25,048 25,052 25,067 25,073Le Haut-Saint-Maurice 16,176 15,926 15,868 15,843 15,829 15,846Le Rocher-Percé 19,666 19,363 19,165 19,010 18,843 18,728Le Val-Saint-François 28,729 28,871 28,978 29,234 29,381 29,597Les Basques 10,035 9,919 9,803 9,685 9,579 9,451Les Chutes-de-la-Chaudière 80,413 81,313 81,726 82,591 83,574 85,152Les Collines-de-l’Outaouais 35,886 36,874 37,771 38,217 39,550 41,017Les Etchemins 18,080 17,989 17,954 17,872 17,758 17,644Les Îles-de-la-Madeleine 13,069 13,028 13,032 13,011 13,030 13,106Les Jardins-de-Napierville 23,270 23,452 23,560 23,839 24,021 24,419Les Laurentides 39,336 39,792 40,473 41,258 42,214 42,764Les Maskoutains 80,481 80,599 81,013 81,269 81,480 81,938Les Moulins 112,307 114,632 118,008 122,541 127,371 131,318Les Pays-d’en-Haut 31,501 32,561 33,440 34,316 35,174 35,776
Statistics Canada – Catalogue no. 91-214 67
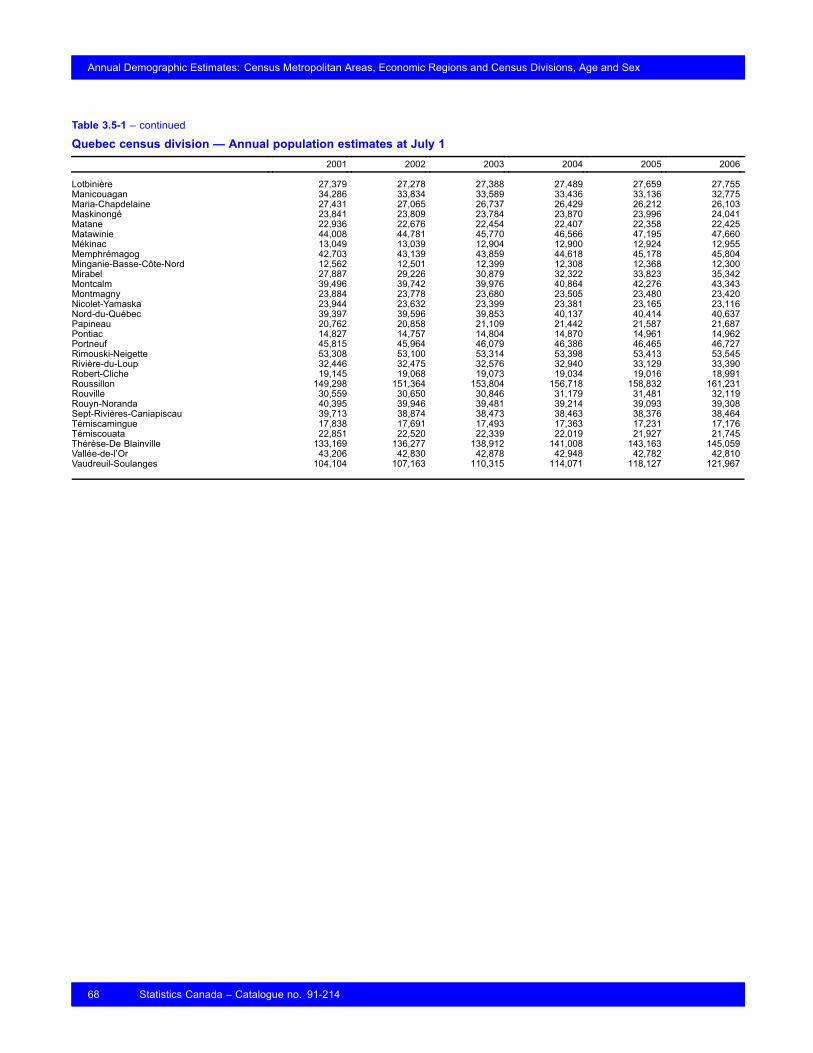
Annual Demographic Estimates: Census Metropolitan Areas, Economic Regions and Census Divisions, Age and Sex
Table 3.5-1 – continued
Quebec census division — Annual population estimates at July 12001 2002 2003 2004 2005 2006
Lotbinière 27,379 27,278 27,388 27,489 27,659 27,755Manicouagan 34,286 33,834 33,589 33,436 33,136 32,775Maria-Chapdelaine 27,431 27,065 26,737 26,429 26,212 26,103Maskinongé 23,841 23,809 23,784 23,870 23,996 24,041Matane 22,936 22,676 22,454 22,407 22,358 22,425Matawinie 44,008 44,781 45,770 46,566 47,195 47,660Mékinac 13,049 13,039 12,904 12,900 12,924 12,955Memphrémagog 42,703 43,139 43,859 44,618 45,178 45,804Minganie-Basse-Côte-Nord 12,562 12,501 12,399 12,308 12,368 12,300Mirabel 27,887 29,226 30,879 32,322 33,823 35,342Montcalm 39,496 39,742 39,976 40,864 42,276 43,343Montmagny 23,884 23,778 23,680 23,505 23,480 23,420Nicolet-Yamaska 23,944 23,632 23,399 23,381 23,165 23,116Nord-du-Québec 39,397 39,596 39,853 40,137 40,414 40,637Papineau 20,762 20,858 21,109 21,442 21,587 21,687Pontiac 14,827 14,757 14,804 14,870 14,961 14,962Portneuf 45,815 45,964 46,079 46,386 46,465 46,727Rimouski-Neigette 53,308 53,100 53,314 53,398 53,413 53,545Rivière-du-Loup 32,446 32,475 32,576 32,940 33,129 33,390Robert-Cliche 19,145 19,068 19,073 19,034 19,016 18,991Roussillon 149,298 151,364 153,804 156,718 158,832 161,231Rouville 30,559 30,650 30,846 31,179 31,481 32,119Rouyn-Noranda 40,395 39,946 39,481 39,214 39,093 39,308Sept-Rivières-Caniapiscau 39,713 38,874 38,473 38,463 38,376 38,464Témiscamingue 17,838 17,691 17,493 17,363 17,231 17,176Témiscouata 22,851 22,520 22,339 22,019 21,927 21,745Thérèse-De Blainville 133,169 136,277 138,912 141,008 143,163 145,059Vallée-de-l’Or 43,206 42,830 42,878 42,948 42,782 42,810Vaudreuil-Soulanges 104,104 107,163 110,315 114,071 118,127 121,967
68 Statistics Canada – Catalogue no. 91-214
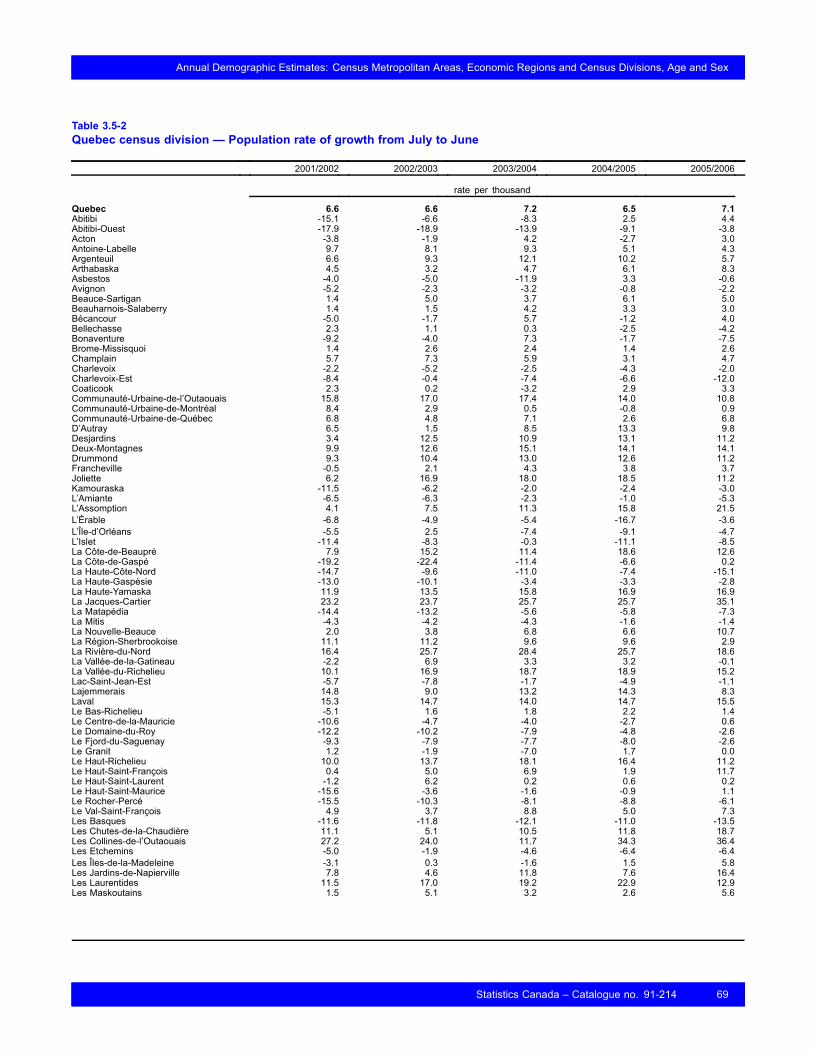
Annual Demographic Estimates: Census Metropolitan Areas, Economic Regions and Census Divisions, Age and Sex
Table 3.5-2Quebec census division — Population rate of growth from July to June
2001/2002 2002/2003 2003/2004 2004/2005 2005/2006
rate per thousand
Quebec 6.6 6.6 7.2 6.5 7.1Abitibi -15.1 -6.6 -8.3 2.5 4.4Abitibi-Ouest -17.9 -18.9 -13.9 -9.1 -3.8Acton -3.8 -1.9 4.2 -2.7 3.0Antoine-Labelle 9.7 8.1 9.3 5.1 4.3Argenteuil 6.6 9.3 12.1 10.2 5.7Arthabaska 4.5 3.2 4.7 6.1 8.3Asbestos -4.0 -5.0 -11.9 3.3 -0.6Avignon -5.2 -2.3 -3.2 -0.8 -2.2Beauce-Sartigan 1.4 5.0 3.7 6.1 5.0Beauharnois-Salaberry 1.4 1.5 4.2 3.3 3.0Bécancour -5.0 -1.7 5.7 -1.2 4.0Bellechasse 2.3 1.1 0.3 -2.5 -4.2Bonaventure -9.2 -4.0 7.3 -1.7 -7.5Brome-Missisquoi 1.4 2.6 2.4 1.4 2.6Champlain 5.7 7.3 5.9 3.1 4.7Charlevoix -2.2 -5.2 -2.5 -4.3 -2.0Charlevoix-Est -8.4 -0.4 -7.4 -6.6 -12.0Coaticook 2.3 0.2 -3.2 2.9 3.3Communauté-Urbaine-de-l’Outaouais 15.8 17.0 17.4 14.0 10.8Communauté-Urbaine-de-Montréal 8.4 2.9 0.5 -0.8 0.9Communauté-Urbaine-de-Québec 6.8 4.8 7.1 2.6 6.8D’Autray 6.5 1.5 8.5 13.3 9.8Desjardins 3.4 12.5 10.9 13.1 11.2Deux-Montagnes 9.9 12.6 15.1 14.1 14.1Drummond 9.3 10.4 13.0 12.6 11.2Francheville -0.5 2.1 4.3 3.8 3.7Joliette 6.2 16.9 18.0 18.5 11.2Kamouraska -11.5 -6.2 -2.0 -2.4 -3.0L’Amiante -6.5 -6.3 -2.3 -1.0 -5.3L’Assomption 4.1 7.5 11.3 15.8 21.5L’Érable -6.8 -4.9 -5.4 -16.7 -3.6L’Île-d’Orléans -5.5 2.5 -7.4 -9.1 -4.7L’Islet -11.4 -8.3 -0.3 -11.1 -8.5La Côte-de-Beaupré 7.9 15.2 11.4 18.6 12.6La Côte-de-Gaspé -19.2 -22.4 -11.4 -6.6 0.2La Haute-Côte-Nord -14.7 -9.6 -11.0 -7.4 -15.1La Haute-Gaspésie -13.0 -10.1 -3.4 -3.3 -2.8La Haute-Yamaska 11.9 13.5 15.8 16.9 16.9La Jacques-Cartier 23.2 23.7 25.7 25.7 35.1La Matapédia -14.4 -13.2 -5.6 -5.8 -7.3La Mitis -4.3 -4.2 -4.3 -1.6 -1.4La Nouvelle-Beauce 2.0 3.8 6.8 6.6 10.7La Région-Sherbrookoise 11.1 11.2 9.6 9.6 2.9La Rivière-du-Nord 16.4 25.7 28.4 25.7 18.6La Vallée-de-la-Gatineau -2.2 6.9 3.3 3.2 -0.1La Vallée-du-Richelieu 10.1 16.9 18.7 18.9 15.2Lac-Saint-Jean-Est -5.7 -7.8 -1.7 -4.9 -1.1Lajemmerais 14.8 9.0 13.2 14.3 8.3Laval 15.3 14.7 14.0 14.7 15.5Le Bas-Richelieu -5.1 1.6 1.8 2.2 1.4Le Centre-de-la-Mauricie -10.6 -4.7 -4.0 -2.7 0.6Le Domaine-du-Roy -12.2 -10.2 -7.9 -4.8 -2.6Le Fjord-du-Saguenay -9.3 -7.9 -7.7 -8.0 -2.6Le Granit 1.2 -1.9 -7.0 1.7 0.0Le Haut-Richelieu 10.0 13.7 18.1 16.4 11.2Le Haut-Saint-François 0.4 5.0 6.9 1.9 11.7Le Haut-Saint-Laurent -1.2 6.2 0.2 0.6 0.2Le Haut-Saint-Maurice -15.6 -3.6 -1.6 -0.9 1.1Le Rocher-Percé -15.5 -10.3 -8.1 -8.8 -6.1Le Val-Saint-François 4.9 3.7 8.8 5.0 7.3Les Basques -11.6 -11.8 -12.1 -11.0 -13.5Les Chutes-de-la-Chaudière 11.1 5.1 10.5 11.8 18.7Les Collines-de-l’Outaouais 27.2 24.0 11.7 34.3 36.4Les Etchemins -5.0 -1.9 -4.6 -6.4 -6.4Les Îles-de-la-Madeleine -3.1 0.3 -1.6 1.5 5.8Les Jardins-de-Napierville 7.8 4.6 11.8 7.6 16.4Les Laurentides 11.5 17.0 19.2 22.9 12.9Les Maskoutains 1.5 5.1 3.2 2.6 5.6
Statistics Canada – Catalogue no. 91-214 69

Annual Demographic Estimates: Census Metropolitan Areas, Economic Regions and Census Divisions, Age and Sex
Table 3.5-2 – continued
Quebec census division — Population rate of growth from July to June2001/2002 2002/2003 2003/2004 2004/2005 2005/2006
rate per thousand
Les Moulins 20.5 29.0 37.7 38.7 30.5Les Pays-d’en-Haut 33.1 26.6 25.9 24.7 17.0Lotbinière -3.7 4.0 3.7 6.2 3.5Manicouagan -13.3 -7.3 -4.6 -9.0 -11.0Maria-Chapdelaine -13.4 -12.2 -11.6 -8.2 -4.2Maskinongé -1.3 -1.1 3.6 5.3 1.9Matane -11.4 -9.8 -2.1 -2.2 3.0Matawinie 17.4 21.8 17.2 13.4 9.8Mékinac -0.8 -10.4 -0.3 1.9 2.4Memphrémagog 10.2 16.6 17.2 12.5 13.8Minganie-Basse-Côte-Nord -4.9 -8.2 -7.4 4.9 -5.5Mirabel 46.9 55.0 45.7 45.4 43.9Montcalm 6.2 5.9 22.0 34.0 24.9Montmagny -4.4 -4.1 -7.4 -1.1 -2.6Nicolet-Yamaska -13.1 -9.9 -0.8 -9.3 -2.1Nord-du-Québec 5.0 6.5 7.1 6.9 5.5Papineau 4.6 12.0 15.7 6.7 4.6Pontiac -4.7 3.2 4.4 6.1 0.1Portneuf 3.2 2.5 6.6 1.7 5.6Rimouski-Neigette -3.9 4.0 1.6 0.3 2.5Rivière-du-Loup 0.9 3.1 11.1 5.7 7.8Robert-Cliche -4.0 0.3 -2.0 -0.9 -1.3Roussillon 13.7 16.0 18.8 13.4 15.0Rouville 3.0 6.4 10.7 9.6 20.1Rouyn-Noranda -11.2 -11.7 -6.8 -3.1 5.5Sept-Rivières-Caniapiscau -21.4 -10.4 -0.3 -2.3 2.3Témiscamingue -8.3 -11.3 -7.5 -7.6 -3.2Témiscouata -14.6 -8.1 -14.4 -4.2 -8.3Thérèse-De Blainville 23.1 19.2 15.0 15.2 13.2Vallée-de-l’Or -8.7 1.1 1.6 -3.9 0.7Vaudreuil-Soulanges 29.0 29.0 33.5 34.9 32.0
70 Statistics Canada – Catalogue no. 91-214

Annual Demographic Estimates: Census Metropolitan Areas, Economic Regions and Census Divisions, Age and Sex
Table 3.5-3Quebec census division — Population estimates and factors of growth from July to June
2005/2006Population 2006(July 1) Natural
increaseNet
internationalmigration
Netinterprovincial
migration
Netintraprovincial
migration
Totalnet
migration
Totalgrowth
Quebec 7,651,531 25,550 36,368 -8,155 0 28,213 53,763Abitibi 24,515 103 -6 21 -39 -24 108Abitibi-Ouest 21,026 15 9 0 -204 -195 -79Acton 15,450 22 1 -4 -50 -53 47Antoine-Labelle 35,373 21 12 -19 185 178 153Argenteuil 30,787 22 5 -16 307 296 176Arthabaska 67,140 203 83 -5 171 249 554Asbestos 14,546 6 4 -8 56 52 -9Avignon 15,347 13 -4 22 -36 -18 -34Beauce-Sartigan 49,864 274 -4 -32 93 57 248Beauharnois-Salaberry 61,086 -18 8 -26 278 260 182Bécancour 19,493 43 -6 -9 -39 -54 78Bellechasse 30,047 68 -21 -14 -89 -124 -126Bonaventure 18,338 12 -5 48 -70 -27 -138Brome-Missisquoi 47,537 30 13 -76 123 60 124Champlain 326,781 1,103 1,840 -542 -1,304 -6 1,545Charlevoix 13,202 -16 -5 1 -27 -31 -27Charlevoix-Est 16,365 -13 11 -8 -89 -86 -197Coaticook 17,014 61 11 10 -17 4 56Communauté-Urbaine-de-l’Outaouais 249,374 1,434 912 927 184 2,023 2,679Communauté-Urbaine-de-Montréal 1,873,971 6,904 27,368 -6,536 -27,846 -7,014 1,627Communauté-Urbaine-de-Québec 534,751 678 1,682 -542 -149 991 3,645D’Autray 40,675 79 -9 -24 517 484 397Desjardins 55,627 313 49 5 383 437 617Deux-Montagnes 90,102 417 21 -31 890 880 1,260Drummond 94,764 330 298 -53 652 897 1,060Francheville 142,949 78 221 -25 372 568 532Joliette 59,274 18 159 -9 960 1,110 660Kamouraska 22,360 7 14 -9 -53 -48 -67L’Amiante 43,136 -17 49 -11 -35 3 -228L’Assomption 112,602 286 51 -4 1,456 1,503 2,399L’Érable 23,586 28 0 -16 -398 -414 -86L’Île-d’Orléans 6,746 9 -20 7 -54 -67 -32L’Islet 18,980 8 -23 -11 -174 -208 -162La Côte-de-Beaupré 22,842 50 7 -3 377 381 286La Côte-de-Gaspé 17,804 -40 1 -2 -65 -66 3La Haute-Côte-Nord 12,409 58 8 -4 -147 -143 -189La Haute-Gaspésie 12,549 -29 6 3 -10 -1 -35La Haute-Yamaska 87,050 303 272 -22 931 1,181 1,463La Jacques-Cartier 30,835 327 26 -183 553 396 1,063La Matapédia 19,386 -7 -5 16 -101 -90 -142La Mitis 19,390 -58 -2 13 32 43 -28La Nouvelle-Beauce 27,161 177 3 -26 40 17 288La Région-Sherbrookoise 150,693 449 1,042 -123 177 1,096 439La Rivière-du-Nord 103,418 366 46 10 2,217 2,273 1,907La Vallée-de-la-Gatineau 20,174 49 3 0 24 27 -2La Vallée-du-Richelieu 132,511 747 10 -2 1,774 1,782 1,993Lac-Saint-Jean-Est 51,664 174 -14 -10 -363 -387 -56Lajemmerais 108,568 768 -4 14 818 828 901Laval 376,845 1,628 1,363 -200 2,837 4,000 5,784Le Bas-Richelieu 51,114 -52 17 -2 189 204 70Le Centre-de-la-Mauricie 64,670 -236 -6 0 115 109 38Le Domaine-du-Roy 32,243 7 29 -21 -151 -143 -85Le Fjord-du-Saguenay 164,085 280 145 -143 -1,523 -1,521 -434Le Granit 22,125 66 24 -7 -29 -12 -1Le Haut-Richelieu 110,119 313 82 7 1,438 1,527 1,229Le Haut-Saint-François 22,382 65 32 -16 -27 -11 261Le Haut-Saint-Laurent 25,073 -1 -19 -40 88 29 6Le Haut-Saint-Maurice 15,846 68 10 -9 -70 -69 17Le Rocher-Percé 18,728 -83 4 -14 -62 -72 -115Le Val-Saint-François 29,597 93 -8 -35 119 76 216Les Basques 9,451 -28 -1 -9 -62 -72 -128Les Chutes-de-la-Chaudière 85,152 502 13 -94 601 520 1,578Les Collines-de-l’Outaouais 41,017 333 5 335 694 1,034 1,467Les Etchemins 17,644 3 -10 -3 -92 -105 -114Les Îles-de-la-Madeleine 13,106 7 1 -1 23 23 76Les Jardins-de-Napierville 24,419 100 5 -19 110 96 398
Statistics Canada – Catalogue no. 91-214 71

Annual Demographic Estimates: Census Metropolitan Areas, Economic Regions and Census Divisions, Age and Sex
Table 3.5-3 – continued
Quebec census division — Population estimates and factors of growth from July to June2005/2006Population 2006
(July 1) Naturalincrease
Netinternationalmigration
Netinterprovincial
migration
Netintraprovincial
migration
Totalnet
migration
Totalgrowth
Les Laurentides 42,764 51 36 1 900 937 550Les Maskoutains 81,938 149 207 -34 -60 113 458Les Moulins 131,318 1,012 24 0 3,868 3,892 3,947Les Pays-d’en-Haut 35,776 10 79 26 770 875 602Lotbinière 27,755 69 -4 -12 136 120 96Manicouagan 32,775 133 -6 -25 -382 -413 -361Maria-Chapdelaine 26,103 72 13 -11 -276 -274 -109Maskinongé 24,041 -2 14 -2 133 145 45Matane 22,425 0 3 -13 -26 -36 67Matawinie 47,660 51 1 -49 651 603 465Mékinac 12,955 -24 13 -6 52 59 31Memphrémagog 45,804 98 -16 2 505 491 626Minganie-Basse-Côte-Nord 12,300 88 -3 -19 -3 -25 -68Mirabel 35,342 336 19 1 1,167 1,187 1,519Montcalm 43,343 146 12 4 1,280 1,296 1,067Montmagny 23,420 42 2 1 -52 -49 -60Nicolet-Yamaska 23,116 -20 6 -6 -178 -178 -49Nord-du-Québec 40,637 723 -15 0 -397 -412 223Papineau 21,687 -16 23 12 138 173 100Pontiac 14,962 4 8 6 67 81 1Portneuf 46,727 8 -17 -15 134 102 262Rimouski-Neigette 53,545 46 50 11 -47 14 132Rivière-du-Loup 33,390 62 -2 5 149 152 261Robert-Cliche 18,991 113 3 -1 -118 -116 -25Roussillon 161,231 896 33 -158 1,414 1,289 2,399Rouville 32,119 112 -15 -21 245 209 638Rouyn-Noranda 39,308 58 -8 -17 -133 -158 215Sept-Rivières-Caniapiscau 38,464 271 3 -58 -283 -338 88Témiscamingue 17,176 55 4 -57 -139 -192 -55Témiscouata 21,745 -7 18 12 -101 -71 -182Thérèse-De Blainville 145,059 1,126 61 42 1,020 1,123 1,896Vallée-de-l’Or 42,810 139 7 -60 -229 -282 28Vaudreuil-Soulanges 121,967 829 12 -135 3,386 3,263 3,840
Note(s): With the exception of Quebec and British Columbia, preliminary estimates for July 1, 2006 are produced using the component method. The populationestimates for both these provinces were created by their respective agencies. As a result, the sum of components does not equal the populationgrowth for 2005/2006.
72 Statistics Canada – Catalogue no. 91-214
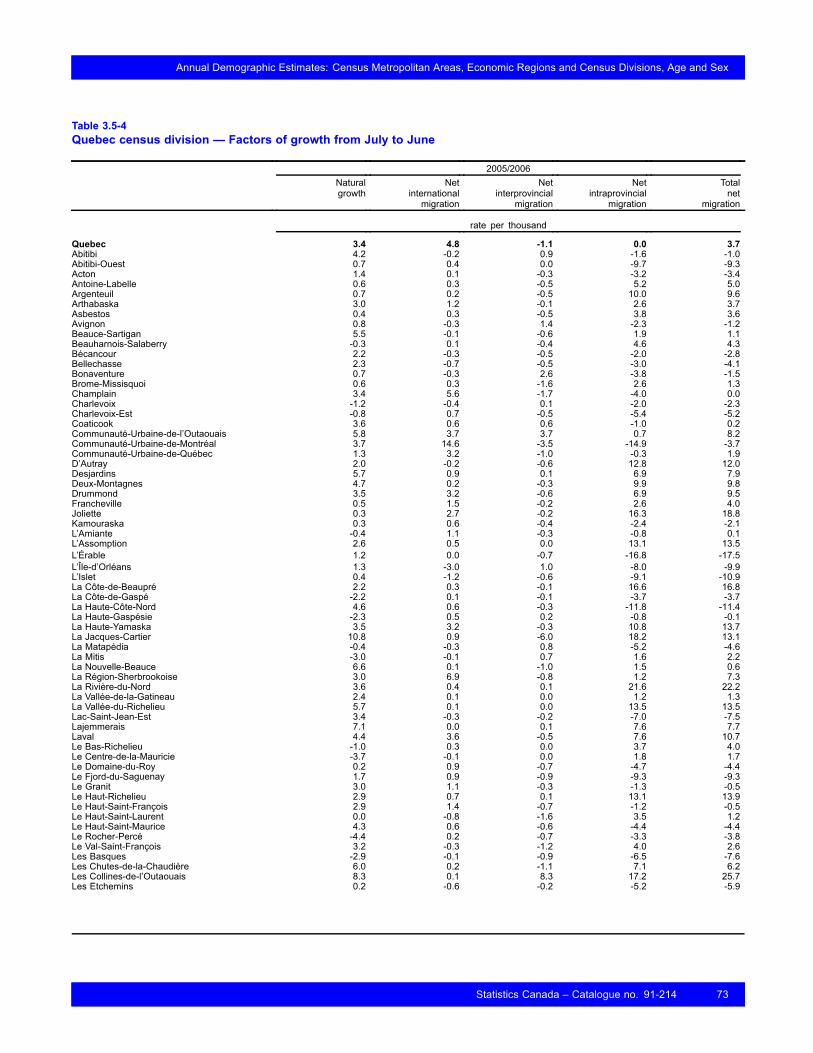
Annual Demographic Estimates: Census Metropolitan Areas, Economic Regions and Census Divisions, Age and Sex
Table 3.5-4Quebec census division — Factors of growth from July to June
2005/2006Naturalgrowth
Netinternationalmigration
Netinterprovincial
migration
Netintraprovincial
migration
Totalnet
migration
rate per thousand
Quebec 3.4 4.8 -1.1 0.0 3.7Abitibi 4.2 -0.2 0.9 -1.6 -1.0Abitibi-Ouest 0.7 0.4 0.0 -9.7 -9.3Acton 1.4 0.1 -0.3 -3.2 -3.4Antoine-Labelle 0.6 0.3 -0.5 5.2 5.0Argenteuil 0.7 0.2 -0.5 10.0 9.6Arthabaska 3.0 1.2 -0.1 2.6 3.7Asbestos 0.4 0.3 -0.5 3.8 3.6Avignon 0.8 -0.3 1.4 -2.3 -1.2Beauce-Sartigan 5.5 -0.1 -0.6 1.9 1.1Beauharnois-Salaberry -0.3 0.1 -0.4 4.6 4.3Bécancour 2.2 -0.3 -0.5 -2.0 -2.8Bellechasse 2.3 -0.7 -0.5 -3.0 -4.1Bonaventure 0.7 -0.3 2.6 -3.8 -1.5Brome-Missisquoi 0.6 0.3 -1.6 2.6 1.3Champlain 3.4 5.6 -1.7 -4.0 0.0Charlevoix -1.2 -0.4 0.1 -2.0 -2.3Charlevoix-Est -0.8 0.7 -0.5 -5.4 -5.2Coaticook 3.6 0.6 0.6 -1.0 0.2Communauté-Urbaine-de-l’Outaouais 5.8 3.7 3.7 0.7 8.2Communauté-Urbaine-de-Montréal 3.7 14.6 -3.5 -14.9 -3.7Communauté-Urbaine-de-Québec 1.3 3.2 -1.0 -0.3 1.9D’Autray 2.0 -0.2 -0.6 12.8 12.0Desjardins 5.7 0.9 0.1 6.9 7.9Deux-Montagnes 4.7 0.2 -0.3 9.9 9.8Drummond 3.5 3.2 -0.6 6.9 9.5Francheville 0.5 1.5 -0.2 2.6 4.0Joliette 0.3 2.7 -0.2 16.3 18.8Kamouraska 0.3 0.6 -0.4 -2.4 -2.1L’Amiante -0.4 1.1 -0.3 -0.8 0.1L’Assomption 2.6 0.5 0.0 13.1 13.5L’Érable 1.2 0.0 -0.7 -16.8 -17.5L’Île-d’Orléans 1.3 -3.0 1.0 -8.0 -9.9L’Islet 0.4 -1.2 -0.6 -9.1 -10.9La Côte-de-Beaupré 2.2 0.3 -0.1 16.6 16.8La Côte-de-Gaspé -2.2 0.1 -0.1 -3.7 -3.7La Haute-Côte-Nord 4.6 0.6 -0.3 -11.8 -11.4La Haute-Gaspésie -2.3 0.5 0.2 -0.8 -0.1La Haute-Yamaska 3.5 3.2 -0.3 10.8 13.7La Jacques-Cartier 10.8 0.9 -6.0 18.2 13.1La Matapédia -0.4 -0.3 0.8 -5.2 -4.6La Mitis -3.0 -0.1 0.7 1.6 2.2La Nouvelle-Beauce 6.6 0.1 -1.0 1.5 0.6La Région-Sherbrookoise 3.0 6.9 -0.8 1.2 7.3La Rivière-du-Nord 3.6 0.4 0.1 21.6 22.2La Vallée-de-la-Gatineau 2.4 0.1 0.0 1.2 1.3La Vallée-du-Richelieu 5.7 0.1 0.0 13.5 13.5Lac-Saint-Jean-Est 3.4 -0.3 -0.2 -7.0 -7.5Lajemmerais 7.1 0.0 0.1 7.6 7.7Laval 4.4 3.6 -0.5 7.6 10.7Le Bas-Richelieu -1.0 0.3 0.0 3.7 4.0Le Centre-de-la-Mauricie -3.7 -0.1 0.0 1.8 1.7Le Domaine-du-Roy 0.2 0.9 -0.7 -4.7 -4.4Le Fjord-du-Saguenay 1.7 0.9 -0.9 -9.3 -9.3Le Granit 3.0 1.1 -0.3 -1.3 -0.5Le Haut-Richelieu 2.9 0.7 0.1 13.1 13.9Le Haut-Saint-François 2.9 1.4 -0.7 -1.2 -0.5Le Haut-Saint-Laurent 0.0 -0.8 -1.6 3.5 1.2Le Haut-Saint-Maurice 4.3 0.6 -0.6 -4.4 -4.4Le Rocher-Percé -4.4 0.2 -0.7 -3.3 -3.8Le Val-Saint-François 3.2 -0.3 -1.2 4.0 2.6Les Basques -2.9 -0.1 -0.9 -6.5 -7.6Les Chutes-de-la-Chaudière 6.0 0.2 -1.1 7.1 6.2Les Collines-de-l’Outaouais 8.3 0.1 8.3 17.2 25.7Les Etchemins 0.2 -0.6 -0.2 -5.2 -5.9
Statistics Canada – Catalogue no. 91-214 73

Annual Demographic Estimates: Census Metropolitan Areas, Economic Regions and Census Divisions, Age and Sex
Table 3.5-4 – continued
Quebec census division — Factors of growth from July to June2005/2006
Naturalgrowth
Netinternationalmigration
Netinterprovincial
migration
Netintraprovincial
migration
Totalnet
migration
rate per thousand
Les Îles-de-la-Madeleine 0.5 0.1 -0.1 1.8 1.8Les Jardins-de-Napierville 4.1 0.2 -0.8 4.5 4.0Les Laurentides 1.2 0.8 0.0 21.2 22.1Les Maskoutains 1.8 2.5 -0.4 -0.7 1.4Les Moulins 7.8 0.2 0.0 29.9 30.1Les Pays-d’en-Haut 0.3 2.2 0.7 21.7 24.7Lotbinière 2.5 -0.1 -0.4 4.9 4.3Manicouagan 4.0 -0.2 -0.8 -11.6 -12.5Maria-Chapdelaine 2.8 0.5 -0.4 -10.6 -10.5Maskinongé -0.1 0.6 -0.1 5.5 6.0Matane 0.0 0.1 -0.6 -1.2 -1.6Matawinie 1.1 0.0 -1.0 13.7 12.7Mékinac -1.9 1.0 -0.5 4.0 4.6Memphrémagog 2.2 -0.4 0.0 11.1 10.8Minganie-Basse-Côte-Nord 7.1 -0.2 -1.5 -0.2 -2.0Mirabel 9.7 0.5 0.0 33.7 34.3Montcalm 3.4 0.3 0.1 29.9 30.3Montmagny 1.8 0.1 0.0 -2.2 -2.1Nicolet-Yamaska -0.9 0.3 -0.3 -7.7 -7.7Nord-du-Québec 17.8 -0.4 0.0 -9.8 -10.2Papineau -0.7 1.1 0.6 6.4 8.0Pontiac 0.3 0.5 0.4 4.5 5.4Portneuf 0.2 -0.4 -0.3 2.9 2.2Rimouski-Neigette 0.9 0.9 0.2 -0.9 0.3Rivière-du-Loup 1.9 -0.1 0.2 4.5 4.6Robert-Cliche 5.9 0.2 -0.1 -6.2 -6.1Roussillon 5.6 0.2 -1.0 8.8 8.1Rouville 3.5 -0.5 -0.7 7.7 6.6Rouyn-Noranda 1.5 -0.2 -0.4 -3.4 -4.0Sept-Rivières-Caniapiscau 7.1 0.1 -1.5 -7.4 -8.8Témiscamingue 3.2 0.2 -3.3 -8.1 -11.2Témiscouata -0.3 0.8 0.5 -4.6 -3.3Thérèse-De Blainville 7.8 0.4 0.3 7.1 7.8Vallée-de-l’Or 3.2 0.2 -1.4 -5.4 -6.6Vaudreuil-Soulanges 6.9 0.1 -1.1 28.2 27.2
74 Statistics Canada – Catalogue no. 91-214

Annual Demographic Estimates: Census Metropolitan Areas, Economic Regions and Census Divisions, Age and Sex
Table 3.6-1Ontario census division — Annual population estimates at July 1
2001 2002 2003 2004 2005 2006
Ontario 11,897,647 12,102,045 12,262,560 12,416,749 12,558,669 12,686,952Algoma 123,927 122,734 122,138 121,738 121,573 121,273Brant 128,871 129,976 131,386 132,799 134,330 135,747Bruce 66,342 66,869 67,177 67,351 67,037 66,663Chatham-Kent 111,902 111,072 110,701 110,091 110,112 110,039Cochrane 89,627 88,202 87,163 86,588 85,983 85,276Dufferin 53,022 53,831 54,712 55,564 56,174 56,733Durham 526,987 537,976 550,897 563,394 574,678 585,560Elgin 84,737 85,448 86,208 87,333 88,108 88,811Essex 390,475 396,550 400,289 403,123 404,425 405,254Frontenac 144,094 145,784 146,974 147,365 147,006 146,321Greater Sudbury / Grand Sudbury 161,214 160,751 161,009 161,244 161,661 161,908Grey 92,476 93,067 93,864 94,279 94,517 94,665Haldimand-Norfolk 109,504 110,180 110,743 111,391 111,752 112,009Haliburton 15,655 15,847 16,087 16,126 16,159 16,175Halton 390,235 402,633 415,417 429,937 443,470 456,560Hamilton 510,073 514,551 517,980 519,358 519,525 519,067Hastings 132,171 133,368 133,847 135,007 135,916 136,639Huron 61,999 61,981 61,907 61,756 61,624 61,446Kawartha Lakes 71,818 72,373 73,324 73,908 74,466 74,968Kenora 66,513 66,471 66,718 66,616 66,250 65,656Lambton 131,835 132,349 132,518 132,571 132,518 132,340Lanark 64,932 65,746 66,386 66,865 67,260 67,586Leeds and Grenville 100,339 100,950 101,769 102,173 102,595 102,911Lennox and Addington 40,963 41,220 41,514 41,783 42,052 42,287Manitoulin 13,165 13,229 13,248 13,321 13,292 13,251Middlesex 421,969 426,142 428,856 432,030 434,363 436,166Muskoka 55,330 55,786 56,412 56,683 56,914 57,083Niagara 426,532 428,644 430,479 432,765 434,171 435,125Nipissing 86,283 86,208 85,962 85,663 85,783 85,788Northumberland 80,458 81,225 82,233 83,042 83,669 84,212Ottawa 806,560 817,585 825,783 830,910 836,505 840,095Oxford 103,149 103,549 104,354 104,902 105,886 106,800Parry Sound 41,181 41,483 41,834 42,005 42,244 42,441Peel 1,032,308 1,082,701 1,127,272 1,172,508 1,216,820 1,260,643Perth 76,543 76,924 77,436 77,547 77,392 77,169Peterborough 130,678 131,744 132,500 133,007 133,537 133,928Prescott and Russell 79,476 80,544 81,807 82,799 83,577 84,206Prince Edward 25,841 26,164 26,276 26,397 26,480 26,536Rainy River 22,959 22,695 22,536 22,355 22,162 21,911Renfrew 98,833 98,859 99,217 99,551 99,383 98,971Simcoe 391,819 401,689 411,398 419,736 427,137 434,019Stormont 115,320 115,717 116,387 116,442 115,958 115,285Sudbury 23,786 23,537 23,255 22,949 22,571 22,167Thunder Bay 157,043 156,043 155,646 154,912 153,749 152,249Timiskaming 35,753 35,064 34,594 34,532 34,226 33,879Toronto 2,592,460 2,617,219 2,615,086 2,616,803 2,625,622 2,631,725Waterloo 456,349 464,049 470,288 478,283 485,177 491,635Wellington 194,821 197,366 199,779 202,573 205,531 208,292York 759,320 807,950 849,194 886,674 917,329 947,482
Statistics Canada – Catalogue no. 91-214 75

Annual Demographic Estimates: Census Metropolitan Areas, Economic Regions and Census Divisions, Age and Sex
Table 3.6-2Ontario census division — Population rate of growth from July to June
2001/2002 2002/2003 2003/2004 2004/2005 2005/2006
rate per thousand
Ontario 17.0 13.2 12.5 11.4 10.2Algoma -9.7 -4.9 -3.3 -1.4 -2.5Brant 8.5 10.8 10.7 11.5 10.5Bruce 7.9 4.6 2.6 -4.7 -5.6Chatham-Kent -7.4 -3.3 -5.5 0.2 -0.7Cochrane -16.0 -11.8 -6.6 -7.0 -8.3Dufferin 15.1 16.2 15.5 10.9 9.9Durham 20.6 23.7 22.4 19.8 18.8Elgin 8.4 8.9 13.0 8.8 7.9Essex 15.4 9.4 7.1 3.2 2.0Frontenac 11.7 8.1 2.7 -2.4 -4.7Greater Sudbury / Grand Sudbury -2.9 1.6 1.5 2.6 1.5Grey 6.4 8.5 4.4 2.5 1.6Haldimand-Norfolk 6.2 5.1 5.8 3.2 2.3Haliburton 12.2 15.0 2.4 2.0 1.0Halton 31.3 31.3 34.4 31.0 29.1Hamilton 8.7 6.6 2.7 0.3 -0.9Hastings 9.0 3.6 8.6 6.7 5.3Huron -0.3 -1.2 -2.4 -2.1 -2.9Kawartha Lakes 7.7 13.1 7.9 7.5 6.7Kenora -0.6 3.7 -1.5 -5.5 -9.0Lambton 3.9 1.3 0.4 -0.4 -1.3Lanark 12.5 9.7 7.2 5.9 4.8Leeds and Grenville 6.1 8.1 4.0 4.1 3.1Lennox and Addington 6.3 7.1 6.5 6.4 5.6Manitoulin 4.8 1.4 5.5 -2.2 -3.1Middlesex 9.8 6.3 7.4 5.4 4.1Muskoka 8.2 11.2 4.8 4.1 3.0Niagara 4.9 4.3 5.3 3.2 2.2Nipissing -0.9 -2.9 -3.5 1.4 0.1Northumberland 9.5 12.3 9.8 7.5 6.5Ottawa 13.6 10.0 6.2 6.7 4.3Oxford 3.9 7.7 5.2 9.3 8.6Parry Sound 7.3 8.4 4.1 5.7 4.7Peel 47.7 40.3 39.3 37.1 35.4Perth 5.0 6.6 1.4 -2.0 -2.9Peterborough 8.1 5.7 3.8 4.0 2.9Prescott and Russell 13.3 15.6 12.1 9.4 7.5Prince Edward 12.4 4.3 4.6 3.1 2.1Rainy River -11.6 -7.0 -8.1 -8.7 -11.4Renfrew 0.3 3.6 3.4 -1.7 -4.2Simcoe 24.9 23.9 20.1 17.5 16.0Stormont 3.4 5.8 0.5 -4.2 -5.8Sudbury -10.5 -12.1 -13.2 -16.6 -18.1Thunder Bay -6.4 -2.5 -4.7 -7.5 -9.8Timiskaming -19.5 -13.5 -1.8 -8.9 -10.2Toronto 9.5 -0.8 0.7 3.4 2.3Waterloo 16.7 13.4 16.9 14.3 13.2Wellington 13.0 12.2 13.9 14.5 13.3York 62.1 49.8 43.2 34.0 32.3
76 Statistics Canada – Catalogue no. 91-214
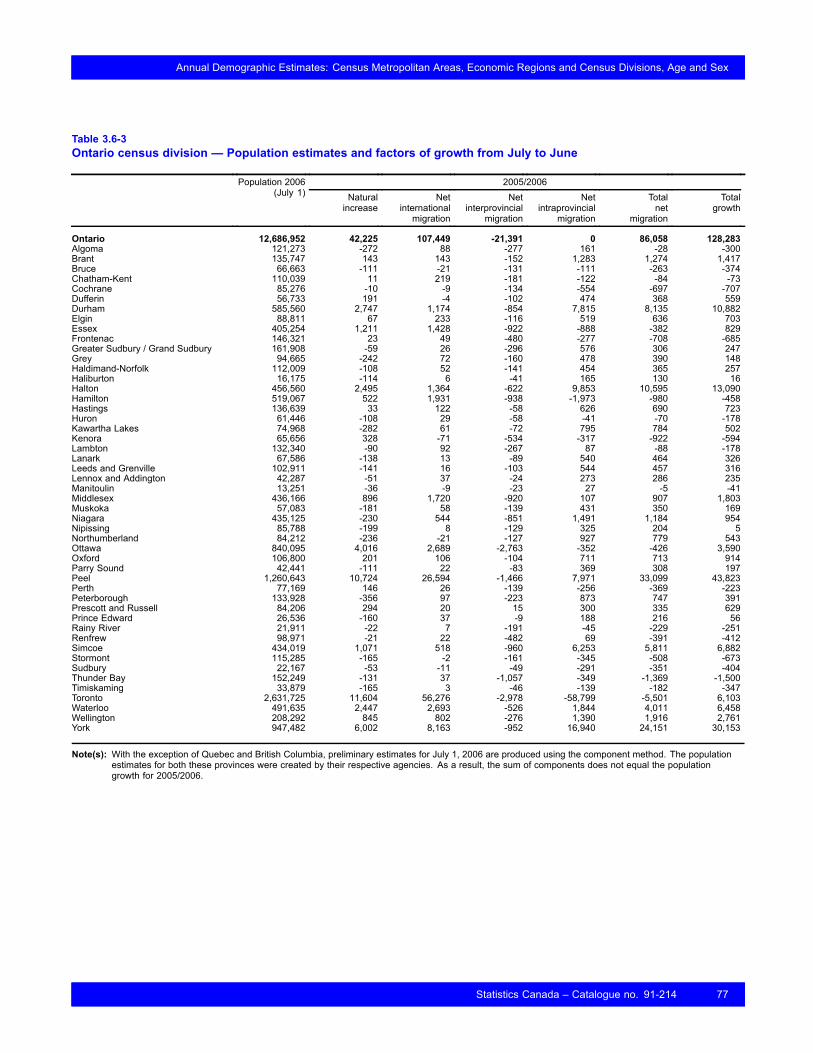
Annual Demographic Estimates: Census Metropolitan Areas, Economic Regions and Census Divisions, Age and Sex
Table 3.6-3Ontario census division — Population estimates and factors of growth from July to June
2005/2006Population 2006(July 1) Natural
increaseNet
internationalmigration
Netinterprovincial
migration
Netintraprovincial
migration
Totalnet
migration
Totalgrowth
Ontario 12,686,952 42,225 107,449 -21,391 0 86,058 128,283Algoma 121,273 -272 88 -277 161 -28 -300Brant 135,747 143 143 -152 1,283 1,274 1,417Bruce 66,663 -111 -21 -131 -111 -263 -374Chatham-Kent 110,039 11 219 -181 -122 -84 -73Cochrane 85,276 -10 -9 -134 -554 -697 -707Dufferin 56,733 191 -4 -102 474 368 559Durham 585,560 2,747 1,174 -854 7,815 8,135 10,882Elgin 88,811 67 233 -116 519 636 703Essex 405,254 1,211 1,428 -922 -888 -382 829Frontenac 146,321 23 49 -480 -277 -708 -685Greater Sudbury / Grand Sudbury 161,908 -59 26 -296 576 306 247Grey 94,665 -242 72 -160 478 390 148Haldimand-Norfolk 112,009 -108 52 -141 454 365 257Haliburton 16,175 -114 6 -41 165 130 16Halton 456,560 2,495 1,364 -622 9,853 10,595 13,090Hamilton 519,067 522 1,931 -938 -1,973 -980 -458Hastings 136,639 33 122 -58 626 690 723Huron 61,446 -108 29 -58 -41 -70 -178Kawartha Lakes 74,968 -282 61 -72 795 784 502Kenora 65,656 328 -71 -534 -317 -922 -594Lambton 132,340 -90 92 -267 87 -88 -178Lanark 67,586 -138 13 -89 540 464 326Leeds and Grenville 102,911 -141 16 -103 544 457 316Lennox and Addington 42,287 -51 37 -24 273 286 235Manitoulin 13,251 -36 -9 -23 27 -5 -41Middlesex 436,166 896 1,720 -920 107 907 1,803Muskoka 57,083 -181 58 -139 431 350 169Niagara 435,125 -230 544 -851 1,491 1,184 954Nipissing 85,788 -199 8 -129 325 204 5Northumberland 84,212 -236 -21 -127 927 779 543Ottawa 840,095 4,016 2,689 -2,763 -352 -426 3,590Oxford 106,800 201 106 -104 711 713 914Parry Sound 42,441 -111 22 -83 369 308 197Peel 1,260,643 10,724 26,594 -1,466 7,971 33,099 43,823Perth 77,169 146 26 -139 -256 -369 -223Peterborough 133,928 -356 97 -223 873 747 391Prescott and Russell 84,206 294 20 15 300 335 629Prince Edward 26,536 -160 37 -9 188 216 56Rainy River 21,911 -22 7 -191 -45 -229 -251Renfrew 98,971 -21 22 -482 69 -391 -412Simcoe 434,019 1,071 518 -960 6,253 5,811 6,882Stormont 115,285 -165 -2 -161 -345 -508 -673Sudbury 22,167 -53 -11 -49 -291 -351 -404Thunder Bay 152,249 -131 37 -1,057 -349 -1,369 -1,500Timiskaming 33,879 -165 3 -46 -139 -182 -347Toronto 2,631,725 11,604 56,276 -2,978 -58,799 -5,501 6,103Waterloo 491,635 2,447 2,693 -526 1,844 4,011 6,458Wellington 208,292 845 802 -276 1,390 1,916 2,761York 947,482 6,002 8,163 -952 16,940 24,151 30,153
Note(s): With the exception of Quebec and British Columbia, preliminary estimates for July 1, 2006 are produced using the component method. The populationestimates for both these provinces were created by their respective agencies. As a result, the sum of components does not equal the populationgrowth for 2005/2006.
Statistics Canada – Catalogue no. 91-214 77

Annual Demographic Estimates: Census Metropolitan Areas, Economic Regions and Census Divisions, Age and Sex
Table 3.6-4Ontario census division — Factors of growth from July to June
2005/2006Naturalgrowth
Netinternationalmigration
Netinterprovincial
migration
Netintraprovincial
migration
Totalnet
migration
rate per thousand
Ontario 3.3 8.5 -1.7 0.0 6.8Algoma -2.2 0.7 -2.3 1.3 -0.2Brant 1.1 1.1 -1.1 9.5 9.4Bruce -1.7 -0.3 -2.0 -1.7 -3.9Chatham-Kent 0.1 2.0 -1.6 -1.1 -0.8Cochrane -0.1 -0.1 -1.6 -6.5 -8.1Dufferin 3.4 -0.1 -1.8 8.4 6.5Durham 4.7 2.0 -1.5 13.5 14.0Elgin 0.8 2.6 -1.3 5.9 7.2Essex 3.0 3.5 -2.3 -2.2 -0.9Frontenac 0.2 0.3 -3.3 -1.9 -4.8Greater Sudbury / Grand Sudbury -0.4 0.2 -1.8 3.6 1.9Grey -2.6 0.8 -1.7 5.1 4.1Haldimand-Norfolk -1.0 0.5 -1.3 4.1 3.3Haliburton -7.1 0.4 -2.5 10.2 8.0Halton 5.5 3.0 -1.4 21.9 23.5Hamilton 1.0 3.7 -1.8 -3.8 -1.9Hastings 0.2 0.9 -0.4 4.6 5.1Huron -1.8 0.5 -0.9 -0.7 -1.1Kawartha Lakes -3.8 0.8 -1.0 10.6 10.5Kenora 5.0 -1.1 -8.1 -4.8 -14.0Lambton -0.7 0.7 -2.0 0.7 -0.7Lanark -2.0 0.2 -1.3 8.0 6.9Leeds and Grenville -1.4 0.2 -1.0 5.3 4.4Lennox and Addington -1.2 0.9 -0.6 6.5 6.8Manitoulin -2.7 -0.7 -1.7 2.0 -0.4Middlesex 2.1 4.0 -2.1 0.2 2.1Muskoka -3.2 1.0 -2.4 7.6 6.1Niagara -0.5 1.3 -2.0 3.4 2.7Nipissing -2.3 0.1 -1.5 3.8 2.4Northumberland -2.8 -0.3 -1.5 11.0 9.3Ottawa 4.8 3.2 -3.3 -0.4 -0.5Oxford 1.9 1.0 -1.0 6.7 6.7Parry Sound -2.6 0.5 -2.0 8.7 7.3Peel 8.7 21.5 -1.2 6.4 26.7Perth 1.9 0.3 -1.8 -3.3 -4.8Peterborough -2.7 0.7 -1.7 6.5 5.6Prescott and Russell 3.5 0.2 0.2 3.6 4.0Prince Edward -6.0 1.4 -0.3 7.1 8.1Rainy River -1.0 0.3 -8.7 -2.0 -10.4Renfrew -0.2 0.2 -4.9 0.7 -3.9Simcoe 2.5 1.2 -2.2 14.5 13.5Stormont -1.4 0.0 -1.4 -3.0 -4.4Sudbury -2.4 -0.5 -2.2 -13.0 -15.7Thunder Bay -0.9 0.2 -6.9 -2.3 -8.9Timiskaming -4.8 0.1 -1.4 -4.1 -5.3Toronto 4.4 21.4 -1.1 -22.4 -2.1Waterloo 5.0 5.5 -1.1 3.8 8.2Wellington 4.1 3.9 -1.3 6.7 9.3York 6.4 8.8 -1.0 18.2 25.9
78 Statistics Canada – Catalogue no. 91-214

Annual Demographic Estimates: Census Metropolitan Areas, Economic Regions and Census Divisions, Age and Sex
Table 3.7-1Manitoba census division — Annual population estimates at July 1
2001 2002 2003 2004 2005 2006
Manitoba 1,151,285 1,155,584 1,161,896 1,170,475 1,174,148 1,177,765Division 1 16,905 17,017 17,204 17,319 17,307 17,287Division 2 52,381 53,453 54,547 56,107 57,726 59,445Division 3 43,507 44,026 44,778 45,635 46,479 47,394Division 4 10,210 10,077 9,904 9,814 9,765 9,707Division 5 14,214 13,957 13,863 13,688 13,553 13,408Division 6 10,383 10,291 10,196 10,096 10,010 9,916Division 7 58,696 58,635 59,014 59,737 60,274 60,770Division 8 15,018 14,991 14,902 14,765 14,659 14,544Division 9 24,089 24,058 24,259 24,728 24,248 23,744Division 10 9,729 9,856 10,093 10,297 10,491 10,675Division 11 638,905 641,792 644,941 649,074 650,157 651,331Division 12 19,787 19,895 20,154 20,388 20,413 20,423Division 13 43,349 43,738 44,093 44,791 45,318 45,829Division 14 18,075 18,072 18,200 18,453 18,626 18,796Division 15 22,511 22,389 22,323 22,235 22,060 21,862Division 16 10,619 10,533 10,498 10,328 10,050 9,753Division 17 23,520 23,260 23,022 22,886 22,775 22,656Division 18 23,221 23,273 23,582 23,440 23,544 23,650Division 19 16,281 16,410 16,668 16,651 16,670 16,687Division 20 11,302 11,233 10,932 10,910 10,763 10,593Division 21 23,193 23,043 23,060 22,865 22,545 22,157Division 22 36,137 36,547 37,043 37,686 38,111 38,514Division 23 9,253 9,038 8,620 8,582 8,604 8,624
Table 3.7-2Manitoba census division — Population rate of growth from July to June
2001/2002 2002/2003 2003/2004 2004/2005 2005/2006
rate per thousand
Manitoba 3.7 5.4 7.4 3.1 3.1Division 1 6.6 10.9 6.7 -0.7 -1.2Division 2 20.3 20.3 28.2 28.4 29.3Division 3 11.9 16.9 19.0 18.3 19.5Division 4 -13.1 -17.3 -9.1 -5.0 -6.0Division 5 -18.2 -6.8 -12.7 -9.9 -10.8Division 6 -8.9 -9.3 -9.9 -8.6 -9.4Division 7 -1.0 6.4 12.2 8.9 8.2Division 8 -1.8 -6.0 -9.2 -7.2 -7.9Division 9 -1.3 8.3 19.1 -19.6 -21.0Division 10 13.0 23.8 20.0 18.7 17.4Division 11 4.5 4.9 6.4 1.7 1.8Division 12 5.4 12.9 11.5 1.2 0.5Division 13 8.9 8.1 15.7 11.7 11.2Division 14 -0.2 7.1 13.8 9.3 9.1Division 15 -5.4 -3.0 -3.9 -7.9 -9.0Division 16 -8.1 -3.3 -16.3 -27.3 -30.0Division 17 -11.1 -10.3 -5.9 -4.9 -5.2Division 18 2.2 13.2 -6.0 4.4 4.5Division 19 7.9 15.6 -1.0 1.1 1.0Division 20 -6.1 -27.2 -2.0 -13.6 -15.9Division 21 -6.5 0.7 -8.5 -14.1 -17.4Division 22 11.3 13.5 17.2 11.2 10.5Division 23 -23.5 -47.3 -4.4 2.6 2.3
Statistics Canada – Catalogue no. 91-214 79
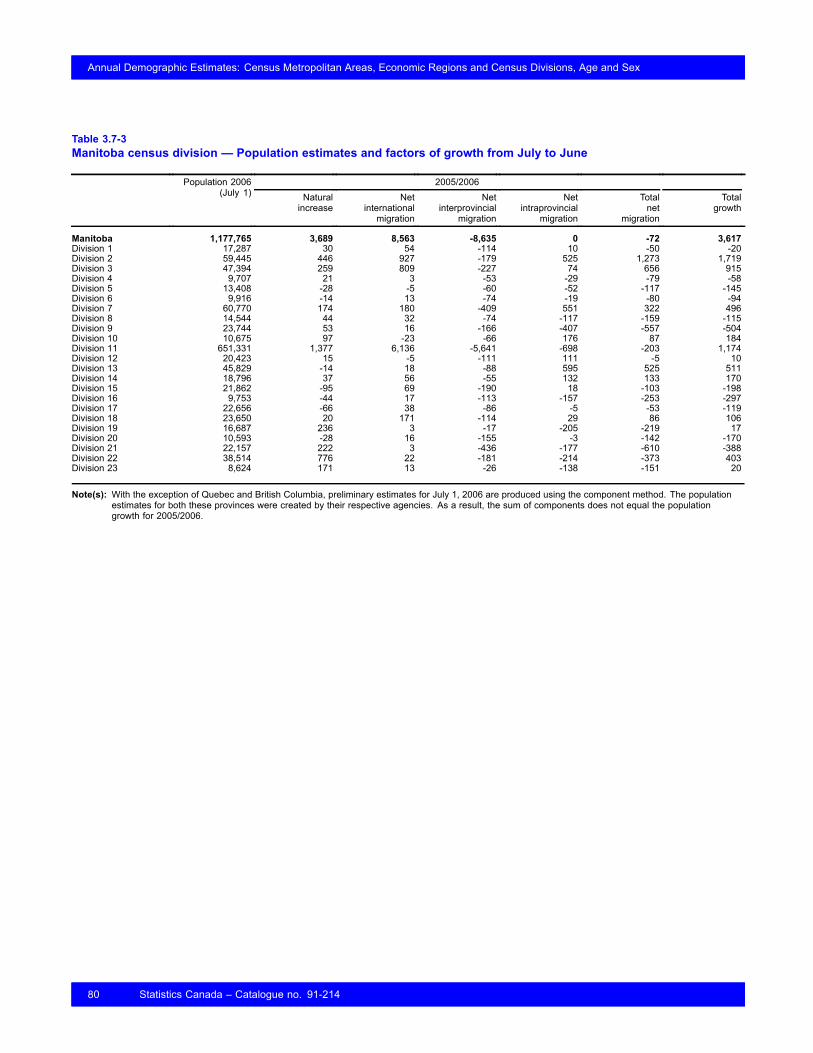
Annual Demographic Estimates: Census Metropolitan Areas, Economic Regions and Census Divisions, Age and Sex
Table 3.7-3Manitoba census division — Population estimates and factors of growth from July to June
2005/2006Population 2006(July 1) Natural
increaseNet
internationalmigration
Netinterprovincial
migration
Netintraprovincial
migration
Totalnet
migration
Totalgrowth
Manitoba 1,177,765 3,689 8,563 -8,635 0 -72 3,617Division 1 17,287 30 54 -114 10 -50 -20Division 2 59,445 446 927 -179 525 1,273 1,719Division 3 47,394 259 809 -227 74 656 915Division 4 9,707 21 3 -53 -29 -79 -58Division 5 13,408 -28 -5 -60 -52 -117 -145Division 6 9,916 -14 13 -74 -19 -80 -94Division 7 60,770 174 180 -409 551 322 496Division 8 14,544 44 32 -74 -117 -159 -115Division 9 23,744 53 16 -166 -407 -557 -504Division 10 10,675 97 -23 -66 176 87 184Division 11 651,331 1,377 6,136 -5,641 -698 -203 1,174Division 12 20,423 15 -5 -111 111 -5 10Division 13 45,829 -14 18 -88 595 525 511Division 14 18,796 37 56 -55 132 133 170Division 15 21,862 -95 69 -190 18 -103 -198Division 16 9,753 -44 17 -113 -157 -253 -297Division 17 22,656 -66 38 -86 -5 -53 -119Division 18 23,650 20 171 -114 29 86 106Division 19 16,687 236 3 -17 -205 -219 17Division 20 10,593 -28 16 -155 -3 -142 -170Division 21 22,157 222 3 -436 -177 -610 -388Division 22 38,514 776 22 -181 -214 -373 403Division 23 8,624 171 13 -26 -138 -151 20
Note(s): With the exception of Quebec and British Columbia, preliminary estimates for July 1, 2006 are produced using the component method. The populationestimates for both these provinces were created by their respective agencies. As a result, the sum of components does not equal the populationgrowth for 2005/2006.
80 Statistics Canada – Catalogue no. 91-214
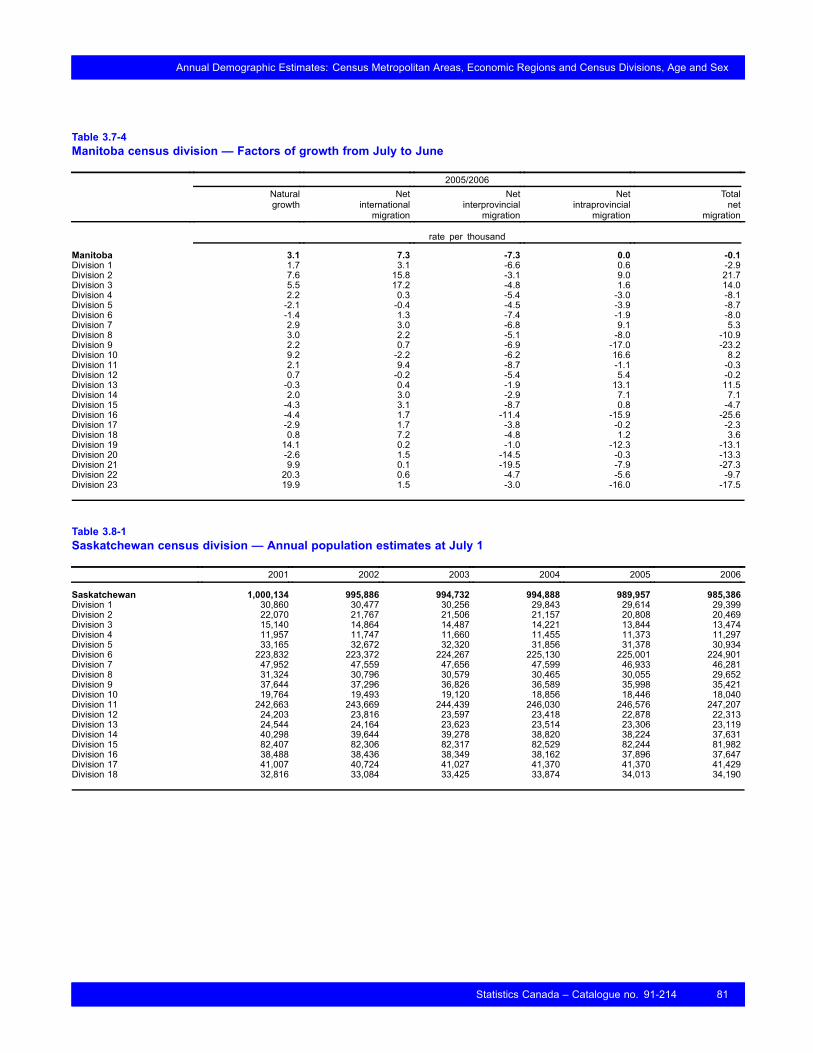
Annual Demographic Estimates: Census Metropolitan Areas, Economic Regions and Census Divisions, Age and Sex
Table 3.7-4Manitoba census division — Factors of growth from July to June
2005/2006Naturalgrowth
Netinternationalmigration
Netinterprovincial
migration
Netintraprovincial
migration
Totalnet
migration
rate per thousand
Manitoba 3.1 7.3 -7.3 0.0 -0.1Division 1 1.7 3.1 -6.6 0.6 -2.9Division 2 7.6 15.8 -3.1 9.0 21.7Division 3 5.5 17.2 -4.8 1.6 14.0Division 4 2.2 0.3 -5.4 -3.0 -8.1Division 5 -2.1 -0.4 -4.5 -3.9 -8.7Division 6 -1.4 1.3 -7.4 -1.9 -8.0Division 7 2.9 3.0 -6.8 9.1 5.3Division 8 3.0 2.2 -5.1 -8.0 -10.9Division 9 2.2 0.7 -6.9 -17.0 -23.2Division 10 9.2 -2.2 -6.2 16.6 8.2Division 11 2.1 9.4 -8.7 -1.1 -0.3Division 12 0.7 -0.2 -5.4 5.4 -0.2Division 13 -0.3 0.4 -1.9 13.1 11.5Division 14 2.0 3.0 -2.9 7.1 7.1Division 15 -4.3 3.1 -8.7 0.8 -4.7Division 16 -4.4 1.7 -11.4 -15.9 -25.6Division 17 -2.9 1.7 -3.8 -0.2 -2.3Division 18 0.8 7.2 -4.8 1.2 3.6Division 19 14.1 0.2 -1.0 -12.3 -13.1Division 20 -2.6 1.5 -14.5 -0.3 -13.3Division 21 9.9 0.1 -19.5 -7.9 -27.3Division 22 20.3 0.6 -4.7 -5.6 -9.7Division 23 19.9 1.5 -3.0 -16.0 -17.5
Table 3.8-1Saskatchewan census division — Annual population estimates at July 1
2001 2002 2003 2004 2005 2006
Saskatchewan 1,000,134 995,886 994,732 994,888 989,957 985,386Division 1 30,860 30,477 30,256 29,843 29,614 29,399Division 2 22,070 21,767 21,506 21,157 20,808 20,469Division 3 15,140 14,864 14,487 14,221 13,844 13,474Division 4 11,957 11,747 11,660 11,455 11,373 11,297Division 5 33,165 32,672 32,320 31,856 31,378 30,934Division 6 223,832 223,372 224,267 225,130 225,001 224,901Division 7 47,952 47,559 47,656 47,599 46,933 46,281Division 8 31,324 30,796 30,579 30,465 30,055 29,652Division 9 37,644 37,296 36,826 36,589 35,998 35,421Division 10 19,764 19,493 19,120 18,856 18,446 18,040Division 11 242,663 243,669 244,439 246,030 246,576 247,207Division 12 24,203 23,816 23,597 23,418 22,878 22,313Division 13 24,544 24,164 23,623 23,514 23,306 23,119Division 14 40,298 39,644 39,278 38,820 38,224 37,631Division 15 82,407 82,306 82,317 82,529 82,244 81,982Division 16 38,488 38,436 38,349 38,162 37,896 37,647Division 17 41,007 40,724 41,027 41,370 41,370 41,429Division 18 32,816 33,084 33,425 33,874 34,013 34,190
Statistics Canada – Catalogue no. 91-214 81

Annual Demographic Estimates: Census Metropolitan Areas, Economic Regions and Census Divisions, Age and Sex
Table 3.8-2Saskatchewan census division — Population rate of growth from July to June
2001/2002 2002/2003 2003/2004 2004/2005 2005/2006
rate per thousand
Manitoba 3.7 5.4 7.4 3.1 3.1Division 1 6.6 10.9 6.7 -0.7 -1.2Division 2 20.3 20.3 28.2 28.4 29.3Division 3 11.9 16.9 19.0 18.3 19.5Division 4 -13.1 -17.3 -9.1 -5.0 -6.0Division 5 -18.2 -6.8 -12.7 -9.9 -10.8Division 6 -8.9 -9.3 -9.9 -8.6 -9.4Division 7 -1.0 6.4 12.2 8.9 8.2Division 8 -1.8 -6.0 -9.2 -7.2 -7.9Division 9 -1.3 8.3 19.1 -19.6 -21.0Division 10 13.0 23.8 20.0 18.7 17.4Division 11 4.5 4.9 6.4 1.7 1.8Division 12 5.4 12.9 11.5 1.2 0.5Division 13 8.9 8.1 15.7 11.7 11.2Division 14 -0.2 7.1 13.8 9.3 9.1Division 15 -5.4 -3.0 -3.9 -7.9 -9.0Division 16 -8.1 -3.3 -16.3 -27.3 -30.0Division 17 -11.1 -10.3 -5.9 -4.9 -5.2Division 18 2.2 13.2 -6.0 4.4 4.5Division 19 7.9 15.6 -1.0 1.1 1.0Division 20 -6.1 -27.2 -2.0 -13.6 -15.9Division 21 -6.5 0.7 -8.5 -14.1 -17.4Division 22 11.3 13.5 17.2 11.2 10.5Division 23 -23.5 -47.3 -4.4 2.6 2.3
Table 3.8-3Saskatchewan census division — Population estimates and factors of growth from July to June
2005/2006Population 2006(July 1) Natural
increaseNet
internationalmigration
Netinterprovincial
migration
Netintraprovincial
migration
Totalnet
migration
Totalgrowth
Saskatchewan 985,386 2,781 1,721 -9,073 0 -7,352 -4,571Division 1 29,399 33 4 -232 -20 -248 -215Division 2 20,469 -88 -9 -96 -146 -251 -339Division 3 13,474 -48 -3 -62 -257 -322 -370Division 4 11,297 -25 7 -108 50 -51 -76Division 5 30,934 -149 7 -95 -207 -295 -444Division 6 224,901 652 686 -2,088 650 -752 -100Division 7 46,281 -56 83 -570 -109 -596 -652Division 8 29,652 -29 17 -358 -33 -374 -403Division 9 35,421 -117 -1 -262 -197 -460 -577Division 10 18,040 -64 -6 -101 -235 -342 -406Division 11 247,207 1,014 814 -2,507 1,310 -383 631Division 12 22,313 16 16 -516 -81 -581 -565Division 13 23,119 89 1 -193 -84 -276 -187Division 14 37,631 -33 31 -339 -252 -560 -593Division 15 81,982 251 48 -574 13 -513 -262Division 16 37,647 180 34 -285 -178 -429 -249Division 17 41,429 475 -6 -624 214 -416 59Division 18 34,190 680 -2 -63 -438 -503 177
Note(s): With the exception of Quebec and British Columbia, preliminary estimates for July 1, 2006 are produced using the component method. The populationestimates for both these provinces were created by their respective agencies. As a result, the sum of components does not equal the populationgrowth for 2005/2006.
82 Statistics Canada – Catalogue no. 91-214
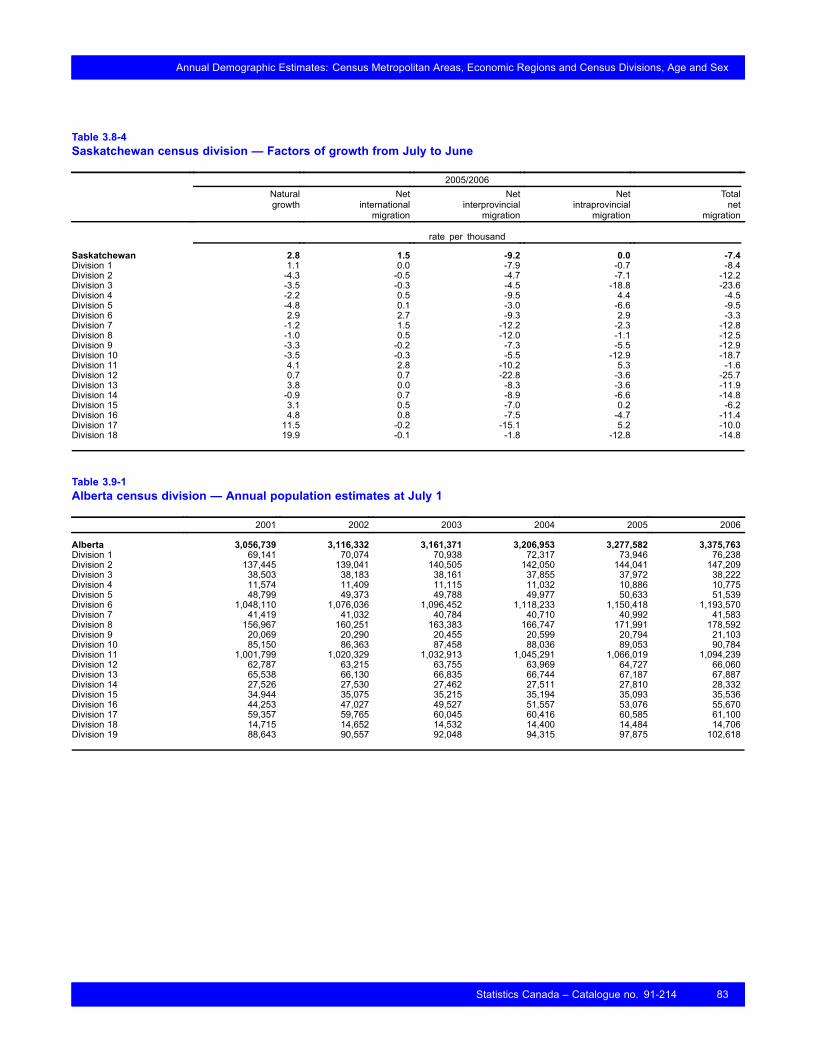
Annual Demographic Estimates: Census Metropolitan Areas, Economic Regions and Census Divisions, Age and Sex
Table 3.8-4Saskatchewan census division — Factors of growth from July to June
2005/2006Naturalgrowth
Netinternationalmigration
Netinterprovincial
migration
Netintraprovincial
migration
Totalnet
migration
rate per thousand
Saskatchewan 2.8 1.5 -9.2 0.0 -7.4Division 1 1.1 0.0 -7.9 -0.7 -8.4Division 2 -4.3 -0.5 -4.7 -7.1 -12.2Division 3 -3.5 -0.3 -4.5 -18.8 -23.6Division 4 -2.2 0.5 -9.5 4.4 -4.5Division 5 -4.8 0.1 -3.0 -6.6 -9.5Division 6 2.9 2.7 -9.3 2.9 -3.3Division 7 -1.2 1.5 -12.2 -2.3 -12.8Division 8 -1.0 0.5 -12.0 -1.1 -12.5Division 9 -3.3 -0.2 -7.3 -5.5 -12.9Division 10 -3.5 -0.3 -5.5 -12.9 -18.7Division 11 4.1 2.8 -10.2 5.3 -1.6Division 12 0.7 0.7 -22.8 -3.6 -25.7Division 13 3.8 0.0 -8.3 -3.6 -11.9Division 14 -0.9 0.7 -8.9 -6.6 -14.8Division 15 3.1 0.5 -7.0 0.2 -6.2Division 16 4.8 0.8 -7.5 -4.7 -11.4Division 17 11.5 -0.2 -15.1 5.2 -10.0Division 18 19.9 -0.1 -1.8 -12.8 -14.8
Table 3.9-1Alberta census division — Annual population estimates at July 1
2001 2002 2003 2004 2005 2006
Alberta 3,056,739 3,116,332 3,161,371 3,206,953 3,277,582 3,375,763Division 1 69,141 70,074 70,938 72,317 73,946 76,238Division 2 137,445 139,041 140,505 142,050 144,041 147,209Division 3 38,503 38,183 38,161 37,855 37,972 38,222Division 4 11,574 11,409 11,115 11,032 10,886 10,775Division 5 48,799 49,373 49,788 49,977 50,633 51,539Division 6 1,048,110 1,076,036 1,096,452 1,118,233 1,150,418 1,193,570Division 7 41,419 41,032 40,784 40,710 40,992 41,583Division 8 156,967 160,251 163,383 166,747 171,991 178,592Division 9 20,069 20,290 20,455 20,599 20,794 21,103Division 10 85,150 86,363 87,458 88,036 89,053 90,784Division 11 1,001,799 1,020,329 1,032,913 1,045,291 1,066,019 1,094,239Division 12 62,787 63,215 63,755 63,969 64,727 66,060Division 13 65,538 66,130 66,835 66,744 67,187 67,887Division 14 27,526 27,530 27,462 27,511 27,810 28,332Division 15 34,944 35,075 35,215 35,194 35,093 35,536Division 16 44,253 47,027 49,527 51,557 53,076 55,670Division 17 59,357 59,765 60,045 60,416 60,585 61,100Division 18 14,715 14,652 14,532 14,400 14,484 14,706Division 19 88,643 90,557 92,048 94,315 97,875 102,618
Statistics Canada – Catalogue no. 91-214 83

Annual Demographic Estimates: Census Metropolitan Areas, Economic Regions and Census Divisions, Age and Sex
Table 3.9-2Alberta census division — Population rate of growth from July to June
2001/2002 2002/2003 2003/2004 2004/2005 2005/2006
rate per thousand
Alberta 19.3 14.3 14.3 21.8 29.5Division 1 13.4 12.3 19.3 22.3 30.5Division 2 11.5 10.5 10.9 13.9 21.8Division 3 -8.3 -0.6 -8.1 3.1 6.6Division 4 -14.4 -26.1 -7.5 -13.3 -10.2Division 5 11.7 8.4 3.8 13.0 17.7Division 6 26.3 18.8 19.7 28.4 36.8Division 7 -9.4 -6.1 -1.8 6.9 14.3Division 8 20.7 19.4 20.4 31.0 37.7Division 9 11.0 8.1 7.0 9.4 14.8Division 10 14.1 12.6 6.6 11.5 19.3Division 11 18.3 12.3 11.9 19.6 26.1Division 12 6.8 8.5 3.4 11.8 20.4Division 13 9.0 10.6 -1.4 6.6 10.4Division 14 0.1 -2.5 1.8 10.8 18.6Division 15 3.7 4.0 -0.6 -2.9 12.5Division 16 60.8 51.8 40.2 29.0 47.7Division 17 6.9 4.7 6.2 2.8 8.5Division 18 -4.3 -8.2 -9.1 5.8 15.2Division 19 21.4 16.3 24.3 37.0 47.3
Table 3.9-3Alberta census division — Population estimates and factors of growth from July to June
2005/2006Population 2006(July 1) Natural
increaseNet
internationalmigration
Netinterprovincial
migration
Netintraprovincial
migration
Totalnet
migration
Totalgrowth
Alberta 3,375,763 21,679 19,397 57,105 0 76,502 98,181Division 1 76,238 236 307 1,695 54 2,056 2,292Division 2 147,209 928 759 2,666 -1,185 2,240 3,168Division 3 38,222 96 -50 288 -84 154 250Division 4 10,775 -15 7 81 -184 -96 -111Division 5 51,539 235 65 465 141 671 906Division 6 1,193,570 8,663 10,881 21,472 2,136 34,489 43,152Division 7 41,583 106 24 923 -462 485 591Division 8 178,592 1,120 288 3,728 1,465 5,481 6,601Division 9 21,103 160 25 256 -132 149 309Division 10 90,784 73 139 1,687 -168 1,658 1,731Division 11 1,094,239 6,277 6,090 13,729 2,124 21,943 28,220Division 12 66,060 496 -4 1,362 -521 837 1,333Division 13 67,887 212 -4 568 -76 488 700Division 14 28,332 165 64 539 -246 357 522Division 15 35,536 178 278 578 -591 265 443Division 16 55,670 764 318 2,745 -1,233 1,830 2,594Division 17 61,100 959 118 663 -1,225 -444 515Division 18 14,706 132 0 362 -272 90 222Division 19 102,618 894 92 3,298 459 3,849 4,743
Note(s): With the exception of Quebec and British Columbia, preliminary estimates for July 1, 2006 are produced using the component method. The populationestimates for both these provinces were created by their respective agencies. As a result, the sum of components does not equal the populationgrowth for 2005/2006.
84 Statistics Canada – Catalogue no. 91-214
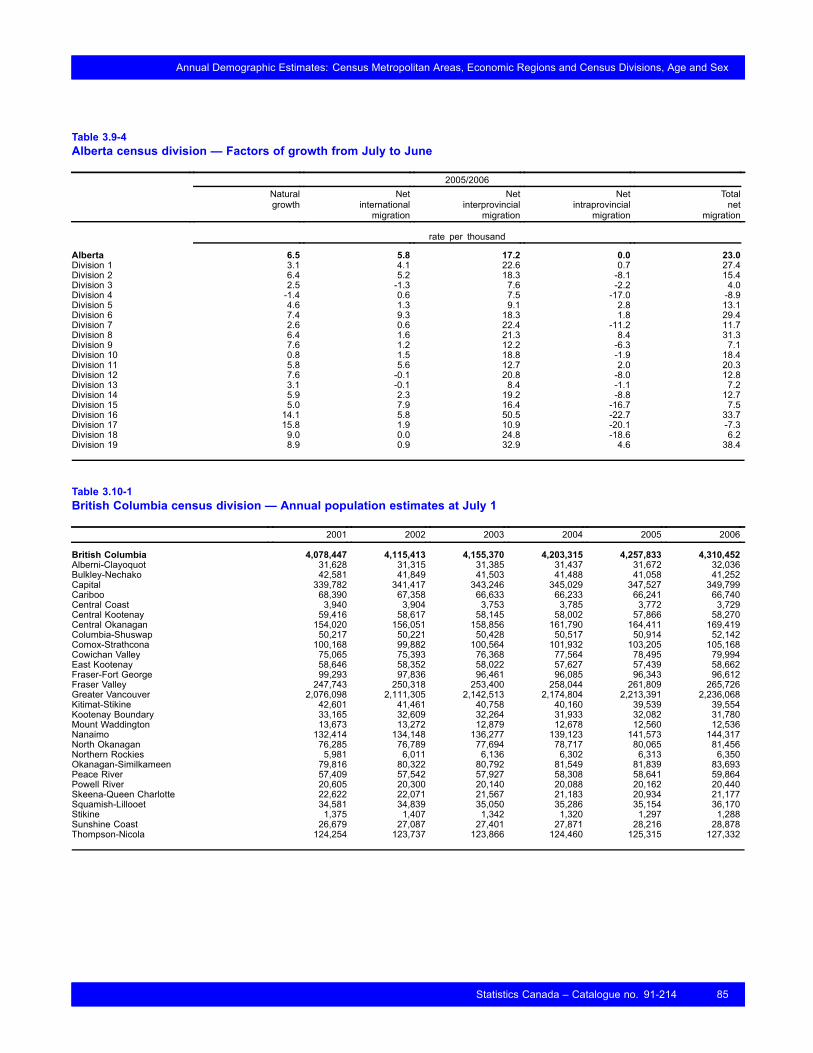
Annual Demographic Estimates: Census Metropolitan Areas, Economic Regions and Census Divisions, Age and Sex
Table 3.9-4Alberta census division — Factors of growth from July to June
2005/2006Naturalgrowth
Netinternationalmigration
Netinterprovincial
migration
Netintraprovincial
migration
Totalnet
migration
rate per thousand
Alberta 6.5 5.8 17.2 0.0 23.0Division 1 3.1 4.1 22.6 0.7 27.4Division 2 6.4 5.2 18.3 -8.1 15.4Division 3 2.5 -1.3 7.6 -2.2 4.0Division 4 -1.4 0.6 7.5 -17.0 -8.9Division 5 4.6 1.3 9.1 2.8 13.1Division 6 7.4 9.3 18.3 1.8 29.4Division 7 2.6 0.6 22.4 -11.2 11.7Division 8 6.4 1.6 21.3 8.4 31.3Division 9 7.6 1.2 12.2 -6.3 7.1Division 10 0.8 1.5 18.8 -1.9 18.4Division 11 5.8 5.6 12.7 2.0 20.3Division 12 7.6 -0.1 20.8 -8.0 12.8Division 13 3.1 -0.1 8.4 -1.1 7.2Division 14 5.9 2.3 19.2 -8.8 12.7Division 15 5.0 7.9 16.4 -16.7 7.5Division 16 14.1 5.8 50.5 -22.7 33.7Division 17 15.8 1.9 10.9 -20.1 -7.3Division 18 9.0 0.0 24.8 -18.6 6.2Division 19 8.9 0.9 32.9 4.6 38.4
Table 3.10-1British Columbia census division — Annual population estimates at July 1
2001 2002 2003 2004 2005 2006
British Columbia 4,078,447 4,115,413 4,155,370 4,203,315 4,257,833 4,310,452Alberni-Clayoquot 31,628 31,315 31,385 31,437 31,672 32,036Bulkley-Nechako 42,581 41,849 41,503 41,488 41,058 41,252Capital 339,782 341,417 343,246 345,029 347,527 349,799Cariboo 68,390 67,358 66,633 66,233 66,241 66,740Central Coast 3,940 3,904 3,753 3,785 3,772 3,729Central Kootenay 59,416 58,617 58,145 58,002 57,866 58,270Central Okanagan 154,020 156,051 158,856 161,790 164,411 169,419Columbia-Shuswap 50,217 50,221 50,428 50,517 50,914 52,142Comox-Strathcona 100,168 99,882 100,564 101,932 103,205 105,168Cowichan Valley 75,065 75,393 76,368 77,564 78,495 79,994East Kootenay 58,646 58,352 58,022 57,627 57,439 58,662Fraser-Fort George 99,293 97,836 96,461 96,085 96,343 96,612Fraser Valley 247,743 250,318 253,400 258,044 261,809 265,726Greater Vancouver 2,076,098 2,111,305 2,142,513 2,174,804 2,213,391 2,236,068Kitimat-Stikine 42,601 41,461 40,758 40,160 39,539 39,554Kootenay Boundary 33,165 32,609 32,264 31,933 32,082 31,780Mount Waddington 13,673 13,272 12,879 12,678 12,560 12,536Nanaimo 132,414 134,148 136,277 139,123 141,573 144,317North Okanagan 76,285 76,789 77,694 78,717 80,065 81,456Northern Rockies 5,981 6,011 6,136 6,302 6,313 6,350Okanagan-Similkameen 79,816 80,322 80,792 81,549 81,839 83,693Peace River 57,409 57,542 57,927 58,308 58,641 59,864Powell River 20,605 20,300 20,140 20,088 20,162 20,440Skeena-Queen Charlotte 22,622 22,071 21,567 21,183 20,934 21,177Squamish-Lillooet 34,581 34,839 35,050 35,286 35,154 36,170Stikine 1,375 1,407 1,342 1,320 1,297 1,288Sunshine Coast 26,679 27,087 27,401 27,871 28,216 28,878Thompson-Nicola 124,254 123,737 123,866 124,460 125,315 127,332
Statistics Canada – Catalogue no. 91-214 85

Annual Demographic Estimates: Census Metropolitan Areas, Economic Regions and Census Divisions, Age and Sex
Table 3.10-2British Columbia census division — Population rate of growth from July to June
2001/2002 2002/2003 2003/2004 2004/2005 2005/2006
rate per thousand
British Columbia 9.0 9.7 11.5 12.9 12.3Alberni-Clayoquot -9.9 2.2 1.7 7.4 11.4Bulkley-Nechako -17.3 -8.3 -0.4 -10.4 4.7Capital 4.8 5.3 5.2 7.2 6.5Cariboo -15.2 -10.8 -6.0 0.1 7.5Central Coast -9.2 -39.4 8.5 -3.4 -11.5Central Kootenay -13.5 -8.1 -2.5 -2.3 7.0Central Okanagan 13.1 17.8 18.3 16.1 30.0Columbia-Shuswap 0.1 4.1 1.8 7.8 23.8Comox-Strathcona -2.9 6.8 13.5 12.4 18.8Cowichan Valley 4.4 12.8 15.5 11.9 18.9East Kootenay -5.0 -5.7 -6.8 -3.3 21.1Fraser-Fort George -14.8 -14.2 -3.9 2.7 2.8Fraser Valley 10.3 12.2 18.2 14.5 14.9Greater Vancouver 16.8 14.7 15.0 17.6 10.2Kitimat-Stikine -27.1 -17.1 -14.8 -15.6 0.4Kootenay Boundary -16.9 -10.6 -10.3 4.7 -9.5Mount Waddington -29.8 -30.1 -15.7 -9.4 -1.9Nanaimo 13.0 15.7 20.7 17.5 19.2North Okanagan 6.6 11.7 13.1 17.0 17.2Northern Rockies 5.0 20.6 26.7 1.7 5.8Okanagan-Similkameen 6.3 5.8 9.3 3.5 22.4Peace River 2.3 6.7 6.6 5.7 20.6Powell River -14.9 -7.9 -2.6 3.7 13.7Skeena-Queen Charlotte -24.7 -23.1 -18.0 -11.8 11.5Squamish-Lillooet 7.4 6.0 6.7 -3.7 28.5Stikine 23.0 -47.3 -16.5 -17.6 -7.0Sunshine Coast 15.2 11.5 17.0 12.3 23.2Thompson-Nicola -4.2 1.0 4.8 6.8 16.0
86 Statistics Canada – Catalogue no. 91-214
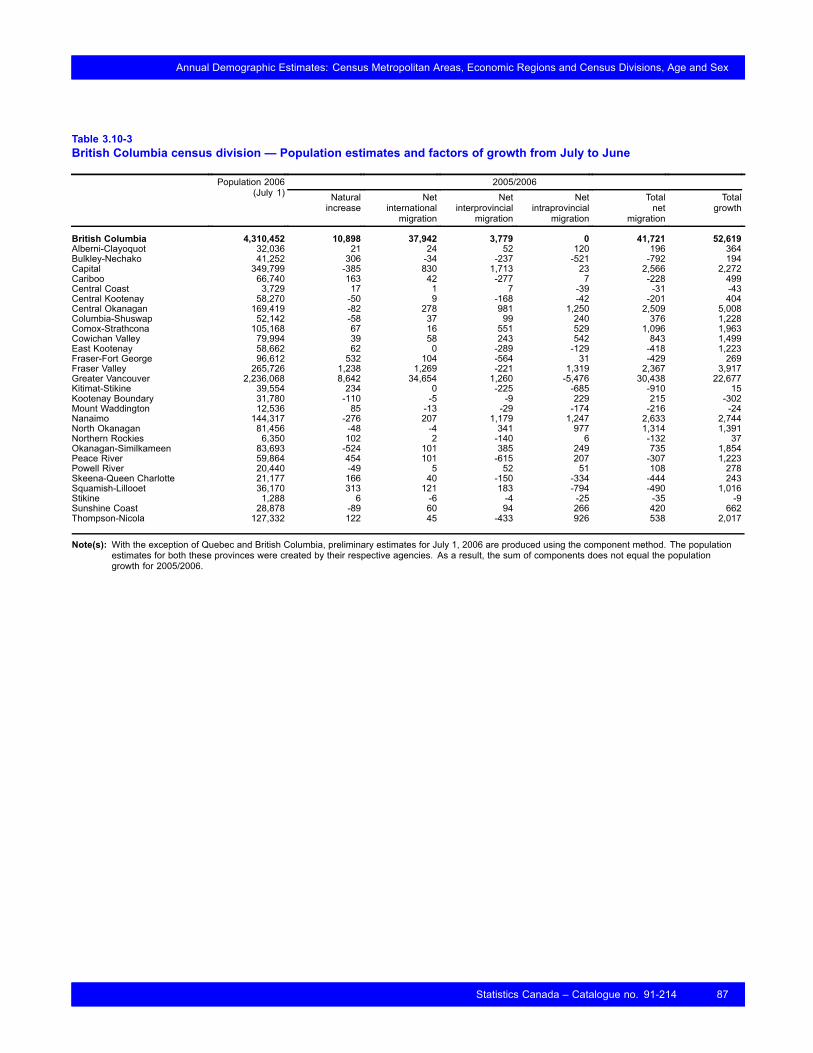
Annual Demographic Estimates: Census Metropolitan Areas, Economic Regions and Census Divisions, Age and Sex
Table 3.10-3British Columbia census division — Population estimates and factors of growth from July to June
2005/2006Population 2006(July 1) Natural
increaseNet
internationalmigration
Netinterprovincial
migration
Netintraprovincial
migration
Totalnet
migration
Totalgrowth
British Columbia 4,310,452 10,898 37,942 3,779 0 41,721 52,619Alberni-Clayoquot 32,036 21 24 52 120 196 364Bulkley-Nechako 41,252 306 -34 -237 -521 -792 194Capital 349,799 -385 830 1,713 23 2,566 2,272Cariboo 66,740 163 42 -277 7 -228 499Central Coast 3,729 17 1 7 -39 -31 -43Central Kootenay 58,270 -50 9 -168 -42 -201 404Central Okanagan 169,419 -82 278 981 1,250 2,509 5,008Columbia-Shuswap 52,142 -58 37 99 240 376 1,228Comox-Strathcona 105,168 67 16 551 529 1,096 1,963Cowichan Valley 79,994 39 58 243 542 843 1,499East Kootenay 58,662 62 0 -289 -129 -418 1,223Fraser-Fort George 96,612 532 104 -564 31 -429 269Fraser Valley 265,726 1,238 1,269 -221 1,319 2,367 3,917Greater Vancouver 2,236,068 8,642 34,654 1,260 -5,476 30,438 22,677Kitimat-Stikine 39,554 234 0 -225 -685 -910 15Kootenay Boundary 31,780 -110 -5 -9 229 215 -302Mount Waddington 12,536 85 -13 -29 -174 -216 -24Nanaimo 144,317 -276 207 1,179 1,247 2,633 2,744North Okanagan 81,456 -48 -4 341 977 1,314 1,391Northern Rockies 6,350 102 2 -140 6 -132 37Okanagan-Similkameen 83,693 -524 101 385 249 735 1,854Peace River 59,864 454 101 -615 207 -307 1,223Powell River 20,440 -49 5 52 51 108 278Skeena-Queen Charlotte 21,177 166 40 -150 -334 -444 243Squamish-Lillooet 36,170 313 121 183 -794 -490 1,016Stikine 1,288 6 -6 -4 -25 -35 -9Sunshine Coast 28,878 -89 60 94 266 420 662Thompson-Nicola 127,332 122 45 -433 926 538 2,017
Note(s): With the exception of Quebec and British Columbia, preliminary estimates for July 1, 2006 are produced using the component method. The populationestimates for both these provinces were created by their respective agencies. As a result, the sum of components does not equal the populationgrowth for 2005/2006.
Statistics Canada – Catalogue no. 91-214 87
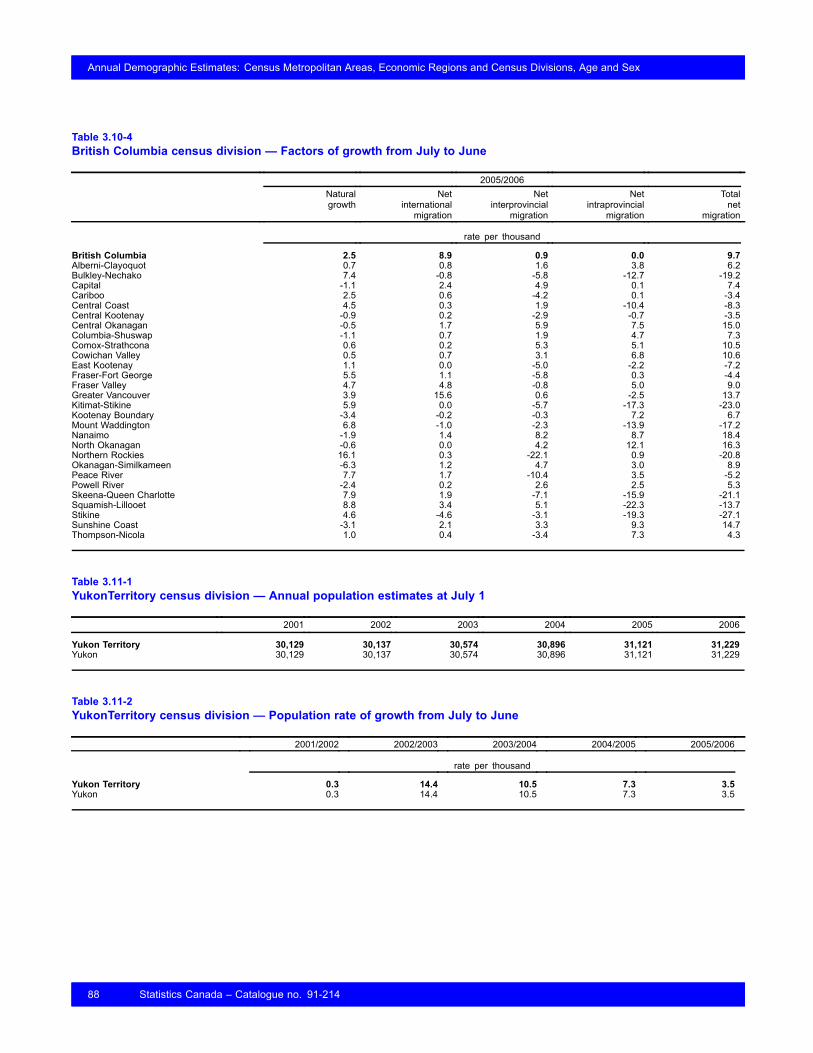
Annual Demographic Estimates: Census Metropolitan Areas, Economic Regions and Census Divisions, Age and Sex
Table 3.10-4British Columbia census division — Factors of growth from July to June
2005/2006Naturalgrowth
Netinternationalmigration
Netinterprovincial
migration
Netintraprovincial
migration
Totalnet
migration
rate per thousand
British Columbia 2.5 8.9 0.9 0.0 9.7Alberni-Clayoquot 0.7 0.8 1.6 3.8 6.2Bulkley-Nechako 7.4 -0.8 -5.8 -12.7 -19.2Capital -1.1 2.4 4.9 0.1 7.4Cariboo 2.5 0.6 -4.2 0.1 -3.4Central Coast 4.5 0.3 1.9 -10.4 -8.3Central Kootenay -0.9 0.2 -2.9 -0.7 -3.5Central Okanagan -0.5 1.7 5.9 7.5 15.0Columbia-Shuswap -1.1 0.7 1.9 4.7 7.3Comox-Strathcona 0.6 0.2 5.3 5.1 10.5Cowichan Valley 0.5 0.7 3.1 6.8 10.6East Kootenay 1.1 0.0 -5.0 -2.2 -7.2Fraser-Fort George 5.5 1.1 -5.8 0.3 -4.4Fraser Valley 4.7 4.8 -0.8 5.0 9.0Greater Vancouver 3.9 15.6 0.6 -2.5 13.7Kitimat-Stikine 5.9 0.0 -5.7 -17.3 -23.0Kootenay Boundary -3.4 -0.2 -0.3 7.2 6.7Mount Waddington 6.8 -1.0 -2.3 -13.9 -17.2Nanaimo -1.9 1.4 8.2 8.7 18.4North Okanagan -0.6 0.0 4.2 12.1 16.3Northern Rockies 16.1 0.3 -22.1 0.9 -20.8Okanagan-Similkameen -6.3 1.2 4.7 3.0 8.9Peace River 7.7 1.7 -10.4 3.5 -5.2Powell River -2.4 0.2 2.6 2.5 5.3Skeena-Queen Charlotte 7.9 1.9 -7.1 -15.9 -21.1Squamish-Lillooet 8.8 3.4 5.1 -22.3 -13.7Stikine 4.6 -4.6 -3.1 -19.3 -27.1Sunshine Coast -3.1 2.1 3.3 9.3 14.7Thompson-Nicola 1.0 0.4 -3.4 7.3 4.3
Table 3.11-1YukonTerritory census division — Annual population estimates at July 1
2001 2002 2003 2004 2005 2006
Yukon Territory 30,129 30,137 30,574 30,896 31,121 31,229Yukon 30,129 30,137 30,574 30,896 31,121 31,229
Table 3.11-2YukonTerritory census division — Population rate of growth from July to June
2001/2002 2002/2003 2003/2004 2004/2005 2005/2006
rate per thousand
Yukon Territory 0.3 14.4 10.5 7.3 3.5Yukon 0.3 14.4 10.5 7.3 3.5
88 Statistics Canada – Catalogue no. 91-214
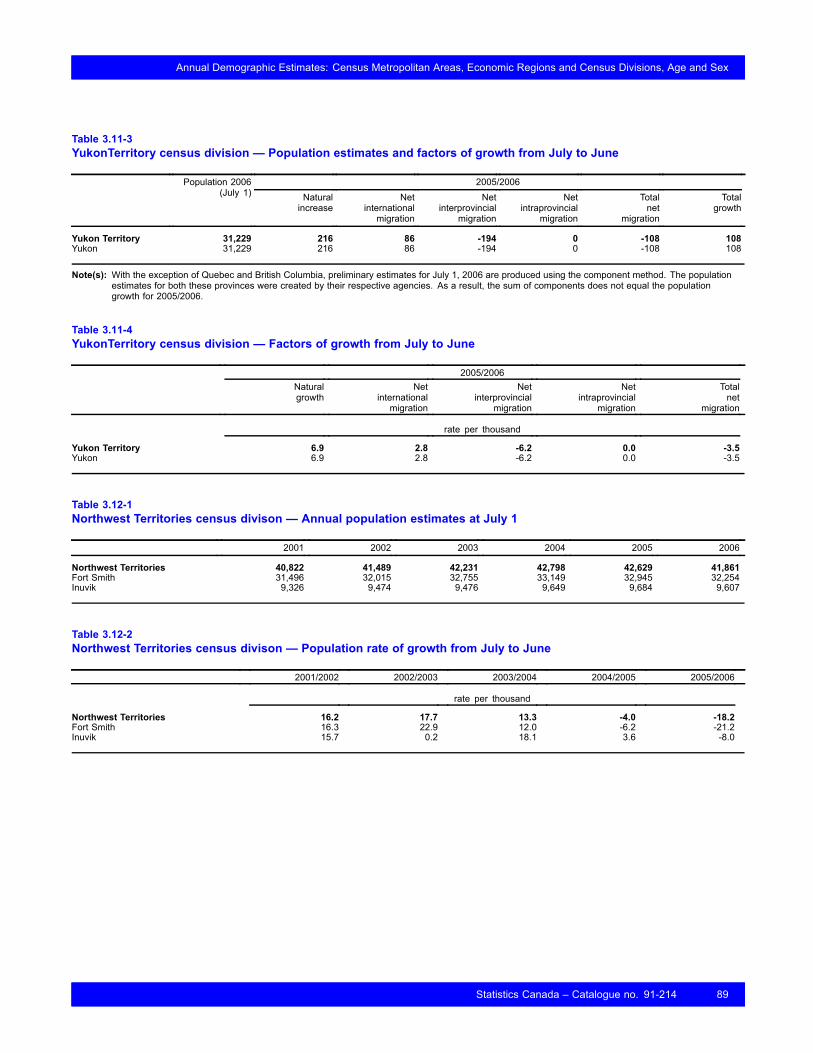
Annual Demographic Estimates: Census Metropolitan Areas, Economic Regions and Census Divisions, Age and Sex
Table 3.11-3YukonTerritory census division — Population estimates and factors of growth from July to June
2005/2006Population 2006(July 1) Natural
increaseNet
internationalmigration
Netinterprovincial
migration
Netintraprovincial
migration
Totalnet
migration
Totalgrowth
Yukon Territory 31,229 216 86 -194 0 -108 108Yukon 31,229 216 86 -194 0 -108 108
Note(s): With the exception of Quebec and British Columbia, preliminary estimates for July 1, 2006 are produced using the component method. The populationestimates for both these provinces were created by their respective agencies. As a result, the sum of components does not equal the populationgrowth for 2005/2006.
Table 3.11-4YukonTerritory census division — Factors of growth from July to June
2005/2006Naturalgrowth
Netinternationalmigration
Netinterprovincial
migration
Netintraprovincial
migration
Totalnet
migration
rate per thousand
Yukon Territory 6.9 2.8 -6.2 0.0 -3.5Yukon 6.9 2.8 -6.2 0.0 -3.5
Table 3.12-1Northwest Territories census divison — Annual population estimates at July 1
2001 2002 2003 2004 2005 2006
Northwest Territories 40,822 41,489 42,231 42,798 42,629 41,861Fort Smith 31,496 32,015 32,755 33,149 32,945 32,254Inuvik 9,326 9,474 9,476 9,649 9,684 9,607
Table 3.12-2Northwest Territories census divison — Population rate of growth from July to June
2001/2002 2002/2003 2003/2004 2004/2005 2005/2006
rate per thousand
Northwest Territories 16.2 17.7 13.3 -4.0 -18.2Fort Smith 16.3 22.9 12.0 -6.2 -21.2Inuvik 15.7 0.2 18.1 3.6 -8.0
Statistics Canada – Catalogue no. 91-214 89

Annual Demographic Estimates: Census Metropolitan Areas, Economic Regions and Census Divisions, Age and Sex
Table 3.12-3Northwest Territories census divison — Population estimates and factors of growth from July to June
2005/2006Population 2006(July 1) Natural
increaseNet
internationalmigration
Netinterprovincial
migration
Netintraprovincial
migration
Totalnet
migration
Totalgrowth
Northwest Territories 41,861 472 87 -1,327 0 -1,240 -768Fort Smith 32,254 361 73 -1,138 13 -1,052 -691Inuvik 9,607 111 14 -189 -13 -188 -77
Note(s): With the exception of Quebec and British Columbia, preliminary estimates for July 1, 2006 are produced using the component method. The populationestimates for both these provinces were created by their respective agencies. As a result, the sum of components does not equal the populationgrowth for 2005/2006.
Table 3.12-4Northwest Territories census divison — Factors of growth from July to June
2005/2006Naturalgrowth
Netinternationalmigration
Netinterprovincial
migration
Netintraprovincial
migration
Totalnet
migration
rate per thousand
Northwest Territories 11.2 2.1 -31.4 0.0 -29.4Fort Smith 11.1 2.2 -34.9 0.4 -32.3Inuvik 11.5 1.5 -19.6 -1.3 -19.5
Table 3.13-1Nunavut census division — Annual population estimates at July 1
2001 2002 2003 2004 2005 2006
Nunavut 28,121 28,739 29,165 29,633 30,040 30,782Baffin 15,116 15,491 15,626 15,888 16,113 16,563Keewatin 7,941 8,047 8,185 8,367 8,500 8,690Kitikmeot Region 5,064 5,201 5,354 5,378 5,427 5,529
Table 3.13-2Nunavut census division — Population rate of growth from July to June
2001/2002 2002/2003 2003/2004 2004/2005 2005/2006
rate per thousand
Nunavut 21.7 14.7 15.9 13.6 24.4Baffin 24.5 8.7 16.6 14.1 27.5Keewatin 13.3 17.0 22.0 15.8 22.1Kitikmeot Region 26.7 29.0 4.5 9.1 18.6
90 Statistics Canada – Catalogue no. 91-214

Annual Demographic Estimates: Census Metropolitan Areas, Economic Regions and Census Divisions, Age and Sex
Table 3.13-3Nunavut census division — Population estimates and factors of growth from July to June
2005/2006Population 2006(July 1) Natural
increaseNet
internationalmigration
Netinterprovincial
migration
Netintraprovincial
migration
Totalnet
migration
Totalgrowth
Nunavut 30,782 634 4 104 0 108 742Baffin 16,563 356 -2 93 3 94 450Keewatin 8,690 202 3 -3 -12 -12 190Kitikmeot Region 5,529 76 3 14 9 26 102
Note(s): With the exception of Quebec and British Columbia, preliminary estimates for July 1, 2006 are produced using the component method. The populationestimates for both these provinces were created by their respective agencies. As a result, the sum of components does not equal the populationgrowth for 2005/2006.
Table 3.13-4Nunavut census division — Factors of growth from July to June
2005/2006Naturalgrowth
Netinternationalmigration
Netinterprovincial
migration
Netintraprovincial
migration
Totalnet
migration
rate per thousand
Nunavut 20.8 0.1 3.4 0.0 3.6Baffin 21.8 -0.1 5.7 0.2 5.8Keewatin 23.5 0.3 -0.3 -1.4 -1.4Kitikmeot Region 13.9 0.5 2.6 1.6 4.7
Statistics Canada – Catalogue no. 91-214 91
Annual Demographic Estimates: Census Metropolitan Areas, Economic Regions and Census Divisions, Age and Sex
Glossary
Age
Age at July 1.
Ageing (of a population)
An increase in the number of old persons as a percentage of the total population.
Census coverage
Net undercoverage: Difference between undercoverage and overcoverage.
Overcoverage: Number of persons who should not have been counted in the census or who were counted morethan once.
Undercoverage: Number of persons who were intended to have been enumerated in a census but were notenumerated.
Census division (CD)
Refers to the general term applying to geographic areas established by provincial or territorial law, which areintermediate geographic areas between the census subdivision and the province or territory (e.g., divisions,counties, regional districts, regional municipalities and seven other types of geographic areas made up of groupsof census subdivisions).
In Newfoundland and Labrador, Manitoba, Saskatchewan, Alberta, Yukon Territory, Northwest Territories andNunavut, provincial or territorial law does not provide for these administrative geographic areas. Therefore, censusdivisions have been created by Statistics Canada in cooperation with these provinces or territories (2001 CensusDictionary, catalogue no. 92-378-X, page 210).
Census metropolitan area (CMA)
The general concept of a census metropolitan area (CMA) is one of a very large urban area, together with adjacenturban and rural areas which have a high degree of economic and social integration with that urban area.
A Census Metropolitan Area is delineated around an urban area, called the urbanized core and having a populationof at least 100,000 (based on the previous census). Once an area becomes a CMA, it is retained in the programeven if its population subsequently declines.
CMAs are comprised of one or more census subdivisions (CSDs) which meet at least one of the following criteria:(1) the CSD falls completely or partly inside the urbanized core; (2) at least 50% of the employed labour force livingin the CSD works in the urbanized core; or (3) at least 25% of the employed labour force working in the CSD livesin the urbanized core (2001 Census Dictionary, catalogue no. 92-378-X, page 214).
92 Statistics Canada – Catalogue no. 91-214
Annual Demographic Estimates: Census Metropolitan Areas, Economic Regions and Census Divisions, Age and Sex
Components of demographic growth
Any of the classes of events generating population movement variations. Births, deaths and migration are thecomponents responsible for the variation since they alter either the total population or the age and sex of thepopulation.
Dependency ratio
The ratio of the combined population aged between 0 to 19 years old and the population aged of 65 years andover to the population aged between 20 to 64 years old.
Economic region (ER)
Refers to a grouping of complete census divisions (with one exception in Ontario) created as a standard geographicunit for analysis of regional economic activity.
Within the province of Quebec, economic regions (the “régions administratives”) are designated by law. In all otherprovinces or territories, economic regions are created by agreement between Statistics Canada and the provincesor territories concerned. Prince Edward Island and the three territories each consist of one economic region. InOntario, there is one exception where the economic region boundary does not respect census division boundaries:the census division of Halton is split between the ER of Hamilton – Niagara Peninsula and the ER of Toronto.(2001 Census Dictionary, catalogue no. 92-378-X, page 237).
Emigrant
Canadian citizen or immigrant who has left Canada to establish a permanent residence in another country.
Error of closure
Difference between the postcensal estimate for the same date as the census and the results of the census adjustedfor net undercoverage.
Immigrant
Within the framework of this publication, the term immigrant refers to landed immigrant. A landed immigrant is aperson who does not have Canadian citizenship but was granted the right by immigration authorities to live in Canadaon a permanent basis.
International migration
International migration represents movement of population between Canada and a foreign country which involvesa change in the usual place of residence. A distinction is made with regard to immigrants, emigrants, returningemigrants, net temporary emigration and net non-permanent residents.
Interprovincial migration
Interprovincial migration represents movement from one province or territory involving a permanent change inresidence. A person who takes up residence in another province or territory is an out-migrant with reference to theprovince or territory of origin and an in-migrant with reference to the province or territory of destination.
Statistics Canada – Catalogue no. 91-214 93
Annual Demographic Estimates: Census Metropolitan Areas, Economic Regions and Census Divisions, Age and Sex
Intraprovincial migration
Intraprovincial migration represents movements from one region to another within the same province or territoryinvolving a permanent change of residence. A person who takes up residence in another region is an out-migrantwith reference to the region of origin and an in-migrant with reference to the region of destination.
Mean age
The mean age of a population is the average age of all its members.
Median age
The median age is an age "x", such that exactly one half of the population is older than "x" and the other half isyounger than "x".
Natural increase
Variation in population size over a given period as a result of the difference between the numbers of births anddeaths.
Net internal migration
Sum of net intraprovincial and netinterprovincial migration.
Net international migration
Net international migration is obtained according to the following formula: Immigrants + returning emigrants + netnon-permanent residents– (emigrants + net temporary emigrants)
Net interprovincial migration
Net interprovincial migration represents the difference between in-migrants and out-migrants for a given province orterritory.
Net intraprovincial migration
Net intraprovincial migration represents the difference between in-migrants and out-migrants in a given region. Aregion can be defined as a census division, an economic region or a census metropolitan area.
Net non-permanent residents
Net non-permanent residents represent the variation in the number of non-permanent residents between two dates.
Non-permanent residents
A non permanent resident belongs to one of the five following groups:
• persons residing in Canada claiming refugee status;
• persons residing in Canada who hold a study permit;
94 Statistics Canada – Catalogue no. 91-214
Annual Demographic Estimates: Census Metropolitan Areas, Economic Regions and Census Divisions, Age and Sex
• persons residing in Canada who hold a work permit;
• persons residing in Canada who hold a minister’s permit;
• all non-Canadian dependants of persons claiming refugee status, or of persons holding study permits, workpermits or minister’s permits and living in Canada.
Net temporary emigration
Net temporary emigration represents the variation in the number of temporary emigrants between two dates.Temporary emigration includes Canadian citizens and immigrants living temporarily abroad who have notmaintained a usual place of residence in Canada.
Population
Estimated population and population according to the census are both defined as being the number of Canadianswhose usual place of residence is in that area, regardless of where they happened to be on Census Day. Alsoincluded are any Canadians staying in a dwelling in that area on Census Day and having no usual place of residenceelsewhere in Canada, as well as those considered non-permanent residents.
Population estimate
(a) Postcensal : Population estimate produced by using data from the most recent available census adjustedfor net undercoverage and estimate of the population growth since that last census. This estimate can bepreliminary, updated or final.
(b) Intercensal: Population estimate derived by using postcensal estimates and data adjusted for netundercoverage of censuses preceding and following the year in question.
Population growth or total growth
Variation of population size between two dates. It can also be obtained by summing the natural increase, totalnet migration and if possible, residual deviation. It can be positive or negative.
Precocity errors
Difference between preliminary and final estimate of a particular component in terms of its relative proportion ofthe total population for the relevant geographical area. It can be calculated for both population and componentestimates.
Rate
Refers to the ratio of the number of events estimated in a year (t, t+1) to the average populations at the beginningand the end of the period. In this regard, the rates of births, deaths, immigration, etc are calculated. Generally, therate is expressed in per 1,000.
Demographic growth or population growth: Ratio of population growth between the year t and t+1, to the averagepopulation of both these years. The rate is generally expressed in per 1,000.
Net undercoverage of population: Difference between undercoverage rate and overcoverage rate.
Overcoverage of population: The ratio of the estimate number of persons who should not have been counted inthe census or who were counted more than once to the total number of persons that should have been enumeratedin the census. Generally, the rate is expressed in percentage.
Statistics Canada – Catalogue no. 91-214 95
Annual Demographic Estimates: Census Metropolitan Areas, Economic Regions and Census Divisions, Age and Sex
Undercoverage of population: The ratio of the estimated number of persons not enumerated in the census (whowere intended to have been enumerated) to the total number of persons that should have been enumerated in thecensus. Generally, the rate is expressed in percentage.
Residual deviation
Difference between demographic population growth calculated using intercensal estimates of populationbetween two dates and that obtained by the sum of the components for the same period. This deviation resultsfrom the distribution of the error of closure between years within the quinquennial period.
Returning emigrant
Canadian citizen or immigrant having previously emigrated from Canada and subsequently returned to the country.
Sex ratio
The ratio of the number of male to the number of female. This is not to be confused with the sex ratio at birth, whichis the ratio of the number of live-born boys to the number of live-born girls. This ratio is usually expressed as anindex, with the number of females taken to be a base of 100.
Total net migration
Sum of net international, net interprovincial and net intraprovincial migration.
Vital statistics
Includes all the demographic events (that is to say births, deaths, marriages and divorces) for which there exists alegal requirement to inform the Provincial or Territorial Registrar’s Office.
Year
Unless otherwise specified, the term year refers to the period beginning July 1 of a given year and ending June 30 ofthe following year.
96 Statistics Canada – Catalogue no. 91-214

Annual Demographic Estimates: Census Metropolitan Areas, Economic Regions and Census Divisions, Age and Sex
Explanatory notes for thetables
Annual population estimates, July 1, subprovincial perspectivePopulation
Population estimates for July 1 are final postcensal from 2001 to 2003, updated postcensal for 2004 and 2005 andpreliminary postcensal for 2006.
Annual estimates of demographic componentsBirths
The numbers of births are final up to 2003/2004, updated for 2004/2005 and preliminary for 2005/2006.
Deaths
The numbers of deaths are final up to 2002/2003, updated for 2003/2004 and 2004/2005 and preliminaryfor 2005/2006.
Immigrants
The numbers of immigrants are final up to 2003/2004, updated for 2004/2005 and preliminary for 2005/2006.
Emigrants
The numbers of emigrants are final up to 2002/2003, updated for 2003/2004 and 2004/2005 and preliminaryfor 2005/2006.
Returning emigrants
The numbers of returning emigrants are final up to 2002/2003, updated for 2003/2004 and 2004/2005 and preliminaryfor 2005/2006.
Net temporary emigrants
The numbers of net temporary emigrants are final up to 2002/2003, updated for 2003/2004 and 2004/2005 andpreliminary for 2005/2006.
Net non-permanent residents
The numbers of net non-permanent residents are final up to 2002/2003, updated for 2003/2004 and 2004/2005 andpreliminary for 2005/2006.
Statistics Canada – Catalogue no. 91-214 97

Annual Demographic Estimates: Census Metropolitan Areas, Economic Regions and Census Divisions, Age and Sex
Interprovincial in-migrants
The numbers of interprovincial in-migrants are final up to 2004/2005 and preliminary for 2005/2006.
Interprovincial out-migrants
The numbers of interprovincial out-migrants are final up to 2004/2005 and preliminary for 2005/2006.
Intraprovincial in-migrants
The numbers of intraprovincial in-migrants are final up to 2004/2005 and preliminary for 2005/2006. For the economicregions, the number of intraprovincial in-migrants is not available.
Intraprovincial out-migrants
The numbers of intraprovincial out-migrants are final up to 2004/2005 and preliminary for 2005/2006. For theeconomic regions, the number of intraprovincial out-migrants is not available.
Annual population estimates and factors of growthNatural increase
Natural increase is final up to 2002/2003, updated for 2003/2004 and 2004/2005 and preliminary for 2005/2006.
Net international migration
Net international migrationnumbersare final up to 2002/2003, updated for 2003/2004 and 2004/2005 and preliminaryfor 2005/2006.
Net interprovincial migration
Net interprovincial migrationnumbersare final up to 2004/2005 and preliminary for 2005/2006.
Net intraprovincial migration
Net intraprovincial migrationnumbersare final up to 2004/2005 and preliminary for 2005/2006.
Total net migration
Total net migrationnumbersare final up to 2002/2003, updated for 2003/2004 and 2004/2005 and preliminaryfor 2005/2006.
Total growth
Numbers for total growthare final up to 2002/2003, updated for 2003/2004 and 2004/2005 and preliminaryfor 2005/2006.
98 Statistics Canada – Catalogue no. 91-214
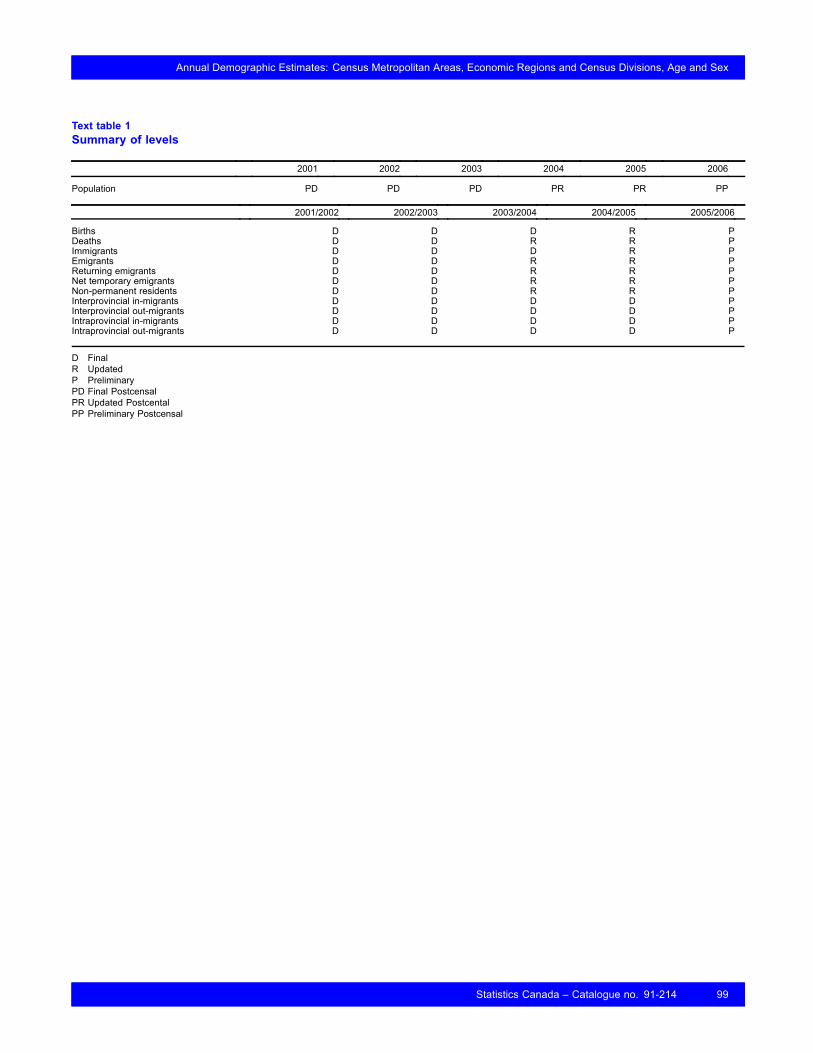
Annual Demographic Estimates: Census Metropolitan Areas, Economic Regions and Census Divisions, Age and Sex
Text table 1Summary of levels
2001 2002 2003 2004 2005 2006
Population PD PD PD PR PR PP
2001/2002 2002/2003 2003/2004 2004/2005 2005/2006
Births D D D R PDeaths D D R R PImmigrants D D D R PEmigrants D D R R PReturning emigrants D D R R PNet temporary emigrants D D R R PNon-permanent residents D D R R PInterprovincial in-migrants D D D D PInterprovincial out-migrants D D D D PIntraprovincial in-migrants D D D D PIntraprovincial out-migrants D D D D P
D FinalR UpdatedP PreliminaryPD Final PostcensalPR Updated PostcentalPP Preliminary Postcensal
Statistics Canada – Catalogue no. 91-214 99

Annual Demographic Estimates: Census Metropolitan Areas, Economic Regions and Census Divisions, Age and Sex
Quality of estimates
Postcensal population estimates
The postcensal estimates contain certain inaccuracies stemming from two types of errors:
(a) errors in the 2001 Census data (the base population on which these estimates were built);
(b) imperfections in other data sources and the method used to estimate the components.
Errors in census data
Census data for total population by province or territory are affected by coverage errors. These errors occur whendwellings and/or individuals are missed, incorrectly included or counted more than once. Following each census,Statistics Canada undertakes coverage studies to measure these errors. The main studies are the ReverseRecord Check Survey (RRC) and the Census Overcoverage Study (COS). Based on these studies, estimates ofnet undercoverage (which is equal to the difference between undercoverage and overcoverage) are produced.Demography Division adjusts the population enumerated in the census by province and territory using theseestimates. At the subprovincial level these rates were applied to all geographic regions in the province or territory.Text table 1Estimated net undercoverage of population, 2001 to 2006 Censuses, Canada, provinces and territories
2001 2006Number Rate in
percentNumber Rate in
percent
Canada 712,119 2.41 958,968 3.10
Newfoundland and Labrador 8,840 1.58 9,401 1.80Prince Edward Island 896 0.66 1,325 0.97Nova Scotia 21,126 2.27 24,521 2.63New Brunswick 14,073 1.87 20,095 2.68Quebec 102,680 1.42 152,880 2.07Ontario 304,139 2.75 452,309 3.81Manitoba 19,052 1.68 31,013 2.70Saskatchewan 28,599 2.81 21,812 2.18Alberta 71,971 2.60 74,834 2.45British Columbia 137,446 3.56 164,805 4.05Yukon Territory 467 1.50 1,422 4.72Northwest Territories 1,979 4.75 3,295 8.10Nunavut 851 3.33 1,256 4.49
The adjustment also incorporates the results of a study on the estimates of the number of people living onincompletely enumerated Indian reserves to complete the corrections for coverage errors in the census. Theresults of the coverage studies contain mainly sampling errors. For further information regarding the main coveragestudies, please see the following document on Statistics Canada’s web site: 2001 Census Technical Report onCoverage.
Errors coming from methodology and other data sources
Errors due to estimation methodologies and data sources other than the census are can also be significant.
100 Statistics Canada – Catalogue no. 91-214
Annual Demographic Estimates: Census Metropolitan Areas, Economic Regions and Census Divisions, Age and Sex
Since the law requires the recording of vital statistics, births and deaths data meet very high standards. Nevertheless,since preliminary estimates are derived, they can be slightly different from final estimates.
With respect to immigrats and non-permanent residents, Citizenship and Immigration Canada administers specialdata files on both of these components. Since immigration is controlled by law (the Immigration Act), data onimmigrants and non-permanent residents are compiled upon arrival in Canada. These data represent only "legal"immigration and exclude illegal immigrants. Thus, for the "legal" part of international movement into Canada, thedata are considered to be of high quality.
However, some biases such as the difference between the place of intended residence at the time of arrival andthe actual place of residence, may persist. Finally, since information provided by the Visitor Data System fromCitizenship and Immigration Canada is not complete (age and sex of dependents, province of residence for certaingroups of permit holders), estimates of nonpermanent residents are more prone to error than data on immigrants.
Estimates of the number of emigrants and returning emigrants are both derived using Child Tax Benefit (CTB) dataprovided by Canada Revenue Agency (CRA). Data are adjusted to take into account the incomplete coverage of theCTB program and to derive the emigration and returning emigration of adults. These adjustments and the delay inobtaining the data are the two main sources of errors.
As current information on the number of persons living temporarily abroad does not exist, estimates are based onthe Reverse Record Check (RRC) and the census. Estimates for the intercensal period, distributed equally amongthe five years, are maintained constant for the postcensal period. Moreover, assumptions were made to allow for thedistribution of national data by subprovincial regions. Any geographical or quarterly variation may introduce error inthe estimation of these components.
While preliminary estimates of interprovincial migration are produced using data from the Child Tax Benefit (CTB)program, final estimates are calculated from the annual taxfile received from Canada Revenue Agency (CRA). Sincethe two estimates of interprovincial migration are produced from different sources of information, they are moresubject to error. Moreover, as no preliminary data is available for subprovincial migration, we assume the samelevel of migration as the previous year. The last two years are therefore identical for this component.
Geographical changes
Subprovincial geographical boundaries may change from one census to another. In order to facilitate chronologicalstudies, population estimates for CDs, CMAs and ER were produced for the 1986 to 2006 period according toboundaries delineated in the 2001 Census.
In order to clarify the demographic significance of geographical boundary changes, the 1996 population estimatesaccording to 1996 Census boundaries will be compared to those of the same year based on 2001 Census boundaries.Data presented here apply to population enumerated in the 1996 Census without adjustment for net undercoverage.
Census metropolitan areas (CMAs)
Among the 25 CMAs as defined in the 1996 Census1, 10 have undergone geographical boundarychanges in the 2001 Census. Had the latter been applied in 1996, population in all 25 CMAs would havereached 17,898,000 instead of 17,885,000, representing a slight increase of 33,000 persons or 0.2%
In certain CMAs, the demographic repercussions of boundary changes were more pronounced. In London, therelative gain attributable to boundary change reached 4.5% and surpassed 1% in four other CMAs: Greater Sudbury(3.2%), Halifax (3.1%), Windsor (2.9%) and Thunder Bay (1.5%).
In some cases (Montréal, Toronto and Winnipeg), boundary changes had a negligible effect on population.
1. Two new CMAs were added in the 2001 Census Abbotsford in British Columbia and Kingston in Ontario.
Statistics Canada – Catalogue no. 91-214 101

Annual Demographic Estimates: Census Metropolitan Areas, Economic Regions and Census Divisions, Age and Sex
In one instance, the boundary change translated into a decline in population. The Ontarian part of theOttawa-Gatineau CMA dropped by 11,800 persons (1.5%).
Census divisions (CDs)
Boundary changes affected 34 of the 288 CDs in Canada and population in 17 CDs was negligibly affected withrelative gains/losses not exceeding 0.1%.
Boundary changes greatly impacted population numbers in five CDs located in Ontario and Quebec. The CD mostaffected was Val-Saint-François in Quebec, with a loss of 15.8% followed by in decreasing order, Northumberland inOntario (-9.0%), Rouville in Quebec (-8.8%), and Sudbury in Ontario (-6.4%). Finally, the CD of Hastings, in Ontario,registered gains of 6.2%.
Quality assessment
In order to assess the quality of our estimates, two evaluation measures are used: precocity errors and errors ofclosure.
Precocity errors
The quality of preliminary estimates of components is analysed using precocity errors. Precocity error, which iscalculated on a quarterly basis, is defined as the difference between preliminary and final estimate of a particularcomponent in terms of its relative proportion of the total population for the relevant geographical area. It can becalculated for both population and component estimates.
Precocity error allows for useful comparisons between components, as well as between different geographical levelof different population size.
Generally speaking, net interprovincial and subprovincial migration yields the greatest precocity errors. This is likelythe result of the use of different data sources for preliminary and final estimates of interprovincial migration. In mostyears and for most provinces/territories, births, deaths and immigration estimates yielded the smallest precocityerrors. For immigration estimates, this reflects the completeness of the data source and the availability of data forthe more timely preliminary estimates. In the case of births and deaths, small precocity errors support the use ofshort-term projections for preliminary estimates.
According to the analysis of the most recent precocity errors and assuming that the quality of the basic data remainsconstant, the present postcensal estimates should have an acceptable degree of reliability.
102 Statistics Canada – Catalogue no. 91-214
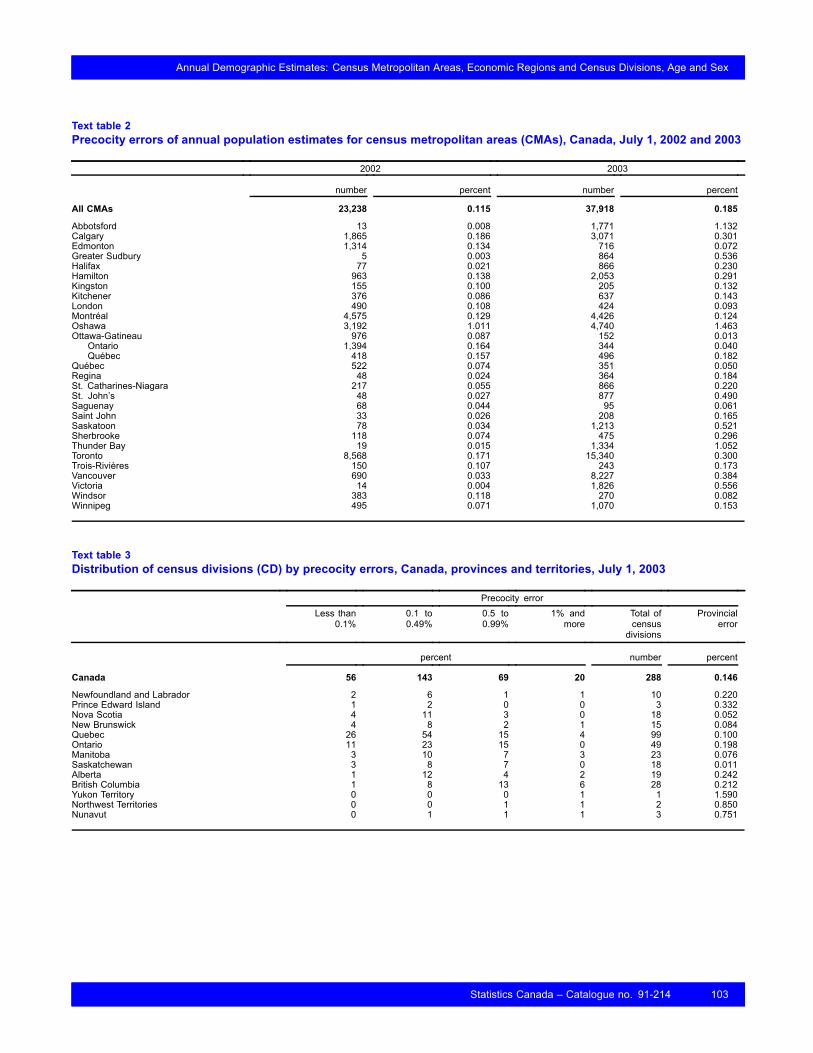
Annual Demographic Estimates: Census Metropolitan Areas, Economic Regions and Census Divisions, Age and Sex
Text table 2Precocity errors of annual population estimates for census metropolitan areas (CMAs), Canada, July 1, 2002 and 2003
2002 2003
number percent number percent
All CMAs 23,238 0.115 37,918 0.185
Abbotsford 13 0.008 1,771 1.132Calgary 1,865 0.186 3,071 0.301Edmonton 1,314 0.134 716 0.072Greater Sudbury 5 0.003 864 0.536Halifax 77 0.021 866 0.230Hamilton 963 0.138 2,053 0.291Kingston 155 0.100 205 0.132Kitchener 376 0.086 637 0.143London 490 0.108 424 0.093Montréal 4,575 0.129 4,426 0.124Oshawa 3,192 1.011 4,740 1.463Ottawa-Gatineau 976 0.087 152 0.013
Ontario 1,394 0.164 344 0.040Québec 418 0.157 496 0.182
Québec 522 0.074 351 0.050Regina 48 0.024 364 0.184St. Catharines-Niagara 217 0.055 866 0.220St. John’s 48 0.027 877 0.490Saguenay 68 0.044 95 0.061Saint John 33 0.026 208 0.165Saskatoon 78 0.034 1,213 0.521Sherbrooke 118 0.074 475 0.296Thunder Bay 19 0.015 1,334 1.052Toronto 8,568 0.171 15,340 0.300Trois-Rivières 150 0.107 243 0.173Vancouver 690 0.033 8,227 0.384Victoria 14 0.004 1,826 0.556Windsor 383 0.118 270 0.082Winnipeg 495 0.071 1,070 0.153
Text table 3Distribution of census divisions (CD) by precocity errors, Canada, provinces and territories, July 1, 2003
Precocity errorLess than
0.1%0.1 to0.49%
0.5 to0.99%
1% andmore
Total ofcensusdivisions
Provincialerror
percent number percent
Canada 56 143 69 20 288 0.146
Newfoundland and Labrador 2 6 1 1 10 0.220Prince Edward Island 1 2 0 0 3 0.332Nova Scotia 4 11 3 0 18 0.052New Brunswick 4 8 2 1 15 0.084Quebec 26 54 15 4 99 0.100Ontario 11 23 15 0 49 0.198Manitoba 3 10 7 3 23 0.076Saskatchewan 3 8 7 0 18 0.011Alberta 1 12 4 2 19 0.242British Columbia 1 8 13 6 28 0.212Yukon Territory 0 0 0 1 1 1.590Northwest Territories 0 0 1 1 2 0.850Nunavut 0 1 1 1 3 0.751
Statistics Canada – Catalogue no. 91-214 103
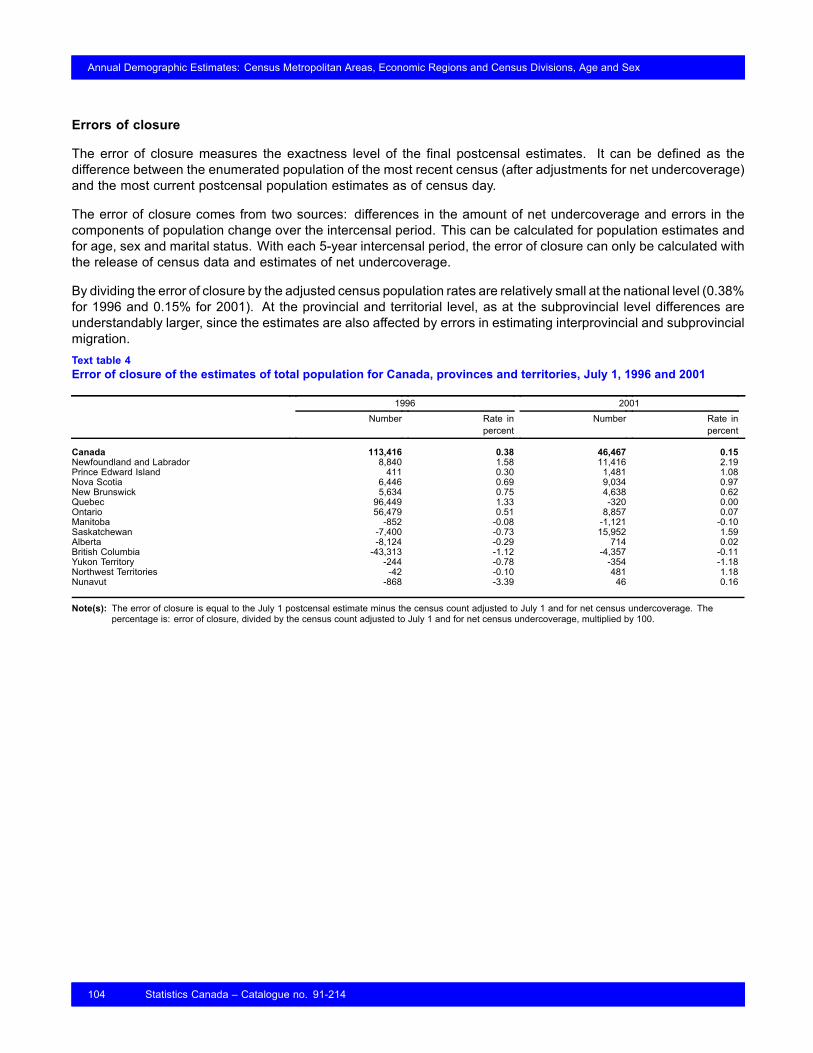
Annual Demographic Estimates: Census Metropolitan Areas, Economic Regions and Census Divisions, Age and Sex
Errors of closure
The error of closure measures the exactness level of the final postcensal estimates. It can be defined as thedifference between the enumerated population of the most recent census (after adjustments for net undercoverage)and the most current postcensal population estimates as of census day.
The error of closure comes from two sources: differences in the amount of net undercoverage and errors in thecomponents of population change over the intercensal period. This can be calculated for population estimates andfor age, sex and marital status. With each 5-year intercensal period, the error of closure can only be calculated withthe release of census data and estimates of net undercoverage.
By dividing the error of closure by the adjusted census population rates are relatively small at the national level (0.38%for 1996 and 0.15% for 2001). At the provincial and territorial level, as at the subprovincial level differences areunderstandably larger, since the estimates are also affected by errors in estimating interprovincial and subprovincialmigration.Text table 4Error of closure of the estimates of total population for Canada, provinces and territories, July 1, 1996 and 2001
1996 2001Number Rate in
percentNumber Rate in
percent
Canada 113,416 0.38 46,467 0.15Newfoundland and Labrador 8,840 1.58 11,416 2.19Prince Edward Island 411 0.30 1,481 1.08Nova Scotia 6,446 0.69 9,034 0.97New Brunswick 5,634 0.75 4,638 0.62Quebec 96,449 1.33 -320 0.00Ontario 56,479 0.51 8,857 0.07Manitoba -852 -0.08 -1,121 -0.10Saskatchewan -7,400 -0.73 15,952 1.59Alberta -8,124 -0.29 714 0.02British Columbia -43,313 -1.12 -4,357 -0.11Yukon Territory -244 -0.78 -354 -1.18Northwest Territories -42 -0.10 481 1.18Nunavut -868 -3.39 46 0.16
Note(s): The error of closure is equal to the July 1 postcensal estimate minus the census count adjusted to July 1 and for net census undercoverage. Thepercentage is: error of closure, divided by the census count adjusted to July 1 and for net census undercoverage, multiplied by 100.
104 Statistics Canada – Catalogue no. 91-214

Annual Demographic Estimates: Census Metropolitan Areas, Economic Regions and Census Divisions, Age and Sex
Text table 5Error of closure of estimates of population for census metropolitan areas, Canada, July 1, 2001
Error of closure
number percent
All Census metropolitan areas -27,246 -0.14
Abbotsford … …Calgary -8,051 -0.82Edmonton -8,110 -0.84Greater Sudbury 387 0.24Halifax -1 0.00Hamilton -8,490 -1.23Kingston … …Kitchener -158 -0.04London -4,908 -1.09Montréal -6,440 -0.18Oshawa -3,858 -1.25Ottawa-Gatineau -8,724 -0.79
Ontario -4,024 -0.48Quebec -4,700 -1.79
Québec -1,680 -0.24Regina 811 0.41St. Catharines-Niagara 1,000 0.26St. John’s -8 0.00Saguenay 593 0.38Saint John 1,056 0.84Saskatoon -407 -0.18Sherbrooke -161 -0.10Thunder Bay 230 0.18Toronto 26,020 0.53Trois-Rivières 681 0.49Vancouver 4,126 0.20Victoria -8,053 -2.47Windsor 2,519 0.79Winnipeg -5,620 -0.81
Statistics Canada – Catalogue no. 91-214 105
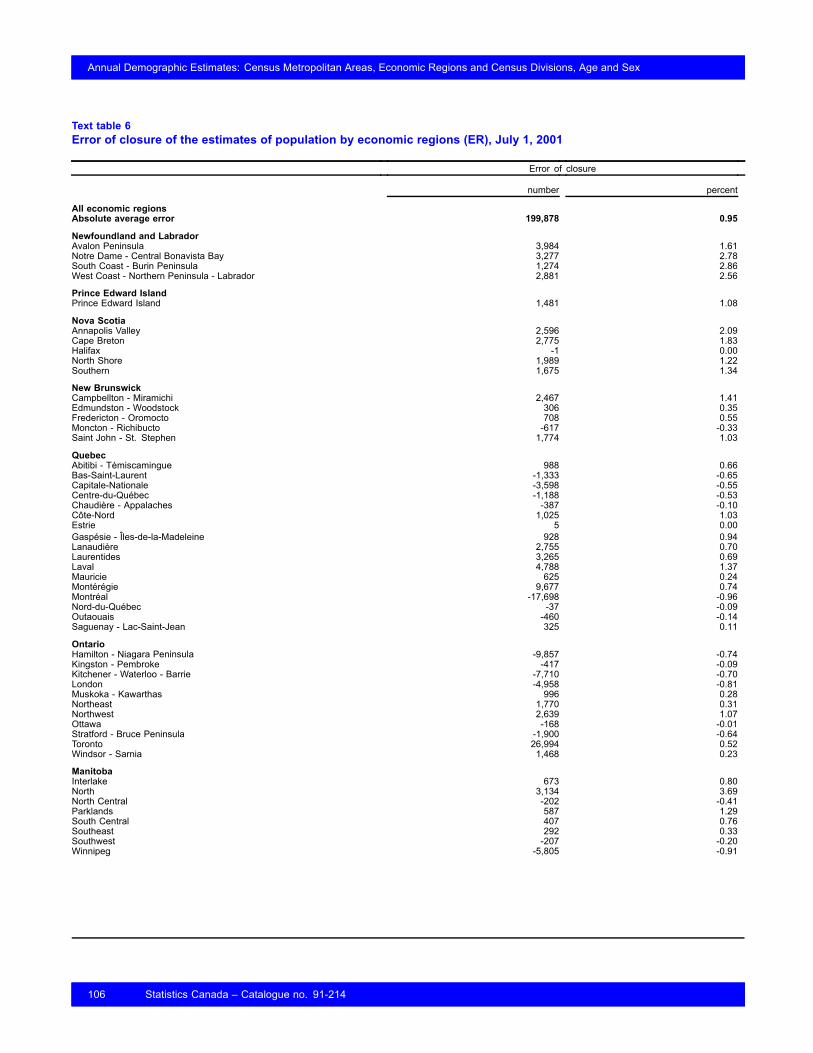
Annual Demographic Estimates: Census Metropolitan Areas, Economic Regions and Census Divisions, Age and Sex
Text table 6Error of closure of the estimates of population by economic regions (ER), July 1, 2001
Error of closure
number percent
All economic regionsAbsolute average error 199,878 0.95
Newfoundland and LabradorAvalon Peninsula 3,984 1.61Notre Dame - Central Bonavista Bay 3,277 2.78South Coast - Burin Peninsula 1,274 2.86West Coast - Northern Peninsula - Labrador 2,881 2.56
Prince Edward IslandPrince Edward Island 1,481 1.08
Nova ScotiaAnnapolis Valley 2,596 2.09Cape Breton 2,775 1.83Halifax -1 0.00North Shore 1,989 1.22Southern 1,675 1.34
New BrunswickCampbellton - Miramichi 2,467 1.41Edmundston - Woodstock 306 0.35Fredericton - Oromocto 708 0.55Moncton - Richibucto -617 -0.33Saint John - St. Stephen 1,774 1.03
QuebecAbitibi - Témiscamingue 988 0.66Bas-Saint-Laurent -1,333 -0.65Capitale-Nationale -3,598 -0.55Centre-du-Québec -1,188 -0.53Chaudière - Appalaches -387 -0.10Côte-Nord 1,025 1.03Estrie 5 0.00Gaspésie - Îles-de-la-Madeleine 928 0.94Lanaudière 2,755 0.70Laurentides 3,265 0.69Laval 4,788 1.37Mauricie 625 0.24Montérégie 9,677 0.74Montréal -17,698 -0.96Nord-du-Québec -37 -0.09Outaouais -460 -0.14Saguenay - Lac-Saint-Jean 325 0.11
OntarioHamilton - Niagara Peninsula -9,857 -0.74Kingston - Pembroke -417 -0.09Kitchener - Waterloo - Barrie -7,710 -0.70London -4,958 -0.81Muskoka - Kawarthas 996 0.28Northeast 1,770 0.31Northwest 2,639 1.07Ottawa -168 -0.01Stratford - Bruce Peninsula -1,900 -0.64Toronto 26,994 0.52Windsor - Sarnia 1,468 0.23
ManitobaInterlake 673 0.80North 3,134 3.69North Central -202 -0.41Parklands 587 1.29South Central 407 0.76Southeast 292 0.33Southwest -207 -0.20Winnipeg -5,805 -0.91
106 Statistics Canada – Catalogue no. 91-214
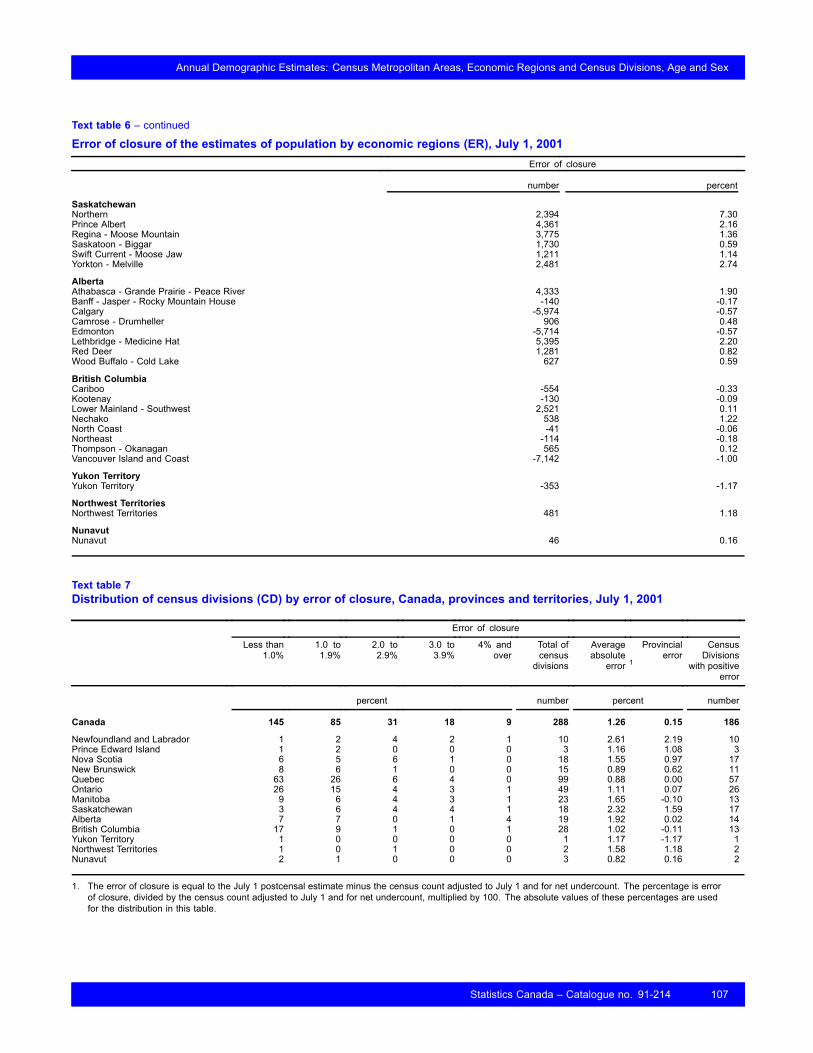
Annual Demographic Estimates: Census Metropolitan Areas, Economic Regions and Census Divisions, Age and Sex
Text table 6 – continued
Error of closure of the estimates of population by economic regions (ER), July 1, 2001Error of closure
number percent
SaskatchewanNorthern 2,394 7.30Prince Albert 4,361 2.16Regina - Moose Mountain 3,775 1.36Saskatoon - Biggar 1,730 0.59Swift Current - Moose Jaw 1,211 1.14Yorkton - Melville 2,481 2.74
AlbertaAthabasca - Grande Prairie - Peace River 4,333 1.90Banff - Jasper - Rocky Mountain House -140 -0.17Calgary -5,974 -0.57Camrose - Drumheller 906 0.48Edmonton -5,714 -0.57Lethbridge - Medicine Hat 5,395 2.20Red Deer 1,281 0.82Wood Buffalo - Cold Lake 627 0.59
British ColumbiaCariboo -554 -0.33Kootenay -130 -0.09Lower Mainland - Southwest 2,521 0.11Nechako 538 1.22North Coast -41 -0.06Northeast -114 -0.18Thompson - Okanagan 565 0.12Vancouver Island and Coast -7,142 -1.00
Yukon TerritoryYukon Territory -353 -1.17
Northwest TerritoriesNorthwest Territories 481 1.18
NunavutNunavut 46 0.16
Text table 7Distribution of census divisions (CD) by error of closure, Canada, provinces and territories, July 1, 2001
Error of closure
Less than1.0%
1.0 to1.9%
2.0 to2.9%
3.0 to3.9%
4% andover
Total ofcensusdivisions
Averageabsolute
error 1
Provincialerror
CensusDivisions
with positiveerror
percent number percent number
Canada 145 85 31 18 9 288 1.26 0.15 186
Newfoundland and Labrador 1 2 4 2 1 10 2.61 2.19 10Prince Edward Island 1 2 0 0 0 3 1.16 1.08 3Nova Scotia 6 5 6 1 0 18 1.55 0.97 17New Brunswick 8 6 1 0 0 15 0.89 0.62 11Quebec 63 26 6 4 0 99 0.88 0.00 57Ontario 26 15 4 3 1 49 1.11 0.07 26Manitoba 9 6 4 3 1 23 1.65 -0.10 13Saskatchewan 3 6 4 4 1 18 2.32 1.59 17Alberta 7 7 0 1 4 19 1.92 0.02 14British Columbia 17 9 1 0 1 28 1.02 -0.11 13Yukon Territory 1 0 0 0 0 1 1.17 -1.17 1Northwest Territories 1 0 1 0 0 2 1.58 1.18 2Nunavut 2 1 0 0 0 3 0.82 0.16 2
1. The error of closure is equal to the July 1 postcensal estimate minus the census count adjusted to July 1 and for net undercount. The percentage is errorof closure, divided by the census count adjusted to July 1 and for net undercount, multiplied by 100. The absolute values of these percentages are usedfor the distribution in this table.
Statistics Canada – Catalogue no. 91-214 107

Annual Demographic Estimates: Census Metropolitan Areas, Economic Regions and Census Divisions, Age and Sex
Population estimates
This appendix describes the concepts, data sources and methodology used to produce the demographic estimatesincluded in this publication.
Types of estimates
Demographic estimates can be categorized as either intercensal or postcensal. Intercensal estimates are producedusing data from two censuses and postcensal estimates, whereas postcensal estimates are produced using datafrom themost recent census as well as components of population growth. In producing up-to-date figures, postcensalestimates are obviously more timely, albeit less accurate. The production of intercensal estimates involves theretrospective adjustment of past figures with the availability of new census data.
Because some data are only available several months after the reference date, three types of postcensal estimatesare issued, preliminary (PP); updated (PR), and final (PD). Reference dates and time lags associated with theavailability of the three types of estimates are typically released within three to four months after the reference datefor preliminary data, while final estimates normally take 2 to 3 years to complete. The quality of population estimatesultimately depends upon the availability of several different administrative data files that are provided to StatisticsCanada from other government departments, both in Canada and internationally. The production of three successiveseries of postcensal estimates, while sometimes confusing to users of demographic statistics, is the strategy that bestsatisfies the need for both timeliness and accuracy. Section "Data quality, concepts and methodology— Explanatorynotes for the tables" in the current publication, indicates the level of the enclosed figures.
Postcensal population estimates
Postcensal estimates were obtained by adding the number of births, subtracting the number of deaths, and byadding or subtracting the net impact of international and internal migration on the most recent census populationadjusted for net census undercoverage (i.e. census undercoverage minus census overcoverage). The inclusionof non-permanent residents in the target population dictated that net variation in the size of this subpopulation inCanada be added to the base period.
Estimates of population were first produced for each province and territory, and then summed to obtain an estimateof the population of Canada. The estimates at the subprovincial level were adjusted proportionately to coincide withannual estimates of the total population for provinces and territories
The component method used in estimating total provincial/territorial populations is expressed as follows:
108 Statistics Canada – Catalogue no. 91-214
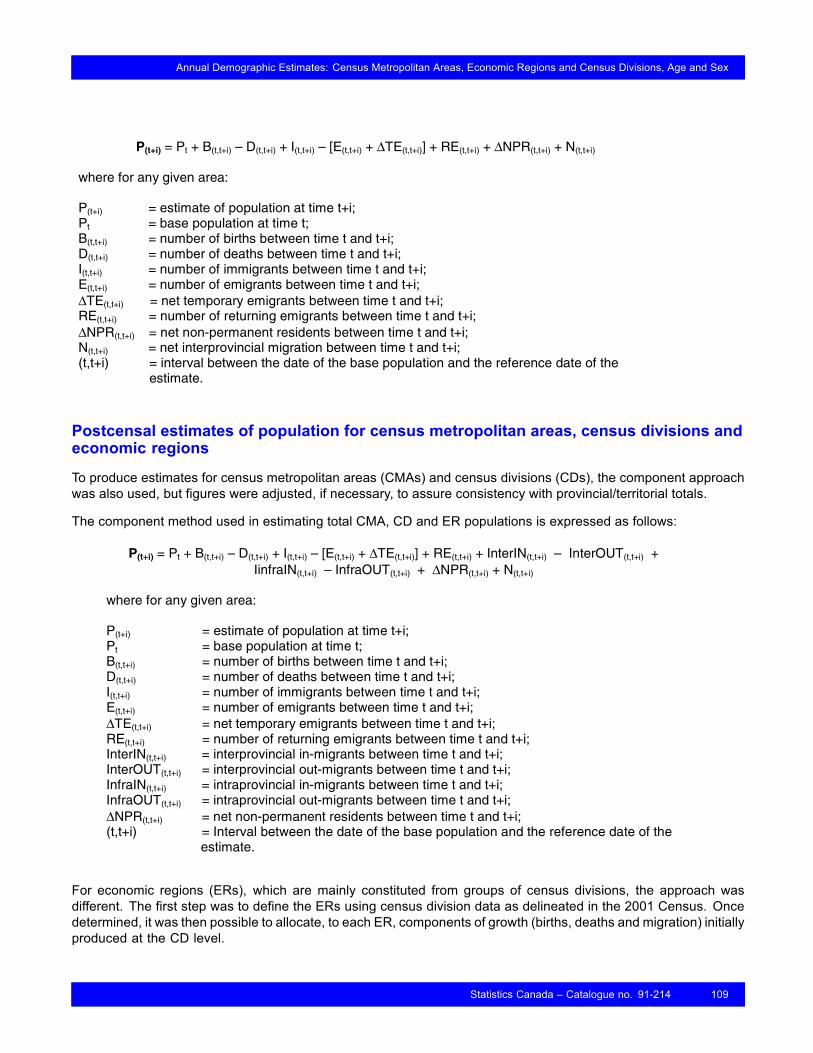
Annual Demographic Estimates: Census Metropolitan Areas, Economic Regions and Census Divisions, Age and Sex
P(t+i) = Pt + B(t,t+i) – D(t,t+i) + I(t,t+i) – [E(t,t+i) + ΔTE(t,t+i)] + RE(t,t+i) + ΔNPR(t,t+i) + N(t,t+i)
where for any given area:
P(t+i) = estimate of population at time t+i; Pt = base population at time t; B(t,t+i) = number of births between time t and t+i; D(t,t+i) = number of deaths between time t and t+i; I(t,t+i) = number of immigrants between time t and t+i; E(t,t+i) = number of emigrants between time t and t+i; ΔTE(t,t+i) = net temporary emigrants between time t and t+i; RE(t,t+i) = number of returning emigrants between time t and t+i; ΔNPR(t,t+i) = net non-permanent residents between time t and t+i; N(t,t+i) = net interprovincial migration between time t and t+i; (t,t+i) = interval between the date of the base population and the reference date of the
estimate.
Postcensal estimates of population for census metropolitan areas, census divisions andeconomic regions
To produce estimates for census metropolitan areas (CMAs) and census divisions (CDs), the component approachwas also used, but figures were adjusted, if necessary, to assure consistency with provincial/territorial totals.
The component method used in estimating total CMA, CD and ER populations is expressed as follows:
P(t+i) = Pt + B(t,t+i) – D(t,t+i) + I(t,t+i) – [E(t,t+i) + ΔTE(t,t+i)] + RE(t,t+i) + InterIN(t,t+i) – InterOUT(t,t+i) + IinfraIN(t,t+i) – InfraOUT(t,t+i) + ΔNPR(t,t+i) + N(t,t+i)
where for any given area:
P(t+i) = estimate of population at time t+i; Pt = base population at time t; B(t,t+i) = number of births between time t and t+i; D(t,t+i) = number of deaths between time t and t+i; I(t,t+i) = number of immigrants between time t and t+i; E(t,t+i) = number of emigrants between time t and t+i; ΔTE(t,t+i) = net temporary emigrants between time t and t+i; RE(t,t+i) = number of returning emigrants between time t and t+i; InterIN(t,t+i) = interprovincial in-migrants between time t and t+i; InterOUT(t,t+i) = interprovincial out-migrants between time t and t+i; InfraIN(t,t+i) = intraprovincial in-migrants between time t and t+i; InfraOUT(t,t+i) = intraprovincial out-migrants between time t and t+i; ΔNPR(t,t+i) = net non-permanent residents between time t and t+i; (t,t+i) = Interval between the date of the base population and the reference date of the
estimate.
For economic regions (ERs), which are mainly constituted from groups of census divisions, the approach wasdifferent. The first step was to define the ERs using census division data as delineated in the 2001 Census. Oncedetermined, it was then possible to allocate, to each ER, components of growth (births, deaths and migration) initiallyproduced at the CD level.
Statistics Canada – Catalogue no. 91-214 109

Annual Demographic Estimates: Census Metropolitan Areas, Economic Regions and Census Divisions, Age and Sex
All components, with the exception of intraprovincial migration, were obtained using this method. In order to producethe latter, we calculated the difference between the growth obtained using population estimates and that of theavailable components. Due to this constraint, only net intraprovincial migration is available. Finally, if required,corrections were made to ensure that totals obtained using the sum of the ER estimates and those calculated at theprovincial and territorial levels agreed.
A prorating procedure was used to adjust total population counts and the components of subprovincial areas.Prorating implies that the difference between the provincial total population and the sum of the subprovincialpopulation is distributed proportionally across subprovincial areas.
Two-way raking is an iterative procedure whereby differences are simultaneously adjusted in assuring a consistencybetween:
i. the sum of subprovincial areas and provincial/territorial population totals, and
ii. the sum across subprovincial areas for specific age/sex categories and the provincial/territorial distributionby age and sex. Thus, this method ensures the consistency between estimates for census divisions, censusmetropolitan areas and economic regions, and provincial/territorial estimates by age and sex.
Quebec and British Columbia
As an exception to the above methodology, the preliminary postcensal estimates for census divisions and censusmetropolitan areas in Quebec and in British Columbia were prepared by their respective statistical agencies. Thissituation also applied to the economic region-level estimates which were derived from the census division-levelestimates. ISQ (Institut de la statistique du Québec) estimates were based on statistics derived from the registrationfile for insured persons of the “Régie de l’assurance-maladie”. BC STATS estimates were produced using aregression model based on residential electrical (Hydro) connections and Old Age Security data as symptomaticindicators. These estimates were controlled to Statistics Canada’s provincial estimates.
Intercensal estimates of population
Following each census, intercensal estimates are produced (that is, estimates of population for reference datesbetween two censuses). These estimates reconcile previous postcensal estimates with the new census-basedinformation.
The production of intercensal estimates involves two basic steps:
i. the calculation of the error of closure;
ii. the linear distribution of the error of closure by year.
The error of closure is defined as the difference between the most current set of postcensal population estimateson Census Day and the enumerated population of that census (after adjustments for net census undercoverage).Assuming that the coverage studies that follow each enumeration are unbiased, the adjusted census figures areaccepted as exact.
Assuming that the error of closure is distributed uniformly over the intercensal period, it is distributed according toan arithmetic function.
The correction of intercensal estimates by age and sex is done similarly by distributing the error of closure acrossage and sex cohorts.
To produce intercensal estimates for the 1986 to 2001 period at the subprovincial level, the base populations andcomponents of demographic growth from 1986 to 2001 needed to be adjusted according to the 2001 Censusboundaries. This was done by applying conversion factors based on the population of the 2001 Census
110 Statistics Canada – Catalogue no. 91-214

Annual Demographic Estimates: Census Metropolitan Areas, Economic Regions and Census Divisions, Age and Sex
subdivisions. For most provinces, there were only minor corrections to census divisions, census metropolitan areasand economic regions (see section ”Data quality, concepts and methodology — Quality of estimates”).
When summed, the series of intercensal estimates by age and sex for subprovincial areas, produced by taking theerror of closure into account, differed slightly from the intercensal estimates at the provincial/territorial levels. Thesedifferences were then proportionally distributed among the age/sex cohorts.
Statistics Canada – Catalogue no. 91-214 111
Annual Demographic Estimates: Census Metropolitan Areas, Economic Regions and Census Divisions, Age and Sex
Components
Base populations
Each of the four base populations was derived from the 1986 to 2001 Censuses. However, the population countswere corrected according to the following steps:
• Adjustment of population by age and sex from Census Day to June 1. The adjustment for the few days betweenCensus Day and June 1 in 1986 and 1991 was made using a proportion of growth method. The adjustmentbetween the Census Day and June 1 in 1996 and 2001 was done using the cohort component approach.
• Adjustment of the population for net undercoverage.
• Addition of independent estimates of incompletely enumerated Indian reserves in 1986, 1991, 1996 and 2001.
• Adjustment for early enumeration in 1991 and 1996 in parts of northern Quebec, Newfoundland and Labrador,the Yukon Territory and the Northwest Territories.
• Estimation of the July 1 base population by addition or subtraction of the components of growth for the month ofJune.
• Addition of estimates of non-permanent residents in 1986.Starting in 1991, non-permanent residents are includedin the census universe.
The adjustment for net census undercoverage is important. Net census undercoverage is the difference betweenthe number of persons who should have been enumerated but were missed (undercoverage), and the number ofpersons who were enumerated, but who should not have been or who were counted more than once (overcoverage).
The coverage studies provide estimates of undercoverage of the 1991, 1996 and 2001 Censuses at the provincialand territorial levels, and of the 1986 Census at the provincial level only. The studies provide estimates ofovercoverage at the provincial and territorial levels of the last three Censuses (1991, 1996 and 2001). Priorto 1991, overcoverage was estimated by assuming that the overcoverage-to-undercoverage ratio observed in eachprovince in 1991 was the same as the Census of 1986. The net census undercoverage for the Yukon Territoryand the Northwest Territories prior to 1991 was estimated by assuming that the ratios between the net censusundercoverage of each territory and the 10 provinces observed in 1991 was the same as the Census of 1986.
For the sake of consistency, 1991 Census under- and overcoverage were revised in 1998, to take into accountthe methodological improvements introduced to the coverage studies in 1996. This modification altered the netundercoverage in the Census of 1986. In the same manner, 1996 Census under- and overcoverage were revisedin 2003.
Various procedures were used to produce the estimates of net census undercoverage by sex and single years of agefor 1991, 1996 and 2001. A curve-smoothing method was used to produce the national estimates by age and sex.An Empirical Bayes regression model created the estimates by broad age groups for each province and a syntheticmodel generated estimates by single years of age. Finally, a two-way raking ratio procedure was used to ensurethat the estimates were consistent with the provincial totals and the national estimates by age and sex. For 1986,the age and sex estimates were simply prorated to the revised estimates of the total population.
Coverage studies do not provide estimates of net census undercoverage for subprovincial areas. In order to obtainestimates at subprovincial levels, provincial rates of net census undercoverage by single years of age and sex wereapplied to all geographic regions in the province.
112 Statistics Canada – Catalogue no. 91-214
Annual Demographic Estimates: Census Metropolitan Areas, Economic Regions and Census Divisions, Age and Sex
Births and deaths
Information on births and deaths is derived directly from Statistics Canada’s Health Statistics Division database.Although Statistics Canada manages the national system of vital statistics, the central vital statistics registries inprovinces and territories are responsible for collecting the statistics. Provincial and territorial Vital Statistics Acts (orequivalent legislation) render compulsory the registration of all live births and deaths, and all provinces and territoriesprovide this information to Statistics Canada.
The universe associated with vital statistics closely parallels the census universe, by including births and deathsof all Canadians, immigrants and non-permanent residents. If statistics for births and deaths are not available forthe most recent years, we estimate the number of births using age-specific fertility rates by age of mother and thenumber of deaths are estimated using age-sex-specific mortality rates by age and sex, except for Quebec and BritishColumbia which provide their most recent statistics on births and deaths.
Migration component at subprovincial level
The components (immigration, emigration, returning emigrants, inter-provincial migration and subprovincialmigration) by broad age groups and sex for subprovincial areas were obtained using tax data. Data by broad agegroups and sex were distributed by single years of age according to the provincial and territorial distribution, withthe exception of subprovincial migration which was based on the 2001 Census mobility data.
A non-permanent resident, as defined by Statistics Canada, is a person who has been granted the right to live inCanada temporarily, and includes persons living in Canada claiming refugee status, persons holding a work permit,study permit or minister’s permit. Also included among non-permanent residents are all family members born outsideCanada currently sharing a residence with the afore-mentioned persons. Statistics Canada estimates the number ofnon-permanent residents based on these permits. These estimates are then used in the calculation of net variationin the size of this sub-population, and they are added to the base population. The distribution of non-permanentresidents at the sub-provincial level are derived from the 2001 Census data.
The net temporary emigrants data from the Reverse Record Check (RRC), the most important Census CoverageStudy, were used to estimate the number of persons living temporarily abroad. Data from the Canadian census onmobility five years ago, combined with the estimates of returning emigration of the intercensal period, were used toestimate the returns of those who were living temporarily abroad at the time of the previous census. From thesetwo estimates, a five-year net change was derived and distributed equally among the five years. In order to producepostcensal estimates, the 1996 to 2001 average annual net numbers were maintained constant.
The estimates of the components at the subprovincial level are adjusted proportionately to coincide with annualestimates of the total population for provinces and territories.
Statistics Canada – Catalogue no. 91-214 113
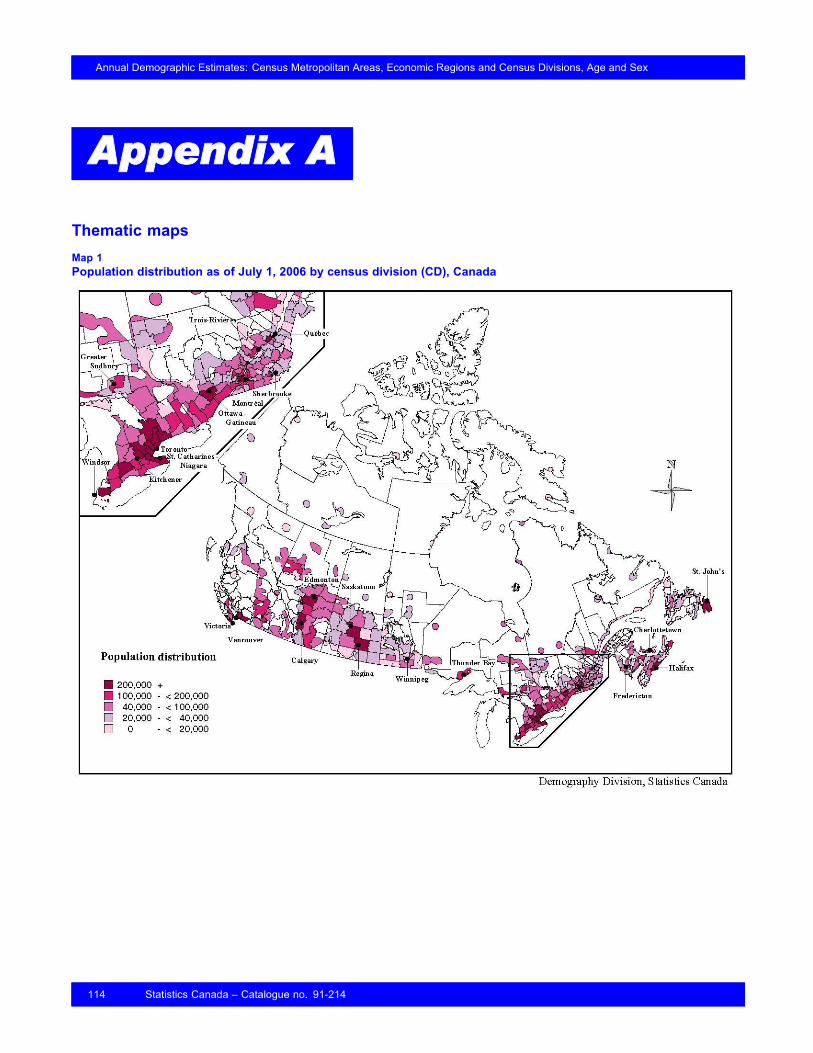
Annual Demographic Estimates: Census Metropolitan Areas, Economic Regions and Census Divisions, Age and Sex
Appendix A
Thematic mapsMap 1Population distribution as of July 1, 2006 by census division (CD), Canada
114 Statistics Canada – Catalogue no. 91-214
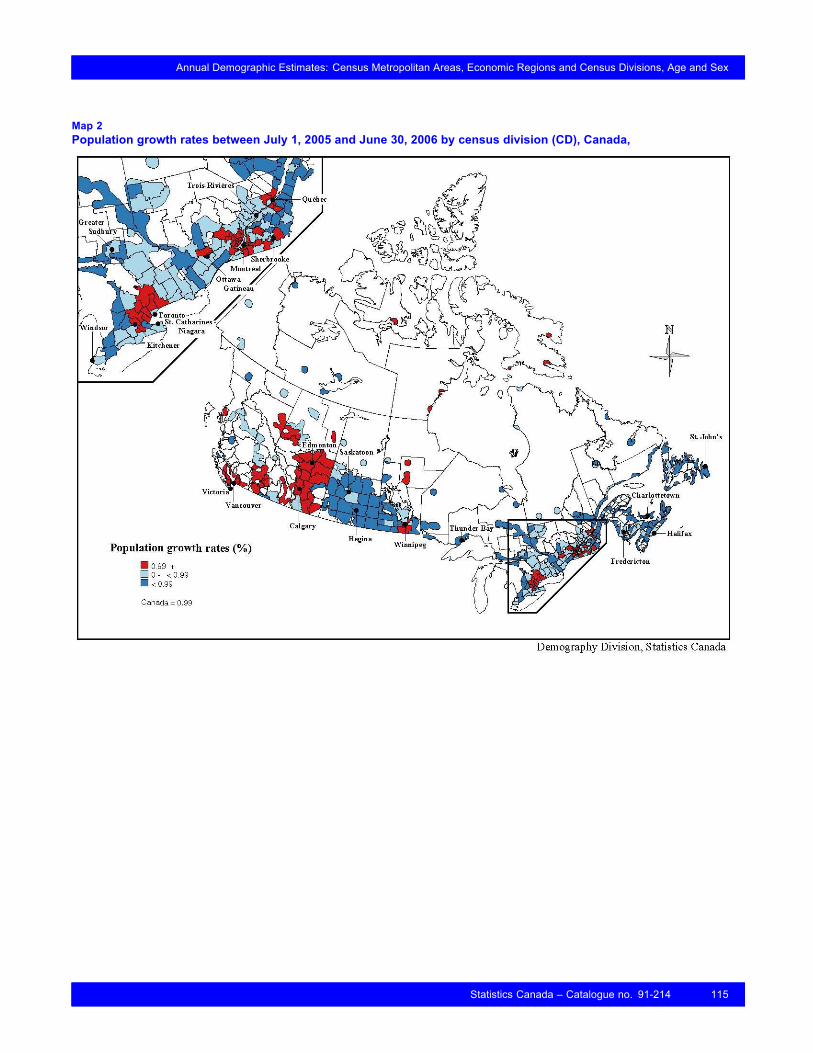
Annual Demographic Estimates: Census Metropolitan Areas, Economic Regions and Census Divisions, Age and Sex
Map 2Population growth rates between July 1, 2005 and June 30, 2006 by census division (CD), Canada,
Statistics Canada – Catalogue no. 91-214 115

Annual Demographic Estimates: Census Metropolitan Areas, Economic Regions and Census Divisions, Age and Sex
Map 3Net interprovincial migration rates between July 1, 2005 and June 30, 2006 by census division (CD), Canada
116 Statistics Canada – Catalogue no. 91-214
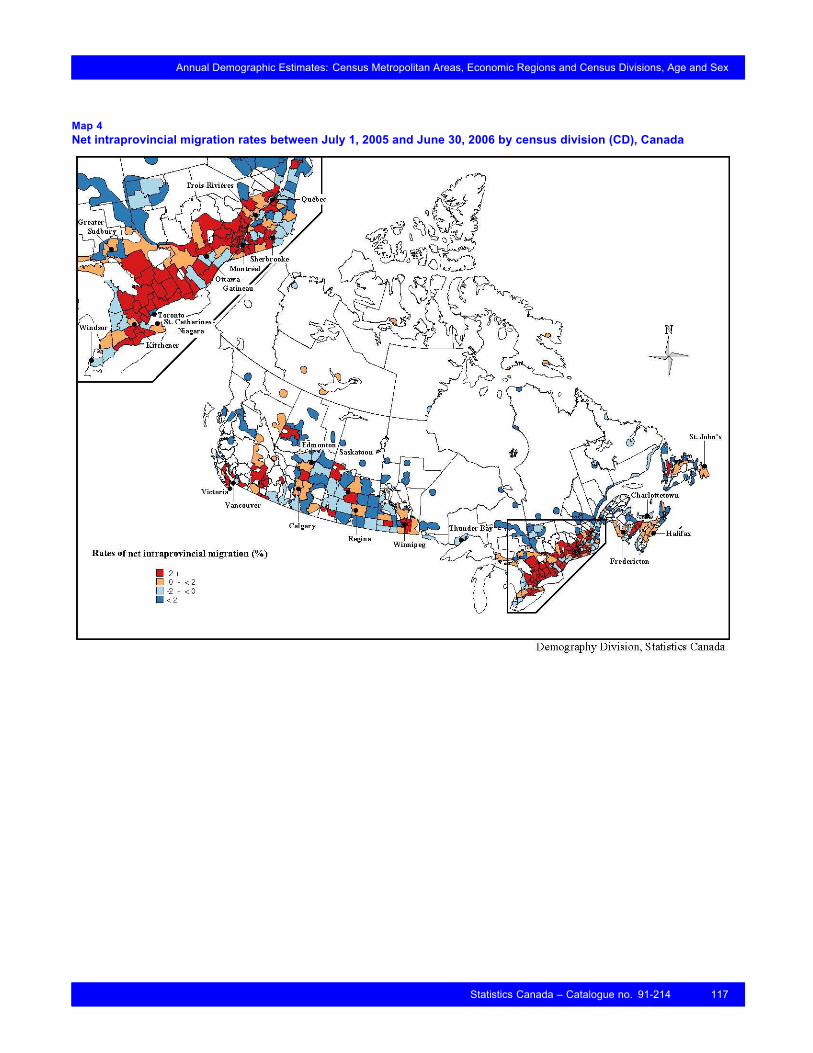
Annual Demographic Estimates: Census Metropolitan Areas, Economic Regions and Census Divisions, Age and Sex
Map 4Net intraprovincial migration rates between July 1, 2005 and June 30, 2006 by census division (CD), Canada
Statistics Canada – Catalogue no. 91-214 117
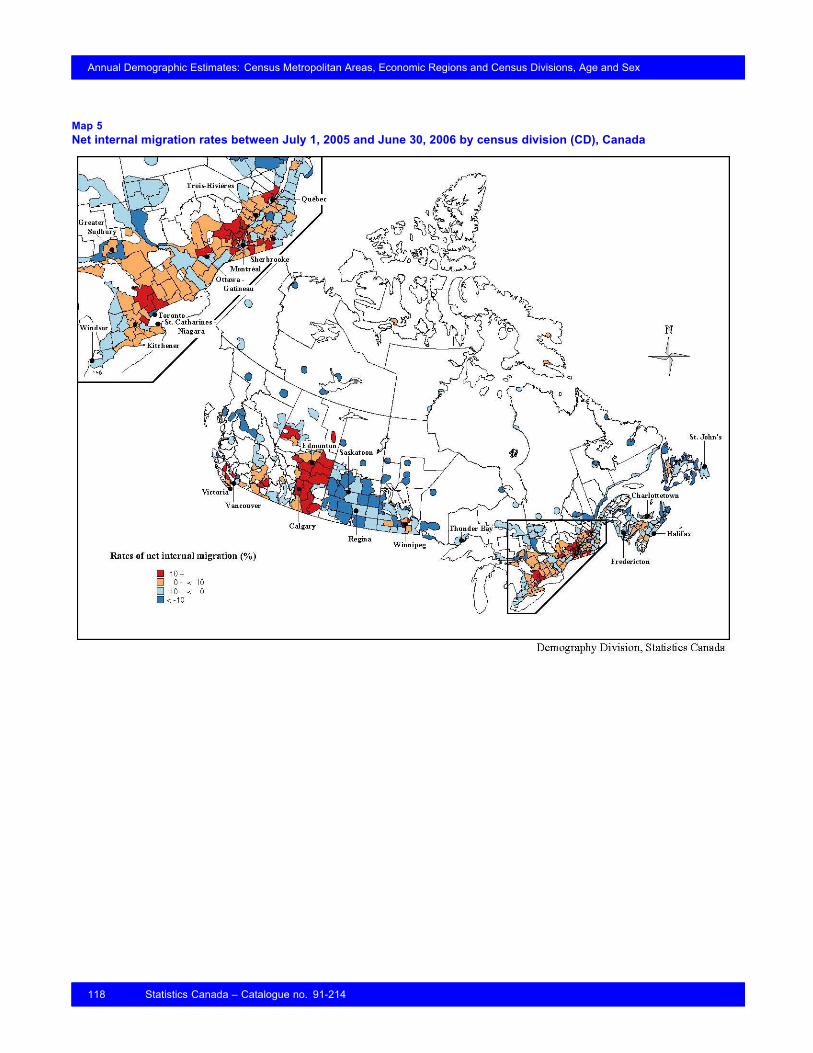
Annual Demographic Estimates: Census Metropolitan Areas, Economic Regions and Census Divisions, Age and Sex
Map 5Net internal migration rates between July 1, 2005 and June 30, 2006 by census division (CD), Canada
118 Statistics Canada – Catalogue no. 91-214
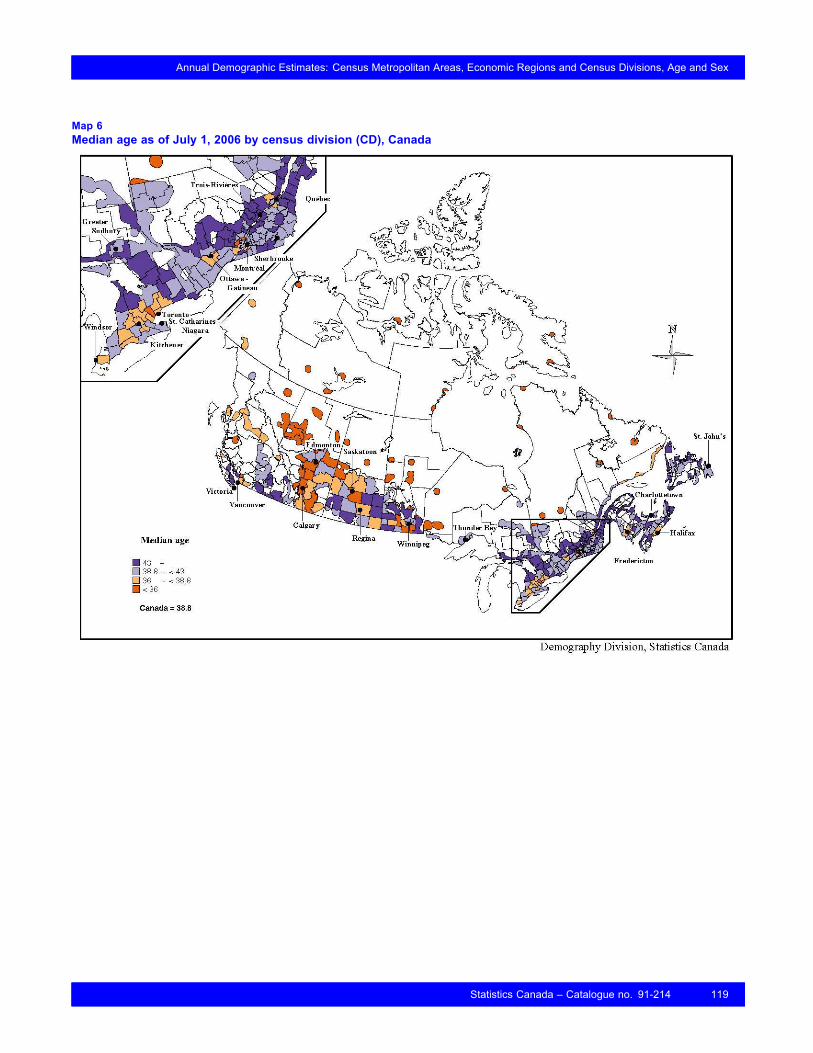
Annual Demographic Estimates: Census Metropolitan Areas, Economic Regions and Census Divisions, Age and Sex
Map 6Median age as of July 1, 2006 by census division (CD), Canada
Statistics Canada – Catalogue no. 91-214 119
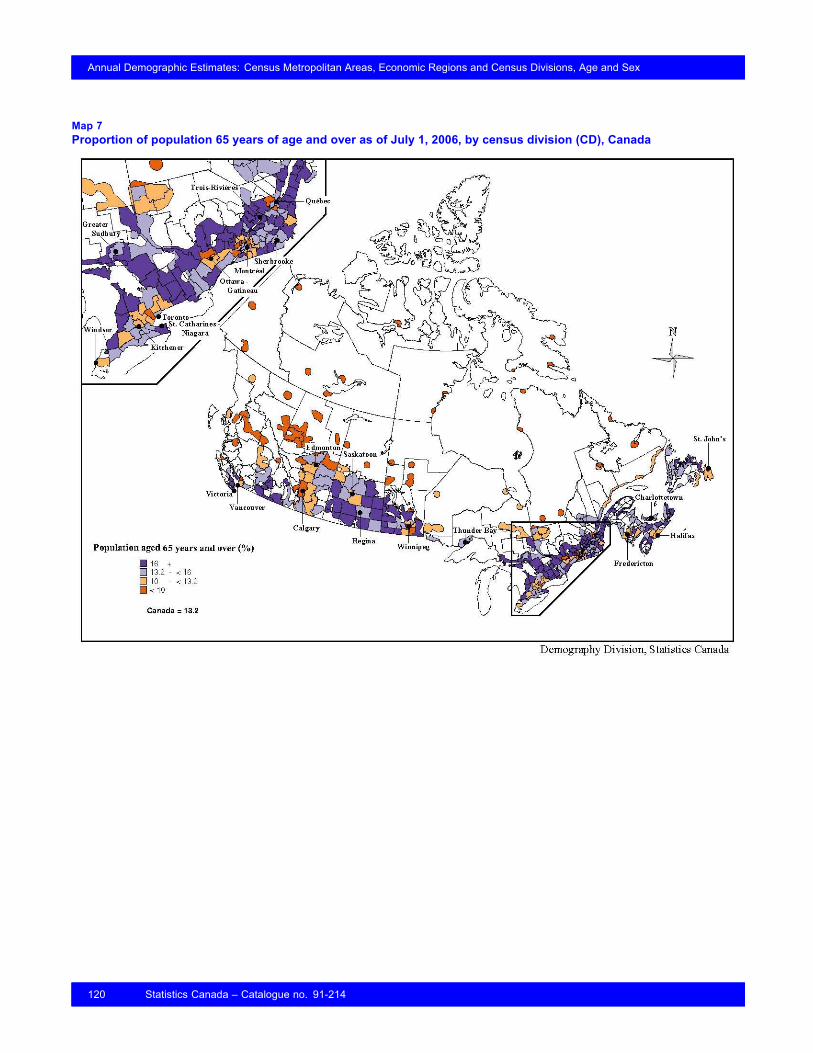
Annual Demographic Estimates: Census Metropolitan Areas, Economic Regions and Census Divisions, Age and Sex
Map 7Proportion of population 65 years of age and over as of July 1, 2006, by census division (CD), Canada
120 Statistics Canada – Catalogue no. 91-214

Annual Demographic Estimates: Census Metropolitan Areas, Economic Regions and Census Divisions, Age and Sex
Appendix B
Sources and remarksBase population
May 15, 2001 Census of Population, adjusted to July 1 and for net undercount.
Statistics Canada, Census of Canada, 2001, catalogue no. 93-360-X.
Births and deaths
Statistics Canada, Health Statistics Division.
Migration
The components (immigration, emigration, returning emigrants, interprovincial and intraprovincial migration) bybroad age group and sex for intraprovincial areas were obtained using tax data. Data by broad age group and sexwere distributed by single year of age according to the provincial and territorial distribution, with the exception ofintraprovincial migration which was based on the 2001 Census mobility data.
Net temporary emigrants
Statistics Canada, Demography Division – based on data from the Reverse Record Check(RRC), 1996 and 2001 Censuses of Canada. Data were distributed by region, single year of age and sexaccording to the emigrant distribution.
Non-permanent residents
Statistics Canada, Demography Division – based on data provided by Citizenship and Immigration Canada. Datawere distributed by region, single year of age and sex according to the most recent census distribution.
Statistics Canada – Catalogue no. 91-214 121