annual budget - mobile, alabama · pdf fileannual budget fiscal year 2015 ... this gives these...
TRANSCRIPT

Annual Budget
Fiscal Year 2015with projections for
Fiscal Years 2016 and 2017
Working to make Mobile the safest,most business and family friendly
City in America by 2020.
2015 BUDGET MESSAGE
CITY OF MOBILE, ALABAMA
WWW.CITYOFMOBILE.ORG
CYCLE OF POSITIVE CHANGE
Introduction
I am pleased to present the city’s proposed fiscal year 2015 budget. It is a budget that directly
addresses the greatest needs of our city while adhering to funding the core functions of city
government – public safety, public works, city finance, strategic planning and economic
development.
Our focus is to increase and redirect capital
dollars toward fixing things that are broken
in the city’s infrastructure from our streets,
sidewalks and parks, to the outdated
computer management systems and other
old equipment the city uses to conduct day-
to-day business. And secondly, it addresses
long needed adjustments to our employees’
compensation. These two areas of focus,
when combined with better management by
city government, will result in our citizens
receiving improved basic services which
they deserve.
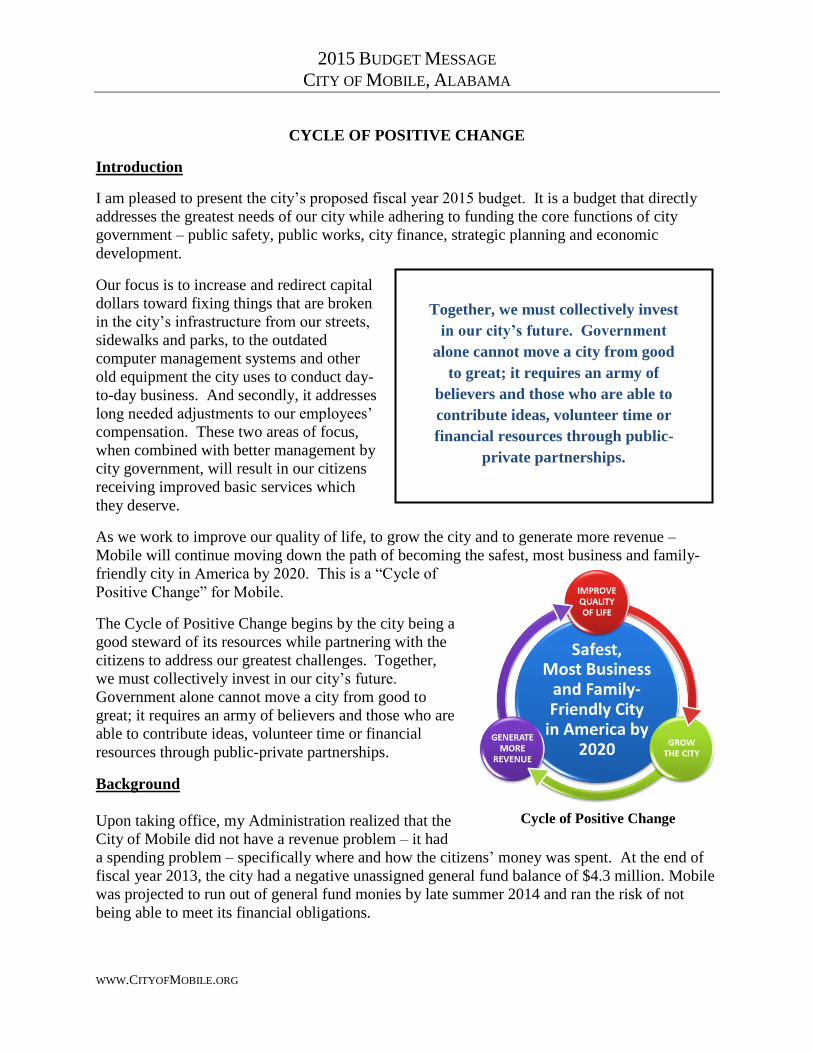
As we work to improve our quality of life, to grow the city and to generate more revenue –
Mobile will continue moving down the path of becoming the safest, most business and family-
friendly city in America by 2020. This is a “Cycle of
Positive Change” for Mobile.
The Cycle of Positive Change begins by the city being a
good steward of its resources while partnering with the
citizens to address our greatest challenges. Together,
we must collectively invest in our city’s future.
Government alone cannot move a city from good to
great; it requires an army of believers and those who are
able to contribute ideas, volunteer time or financial
resources through public-private partnerships.
Background
Upon taking office, my Administration realized that the
City of Mobile did not have a revenue problem – it had
a spending problem – specifically where and how the citizens’ money was spent. At the end of
fiscal year 2013, the city had a negative unassigned general fund balance of $4.3 million. Mobile
was projected to run out of general fund monies by late summer 2014 and ran the risk of not
being able to meet its financial obligations.
Together, we must collectively invest
in our city’s future. Government
alone cannot move a city from good
to great; it requires an army of
believers and those who are able to
contribute ideas, volunteer time or
financial resources through public-
private partnerships.
Cycle of Positive Change
2015 BUDGET MESSAGE – CITY OF MOBILE, ALABAMA
WWW.CITYOFMOBILE.ORG ii
My Administration immediately went to work addressing this challenge and on April 1, 2014,
the City Council unanimously passed an amended 2014 budget that began to help get our fiscal
house in order.
Also, in April, Moody's placed the city's ratings under review because of a "rapid deterioration"
in the city's general fund and financial reserves during fiscal 2012 and 2013. In late June, after
extensive effort by the Administration to outline a recovery plan to improve the city’s fiscal
health, Moody's Investors Service decided to maintain the City of Mobile's Aa2 credit rating,
avoiding a possible downgrade.
Next Step
The next step in the Cycle of Positive Change is to create and get approved a budget that begins
to give the city the capacity to excel in the delivery of its core functions that will improve the
quality of life for all of its citizens. That is what we have presented.
General Fund
The accounts of the General Fund reflect the major share of the city's fiscal transactions. It
details the city’s revenue (taxes, fees, licenses, fines and forfeitures, interest, etc.) and
expenditures (personnel costs, operating costs, etc.).
In the 2015 budget, our department heads have built reasonable and manageable budgets that
allow the city to operate effectively while redirecting much needed monies back to capital
investment.
Projected 2015 revenue ($227,137,621) and expenditures ($222,594,869) in the proposed
General Fund are within a half-percent of last year’s budget. This type of fiscal discipline allows
the city to begin achieving the goals of:
o Addressing the city’s capital and infrastructure needs;
o Giving the city employees a significant and long overdue raise;
o Delivering better basic services to the citizens of Mobile;
o Developing and implementing a comprehensive city strategic plan;
o Fostering neighborhood cohesion and public safety;
o Cleaning-up our city through blight, litter and storm water initiatives;
o Improving parks, recreational opportunities and public spaces; and,
o Creating greater mobility and accessibility across the city.
As we strive to find the right balance of how to allocate and direct the resources entrusted to the
city, we are taking a practical approach at evaluating every budget cost center. The following
General Fund items are likely to standout because of their significance.

2015 BUDGET MESSAGE – CITY OF MOBILE, ALABAMA
WWW.CITYOFMOBILE.ORG iii
Compensation Adjustment: In the area of employee compensation, we need to be fair to both
the employees and the public. We need to be balanced. We also need to be competitive. But,
we are not. I am a firm believer that in order to provide the citizens improved basic services, the
City of Mobile needs to be able to attract and retain quality personnel. I further believe that if we
take care of our employees, they will take care of our citizens. To do so, our employees must be
competitively compensated. In fairness to the public, I am also a believer in the notion that “to
whom much is given, much will be required.” I have high expectations for our employees and
will be requiring more productivity from them as we are able to improve their compensation and
give them better training.
Pay Raise: The last time the city employees received a pay raise was in 2007. The
gap in raises may be a result of economic factors beyond the city’s control, but it is
nonetheless too long. Our employees deserve a raise. Included in this year’s
personnel costs are two pay raises - a 2.5% Cost of Living Adjustment (COLA) in
October 2014 and a 2.5% Merit Raise in April 2015. The COLA will bring up the
baseline pay across the board and begin to make Mobile competitive with our
regional peers. These pay raises are partially funded by the department heads’
meticulous management of head-count and overtime.
Health Plan Cost – Sharing: The City of Mobile’s health plan has excellent
coverage with below market expense sharing to its employees. The city needs to
make adjustments to the cost-sharing model of the employee and retiree health plans.
For the last several years the city has not been in compliance with its 80/20
(city/employee) cost share. Presently, the cost share is about 84/16 for current
employees. Beginning in January 2015, we will make adjustments to get back into
compliance at 80/20 and will remain in compliance going forward. Beginning in
January 2015, the cost share for new hires will be 60/40 (city/employee).
Recognizing that some will say you cannot give raises only to take it back with increased health
care plan premiums; the city has a thoughtful solution. For current employees who make
$40,000 or less – the city will pay their first year premium increases. This gives these employees
the full realization of the two pay raises in the first year.
Performance Contracts: The purpose of performance contracts is to partner with organizations
that provide a service that the city needs and cannot otherwise provide for itself. Performance
contracts have morphed into a collective of both organizations providing services for the city --
and charitable, non-profit organizations in need of funding. For many years, the city has been
one the largest funders of benevolent organizations in the City of Mobile. There is no doubt that
every organization the city previously funded is an important part of our community.
However, we can no longer sustain previous years’ funding levels and address our priorities of
returning money to capital projects and employee compensation.
The city recommends funding those organizations that provide a specific service for the city and
funding other qualified non-profits through the United Way of Southwest Alabama (social
services) and the Community Foundation of South Alabama (arts and culture) for one year only
– ensuring city funds stay in the city and have collective and measurable impact.
2015 BUDGET MESSAGE – CITY OF MOBILE, ALABAMA
WWW.CITYOFMOBILE.ORG iv
A top priority of my Administration is redirecting capital back
to capital improvements – fixing what is broken in our city.
Capital Funds
I am also proposing a series of budgets addressing the capital needs of the city via the Capital
Improvements Fund; Strategic Plan Fund; and, Convention Center Fund. In future years, I will
be working with the City Council to streamline these capital funds to be user-friendly for the
citizens. We only need two budgets – a general fund budget and a capital fund budget.
As stated previously, a top priority of my Administration is redirecting capital back to capital
improvements – fixing what is broken in our city. We have a sizeable list of capital
improvements that needs to be addressed now. Therefore, the proposed 2015 budget contains a
400% increase ($3,513,000 in 2014 to $14,345,000 in 2015) in directed capital allocations for
backlogged infrastructure improvements, repairs and capital equipment, such as:
o ($750,000) Litter Trap for Dog River and Litter Vessel for our littered waterways;
o ($3,200,000) Additional 100 New Police Cars in 2015;
o ($2,000,000) New Fire-Rescue Vehicles;
o ($750,000) New Public Works Vehicles;
o ($3,000,000) Park Improvements and Repairs; (Fields, Lights, Restrooms, Dog Parks, Splash Pads, Walking/Bike Trails, Playgrounds, etc.)
o ($4,000,000) Maintenance and Repair of Streets, Drainage, Buildings, etc.
The city is also upgrading to a modern and efficient, citywide software system, an investment
costing $2,200,000. This system will allow the city to shift from paper intensive operations (e.g.
Municipal Court, Police, Permitting, Finance, etc.) to efficient data input and processing
capabilities. The city and the public will realize efficiencies through our customer service
model, and ultimately through operating cost-savings -- it will be cheaper for the city to conduct
business and redirect money to where the citizens need it the most -- fixing the broken parts of
our city.

2015 BUDGET MESSAGE – CITY OF MOBILE, ALABAMA
WWW.CITYOFMOBILE.ORG v
Closing
This proposed budget is only possible because the city employees have bought into the vision of
becoming the safest, most business and family-friendly city in America by 2020. We have
empowered department heads, like never before, to be in complete control of their personnel and
operating budgets. They know what they need to do to get the job done for the citizens.
Every day, I become more excited about the future of One Mobile – a city working together
across all parts of our community for the greater good. I am inspired daily by the citizen who
asks how they can help and by the city employee who improves our community by finding ways
to do their job even better.
Almost a year ago, I received the most humbling honor of my life, being elected as the Mayor of
this great city. The charge to lead this city and to improve upon the work done by generations of
Mayors before me is a charge I will keep. It is a pleasure to serve as the 108th Mayor of
Mobile, Alabama.
It is without reservation and in accordance with Alabama Code § 11-44C-42, that I submit a
balanced, fiscally responsible 2015 budget to the Mobile City Council for their consideration.
William S. Stimpson
Mayor
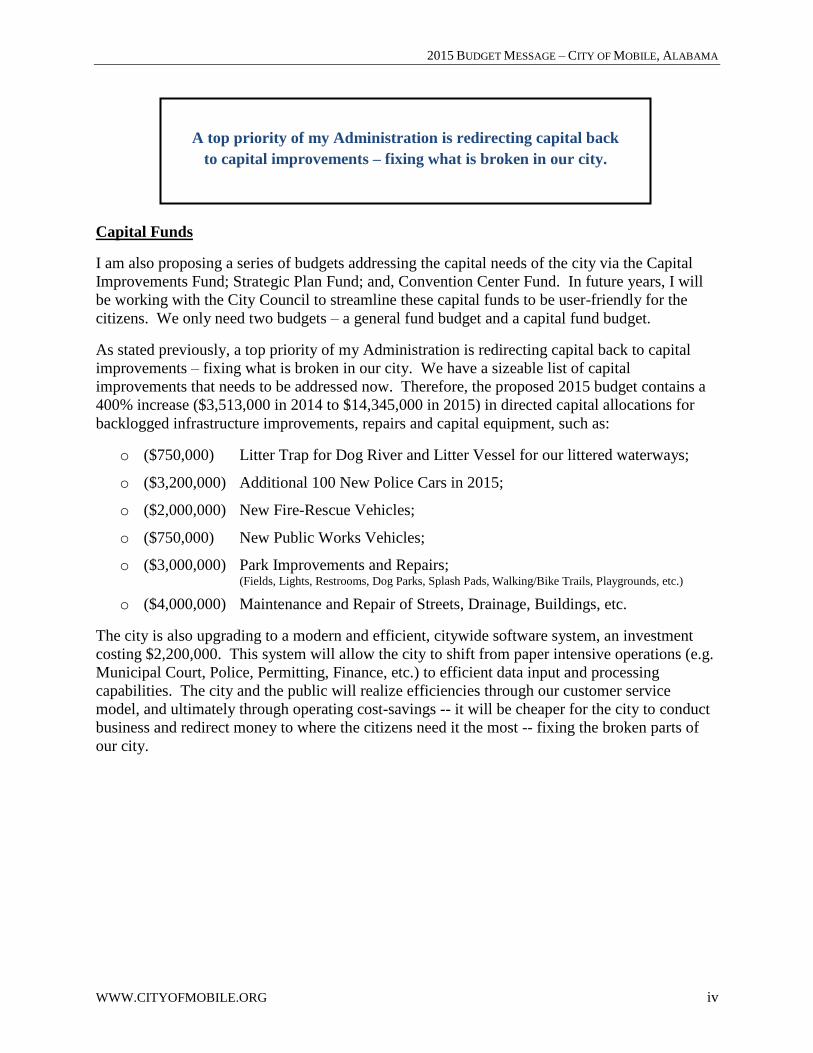
Elected Officials
William S. StimpsonMayor
John C. WilliamsDistrict 4
Joel DavesDistrict 5
Fred Richardson, Jr.District 1 • Vice President
C. J. SmallDistrict 3
Gina GregoryDistrict 4 • President
Bess RichDistrict 6
Levon C. ManzieDistrict 2

General Fund

General Fund Revenues and Transfers In FY2015
$2,994,000
$680,000
$7,491,928
$440,000
$36,342,994
$179,188,699
Taxes
Licenses
Other
Fees
Fines &Forfeitures
Transfers In
General Fund Expenditures and Transfers Out FY2015
$126,597,274
$31,609,360
$36,344,397
$27,485,904
($1,442,066)
$2,000,000
PersonnelCosts
OperatingCosts
NaturalEmploymentReduction
Reserve forRetirements
Other CostCenters
TransfersOut
2
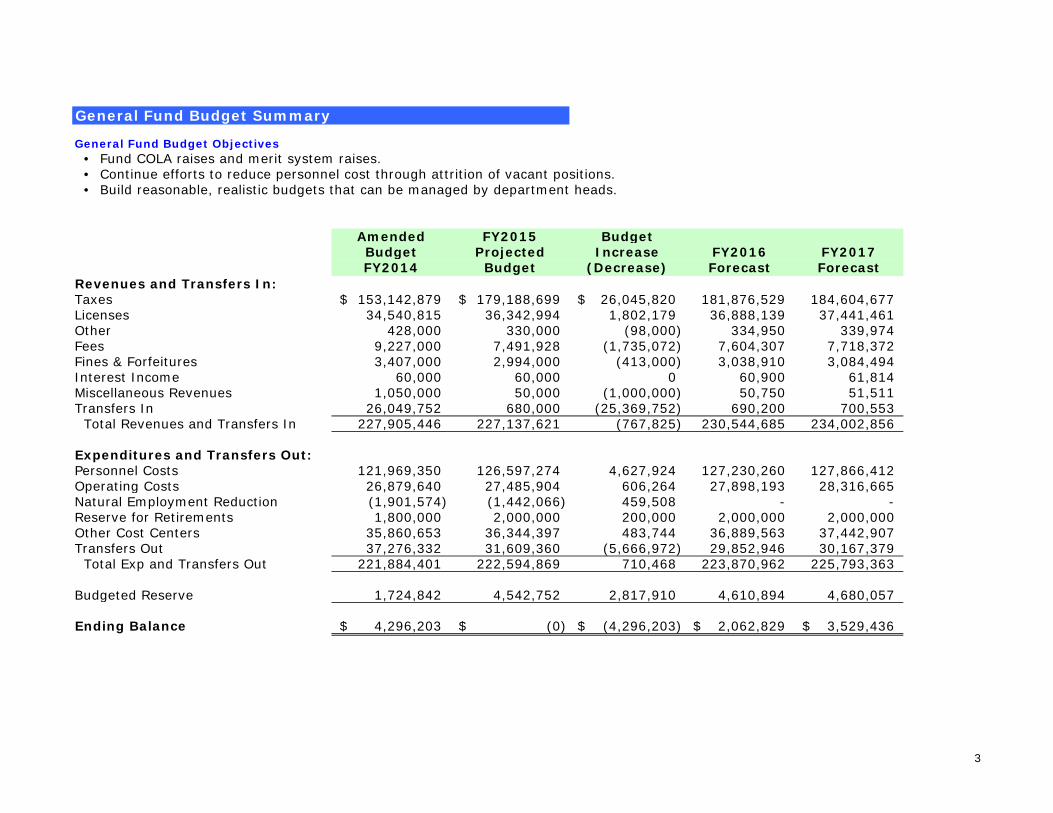
General Fund Budget Summary
General Fund Budget Objectives
Amended FY2015 BudgetBudget Projected Increase FY2016 FY2017FY2014 Budget (Decrease) Forecast Forecast
Revenues and Transfers In:Taxes 153,142,879$ 179,188,699$ 26,045,820$ 181,876,529 184,604,677Licenses 34,540,815 36,342,994 1,802,179 36,888,139 37,441,461Other 428,000 330,000 (98,000) 334,950 339,974Fees 9,227,000 7,491,928 (1,735,072) 7,604,307 7,718,372Fines & Forfeitures 3,407,000 2,994,000 (413,000) 3,038,910 3,084,494Interest Income 60,000 60,000 0 60,900 61,814Miscellaneous Revenues 1,050,000 50,000 (1,000,000) 50,750 51,511Transfers In 26,049,752 680,000 (25,369,752) 690,200 700,553 Total Revenues and Transfers In 227,905,446 227,137,621 (767,825) 230,544,685 234,002,856
Expenditures and Transfers Out:Personnel Costs 121,969,350 126,597,274 4,627,924 127,230,260 127,866,412Operating Costs 26,879,640 27,485,904 606,264 27,898,193 28,316,665Natural Employment Reduction (1,901,574) (1,442,066) 459,508 - - Reserve for Retirements 1,800,000 2,000,000 200,000 2,000,000 2,000,000 Other Cost Centers 35,860,653 36,344,397 483,744 36,889,563 37,442,907Transfers Out 37,276,332 31,609,360 (5,666,972) 29,852,946 30,167,379 Total Exp and Transfers Out 221,884,401 222,594,869 710,468 223,870,962 225,793,363
Budgeted Reserve 1,724,842 4,542,752 2,817,910 4,610,894 4,680,057
Ending Balance 4,296,203$ (0)$ (4,296,203)$ 2,062,829$ 3,529,436$
• Fund COLA raises and merit system raises. • Continue efforts to reduce personnel cost through attrition of vacant positions. • Build reasonable, realistic budgets that can be managed by department heads.
3
Amended FY 2015 BudgetBudget Projected IncreaseFY2014 Budget (Decrease)
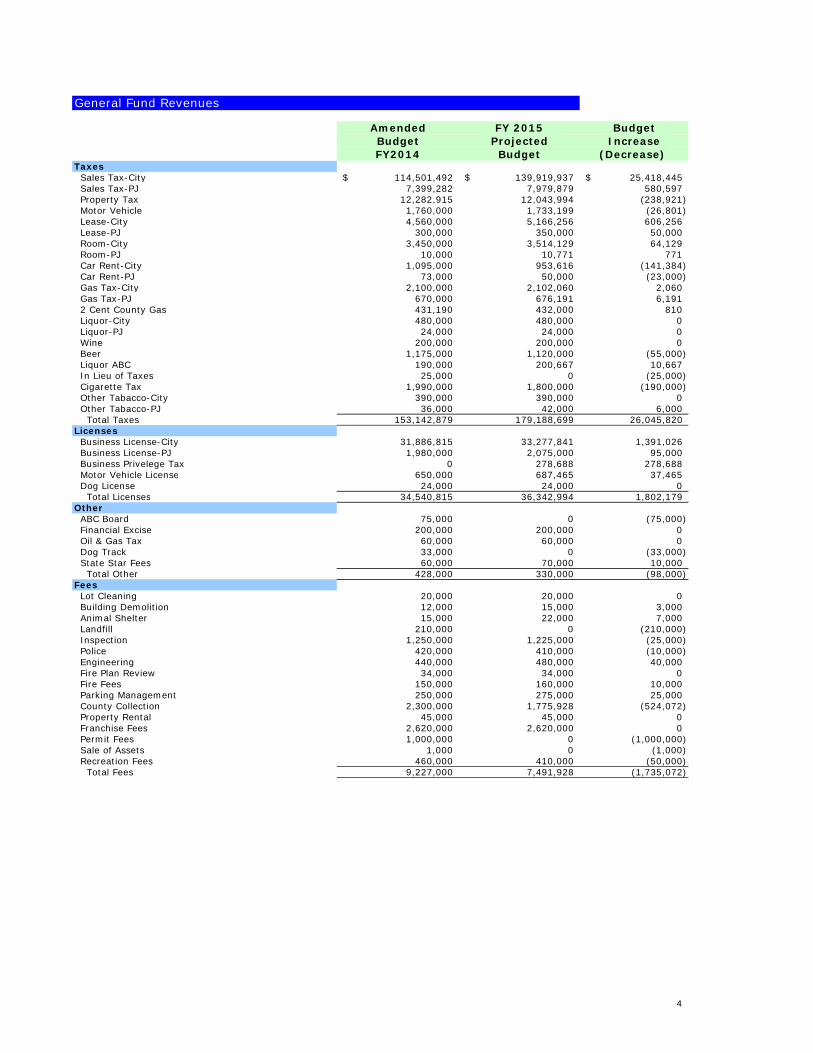
Taxes Sales Tax-City 114,501,492$ 139,919,937$ 25,418,445$ Sales Tax-PJ 7,399,282 7,979,879 580,597 Property Tax 12,282,915 12,043,994 (238,921) Motor Vehicle 1,760,000 1,733,199 (26,801) Lease-City 4,560,000 5,166,256 606,256 Lease-PJ 300,000 350,000 50,000 Room-City 3,450,000 3,514,129 64,129 Room-PJ 10,000 10,771 771 Car Rent-City 1,095,000 953,616 (141,384) Car Rent-PJ 73,000 50,000 (23,000) Gas Tax-City 2,100,000 2,102,060 2,060 Gas Tax-PJ 670,000 676,191 6,191 2 Cent County Gas 431,190 432,000 810 Liquor-City 480,000 480,000 0 Liquor-PJ 24,000 24,000 0 Wine 200,000 200,000 0 Beer 1,175,000 1,120,000 (55,000) Liquor ABC 190,000 200,667 10,667 In Lieu of Taxes 25,000 0 (25,000) Cigarette Tax 1,990,000 1,800,000 (190,000) Other Tabacco-City 390,000 390,000 0 Other Tabacco-PJ 36,000 42,000 6,000 Total Taxes 153,142,879 179,188,699 26,045,820Licenses Business License-City 31,886,815 33,277,841 1,391,026 Business License-PJ 1,980,000 2,075,000 95,000 Business Privelege Tax 0 278,688 278,688 Motor Vehicle License 650,000 687,465 37,465 Dog License 24,000 24,000 0 Total Licenses 34,540,815 36,342,994 1,802,179Other ABC Board 75,000 0 (75,000) Financial Excise 200,000 200,000 0 Oil & Gas Tax 60,000 60,000 0 Dog Track 33,000 0 (33,000) State Star Fees 60,000 70,000 10,000 Total Other 428,000 330,000 (98,000)Fees Lot Cleaning 20,000 20,000 0 Building Demolition 12,000 15,000 3,000 Animal Shelter 15,000 22,000 7,000 Landfill 210,000 0 (210,000) Inspection 1,250,000 1,225,000 (25,000) Police 420,000 410,000 (10,000) Engineering 440,000 480,000 40,000 Fire Plan Review 34,000 34,000 0 Fire Fees 150,000 160,000 10,000 Parking Management 250,000 275,000 25,000 County Collection 2,300,000 1,775,928 (524,072) Property Rental 45,000 45,000 0 Franchise Fees 2,620,000 2,620,000 0 Permit Fees 1,000,000 0 (1,000,000) Sale of Assets 1,000 0 (1,000) Recreation Fees 460,000 410,000 (50,000) Total Fees 9,227,000 7,491,928 (1,735,072)
4
General Fund Revenues

Amended FY 2015 BudgetBudget Projected IncreaseFY2014 Budget (Decrease)
General Fund Revenues
Fines & Forfeitures Police Fines 1,250,000 1,025,000 (225,000) MOT 75,000 48,000 (27,000) D A Restitution 130,000 115,000 (15,000) Bond Forfeitures 75,000 95,000 20,000 Drivers Education 375,000 370,000 (5,000) Corrections Fund 1,050,000 930,000 (120,000) Municipal Court Admin 75,000 55,000 (20,000) Court Costs 365,000 340,000 (25,000) Alarm Ordinance 12,000 16,000 4,000 Total Fines & Forfeitures 3,407,000 2,994,000 (413,000)Interest IncomeInterest Income 60,000 60,000 0Miscellaneous Revenue 1,050,000 50,000 (1,000,000)
TRANSFER IN: Strategic Plan 4,270,084 0 (4,270,084) Fuel Inspection 80,000 80,000 0 WAVE Transit 1,670,565 0 (1,670,565) Capital 17,864,103 0 (17,864,103) Parking Garage 1,000,000 0 (1,000,000) 7 cent Roadway 300,000 0 (300,000) 5 cent Gas 865,000 600,000 (265,000) Total Transfers 26,049,752 680,000 (25,369,752)
TOTAL REVENUES AND TRANSFERS IN 227,905,446$ 227,137,621$ (767,825)$
5

FY2014 FY 2015 BudgetAmended Proposed Increase
Department Category Budget Budget (Decrease)City Clerk Personnel 543,135$ 567,823$ 24,688$
Operating 20,508 27,630 7,122City Clerk Total 563,643 595,453 31,810
Mayor's Office Personnel 709,620 574,214 (135,406)Operating 132,454 140,050 7,596
Mayor's Office Total 842,074 714,264 (127,810)
City Council Personnel 288,081 288,081 0Operating 169,710 211,100 41,390
City Council Total 457,791 499,181 41,390
Office of Strategic Initiatives Personnel 0 0 0Operating 1,085 0 (1,085)
Office of Strategic Initiatives Total 1,085 0 (1,085)
Archives Personnel 206,877 259,350 52,473Operating 61,093 62,652 1,559
Archives Total 267,970 322,002 54,032
Internal Audit Personnel 57,209 59,558 2,349Operating 3,371 4,925 1,554
Internal Audit Total 60,580 64,483 3,903
City Hall Overhead Personnel 77,857 80,385 2,528Operating 4,623,234 4,888,985 265,751
Total City Hall Overhead 4,701,091 4,969,370 268,279
Municipal Court Personnel 2,074,500 2,079,543 5,043Operating 128,800 118,100 (10,700)
Municipal Court Total 2,203,300 2,197,643 (5,657)
Legal Personnel 1,023,001 1,105,839 82,838Operating 240,174 191,720 (48,454)
Legal Total 1,263,175 1,297,559 34,384
History Museum Personnel 893,460 1,103,938 210,478Operating 245,221 144,329 (100,892)
History Museum Total 1,138,681 1,248,267 109,586
Mobile Museum of Art Personnel 1,445,807 1,528,025 82,218Operating 622,589 568,460 (54,129)
Mobile Museum of Art Total 2,068,396 2,096,485 28,089
Mobile Film Office Personnel 137,670 147,982 10,312Operating 28,477 28,477 0
Mobile Film Office Total 166,147 176,459 10,312
6
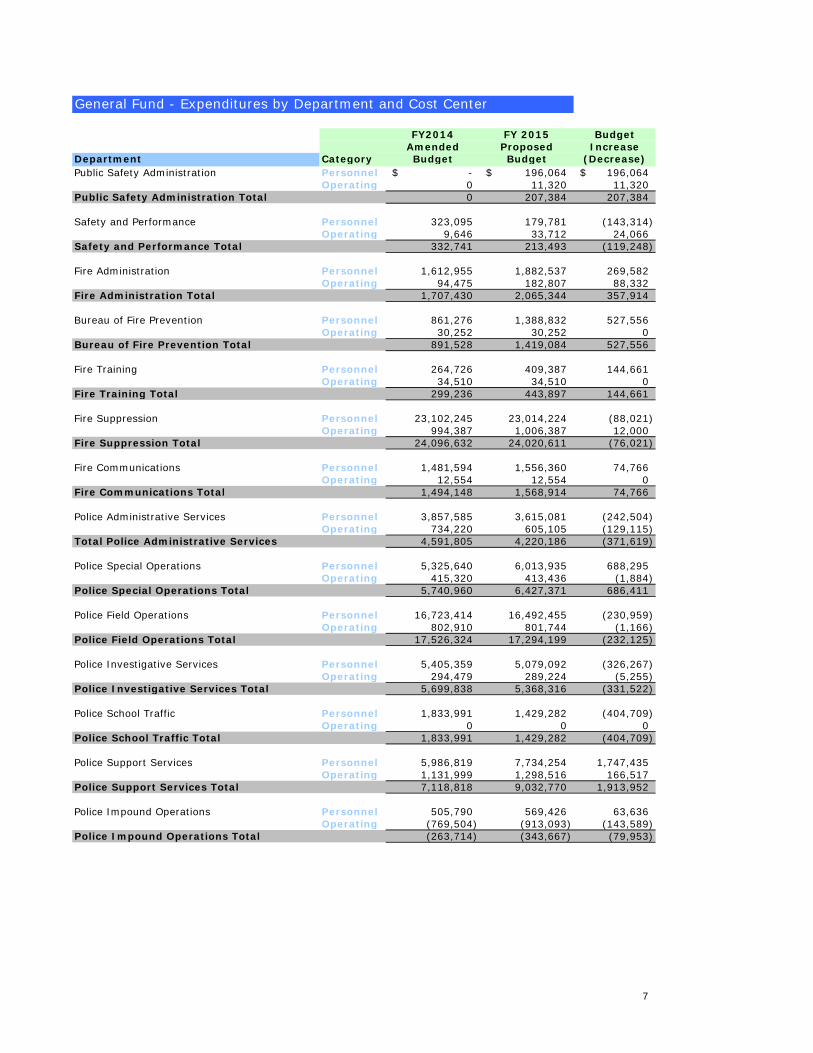
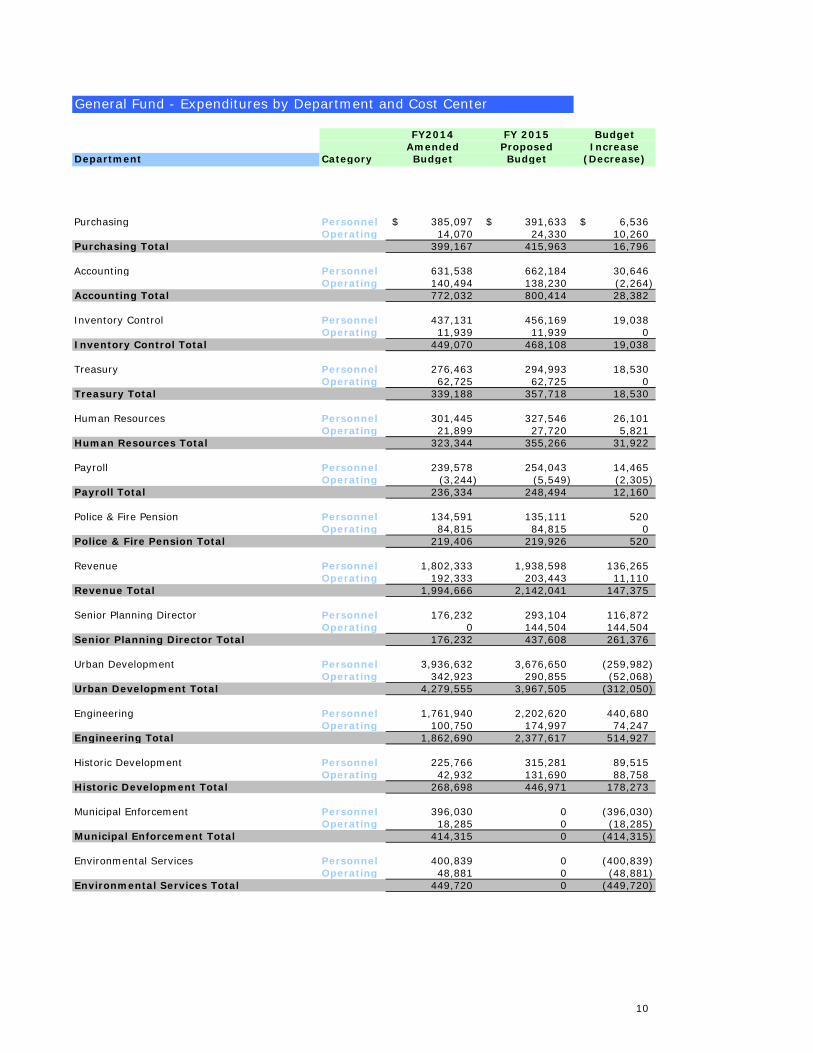
General Fund - Expenditures by Department and Cost Center
FY2014 FY 2015 BudgetAmended Proposed Increase
Department Category Budget Budget (Decrease)
General Fund - Expenditures by Department and Cost Center
Public Safety Administration Personnel -$ 196,064$ 196,064$ Operating 0 11,320 11,320
Public Safety Administration Total 0 207,384 207,384
Safety and Performance Personnel 323,095 179,781 (143,314)Operating 9,646 33,712 24,066
Safety and Performance Total 332,741 213,493 (119,248)
Fire Administration Personnel 1,612,955 1,882,537 269,582Operating 94,475 182,807 88,332
Fire Administration Total 1,707,430 2,065,344 357,914
Bureau of Fire Prevention Personnel 861,276 1,388,832 527,556Operating 30,252 30,252 0
Bureau of Fire Prevention Total 891,528 1,419,084 527,556
Fire Training Personnel 264,726 409,387 144,661Operating 34,510 34,510 0
Fire Training Total 299,236 443,897 144,661
Fire Suppression Personnel 23,102,245 23,014,224 (88,021)Operating 994,387 1,006,387 12,000
Fire Suppression Total 24,096,632 24,020,611 (76,021)
Fire Communications Personnel 1,481,594 1,556,360 74,766Operating 12,554 12,554 0
Fire Communications Total 1,494,148 1,568,914 74,766
Police Administrative Services Personnel 3,857,585 3,615,081 (242,504)Operating 734,220 605,105 (129,115)
Total Police Administrative Services 4,591,805 4,220,186 (371,619)
Police Special Operations Personnel 5,325,640 6,013,935 688,295Operating 415,320 413,436 (1,884)
Police Special Operations Total 5,740,960 6,427,371 686,411
Police Field Operations Personnel 16,723,414 16,492,455 (230,959)Operating 802,910 801,744 (1,166)
Police Field Operations Total 17,526,324 17,294,199 (232,125)
Police Investigative Services Personnel 5,405,359 5,079,092 (326,267)Operating 294,479 289,224 (5,255)
Police Investigative Services Total 5,699,838 5,368,316 (331,522)
Police School Traffic Personnel 1,833,991 1,429,282 (404,709)Operating 0 0 0
Police School Traffic Total 1,833,991 1,429,282 (404,709)
Police Support Services Personnel 5,986,819 7,734,254 1,747,435Operating 1,131,999 1,298,516 166,517
Police Support Services Total 7,118,818 9,032,770 1,913,952
Police Impound Operations Personnel 505,790 569,426 63,636Operating (769,504) (913,093) (143,589)
Police Impound Operations Total (263,714) (343,667) (79,953)
7
FY2014 FY 2015 BudgetAmended Proposed Increase
Department Category Budget Budget (Decrease)
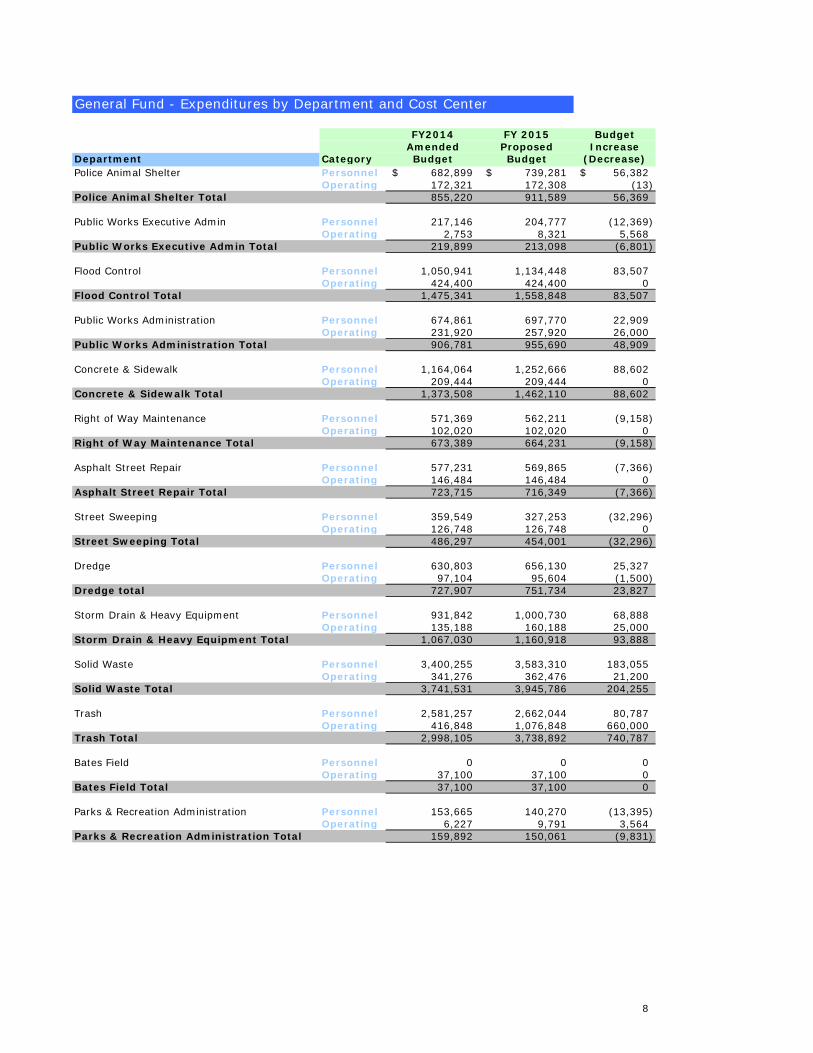
General Fund - Expenditures by Department and Cost Center
Police Animal Shelter Personnel 682,899$ 739,281$ 56,382$ Operating 172,321 172,308 (13)
Police Animal Shelter Total 855,220 911,589 56,369
Public Works Executive Admin Personnel 217,146 204,777 (12,369)Operating 2,753 8,321 5,568
Public Works Executive Admin Total 219,899 213,098 (6,801)
Flood Control Personnel 1,050,941 1,134,448 83,507Operating 424,400 424,400 0
Flood Control Total 1,475,341 1,558,848 83,507
Public Works Administration Personnel 674,861 697,770 22,909Operating 231,920 257,920 26,000
Public Works Administration Total 906,781 955,690 48,909
Concrete & Sidewalk Personnel 1,164,064 1,252,666 88,602Operating 209,444 209,444 0
Concrete & Sidewalk Total 1,373,508 1,462,110 88,602
Right of Way Maintenance Personnel 571,369 562,211 (9,158)Operating 102,020 102,020 0
Right of Way Maintenance Total 673,389 664,231 (9,158)
Asphalt Street Repair Personnel 577,231 569,865 (7,366)Operating 146,484 146,484 0
Asphalt Street Repair Total 723,715 716,349 (7,366)
Street Sweeping Personnel 359,549 327,253 (32,296)Operating 126,748 126,748 0
Street Sweeping Total 486,297 454,001 (32,296)
Dredge Personnel 630,803 656,130 25,327Operating 97,104 95,604 (1,500)
Dredge total 727,907 751,734 23,827
Storm Drain & Heavy Equipment Personnel 931,842 1,000,730 68,888Operating 135,188 160,188 25,000
Storm Drain & Heavy Equipment Total 1,067,030 1,160,918 93,888
Solid Waste Personnel 3,400,255 3,583,310 183,055Operating 341,276 362,476 21,200
Solid Waste Total 3,741,531 3,945,786 204,255
Trash Personnel 2,581,257 2,662,044 80,787Operating 416,848 1,076,848 660,000
Trash Total 2,998,105 3,738,892 740,787
Bates Field Personnel 0 0 0Operating 37,100 37,100 0
Bates Field Total 37,100 37,100 0
Parks & Recreation Administration Personnel 153,665 140,270 (13,395)Operating 6,227 9,791 3,564
Parks & Recreation Administration Total 159,892 150,061 (9,831)
8

FY2014 FY 2015 BudgetAmended Proposed Increase
Department Category Budget Budget (Decrease)
General Fund - Expenditures by Department and Cost Center
Parks, Cemeteries, Operations Personnel 211,871$ 223,974$ 12,103$ Operating 1,948,746 1,745,433 (203,313)
Parks, Cemeteries, Operations Total 2,160,617 1,969,407 (191,210)
Athletics Personnel 688,192 672,043 (16,149)Operating 164,227 174,589 10,362
Athletics Total 852,419 846,632 (5,787)
Recreation Personnel 2,377,906 2,581,667 203,761Operating 64,290 69,421 5,131
Recreation Total 2,442,196 2,651,088 208,892
Mobile Regional Community Center Personnel 313,245 329,167 15,922Operating 121,060 125,347 4,287
Mobile Regional Community Center Total 434,305 454,514 20,209
Community Activities Personnel 737,260 751,755 14,495Operating 64,569 70,594 6,025
Community Activities Total 801,829 822,349 20,520
Special Activities Personnel 672,067 883,861 211,794Operating 75,887 78,172 2,285
Special Activities Total 747,954 962,033 214,079
Parks Maintenance Personnel 3,125,050 3,796,478 671,428Operating 442,200 584,088 141,888
Parks Maintenance Total 3,567,250 4,380,566 813,316
Traffic Engineering Personnel 1,203,442 1,275,911 72,469Operating 136,124 195,030 58,906
Traffic Engineering Total 1,339,566 1,470,941 131,375
Equipment Services/Garage Personnel 3,062,692 2,856,921 (205,771)Operating 7,564,789 6,911,647 (653,142)
Equipment Services/Garage Total 10,627,481 9,768,568 (858,913)
Electrical Personnel 1,712,303 1,842,035 129,732Operating 330,524 398,742 68,218
Electrical Total 2,042,827 2,240,777 197,950
Keep Mobile Beautiful Personnel 293,271 296,588 3,317Operating 59,110 54,985 (4,125)
Keep Mobile Beautiful Total 352,381 351,573 (808)
Finance Administration Personnel 412,780 430,559 17,779Operating 17,133 30,665 13,532
Finance Administration Total 429,913 461,224 31,311
Budget Personnel 233,516 243,154 9,638Operating 1,892 3,132 1,240
Budget Total 235,408 246,286 10,878
9
FY2014 FY 2015 BudgetAmended Proposed Increase
Department Category Budget Budget (Decrease)
General Fund - Expenditures by Department and Cost Center
Purchasing Personnel 385,097$ 391,633$ 6,536$ Operating 14,070 24,330 10,260
Purchasing Total 399,167 415,963 16,796
Accounting Personnel 631,538 662,184 30,646Operating 140,494 138,230 (2,264)
Accounting Total 772,032 800,414 28,382
Inventory Control Personnel 437,131 456,169 19,038Operating 11,939 11,939 0
Inventory Control Total 449,070 468,108 19,038
Treasury Personnel 276,463 294,993 18,530Operating 62,725 62,725 0
Treasury Total 339,188 357,718 18,530
Human Resources Personnel 301,445 327,546 26,101Operating 21,899 27,720 5,821
Human Resources Total 323,344 355,266 31,922
Payroll Personnel 239,578 254,043 14,465Operating (3,244) (5,549) (2,305)
Payroll Total 236,334 248,494 12,160
Police & Fire Pension Personnel 134,591 135,111 520Operating 84,815 84,815 0
Police & Fire Pension Total 219,406 219,926 520
Revenue Personnel 1,802,333 1,938,598 136,265Operating 192,333 203,443 11,110
Revenue Total 1,994,666 2,142,041 147,375
Senior Planning Director Personnel 176,232 293,104 116,872Operating 0 144,504 144,504
Senior Planning Director Total 176,232 437,608 261,376
Urban Development Personnel 3,936,632 3,676,650 (259,982)Operating 342,923 290,855 (52,068)
Urban Development Total 4,279,555 3,967,505 (312,050)
Engineering Personnel 1,761,940 2,202,620 440,680Operating 100,750 174,997 74,247
Engineering Total 1,862,690 2,377,617 514,927
Historic Development Personnel 225,766 315,281 89,515Operating 42,932 131,690 88,758
Historic Development Total 268,698 446,971 178,273
Municipal Enforcement Personnel 396,030 0 (396,030)Operating 18,285 0 (18,285)
Municipal Enforcement Total 414,315 0 (414,315)
Environmental Services Personnel 400,839 0 (400,839)Operating 48,881 0 (48,881)
Environmental Services Total 449,720 0 (449,720)
10

FY2014 FY 2015 BudgetAmended Proposed Increase
Department Category Budget Budget (Decrease)
General Fund - Expenditures by Department and Cost Center
Real Estate Asset Management Personnel 171,023$ 178,168$ 7,145$ Operating 3,315 3,429 114
Real Estate Asset Management Total 174,338 181,597 7,259
Real Estate Personnel 226,709 235,736 9,027Operating 4,236 5,353 1,117
Real Estate Total 230,945 241,089 10,144
Architectural Engineering Personnel 967,535 1,044,027 76,492Operating 356,232 379,625 23,393
Architectural Engineering Total 1,323,767 1,423,652 99,885
Public Buildings Personnel 1,930,494 2,089,490 158,996Operating 201,494 206,514 5,020
Public Buildings Total 2,131,988 2,296,004 164,016
Mechanical Systems Personnel 1,397,185 1,514,520 117,335Operating 224,174 230,408 6,234
Mechanical Systems Total 1,621,359 1,744,928 123,569
Community Affairs Administration Personnel 0 281,649 281,649Operating 0 33,500 33,500
Community Affairs Administration Total 0 315,149 315,149
Special Events Personnel 318,340 345,176 26,836Operating 131,939 131,184 (755)
Special Events Total 450,279 476,360 26,081
Senior Director Information Technology Personnel 188,149 0 (188,149)Operating 0 0 0
Senior Director Info Technology Total 188,149 0 (188,149)
GIS Personnel 613,346 625,027 11,681Operating 111,088 120,717 9,629
GIS Total 724,434 745,744 21,310
Telecommunications Personnel 0 0 0Operating 509,458 0 (509,458)
Telecommunications Total 509,458 0 (509,458)
MIT Personnel 2,269,771 2,265,233 (4,538)Operating 756,554 1,261,076 504,522
MIT Total 3,026,325 3,526,309 499,984
Reserve for retirements 1,800,000 2,000,000 200,000Natural Employment Reduction (1,901,574) (1,442,066) 459,508
GRAND TOTAL DEPARTMENTS 148,747,416$ 154,641,112$ 5,893,696$
11

FY2014 FY 2015 BudgetAmended Proposed Increase
Department Category Budget Budget (Decrease)
General Fund - Expenditures by Department and Cost Center
Other Cost Centers:
Mobile Metro Jail 8,300,000$ 8,736,007$ 436,007$ Personnel Board 1,257,500 1,368,438 110,938Board of Health 600,000 600,000 0Juvenile Court 3,250,000 3,400,000 150,000Board of Equalization 7,152 7,152 0Emergency Management 432,876 436,116 3,240Legislative Delegation 9,972 4,490 (5,482)Library 6,597,319 6,788,077 190,758Retirees Insurance 4,808,380 5,043,012 234,632Employee Education 120,000 120,000 0Worker's Compensation 3,000,000 4,048,600 1,048,600Unemployment Compensation 125,000 75,000 (50,000)Employees Pension 76,872 110,412 33,540Fire Insurance 2,092,000 2,000,000 (92,000)Mayor's Discretionary Fund 25,000 25,000 0City Council Discretionary Funds 175,000 280,000 105,000Performance Contracts 4,503,657 2,421,640 (2,082,017)Dues 374,925 375,453 528Fee Waiver Expense 0 400,000 400,000Contingency Reserve 105,000 105,000 0
Other Cost Centers Total 35,860,653 36,344,397 483,744
TransfersTo Grants 375,000 375,000 0To Capital 156,229 0 (156,229)To Civic Center 983,605 819,565 (164,040)To ALS 3,048,090 4,924,437 1,876,347To WAVE Transit 6,026,948 6,026,948 0To RSA (MTA) 0 200,000 200,000To Motor Pool 300,000 0 (300,000)To Tennis Center 482,045 542,959 60,914To Saenger Theatre 0 155,000 155,000To Seven Cent Gas Fund 0 350,000 350,000To Golf Course 98,506 265,464 166,958To Solid Waste Authority 2,250,000 1,600,000 (650,000)To P & F Pension Fund 12,904,772 8,904,772 (4,000,000)To General Municipal Employee Pension 22,800 10,000 (12,800)To Health Plan 8,494,537 5,186,335 (3,308,202)To Liability Fund 2,133,800 2,248,880 115,080
Transfers Total 37,276,332 31,609,360 (5,666,972)
Total Expenditures 221,884,401$ 222,594,869$ 710,468$
12

FY2014 FY2015 BUDGETAMENDED PROPOSED INCREASEBUDGET BUDGET (DECREASE)
DuesAlabama League of Municipalities 23,721$ 23,721$ -$ Coosa-AL River Association 1,500 1,500 - National League of Cities 11,091 11,091 - Sister Cities International 880 880 - South Alabama Regional Planning 321,591 322,119 528 American Society of Public Admin 2,000 2,000 - U.S. Conference of Mayors 12,242 12,242 - Mobile County Municipal Association 100 100 - Warrior-Tombigbee Development 1,800 1,800 - Total Dues 374,925$ 375,453$ 528$
Performance ContractsBusiness Improvement District 86,670 75,000 (11,670) Chamber of Commerce 390,740 375,000 (15,740) Foreign Trade Zone 18,000 18,000 - Historic Preservation 52,650 50,000 (2,650) Ladd Memorial Stadium 249,816 200,000 (49,816) Magnolia Cemetery** 188,640 188,640 Mobile City Youth Athletic 100,000 100,000 - Mobile Bay Sports Authority - 100,000 100,000 Mobile Tennis Association 67,797 45,000 (22,797) South Alabama Workforce Development - 70,000 70,000 United Way of SW Ala, Inc./Community Fdn 38,880 1,200,000 1,161,120 Other Performance Contracts 3,499,104 - (3,499,104) General Fund Performance Contract Total 4,503,657$ 2,421,640$ (2,082,017)$
Operations Budget.
13
GENERAL FUND DUES & PERFORMANCE CONTRACT DETAIL
*McKemmie Place FY2014 Budget was $18,000 and was included in Parks,Cemeteries, Operations Budget.**Magnolia Cemetery FY2014 Budget was $188,640 and was included in Parks, Cemeteries,

SUBSIDIZED BY THE GENERAL FUND
FY2014 FY2015 BUDGETADOPTED PROPOSED INCREASEBUDGET BUDGET (DECREASE)
Motor Pool Revenues 4,575,000$ 5,011,480$ 436,480$ Transfer from GF 300,000 - (300,000) Personnel Exp 149,699 136,685 (13,014) Operating Exp 3,372,927 3,318,941 (53,986) Capital Exp 1,333,488 1,408,488 75,000 Motor Pool Net 18,886$ 147,366$ 128,480$
Mobile Tennis CenterRevenues 157,680$ 242,500$ 84,820$ Transfer from GF 482,045 542,959 60,914 Personnel Exp 391,167 507,973 116,806 Operating Exp 248,558 277,486 28,928
Mobile Tennis Center Net -$ -$ -$
ALS TransportRevenues 5,101,930$ 5,101,930$ -$ Transfer from GF 3,048,090 4,924,437 1,876,347 Transfer from SP 1,023,428 - (1,023,428) Personnel Exp 5,326,560 6,171,479 844,919 Operating Exp 3,846,888 3,854,888 8,000
ALS Transport Net -$ -$ -$
Azalea City Golf Revenues 1,359,091$ 1,297,132$ (61,959)$ Transfer from GF 98,506 265,464 166,958 Personnel Exp 767,597 861,906 94,309 Operating Exp 690,000 700,690 10,690
-$ -$ -$
Civic Center Transfer from GF 983,605$ 819,565$ (164,040)$ WAVE Transit Transfer from GF 6,026,948$ 6,026,948$ -$ Saenger Theatre* Transfer from GF -$ 155,000$ 155,000$
14
INTERNAL SERVICE & ENTERPRISE FUNDS
City Departments
Run by Management Companies
*FY2014 the Saenger Theatre was budgeted in the Capital Fund in the amount of $200,000.

Capital Improvement Fund
15

Capital Revenues and Transfers In FY2015
$23,582,292
$5,054,719
$1,722,554
$2,500,000
$2,000,000
Net Sales Tax Receipts Prior Period Carryforward
From Reserve Policy Surplus From Convention Center Fund
From Strategic Plan Fund
Strategic Plan Debt Service, Expenditures and Transfers Out FY2015
$5,054,719
$1,135,000
$2,200,000
$4,991,100
$140,000
$100,000
$25,000 $25,000
Transfer to Capital Improvement Fund Debt Service
Site Rental for 800 MHZ New Software System
Mary Abbie Berg Center Communication/React/CitiSmart
Consultant & Misc Expenses College Football Bowl Game
Strategic Plan Revenues FY2015
$3,913,798
$2,102,209$1,756,978
$5,458
$395,723
$1,722,095$600,000$379,180
$5,140$2,790,238
Lease/Rental Car Rental Sales Tax Discount
Gas Tax Increase Room Tax--City Room Tax--PJ
Business License Increase Interest Income Apt Business License
Receivable From College Bowl Game
Convention Center Revenues FY2015
$8,794,769
$1,756,801
Sales Tax Room Tax
Capital Debt Service, Expenditures and Transfers Out FY2015
$16,853,715
$500,000$445,000$4,000,000
$3,000,000
$2,500,000
$6,900,000
$350,000$290,000
Debt Service Transfer to Metro Transit Improvements & Repairs
Street & Building Repairs Park Improvements Economic Incentive
Capital Escrow-Publ Ser & Safety Stormwater Management Other
Convention Center Debt Service, Expenditures and Transfers Out FY2015
$40,000$1,722,554
$4,154,016
$100,000
$100,000
$135,000
$1,350,000
$500,000
$2,000,000
$450,000
Transfers to Capital Imrovement Fund Debt Service Convention Center Operations
Maintenance & Equip. Allowance Senior Bowl Events Mobile
Bayfest Citywide Sporting Events Mobile Bay Conv & Visitors Bureau
Building Insurance
16

FY2014 FY2015 BUDGETADOPTED PROPOSED INCREASEBUDGET BUDGET (DECREASE)
ANTICIPATED REVENUESNet Sales Tax Receipts 41,383,336$ 23,582,292$ (17,801,044)$ SPF Library Loan (Through FY 2014-15) 100,000 100,000 - Prior Period Carryforward - 2,500,000 2,500,000 From Reserve Policy Surplus - 2,000,000 2,000,000 From Convention Center Fund - 1,722,554 1,722,554 From Strategic Plan Fund - 4,954,719 4,954,719 TOTAL REVENUES 41,483,336 34,859,565 (6,623,771)
LESSDebt Service G.O. Warrants 10,883,115 14,184,278 3,301,163 Debt Service--Cruise Terminal 1,862,385 1,863,704 1,319 Bank Service Charges 20,000 20,000 - Arbitrage Rebate Calculation 10,000 20,000 10,000 Transfer to General Fund 17,664,103 - (17,664,103) Transfer Citywide Improvement Projects 200,000 - (200,000) Lease Payments 958,207 765,733 (192,474) Transfer to Metro Transit 307,526 500,000 192,474 Advertising Revenue-Metro Transit (75,000) - 75,000 Total Reserve, Debt Services and Transfer 31,830,336 17,353,715 (14,476,621) AMOUNT AVAILABLE FOR ALLOCATION 9,653,000 17,505,850 7,852,850
EXPENDITURESImprovements & Repairs 1,738,000 7,445,000 5,707,000 City's Share-Eco. Dev. Incent-Through FY 2015 2,000,000 2,000,000 - City's Share-Eco. Dev. Incent 3,800,000 500,000 (3,300,000) Capital Escrow-Publ Ser & Safety 1,775,000 6,900,000 5,125,000 Stormwater Management - 350,000 350,000 Equipment Finance 25,000 - (25,000) Equipment Administration 25,000 - (25,000) Equipment-City Clerk 20,000 20,000 - Finance-Equip/Software Upgrade 270,000 270,000 - TOTAL EXPENDITURES 9,653,000 17,485,000 7,832,000
UNALLOCATED BALANCE -$ 20,850$ 20,850$
CAPITAL IMPROVEMENTS FUND BUDGET
17
FY2014 FY2015 BUDGETADOPTED PROPOSED INCREASEBUDGET BUDGET (DECREASE)
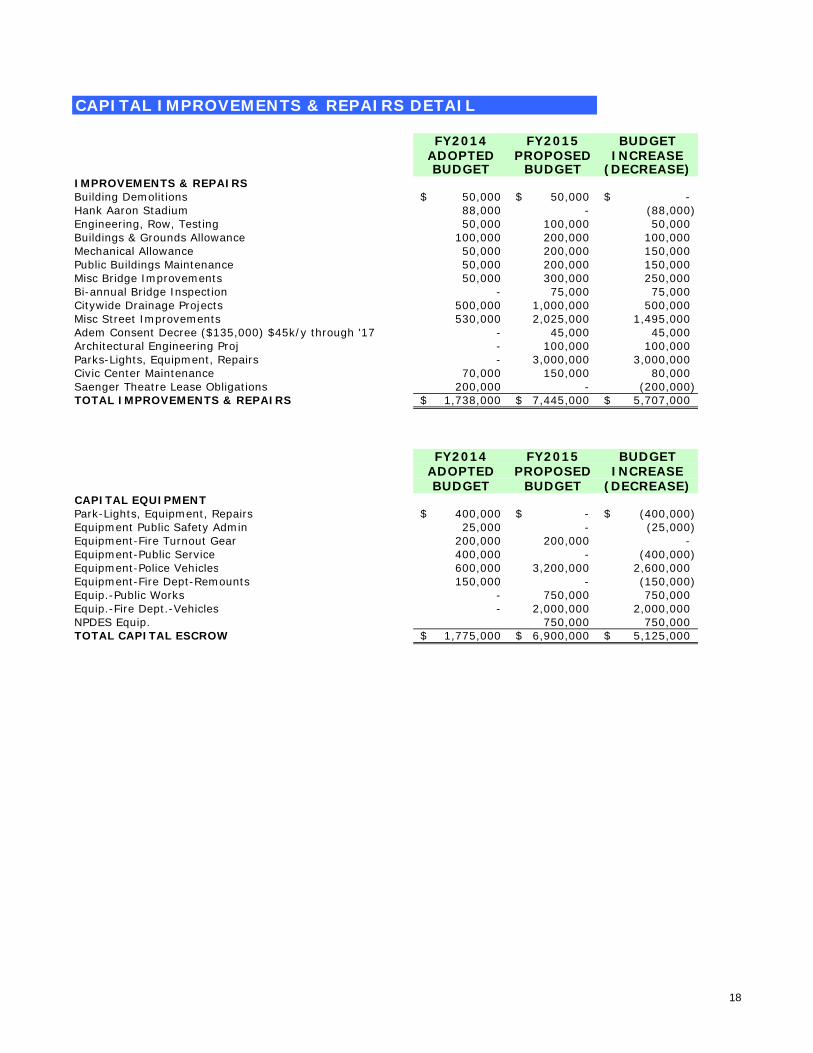
IMPROVEMENTS & REPAIRS Building Demolitions 50,000$ 50,000$ -$ Hank Aaron Stadium 88,000 - (88,000) Engineering, Row, Testing 50,000 100,000 50,000 Buildings & Grounds Allowance 100,000 200,000 100,000 Mechanical Allowance 50,000 200,000 150,000 Public Buildings Maintenance 50,000 200,000 150,000 Misc Bridge Improvements 50,000 300,000 250,000 Bi-annual Bridge Inspection - 75,000 75,000 Citywide Drainage Projects 500,000 1,000,000 500,000 Misc Street Improvements 530,000 2,025,000 1,495,000 Adem Consent Decree ($135,000) $45k/y through '17 - 45,000 45,000 Architectural Engineering Proj - 100,000 100,000 Parks-Lights, Equipment, Repairs - 3,000,000 3,000,000 Civic Center Maintenance 70,000 150,000 80,000 Saenger Theatre Lease Obligations 200,000 - (200,000) TOTAL IMPROVEMENTS & REPAIRS 1,738,000$ 7,445,000$ 5,707,000$
FY2014 FY2015 BUDGETADOPTED PROPOSED INCREASEBUDGET BUDGET (DECREASE)
CAPITAL EQUIPMENT Park-Lights, Equipment, Repairs 400,000$ -$ (400,000)$ Equipment Public Safety Admin 25,000 - (25,000) Equipment-Fire Turnout Gear 200,000 200,000 - Equipment-Public Service 400,000 - (400,000) Equipment-Police Vehicles 600,000 3,200,000 2,600,000 Equipment-Fire Dept-Remounts 150,000 - (150,000) Equip.-Public Works - 750,000 750,000 Equip.-Fire Dept.-Vehicles - 2,000,000 2,000,000 NPDES Equip. 750,000 750,000 TOTAL CAPITAL ESCROW 1,775,000$ 6,900,000$ 5,125,000$
CAPITAL IMPROVEMENTS & REPAIRS DETAIL
18

FY2015 FY2016 FY2017 FY2018 FY2019RevenuesNet Sales Tax 23,582,292$ 22,557,441$ 22,895,802$ 23,239,239$ 23,587,828$ SPF Library Loan 100,000 - - - - Prior Period Carryforward 2,500,000 - - - - From Reserve Policy Surplus 2,000,000 1,500,000 1,500,000 1,500,000 1,500,000 From Convention Center 1,722,554 1,921,728 2,143,275 2,306,333 2,471,836 From Strategic Plan 4,954,719 6,249,406 8,913,795 10,147,555 10,361,984
Total Revenues and Transfers In 34,859,565 32,228,575 35,452,872 37,193,127 37,921,648
Debt Service and Transfers Out 17,353,715 16,688,142 20,769,124 19,581,672 18,772,331
Amount Available for Allocation 17,505,850 15,540,433 14,683,748 17,611,455 19,149,317
ExpendituresImprovements & Repairs 7,445,000 5,715,000 5,815,000 7,215,000 8,365,000 Economic Incentive 2,500,000 2,500,000 1,500,000 1,500,000 1,500,000 Public Service & Safety 6,900,000 6,650,000 6,700,000 8,250,000 8,600,000 Stormwater Management 350,000 350,000 350,000 350,000 350,000 Office Equipment 290,000 290,000 290,000 290,000 290,000
Balance 20,850$ 35,433$ 28,748$ 6,455$ 44,317$
Capital Improvements
19

FY2014 FY2015 BUDGETADOPTED PROPOSED INCREASEBUDGET BUDGET (DECREASE)
STRATEGIC PLAN REVENUESLease/Rental 1,329,270$ 1,722,095$ 392,825$ Car Rental 429,502 395,723 (33,779) Sales Tax Discount 3,718,637 3,913,798 195,161 Gas Tax Increase 2,062,198 2,102,209 40,011 Room Tax--City 1,599,710 1,756,978 157,268 Room Tax--PJ 4,800 5,458 658 Business License Increase 2,443,760 2,790,238 346,478 Interest Income 6,000 5,140 (860) Apt Business License 385,281 379,180 (6,101) Receivable From College Bowl Game 1,000,000 600,000 (400,000) TOTAL REVENUE 12,979,158 13,670,819 691,661
TRANSFERSTo Capital Improvement Fund 1,308,812 4,954,719 3,645,907 To Capital Improv-MPL Loan 466,837 100,000 (366,837) Additional Police Officers 2,494,435 - (2,494,435) ALS Transport 619,282 - (619,282) 4th Paramedic Unit 404,146 - (404,146) To Capital Improv-MPL Loan 100,000 - (100,000) TOTAL TRANSFERS 5,393,512 5,054,719 (338,793)
DEBT SERVICE 2006 G.O. Ref & Cap Warrants 4,994,475 4,991,100 (3,375) USA-Cancer Center Debt 763,671 - (763,671) TOTAL DEBT SERVICE 5,758,146 4,991,100 (767,046)
EXPENDITURESSite Rental for 800 MHZ 140,000 140,000 - Mobile Education Foundation 135,000 - (135,000) Community Fdn-Workforce Development 54,000 - (54,000) Hank Aaron Stadium 71,000 - (71,000) Homeless Coalition 67,500 - (67,500) New Software System - 2,200,000 2,200,000 USA Cancer Center - - - Mary Abbie Berg Center 100,000 100,000 - Communication/React/CitiSmart 100,000 25,000 (75,000) Consultant & Misc Expenses 25,000 25,000 - College Football Bowl Game 1,135,000 1,135,000 - TOTAL EXPENDITURES 1,827,500 3,625,000 1,797,500
UNALLOCATED BALANCE -$ -$ -$
STRATEGIC PLAN FUND BUDGET
20

FY2015 FY2016 FY2017 FY2018 FY2019
Revenues 13,670,819$ 13,875,881$ 14,084,020$ 14,295,280$ 14,509,709$
To Capital Improvement Fund 5,054,719 6,249,406 8,913,795 10,147,555 10,361,984
Debt Service 4,991,100 5,351,475 2,895,225 1,872,725 1,872,725
Expenditures 3,625,000 2,275,000 2,275,000 2,275,000 2,275,000
Balance -$ -$ -$ -$ -$
Strategic Plan Fund
21
FY2014 FY2015 BUDGETADOPTED PROPOSED INCREASEBUDGET BUDGET (DECREASE)
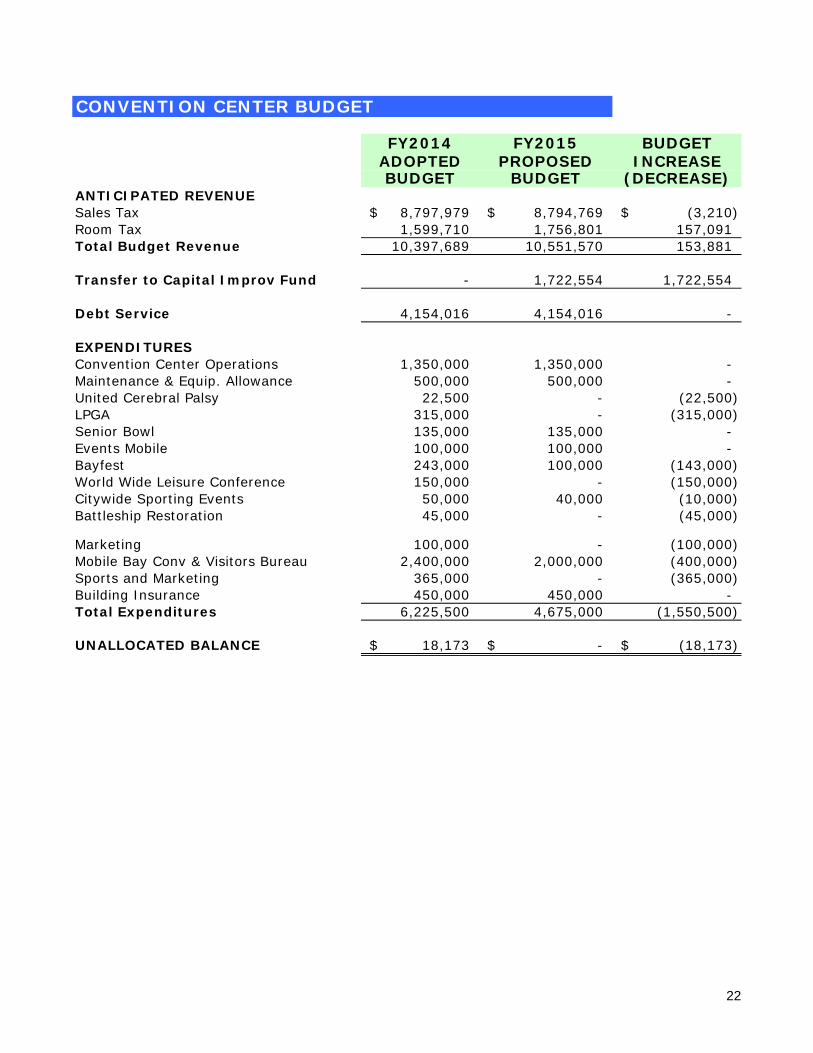
ANTICIPATED REVENUE Sales Tax 8,797,979$ 8,794,769$ (3,210)$ Room Tax 1,599,710 1,756,801 157,091 Total Budget Revenue 10,397,689 10,551,570 153,881
Transfer to Capital Improv Fund - 1,722,554 1,722,554
Debt Service 4,154,016 4,154,016 -
EXPENDITURESConvention Center Operations 1,350,000 1,350,000 - Maintenance & Equip. Allowance 500,000 500,000 - United Cerebral Palsy 22,500 - (22,500) LPGA 315,000 - (315,000) Senior Bowl 135,000 135,000 - Events Mobile 100,000 100,000 - Bayfest 243,000 100,000 (143,000) World Wide Leisure Conference 150,000 - (150,000) Citywide Sporting Events 50,000 40,000 (10,000) Battleship Restoration 45,000 - (45,000)
Marketing 100,000 - (100,000) Mobile Bay Conv & Visitors Bureau 2,400,000 2,000,000 (400,000) Sports and Marketing 365,000 - (365,000) Building Insurance 450,000 450,000 - Total Expenditures 6,225,500 4,675,000 (1,550,500)
UNALLOCATED BALANCE 18,173$ -$ (18,173)$
CONVENTION CENTER BUDGET
22
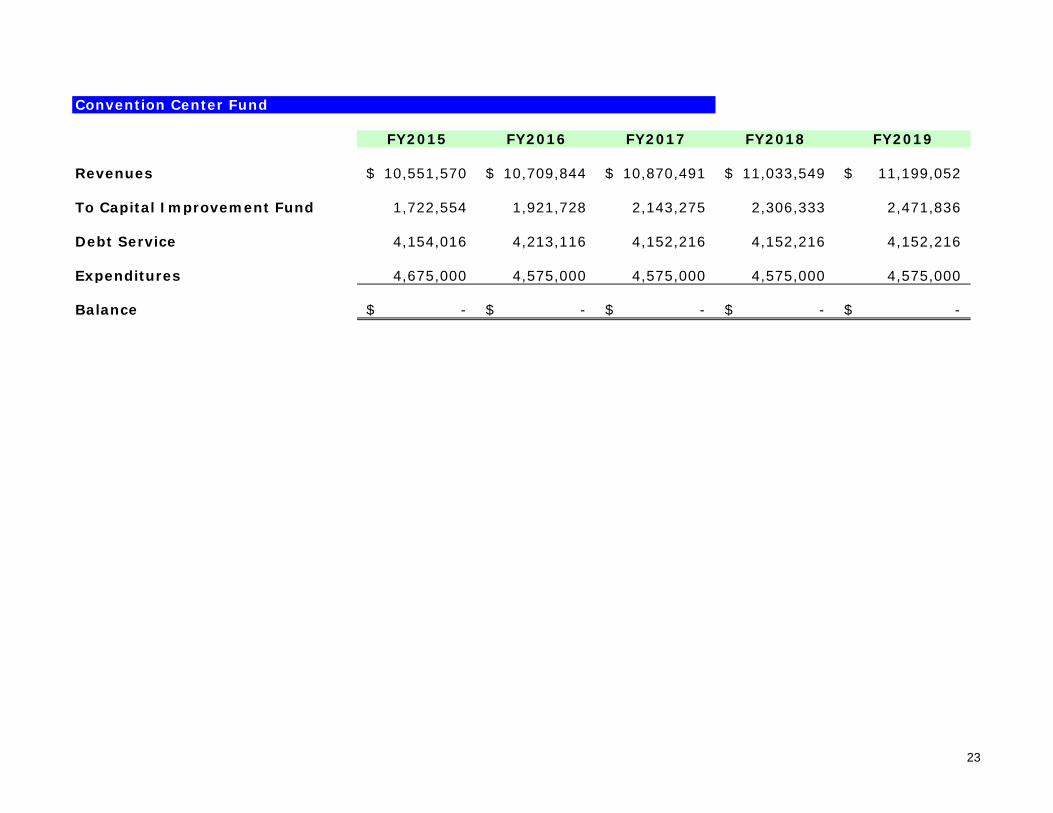
FY2015 FY2016 FY2017 FY2018 FY2019
Revenues 10,551,570$ 10,709,844$ 10,870,491$ 11,033,549$ 11,199,052$
To Capital Improvement Fund 1,722,554 1,921,728 2,143,275 2,306,333 2,471,836
Debt Service 4,154,016 4,213,116 4,152,216 4,152,216 4,152,216
Expenditures 4,675,000 4,575,000 4,575,000 4,575,000 4,575,000
Balance -$ -$ -$ -$ -$
Convention Center Fund
23