annual aquatic plant surveys at center pond becket ... pond... · stem ewm plants were commonly...
TRANSCRIPT
Aquatic Control Technology, Inc. 11 John Road ● Sutton, MA 01590-2509 ● (508) 865-1000 ● Fax (508) 865-1220 ● [email protected]
Annual Aquatic Plant Surveys at Center Pond Becket, Massachusetts ‐ 2010
Report Prepared by: Aquatic Control Technology, Inc. 11 John Road Sutton, MA 01590 Report Prepared for: Center Pond Restoration and Protection District
c/o Ted Weiller 213 Old Pond Road Becket, MA 01223
Early Season Survey performed June 21, 2010; update report submitted June 28, 2010 Late Season Survey completed October 13, 2010; final report submitted November 10, 2010
INTRODUCTION AND BACKGROUND The following report details findings of the late season aquatic plant survey performed by Aquatic Control Technology, Inc. in October 2010, and it provides recommendations for ongoing management of invasive aquatic plants at Center Pond. This work was completed for and at the direction of the Center Pond Restoration and Protection District (CPRPD). Prior to the formation of the CPRPD, the early season survey was performed for the Center Pond Protection and Preservation Foundation (CPP&PF). Objectives of these annual surveys were defined in prior years and remain as follows: A) Document the distribution and density of
non‐native aquatic plants, namely Eurasian watermilfoil (Myriophyllum spicatum) and curlyleaf pondweed (Potamogeton crispus);
B) Provide data and information necessary to formulate annual management plans to limit the spread of these invasive species;
C) Evaluate the effectiveness of these control plans make adjustments as necessary; and
D) Insure that control management techniques will not adversely impact native aquatic plants or fish and wildlife habitat.
Based on the limited distribution of Eurasian watermilfoil found in 2009, there were no plans to pursue an herbicide treatment during the 2010 season. The early season survey was still performed in late June to record the early season distribution of Eurasian watermilfoil and to make recommendations to help guide hand‐pulling efforts planned for the 2010 summer. A map depicting the distribution and relative
Center Pond – Annual Aquatic Plant Survey Report – 2010 2
abundance of Eurasian watermilfoil was prepared and forwarded to CPP&PF within about a week of the early season survey. The late season survey was conducted mid October. EARLY SEASON SURVEY SUMMARY The early season survey was performed on June 21, 2010. Representatives from Aquatic Control, CPP&PF, and the Center Pond Weed Project were present for the survey. Locations of Eurasian watermilfoil (EWM) plants were recorded using a Differential GPS unit and a distribution map was prepared and provided to CPP&F along with the spring update report on June 28, 2010. The EWM distribution and density was comparable with conditions seen during the 2009 late season survey. There was a notable reduction of the dense EWM beds near the Center Lakes Estate beach in the southeast cove. Management recommendations for the 2010 summer season were to bolster the Center Pond Weed Project’s hand pulling effort. Specific recommendations included: 1. Consider the use of benthic barriers or a Diver
Assisted Suction Harvester (DASH) to remove dense EWM beds.
2. Hire additional professional SCUBA divers.
3. Utilize a motor boat for diver transportation to and from hand‐pulling sites and for EWM reconnaissance surveys.
4. Utilize a low‐cost, hand‐held GPS unit to mark locations of EWM plants as a back‐up to the surface buoy markers currently being used.
5. Consider using Restricted Use Area (RUA) marker buoys to keep boaters away from higher density EWM growth to limit fragmentation.
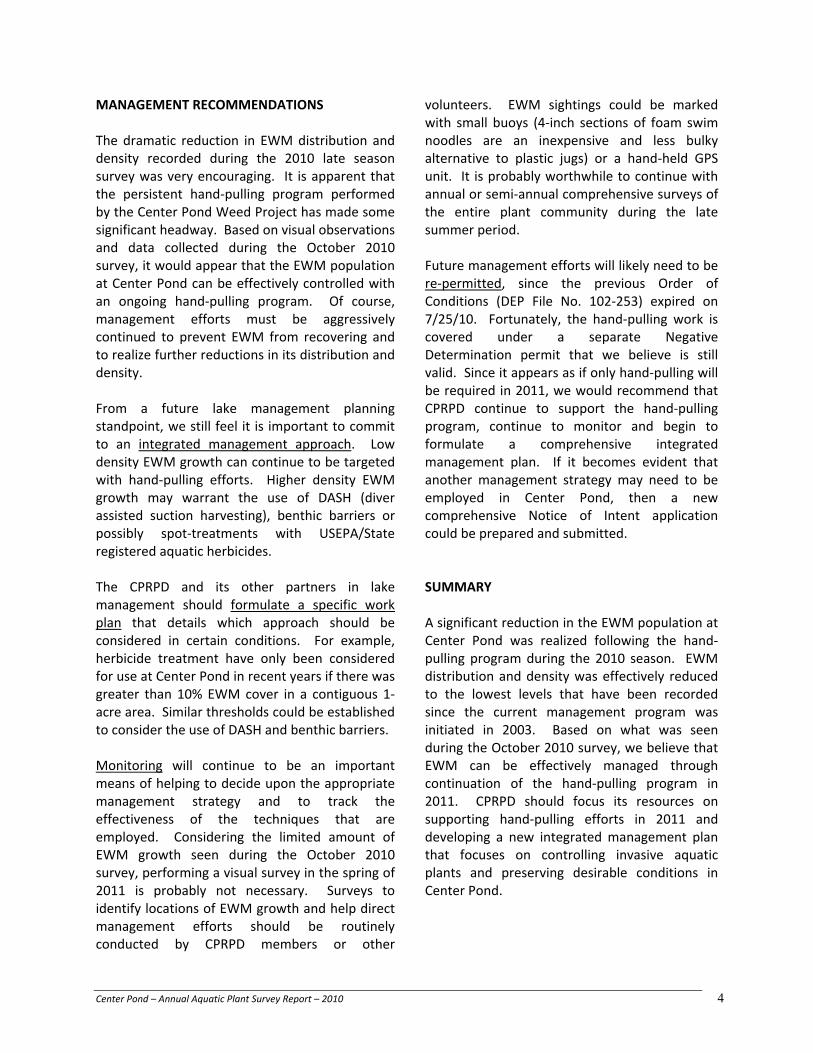
LATE SEASON SURVEY SUMMARY The late season survey was completed on October 13, 2010. Representatives from Aquatic Control, CPRPD, and the Center Pond Weed Project were present. The same survey methods used in prior years were used. Weather conditions were favorable with mostly sunny skies and only a sporadic light breeze and the water appeared to be exceptionally clear; providing for excellent visibility. A complete description of the survey methods is provided in the Appendix. The visual survey to record EWM locations with a Differential GPS unit was performed first. Figure 1 – Late Season EWM Distribution

Center Pond – Annual Aquatic Plant Survey Report – 2010 3
Table 2 – Frequency of Occurrence of Dominant Aquatic Plant Species
Common Name Scientific Name 2003
%
2004
%
2005
%
2006
%
2007
%
2008
%
2009
%
2010
%
Robbins Pondweed Potamogeton robbinsii 92 94 97 95 96 99 97 96
Largeleaf Pondweed Potamogeton amplifolius 9 13 13 14 19 28 22 14
Wild Celery Vallisneria americana 10 5 22 13 12 12 9 5
Stonewort / Muskgrass Nitella sp. / Chara sp. 10 20 18 12 17 12 5 6
Ribbonleaf Pondweed Potamogeton epihydrus 8 2 17 14 14 15 0 3
Eurasian watermilfoil (EWM) Myriophyllum spicatum 31 38 12 14 22 23 19 1
Quillwort Isoetes sp. 8 1 2 1 0 0 10 0
Note: Values derived based on presence/absence of plant species at the 78 pre‐determined data points. Other plant species
observed during the 10/13/10 survey included white waterlily (Nymphaea odorata) and cattail (Typha sp.). A complete list of plant species is provided in the Field Data Table in the Appendix.
There was a marked reduction in the EWM distribution and density as compared with prior surveys. In most locations only single stem EWM plants were encountered. There were two areas where EWM was encountered more frequently. The first was in the southern portion of Rosner’s Cove at the northern end of the pond. Single stem EWM plants were commonly encountered in this location. The bottom consists of large rocks in this location, which undoubtedly hinders hand‐pulling efforts. The highest density milfoil was still found near the Center Lake Estates beach in the southeast cove. Small patches of 5‐20 EWM plants were still marked in several locations, but there was a considerable reduction from what was observed during the spring 2010 survey and in prior years. The comprehensive transect/data point survey was completed following the visual survey. The following summary data was calculated by analyzing data collected at the 78 data points that were surveyed Center Pond (Appendix: Figure 2 and Field Data Table). The overall aquatic plant community remained fairly consistent. Robbins pondweed
(Potamogeton robbinsii) continues to dominate the plant community. Some of the quantitative measures (cover, biomass and species richness shown in Table 1) were slightly reduced from prior years, which may be due to the lateness of the survey and seasonal variability. Table 1 – Plant Survey Summary Statistics Year Total
Plant Cover
EWM Cover
Biomass Index
Species Richness
2003 60.2% 4.9% 1.8 1.9 2004 60.1% 1.2% 1.8 1.6 2005 60.1% 0.3% 1.8 1.8 2006 63.2% 0.5% 1.9 1.6 2007 61.0% 0.6% 1.9 1.9 2008 61.1% 0.6% 2.1 1.6 2009 63.1% 1.0% 2.1 1.6 2010 63.3% <0.1% 1.6 1.3 Many of the frequency of occurrence values of dominant plants encountered at the data point locations were also slightly lower, but the overall plant community appeared to be fairly stable.
Center Pond – Annual Aquatic Plant Survey Report – 2010 4
MANAGEMENT RECOMMENDATIONS The dramatic reduction in EWM distribution and density recorded during the 2010 late season survey was very encouraging. It is apparent that the persistent hand‐pulling program performed by the Center Pond Weed Project has made some significant headway. Based on visual observations and data collected during the October 2010 survey, it would appear that the EWM population at Center Pond can be effectively controlled with an ongoing hand‐pulling program. Of course, management efforts must be aggressively continued to prevent EWM from recovering and to realize further reductions in its distribution and density. From a future lake management planning standpoint, we still feel it is important to commit to an integrated management approach. Low density EWM growth can continue to be targeted with hand‐pulling efforts. Higher density EWM growth may warrant the use of DASH (diver assisted suction harvesting), benthic barriers or possibly spot‐treatments with USEPA/State registered aquatic herbicides. The CPRPD and its other partners in lake management should formulate a specific work plan that details which approach should be considered in certain conditions. For example, herbicide treatment have only been considered for use at Center Pond in recent years if there was greater than 10% EWM cover in a contiguous 1‐acre area. Similar thresholds could be established to consider the use of DASH and benthic barriers. Monitoring will continue to be an important means of helping to decide upon the appropriate management strategy and to track the effectiveness of the techniques that are employed. Considering the limited amount of EWM growth seen during the October 2010 survey, performing a visual survey in the spring of 2011 is probably not necessary. Surveys to identify locations of EWM growth and help direct management efforts should be routinely conducted by CPRPD members or other
volunteers. EWM sightings could be marked with small buoys (4‐inch sections of foam swim noodles are an inexpensive and less bulky alternative to plastic jugs) or a hand‐held GPS unit. It is probably worthwhile to continue with annual or semi‐annual comprehensive surveys of the entire plant community during the late summer period. Future management efforts will likely need to be re‐permitted, since the previous Order of Conditions (DEP File No. 102‐253) expired on 7/25/10. Fortunately, the hand‐pulling work is covered under a separate Negative Determination permit that we believe is still valid. Since it appears as if only hand‐pulling will be required in 2011, we would recommend that CPRPD continue to support the hand‐pulling program, continue to monitor and begin to formulate a comprehensive integrated management plan. If it becomes evident that another management strategy may need to be employed in Center Pond, then a new comprehensive Notice of Intent application could be prepared and submitted. SUMMARY A significant reduction in the EWM population at Center Pond was realized following the hand‐pulling program during the 2010 season. EWM distribution and density was effectively reduced to the lowest levels that have been recorded since the current management program was initiated in 2003. Based on what was seen during the October 2010 survey, we believe that EWM can be effectively managed through continuation of the hand‐pulling program in 2011. CPRPD should focus its resources on supporting hand‐pulling efforts in 2011 and developing a new integrated management plan that focuses on controlling invasive aquatic plants and preserving desirable conditions in Center Pond.

Center Pond – Annual Aquatic Plant Survey Report – 2010 5
APPENDIX
Survey Methods
Table 1 – Field Survey Data Table
Figure 1 – Late Season EWM Distribution Comparison 2005‐2008
Figure 2 – Transect/Data Point Location Map
Figure 3 – 2010 Late Season Milfoil Distribution
Figure 4 – 2010 Late Season Dominant Aquatic Plant Assemblage
Report on Aquatic Plant Survey – Spring/Early Summer 2010 (submitted 6/28/10)

SURVEY METHODS The first task involved a boat tour of the entire littoral zone of the lake to visually identify milfoil and curlyleaf pondweed growth. This involved visual inspections along with use of Bata Scope (view scope) and Aqua Vu Underwater Camera System. A Differential GPS unit with sub‐meter accuracy was also used to record milfoil locations. The second, more comprehensive task was the completion of a quantitative transect/data point analysis. Survey methods used since the current management program’s inception in 2003 were replicated. Geo‐spatially referenced data points were relocated using a DGPS system equipped with sub‐meter accuracy. A total of 15 transects and 78 data points were sampled, 41 of which were located in the designated Wildlife Habitat Protection Zone (Figure 2). The following information was recorded at each data point: water depth, aquatic plants present in decreasing order of abundance, percent total plant cover, plant biomass and percent milfoil cover. Water depth was measured using a digital depth finder and calibrated sounding rod. The plant community was assessed through visual inspection, use of a long‐handled rake and throw‐rake, and with an Aqua‐Vu underwater camera system. Plants were identified to species level when possible. Plant cover was given a percentage rank based on the areal coverage of plants within an approximate 400 square foot area assessed at each data point. Generally, in areas with 100% cover, bottom sediments could not be seen through the vegetation. Percentages less than 100% indicated the amount of bottom area covered by plant growth. The percentage of Eurasian watermilfoil was also recorded at each data point. In addition to cover percentage, a plant biomass index was assigned at each data point to document the amount of plant growth vertically through the water column. Plant biomass was estimated on a scale of 0‐4, as follows:
0 No biomass; plants generally absent 1 Low biomass; plants growing only as a low layer on the sediment 2 Moderate biomass; plants protruding well into the water column but generally not reaching the
water surface 3 High biomass; plants filling enough of the water column and/or covering enough of the water
surface to be considered a possible recreational nuisance or habitat impairment 4 Extremely high biomass; water column filled and/or surface completely covered, obvious
nuisance conditions and habitat impairment severe

TABLE 1 - FIELD SURVEY DATA TABLE CENTER POND 2010 Survey Date: 10/13/10
Data Point
Water Depth (feet)
Ms Pr Pa Pe Pp Ni V Ec Sp Nu ITotal Plant
% Cover
Milfoil % Cover
Biomass Index
Species Richness
1a 2.5 100 100 2 11b 9 90 90 1 11c 10 100 100 1 11d 5 50 50 1 11e 5 70 70 1 12a 5.5 30 30 1 12b 13 40 40 1 12c 18 0 0 02d 14 90 90 2 12e 4 75 5 80 2 23a 5.5 60 5 65 2 23b 7 90 90 2 13c 14 80 80 1 13d 7.5 80 80 2 13e 4.5 70 70 2 13f 4 50 50 2 14a 3.5 70 70 2 14b 7.5 20 20 1 40 3 34c 2.5 60 5 65 2 25a 5 60 60 2 15b 10 50 50 1 15c 11 90 90 1 15d 4.5 80 5 5 90 2 35e 2 30 30 1 16a 2 40 40 2 16b 10 70 5 75 2 26c 12.5 90 90 2 16d 8 90 80 2 16e 4.5 60 60 2 17a 3.5 1 50 50 1 2 27b 7 50 50 2 17c 10 90 90 1 17d 11.5 90 90 1 17e 8.5 90 90 2 1
Page 1 of 3

TABLE 1 - FIELD SURVEY DATA TABLE CENTER POND 2010 Survey Date: 10/13/10
Data Point
Water Depth (feet)
Ms Pr Pa Pe Pp Ni V Ec Sp Nu ITotal Plant
% Cover
Milfoil % Cover
Biomass Index
Species Richness
7f 4 40 40 2 18a 5 40 40 1 18b 10 70 70 1 18c 12.5 90 90 1 18d 8 90 90 1 18e 4 50 50 2 19a 3 60 60 2 19b 6 30 10 5 10 55 2 49c 7.5 90 90 2 19d 7 50 50 2 19e 5.5 60 5 10 75 2 310a 5 5 10 15 1 210b 8 80 80 2 110c 11 80 80 2 110d 18 0 0 010e 11 80 80 2 110f 4 40 40 2 111a 5 80 5 85 2 211b 13 80 70 2 111c 16 80 80 2 111d 12 80 80 2 111e 8 70 70 2 111f 4 50 10 10 70 2 312a 3 80 80 2 112b 4.5 90 90 2 112c 8 80 5 85 2 212d 6 50 50 2 112e 3 30 5 5 40 1 312f 2 20 20 1 113a 3.5 70 70 2 113b 6 60 60 2 113c 8 70 5 75 2 213d 16 70 70 1 113e 5.5 5 10 15 1 214a 7 30 30 2 114b 17 0 0 0
Page 2 of 3

TABLE 1 - FIELD SURVEY DATA TABLE CENTER POND 2010 Survey Date: 10/13/10
Data Point
Water Depth (feet)
Ms Pr Pa Pe Pp Ni V Ec Sp Nu ITotal Plant
% Cover
Milfoil % Cover
Biomass Index
Species Richness
14c 10 70 70 2 114d 7 50 50 2 114e 3 30 30 1 115a 6 40 40 2 115b 8 80 80 2 115c 13 90 90 1 115d 11 90 90 2 115e 4 50 50 2 1Averages7.58 63.33 1.64 1.26Sum 1 4805 80 10 0 31 35 0 0 0 0 4940 1 128 98Average (%) 0.01 61.60 1.03 0.13 0.00 0.40 0.45 0.00 0.00 0.00 0.00 63.33 0.01 1.64 1.26Count 1 75 11 2 0 5 4 0 0 0 0Freq 1.3% 96.2% 14.1% 2.6% 0.0% 6.4% 5.1% 0.0% 0.0% 0.0% 0.0%
NOTES:
Macrophyte Species Common Name 2010 Late Season Distribution 10/6/09 Survey Conditions: (abbreviation used in data tables) - Mostly sunny
- Light, gusty breeze (<5 mph)Potamogeton robbinsii (Pr) Robbins pondweed Abundant; Dominant plant - Visibility: good to very goodPotamogeton amplifolius (Pa) Largeleaf pondweed CommonVallisneria americana (V) Wild celery Scattered in southern half - Secchi Disk water clarity = >17 feetPotamogeton epihydrus (Pe) Ribbonleaf pondweed SparseNitella / Chara (Ni) Stonewort (macroalgae) Scattered in deeper water Depth (m) T (*C/*F) DO (mg/l)Myriophyllum spicatum (Ms) Eurasian watermilfoil EXOTIC – sparse 1 14.3/57.8 10.2Najas flexilis (Nf) Slender naiad/bushy pondweed None encountered 5 13.3/55.9 9.1Potamogeton pusillus (Pp) Thinleaf pondweed None encounteredIsoetes sp. (I) Quillwort None encounteredTypha latifolia. (T) Broad-leaf cattails Patchy shoreline growthSparganium (Sp) Burreed None encounteredChlorophyta (Fa) Filamentous green algae None encounteredPotamogeton crispus (Pc) Curlyleaf pondweed EXOTIC – none encounteredElodea canadensis (Ec) Elodea None encounteredNuphar sp. (Nu) Spatterdock/yellow waterlily None encountered
Page 3 of 3


9e
9d
9c
9b9a
8e8d8c8b8a
7f7e
7d7c 7b
7a
6e6d
6c6b6a
5e5d
5c 5b5a
4c
4b
4a
3f3e3d3c
3b3a
2e 2d 2c 2b2a
1e
1d
1c1b
1a
15e15d
15c 15b15a
14e14d14c14b14a
13e13d
13c13b
13a
12f
12e
12d
12c
12b12a11f
11e11d
11c11b11a
10f10e 10d10c 10b
Legend:
FIGURE: MAP DATE:SURVEY DATE:
10/13/10 11/09/10
0 1,000500
Feet
CENTER POND
TRANSECT/DATA POINT LOCATIONS
Becket, MA
11 JOHN ROAD
SUTTON, MASSACHUSETTS 01590
PHONE: (508) 865-1000
FAX: (508) 865-1220
WEB: WWW.AQUATICCONTROLTECH.COM
¯
2
73894.sid (orthophoto courtesy of MassGIS)
Data point locations(same locations sampled since 2003)

!
!!
!
!
!!! !
!!!!
!
!
!!
!
!
!
!
#
!!!#
$""
!
!
!
!
"
Legend:
FIGURE: MAP DATE:SURVEY DATE:
10/13/10 11/09/10
CENTER POND
2010 Late Season Milfoil Distribution
Becket, MA
11 JOHN ROAD
SUTTON, MASSACHUSETTS 01590
PHONE: (508) 865-1000
FAX: (508) 865-1220
WEB: WWW.AQUATICCONTROLTECH.COM
²
3 Orthophoto from MassGIS: 73894.sid
! 1 - EWM plant
# 5 - EWM plants
" 20+ - EWM plants
0 400 800 1,200 1,600 2,000200Feet
DGPS locations of Eurasian watermilfoil (EWM)found during 10/13/10 survey
10+ - EWM plants$

Legend:
FIGURE: MAP DATE:SURVEY DATE:
10/13/10 11/09/10
CENTER POND
2008 LATE SEASON DOMINANTAQUATIC VEGETATION
Becket, MA
11 JOHN ROAD
SUTTON, MASSACHUSETTS 01590
PHONE: (508) 865-1000
FAX: (508) 865-1220
WEB: WWW.AQUATICCONTROLTECH.COM
¯
4 Orthophoto from MassGIS: 73894.sid
0 400 800 1,200 1,600 2,000 2,400200
Feet
Mixed assemblage - pondweeds, wild celery, EWM
White waterlily bed
Robbins pondweed <50% & EWM
Robbins pondweed >50%, EWM present, otherspecies uncommon
little or no vegetation

Aquatic Control Technology, Inc.
11 John Road Sutton, MA 01590-2509 (508) 865-1000 Fax (508) 865-1220 [email protected]
June 28, 2010
Center Pond Preservation and Protection Foundation, Inc. c/o Alfred G. Kirchner 116 Anthony Road Dalton, MA 01226
Re: Report on Aquatic Plant Survey – Spring/Early Summer 2010
Dear Mr. Kirchner:
This report details findings of our Spring/Early Summer 2010 aquatic plant survey of Center Pond. Similar to last year, the primary focus of the survey was to identify the distribution of the two known non-native and invasive species in the lake, Eurasian watermilfoil (Myriophyllum spicatum) and curlyleaf pondweed (Potamogeton crispus), and to help guide management efforts for the 2010 season.
SURVEY APPROACH
The 2010 spring/early summer survey was performed on June 21st between 10:30 a.m. and 1:30 p.m. Weather conditions were good with mostly sunny skies and only a light intermittent wind, which provided for good visibility.
Representatives from Aquatic Control, the Center Pond Preservation and Protection Foundation, tand the Center Pond Weed Project were present. The survey was conducted from Aquatic Control’s boat and involved visual inspections, along with the use of Batascope (view scope). A Trimble Differential GPS unit with sub-meter accuracy was used to record locations where milfoil was encountered. The survey began at the Town Beach and boat launch and then the lake was toured in a counter-clockwise direction. Special attention was paid to areas of known milfoil populations.
AQUATIC VEGETATION SURVEY FINDINGS
The DGPS recorded locations where Eurasian watermilfoil (EWM) was found during the survey are shown on the attached map (Figure 2010-1). Consistent with the 2009 late season survey and prior surveys, four (4) designations for milfoil are shown on the map. The yellow dots represent individual milfoil plants or areas where there were single-stem EWM plants in the immediate vicinity of the boat. The red triangles represent areas where 5 EWM plants were found within the immediate vicinity of the boat. The blue pentagons represent areas where 10 or more EWM plants were found within the immediate vicinity of the boat. The green squares represent areas where 20 or more EWM plants were found within the immediate vicinity of the boat. The purple crosses represent areas where 100 or more EWM plants were found within immediate vicinity of the boat. The perimeter of dense milfoil beds were also mapped using DGPS. One dense bed was found in the southeast corner near Center Lake Estates. The bed was present in 2009, but does appear to have been reduced in size.
No curlyleaf pondweed plants were encountered during the survey.

Center Pond – Spring/Early Summer 2010 Aquatic Vegetation Survey
2
The EWM infestation is similar to what has been documented over the past couple of years. There did appear to be a similar EWM distribution and density to what was documented during the late summer survey in 2009, and that the EWM distribution and density was somewhat reduced from what was documented during the early season survey in 2009. The hand-pulling program appears to making some progress towards EWM reductions, but the efforts must continue; preferably at a greater level than has been performed over the past couple of years. Allowing EWM to recover in areas that were cleared in 2009 or not targeting all of the established EWM growth in 2010, may lead to a more established infestation that will become more difficult to control in the future.
MANAGEMENT RECOMMENDATIONS – 2010 SEASON
Our recommendations remain essentially unchanged from what we proposed in 2009. Again, since herbicide spot-treatments will not be pursued in 2010, there is a substantial need to bolster the current, hand-pulling program in order to achieve measurable reductions in EWM density. We would recommend the following non-chemical strategies be considered for the 2010 season:
1. Consider utilizing Diver Assisted Suction Harvesting (DASH) or bottom (benthic) weed barriers to control the dense EWM beds found by the Center Lake Estates. Focusing on this area with the current hand-pulling program requires considerable time and effort and delays the removal of more widely scattered EWM growth found in other portions of the lake. The longer that these EWM plants remain unmanaged, the more energy is sent into developing their root crowns, and this will ultimately make control more difficult to achieve. Several regionally-based companies are currently offering “for-hire” DASH services. Most lake associations and other lake managers report that DASH can greatly accelerate EWM removal efforts. Most groups appear to offer services in the $1200-$1500 per day range.
2. Consider contracting with other professional SCUBA diver hand-pulling crews that can assist the current effort in targeting complete removal of EWM from Center Pond.
3. Utilize a motor boat for the diver hand-pulling effort. We have repeatedly stated that the divers’ efficiency has been limited since they need to swim to hand-pulling areas from sometimes distant shoreline access points. A motor boat would help in transporting the divers to hand-pull areas in order to maximize their dive time. Several other lakes in the Northeast have also utilized motor boats to tow divers around the lake, increasing EWM detection and removal rates.
4. Utilize a hand-held GPS units (available for $200-$400) to mark EWM locations. This will help provide a record of actual locations and serve as a back-up to the surface buoy/marker system that is currently being employed.
5. Consider using Restricted Use Area (RUA) marker buoys to keep boaters away from areas with higher density EWM growth that is susceptible to fragmentation and spread. Large, brightly color buoys, or vertical column-style, spar-buoys with custom wording could be used. This strategy has been successfully employed by the Massachusetts DCR and the New Hampshire Department of Environmental Services.
Again, we still believe that it is critical that all EWM growth be targeted for removal during the 2010 season. Scattered EWM plants left unmanaged will only increase their root crown and result in additional spread and displacement of native plants. We have seen several lakes hold EWM infestations “at-bay” for several years only to experience explosive growth that quickly overwhelms past successes. Center

Center Pond – Spring/Early Summer 2010 Aquatic Vegetation Survey
3
Pond is fortunate that EWM appears to grow and spread more slowly than what we have seen at other regional lakes. This is probably due in part to low nutrient levels and the robust bottom cover of Robbins pondweed. However, conditions could still deteriorate rapidly with a highly invasive plant like Eurasian watermilfoil.
We trust that this information will assist with your 2010 EWM management efforts. Please feel free to contact me if you have any questions.
Sincerely,
AQUATIC CONTROL TECHNOLOGY, INC.
Marc Bellaud Senior Biologist
CC: Becket Conservation Commission Richard Furlong, Town Administrator, Town of Becket
Attachment: Figure 2010_1 Early Season Milfoil Survey Distribution Map

!
!!
!!!
!
!
!!
!!!!
!!
!!!
!
!
!!!!!!
!!!
!
!
!!
!
!
!
!
!
!
!
!!!
!
!
!
!
!!!
!
!!
!
!!
! !
!
!
!!!
!
#
####
##
##
#
##
#
#
#
#
##
#
##
#
#
$$$$
$
$
$
$
$
$
$$
$
""
"
"
"
"
"
"""
""
"
""
Legend:
FIGURE: MAP DATE:SURVEY DATE:
6/21/10 6/24/10
CENTER POND
2009 Early Season Milfoil Distribution
Becket, MA
11 JOHN ROAD
SUTTON, MASSACHUSETTS 01590
PHONE: (508) 865-1000
FAX: (508) 865-1220
WEB: WWW.AQUATICCONTROLTECH.COM
¯
2010_1Orthophoto from MassGIS: 73894.sid
! 1 - EWM plant
# 5 - EWM plants
" 20+ - EWM plants
0 400 800 1,200 1,600 2,000200Feet
DGPS locations of Eurasian watermilfoil (EWM)found during 6/21/10 survey
$ 10 - EWM plants
Perimeter of denseEWM bed