annual - gsanborns.com.mx · annual report 2012. grupo ... ishop-mixup, edumac, dax, sanborn s...
TRANSCRIPT

www.gsanborns.com.mx
ann
ual r
epor
t 201
2G
ru
po
Sa
nb
or
nS
annualreport 2012

Grupo SanbornS iS a leadinG retail company in mexico with a unique, multi-format portfolio that includeS department StoreS, technoloGy and electronicS StoreS, convenience StoreS, luxury StoreS, and reStaurantS, featurinG biG-name brandS Such aS SearS, SanbornS, iShop-mixup, edumac, dax, SanbornS café and SakS fifth avenue. Grupo SanbornS operateS 418 StoreS, totalinG almoSt a million Square meterS in SaleS area, in 53 citieS in mexico. we offer a broad value propoSition to our cuStomerS, which include 2.8 million cardholderS.
investor relations
contact:Angélica Piña Garnica
internet websitesFor more information about Grupo Sanborns
please visit the following webpages:
www.sanborns.com.mx
www.sears.com.mx
www.ishopmixup.com
the company’s headquarters are located at:Lago Zurich No. 245
Presa Falcón Building
Seventh Floor, Plaza Carso,
Ampliación Granada
Mexico City, 11529
share information:Grupo Sanborns shares trade in the Mexican
Stock Exchange under the ticker symbol: GSANBOR
This Report contains forward-looking statements and projections. By their nature, the forward-looking statements and projections involve inherent uncertainties and risks, both general and specific, and there is a risk that the predictions, forecasts, projections and other forward-looking statements will not be achieved. Although we believe the plans, intentions and expectations reflected in or suggested by such forward-looking statements are reasonable, we can not ensure that such plans, intentions and expectations will be achieved.Additionally, the potential investors shall not construe statements made in connection with past trends or activities as an assurance that such trends or activities will continue in the future.
dowload the annual report application to your ipad®
Des
ign:
ww
w.x
des
ign.
com
.mx
P
rint:
Ear
thco
lor,
Hou
ston
to acceSS the multimedia materialS for the annual report on your Smart phone or tablet, follow theSe Simple StepS...
1. Scan thiS qr code 3. that’S it! now Simply click on the paGeS with thiS loGo:
2. download the app
2.20 trees preserved
798.57 gallons of water saved
379.19 lb of greenhouse gases reduced and/or offset
1.53 million BTU’s energy not consumed
This report was printed on Earthaware paper, FSC® certified, elemental chlorine and acid-free
All efforts are important, and although the press run of this Annual Report is relatively small, we reiterate our commitment to the environment by using environmentally-safe materials.The following are savings resulting from the use of recycled fiber in this project:

2012 2011 VARRevenues 39,411,287 36,415,957 8.2%
Operating Income 4,565,522 4,301,845 6.1%
Operating Margin 11.6% 11.8% -0.2
EBITDA 5,225,703 4,916,525 6.3%
EBITDA margin 13.3% 13.5% -0.2
Controlling Participation in Net Income 2,966,795 2,674,272 10.9%
Net Margin 7.5% 7.3% 0.20
Total Assets 31,201,517 29,956,018 4.2%
Total Liabilities 15,972,727 11,563,598 38.1%
Consolidated Shareholders´ Equity 15,228,790 18,392,420 -17.2%
Total Debt 5,273,039 1,372,936 284.1%
Net Debt 2,945,184 -676,626 NA
Total Sales Area (sq meters) 973,876 978,103 -0.4%
Credit Portfolio 8,444,661 8,017,932 5.3%
% Non Performing Loans 2.2% 2.7% -0.5
Total Debt/EBITDA 1.01 0.28 0.7
Outstanding shares (‘000)** 1,949,692 1,949,692 0
Earnings per Share of the Controlling Participation 1.52 1.37 10.9%
End year price of the stock*** 0 0 NA
*Except outstanding shares and earnings per share ** Compounded Average ***Started quoting in the Mexican Stock Exchange on February
8th, 2013 at $28.00 pesos per share. EBITDA: Is calculated as comprehensive income plus depreciation and amortization, income taxes,
interest expense, foreign exchange loss, loss on valuation of derivatives and the effect of conversion of investments in companies abroad,
less interest income, exchange gain and gain on valuation of derivative financial instruments.
key financial InfoRmAtIon
1
(Thousand pesos as of December 31, 2012 and 2011*)

418stoRes
973,876sqmtotAl AReA
Grupo SanbornS hAS A BROAD gEOgRAPhIC COvERAgE wITh A fOCuS PRIMARILy IN MExICO.
ThROugh OuR STORE NETwORk wE hAvE PRESENCE IN 53 CITIES ACROSS ThE COuNTRy
51.7% 20,382,975
31.8% 12,535,064
10.9% 4,281,425
5.6% 2,211,823
100.0% 39,411,287
53.2% 2,781,301
22.5% 1,174,955
5.0% 262,918
19.3% 1,006,529
100.0% 5,225,703
SearS
SanbornS
iShop/MixUp
other
SearS
SanbornS
iShop/MixUp
other
Revenue BReakdown By suBsidiaRy(Thousand pesos)
EBITDA BrEAkDown By suBsIDIAry(Thousand pesos)
outstAndIng poRtfolIo of multI-foRmAts wIth hIghly RecognIzed bRAnds
2 3Grupo SanbornS Annual Report 2012
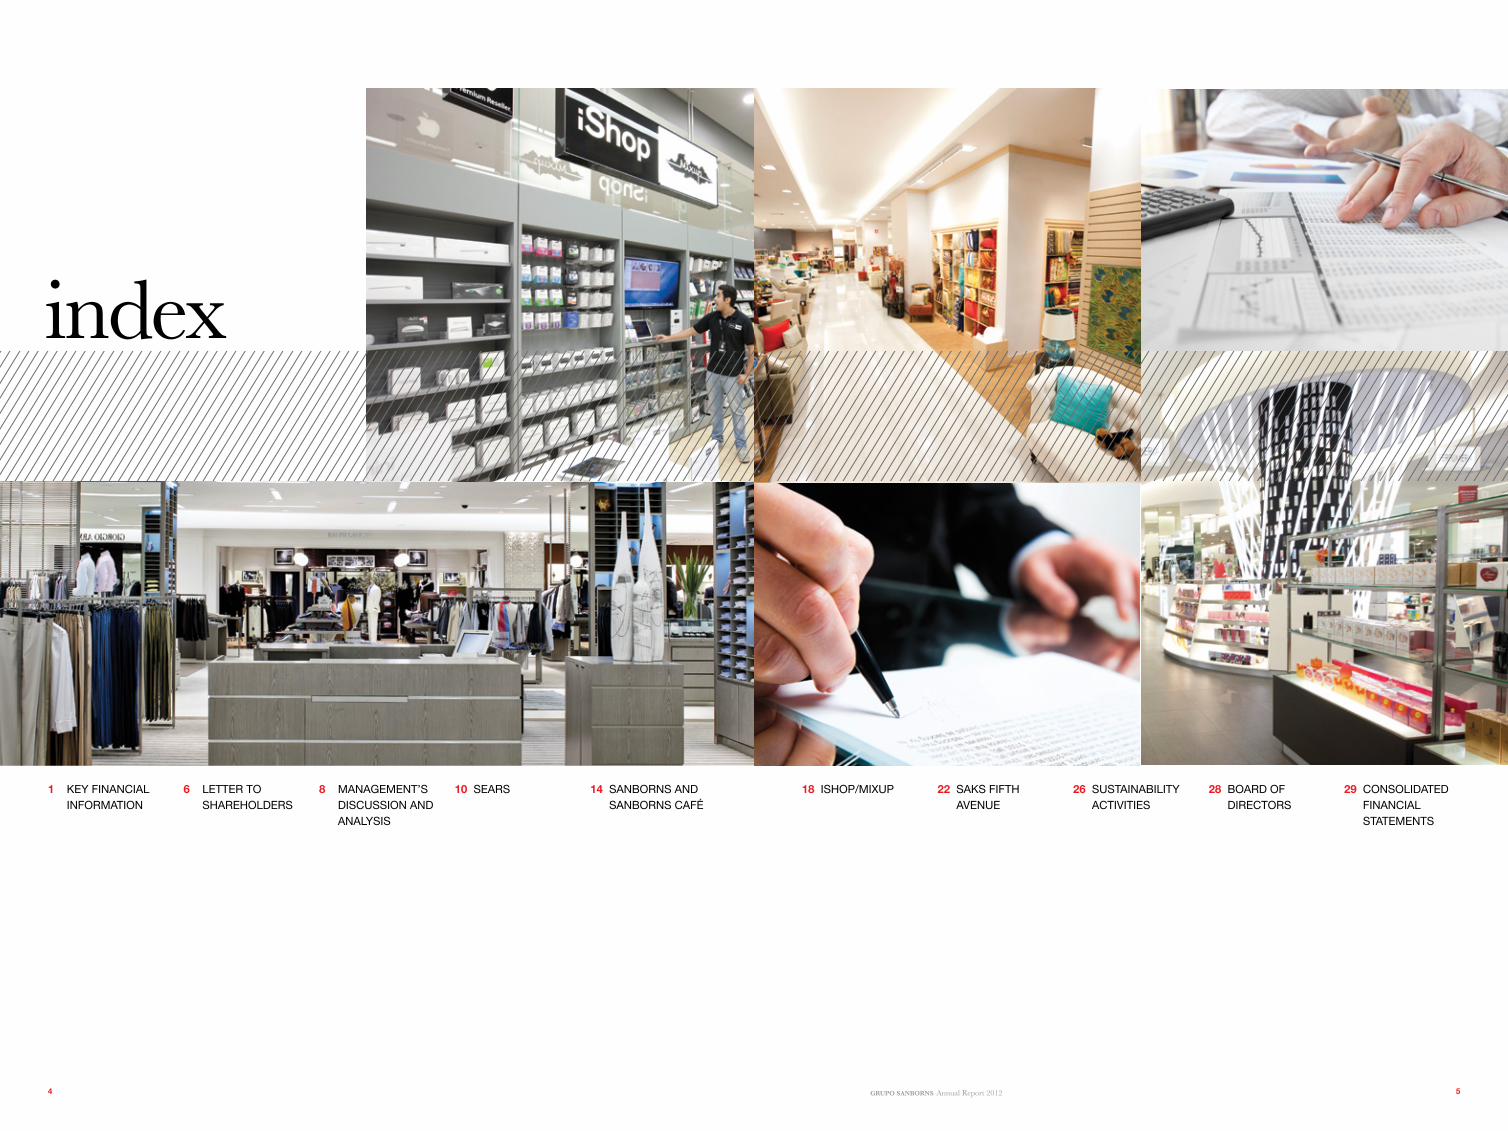
29 Consolidated FinanCial statements
1 Key FinanCial inFormation
6 letter to shareholders
8 management’s disCussion and analysis
10 sears 14 sanborns and sanborns CaFé
18 ishoP/miXuP 22 saKs FiFth aVenue
26 sustainability aCtiVities
28 board oF direCtors
index
4 Grupo SanbornS Annual Report 2012 5

Economic contExtThe same structural and financial conditions that characterized the global economy in the past few years remained in force in 2012. Most significantly, the macroeconomic variables of developed nations continue to be problematic, which has an impact on global economic growth. On the other hand, developing countries, most of which have healthy fiscal and financial systems, have benefited from global monetary policies, since low interest rates and the easy availability of resources encourage the development of productive projects, make the economy more dynamic, and create jobs.
The united States has maintained a short-term monetary policy of negative interest in real terms in an effort to reactivate investment in production to accelerate economic activity and to make the payment of interest on its enormous government debt less onerous, even as it seeks to make mortgage payments more affordable for families. however, the problem of the high fiscal deficit remains, which forces the u.S. to continue to raise its debt ceiling by having agreed to a fiscal consolidation plan that allows it to meet its immediate spending commitments and reduce over the medium term the high deficit, which began to worsen in 2008, and lower the overall debt level, which in 2012 exceeded 100% of the country’s gDP.
for its part, Europe is facing similar circumstances, but with strong restrictions on spending, an overvalued currency, and high unemployment rates in many countries in the region. growth is practically flat or even negative in some countries, and short and medium-term prospects are not promising.
Mexico’s economic variables remain strong. Since its low rates are higher than those of the developed countries, it is attracting a lot of foreign portfolio investment, a flow that in 2012 exceeded uS$ 80 million, double that of the previous year. Although this reflects the confidence of investors in our country, this situation creates vulnerability since its duration is uncertain and because of the revaluation of the peso, which leads to higher imports and lower exports. with regard to foreign direct investment, the country has become a primary destination for manufacturing, especially for the automotive industry, due to competitive advantages in terms of cost attributable to production and proximity to the world’s biggest market. Inflation, however, is unstable.
Mexico’s banking system is well capitalized and characterized by sound public finances, interest rates that encourage financing and investment, long-term money availability internal and external savings, a young population, natural resources, and potential in terms of tourism, agriculture, energy, infrastructure, and mining, among other factors that encourage development. Therefore, despite an unfavorable global environment, our country has the opportunity to accelerate its expansion, adding millions of people to productive operations, creating wellbeing and consumption capacity, which are the only sustainable drivers of permanent growth.
Grupo SanbornShere at grupo Sanborns we have confidence in Mexico’s economy, which is marked by favorable demographic and macroeconomic variables. As a result, we believe business conditions are very attractive for the department and specialty store industry.
grupo Sanborns became a publicly held company in 2013. The percentage of capital invested reached 17%, and the distribution of shares was successful not only in the Mexican market, where 60% was allocated, but also in international markets, which accounted for 40%.
In 2012 we opened a number of stores of various formats. These included: four iShops, one Sears and four Sanborns, including the Condes de xala location in a historic mansion that was restored for the benefit and enjoyment of anyone visiting downtown Mexico City. At the end of the year, grupo Sanborns’ total sales area stood at 973,876 square meters, including 60,331 restaurant seats.
The 2012 Sanborns and Sears store openings integrated a new, more attractive design, which is also consonant with our new strategy to continue to offer a variety of current, trendy options and high-quality services even as we increase the value propositions we offer our customers and grow market share.
Our credit portfolio grew by 5%, totaling $8,859 million pesos and more than 2.8 million cardholders, while our past-due loans remained at just 2.2%. Since we believe that our private-brand Sears, Sanborns, Mixup and Saks fifth Avenue cards – along with our financing experience – increase purchasing power and offer our customers additional benefits, we plan to grow this business.
with respect to operations, dynamic performance across all of our formats, but particularly by Sears, led to an 8% increase in sales, which totaled $39,411 million pesos. EBITDA moved up 6.3%, accompanied by a slight decline of 0.2 percentage points in EBITDA margin which was 13.3%, due to a change in the mix of products with lower added value.
Total equity came to $31,201 million pesos, with the controlling shareholders’ equity totaling $13,777 million pesos. we maintained a solid financial performance with a net operating cash flow of $3,418 million pesos, allowing us to maintain a conservative debt profile, resulting in a total liabilities-to-EBITDA ratio of 1.0x in 12 months.
A clear business strategy coupled with the resources obtained in the primary offering, the Company’s capital structure and cash flow generation, have allowed us to outline an aggressive expansion and remodeling plan for the next five years, through which we will seek attractive returns on invested capital and to strengthen our position in the market through our retail formats.
with respect to sustainability, protecting the environment is a priority at Sanborns and Sears, which in 2012 continued installing solar panels and replacing florescent bulbs and refrigeration and air conditioning equipment. Programs aimed at reducing the use and increasing recycling of paper were implemented, and additional training was provided to maintenance and sales personnel, the first group with whom our customers come into contact. Regarding social initiatives, grupo Sanborns continued to donate food cases to a variety of non-profit and religious organizations, maintained its property rescue program and continued to hire individuals with disabilities at its stores and restaurants.
Our 2012 accomplishments resulted from the effort and commitment of all of our employees, the support of our customers and providers and the confidence displayed by you, our shareholders. On behalf of the board of directors and our executive team I would like to thank you once again and reiterate grupo Sanborns’ commitment to stay on the path of success in order to continue to contribute to the development of our country.
Sincerely,
Carlos Slim DomitChairman of the Board of direCtors of grupo sanBorns s.a.B. de C.v.
letterto ShareholderS
Grupo SanbornS Sab de CV
Grupo SanbornS Annual Report 2012 76

management´s Discussion anD analysis
In 2012 we augmented our presence in the market and implemented Initiatives to reward our customers’ loyalty, which resulted in increased traffic at the stores. we began introducing exclusive merchandise and we diversified menu selections at our restaurants, while maintaining quality of service.
Consistent with our expectations, our sales totaled $39,411 million pesos, an 8.2% increase of $2,995 million pesos over 2011.
This growth was attributable to: i) sales of merchandise and food and beverages, particularly at Sears and, to a lesser extent, at Sanborns and iShop stores, as well as ii) consumer credit income from the Sears, Sanborns and Mixup credit cards.
In cumulative terms, Sears increased its total sales by 8.7% and its same-store sales by 5.7%. Sanborns increased total sales by 5.7% and same-store sales by 4.2%. The iShop/Mixup stores increased their total sales by 16.8% and same-store sales by 10.0%, and total sales at other formats, such as Dax, Saks and Sanborns Café, grew by 3.4%.
In 2012 we opened 1 Sears store, 4 Sanborns store-restaurants, and 4 iShop stores. we closed 2 Sears location, 1 Jeanious boutique, 1 Sanborns store and 2 Sanborns Cafés, and we converted 2 Sanborns stores into Sanborns Café restaurants. we also closed 3 Mixup music stores and 1 eduMac center.
At the end of 2012, grupo Sanborns had 418 units in operation, occupying a sales area of 973,876 square meters with 60,331 restaurant seats. These units were distributed among formats such as Sears, Sanborns and iShop/Mixup, as well as others, including Dax stores, Sanborns Café restaurants, Saks fifth Avenue, Sears and Sanborns locations in Central America, a few specialty boutiques and two shopping centers.
Operating income totaled $4,566 million pesos on a margin of 11.6%, representing a slight decrease of 0.2 percentage points as a result of an increase in the cost of merchandise and a decrease in operating expenses, both with respect sales. EBITDA came to $5,226 million, an increase of 6.3% in 2012, representing a 13.3% margin.
with respect to financing, we recorded a positive comprehensive financing result of $57 million pesos, compared to a cost of $87 million pesos 2011, which included the booking a foreign exchange loss, higher interest expense, and a derivatives loss.
grupo Sanborns’ consolidated net income was $3,298 million, versus $2,951 million in 2011, an 11.7% increase.
grupo Sanborns’ capital investments increased to $749 million pesos, which included investments in new stores and renovations. The make-over of the Sanborns stores included the elimination of the glass showcases, allowing merchandise to me displayed in a more attractive fashion. Sears focused more on fashion and accessories for the entire family and continued to stock appliances and to offer additional technical service. This new concept involved replacing the existing lighting with LED options and, in the case of Sanborn, the introduction of energy co-generation plants, steps that create significant savings for the Company.
On December 31, 2012, total debt stood at $5,273 million pesos, versus the $1,373 million pesos reported at the close of the previous year. Net debt was $2,945 million pesos, compared to ($677) million pesos at the close of 2011. All of our loans involve short-term contracts, and leverage ratios remain strong: our total debt to EBITDA ratio was 1.0x in 2012, compared to 0.28 last year.
The company has a short-term stock certificate program, authorized in May of 2011 for up to $2,500 million pesos over a term of up to two years. As of the end of 2012, it has been fully issued.
finally, grupo Sanborns and its subsidiaries paid out $6,328 million pesos in dividends in 2012.
Sincerely,
patrick Slim DomitCeo of grupo sanBorns s.a.B. de C.v.
Grupo SanbornS Sab de CV
Grupo SanbornS Annual Report 2012 98

Greater focus on fashion and a portfolio of brands
for the entire family
10 Grupo SanbornS Annual Report 2012 11

Sears stores are well recognized throughout
Mexico and offer a broad array of products,
ranging from affordable-brand clothing to
state-of-the-art electronics and household
items, which carry the Sears quality
guarantee, as well as additional service plans.
In late 2012 Sears opened a store in the
Buenavista forum shopping center. This
opening is significant for Sears because
it represents the launch of a new design
and store concept aimed enhancing its
attractiveness to the entire family, but
particularly to young shoppers, by offering
Having issued more than 2.4 million credit cards, Sears is one of Mexico’s largest non-banking credit providers
a broader assortment of clothing and
accessories, larger fashion spaces and better
lighting, which also resulted in energy savings,
thanks to the substitution of older fixtures for
LED lights.
Our portfolio of proprietary and exclusive
brands includes Jeanious Company, Elle,
C2C, Apostrophe, City femme, LifeStyler,
home Nature, Basel, Carosello, Carlo Corinto,
Craftsman, kenmore, Pier 1 Imports and
Professional Series.
45%
42%
12%
1%
Hardlines
softlines
Credit
serviCes
SaleS breakDown by CateGory
18,754
20,383
2011
2012
SearS ToTal SaleS(Million Pesos)
Grupo SanbornS Annual Report 2012 1312

A specialized convenience store format that is unique in Mexico
14 15Grupo SanbornS Annual Report 2012

SanbornS total SaleS(million Pesos)
Sanborns stores offer shoppers an all-in-one
experience, with restaurant and bar areas,
as well as a wide range of products including
books, magazines, music, pharmaceuticals,
health and beauty products, electronics,
jewelry, gifts, sweets and toys. They also
offer the convenience of making payments to
various third-party services.
Contributes with 32% of the group’s total sales and 23%
of its consolidated EBITDASanborns’ most significant activities in 2012
included the opening of Sanborns Buenavista
and Plaza Carso. The openings of these
stores coincided with the debut of a new
look, which includes a complete make-over
that enhances their attractiveness with better
lighting, more modern furnishings and the
removal or the glass display cases, which
increases space and allows for more efficient
arrangement of the items. Ten stores had
been remodeled by the close of 2012.
11,858
12,535
2011
2012
23%
3%
74%
FooD AnD BEvErAgES
oThEr
rETAIl SAlES
revenue breaDown
16 17Grupo SanbornS Annual Report 2012

Adaptation and innovation, consistent with market trends
18 19Grupo SanbornS Annual Report 2012
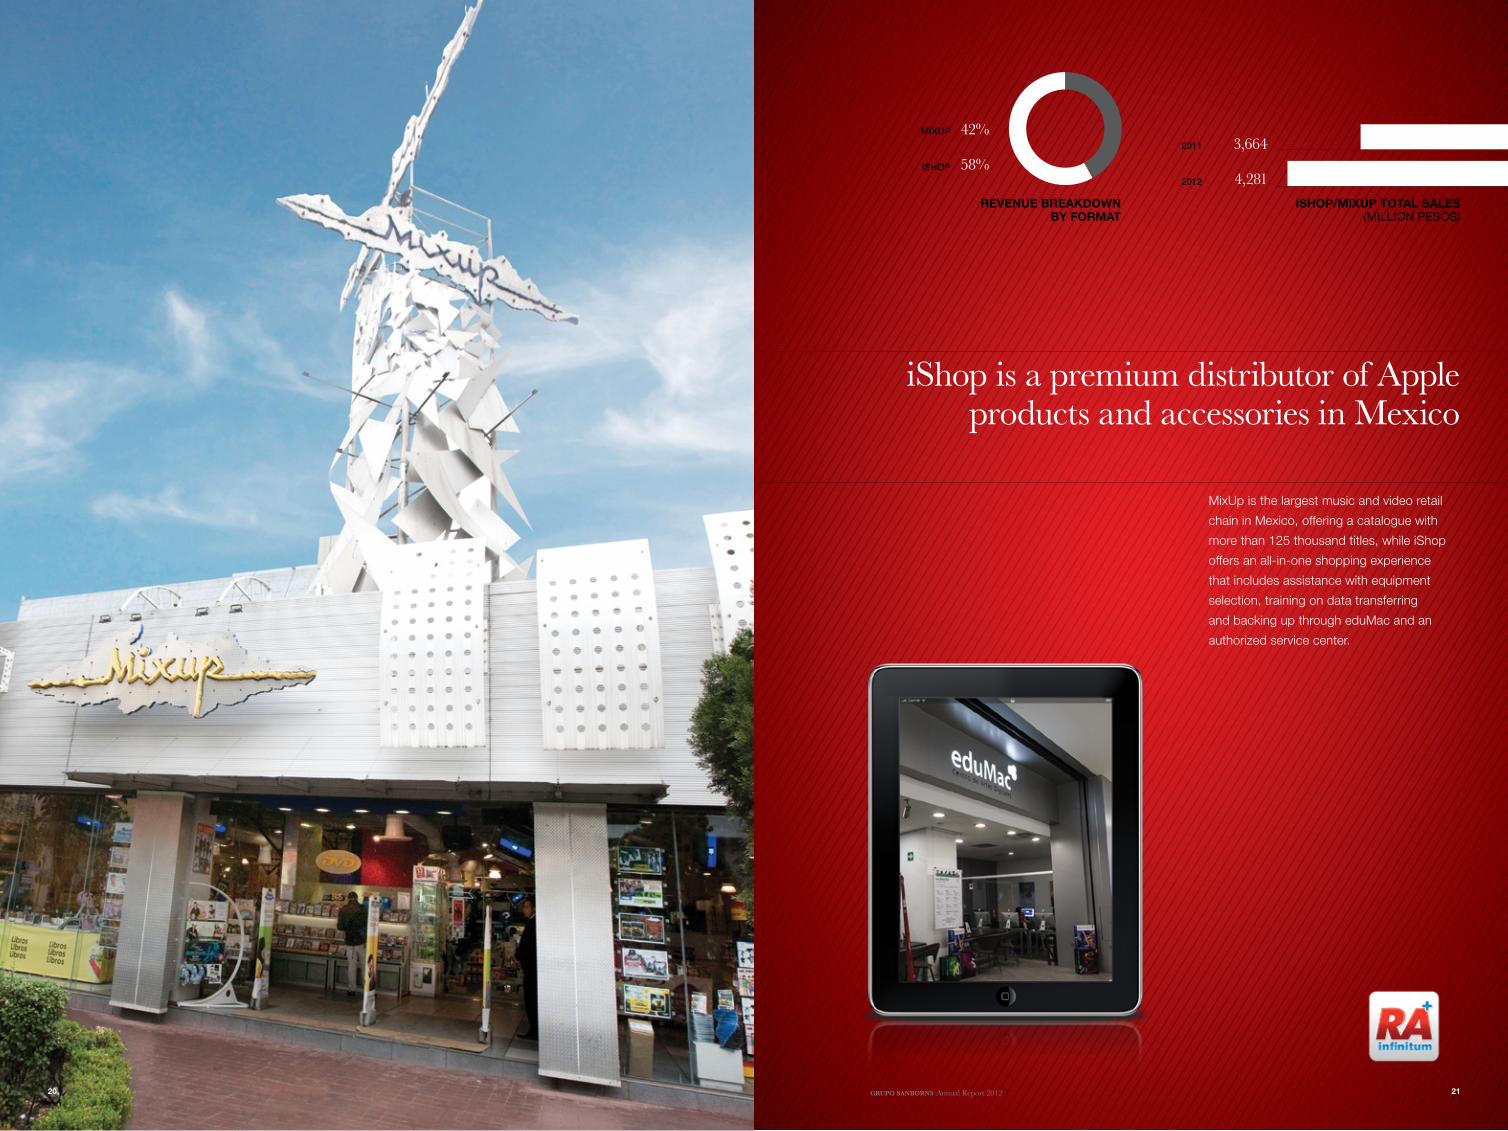
iShop is a premium distributor of Apple products and accessories in Mexico
Mixup is the largest music and video retail
chain in Mexico, offering a catalogue with
more than 125 thousand titles, while iShop
offers an all-in-one shopping experience
that includes assistance with equipment
selection, training on data transferring
and backing up through eduMac and an
authorized service center.
3,664
4,281
iShop/MixUp ToTal SaleS(Million pesos)
2011
2012
42%
58%
MixUp
iShop
Revenue BReakdown By FoRmat
20 21Grupo SanbornS Annual Report 2012

Luxury department store that offers brands by
International designers
22 23Grupo SanbornS Annual Report 2012grupo sanBorns Annual Report 2012

Saks Fifth Avenue has two locations in Mexico City, which focus on the upper-middle class consumer segment
Grupo SanbornS Annual Report 2012 2524

sustAInAbIlIty ActIonsSocial responsibility is a key aspect of the strategy and philosophy of grupo Carso and of its grupo Sanborns subsidiaries, which is why it has been working for more than 25 years to connect its business experience with social Initiatives through the Carlos Slim foundation, which was created under the name of Asociación Carso, A.C. in 1986.
grupo Sanborns also participates in initiatives focused on the three areas of the environment, society and its stakeholders, consistent with programs of the Carlos Slim foundation and the Company’s values.
enVIRonmentAl InItIAtIVesgrupo Sanborns is a member of the Carso green Committee, which was created in November of 2009 for the purpose of reducing the impact of its processes on the environment and raising awareness of environmental protection among all of its employees.
The following environmental protection activities have been implemented:
• The Energy Program (gas and electricity)• The water Saving Program• The Paper use Reduction and Recycling
Program
In 2012 Sanborns continued to install solar panels and to recover and reuse rainwater. It also implemented various upgrade or replacement programs, focusing on aspects such as more efficient lighting, centralized refrigeration, state-of-the-art compressors and waterless urinals. To encourage better control and more efficient use of energy at Sears, air conditioning units were installed, training courses were provided to maintenance personnel and legends were added to switches and electronic equipment.
stAkeholdeR outReAch ActIVItIesEducational activities and initiatives focused on the development of human capital to help the nation grow are priorities for grupo Sanborns, which is why it engages in educational and cultural activities such as the following:
Each year, in collaboration with the Carlos Slim foundation, we sponsor digital scholarships, which consist of providing computers and internet connection services to elementary, secondary and preparatory school students. In addition, and with the support of the Telmex foundation, grupo Sanborns provides annual higher education scholarships to high-performing students.
As part of our property rescue program, in 2012 we inaugurated a Sanborns restaurant in the Casa de los Condes de xala, an 18th century building with a significant historical and architectural heritage located in downtown Mexico City. The original layout of the building had changed a lot over the years, with many of its spaces being adapted for varying uses. The restoration project had three phases: restoration of the building and recovery of its original spaces, as well as its patios and the spaces on three levels. A lot of detailed work went into the conservation and restoration of the building’s walls, all of the quarried stone elements and the patio access arches, which had been destroyed. finally, plans for properly adapting it for the restaurant addition were developed, ensuring a new use for the valuable building which will allow future generations to enjoy it. This Project led to the creation of 229 new direct jobs and made a new space available to the historic Downtown community, which will also be open to the general public.
socIAl InItIAtIVeswith respect to the communities most impacted by its operations, grupo Sanborns engaged in annual campaigns aimed at preventing and treating medical conditions and also distributed basic self-care guides in collaboration with the Carlos Slim health Institute.
As has become tradition, grupo Sanborns continued to donate cases of food to a variety of non-profit and religious organizations on a monthly basis to help to supplement the nutrition of children, women, and the elderly. Moreover, a percentage of the sales from the restaurants’ gourmet festival were donated on a non-profit group (a different group is chosen each year). Sanborns continued to implement a number of different initiatives aimed at assisting organizations. These included: A kilo of help, Doctor Smiles and the Chespirito foundation.
with the assistance of the Mexican Confederation of Organizations for Persons with Intellectual Disabilities (CONfE) the Multi Care Center (CAM), the yMCA and the DIf, the group continued to hire persons with disabilities at its Sanborns stores, both locally and abroad.
Consult the following resources for more information and further details about the group’s sustainability efforts:
Carlos Slim Foundation report (In Spanish only)http://www.carlosslim.com/pdf/reporte_fcs_agosto2012.pdf
Carso environmental report (In Spanish only)http://www.carso.com.mx/ES/folleto%20informativo/gCARSO_reporte_ambiental_2010.pdf
sustainability ActIons
26 Grupo SanbornS Annual Report 2012 27

boardof Directors As of December 31, 2012
CARLOS SLIM DOMITchAIRmAn of the boARd
PATRICk SLIM DOMITchIef eXecutIVe offIceR
ANgEL EDuARDO PERALTA ROSADOVIce-chAIRmAn
JuAN ANTONIO PéREz SIMóN
JOSé huMBERTO guTIéRREz-OLvERA zuBIzARRETA
IgNACIO COBO TRuJILLO
PABLO ANDRéS guzMáN RIvERA RíO
JOSé MANuEL CAMPO y MENéNDEz
JOSé DE JESúS gALLARDO DOMíNguEz
ISAAC MASSRy NAkASh
OMAR LugO ANDERE secRetARy
fRANCISCO MACíAS vALADéz TREvIñO stAtutoRy AudItoR
wALTER fRASChETTO vALDéSAlteRnAte AudItoR
content pAge
indePendent auditors’ rePort 30
Consolidated statements oF FinanCial Position 32
Consolidated statements oF ComPrehensiVe inCome 33
Consolidated statements oF Changes in stoCKholders’ equity 34
Consolidated statements oF Cash Flows 36
notes to Consolidated FinanCial statements 37
Grupo SanbornS, S.a.b. de C.V. and SubSidiarieS(Former Grupo SanbornS, S.a. de C.V.)(SubSidiary oF Grupo CarSo, S.a.b. de C.V.)Consolidated Financial Statements as of december 31, 2012 and 2011, and January 1, 2011, and independent auditors’ report dated march 15, 2013
Grupo SanbornS Annual Report 2012 2928

we have audited the accompanying consolidated financial statements of grupo Sanborns, S.A.B. de
C. v. and Subsidiaries (the “Entity”), which comprise the consolidated statements of financial position as
of December 31, 2012 and 2011 and January 1, 2011 (transition date), the consolidated statements of
comprehensive income, changes in stockholders’ equity and cash flows for the years ended December 31,
2012 and 2011, and a summary of significant accounting policies and other explanatory information.
MAnAGEMEnT’S RESponSIBILITy FoR THE ConSoLIDATED FInAnCIAL stAtementsManagement is responsible for the preparation and fair presentation of these consolidated financial
statements in accordance with International financial Reporting Standards, and for such internal control as
management determines is necessary to enable the preparation of consolidated financial statements that
are free of material misstatement, whether due to fraud or error.
ResponsIbIlIty of Independent AudItoRsOur responsibility is to express an opinion on these consolidated financial statements based on our audits.
we conducted our audits in accordance with International Standards on Auditing. Those standards require
that we comply with ethical requirements and plan and perform the audit to obtain reasonable assurance
about whether the consolidated financial statements are free from material misstatement.
An audit involves performing procedures to obtain audit evidence about the amounts and disclosures in the
consolidated financial statements. The procedures selected depend on the auditor’s judgment, including
the assessment of the risks of material misstatement of the consolidated financial statements, whether due
to fraud or error. In making those risk assessments, the auditor considers internal control relevant to the
Entity’s preparation and fair presentation of the consolidated financial statements in order to design audit
procedures that are appropriate in the circumstances, but not for the purpose of expressing an opinion on
the effectiveness of the entity’s internal control. An audit also includes evaluating the appropriateness of
accounting policies used and the reasonableness of accounting estimates made by management, as well
as evaluating the overall presentation of the consolidated financial statements.
we believe that the audit evidence we have obtained is sufficient and appropriate to provide a basis for our
opinion.
opInIonIn our opinion, the consolidated financial statements present fairly, in all material respects, the financial
position of grupo Sanborns, S.A.B. de C.v. and subsidiaries as of December 31, 2012 and 2011 and
January 1, 2011 (transition date) and their financial performance and their cash flows for the years ended
December 31, 2012 and 2011 in accordance with International financial Reporting Standards.
emphAsIs of mAtteR
As mentioned in Note 2, the Entity adopted International financial Reporting Standards for the year ended
December 31, 2012, with a transition date of January 1, 2011. Such adoption affected the amounts
reported in the Entity´s consolidated financial statements as of and for the year ended December 31, 2011
which were previously, prepared in conformity with Mexican financial Reporting Standards. The effects
of the transition to International financial Reporting Standards on the consolidated financial position and
consolidated financial performance are shown in Note 27.
The accompanying consolidated financial statements have been translated into English for the convenience
of readers.
Galaz, yamazaki, ruiz urquiza, S. C.
memBer of deloitte touChe tohmatsu limited
C. P. C. Luis Javier fernández Barragán
March 15, 2013
Independent Auditors’ Report
to the boARd of dIRectoRs And stockholdeRs of gRupo sAnboRns, s.A.b. de c.V.
30 Grupo SanbornS Annual Report 2012 31

Note 2012 2011 JaNuary 1, 2011
(transition date)
Current assets:
Cash and cash equivalents 6 $ 2,327,855 $ 2,049,562 $ 1,526,317
Accounts receivable – net 7 8,856,549 8,451,519 8,293,016
Inventories – net 8 8,840,163 8,155,504 7,138,344
Prepaid expenses 50,483 59,486 78,069
Derivative financial instruments 11 - - 154,734
Total current assets 20,075,050 18,716,071 17,190,480
Non-current assets:
Long-term receivables 69,000 80,500 92,000
Property, machinery and equipment 12 8,808,288 8,811,067 8,274,982
Investment property 13 1,477,628 1,477,628 1,424,216
Investment in associates 1,318 1,319 1,319
Employee retirement benefits 17 736,531 832,066 758,959
Other assets - net 33,702 37,367 27,049
Total assets $ 31,201,517 $ 29,956,018 $ 27,769,005
Current liabilities:
Notes payable to financial institutions and current portion of long-term debt 14 $ 2,774,069 $ 25,861 $ 2,831,352
Debt securities 15 2,498,970 1,347,073 -
Accounts payable to suppliers 5,964,007 5,462,470 4,270,151
Direct employee benefits 385,617 352,650 335,637
Income taxes 134,696 21,348 -
Accrued expenses and other taxes 2,716,854 2,120,210 2,103,465
Provisions 16 86,451 74,708 61,551
Derivative financial instruments 11 10 21,237 113
Due to related parties 20 250,860 695,191 1,121,616
Total current liabilities 14,811,534 10,120,748 10,723,885
Non-current liabilities:
Deferred taxes 23 1,161,193 1,442,850 1,464,516
Total liabilities 15,972,727 11,563,598 12,188,401
Stockholders’ equity:
Capital stock 1,634,370 1,634,370 1,634,370
Additional paid-in capital 140,043 140,043 140,043
Retained earnings 12,183,563 15,116,768 12,442,496
Other comprehensive income items (180,544) (46,821) -
Controlling interest 13,777,432 16,844,360 14,216,909
Non-controlling interest 1,451,358 1,548,060 1,363,695
Total stockholders’ equity 18 15,228,790 18,392,420 15,580,604
Total liabilities and stockholders’ equity $ 31,201,517 $ 29,956,018 $ 27,769,005
See accompanying notes to consolidated financial statements.
Note 2012 2011
Net sales $ 39,411,287 $ 36,415,957
Cost of sales 22 23,818,767 21,773,912
gross profit 15,592,520 14,642,045
Sales and development expenses 22 8,644,931 8,002,375
Administrative expenses 22 1,841,820 1,878,354
Depreciation and amortization 632,536 583,540
Other income 21 (92,289) (124,069)
Interest expense 198,240 199,951
Interest income (199,842) (178,011)
Exchange (gain) loss (10,220) 57,441
Effects of valuation of derivative financial instruments (45,134) 7,328
Income before income taxes 4,622,478 4,215,136
Income taxes 23 1,324,580 1,263,955
Consolidated net income for the year 3,297,898 2,951,181
Other comprehensive income (loss):
Translation effects 2,468 (10,432)
Actuarial losses, net of taxes (136,191) (36,389)
Consolidated comprehensive income for the year $ 3,164,175 $ 2,904,360
Consolidated net income attributable to:
Controlling interest $ 2,966,795 $ 2,674,272
Non-controlling interest 331,103 276,909
$ 3,297,898 $ 2,951,181
Basic and diluted earnings per common share attributable to controlling interest $ 1.52 $ 1.37
weighted average number of shares (‘000) 1,949,692 1,949,692
Consolidated comprehensive income attributable to:
Controlling interest $ 2,833,072 $ 2,627,451
Non-controlling interest 331,103 276,909
$ 3,164,175 $ 2,904,360
See accompanying notes to consolidated financial statements.
Grupo Sanborns, S.A.B. de C.V. and Subsidiaries (Subsidiary of Grupo Carso, S.A.B. de C.V.)
consolIdAted stAtements of fInAncIAl posItIonas of december 31, 2012 and 2011 and January 1, 2011 (transition date)(in thousands of mexican pesos)
Grupo Sanborns, S.A.B. de C.V. and Subsidiaries (Subsidiary of Grupo Carso, S.A.B. de C.V.)
consolIdAted stAtements of compRehensIVe Income For the years ended december 31, 2012 and 2011 (in thousands of mexican pesos, except per share data expressed in pesos)
32 Grupo SanbornS Annual Report 2012 33

Capital stoCkadditioNal
paid-iN Capital
retaiNed earNiNgs
traNslatioN effeCts
of foreigN operatioNs
aCtuarial losses
total CoNtrolliNg
iNterest
NoN-CoNtrolliNg
iNterest
total stoCkholders’
equity
Balances as of January 1, 2011 (transition date) $ 1,634,370 $ 140,043 $ 12,442,496 $ - $ - $ 14,216,909 $ 1,363,695 $ 15,580,604
Dividends paid to non-controlling interest - - - - - - (92,544) (92,544)
Consolidated comprehensive income for the year - - 2,674,272 (10,432) (36,389) 2,627,451 276,909 2,904,360
Balances as of December 31, 2011 1,634,370 140,043 15,116,768 (10,432) (36,389) 16,844,360 1,548,060 18,392,420
Dividends paid to controlling and non-controlling interest - - (5,900,000) - - (5,900,000) (427,805) (6,327,805)
Consolidated comprehensive income for the year - - 2,966,795 2,468 (136,191) 2,833,072 331,103 3,164,175
Balances as of December 31, 2012 $ 1,634,370 $ 140,043 $ 12,183,563 $ (7,964) $ (172,580) $ 13,777,432 $ 1,451,358 $ 15,228,790
See accompanying notes to consolidated financial statements.
Grupo Sanborns, S.A.B. de C.V. and Subsidiaries (Subsidiary of Grupo Carso, S.A.B. de C.V.)consolIdAted stAtements of chAnges In SToCkHoLDERS’ EquITy as of december 31, 2012 and 2011 and January 1, 2011 (transition date)(in thousands of mexican pesos)
34 Grupo SanbornS Annual Report 2012 35

1. ActIVItIes
grupo Sanborns, S.A. de C.v. (“grupo Sanborns”) and Subsidiaries (the “Entity”) is a subsidiary of grupo Carso, S.A.B. de C.v. (“grupo Carso”). The Entity is the owner of a group of companies mainly domiciled in Lago zurich Núm. 245 floor 7, Colonia Ampliación granada in México Distrito federal, Postal Code 11529 and is primarily engaged in the operation of retail stores and restaurants, including a department store chain, high fashion boutiques, Sanborns retail stores, a retail and service chain selling the last-generation Apple- brand products, a retail network of recorded music and video, a luxury department store chain, a regional cosmetic and perfume retailer a restaurant chain offering traditional Mexican food and a chain of industrial cafeterias, and managing and leasing of two shopping malls.
The Entity´s main subsidiaries and their respective primary activities are described in Note 3.b.
2. InTERnATIonAL FInAnCIAL REpoRTInG STAnDARDS (“IFRS”)
IFrS adoption - Beginning with its financial statements for the year ended December 31, 2012, the Entity adopted International financial Reporting Standards (“IfRS”) and their amendments and interpretations issued by the International Accounting Standards Board (“IASB”), effective as of December 31, 2012, with a transition date of January 1, 2011. Therefore, the Entity adopted IfRS 1, First-time Adoption of International Financial Reporting Standards as of its transition date. Such adoption affected the Entity’s consolidated financial statements for the year ended December 31, 2011, which were previously prepared in conformity with under Mexican financial Reporting Standards (“MfRS”, individually referred to as Normas de Información Financiera or “NIf”). IfRS comprises various standards and interpretations known, by their acronyms, as IfRS, IAS, IfRIC and SIC.
IfRS 1 generally requires retrospective application of the standards and interpretations applicable in an entity’s first set of IfRS financial statements. Nevertheless, IfRS 1 contains certain mandatory exceptions and allows certain other voluntary exemptions to retrospective application of certain IfRS upon initial adoption, to assist entities in the transition process. The Entity has applied the mandatory exceptions and has elected certain first-time adoption exceptions as described below. further information regarding the effects of adoption are discussed in Note 27.
Mandatory exceptions:i) The Entity applied the mandatory exception to with respect to accounting estimates at the transition date,
as they are consistent with those used as of that date under MfRS. This mandatory exception does not apply to MfRS accounting estimates that were determined on a basis different from that under IfRS.
ii) Non-controlling interests– The Entity prospectively applied certain requirements of IAS 27 (2008) Consolidated and Separate Financial Statements as of the transition date.
Other mandatory exceptions are not applicable to the Entity.
furthermore, the Entity has applied the optional exceptions for first-time adoption, as described below:i) The Entity elected to use the revalued amount under MfRS (depreciated cost adjusted for inflationary
effects) at the transition date, as deemed cost for certain of its property, plant and equipment.ii) with respect to the recognition of employee retirement benefits, the Entity applied the exemption to
recognize all actuarial gains and losses at the transition date, of all employee benefit plans, instead of separating the respective recognized and unrecognized portions. furthermore, it early-adopted the amendments established in IAS19 (2011), Employee Benefits, which required the recognition of all unamortized past service costs existing at the transition date.
2012 2011
Cash flows from operating activities:
Consolidated net income for the year $ 3,297,898 $ 2,951,181
Adjustments not requiring (providing) cash:
Income tax recognized in earnings 1,324,580 1,263,955
Depreciation 660,181 614,681
Loss on sale of property, machinery and equipment 58,885 30,443
Surplus on investment property - (53,412)
Interest income (199,842) (178,011)
Interest expense (136,191) (36,389)
198,240 199,951
5,203,751 4,792,399
Items related to operating activities:
Accounts receivable - net (405,030) (158,503)
Inventories (684,659) (1,017,160)
Prepaid expenses 9,003 18,583
Other assets 3,665 (10,318)
Net assets from projected future benefits 95,535 (73,107)
Long-term receivables 11,500 11,500
Accounts payable to suppliers 501,537 1,192,319
Direct employee benefits 32,967 17,013
Income taxes paid (1,492,889) (1,264,273)
Accrued expenses and other taxes 596,645 16,745
Provisions 11,743 13,157
Derivative financial instruments (21,227) 175,858
Due to related parties (444,331) (426,425)
Net cash flows provided by operating activities 3,418,210 3,287,788
Cash flows from investing activities:
Purchase of property, machinery and equipment (748,891) (1,225,299)
Proceeds from sale of property, machinery and equipment 32,604 44,090
Interest received 199,842 178,011
Net cash flows used in investing activities (516,445) (1,003,198)
Cash flows from financing activities:
Debt securities issued 1,151,897 1,347,073
Borrowings from financial institutions 2,748,208 -
Payment to financial institutions and long-term debt - (2,805,491)
Interest paid (198,240) (199,951)
Dividends paid to controlling and non-controlling interest (6,327,805) (92,544)
Net cash flows used in financing activities (2,625,940) (1,750,913)
Effects of exchange rate changes on cash and cash equivalents 2,468 (10,432)
Net increase in cash and cash equivalents 278,293 523,245
Cash and cash equivalents at beginning of the year 2,049,562 1,526,317
Cash and cash equivalents at end of the year $ 2,327,855 $ 2,049,562
See accompanying notes to consolidated financial statements.
Grupo Sanborns, S.A.B. de C.V. and Subsidiaries (Subsidiary of Grupo Carso, S.A.B. de C.V.)
consolIdAted stAtements of cAsh flows For the years ended december 31, 2012 and 2011(in thousands of mexican pesos)
Grupo Sanborns, S.A.B. de C.V. and Subsidiaries (Subsidiary of Grupo Carso, S.A.B. de C.V.)
notes to consolIdAted fInAncIAl stAtements For the years ended december 31, 2012 and 2011 (in thousands of mexican pesos ($) and thousands of u.s. dollars (us$))
36 Grupo SanbornS Annual Report 2012 37

4. sIgnIfIcAnt AccountIng polIcIesThe accompanying consolidated financial statements have been prepared in accordance with IfRS. Their preparation requires that the Entity’s management make certain estimates and use certain assumptions that affect the amounts reported in the financial statements and their related disclosures. however, actual results may differ from such estimates. The Entity’s management, upon applying professional judgment, believes that estimates made and assumptions used were adequate under the circumstances. The significant accounting policies of the Entity are as follows:
a. recognition of effects of inflation - The Entity only recognizes the inflationary effects for entities that operate in hyperinflationary economies, which is considered to be economies in which cumulative inflation over the three preceding years is greater than 100%. In 2012 and 2011, the Entity did not recognize inflationary effects in its operations.
b. Foreign operations - To consolidate the financial statements of foreign operations , the following
methodologies are applied:
foreign operations with a functional currency different from the local currency translate their financial statements from local currency to functional currency, using the following exchange rates: 1) the closing exchange rate in effect at the date of the statement of financial position for monetary assets and liabilities; 2) historical exchange rates for non-monetary assets and liabilities and stockholders’ equity; and 3) the rate on the date of accrual of revenues, costs and expenses, except those arising from non-monetary items that are translated using the historical exchange rate for the related non-monetary item. Translation effects are recorded as foreign currency gains and losses in the consolidated statement of comprehensive income. The financial information in functional currency is subsequently translated to the reporting currency using the exchange rate in effect at the date of the statement of financial position for assets and liabilities, the historical exchange rate for stockholders’ equity and the rate on the date of accrual of revenues, costs and expenses; translation effects are recorded within other comprehensive income.
Non-monetary items that are measured at fair value in a foreign currency are translated using the exchange rate in effect on the date the fair values are determined.
foreign operations with a reporting currency different from the functional currency translate their financial statements using the following exchange rates: 1) the closing exchange rate in effect at the date of the statement of financial position for assets and liabilities; 2) historical exchange rates for stockholders’ equity; and 3) the rate on the date of accrual of revenues, costs and expenses. Translation effects are recorded in other comprehensive income.
The functional and recording currency of grupo Sanborns and all of its subsidiaries is the Mexican peso, except for two foreign subsidiaries whose functional and recording currency are as shown below:
eNtity reCordiNg CurreNCy fuNCtioNal CurreNCy
grupo Sanborns Internacional, S.A. (Panama) u. S. dollar u. S. dollar
Corporación de Tiendas Internacionales, S.A. de C.v. (El Salvador) u. S. dollar u. S. dollar
foreign currency transactions are recorded at the exchange rate in effect as of the date of the transaction. Monetary assets and liabilities denominated in foreign currency are translated to the reporting currency in effect at the date of the statement of financial position; exchange rate gains and losses are recognized within the statement of comprehensive income.
c. Cash and cash equivalents- Consist mainly of bank deposits in checking accounts and short-term investments, highly liquid and easily convertible into cash or with a maturity of three months upon its acquisition and are subject to insignificant value change risks. Cash is stated at nominal value and cash equivalents are valued at fair value; any fluctuations in value are recognized in results of the period. Cash equivalents are represented by money market funds and short-term bank investments.
d. inventories and cost of sales- Inventories are stated at the lower of cost or net realizable value (estimated selling price less all necessary costs to complete sale)
iii) The Entity elected to take the exemption which allows for the application of foreign currency translation effects against retained earnings on the transition date. This optional exemption was applied to the foreign currency translation effects of all subsidiaries with a functional currency different from the Mexican peso.
iv) The Entity applied the transition provisions of IAS 23, Borrowing Costs, which enables the transition date to be designated as the starting date upon which to capitalize borrowing costs of loans related to all qualifying assets.
3. pRepARAtIon And consolIdAtIon bAsIsa. basis of preparation - The accompanying consolidated financial statements as of December 31, 2012 and
2011 and for the years then ended have been prepared in accordance International financial Reporting Standards (“IfRS”).
The accompanying consolidated financial statements have been prepared on a historical cost basis, except for certain long-term non-monetary assets and financial instruments. historical cost is generally measured as the fair value of the consideration received for the assets. The consolidated financial statements are prepared in pesos, the legal currency of the united Mexican States and are presented in thousands, except as noted otherwise.
The policies set out below have been consistently applied to all periods presented.
b. basis of consolidation of financial statements - The consolidated financial statements include those of grupo Sanborns, S.A.B. de C.v. and its direct and indirect subsidiaries over which it exercises control. Intercompany balances and transactions have been eliminated on consolidation. The ownership percentages over the capital stock of its subsidiaries as of December 31, 2012, 2011, and January 1, 2011 are shown below:
owNership %
subsidiary aCtivitydeCember 31,
2012deCember 31,
2011JaNuary 1,
2011
Sanborn hermanos, S.A. and Subsidiaries (“Sanborns”)
Operation of department, gift, and record stores and restaurants under the Sanborns brand 99.94 99.94 99.94
Sears Operadora México, S.A. de C.v. and Subsidiaries (“Sears”)
Operation of department stores under the Sears brand 84.94 84.94 84.94
Promotora Comercial Sanborns, S.A. de C.v. and Subsidiaries
Operation of computer and record stores, restaurants and coffee shops under the Ishop, Mix-up and Sanborns Café brands 99.96 99.96 99.96
Operadora de Tiendas Internacionales, S.A. de C.v.
Operation of department stores under the Saks fifth Avenue brand 100.00 100.00 100.00
Servicios Corporativos de grupo Sanborns, S.A. de C.v. Boutiques operator and subholding 100.00 100.00 100.00
grupo Sanborns Internacional, S.A. and Subsidiaries Sanborns stores in Panama 100.00 100.00 100.00
Corporación de Tiendas Internacionales, S.A. de C.v. (“Corpti”)
Sanborns and Sears stores in El Salvador 100.00 100.00 100.00
Comercializadora Dax, S.A. de C.v.
Operation of department stores under Dax brand 100.00 100.00 -
Prestadora de Servicios Loreto y Cuicuilco, S.A. de C.v.
Personnel services provided to shopping malls 100.00 100.00 -
The equity in results and changes in stockholders’ equity of the subsidiaries bought or sold during the year are included in the financial statements, from or up to the date on which the transactions were performed.
38 Grupo SanbornS Annual Report 2012 39

j. impairment of tangible assets- The Entity reviews the carrying values of its tangible assets to determine whether there are indications that such assets have suffered any loss for impairment. In the event of any such indication, the recoverable amount of the asset is calculated in order to determine the amount of the loss from impairment. when it is not possible to estimate the recoverable amount of an individual asset, the Entity estimates the recoverable amount of the cash generating unit to which such asset belongs. when a reasonable and consistent distribution basis can be identified, the corporate assets are also assigned to the individual cash generating units; otherwise, they are assigned to the smallest group of cash generating units for which a reasonable and consistent distribution basis can be identified.
The recoverable amount is the higher of fair value less cost of sale and the value in use. when the value in use is assessed, the estimated future cash flows are discounted at present value using a pre-tax discount rate that reflects the current market assessment of the value of money over time and the specific risks of the asset for which the estimated future cash flows have not been adjusted.
If it is estimated that the recoverable amount of an asset (or cash generating unit) is less than its carrying value, the carrying value of the asset (or cash generating unit) is reduced to its recoverable value. Losses from impairment are recognized in results.
when a loss from impairment subsequently reverses, the carrying value of the asset (or cash generating unit) is increased to the estimated value revised to its recoverable value, in such a way that the increased carrying value does not exceed the carrying value that would have been determined if a loss from impairment had not been recognized for such asset (or cash generating unit) in previous years. The reversal of the loss from impairment is recognized in results.
k. Financial instruments- financial assets and financial liabilities are recognized when the Entity becomes a party to the contractual provisions of the instrument.
financial assets and financial liabilities are initially measured at fair value. Transaction costs that are directly attributable to the acquisition or issue of financial assets and financial liabilities (other than financial assets and financial liabilities at fair value through profit or loss) are added to or deducted from the fair value of the financial assets or financial liabilities, as appropriate, on initial recognition. Transaction costs directly attributable to the acquisition of financial assets or financial liabilities at fair value through profit or loss are recognized immediately in profit or loss.
i. Financial assets - All the financial assets are recognized and are derecognized for accounting purposes at the transaction date, in the presence of a purchase or sale of a financial asset under a contract whose conditions require the delivery of the asset over a period generally regulated by the respective market, and are initially measured at fair value, plus transaction costs.
financial assets are classified into the following specified categories: financial assets “at fair value through profit or loss” (fvTPL), “held-to-maturity” investments, “available-for-sale” (AfS) financial assets and “loans and receivables”. The classification depends on the nature and purpose of the financial assets and is determined at the time of initial recognition. Currently, the Entity holds trading investments and loans and receivables.
− Financial assets at fair value through profit or loss (FvTPl) financial assets are classified as fvTPL when the financial asset is held for trading purposes or
designated as a fair value financial asset with changes through results.
A financial asset will be classified as held for trading purposes if:• It is purchased mainly for the purpose of sale in the near term; or• upon its initial recognition, it forms part of a portfolio of identified financial instruments which
the Entity manages together, and for which there is a recent actual pattern of short-term profit-taking; or
• It is a derivative that is not designated as a hedge instrument.
Cost is determined based on average costs, including the cost of materials, direct costs and an appropriate portion of fixed and variable overhead costs that are incurred in the acquisition of inventories. Reductions in value of inventories are recognized through impairment allowances.
e. Property, machinery and equipment - As of January 1, 2011, property, plant and equipment were valued
at deemed cost (depreciated cost adjusted for an inflation index). Subsequent acquisitions are recorded at acquisition cost. Depreciation is calculated using the straight-line method based on the remaining useful lives of the related assets which are reviewed yearly; the effect of any change in the recorded estimate is recognized on a prospective basis.
depreCiatioN weighted average rate
Buildings and leasehold improvements from 1.43 to 10.00
Machinery and equipment 5
furniture and equipment 5
vehicles 25
Computers 16.67 and 25.00
Borrowing costs incurred during the period of construction and installation of qualifying property,
machinery and equipment was capitalized.
The gain or loss on the sale or retirement of an item of property, plant and equipment is calculated as the difference between the resources received from sale and the carrying value of the asset, and is recognized in results.
f. leases- Leases are classified as finance leases when the terms of the lease substantially transfer all the risks and benefits inherent to ownership. All other leases are classified as operating leases.
Rental payments for operating leases are charged to results using the straight-line method during the lease term, except when another systematic distribution basis is more representative of reflecting the pattern of leasing benefits. Contingent rentals are recognized as expenses in the periods in which they are incurred.
g. investment properties- Investment properties are those maintained for leasing and/or capital gains through appreciation in their value over time (including properties in construction for such purpose). Investment properties are valued at fair value. The gains or losses that arise from changes in the fair value of the investment property are included in the net gain or loss during the period in which they are originated. Properties which are held as investment include two shopping malls.
h. investment in shares of associated companies - Permanent investments in entities where significant influence exists are initially recognized based on the net fair value of the entities’ identifiable assets and liabilities as of the date of acquisition. If impairment indicators are present, investment in shares of associated companies is subject to impairment testing.
i. other assets- Intangible assets are recognized in the statement of financial position when they are identifiable, provide future economic benefits and there is control over such benefits. Intangible assets with indefinite lives are not amortized and those with definite lives are systematically amortized based on the best estimate of their useful lives, which is determined based on the period over which the Entity expects to receive the future economic benefits of the related asset. The value of these assets is subject to an annual impairment test.
Expenses incurred in the installation of a new system are recognized as,intangible assets in the consolidated financial statements; such costs will be amortized once the system is through its testing phase and its implementation is completed.
40 Grupo SanbornS Annual Report 2012 41
− other financial liabilities Other financial liabilities, including loans, are initially valued at fair value, net of transaction costs;
subsequently, they are valued at amortized cost using the effective interest rate method, and the interest expense is recognized on an effective yield basis.
− Derecognition of financial liabilities The Entity derecognizes financial liabilities when, and only when, the Entity´s obligations are
discharged, cancelled or they expire. The difference between the carrying value and the sum of the consideration paid or payable is recognized in results.
l. derivative financial instruments - The Entity enters into derivative financial instruments for trading purposes and for hedging risks related to: a) interest rates, and b) exchange rates on long-term debt. Note 11 provides additional detail regarding derivative financial instruments.
when derivatives are entered into to hedge risks, and such derivatives meet all hedging requirements, their designation is documented at the beginning of the hedging transaction, describing the transaction’s objective, characteristics, accounting treatment and how the effectiveness of the instrument will be measured.
Derivatives are initially recognized at fair value at the date on which the derivative contract is signed and are subsequently remeasured at fair value at the end of the reporting period. The resulting gain or loss is recognized in results unless the derivative is designated and is effective as a hedge, in which case the timing of the recognition in results will depend on the nature of the hedging relationship. The Entity designates certain derivatives either as fair value hedges of recognized assets or liabilities or firm commitments (fair value hedges), hedges of highly probable forecasted transactions or foreign currency risk hedges of firm commitments (cash flow hedges).
A derivative with a positive fair value is recognized as a financial asset whereas a derivative with a negative fair value is recognized as a financial liability. A derivative is presented as a long-term asset or liability if the maturity date of the instrument is 12 months or more, and it is not expected to be realized or canceled within those 12 months. Other derivatives are presented as short-term assets and liabilities.
− Cash flow hedges At the start of each hedge, the Entity documents the hedging relationship and objective, together with its
risk management strategy. This documentation includes the manner in which the Entity will measure the effectiveness of the hedge with regards to offsetting changes to the fair value of the hedged item or the cash flow attributable to the hedged risk.
The Entity recognizes all assets and liabilities resulting from transactions involving derivative financial
instruments at fair value in the statement of changes in financial position, regardless of its reason for holding these instruments. fair value is determined based on the prices reported on recognized markets; however, when they are not quoted on a market, the Entity utilizes valuation techniques accepted by the financial sector. The decision to enter into an economic or accounting hedge is based on an analysis of market conditions and expectations concerning domestic and international economic scenarios.
The effective portion of changes to the fair value of the derivative financial instruments designated and classified as cash flow hedges is recognized under other comprehensive income. The gains and losses derived from the ineffective portion of the hedge instrument are recognized in results and included under the heading of “effects of valuation of derivative financial instruments”.
The amounts previously recognized under other comprehensive income within stockholders’ equity are reclassified to the results of the periods in which the hedged item is recognized in results, under the same heading as the recognized hedged item. however, when a forecast hedged transaction leads to the recognition of a nonfinancial asset or liability, the losses or gains previously recognized in other comprehensive income within stockholders’ equity are transferred and included in the initial cost of the nonfinancial asset or liability.
− loans and accounts receivable Loans, customer receivables and other accounts receivable with fixed or determinable payments,
which are not traded on an active market, are classified as loans and accounts receivable. Loans and accounts receivable are valued at amortized cost using the effective interest rate method, less any impairment. An allowance for bad debts is recognized in results when there is objective evidence that the accounts receivable are impaired. Interest income is recognized by applying the effective interest rate, except for short-term accounts receivable if the interest recognition is immaterial.
− Effective interest rate method This is a method of calculation for the amortized cost of a financial instrument and of assigning
the financial revenue or financial expense throughout the relevant period. The effective interest rate is the discount rate that exactly discounts the estimated future cash flows receivable or payable (including commission, interest basis points paid or received, transaction costs and other premiums or discounts that are included in the effective interest rate calculation) throughout the expected life of the financial instrument (or, when appropriate, in a shorter period), to the net carrying value of the financial asset or liability upon its initial recognition.
− Impairment of financial assets financial assets, other than those at fvTPL, are assessed for indicators of impairment at the end
of each reporting period. financial assets are impaired where there is objective evidence that, as a result of one or more events that occurred after the initial recognition of the financial asset, the estimated future cash flows of the investment have been affected.
Objective evidence of impairment could include: • Significant financial difficulty of the issuer or counterparty; or • Default or delinquency in interest or principal payments; or • It becoming probable that the borrower will enter bankruptcy or financial re-organization.
for certain categories of financial assets, such as customer receivables, the assets which have been subjected to impairment testing and have not suffered individual impairment, are included in the evaluation of impairment on a collective basis. The objective evidence that a receivables portfolio might be impaired could include the Entity’s past experience in terms of collections, an increase in the number of late payments in the portfolio which exceed the average credit period of seven months, and observable changes in national and local economic conditions that correlate with payment defaults.
for the financial assets recorded at amortized cost, the amount of the recognized loss from impairment is the difference between the carrying value of the asset and the present value of future collections, discounted at the original effective interest rate of the financial asset.
The carrying value of the financial asset is directly reduced by loss from impairment for all financial assets, except customer receivables, where the carrying value is reduced through an allowance for doubtful accounts. when an account receivable is deemed to permanently impaired, it is eliminated against the allowance. The subsequent recovery of amounts previously eliminated is recognized against results. Changes in the carrying value of the allowance for bad debts are also recognized within results.
ii. Financial liabilities and equity instruments issued by the entity Classification as debt or equity - Debt and equity instruments are classified as either financial
liabilities or as equity in accordance with the substance of the contractual arrangement.
Equity instruments - An equity instrument is any contract that evidences a residual interest in the net assets of an entity. Equity instruments issued by the Entity are recognized at the proceeds received, net of direct issuance costs.
Financial liabilities - financial liabilities are classified as either financial liabilities at fvTPL or other financial liabilities. Currently, the Entity only holds other financial liabilities, including derivative financial instruments designated as hedges, and has not designated any financial liabilities as fvTPL.
42 Grupo SanbornS Annual Report 2012 43

The Entity recognizes a deferred tax liability for taxable temporary differences related to its investments in subsidiaries, except when it is able to control the reversal of the temporary difference and it is likely that the latter will not be reversed in the foreseeable future. The deferred tax assets generated by the temporary differences associated with these investments are only recognized when it is likely that the Entity will generate sufficient future tax income to which these temporary differences can be applied and when they are expected to be reversed in the near future.
The carrying value of a deferred tax asset must be reviewed at the end of each reporting period and must be decreased to the extent that the Entity considers that it will generate sufficient taxable profits to enable it to totally or partially recover the asset.
Deferred tax assets and liabilities are calculated using the tax rates which the Entity’s expects to apply in the period in which the liability is settled or the asset is realized, based on the rates (and tax laws) which have been enacted or substantially enacted at the end of the reporting period. The valuation of deferred tax liabilities and assets reflects the tax effects that would be generated by the manner in which the Entity expects to recover or settle the carrying values of its assets and liabilities at the end of the reporting period.
The Entity incurs consolidated income tax (ISR) in conjunction with grupo Carso, S.A.B. de C.v.
Current and deferred income tax are recorded in the results of the year they are incurred, except when related to items recognized as other comprehensive income.
o. direct employee benefits and at retirement - The costs incurred related to direct benefits and defined retirement benefit plans are recognized as expenses when employees have provided the services which grant them the right to these benefits.
The seniority premium liability for all personnel, non-union personnel pensions and retirement payments treated as pensions are considered in defined benefit plans. The cost of these benefits is determined by using the projected unit credit method and the actuarial valuations prepared at the end of each reporting period. Actuarial gains and losses are immediately recognized in other comprehensive income, net of deferred tax, based on the net asset or liability recognized in the consolidated statement of financial position, so as to reflect the over- or underfunded status of employee benefit plan obligations. Similarly, past service costs are recognized in results when the plan is modified or when restructuring costs are incurred.
Retirement benefit obligations recognized in the statement of financial position represent the current value of the defined benefit obligation adjusted according to actuarial gains and losses and the past service costs, less the fair value of plan assets. when plan assets exceed the liabilities of the defined benefit plan, they are valued according to the lower of: i) the defined benefit plan surplus, and ii) the current value of any economic benefits derived from the plan and available as future plan contribution reimbursements or reductions.
p. revenue recognition - Revenue is measured at the fair value of the consideration received or receivable considering the amount of sales returns, discounts and other similar discounts or rebates. Revenues are recognized based on the criteria below:
− Sale of goods - The sale of goods is recognized when the inherent risks and rewards are transferred to the customer, provided the respective income can be reliably measured, it is likely that the Entity will receive the economic benefits associated with the transaction, the costs that have been or will be incurred to perform the transaction can be reliably measured, the Entity is not continuously involved in the ownership of the goods and does not retain effective control over them. generally, revenues recognition coincides with the date on which the goods are delivered and ownership is legally transferred to the customer.
− Finance income on credit sales – finance income on credit sales is recognized when it is accrued and is generated by credit card transactions (Sanborns, Sears, Saks, Dorian’s, Mixup and Corpti).
− Services – Revenues from services provided are recognized when the service is rendered.
The Entity ceases to account for hedges whenever the hedging relationship is revoked, the instrument expires or is sold, terminated or exercised, or when it ceases to reflect the criteria established for hedge accounting purposes. Any accrued gain or loss derived from the hedge instrument and recognized in equity remains there until the forecasted transaction is ultimately recognized in results. when the forecasted transaction is no longer expected to occur, the gain or loss accrued to equity is immediately reclassified to results.
− Fair value hedges Changes to the fair value of derivative financial instruments designated and classified as fair value
hedges are recognized in results together with any change to the fair value of the hedged asset or liability attributable to the hedged risk. The change to the fair value of the hedge instrument and hedged item attributable to the hedged risk are recognized in results under the same heading.
The Entity ceases to account for hedges whenever the hedge relationship is revoked, the instrument expires or is sold, terminated or exercised, or when it ceases to reflect the criteria established for hedge accounting purposes. The adjustment in accounting to the fair value of the hedged item derived from the hedged risk is applied to results as of that date.
− Embedded derivatives The Entity reviews its executed contracts to identify any embedded derivatives which must be
separated from the host contract for valuation and accounting purposes. when embedded derivatives are identified in other financial instruments or contracts (host contracts), they are treated as separate derivatives when their risks and characteristics are not closely related to those of the respective host contracts and when the latter are not recorded at their fair value with changes recorded through results.
An embedded derivative is presented as a long-term asset or liability when the respective hybrid instrument will mature in 12 months or more and when is not expected to be realized or canceled during that 12-month period. Other embedded derivatives are presented as short-term assets or liabilities.
During the reporting period, the Entity did not enter into any fair value hedges for its net investment in
foreign operations or any embedded derivatives.
m. Provisions - Are recognized for current obligations (legal or assumed) that arise from a past event, that are probable to result in the use of economic resources, and that can be reasonably estimated.
The amount recognized as a provision is the best estimate of the resources required to settle the present obligation at end of period, taking into account the risks and uncertainties associated with the obligation. when a provision is valued using the estimated cash flows to settle the present obligation, its carrying amount represents the present value of the cash flow (only when the value of money over time is material).
when it is expected that some or all of the economic benefits required to settle a provision are recovered from a third party, an asset is recognized by a receivable when it is virtually certain that reimbursement will be received and the amount of the receivable can be measured reliably.
n. income taxes - The expense for income taxes represents the sum of current and deferred tax calculated as the higher of regular income tax (ISR) or the business flat tax (IETu). ISR is calculated based on taxable profit which differs from net income reported in the consolidated statement of comprehensive income due to income or expenses taxable or nontaxable in other periods as well as items that are not taxable or deductible. IETu is calculated based on cash flows of each fiscal year, representing revenues, less deductions and certain tax credits. The income tax liability is calculated based on the promulgated or substantially approved tax rate at the end of the reporting period.
Deferred taxes are calculated by applying the corresponding tax rate to temporary differences resulting from comparing the accounting and tax bases of assets and liabilities and including, if any, future benefits from tax loss carry forwards and certain tax credits. Deferred tax assets are recorded only when there is a high probability of recovery, to the extent that estimated taxable profits will be available to utilize such tax benefits. Deferred tax assets and liabilities are not recognized if temporary differences arise from goodwill or the initial recognition (unless involving a business combination) of other assets and liabilities in a transaction that will not affect the Entity’s taxable income or accounting profit.
44 Grupo SanbornS Annual Report 2012 45

d. impairment of long-lived assets - The carrying value of noncurrent assets is reviewed to detect indications of impairment; i.e., if certain situations or changing circumstances indicate that carrying values may not be recoverable. If indications of impairment are detected, the Entity performs a review to determine whether the carrying value exceeds its recovery value and is impaired. when applying asset impairment tests, the Entity must estimate the value in use assigned to property, plant and equipment and cash generating units, in the case of certain assets. value in use calculations require that the Entity determine the future cash flows produced by cash generating units, together with an appropriate discount rate for calculating present value. The Entity utilizes cash flow projections by estimating market conditions, prices, production and sales volumes.
e. Valuation of financial instruments - The Entity uses valuation techniques for its financial instruments
which include information that is not always based on an observable market to estimate the fair value of certain financial instruments. Note 10 contains detailed information on the key assumptions used to determine the fair value of the Entity’s financial instruments, as well as an in-depth sensitivity analysis of these assumptions. Entity management considers that the valuation techniques and assumptions it has utilized are suitable for determining the fair value of its financial instruments.
f. Contingencies - As the Entity is involved in certain legal proceedings, it evaluates the probability of a payment obligation arising. Accordingly, it considers the legal situation in effect at the estimate date and the opinion of its legal advisers; these evaluations are periodically reconsidered.
g. employee benefits at retirement - The Entity uses assumptions to determine the best annual estimate of these benefits. Like the above assumptions, these benefits are jointly and annually determined in conjunction with independent actuaries. These assumptions include demographic hypotheses, discount rates, expected remuneration increases and future employee tenure, among other items. while the Entity considers that these assumptions are appropriate, any modification in this regard could affect the value of employee benefit assets (liabilities) and the statement of comprehensive income of the period in which any such modification takes place.
6. CASH AnD CASH EquIVALEnTS
2012 2011JaNuary 1,
2011
Cash $ 582,139 $ 745,103 $ 516,356
Cash equivalents:
Treasury notes 1,048,724 467,900 24,958
Banking paper 676,836 822,440 910,999
Money market funds in uS dollars 18,004 8,732 68,757
Others 2,152 5,387 5,247
$ 2,327,855 $ 2,049,562 $ 1,526,317
7. Accounts ReceIVAble
2012 2011JaNuary 1,
2011
Clients $ 9,036,688 $ 8,599,415 $ 8,344,510
Allowance for doubtful accounts (328,045) (330,445) (336,746)
8,708,643 8,268,970 8,007,764
Sundry debtors 92,163 102,280 145,857
Due to related parties 16,748 8,435 6,612
Recoverable income tax - - 45,712
Recoverable taxes and payroll tax credit 38,995 71,834 87,071
$ 8,856,549 $ 8,451,519 $ 8,293,016
− rentals – Rental revenue is recognized on a straight-line basis as lease services are provided and maintenance fees are collected; these amounts are recognized throughout the period of the lease contract from which they are derived.
q. loyalty programs for customers - Awards are accounted for as a separate component of the initial sale transaction, measured at their fair value and recognized as deferred income in the statement of financial position, within other accounts payable and accrued liabilities. Deferred revenue is recognized in income once the award is redeemed or expires.
r. Cash flows statement - The Entity reports cash flows from operating activities using the indirect method, whereby profit or loss is adjusted for the effects of transactions of a non-cash nature. Interest received is presented as an investing activity and interest paid is presented as a financing activity.
s. earnings per share - The basic earnings per common share is calculated by dividing the net consolidated
profit attributable to the controlling interest by the weighted average of common outstanding shares during the year. The Entity does not have any potentially dilutive instruments outstanding with respect to its shares, for which reason diluted earnings per share is the same as basic earnings per share.
5. cRItIcAl AccountIng judgments And key souRces of unceRtAInty estImAtIons
In applying the accounting policies (see Note 4), the Entity’s management makes judgments, estimates and assumptions about certain amounts of assets and liabilities in the financial statements. The estimates and associated assumptions are based on historical experience and other factors deemed relevant. Actual results could differ from those estimates.
The estimates and underlying assumptions are reviewed on a regular basis. Revisions to accounting estimates are recognized in the period of the revision and future periods if the revision affects both current period and subsequent periods.
Critical accounting judgments and key sources of uncertainty in applying the estimations that may have a significant impact on the amounts recognized in the accompanying consolidated financial statements are as follows:
a. inventory and accounts receivable allowances - The Entity use estimates to determine inventory and accounts receivable reserves. when calculating inventory reserves, the Entity considers production and sales volumes, as well as the demand for certain products. when determining the allowance for doubtful accounts, the Entity primarily considers the financial risk represented by each customer, unguaranteed accounts and significant collection delays based on established credit conditions. See Notes 7 and 8 for further detail.
b. Property, machinery and equipment - The Entity reviews the estimated useful life of property, plant and equipment at the end of each annual period to determine the depreciation of these assets. Asset useful lives are defined according to the technical studies prepared by specialized internal personnel and with the participation of external specialists. As part of the adoption of IfRS, Entity management prepared a detailed analysis to modify the useful life of certain components of property, plant and equipment components. The level of uncertainty related to useful life estimates is also linked to market changes and asset utilization based on production volumes and technological development.
c. investment property - The Entity prepares an annual valuation of investment property with the assistance of independent appraisers. The valuation techniques are based on different methods including physical inspection, market and income approaches; the Entity has utilized the physical inspection approach for the value of investment properties included in the accompanying consolidated financial statements. The valuation methodology includes observable assumptions for properties which, while dissimilar, nonetheless involve the same geographic zones and commercial use. The Entity considers the highest and best use of its assets.
The valuation techniques used by the Entity were not modified in 2012 and 2011. Entity management considers that the valuation methodologies and assumptions utilized are appropriate for determining the fair value of the Entity’s investment properties.
46 Grupo SanbornS Annual Report 2012 47

a. A reconciliation of the allowance for obsolete, slow moving and missing inventories is presented below:
deCember 31, 2012
deCember 31, 2011
Beginning balance $ 254,600 $ 228,182
Period accrual 80,606 75,268
write offs and cancelations (48,253) (48,850)
Ending balance $ 286,953 $ 254,600
9. fInAncIAl RIsk mAnAgement
The Entity is exposed to market, operating and financial risks as a result of its use of financial instruments. These include interest rate, credit, liquidity and exchange rate risks, which are managed in a centralized manner by the corporate treasury of grupo Carso. The Entity seeks to minimize its exposure to these risks by contracting hedges based on derivative financial instruments.
The different financial instrument categories and amounts at December 31, 2012 and December 31 and January 1, 2011, are detailed below:
deCember 31, 2012
deCember 31, 2011
JaNuary 1, 2011
financial assets
Cash and cash equivalents $ 2,327,855 $ 2,049,562 $ 1,526,317
Measured at fair value:
• Derivative financial instruments - - 154,734
Loans and receivables 8,839,801 8,443,084 8,286,404
• Long term 69,000 80,500 92,000
• Due to related parties 16,748 8,435 6,612
financial liabilities
At amortized cost:
• Loans with financial institutions 2,774,069 25,861 2,831,352
• Debt securities 2,498,970 1,347,073 -
• Payables to suppliers 5,964,007 5,462,470 4,270,151
• Due to related parties 250,860 695,191 1,121,616
• Accrued expenses 1,732,537 1,491,939 1,644,750
Measured at fair value:
• Derivative financial instruments 10 21,237 113
The Board of Directors establishes and monitors the policies and procedures used to measure risks, which are described below:
a. Capital risk management - The Entity manages its capital to ensure that it will continue as a going concern, while it maximizes returns to its shareholders through the optimization of the balances of debt and equity. The capital structure of grupo Sanborns is composed by its net debt (mainly the bank loans, securitization certificates and intercompany loans detailed in Notes 14, 15 and 20) and stockholders’ equity (issued capital, capital reserves, the group profits and noncontrolling equity detailed in Note 18). The Entity is not subject to any kind of capital requirement.
grupo Carso has the policy of maintaining a net debt ratio not exceeding three times its EBITDA (Earnings before taxes, plus/less interest, exchange rate fluctuations, and the valuation effect of derivative financial instruments, depreciation and amortization); see detail in Note 26.
a. Clients The Entity organizes sales promotions in which it grants credit to its customers for different average
periods of 211, 218 and 224 days at December 31, 2012 and December 31 and January 1, 2011, respectively. In the case of sales promotions with collection periods exceeding one year, the respective accounts receivable are classified as short-term because they form part of the Entity’s regular transaction cycle, which is a standard industry practice. Total maturities arising after one year are $703,131 at December 31, 2012, $657,874 and $673,916 at December 31 and January 1, 2011, respectively.
b. Past due but not impaired Accounts receivable from customers include amounts that are overdue at the end of the reporting period
and for which the Entity has not recognized an allowance for bad debts as there has been no significant change in the customer’s credit rating and the amounts in question are still deemed to be recoverable. A summary of customer accounts receivable which are overdue, but are not considered impaired is detailed below:
deCember 31, 2012
deCember 31, 2011
JaNuary 1, 2011
Past due more than 90 days $ 122,248 $ 141,322 $ 190,445
The Entity provides follow-up on customers’ compliance with payments for which collateral was not provided and which only have guarantors. According to the Entity’s policies, if customer payments are delayed, the respective credit line is suspended for future purchases. Similarly, in the event of more significant delays, the Entity implements out-of-court and legal measures to recover the outstanding balance. however, if it is unsuccessful, the respective credit line and account are canceled. The Entity has recognized an allowance for doubtful accounts equal to 100% of all accounts receivable which could become uncollectible.
c. reconciliation of the allowance for doubtful accounts is presented below:
deCember 31, 2012
deCember 31, 2011
Beginning balance $ 330,445 $ 336,746
Period accrual 286,621 262,619
write offs and cancelations (289,021) (268,920)
Ending balance $ 328,045 $ 330,445
8. InVentoRIes
deCember 31, 2012
deCember 31, 2011
JaNuary 1, 2011
Inventory in stores $ 8,762,282 $ 8,018,928 $ 7,067,352Allowance for obsolescence and missing inventories (286,953) (254,600) (228,182)
8,475,329 7,764,328 6,839,170Merchandise in transit 245,568 262,813 191,614Spare parts and other inventories 119,266 128,363 107,560
$ 8,840,163 $ 8,155,504 $ 7,138,344
The Entity recognizes two estimates for possible losses derived from inventory impairment, one for obsolete and slow-moving goods and one for shrinkage.
The estimate for obsolete and slow-moving goods is determined based on the Entity’s prior-year experience by store and department, which enables it to determine the movement of goods on the market, their use at different locations, fashion trends and new product models. Accordingly, it evaluates the possibility of increasing this reserve if the goods in question are slow-moving until considering the entire cost as an impairment loss.
The estimate related to goods shrinkage is determined based on the Entity’s experience with shrinkage determined from physical inventories taken on a periodic basis. The Entity therefore adjusts inventory according to the variable percentages of shrinkage in effect at different stores.
48 Grupo SanbornS Annual Report 2012 49

d. Credit risk management - The credit risk refers to the situation in which the borrower defaults on its contractual obligations, thereby generating a financial loss for the Entity and which is essentially derived from customer accounts receivable and liquid funds. The credit risk affecting cash and cash equivalents and derivative financial instruments is limited because the counterparts are banks with high credit ratings issued by credit rating agencies. The Entity’s maximum credit risk exposure is represented by the balance in the statement of financial position. The Entity primarily grants credit to customers in Mexico after first evaluating their credit capacity, which it constantly evaluates, while providing follow-up according to the credit policies explained in Note 8. There are no credit risk concentrations in the Entity’s database because all accounts receivable are diluted by more than 1,762,000 customers, which do not represent an individual concentration risk. The Entity’s maximum credit risk can be found in the consolidated statement of financial position, comprised of the sum of cash, cash equivalents and accounts receivable.
e. liquidity risk management - Entity management reviews working capital, which enables it to administer short, medium and long-term financing requirements, maintain cash reserves and credit line availability, constantly monitor cash flows (projected and actual) and reconcile the maturity profiles of financial assets and liabilities.
The following table details the remaining contractual maturities of the Entity’s non-derivative financial liabilities, based on contractual repayment periods. The table has been designed based on un-discounted projected cash flows of financial liabilities based on the date on which the Entity must make payments. The table includes both projected cash flows related to interest and capital on financial debt in the statements of financial position. where the contractual interest payments are based on variable rates, the amounts are derived from interest rate at the end of the period.
weighted
average effeCtive
iNterest rate 3 moNths 6 moNths
more thaN 6 moNths,
less thaN 1 year total
As of December 31, 2012Loans with financial institutions 3.55% $ 2,774,069 $ - $ - $ 2,774,069Debt securities 4.5% y 4.6% 2,498,970 - - 2,498,970Payables to suppliers 5,807,111 156,896 - 5,964,007Derivative financial instruments 10 - - 10Due to related parties 250,860 - - 250,860Accrued expenses 1,732,537 1,732,537Total $ 13,063,557 $ 156,896 $ - $ 13,220,453As of December 31, 2011Loans with financial institutions 1.52% $ 25,861 $ - $ - $ 25,861Debt securities 4.5% and 4.6% 1,347,073 - - 1,347,073Payables to suppliers 5,293,478 168,992 - 5,462,470Derivative financial instruments 21,237 - - 21,237Due to related parties 695,191 - - 695,191Accrued expenses 1,491,939 1,491,939Total $ 8,874,779 $ 168,992 $ - $ 9,043,771As of January 1, 2011Loans with financial institutions 2.36% $ 359,932 $ - $ 2,471,420 $ 2,831,352Payables to suppliers 4,270,151 - - 4,270,151Derivative financial instruments 113 - - 113Due to related parties 1,121,616 - - 1,121,616
Accrued expenses 1,644,750 1,644,750Total $ 7,396,562 $ - $ 2,471,420 $ 9,867,982
f. Financial asset reclassifications- During the presented periods there were no reclassifications between categories of instruments
The net debt ratio of the Entity is presented below
deCember 31, 2012
deCember 31, 2011
JaNuary 1,2011
Loans with financial institutions $ 2,774,069 $ 25,861 $ 2,831,352
Debt securities 2,498,970 1,347,073 -
Cash and cash equivalents 2,327,855 2,049,562 1,526,317
Net debt with financial institutions 2,945,184 (676,628) 1,305,035
EBITDA $ 5,225,703 $ 4,916,526 $ 4,489,486
Net debt ratio 0.56 N/A 0.29
b. interest rate risk management - The Entity is exposed to interest rate risks from customer loans and financial debt contracted at variable rates. however, it manages this risk through an adequate combination of fixed and variable interest rates and by using interest rate swaps for its customer portfolio. hedging activities are regularly evaluated to ensure that they are properly aligned with interest rates and the respective risks and to facilitate the application of more profitable hedge strategies. hedge contracts are detailed in Note 11.
The Entity’s exposure to interest rate risks is primarily based on the Mexican Interbank Equilibrium Offered rate (TIIE) applicable to financial liabilities and its customer portfolio. Accordingly, it periodically prepares a sensitivity analysis by considering the cost of the net exposure from its customer portfolio and financial liabilities derived that earn and bear interest at variable interest rates; it also prepares an analysis based on the amount of outstanding credit at the end of the period.
If the TIIE interest rate increased or decreased by 100 basis points in each reporting period and all other variables remained constant, the pretax profit for the years ended December 31, 2012 and 2011 would have increased (decreased) by $31,833 and $26,424, respectively.
c. exchange risk management - The Entity’s functional currency is the Mexican peso. Its acquisition of goods through foreign currency transactions represents less than 12% of its total purchases; however, when deemed appropriate, it enters into exchange rate hedges to manage the exchange rate risk. The carrying values of monetary assets and liabilities denominated in foreign currency and which primarily generate exposure for the Entity at the end of the reporting period, are as follows (figures in thousands):
liabilities assets
deCember 31, 2012
deCember 31, 2011
JaNuary 1, 2011
deCember 31, 2012
deCember 31, 2011
JaNuary 1, 2011
u.S. dollars 42,131 44,756 237,218 41,118 38,096 39,201
The following table indicates the Entity’s sensitivity to a 10% increase or decrease of the Mexican peso versus the uS dollar. This percentage is the sensitivity rate used to internally report the exchange rate risk to key management personnel and also represents management’s evaluation of the possible fair value change to exchange rates. The sensitivity analysis only includes monetary items denominated in foreign currency and adjusts their conversion at the end of the period by applying a 10% fluctuation; it also includes external loans. A negative or positive figure, respectively (as detailed in the following table), indicates a (decrease) or increase in net income derived from a depreciation of the Mexican peso by 10% with regard to the uS dollar (figures in thousands):
deCember 31, 2012
deCember 31, 2011
JaNuary 1,2011
u.S. dollars (101) (666) (19,802)
50 Grupo SanbornS Annual Report 2012 51

11. deRIVAtIVe fInAncIAl InstRumentsThe Entity executes contracts with derivative financial instruments in order to partially hedge against the financial risks generated by its exchange and interest rate exposure. These contracts may be classified as accounting hedges if they meet hedge criteria; otherwise, they are considered and accounted for as economic hedges. The decision to enter into an economic hedge is based on market conditions, the related expectations of the instrument, and the domestic and international economic indicators which could affect the Entity’s operations.
Transactions performed with currency forwards and swaps and/or interest rates are summarized below:
NotioNalmeasuremeNt as of deCember 31, 2012
iNstrumeNtClassified
asamouNt
(‘000) CurreNCy maturityasset
(liability)Net iNCome
for the yeariNCome of
prior year
(gaiN) loss oN
settlemeNt
Dollar forwardsTradingBuying 45,000 Dólares
January 30,12 $ - $ - $ - $ (45,134)
fixed TIIE swapsTradingBuying 150,000 Pesos
february 28, 13 (10) 10 - -
fixed TIIE swapsTrading Buying 266,667 Pesos
September19, 12 - - - 59
Total as of December 31, 2012 $ (10) $ 10 $ - $ (45,075)Total as of December 31, 2011 $ (21,237) $ 21,237 $ - $ (191,417)
Total as of January 1, 2011 $ 154,621 $ 93,855 $ (248,476) $ 57,702
12. pRopERTy, MACHInERy AnD EquIpMEnTProperty, machinery and equipment are summarized below:
balaNCe as of deCember 31,
2011 additioNssales to third
parties
traNsfers to related
assets
balaNCe as of deCember 31,
2012
Investment:
Building and leasehold improvements $ 8,765,534 $ 408,001 (84,535) - $ 9,089,000
Machinery and equipment 1,971,254 93,191 (25,629) - 2,038,816
furniture and equipment 2,976,423 119,712 (33,251) - 3,062,884
vehicles 268,788 46,946 (37,579) - 278,155
Computers 911,517 68,716 (8,899) - 971,334
Total investment 14,893,516 736,566 (189,893) - 15,440,189
Accumulated depreciation:
Building and leasehold improvements (3,796,519) (362,432) 20,802 - (4,138,149)
Machinery and equipment (1,463,706) (65,631) 22,330 - (1,507,007)
furniture and equipment (1,815,986) (147,612) 14,018 - (1,949,580)
vehicles (207,754) (22,578) 33,440 - (196,892)
Computers (777,749) (61,928) 7,814 - (831,863)
Total accumulated depreciation (8,061,714) (660,181) 98,404 - (8,623,491)
Subtotal 6,831,802 76,385 (91,489) - 6,816,698
Land 1,791,817 - - - 1,791,817
Investment:
Construction in progress 187,448 12,325 - - 199,773
Net investment $ 8,811,067 $ 88,710 $ (91,489) $ - $ 8,808,288
10. fAIR VAlue of fInAncIAl InstRuments The fair value of financial instruments presented below has been determined by the Entity using available market information or other valuation techniques that require judgment in developing and interpreting the estimates of fair values. . The Entity also makes assumptions that are based on market conditions existing at each of the dates of the statement of financial position. Consequently, the estimated amounts presented are not necessarily indicative of the amounts the Entity could realize in a current market exchange. The use of different assumptions and / or estimation methods may have a material effect on the estimated fair value amounts. The financial instruments which are measured following their initial fair value recognition and are grouped by levels ranging from 1 to 3 based on the extent to which their value can be observed, are as follows: • Level 1 of fair value measurements are those derived from quoted prices (unadjusted) in active markets for
identical assets or liabilities;
• Level 2 of the fair value measurements are those derived from indicators other than quoted prices included within Level 1 but including indicators that are observable for the asset or liability, either directly or indirectly, such as amounts derived from quoted prices and
• Level 3 of fair value measurements are those derived from valuation techniques that include indicators for the asset or liability that are not based on observable market data (unobservable indicators).
The Entity considers that the carrying amount of cash, accounts receivable and accounts payable from related and third parties approximate their fair values because they have short-term maturities.
To obtain and disclose the fair value of long-term debt, fair value is based on market rates or rates for similar instruments. In order to determine the fair value of other financial instruments, the Entity utilizes other techniques such as estimated cash flows, discounting these cash flows by using rates that reflect the counterparty risk and the credit risk of the Entity itself during the reference period. The fair value of interest rate swaps is calculated as the present value of estimated future net cash flows. The fair value of currency forwards is determined by using the future exchange rates quoted at the date of the statement of changes in financial position.
The amounts of the financial instruments by category and their fair values are presented below:
deCember 31,2012 deCember 31, 2011 JaNuary1, 2011
CarryiNg amouNt
fairvalue
CarryiNg amouNt
CarryiNg amouNt
fairvalue
CarryiNg amouNt
financial assets:
Cash and cash equivalents $ 2,327,855 $ 2,327,855 $ 2,049,562 $ 2,049,562 $ 1,526,317 $ 1,526,317
Investments held for trading:
Derivative financial instruments - - - - 154,734 154,734
Loans and receivables:
Clients 8,856,549 9,262,046 8,451,519 8,438,196 8,293,016 8,228,942
financial institutions loans:
Bank loans including current portion of long-term debt 2,774,069 2,774,069 25,861 25,861 2,831,352 2,831,352
Debt securities 2,498,970 2,499,366 1,347,073 1,343,255 - -
Payables to suppliers 5,964,007 5,964,007 5,462,470 5,462,470 4,270,151 4,270,151
Due to related parties 250,860 250,860 695,191 695,191 1,121,616 1,121,616
Accrued expenses 1,732,537 1,732,537 1,491,939 1,491,939 1,644,750 1,644,750
Derivative instruments non classified for hedge purposes:
Interest rate swaps 10 10 21,237 21,237 113 113
Total $ (2,036,049) $ (1,630,948) $ 1,457,310 $ 1,447,805 $ 106,085 $ 42,011
No transfers between Level 1, 2 and 3 occurred during the period.
52 Grupo SanbornS Annual Report 2012 53
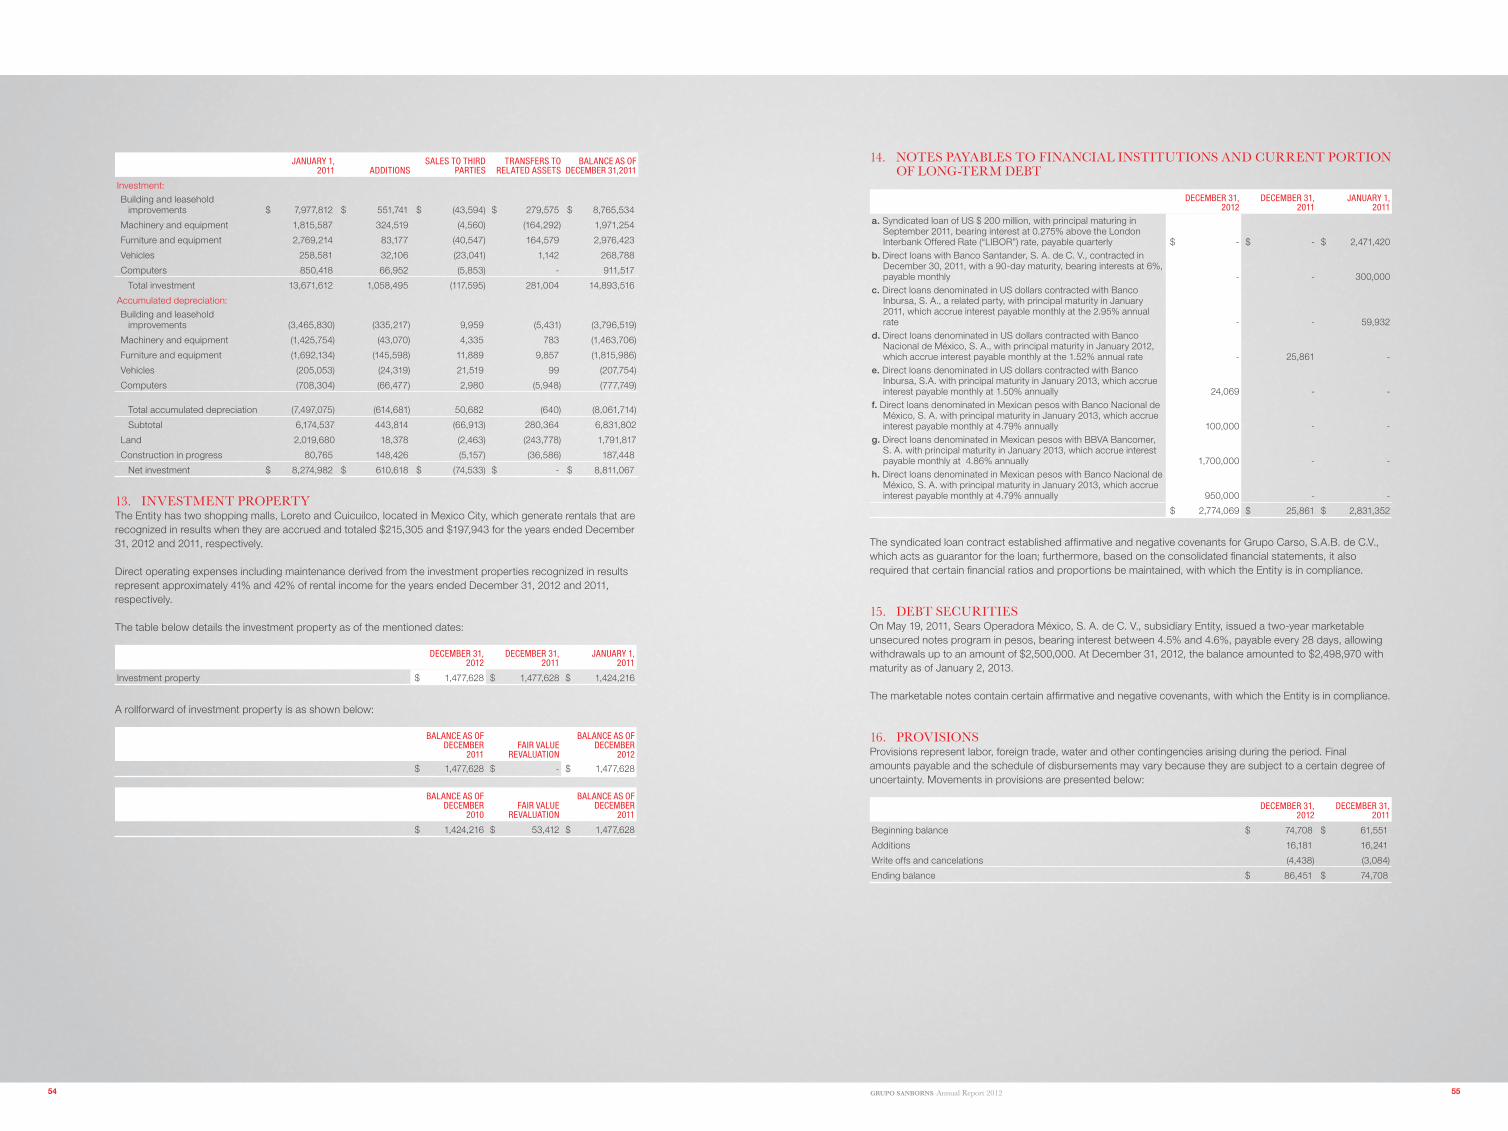
14. notes pAyAbles to fInAncIAl InstItutIons And cuRRent poRtIon of long-teRm debt
deCember 31,2012
deCember 31,2011
JaNuary 1, 2011
a. Syndicated loan of uS $ 200 million, with principal maturing in September 2011, bearing interest at 0.275% above the London Interbank Offered Rate (“LIBOR”) rate, payable quarterly $ - $ - $ 2,471,420
b. Direct loans with Banco Santander, S. A. de C. v., contracted in December 30, 2011, with a 90-day maturity, bearing interests at 6%, payable monthly - - 300,000
c. Direct loans denominated in uS dollars contracted with Banco Inbursa, S. A., a related party, with principal maturity in January 2011, which accrue interest payable monthly at the 2.95% annual rate - - 59,932
d. Direct loans denominated in uS dollars contracted with Banco Nacional de México, S. A., with principal maturity in January 2012, which accrue interest payable monthly at the 1.52% annual rate - 25,861 -
e. Direct loans denominated in uS dollars contracted with Banco Inbursa, S.A. with principal maturity in January 2013, which accrue interest payable monthly at 1.50% annually 24,069 - -
f. Direct loans denominated in Mexican pesos with Banco Nacional de México, S. A. with principal maturity in January 2013, which accrue interest payable monthly at 4.79% annually 100,000 - -
g. Direct loans denominated in Mexican pesos with BBvA Bancomer, S. A. with principal maturity in January 2013, which accrue interest payable monthly at 4.86% annually 1,700,000 - -
h. Direct loans denominated in Mexican pesos with Banco Nacional de México, S. A. with principal maturity in January 2013, which accrue interest payable monthly at 4.79% annually 950,000 - -
$ 2,774,069 $ 25,861 $ 2,831,352
The syndicated loan contract established affirmative and negative covenants for grupo Carso, S.A.B. de C.v., which acts as guarantor for the loan; furthermore, based on the consolidated financial statements, it also required that certain financial ratios and proportions be maintained, with which the Entity is in compliance.
15. debt secuRItIesOn May 19, 2011, Sears Operadora México, S. A. de C. v., subsidiary Entity, issued a two-year marketable unsecured notes program in pesos, bearing interest between 4.5% and 4.6%, payable every 28 days, allowing withdrawals up to an amount of $2,500,000. At December 31, 2012, the balance amounted to $2,498,970 with maturity as of January 2, 2013.
The marketable notes contain certain affirmative and negative covenants, with which the Entity is in compliance.
16. pRoVIsIonsProvisions represent labor, foreign trade, water and other contingencies arising during the period. final amounts payable and the schedule of disbursements may vary because they are subject to a certain degree of uncertainty. Movements in provisions are presented below:
deCember 31,2012
deCember 31,2011
Beginning balance $ 74,708 $ 61,551
Additions 16,181 16,241
write offs and cancelations (4,438) (3,084)
Ending balance $ 86,451 $ 74,708
JaNuary 1, 2011 additioNs
sales to third parties
traNsfers to related assets
balaNCe as of deCember 31,2011
Investment:
Building and leasehold improvements $ 7,977,812 $ 551,741 $ (43,594) $ 279,575 $ 8,765,534
Machinery and equipment 1,815,587 324,519 (4,560) (164,292) 1,971,254
furniture and equipment 2,769,214 83,177 (40,547) 164,579 2,976,423
vehicles 258,581 32,106 (23,041) 1,142 268,788
Computers 850,418 66,952 (5,853) - 911,517
Total investment 13,671,612 1,058,495 (117,595) 281,004 14,893,516
Accumulated depreciation:
Building and leasehold improvements (3,465,830) (335,217) 9,959 (5,431) (3,796,519)
Machinery and equipment (1,425,754) (43,070) 4,335 783 (1,463,706)
furniture and equipment (1,692,134) (145,598) 11,889 9,857 (1,815,986)
vehicles (205,053) (24,319) 21,519 99 (207,754)
Computers (708,304) (66,477) 2,980 (5,948) (777,749)
Total accumulated depreciation (7,497,075) (614,681) 50,682 (640) (8,061,714)
Subtotal 6,174,537 443,814 (66,913) 280,364 6,831,802
Land 2,019,680 18,378 (2,463) (243,778) 1,791,817
Construction in progress 80,765 148,426 (5,157) (36,586) 187,448
Net investment $ 8,274,982 $ 610,618 $ (74,533) $ - $ 8,811,067
13. InVestment pRopeRtyThe Entity has two shopping malls, Loreto and Cuicuilco, located in Mexico City, which generate rentals that are recognized in results when they are accrued and totaled $215,305 and $197,943 for the years ended December 31, 2012 and 2011, respectively.
Direct operating expenses including maintenance derived from the investment properties recognized in results represent approximately 41% and 42% of rental income for the years ended December 31, 2012 and 2011, respectively.
The table below details the investment property as of the mentioned dates:
deCember 31,2012
deCember 31,2011
JaNuary 1, 2011
Investment property $ 1,477,628 $ 1,477,628 $ 1,424,216
A rollforward of investment property is as shown below:
balaNCe as of deCember
2011fair value
revaluatioN
balaNCe as of deCember
2012
$ 1,477,628 $ - $ 1,477,628
balaNCe as of
deCember 2010
fair value revaluatioN
balaNCe as of deCember
2011
$ 1,424,216 $ 53,412 $ 1,477,628
54 Grupo SanbornS Annual Report 2012 55

The main categories of investments are:
plaN assets at fair value 2012
plaN assets at fair value 2011
Equity instruments $ 958,217 $ 1,034,734
Debt instruments $ 964,463 $ 823,246
The general expected rate of return represents a weighted average of the expected returns generated by different plan asset categories. Directors’ evaluation of expected returns is based on historical return trends and forecasts made by market analysts of asset returns during the life of the related obligation.
18. SToCkHoLDERS’ EquITya. As of December 31, 2012, December 31, 2011 and January 1, 2011, the capital stock of the Entity is
comprised as follows:
Number of shares amouNt
historical capital stock B1 Series 974,845,882 $ 1,153,102
Common stock is composed by ordinary, nominative shares at no par value. Series B1 shares represent fixed capital, while Series B2 shares represent variable capital, which is unlimited; these shares can be freely subscribed
b. At the Ordinary general Meeting of the Stockholders of grupo Sanborns on April 26, 2012, the stockholders declared dividends of $1,200,000, which were paid on April 30, 2012. At the Ordinary general Meeting of the Stockholders of grupo Sanborns on November 20, 2012 the stockholders declared dividends of $ 4,700,000, which were paid on November 21, 2012.
c. Retained earnings include the statutory legal reserve. The general Corporate Law requires that at least 5% of net income of the year be transferred to the legal reserve until the reserve equals 20% of capital stock at par value. The legal reserve may be capitalized but may not be distributed unless the entity is dissolved and must be replenished if it is reduced for any reason. As of December 31, 2012, December 31, 2011 and January 1, 2011, the legal reserve was $256,569.
d. Stockholders’ equity, except for restated paid-in capital and tax retained earnings will be subject to ISR payable by the Entity at the rate in effect upon distribution. Any tax paid on such distribution may be credited against annual and estimated ISR of the year in which the tax on dividends is paid and the following two fiscal years,
e. The balances of the stockholders’ equity tax accounts are as follows:
deCember 31, 2012
deCember 31, 2011
JaNuary 1, 2011
Contributed capital account $ 3,834,764 $ 3,702,793 $ 3,567,035
Net consolidated tax income account 10,508,079 7,875,751 7,561,788
Total $ 14,342,843 $ 11,578,544 $ 11,128,823
17. RetIRement employee benefItsThe Entity has created payment plans for the retirement, death or total disability of non-union personnel at most of its subsidiaries. Likewise, seniority premium payment plans are in effect for all personnel, as required by employment contracts. The respective liability and the annual cost of these benefits are calculated by an independent actuary according to the bases defined in these plans and by using the projected unit credit method. The current values of these obligations and the rates used for calculation purposes are as follows:
deCember 31,2012
deCember 31,2011
vested benefit obligation $ (249,136) $ (247,642)
Non-vested benefit obligation (937,013) (778,272)
Defined benefit obligation (1,186,149) (1,025,914)
Plan assets at fair value 1,922,680 1,857,980
Net projected asset $ 736,531 $ 832,066
Contributions to plan assets $ 34,000 $ 33,000
Nominal rates used in actuarial calculations are as follows:
deCember 31,2012 %
deCember 31, 2011 %
Discount of the projected benefit obligation at present value 7.00 7.13
Salary increase 4.00 4.74
future pension increase 7.65 7.33
Net cost for the period includes the following items:
deCember 31,2012
deCember 31,2011
Current service cost $ 53,146 $ 53,365
Past service cost 2,110 8,167
financial cost 74,448 74,052
Interest income (138,973) (135,301)
Curtailment and settlement other than restructuring (1,020) (24,958)
Net period income $ (10,289) $ (24,675)
Changes in the present value of the defined benefit obligation:
deCember 31,2012
deCember 31,2011
Changes in the present value of the defined benefit obligations as of January, 1 $ 1,025,917 $ 1,015,959
Current service cost 53,146 53,365
Past service cost 2,110 8,167
financial cost 74,448 74,052
Actuarial losses (gains) 73,330 (84,377)
Personnel transfers 307 -
Benefits paid (42,089) (16,294)
Curtailment and settlement other than restructuring (1,020) (24,958)
Present value of the defined benefit obligations $ 1,186,149 $ 1,025,914
Changes in the present value of the plan assets during the period:
deCember 31,2012
deCember 31,2011
fair value of the plan assets at the beginning of the year $ 1,862,698 $ 1,774,918
Interest income 138,973 135,301
Actuarial losses (71,209) (68,945)
Employer contributions 34,000 33,000
Personnel transfers 307 -
Benefits paid (42,089) (16,294)
Total fair value of the plan assets at the end of the year $ 1,922,680 $ 1,857,980
56 Grupo SanbornS Annual Report 2012 57

20. bAlAnces And tRAnsActIons wIth RelAted pARtIesa. Balances with related parties are as follows:
deCember 31, 2012
deCember 31, 2011
JaNuary 1, 2011
Receivables-
grupo Técnico de Servicios Telvista, S. A. de C. v. $ 3,621 $ 2,688 $ 2,866
Promotora del Desarrollo de América Latina, S. A. de C. v. 1,838 484 274
Nacional de Conductores Eléctricos, S.A. de C.v. 1,757 - -
Inmobiliaria Carso, S.A. de C.v. 1,241 60 -
Administradora y Operadora de Estacionamientos, S.A. de C.v. 1,067 - -
Imsalmar 693 259 -
Banco Inbursa, S.A. - - 548
Otros 6,531 4,944 2,924
$ 16,748 $ 8,435 $ 6,612
Payables-
Radiomóvil Dipsa, S. A. de C. v. $ 64,738 $ 86,738 $ 46,797
Inmuebles Srom, S. A. de C. v. 29,649 76,526 -
Dorians Tijuana, S. A. de C. v. 2,550 470,984 -
Sears Brands Management Corporation 76,875 - -
América Móvil, S.A. de C.v. 13,278 133 -
Teléfonos de México, S. A. B. de C. v. 4,896 6,346 3,791
Philip Morris México, S. A. de C. v. 6,976 8,685 22,569
Inmose, S. A. de C. v. 13,506 7,644 -
Distribuidora Telcel, S. A.de C. v. 3,288 2,816 29,397
Consorcio Red uno, S. A. de C. v. 3,618 447 4,236
Bajasur, S. A. de C. v. 5,909 5,633 -
Seguros Inbursa, S. A. de C. v. 5,746 5,291 -
Operadora Mercantil, S. A. de C. v. 2,265 3,262 3,752
Desarrollos Sagesco, S. A. de C. v. 5,754 3,404 -
Bienes Raíces de Acapulco, S. A. de C. v. 856 6,839 -
Patrimonial Inbursa, S.A. de C.v. 186 - (1) 921,252
fianzas guardiana Inbursa, S.A. de C.v. 85 772 89,102
Otras 10,685 9,671 720
$ 250,860 $ 695,191 $ 1,121,616
(1) unsecured loan denominated in Mexican pesos, maturing as of January 19, 2011, bearing interest at a 5.9% rate.
19. foReIgn cuRRency bAlAnces And tRAnsActIonsAs of December 31, 2012, December 31 and January 1, 2011, assets, liabilities and transactions in foreign currency different than the functional currency of each reported unit translated to u. S. dollars are presented below:
thousaNds of u. s. dollars
deCember 31,
2012deCember 31,
2011JaNuary 1,
2011
Current assets 41,118 38,096 39,201
Current liabilities 42,131 44,756 237,218
Net foreign currency liability position (1,013) (6,660) (198,017)
Transactions denominated in foreign currency, except purchases of machinery and equipment, were as follows:
thousaNds of u. s. dollars
deCember 31, 2012
deCember 31, 2011
Sales 33,101 31,678
Interest paid (29) (816)
Purchases (9,259) (33,724)
Import purchases (116,672) (81,312)
Equipment maintenance (2,462) (2,908)
Services (10,607) (18,254)
Dividends (3,446) -
Royalties (15,097) (15,149)
Rents paid (2,694) (2,710)
Credit notes (356) (502)
Total (127,521) (123,697)
u.S. dollar exchange rates as of each reporting period and as of the issuance date of the accompanying consolidated financial statements were as follows:
deCember 31, 2012
deCember 31, 2011
JaNuary 1,2011
marCh 15,2013
Mexican pesos per one u.S. dollar $ 13.0101 $ 13.9787 $ 12.3571 $ 12.4545
58 Grupo SanbornS Annual Report 2012 59

c. Compensation of key management personnel
The management compensation and other members of key management during the year was as follows:
deCember 31, 2012
deCember 31, 2011
Short term benefits $ 53,150 $ 82,127
Defined benefits plans $ 113,139 $ 97,458
21. oTHER (InCoME) ExpEnSES
2012 2011
Loyalty program benefits cancellations $ (40,149) $ -
Royalties (7,560) (1,917)
gains from investment properties - (53,413)
Materials and waste sales (98,914) (92,419)
Loss on sale of property, plant and equipment, net 58,885 30,443
Others, net (4,551) (6,763)
$ (92,289) $ (124,069)
22. cost And eXpenses by nAtuRe
2012
CoNCeptCost
of sales
sales aNd developmeNt
expeNsesadmiNistrative
expeNsestotal
expeNses
wages and salaries $ 6,654 $ 2,449,742 $ 520,449 $ 2,976,845
Merchandise 23,682,402 - - 23,682,402
Royalties - 217,972 3,303 221,275
Advertising 1,444 354,209 431 356,084
Insurance 2,824 73,056 3,364 79,244
Employee benefits 19 1,872,481 252,447 2,124,947
Leases - 1,104,426 51,614 1,156,040
Electricity - 635,758 6,692 642,450
Maintenance 2,821 375,572 419,720
Safety and security - 107,277 5,457 112,734
Cleaning accessories - 216,558 1,012 217,570
Suppliers - 97,966 29,193 127,159
Securities collectors - 60,601 - 60,601
water - 103,032 1,298 104,330
Taxes and duties 122 63,418 20,899 84,439
fuel 9,144 95,071 98 104,313
freight 2,265 98,399 1,029 101,693
Employee profit sharing - 106,347 - 106,347
Store opening expenses - - 109,296
Telephone - 52,217 60,198 112,415
Messaging - 9,145 61,500 70,645
Travel expenses 3,571 104,696 25,551 133,818
Others 79,856 446,988 646,662 1,173,506
23,791,122 8,644,931 1,841,820 34,277,873
Depreciation 27,645 604,476 28,060 660,181
$ 23,818,767 $ 9,249,407 $ 1,869,880 $ 34,938,054
b. Transactions with related parties, carried out in the ordinary course of business are as follows:
2012 2011
Sales-
Radiomóvil Dipsa, S.A. de C.v. $ 52,250 $ 37,576
Seguros Inbursa, S.A. 28,439 23,150
grupo Técnico de Servicios, S.A. de C. v. 23,717 22,459
Banco Inbursa, S.A. 14,615 5,532
Teléfonos de México, S.A.B. de C.v. 12,834 25,589
Inversora Bursátil, S.A. de C.v. 7,857 7,897
Nacobre Servicios Administrativos, S.A. de C.v. 6,612 2,322
Promotora del Desarrollo de América Latina, S.A. de C.v. 2,334 5,992
Nacional de Cobre, S.A. de C.v. 1,296 5,741
Sales (others) 60,847 28,983
Total $ 210,801 $ 165,241
Interest received $ - $ 3,106
Leases granted -
Administradora y Operadora de Estacionamientos Ideal, S.A. de C.v. $ 13,927 $ 5,614
Radiomóvil Dipsa, S.A. de C.v. 12,701 11,080
Teléfonos de México, S.A.B. de C.v. 8,583 7,256
Microm, S.A. de C.v. 5,271 4,732
Banco Inbursa, S.A. 4,463 2,766
Leases granted (others) 1,214 147
Total $ 46,159 $ 31,595
Services income-
Radiomóvil Dipsa, S.A. de C.v. $ 115,164 $ 92,200
Patrimonial Inbursa, S.A. 13,209 13,059
América Móvil, S.A.B. de C.v. 9,958 -
Teléfonos de México, S.A.B. de C.v. 8,650 9,835
Banco Inbursa, S.A. 8,195 12,525
Seguros Inbursa, S.A. 3,577 1,226
Promotora de Desarrollo de América Latina 3,136 -
Services (others) 6,613 6,487
Total $ 168,502 $ 135,332
gain on sale of fixed assets $ 1,049 $ 2,656
Inventories purchases
Radiomóvil Dipsa, S.A. de C.v. $ (1,146,044) $ (1,077,253)
Sears Brands Management Corporation (210,126) (182,808)
Phillips Morris de México, S.A. de C.v. (125,780) (129,080)
América Móvil, S.A. de C.v. (319,185) (323,108)
Inventories purchases (others) (54,634) (73,689)
Total $ (1,855,769) $ (1,785,938)
Insurance expenses $ (40,234) $ (21,517)
Lease expenses -
Inmuebles Srom, S.A. de C.v. $ (150,031) $ (149,141)
Inmose, S.A. de C.v. (69,460) (63,317)
Inmuebles general, S.A. de C.v. (59,410) (51,373)
Bienes Raíces de Acapulco, S.A. de C.v. (49,477) (41,715)
Desarrollos Sagesco, S.A. de C.v. (29,842) (24,892)
Bajasur, S.A. de C.v. (24,561) (28,782)
Rental expense (others) (92,029) (75,137)
Total $ (474,810) $ (434,357)
Interest expenses $ (6,065) $ (14,123)
Services expenses -
Teléfonos de México, S.A.B. de C.v. $ (197,548) $ (300,589)
Sears Brands Management Corporation (211,388) (193,876)
Banco Inbursa, S.A. (10,994) (28,025)
Editorial Contenido, S.A. de C.v. (15,828) (8,560)
Seguros Inbursa, S.A. (5,664) (25,085)
Inventories purchases (others) (34,675) (29,666)
Total $ (476,097) $ (585,801)
Other expenses, net $ (92,643) $ (58,598)
fixed asset purchase $ (36,604) $ (96,148)
60 Grupo SanbornS Annual Report 2012 61

a. Income taxes consist of the following:
2012 2011
ISR:
Current $ 1,602,693 $ 1,274,274
Deferred (278,113) (10,319)
$ 1,324,580 $ 1,263,955
b. The main items originating a deferred ISR liability at December 31, 2012 and December 31 and January 1, 2011 are:
deCember 31, 2012
deCember 31, 2011
JaNuary 1, 2011
Deferred tax (asset) liability:
Property, machinery and equipment $ 1,566,141 $ 1,377,644 $ 1,432,877
Inventories 126,317 228,516 257,934
Accounts receivables in installment sales 276,560 340,948 389,160
Accrued expenses (716,230) (695,705) (632,804)
Employee benefits 220,959 241,299 220,098
Others (64,270) (41,305) (132,219)
Deferred ISR due to temporary differences 1,409,477 1,451,397 1,535,046
Tax loss carryforwards (37,130) (44,200) (57,715)
Asset tax (900) (987) (987)
Effect of changes in statutory tax rate (210,254) 36,640 (11,828)
Deferred income tax liability $ 1,161,193 $ 1,442,850 $ 1,464,516
c. A reconciliation of the deferred income tax liability is shown below:
2012 2011
Beginning balance $ 1,442,850 $ 1,464,516
Income tax applied to period results (278,113) (10,319)
Others (3,544) (11,347)
Closing balance $ 1,161,193 $ 1,442,850
d. The reconciliation of income tax statutory rate and the effective rate expressed as a percentage of income
before income taxes is as follows:
2012 % 2011 %
Statutory rate 30 30
Add (deduct) permanent differences -
Nondeductible expenses 1 1
Inflation effects (2) (1)
Effective rate 29 30
e. Benefits from restated tax loss carry forwards for which a deferred ISR asset has been recognized can be recovered by fulfilling certain requirements. The amount of tax loss carryforwards for all of the Entity’s subsidiaries and their related expiration dates as of December 31, 2012 are as follows:
expiratioN date amouNt
2016 $ 312
2017 286
2018 82,912
2019 722
2020 and thereafter 39,533
$ 123,765
2011
CoNCeptCost
of sales
sales aNd developmeNt
expeNsesadmiNistrative
expeNsestotal
expeNsess
wages and salaries $ 6,940 $ 2,276,090 $ 500,388 $ 2,783,418
Merchandise 21,660,846 - - 21,660,846
Royalties - 193,876 - 193,876
Advertising 1,716 320,881 16 322,613
Insurance 3,058 72,356 5,166 80,580
Employee benefits - 1,747,692 242,403 1,990,095
Leases - 997,659 55,661 1,053,320
Electricity - 597,831 9,375 607,206
Maintenance - 347,300 37,717 385,017
Safety and security - 101,905 5,488 107,393
Cleaning accessories - 140,415 - 140,415
Suppliers - 89,559 17,622 107,181
Securities collectors - 65,470 - 65,470
water - 99,915 2,098 102,013
Taxes and duties - 64,568 22,901 87,469
fuel - 89,047 197 89,244
freight - 90,109 878 90,987
Employee profit sharing - 96,375 - 96,375
Store opening expenses - 62,644 74,257 136,901
Telephone - 42,194 57,921 100,115
Messaging - 5,010 56,656 61,666
Travel expenses - 74,287 25,162 99,449
Others 70,211 427,192 764,448 1,261,851
21,742,771 8,002,375 1,878,354 31,623,500
Depreciation 31,141 559,268 24,272 614,681
$ 21,773,912 $ 8,561,643 $ 1,902,626 $ 32,238,181
23. Income tAXesIncome tax (ISR) is calculated based on the taxable profit which differs from accounting net income reported in the consolidated statement of comprehensive income due to income or expenses taxable or nontaxable in other periods as well as items that will never be deductible or taxable. Income tax liability is calculated based on the enacted or substantially enacted tax rate at the end of the reporting period for in the jurisdictions in which the Entity and its subsidiaries are located.
The Entity is subject to ISR and IETu.
The ISR rate is 30% for 2010 to 2012 and will decrease to 29% in 2013 and 28% for 2014. The Entity pays ISR, together with grupo Carso, S. A. B. de C. v. on a consolidated basis.
IETu - Revenues, as well as deductions and certain tax credits, are determined based on cash flows of each fiscal year. Beginning in 2010, the IETu rate is 17.5%. In addition, as opposed to ISR, the parent and its subsidiaries will incur IETu on an individual basis.
Income tax incurred will be the higher of ISR and IETu.
Based on its financial projections, the Entity determined that it will basically pay ISR, therefore, it only recognizes deferred ISR. As of December 31, 2012 and December 31 and January 1, 2011 neither the Entity, nor its subsidiaries incurred IETu.
62 Grupo SanbornS Annual Report 2012 63

26. segment InfoRmAtIonInformation reported to the chief operating decision maker for purposes of resource allocation and assessment of segment performance is based on the reportable segments as presented below.
a. Information by operating segment is as follows:
2012
sears aNd boutiques saNborNs
mixup aNd ishop
others aNd elimiNatioNs
total CoNsolidated
Total revenue $ 20,382,975 $ 12,535,064 $ 4,281,425 $ 2,211,823 39,411,287
EBITDA (1) 2,781,301 1,174,955 262,918 1,006,529 5,225,703
Consolidated net income 1,709,639 545,442 150,323 758,771 3,164,175
Interest income 29,209 106,035 11,440 53,158 199,842
Interest expense 119,083 97,466 2,969 (21,278) 198,240
Depreciation 277,666 280,884 56,149 45,482 660,181
Income taxes 694,955 260,403 84,832 284,390 1,324,580
Total assets 16,011,165 8,723,285 2,079,309 4,387,758 31,201,517
Current liabilities 8,515,884 4,040,131 1,248,962 1,006,557 14,811,534
Long-term liabilities 488,289 368,674 20,476 283,754 1,161,193
Total liabilities 9,004,173 4,408,805 1,269,201 1,290,548 15,972,727
Capital expenditures 391,004 267,711 21,539 68,637 748,891
2011
sears aNd boutiques saNborNs
mixup aNd ishop
others aNd elimiNatioNs
total CoNsolidated
Total revenue $ 18,753,753 $ 11,858,017 $ 3,664,282 $ 2,139,905 36,415,957
EBITDA (1) 2,657,084 1,103,762 174,732 980,948 4,916,526
Consolidated net income 1,554,899 622,221 76,943 650,297 2,904,360
Interest income 4,129 121,972 8,934 42,976 178,011
Interest expense 88,827 108,979 3,003 (858) 199,951
Depreciation 244,753 272,644 51,555 45,729 614,681
Income taxes 719,040 237,938 76,174 230,803 1,263,955
Total assets 15,462,223 8,927,231 1,632,582 3,933,982 29,956,018
Current liabilities 6,837,819 3,208,478 906,243 (831,792) 10,120,748
Long-term liabilities 662,024 445,463 18,170 317,193 1,442,850
Total liabilities 7,499,483 3,653,941 924,413 (514,239) 11,563,598
Capital expenditures 662,548 424,599 26,066 112,086 1,225,299
1) (1) EBITDA reconciliation
deCember 31, 2012
deCember 31, 2011
Income before income taxes $ 4,622,478 $ 4,215,136
Depreciation 660,181 614,681
Interest income (199,842) (178,011)
Interest expense 198,240 199,951
Exchange (gain) loss (10,220) 57,441
Effects of valuation of derivative financial instruments (45,134) 7,328
EBITDA $ 5,225,703 $ 4,916,526
b. general information of segments by geographical area:
The Entity operates in different locations and has distribution channels in Mexico and Central America through its commercial offices or representatives. geographic distribution of revenues is as follows:
deCember 31, 2012 %
deCember 31, 2011 %
México $ 38,976,388 98.90 $ 36,015,839 98.90
El Salvador 324,356 0.82 302,952 0.83
Panamá 110,543 0.28 97,166 0.27
$ 39,411,287 100.00 $ 36,415,957 100.00
24. commItmentsa. As of December 31, 2012, contracts were executed with suppliers for the renovation and construction of
certain of the Entity’s stores. The related commitment amount is approximately $1,150,790.
b. Similarly, as of December 31, 2012, the Entity and its subsidiaries have executed lease agreements in 302 stores (Sears, Saks, Sanborn hermanos, Sanborn’s - Café, Mix-up, Discolandia, I Shop, Comercializadora Dax, Corpti and Sanborns Panama). Such lease agreements are for mandatory terms ranging from one to 20 years. Lease expense for the years ended December 31, 2012 and 2011 was $1,200,031 and $1,110,631, respectively; additionally, as a lessor the Entity and its subsidiaries have executed contracts for terms ranging from one to 15 years; the lease income for the years ended December 31, 2012 and 2011 was $242,839 and $219,272, respectively.
• future minimum lease payments payable by the Entity are as follows:
maturitydeCember 31,
2012
1 year $ 289,9841 to 5 years 1,214,782More than 5 years 2,055,020
$ 3,559,786
• future minimum lease payments receivable by the Entity are as follows:
maturitydeCember 31,
2012
1 year $ 14,4101 to 5 years 115,728More than 5 years 138,031
$ 268,169
c. In December 2010, Sears Operadora México, S.A. de C.v. (formerly Sears Roebuck de México, S.A. de C.v. or (“Sears”) and Sears Roebuck and Co. (Sears uS), extended the current terms of the Brand use License Agreement and the Advice and Merchandise Sales agreements, which govern the commercial relationship among the parties and under which Sears pays royalties to Sears uS of 1% of sales. The agreement will be in effect until September 30, 2019, but provides for a seven-year extension under the same conditions, unless otherwise decided by either party, which must then give two years’ notice to the other party.
d. Through an agreement executed on September 12, 2006, the Entity agreed to pay, to Saks fifth Avenue, amounts for consulting services and the brand use license for an initial term of 15 years, renewable for 10 years. The agreement establishes a minimum annual payment of uS$500 and allows the use of the Saks fifth Avenue brand name both in its corporate name and in its stores.
25. contIngencIesAt the date of these financial statements the Entity is involved in legal proceedings pending resolution by the competent authorities related to various matters, primarily contributions from foreign trade, collection recovery and labor claims.
The aggregate amount of these proceedings as of December 31, 2012 amounts to $873,506, of which a liability of $112,700 has been recorded in other liabilities in the consolidated statements of financial position. The Entity disbursed approximately $22,100 for these purposes during 2012. while the results of these legal proceedings cannot be predicted with certainty, management of the Entity does not believe that there are any legal proceedings which, if determined adversely to the Entity, would have a material adverse effect on its financial position or results of operations.
64 Grupo SanbornS Annual Report 2012 65
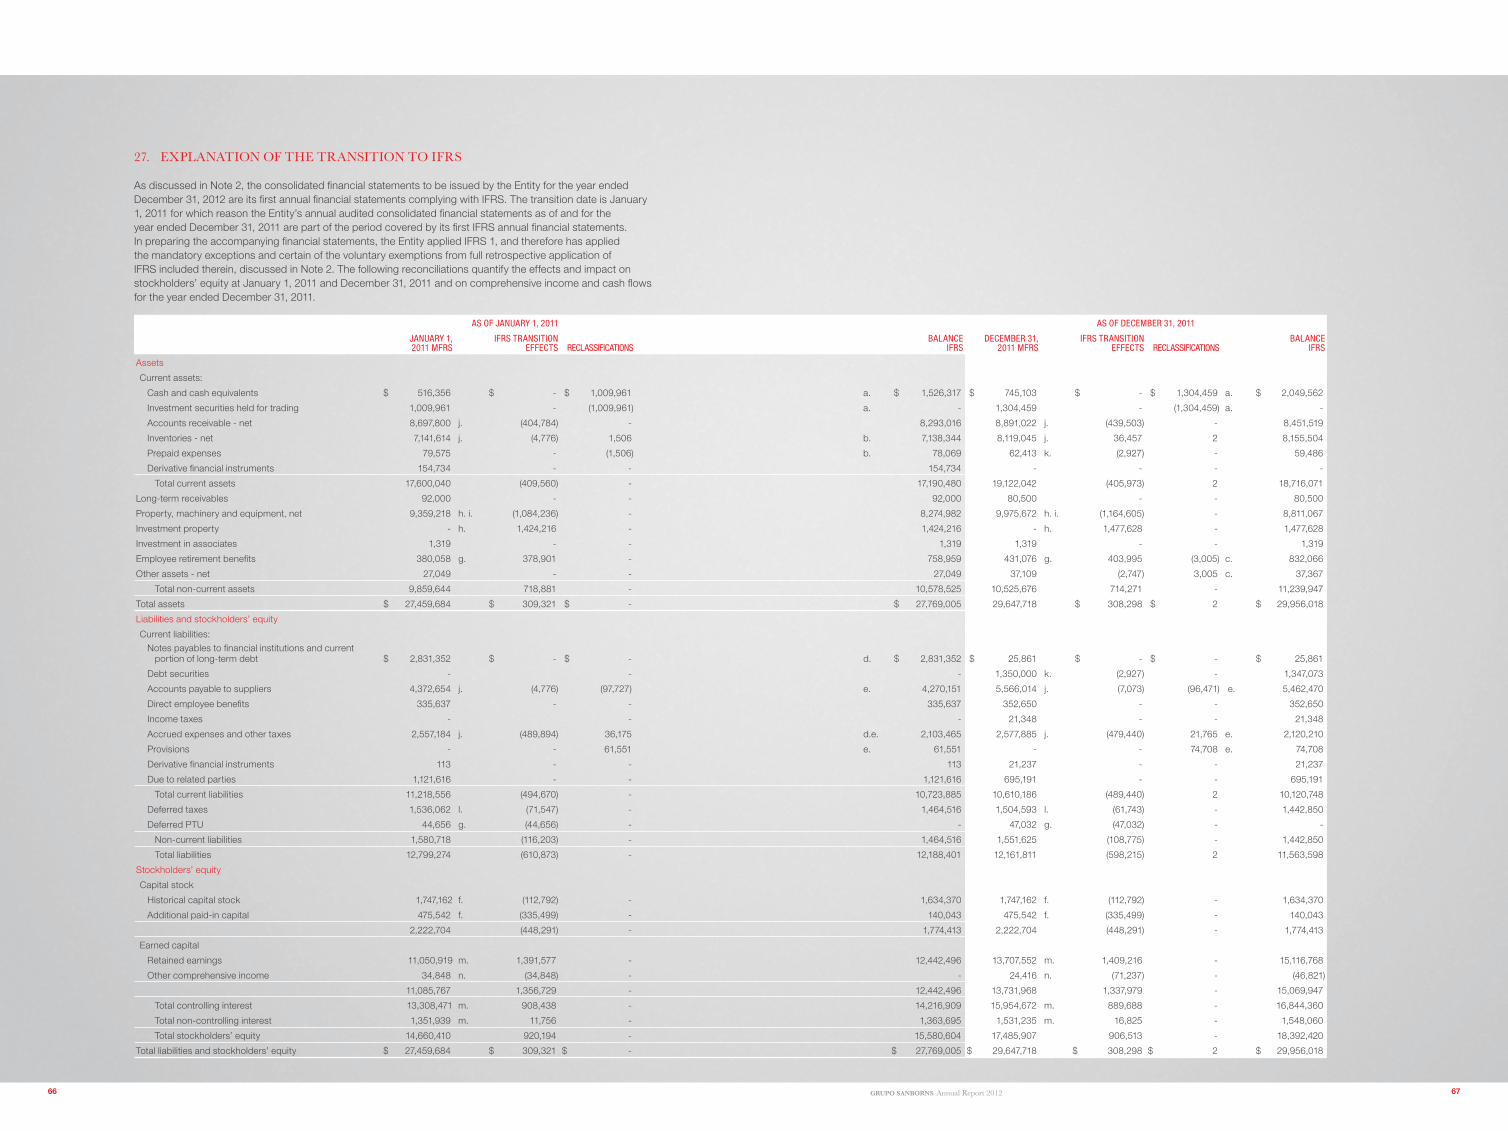
27. eXplAnAtIon of the tRAnsItIon to IfRs
As discussed in Note 2, the consolidated financial statements to be issued by the Entity for the year ended December 31, 2012 are its first annual financial statements complying with IfRS. The transition date is January 1, 2011 for which reason the Entity’s annual audited consolidated financial statements as of and for the year ended December 31, 2011 are part of the period covered by its first IfRS annual financial statements. In preparing the accompanying financial statements, the Entity applied IfRS 1, and therefore has applied the mandatory exceptions and certain of the voluntary exemptions from full retrospective application of IfRS included therein, discussed in Note 2. The following reconciliations quantify the effects and impact on stockholders’ equity at January 1, 2011 and December 31, 2011 and on comprehensive income and cash flows for the year ended December 31, 2011.
as of JaNuary 1, 2011 as of deCember 31, 2011
JaNuary 1, 2011 mfrs
ifrs traNsitioN effeCts reClassifiCatioNs
balaNCeifrs
deCember 31, 2011 mfrs
ifrs traNsitioN effeCts reClassifiCatioNs
balaNCeifrs
Assets
Current assets:
Cash and cash equivalents $ 516,356 $ - $ 1,009,961 a. $ 1,526,317 $ 745,103 $ - $ 1,304,459 a. $ 2,049,562
Investment securities held for trading 1,009,961 - (1,009,961) a. - 1,304,459 - (1,304,459) a. -
Accounts receivable - net 8,697,800 j. (404,784) - 8,293,016 8,891,022 j. (439,503) - 8,451,519
Inventories - net 7,141,614 j. (4,776) 1,506 b. 7,138,344 8,119,045 j. 36,457 2 8,155,504
Prepaid expenses 79,575 - (1,506) b. 78,069 62,413 k. (2,927) - 59,486
Derivative financial instruments 154,734 - - 154,734 - - - -
Total current assets 17,600,040 (409,560) - 17,190,480 19,122,042 (405,973) 2 18,716,071
Long-term receivables 92,000 - - 92,000 80,500 - - 80,500
Property, machinery and equipment, net 9,359,218 h. i. (1,084,236) - 8,274,982 9,975,672 h. i. (1,164,605) - 8,811,067
Investment property - h. 1,424,216 - 1,424,216 - h. 1,477,628 - 1,477,628
Investment in associates 1,319 - - 1,319 1,319 - - 1,319
Employee retirement benefits 380,058 g. 378,901 - 758,959 431,076 g. 403,995 (3,005) c. 832,066
Other assets - net 27,049 - - 27,049 37,109 (2,747) 3,005 c. 37,367
Total non-current assets 9,859,644 718,881 - 10,578,525 10,525,676 714,271 - 11,239,947
Total assets $ 27,459,684 $ 309,321 $ - $ 27,769,005 29,647,718 $ 308,298 $ 2 $ 29,956,018
Liabilities and stockholders’ equity
Current liabilities:
Notes payables to financial institutions and current portion of long-term debt $ 2,831,352 $ - $ - d. $ 2,831,352 $ 25,861 $ - $ - $ 25,861
Debt securities - - - 1,350,000 k. (2,927) - 1,347,073
Accounts payable to suppliers 4,372,654 j. (4,776) (97,727) e. 4,270,151 5,566,014 j. (7,073) (96,471) e. 5,462,470
Direct employee benefits 335,637 - - 335,637 352,650 - - 352,650
Income taxes - - - 21,348 - - 21,348
Accrued expenses and other taxes 2,557,184 j. (489,894) 36,175 d.e. 2,103,465 2,577,885 j. (479,440) 21,765 e. 2,120,210
Provisions - - 61,551 e. 61,551 - - 74,708 e. 74,708
Derivative financial instruments 113 - - 113 21,237 - - 21,237
Due to related parties 1,121,616 - - 1,121,616 695,191 - - 695,191
Total current liabilities 11,218,556 (494,670) - 10,723,885 10,610,186 (489,440) 2 10,120,748
Deferred taxes 1,536,062 l. (71,547) - 1,464,516 1,504,593 l. (61,743) - 1,442,850
Deferred PTu 44,656 g. (44,656) - - 47,032 g. (47,032) - -
Non-current liabilities 1,580,718 (116,203) - 1,464,516 1,551,625 (108,775) - 1,442,850
Total liabilities 12,799,274 (610,873) - 12,188,401 12,161,811 (598,215) 2 11,563,598
Stockholders’ equity
Capital stock
historical capital stock 1,747,162 f. (112,792) - 1,634,370 1,747,162 f. (112,792) - 1,634,370
Additional paid-in capital 475,542 f. (335,499) - 140,043 475,542 f. (335,499) - 140,043
2,222,704 (448,291) - 1,774,413 2,222,704 (448,291) - 1,774,413
Earned capital
Retained earnings 11,050,919 m. 1,391,577 - 12,442,496 13,707,552 m. 1,409,216 - 15,116,768
Other comprehensive income 34,848 n. (34,848) - - 24,416 n. (71,237) - (46,821)
11,085,767 1,356,729 - 12,442,496 13,731,968 1,337,979 - 15,069,947
Total controlling interest 13,308,471 m. 908,438 - 14,216,909 15,954,672 m. 889,688 - 16,844,360
Total non-controlling interest 1,351,939 m. 11,756 - 1,363,695 1,531,235 m. 16,825 - 1,548,060
Total stockholders’ equity 14,660,410 920,194 - 15,580,604 17,485,907 906,513 - 18,392,420
Total liabilities and stockholders’ equity $ 27,459,684 $ 309,321 $ - $ 27,769,005 $ 29,647,718 $ 308,298 $ 2 $ 29,956,018
66 Grupo SanbornS Annual Report 2012 67

l. According to IAS 12, Income Taxes, the Entity recalculated deferred taxes by utilizing the carrying values of assets and liabilities valued based on their IfRS amounts. Additionally, under IAS 12, deferred tax liabilities are recognized for all taxable temporary differences, except to the extent that such deferred tax liability arises from the initial recognition of goodwill. The adjustment hereon also eliminates the deferred tax liability recognized under MfRS for the initial recognition of goodwill in a business acquisition in 1999.
m. At January 1, 2011, all the adjustments derived from the adoption of IfRS were recorded in retained earnings, with the respective effects recognized within noncontrolling interest.
n. The Entity elected to reset all translation effects of foreign operations to zero, as permitted by IfRS 1 and as discussed in Note 2.
Effects of adopting IfRS in the consolidated statements of comprehensive income are as follows:
mfrsifrs adoptioN adJustmeNts reClasifiCatioNs total ifrs
Total revenue $ 37,044,327 a,b.c, $ (628,370) $ 36,415,957
Cost of sales 22,567,948 a,b.d,f (794,036) 21,773,912
14,476,379 165,666 14,642,045
Sales and development expenses 7,662,084 a.e,f.h. 334,624 5,667 8,002,375
Administrative expenses 1,717,294 a.e,f.h. 70,352 90,708 1,878,354
Depreciation 491,171 f. 92,368 583,539
Other (income) expenses 25,855 g. (53,548) (96,375) (124,068)
Interest expense 419,333 e.h. (272,703) 53,321 199,951
Interest income (74,139) e.h. (50,551) (53,321) (178,011)
Exchange loss (gain) 64,769 (7,328) 57,441
Effects of valuation of derivative financial instruments - 7,328 7,328
Income before income taxes 4,170,012 45,124 4,215,136
Income taxes 1,243,581 i. 20,374 1,263,955
Consolidated net income for the year 2,926,431 24,750 2,951,181
Other comprehensive income
foreign currency translation effects (10,344) (88) (10,432)Non controlling interest consolidated
net income - (36,389) (36,389)Consolidated comprehensive income
for the year $ 2,916,087 $ (11,727) $ 2,904,360
notes to reconciling items to IFrS on the statements of comprehensive income:a. According to IAS 18, Revenue, sales generated under the “interest-free installment sales” scheme must be
recognized at their discounted value to separate the financing component of the sale; subsequently, the Entity recognizes financing revenue over the period in which it receives payment for the goods, using the effective interest method. In addition, the Entity seeks a discount on the cost of products sold under this scheme; accordingly, the value of the inventory, related cost of sales and accrued expenses or payable related to the purchase of these goods is adjusted to reflect these discounts.
b. under IfRIC 13, Customer Loyalty Programs, the fair value of the payment received for the initial sale must be allocated between the sale of the good or service and the value of the customer loyalty program component. Consequently, the Entity reclassified the provision for the deferred revenue related to the customer loyalty program component from cost of sales to be presented as an adjustment to revenue.
c. According to IAS 18, Revenues, in those cases in which products sold are permitted to be returned by the customer under the Entity’s return policy, revenues associated with the transaction may only be recognized if expected returns can be reliably estimated. The Entity therefore determined the amount of expected customer returns based on prior experience and other relevant factors, with a corresponding decrease to revenues and the related accounts receivable.
d. IAS 2, Inventories, establishes that the cost of inventory includes all acquisition, conversion and other costs incurred to bring inventories to their condition and location for immediate sale. As this standard does not permit direct costing, the Entity recognized an allocation of distribution center expenses as part of inventory, which had been directly recognized in the cost of sales under NIf.
reclassifications in the statement of financial position.a. Certain of the Entity’s investments in securities for trading purposes meet the criteria as cash equivalents
and have been reclassified to the cash and cash equivalents category.
b. The Entity reclassified spare parts that were presented as prepaid expenses to inventories. Additionally, certain amounts in other assets were reclassified to prepaid expenses.
c. Certain of the Entity’s employee retirement benefits assets were reclassified to other assets.
d. The Entity reclassified interest related to its notes payables, presented within accrued expenses, to the Notes payables to financial institutions and current portion of long-term debt caption.
e. The Entity reclassified certain amounts that were presented as accounts payable to suppliers as provisions
and accrued expenses.
The effects generated by the transition to IfRS are as follows:
f. According to IAS 29, financial Information in hyperinflationary Economies, the effects of inflation are only be recognized in a hyperinflationary economy. An economy is considered hyperinflationary when, among other indicators, the cumulative inflation of the prior three years approximates or exceeds 100%. As the Entity and its main subsidiaries have operated in a non-hyperinflationary economy since 1999, the effects of inflation recognized in conformity with NIf from 1999 until 2007 were eliminated, except for those assets for which the Entity applied the deemed cost exception of IfRS 1, as discussed in Note 2.
g. under IAS 19, Employee Benefits, the provision recorded for employment benefits was recalculated by: i) eliminating the provision for severance indemnities as they do not comply with the recognition criteria for termination benefits established by IAS 19; ii) recognizing the previously unrecognized actuarial losses and gains; and iii) recognizing the previously unrecognized past services costs due to amendments to IAS 19.
Additionally, the provision for deferred PTu was eliminated as it does not meet the definition of an employee benefit under IfRS.
h. According to IAS 40, Investment Property, the two types of real property that meet the criteria as investment property were reclassified from the property, machinery and equipment heading. As an accounting policy, the Entity established the use of the fair value model for the subsequent valuation of its investment properties. Accordingly, the adjustment also includes the revaluation of the properties.
i. In conformity with IAS 16, Property, Plant and Equipment, the Entity determined the most significant components of its real property and equipment; it subsequently adjusted the useful lives of these assets and the respective effect on accumulated depreciation. The Entity also capitalized spare parts and utensils because it expects to use these items for more than one year. These items were formerly recognized as an expense at their acquisition date. Similarly, the Entity incurred certain expenses which did not qualify for capitalization as part of fixed assets under IfRS and were eliminated hereon.
As the Entity opted to apply the deemed cost exception, it utilized historical costs plus inflationary effects at the transition date as its deemed cost for certain assets under the heading of property, plant and equipment.
j. According to IAS 18, Revenue, sales generated under the “interest-free installment sales” scheme must be recognized at their discounted value to separate the financing component of the sale; subsequently, the Entity recognizes financing revenue over the period in which it receives payment for the goods, using the effective interest method. In addition, the Entity seeks a discount on the cost of products sold under this scheme; accordingly, the value of the inventory, related cost of sales and accrued expenses or payable related to the purchase of these goods is adjusted to reflect these discounts.
The adjustment to inventories also contemplates an adjustment with respect to costing of inventories. IAS 2, Inventories, establishes that the cost of inventory includes all acquisition, conversion and other costs incurred to bring inventories to their condition and location for immediate sale. As this standard does not permit direct costing, the Entity recognized an allocation of distribution center expenses as part of inventory, which had been directly recognized in the cost of sales under NIf.
k. under IAS 39, financial Instruments: Recognition and Measurement, financial liabilities are initially recognized at their fair value less the costs directly attributable to the acquisition or issuance of these instruments.
68 Grupo SanbornS Annual Report 2012 69

The Entity intends to use the net proceeds for general corporate purposes, including, among others, to fund the expansion of our store and restaurant network and renovate existing stores and restaurants, increase our working capital, fund our operating needs and, as the case may be, fund our development and expansion plans organically or through acquisitions and repay outstanding indebtedness.
b. On february 13, 2013, grupo Sanborns, S.A.B. de C.v. (grupo Sanborns) successfully carried out its initial public offering, during which it sold its shares, in a combined public offering in Mexico and in other international markets, for a total value of $10,511.4 million, in addition to the exercise of an overallotment option of an additional $837.2 million, which was settled on March 13, 2013.
29. new AccountIng pRIncIplesThe International Accounting Standards Board (IASB) has published a series of new IfRS and amendments to the IAS, which were issued, but had not taken effect at the date of this report:− IfRS 9, financial Instruments, is applicable as of January 1, 2013, although its early application is
permitted. In August 2011, the IASB issued an accounting regulatory proposal entitled IfRS Mandatory Effective Date, which proposes changing the effective date of IfRS 9 from January 1, 2013 to January 1, 2015.
− IfRS 10, Consolidated financial Statements.− IfRS 11, Joint Arrangements.− IfRS 12, Disclosure of Interests in Other Entities.− IfRS 13, fair value Measurement.− IAS 28, Investments in Associates and Joint ventures
IfRS 9 requires that all recognized financial assets within the scope of IAS 39 be subsequently measured based on their applied cost or fair value. More specifically, debt investments in a business model intended to collect contractual cash flows exclusively composed by principal and interest on outstanding principal balances are generally measured according to their applied cost at the end of subsequent accounting periods. All other debt and capital investments are measured based on their fair value at the end of subsequent accounting periods.
In May 2011, a package of four standards involving consolidation, joint arrangements, associates and disclosures, including IfRS 10, IfRS 11, IfRS 12 and IAS 27 (according to the 2011 revision) was issued. The main requirements of these standards are described below:
IfRS 10, Consolidated financial Statements. IfRS 10 replaces the parts of IAS 27, Consolidated and Separate financial Statements, regarding consolidated financial statements. Additionally, Standards Interpretation Committee Interpretation No. 12, Consolidation-Special Purpose Entities, has been withdrawn due to the issuance of IfRS 10. under IfRS 10, control is the only basis for consolidation. furthermore, IfRS 10 includes a new definition of control which contains three elements: (a) power over an investee; (b) exposure or rights to variable returns from involvement with an investee, and (c) the investor’s ability to utilize this power over the investee to affect the amount of the investor’s returns. A large number of guidelines have been added to IfRS 10 to deal with complex scenarios.
IfRS 11, Joint Arrangements. IfRS 11 replaces IAS 31, Interests in Joint ventures. IfRS 11 focuses on the manner in which an arrangement, in which two or more parties exercise joint control, must be classified. under IfRS 11, joint arrangements are classified as joint operations or joint ventures, depending on the rights and obligations of the parties to the arrangements. In contrast, there are three types of joint ventures according to IAS 31: entities under joint control, assets under joint control and operations under joint control. Likewise, according to IfRS 11, joint ventures must be accounted for by using the equity method, while entities under joint control according to IAS 31 can utilize the equity or proportionate consolidation method.
IfRS 12, Disclosure of Interests in Other Entities. IfRS 12 is a disclosure standard applicable to entities holding equity in subsidiaries, joint ventures, associates and/or unconsolidated structured entities. In general terms, the disclosure requirements of IfRS 12 are more extensive than under current standards.
e. under IAS 19, Employee Benefits (revised in 2011), the Entity recalculated the employment benefit provision by: i) eliminating the provision for severance indemnities, as they do not comply with the recognition criteria for termination benefits established by IAS 19; ii) recognizing the previously unrecognized actuarial losses and gains; and iii) recognizing the previously unrecognized past service costs, due to amendments to IAS 19.
f. In conformity with IAS 16, Property, Plant and Equipment, the Entity depreciates fixed assets based on their components under IfRS. Additionally, certain fixed assets were valued at their fair value as of the transition date, thereby affecting the amount of depreciation for the periods presented.
g. The Entity established the use of the fair value model for the subsequent valuation of its investment properties. The adjustment hereon represents the change in the fair value of the investment property during the respective period.
h. Presentation differences: The following reclassifications have been included herein: i) Commissions related to payments with credit card were classified as interest expense under MfRS; under IfRS, such expenses are presented within sales and development expenses; ii) the financing component related to employee benefit obligations and the related assets were classified as sales and development and administrative expenses under MfRS; under IfRS, the Entity has elected to present such amounts within interest expense and interest income.
i. Deferred ISR was recalculated by utilizing accounting bases as adjusted for the effects of IfRS.
Cash flows: The transition to IfRS did not significantly affect the presentation of the Entity’s consolidatedstatement of cash flows. 28. SuBSEquEnT EVEnTSa. On January 29, 2013, at the Entity’s general ordinary and extraordinary shareholders’ meeting, the
following was approved:
i. Commence a public offering of ordinary shares representing the Entity’s fixed capital (i) in Mexico through the Bolsa Mexicana de valores, S.A.B. de C.v., and/or (ii) in the united States under Rule 144A and/or Regulation S of the uS Securities Act of 1933, as amended or any other applicable regulations, and in other foreign markets according to applicable laws, as necessary or deemed appropriate.
ii. That Offering would be held according to the periods, terms and conditions determined by the Offering Representatives based on the level of supply and demand, the conditions in effect in the stock markets at the placement date and any other relevant factors.
iii. Carry out a stock split of shares representing the Entity’s common stock by issuing two new shares for each current outstanding share, without affecting the value of the Entity’s capital stock.
iv. Increase the minimum portion of fixed capital without withdrawal rights by $432,308 thousand by issuing up to 432,308,236 ordinary, nominative Series “B-1” shares, whereby the Entity’s authorized minimum fixed capital without withdrawal rights remains at a total amount of up to $1,585,410 thousand, as represented by a total of up to 2,382,000,000 ordinary, nominative Series “B-1” shares after giving effect to the stock split. All the shares subject to this increase will be included for placement in the Offering based on the price per share determined by the Offering Representatives; any unsubscribed shares will be held by the treasury.
v. Amend the Entity’s corporate bylaws to comply with the requirements established by the National Banking and Securities Commissions (CNBv), provided that the Entity’s new corporate bylaws will take effect for general purposes as of the present date, albeit except for the articles regarding the Entity’s corporate name as a “public stock Entity”, which will take effect when the shares representing its common stock are registered with the National Securities Registry maintained by the CNBv.
70 Grupo SanbornS Annual Report 2012 71

IfRS 13, fair value Measurement. IfRS 13 establishes a single body of guidelines for fair value measurements and the respective disclosures. This standard defines fair value, establishes its measurement framework and requires disclosures regarding these measurements. The scope of IfRS 13 is extensive because it is applicable to both financial instrument items and non-financial instrument items for which other IfRS require or permit fair value measurements and disclosures about fair value measurement. In general terms, the disclosure requirements of IfRS 13 are more extensive than under current standards.
These standards apply to years beginning on or after January 1, 2013. Earlier application is permitted provided that such standards are applied early at the same time.
The Entity is currently evaluating the impacts of adopting these standards in its consolidated financial information.
30. AuthoRIzAtIon to Issue the fInAncIAl stAtements
On March 15, 2013, the issuance of the accompanying consolidated financial statements were authorized by the Entity’s Chief financial Officer Lic. Mario Bermudez Dávila. Consequently, they do not reflect events that may have occurred after that date and are subject to the approval of the Entity’s Board of Directors and at the Stockholders’ Ordinary general Meeting, where they may be amended, based on the relevant provisions of the Mexican general Corporate Law.
72

Grupo SanbornS iS a leadinG retail company in mexico with a unique, multi-format portfolio that includeS department StoreS, technoloGy and electronicS StoreS, convenience StoreS, luxury StoreS, and reStaurantS, featurinG biG-name brandS Such aS SearS, SanbornS, iShop-mixup, edumac, dax, SanbornS café and SakS fifth avenue. Grupo SanbornS operateS 418 StoreS, totalinG almoSt a million Square meterS in SaleS area, in 53 citieS in mexico. we offer a broad value propoSition to our cuStomerS, which include 2.8 million cardholderS.
investor relations
contact:Angélica Piña Garnica
internet websitesFor more information about Grupo Sanborns
please visit the following webpages:
www.sanborns.com.mx
www.sears.com.mx
www.ishopmixup.com
the company’s headquarters are located at:Lago Zurich No. 245
Presa Falcón Building
Seventh Floor, Plaza Carso,
Ampliación Granada
Mexico City, 11529
share information:Grupo Sanborns shares trade in the Mexican
Stock Exchange under the ticker symbol: GSANBOR
This Report contains forward-looking statements and projections. By their nature, the forward-looking statements and projections involve inherent uncertainties and risks, both general and specific, and there is a risk that the predictions, forecasts, projections and other forward-looking statements will not be achieved. Although we believe the plans, intentions and expectations reflected in or suggested by such forward-looking statements are reasonable, we can not ensure that such plans, intentions and expectations will be achieved.Additionally, the potential investors shall not construe statements made in connection with past trends or activities as an assurance that such trends or activities will continue in the future.
dowload the annual report application to your ipad®
Des
ign:
ww
w.x
des
ign.
com
.mx
P
rint:
Ear
thco
lor,
Hou
ston
to acceSS the multimedia materialS for the annual report on your Smart phone or tablet, follow theSe Simple StepS...
1. Scan thiS qr code 3. that’S it! now Simply click on the paGeS with thiS loGo:
2. download the app
2.20 trees preserved
798.57 gallons of water saved
379.19 lb of greenhouse gases reduced and/or offset
1.53 million BTU’s energy not consumed
This report was printed on Earthaware paper, FSC® certified, elemental chlorine and acid-free
All efforts are important, and although the press run of this Annual Report is relatively small, we reiterate our commitment to the environment by using environmentally-safe materials.The following are savings resulting from the use of recycled fiber in this project:

www.gsanborns.com.mx
ann
ual r
epor
t 201
2G
ru
po
Sa
nb
or
nS
annualreport 2012