annual agricultural survey report 2019 traditional sector
TRANSCRIPT
ANNUAL AGRICULTURAL SURVEY REPORT 2019TRADITIONAL SECTOR
Private Bag 0024, Gaborone Tel: 3671300 Fax: 3952201 Toll Free: 0800 600 200
Private Bag F193, City of Francistown Botswana Tel. 241 5848, Fax. 241 7540
Private Bag 32 GhanziTel: 371 5723 Fax: 659 7506
Private Bag 47MaunTel: 371 5716 Fax: 686 4327
E-mail: [email protected] Website: http://www.statsbots.org.bw

ANNUAL AGRICULTURAL SURVEY REPORT 2019TRADITIONAL SECTOR
Published by
Statistics BotswanaPrivate Bag 0024, GaboronePhone: (267) 3671 300Fax: (267) 3952 201Email: [email protected] Website: www.statsbots.org.bw
Contact Unit:
Agricultural Statistics SectionStatistics BotswanaPrivate Bag 0024, GaboroneTelephone: (267) 3671 300Fax: (267) 3952201
ISBN: 978-99968-482-8-5 (e-book)
November 2020
COPYRIGHT RESERVED
Extracts may be published ifSource is duly acknowledged
Statistics Botswana ANNUAL AGRICULTURAL SURVEY REPORT 2019
TRADITIONAL SECTORANNUAL AGRICULTURAL SURVEY REPORT 2019
TRADITIONAL SECTORI
PREFACEThis report presents the 2019 Annual Agricultural Survey results. The survey is part of a series of household surveys carried out by Statistics Botswana through the Agricultural Statistics Unit (ASU) and in collaboration with the Department of Agricultural Research, Statistics and Policy Development (DARSPD) of the Ministry of Agricultural Development and Food Security.
The aim of the agricultural surveys is to provide time series data on key production indicators in the livestock and crop sub-sectors for evidence-based decision-making, development planning as well as to monitor and evaluate Government development programmes and projects.
I wish to acknowledge all those who contributed to the successful completion of this survey. In particular, I would like to thank the Ministry of Agricultural Development and Food Security for their partnership in this exercise and farmers for their invaluable time and cooperation to provide data to our enumerators. For more information and further enquires, contact the Directorate of Stakeholder Relations at 3671300. All Statistics Botswana outputs/publications are available on the website at www.statsbots.org.bw and at Statistics Botswana Library (Head-Office, Gaborone).
__________________Dr. Burton S. MguniStatistician GeneralNovember 2020
ANNUAL AGRICULTURAL SURVEY REPORT 2019TRADITIONAL SECTOR II Statistics Botswana
LIST OF AGRONYMSALDEP – Arable Land Development PolicyASU – Agriculture Statistics UnitCSPro – Census and Surveys Processing SystemDARSPD – Department Agricultural Research, Statistics & Policy DevelopmentEER – Establishment and Enterprise Register GDP – Gross Domestic ProductIMPS – Integrated Microcomputer Processing SystemISPAAD – Integrated Support Programme for Arable Agriculture Development LIMID – Livestock Management and Infrastructure DevelopmentMoA – Ministry of Agricultural Development and Food Security MFDP – Ministry of Finance and Development PlanningNAMPAADD – National Master Plan for Arable Agriculture and Dairy DevelopmentSLOCA – Services to Livestock Owners in Communal AreasStatsBots – Statistics BotswanaTGLP – Tribal Grazing Land Policy
Statistics Botswana ANNUAL AGRICULTURAL SURVEY REPORT 2019
TRADITIONAL SECTORANNUAL AGRICULTURAL SURVEY REPORT 2019
TRADITIONAL SECTORIII
TABLE OF CONTENTSPREFACE...........................................................................................................................................................................ILIST OF ACRONYMS........................................................................................................................................................II
TABLE OF CONTENTS.......................................................................................................................................................IIIEXECUTIVE SUMMARY……………..................……….……………………………………………………............................VICHAPTER 1: INTRODUCTION…………………………………………………………………………………...........................1CHAPTER 2: ANALYSIS OF RESULTS..................................................................................................................................1CHAPTER 3: CONCLUSION...............................................................................................................................................12
TIME SERIES DATA TABLESTable 1.1 Livestock Population Trends (Traditional & Commercial): (‘000)...........................................................14Table 1.2 Cattle Production Indicator Trends: Births, Deaths and Offtake Rates (%)...........................................15Table 1.3 Goats Production Indicator Trends: Births, Deaths and Offtake Rates (%)............................................16Table 1.4 Sheep Production Indicator Trends: Births, Deaths and Offtake Rates (%)..........................................17Table 1.5 Traditional Sector: Area Planted Trends (‘000 Hectares) By Crop..........................................................18Table 1.6 Traditional Sector: Area Harvested Trends (‘000 Hectares) By Crop......................................................19Table 1.7 Total Production Trends (Metric Tonnes) - (Commercial and traditional) By Crop................................20Table 1.8 Traditional Sector: Yield per Hectare Planted (KG/HA) Trends By Crop...............................................21
ANNUAL AGRICULTURAL SURVEYS SUMMARY TABLESTable 2.1 Summary of Traditional and Commercial Sectors Livestock Statistics....................................................23Table 2.2 Summary of Traditional and Commercial Sectors Crop Statistics..........................................................24Table 2.3 Traditional: land, Crop, Cattle, Goats and Sheep Holdings by District.................................................25
HOLDERS AND THEIR CHARACTERISTICS: TRADITIONAL SECTOR:Table 3.1 Number of Holders by Gender and District............................................................................................... 27Table 3.2 Number of Holders by Marital Status and District .................................................................................28Table 3.3 Number of Male Holders by Marital Status and District........................................................................28Table 3.4 Number of Female Holders by Marital Status and District.....................................................................29Table 3.5 Number of Holders by Age Group and District.......................................................................................29Table 3.6 Number of Holders by Type of Holding Operation and District.............................................................30Table 3.7 Number of Holdings by Holders’ Status and District.................................................................................30Table 3.8 Number of Holdings by Access to Weather Forecast Information and utilization status & District....31Table 3.9 Number of Holdings by Awareness to Climate Change & District..........................................................31Table 3.10 Number of Holdings by Type of Climate Change Over the Years & District.......................................32Table 3.11 Number of Holdings by Reliable Water Source for Livestock Watering and District...........................32Table 3.12 Number of Holdings by Ownership of Livestock Water Supply and District.........................................33Table 3.13 Number of Holdings by Borehole Source of Energy and District...........................................................33Table 3.14 Number of Holdings by Livestock Feeds status and District ................................................................34Table 3.15 Number of Holdings by Cattle Vaccination and District.......................................................................34Table 3.16 Number of Holdings by Type of Cattle Disease Controlled and District..............................................35Table 3.17 Number of Holdings with employed Farm Worhers by District..............................................................35Table 3.18A Number of Farm Workers by Marital Status, Gender and District ......................................................36Table 3.18B Number of Farm Workers by Age group and District……………..….……………….............................37Table 3.18C Number of Farm Workers by Education attainment, Gender and District…….…...........................37Table 3.18D Number of Farm Workers by Citizenship, Gender and District….……………….….......................... 38Table 3.19 Number of Farm Workers by Employee Status and District .................................................................39Table 3.20 Number of Farm Workers by Employment Status, Earnings and District.......................................39
ANNUAL AGRICULTURAL SURVEY REPORT 2019TRADITIONAL SECTOR IV Statistics Botswana
TRADITIONAL SECTOR: CATTLE
Table 4.1A Cattle Holdings and Population by Gender and District...............................................................41Table 4.1B Cattle Population by Age Group of Holder and District ...............................................................42Table 4.2A Cattle Herd Composition by District ................................................................................................43Table 4.2B Percentage: Cattle Herd Composition BY District..........................................................................43Table 4.3 Cattle Holdings by Type of Breed and District....................................................................................44Table 4.4 Cattle Population by Type of Breed and District ..............................................................................44Table 4.5A Cattle Inventory (Births, Deaths, Offtake …) by District.................................................................45Table 4.5B Percentage: Cattle Inventory (Births, Deaths, Offtake …) by District..........................................46Table 4.6 Cattle Sales by Various Buyers and District......................................................................................47Table 4.7 Cattle Revenue Received (PULA) by Various Buyers and District....................................................48Table 4.8 Cattle Average Prices (PULA) by Various Buyers and District...........................................................49Table 4.9 Cattle Sales and Revenue Received (PULA) by District....................................................................50Table 4.10 Cattle Purchases and Cost Incurred (PULA) by District..................................................................51Table 4.11 Cattle Holdings by Cattle Breeding Method Used and District.....................................................51
TRADITIONAL SECTOR: SMALL STOCK (GOATS)Table 5.1A Goats Holdings and Population by Gender and District...............................................................53Table 5.1B Goats Holdings by Age Group of Holder and District....................................................................54Table 5.1C Goats Population by Age Group of Holder and District................................................................55Table 5.2 Goats Composition by District ...........................................................................................................55Table 5.3 Goats Population by Type of Breed and District...............................................................................56Table 5.4A Goats Inventory (Births, Deaths, Offtake …) by District ................................................................57Table 5.4B Percentage: Goats Inventory (Births, deaths, Offtake …) by District ..........................................57Table 5.5 Goats Sales and Revenue Received (PULA) by District ..................................................................58Table 5.6 Goats Purchases and Cost Incurred (PULA) by District ...................................................................58
TRADITIONAL SECTOR: SMALL STOCK (SHEEP)Table 5.7A Sheep Holdings and Population by Gender and District .............................................................60Table 5.7B Sheep Holdings by Age group of the Holder by District.................................................................61Table 5.7C Sheep Population by Age group of the Holder by District............................................................61Table 5.8 Sheep Composition by District............................................................................................................62Table 5.9 Sheep Population by Type of Breed and District...............................................................................62Table 5.10A Sheep Inventory (Births, Deaths, Offtake …) by District ..............................................................63Table 5.10B Percentage: Sheep Inventory (Births, Deaths, Offtake …) by District........................................63Table 5.11 Sheep Sales and Revenue Received (PULA) by District ...............................................................64Table 5.12 Sheep Purchases and Cost Incurred (PULA) by District .................................................................64
TRADITIONAL SECTOR: OTHER LIVESTOCKTable 6.1A Donkeys: Total Holdings and Population by Gender and District.................................................66Table 6.1B Mules: Total Holdings and Population by Gender and District......................................................67Table 6.2 Donkeys: Total Sales and Revenue Received (PULA) by District......................................................67Table 6.3 Chickens: Total Holdings and Population by Gender and District...................................................68Table 6.4 Chickens: Total Sales and Revenue Received (PULA) by District ...................................................69Table 6.5 Horses: Total Holdings and Population by Gender and District............................................................70Table 6.6 Horses: Total Sales and Revenue Received (PULA) by District ............................................................70Table 6.7 Pigs: Total Holdings and Population by Gender and District..................................................................71Table 6.8 Pigs: Total Sales and Revenue Received (PULA) by District.................................................................72
Statistics Botswana ANNUAL AGRICULTURAL SURVEY REPORT 2019
TRADITIONAL SECTORANNUAL AGRICULTURAL SURVEY REPORT 2019
TRADITIONAL SECTORV
TRADITIONAL SECTOR: CROP PRODUCTIONTable 7.1 Land Holdings, Land Area (Hectares) & Fields by Gender and District .............................................74Table 7.2 Holdings Planted and Area Planted (Hectares) by Gender and District............................................75Table 7.3 Holdings Harvested & Area Harvested (Hectares) by Gender and District........................................76Table 7.4 Holdings Planted by Type of Crop and District......................................................................................77Table 7.5 Holdings Harvested by Type of Crop and District.................................................................................77Table 7.6 Area Planted (Hectares) by Type of Crop and District.............................................................................78Table 7.7 Area Harvested (Hectares) by Type of Crop and District..................................................................78Table 7.8 Total Production (Metric Tonnes) by Type of Crop and District......................................................79Table 7.9 Yield Per Hectare Planted (KG/HA) by Type of Crop and District................................................79Table 7.10 Yield Per Hectare Harvested (KG/HA) by Type of Crop and District....................................................80Table 7.11A Sorghum Production Disposal (Metric Tonnes) by District...............................................................81Table 7.11B Maize Production Disposal (Metric Tonnes) by District.............................................................81Table 7.11C Pulses Production Disposal (Metric Tonnes) by District.................................................................82Table 7.11D Millet Production Disposal (Metric Tonnes) by District..................................................................82Table 7.11E Water melons Production Disposal (Metric Tonnes) by District.....................................................83Table 7.11F Melons Production Disposal (Metric Tonnes) by District..................................................................83Table 7.11G Sweetreed Production Disposal (Metric Tonnes) by District...........................................................84Table 7.12A Sorghum Quantity Sold (KG) & Revenue Received (PULA) by District ............................................85Table 7.12B Maize Quantity Sold (KG) & Revenue Received (PULA) by District................................................85Table 7.12C Pulses Quantity Sold (KG) & Revenue Received (PULA) by District.................................................86Table 7.12D Millet Quantity Sold (KG) & Revenue Received (PULA) by District............................................86Table 7.12E Watermelons Quantity Sold (KG) & Revenue Received (PULA) by District....................................87Table 7.12F Melons Quantity Sold (KG) & Revenue Received (PULA) by District.............................................87Table 7.12G Sweetreed Quantity Sold (KG) & Revenue Received (PULA) by District...................................88Table 7.12H Land Holdings by Planting Location(molapo, dry land or both) by District...............................88Table 7.13 Land Holdings by Reasons for not Ploughing or Planting and District..............................................89Table 7.14 Holdings Planted by Sources of Seeds and District........................................................................89Table 7.15 Land Holdings by Fencing Status and District................................................................................90Table 7.16 Holdings Planted by Weeding Status and District...........................................................................90Table 7.17 Holdings Planted by Predominant Weeds and District......................................................................91Table 7.18 Holdings by Fertilizer Use Status and District.....................................................................................91Table 7.19 Land Holdings by Type of Soil of Arable Land by District.............................................................92Table 7.20 Holdings Planted By Draught Power Used and District.................................................................92Table 7.21 Holdings Planted by Provision of Draught Power Used and District................................................93Table 7.22 Holdings Planted By Payment of Draught Power Used and District...............................................93Table 7.23 Holdings Planted By Method Used to Plant Seeds and District........................................................94

ANNUAL AGRICULTURAL SURVEY REPORT 2019TRADITIONAL SECTOR VI Statistics Botswana
EXECUTIVE SUMMARY Agriculture in Botswana consists of two distinct sectors, namely the commercial and the traditional sectors. The agricultural survey carried out in 2019 covered the traditional sector while the commercial sector coverage was low and as such cannot be used to produce meaningful results to guide policy and decision making. This report therefore presents the 2019 survey results for the traditional sector only. The results of 2019 survey will be compared with 2017 survey results since there was no survey in 2018.
The results of the 2019 agricultural survey depict improved trends in some of the livestock production enterprises than under crop production within the traditional sector. The cattle enterprise under the Livestock production subsector showed a decline in 2019, while goats and sheep showed a marked improvement. The good performance of the small-stock production is attributable to government programmes such as LIMID and Poverty Eradication, as well as low mortality recorded in 2019 for both goats and sheep. However, arable production showed a downward production trend in all the major crops compared to the 2017 Annual Agricultural Survey results.
Cattle population for the traditional sector dropped from 1.1 million in 2017 to 935 thousand in 2019. The decline in cattle population is attributed to an increase in cattle deaths from 64,447 in 2017 to 102,255 in 2019. Cattle lost due to straying/theft are lower than the 79,799 in 2017 but still considered high at 53,571 in 2019. This indicates that a significant number of cattle were lost due to straying/theft in 2017 and 2019. Despite the increase in cattle birth rate from 47.3 percent to 56.5 percent, the mortality rate doubled from 5.9 percent in 2017 to 10.9 percent in 2019 and off-take rate increased from 5.5 percent to 7.0 percent during the same period. The mortality is attributed to the severe drought that ravaged the country during the 2017/2018 and 2018/2019 seasons. Both the years 2017/18 and 2018/19 were declared drought years for the whole country (Botswana Environment Statistics, Natural and Technological Disasters Digest 2019) and as such the decline in both crop and livestock production indicators is attributed to drought.
During the period under review, the goats’ population increased from 1,200,000 in 2017 to 1,229,000 in 2019. The birth rate of goats increased by a percentage point from 39.1 to 39.2 percent. The goats’ mortality rate decreased from 23.3 to 18.9 percent in 2017 and 2019 respectively. A decrease in mortality rate and a slight increase in birth rate resulted in an increase in goats’ population. The off-take rate declined from 7.3 to 6.6 percent.
The Sheep population increased from 234,621 to 242,911between 2017 and 2019. The birth rate experienced a slight decrease from 33.6 to 32.8 percent in the same period, while the mortality rate also dropped to 14.1 percent in 2019 from 16.1 percent recorded in 2017. However, the off-take rate increased from 3.9 to 4.5 percent. The sheep enterprise shows a slight improvement in performance from 2017 to 2019 survey years.
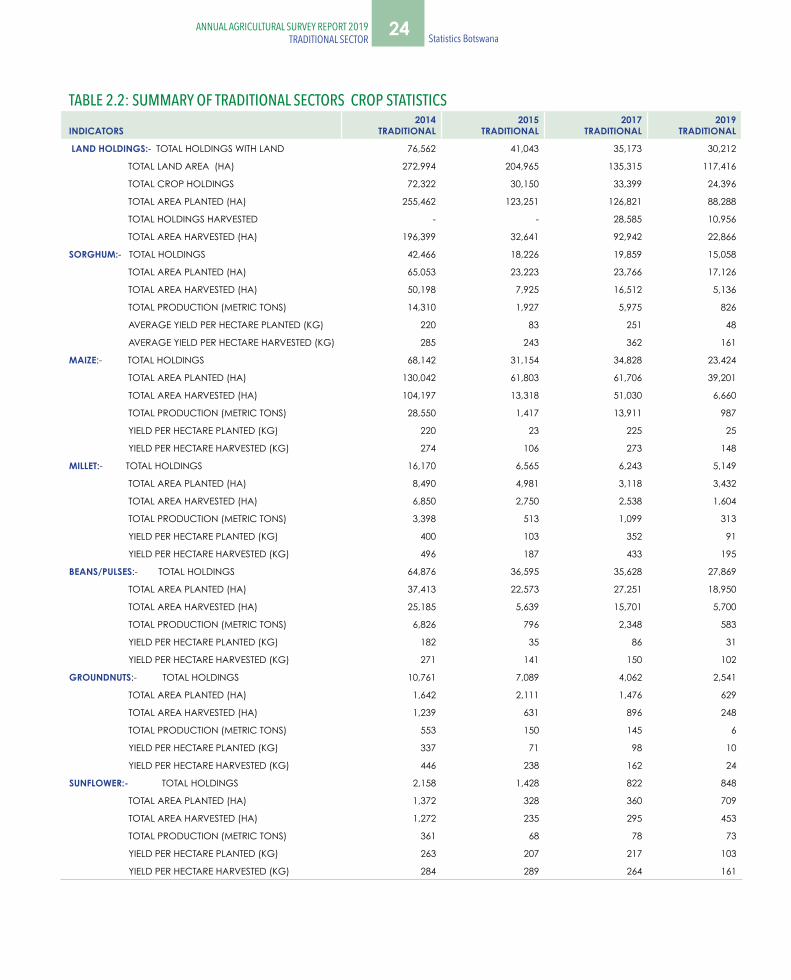
The 2019 survey results indicate that the traditional crop sector experienced a poor harvest compared to 2017. Sorghum production recorded a substantial reduction from 5,975 metric tons in 2017 to 826 metric tons (86.2 percent) in 2019. Maize production also experienced a huge reduction from 13,911 metric tons to a staggering 987 metric tons (92.9 percent), while millet production dropped from 1,099 metric tons to 313 metric tons (71.5 percent) in 2017 and 2019 respectively. The beans/pulses also realized a significant reduction in production from 2,348 metric tons in 2017 to 583 metric tons (75.2 percent) between the 2017 and 2019 agricultural seasons. Compared to 2017 agricultural survey results, there was a decrease in area planted and area harvested for all the crops in 2019 except for millet which remained the same. The crop sector recorded substantially low yields during the 2019 compared to the 2017 cropping season, in terms of both yield per hectare planted and yield per hectare harvested. The yields per hectare planted for sorghum dropped from 251 kg/ha in 2017 to 48 kg/ha in 2019, while maize yield was 225kg/ha in 2017 but dropped to 25kg/ha in 2019. The millet yield reduced from 353 kg/ha to 91kg/ha between 2017 and 2019 respectively, while the yield for pulses also showed a marked reduction from 86 kg/ha to 31 kg/ha between 2017 and 2019 survey years respectively.
ANNUAL AGRICULTURAL SURVEY REPORT 2019TRADITIONAL SECTOR
ANNUAL AGRICULTURAL SURVEY REPORT 2019TRADITIONAL SECTORVII Statistics Botswana
1ANNUAL AGRICULTURAL SURVEY REPORT 2019TRADITIONAL SECTOR Statistics Botswana
CHAPTER 1: INTRODUCTION Agriculture plays an important role in rural development by providing food, income and employment for the majority of the rural dwellers. In Botswana, it has a potential for growth and creation of employment opportunities particularly for the unskilled and semi-skilled people. However, the sector is not performing optimally due to recurring droughts, losses due to straying and theft and endemic animal diseases such as Foot and Mouth Disease (FMD). Nevertheless, agriculture still remains a viable option for poverty reduction and employment creation because it is labor intensive.
This report provides statistics on a wide range of agricultural production indicators with the view of facilitating evidence-based decision-making, policy development and monitoring and evaluation of agricultural development programs. In the livestock sub-sector, the report provides information on birth rates, off-take rates, death rates, number of holdings and livestock population. In the arable sub-sector, production indicators covered include area planted, area harvested, production and yield per hectare. Information on the agricultural holders’ characteristics such as gender, marital status and age is covered as well.
CHAPTER 2:ANALYSIS OF THE RESULTS
2.1 Agricultural Holders Characteristics
2.1.1 Gender & Marital Status
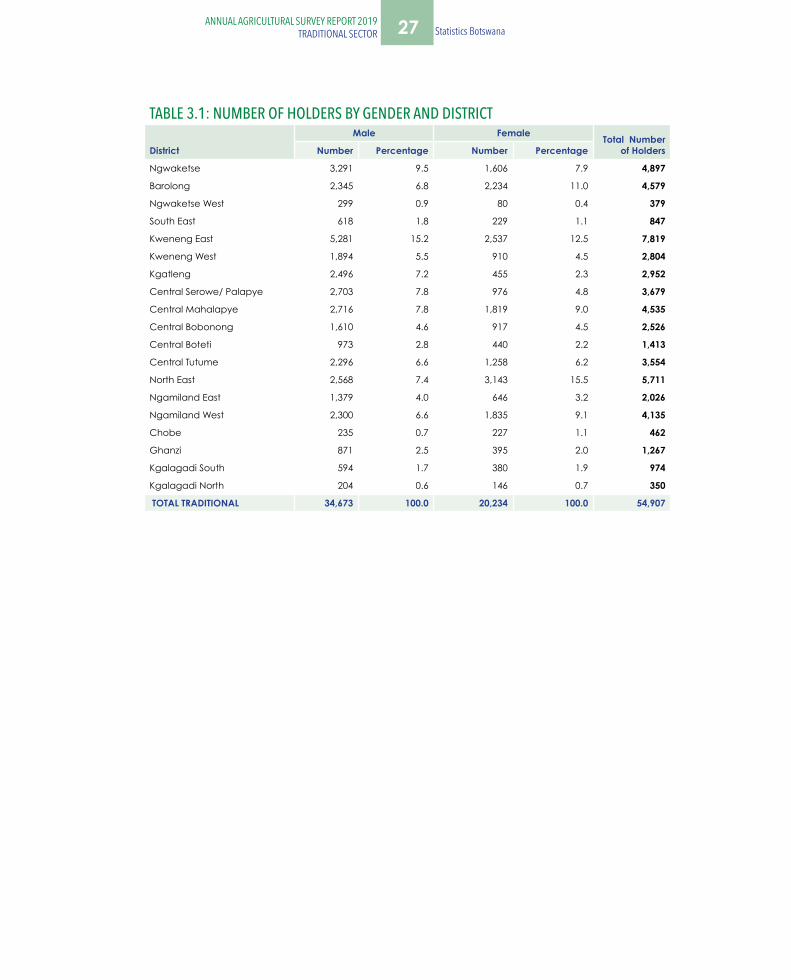
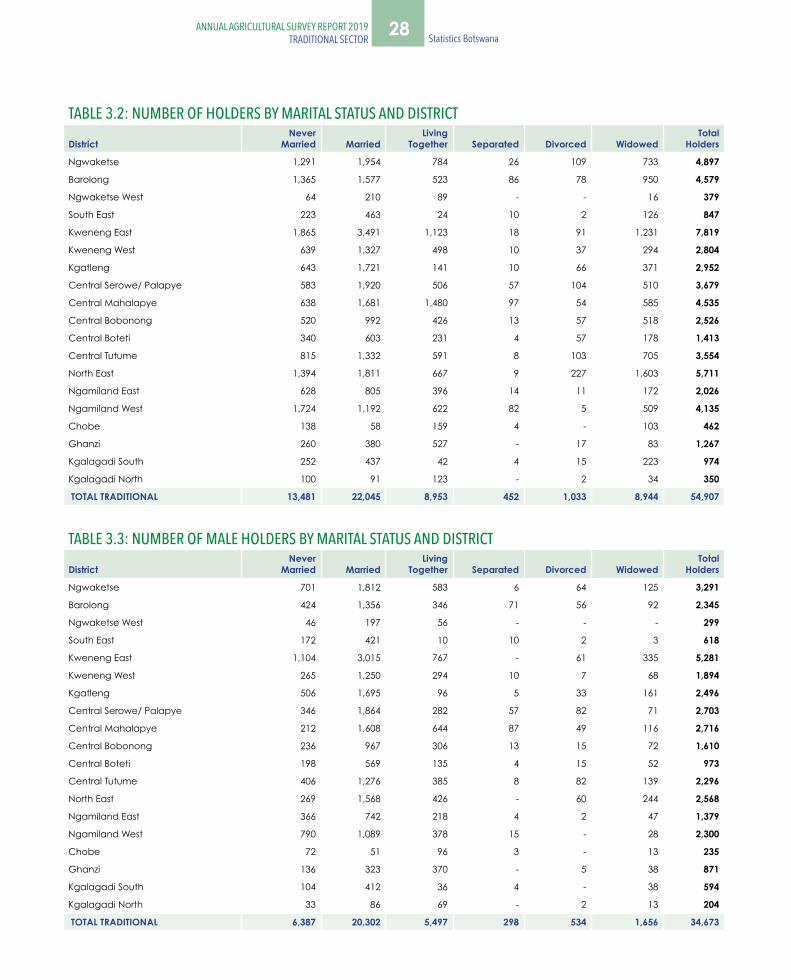
The results of the survey indicate that in the 2019 agricultural season, male farmers continued to dominate farming at 63.1 percent compared to their female counterparts with only 36.9 percent participation (Table 3.1). Most holders, accounting for 22,045 out of the total number of 54, 908 are married, and this is 40.1 percent while 24.5 percent were never married and 16.3 percent were living together (Table 3.2).
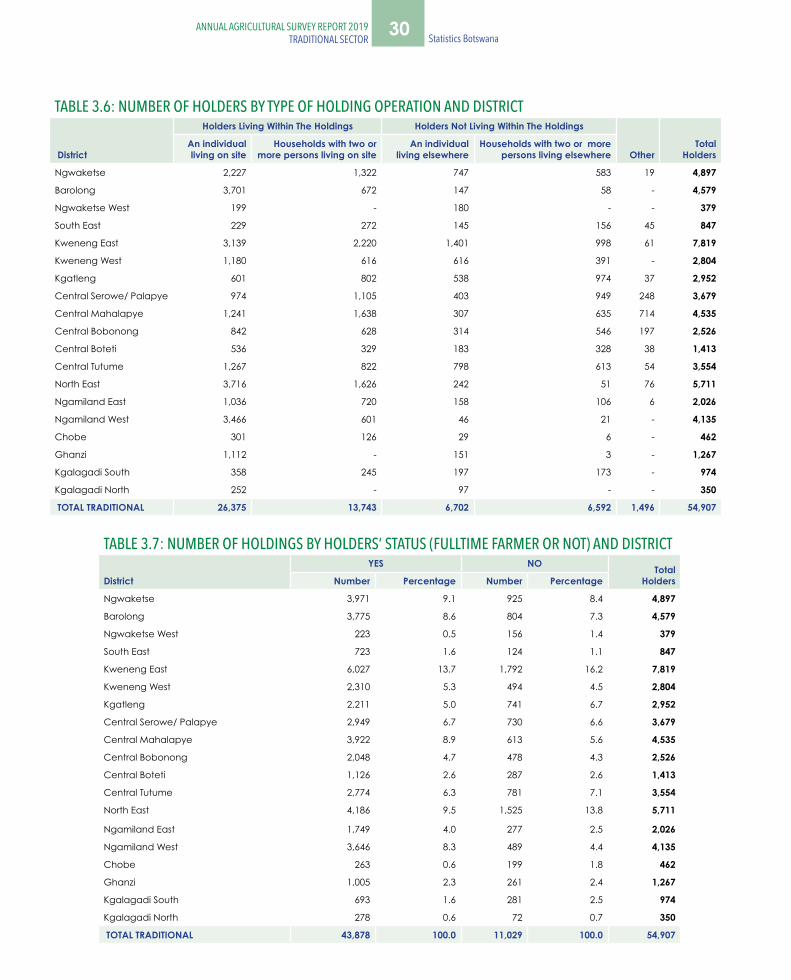
The 2019 survey results also indicate that 73.1 percent of holders are living within their holdings, while 24.2 percent are staying away from their farm holdings (Table 3.6). Therefore, the survey results show that most traditional farmers reside within their farm holdings and manage their own livestock on a daily basis, averting the poor manage practices often associated with absentee farming. The results further reveal that most holders, 79.9 percent are full time farmers and this implies that most traditional farmers concentrates their effort on farming rather than on other forms of employment (Table 3.7).
2.1.2 Youth participation
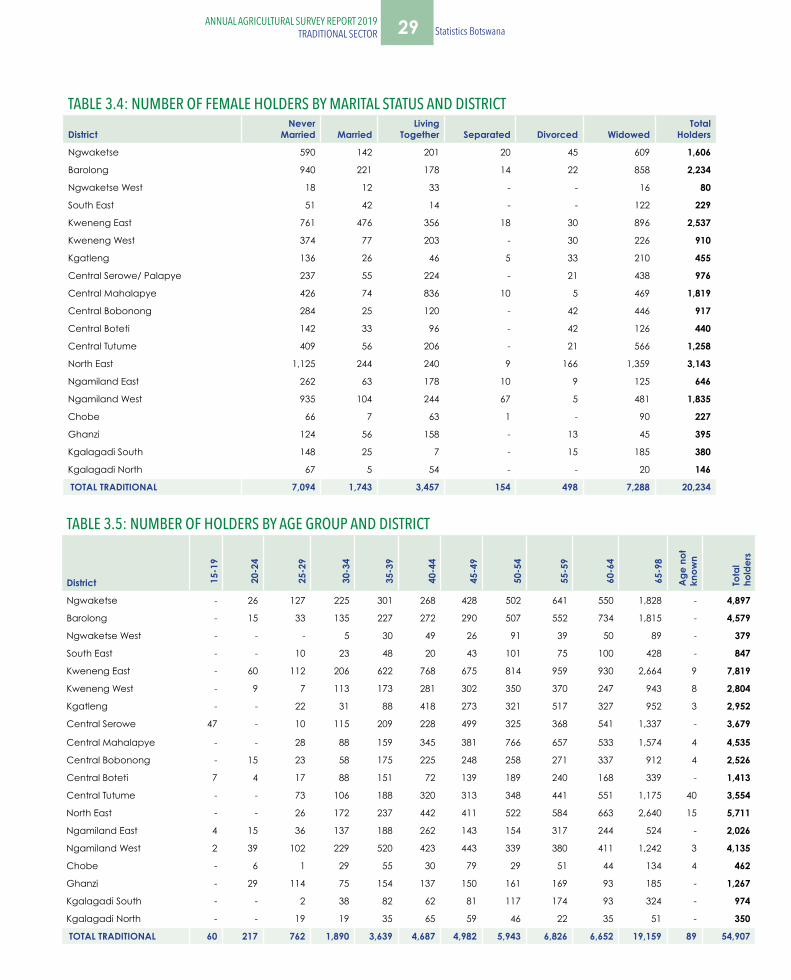
The participation of youth in agriculture is still low according to the 2019 survey results. Out of a total of 54,908 traditional farmers/holders countrywide, only 5.3 percent were aged between 15 and 35 years. The majority of farmers were in the age group 65 years and above (34.9 percent) and between 55-59 years at 12.4 percent (Table 3.5).
2.1.3 Farm workers and economic activities
The survey results illustrate that 13,191 holdings (24.0 percent) employed farm workers (Table 3.17). There were 15,422 farm workers in 2017 as compared to 14,898 in 2019, which is a 3.4 percent reduction. The 2019 survey results further revealed that the majority of farm workers were permanent at 90.1 percent (Table 3.20). Males accounted for the majority of these farm workers at 95.0 percent compared to the 5 percent of their female counterparts.

2 Statistics Botswana ANNUAL AGRICULTURAL SURVEY REPORT 2019
TRADITIONAL SECTORANNUAL AGRICULTURAL SURVEY REPORT 2019
TRADITIONAL SECTOR
There was an increase in the average farm wage from P967 in 2017 to P1, 174 in 2019. This shows that most farmers comply with the minimum wage set by the government for agricultural farmers which is P1, 000. It is worth noting that the average wage in both years was above the minimum wages approved by the Government of P550 and P1, 000 for 2017 and 2019 respectively. The 2019 survey results also demonstrated that farmers pay their workers both inkind and cash and this results in high average farm wages than the approved rates.
2.2: Livestock Statistics
Livestock statistics comprises cattle, goats, sheep, donkeys/mules, horses, pigs, ostriches, chicken and others, but this summary will only concentrate on the three main ones in Botswana and these are cattle, goats and sheep.
Table 2.2a: Livestock Holdings, Population & Indicators between 2017 & 2019 INDICATORS 2017 Traditional 2019 Traditional
CATTLE:- Total Cattle Holdings 33,819 29,355
Total Cattle 1,100,375 934,732
Offtake rate (%) 5.5 7.0
Birth rate (%) 47.3 56.5
Death rate (%) 5.9 10.9
GOATS:- Total Goats Holdings 58,332 42,179
Total Goats 1,199,661 1,228,744
Offtake rate (%) 7.3 6.6
Birth rate (%) 39.1 39.2
Death rate (%) 23.3 18.9
SHEEP:- Total Sheep Holdings 12,992 11,905
Total Sheep 234,621 242,911
Offtake rate (%) 3.9 7.7
Birth rate (%) 33.6 32.8
Death rate (%) 16.1 14.1
The Table 2.2a above indicates a decline in the total number of agricultural holdings constituted by all types of livestock. In contrary to the total goats and sheep holdings decline, their populations have slightly increased by 2.4 and 3.5 percent respectively. This increase is attributed to lower death rates during 2019 as compared to 2017 agricultural season among others. The cattle population has declined due to high death rate in 2019.
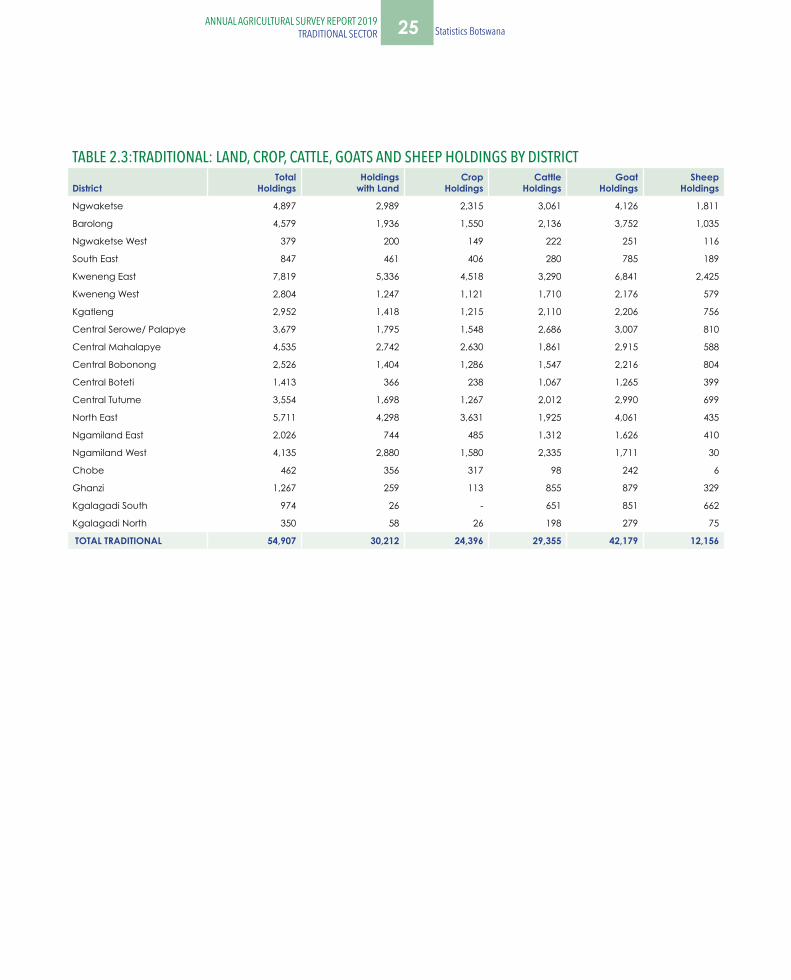
The cattle population is observed to be the highest in Central Serowe/Palapye with 10.5 percent of the total cattle population countrywide. This is partly due to the districts’ vast geographic coverage compared to other districts. Ngwaketse and Central Mahalapye had the second highest cattle population at 7.7 percent each. The lowest cattle population were recorded at South East and Chobe with 0.4 and 0.3 percent respectively (Table 4.2B). Both areas have small geographic areas and limited carrying capacities for livestock. Chobe in particular has vast wildlife management areas and intrusion of predators which further contribute to low numbers of livestock kept in the area.
3ANNUAL AGRICULTURAL SURVEY REPORT 2019TRADITIONAL SECTOR Statistics Botswana
Cattle sales were observed to be highest in Central Serowe/Palapye at 12.1 percent followed by Ghanzi with 9.5 percent), Ngamiland East with 9.3 percent and Kweneng West recording 8.0 percent as presented in Table 4.5A. The highest number of cattle were sold to butcheries followed by feedlots, then to other farmers and the least number of cattle were sold directly to BMC (Table 4.6).
Livestock ownership shows a widening gap between males and females with regard to the two survey years under review. In 2017 males owned 73 percent of cattle, 62 percent of goats and 73 percent of sheep. The 2019 survey however, shows that males now own 85 percent, 71 percent and 79 percent of the above mentioned livestock respectively (Tables 4.1A, 5.1A and 5.7A). This shows a 12 percentage point, 9 percentage point and 6 percentage point differences between 2017 and 2019 surveys respectively. Therefore, there is need for a suitable affirmative action plan to be put in place to lure and support women into livestock rearing.
Supplementary feeding in the traditional livestock sub-sector is only practiced by fewer households and this results in high cattle mortality during drought years. As revealed by the 2019 survey results, 41.7 percent of households provided supplementary feeds for their cattle, while only 26 and 37 percent of households supplemented their goats and sheep respectively (Table 3.14). It is worth noting that though the percentage of households that provided supplementary feeds for goats and sheep were lower than those that supplemented their cattle, the mortality rate for cattle was higher. This indicates that cattle mostly require supplementary feeding during dry winter seasons because cattle are susceptible to droughts compared to small-stock which is more resilient.
2.2.1 Cattle holdings and population
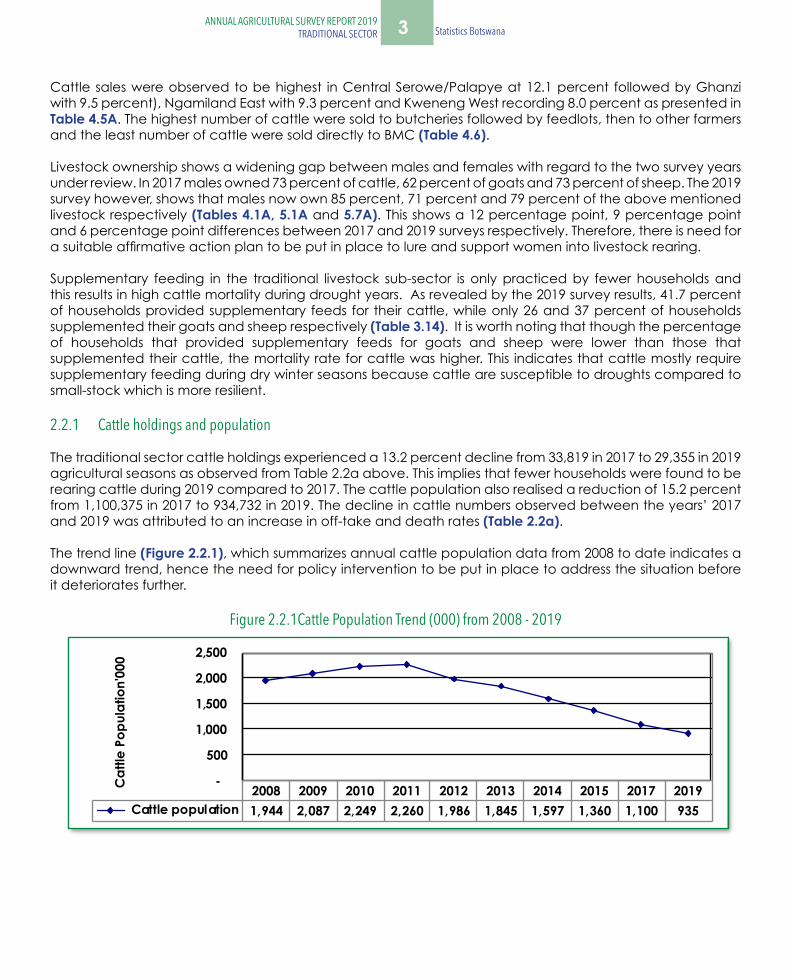
The traditional sector cattle holdings experienced a 13.2 percent decline from 33,819 in 2017 to 29,355 in 2019 agricultural seasons as observed from Table 2.2a above. This implies that fewer households were found to be rearing cattle during 2019 compared to 2017. The cattle population also realised a reduction of 15.2 percent from 1,100,375 in 2017 to 934,732 in 2019. The decline in cattle numbers observed between the years’ 2017 and 2019 was attributed to an increase in off-take and death rates (Table 2.2a).
The trend line (Figure 2.2.1), which summarizes annual cattle population data from 2008 to date indicates a downward trend, hence the need for policy intervention to be put in place to address the situation before it deteriorates further.
Figure 2.2.1Cattle Population Trend (000) from 2008 - 2019
4 Statistics Botswana ANNUAL AGRICULTURAL SURVEY REPORT 2019
TRADITIONAL SECTORANNUAL AGRICULTURAL SURVEY REPORT 2019
TRADITIONAL SECTOR
2.2.1A Cattle production indicators (birth, death and off-take rates)
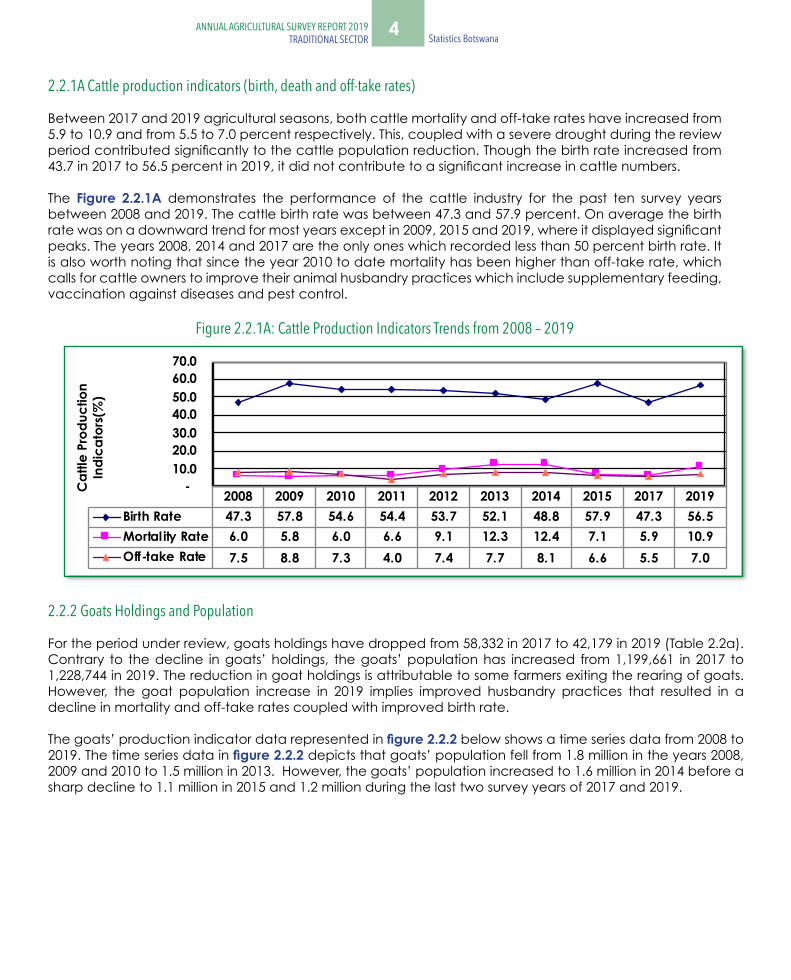
Between 2017 and 2019 agricultural seasons, both cattle mortality and off-take rates have increased from 5.9 to 10.9 and from 5.5 to 7.0 percent respectively. This, coupled with a severe drought during the review period contributed significantly to the cattle population reduction. Though the birth rate increased from 43.7 in 2017 to 56.5 percent in 2019, it did not contribute to a significant increase in cattle numbers.
The Figure 2.2.1A demonstrates the performance of the cattle industry for the past ten survey years between 2008 and 2019. The cattle birth rate was between 47.3 and 57.9 percent. On average the birth rate was on a downward trend for most years except in 2009, 2015 and 2019, where it displayed significant peaks. The years 2008, 2014 and 2017 are the only ones which recorded less than 50 percent birth rate. It is also worth noting that since the year 2010 to date mortality has been higher than off-take rate, which calls for cattle owners to improve their animal husbandry practices which include supplementary feeding, vaccination against diseases and pest control.
Figure 2.2.1A: Cattle Production Indicators Trends from 2008 – 2019
2.2.2 Goats Holdings and Population
For the period under review, goats holdings have dropped from 58,332 in 2017 to 42,179 in 2019 (Table 2.2a). Contrary to the decline in goats’ holdings, the goats’ population has increased from 1,199,661 in 2017 to 1,228,744 in 2019. The reduction in goat holdings is attributable to some farmers exiting the rearing of goats. However, the goat population increase in 2019 implies improved husbandry practices that resulted in a decline in mortality and off-take rates coupled with improved birth rate.
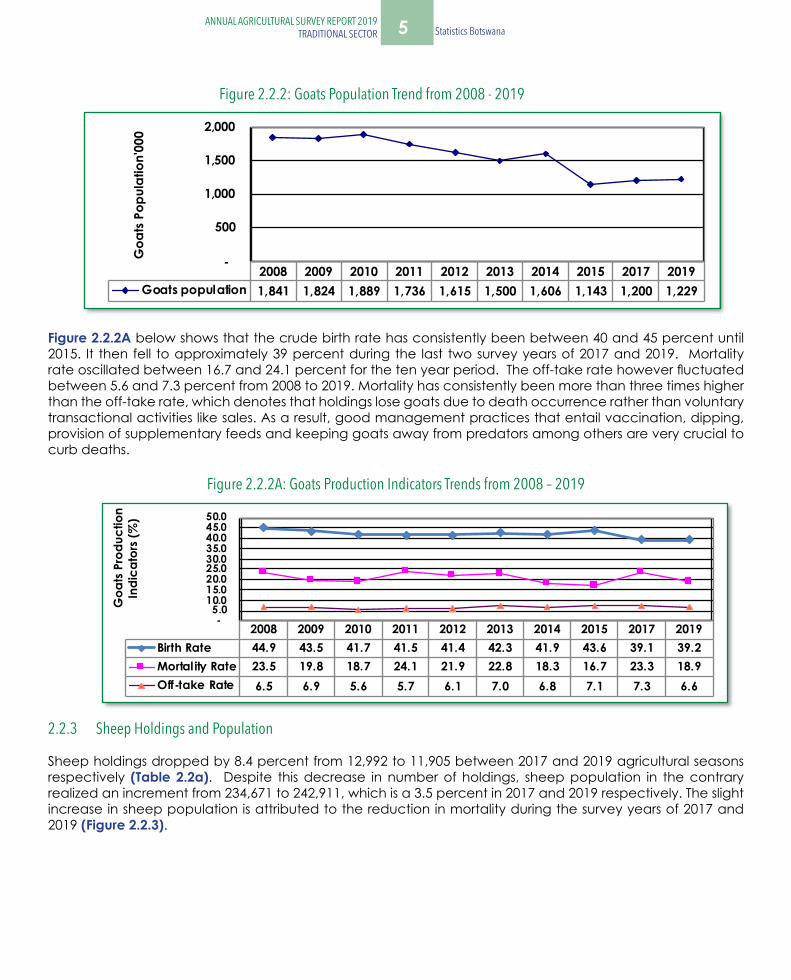
The goats’ production indicator data represented in figure 2.2.2 below shows a time series data from 2008 to 2019. The time series data in figure 2.2.2 depicts that goats’ population fell from 1.8 million in the years 2008, 2009 and 2010 to 1.5 million in 2013. However, the goats’ population increased to 1.6 million in 2014 before a sharp decline to 1.1 million in 2015 and 1.2 million during the last two survey years of 2017 and 2019.
5ANNUAL AGRICULTURAL SURVEY REPORT 2019TRADITIONAL SECTOR Statistics Botswana
Figure 2.2.2: Goats Population Trend from 2008 - 2019
Figure 2.2.2A below shows that the crude birth rate has consistently been between 40 and 45 percent until 2015. It then fell to approximately 39 percent during the last two survey years of 2017 and 2019. Mortality rate oscillated between 16.7 and 24.1 percent for the ten year period. The off-take rate however fluctuated between 5.6 and 7.3 percent from 2008 to 2019. Mortality has consistently been more than three times higher than the off-take rate, which denotes that holdings lose goats due to death occurrence rather than voluntary transactional activities like sales. As a result, good management practices that entail vaccination, dipping, provision of supplementary feeds and keeping goats away from predators among others are very crucial to curb deaths.
Figure 2.2.2A: Goats Production Indicators Trends from 2008 – 2019
2.2.3 Sheep Holdings and Population
Sheep holdings dropped by 8.4 percent from 12,992 to 11,905 between 2017 and 2019 agricultural seasons respectively (Table 2.2a). Despite this decrease in number of holdings, sheep population in the contrary realized an increment from 234,671 to 242,911, which is a 3.5 percent in 2017 and 2019 respectively. The slight increase in sheep population is attributed to the reduction in mortality during the survey years of 2017 and 2019 (Figure 2.2.3).

6 Statistics Botswana ANNUAL AGRICULTURAL SURVEY REPORT 2019
TRADITIONAL SECTORANNUAL AGRICULTURAL SURVEY REPORT 2019
TRADITIONAL SECTOR
Figure 2.2.3: Sheep Population Trend (000) from 2008 - 2019
Sheep production indicators trends given in figure 2.2.3A below shows that birth, mortality and off-take rates are almost constant at 35, 15 and 5 percent respectively. This indicates that sheep rearing in Botswana is on average neither improving nor deteriorating but just stagnant. For the period under review, birth rate fluctuated between 32.7 and 36.7 percent while mortality rates oscillated between 11.7 and 16.3 percent. The off-take rates were between 3.9 and 7.7 percent.
Figure 2.2.3A: Sheep Population Indicators Trends from 2008 – 2019
2.3 Crop Statistics
The section gives a summary of crop statistics for 2017 and 2019 cropping seasons under the traditional sector. Crops covered include sorghum, maize, millet, beans/pulses, sunflower, groundnuts, watermelons, melons and others. The discussion will mainly focus on the four major crops namely sorghum, maize, millet and beans/pulses.
2.3.1 Total Holdings, Total Area Planted and Harvested
Table 2.3.1 below presents total land holdings and land area, total crop holdings and area planted, total holdings harvested and total area harvested in 2017 and 2019 agricultural seasons.
7ANNUAL AGRICULTURAL SURVEY REPORT 2019TRADITIONAL SECTOR Statistics Botswana
Table 2.3.1: Total Holdings, Area Planted & Harvested from 2017 – 2019
INDICATORS
TRADITIONAL SECTOR
2017 2019
Land Holdings 35, 173 30,212
Holdings Planted 33,399 24,396
Holdings Harvested 28,585 10,956
Total Land Area (ha) 135,315 117,416
Total Area Planted (ha) 126,821 88,288
Total Area Harvested (ha) 92, 942 22,866
Fallow Land Area 8,494 29,128
% Land Area not Planted 6.3 24.8
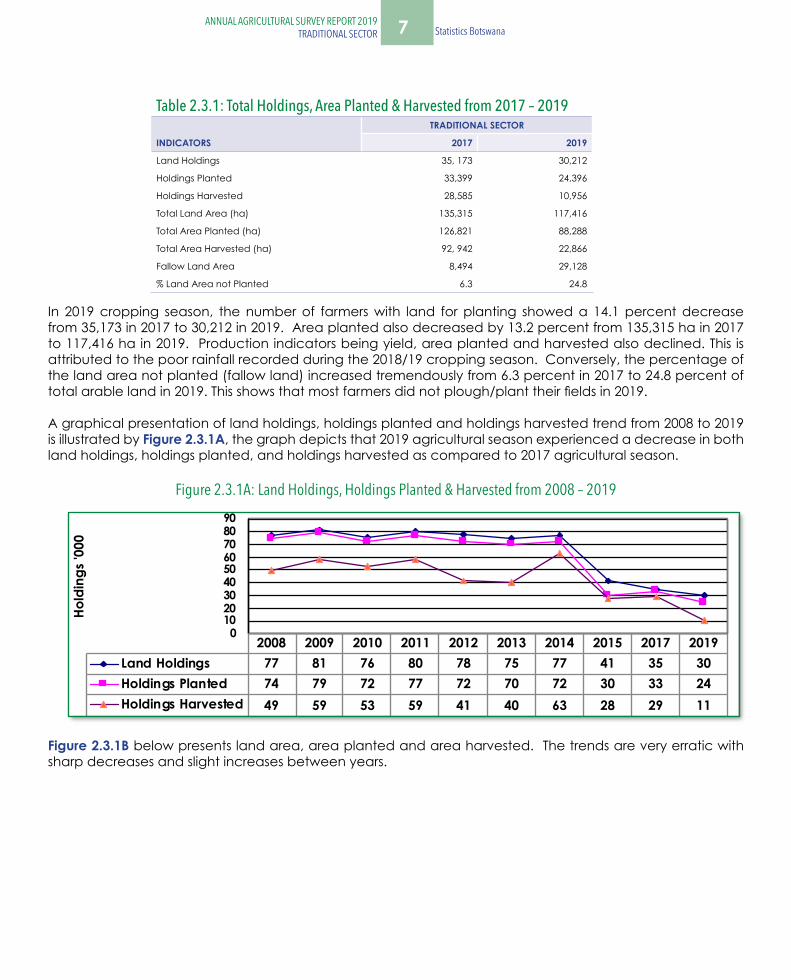
In 2019 cropping season, the number of farmers with land for planting showed a 14.1 percent decrease from 35,173 in 2017 to 30,212 in 2019. Area planted also decreased by 13.2 percent from 135,315 ha in 2017 to 117,416 ha in 2019. Production indicators being yield, area planted and harvested also declined. This is attributed to the poor rainfall recorded during the 2018/19 cropping season. Conversely, the percentage of the land area not planted (fallow land) increased tremendously from 6.3 percent in 2017 to 24.8 percent of total arable land in 2019. This shows that most farmers did not plough/plant their fields in 2019.
A graphical presentation of land holdings, holdings planted and holdings harvested trend from 2008 to 2019 is illustrated by Figure 2.3.1A, the graph depicts that 2019 agricultural season experienced a decrease in both land holdings, holdings planted, and holdings harvested as compared to 2017 agricultural season.
Figure 2.3.1A: Land Holdings, Holdings Planted & Harvested from 2008 – 2019
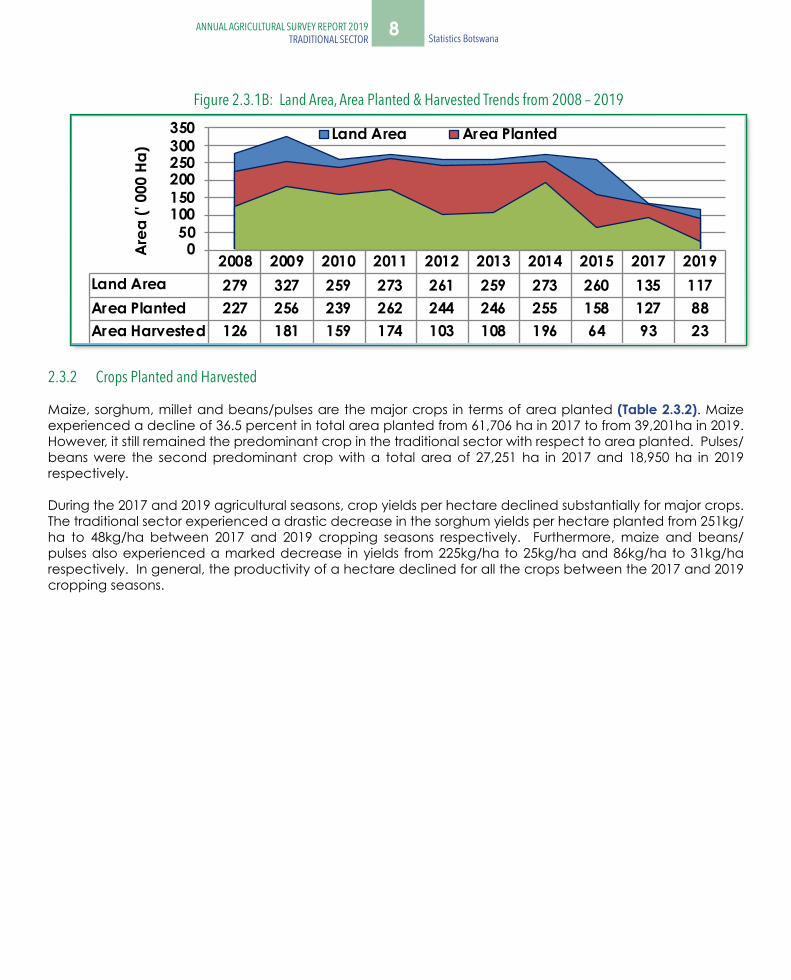
Figure 2.3.1B below presents land area, area planted and area harvested. The trends are very erratic with sharp decreases and slight increases between years.
8 Statistics Botswana ANNUAL AGRICULTURAL SURVEY REPORT 2019
TRADITIONAL SECTORANNUAL AGRICULTURAL SURVEY REPORT 2019
TRADITIONAL SECTOR
Figure 2.3.1B: Land Area, Area Planted & Harvested Trends from 2008 – 2019
2.3.2 Crops Planted and Harvested
Maize, sorghum, millet and beans/pulses are the major crops in terms of area planted (Table 2.3.2). Maize experienced a decline of 36.5 percent in total area planted from 61,706 ha in 2017 to from 39,201ha in 2019. However, it still remained the predominant crop in the traditional sector with respect to area planted. Pulses/beans were the second predominant crop with a total area of 27,251 ha in 2017 and 18,950 ha in 2019 respectively.
During the 2017 and 2019 agricultural seasons, crop yields per hectare declined substantially for major crops. The traditional sector experienced a drastic decrease in the sorghum yields per hectare planted from 251kg/ha to 48kg/ha between 2017 and 2019 cropping seasons respectively. Furthermore, maize and beans/pulses also experienced a marked decrease in yields from 225kg/ha to 25kg/ha and 86kg/ha to 31kg/ha respectively. In general, the productivity of a hectare declined for all the crops between the 2017 and 2019 cropping seasons.
9ANNUAL AGRICULTURAL SURVEY REPORT 2019TRADITIONAL SECTOR Statistics Botswana
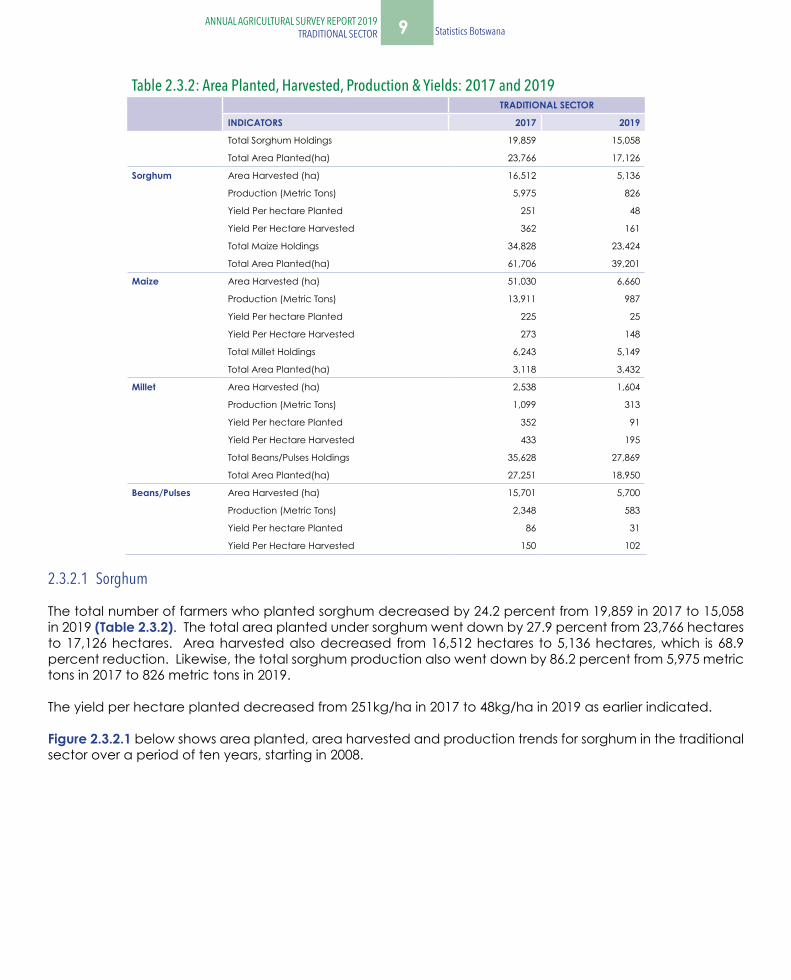
Table 2.3.2: Area Planted, Harvested, Production & Yields: 2017 and 2019TRADITIONAL SECTOR
INDICATORS 2017 2019
Total Sorghum Holdings 19,859 15,058
Total Area Planted(ha) 23,766 17,126
Sorghum Area Harvested (ha) 16,512 5,136
Production (Metric Tons) 5,975 826
Yield Per hectare Planted 251 48
Yield Per Hectare Harvested 362 161
Total Maize Holdings 34,828 23,424
Total Area Planted(ha) 61,706 39,201
Maize Area Harvested (ha) 51,030 6,660
Production (Metric Tons) 13,911 987
Yield Per hectare Planted 225 25
Yield Per Hectare Harvested 273 148
Total Millet Holdings 6,243 5,149
Total Area Planted(ha) 3,118 3,432
Millet Area Harvested (ha) 2,538 1,604
Production (Metric Tons) 1,099 313
Yield Per hectare Planted 352 91
Yield Per Hectare Harvested 433 195
Total Beans/Pulses Holdings 35,628 27,869
Total Area Planted(ha) 27,251 18,950
Beans/Pulses Area Harvested (ha) 15,701 5,700
Production (Metric Tons) 2,348 583
Yield Per hectare Planted 86 31
Yield Per Hectare Harvested 150 102
2.3.2.1 Sorghum
The total number of farmers who planted sorghum decreased by 24.2 percent from 19,859 in 2017 to 15,058 in 2019 (Table 2.3.2). The total area planted under sorghum went down by 27.9 percent from 23,766 hectares to 17,126 hectares. Area harvested also decreased from 16,512 hectares to 5,136 hectares, which is 68.9 percent reduction. Likewise, the total sorghum production also went down by 86.2 percent from 5,975 metric tons in 2017 to 826 metric tons in 2019.
The yield per hectare planted decreased from 251kg/ha in 2017 to 48kg/ha in 2019 as earlier indicated.
Figure 2.3.2.1 below shows area planted, area harvested and production trends for sorghum in the traditional sector over a period of ten years, starting in 2008.
10 Statistics Botswana ANNUAL AGRICULTURAL SURVEY REPORT 2019
TRADITIONAL SECTORANNUAL AGRICULTURAL SURVEY REPORT 2019
TRADITIONAL SECTOR
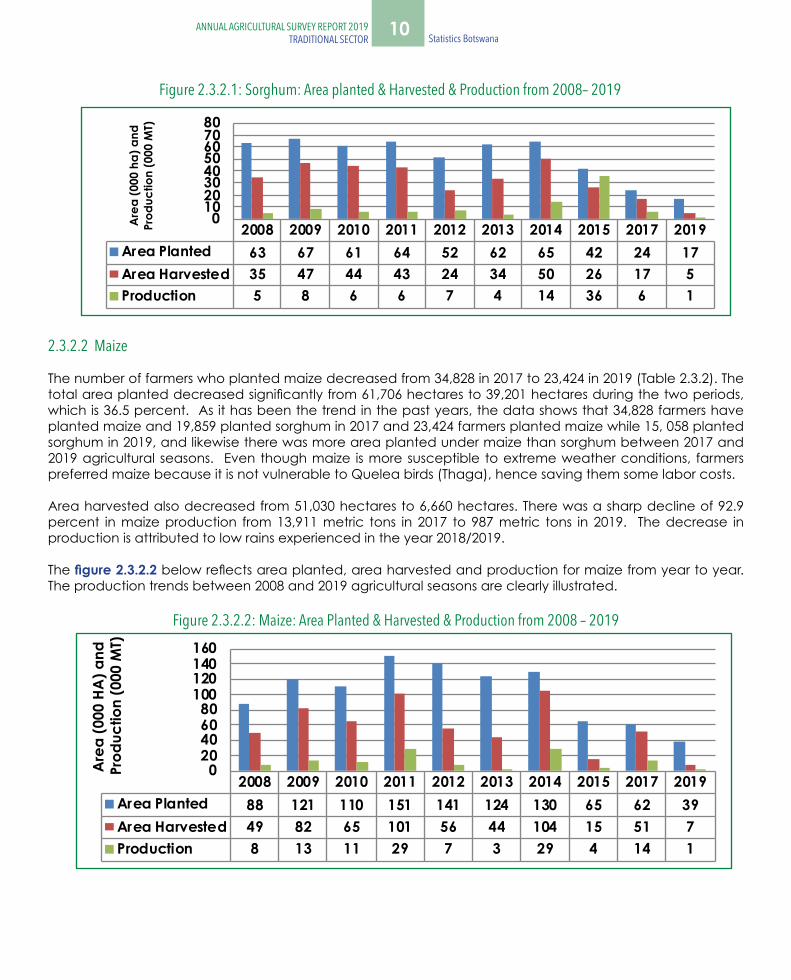
Figure 2.3.2.1: Sorghum: Area planted & Harvested & Production from 2008– 2019
2.3.2.2 Maize
The number of farmers who planted maize decreased from 34,828 in 2017 to 23,424 in 2019 (Table 2.3.2). The total area planted decreased significantly from 61,706 hectares to 39,201 hectares during the two periods, which is 36.5 percent. As it has been the trend in the past years, the data shows that 34,828 farmers have planted maize and 19,859 planted sorghum in 2017 and 23,424 farmers planted maize while 15, 058 planted sorghum in 2019, and likewise there was more area planted under maize than sorghum between 2017 and 2019 agricultural seasons. Even though maize is more susceptible to extreme weather conditions, farmers preferred maize because it is not vulnerable to Quelea birds (Thaga), hence saving them some labor costs.
Area harvested also decreased from 51,030 hectares to 6,660 hectares. There was a sharp decline of 92.9 percent in maize production from 13,911 metric tons in 2017 to 987 metric tons in 2019. The decrease in production is attributed to low rains experienced in the year 2018/2019.
The figure 2.3.2.2 below reflects area planted, area harvested and production for maize from year to year. The production trends between 2008 and 2019 agricultural seasons are clearly illustrated.
Figure 2.3.2.2: Maize: Area Planted & Harvested & Production from 2008 – 2019
11ANNUAL AGRICULTURAL SURVEY REPORT 2019TRADITIONAL SECTOR Statistics Botswana
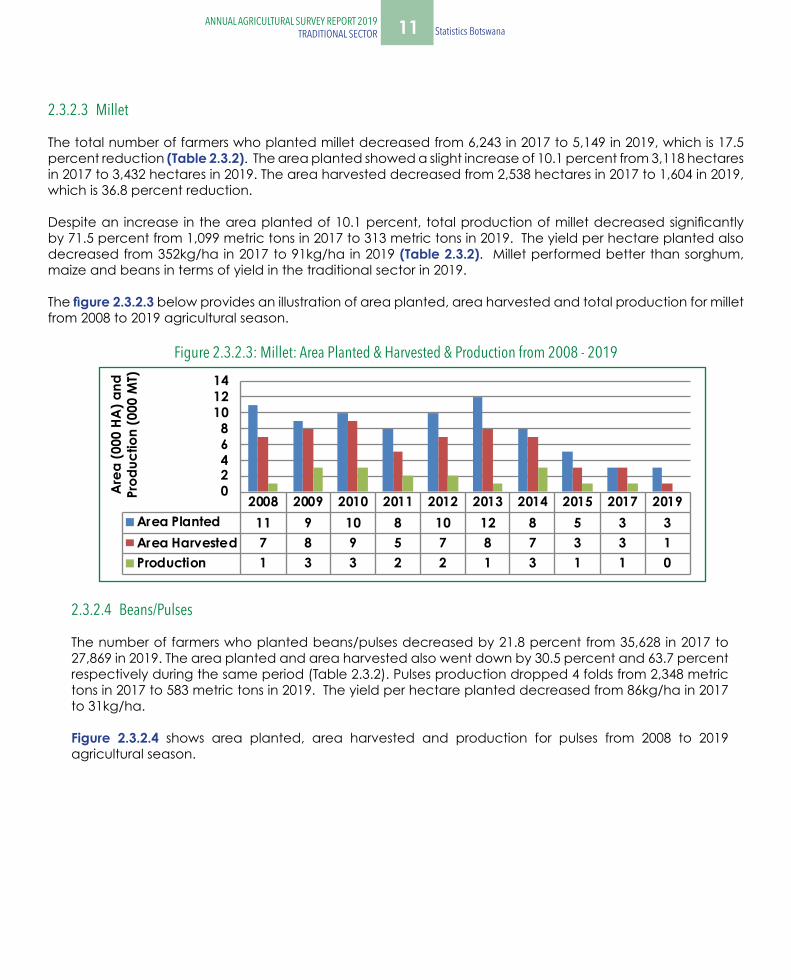
2.3.2.3 Millet
The total number of farmers who planted millet decreased from 6,243 in 2017 to 5,149 in 2019, which is 17.5 percent reduction (Table 2.3.2). The area planted showed a slight increase of 10.1 percent from 3,118 hectares in 2017 to 3,432 hectares in 2019. The area harvested decreased from 2,538 hectares in 2017 to 1,604 in 2019, which is 36.8 percent reduction.
Despite an increase in the area planted of 10.1 percent, total production of millet decreased significantly by 71.5 percent from 1,099 metric tons in 2017 to 313 metric tons in 2019. The yield per hectare planted also decreased from 352kg/ha in 2017 to 91kg/ha in 2019 (Table 2.3.2). Millet performed better than sorghum, maize and beans in terms of yield in the traditional sector in 2019.
The figure 2.3.2.3 below provides an illustration of area planted, area harvested and total production for millet from 2008 to 2019 agricultural season.
Figure 2.3.2.3: Millet: Area Planted & Harvested & Production from 2008 - 2019
2.3.2.4 Beans/Pulses
The number of farmers who planted beans/pulses decreased by 21.8 percent from 35,628 in 2017 to 27,869 in 2019. The area planted and area harvested also went down by 30.5 percent and 63.7 percent respectively during the same period (Table 2.3.2). Pulses production dropped 4 folds from 2,348 metric tons in 2017 to 583 metric tons in 2019. The yield per hectare planted decreased from 86kg/ha in 2017 to 31kg/ha.
Figure 2.3.2.4 shows area planted, area harvested and production for pulses from 2008 to 2019 agricultural season.

12 Statistics Botswana ANNUAL AGRICULTURAL SURVEY REPORT 2019
TRADITIONAL SECTORANNUAL AGRICULTURAL SURVEY REPORT 2019
TRADITIONAL SECTOR
Figure 2.3.2.4: Pulses: Area Planted & Harvested & Production from 2008 – 2019
CHAPTER 3: CONCLUSION In conclusion, the results of the 2019 agricultural survey show that cattle performance declined while goats and sheep depicted improved performance. Livestock production indicators showed some improvement except for cattle population, which depicted a decline. Cattle population dropped due to an increase in cattle deaths and cattle lost due to straying as well as stock theft. The good performance of the small-stock production indicators is attributable to the government programs such as LIMID and Poverty Eradication as well as low mortality recorded in 2019 for both goats and sheep.
The mortality in cattle was exacerbated by a severe drought that ravaged the country during the 2017/2018 and 2018/2019 seasons. Both the years 2017/18 and 2018/19 were declared drought years for the whole country (Botswana Environment Statistics, Natural and Technological Disasters Digest 2019). Notwithstanding the severe drought, small-stock performed relatively well, indicating that they are more resilient to drought compared to cattle. Therefore small-stock has proved to be an area where more investment could yield even better results.
The arable production on the other hand exhibited a sharp decline in production trends in all the four major crops compared to the 2017 annual agricultural survey results. Sorghum, Maize, Millet and Pulses all experienced substantial reduction in yield per hectare in 2019 compared to 2017. The area planted and harvested were also low, which translated into very low production figures for all the four major crops in 2019 in comparison to 2017. This indicates a direct relationship between rainfall / moisture availability and sustained crop production. Therefore, since 2017/18 and 2018/19 were drought years, the results of the 2019 survey reveal that there was insufficient moisture for crop growth during the period.

13ANNUAL AGRICULTURAL SURVEY REPORT 2019TRADITIONAL SECTOR Statistics Botswana
TIME SERIES DATA TABLES
14 Statistics Botswana ANNUAL AGRICULTURAL SURVEY REPORT 2019
TRADITIONAL SECTORANNUAL AGRICULTURAL SURVEY REPORT 2019
TRADITIONAL SECTOR
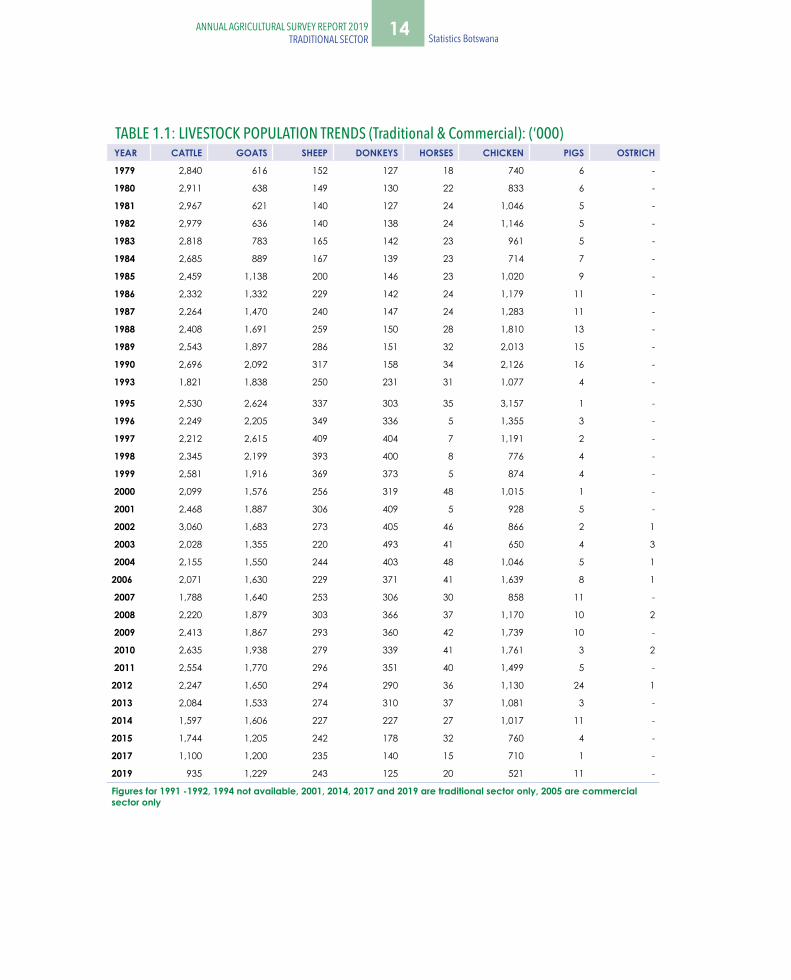
TABLE 1.1: LIVESTOCK POPULATION TRENDS (Traditional & Commercial): (‘000) YEAR CATTLE GOATS SHEEP DONKEYS HORSES CHICKEN PIGS OSTRICH
1979 2,840 616 152 127 18 740 6 -
1980 2,911 638 149 130 22 833 6 -
1981 2,967 621 140 127 24 1,046 5 -
1982 2,979 636 140 138 24 1,146 5 -
1983 2,818 783 165 142 23 961 5 -
1984 2,685 889 167 139 23 714 7 -
1985 2,459 1,138 200 146 23 1,020 9 -
1986 2,332 1,332 229 142 24 1,179 11 -
1987 2,264 1,470 240 147 24 1,283 11 -
1988 2,408 1,691 259 150 28 1,810 13 -
1989 2,543 1,897 286 151 32 2,013 15 -
1990 2,696 2,092 317 158 34 2,126 16 -
1993 1,821 1,838 250 231 31 1,077 4 -
1995 2,530 2,624 337 303 35 3,157 1 -
1996 2,249 2,205 349 336 5 1,355 3 -
1997 2,212 2,615 409 404 7 1,191 2 -
1998 2,345 2,199 393 400 8 776 4 -
1999 2,581 1,916 369 373 5 874 4 -
2000 2,099 1,576 256 319 48 1,015 1 -
2001 2,468 1,887 306 409 5 928 5 -
2002 3,060 1,683 273 405 46 866 2 1
2003 2,028 1,355 220 493 41 650 4 3
2004 2,155 1,550 244 403 48 1,046 5 1
2006 2,071 1,630 229 371 41 1,639 8 1
2007 1,788 1,640 253 306 30 858 11 -
2008 2,220 1,879 303 366 37 1,170 10 2
2009 2,413 1,867 293 360 42 1,739 10 -
2010 2,635 1,938 279 339 41 1,761 3 2
2011 2,554 1,770 296 351 40 1,499 5 -
2012 2,247 1,650 294 290 36 1,130 24 1
2013 2,084 1,533 274 310 37 1,081 3 -
2014 1,597 1,606 227 227 27 1,017 11 -
2015 1,744 1,205 242 178 32 760 4 -
2017 1,100 1,200 235 140 15 710 1 -
2019 935 1,229 243 125 20 521 11 -
Figures for 1991 -1992, 1994 not available, 2001, 2014, 2017 and 2019 are traditional sector only, 2005 are commercial sector only

15ANNUAL AGRICULTURAL SURVEY REPORT 2019TRADITIONAL SECTOR Statistics Botswana
TABLE 1.2: CATTLE PRODUCTION INDICATOR TRENDS: BIRTHS, DEATHS AND OFFTAKE RATES (%)
YEAR
BIRTH RATES DEATH RATES OFF-TAKE RATES
TRADITIONAL SECTOR
COMMERCIAL SECTOR
TRADITIONAL SECTOR
COMMERCIAL SECTOR
TRADITIONAL SECTOR
COMMERCIAL SECTOR
1979 58.4 63.4 10.9 3.6 8.8 17.7
1980 58.4 60.3 13.8 3.9 6.8 13.4
1981 57.5 54.1 13.6 4.0 7.2 12.1
1982 59.4 61.0 17.0 5.9 7.1 13.7
1983 52.8 56.2 17.8 8.9 8.0 24.7
1984 52.5 61.5 19.3 10.0 7.2 23.0
1985 54.3 56.0 23.6 6.2 10.3 22.4
1986 55.7 62.1 23.2 8.8 8.7 14.5
1987 58.5 49.4 22.7 6.3 7.2 14.9
1988 65.5 67.7 15.4 5.1 6.8 13.4
1989 61.9 65.0 12.9 5.0 7.6 16.0
1990 61.6 69.8 12.7 4.2 7.6 17.9
1993 57.0 56.1 32.0 6.7 10.2 58.4
1995 61.0 59.6 14.3 8.2 7.4 3.9
1996 58.4 64.0 4.9 3.5 7.9 23.4
1997 54.6 51.1 4.3 3.6 11.8 1.7
1998 59.9 51.5 6.1 4.5 6.3 13.9
1999 54.0 55.9 7.9 3.6 9.6 14.1
2000 51.3 33.2 6.0 2.6 10.6 1.6
2001 55.5 - 4.9 - 7.7 -
2002 55.9 45.8 5.4 4.8 6.8 15.0
2003 66.6 49.1 16.4 4.7 12.2 15.4
2004 54.4 49.4 12.7 4.8 8.1 12.3
2006 56.9 46.5 9.8 4.3 7.7 10.7
2007 61.3 41.4 8.5 4.5 8.7 18.2
2008 47.3 42.3 6.0 4.2 7.5 12.9
2009 57.8 44.2 5.8 3.4 8.8 10.9
2010 54.6 40.9 6.0 3.2 7.3 12.5
2011 54.4 38.9 6.6 1.6 6.0 13.5
2012 53.7 48.6 9.9 3.3 6.9 11.9
2013 52.1 40.0 12.9 8.0 7.7 10.0
2014 48.8 - 12.4 - 8.1 -
2015 58.0 52.0 7.0 3.0 7.0 12.0
2017 47.3 - 5.9 - 5.5 -
2019 56.5 - 10.9 - 7.0 -
Figures for 1991 -1992, 1994 not available, 2001, 2014, 2017 and 2019 are traditional sector only, 2005 are commercial sector only
16 Statistics Botswana ANNUAL AGRICULTURAL SURVEY REPORT 2019
TRADITIONAL SECTORANNUAL AGRICULTURAL SURVEY REPORT 2019
TRADITIONAL SECTOR
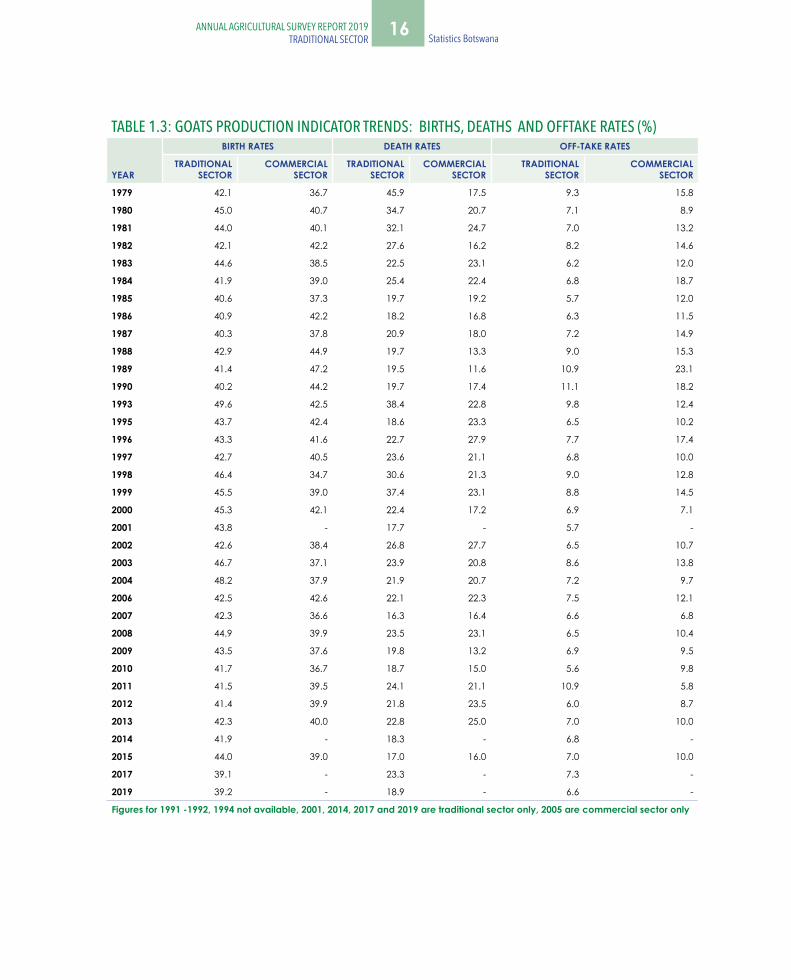
TABLE 1.3: GOATS PRODUCTION INDICATOR TRENDS: BIRTHS, DEATHS AND OFFTAKE RATES (%)
YEAR
BIRTH RATES DEATH RATES OFF-TAKE RATES
TRADITIONAL SECTOR
COMMERCIAL SECTOR
TRADITIONAL SECTOR
COMMERCIAL SECTOR
TRADITIONAL SECTOR
COMMERCIAL SECTOR
1979 42.1 36.7 45.9 17.5 9.3 15.8
1980 45.0 40.7 34.7 20.7 7.1 8.9
1981 44.0 40.1 32.1 24.7 7.0 13.2
1982 42.1 42.2 27.6 16.2 8.2 14.6
1983 44.6 38.5 22.5 23.1 6.2 12.0
1984 41.9 39.0 25.4 22.4 6.8 18.7
1985 40.6 37.3 19.7 19.2 5.7 12.0
1986 40.9 42.2 18.2 16.8 6.3 11.5
1987 40.3 37.8 20.9 18.0 7.2 14.9
1988 42.9 44.9 19.7 13.3 9.0 15.3
1989 41.4 47.2 19.5 11.6 10.9 23.1
1990 40.2 44.2 19.7 17.4 11.1 18.2
1993 49.6 42.5 38.4 22.8 9.8 12.4
1995 43.7 42.4 18.6 23.3 6.5 10.2
1996 43.3 41.6 22.7 27.9 7.7 17.4
1997 42.7 40.5 23.6 21.1 6.8 10.0
1998 46.4 34.7 30.6 21.3 9.0 12.8
1999 45.5 39.0 37.4 23.1 8.8 14.5
2000 45.3 42.1 22.4 17.2 6.9 7.1
2001 43.8 - 17.7 - 5.7 -
2002 42.6 38.4 26.8 27.7 6.5 10.7
2003 46.7 37.1 23.9 20.8 8.6 13.8
2004 48.2 37.9 21.9 20.7 7.2 9.7
2006 42.5 42.6 22.1 22.3 7.5 12.1
2007 42.3 36.6 16.3 16.4 6.6 6.8
2008 44.9 39.9 23.5 23.1 6.5 10.4
2009 43.5 37.6 19.8 13.2 6.9 9.5
2010 41.7 36.7 18.7 15.0 5.6 9.8
2011 41.5 39.5 24.1 21.1 10.9 5.8
2012 41.4 39.9 21.8 23.5 6.0 8.7
2013 42.3 40.0 22.8 25.0 7.0 10.0
2014 41.9 - 18.3 - 6.8 -
2015 44.0 39.0 17.0 16.0 7.0 10.0
2017 39.1 - 23.3 - 7.3 -
2019 39.2 - 18.9 - 6.6 -
Figures for 1991 -1992, 1994 not available, 2001, 2014, 2017 and 2019 are traditional sector only, 2005 are commercial sector only
17ANNUAL AGRICULTURAL SURVEY REPORT 2019TRADITIONAL SECTOR Statistics Botswana
TABLE 1.3: GOATS PRODUCTION INDICATOR TRENDS: BIRTHS, DEATHS AND OFFTAKE RATES (%)
YEAR
BIRTH RATES DEATH RATES OFF-TAKE RATES
TRADITIONAL SECTOR
COMMERCIAL SECTOR
TRADITIONAL SECTOR
COMMERCIAL SECTOR
TRADITIONAL SECTOR
COMMERCIAL SECTOR
1979 42.1 36.7 45.9 17.5 9.3 15.8
1980 45.0 40.7 34.7 20.7 7.1 8.9
1981 44.0 40.1 32.1 24.7 7.0 13.2
1982 42.1 42.2 27.6 16.2 8.2 14.6
1983 44.6 38.5 22.5 23.1 6.2 12.0
1984 41.9 39.0 25.4 22.4 6.8 18.7
1985 40.6 37.3 19.7 19.2 5.7 12.0
1986 40.9 42.2 18.2 16.8 6.3 11.5
1987 40.3 37.8 20.9 18.0 7.2 14.9
1988 42.9 44.9 19.7 13.3 9.0 15.3
1989 41.4 47.2 19.5 11.6 10.9 23.1
1990 40.2 44.2 19.7 17.4 11.1 18.2
1993 49.6 42.5 38.4 22.8 9.8 12.4
1995 43.7 42.4 18.6 23.3 6.5 10.2
1996 43.3 41.6 22.7 27.9 7.7 17.4
1997 42.7 40.5 23.6 21.1 6.8 10.0
1998 46.4 34.7 30.6 21.3 9.0 12.8
1999 45.5 39.0 37.4 23.1 8.8 14.5
2000 45.3 42.1 22.4 17.2 6.9 7.1
2001 43.8 - 17.7 - 5.7 -
2002 42.6 38.4 26.8 27.7 6.5 10.7
2003 46.7 37.1 23.9 20.8 8.6 13.8
2004 48.2 37.9 21.9 20.7 7.2 9.7
2006 42.5 42.6 22.1 22.3 7.5 12.1
2007 42.3 36.6 16.3 16.4 6.6 6.8
2008 44.9 39.9 23.5 23.1 6.5 10.4
2009 43.5 37.6 19.8 13.2 6.9 9.5
2010 41.7 36.7 18.7 15.0 5.6 9.8
2011 41.5 39.5 24.1 21.1 10.9 5.8
2012 41.4 39.9 21.8 23.5 6.0 8.7
2013 42.3 40.0 22.8 25.0 7.0 10.0
2014 41.9 - 18.3 - 6.8 -
2015 44.0 39.0 17.0 16.0 7.0 10.0
2017 39.1 - 23.3 - 7.3 -
2019 39.2 - 18.9 - 6.6 -
Figures for 1991 -1992, 1994 not available, 2001, 2014, 2017 and 2019 are traditional sector only, 2005 are commercial sector only
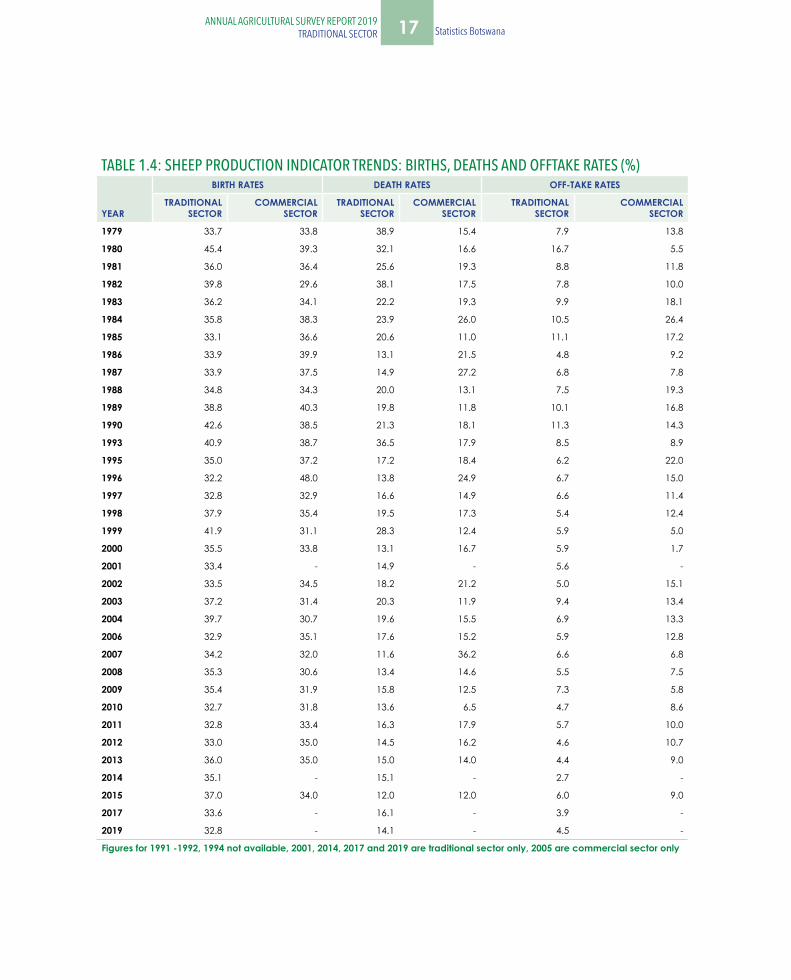
TABLE 1.4: SHEEP PRODUCTION INDICATOR TRENDS: BIRTHS, DEATHS AND OFFTAKE RATES (%)
YEAR
BIRTH RATES DEATH RATES OFF-TAKE RATES
TRADITIONAL SECTOR
COMMERCIAL SECTOR
TRADITIONAL SECTOR
COMMERCIAL SECTOR
TRADITIONAL SECTOR
COMMERCIAL SECTOR
1979 33.7 33.8 38.9 15.4 7.9 13.8
1980 45.4 39.3 32.1 16.6 16.7 5.5
1981 36.0 36.4 25.6 19.3 8.8 11.8
1982 39.8 29.6 38.1 17.5 7.8 10.0
1983 36.2 34.1 22.2 19.3 9.9 18.1
1984 35.8 38.3 23.9 26.0 10.5 26.4
1985 33.1 36.6 20.6 11.0 11.1 17.2
1986 33.9 39.9 13.1 21.5 4.8 9.2
1987 33.9 37.5 14.9 27.2 6.8 7.8
1988 34.8 34.3 20.0 13.1 7.5 19.3
1989 38.8 40.3 19.8 11.8 10.1 16.8
1990 42.6 38.5 21.3 18.1 11.3 14.3
1993 40.9 38.7 36.5 17.9 8.5 8.9
1995 35.0 37.2 17.2 18.4 6.2 22.0
1996 32.2 48.0 13.8 24.9 6.7 15.0
1997 32.8 32.9 16.6 14.9 6.6 11.4
1998 37.9 35.4 19.5 17.3 5.4 12.4
1999 41.9 31.1 28.3 12.4 5.9 5.0
2000 35.5 33.8 13.1 16.7 5.9 1.7
2001 33.4 - 14.9 - 5.6 -
2002 33.5 34.5 18.2 21.2 5.0 15.1
2003 37.2 31.4 20.3 11.9 9.4 13.4
2004 39.7 30.7 19.6 15.5 6.9 13.3
2006 32.9 35.1 17.6 15.2 5.9 12.8
2007 34.2 32.0 11.6 36.2 6.6 6.8
2008 35.3 30.6 13.4 14.6 5.5 7.5
2009 35.4 31.9 15.8 12.5 7.3 5.8
2010 32.7 31.8 13.6 6.5 4.7 8.6
2011 32.8 33.4 16.3 17.9 5.7 10.0
2012 33.0 35.0 14.5 16.2 4.6 10.7
2013 36.0 35.0 15.0 14.0 4.4 9.0
2014 35.1 - 15.1 - 2.7 -
2015 37.0 34.0 12.0 12.0 6.0 9.0
2017 33.6 - 16.1 - 3.9 -
2019 32.8 - 14.1 - 4.5 -
Figures for 1991 -1992, 1994 not available, 2001, 2014, 2017 and 2019 are traditional sector only, 2005 are commercial sector only
18 Statistics Botswana ANNUAL AGRICULTURAL SURVEY REPORT 2019
TRADITIONAL SECTORANNUAL AGRICULTURAL SURVEY REPORT 2019
TRADITIONAL SECTOR
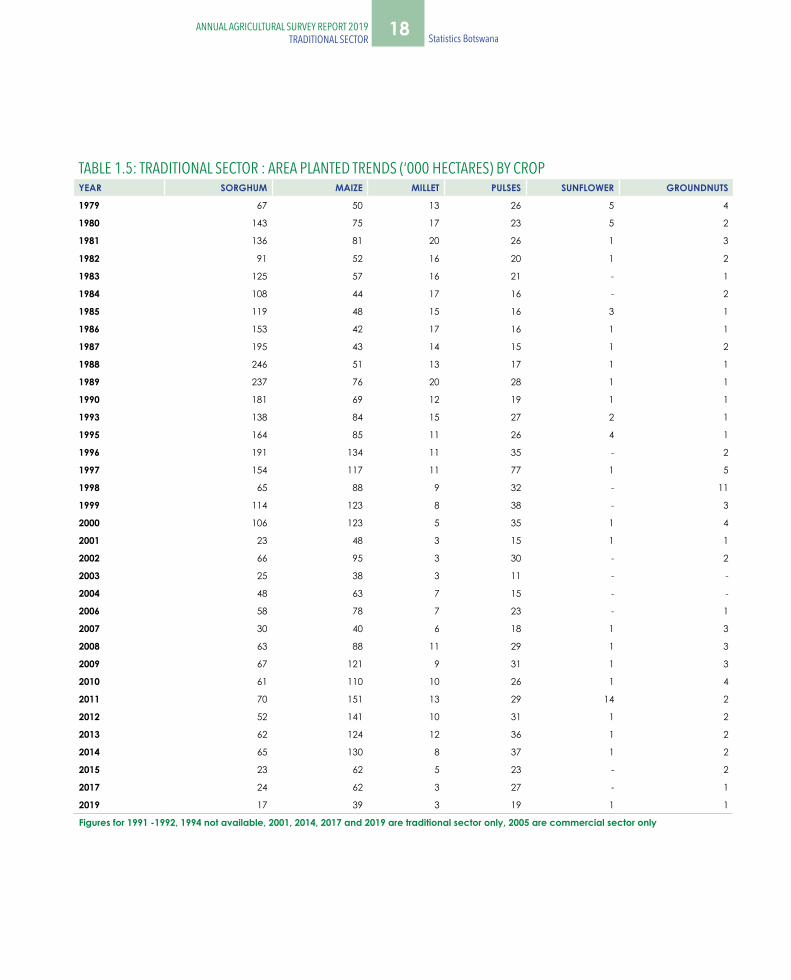
TABLE 1.5: TRADITIONAL SECTOR : AREA PLANTED TRENDS (‘000 HECTARES) BY CROP YEAR SORGHUM MAIZE MILLET PULSES SUNFLOWER GROUNDNUTS
1979 67 50 13 26 5 4
1980 143 75 17 23 5 2
1981 136 81 20 26 1 3
1982 91 52 16 20 1 2
1983 125 57 16 21 - 1
1984 108 44 17 16 - 2
1985 119 48 15 16 3 1
1986 153 42 17 16 1 1
1987 195 43 14 15 1 2
1988 246 51 13 17 1 1
1989 237 76 20 28 1 1
1990 181 69 12 19 1 1
1993 138 84 15 27 2 1
1995 164 85 11 26 4 1
1996 191 134 11 35 - 2
1997 154 117 11 77 1 5
1998 65 88 9 32 - 11
1999 114 123 8 38 - 3
2000 106 123 5 35 1 4
2001 23 48 3 15 1 1
2002 66 95 3 30 - 2
2003 25 38 3 11 - -
2004 48 63 7 15 - -
2006 58 78 7 23 - 1
2007 30 40 6 18 1 3
2008 63 88 11 29 1 3
2009 67 121 9 31 1 3
2010 61 110 10 26 1 4
2011 70 151 13 29 14 2
2012 52 141 10 31 1 2
2013 62 124 12 36 1 2
2014 65 130 8 37 1 2
2015 23 62 5 23 - 2
2017 24 62 3 27 - 1
2019 17 39 3 19 1 1
Figures for 1991 -1992, 1994 not available, 2001, 2014, 2017 and 2019 are traditional sector only, 2005 are commercial sector only

19ANNUAL AGRICULTURAL SURVEY REPORT 2019TRADITIONAL SECTOR Statistics Botswana
TABLE 1.5: TRADITIONAL SECTOR : AREA PLANTED TRENDS (‘000 HECTARES) BY CROP YEAR SORGHUM MAIZE MILLET PULSES SUNFLOWER GROUNDNUTS
1979 67 50 13 26 5 4
1980 143 75 17 23 5 2
1981 136 81 20 26 1 3
1982 91 52 16 20 1 2
1983 125 57 16 21 - 1
1984 108 44 17 16 - 2
1985 119 48 15 16 3 1
1986 153 42 17 16 1 1
1987 195 43 14 15 1 2
1988 246 51 13 17 1 1
1989 237 76 20 28 1 1
1990 181 69 12 19 1 1
1993 138 84 15 27 2 1
1995 164 85 11 26 4 1
1996 191 134 11 35 - 2
1997 154 117 11 77 1 5
1998 65 88 9 32 - 11
1999 114 123 8 38 - 3
2000 106 123 5 35 1 4
2001 23 48 3 15 1 1
2002 66 95 3 30 - 2
2003 25 38 3 11 - -
2004 48 63 7 15 - -
2006 58 78 7 23 - 1
2007 30 40 6 18 1 3
2008 63 88 11 29 1 3
2009 67 121 9 31 1 3
2010 61 110 10 26 1 4
2011 70 151 13 29 14 2
2012 52 141 10 31 1 2
2013 62 124 12 36 1 2
2014 65 130 8 37 1 2
2015 23 62 5 23 - 2
2017 24 62 3 27 - 1
2019 17 39 3 19 1 1
Figures for 1991 -1992, 1994 not available, 2001, 2014, 2017 and 2019 are traditional sector only, 2005 are commercial sector only
TABLE 1.6: TRADITIONAL SECTOR : AREA HARVESTED TRENDS (‘000 HECTARES) BY CROP YEAR SORGHUM MAIZE MILLET PULSES SUNFLOWER GROUNDNUTS
1979 41 19 8 14 4 2
1980 126 41 14 12 5 1
1981 118 54 13 15 1 2
1982 36 12 3 3 1 1
1983 34 16 6 3 - -
1984 46 1 8 3 - -
1985 78 7 10 3 - 1
1986 90 8 10 5 - -
1987 103 3 5 2 - -
1988 219 30 9 10 - -
1989 184 45 11 16 - 1
1990 132 34 9 12 - 1
1993 67 22 11 9 1 1
1995 104 18 7 10 3 -
1996 164 100 9 25 - 1
1997 65 78 8 34 1 4
1998 26 24 5 13 - 9
1999 45 34 5 11 - 1
2000 53 78 3 22 1 2
2001 13 25 2 8 1 1
2002 31 35 - 11 - -
2003 5 8 1 3 - -
2004 39 43 6 8 - -
2006 46 60 6 16 0 1
2007 7 8 2 3 0 0
2008 35 49 7 13 0 1
2009 47 82 8 18 1 2
2010 44 65 9 15 0 3
2011 49 101 11 20 14 1
2012 24 56 7 12 0 1
2013 34 44 8 16 - 1
2014 50 104 7 25 1 1
2015 8 13 3 6 - 1
2017 17 51 3 16 - 1
2019 5 7 2 6 - -
Figures for 1991 -1992, 1994 not available, 2001, 2014, 2017 and 2019 are traditional sector only, 2005 are commercial sector only
20 Statistics Botswana ANNUAL AGRICULTURAL SURVEY REPORT 2019
TRADITIONAL SECTORANNUAL AGRICULTURAL SURVEY REPORT 2019
TRADITIONAL SECTOR
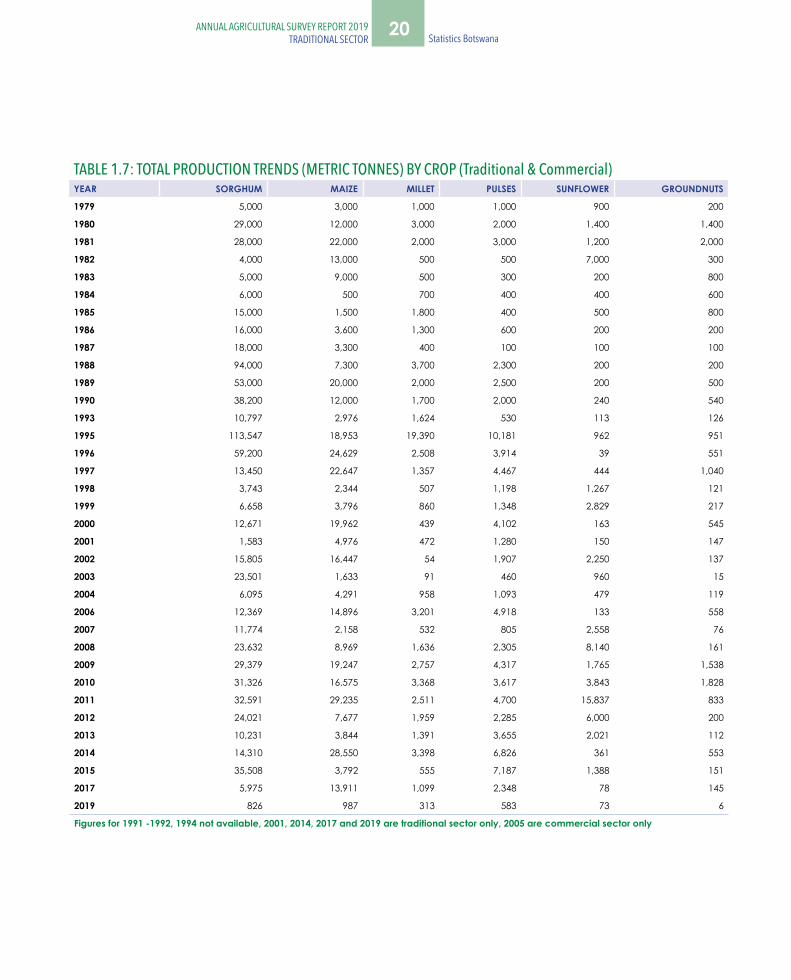
TABLE 1.7: TOTAL PRODUCTION TRENDS (METRIC TONNES) BY CROP (Traditional & Commercial)YEAR SORGHUM MAIZE MILLET PULSES SUNFLOWER GROUNDNUTS
1979 5,000 3,000 1,000 1,000 900 200
1980 29,000 12,000 3,000 2,000 1,400 1,400
1981 28,000 22,000 2,000 3,000 1,200 2,000
1982 4,000 13,000 500 500 7,000 300
1983 5,000 9,000 500 300 200 800
1984 6,000 500 700 400 400 600
1985 15,000 1,500 1,800 400 500 800
1986 16,000 3,600 1,300 600 200 200
1987 18,000 3,300 400 100 100 100
1988 94,000 7,300 3,700 2,300 200 200
1989 53,000 20,000 2,000 2,500 200 500
1990 38,200 12,000 1,700 2,000 240 540
1993 10,797 2,976 1,624 530 113 126
1995 113,547 18,953 19,390 10,181 962 951
1996 59,200 24,629 2,508 3,914 39 551
1997 13,450 22,647 1,357 4,467 444 1,040
1998 3,743 2,344 507 1,198 1,267 121
1999 6,658 3,796 860 1,348 2,829 217
2000 12,671 19,962 439 4,102 163 545
2001 1,583 4,976 472 1,280 150 147
2002 15,805 16,447 54 1,907 2,250 137
2003 23,501 1,633 91 460 960 15
2004 6,095 4,291 958 1,093 479 119
2006 12,369 14,896 3,201 4,918 133 558
2007 11,774 2,158 532 805 2,558 76
2008 23,632 8,969 1,636 2,305 8,140 161
2009 29,379 19,247 2,757 4,317 1,765 1,538
2010 31,326 16,575 3,368 3,617 3,843 1,828
2011 32,591 29,235 2,511 4,700 15,837 833
2012 24,021 7,677 1,959 2,285 6,000 200
2013 10,231 3,844 1,391 3,655 2,021 112
2014 14,310 28,550 3,398 6,826 361 553
2015 35,508 3,792 555 7,187 1,388 151
2017 5,975 13,911 1,099 2,348 78 145
2019 826 987 313 583 73 6
Figures for 1991 -1992, 1994 not available, 2001, 2014, 2017 and 2019 are traditional sector only, 2005 are commercial sector only

21ANNUAL AGRICULTURAL SURVEY REPORT 2019TRADITIONAL SECTOR Statistics Botswana
TABLE 1.8: TRADITIONAL SECTOR: YIELD PER HECTARE PLANTED TRENDS (KG/HA ) BY CROPYEAR SORGHUM MAIZE MILLET PULSES SUNFLOWER GROUNDNUTS
1979 74 58 77 37 150 50
1980 197 150 176 83 200 280
1981 199 253 100 115 400 400
1982 43 203 31 25 350 150
1983 40 148 29 14 200 800
1984 53 10 41 24 200 150
1985 120 31 113 27 167 400
1986 99 82 74 33 211 129
1987 86 70 26 20 175 33
1988 338 141 225 128 200 282
1989 199 224 97 83 200 232
1990 185 147 135 98 300 257
1993 78 36 108 20 51 90
1995 685 220 1,708 394 197 856
1996 310 180 227 109 65 240
1997 67 189 129 58 147 193
1998 55 25 55 38 32 10
1999 47 30 109 36 69 73
2000 119 162 82 116 178 146
2001 68 104 141 87 156 100
2002 89 75 15 63 86 64
2003 37 42 36 41 24 23
2004 213 134 329 134 97 250
2006 211 191 444 218 313 442
2007 42 45 61 34 7 25
2008 82 95 132 69 158 49
2009 118 108 267 99 191 447
2010 101 96 301 111 180 429
2011 93 193 195 133 437 334
2012 144 53 153 63 165 91
2013 71 22 109 7 169 71
2014 220 220 400 182 263 337
2015 83 23 103 35 209 71
2017 251 225 353 86 216 98
2019 48 25 91 31 103 10
Figures for 1991 -1992, 1994 not available, 2001, 2014, 2017 and 2019 are traditional sector only, 2005 are commercial sector only
22 Statistics Botswana ANNUAL AGRICULTURAL SURVEY REPORT 2019
TRADITIONAL SECTORANNUAL AGRICULTURAL SURVEY REPORT 2019
TRADITIONAL SECTOR
ANNUAL AGRICULTURAL SURVEYS SUMMARY
23ANNUAL AGRICULTURAL SURVEY REPORT 2019TRADITIONAL SECTOR Statistics Botswana
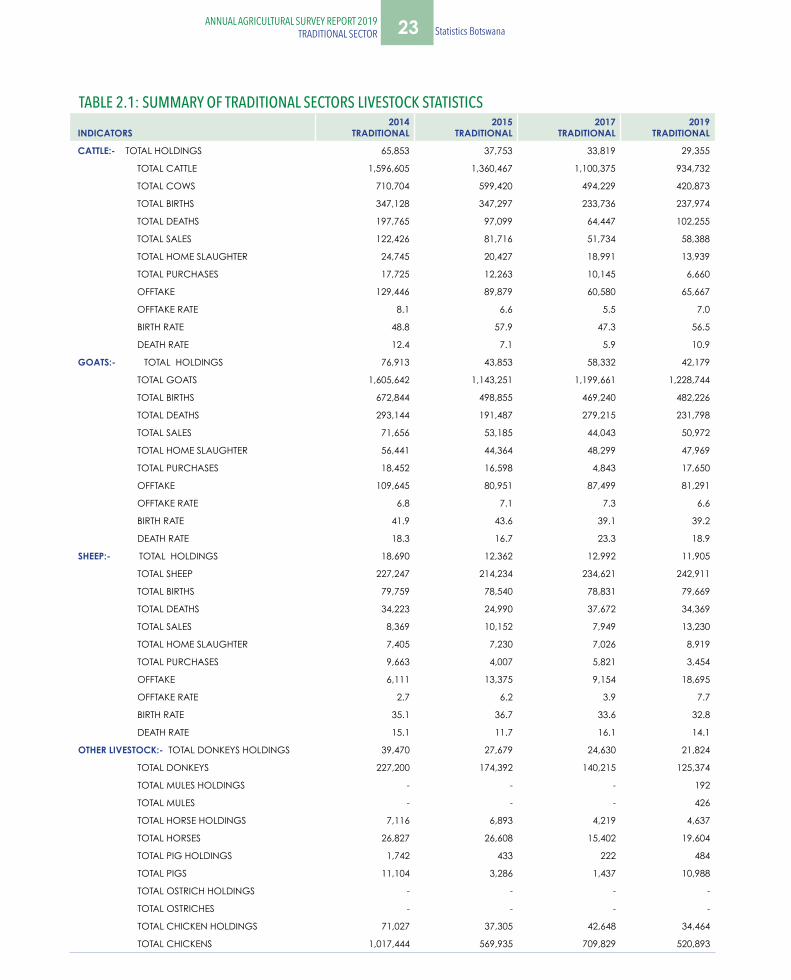
TABLE 2.1: SUMMARY OF TRADITIONAL SECTORS LIVESTOCK STATISTICS
INDICATORS 2014
TRADITIONAL 2015
TRADITIONAL 2017
TRADITIONAL 2019
TRADITIONAL
CATTLE:- TOTAL HOLDINGS 65,853 37,753 33,819 29,355
TOTAL CATTLE 1,596,605 1,360,467 1,100,375 934,732
TOTAL COWS 710,704 599,420 494,229 420,873
TOTAL BIRTHS 347,128 347,297 233,736 237,974
TOTAL DEATHS 197,765 97,099 64,447 102,255
TOTAL SALES 122,426 81,716 51,734 58,388
TOTAL HOME SLAUGHTER 24,745 20,427 18,991 13,939
TOTAL PURCHASES 17,725 12,263 10,145 6,660
OFFTAKE 129,446 89,879 60,580 65,667
OFFTAKE RATE 8.1 6.6 5.5 7.0
BIRTH RATE 48.8 57.9 47.3 56.5
DEATH RATE 12.4 7.1 5.9 10.9
GOATS:- TOTAL HOLDINGS 76,913 43,853 58,332 42,179
TOTAL GOATS 1,605,642 1,143,251 1,199,661 1,228,744
TOTAL BIRTHS 672,844 498,855 469,240 482,226
TOTAL DEATHS 293,144 191,487 279,215 231,798
TOTAL SALES 71,656 53,185 44,043 50,972
TOTAL HOME SLAUGHTER 56,441 44,364 48,299 47,969
TOTAL PURCHASES 18,452 16,598 4,843 17,650
OFFTAKE 109,645 80,951 87,499 81,291
OFFTAKE RATE 6.8 7.1 7.3 6.6
BIRTH RATE 41.9 43.6 39.1 39.2
DEATH RATE 18.3 16.7 23.3 18.9
SHEEP:- TOTAL HOLDINGS 18,690 12,362 12,992 11,905
TOTAL SHEEP 227,247 214,234 234,621 242,911
TOTAL BIRTHS 79,759 78,540 78,831 79,669
TOTAL DEATHS 34,223 24,990 37,672 34,369
TOTAL SALES 8,369 10,152 7,949 13,230
TOTAL HOME SLAUGHTER 7,405 7,230 7,026 8,919
TOTAL PURCHASES 9,663 4,007 5,821 3,454
OFFTAKE 6,111 13,375 9,154 18,695
OFFTAKE RATE 2.7 6.2 3.9 7.7
BIRTH RATE 35.1 36.7 33.6 32.8
DEATH RATE 15.1 11.7 16.1 14.1
OTHER LIVESTOCK:- TOTAL DONKEYS HOLDINGS 39,470 27,679 24,630 21,824
TOTAL DONKEYS 227,200 174,392 140,215 125,374
TOTAL MULES HOLDINGS - - - 192
TOTAL MULES - - - 426
TOTAL HORSE HOLDINGS 7,116 6,893 4,219 4,637
TOTAL HORSES 26,827 26,608 15,402 19,604
TOTAL PIG HOLDINGS 1,742 433 222 484
TOTAL PIGS 11,104 3,286 1,437 10,988
TOTAL OSTRICH HOLDINGS - - - -
TOTAL OSTRICHES - - - -
TOTAL CHICKEN HOLDINGS 71,027 37,305 42,648 34,464
TOTAL CHICKENS 1,017,444 569,935 709,829 520,893
24 Statistics Botswana ANNUAL AGRICULTURAL SURVEY REPORT 2019
TRADITIONAL SECTORANNUAL AGRICULTURAL SURVEY REPORT 2019
TRADITIONAL SECTOR
TABLE 2.2: SUMMARY OF TRADITIONAL SECTORS CROP STATISTICS
INDICATORS 2014
TRADITIONAL 2015
TRADITIONAL 2017
TRADITIONAL 2019
TRADITIONAL
LAND HOLDINGS:- TOTAL HOLDINGS WITH LAND 76,562 41,043 35,173 30,212
TOTAL LAND AREA (HA) 272,994 204,965 135,315 117,416
TOTAL CROP HOLDINGS 72,322 30,150 33,399 24,396
TOTAL AREA PLANTED (HA) 255,462 123,251 126,821 88,288
TOTAL HOLDINGS HARVESTED - - 28,585 10,956
TOTAL AREA HARVESTED (HA) 196,399 32,641 92,942 22,866
SORGHUM:- TOTAL HOLDINGS 42,466 18,226 19,859 15,058
TOTAL AREA PLANTED (HA) 65,053 23,223 23,766 17,126
TOTAL AREA HARVESTED (HA) 50,198 7,925 16,512 5,136
TOTAL PRODUCTION (METRIC TONS) 14,310 1,927 5,975 826
AVERAGE YIELD PER HECTARE PLANTED (KG) 220 83 251 48
AVERAGE YIELD PER HECTARE HARVESTED (KG) 285 243 362 161
MAIZE:- TOTAL HOLDINGS 68,142 31,154 34,828 23,424
TOTAL AREA PLANTED (HA) 130,042 61,803 61,706 39,201
TOTAL AREA HARVESTED (HA) 104,197 13,318 51,030 6,660
TOTAL PRODUCTION (METRIC TONS) 28,550 1,417 13,911 987
YIELD PER HECTARE PLANTED (KG) 220 23 225 25
YIELD PER HECTARE HARVESTED (KG) 274 106 273 148
MILLET:- TOTAL HOLDINGS 16,170 6,565 6,243 5,149
TOTAL AREA PLANTED (HA) 8,490 4,981 3,118 3,432
TOTAL AREA HARVESTED (HA) 6,850 2,750 2,538 1,604
TOTAL PRODUCTION (METRIC TONS) 3,398 513 1,099 313
YIELD PER HECTARE PLANTED (KG) 400 103 352 91
YIELD PER HECTARE HARVESTED (KG) 496 187 433 195
BEANS/PULSES:- TOTAL HOLDINGS 64,876 36,595 35,628 27,869
TOTAL AREA PLANTED (HA) 37,413 22,573 27,251 18,950
TOTAL AREA HARVESTED (HA) 25,185 5,639 15,701 5,700
TOTAL PRODUCTION (METRIC TONS) 6,826 796 2,348 583
YIELD PER HECTARE PLANTED (KG) 182 35 86 31
YIELD PER HECTARE HARVESTED (KG) 271 141 150 102
GROUNDNUTS:- TOTAL HOLDINGS 10,761 7,089 4,062 2,541
TOTAL AREA PLANTED (HA) 1,642 2,111 1,476 629
TOTAL AREA HARVESTED (HA) 1,239 631 896 248
TOTAL PRODUCTION (METRIC TONS) 553 150 145 6
YIELD PER HECTARE PLANTED (KG) 337 71 98 10
YIELD PER HECTARE HARVESTED (KG) 446 238 162 24
SUNFLOWER:- TOTAL HOLDINGS 2,158 1,428 822 848
TOTAL AREA PLANTED (HA) 1,372 328 360 709
TOTAL AREA HARVESTED (HA) 1,272 235 295 453
TOTAL PRODUCTION (METRIC TONS) 361 68 78 73
YIELD PER HECTARE PLANTED (KG) 263 207 217 103
YIELD PER HECTARE HARVESTED (KG) 284 289 264 161
25ANNUAL AGRICULTURAL SURVEY REPORT 2019TRADITIONAL SECTOR Statistics Botswana
TABLE 2.3:TRADITIONAL: LAND, CROP, CATTLE, GOATS AND SHEEP HOLDINGS BY DISTRICT
District Total
HoldingsHoldings
with LandCrop
HoldingsCattle
HoldingsGoat
HoldingsSheep
Holdings
Ngwaketse 4,897 2,989 2,315 3,061 4,126 1,811
Barolong 4,579 1,936 1,550 2,136 3,752 1,035
Ngwaketse West 379 200 149 222 251 116
South East 847 461 406 280 785 189
Kweneng East 7,819 5,336 4,518 3,290 6,841 2,425
Kweneng West 2,804 1,247 1,121 1,710 2,176 579
Kgatleng 2,952 1,418 1,215 2,110 2,206 756
Central Serowe/ Palapye 3,679 1,795 1,548 2,686 3,007 810
Central Mahalapye 4,535 2,742 2,630 1,861 2,915 588
Central Bobonong 2,526 1,404 1,286 1,547 2,216 804
Central Boteti 1,413 366 238 1,067 1,265 399
Central Tutume 3,554 1,698 1,267 2,012 2,990 699
North East 5,711 4,298 3,631 1,925 4,061 435
Ngamiland East 2,026 744 485 1,312 1,626 410
Ngamiland West 4,135 2,880 1,580 2,335 1,711 30
Chobe 462 356 317 98 242 6
Ghanzi 1,267 259 113 855 879 329
Kgalagadi South 974 26 - 651 851 662
Kgalagadi North 350 58 26 198 279 75
TOTAL TRADITIONAL 54,907 30,212 24,396 29,355 42,179 12,156
26 Statistics Botswana ANNUAL AGRICULTURAL SURVEY REPORT 2019
TRADITIONAL SECTORANNUAL AGRICULTURAL SURVEY REPORT 2019
TRADITIONAL SECTOR
HOLDERS AND THEIR CHARACTERISTICS: TRADITIONAL SECTOR:
27ANNUAL AGRICULTURAL SURVEY REPORT 2019TRADITIONAL SECTOR Statistics Botswana
TABLE 3.1: NUMBER OF HOLDERS BY GENDER AND DISTRICT
District
Male Female Total Number of HoldersNumber Percentage Number Percentage
Ngwaketse 3,291 9.5 1,606 7.9 4,897
Barolong 2,345 6.8 2,234 11.0 4,579
Ngwaketse West 299 0.9 80 0.4 379
South East 618 1.8 229 1.1 847
Kweneng East 5,281 15.2 2,537 12.5 7,819
Kweneng West 1,894 5.5 910 4.5 2,804
Kgatleng 2,496 7.2 455 2.3 2,952
Central Serowe/ Palapye 2,703 7.8 976 4.8 3,679
Central Mahalapye 2,716 7.8 1,819 9.0 4,535
Central Bobonong 1,610 4.6 917 4.5 2,526
Central Boteti 973 2.8 440 2.2 1,413
Central Tutume 2,296 6.6 1,258 6.2 3,554
North East 2,568 7.4 3,143 15.5 5,711
Ngamiland East 1,379 4.0 646 3.2 2,026
Ngamiland West 2,300 6.6 1,835 9.1 4,135
Chobe 235 0.7 227 1.1 462
Ghanzi 871 2.5 395 2.0 1,267
Kgalagadi South 594 1.7 380 1.9 974
Kgalagadi North 204 0.6 146 0.7 350
TOTAL TRADITIONAL 34,673 100.0 20,234 100.0 54,907
28 Statistics Botswana ANNUAL AGRICULTURAL SURVEY REPORT 2019
TRADITIONAL SECTORANNUAL AGRICULTURAL SURVEY REPORT 2019
TRADITIONAL SECTOR
TABLE 3.2: NUMBER OF HOLDERS BY MARITAL STATUS AND DISTRICT
DistrictNever
Married MarriedLiving
Together Separated Divorced WidowedTotal
Holders
Ngwaketse 1,291 1,954 784 26 109 733 4,897
Barolong 1,365 1,577 523 86 78 950 4,579
Ngwaketse West 64 210 89 - - 16 379
South East 223 463 24 10 2 126 847
Kweneng East 1,865 3,491 1,123 18 91 1,231 7,819
Kweneng West 639 1,327 498 10 37 294 2,804
Kgatleng 643 1,721 141 10 66 371 2,952
Central Serowe/ Palapye 583 1,920 506 57 104 510 3,679
Central Mahalapye 638 1,681 1,480 97 54 585 4,535
Central Bobonong 520 992 426 13 57 518 2,526
Central Boteti 340 603 231 4 57 178 1,413
Central Tutume 815 1,332 591 8 103 705 3,554
North East 1,394 1,811 667 9 227 1,603 5,711
Ngamiland East 628 805 396 14 11 172 2,026
Ngamiland West 1,724 1,192 622 82 5 509 4,135
Chobe 138 58 159 4 - 103 462
Ghanzi 260 380 527 - 17 83 1,267
Kgalagadi South 252 437 42 4 15 223 974
Kgalagadi North 100 91 123 - 2 34 350
TOTAL TRADITIONAL 13,481 22,045 8,953 452 1,033 8,944 54,907
TABLE 3.3: NUMBER OF MALE HOLDERS BY MARITAL STATUS AND DISTRICT
DistrictNever
Married MarriedLiving
Together Separated Divorced WidowedTotal
Holders
Ngwaketse 701 1,812 583 6 64 125 3,291
Barolong 424 1,356 346 71 56 92 2,345
Ngwaketse West 46 197 56 - - - 299
South East 172 421 10 10 2 3 618
Kweneng East 1,104 3,015 767 - 61 335 5,281
Kweneng West 265 1,250 294 10 7 68 1,894
Kgatleng 506 1,695 96 5 33 161 2,496
Central Serowe/ Palapye 346 1,864 282 57 82 71 2,703
Central Mahalapye 212 1,608 644 87 49 116 2,716
Central Bobonong 236 967 306 13 15 72 1,610
Central Boteti 198 569 135 4 15 52 973
Central Tutume 406 1,276 385 8 82 139 2,296
North East 269 1,568 426 - 60 244 2,568
Ngamiland East 366 742 218 4 2 47 1,379
Ngamiland West 790 1,089 378 15 - 28 2,300
Chobe 72 51 96 3 - 13 235
Ghanzi 136 323 370 - 5 38 871
Kgalagadi South 104 412 36 4 - 38 594
Kgalagadi North 33 86 69 - 2 13 204
TOTAL TRADITIONAL 6,387 20,302 5,497 298 534 1,656 34,673
29ANNUAL AGRICULTURAL SURVEY REPORT 2019TRADITIONAL SECTOR Statistics Botswana
TABLE 3.4: NUMBER OF FEMALE HOLDERS BY MARITAL STATUS AND DISTRICT
DistrictNever
Married MarriedLiving
Together Separated Divorced WidowedTotal
Holders
Ngwaketse 590 142 201 20 45 609 1,606
Barolong 940 221 178 14 22 858 2,234
Ngwaketse West 18 12 33 - - 16 80
South East 51 42 14 - - 122 229
Kweneng East 761 476 356 18 30 896 2,537
Kweneng West 374 77 203 - 30 226 910
Kgatleng 136 26 46 5 33 210 455
Central Serowe/ Palapye 237 55 224 - 21 438 976
Central Mahalapye 426 74 836 10 5 469 1,819
Central Bobonong 284 25 120 - 42 446 917
Central Boteti 142 33 96 - 42 126 440
Central Tutume 409 56 206 - 21 566 1,258
North East 1,125 244 240 9 166 1,359 3,143
Ngamiland East 262 63 178 10 9 125 646
Ngamiland West 935 104 244 67 5 481 1,835
Chobe 66 7 63 1 - 90 227
Ghanzi 124 56 158 - 13 45 395
Kgalagadi South 148 25 7 - 15 185 380
Kgalagadi North 67 5 54 - - 20 146
TOTAL TRADITIONAL 7,094 1,743 3,457 154 498 7,288 20,234
TABLE 3.5: NUMBER OF HOLDERS BY AGE GROUP AND DISTRICT
District 15-
19
20-
24
25-
29
30-
34
35-
39
40-
44
45-
49
50-
54
55-
59
60-
64
65-
98
Age
not
kn
own
Tota
l ho
lder
s
Ngwaketse - 26 127 225 301 268 428 502 641 550 1,828 - 4,897
Barolong - 15 33 135 227 272 290 507 552 734 1,815 - 4,579
Ngwaketse West - - - 5 30 49 26 91 39 50 89 - 379
South East - - 10 23 48 20 43 101 75 100 428 - 847
Kweneng East - 60 112 206 622 768 675 814 959 930 2,664 9 7,819
Kweneng West - 9 7 113 173 281 302 350 370 247 943 8 2,804
Kgatleng - - 22 31 88 418 273 321 517 327 952 3 2,952
Central Serowe 47 - 10 115 209 228 499 325 368 541 1,337 - 3,679
Central Mahalapye - - 28 88 159 345 381 766 657 533 1,574 4 4,535
Central Bobonong - 15 23 58 175 225 248 258 271 337 912 4 2,526
Central Boteti 7 4 17 88 151 72 139 189 240 168 339 - 1,413
Central Tutume - - 73 106 188 320 313 348 441 551 1,175 40 3,554
North East - - 26 172 237 442 411 522 584 663 2,640 15 5,711
Ngamiland East 4 15 36 137 188 262 143 154 317 244 524 - 2,026
Ngamiland West 2 39 102 229 520 423 443 339 380 411 1,242 3 4,135
Chobe - 6 1 29 55 30 79 29 51 44 134 4 462
Ghanzi - 29 114 75 154 137 150 161 169 93 185 - 1,267
Kgalagadi South - - 2 38 82 62 81 117 174 93 324 - 974
Kgalagadi North - - 19 19 35 65 59 46 22 35 51 - 350
TOTAL TRADITIONAL 60 217 762 1,890 3,639 4,687 4,982 5,943 6,826 6,652 19,159 89 54,907
30 Statistics Botswana ANNUAL AGRICULTURAL SURVEY REPORT 2019
TRADITIONAL SECTORANNUAL AGRICULTURAL SURVEY REPORT 2019
TRADITIONAL SECTOR
TABLE 3.6: NUMBER OF HOLDERS BY TYPE OF HOLDING OPERATION AND DISTRICT
District
Holders Living Within The Holdings Holders Not Living Within The Holdings
OtherTotal
HoldersAn individual living on site
Households with two or more persons living on site
An individual living elsewhere
Households with two or more persons living elsewhere
Ngwaketse 2,227 1,322 747 583 19 4,897
Barolong 3,701 672 147 58 - 4,579
Ngwaketse West 199 - 180 - - 379
South East 229 272 145 156 45 847
Kweneng East 3,139 2,220 1,401 998 61 7,819
Kweneng West 1,180 616 616 391 - 2,804
Kgatleng 601 802 538 974 37 2,952
Central Serowe/ Palapye 974 1,105 403 949 248 3,679
Central Mahalapye 1,241 1,638 307 635 714 4,535
Central Bobonong 842 628 314 546 197 2,526
Central Boteti 536 329 183 328 38 1,413
Central Tutume 1,267 822 798 613 54 3,554
North East 3,716 1,626 242 51 76 5,711
Ngamiland East 1,036 720 158 106 6 2,026
Ngamiland West 3,466 601 46 21 - 4,135
Chobe 301 126 29 6 - 462
Ghanzi 1,112 - 151 3 - 1,267
Kgalagadi South 358 245 197 173 - 974
Kgalagadi North 252 - 97 - - 350
TOTAL TRADITIONAL 26,375 13,743 6,702 6,592 1,496 54,907
TABLE 3.7: NUMBER OF HOLDINGS BY HOLDERS’ STATUS (FULLTIME FARMER OR NOT) AND DISTRICT
District
YES NO Total HoldersNumber Percentage Number Percentage
Ngwaketse 3,971 9.1 925 8.4 4,897
Barolong 3,775 8.6 804 7.3 4,579
Ngwaketse West 223 0.5 156 1.4 379
South East 723 1.6 124 1.1 847
Kweneng East 6,027 13.7 1,792 16.2 7,819
Kweneng West 2,310 5.3 494 4.5 2,804
Kgatleng 2,211 5.0 741 6.7 2,952
Central Serowe/ Palapye 2,949 6.7 730 6.6 3,679
Central Mahalapye 3,922 8.9 613 5.6 4,535
Central Bobonong 2,048 4.7 478 4.3 2,526
Central Boteti 1,126 2.6 287 2.6 1,413
Central Tutume 2,774 6.3 781 7.1 3,554
North East 4,186 9.5 1,525 13.8 5,711
Ngamiland East 1,749 4.0 277 2.5 2,026
Ngamiland West 3,646 8.3 489 4.4 4,135
Chobe 263 0.6 199 1.8 462
Ghanzi 1,005 2.3 261 2.4 1,267
Kgalagadi South 693 1.6 281 2.5 974
Kgalagadi North 278 0.6 72 0.7 350
TOTAL TRADITIONAL 43,878 100.0 11,029 100.0 54,907
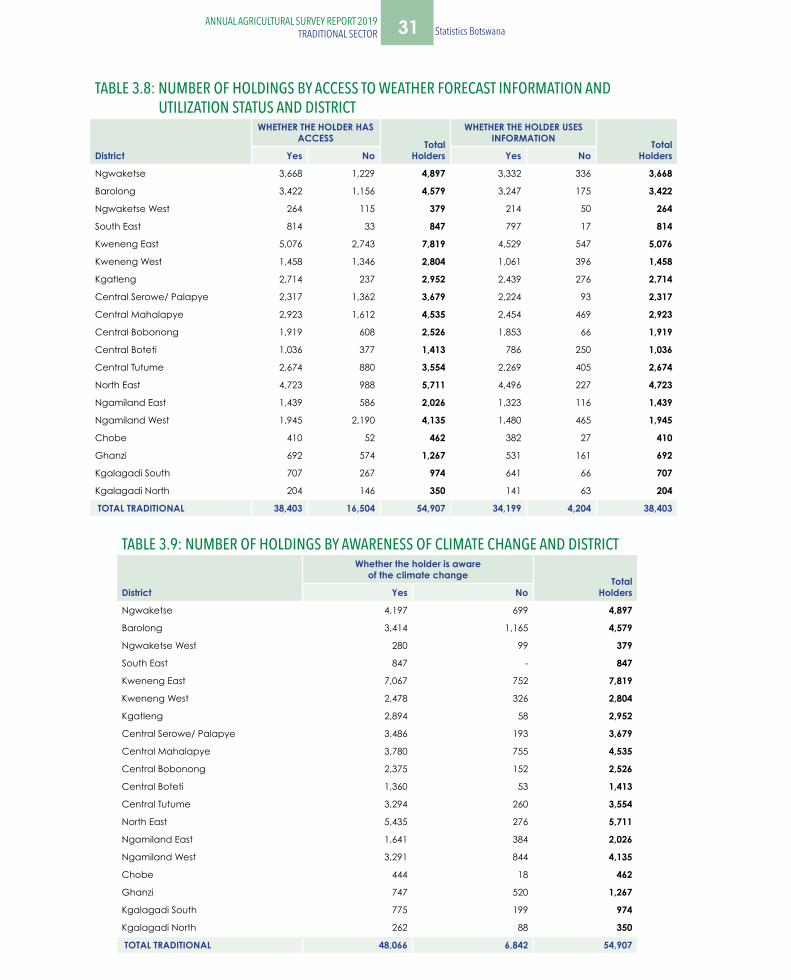
31ANNUAL AGRICULTURAL SURVEY REPORT 2019TRADITIONAL SECTOR Statistics Botswana
TABLE 3.8: NUMBER OF HOLDINGS BY ACCESS TO WEATHER FORECAST INFORMATION AND UTILIZATION STATUS AND DISTRICT
District
WHETHER THE HOLDER HAS ACCESS Total
Holders
WHETHER THE HOLDER USES INFORMATION Total
HoldersYes No Yes No
Ngwaketse 3,668 1,229 4,897 3,332 336 3,668
Barolong 3,422 1,156 4,579 3,247 175 3,422
Ngwaketse West 264 115 379 214 50 264
South East 814 33 847 797 17 814
Kweneng East 5,076 2,743 7,819 4,529 547 5,076
Kweneng West 1,458 1,346 2,804 1,061 396 1,458
Kgatleng 2,714 237 2,952 2,439 276 2,714
Central Serowe/ Palapye 2,317 1,362 3,679 2,224 93 2,317
Central Mahalapye 2,923 1,612 4,535 2,454 469 2,923
Central Bobonong 1,919 608 2,526 1,853 66 1,919
Central Boteti 1,036 377 1,413 786 250 1,036
Central Tutume 2,674 880 3,554 2,269 405 2,674
North East 4,723 988 5,711 4,496 227 4,723
Ngamiland East 1,439 586 2,026 1,323 116 1,439
Ngamiland West 1,945 2,190 4,135 1,480 465 1,945
Chobe 410 52 462 382 27 410
Ghanzi 692 574 1,267 531 161 692
Kgalagadi South 707 267 974 641 66 707
Kgalagadi North 204 146 350 141 63 204
TOTAL TRADITIONAL 38,403 16,504 54,907 34,199 4,204 38,403
TABLE 3.9: NUMBER OF HOLDINGS BY AWARENESS OF CLIMATE CHANGE AND DISTRICT
District
Whether the holder is aware of the climate change Total
HoldersYes No
Ngwaketse 4,197 699 4,897
Barolong 3,414 1,165 4,579
Ngwaketse West 280 99 379
South East 847 - 847
Kweneng East 7,067 752 7,819
Kweneng West 2,478 326 2,804
Kgatleng 2,894 58 2,952
Central Serowe/ Palapye 3,486 193 3,679
Central Mahalapye 3,780 755 4,535
Central Bobonong 2,375 152 2,526
Central Boteti 1,360 53 1,413
Central Tutume 3,294 260 3,554
North East 5,435 276 5,711
Ngamiland East 1,641 384 2,026
Ngamiland West 3,291 844 4,135
Chobe 444 18 462
Ghanzi 747 520 1,267
Kgalagadi South 775 199 974
Kgalagadi North 262 88 350
TOTAL TRADITIONAL 48,066 6,842 54,907

32 Statistics Botswana ANNUAL AGRICULTURAL SURVEY REPORT 2019
TRADITIONAL SECTORANNUAL AGRICULTURAL SURVEY REPORT 2019
TRADITIONAL SECTOR
TABLE 3.10: NUMBER OF HOLDINGS BY TYPE OF CLIMATE CHANGES NOTICED OVER YEARS AND DISTRICT
District Shift in
SeasonsOut Break of
Diseases / PestsHeavy
FallsSevere
Drought None
Ngwaketse 2,742 193 141 2,278 98
Barolong 2,056 103 115 2,610 12
Ngwaketse West 270 - - 178 -
South East 673 115 125 762 -
Kweneng East 5,936 188 477 2,382 9
Kweneng West 1,095 12 78 1,462 11
Kgatleng 1,894 653 845 2,205 -
Central Serowe/ Palapye 2,311 218 361 1,462 184
Central Mahalapye 907 47 352 3,173 178
Central Bobonong 992 188 130 1,608 16
Central Boteti 841 7 10 738 216
Central Tutume 1,973 118 60 1,922 -
North East 3,673 87 122 3,557 184
Ngamiland East 1,450 12 24 653 17
Ngamiland West 677 28 23 2,693 26
Chobe 189 - 1 322 -
Ghanzi 378 - - 694 -
Kgalagadi South 543 23 - 600 6
Kgalagadi North 135 - 4 241 -
TOTAL TRADITIONAL 28,736 1,992 2,868 29,542 955
TABLE 3.11: NUMBER OF HOLDINGS BY RELIABLE WATER SOURCE FOR LIVESTOCK WATERING AND DISTRICT
District/Region Borehole Well/Petse Dam River Lecha
(Pan) Pond
(Mogobe)Aldep
TankTotal
Holders
Ngwaketse 2,474 35 1,541 715 27 - - 4,793
Barolong 2,829 64 1,442 63 49 6 11 4,465
Ngwaketse West 295 39 - - - - - 334
South East 486 - 114 225 - - 23 847
Kweneng East 4,157 1,009 1,597 897 - - - 7,661
Kweneng West 2,456 10 126 - 13 - - 2,605
Kgatleng 2,185 19 210 298 10 69 65 2,856
Central Serowe/ Palapye 1,984 792 495 227 1 9 16 3,524
Central Mahalapye 3,043 427 74 352 - 9 7 3,912
Central Bobonong 683 858 108 764 20 14 10 2,458
Central Boteti 969.2 129.2 54.7 248.6 - - - 1,402
Central Tutume 1,550 557 657 496 70 20 - 3,350
North East 779 149 2,595 1,051 89 114 41 4,818
Ngamiland East 1,039 251 - 625 30 7 7 1,960
Ngamiland West 365 937 - 2,130 - - 5 3,438
Chobe 257 30 8 16 - 6 - 316
Ghanzi 1,219 5 5 - 3 - - 1,232
Kgalagadi South 878 71 15 - - - - 964
Kgalagadi North 318 - - - 14 - - 332
TOTAL TRADITIONAL 27,969 5,383 9,042 8,109 327 252 184 51,267
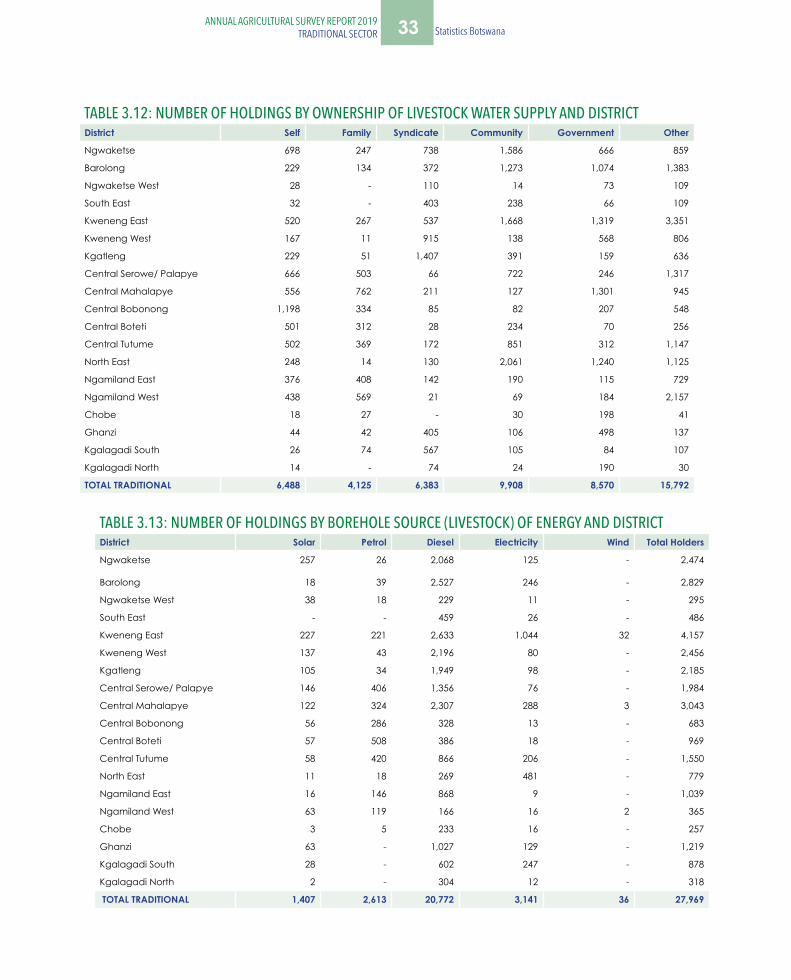
33ANNUAL AGRICULTURAL SURVEY REPORT 2019TRADITIONAL SECTOR Statistics Botswana
TABLE 3.12: NUMBER OF HOLDINGS BY OWNERSHIP OF LIVESTOCK WATER SUPPLY AND DISTRICTDistrict Self Family Syndicate Community Government Other
Ngwaketse 698 247 738 1,586 666 859
Barolong 229 134 372 1,273 1,074 1,383
Ngwaketse West 28 - 110 14 73 109
South East 32 - 403 238 66 109
Kweneng East 520 267 537 1,668 1,319 3,351
Kweneng West 167 11 915 138 568 806
Kgatleng 229 51 1,407 391 159 636
Central Serowe/ Palapye 666 503 66 722 246 1,317
Central Mahalapye 556 762 211 127 1,301 945
Central Bobonong 1,198 334 85 82 207 548
Central Boteti 501 312 28 234 70 256
Central Tutume 502 369 172 851 312 1,147
North East 248 14 130 2,061 1,240 1,125
Ngamiland East 376 408 142 190 115 729
Ngamiland West 438 569 21 69 184 2,157
Chobe 18 27 - 30 198 41
Ghanzi 44 42 405 106 498 137
Kgalagadi South 26 74 567 105 84 107
Kgalagadi North 14 - 74 24 190 30
TOTAL TRADITIONAL 6,488 4,125 6,383 9,908 8,570 15,792
TABLE 3.13: NUMBER OF HOLDINGS BY BOREHOLE SOURCE (LIVESTOCK) OF ENERGY AND DISTRICTDistrict Solar Petrol Diesel Electricity Wind Total Holders
Ngwaketse 257 26 2,068 125 - 2,474
Barolong 18 39 2,527 246 - 2,829
Ngwaketse West 38 18 229 11 - 295
South East - - 459 26 - 486
Kweneng East 227 221 2,633 1,044 32 4,157
Kweneng West 137 43 2,196 80 - 2,456
Kgatleng 105 34 1,949 98 - 2,185
Central Serowe/ Palapye 146 406 1,356 76 - 1,984
Central Mahalapye 122 324 2,307 288 3 3,043
Central Bobonong 56 286 328 13 - 683
Central Boteti 57 508 386 18 - 969
Central Tutume 58 420 866 206 - 1,550
North East 11 18 269 481 - 779
Ngamiland East 16 146 868 9 - 1,039
Ngamiland West 63 119 166 16 2 365
Chobe 3 5 233 16 - 257
Ghanzi 63 - 1,027 129 - 1,219
Kgalagadi South 28 - 602 247 - 878
Kgalagadi North 2 - 304 12 - 318
TOTAL TRADITIONAL 1,407 2,613 20,772 3,141 36 27,969

34 Statistics Botswana ANNUAL AGRICULTURAL SURVEY REPORT 2019
TRADITIONAL SECTORANNUAL AGRICULTURAL SURVEY REPORT 2019
TRADITIONAL SECTOR
TABLE 3.14: NUMBER OF HOLDINGS BY LIVESTOCK FEEDS STATUS AND DISTRICT
District
SUPPLEMENTARY FEED - CATTLE SUPPLEMENTARY FEED - GOATS SUPPLEMENTARY FEED - SHEEP
Yes NoTotal Cattle
Holdings Yes NoTotal Goat
Holdings Yes NoTotal Sheep
Holdings
Ngwaketse 1,677 1,421 3,098 1,289 2,881 4,170 652 1,197 1,849
Barolong 1,252 884 2,136 1,583 2,199 3,782 592 450 1,041
Ngwaketse West 140 88 229 124 127 251 70 46 116
South East 190 94 284 283 511 795 69 142 211
Kweneng East 1,617 1,715 3,332 1,765 5,076 6,841 757 1,668 2,425
Kweneng West 1,033 690 1,723 599 1,613 2,212 245 340 585
Kgatleng 979 1,131 2,110 720 1,486 2,206 350 412 762
Central Serowe/ Palapye 1,013 1,685 2,698 576 2,448 3,024 302 508 810
Central Mahalapye 673 1,191 1,864 431 2,490 2,922 151 444 595
Central Bobonong 449 1,098 1,547 475 1,741 2,216 238 566 804
Central Boteti 370 697 1,067 490 776 1,265 121 109 230
Central Tutume 641 1,372 2,014 461 2,529 2,990 154 549 702
North East 511 1,422 1,933 625 3,470 4,094 123 312 435
Ngamiland East 291 1,084 1,375 288 1,366 1,654 71 339 410
Ngamiland West 623 1,722 2,345 331 1,384 1,715 4 26 30
Chobe 17 81 98 41 201 242 6 - 6
Ghanzi 427 436 863 256 622 879 151 178 329
Kgalagadi South 371 281 651 440 411 851 364 219 583
Kgalagadi North 63 139 202 83 196 279 25 50 75
TOTAL TRADITIONAL 12,337 17,231 29,567 10,859 31,528 42,387 4,444 7,554 11,998
TABLE 3.15: NUMBER OF HOLDINGS BY CATTLE VACCINATION AND DISTRICT
District
WHETHER CATTLE VACCINATED Total Cattle Holdings Yes Percentage No Percentage
Ngwaketse 2,275 10.9 823 9.4 3,098
Barolong 1,661 8.0 474 5.4 2,136
Ngwaketse West 158 0.8 71 0.8 229
South East 206 1.0 77 0.9 284
Kweneng East 1,842 8.8 1,490 17.1 3,332
Kweneng West 882 4.2 841 9.6 1,723
Kgatleng 1,242 6.0 869 10.0 2,110
Central Serowe/ Palapye 2,207 10.6 492 5.6 2,698
Central Mahalapye 1,006 4.8 858 9.8 1,864
Central Bobonong 1,077 5.2 470 5.4 1,547
Central Boteti 474 2.3 593 6.8 1,067
Central Tutume 1,330 6.4 684 7.8 2,014
North East 1,690 8.1 243 2.8 1,933
Ngamiland East 1,229 5.9 146 1.7 1,375
Ngamiland West 2,168 10.4 177 2.0 2,345
Chobe 98 0.5 - - 98
Ghanzi 622 3.0 241 2.8 863
Kgalagadi South 519 2.5 132 1.5 651
Kgalagadi North 158 0.8 44 0.5 202
TOTAL TRADITIONAL 20,843 100.0 8,724 100.0 29,567
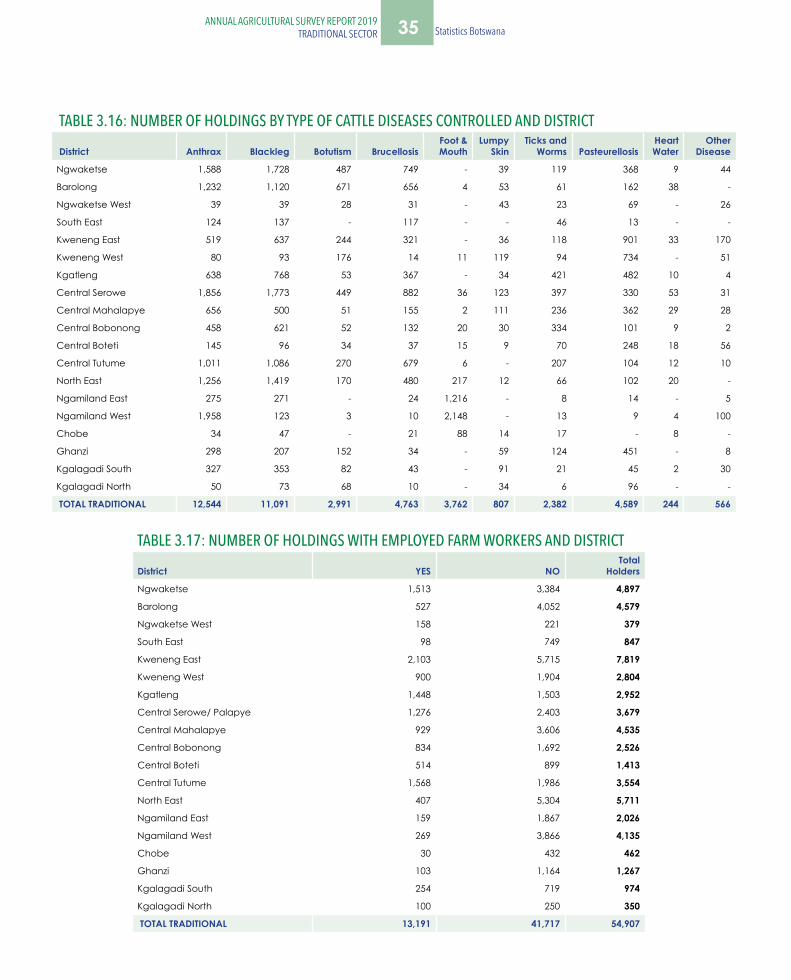
35ANNUAL AGRICULTURAL SURVEY REPORT 2019TRADITIONAL SECTOR Statistics Botswana
TABLE 3.17: NUMBER OF HOLDINGS WITH EMPLOYED FARM WORKERS AND DISTRICT
District YES NO Total
Holders
Ngwaketse 1,513 3,384 4,897
Barolong 527 4,052 4,579
Ngwaketse West 158 221 379
South East 98 749 847
Kweneng East 2,103 5,715 7,819
Kweneng West 900 1,904 2,804
Kgatleng 1,448 1,503 2,952
Central Serowe/ Palapye 1,276 2,403 3,679
Central Mahalapye 929 3,606 4,535
Central Bobonong 834 1,692 2,526
Central Boteti 514 899 1,413
Central Tutume 1,568 1,986 3,554
North East 407 5,304 5,711
Ngamiland East 159 1,867 2,026
Ngamiland West 269 3,866 4,135
Chobe 30 432 462
Ghanzi 103 1,164 1,267
Kgalagadi South 254 719 974
Kgalagadi North 100 250 350
TOTAL TRADITIONAL 13,191 41,717 54,907
TABLE 3.16: NUMBER OF HOLDINGS BY TYPE OF CATTLE DISEASES CONTROLLED AND DISTRICT
District Anthrax Blackleg Botutism Brucellosis Foot & Mouth
Lumpy Skin
Ticks and Worms Pasteurellosis
Heart Water
Other Disease
Ngwaketse 1,588 1,728 487 749 - 39 119 368 9 44
Barolong 1,232 1,120 671 656 4 53 61 162 38 -
Ngwaketse West 39 39 28 31 - 43 23 69 - 26
South East 124 137 - 117 - - 46 13 - -
Kweneng East 519 637 244 321 - 36 118 901 33 170
Kweneng West 80 93 176 14 11 119 94 734 - 51
Kgatleng 638 768 53 367 - 34 421 482 10 4
Central Serowe 1,856 1,773 449 882 36 123 397 330 53 31
Central Mahalapye 656 500 51 155 2 111 236 362 29 28
Central Bobonong 458 621 52 132 20 30 334 101 9 2
Central Boteti 145 96 34 37 15 9 70 248 18 56
Central Tutume 1,011 1,086 270 679 6 - 207 104 12 10
North East 1,256 1,419 170 480 217 12 66 102 20 -
Ngamiland East 275 271 - 24 1,216 - 8 14 - 5
Ngamiland West 1,958 123 3 10 2,148 - 13 9 4 100
Chobe 34 47 - 21 88 14 17 - 8 -
Ghanzi 298 207 152 34 - 59 124 451 - 8
Kgalagadi South 327 353 82 43 - 91 21 45 2 30
Kgalagadi North 50 73 68 10 - 34 6 96 - -
TOTAL TRADITIONAL 12,544 11,091 2,991 4,763 3,762 807 2,382 4,589 244 566
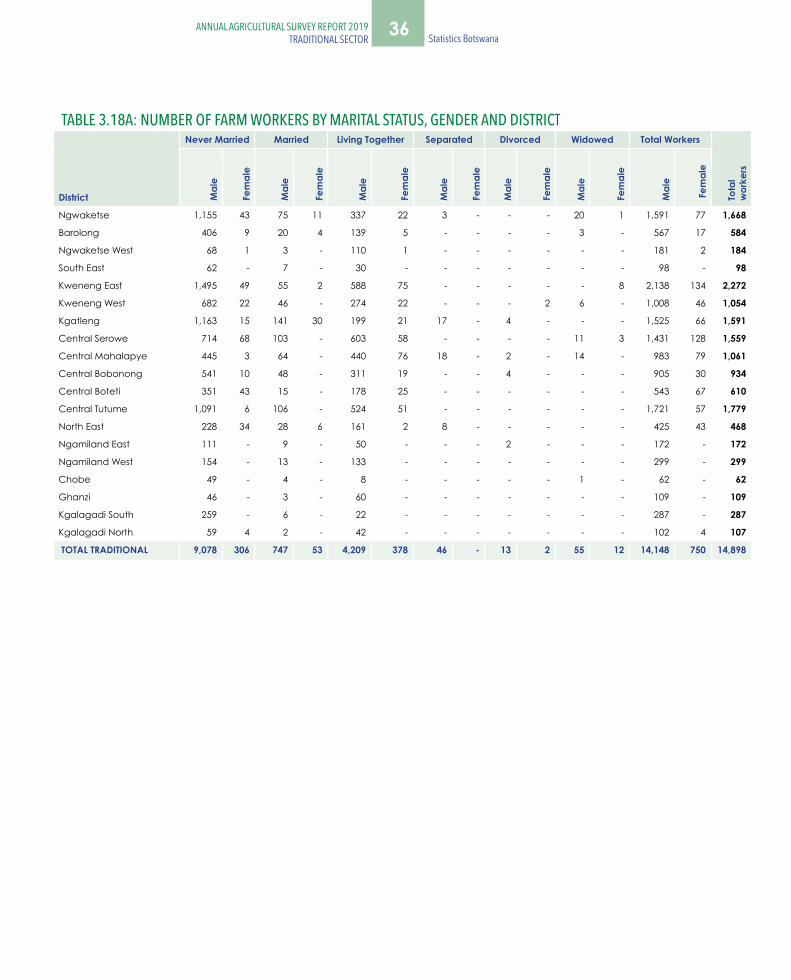
36 Statistics Botswana ANNUAL AGRICULTURAL SURVEY REPORT 2019
TRADITIONAL SECTORANNUAL AGRICULTURAL SURVEY REPORT 2019
TRADITIONAL SECTOR
TABLE 3.18A: NUMBER OF FARM WORKERS BY MARITAL STATUS, GENDER AND DISTRICT
District
Never Married Married Living Together Separated Divorced Widowed Total Workers
Tota
l w
orke
rs
Mal
e
Fem
ale
Mal
e
Fem
ale
Mal
e
Fem
ale
Mal
e
Fem
ale
Mal
e
Fem
ale
Mal
e
Fem
ale
Mal
e
Fem
ale
Ngwaketse 1,155 43 75 11 337 22 3 - - - 20 1 1,591 77 1,668
Barolong 406 9 20 4 139 5 - - - - 3 - 567 17 584
Ngwaketse West 68 1 3 - 110 1 - - - - - - 181 2 184
South East 62 - 7 - 30 - - - - - - - 98 - 98
Kweneng East 1,495 49 55 2 588 75 - - - - - 8 2,138 134 2,272
Kweneng West 682 22 46 - 274 22 - - - 2 6 - 1,008 46 1,054
Kgatleng 1,163 15 141 30 199 21 17 - 4 - - - 1,525 66 1,591
Central Serowe 714 68 103 - 603 58 - - - - 11 3 1,431 128 1,559
Central Mahalapye 445 3 64 - 440 76 18 - 2 - 14 - 983 79 1,061
Central Bobonong 541 10 48 - 311 19 - - 4 - - - 905 30 934
Central Boteti 351 43 15 - 178 25 - - - - - - 543 67 610
Central Tutume 1,091 6 106 - 524 51 - - - - - - 1,721 57 1,779
North East 228 34 28 6 161 2 8 - - - - - 425 43 468
Ngamiland East 111 - 9 - 50 - - - 2 - - - 172 - 172
Ngamiland West 154 - 13 - 133 - - - - - - - 299 - 299
Chobe 49 - 4 - 8 - - - - - 1 - 62 - 62
Ghanzi 46 - 3 - 60 - - - - - - - 109 - 109
Kgalagadi South 259 - 6 - 22 - - - - - - - 287 - 287
Kgalagadi North 59 4 2 - 42 - - - - - - - 102 4 107
TOTAL TRADITIONAL 9,078 306 747 53 4,209 378 46 - 13 2 55 12 14,148 750 14,898
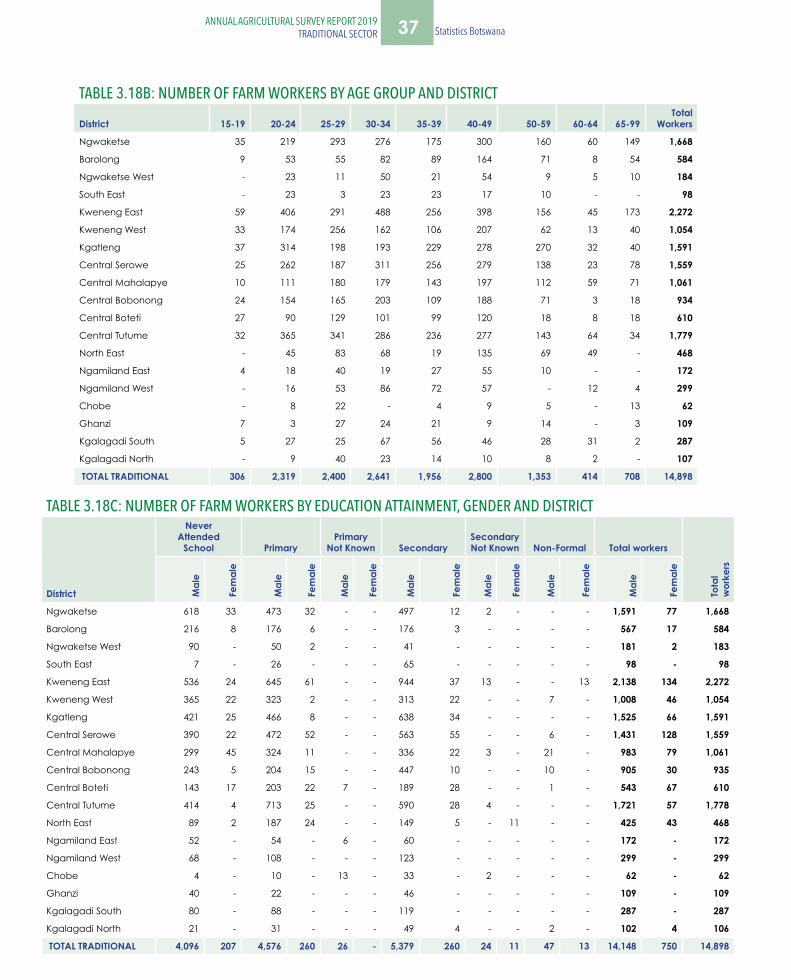
37ANNUAL AGRICULTURAL SURVEY REPORT 2019TRADITIONAL SECTOR Statistics Botswana
TABLE 3.18B: NUMBER OF FARM WORKERS BY AGE GROUP AND DISTRICT
District 15-19 20-24 25-29 30-34 35-39 40-49 50-59 60-64 65-99 Total
Workers
Ngwaketse 35 219 293 276 175 300 160 60 149 1,668
Barolong 9 53 55 82 89 164 71 8 54 584
Ngwaketse West - 23 11 50 21 54 9 5 10 184
South East - 23 3 23 23 17 10 - - 98
Kweneng East 59 406 291 488 256 398 156 45 173 2,272
Kweneng West 33 174 256 162 106 207 62 13 40 1,054
Kgatleng 37 314 198 193 229 278 270 32 40 1,591
Central Serowe 25 262 187 311 256 279 138 23 78 1,559
Central Mahalapye 10 111 180 179 143 197 112 59 71 1,061
Central Bobonong 24 154 165 203 109 188 71 3 18 934
Central Boteti 27 90 129 101 99 120 18 8 18 610
Central Tutume 32 365 341 286 236 277 143 64 34 1,779
North East - 45 83 68 19 135 69 49 - 468
Ngamiland East 4 18 40 19 27 55 10 - - 172
Ngamiland West - 16 53 86 72 57 - 12 4 299
Chobe - 8 22 - 4 9 5 - 13 62
Ghanzi 7 3 27 24 21 9 14 - 3 109
Kgalagadi South 5 27 25 67 56 46 28 31 2 287
Kgalagadi North - 9 40 23 14 10 8 2 - 107
TOTAL TRADITIONAL 306 2,319 2,400 2,641 1,956 2,800 1,353 414 708 14,898
TABLE 3.18C: NUMBER OF FARM WORKERS BY EDUCATION ATTAINMENT, GENDER AND DISTRICT
District
Never Attended
School PrimaryPrimary
Not Known SecondarySecondary Not Known Non-Formal Total workers
Tota
l w
orke
rs
Mal
e
Fem
ale
Mal
e
Fem
ale
Mal
e
Fem
ale
Mal
e
Fem
ale
Mal
e
Fem
ale
Mal
e
Fem
ale
Mal
e
Fem
ale
Ngwaketse 618 33 473 32 - - 497 12 2 - - - 1,591 77 1,668
Barolong 216 8 176 6 - - 176 3 - - - - 567 17 584
Ngwaketse West 90 - 50 2 - - 41 - - - - - 181 2 183
South East 7 - 26 - - - 65 - - - - - 98 - 98
Kweneng East 536 24 645 61 - - 944 37 13 - - 13 2,138 134 2,272
Kweneng West 365 22 323 2 - - 313 22 - - 7 - 1,008 46 1,054
Kgatleng 421 25 466 8 - - 638 34 - - - - 1,525 66 1,591
Central Serowe 390 22 472 52 - - 563 55 - - 6 - 1,431 128 1,559
Central Mahalapye 299 45 324 11 - - 336 22 3 - 21 - 983 79 1,061
Central Bobonong 243 5 204 15 - - 447 10 - - 10 - 905 30 935
Central Boteti 143 17 203 22 7 - 189 28 - - 1 - 543 67 610
Central Tutume 414 4 713 25 - - 590 28 4 - - - 1,721 57 1,778
North East 89 2 187 24 - - 149 5 - 11 - - 425 43 468
Ngamiland East 52 - 54 - 6 - 60 - - - - - 172 - 172
Ngamiland West 68 - 108 - - - 123 - - - - - 299 - 299
Chobe 4 - 10 - 13 - 33 - 2 - - - 62 - 62
Ghanzi 40 - 22 - - - 46 - - - - - 109 - 109
Kgalagadi South 80 - 88 - - - 119 - - - - - 287 - 287
Kgalagadi North 21 - 31 - - - 49 4 - - 2 - 102 4 106
TOTAL TRADITIONAL 4,096 207 4,576 260 26 - 5,379 260 24 11 47 13 14,148 750 14,898
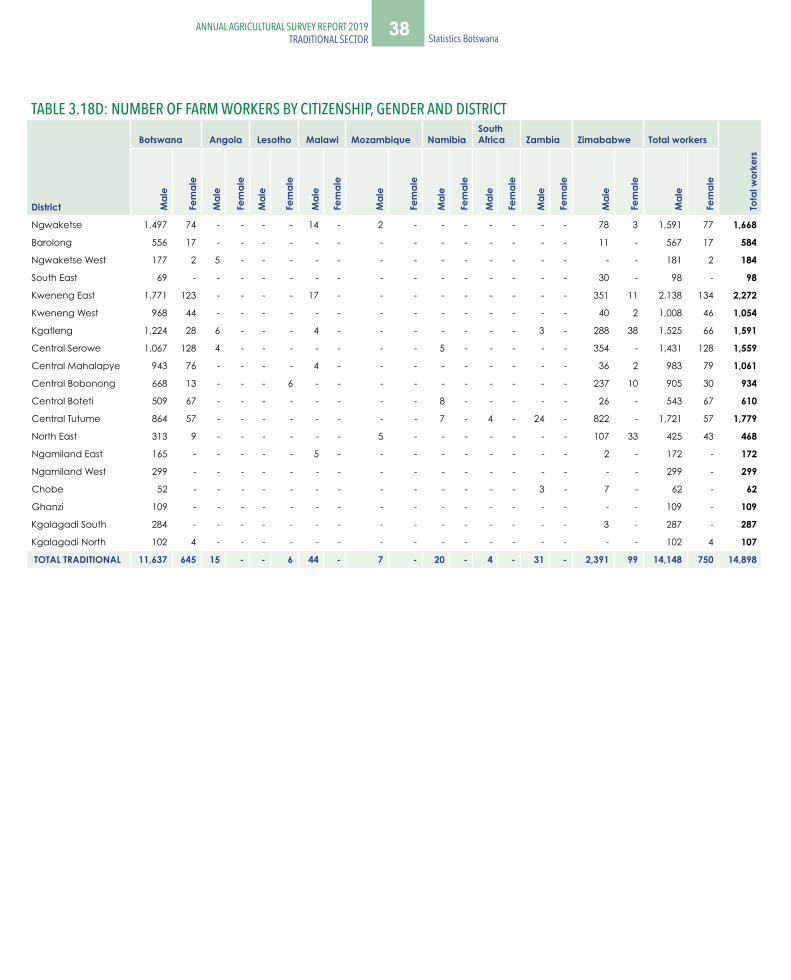
38 Statistics Botswana ANNUAL AGRICULTURAL SURVEY REPORT 2019
TRADITIONAL SECTORANNUAL AGRICULTURAL SURVEY REPORT 2019
TRADITIONAL SECTOR
TABLE 3.18D: NUMBER OF FARM WORKERS BY CITIZENSHIP, GENDER AND DISTRICT
District
Botswana Angola Lesotho Malawi Mozambique Namibia South Africa Zambia Zimababwe Total workers
Tota
l wor
kers
Mal
e
Fem
ale
Mal
e
Fem
ale
Mal
e
Fem
ale
Mal
e
Fem
ale
Mal
e
Fem
ale
Mal
e
Fem
ale
Mal
e
Fem
ale
Mal
e
Fem
ale
Mal
e
Fem
ale
Mal
e
Fem
ale
Ngwaketse 1,497 74 - - - - 14 - 2 - - - - - - - 78 3 1,591 77 1,668
Barolong 556 17 - - - - - - - - - - - - - - 11 - 567 17 584
Ngwaketse West 177 2 5 - - - - - - - - - - - - - - - 181 2 184
South East 69 - - - - - - - - - - - - - - - 30 - 98 - 98
Kweneng East 1,771 123 - - - - 17 - - - - - - - - - 351 11 2,138 134 2,272
Kweneng West 968 44 - - - - - - - - - - - - - - 40 2 1,008 46 1,054
Kgatleng 1,224 28 6 - - - 4 - - - - - - - 3 - 288 38 1,525 66 1,591
Central Serowe 1,067 128 4 - - - - - - - 5 - - - - - 354 - 1,431 128 1,559
Central Mahalapye 943 76 - - - - 4 - - - - - - - - - 36 2 983 79 1,061
Central Bobonong 668 13 - - - 6 - - - - - - - - - - 237 10 905 30 934
Central Boteti 509 67 - - - - - - - - 8 - - - - - 26 - 543 67 610
Central Tutume 864 57 - - - - - - - - 7 - 4 - 24 - 822 - 1,721 57 1,779
North East 313 9 - - - - - - 5 - - - - - - - 107 33 425 43 468
Ngamiland East 165 - - - - - 5 - - - - - - - - - 2 - 172 - 172
Ngamiland West 299 - - - - - - - - - - - - - - - - - 299 - 299
Chobe 52 - - - - - - - - - - - - - 3 - 7 - 62 - 62
Ghanzi 109 - - - - - - - - - - - - - - - - - 109 - 109
Kgalagadi South 284 - - - - - - - - - - - - - - - 3 - 287 - 287
Kgalagadi North 102 4 - - - - - - - - - - - - - - - - 102 4 107
TOTAL TRADITIONAL 11,637 645 15 - - 6 44 - 7 - 20 - 4 - 31 - 2,391 99 14,148 750 14,898
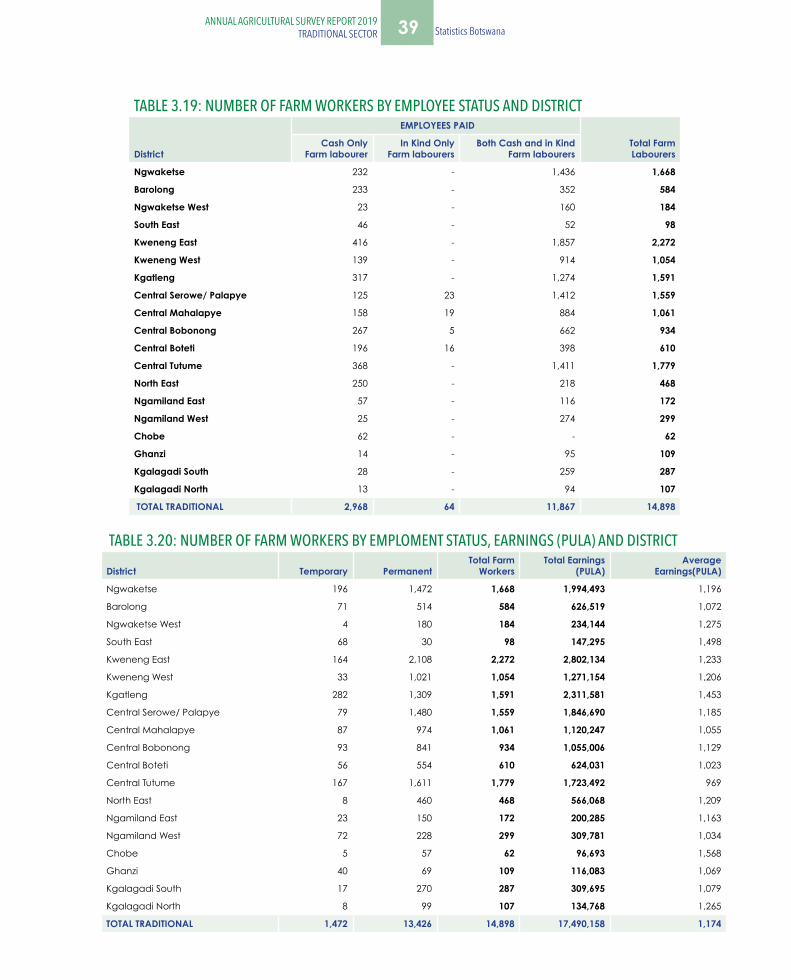
39ANNUAL AGRICULTURAL SURVEY REPORT 2019TRADITIONAL SECTOR Statistics Botswana
TABLE 3.19: NUMBER OF FARM WORKERS BY EMPLOYEE STATUS AND DISTRICT
District
EMPLOYEES PAID
Total Farm Labourers
Cash OnlyFarm labourer
In Kind OnlyFarm labourers
Both Cash and in KindFarm labourers
Ngwaketse 232 - 1,436 1,668
Barolong 233 - 352 584
Ngwaketse West 23 - 160 184
South East 46 - 52 98
Kweneng East 416 - 1,857 2,272
Kweneng West 139 - 914 1,054
Kgatleng 317 - 1,274 1,591
Central Serowe/ Palapye 125 23 1,412 1,559
Central Mahalapye 158 19 884 1,061
Central Bobonong 267 5 662 934
Central Boteti 196 16 398 610
Central Tutume 368 - 1,411 1,779
North East 250 - 218 468
Ngamiland East 57 - 116 172
Ngamiland West 25 - 274 299
Chobe 62 - - 62
Ghanzi 14 - 95 109
Kgalagadi South 28 - 259 287
Kgalagadi North 13 - 94 107
TOTAL TRADITIONAL 2,968 64 11,867 14,898
TABLE 3.20: NUMBER OF FARM WORKERS BY EMPLOMENT STATUS, EARNINGS (PULA) AND DISTRICT
District
Temporary
PermanentTotal Farm
WorkersTotal Earnings
(PULA)Average
Earnings(PULA)
Ngwaketse 196 1,472 1,668 1,994,493 1,196
Barolong 71 514 584 626,519 1,072
Ngwaketse West 4 180 184 234,144 1,275
South East 68 30 98 147,295 1,498
Kweneng East 164 2,108 2,272 2,802,134 1,233
Kweneng West 33 1,021 1,054 1,271,154 1,206
Kgatleng 282 1,309 1,591 2,311,581 1,453
Central Serowe/ Palapye 79 1,480 1,559 1,846,690 1,185
Central Mahalapye 87 974 1,061 1,120,247 1,055
Central Bobonong 93 841 934 1,055,006 1,129
Central Boteti 56 554 610 624,031 1,023
Central Tutume 167 1,611 1,779 1,723,492 969
North East 8 460 468 566,068 1,209
Ngamiland East 23 150 172 200,285 1,163
Ngamiland West 72 228 299 309,781 1,034
Chobe 5 57 62 96,693 1,568
Ghanzi 40 69 109 116,083 1,069
Kgalagadi South 17 270 287 309,695 1,079
Kgalagadi North 8 99 107 134,768 1,265
TOTAL TRADITIONAL 1,472 13,426 14,898 17,490,158 1,174

40 Statistics Botswana ANNUAL AGRICULTURAL SURVEY REPORT 2019
TRADITIONAL SECTORANNUAL AGRICULTURAL SURVEY REPORT 2019
TRADITIONAL SECTOR
TRADITIONAL SECTOR: CATTLE
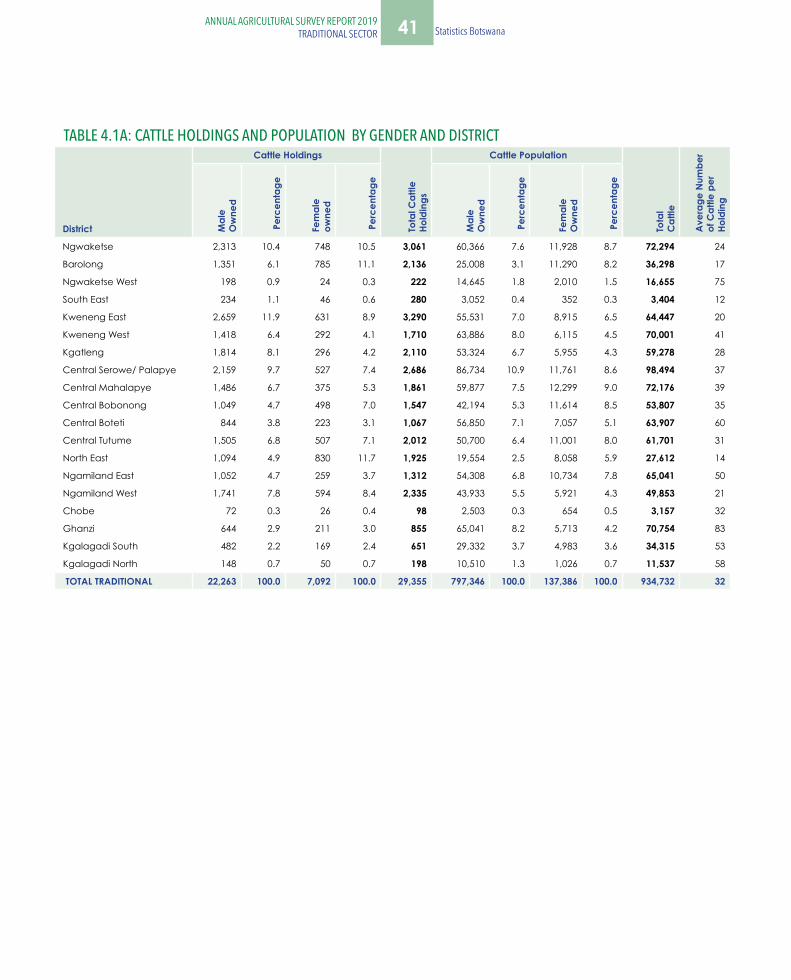
41ANNUAL AGRICULTURAL SURVEY REPORT 2019TRADITIONAL SECTOR Statistics Botswana
TABLE 4.1A: CATTLE HOLDINGS AND POPULATION BY GENDER AND DISTRICT
District
Cattle Holdings
Tota
l Cat
tle
Hold
ings
Cattle Population
Tota
l C
attle
Ave
rage
Num
ber
of C
attle
per
Ho
ldin
g
Mal
e O
wne
d
Per
cent
age
Fem
ale
owne
d
Per
cent
age
Mal
e O
wne
d
Per
cent
age
Fem
ale
Ow
ned
Per
cent
age
Ngwaketse 2,313 10.4 748 10.5 3,061 60,366 7.6 11,928 8.7 72,294 24
Barolong 1,351 6.1 785 11.1 2,136 25,008 3.1 11,290 8.2 36,298 17
Ngwaketse West 198 0.9 24 0.3 222 14,645 1.8 2,010 1.5 16,655 75
South East 234 1.1 46 0.6 280 3,052 0.4 352 0.3 3,404 12
Kweneng East 2,659 11.9 631 8.9 3,290 55,531 7.0 8,915 6.5 64,447 20
Kweneng West 1,418 6.4 292 4.1 1,710 63,886 8.0 6,115 4.5 70,001 41
Kgatleng 1,814 8.1 296 4.2 2,110 53,324 6.7 5,955 4.3 59,278 28
Central Serowe/ Palapye 2,159 9.7 527 7.4 2,686 86,734 10.9 11,761 8.6 98,494 37
Central Mahalapye 1,486 6.7 375 5.3 1,861 59,877 7.5 12,299 9.0 72,176 39
Central Bobonong 1,049 4.7 498 7.0 1,547 42,194 5.3 11,614 8.5 53,807 35
Central Boteti 844 3.8 223 3.1 1,067 56,850 7.1 7,057 5.1 63,907 60
Central Tutume 1,505 6.8 507 7.1 2,012 50,700 6.4 11,001 8.0 61,701 31
North East 1,094 4.9 830 11.7 1,925 19,554 2.5 8,058 5.9 27,612 14
Ngamiland East 1,052 4.7 259 3.7 1,312 54,308 6.8 10,734 7.8 65,041 50
Ngamiland West 1,741 7.8 594 8.4 2,335 43,933 5.5 5,921 4.3 49,853 21
Chobe 72 0.3 26 0.4 98 2,503 0.3 654 0.5 3,157 32
Ghanzi 644 2.9 211 3.0 855 65,041 8.2 5,713 4.2 70,754 83
Kgalagadi South 482 2.2 169 2.4 651 29,332 3.7 4,983 3.6 34,315 53
Kgalagadi North 148 0.7 50 0.7 198 10,510 1.3 1,026 0.7 11,537 58
TOTAL TRADITIONAL 22,263 100.0 7,092 100.0 29,355 797,346 100.0 137,386 100.0 934,732 32

42 Statistics Botswana ANNUAL AGRICULTURAL SURVEY REPORT 2019
TRADITIONAL SECTORANNUAL AGRICULTURAL SURVEY REPORT 2019
TRADITIONAL SECTOR
TABLE 4.1B: CATTLE POPULATION BY AGE GROUP OF THE HOLDER AND DISTRICT
District 15-19 20-24 25-29 30-34 35-39 40-44 45-49 50-54 55-59 60-64 65+ Age not
Known Total
Cattle
Ngwaketse - 116 323 946 5,759 3,200 5,432 11,629 11,647 8,595 24,646 - 72,294
Barolong - 37 195 1,078 2,046 1,834 1,611 2,333 4,489 5,358 17,316 - 36,298
Ngwaketse West - - - 373 1,329 406 1,275 4,103 2,859 3,039 3,270 - 16,655
South East - - - - 207 235 - 337 757 282 1,587 - 3,404
Kweneng East - - 241 2,141 2,128 2,140 5,387 6,973 10,070 8,830 26,537 - 64,447
Kweneng West - - 33 1,165 3,779 5,307 8,166 8,765 13,082 7,436 22,093 173 70,001
Kgatleng - - - 256 617 6,685 6,562 6,048 10,643 8,667 19,733 66 59,278
Central Serowe/ Palapye 2,520 - 71 2,339 4,387 5,384 16,113 10,104 13,618 15,845 28,112 - 98,494
Central Mahalapye - - 16 652 2,898 5,118 4,449 9,582 11,355 11,545 26,277 283 72,176
Central Bobonong - 62 101 901 1,929 2,921 4,121 5,264 7,139 8,152 22,979 239 53,807
Central Boteti 187 106 614 2,221 4,497 3,930 5,366 7,621 12,446 8,928 17,993 - 63,907
Central Tutume - - - 21 787 3,997 2,773 8,469 13,954 8,073 22,354 1,274 61,701
North East - - 115 340 528 781 1,694 2,570 2,929 3,160 15,480 15 27,612
Ngamiland East 52 580 674 1,316 3,566 8,116 5,211 5,304 12,398 6,609 21,216 - 65,041
Ngamiland West 56 376 326 1,633 5,531 1,837 5,767 5,859 3,087 10,700 14,682 - 49,853
Chobe - - 15 117 100 - 45 105 368 821 1,488 99 3,157
Ghanzi - 2,503 6,326 2,696 5,821 6,167 4,912 8,863 19,376 3,211 10,879 - 70,754
Kgalagadi South - - 588 54 2,451 1,708 920 6,151 6,270 1,957 14,215 - 34,315
Kgalagadi North - - 173 403 509 806 1,366 900 1,629 1,512 4,239 - 11,537
TOTAL TRADITIONAL 2,815 3,779 9,812 18,653 48,870 60,571 81,167 110,980 158,115 122,720 315,098 2,149 934,732
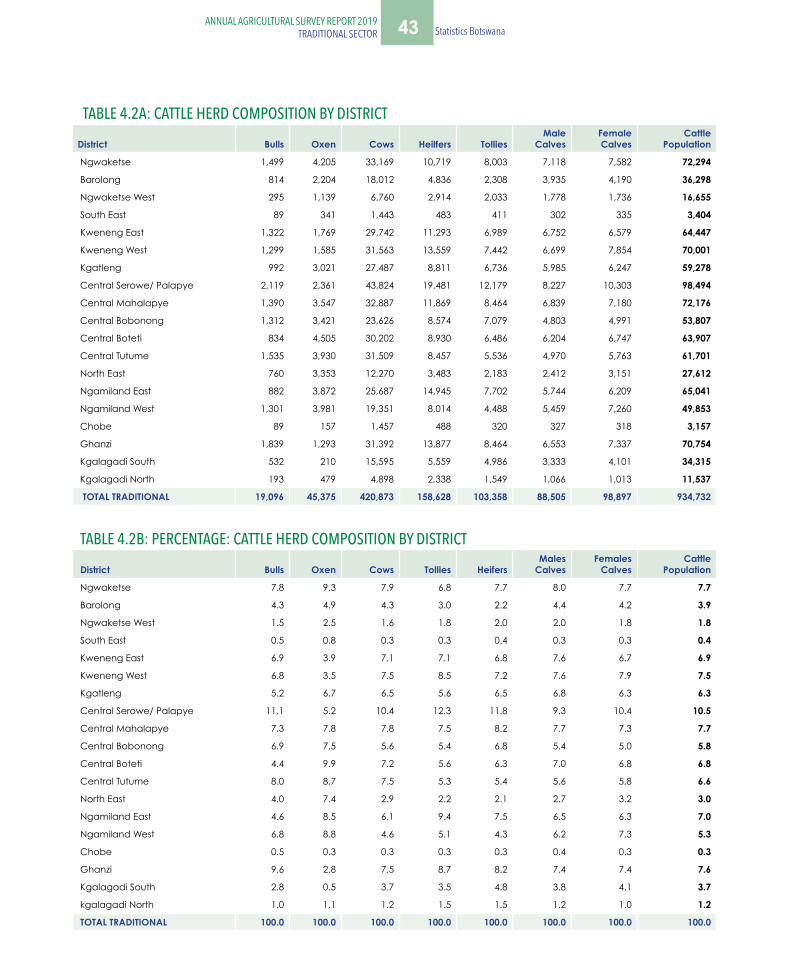
43ANNUAL AGRICULTURAL SURVEY REPORT 2019TRADITIONAL SECTOR Statistics Botswana
TABLE 4.2A: CATTLE HERD COMPOSITION BY DISTRICT
District Bulls Oxen Cows Heilfers Tollies Male
Calves Female
Calves Cattle
Population
Ngwaketse 1,499 4,205 33,169 10,719 8,003 7,118 7,582 72,294
Barolong 814 2,204 18,012 4,836 2,308 3,935 4,190 36,298
Ngwaketse West 295 1,139 6,760 2,914 2,033 1,778 1,736 16,655
South East 89 341 1,443 483 411 302 335 3,404
Kweneng East 1,322 1,769 29,742 11,293 6,989 6,752 6,579 64,447
Kweneng West 1,299 1,585 31,563 13,559 7,442 6,699 7,854 70,001
Kgatleng 992 3,021 27,487 8,811 6,736 5,985 6,247 59,278
Central Serowe/ Palapye 2,119 2,361 43,824 19,481 12,179 8,227 10,303 98,494
Central Mahalapye 1,390 3,547 32,887 11,869 8,464 6,839 7,180 72,176
Central Bobonong 1,312 3,421 23,626 8,574 7,079 4,803 4,991 53,807
Central Boteti 834 4,505 30,202 8,930 6,486 6,204 6,747 63,907
Central Tutume 1,535 3,930 31,509 8,457 5,536 4,970 5,763 61,701
North East 760 3,353 12,270 3,483 2,183 2,412 3,151 27,612
Ngamiland East 882 3,872 25,687 14,945 7,702 5,744 6,209 65,041
Ngamiland West 1,301 3,981 19,351 8,014 4,488 5,459 7,260 49,853
Chobe 89 157 1,457 488 320 327 318 3,157
Ghanzi 1,839 1,293 31,392 13,877 8,464 6,553 7,337 70,754
Kgalagadi South 532 210 15,595 5,559 4,986 3,333 4,101 34,315
Kgalagadi North 193 479 4,898 2,338 1,549 1,066 1,013 11,537
TOTAL TRADITIONAL 19,096 45,375 420,873 158,628 103,358 88,505 98,897 934,732
TABLE 4.2B: PERCENTAGE: CATTLE HERD COMPOSITION BY DISTRICT
District Bulls Oxen Cows Tollies Heifers Males Calves
Females Calves
Cattle Population
Ngwaketse 7.8 9.3 7.9 6.8 7.7 8.0 7.7 7.7
Barolong 4.3 4.9 4.3 3.0 2.2 4.4 4.2 3.9
Ngwaketse West 1.5 2.5 1.6 1.8 2.0 2.0 1.8 1.8
South East 0.5 0.8 0.3 0.3 0.4 0.3 0.3 0.4
Kweneng East 6.9 3.9 7.1 7.1 6.8 7.6 6.7 6.9
Kweneng West 6.8 3.5 7.5 8.5 7.2 7.6 7.9 7.5
Kgatleng 5.2 6.7 6.5 5.6 6.5 6.8 6.3 6.3
Central Serowe/ Palapye 11.1 5.2 10.4 12.3 11.8 9.3 10.4 10.5
Central Mahalapye 7.3 7.8 7.8 7.5 8.2 7.7 7.3 7.7
Central Bobonong 6.9 7.5 5.6 5.4 6.8 5.4 5.0 5.8
Central Boteti 4.4 9.9 7.2 5.6 6.3 7.0 6.8 6.8
Central Tutume 8.0 8.7 7.5 5.3 5.4 5.6 5.8 6.6
North East 4.0 7.4 2.9 2.2 2.1 2.7 3.2 3.0
Ngamiland East 4.6 8.5 6.1 9.4 7.5 6.5 6.3 7.0
Ngamiland West 6.8 8.8 4.6 5.1 4.3 6.2 7.3 5.3
Chobe 0.5 0.3 0.3 0.3 0.3 0.4 0.3 0.3
Ghanzi 9.6 2.8 7.5 8.7 8.2 7.4 7.4 7.6
Kgalagadi South 2.8 0.5 3.7 3.5 4.8 3.8 4.1 3.7
kgalagadi North 1.0 1.1 1.2 1.5 1.5 1.2 1.0 1.2
TOTAL TRADITIONAL 100.0 100.0 100.0 100.0 100.0 100.0 100.0 100.0
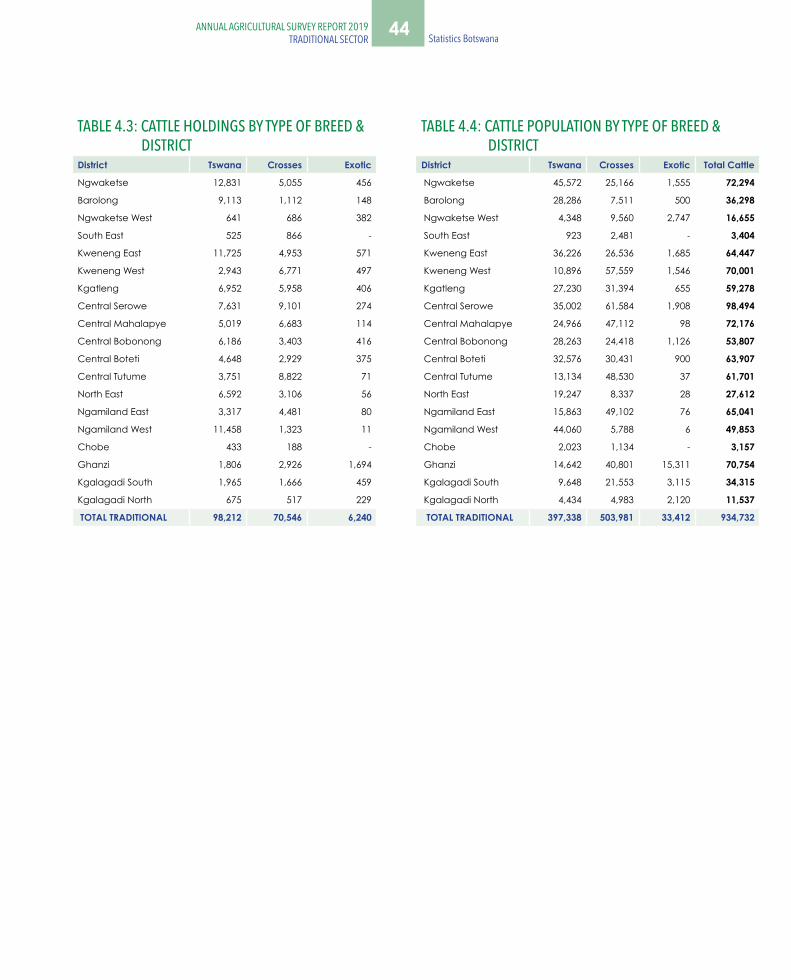
44 Statistics Botswana ANNUAL AGRICULTURAL SURVEY REPORT 2019
TRADITIONAL SECTORANNUAL AGRICULTURAL SURVEY REPORT 2019
TRADITIONAL SECTOR
TABLE 4.3: CATTLE HOLDINGS BY TYPE OF BREED & DISTRICT
TABLE 4.4: CATTLE POPULATION BY TYPE OF BREED & DISTRICT
District Tswana Crosses Exotic District Tswana Crosses Exotic Total Cattle
Ngwaketse 12,831 5,055 456 Ngwaketse 45,572 25,166 1,555 72,294
Barolong 9,113 1,112 148 Barolong 28,286 7,511 500 36,298
Ngwaketse West 641 686 382 Ngwaketse West 4,348 9,560 2,747 16,655
South East 525 866 - South East 923 2,481 - 3,404
Kweneng East 11,725 4,953 571 Kweneng East 36,226 26,536 1,685 64,447
Kweneng West 2,943 6,771 497 Kweneng West 10,896 57,559 1,546 70,001
Kgatleng 6,952 5,958 406 Kgatleng 27,230 31,394 655 59,278
Central Serowe 7,631 9,101 274 Central Serowe 35,002 61,584 1,908 98,494
Central Mahalapye 5,019 6,683 114 Central Mahalapye 24,966 47,112 98 72,176
Central Bobonong 6,186 3,403 416 Central Bobonong 28,263 24,418 1,126 53,807
Central Boteti 4,648 2,929 375 Central Boteti 32,576 30,431 900 63,907
Central Tutume 3,751 8,822 71 Central Tutume 13,134 48,530 37 61,701
North East 6,592 3,106 56 North East 19,247 8,337 28 27,612
Ngamiland East 3,317 4,481 80 Ngamiland East 15,863 49,102 76 65,041
Ngamiland West 11,458 1,323 11 Ngamiland West 44,060 5,788 6 49,853
Chobe 433 188 - Chobe 2,023 1,134 - 3,157
Ghanzi 1,806 2,926 1,694 Ghanzi 14,642 40,801 15,311 70,754
Kgalagadi South 1,965 1,666 459 Kgalagadi South 9,648 21,553 3,115 34,315
Kgalagadi North 675 517 229 Kgalagadi North 4,434 4,983 2,120 11,537
TOTAL TRADITIONAL 98,212 70,546 6,240 TOTAL TRADITIONAL 397,338 503,981 33,412 934,732
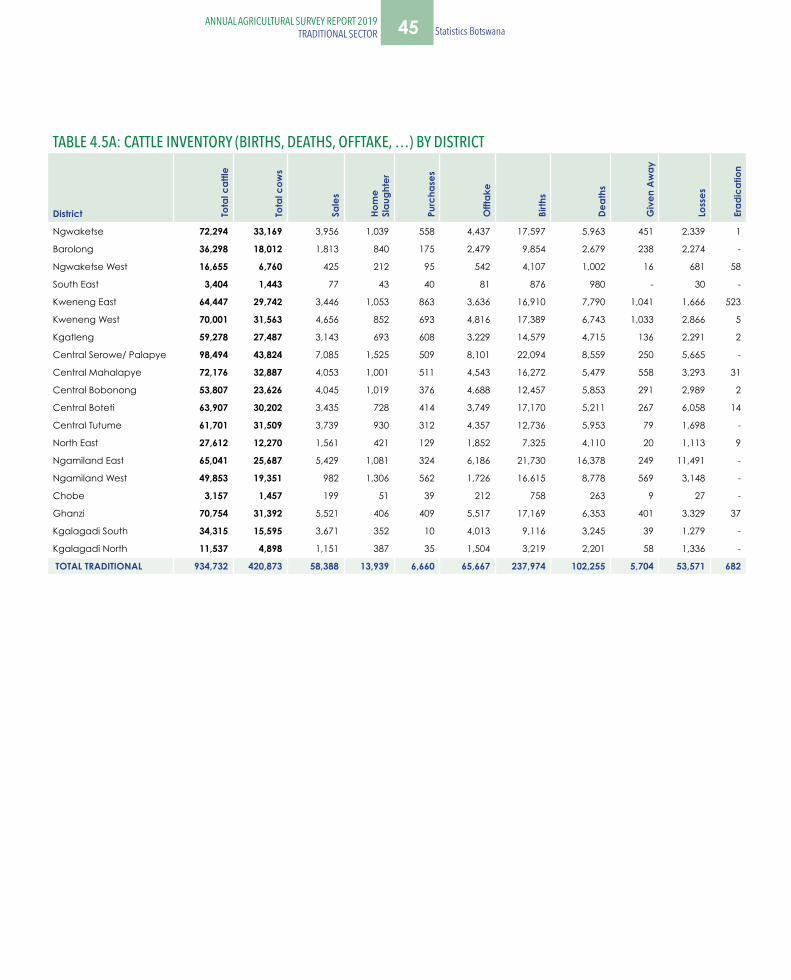
45ANNUAL AGRICULTURAL SURVEY REPORT 2019TRADITIONAL SECTOR Statistics Botswana
TABLE 4.5A: CATTLE INVENTORY (BIRTHS, DEATHS, OFFTAKE, …) BY DISTRICT
District Tota
l cat
tle
Tota
l cow
s
Sale
s
Hom
e Sl
augh
ter
Purc
hase
s
Offt
ake
Birth
s
Deat
hs
Giv
en A
way
Loss
es
Erad
icat
ion
Ngwaketse 72,294 33,169 3,956 1,039 558 4,437 17,597 5,963 451 2,339 1
Barolong 36,298 18,012 1,813 840 175 2,479 9,854 2,679 238 2,274 -
Ngwaketse West 16,655 6,760 425 212 95 542 4,107 1,002 16 681 58
South East 3,404 1,443 77 43 40 81 876 980 - 30 -
Kweneng East 64,447 29,742 3,446 1,053 863 3,636 16,910 7,790 1,041 1,666 523
Kweneng West 70,001 31,563 4,656 852 693 4,816 17,389 6,743 1,033 2,866 5
Kgatleng 59,278 27,487 3,143 693 608 3,229 14,579 4,715 136 2,291 2
Central Serowe/ Palapye 98,494 43,824 7,085 1,525 509 8,101 22,094 8,559 250 5,665 -
Central Mahalapye 72,176 32,887 4,053 1,001 511 4,543 16,272 5,479 558 3,293 31
Central Bobonong 53,807 23,626 4,045 1,019 376 4,688 12,457 5,853 291 2,989 2
Central Boteti 63,907 30,202 3,435 728 414 3,749 17,170 5,211 267 6,058 14
Central Tutume 61,701 31,509 3,739 930 312 4,357 12,736 5,953 79 1,698 -
North East 27,612 12,270 1,561 421 129 1,852 7,325 4,110 20 1,113 9
Ngamiland East 65,041 25,687 5,429 1,081 324 6,186 21,730 16,378 249 11,491 -
Ngamiland West 49,853 19,351 982 1,306 562 1,726 16,615 8,778 569 3,148 -
Chobe 3,157 1,457 199 51 39 212 758 263 9 27 -
Ghanzi 70,754 31,392 5,521 406 409 5,517 17,169 6,353 401 3,329 37
Kgalagadi South 34,315 15,595 3,671 352 10 4,013 9,116 3,245 39 1,279 -
Kgalagadi North 11,537 4,898 1,151 387 35 1,504 3,219 2,201 58 1,336 -
TOTAL TRADITIONAL 934,732 420,873 58,388 13,939 6,660 65,667 237,974 102,255 5,704 53,571 682
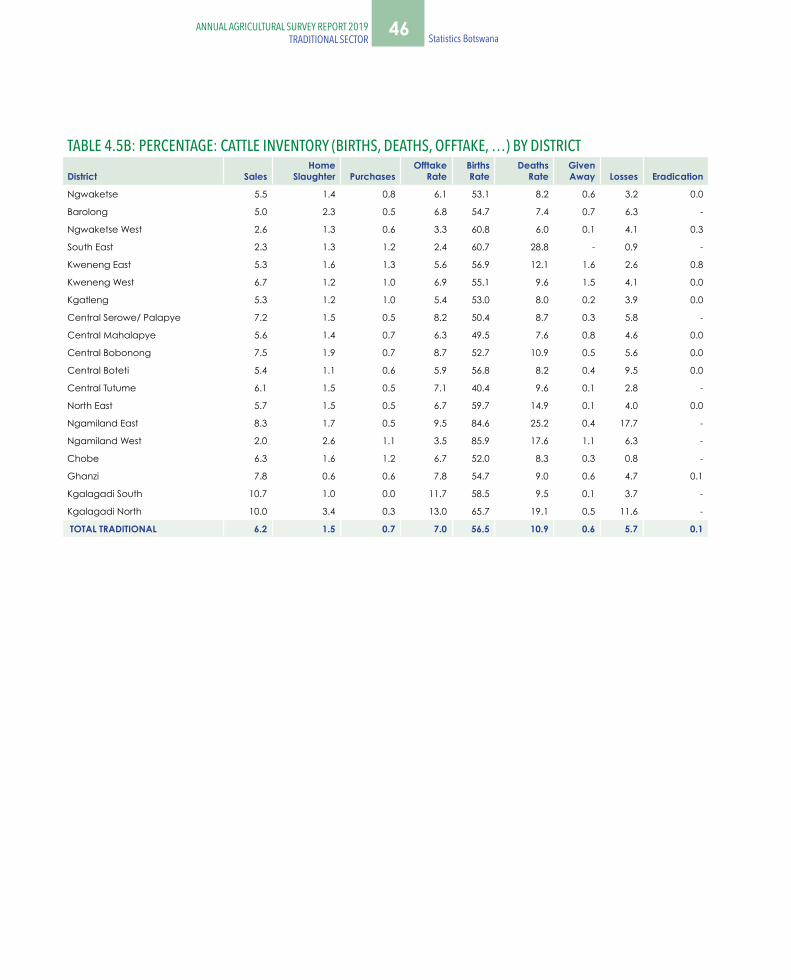
46 Statistics Botswana ANNUAL AGRICULTURAL SURVEY REPORT 2019
TRADITIONAL SECTORANNUAL AGRICULTURAL SURVEY REPORT 2019
TRADITIONAL SECTOR
TABLE 4.5B: PERCENTAGE: CATTLE INVENTORY (BIRTHS, DEATHS, OFFTAKE, …) BY DISTRICT
District SalesHome
Slaughter PurchasesOfftake
RateBirths Rate
Deaths Rate
Given Away Losses Eradication
Ngwaketse 5.5 1.4 0.8 6.1 53.1 8.2 0.6 3.2 0.0
Barolong 5.0 2.3 0.5 6.8 54.7 7.4 0.7 6.3 -
Ngwaketse West 2.6 1.3 0.6 3.3 60.8 6.0 0.1 4.1 0.3
South East 2.3 1.3 1.2 2.4 60.7 28.8 - 0.9 -
Kweneng East 5.3 1.6 1.3 5.6 56.9 12.1 1.6 2.6 0.8
Kweneng West 6.7 1.2 1.0 6.9 55.1 9.6 1.5 4.1 0.0
Kgatleng 5.3 1.2 1.0 5.4 53.0 8.0 0.2 3.9 0.0
Central Serowe/ Palapye 7.2 1.5 0.5 8.2 50.4 8.7 0.3 5.8 -
Central Mahalapye 5.6 1.4 0.7 6.3 49.5 7.6 0.8 4.6 0.0
Central Bobonong 7.5 1.9 0.7 8.7 52.7 10.9 0.5 5.6 0.0
Central Boteti 5.4 1.1 0.6 5.9 56.8 8.2 0.4 9.5 0.0
Central Tutume 6.1 1.5 0.5 7.1 40.4 9.6 0.1 2.8 -
North East 5.7 1.5 0.5 6.7 59.7 14.9 0.1 4.0 0.0
Ngamiland East 8.3 1.7 0.5 9.5 84.6 25.2 0.4 17.7 -
Ngamiland West 2.0 2.6 1.1 3.5 85.9 17.6 1.1 6.3 -
Chobe 6.3 1.6 1.2 6.7 52.0 8.3 0.3 0.8 -
Ghanzi 7.8 0.6 0.6 7.8 54.7 9.0 0.6 4.7 0.1
Kgalagadi South 10.7 1.0 0.0 11.7 58.5 9.5 0.1 3.7 -
Kgalagadi North 10.0 3.4 0.3 13.0 65.7 19.1 0.5 11.6 -
TOTAL TRADITIONAL 6.2 1.5 0.7 7.0 56.5 10.9 0.6 5.7 0.1
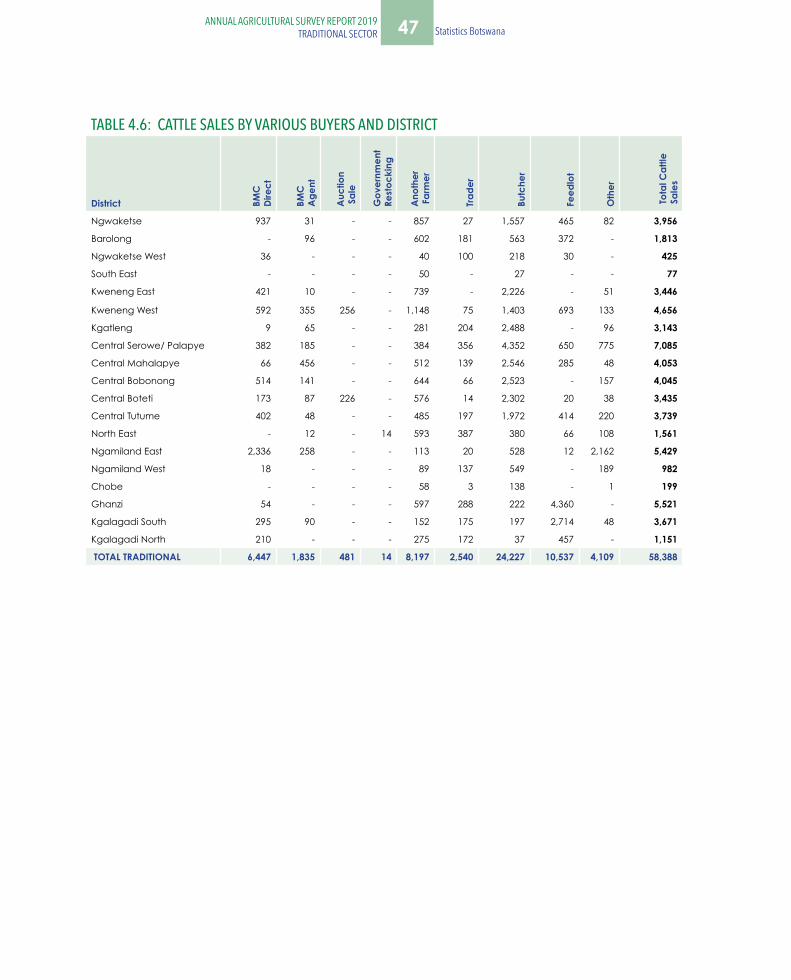
47ANNUAL AGRICULTURAL SURVEY REPORT 2019TRADITIONAL SECTOR Statistics Botswana
TABLE 4.6: CATTLE SALES BY VARIOUS BUYERS AND DISTRICT
District BMC
Dire
ct
BMC
Age
nt
Auc
tion
Sal
e
Gov
ernm
ent
Rest
ocki
ng
Ano
ther
Far
mer
Trad
er
Butc
her
Feed
lot
Oth
er
Tota
l Cat
tle
Sal
es
Ngwaketse 937 31 - - 857 27 1,557 465 82 3,956
Barolong - 96 - - 602 181 563 372 - 1,813
Ngwaketse West 36 - - - 40 100 218 30 - 425
South East - - - - 50 - 27 - - 77
Kweneng East 421 10 - - 739 - 2,226 - 51 3,446
Kweneng West 592 355 256 - 1,148 75 1,403 693 133 4,656
Kgatleng 9 65 - - 281 204 2,488 - 96 3,143
Central Serowe/ Palapye 382 185 - - 384 356 4,352 650 775 7,085
Central Mahalapye 66 456 - - 512 139 2,546 285 48 4,053
Central Bobonong 514 141 - - 644 66 2,523 - 157 4,045
Central Boteti 173 87 226 - 576 14 2,302 20 38 3,435
Central Tutume 402 48 - - 485 197 1,972 414 220 3,739
North East - 12 - 14 593 387 380 66 108 1,561
Ngamiland East 2,336 258 - - 113 20 528 12 2,162 5,429
Ngamiland West 18 - - - 89 137 549 - 189 982
Chobe - - - - 58 3 138 - 1 199
Ghanzi 54 - - - 597 288 222 4,360 - 5,521
Kgalagadi South 295 90 - - 152 175 197 2,714 48 3,671
Kgalagadi North 210 - - - 275 172 37 457 - 1,151
TOTAL TRADITIONAL 6,447 1,835 481 14 8,197 2,540 24,227 10,537 4,109 58,388
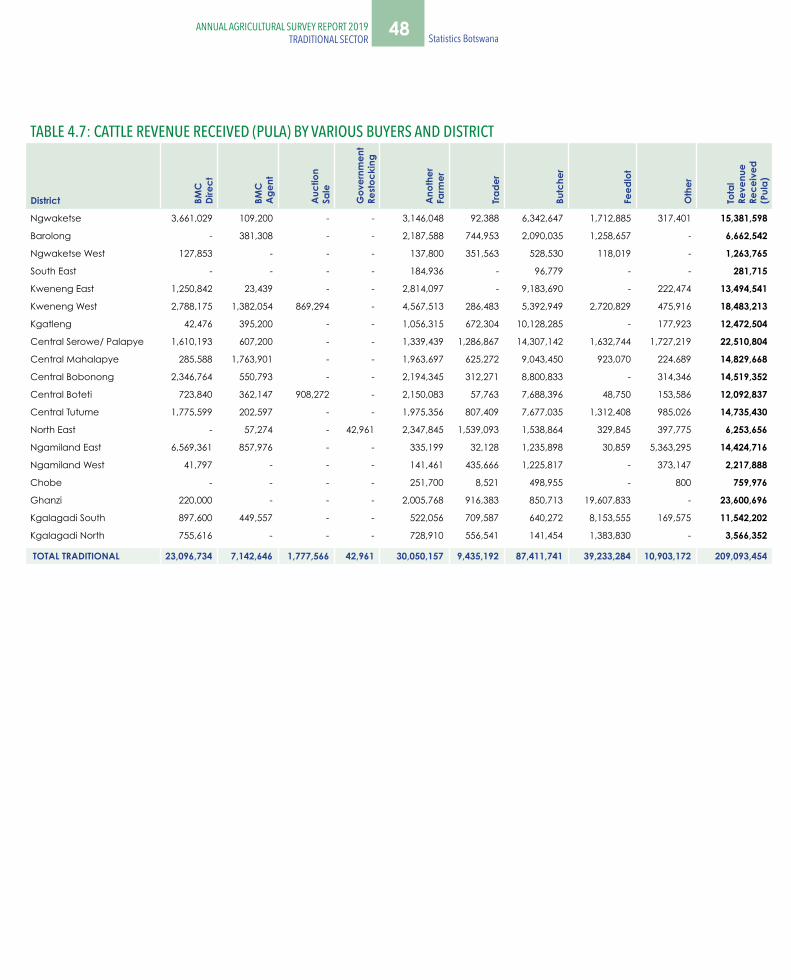
48 Statistics Botswana ANNUAL AGRICULTURAL SURVEY REPORT 2019
TRADITIONAL SECTORANNUAL AGRICULTURAL SURVEY REPORT 2019
TRADITIONAL SECTOR
TABLE 4.7: CATTLE REVENUE RECEIVED (PULA) BY VARIOUS BUYERS AND DISTRICT
District BMC
Dire
ct
BMC
Age
nt
Auc
tion
Sale
Gov
ernm
ent
Rest
ocki
ng
Ano
ther
Farm
er
Trad
er
Butc
her
Feed
lot
Oth
er
Tota
l Re
venu
e Re
ceiv
ed
(Pul
a)
Ngwaketse 3,661,029 109,200 - - 3,146,048 92,388 6,342,647 1,712,885 317,401 15,381,598
Barolong - 381,308 - - 2,187,588 744,953 2,090,035 1,258,657 - 6,662,542
Ngwaketse West 127,853 - - - 137,800 351,563 528,530 118,019 - 1,263,765
South East - - - - 184,936 - 96,779 - - 281,715
Kweneng East 1,250,842 23,439 - - 2,814,097 - 9,183,690 - 222,474 13,494,541
Kweneng West 2,788,175 1,382,054 869,294 - 4,567,513 286,483 5,392,949 2,720,829 475,916 18,483,213
Kgatleng 42,476 395,200 - - 1,056,315 672,304 10,128,285 - 177,923 12,472,504
Central Serowe/ Palapye 1,610,193 607,200 - - 1,339,439 1,286,867 14,307,142 1,632,744 1,727,219 22,510,804
Central Mahalapye 285,588 1,763,901 - - 1,963,697 625,272 9,043,450 923,070 224,689 14,829,668
Central Bobonong 2,346,764 550,793 - - 2,194,345 312,271 8,800,833 - 314,346 14,519,352
Central Boteti 723,840 362,147 908,272 - 2,150,083 57,763 7,688,396 48,750 153,586 12,092,837
Central Tutume 1,775,599 202,597 - - 1,975,356 807,409 7,677,035 1,312,408 985,026 14,735,430
North East - 57,274 - 42,961 2,347,845 1,539,093 1,538,864 329,845 397,775 6,253,656
Ngamiland East 6,569,361 857,976 - - 335,199 32,128 1,235,898 30,859 5,363,295 14,424,716
Ngamiland West 41,797 - - - 141,461 435,666 1,225,817 - 373,147 2,217,888
Chobe - - - - 251,700 8,521 498,955 - 800 759,976
Ghanzi 220,000 - - - 2,005,768 916,383 850,713 19,607,833 - 23,600,696
Kgalagadi South 897,600 449,557 - - 522,056 709,587 640,272 8,153,555 169,575 11,542,202
Kgalagadi North 755,616 - - - 728,910 556,541 141,454 1,383,830 - 3,566,352
TOTAL TRADITIONAL 23,096,734 7,142,646 1,777,566 42,961 30,050,157 9,435,192 87,411,741 39,233,284 10,903,172 209,093,454
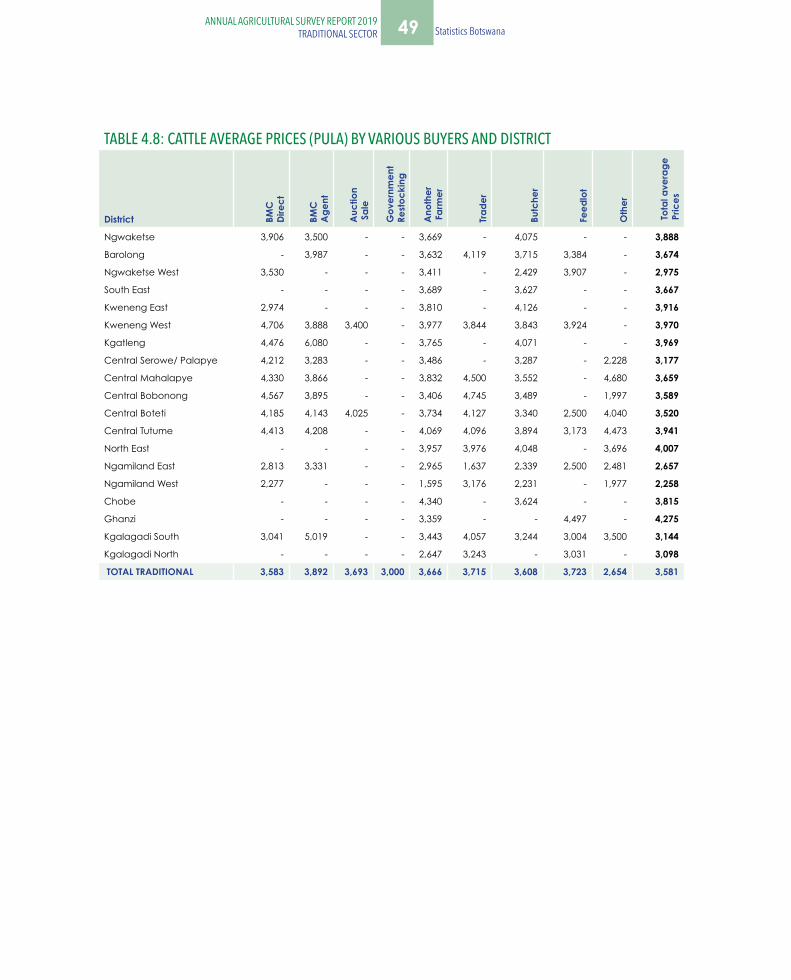
49ANNUAL AGRICULTURAL SURVEY REPORT 2019TRADITIONAL SECTOR Statistics Botswana
TABLE 4.8: CATTLE AVERAGE PRICES (PULA) BY VARIOUS BUYERS AND DISTRICT
District BMC
Dire
ct
BMC
Age
nt
Auc
tion
Sal
e
Gov
ernm
ent
Rest
ocki
ng
Ano
ther
Far
mer
Trad
er
Butc
her
Feed
lot
Oth
er
Tota
l ave
rage
P
rices
Ngwaketse 3,906 3,500 - - 3,669 - 4,075 - - 3,888
Barolong - 3,987 - - 3,632 4,119 3,715 3,384 - 3,674
Ngwaketse West 3,530 - - - 3,411 - 2,429 3,907 - 2,975
South East - - - - 3,689 - 3,627 - - 3,667
Kweneng East 2,974 - - - 3,810 - 4,126 - - 3,916
Kweneng West 4,706 3,888 3,400 - 3,977 3,844 3,843 3,924 - 3,970
Kgatleng 4,476 6,080 - - 3,765 - 4,071 - - 3,969
Central Serowe/ Palapye 4,212 3,283 - - 3,486 - 3,287 - 2,228 3,177
Central Mahalapye 4,330 3,866 - - 3,832 4,500 3,552 - 4,680 3,659
Central Bobonong 4,567 3,895 - - 3,406 4,745 3,489 - 1,997 3,589
Central Boteti 4,185 4,143 4,025 - 3,734 4,127 3,340 2,500 4,040 3,520
Central Tutume 4,413 4,208 - - 4,069 4,096 3,894 3,173 4,473 3,941
North East - - - - 3,957 3,976 4,048 - 3,696 4,007
Ngamiland East 2,813 3,331 - - 2,965 1,637 2,339 2,500 2,481 2,657
Ngamiland West 2,277 - - - 1,595 3,176 2,231 - 1,977 2,258
Chobe - - - - 4,340 - 3,624 - - 3,815
Ghanzi - - - - 3,359 - - 4,497 - 4,275
Kgalagadi South 3,041 5,019 - - 3,443 4,057 3,244 3,004 3,500 3,144
Kgalagadi North - - - - 2,647 3,243 - 3,031 - 3,098
TOTAL TRADITIONAL 3,583 3,892 3,693 3,000 3,666 3,715 3,608 3,723 2,654 3,581
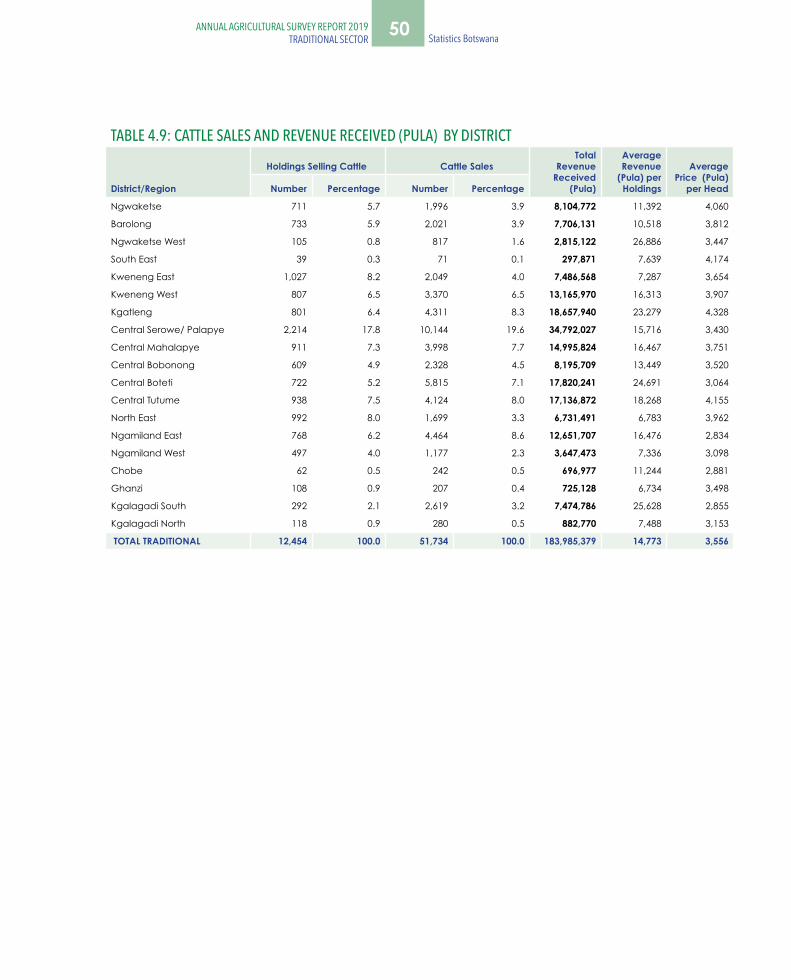
50 Statistics Botswana ANNUAL AGRICULTURAL SURVEY REPORT 2019
TRADITIONAL SECTORANNUAL AGRICULTURAL SURVEY REPORT 2019
TRADITIONAL SECTOR
TABLE 4.9: CATTLE SALES AND REVENUE RECEIVED (PULA) BY DISTRICT
District/Region
Holdings Selling Cattle Cattle SalesTotal
Revenue Received
(Pula)
Average Revenue
(Pula) per Holdings
Average Price (Pula)
per HeadNumber Percentage Number Percentage
Ngwaketse 711 5.7 1,996 3.9 8,104,772 11,392 4,060
Barolong 733 5.9 2,021 3.9 7,706,131 10,518 3,812
Ngwaketse West 105 0.8 817 1.6 2,815,122 26,886 3,447
South East 39 0.3 71 0.1 297,871 7,639 4,174
Kweneng East 1,027 8.2 2,049 4.0 7,486,568 7,287 3,654
Kweneng West 807 6.5 3,370 6.5 13,165,970 16,313 3,907
Kgatleng 801 6.4 4,311 8.3 18,657,940 23,279 4,328
Central Serowe/ Palapye 2,214 17.8 10,144 19.6 34,792,027 15,716 3,430
Central Mahalapye 911 7.3 3,998 7.7 14,995,824 16,467 3,751
Central Bobonong 609 4.9 2,328 4.5 8,195,709 13,449 3,520
Central Boteti 722 5.2 5,815 7.1 17,820,241 24,691 3,064
Central Tutume 938 7.5 4,124 8.0 17,136,872 18,268 4,155
North East 992 8.0 1,699 3.3 6,731,491 6,783 3,962
Ngamiland East 768 6.2 4,464 8.6 12,651,707 16,476 2,834
Ngamiland West 497 4.0 1,177 2.3 3,647,473 7,336 3,098
Chobe 62 0.5 242 0.5 696,977 11,244 2,881
Ghanzi 108 0.9 207 0.4 725,128 6,734 3,498
Kgalagadi South 292 2.1 2,619 3.2 7,474,786 25,628 2,855
Kgalagadi North 118 0.9 280 0.5 882,770 7,488 3,153
TOTAL TRADITIONAL 12,454 100.0 51,734 100.0 183,985,379 14,773 3,556

51ANNUAL AGRICULTURAL SURVEY REPORT 2019TRADITIONAL SECTOR Statistics Botswana
TABLE 4.10: CATTLE PURCHASES AND COST INCURRED (PULA) BY DISTRICT
District
Holdings Purchasing Cattle Cattle Purchases Total Cost Incurred
(Pula)
Average Cost (Pula)
per Holding
Average Cost (Pula)
per HeadNumber Percentage Number Percentage
Ngwaketse 210 7.7 558 8.4 1,883,794 8,949 3,374
Barolong 94 3.5 175 2.6 634,336 6,743 3,628
Ngwaketse West 38 1.4 95 1.4 295,291 7,812 3,125
South East 13 0.5 40 0.6 158,354 12,027 4,009
Kweneng East 387 14.2 863 13.0 3,507,888 9,070 4,066
Kweneng West 206 7.6 693 10.4 3,484,357 16,922 5,030
Kgatleng 98 3.6 608 9.1 1,453,591 14,769 2,392
Central Serowe/ Palapye 257 9.4 509 7.6 2,391,594 9,321 4,699
Central Mahalapye 213 7.8 511 7.7 1,832,787 8,602 3,588
Central Bobonong 177 6.5 376 5.6 1,517,842 8,554 4,036
Central Boteti 191 7.0 414 6.2 1,431,687 18,889 2,517
Central Tutume 126 4.6 312 4.7 710,679 5,648 2,279
North East 105 3.9 129 1.9 491,985 4,704 3,802
Ngamiland East 103 3.8 324 4.9 699,916 6,772 2,160
Ngamiland West 330 12.2 562 8.4 1,773,267 5,370 3,154
Chobe 17 0.6 39 0.6 141,416 8,540 3,663
Ghanzi 130 4.8 409 6.1 1,218,891 9,390 2,980
Kgalagadi South 2 0.1 10 0.1 96,000 65,008 5,679
Kgalagadi North 19 0.7 35 0.5 118,323 6,357 3,392
TOTAL TRADITIONAL 2,717 100.0 6,660 100.0 23,841,997 8,777 3,580
TABLE 4.11: CATTLE HOLDINGS BY CATTLE BREEDING METHOD USED AND DISTRICT
District Artificial
InseminationBull
Service BothTotal
Cattle Holdings
Ngwaketse 31 2,993 37 3,061
Barolong 26 2,092 17 2,136
Ngwaketse West - 208 14 222
South East - 280 - 280
Kweneng East 6 3,279 5 3,290
Kweneng West 8 1,692 10 1,710
Kgatleng 8 2,103 - 2,110
Central Serowe/ Palapye - 2,667 18 2,686
Central Mahalapye 3 1,820 38 1,861
Central Bobonong 38 1,506 4 1,547
Central Boteti 18.5 1,028.3 20.4 1,067.2
Central Tutume 6 2,005 - 2,012
North East 23 1,888 14 1,925
Ngamiland East 12 1,300 - 1,312
Ngamiland West 1 2,334 - 2,335
Chobe - 98 - 98
Ghanzi 1 854 - 855
Kgalagadi South - 651 - 625
Kgalagadi North - 183 14 198
TOTAL TRADITIONAL 181 28,982 192 29,355
52 Statistics Botswana ANNUAL AGRICULTURAL SURVEY REPORT 2019
TRADITIONAL SECTORANNUAL AGRICULTURAL SURVEY REPORT 2019
TRADITIONAL SECTOR
TRADITIONAL SECTOR: SMALL STOCK (GOATS)

53ANNUAL AGRICULTURAL SURVEY REPORT 2019TRADITIONAL SECTOR Statistics Botswana
TABLE 5.1A: GOATS HOLDINGS AND POPULATION BY GENDER AND DISTRICT
District
Goats Holdings
Tota
l Goa
ts
Hold
ings
Total Goats
Tota
l G
oats
Ave
rage
N
umbe
r of
Goa
ts p
er
hold
ing
Mal
e O
wne
d
Per
cent
age
Fem
ale
Ow
ned
Per
cent
age
Mal
e O
wne
d
Perc
enta
ge
Fem
ale
Ow
ned
Per
cent
age
Ngwaketse 2,823 10.4 1,303 8.6 4,126 102,313 11.7 46,981 13.4 149,294 36
Barolong 1,885 7.0 1,867 12.3 3,752 45,498 5.2 35,390 10.1 80,888 22
Ngwaketse West 202 0.7 49 0.3 251 6,214 0.7 3,008 0.9 9,222 37
South East 566 2.1 219 1.4 785 23,721 2.7 6,863 2.0 30,585 39
Kweneng East 4,645 17.2 2,196 14.5 6,841 165,803 18.9 56,901 16.2 222,705 33
Kweneng West 1,476 5.5 700 4.6 2,176 49,578 5.7 12,886 3.7 62,464 29
Kgatleng 1,839 6.8 367 2.4 2,206 80,965 9.2 13,663 3.9 94,628 43
Central Serowe/ Palapye 2,239 8.3 768 5.1 3,007 72,611 8.3 17,712 5.0 90,323 30
Central Mahalapye 1,672 6.2 1,243 8.2 2,915 54,876 6.3 27,407 7.8 82,284 28
Central Bobonong 1,408 5.2 807 5.3 2,216 46,219 5.3 24,642 7.0 70,861 32
Central Boteti 848 3.1 418 2.8 1,265 35,012 4.0 14,126 4.0 49,138 39
Central Tutume 1,944 7.2 1,046 6.9 2,990 51,183 5.8 22,670 6.4 73,853 25
North East 1,907 7.0 2,155 14.2 4,061 35,192 4.0 28,949 8.2 64,141 16
Ngamiland East 1,116 4.1 509 3.4 1,626 35,530 4.1 12,015 3.4 47,546 29
Ngamiland West 1,048 3.9 663 4.4 1,711 19,875 2.3 8,813 2.5 28,687 17
Chobe 108 0.4 134 0.9 242 1,731 0.2 1,715 0.5 3,447 14
Ghanzi 637 2.4 242 1.6 879 21,243 2.4 4,330 1.2 25,572 29
Kgalagadi South 520 1.9 331 2.2 851 23,381 2.7 10,906 3.1 34,287 40
Kgalagadi North 169 0.6 110 0.7 279 6,276 0.7 2,544 0.7 8,820 32
TOTAL TRADITIONAL 27,051 100.0 15,128 100.0 42,179 877,222 100.0 351,521 100.0 1,228,744 29
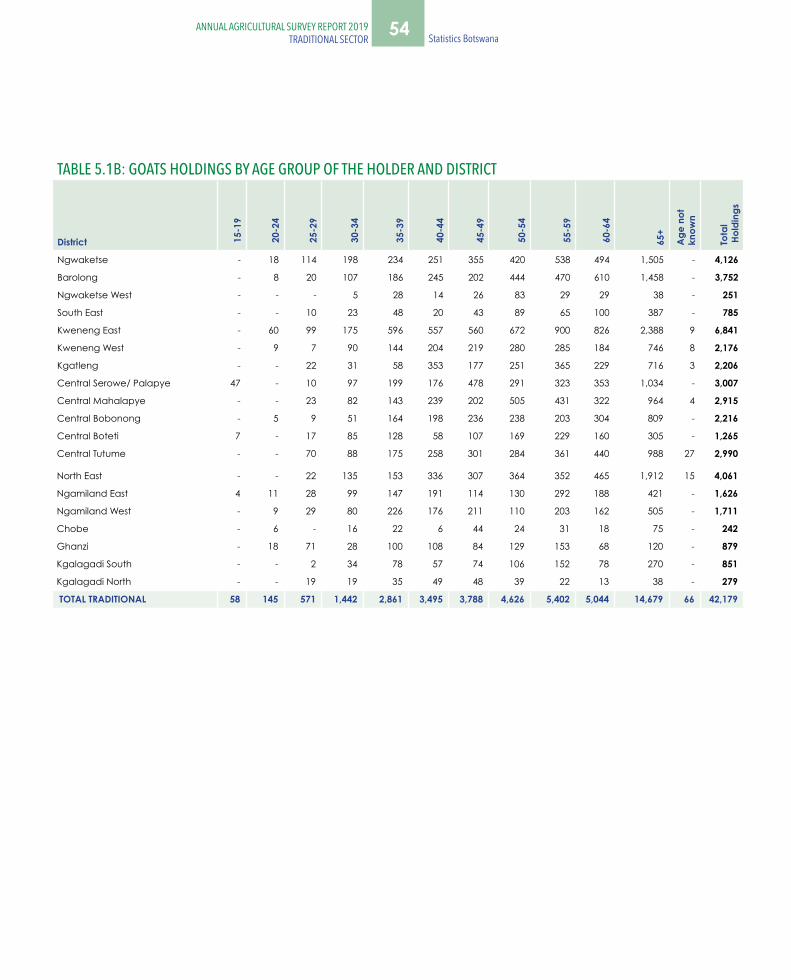
54 Statistics Botswana ANNUAL AGRICULTURAL SURVEY REPORT 2019
TRADITIONAL SECTORANNUAL AGRICULTURAL SURVEY REPORT 2019
TRADITIONAL SECTOR
TABLE 5.1B: GOATS HOLDINGS BY AGE GROUP OF THE HOLDER AND DISTRICT
District 15-
19
20-
24
25-
29
30-
34
35-
39
40-
44
45-
49
50-
54
55-
59
60-
64
65+
Age
not
kn
own
Tota
l H
oldi
ngs
Ngwaketse - 18 114 198 234 251 355 420 538 494 1,505 - 4,126
Barolong - 8 20 107 186 245 202 444 470 610 1,458 - 3,752
Ngwaketse West - - - 5 28 14 26 83 29 29 38 - 251
South East - - 10 23 48 20 43 89 65 100 387 - 785
Kweneng East - 60 99 175 596 557 560 672 900 826 2,388 9 6,841
Kweneng West - 9 7 90 144 204 219 280 285 184 746 8 2,176
Kgatleng - - 22 31 58 353 177 251 365 229 716 3 2,206
Central Serowe/ Palapye 47 - 10 97 199 176 478 291 323 353 1,034 - 3,007
Central Mahalapye - - 23 82 143 239 202 505 431 322 964 4 2,915
Central Bobonong - 5 9 51 164 198 236 238 203 304 809 - 2,216
Central Boteti 7 - 17 85 128 58 107 169 229 160 305 - 1,265
Central Tutume - - 70 88 175 258 301 284 361 440 988 27 2,990
North East - - 22 135 153 336 307 364 352 465 1,912 15 4,061
Ngamiland East 4 11 28 99 147 191 114 130 292 188 421 - 1,626
Ngamiland West - 9 29 80 226 176 211 110 203 162 505 - 1,711
Chobe - 6 - 16 22 6 44 24 31 18 75 - 242
Ghanzi - 18 71 28 100 108 84 129 153 68 120 - 879
Kgalagadi South - - 2 34 78 57 74 106 152 78 270 - 851
Kgalagadi North - - 19 19 35 49 48 39 22 13 38 - 279
TOTAL TRADITIONAL 58 145 571 1,442 2,861 3,495 3,788 4,626 5,402 5,044 14,679 66 42,179
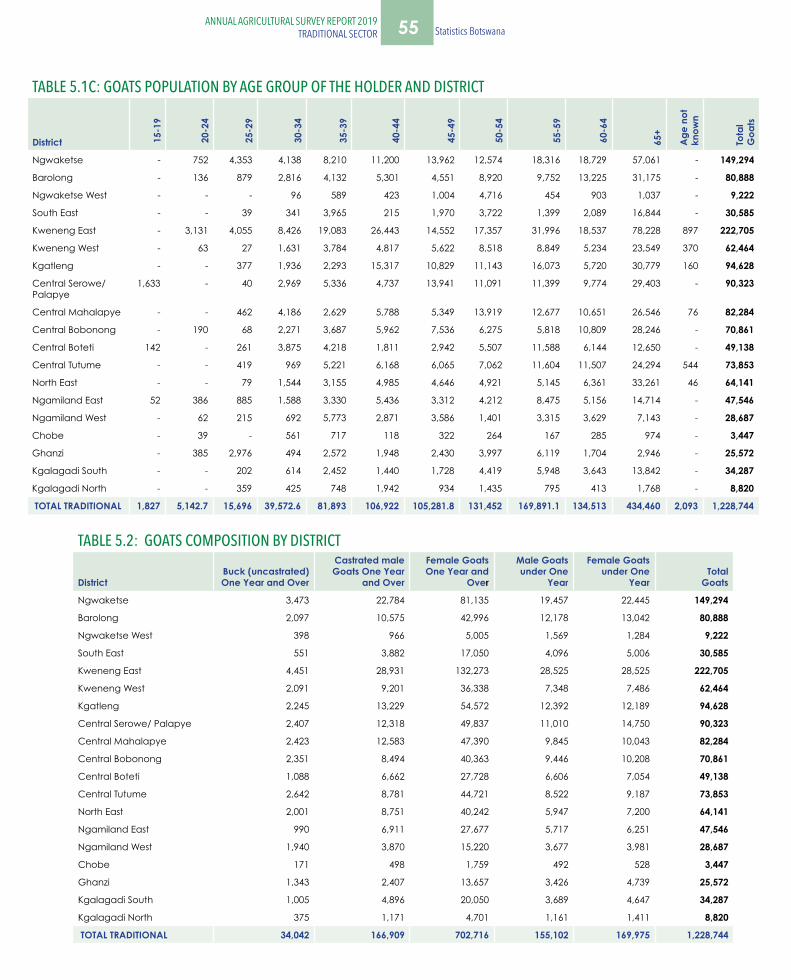
55ANNUAL AGRICULTURAL SURVEY REPORT 2019TRADITIONAL SECTOR Statistics Botswana
TABLE 5.1C: GOATS POPULATION BY AGE GROUP OF THE HOLDER AND DISTRICT
District 15-
19
20-
24
25-
29
30-
34
35-
39
40-
44
45-
49
50-
54
55-
59
60-
64
65+
Age
not
kn
own
Tota
l G
oats
Ngwaketse - 752 4,353 4,138 8,210 11,200 13,962 12,574 18,316 18,729 57,061 - 149,294
Barolong - 136 879 2,816 4,132 5,301 4,551 8,920 9,752 13,225 31,175 - 80,888
Ngwaketse West - - - 96 589 423 1,004 4,716 454 903 1,037 - 9,222
South East - - 39 341 3,965 215 1,970 3,722 1,399 2,089 16,844 - 30,585
Kweneng East - 3,131 4,055 8,426 19,083 26,443 14,552 17,357 31,996 18,537 78,228 897 222,705
Kweneng West - 63 27 1,631 3,784 4,817 5,622 8,518 8,849 5,234 23,549 370 62,464
Kgatleng - - 377 1,936 2,293 15,317 10,829 11,143 16,073 5,720 30,779 160 94,628
Central Serowe/ Palapye
1,633 - 40 2,969 5,336 4,737 13,941 11,091 11,399 9,774 29,403 - 90,323
Central Mahalapye - - 462 4,186 2,629 5,788 5,349 13,919 12,677 10,651 26,546 76 82,284
Central Bobonong - 190 68 2,271 3,687 5,962 7,536 6,275 5,818 10,809 28,246 - 70,861
Central Boteti 142 - 261 3,875 4,218 1,811 2,942 5,507 11,588 6,144 12,650 - 49,138
Central Tutume - - 419 969 5,221 6,168 6,065 7,062 11,604 11,507 24,294 544 73,853
North East - - 79 1,544 3,155 4,985 4,646 4,921 5,145 6,361 33,261 46 64,141
Ngamiland East 52 386 885 1,588 3,330 5,436 3,312 4,212 8,475 5,156 14,714 - 47,546
Ngamiland West - 62 215 692 5,773 2,871 3,586 1,401 3,315 3,629 7,143 - 28,687
Chobe - 39 - 561 717 118 322 264 167 285 974 - 3,447
Ghanzi - 385 2,976 494 2,572 1,948 2,430 3,997 6,119 1,704 2,946 - 25,572
Kgalagadi South - - 202 614 2,452 1,440 1,728 4,419 5,948 3,643 13,842 - 34,287
Kgalagadi North - - 359 425 748 1,942 934 1,435 795 413 1,768 - 8,820
TOTAL TRADITIONAL 1,827 5,142.7 15,696 39,572.6 81,893 106,922 105,281.8 131,452 169,891.1 134,513 434,460 2,093 1,228,744
TABLE 5.2: GOATS COMPOSITION BY DISTRICT
District Buck (uncastrated) One Year and Over
Castrated male Goats One Year
and Over
Female Goats One Year and
Over
Male Goats under One
Year
Female Goats under One
YearTotal
Goats
Ngwaketse 3,473 22,784 81,135 19,457 22,445 149,294
Barolong 2,097 10,575 42,996 12,178 13,042 80,888
Ngwaketse West 398 966 5,005 1,569 1,284 9,222
South East 551 3,882 17,050 4,096 5,006 30,585
Kweneng East 4,451 28,931 132,273 28,525 28,525 222,705
Kweneng West 2,091 9,201 36,338 7,348 7,486 62,464
Kgatleng 2,245 13,229 54,572 12,392 12,189 94,628
Central Serowe/ Palapye 2,407 12,318 49,837 11,010 14,750 90,323
Central Mahalapye 2,423 12,583 47,390 9,845 10,043 82,284
Central Bobonong 2,351 8,494 40,363 9,446 10,208 70,861
Central Boteti 1,088 6,662 27,728 6,606 7,054 49,138
Central Tutume 2,642 8,781 44,721 8,522 9,187 73,853
North East 2,001 8,751 40,242 5,947 7,200 64,141
Ngamiland East 990 6,911 27,677 5,717 6,251 47,546
Ngamiland West 1,940 3,870 15,220 3,677 3,981 28,687
Chobe 171 498 1,759 492 528 3,447
Ghanzi 1,343 2,407 13,657 3,426 4,739 25,572
Kgalagadi South 1,005 4,896 20,050 3,689 4,647 34,287
Kgalagadi North 375 1,171 4,701 1,161 1,411 8,820
TOTAL TRADITIONAL 34,042 166,909 702,716 155,102 169,975 1,228,744
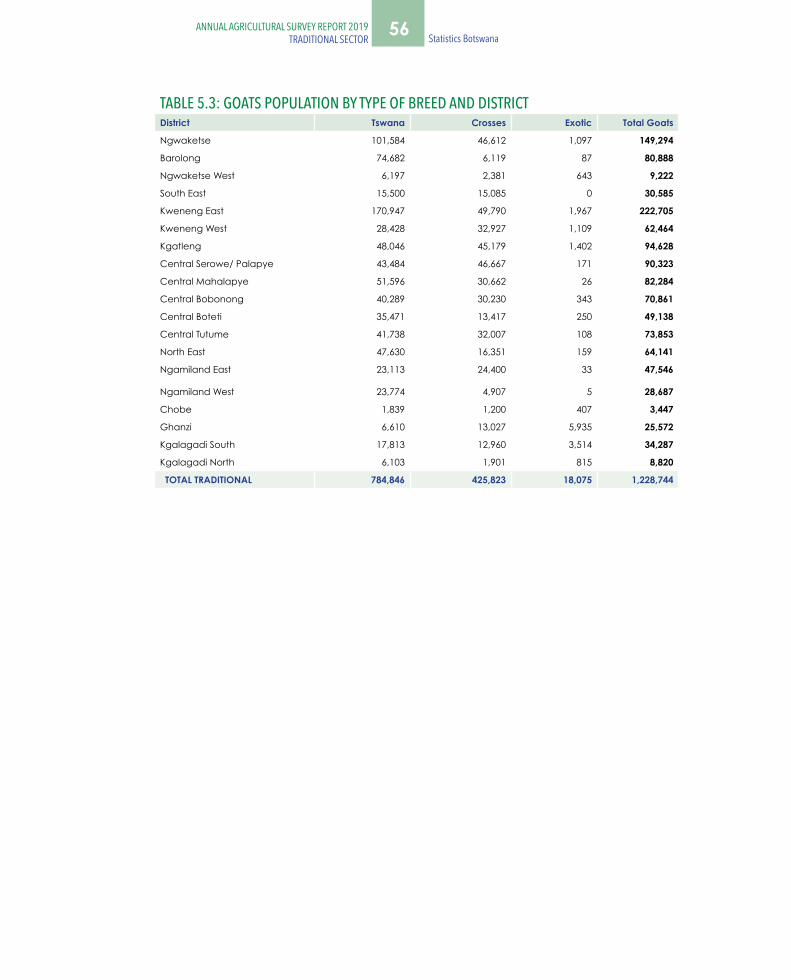
56 Statistics Botswana ANNUAL AGRICULTURAL SURVEY REPORT 2019
TRADITIONAL SECTORANNUAL AGRICULTURAL SURVEY REPORT 2019
TRADITIONAL SECTOR
TABLE 5.3: GOATS POPULATION BY TYPE OF BREED AND DISTRICTDistrict Tswana Crosses Exotic Total Goats
Ngwaketse 101,584 46,612 1,097 149,294
Barolong 74,682 6,119 87 80,888
Ngwaketse West 6,197 2,381 643 9,222
South East 15,500 15,085 0 30,585
Kweneng East 170,947 49,790 1,967 222,705
Kweneng West 28,428 32,927 1,109 62,464
Kgatleng 48,046 45,179 1,402 94,628
Central Serowe/ Palapye 43,484 46,667 171 90,323
Central Mahalapye 51,596 30,662 26 82,284
Central Bobonong 40,289 30,230 343 70,861
Central Boteti 35,471 13,417 250 49,138
Central Tutume 41,738 32,007 108 73,853
North East 47,630 16,351 159 64,141
Ngamiland East 23,113 24,400 33 47,546
Ngamiland West 23,774 4,907 5 28,687
Chobe 1,839 1,200 407 3,447
Ghanzi 6,610 13,027 5,935 25,572
Kgalagadi South 17,813 12,960 3,514 34,287
Kgalagadi North 6,103 1,901 815 8,820
TOTAL TRADITIONAL 784,846 425,823 18,075 1,228,744

57ANNUAL AGRICULTURAL SURVEY REPORT 2019TRADITIONAL SECTOR Statistics Botswana
TABLE 5.4A: GOATS INVENTORY ( BIRTHS, DEATHS, OFFTAKE, ...) BY DISTRICT
District Total Goats SalesHome
Slaughter PurchasesOfftake
RateBirthsRate Deaths
Given Away Losses
Ngwaketse 149,294 6,362 5,438 755 11,045 57,259 21,977 1,232 3,659
Barolong 80,888 2,152 3,002 857 4,298 32,798 8,845 322 2,635
Ngwaketse West 9,222 961 253 604 611 3,418 1,307 175 89
South East 30,585 859 1,101 73 1,887 12,243 4,357 98 398
Kweneng East 222,705 8,312 7,846 5,438 10,719 86,286 42,633 1,729 5,336
Kweneng West 62,464 3,188 2,359 581 4,966 25,987 17,006 855 2,380
Kgatleng 94,628 4,366 3,560 925 7,001 28,869 6,962 312 1,182
Central Serowe/ Palapye 90,323 2,849 3,367 477 5,740 35,208 13,640 578 2,068
Central Mahalapye 82,284 2,426 3,147 1,019 4,553 26,225 10,782 243 3,396
Central Bobonong 70,861 1,551 3,315 887 3,979 29,019 13,764 547 3,454
Central Boteti 49,138 1,759 1,429 662 2,526 19,810 8,396 282 2,377
Central Tutume 73,853 3,080 2,705 1,175 4,610 28,986 16,803 302 2,049
North East 64,141 3,606 3,848 1,403 6,051 30,618 24,862 197 5,504
Ngamiland East 47,546 2,590 1,539 674 3,455 22,994 15,867 398 5,353
Ngamiland West 28,687 1,471 1,155 343 2,283 12,192 7,428 125 1,776
Chobe 3,447 210 121 99 232 1,536 861 21 203
Ghanzi 25,572 1,824 1,416 1,362 1,878 12,864 7,878 192 1,864
Kgalagadi South 34,287 3,040 1,913 193 4,759 11,371 5,290 483 1,468
Kgalagadi North 8,820 365 454 122 697 4,541 3,141 78 524
TOTAL TRADITIONAL 1,228,744 50,972 47,969 17,650 81,291 482,226 231,798 8,170 45,717
TABLE 5.4B: PERCENTAGE: GOATS INVENTORY (BIRTHS, DEATHS, OFFTAKE, ...) BY DISTRICT
District SalesHome
Slaughter PurchasesOfftake
RateBirths Rate
Deaths Rate
Given Away Losses
Ngwaketse 4.3 3.6 0.5 7.4 38.4 14.7 0.8 2.5
Barolong 2.7 3.7 1.1 5.3 40.5 10.9 0.4 3.3
Ngwaketse West 10.4 2.7 6.5 6.6 37.1 14.2 1.9 1.0
South East 2.8 3.6 0.2 6.2 40.0 14.2 0.3 1.3
Kweneng East 3.7 3.5 2.4 4.8 38.7 19.1 0.8 2.4
Kweneng West 5.1 3.8 0.9 8.0 41.6 27.2 1.4 3.8
Kgatleng 4.6 3.8 1.0 7.4 30.5 7.4 0.3 1.2
Central Serowe/ Palapye 3.2 3.7 0.5 6.4 39.0 15.1 0.6 2.3
Central Mahalapye 2.9 3.8 1.2 5.5 31.9 13.1 0.3 4.1
Central Bobonong 2.2 4.7 1.3 5.6 41.0 19.4 0.8 4.9
Central Boteti 3.6 2.9 1.3 5.1 40.3 17.1 0.6 4.8
Central Tutume 4.2 3.7 1.6 6.2 39.2 22.8 0.4 2.8
North East 5.6 6.0 2.2 9.4 47.7 38.8 0.3 8.6
Ngamiland East 5.4 3.2 1.4 7.3 48.4 33.4 0.8 11.3
Ngamiland West 5.1 4.0 1.2 8.0 42.5 25.9 0.4 6.2
Chobe 6.1 3.5 2.9 6.7 44.6 25.0 0.6 5.9
Ghanzi 7.1 5.5 5.3 7.3 50.3 30.8 0.8 7.3
Kgalagadi South 8.9 5.6 0.6 13.9 33.2 15.4 1.4 4.3
Kgalagadi North 4.1 5.1 1.4 7.9 51.5 35.6 0.9 5.9
TOTAL TRADITIONAL 4.1 3.9 1.4 6.6 39.2 18.9 0.7 3.7
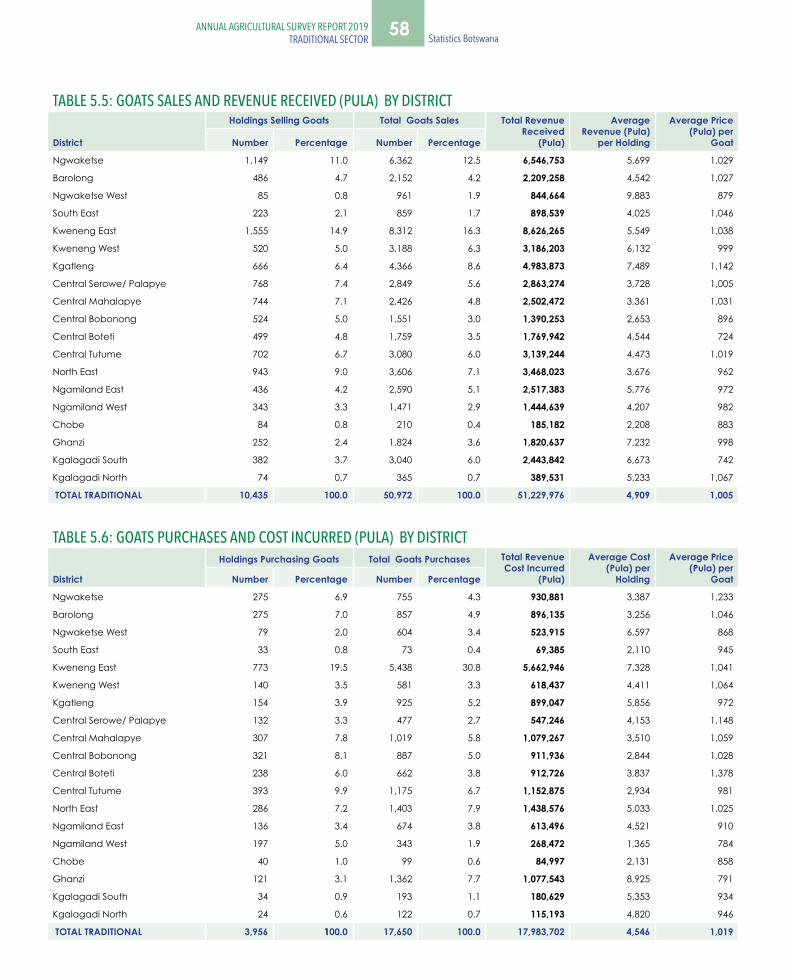
58 Statistics Botswana ANNUAL AGRICULTURAL SURVEY REPORT 2019
TRADITIONAL SECTORANNUAL AGRICULTURAL SURVEY REPORT 2019
TRADITIONAL SECTOR
TABLE 5.5: GOATS SALES AND REVENUE RECEIVED (PULA) BY DISTRICT
District
Holdings Selling Goats Total Goats Sales Total Revenue Received
(Pula)
Average Revenue (Pula)
per Holding
Average Price (Pula) per
Goat Number Percentage Number Percentage
Ngwaketse 1,149 11.0 6,362 12.5 6,546,753 5,699 1,029
Barolong 486 4.7 2,152 4.2 2,209,258 4,542 1,027
Ngwaketse West 85 0.8 961 1.9 844,664 9,883 879
South East 223 2.1 859 1.7 898,539 4,025 1,046
Kweneng East 1,555 14.9 8,312 16.3 8,626,265 5,549 1,038
Kweneng West 520 5.0 3,188 6.3 3,186,203 6,132 999
Kgatleng 666 6.4 4,366 8.6 4,983,873 7,489 1,142
Central Serowe/ Palapye 768 7.4 2,849 5.6 2,863,274 3,728 1,005
Central Mahalapye 744 7.1 2,426 4.8 2,502,472 3,361 1,031
Central Bobonong 524 5.0 1,551 3.0 1,390,253 2,653 896
Central Boteti 499 4.8 1,759 3.5 1,769,942 4,544 724
Central Tutume 702 6.7 3,080 6.0 3,139,244 4,473 1,019
North East 943 9.0 3,606 7.1 3,468,023 3,676 962
Ngamiland East 436 4.2 2,590 5.1 2,517,383 5,776 972
Ngamiland West 343 3.3 1,471 2.9 1,444,639 4,207 982
Chobe 84 0.8 210 0.4 185,182 2,208 883
Ghanzi 252 2.4 1,824 3.6 1,820,637 7,232 998
Kgalagadi South 382 3.7 3,040 6.0 2,443,842 6,673 742
Kgalagadi North 74 0.7 365 0.7 389,531 5,233 1,067
TOTAL TRADITIONAL 10,435 100.0 50,972 100.0 51,229,976 4,909 1,005
TABLE 5.6: GOATS PURCHASES AND COST INCURRED (PULA) BY DISTRICT
District
Holdings Purchasing Goats Total Goats Purchases Total Revenue Cost Incurred
(Pula)
Average Cost (Pula) per
Holding
Average Price (Pula) per
Goat Number Percentage Number Percentage
Ngwaketse 275 6.9 755 4.3 930,881 3,387 1,233
Barolong 275 7.0 857 4.9 896,135 3,256 1,046
Ngwaketse West 79 2.0 604 3.4 523,915 6,597 868
South East 33 0.8 73 0.4 69,385 2,110 945
Kweneng East 773 19.5 5,438 30.8 5,662,946 7,328 1,041
Kweneng West 140 3.5 581 3.3 618,437 4,411 1,064
Kgatleng 154 3.9 925 5.2 899,047 5,856 972
Central Serowe/ Palapye 132 3.3 477 2.7 547,246 4,153 1,148
Central Mahalapye 307 7.8 1,019 5.8 1,079,267 3,510 1,059
Central Bobonong 321 8.1 887 5.0 911,936 2,844 1,028
Central Boteti 238 6.0 662 3.8 912,726 3,837 1,378
Central Tutume 393 9.9 1,175 6.7 1,152,875 2,934 981
North East 286 7.2 1,403 7.9 1,438,576 5,033 1,025
Ngamiland East 136 3.4 674 3.8 613,496 4,521 910
Ngamiland West 197 5.0 343 1.9 268,472 1,365 784
Chobe 40 1.0 99 0.6 84,997 2,131 858
Ghanzi 121 3.1 1,362 7.7 1,077,543 8,925 791
Kgalagadi South 34 0.9 193 1.1 180,629 5,353 934
Kgalagadi North 24 0.6 122 0.7 115,193 4,820 946
TOTAL TRADITIONAL 3,956 100.0 17,650 100.0 17,983,702 4,546 1,019
59ANNUAL AGRICULTURAL SURVEY REPORT 2019TRADITIONAL SECTOR Statistics Botswana
TRADITIONAL SECTOR: SMALL STOCK (SHEEP)
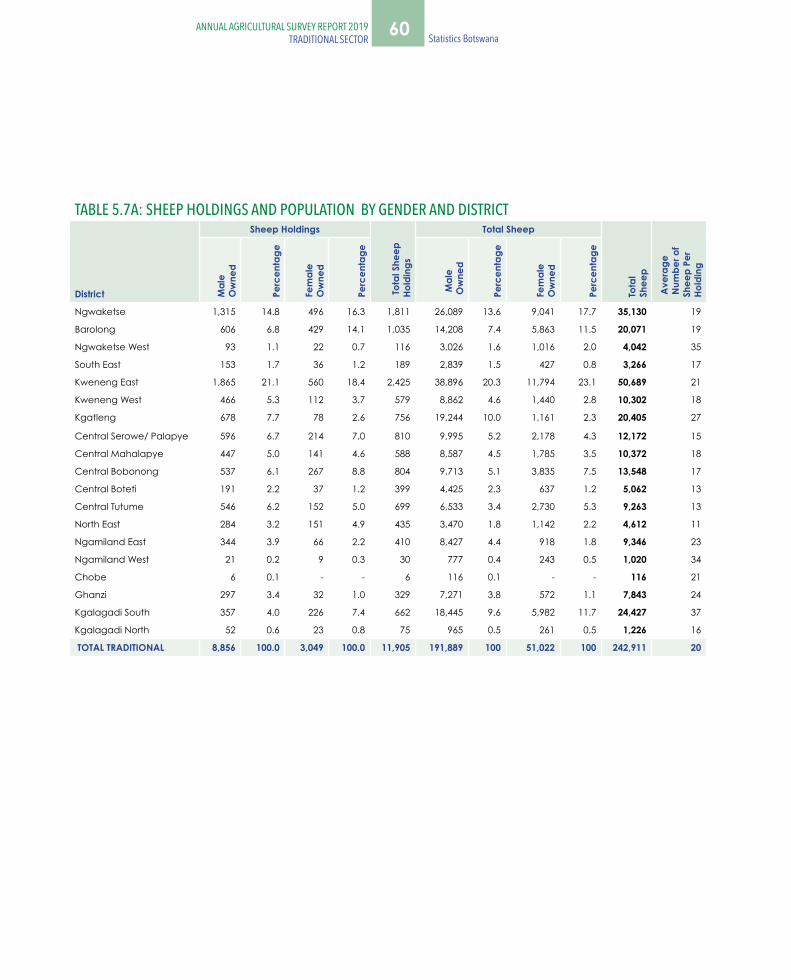
60 Statistics Botswana ANNUAL AGRICULTURAL SURVEY REPORT 2019
TRADITIONAL SECTORANNUAL AGRICULTURAL SURVEY REPORT 2019
TRADITIONAL SECTOR
TABLE 5.7A: SHEEP HOLDINGS AND POPULATION BY GENDER AND DISTRICT
District
Sheep Holdings
Tota
l She
ep
Hold
ings
Total Sheep
Tota
l Sh
eep
Ave
rage
Num
ber o
fSh
eep
Per
Hold
ing
Mal
e O
wne
d
Perc
enta
ge
Fem
ale
Ow
ned
Perc
enta
ge
Mal
e O
wne
d
Perc
enta
ge
Fem
ale
Ow
ned
Perc
enta
ge
Ngwaketse 1,315 14.8 496 16.3 1,811 26,089 13.6 9,041 17.7 35,130 19
Barolong 606 6.8 429 14.1 1,035 14,208 7.4 5,863 11.5 20,071 19
Ngwaketse West 93 1.1 22 0.7 116 3,026 1.6 1,016 2.0 4,042 35
South East 153 1.7 36 1.2 189 2,839 1.5 427 0.8 3,266 17
Kweneng East 1,865 21.1 560 18.4 2,425 38,896 20.3 11,794 23.1 50,689 21
Kweneng West 466 5.3 112 3.7 579 8,862 4.6 1,440 2.8 10,302 18
Kgatleng 678 7.7 78 2.6 756 19,244 10.0 1,161 2.3 20,405 27
Central Serowe/ Palapye 596 6.7 214 7.0 810 9,995 5.2 2,178 4.3 12,172 15
Central Mahalapye 447 5.0 141 4.6 588 8,587 4.5 1,785 3.5 10,372 18
Central Bobonong 537 6.1 267 8.8 804 9,713 5.1 3,835 7.5 13,548 17
Central Boteti 191 2.2 37 1.2 399 4,425 2.3 637 1.2 5,062 13
Central Tutume 546 6.2 152 5.0 699 6,533 3.4 2,730 5.3 9,263 13
North East 284 3.2 151 4.9 435 3,470 1.8 1,142 2.2 4,612 11
Ngamiland East 344 3.9 66 2.2 410 8,427 4.4 918 1.8 9,346 23
Ngamiland West 21 0.2 9 0.3 30 777 0.4 243 0.5 1,020 34
Chobe 6 0.1 - - 6 116 0.1 - - 116 21
Ghanzi 297 3.4 32 1.0 329 7,271 3.8 572 1.1 7,843 24
Kgalagadi South 357 4.0 226 7.4 662 18,445 9.6 5,982 11.7 24,427 37
Kgalagadi North 52 0.6 23 0.8 75 965 0.5 261 0.5 1,226 16
TOTAL TRADITIONAL 8,856 100.0 3,049 100.0 11,905 191,889 100 51,022 100 242,911 20

61ANNUAL AGRICULTURAL SURVEY REPORT 2019TRADITIONAL SECTOR Statistics Botswana
TABLE 5.7B: SHEEP HOLDINGS BY AGE GROUP AND DISTRICT
District 15-19 20-24 25-29 30-34 35-39 40-44 45-49 50-54 55-59 60-64 65+
Age not
knownTotal
Holdings
Ngwaketse - 3 63 54 139 95 146 196 266 231 617 - 1,811
Barolong - - 15 35 80 61 48 141 111 153 390 - 1,035
Ngwaketse West - - - 5 11 5 12 58 4 11 11 - 116
South East - - - - 3 20 2 49 10 7 98 - 189
Kweneng East - - 25 41 268 206 235 298 279 251 812 9 2,425
Kweneng West - - - 5 39 60 72 69 61 64 208 - 579
Kgatleng - - 17 - 23 132 60 61 107 123 229 3 756
Central Serowe/ Palapye
47 - - 31 31 65 147 24 97 59 310 - 810
Central Mahalapye - - - 14 28 50 43 70 114 92 175 1 588
Central Bobonong - 5 6 7 38 25 60 92 110 120 338 4 804
Central Boteti - - 2 11 17 14 15 17 62 26 63 - 227
Central Tutume - - - 12 23 61 94 104 111 98 195 - 699
North East - - - - 38 47 61 71 52 27 139 - 435
Ngamiland East - - 10 4 31 43 35 26 84 51 125 - 410
Ngamiland West - - - - 1 - 4 1 - 13 11 - 30
Chobe - - - - 6 - - - - - - - 6
Ghanzi - 1 23 19 40 42 21 73 39 27 43 - 329
Kgalagadi South - - 2 19 15 37 46 85 124 56 198 - 583
Kgalagadi North - - - 5 9 18 11 14 6 4 8 - 75
TOTAL TRADITIONAL 47 10 165 263 841 980 1,112 1,450 1,638 1,412 3,971 17 11,905
TABLE 5.7C: SHEEP POPULATION BY AGE GROUP AND DISTRICT
District 15-19 20-24 25-29 30-34 35-39 40-44 45-49 50-54 55-59 60-64 65+
Age not
knownTotal
Sheep
Ngwaketse - 72 772 330 2,785 1,623 3,673 3,349 4,851 5,378 12,297 - 35,130
Barolong - - 186 1,318 2,853 964 1,029 2,087 1,756 3,061 6,817 - 20,071
Ngwaketse West - - - 109 279 73 405 2,654 80 112 330 - 4,042
South East - - - - 47 284 6 1,249 69 101 1,509 - 3,266
Kweneng East - - 583 1,082 8,314 4,535 4,232 4,045 6,939 4,578 16,165 217 50,689
Kweneng West - - - 66 468 1,234 1,304 1,379 999 1,154 3,698 - 10,302
Kgatleng - - 136 - 1,727 3,644 1,759 2,436 3,872 1,575 5,252 3 20,405
Central Serowe/ Palapye
420 - - 552 121 1,944 1,378 404 2,886 836 3,630 - 12,172
Central Mahalapye - - - 584 328 1,216 678 954 2,371 1,225 2,987 30 10,372
Central Bobonong - 51 13 27 867 156 1,017 1,419 2,675 1,928 5,385 11 13,548
Central Boteti - - 48 105 276 196 1,122 744 831 334 1,406 - 5,062
Central Tutume - - - 77 65 420 588 1,487 1,034 1,650 3,941 - 9,263
North East - - - - 265 737 215 725 260 231 2,179 - 4,612
Ngamiland East - - 96 31 404 462 1,147 263 1,981 980 3,981 - 9,346
Ngamiland West - - - - 15 - 68 38 - 256 644 - 1,020
Chobe - - - - 116 - - - - - - - 116
Ghanzi - 60 754 207 519 781 464 2,251 970 454 1,383 - 7,843
Kgalagadi South - - 194 381 2,664 1,389 896 3,242 3,466 3,413 8,781 - 24,427
Kgalagadi North - - - 70 28 323 121 327 128 155 74 - 1,226
TOTAL TRADITIONAL 420 183 2,782 4,941 22,141 19,980 20,102 29,053 35,166 27,421 80,460 262 242,911
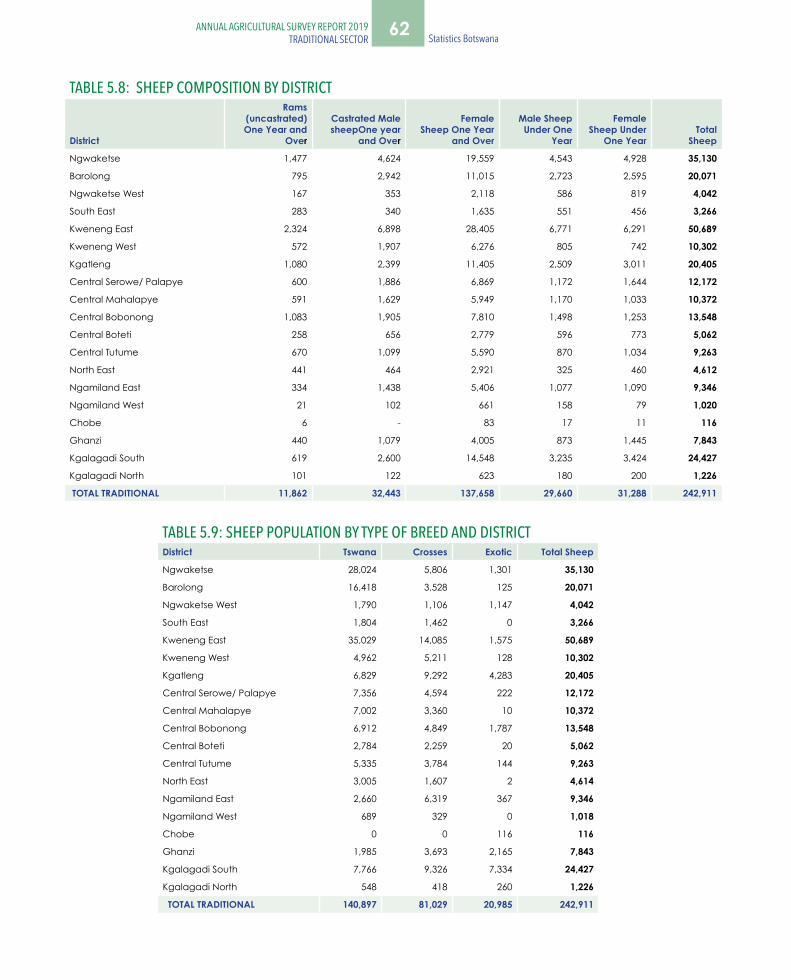
62 Statistics Botswana ANNUAL AGRICULTURAL SURVEY REPORT 2019
TRADITIONAL SECTORANNUAL AGRICULTURAL SURVEY REPORT 2019
TRADITIONAL SECTOR
TABLE 5.8: SHEEP COMPOSITION BY DISTRICT
District
Rams (uncastrated) One Year and
Over
Castrated Male sheepOne year
and Over
Female Sheep One Year
and Over
Male Sheep Under One
Year
Female Sheep Under
One Year Total
Sheep
Ngwaketse 1,477 4,624 19,559 4,543 4,928 35,130
Barolong 795 2,942 11,015 2,723 2,595 20,071
Ngwaketse West 167 353 2,118 586 819 4,042
South East 283 340 1,635 551 456 3,266
Kweneng East 2,324 6,898 28,405 6,771 6,291 50,689
Kweneng West 572 1,907 6,276 805 742 10,302
Kgatleng 1,080 2,399 11,405 2,509 3,011 20,405
Central Serowe/ Palapye 600 1,886 6,869 1,172 1,644 12,172
Central Mahalapye 591 1,629 5,949 1,170 1,033 10,372
Central Bobonong 1,083 1,905 7,810 1,498 1,253 13,548
Central Boteti 258 656 2,779 596 773 5,062
Central Tutume 670 1,099 5,590 870 1,034 9,263
North East 441 464 2,921 325 460 4,612
Ngamiland East 334 1,438 5,406 1,077 1,090 9,346
Ngamiland West 21 102 661 158 79 1,020
Chobe 6 - 83 17 11 116
Ghanzi 440 1,079 4,005 873 1,445 7,843
Kgalagadi South 619 2,600 14,548 3,235 3,424 24,427
Kgalagadi North 101 122 623 180 200 1,226
TOTAL TRADITIONAL 11,862 32,443 137,658 29,660 31,288 242,911
TABLE 5.9: SHEEP POPULATION BY TYPE OF BREED AND DISTRICTDistrict Tswana Crosses Exotic Total Sheep
Ngwaketse 28,024 5,806 1,301 35,130
Barolong 16,418 3,528 125 20,071
Ngwaketse West 1,790 1,106 1,147 4,042
South East 1,804 1,462 0 3,266
Kweneng East 35,029 14,085 1,575 50,689
Kweneng West 4,962 5,211 128 10,302
Kgatleng 6,829 9,292 4,283 20,405
Central Serowe/ Palapye 7,356 4,594 222 12,172
Central Mahalapye 7,002 3,360 10 10,372
Central Bobonong 6,912 4,849 1,787 13,548
Central Boteti 2,784 2,259 20 5,062
Central Tutume 5,335 3,784 144 9,263
North East 3,005 1,607 2 4,614
Ngamiland East 2,660 6,319 367 9,346
Ngamiland West 689 329 0 1,018
Chobe 0 0 116 116
Ghanzi 1,985 3,693 2,165 7,843
Kgalagadi South 7,766 9,326 7,334 24,427
Kgalagadi North 548 418 260 1,226
TOTAL TRADITIONAL 140,897 81,029 20,985 242,911

63ANNUAL AGRICULTURAL SURVEY REPORT 2019TRADITIONAL SECTOR Statistics Botswana
TABLE 5.10A: SHEEP INVENTORY ( BIRTHS, DEATHS, OFFTAKE, …) BY DISTRICT
District Total
Sheep Sales Home
Slaughter Purchases Offtake Births Deaths Given Away Losses
Ngwaketse 35,130 1,066 1,101 411 1,755 12,014 3,797 114 1,264
Barolong 20,071 798 460 274 985 6,114 1,294 117 614
Ngwaketse West 4,042 746 216 71 891 1,543 305 - 350
South East 3,266 166 114 182 98 1,339 839 26 62
Kweneng East 50,689 2,915 1,539 600 3,855 17,456 9,869 104 638
Kweneng West 10,302 491 465 257 699 2,532 1,788 - 368
Kgatleng 20,405 1,788 1,195 307 2,676 6,367 1,261 254 205
Central Serowe/ Palapye 12,172 110 306 89 327 3,689 1,364 70 379
Central Mahalapye 10,372 195 466 123 537 2,740 798 17 419
Central Bobonong 13,548 318 593 205 706 4,402 2,475 39 557
Central Boteti 5,062 159 206 172 193 1,851 694 23 204
Central Tutume 9,263 176 308 78 405 2,411 1,296 19 245
North East 4,612 330 368 103 595 1,429 1,660 115 245
Ngamiland East 9,346 693 192 206 679 3,261 1,879 21 721
Ngamiland West 1,020 26 14 - 40 304 106 4 16
Chobe 116 28 - - 28 55 50 - -
Ghanzi 7,843 481 362 32 811 3,255 1,524 38 394
Kgalagadi South 24,427 2,726 957 238 3,444 8,401 3,082 112 881
Kgalagadi North 1,226 19 56 105 (30) 507 290 - 68
TOTAL TRADITIONAL 242,911 13,230 8,919 3,454 18,695 79,669 34,369 1,073 7,630
() Denotes negative figure
TABLE 5.10B: PERCENTAGE: SHEEP INVENTORY ( BIRTHS, DEATHS, OFFTAKE, …) BY DISTRICT
District SalesHome
Slaughter Purchases Offtake Births DeathsGiven Away Losses
Ngwaketse 3.0 3.1 1.2 5.0 34.2 10.8 0.3 3.6
Barolong 4.0 2.3 1.4 4.9 30.5 6.4 0.6 3.1
Ngwaketse West 18.5 5.3 1.8 22.1 38.2 7.5 - 8.7
South East 5.1 3.5 5.6 3.0 41.0 25.7 0.8 1.9
Kweneng East 5.8 3.0 1.2 7.6 34.4 19.5 0.2 1.3
Kweneng West 4.8 4.5 2.5 6.8 24.6 17.4 - 3.6
Kgatleng 8.8 5.9 1.5 13.1 31.2 6.2 1.2 1.0
Central Serowe/ Palapye 0.9 2.5 0.7 2.7 30.3 11.2 0.6 3.1
Central Mahalapye 1.9 4.5 1.2 5.2 26.4 7.7 0.2 4.0
Central Bobonong 2.3 4.4 1.5 5.2 32.5 18.3 0.3 4.1
Central Boteti 3.1 4.1 3.4 3.8 36.6 13.7 0.5 4.0
Central Tutume 1.9 3.3 0.8 4.4 26.0 14.0 0.2 2.6
North East 7.2 8.0 2.2 12.9 31.0 36.0 2.5 5.3
Ngamiland East 7.4 2.1 2.2 7.3 34.9 20.1 0.2 7.7
Ngamiland West 2.6 1.4 - 4.0 29.8 10.4 0.4 1.5
Chobe 23.8 - - 23.8 47.6 42.9 - -
Ghanzi 6.1 4.6 0.4 10.3 41.5 19.4 0.5 5.0
Kgalagadi South 11.2 3.9 1.0 14.1 34.4 12.6 0.5 3.6
Kgalagadi North 1.5 4.6 8.6 (2.5) 41.3 23.6 - 5.5
TOTAL TRADITIONAL 5.4 3.7 1.4 7.7 32.8 14.1 0.4 3.1
() Denotes negative figure
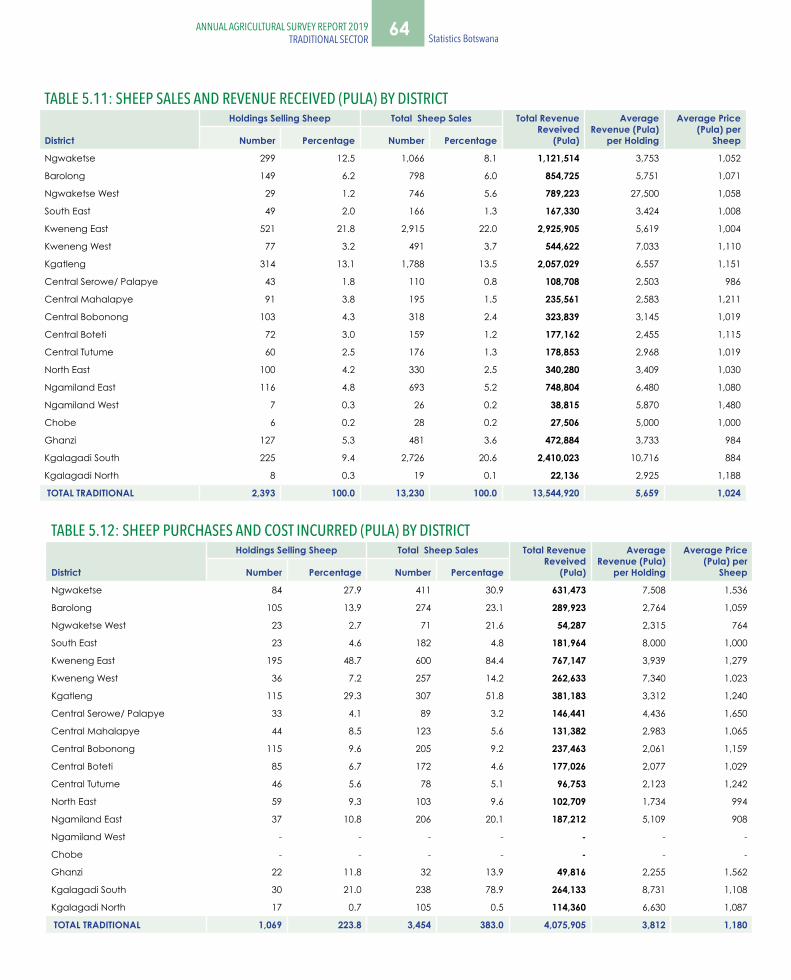
64 Statistics Botswana ANNUAL AGRICULTURAL SURVEY REPORT 2019
TRADITIONAL SECTORANNUAL AGRICULTURAL SURVEY REPORT 2019
TRADITIONAL SECTOR
TABLE 5.11: SHEEP SALES AND REVENUE RECEIVED (PULA) BY DISTRICT
District
Holdings Selling Sheep Total Sheep Sales Total Revenue Reveived
(Pula)
Average Revenue (Pula)
per Holding
Average Price (Pula) per
Sheep Number Percentage Number Percentage
Ngwaketse 299 12.5 1,066 8.1 1,121,514 3,753 1,052
Barolong 149 6.2 798 6.0 854,725 5,751 1,071
Ngwaketse West 29 1.2 746 5.6 789,223 27,500 1,058
South East 49 2.0 166 1.3 167,330 3,424 1,008
Kweneng East 521 21.8 2,915 22.0 2,925,905 5,619 1,004
Kweneng West 77 3.2 491 3.7 544,622 7,033 1,110
Kgatleng 314 13.1 1,788 13.5 2,057,029 6,557 1,151
Central Serowe/ Palapye 43 1.8 110 0.8 108,708 2,503 986
Central Mahalapye 91 3.8 195 1.5 235,561 2,583 1,211
Central Bobonong 103 4.3 318 2.4 323,839 3,145 1,019
Central Boteti 72 3.0 159 1.2 177,162 2,455 1,115
Central Tutume 60 2.5 176 1.3 178,853 2,968 1,019
North East 100 4.2 330 2.5 340,280 3,409 1,030
Ngamiland East 116 4.8 693 5.2 748,804 6,480 1,080
Ngamiland West 7 0.3 26 0.2 38,815 5,870 1,480
Chobe 6 0.2 28 0.2 27,506 5,000 1,000
Ghanzi 127 5.3 481 3.6 472,884 3,733 984
Kgalagadi South 225 9.4 2,726 20.6 2,410,023 10,716 884
Kgalagadi North 8 0.3 19 0.1 22,136 2,925 1,188
TOTAL TRADITIONAL 2,393 100.0 13,230 100.0 13,544,920 5,659 1,024
TABLE 5.12: SHEEP PURCHASES AND COST INCURRED (PULA) BY DISTRICT
District
Holdings Selling Sheep Total Sheep Sales Total Revenue Reveived
(Pula)
Average Revenue (Pula)
per Holding
Average Price (Pula) per
Sheep Number Percentage Number Percentage
Ngwaketse 84 27.9 411 30.9 631,473 7,508 1,536
Barolong 105 13.9 274 23.1 289,923 2,764 1,059
Ngwaketse West 23 2.7 71 21.6 54,287 2,315 764
South East 23 4.6 182 4.8 181,964 8,000 1,000
Kweneng East 195 48.7 600 84.4 767,147 3,939 1,279
Kweneng West 36 7.2 257 14.2 262,633 7,340 1,023
Kgatleng 115 29.3 307 51.8 381,183 3,312 1,240
Central Serowe/ Palapye 33 4.1 89 3.2 146,441 4,436 1,650
Central Mahalapye 44 8.5 123 5.6 131,382 2,983 1,065
Central Bobonong 115 9.6 205 9.2 237,463 2,061 1,159
Central Boteti 85 6.7 172 4.6 177,026 2,077 1,029
Central Tutume 46 5.6 78 5.1 96,753 2,123 1,242
North East 59 9.3 103 9.6 102,709 1,734 994
Ngamiland East 37 10.8 206 20.1 187,212 5,109 908
Ngamiland West - - - - - - -
Chobe - - - - - - -
Ghanzi 22 11.8 32 13.9 49,816 2,255 1,562
Kgalagadi South 30 21.0 238 78.9 264,133 8,731 1,108
Kgalagadi North 17 0.7 105 0.5 114,360 6,630 1,087
TOTAL TRADITIONAL 1,069 223.8 3,454 383.0 4,075,905 3,812 1,180
65ANNUAL AGRICULTURAL SURVEY REPORT 2019TRADITIONAL SECTOR Statistics Botswana
TRADITIONAL SECTOR: OTHER LIVESTOCK
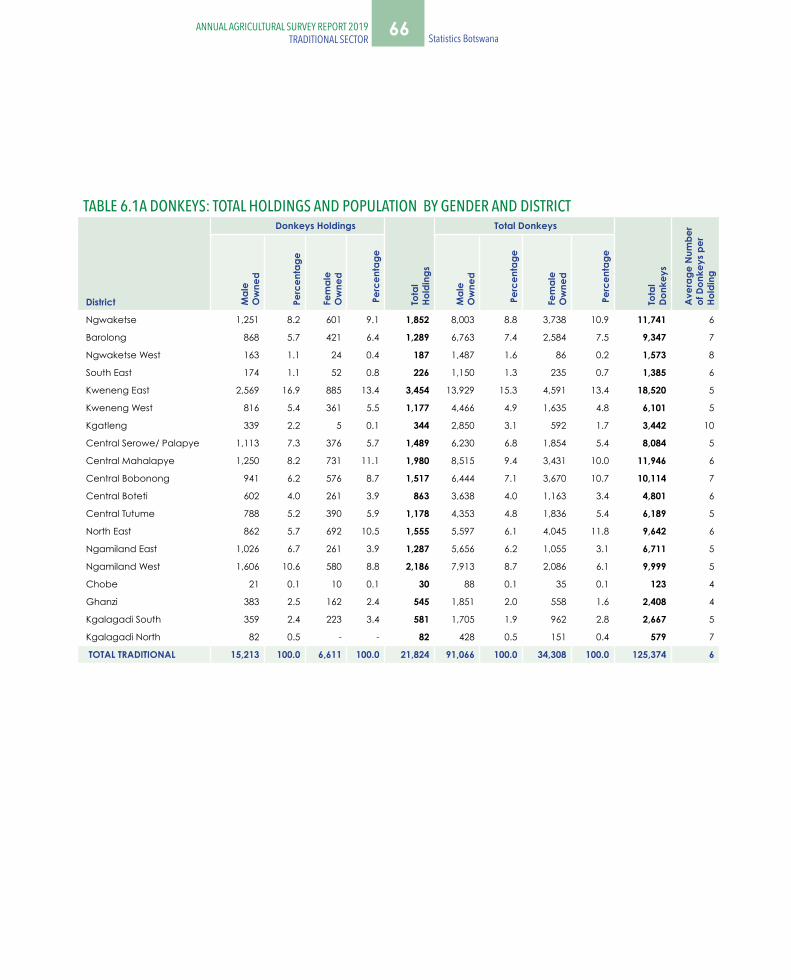
66 Statistics Botswana ANNUAL AGRICULTURAL SURVEY REPORT 2019
TRADITIONAL SECTORANNUAL AGRICULTURAL SURVEY REPORT 2019
TRADITIONAL SECTOR
TABLE 6.1A DONKEYS: TOTAL HOLDINGS AND POPULATION BY GENDER AND DISTRICT
District
Donkeys Holdings
Tota
l Ho
ldin
gs
Total Donkeys
Tota
l Do
nkey
s
Ave
rage
Num
ber
of D
onke
ys p
er
Hold
ing
Mal
e O
wne
d
Perc
enta
ge
Fem
ale
Ow
ned
Per
cent
age
Mal
e O
wne
d
Per
cent
age
Fem
ale
Ow
ned
Per
cent
age
Ngwaketse 1,251 8.2 601 9.1 1,852 8,003 8.8 3,738 10.9 11,741 6
Barolong 868 5.7 421 6.4 1,289 6,763 7.4 2,584 7.5 9,347 7
Ngwaketse West 163 1.1 24 0.4 187 1,487 1.6 86 0.2 1,573 8
South East 174 1.1 52 0.8 226 1,150 1.3 235 0.7 1,385 6
Kweneng East 2,569 16.9 885 13.4 3,454 13,929 15.3 4,591 13.4 18,520 5
Kweneng West 816 5.4 361 5.5 1,177 4,466 4.9 1,635 4.8 6,101 5
Kgatleng 339 2.2 5 0.1 344 2,850 3.1 592 1.7 3,442 10
Central Serowe/ Palapye 1,113 7.3 376 5.7 1,489 6,230 6.8 1,854 5.4 8,084 5
Central Mahalapye 1,250 8.2 731 11.1 1,980 8,515 9.4 3,431 10.0 11,946 6
Central Bobonong 941 6.2 576 8.7 1,517 6,444 7.1 3,670 10.7 10,114 7
Central Boteti 602 4.0 261 3.9 863 3,638 4.0 1,163 3.4 4,801 6
Central Tutume 788 5.2 390 5.9 1,178 4,353 4.8 1,836 5.4 6,189 5
North East 862 5.7 692 10.5 1,555 5,597 6.1 4,045 11.8 9,642 6
Ngamiland East 1,026 6.7 261 3.9 1,287 5,656 6.2 1,055 3.1 6,711 5
Ngamiland West 1,606 10.6 580 8.8 2,186 7,913 8.7 2,086 6.1 9,999 5
Chobe 21 0.1 10 0.1 30 88 0.1 35 0.1 123 4
Ghanzi 383 2.5 162 2.4 545 1,851 2.0 558 1.6 2,408 4
Kgalagadi South 359 2.4 223 3.4 581 1,705 1.9 962 2.8 2,667 5
Kgalagadi North 82 0.5 - - 82 428 0.5 151 0.4 579 7
TOTAL TRADITIONAL 15,213 100.0 6,611 100.0 21,824 91,066 100.0 34,308 100.0 125,374 6

67ANNUAL AGRICULTURAL SURVEY REPORT 2019TRADITIONAL SECTOR Statistics Botswana
TABLE 6.1B MULES: TOTAL HOLDINGS AND POPULATION BY GENDER AND DISTRICT
District
Mules Holdings
Tota
l H
oldi
ngs
Total Mules
Tota
l M
ules
Ave
rage
N
umbe
r of
Mul
es p
er
Hold
ing
Mal
e O
wne
d
Per
cent
age
Fem
ale
Ow
ned
Per
cent
age
Mal
e O
wne
d
Per
cent
age
Fem
ale
Ow
ned
Per
cent
age
Ngwaketse 24 16.1 - - 24 65 0.1 - - 65 3
Barolong 13 9.1 - - 13 28 0.0 - - 28 2
Ngwaketse West - - - - - - - - - - -
South East - - - - - - - - - - -
Kweneng East 8 5.7 - - 8 17 0.0 - - 17 2
Kweneng West 16 10.4 6 0.1 22 20 0.0 18 0.1 38 2
Kgatleng - - - - - - - - - - -
Central Serowe/ Palapye - - - - - - - - - - -
Central Mahalapye 9 5.8 - - 9 26 0.0 - - 26 3
Central Bobonong - - 5 0.1 5 - - 15 0.0 15 3
Central Boteti - - - - - - - - - - -
Central Tutume - - - - - - - - - - -
North East - - - - - - - - - - -
Ngamiland East - - 9 0.1 9 - - 17 0.1 17 2
Ngamiland West - - - - - - - - - - -
Chobe - - - - - - - - - - -
Ghanzi 4 2.7 - - 4 44 0.0 - - 44 11
Kgalagadi South 68 45.5 23 0.3 91 119 0.1 46 0.1 165 2
Kgalagadi North 7 4.7 - - 7 12 0.0 - - 12 2
TOTAL TRADITIONAL 149 100 43 100 192 330 100 97 100 426 2
TABLE 6.2 DONKEYS: TOTAL SALES AND REVENUE RECEIVED (PULA) BY DISTRICT
District
Holdings Selling Donkeys Total Donkey Sales Total Revenue Received
(Pula)
Average Revenue Per
Holding (Pula)
Average Price Per Donkey
(Pula)Number Percentage Number Percentage
Ngwaketse 4 0.7 4 0.3 2,751 700 700
Barolong 30 5.4 48 3.8 28,323 956 586
Ngwaketse West 14 2.6 57 4.5 57,398 4,000 1,000
South East - - - - - - -
Kweneng East 13 2.4 32 2.5 20,779 1,559 647
Kweneng West 6 1.1 24 1.9 14,489 2,400 600
Kgatleng 20 3.6 40 7.2 19,863 3,616 658
Central Serowe/ Palapye 21 3.8 41 7.4 19,888 3,621 659
Central Mahalapye 158 28.7 271 21.3 258,334 1,640 952
Central Bobonong 84 15.3 175 13.8 139,898 1,664 797
Central Boteti 74 13.4 177 13.9 96,978 1,315 549
Central Tutume 23 4.2 65 5.2 47,957 2,085 732
North East 23 4.2 36 2.8 31,181 1,346 862
Ngamiland East 14 2.6 176 13.9 108,146 7,461 614
Ngamiland West 50 9.2 98 7.7 85,079 1,689 869
Chobe 1 0.2 2 0.2 2,000 2,000 1,000
Ghanzi 9 1.7 14 1.1 5,690 600 400
Kgalagadi South - - - - - - -
Kgalagadi North 5 0.9 9 0.7 3,757 800 400
TOTAL TRADITIONAL 549 100.0 1,271 100.0 942,512 1,716 742

68 Statistics Botswana ANNUAL AGRICULTURAL SURVEY REPORT 2019
TRADITIONAL SECTORANNUAL AGRICULTURAL SURVEY REPORT 2019
TRADITIONAL SECTOR
TABLE 6.3 CHICKENS: TOTAL HOLDINGS AND POPULATION BY GENDER AND DISTRICT
District
Chicken Holdings
Tota
l Ho
ldin
gs
Total Chickens
Tota
l C
hick
ens
Ave
rage
C
hick
ens
Per
hold
ings
Mal
e O
wne
d
Perc
enta
ge
Fem
ale
Ow
ned
Perc
enta
ge
Mal
e O
wne
d
Perc
enta
ge
Fem
ale
Ow
ned
Perc
enta
ge
Ngwaketse 2,335 10.2 1,195 8.7 3,530 31,814 9.0 13,592 8.2 45,406 13
Barolong 1,701 7.5 1,645 12.0 3,347 23,314 6.6 17,560 10.6 40,873 12
Ngwaketse West 181 0.8 38 0.3 219 2,530 0.7 661 0.4 3,192 15
South East 438 1.9 153 1.1 592 7,752 2.2 1,166 0.7 8,917 15
Kweneng East 3,706 16.3 1,887 13.8 5,594 55,436 15.6 25,722 15.5 81,159 15
Kweneng West 1,302 5.7 537 3.9 1,840 24,460 6.9 6,744 4.1 31,204 17
Kgatleng 1,773 7.8 346 2.5 2,119 39,406 11.1 5,554 3.3 44,960 21
Central Serowe/ Palapye 1,972 8.6 719 5.3 2,692 34,526 9.7 11,327 6.8 45,853 17
Central Mahalapye 1,546 6.8 1,184 8.7 2,730 23,093 6.5 13,117 7.9 36,210 13
Central Bobonong 1,257 5.5 732 5.4 1,989 19,371 5.5 10,940 6.6 30,311 15
Central Boteti 614 2.7 321 2.3 934 9,081 2.6 3,175 1.9 12,256 13
Central Tutume 1,590 7.0 792 5.8 2,381 30,149 8.5 8,944 5.4 39,094 16
North East 1,928 8.5 2,515 18.4 4,443 27,692 7.8 33,727 20.3 61,420 14
Ngamiland East 724 3.2 296 2.2 1,020 7,572 2.1 2,234 1.3 9,806 10
Ngamiland West 867 3.8 738 5.4 1,606 7,749 2.2 5,328 3.2 13,077 8
Chobe 162 0.7 136 1.0 298 4,155 1.2 1,802 1.1 5,958 20
Ghanzi 434 1.9 165 1.2 599 4,006 1.1 1,497 0.9 5,504 9
Kgalagadi South 266 1.2 217 1.6 483 1,870 0.5 1,796 1.1 3,666 8
Kgalagadi North 7 0.0 45 0.3 52 1,010 0.3 1,019 0.6 2,028 39
TOTAL TRADITIONAL 22,804 100.0 13,660 100.0 36,464 354,986 100.0 165,907 100.0 520,893 14
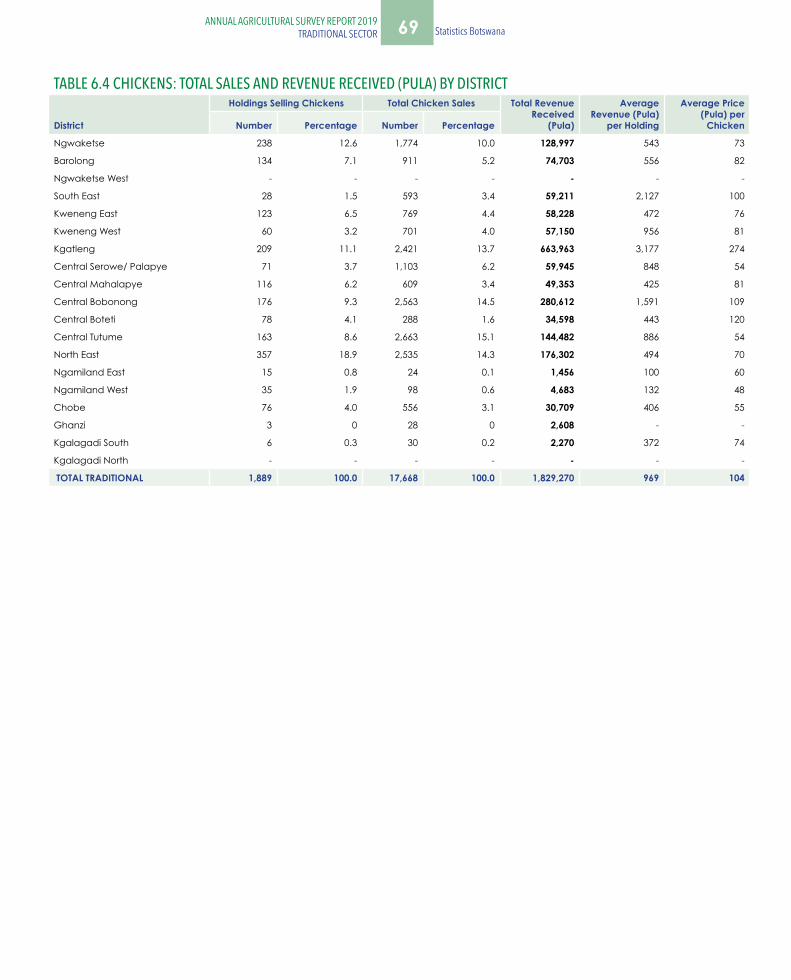
69ANNUAL AGRICULTURAL SURVEY REPORT 2019TRADITIONAL SECTOR Statistics Botswana
TABLE 6.3 CHICKENS: TOTAL HOLDINGS AND POPULATION BY GENDER AND DISTRICT
District
Chicken Holdings
Tota
l Ho
ldin
gs
Total Chickens
Tota
l C
hick
ens
Ave
rage
C
hick
ens
Per
hold
ings
Mal
e O
wne
d
Perc
enta
ge
Fem
ale
Ow
ned
Perc
enta
ge
Mal
e O
wne
d
Perc
enta
ge
Fem
ale
Ow
ned
Perc
enta
ge
Ngwaketse 2,335 10.2 1,195 8.7 3,530 31,814 9.0 13,592 8.2 45,406 13
Barolong 1,701 7.5 1,645 12.0 3,347 23,314 6.6 17,560 10.6 40,873 12
Ngwaketse West 181 0.8 38 0.3 219 2,530 0.7 661 0.4 3,192 15
South East 438 1.9 153 1.1 592 7,752 2.2 1,166 0.7 8,917 15
Kweneng East 3,706 16.3 1,887 13.8 5,594 55,436 15.6 25,722 15.5 81,159 15
Kweneng West 1,302 5.7 537 3.9 1,840 24,460 6.9 6,744 4.1 31,204 17
Kgatleng 1,773 7.8 346 2.5 2,119 39,406 11.1 5,554 3.3 44,960 21
Central Serowe/ Palapye 1,972 8.6 719 5.3 2,692 34,526 9.7 11,327 6.8 45,853 17
Central Mahalapye 1,546 6.8 1,184 8.7 2,730 23,093 6.5 13,117 7.9 36,210 13
Central Bobonong 1,257 5.5 732 5.4 1,989 19,371 5.5 10,940 6.6 30,311 15
Central Boteti 614 2.7 321 2.3 934 9,081 2.6 3,175 1.9 12,256 13
Central Tutume 1,590 7.0 792 5.8 2,381 30,149 8.5 8,944 5.4 39,094 16
North East 1,928 8.5 2,515 18.4 4,443 27,692 7.8 33,727 20.3 61,420 14
Ngamiland East 724 3.2 296 2.2 1,020 7,572 2.1 2,234 1.3 9,806 10
Ngamiland West 867 3.8 738 5.4 1,606 7,749 2.2 5,328 3.2 13,077 8
Chobe 162 0.7 136 1.0 298 4,155 1.2 1,802 1.1 5,958 20
Ghanzi 434 1.9 165 1.2 599 4,006 1.1 1,497 0.9 5,504 9
Kgalagadi South 266 1.2 217 1.6 483 1,870 0.5 1,796 1.1 3,666 8
Kgalagadi North 7 0.0 45 0.3 52 1,010 0.3 1,019 0.6 2,028 39
TOTAL TRADITIONAL 22,804 100.0 13,660 100.0 36,464 354,986 100.0 165,907 100.0 520,893 14
TABLE 6.4 CHICKENS: TOTAL SALES AND REVENUE RECEIVED (PULA) BY DISTRICT
District
Holdings Selling Chickens Total Chicken Sales Total Revenue Received
(Pula)
Average Revenue (Pula)
per Holding
Average Price (Pula) per
ChickenNumber Percentage Number Percentage
Ngwaketse 238 12.6 1,774 10.0 128,997 543 73
Barolong 134 7.1 911 5.2 74,703 556 82
Ngwaketse West - - - - - - -
South East 28 1.5 593 3.4 59,211 2,127 100
Kweneng East 123 6.5 769 4.4 58,228 472 76
Kweneng West 60 3.2 701 4.0 57,150 956 81
Kgatleng 209 11.1 2,421 13.7 663,963 3,177 274
Central Serowe/ Palapye 71 3.7 1,103 6.2 59,945 848 54
Central Mahalapye 116 6.2 609 3.4 49,353 425 81
Central Bobonong 176 9.3 2,563 14.5 280,612 1,591 109
Central Boteti 78 4.1 288 1.6 34,598 443 120
Central Tutume 163 8.6 2,663 15.1 144,482 886 54
North East 357 18.9 2,535 14.3 176,302 494 70
Ngamiland East 15 0.8 24 0.1 1,456 100 60
Ngamiland West 35 1.9 98 0.6 4,683 132 48
Chobe 76 4.0 556 3.1 30,709 406 55
Ghanzi 3 0 28 0 2,608 - -
Kgalagadi South 6 0.3 30 0.2 2,270 372 74
Kgalagadi North - - - - - - -
TOTAL TRADITIONAL 1,889 100.0 17,668 100.0 1,829,270 969 104

70 Statistics Botswana ANNUAL AGRICULTURAL SURVEY REPORT 2019
TRADITIONAL SECTORANNUAL AGRICULTURAL SURVEY REPORT 2019
TRADITIONAL SECTOR
TABLE 6.5 HORSES: TOTAL HOLDINGS AND POPULATION BY GENDER AND DISTRICT
District
Horse Holdings
Tota
l Hol
ding
s Total Horses
Tota
l Hor
ses
Ave
rage
N
umbe
r of
Hors
es p
er
Hold
ing
Mal
e O
wne
d
Perc
enta
ge
Fem
ale
Ow
ned
Perc
enta
ge
Mal
e O
wne
d
Perc
enta
ge
Fem
ale
Ow
ned
Perc
enta
ge
Ngwaketse 233 5.8 29 4.6 262 828 4.7 86 4.5 913 3
Barolong 98 2.5 18 2.9 117 285 1.6 39 2.1 324 3
Ngwaketse West 192 4.8 14 2.2 206 1,367 7.7 44 2.3 1,411 7
South East 3 0.1 - - 3 7 0.0 - - 7 2
Kweneng East 63 1.6 0 0.0 64 180 1.0 26 1.3 206 3
Kweneng West 611 15.2 9 1.4 620 2,221 12.6 326 17.0 2,547 4
Kgatleng 108 2.7 8 1.2 116 530 3.0 38 2.0 569 5
Central Serowe/ Palapye 7 0.2 17 2.6 24 225 1.3 51 2.7 277 12
Central Mahalapye 199 5.0 35 5.5 234 528 3.0 64 3.3 592 3
Central Bobonong 91 2.3 1 0.1 92 274 1.6 20 1.0 294 3
Central Boteti 526 13.1 93 14.9 619 2,318 13.1 257 13.4 2,575 4
Central Tutume 8 0.2 38 6.1 46 360 2.0 71 3.7 431 9
North East 30 1 - - 30 238 1 - - 238 -
Ngamiland East 595 14.8 108 17.2 703 2,060 11.7 318 16.6 2,378 3
Ngamiland West 484 12.1 40 6.3 524 1,463 8.3 98 5.1 1,562 3
Chobe - - - - - - - - - - -
Ghanzi 400 10.0 90 14.4 491 3,004 17.0 168 8.7 3,172 6
Kgalagadi South 240 6.0 99 15.9 340 989 5.6 238 12.4 1,227 4
Kgalagadi North 122 3.0 28 4.5 150 805 4.6 77 4.0 883 6
TOTAL TRADITIONAL 4,012 100 625 100 4,637 17,682 100 1,923 100 19,604 4
TABLE 6.6 HORSES: TOTAL SALES AND REVENUE RECEIVED (PULA) BY DISTRICT
District
Holdings Selling Horses Total Horse SalesTotal Revenue
Received (Pula)Average Revenue (Pula) per Holding
Average Price (Pula)
per HorseNumber Percentage Number Percentage
Ngwaketse 6 - 6 - 30,450 5,033 5,033
Barolong 2 1 5 1 17,325 10,500 3,500
Ngwaketse West 14 10 43 11 129,146 9,000 3,000
South East - - - - - - -
Kweneng East - - - - - - -
Kweneng West - - - - - - -
Kgatleng 8 5 23 6 114,632 15,000 5,000
Central Serowe/ Palapye - - - - - - -
Central Mahalapye 30 21 52 13 275,230 9,233 5,341
Central Bobonong - - - - - - -
Central Boteti 31 21 62 16 230,577 7,559 3,735
Central Tutume 8 6 12 3 33,833 4,145 2,820
North East - - - - - - -
Ngamiland East 5 4 27 7 26,750 5,000 1,000
Ngamiland West 3 2 6 - 23,157 6,938 3,835
Chobe - - - - - - -
Ghanzi 19 14 113 - 689,056 - -
Kgalagadi South 6 4 12 3 57,889 10,000 5,000
Kgalagadi North 12 8 22 - 87,476 - -
TOTAL TRADITIONAL 144 100 382 100 1,715,520 11,930 4,494

71ANNUAL AGRICULTURAL SURVEY REPORT 2019TRADITIONAL SECTOR Statistics Botswana
TABLE 6.7 PIGS: TOTAL HOLDINGS AND POPULATION BY GENDER AND DISTRICT
District
Pig Holdings
Tota
l Ho
ldin
gs
Pig Population
Tota
l Pi
gs
Ave
rage
N
umbe
r of P
igs
per H
oldi
ng
Mal
e O
wne
d
Perc
enta
ge
Fem
ale
Ow
ned
Perc
enta
ge
Mal
eO
wne
d
Perc
enta
ge
Fem
ale
Ow
ned
Perc
enta
ge
Ngwaketse 20 5.7 14 10.7 34 217 3.1 250 6.3 467 -
Barolong 7 1.9 3 2.2 9 29 0.4 9 0.2 38 4
Ngwaketse West - - - - - - - - - - -
South East 30 8.4 8 5.9 37 218 3.1 79 2.0 297 8
Kweneng East 154 43.5 72 55.5 226 4,535 64.9 3,179 79.6 7,715 34
Kweneng West - - - - - - - - - - -
Kgatleng 65 18.3 26 20.1 91 1,039 14.9 422 10.6 1,461 16
Central Serowe/ Palapye 12 3.5 - - 12 174 2.5 - - 174 -
Central Mahalapye 12 3.4 7 5.5 19 147 2.1 57 1.4 204 -
Central Bobonong 20 5.5 - - 20 54 0.8 - - 54 3
Central Boteti - - - - - - - - - - -
Central Tutume 8 2.2 - - 8 161 2.3 - - 161 20
North East - - - - - - - - - - -
Ngamiland East 1 0.3 - - 1 6 0.1 - - 6 -
Ngamiland West - - - - - - - - - - -
Chobe 19 5.2 - - 19 327 4.7 - - 327 -
Ghanzi 8 2.2 - - 8 85 1.2 - - 85 11
Kgalagadi South - - - - - - - - - - -
Kgalagadi North - - - - - - - - - - -
TOTAL TRADITIONAL 355 100.0 129 100.0 484 6,992 100.0 3,996 100.0 10,988 23
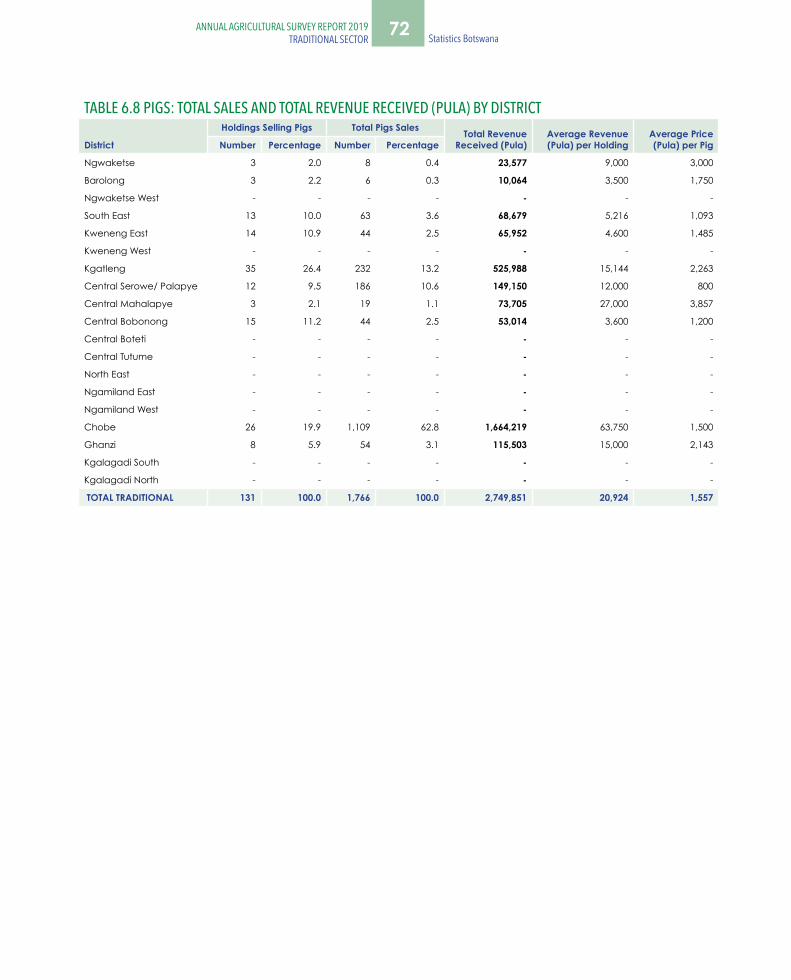
72 Statistics Botswana ANNUAL AGRICULTURAL SURVEY REPORT 2019
TRADITIONAL SECTORANNUAL AGRICULTURAL SURVEY REPORT 2019
TRADITIONAL SECTOR
TABLE 6.8 PIGS: TOTAL SALES AND TOTAL REVENUE RECEIVED (PULA) BY DISTRICT
District
Holdings Selling Pigs Total Pigs Sales Total Revenue Received (Pula)
Average Revenue (Pula) per Holding
Average Price (Pula) per PigNumber Percentage Number Percentage
Ngwaketse 3 2.0 8 0.4 23,577 9,000 3,000
Barolong 3 2.2 6 0.3 10,064 3,500 1,750
Ngwaketse West - - - - - - -
South East 13 10.0 63 3.6 68,679 5,216 1,093
Kweneng East 14 10.9 44 2.5 65,952 4,600 1,485
Kweneng West - - - - - - -
Kgatleng 35 26.4 232 13.2 525,988 15,144 2,263
Central Serowe/ Palapye 12 9.5 186 10.6 149,150 12,000 800
Central Mahalapye 3 2.1 19 1.1 73,705 27,000 3,857
Central Bobonong 15 11.2 44 2.5 53,014 3,600 1,200
Central Boteti - - - - - - -
Central Tutume - - - - - - -
North East - - - - - - -
Ngamiland East - - - - - - -
Ngamiland West - - - - - - -
Chobe 26 19.9 1,109 62.8 1,664,219 63,750 1,500
Ghanzi 8 5.9 54 3.1 115,503 15,000 2,143
Kgalagadi South - - - - - - -
Kgalagadi North - - - - - - -
TOTAL TRADITIONAL 131 100.0 1,766 100.0 2,749,851 20,924 1,557

73ANNUAL AGRICULTURAL SURVEY REPORT 2019TRADITIONAL SECTOR Statistics Botswana
TRADITIONAL SECTOR: CROP PRODUCTION
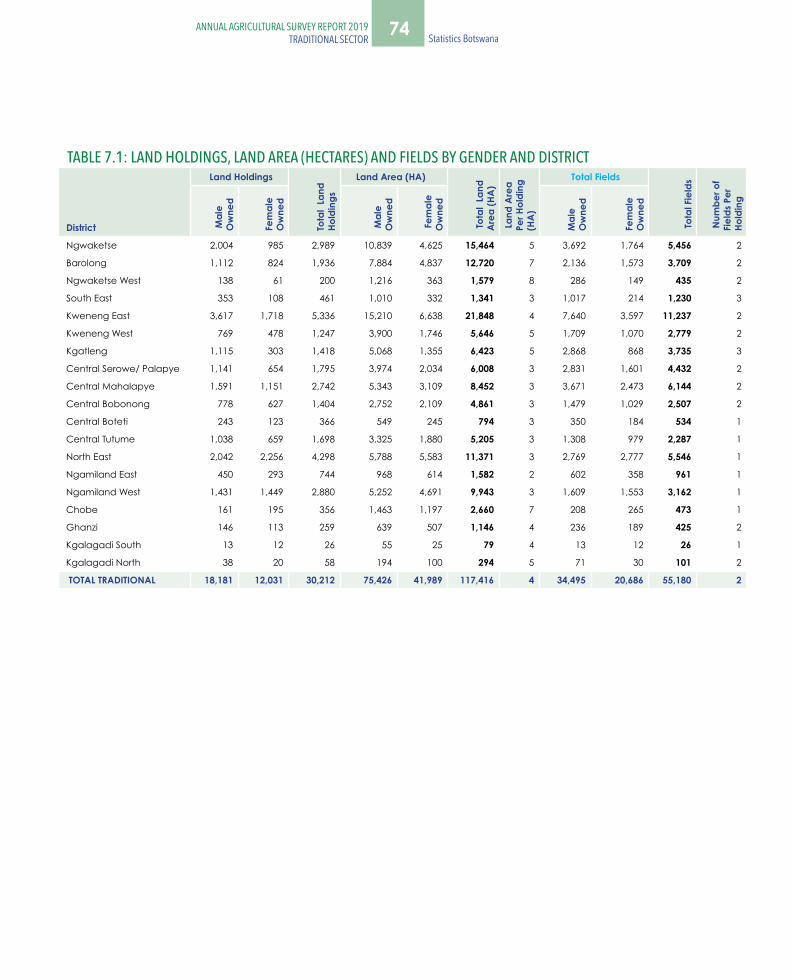
74 Statistics Botswana ANNUAL AGRICULTURAL SURVEY REPORT 2019
TRADITIONAL SECTORANNUAL AGRICULTURAL SURVEY REPORT 2019
TRADITIONAL SECTOR
TABLE 7.1: LAND HOLDINGS, LAND AREA (HECTARES) AND FIELDS BY GENDER AND DISTRICT
District
Land Holdings
Tota
l La
nd
Hold
ings
Land Area (HA)
Tota
l La
nd
Are
a (H
A)
Lan
d A
rea
Per H
oldi
ng
(HA
)
Total Fields
Tota
l Fie
lds
Num
ber o
f Fi
elds
Per
Ho
ldin
g
Mal
e O
wne
d
Fem
ale
Ow
ned
Mal
e O
wne
d
Fem
ale
Ow
ned
Mal
e O
wne
d
Fem
ale
Ow
ned
Ngwaketse 2,004 985 2,989 10,839 4,625 15,464 5 3,692 1,764 5,456 2
Barolong 1,112 824 1,936 7,884 4,837 12,720 7 2,136 1,573 3,709 2
Ngwaketse West 138 61 200 1,216 363 1,579 8 286 149 435 2
South East 353 108 461 1,010 332 1,341 3 1,017 214 1,230 3
Kweneng East 3,617 1,718 5,336 15,210 6,638 21,848 4 7,640 3,597 11,237 2
Kweneng West 769 478 1,247 3,900 1,746 5,646 5 1,709 1,070 2,779 2
Kgatleng 1,115 303 1,418 5,068 1,355 6,423 5 2,868 868 3,735 3
Central Serowe/ Palapye 1,141 654 1,795 3,974 2,034 6,008 3 2,831 1,601 4,432 2
Central Mahalapye 1,591 1,151 2,742 5,343 3,109 8,452 3 3,671 2,473 6,144 2
Central Bobonong 778 627 1,404 2,752 2,109 4,861 3 1,479 1,029 2,507 2
Central Boteti 243 123 366 549 245 794 3 350 184 534 1
Central Tutume 1,038 659 1,698 3,325 1,880 5,205 3 1,308 979 2,287 1
North East 2,042 2,256 4,298 5,788 5,583 11,371 3 2,769 2,777 5,546 1
Ngamiland East 450 293 744 968 614 1,582 2 602 358 961 1
Ngamiland West 1,431 1,449 2,880 5,252 4,691 9,943 3 1,609 1,553 3,162 1
Chobe 161 195 356 1,463 1,197 2,660 7 208 265 473 1
Ghanzi 146 113 259 639 507 1,146 4 236 189 425 2
Kgalagadi South 13 12 26 55 25 79 4 13 12 26 1
Kgalagadi North 38 20 58 194 100 294 5 71 30 101 2
TOTAL TRADITIONAL 18,181 12,031 30,212 75,426 41,989 117,416 4 34,495 20,686 55,180 2
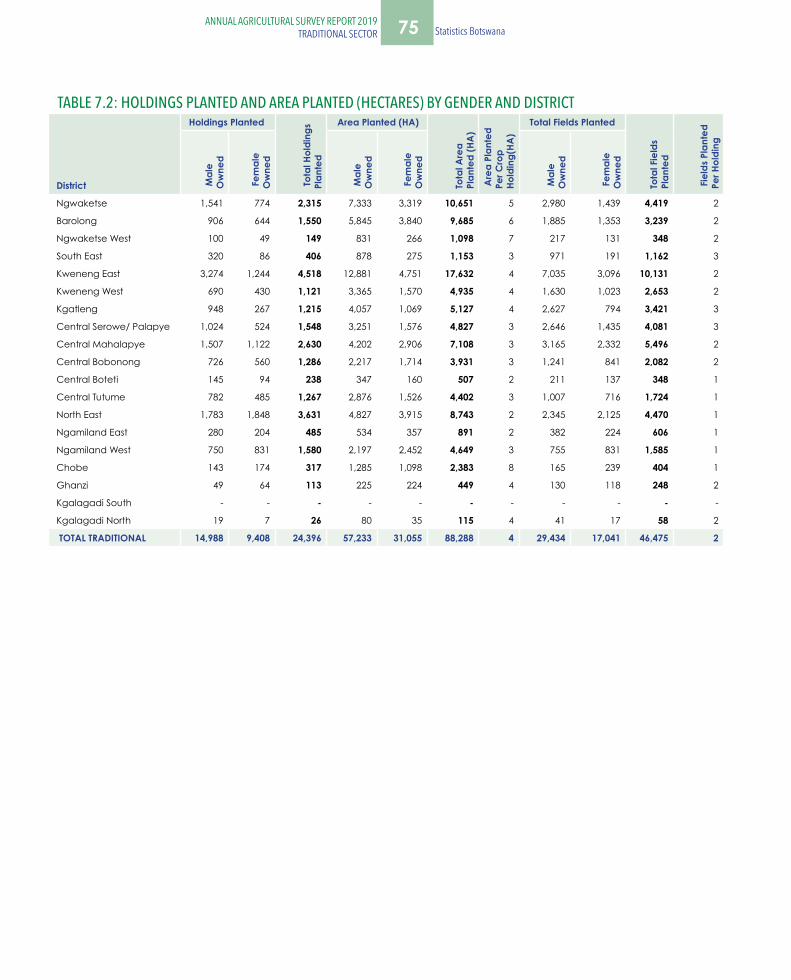
75ANNUAL AGRICULTURAL SURVEY REPORT 2019TRADITIONAL SECTOR Statistics Botswana
TABLE 7.2: HOLDINGS PLANTED AND AREA PLANTED (HECTARES) BY GENDER AND DISTRICT
District
Holdings Planted
Tota
l Hol
ding
s Pl
ante
d
Area Planted (HA)
Tota
l Are
a Pl
ante
d (H
A)
Are
a Pl
ante
d Pe
r Cro
p Ho
ldin
g(HA
)
Total Fields Planted
Tota
l Fie
lds
Plan
ted
Fie
lds
Plan
ted
Per H
oldi
ng
Mal
e O
wne
d
Fem
ale
Ow
ned
Mal
e O
wne
d
Fem
ale
Ow
ned
Mal
e O
wne
d
Fem
ale
Ow
ned
Ngwaketse 1,541 774 2,315 7,333 3,319 10,651 5 2,980 1,439 4,419 2
Barolong 906 644 1,550 5,845 3,840 9,685 6 1,885 1,353 3,239 2
Ngwaketse West 100 49 149 831 266 1,098 7 217 131 348 2
South East 320 86 406 878 275 1,153 3 971 191 1,162 3
Kweneng East 3,274 1,244 4,518 12,881 4,751 17,632 4 7,035 3,096 10,131 2
Kweneng West 690 430 1,121 3,365 1,570 4,935 4 1,630 1,023 2,653 2
Kgatleng 948 267 1,215 4,057 1,069 5,127 4 2,627 794 3,421 3
Central Serowe/ Palapye 1,024 524 1,548 3,251 1,576 4,827 3 2,646 1,435 4,081 3
Central Mahalapye 1,507 1,122 2,630 4,202 2,906 7,108 3 3,165 2,332 5,496 2
Central Bobonong 726 560 1,286 2,217 1,714 3,931 3 1,241 841 2,082 2
Central Boteti 145 94 238 347 160 507 2 211 137 348 1
Central Tutume 782 485 1,267 2,876 1,526 4,402 3 1,007 716 1,724 1
North East 1,783 1,848 3,631 4,827 3,915 8,743 2 2,345 2,125 4,470 1
Ngamiland East 280 204 485 534 357 891 2 382 224 606 1
Ngamiland West 750 831 1,580 2,197 2,452 4,649 3 755 831 1,585 1
Chobe 143 174 317 1,285 1,098 2,383 8 165 239 404 1
Ghanzi 49 64 113 225 224 449 4 130 118 248 2
Kgalagadi South - - - - - - - - - - -
Kgalagadi North 19 7 26 80 35 115 4 41 17 58 2
TOTAL TRADITIONAL 14,988 9,408 24,396 57,233 31,055 88,288 4 29,434 17,041 46,475 2
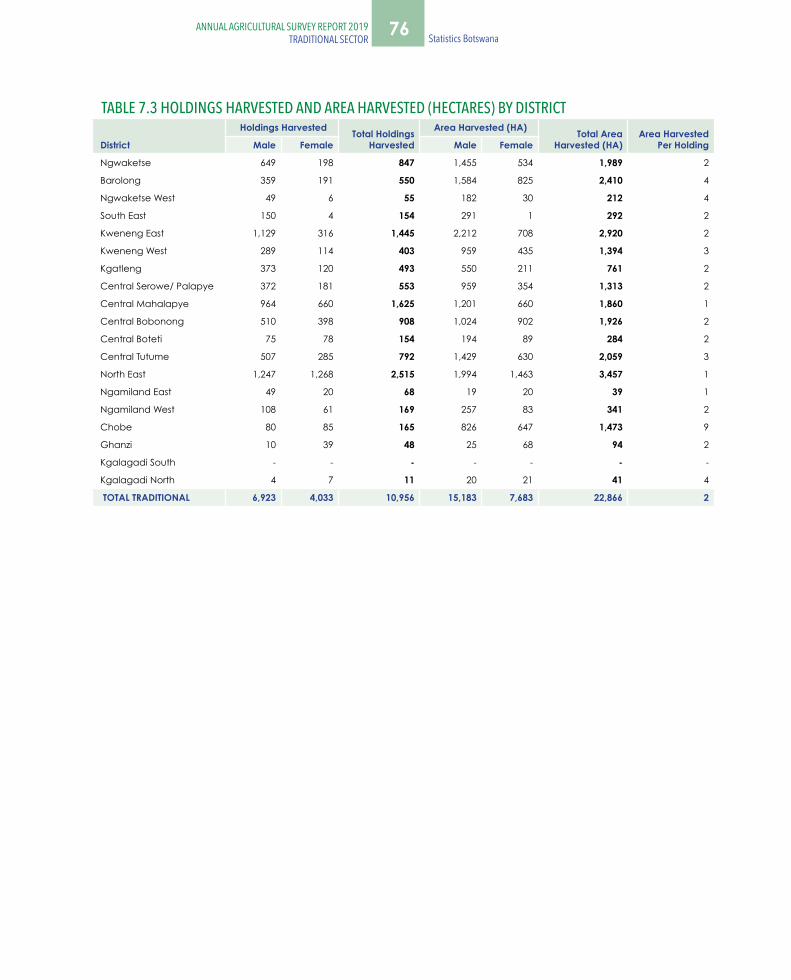
76 Statistics Botswana ANNUAL AGRICULTURAL SURVEY REPORT 2019
TRADITIONAL SECTORANNUAL AGRICULTURAL SURVEY REPORT 2019
TRADITIONAL SECTOR
TABLE 7.3 HOLDINGS HARVESTED AND AREA HARVESTED (HECTARES) BY DISTRICT
District
Holdings Harvested Total Holdings Harvested
Area Harvested (HA) Total Area Harvested (HA)
Area Harvested Per Holding Male Female Male Female
Ngwaketse 649 198 847 1,455 534 1,989 2
Barolong 359 191 550 1,584 825 2,410 4
Ngwaketse West 49 6 55 182 30 212 4
South East 150 4 154 291 1 292 2
Kweneng East 1,129 316 1,445 2,212 708 2,920 2
Kweneng West 289 114 403 959 435 1,394 3
Kgatleng 373 120 493 550 211 761 2
Central Serowe/ Palapye 372 181 553 959 354 1,313 2
Central Mahalapye 964 660 1,625 1,201 660 1,860 1
Central Bobonong 510 398 908 1,024 902 1,926 2
Central Boteti 75 78 154 194 89 284 2
Central Tutume 507 285 792 1,429 630 2,059 3
North East 1,247 1,268 2,515 1,994 1,463 3,457 1
Ngamiland East 49 20 68 19 20 39 1
Ngamiland West 108 61 169 257 83 341 2
Chobe 80 85 165 826 647 1,473 9
Ghanzi 10 39 48 25 68 94 2
Kgalagadi South - - - - - - -
Kgalagadi North 4 7 11 20 21 41 4
TOTAL TRADITIONAL 6,923 4,033 10,956 15,183 7,683 22,866 2

77ANNUAL AGRICULTURAL SURVEY REPORT 2019TRADITIONAL SECTOR Statistics Botswana
TABLE 7.3 HOLDINGS HARVESTED AND AREA HARVESTED (HECTARES) BY DISTRICT
District
Holdings Harvested Total Holdings Harvested
Area Harvested (HA) Total Area Harvested (HA)
Area Harvested Per Holding Male Female Male Female
Ngwaketse 649 198 847 1,455 534 1,989 2
Barolong 359 191 550 1,584 825 2,410 4
Ngwaketse West 49 6 55 182 30 212 4
South East 150 4 154 291 1 292 2
Kweneng East 1,129 316 1,445 2,212 708 2,920 2
Kweneng West 289 114 403 959 435 1,394 3
Kgatleng 373 120 493 550 211 761 2
Central Serowe/ Palapye 372 181 553 959 354 1,313 2
Central Mahalapye 964 660 1,625 1,201 660 1,860 1
Central Bobonong 510 398 908 1,024 902 1,926 2
Central Boteti 75 78 154 194 89 284 2
Central Tutume 507 285 792 1,429 630 2,059 3
North East 1,247 1,268 2,515 1,994 1,463 3,457 1
Ngamiland East 49 20 68 19 20 39 1
Ngamiland West 108 61 169 257 83 341 2
Chobe 80 85 165 826 647 1,473 9
Ghanzi 10 39 48 25 68 94 2
Kgalagadi South - - - - - - -
Kgalagadi North 4 7 11 20 21 41 4
TOTAL TRADITIONAL 6,923 4,033 10,956 15,183 7,683 22,866 2
TABLE 7.4: HOLDINGS PLANTED BY TYPE OF CROP AND DISTRICT
District Sorghum Maize Beans/
Pulses Millet Sunflower Groundnuts Water
Melons Melons Sweet Reeds
Other Crops
Ngwaketse 380 2,400 2,297 11 46 3 860 395 928 196
Barolong 471 1,608 1,359 - 69 15 119 36 208 87
Ngwaketse West 35 149 145 - 6 - 6 11 2 -
South East 114 461 438 - 3 - 363 220 173 128
Kweneng East 1,500 4,519 4,608 60 77 72 2,262 817 1,697 895
Kweneng West 400 1,286 1,123 17 24 50 362 301 316 174
Kgatleng 572 1,147 1,195 29 31 2 892 445 303 529
Central Serowe 1,024 1,328 1,700 109 45 81 981 126 413 245
Central Mahalapye 3,138 2,617 4,812 120 66 273 2,717 390 690 561
Central Bobonong 1,088 1,126 1,517 385 199 219 1,275 332 448 557
Central Boteti 63 288 278 37 15 74 231 79 100 68
Central Tutume 1,226 1,138 1,471 708 86 234 831 465 572 341
North East 3,799 3,300 4,551 2,285 180 1,202 2,468 1,832 1,851 1,173
Ngamiland East 102 466 451 85 - 69 405 105 353 361
Ngamiland West 884 1,390 1,658 1,301 - 248 1,241 228 935 444
Chobe 247 78 143 1 - - 31 20 32 15
Ghanzi 8 105 106 - - - 8 29 5 1
Kgalagadi South - - - - - - - - - -
Kgalagadi North 8 18 17 - - - - - 3 4
TOTAL TRADITIONAL 15,058 23,424 27,869 5,149 848 2,541 15,052 5,831 9,030 5,778
TABLE 7.5: HOLDINGS HARVESTED BY TYPE OF CROP AND DISTRICT
District Sorghum Maize Beans/
Pulses Millet Sunflower Groundnuts Water
Melons Melons Sweet Reeds
Other Crops
Ngwaketse 108 879 844 11 - 3 348 238 415 106
Barolong 134 576 457 - 56 15 49 29 84 38
Ngwaketse West 14 55 55 - - - - - 2 -
South East 91 158 184 - 3 - 150 76 59 78
Kweneng East 430 1,472 1,478 43 13 23 843 407 613 460
Kweneng West 99 497 414 17 24 31 151 135 145 100
Kgatleng 231 460 523 11 10 2 366 217 211 249
Central Serowe 423 435 644 80 24 61 428 80 128 170
Central Mahalapye 2,345 1,685 3,237 40 61 175 1,726 332 461 282
Central Bobonong 815 811 1,130 305 175 173 929 251 353 383
Central Boteti 36 192 211 21 15 54 165 49 60 48
Central Tutume 797 713 921 511 48 183 539 323 337 254
North East 2,674 2,178 3,227 1,697 127 836 1,808 1,350 1,248 1,006
Ngamiland East 18 68 65 18 - 11 59 6 49 22
Ngamiland West 114 154 175 153 - 24 109 18 56 23
Chobe 131 32 80 - - - 15 16 10 15
Ghanzi - 47 48 - - - 8 12 - 1
Kgalagadi South - - - - - - - - - -
Kgalagadi North 4 7 7 - - - 8 - 3 -
TOTAL TRADITIONAL 8,462 10,418 13,702 2,905 556 1,589 7,701 3,539 4,234 3,235
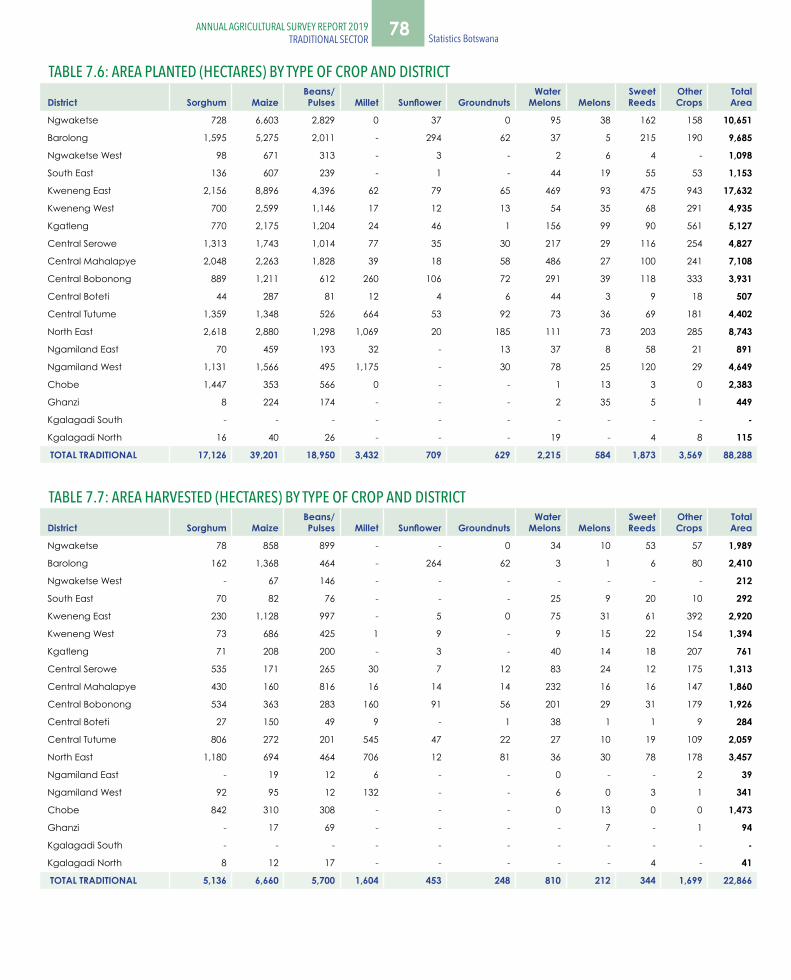
78 Statistics Botswana ANNUAL AGRICULTURAL SURVEY REPORT 2019
TRADITIONAL SECTORANNUAL AGRICULTURAL SURVEY REPORT 2019
TRADITIONAL SECTOR
TABLE 7.6: AREA PLANTED (HECTARES) BY TYPE OF CROP AND DISTRICT
District Sorghum Maize Beans/
Pulses Millet Sunflower Groundnuts Water
Melons Melons Sweet Reeds
Other Crops
Total Area
Ngwaketse 728 6,603 2,829 0 37 0 95 38 162 158 10,651
Barolong 1,595 5,275 2,011 - 294 62 37 5 215 190 9,685
Ngwaketse West 98 671 313 - 3 - 2 6 4 - 1,098
South East 136 607 239 - 1 - 44 19 55 53 1,153
Kweneng East 2,156 8,896 4,396 62 79 65 469 93 475 943 17,632
Kweneng West 700 2,599 1,146 17 12 13 54 35 68 291 4,935
Kgatleng 770 2,175 1,204 24 46 1 156 99 90 561 5,127
Central Serowe 1,313 1,743 1,014 77 35 30 217 29 116 254 4,827
Central Mahalapye 2,048 2,263 1,828 39 18 58 486 27 100 241 7,108
Central Bobonong 889 1,211 612 260 106 72 291 39 118 333 3,931
Central Boteti 44 287 81 12 4 6 44 3 9 18 507
Central Tutume 1,359 1,348 526 664 53 92 73 36 69 181 4,402
North East 2,618 2,880 1,298 1,069 20 185 111 73 203 285 8,743
Ngamiland East 70 459 193 32 - 13 37 8 58 21 891
Ngamiland West 1,131 1,566 495 1,175 - 30 78 25 120 29 4,649
Chobe 1,447 353 566 0 - - 1 13 3 0 2,383
Ghanzi 8 224 174 - - - 2 35 5 1 449
Kgalagadi South - - - - - - - - - - -
Kgalagadi North 16 40 26 - - - 19 - 4 8 115
TOTAL TRADITIONAL 17,126 39,201 18,950 3,432 709 629 2,215 584 1,873 3,569 88,288
TABLE 7.7: AREA HARVESTED (HECTARES) BY TYPE OF CROP AND DISTRICT
District Sorghum Maize Beans/
Pulses Millet Sunflower Groundnuts Water
Melons Melons Sweet Reeds
Other Crops
Total Area
Ngwaketse 78 858 899 - - 0 34 10 53 57 1,989
Barolong 162 1,368 464 - 264 62 3 1 6 80 2,410
Ngwaketse West - 67 146 - - - - - - - 212
South East 70 82 76 - - - 25 9 20 10 292
Kweneng East 230 1,128 997 - 5 0 75 31 61 392 2,920
Kweneng West 73 686 425 1 9 - 9 15 22 154 1,394
Kgatleng 71 208 200 - 3 - 40 14 18 207 761
Central Serowe 535 171 265 30 7 12 83 24 12 175 1,313
Central Mahalapye 430 160 816 16 14 14 232 16 16 147 1,860
Central Bobonong 534 363 283 160 91 56 201 29 31 179 1,926
Central Boteti 27 150 49 9 - 1 38 1 1 9 284
Central Tutume 806 272 201 545 47 22 27 10 19 109 2,059
North East 1,180 694 464 706 12 81 36 30 78 178 3,457
Ngamiland East - 19 12 6 - - 0 - - 2 39
Ngamiland West 92 95 12 132 - - 6 0 3 1 341
Chobe 842 310 308 - - - 0 13 0 0 1,473
Ghanzi - 17 69 - - - - 7 - 1 94
Kgalagadi South - - - - - - - - - - -
Kgalagadi North 8 12 17 - - - - - 4 - 41
TOTAL TRADITIONAL 5,136 6,660 5,700 1,604 453 248 810 212 344 1,699 22,866
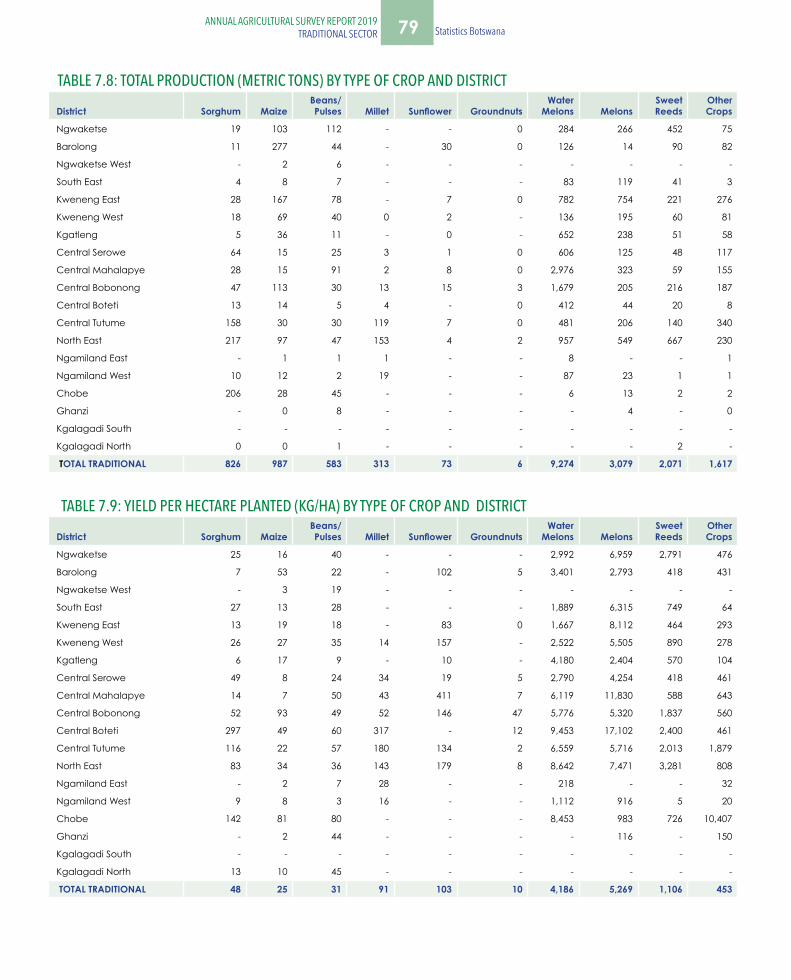
79ANNUAL AGRICULTURAL SURVEY REPORT 2019TRADITIONAL SECTOR Statistics Botswana
TABLE 7.8: TOTAL PRODUCTION (METRIC TONS) BY TYPE OF CROP AND DISTRICT
District Sorghum Maize Beans/
Pulses Millet Sunflower Groundnuts Water
Melons Melons Sweet Reeds
Other Crops
Ngwaketse 19 103 112 - - 0 284 266 452 75
Barolong 11 277 44 - 30 0 126 14 90 82
Ngwaketse West - 2 6 - - - - - - -
South East 4 8 7 - - - 83 119 41 3
Kweneng East 28 167 78 - 7 0 782 754 221 276
Kweneng West 18 69 40 0 2 - 136 195 60 81
Kgatleng 5 36 11 - 0 - 652 238 51 58
Central Serowe 64 15 25 3 1 0 606 125 48 117
Central Mahalapye 28 15 91 2 8 0 2,976 323 59 155
Central Bobonong 47 113 30 13 15 3 1,679 205 216 187
Central Boteti 13 14 5 4 - 0 412 44 20 8
Central Tutume 158 30 30 119 7 0 481 206 140 340
North East 217 97 47 153 4 2 957 549 667 230
Ngamiland East - 1 1 1 - - 8 - - 1
Ngamiland West 10 12 2 19 - - 87 23 1 1
Chobe 206 28 45 - - - 6 13 2 2
Ghanzi - 0 8 - - - - 4 - 0
Kgalagadi South - - - - - - - - - -
Kgalagadi North 0 0 1 - - - - - 2 -
TOTAL TRADITIONAL 826 987 583 313 73 6 9,274 3,079 2,071 1,617
TABLE 7.9: YIELD PER HECTARE PLANTED (KG/HA) BY TYPE OF CROP AND DISTRICT
District Sorghum Maize Beans/
Pulses Millet Sunflower Groundnuts Water
Melons Melons Sweet Reeds
Other Crops
Ngwaketse 25 16 40 - - - 2,992 6,959 2,791 476
Barolong 7 53 22 - 102 5 3,401 2,793 418 431
Ngwaketse West - 3 19 - - - - - - -
South East 27 13 28 - - - 1,889 6,315 749 64
Kweneng East 13 19 18 - 83 0 1,667 8,112 464 293
Kweneng West 26 27 35 14 157 - 2,522 5,505 890 278
Kgatleng 6 17 9 - 10 - 4,180 2,404 570 104
Central Serowe 49 8 24 34 19 5 2,790 4,254 418 461
Central Mahalapye 14 7 50 43 411 7 6,119 11,830 588 643
Central Bobonong 52 93 49 52 146 47 5,776 5,320 1,837 560
Central Boteti 297 49 60 317 - 12 9,453 17,102 2,400 461
Central Tutume 116 22 57 180 134 2 6,559 5,716 2,013 1,879
North East 83 34 36 143 179 8 8,642 7,471 3,281 808
Ngamiland East - 2 7 28 - - 218 - - 32
Ngamiland West 9 8 3 16 - - 1,112 916 5 20
Chobe 142 81 80 - - - 8,453 983 726 10,407
Ghanzi - 2 44 - - - - 116 - 150
Kgalagadi South - - - - - - - - - -
Kgalagadi North 13 10 45 - - - - - - -
TOTAL TRADITIONAL 48 25 31 91 103 10 4,186 5,269 1,106 453
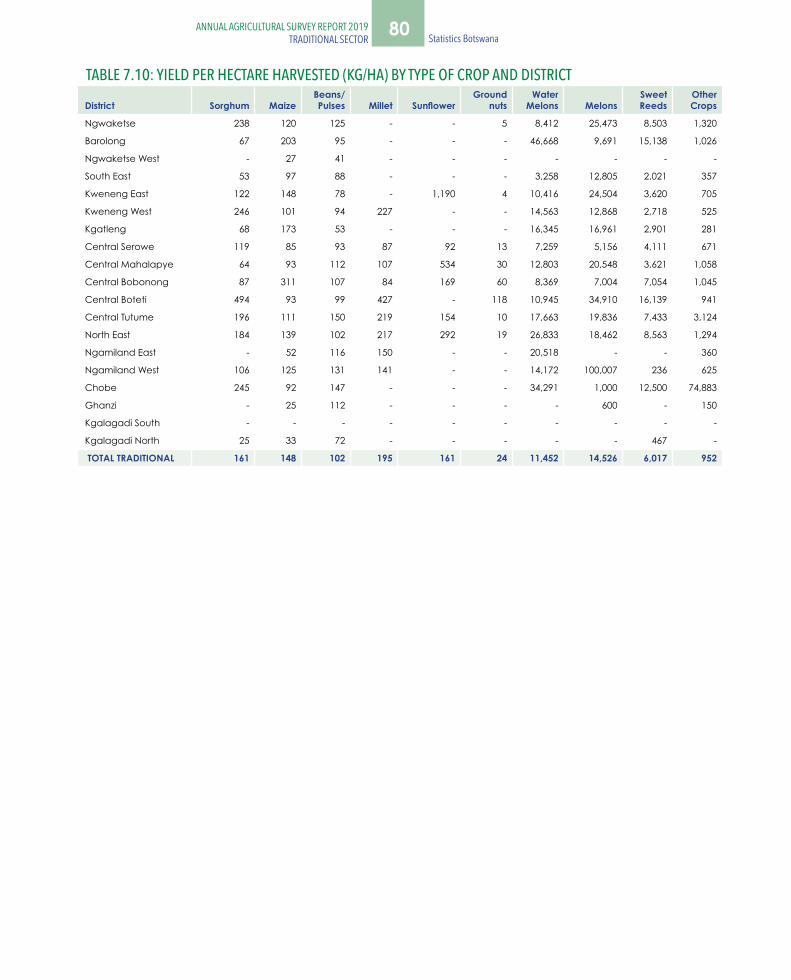
80 Statistics Botswana ANNUAL AGRICULTURAL SURVEY REPORT 2019
TRADITIONAL SECTORANNUAL AGRICULTURAL SURVEY REPORT 2019
TRADITIONAL SECTOR
TABLE 7.10: YIELD PER HECTARE HARVESTED (KG/HA) BY TYPE OF CROP AND DISTRICT
District Sorghum Maize Beans/
Pulses Millet Sunflower Ground
nuts Water
Melons Melons Sweet Reeds
Other Crops
Ngwaketse 238 120 125 - - 5 8,412 25,473 8,503 1,320
Barolong 67 203 95 - - - 46,668 9,691 15,138 1,026
Ngwaketse West - 27 41 - - - - - - -
South East 53 97 88 - - - 3,258 12,805 2,021 357
Kweneng East 122 148 78 - 1,190 4 10,416 24,504 3,620 705
Kweneng West 246 101 94 227 - - 14,563 12,868 2,718 525
Kgatleng 68 173 53 - - - 16,345 16,961 2,901 281
Central Serowe 119 85 93 87 92 13 7,259 5,156 4,111 671
Central Mahalapye 64 93 112 107 534 30 12,803 20,548 3,621 1,058
Central Bobonong 87 311 107 84 169 60 8,369 7,004 7,054 1,045
Central Boteti 494 93 99 427 - 118 10,945 34,910 16,139 941
Central Tutume 196 111 150 219 154 10 17,663 19,836 7,433 3,124
North East 184 139 102 217 292 19 26,833 18,462 8,563 1,294
Ngamiland East - 52 116 150 - - 20,518 - - 360
Ngamiland West 106 125 131 141 - - 14,172 100,007 236 625
Chobe 245 92 147 - - - 34,291 1,000 12,500 74,883
Ghanzi - 25 112 - - - - 600 - 150
Kgalagadi South - - - - - - - - - -
Kgalagadi North 25 33 72 - - - - - 467 -
TOTAL TRADITIONAL 161 148 102 195 161 24 11,452 14,526 6,017 952
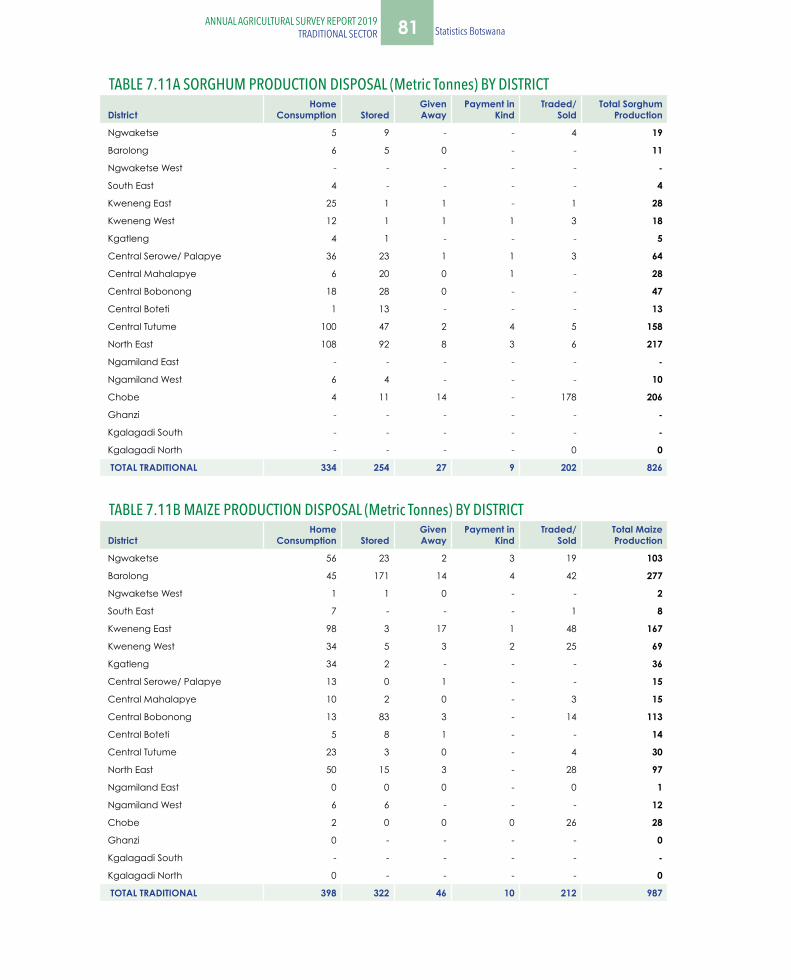
81ANNUAL AGRICULTURAL SURVEY REPORT 2019TRADITIONAL SECTOR Statistics Botswana
TABLE 7.11A SORGHUM PRODUCTION DISPOSAL (Metric Tonnes) BY DISTRICT
District Home
Consumption Stored Given Away
Payment in Kind
Traded/Sold
Total Sorghum Production
Ngwaketse 5 9 - - 4 19
Barolong 6 5 0 - - 11
Ngwaketse West - - - - - -
South East 4 - - - - 4
Kweneng East 25 1 1 - 1 28
Kweneng West 12 1 1 1 3 18
Kgatleng 4 1 - - - 5
Central Serowe/ Palapye 36 23 1 1 3 64
Central Mahalapye 6 20 0 1 - 28
Central Bobonong 18 28 0 - - 47
Central Boteti 1 13 - - - 13
Central Tutume 100 47 2 4 5 158
North East 108 92 8 3 6 217
Ngamiland East - - - - - -
Ngamiland West 6 4 - - - 10
Chobe 4 11 14 - 178 206
Ghanzi - - - - - -
Kgalagadi South - - - - - -
Kgalagadi North - - - - 0 0
TOTAL TRADITIONAL 334 254 27 9 202 826
TABLE 7.11B MAIZE PRODUCTION DISPOSAL (Metric Tonnes) BY DISTRICT
District Home
Consumption Stored Given Away
Payment in Kind
Traded/Sold
Total Maize Production
Ngwaketse 56 23 2 3 19 103
Barolong 45 171 14 4 42 277
Ngwaketse West 1 1 0 - - 2
South East 7 - - - 1 8
Kweneng East 98 3 17 1 48 167
Kweneng West 34 5 3 2 25 69
Kgatleng 34 2 - - - 36
Central Serowe/ Palapye 13 0 1 - - 15
Central Mahalapye 10 2 0 - 3 15
Central Bobonong 13 83 3 - 14 113
Central Boteti 5 8 1 - - 14
Central Tutume 23 3 0 - 4 30
North East 50 15 3 - 28 97
Ngamiland East 0 0 0 - 0 1
Ngamiland West 6 6 - - - 12
Chobe 2 0 0 0 26 28
Ghanzi 0 - - - - 0
Kgalagadi South - - - - - -
Kgalagadi North 0 - - - - 0
TOTAL TRADITIONAL 398 322 46 10 212 987
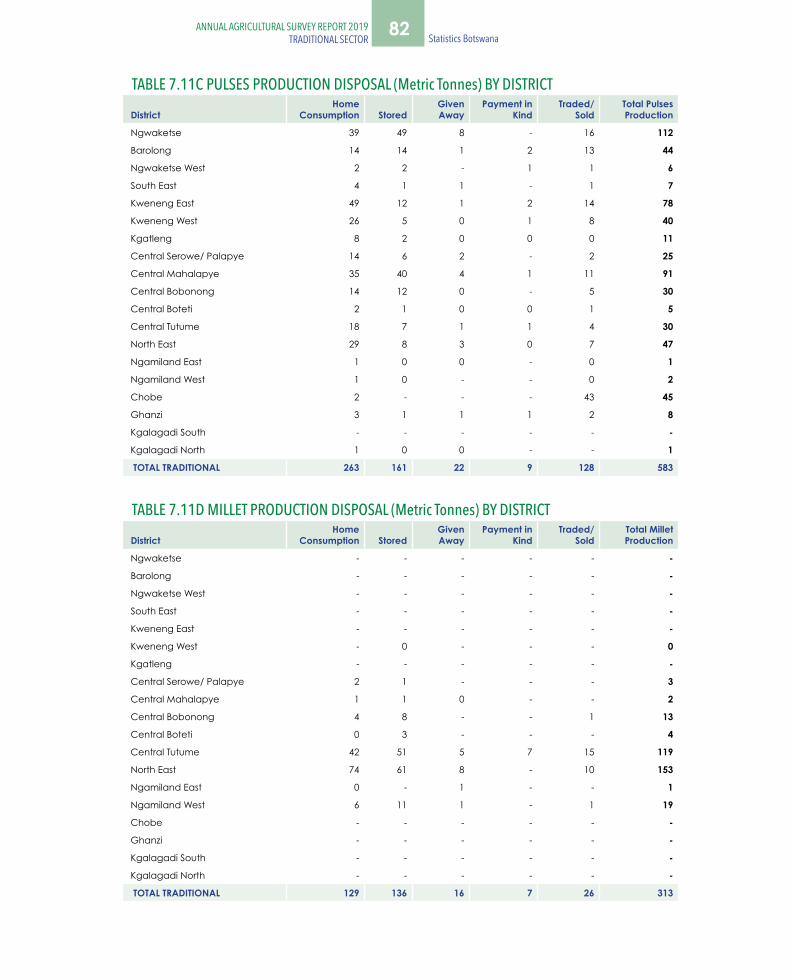
82 Statistics Botswana ANNUAL AGRICULTURAL SURVEY REPORT 2019
TRADITIONAL SECTORANNUAL AGRICULTURAL SURVEY REPORT 2019
TRADITIONAL SECTOR
TABLE 7.11C PULSES PRODUCTION DISPOSAL (Metric Tonnes) BY DISTRICT
District Home
Consumption Stored Given Away
Payment in Kind
Traded/Sold
Total Pulses Production
Ngwaketse 39 49 8 - 16 112
Barolong 14 14 1 2 13 44
Ngwaketse West 2 2 - 1 1 6
South East 4 1 1 - 1 7
Kweneng East 49 12 1 2 14 78
Kweneng West 26 5 0 1 8 40
Kgatleng 8 2 0 0 0 11
Central Serowe/ Palapye 14 6 2 - 2 25
Central Mahalapye 35 40 4 1 11 91
Central Bobonong 14 12 0 - 5 30
Central Boteti 2 1 0 0 1 5
Central Tutume 18 7 1 1 4 30
North East 29 8 3 0 7 47
Ngamiland East 1 0 0 - 0 1
Ngamiland West 1 0 - - 0 2
Chobe 2 - - - 43 45
Ghanzi 3 1 1 1 2 8
Kgalagadi South - - - - - -
Kgalagadi North 1 0 0 - - 1
TOTAL TRADITIONAL 263 161 22 9 128 583
TABLE 7.11D MILLET PRODUCTION DISPOSAL (Metric Tonnes) BY DISTRICT
District Home
Consumption Stored Given Away
Payment in Kind
Traded/Sold
Total Millet Production
Ngwaketse - - - - - -
Barolong - - - - - -
Ngwaketse West - - - - - -
South East - - - - - -
Kweneng East - - - - - -
Kweneng West - 0 - - - 0
Kgatleng - - - - - -
Central Serowe/ Palapye 2 1 - - - 3
Central Mahalapye 1 1 0 - - 2
Central Bobonong 4 8 - - 1 13
Central Boteti 0 3 - - - 4
Central Tutume 42 51 5 7 15 119
North East 74 61 8 - 10 153
Ngamiland East 0 - 1 - - 1
Ngamiland West 6 11 1 - 1 19
Chobe - - - - - -
Ghanzi - - - - - -
Kgalagadi South - - - - - -
Kgalagadi North - - - - - -
TOTAL TRADITIONAL 129 136 16 7 26 313
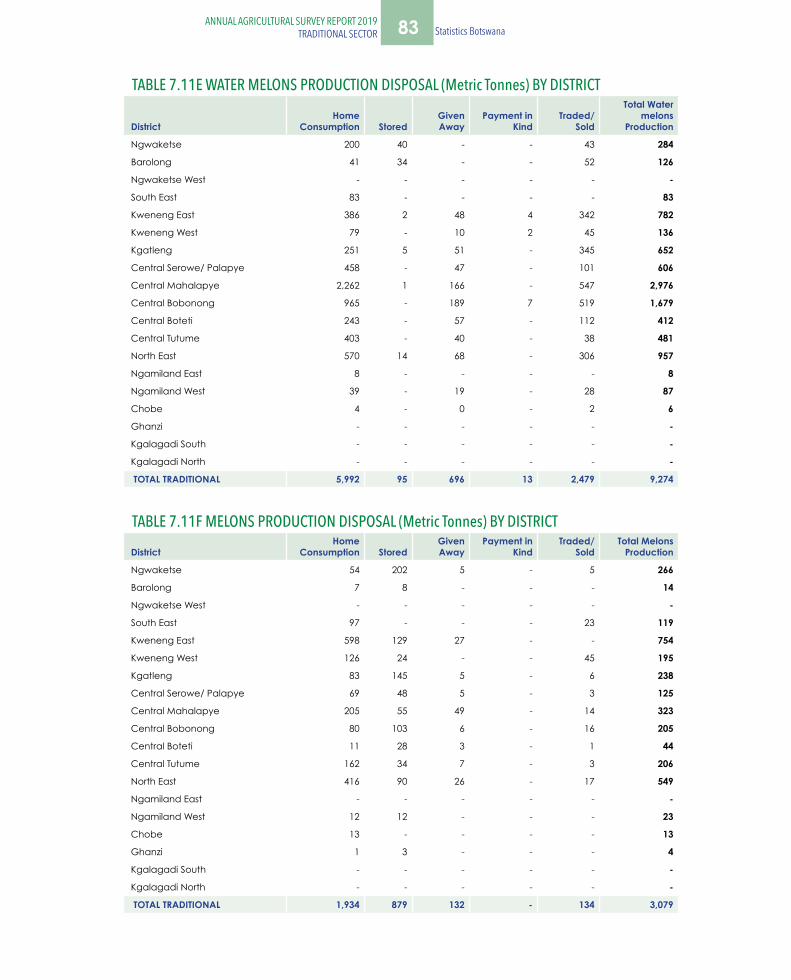
83ANNUAL AGRICULTURAL SURVEY REPORT 2019TRADITIONAL SECTOR Statistics Botswana
TABLE 7.11E WATER MELONS PRODUCTION DISPOSAL (Metric Tonnes) BY DISTRICT
District Home
Consumption Stored Given Away
Payment in Kind
Traded/Sold
Total Water melons
Production
Ngwaketse 200 40 - - 43 284
Barolong 41 34 - - 52 126
Ngwaketse West - - - - - -
South East 83 - - - - 83
Kweneng East 386 2 48 4 342 782
Kweneng West 79 - 10 2 45 136
Kgatleng 251 5 51 - 345 652
Central Serowe/ Palapye 458 - 47 - 101 606
Central Mahalapye 2,262 1 166 - 547 2,976
Central Bobonong 965 - 189 7 519 1,679
Central Boteti 243 - 57 - 112 412
Central Tutume 403 - 40 - 38 481
North East 570 14 68 - 306 957
Ngamiland East 8 - - - - 8
Ngamiland West 39 - 19 - 28 87
Chobe 4 - 0 - 2 6
Ghanzi - - - - - -
Kgalagadi South - - - - - -
Kgalagadi North - - - - - -
TOTAL TRADITIONAL 5,992 95 696 13 2,479 9,274
TABLE 7.11F MELONS PRODUCTION DISPOSAL (Metric Tonnes) BY DISTRICT
District Home
Consumption Stored Given Away
Payment in Kind
Traded/Sold
Total Melons Production
Ngwaketse 54 202 5 - 5 266
Barolong 7 8 - - - 14
Ngwaketse West - - - - - -
South East 97 - - - 23 119
Kweneng East 598 129 27 - - 754
Kweneng West 126 24 - - 45 195
Kgatleng 83 145 5 - 6 238
Central Serowe/ Palapye 69 48 5 - 3 125
Central Mahalapye 205 55 49 - 14 323
Central Bobonong 80 103 6 - 16 205
Central Boteti 11 28 3 - 1 44
Central Tutume 162 34 7 - 3 206
North East 416 90 26 - 17 549
Ngamiland East - - - - - -
Ngamiland West 12 12 - - - 23
Chobe 13 - - - - 13
Ghanzi 1 3 - - - 4
Kgalagadi South - - - - - -
Kgalagadi North - - - - - -
TOTAL TRADITIONAL 1,934 879 132 - 134 3,079

84 Statistics Botswana ANNUAL AGRICULTURAL SURVEY REPORT 2019
TRADITIONAL SECTORANNUAL AGRICULTURAL SURVEY REPORT 2019
TRADITIONAL SECTOR
TABLE 7.11G SWEET REED PRODUCTION DISPOSAL (Metric Tonnes) BY DISTRICT
District Home
Consumption Stored Given Away
Payment in Kind
Traded/Sold
Total Sweetreed Production
Ngwaketse 241 - - - 211 452
Barolong 72 - 18 - - 90
Ngwaketse West - - - - - -
South East 20 - 11 - 10 41
Kweneng East 195 - 10 - 16 221
Kweneng West 24 1 9 - 26 60
Kgatleng 51 - - - - 51
Central Serowe/ Palapye 48 - - - - 48
Central Mahalapye 36 0 5 - 17 59
Central Bobonong 101 - 18 - 98 216
Central Boteti 15 - 6 - - 20
Central Tutume 133 - 7 - - 140
North East 503 0 47 - 116 667
Ngamiland East - - - - - -
Ngamiland West 1 - - - - 1
Chobe 1 - - - 1 2
Ghanzi - - - - - -
Kgalagadi South - - - - - -
Kgalagadi North 2 - - - - 2
TOTAL TRADITIONAL 1,443 2 130 - 496 2,071
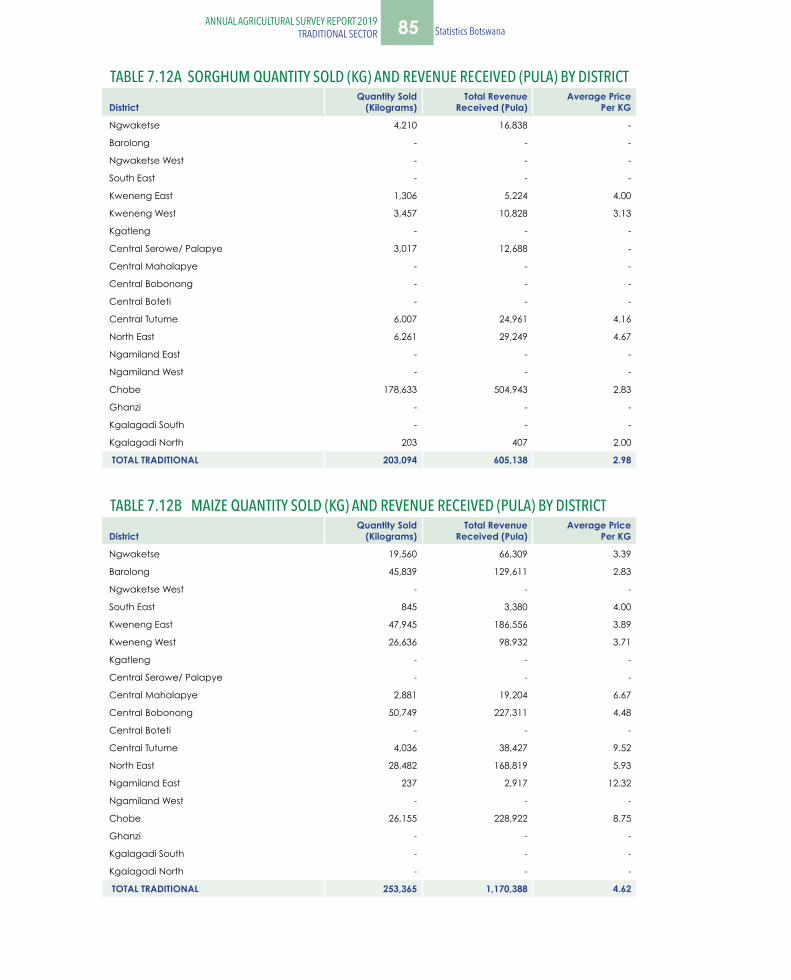
85ANNUAL AGRICULTURAL SURVEY REPORT 2019TRADITIONAL SECTOR Statistics Botswana
TABLE 7.12A SORGHUM QUANTITY SOLD (KG) AND REVENUE RECEIVED (PULA) BY DISTRICT
District Quantity Sold
(Kilograms) Total Revenue
Received (Pula) Average Price
Per KG
Ngwaketse 4,210 16,838 -
Barolong - - -
Ngwaketse West - - -
South East - - -
Kweneng East 1,306 5,224 4.00
Kweneng West 3,457 10,828 3.13
Kgatleng - - -
Central Serowe/ Palapye 3,017 12,688 -
Central Mahalapye - - -
Central Bobonong - - -
Central Boteti - - -
Central Tutume 6,007 24,961 4.16
North East 6,261 29,249 4.67
Ngamiland East - - -
Ngamiland West - - -
Chobe 178,633 504,943 2.83
Ghanzi - - -
Kgalagadi South - - -
Kgalagadi North 203 407 2.00
TOTAL TRADITIONAL 203,094 605,138 2.98
TABLE 7.12B MAIZE QUANTITY SOLD (KG) AND REVENUE RECEIVED (PULA) BY DISTRICT
District Quantity Sold
(Kilograms) Total Revenue
Received (Pula) Average Price
Per KG
Ngwaketse 19,560 66,309 3.39
Barolong 45,839 129,611 2.83
Ngwaketse West - - -
South East 845 3,380 4.00
Kweneng East 47,945 186,556 3.89
Kweneng West 26,636 98,932 3.71
Kgatleng - - -
Central Serowe/ Palapye - - -
Central Mahalapye 2,881 19,204 6.67
Central Bobonong 50,749 227,311 4.48
Central Boteti - - -
Central Tutume 4,036 38,427 9.52
North East 28,482 168,819 5.93
Ngamiland East 237 2,917 12.32
Ngamiland West - - -
Chobe 26,155 228,922 8.75
Ghanzi - - -
Kgalagadi South - - -
Kgalagadi North - - -
TOTAL TRADITIONAL 253,365 1,170,388 4.62
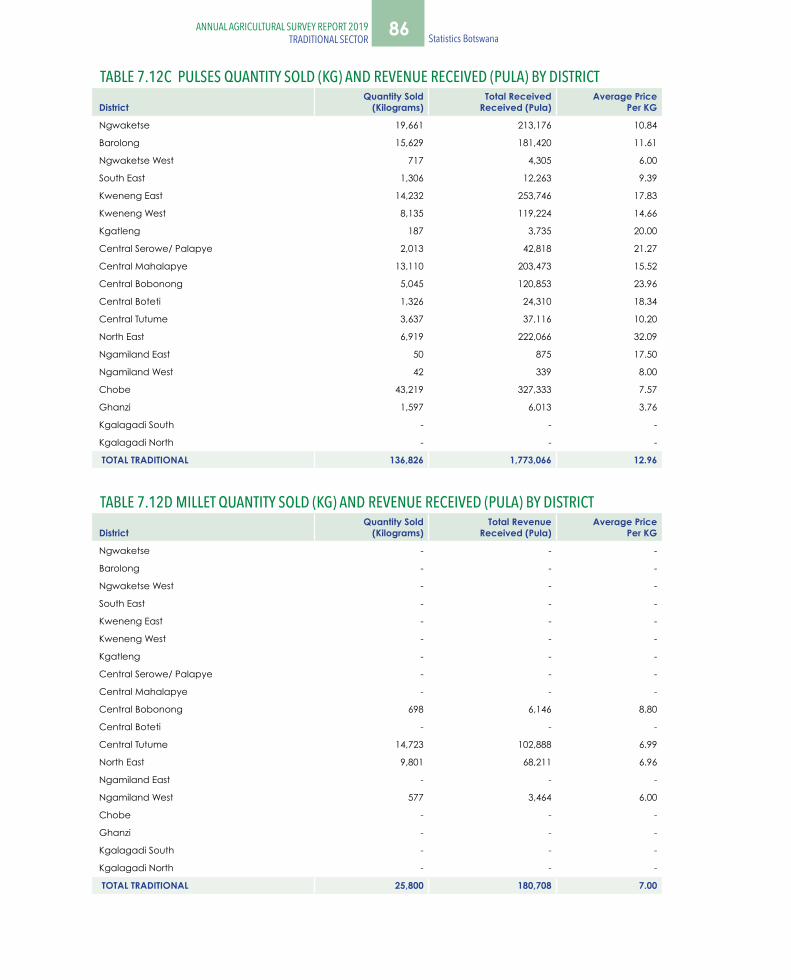
86 Statistics Botswana ANNUAL AGRICULTURAL SURVEY REPORT 2019
TRADITIONAL SECTORANNUAL AGRICULTURAL SURVEY REPORT 2019
TRADITIONAL SECTOR
TABLE 7.12C PULSES QUANTITY SOLD (KG) AND REVENUE RECEIVED (PULA) BY DISTRICT
District Quantity Sold
(Kilograms) Total Received
Received (Pula) Average Price
Per KG
Ngwaketse 19,661 213,176 10.84
Barolong 15,629 181,420 11.61
Ngwaketse West 717 4,305 6.00
South East 1,306 12,263 9.39
Kweneng East 14,232 253,746 17.83
Kweneng West 8,135 119,224 14.66
Kgatleng 187 3,735 20.00
Central Serowe/ Palapye 2,013 42,818 21.27
Central Mahalapye 13,110 203,473 15.52
Central Bobonong 5,045 120,853 23.96
Central Boteti 1,326 24,310 18.34
Central Tutume 3,637 37,116 10.20
North East 6,919 222,066 32.09
Ngamiland East 50 875 17.50
Ngamiland West 42 339 8.00
Chobe 43,219 327,333 7.57
Ghanzi 1,597 6,013 3.76
Kgalagadi South - - -
Kgalagadi North - - -
TOTAL TRADITIONAL 136,826 1,773,066 12.96
TABLE 7.12D MILLET QUANTITY SOLD (KG) AND REVENUE RECEIVED (PULA) BY DISTRICT
District Quantity Sold
(Kilograms) Total Revenue
Received (Pula) Average Price
Per KG
Ngwaketse - - -
Barolong - - -
Ngwaketse West - - -
South East - - -
Kweneng East - - -
Kweneng West - - -
Kgatleng - - -
Central Serowe/ Palapye - - -
Central Mahalapye - - -
Central Bobonong 698 6,146 8.80
Central Boteti - - -
Central Tutume 14,723 102,888 6.99
North East 9,801 68,211 6.96
Ngamiland East - - -
Ngamiland West 577 3,464 6.00
Chobe - - -
Ghanzi - - -
Kgalagadi South - - -
Kgalagadi North - - -
TOTAL TRADITIONAL 25,800 180,708 7.00
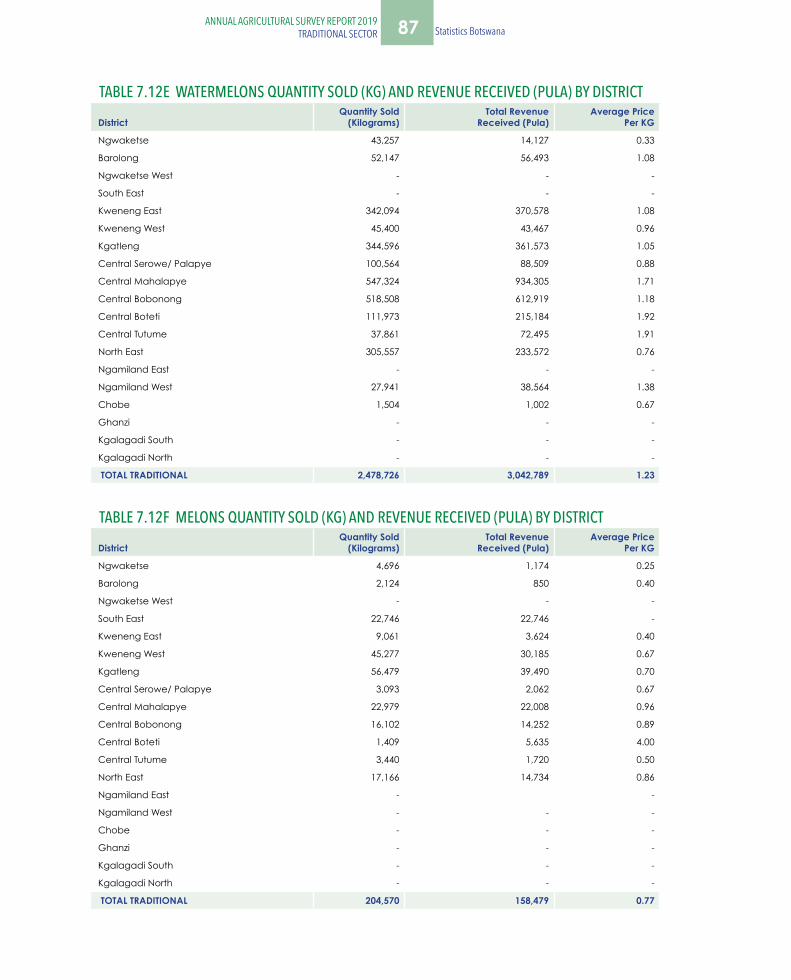
87ANNUAL AGRICULTURAL SURVEY REPORT 2019TRADITIONAL SECTOR Statistics Botswana
TABLE 7.12E WATERMELONS QUANTITY SOLD (KG) AND REVENUE RECEIVED (PULA) BY DISTRICT
District Quantity Sold
(Kilograms) Total Revenue
Received (Pula) Average Price
Per KG
Ngwaketse 43,257 14,127 0.33
Barolong 52,147 56,493 1.08
Ngwaketse West - - -
South East - - -
Kweneng East 342,094 370,578 1.08
Kweneng West 45,400 43,467 0.96
Kgatleng 344,596 361,573 1.05
Central Serowe/ Palapye 100,564 88,509 0.88
Central Mahalapye 547,324 934,305 1.71
Central Bobonong 518,508 612,919 1.18
Central Boteti 111,973 215,184 1.92
Central Tutume 37,861 72,495 1.91
North East 305,557 233,572 0.76
Ngamiland East - - -
Ngamiland West 27,941 38,564 1.38
Chobe 1,504 1,002 0.67
Ghanzi - - -
Kgalagadi South - - -
Kgalagadi North - - -
TOTAL TRADITIONAL 2,478,726 3,042,789 1.23
TABLE 7.12F MELONS QUANTITY SOLD (KG) AND REVENUE RECEIVED (PULA) BY DISTRICT
District Quantity Sold
(Kilograms) Total Revenue
Received (Pula) Average Price
Per KG
Ngwaketse 4,696 1,174 0.25
Barolong 2,124 850 0.40
Ngwaketse West - - -
South East 22,746 22,746 -
Kweneng East 9,061 3,624 0.40
Kweneng West 45,277 30,185 0.67
Kgatleng 56,479 39,490 0.70
Central Serowe/ Palapye 3,093 2,062 0.67
Central Mahalapye 22,979 22,008 0.96
Central Bobonong 16,102 14,252 0.89
Central Boteti 1,409 5,635 4.00
Central Tutume 3,440 1,720 0.50
North East 17,166 14,734 0.86
Ngamiland East - -
Ngamiland West - - -
Chobe - - -
Ghanzi - - -
Kgalagadi South - - -
Kgalagadi North - - -
TOTAL TRADITIONAL 204,570 158,479 0.77
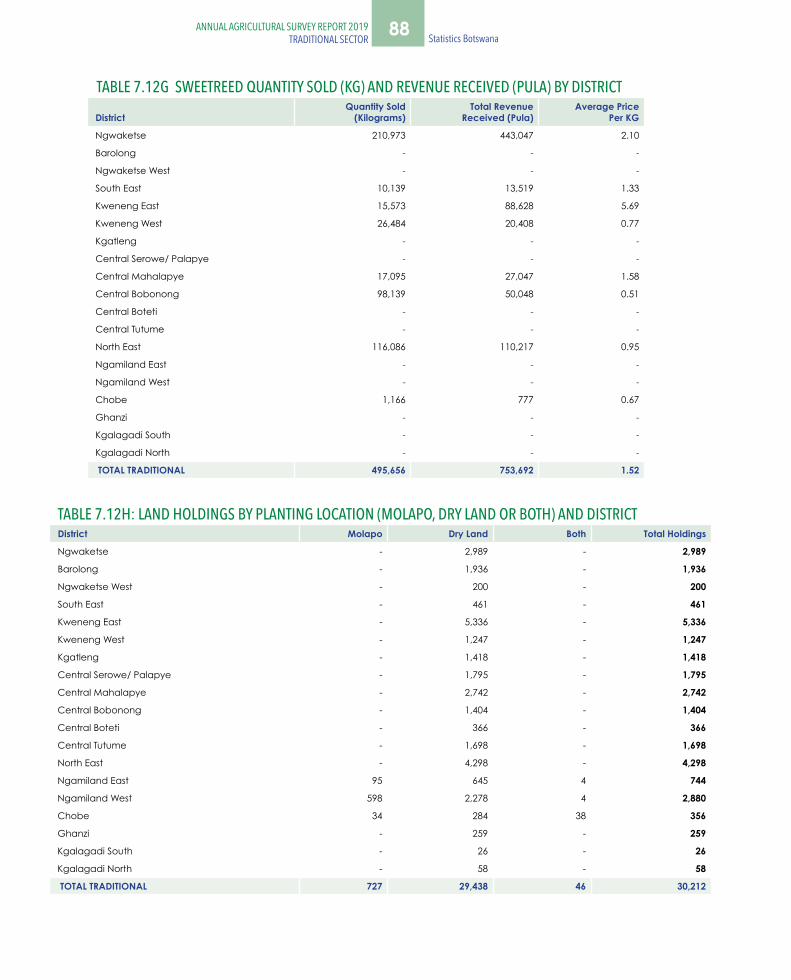
88 Statistics Botswana ANNUAL AGRICULTURAL SURVEY REPORT 2019
TRADITIONAL SECTORANNUAL AGRICULTURAL SURVEY REPORT 2019
TRADITIONAL SECTOR
TABLE 7.12G SWEETREED QUANTITY SOLD (KG) AND REVENUE RECEIVED (PULA) BY DISTRICT
District Quantity Sold
(Kilograms) Total Revenue
Received (Pula) Average Price
Per KG
Ngwaketse 210,973 443,047 2.10
Barolong - - -
Ngwaketse West - - -
South East 10,139 13,519 1.33
Kweneng East 15,573 88,628 5.69
Kweneng West 26,484 20,408 0.77
Kgatleng - - -
Central Serowe/ Palapye - - -
Central Mahalapye 17,095 27,047 1.58
Central Bobonong 98,139 50,048 0.51
Central Boteti - - -
Central Tutume - - -
North East 116,086 110,217 0.95
Ngamiland East - - -
Ngamiland West - - -
Chobe 1,166 777 0.67
Ghanzi - - -
Kgalagadi South - - -
Kgalagadi North - - -
TOTAL TRADITIONAL 495,656 753,692 1.52
TABLE 7.12H: LAND HOLDINGS BY PLANTING LOCATION (MOLAPO, DRY LAND OR BOTH) AND DISTRICT District Molapo Dry Land Both Total Holdings
Ngwaketse - 2,989 - 2,989
Barolong - 1,936 - 1,936
Ngwaketse West - 200 - 200
South East - 461 - 461
Kweneng East - 5,336 - 5,336
Kweneng West - 1,247 - 1,247
Kgatleng - 1,418 - 1,418
Central Serowe/ Palapye - 1,795 - 1,795
Central Mahalapye - 2,742 - 2,742
Central Bobonong - 1,404 - 1,404
Central Boteti - 366 - 366
Central Tutume - 1,698 - 1,698
North East - 4,298 - 4,298
Ngamiland East 95 645 4 744
Ngamiland West 598 2,278 4 2,880
Chobe 34 284 38 356
Ghanzi - 259 - 259
Kgalagadi South - 26 - 26
Kgalagadi North - 58 - 58
TOTAL TRADITIONAL 727 29,438 46 30,212

89ANNUAL AGRICULTURAL SURVEY REPORT 2019TRADITIONAL SECTOR Statistics Botswana
TABLE 7.13: LAND HOLDINGS BY REASONS FOR NOT PLOUGHING OR PLANTING AND DISTRICT
District Lack of
Rain Lack of Money
Lack of Seeds
Lack of Labour
Lack of Draught Power Floods
Lack of Equipment
Poor Soil
Other Resons
Ngwaketse 870 11 63 36 47 - 46 9 84
Barolong 346 - 6 10 37 - 55 - 40
Ngwaketse West 81 - - - 6 - - - -
South East 65 - - - 3 - - - -
Kweneng East 950 - 5 47 - - 9 16 -
Kweneng West 103 - - 16 - - - - 8
Kgatleng 247 5 - 16 - - 5 - 22
Central Serowe/ Palapye 294 - 14 4 12 - 9 - 18
Central Mahalapye 594 15 8 6 3 - 13 - 16
Central Bobonong 315 7 - 56 - - - - 29
Central Boteti 115 4 17 5 7 - 13 - 36
Central Tutume 382 70 - 31 19 - 70 - 12
North East 557 44 - 183 97 - 16 - 109
Ngamiland East 251 18 3 9 20 - 3 - 53
Ngamiland West 1,346 14 - 157 201 - 12 - 51
Chobe 19 21 - 24 24 - 8 - -
Ghanzi 106 - - 8 16 - - - -
Kgalagadi South 26 - - - 4 - - - -
Kgalagadi North 26 4 - 10 - - 6 - -
TOTAL TRADITIONAL 6,693 213 117 617 496 - 265 25 479
TABLE 7.14: HOLDINGS PLANTED BY SOURCES OF SEEDS AND DISTRICT
District BAM
B
Drou
ght R
elie
f
Coo
pera
tives
Trad
er
Ano
ther
Fa
rmer
Prev
ious
Yea
r Ha
rves
t
Seed
M
ultip
licat
ion
ISPA
AD
Oth
er
Sour
ces
Ngwaketse 133 - 216 13 501 1,085 25 2,140 11
Barolong 38 - 124 91 74 255 23 1,468 -
Ngwaketse West - - - - 6 11 - 149 -
South East - - - 120 49 279 - 396 -
Kweneng East 61 - 1,052 747 590 1,573 6 3,292 36
Kweneng West 36 - 5 148 168 353 8 960 4
Kgatleng 79 - - 492 155 701 5 806 40
Central Serowe/ Palapye 74 - 31 419 463 746 8 987 -
Central Mahalapye 236 - 10 419 1,027 2,347 - 2,057 161
Central Bobonong 144 - 22 166 466 986 13 670 7
Central Boteti - - - 104 82 169 - 152 -
Central Tutume 146 - - 294 277 899 19 766 6
North East 180 - 11 935 807 2,494 15 3,152 51
Ngamiland East 44 - 4 152 162 392 - 267 -
Ngamiland West 37 - 7 65 508 1,098 2 1,348 6
Chobe 20 - - 57 51 55 - 289 -
Ghanzi - - - 6 18 29 - 104 -
Kgalagadi South - - - - - - - - -
Kgalagadi North - - 7 - 4 3 - 22 -
TOTAL TRADITIONAL 1,228 - 1,487 4,229 5,408 13,474 124 19,027 322
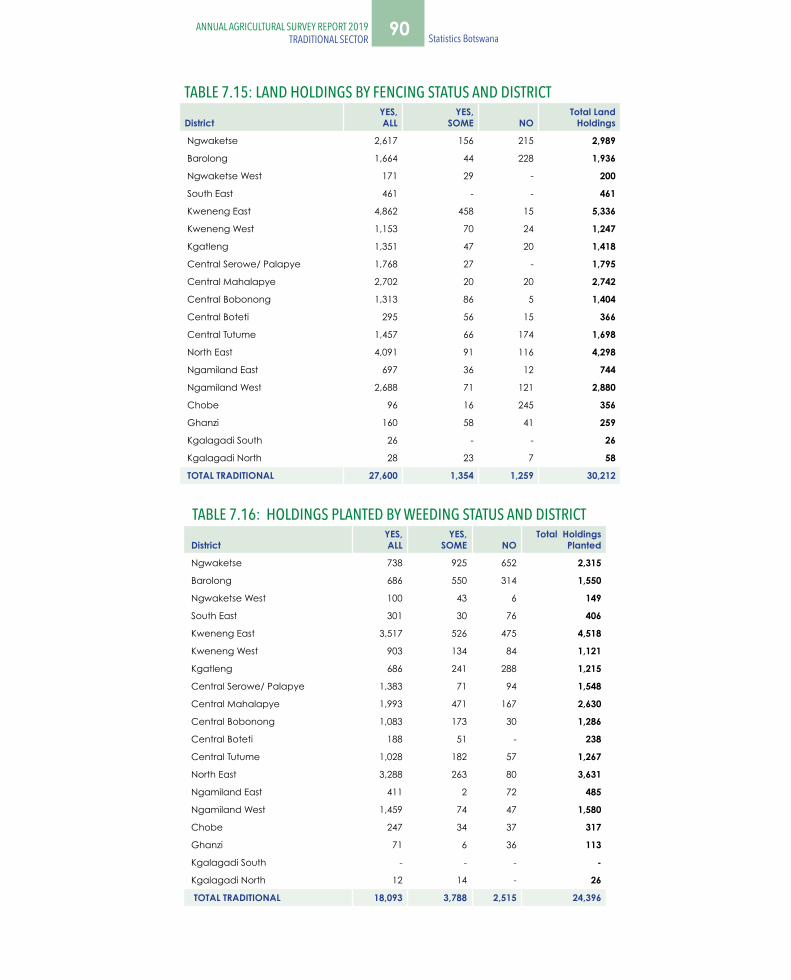
90 Statistics Botswana ANNUAL AGRICULTURAL SURVEY REPORT 2019
TRADITIONAL SECTORANNUAL AGRICULTURAL SURVEY REPORT 2019
TRADITIONAL SECTOR
TABLE 7.15: LAND HOLDINGS BY FENCING STATUS AND DISTRICT
District YES,
ALL YES,
SOME NOTotal Land
Holdings
Ngwaketse 2,617 156 215 2,989
Barolong 1,664 44 228 1,936
Ngwaketse West 171 29 - 200
South East 461 - - 461
Kweneng East 4,862 458 15 5,336
Kweneng West 1,153 70 24 1,247
Kgatleng 1,351 47 20 1,418
Central Serowe/ Palapye 1,768 27 - 1,795
Central Mahalapye 2,702 20 20 2,742
Central Bobonong 1,313 86 5 1,404
Central Boteti 295 56 15 366
Central Tutume 1,457 66 174 1,698
North East 4,091 91 116 4,298
Ngamiland East 697 36 12 744
Ngamiland West 2,688 71 121 2,880
Chobe 96 16 245 356
Ghanzi 160 58 41 259
Kgalagadi South 26 - - 26
Kgalagadi North 28 23 7 58
TOTAL TRADITIONAL 27,600 1,354 1,259 30,212
TABLE 7.16: HOLDINGS PLANTED BY WEEDING STATUS AND DISTRICT
District YES,
ALL YES,
SOME
NO Total Holdings
Planted
Ngwaketse 738 925 652 2,315
Barolong 686 550 314 1,550
Ngwaketse West 100 43 6 149
South East 301 30 76 406
Kweneng East 3,517 526 475 4,518
Kweneng West 903 134 84 1,121
Kgatleng 686 241 288 1,215
Central Serowe/ Palapye 1,383 71 94 1,548
Central Mahalapye 1,993 471 167 2,630
Central Bobonong 1,083 173 30 1,286
Central Boteti 188 51 - 238
Central Tutume 1,028 182 57 1,267
North East 3,288 263 80 3,631
Ngamiland East 411 2 72 485
Ngamiland West 1,459 74 47 1,580
Chobe 247 34 37 317
Ghanzi 71 6 36 113
Kgalagadi South - - - -
Kgalagadi North 12 14 - 26
TOTAL TRADITIONAL 18,093 3,788 2,515 24,396
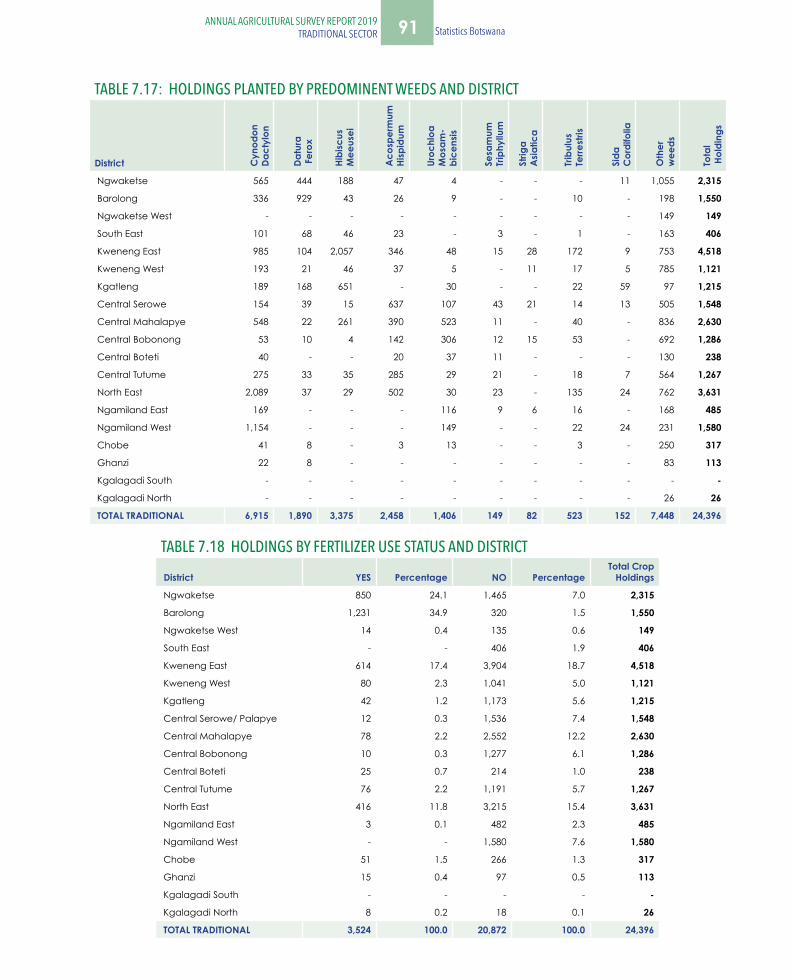
91ANNUAL AGRICULTURAL SURVEY REPORT 2019TRADITIONAL SECTOR Statistics Botswana
TABLE 7.18 HOLDINGS BY FERTILIZER USE STATUS AND DISTRICT
District YES Percentage NO PercentageTotal Crop
Holdings
Ngwaketse 850 24.1 1,465 7.0 2,315
Barolong 1,231 34.9 320 1.5 1,550
Ngwaketse West 14 0.4 135 0.6 149
South East - - 406 1.9 406
Kweneng East 614 17.4 3,904 18.7 4,518
Kweneng West 80 2.3 1,041 5.0 1,121
Kgatleng 42 1.2 1,173 5.6 1,215
Central Serowe/ Palapye 12 0.3 1,536 7.4 1,548
Central Mahalapye 78 2.2 2,552 12.2 2,630
Central Bobonong 10 0.3 1,277 6.1 1,286
Central Boteti 25 0.7 214 1.0 238
Central Tutume 76 2.2 1,191 5.7 1,267
North East 416 11.8 3,215 15.4 3,631
Ngamiland East 3 0.1 482 2.3 485
Ngamiland West - - 1,580 7.6 1,580
Chobe 51 1.5 266 1.3 317
Ghanzi 15 0.4 97 0.5 113
Kgalagadi South - - - - -
Kgalagadi North 8 0.2 18 0.1 26
TOTAL TRADITIONAL 3,524 100.0 20,872 100.0 24,396
TABLE 7.17: HOLDINGS PLANTED BY PREDOMINENT WEEDS AND DISTRICT
District Cyn
odon
Da
ctyl
on
Datu
ra F
erox
Hibi
scus
M
eeus
ei
Aco
sper
mum
Hi
spid
um
Uroc
hloa
M
osam
-bi
cens
is
Sesa
mum
Tr
iphy
llum
Strig
a A
siatic
a
Trib
ulus
Te
rrest
ris
Sida
C
ordi
folia
Oth
er
wee
ds
Tota
l H
oldi
ngs
Ngwaketse 565 444 188 47 4 - - - 11 1,055 2,315
Barolong 336 929 43 26 9 - - 10 - 198 1,550
Ngwaketse West - - - - - - - - - 149 149
South East 101 68 46 23 - 3 - 1 - 163 406
Kweneng East 985 104 2,057 346 48 15 28 172 9 753 4,518
Kweneng West 193 21 46 37 5 - 11 17 5 785 1,121
Kgatleng 189 168 651 - 30 - - 22 59 97 1,215
Central Serowe 154 39 15 637 107 43 21 14 13 505 1,548
Central Mahalapye 548 22 261 390 523 11 - 40 - 836 2,630
Central Bobonong 53 10 4 142 306 12 15 53 - 692 1,286
Central Boteti 40 - - 20 37 11 - - - 130 238
Central Tutume 275 33 35 285 29 21 - 18 7 564 1,267
North East 2,089 37 29 502 30 23 - 135 24 762 3,631
Ngamiland East 169 - - - 116 9 6 16 - 168 485
Ngamiland West 1,154 - - - 149 - - 22 24 231 1,580
Chobe 41 8 - 3 13 - - 3 - 250 317
Ghanzi 22 8 - - - - - - - 83 113
Kgalagadi South - - - - - - - - - - -
Kgalagadi North - - - - - - - - - 26 26
TOTAL TRADITIONAL 6,915 1,890 3,375 2,458 1,406 149 82 523 152 7,448 24,396

92 Statistics Botswana ANNUAL AGRICULTURAL SURVEY REPORT 2019
TRADITIONAL SECTORANNUAL AGRICULTURAL SURVEY REPORT 2019
TRADITIONAL SECTOR
TABLE 7.20: HOLDINGS PLANTED BY DRAUGHT POWER USED AND DISTRICT
District Oxen
Only Cows
Only Both Oxen and Cows Donkeys
Tractor Farmer
Other Sources
Ngwaketse - - - 533 1,740 43
Barolong - - - 114 1,450 -
Ngwaketse West - - - 74 75 -
South East - - - 30 376 -
Kweneng East 10 - - 834 3,726 -
Kweneng West - - - 90 1,044 -
Kgatleng - - - 67 1,160 5
Central Serowe/ Palapye 11 - 9 277 1,263 -
Central Mahalapye - - - 1,648 1,245 -
Central Bobonong - - - 855 524 4
Central Boteti - - - 138 97 7
Central Tutume 14 20 25 436 853 7
North East 23 21 17 1,379 2,304 11
Ngamiland East 33 - - 270 173 8
Ngamiland West 792 69 18 647 16 70
Chobe 1 - - 6 311 -
Ghanzi - - - 45 68 -
Kgalagadi South - - - - - -
kgalagadi North - - - 15 14 -
TOTAL TRADITIONAL 884 110 69 7,458 16,439 155
TABLE 7.19: LAND HOLDINGS TYPE OF SOIL OF ARABLE LAND BY DISTRICT
DistrictLoamy
Soil Clay
Soil Sandy Soil Total
Holdings
Ngwaketse 1,277 703 1,009 2,989
Barolong 859 418 659 1,936
Ngwaketse West 102 - 98 200
South East 448 13 - 461
Kweneng East 3,566 575 1,195 5,336
Kweneng West 734 123 391 1,247
Kgatleng 1,225 42 151 1,418
Central Serowe/ Palapye 1,306 162 326 1,795
Central Mahalapye 2,042 172 528 2,742
Central Bobonong 942 111 352 1,404
Central Boteti 255 60 50 366
Central Tutume 1,111 311 275 1,698
North East 2,786 648 864 4,298
Ngamiland East 48 139 557 744
Ngamiland West 1,360 600 920 2,880
Chobe 67 279 10 356
Ghanzi 22 20 217 259
Kgalagadi South - - 26 26
Kgalagadi North - 3 55 58
TOTAL TRADITIONAL 18,150 4,380 7,683 30,212
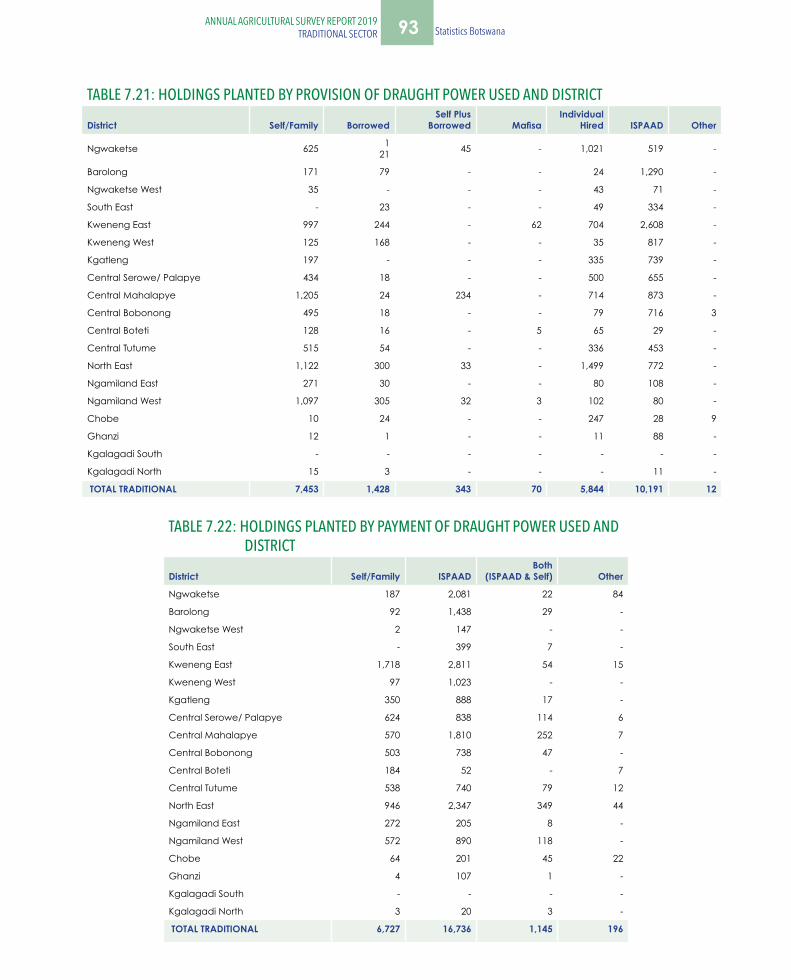
93ANNUAL AGRICULTURAL SURVEY REPORT 2019TRADITIONAL SECTOR Statistics Botswana
TABLE 7.21: HOLDINGS PLANTED BY PROVISION OF DRAUGHT POWER USED AND DISTRICT
District Self/Family Borrowed Self Plus
Borrowed Mafisa Individual
Hired ISPAAD Other
Ngwaketse 625 121
45 - 1,021 519 -
Barolong 171 79 - - 24 1,290 -
Ngwaketse West 35 - - - 43 71 -
South East - 23 - - 49 334 -
Kweneng East 997 244 - 62 704 2,608 -
Kweneng West 125 168 - - 35 817 -
Kgatleng 197 - - - 335 739 -
Central Serowe/ Palapye 434 18 - - 500 655 -
Central Mahalapye 1,205 24 234 - 714 873 -
Central Bobonong 495 18 - - 79 716 3
Central Boteti 128 16 - 5 65 29 -
Central Tutume 515 54 - - 336 453 -
North East 1,122 300 33 - 1,499 772 -
Ngamiland East 271 30 - - 80 108 -
Ngamiland West 1,097 305 32 3 102 80 -
Chobe 10 24 - - 247 28 9
Ghanzi 12 1 - - 11 88 -
Kgalagadi South - - - - - - -
Kgalagadi North 15 3 - - - 11 -
TOTAL TRADITIONAL 7,453 1,428 343 70 5,844 10,191 12
TABLE 7.22: HOLDINGS PLANTED BY PAYMENT OF DRAUGHT POWER USED AND DISTRICT
District Self/Family ISPAAD Both
(ISPAAD & Self) Other
Ngwaketse 187 2,081 22 84
Barolong 92 1,438 29 -
Ngwaketse West 2 147 - -
South East - 399 7 -
Kweneng East 1,718 2,811 54 15
Kweneng West 97 1,023 - -
Kgatleng 350 888 17 -
Central Serowe/ Palapye 624 838 114 6
Central Mahalapye 570 1,810 252 7
Central Bobonong 503 738 47 -
Central Boteti 184 52 - 7
Central Tutume 538 740 79 12
North East 946 2,347 349 44
Ngamiland East 272 205 8 -
Ngamiland West 572 890 118 -
Chobe 64 201 45 22
Ghanzi 4 107 1 -
Kgalagadi South - - - -
Kgalagadi North 3 20 3 -
TOTAL TRADITIONAL 6,727 16,736 1,145 196
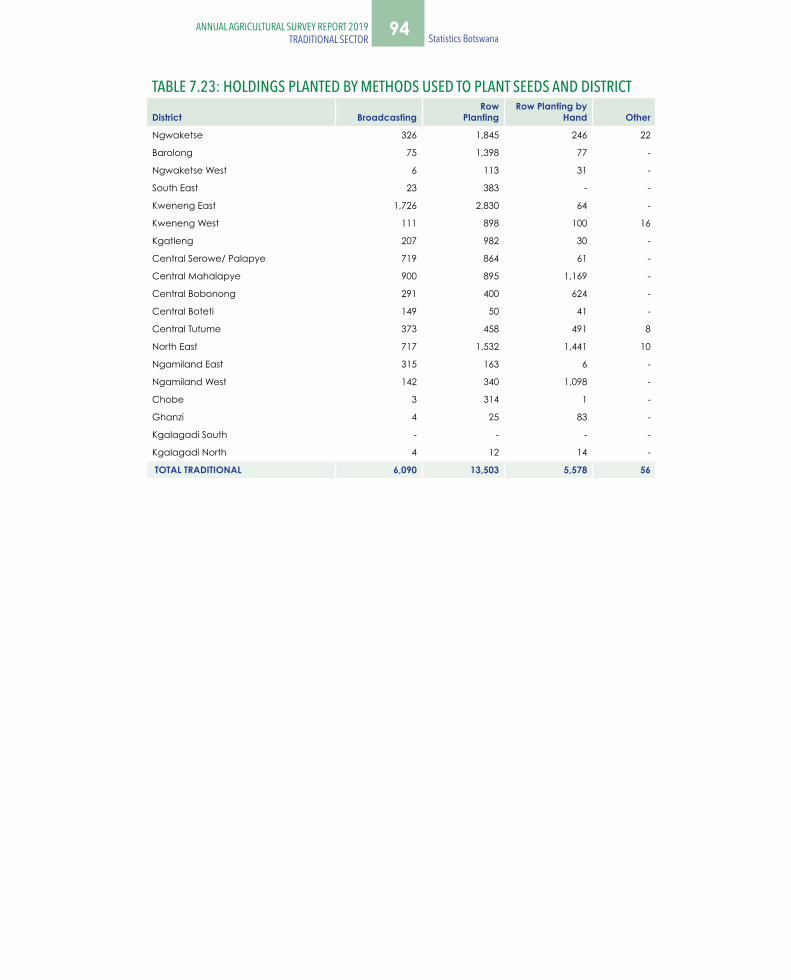
94 Statistics Botswana ANNUAL AGRICULTURAL SURVEY REPORT 2019
TRADITIONAL SECTORANNUAL AGRICULTURAL SURVEY REPORT 2019
TRADITIONAL SECTOR
TABLE 7.23: HOLDINGS PLANTED BY METHODS USED TO PLANT SEEDS AND DISTRICT
District Broadcasting Row
Planting Row Planting by
Hand Other
Ngwaketse 326 1,845 246 22
Barolong 75 1,398 77 -
Ngwaketse West 6 113 31 -
South East 23 383 - -
Kweneng East 1,726 2,830 64 -
Kweneng West 111 898 100 16
Kgatleng 207 982 30 -
Central Serowe/ Palapye 719 864 61 -
Central Mahalapye 900 895 1,169 -
Central Bobonong 291 400 624 -
Central Boteti 149 50 41 -
Central Tutume 373 458 491 8
North East 717 1,532 1,441 10
Ngamiland East 315 163 6 -
Ngamiland West 142 340 1,098 -
Chobe 3 314 1 -
Ghanzi 4 25 83 -
Kgalagadi South - - - -
Kgalagadi North 4 12 14 -
TOTAL TRADITIONAL 6,090 13,503 5,578 56

95ANNUAL AGRICULTURAL SURVEY REPORT 2019TRADITIONAL SECTOR Statistics Botswana
96 Statistics Botswana ANNUAL AGRICULTURAL SURVEY REPORT 2019
TRADITIONAL SECTORANNUAL AGRICULTURAL SURVEY REPORT 2019
TRADITIONAL SECTOR
Private Bag 0024, Gaborone Tel: 3671300 Fax: 3952201 Toll Free: 0800 600 200
Private Bag F193, City of Francistown Botswana Tel. 241 5848, Fax. 241 7540
Private Bag 32 GhanziTel: 371 5723 Fax: 659 7506
Private Bag 47MaunTel: 371 5716 Fax: 686 4327
E-mail: [email protected] Website: http://www.statsbots.org.bw
ISBN: 978-99968-482-8-5 (e-book)