annual 2017 state of the line report · annual 2017 state of the line report ... 2015)
TRANSCRIPT
AIS2017© Copyright 2017 NCCI Holdings, Inc. All Rights Reserved.
ANNUALISSUES
SYMPOSIUM2017
T H E
SYSTEM@WORK
STATE OF THE LINEREPORT
KATHY ANTONELLO, FCAS, FSA, MAAACHIEF ACTUARYNCCI
© Copyright 2017 NCCI Holdings, Inc. All Rights Reserved.
AIS2017
ANNUALISSUES
SYMPOSIUM2017 PROPERTY/CASUALTY (P/C)
RESULTS

© Copyright 2017 NCCI Holdings, Inc. All Rights Reserved.
AIS20173
Line of Business 2015 ($B) 2016p ($B) % Change From 2015
Personal Auto 192.8 207.3
Homeowners 79.4 80.6
Other Liability (Incl Prod Liab) 49.3 47.9
Workers Compensation 39.7 40.1
Commercial Multiple Peril 34.7 33.8
Fire & Allied Lines (Incl EQ) 26.2 26.3
Commercial Auto 27.6 28.2
All Other Lines 64.7 63.7
Total P/C Industry 514.3 527.8 2.6
-1.5
2.2
0.4
-2.6
1.0
-2.8
1.5
7.5
P/C Industry Net Written Premium GrowthPrivate Carriers
p Preliminary Source: National Association of Insurance Commissioners’ (NAIC’s) Annual Statement data for individual carriers prior to consolidation of affiliated carriers; includes carrier data available as of 4/7/2017

© Copyright 2017 NCCI Holdings, Inc. All Rights Reserved.
AIS20174
Line of Business 2015 (%) 2016p (%) Difference From 2015
Personal Auto 105 106
Homeowners 92 93
Other Liability (Incl Prod Liab) 103 111
Workers Compensation 94 94
Commercial Multiple Peril 95 102
Fire & Allied Lines (Incl EQ) 86 90
Commercial Auto 109 111
All Other Lines 84 87
Total P/C Industry 98 101 3
3
2
4
7
0
8
1
1
P/C Industry Net Combined RatioPrivate Carriers
p Preliminary Source: NAIC’s Annual Statement data for individual carriers prior to consolidation of affiliated carriers; includes carrier data available as of 4/7/2017

© Copyright 2017 NCCI Holdings, Inc. All Rights Reserved.
AIS20175
P/C Industry Net Combined RatioPrivate Carriers
98
101
85
90
95
100
105
110
115
120
95 96 97 98 99 00 01 02 03 04 05 06 07 08 09 10 11 12 13 14 15 16p
Percent
Calendar Year
p PreliminarySources: 1995–2007 and 2012–2016p, NAIC’s Annual Statement data
2008–2011, ISO
4% Lower
© Copyright 2017 NCCI Holdings, Inc. All Rights Reserved.
AIS20176
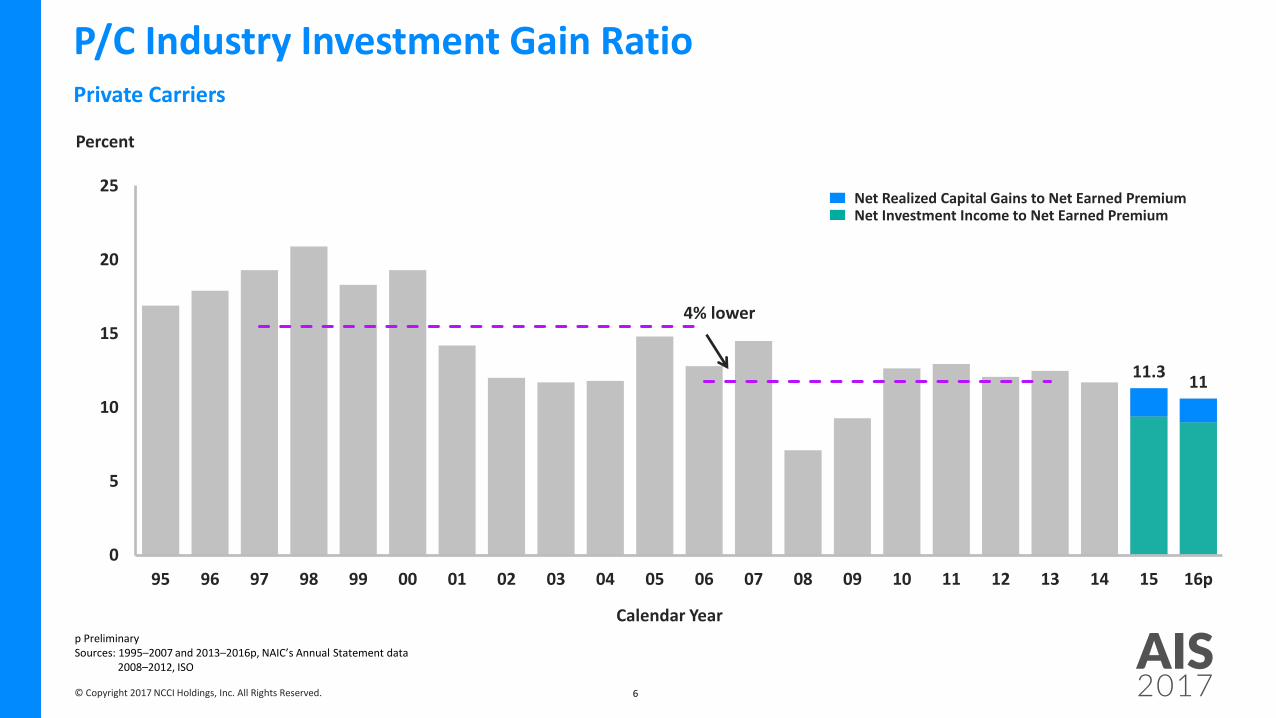
P/C Industry Investment Gain RatioPrivate Carriers
11.311
0
5
10
15
20
25
95 96 97 98 99 00 01 02 03 04 05 06 07 08 09 10 11 12 13 14 15 16p
Percent
Calendar Yearp PreliminarySources: 1995–2007 and 2013–2016p, NAIC’s Annual Statement data
2008–2012, ISO
4% lower
Net Realized Capital Gains to Net Earned PremiumNet Investment Income to Net Earned Premium
© Copyright 2017 NCCI Holdings, Inc. All Rights Reserved.
AIS20177
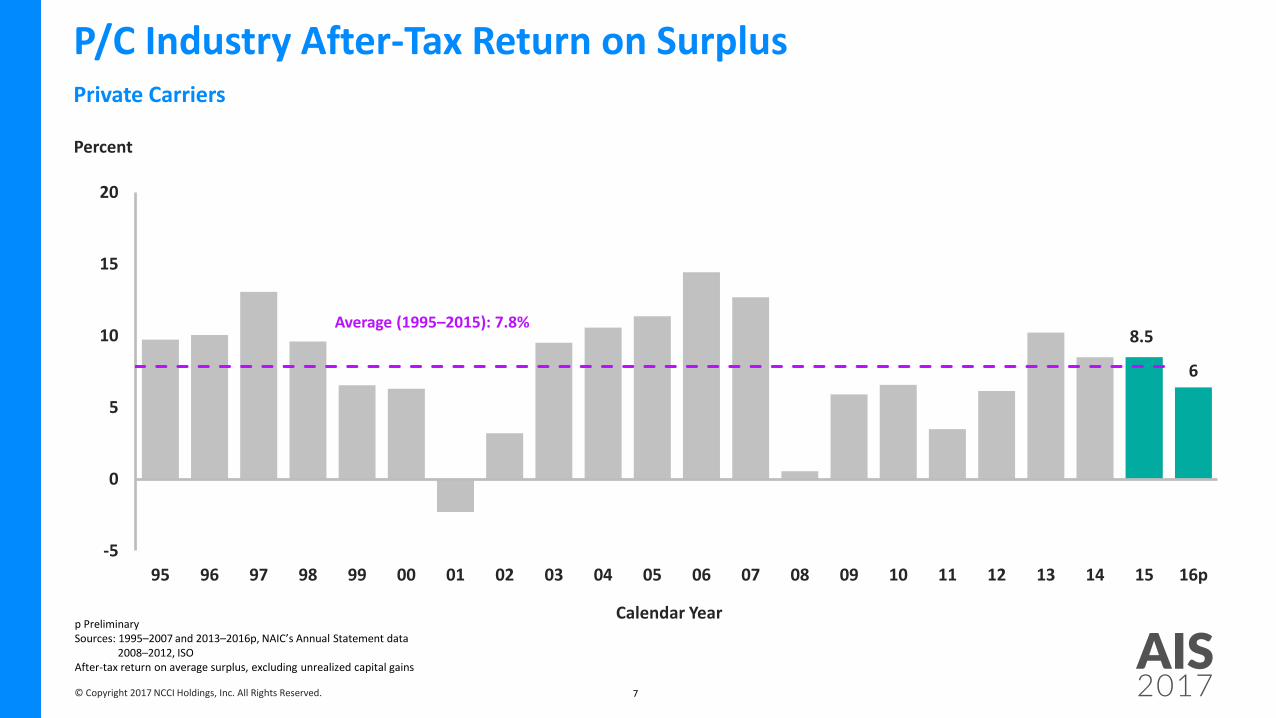
P/C Industry After-Tax Return on SurplusPrivate Carriers
8.5
6
-5
0
5
10
15
20
95 96 97 98 99 00 01 02 03 04 05 06 07 08 09 10 11 12 13 14 15 16p
Percent
Calendar Yearp PreliminarySources: 1995–2007 and 2013–2016p, NAIC’s Annual Statement data
2008–2012, ISOAfter-tax return on average surplus, excluding unrealized capital gains
Average (1995–2015): 7.8%
© Copyright 2017 NCCI Holdings, Inc. All Rights Reserved.
AIS20178
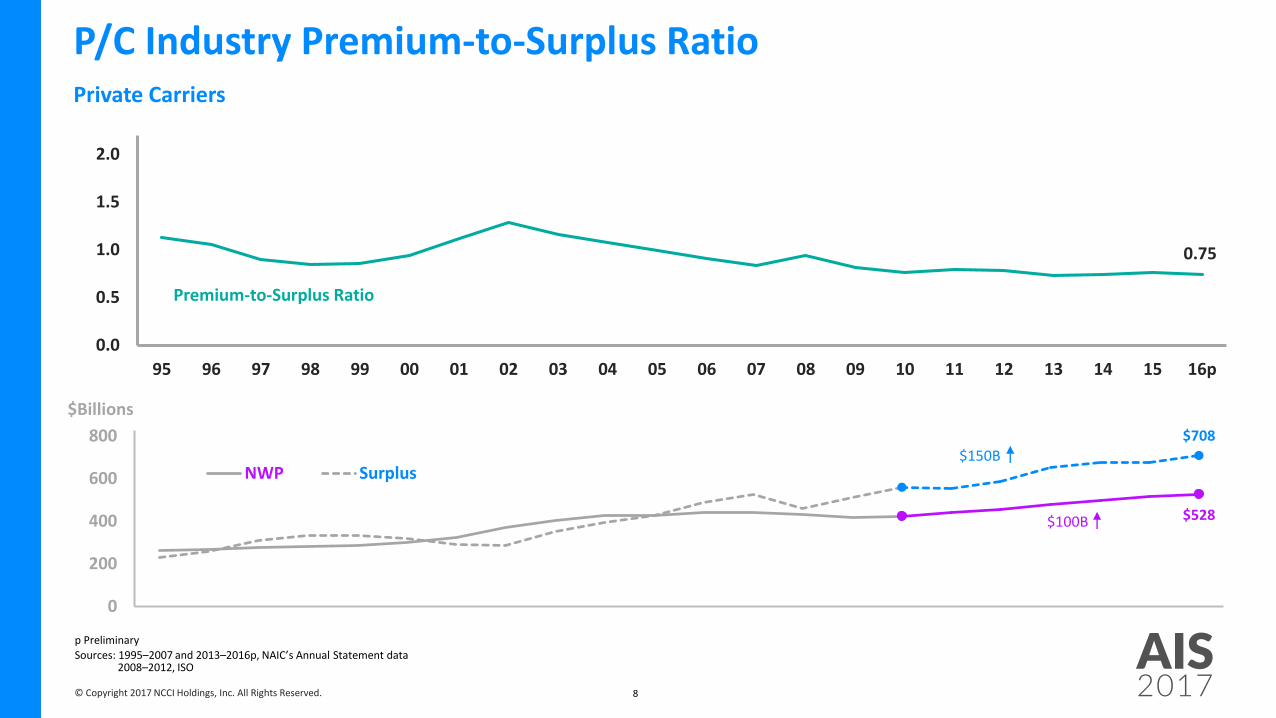
0.75
0.0
0.5
1.0
1.5
2.0
95 96 97 98 99 00 01 02 03 04 05 06 07 08 09 10 11 12 13 14 15 16p
Premium-to-Surplus Ratio
P/C Industry Premium-to-Surplus RatioPrivate Carriers
$528
$708
0
200
400
600
800
$Billions
NWP Surplus
p Preliminary
Sources: 1995–2007 and 2013–2016p, NAIC’s Annual Statement data 2008–2012, ISO
$100B
$150B

© Copyright 2017 NCCI Holdings, Inc. All Rights Reserved.
AIS2017
ANNUALISSUES
SYMPOSIUM2017 WORKERS
COMPENSATION (WC) PREMIUM

© Copyright 2017 NCCI Holdings, Inc. All Rights Reserved.
AIS201710
WC Net Written PremiumPrivate Carriers and State Funds
37.8 39.7 40.1
47.845.5 45.5
0
10
20
30
40
50
95 96 97 98 99 00 01 02 03 04 05 06 07 08 09 10 11 12 13 14 15 16p
$ Billions
Calendar Year
State Funds ($B)
Private Carriers ($B)
p PreliminarySource: NAIC’s Annual Statement data; includes state insurance fund data for the following states: AZ, CA, CO, HI, ID, KY, LA, MD, MO, MT, NM, OK, OR, RI, TX, and UTEach calendar year total for state funds includes all funds operating as a state fund in that year
© Copyright 2017 NCCI Holdings, Inc. All Rights Reserved.
AIS201711
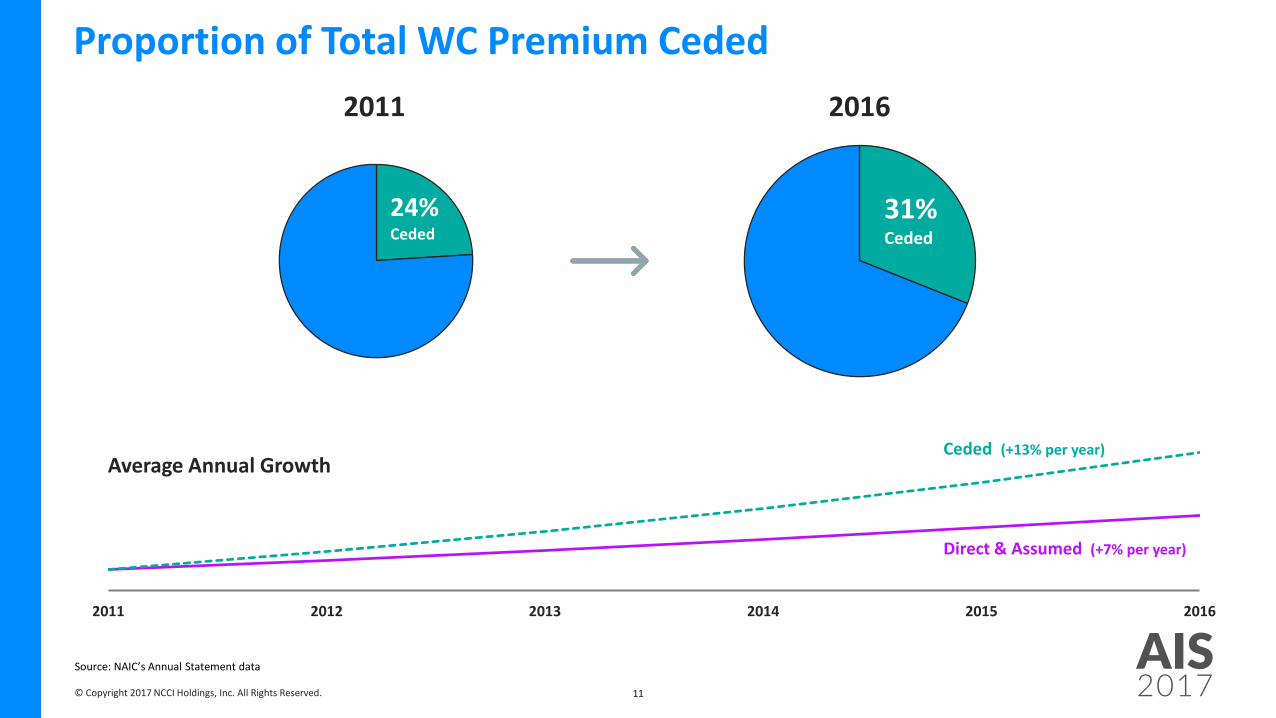
Proportion of Total WC Premium Ceded
2011 2012 2013 2014 2015 2016
Source: NAIC’s Annual Statement data
2011 2016
Average Annual Growth
Direct & Assumed (+7% per year)
Ceded (+13% per year)
24%Ceded
31%Ceded

© Copyright 2017 NCCI Holdings, Inc. All Rights Reserved.
AIS201712
WC Residual Market PremiumNCCI-Serviced WC Residual Market Pools
1.1 1.1
0
1
2
95 96 97 98 99 00 01 02 03 04 05 06 07 08 09 10 11 12 13 14 15 16p
$ Billions
Policy Year
p Preliminary, incomplete policy year projected to ultimateIncludes Pool data for all NCCI-serviced WC Residual Market Pool states, valued as of 12/31/2016Tennessee Reinsurance Mechanism premium is not includedSource: NCCI’s Residual Market Quarterly Results

© Copyright 2017 NCCI Holdings, Inc. All Rights Reserved.
AIS201713
Size of Risk
Premium ($ Millions)
Q1 2016 Q1 2017 % Change From 2016
$ 0 – 2,499 34.1 37.0
$ 2,500 – 4,999 19.6 19.5
$ 5,000 – 9,999 26.9 26.8
$ 10,000 – 49,999 68.6 64.3
$ 50,000 – 99,999 23.5 19.3
$ 100,000 and Over 33.3 23.6
Total 206.0 190.4 -8
-29
-18
-6
-1
-1
9
WC Residual Market Premium by Size of RiskNCCI-Administered WC Residual Market Plan States
Total estimated annual premiumIncludes Pool and direct assignment data for all NCCI-administered WC Residual Market Plan states
© Copyright 2017 NCCI Holdings, Inc. All Rights Reserved.
AIS201714
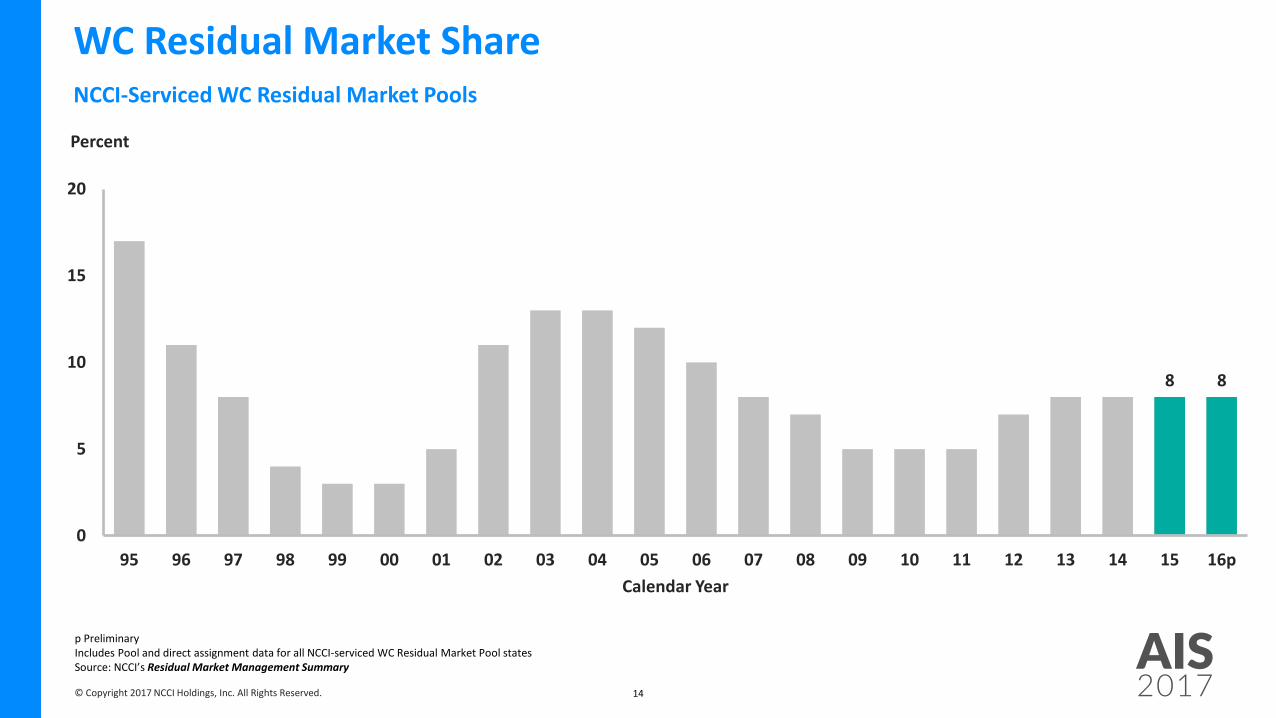
WC Residual Market ShareNCCI-Serviced WC Residual Market Pools
8 8
0
5
10
15
20
95 96 97 98 99 00 01 02 03 04 05 06 07 08 09 10 11 12 13 14 15 16p
Percent
Calendar Year
p PreliminaryIncludes Pool and direct assignment data for all NCCI-serviced WC Residual Market Pool statesSource: NCCI’s Residual Market Management Summary

© Copyright 2017 NCCI Holdings, Inc. All Rights Reserved.
AIS201715
WC Direct Written Premium 2016 GrowthPrivate Carriers
Source: 2015 and 2016, NAIC’s Annual Statement Statutory Page 14
+10%
–20%
0%
© Copyright 2017 NCCI Holdings, Inc. All Rights Reserved.
AIS201716
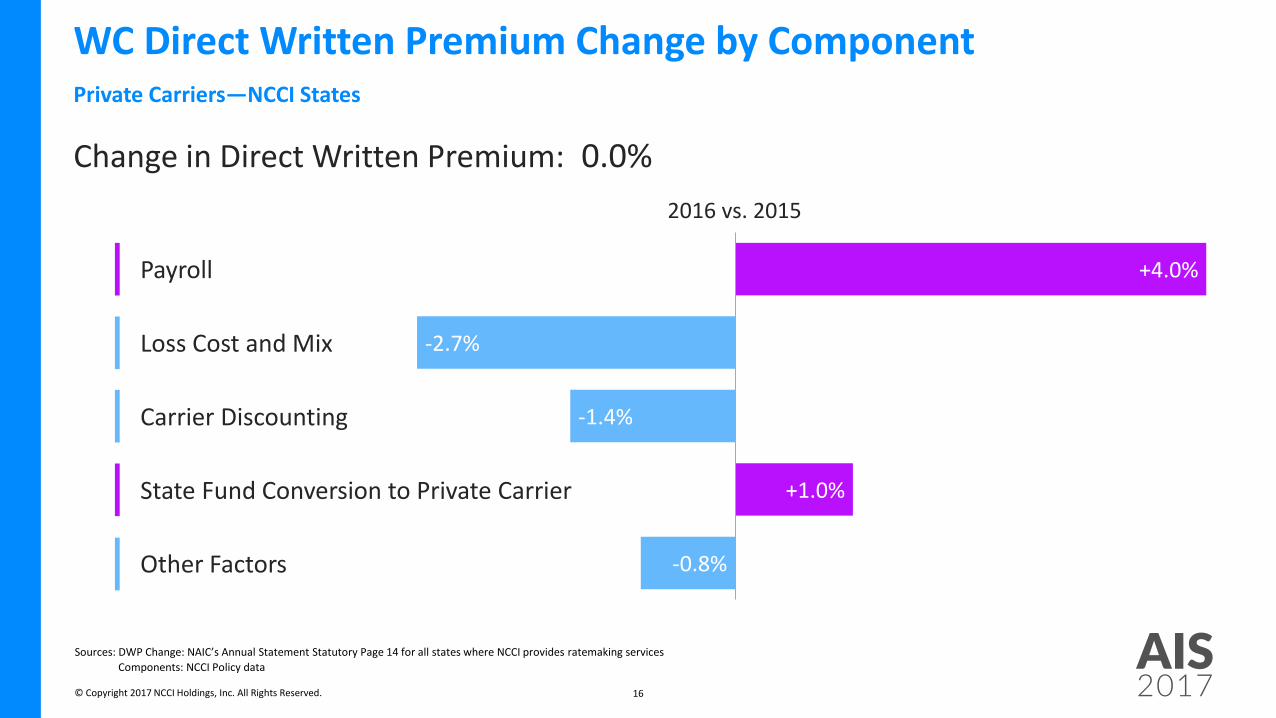
WC Direct Written Premium Change by ComponentPrivate Carriers—NCCI States
Sources: DWP Change: NAIC’s Annual Statement Statutory Page 14 for all states where NCCI provides ratemaking services
Components: NCCI Policy data
2016 vs. 2015
-0.8%
+1.0%
-1.4%
-2.7%
+4.0%
State Fund Conversion to Private Carrier
Payroll
Loss Cost and Mix
Carrier Discounting
Other Factors
Change in Direct Written Premium: 0.0%
© Copyright 2017 NCCI Holdings, Inc. All Rights Reserved.
AIS201717
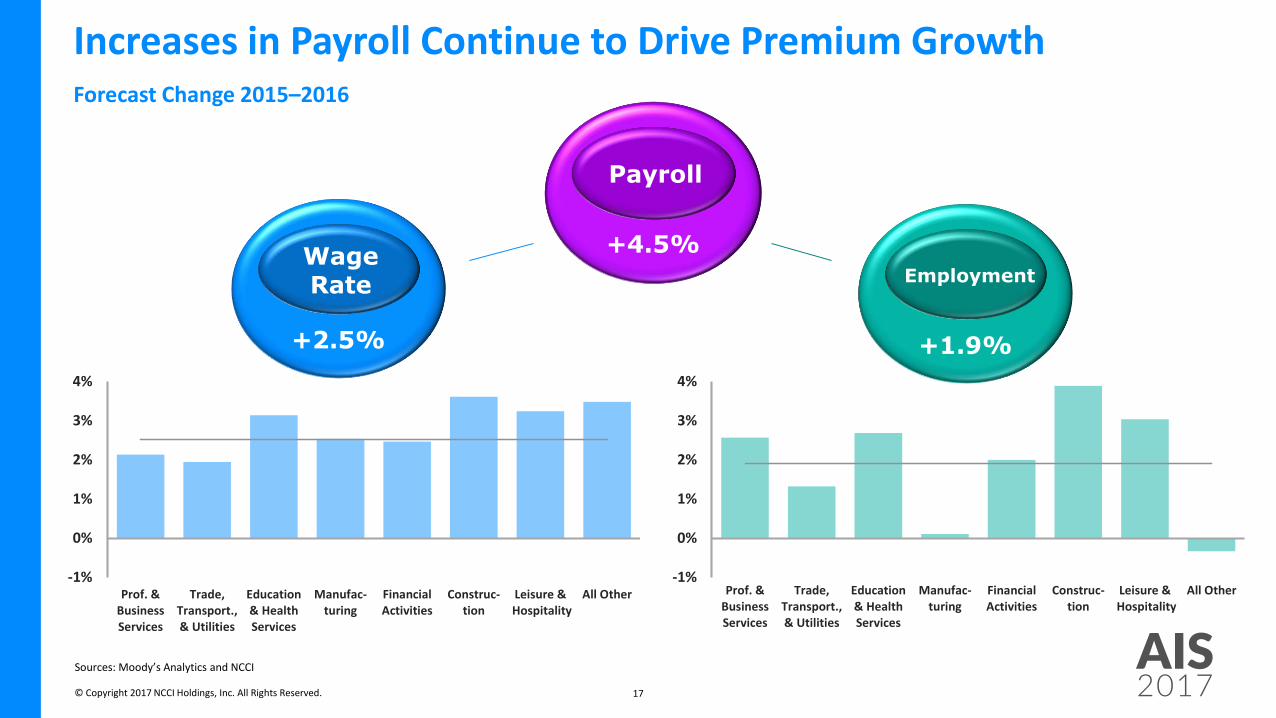
Increases in Payroll Continue to Drive Premium GrowthForecast Change 2015–2016
Sources: Moody’s Analytics and NCCI
+2.5%
WageRate
+4.5%
Payroll
-1%
0%
1%
2%
3%
4%
Prof. &BusinessServices
Trade,Transport.,& Utilities
Education& HealthServices
Manufac-turing
FinancialActivities
Construc-tion
Leisure & Hospitality
All Other-1%
0%
1%
2%
3%
4%
Prof. &BusinessServices
Trade,Transport.,& Utilities
Education& HealthServices
Manufac-turing
FinancialActivities
Construc-tion
Leisure & Hospitality
All Other
+1.9%
Employment

© Copyright 2017 NCCI Holdings, Inc. All Rights Reserved.
AIS201718
WC Approved Changes in Bureau Premium LevelBy Effective Year for NCCI States
-2.5
-6.7
-10
-5
0
5
00 01 02 03 04 05 06 07 08 09 10 11 12 13 14 15 16 17p
Percent
Calendar Year
p PreliminarySource: NAIC’s Annual Statement Statutory Page 14Bureau premium level changes reflect approved changes in advisory rates, loss costs, assigned risk rates, and rating values, as of 5/12/2017, relative to those previously approved in NCCI states onlyIN and NC are filed in cooperation with state rating bureaus
© Copyright 2017 NCCI Holdings, Inc. All Rights Reserved.
AIS201719
-14
.7
-14
.4
-13
.4
-12
.8
-12
.6
-12
.1
-10
.9
-10
.7
-10
.2
-9.9
-9.8 -9.3
-9.0
-9.0
-8.8
-8.4
-8.4 -7.9
-7.8
-7.8 -6
.6 -6.1 -5.5 -5.0
-4.7
-4.7
-4.3
-4.0
-3.7
-3.7 -2
.6
-2.4 -1
.6
-1.2
-1.0 -0.5
1.3 2
.5
-20
-10
0
10
WV NC IL AZ TN AL CT NV OK MD LA IN NH NM UT AR KS VT MT TX OR MS VA KY FL IA ME NE DC MO RI CO AK ID SD GA HI SC
Percent
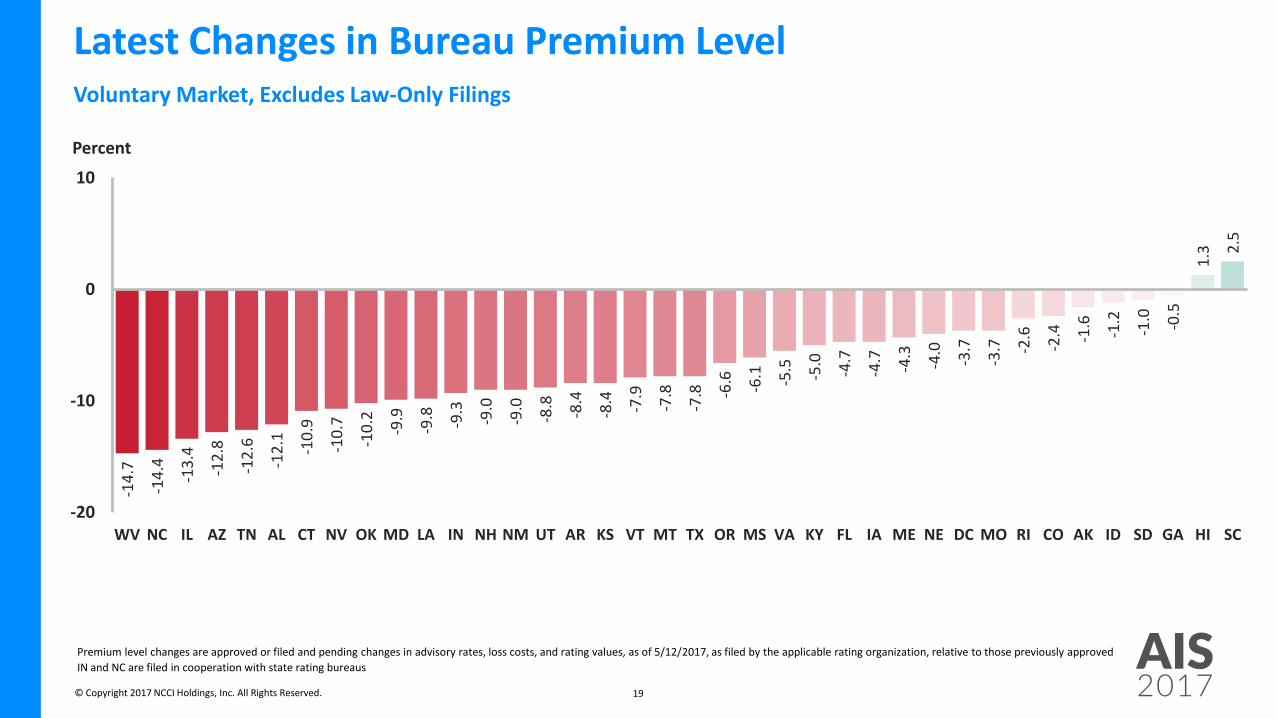
Latest Changes in Bureau Premium LevelVoluntary Market, Excludes Law-Only Filings
Premium level changes are approved or filed and pending changes in advisory rates, loss costs, and rating values, as of 5/12/2017, as filed by the applicable rating organization, relative to those previously approved
IN and NC are filed in cooperation with state rating bureaus

© Copyright 2017 NCCI Holdings, Inc. All Rights Reserved.
AIS201720
WC Impact of Discounting on PremiumPrivate Carriers—NCCI States
2.60.5
-25
-15
-5
5
95 96 97 98 99 00 01 02 03 04 05 06 07 08 09 10 11 12 13 14 15 16p
Percent
Policy Year
p PreliminarySources: NAIC’s Annual Statement Statutory Page 14 and NCCI’s Financial Call data NCCI benchmark level does not include a profit and contingency provision or expense constantBased on data for all states where NCCI provides ratemaking services, excluding TX
© Copyright 2017 NCCI Holdings, Inc. All Rights Reserved.
AIS201721
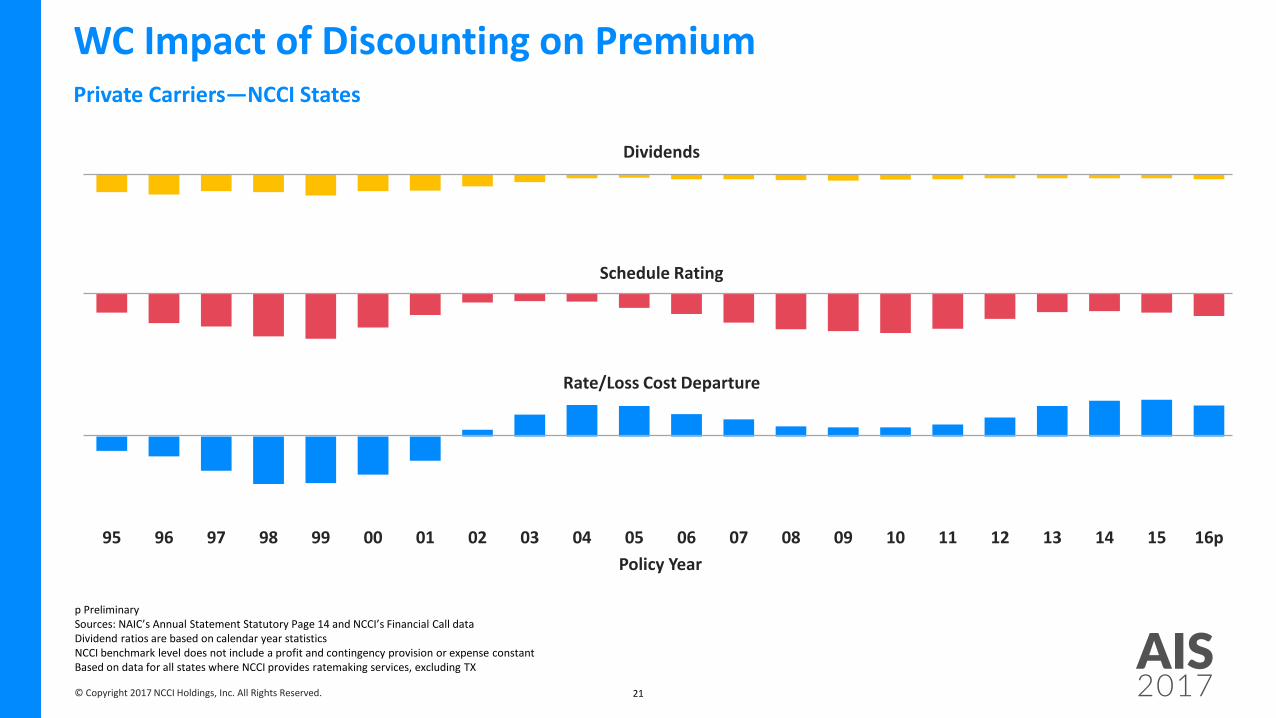
WC Impact of Discounting on PremiumPrivate Carriers—NCCI States
95 96 97 98 99 00 01 02 03 04 05 06 07 08 09 10 11 12 13 14 15 16p
Policy Year
p PreliminarySources: NAIC’s Annual Statement Statutory Page 14 and NCCI’s Financial Call data Dividend ratios are based on calendar year statisticsNCCI benchmark level does not include a profit and contingency provision or expense constantBased on data for all states where NCCI provides ratemaking services, excluding TX
Rate/Loss Cost Departure
Schedule Rating
Dividends
© Copyright 2017 NCCI Holdings, Inc. All Rights Reserved.
AIS201722
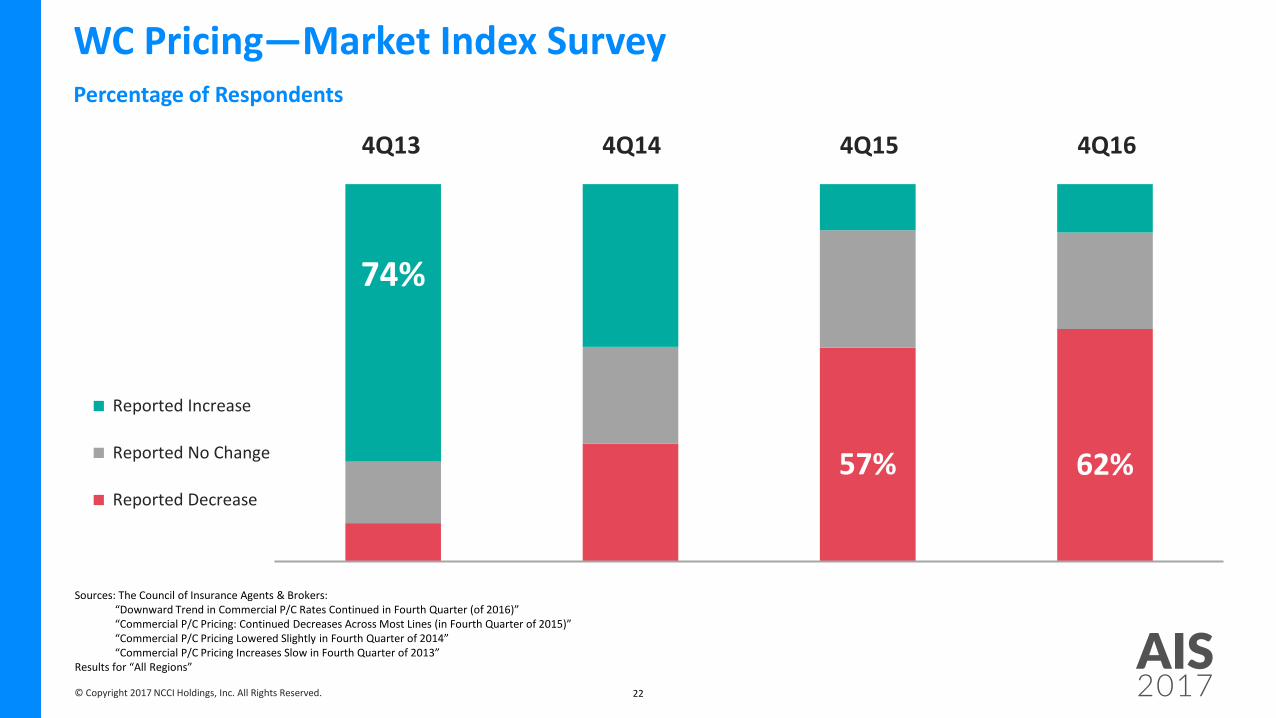
WC Pricing—Market Index SurveyPercentage of Respondents
57% 62%
74%
Reported Increase
Reported No Change
Reported Decrease
Sources: The Council of Insurance Agents & Brokers:“Downward Trend in Commercial P/C Rates Continued in Fourth Quarter (of 2016)” “Commercial P/C Pricing: Continued Decreases Across Most Lines (in Fourth Quarter of 2015)”“Commercial P/C Pricing Lowered Slightly in Fourth Quarter of 2014” “Commercial P/C Pricing Increases Slow in Fourth Quarter of 2013”
Results for “All Regions”
4Q13 4Q14 4Q15 4Q16

© Copyright 2017 NCCI Holdings, Inc. All Rights Reserved.
AIS2017
ANNUALISSUES
SYMPOSIUM2017 WORKERS
COMPENSATION RESULTS

© Copyright 2017 NCCI Holdings, Inc. All Rights Reserved.
AIS201724
WC Combined Ratio—Underwriting Gain AchievedPrivate Carriers
94 94
85
90
95
100
105
110
115
120
125
95 96 97 98 99 00 01 02 03 04 05 06 07 08 09 10 11 12 13 14 15 16p
Percent
Calendar Year
p PreliminarySource: NAIC’s Annual Statement data
3% lower
© Copyright 2017 NCCI Holdings, Inc. All Rights Reserved.
AIS201725
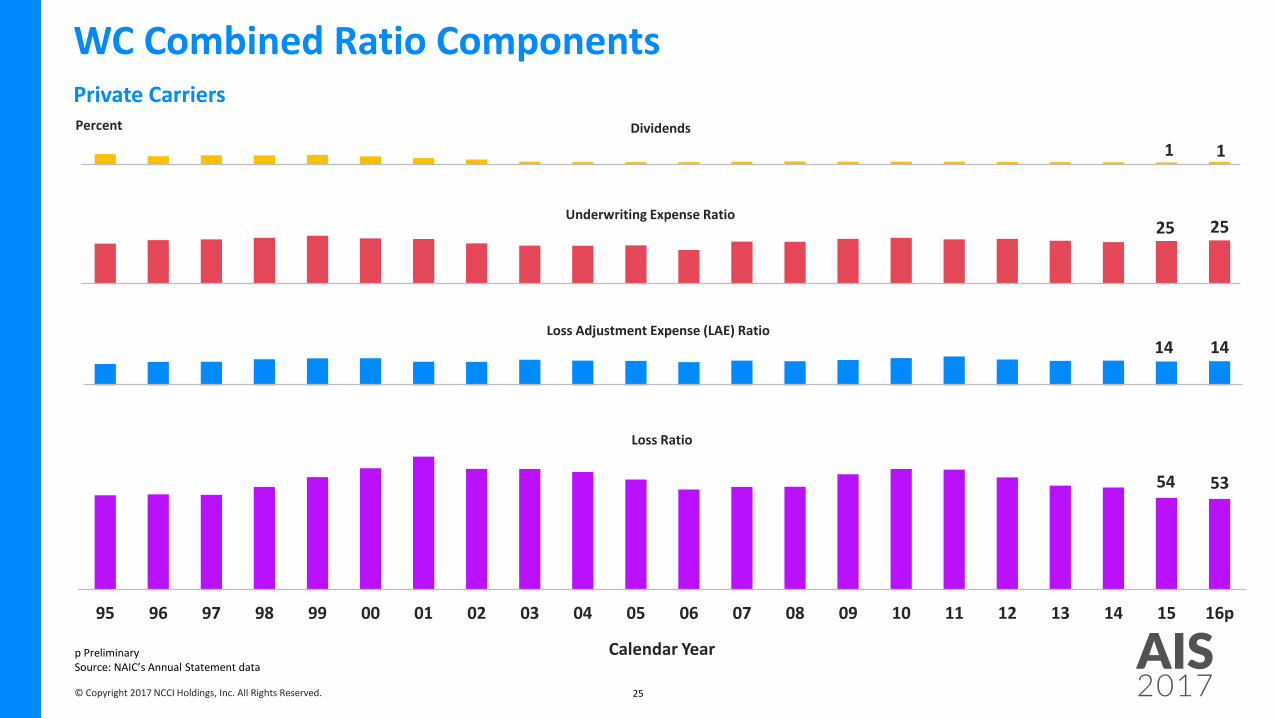
WC Combined Ratio ComponentsPrivate Carriers
54 53
14 14
25 25
1 1
95 96 97 98 99 00 01 02 03 04 05 06 07 08 09 10 11 12 13 14 15 16p
p PreliminarySource: NAIC’s Annual Statement data
Loss Ratio
Loss Adjustment Expense (LAE) Ratio
Underwriting Expense Ratio
Percent
Calendar Year
Dividends
© Copyright 2017 NCCI Holdings, Inc. All Rights Reserved.
AIS201726
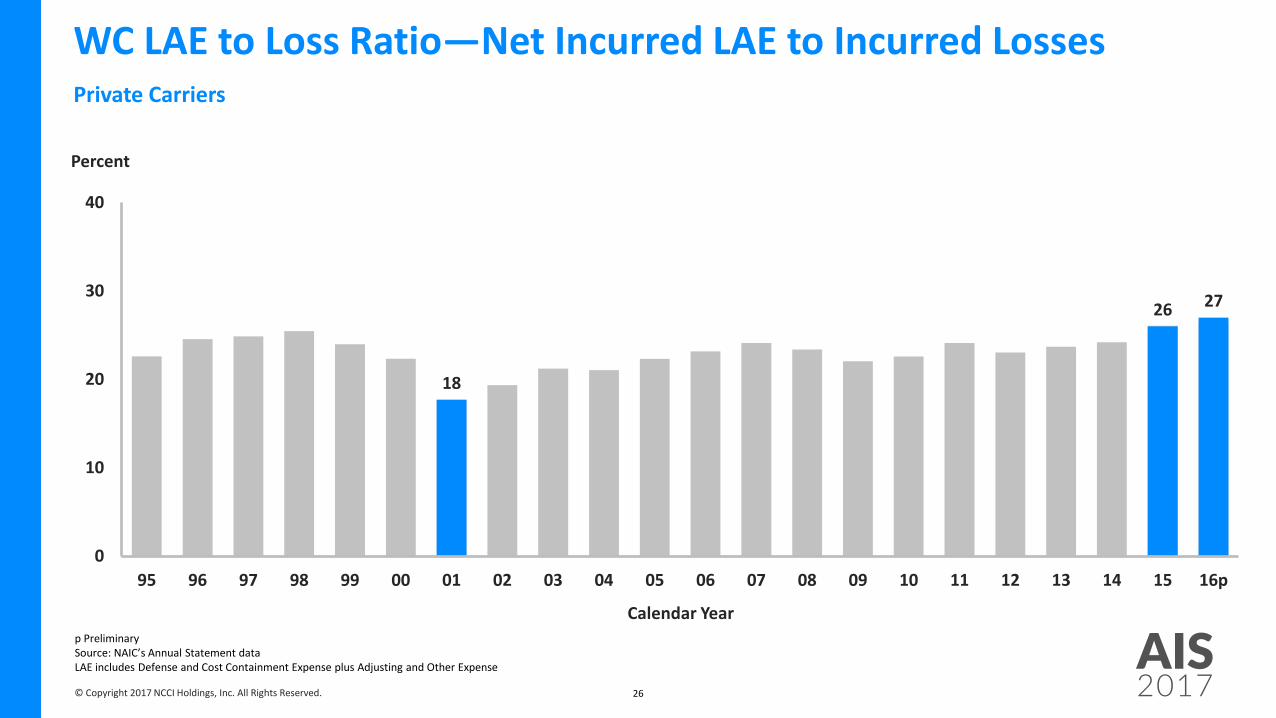
WC LAE to Loss Ratio—Net Incurred LAE to Incurred LossesPrivate Carriers
18
26 27
0
10
20
30
40
95 96 97 98 99 00 01 02 03 04 05 06 07 08 09 10 11 12 13 14 15 16p
Percent
Calendar Yearp PreliminarySource: NAIC’s Annual Statement dataLAE includes Defense and Cost Containment Expense plus Adjusting and Other Expense

© Copyright 2017 NCCI Holdings, Inc. All Rights Reserved.
AIS201727
WC Residual Market Combined RatioNCCI-Serviced WC Residual Market Pools
103
106
80
90
100
110
120
95 96 97 98 99 00 01 02 03 04 05 06 07 08 09 10 11 12 13 14 15 16p
Percent
Policy Yearp Preliminary, incomplete policy year projected to ultimateIncludes Pool data and Plan expenses for pool members for all NCCI-serviced WC Residual Market Pool states, valued as of 12/31/2016Tennessee Reinsurance Mechanism experience is not included in the combined ratiosSource: NCCI’s Residual Market Quarterly Results
© Copyright 2017 NCCI Holdings, Inc. All Rights Reserved.
AIS201728
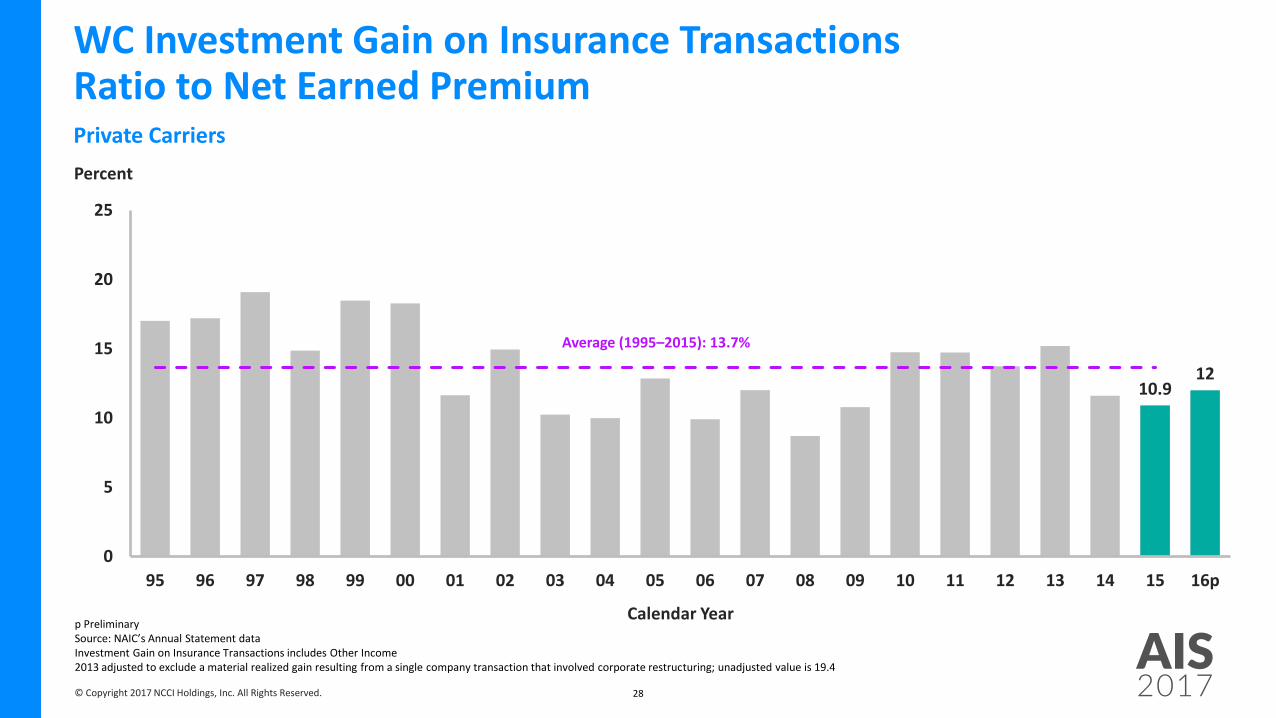
WC Investment Gain on Insurance TransactionsRatio to Net Earned PremiumPrivate Carriers
10.912
0
5
10
15
20
25
95 96 97 98 99 00 01 02 03 04 05 06 07 08 09 10 11 12 13 14 15 16p
Percent
Calendar Yearp PreliminarySource: NAIC’s Annual Statement dataInvestment Gain on Insurance Transactions includes Other Income2013 adjusted to exclude a material realized gain resulting from a single company transaction that involved corporate restructuring; unadjusted value is 19.4
Average (1995–2015): 13.7%

© Copyright 2017 NCCI Holdings, Inc. All Rights Reserved.
AIS201729
WC Pretax Operating GainPrivate Carriers
17.1 18
-15
-10
-5
0
5
10
15
20
25
95 96 97 98 99 00 01 02 03 04 05 06 07 08 09 10 11 12 13 14 15 16p
Percent
Calendar Year
p PreliminarySource: NAIC’s Annual Statement dataOperating Gain equals 1.00 minus (Combined Ratio less Investment Gain on Insurance Transactions and Other Income)2013 adjusted to exclude a material realized gain resulting from a single company transaction that involved corporate restructuring; unadjusted value is 17.7
Average (1995–2015): 7.6%
© Copyright 2017 NCCI Holdings, Inc. All Rights Reserved.
AIS201730
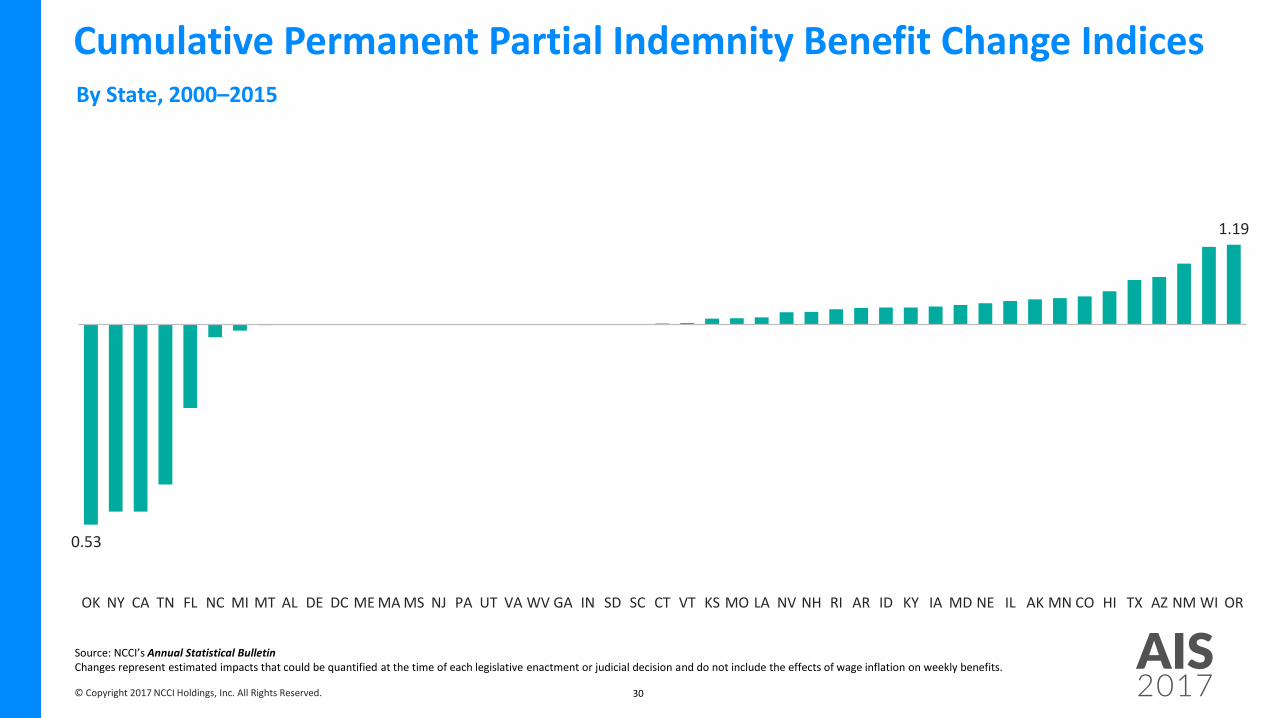
0.53
1.19
OK NY CA TN FL NC MI MT AL DE DC ME MA MS NJ PA UT VA WV GA IN SD SC CT VT KS MO LA NV NH RI AR ID KY IA MD NE IL AK MN CO HI TX AZ NM WI OR
Cumulative Permanent Partial Indemnity Benefit Change IndicesBy State, 2000–2015
Source: NCCI’s Annual Statistical BulletinChanges represent estimated impacts that could be quantified at the time of each legislative enactment or judicial decision and do not include the effects of wage inflation on weekly benefits.

© Copyright 2017 NCCI Holdings, Inc. All Rights Reserved.
AIS201731
Before Offset After Offset
Combined WC plus SSDI benefit cap
WC and Social Security Disability Insurance (SSDI) BenefitsComparison of Weekly PPD Benefits for a Dual Recipient Before and After the SSDI Offset
Illustrative example of initial benefits in a standard offset state for a dual recipient who previously earned the state median wage
Offset to SSDI benefits due to the WC plus SSDI cap
SSDI Benefit
WC Benefit

© Copyright 2017 NCCI Holdings, Inc. All Rights Reserved.
AIS2017
ANNUALISSUES
SYMPOSIUM2017 WORKERS
COMPENSATION ACCIDENT YEAR RESULTS ANDRESERVE ESTIMATES
© Copyright 2017 NCCI Holdings, Inc. All Rights Reserved.
AIS201733
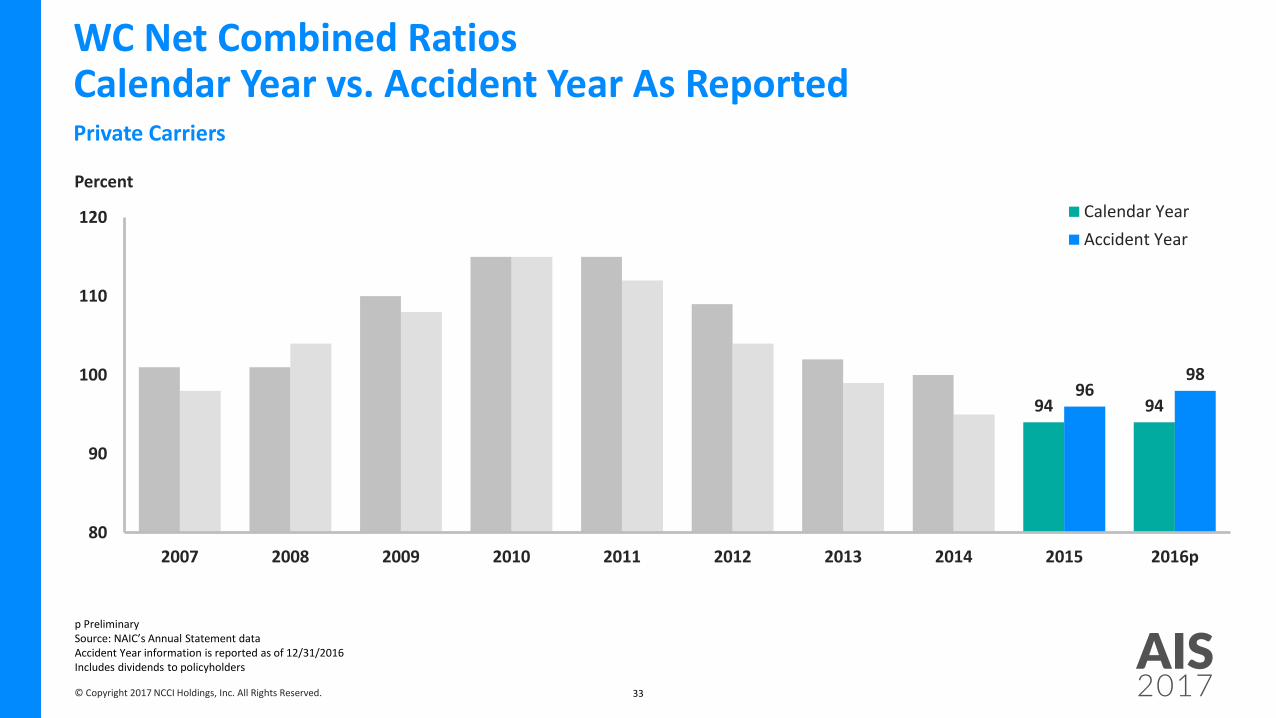
WC Net Combined RatiosCalendar Year vs. Accident Year As ReportedPrivate Carriers
94 9496
98
80
90
100
110
120
2007 2008 2009 2010 2011 2012 2013 2014 2015 2016p
Percent
Calendar Year
Accident Year
p PreliminarySource: NAIC’s Annual Statement dataAccident Year information is reported as of 12/31/2016Includes dividends to policyholders
© Copyright 2017 NCCI Holdings, Inc. All Rights Reserved.
AIS201734
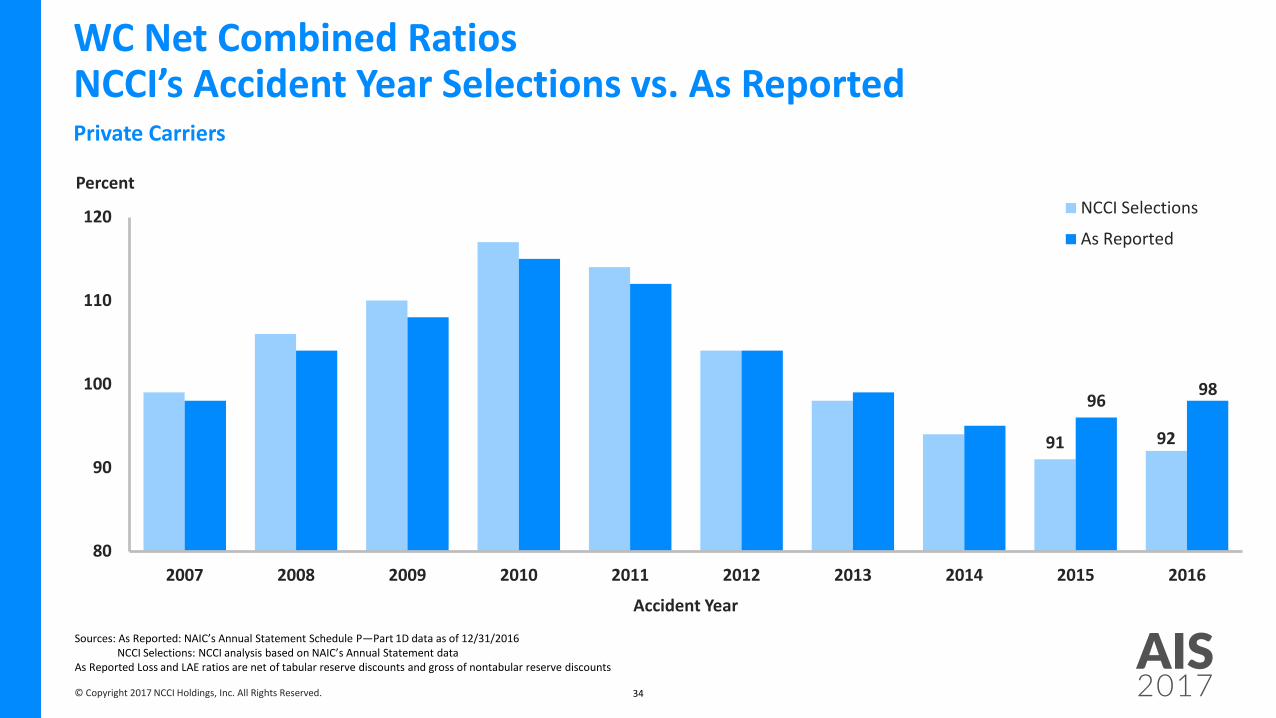
WC Net Combined RatiosNCCI’s Accident Year Selections vs. As ReportedPrivate Carriers
91 92
9698
80
90
100
110
120
2007 2008 2009 2010 2011 2012 2013 2014 2015 2016
Percent
Accident Year
NCCI Selections
As Reported
Sources: As Reported: NAIC’s Annual Statement Schedule P—Part 1D data as of 12/31/2016NCCI Selections: NCCI analysis based on NAIC’s Annual Statement data
As Reported Loss and LAE ratios are net of tabular reserve discounts and gross of nontabular reserve discounts
© Copyright 2017 NCCI Holdings, Inc. All Rights Reserved.
AIS201735
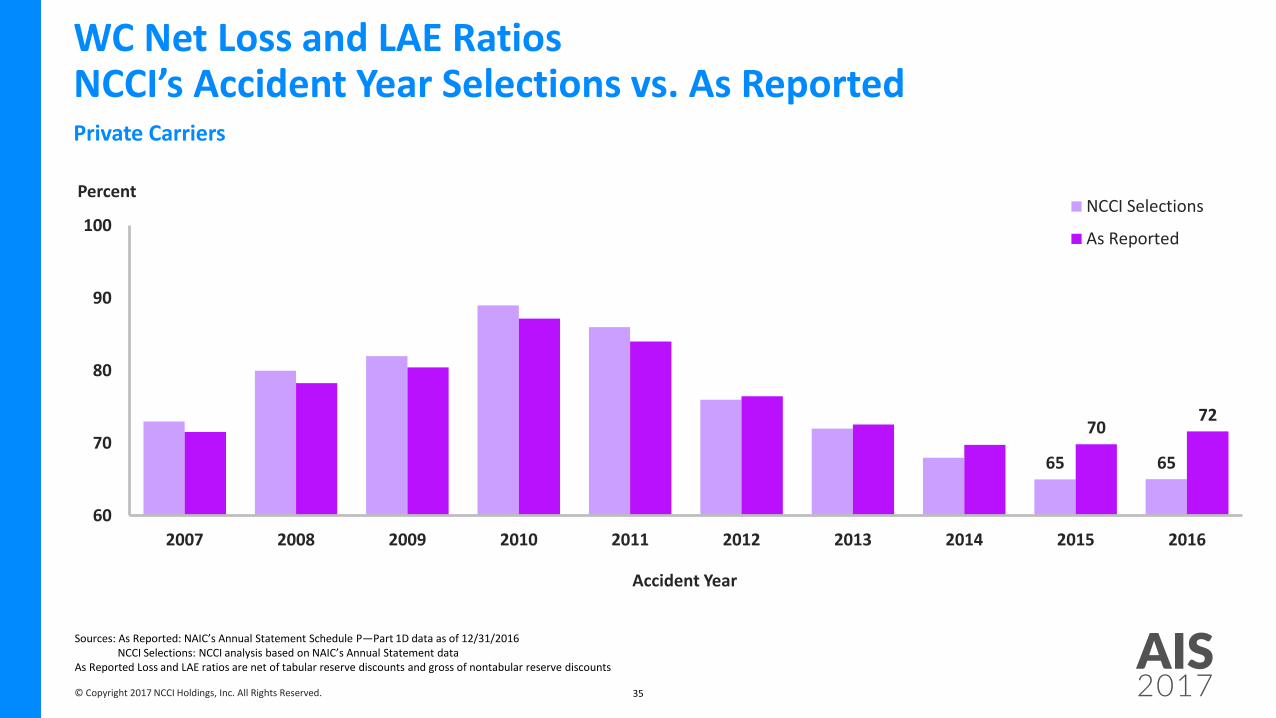
WC Net Loss and LAE RatiosNCCI’s Accident Year Selections vs. As Reported Private Carriers
65 65
7072
60
70
80
90
100
2007 2008 2009 2010 2011 2012 2013 2014 2015 2016
Percent
Accident Year
NCCI Selections
As Reported
Sources: As Reported: NAIC’s Annual Statement Schedule P—Part 1D data as of 12/31/2016NCCI Selections: NCCI analysis based on NAIC’s Annual Statement data
As Reported Loss and LAE ratios are net of tabular reserve discounts and gross of nontabular reserve discounts

© Copyright 2017 NCCI Holdings, Inc. All Rights Reserved.
AIS201736
WC Net Loss and LAE Reserve DeficienciesPrivate Carriers
21
75
0
5
10
15
20
25
95 96 97 98 99 00 01 02 03 04 05 06 07 08 09 10 11 12 13 14 15 16
$ Billions
Year-End Valuation
Source: NCCI analysis based on NAIC’s Annual Statement dataConsiders all reserve discounts as deficiencies
2016 Tabular Discount Is $4.5 Billion
(33% of CY Total Reserves)
(4% of CY Total Reserves)

© Copyright 2017 NCCI Holdings, Inc. All Rights Reserved.
AIS201737
WC Net Loss and LAE Ratio EmergencePrivate Carriers
60
70
80
90
100
2007 2008 2009 2010 2011 2012 2013 2014 2015 2016
Percent
Accident Year
Source: NAIC’s Annual Statement Schedule P—Part 1D data at year-end valuationsAs Reported Loss and LAE ratios are net of tabular reserve discounts and gross of nontabular reserve discounts
© Copyright 2017 NCCI Holdings, Inc. All Rights Reserved.
AIS2017
ANNUALISSUES
SYMPOSIUM2017 WORKERS
COMPENSATION LOSS DRIVERS
© Copyright 2017 NCCI Holdings, Inc. All Rights Reserved.
AIS201739
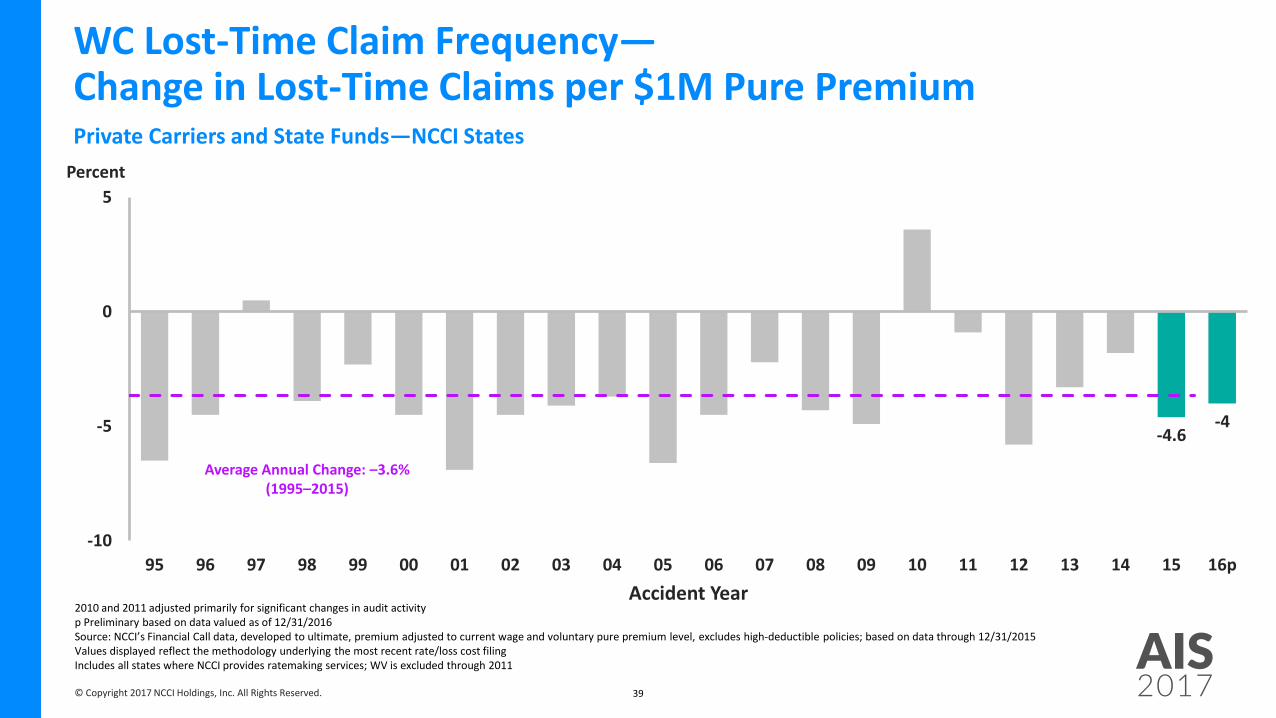
WC Lost-Time Claim Frequency—Change in Lost-Time Claims per $1M Pure PremiumPrivate Carriers and State Funds—NCCI States
-4.6-4
-10
-5
0
5
95 96 97 98 99 00 01 02 03 04 05 06 07 08 09 10 11 12 13 14 15 16p
Percent
Accident Year2010 and 2011 adjusted primarily for significant changes in audit activityp Preliminary based on data valued as of 12/31/2016Source: NCCI’s Financial Call data, developed to ultimate, premium adjusted to current wage and voluntary pure premium level, excludes high-deductible policies; based on data through 12/31/2015Values displayed reflect the methodology underlying the most recent rate/loss cost filingIncludes all states where NCCI provides ratemaking services; WV is excluded through 2011
Average Annual Change: –3.6%(1995–2015)
© Copyright 2017 NCCI Holdings, Inc. All Rights Reserved.
AIS201740
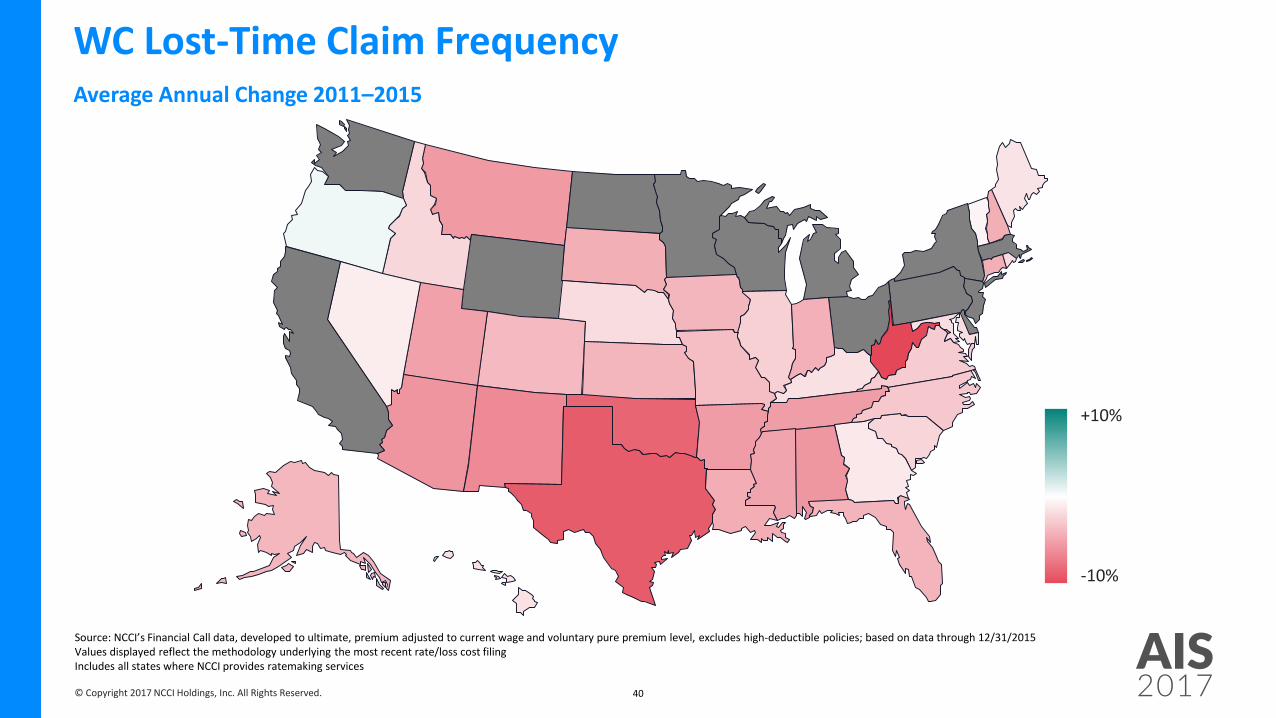
WC Lost-Time Claim FrequencyAverage Annual Change 2011–2015
Source: NCCI’s Financial Call data, developed to ultimate, premium adjusted to current wage and voluntary pure premium level, excludes high-deductible policies; based on data through 12/31/2015Values displayed reflect the methodology underlying the most recent rate/loss cost filingIncludes all states where NCCI provides ratemaking services
+10%
-10%

© Copyright 2017 NCCI Holdings, Inc. All Rights Reserved.
AIS201741
Distribution of Medical Costs
Service Year 2015Source: Data underlying NCCI’s State Medical Data Reports for all states where NCCI provides ratemaking services, excluding TX
38%
11%
18%
13%
8% 7%
5%
© Copyright 2017 NCCI Holdings, Inc. All Rights Reserved.
AIS201742
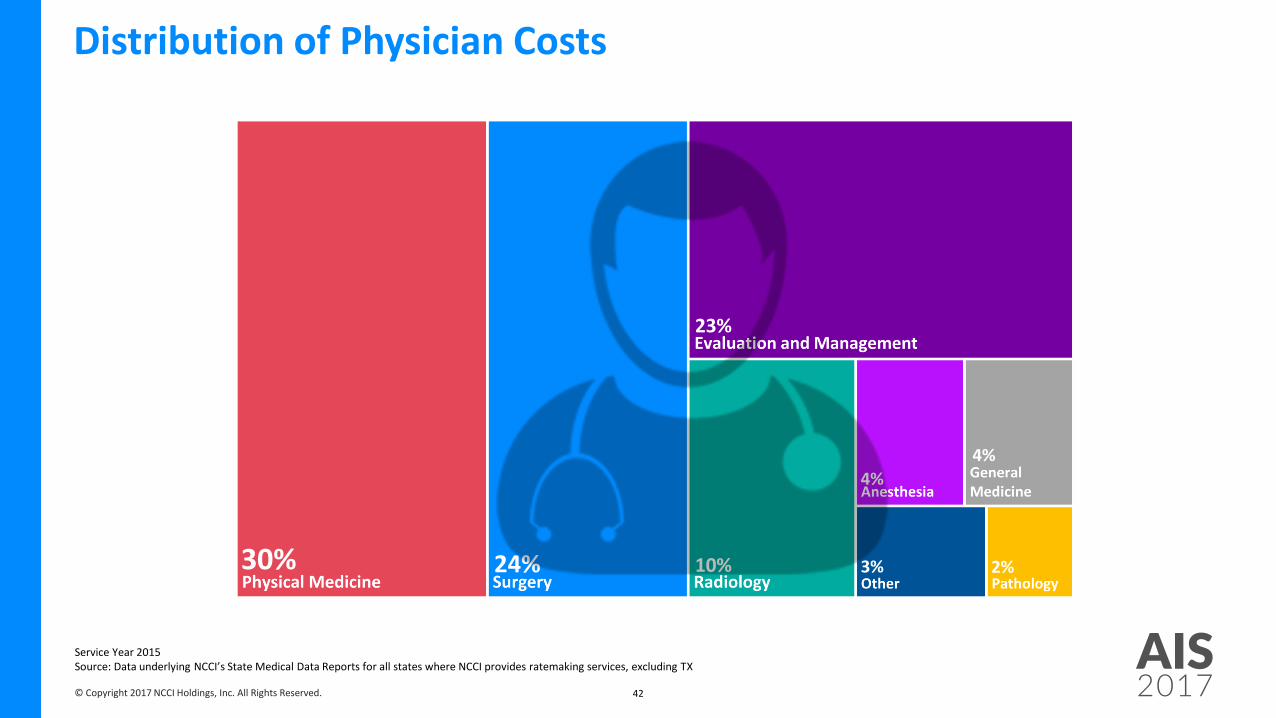
Distribution of Physician Costs
30% 24% 10%
23%
4%
3%
4%
2%
Service Year 2015Source: Data underlying NCCI’s State Medical Data Reports for all states where NCCI provides ratemaking services, excluding TX

© Copyright 2017 NCCI Holdings, Inc. All Rights Reserved.
AIS201743
Prescription Drugs—Changes Over Time
Generic (%)
2011 2015
Brand Name (%)
47% 58%Original Formulation (%)
Repackaged (%)
2011 2015
86% 97%
Repackaged drugs represent a very small proportion of overall drug payments.
Source: Data underlying NCCI’s State Medical Data Reports for all states where NCCI provides ratemaking services, excluding TX
Generic equivalents now represent the majority of payments for drugs prescribed in workers compensation.
© Copyright 2017 NCCI Holdings, Inc. All Rights Reserved.
AIS201744
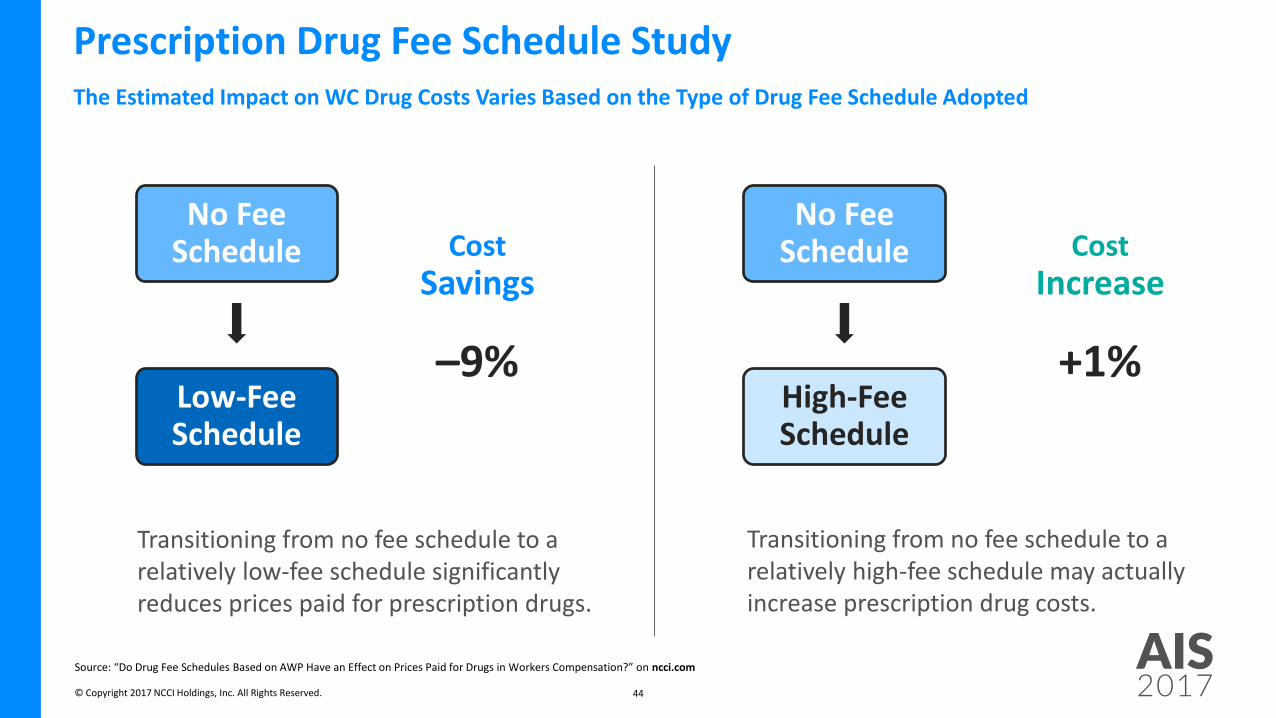
Prescription Drug Fee Schedule StudyThe Estimated Impact on WC Drug Costs Varies Based on the Type of Drug Fee Schedule Adopted
Source: “Do Drug Fee Schedules Based on AWP Have an Effect on Prices Paid for Drugs in Workers Compensation?” on ncci.com
Low-Fee Schedule
Cost Savings
–9%
No Fee Schedule
Transitioning from no fee schedule to a relatively low-fee schedule significantly reduces prices paid for prescription drugs.
Transitioning from no fee schedule to a relatively high-fee schedule may actually increase prescription drug costs.
High-Fee Schedule
No Fee Schedule Cost
Increase
+1%
© Copyright 2017 NCCI Holdings, Inc. All Rights Reserved.
AIS201745
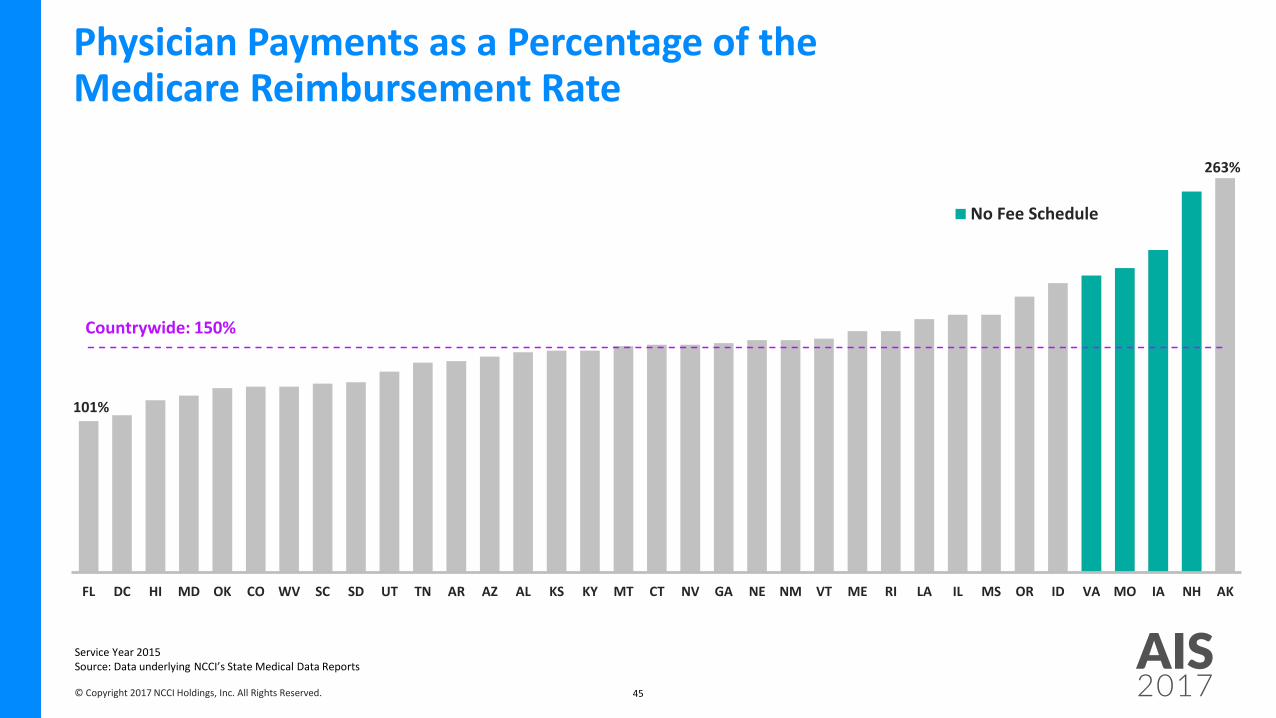
Physician Payments as a Percentage of the Medicare Reimbursement Rate
101%
263%
FL DC HI MD OK CO WV SC SD UT TN AR AZ AL KS KY MT CT NV GA NE NM VT ME RI LA IL MS OR ID VA MO IA NH AK
No Fee Schedule
Countrywide: 150%
Service Year 2015Source: Data underlying NCCI’s State Medical Data Reports
© Copyright 2017 NCCI Holdings, Inc. All Rights Reserved.
AIS201746
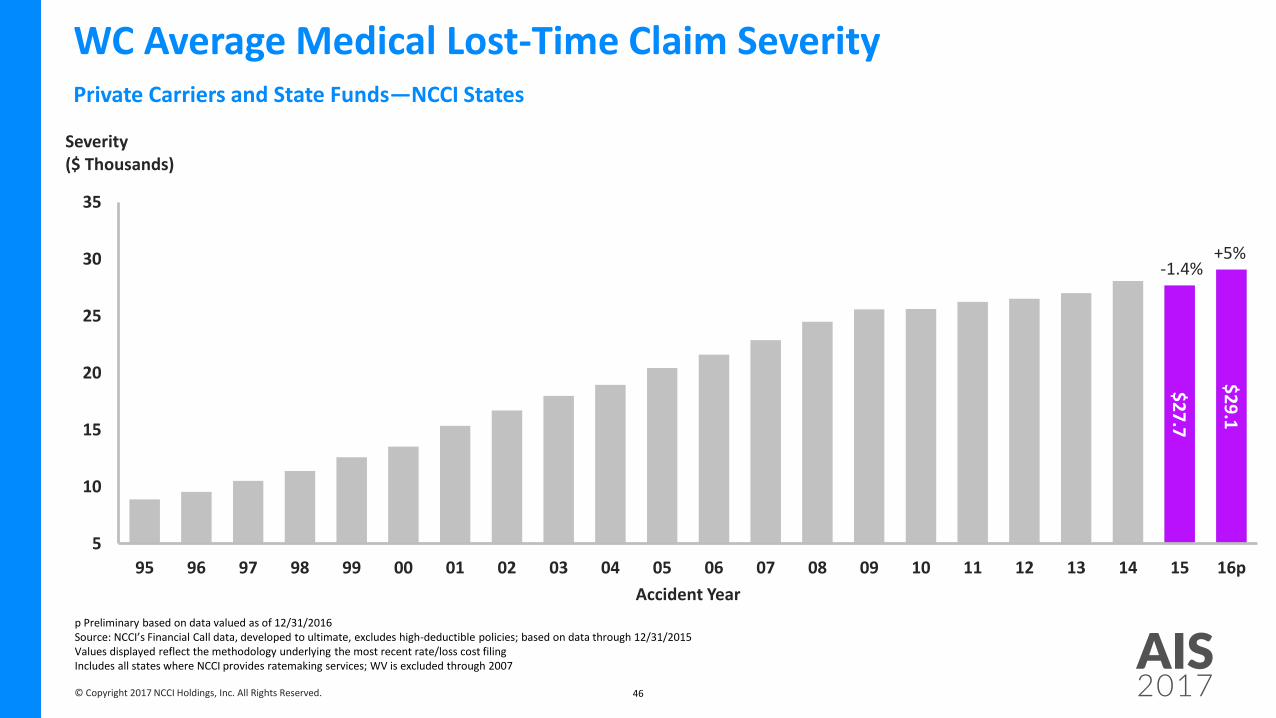
WC Average Medical Lost-Time Claim SeverityPrivate Carriers and State Funds—NCCI States
$2
7.7
$2
9.1
-1.4%+5%
5
10
15
20
25
30
35
95 96 97 98 99 00 01 02 03 04 05 06 07 08 09 10 11 12 13 14 15 16p
Severity ($ Thousands)
Accident Year
p Preliminary based on data valued as of 12/31/2016Source: NCCI’s Financial Call data, developed to ultimate, excludes high-deductible policies; based on data through 12/31/2015Values displayed reflect the methodology underlying the most recent rate/loss cost filingIncludes all states where NCCI provides ratemaking services; WV is excluded through 2007

© Copyright 2017 NCCI Holdings, Inc. All Rights Reserved.
AIS201747
WC Average Medical Lost-Time Claim SeverityPrivate Carriers and State Funds—NCCI States
95 96 97 98 99 00 01 02 03 04 05 06 07 08 09 10 11 12 13 14 15 16p
Accident Yearp Preliminary based on data valued as of 12/31/2016Sources: Severity: NCCI’s Financial Call data, developed to ultimate, excludes high-deductible policies; based on data through 12/31/2015
Values displayed reflect the methodology underlying the most recent rate/loss cost filingIncludes all states where NCCI provides ratemaking services; WV is excluded through 2007Personal Health Care (PHC) Chain-Weighted Price Index: Centers for Medicare & Medicaid Services
Cumulative Change in Medical Lost-Time Claim Severity (1995–2016p): +227%
Cumulative Change in the Personal Health Care Chain-Weighted Price Index (1995–2016p): +66%
© Copyright 2017 NCCI Holdings, Inc. All Rights Reserved.
AIS201748
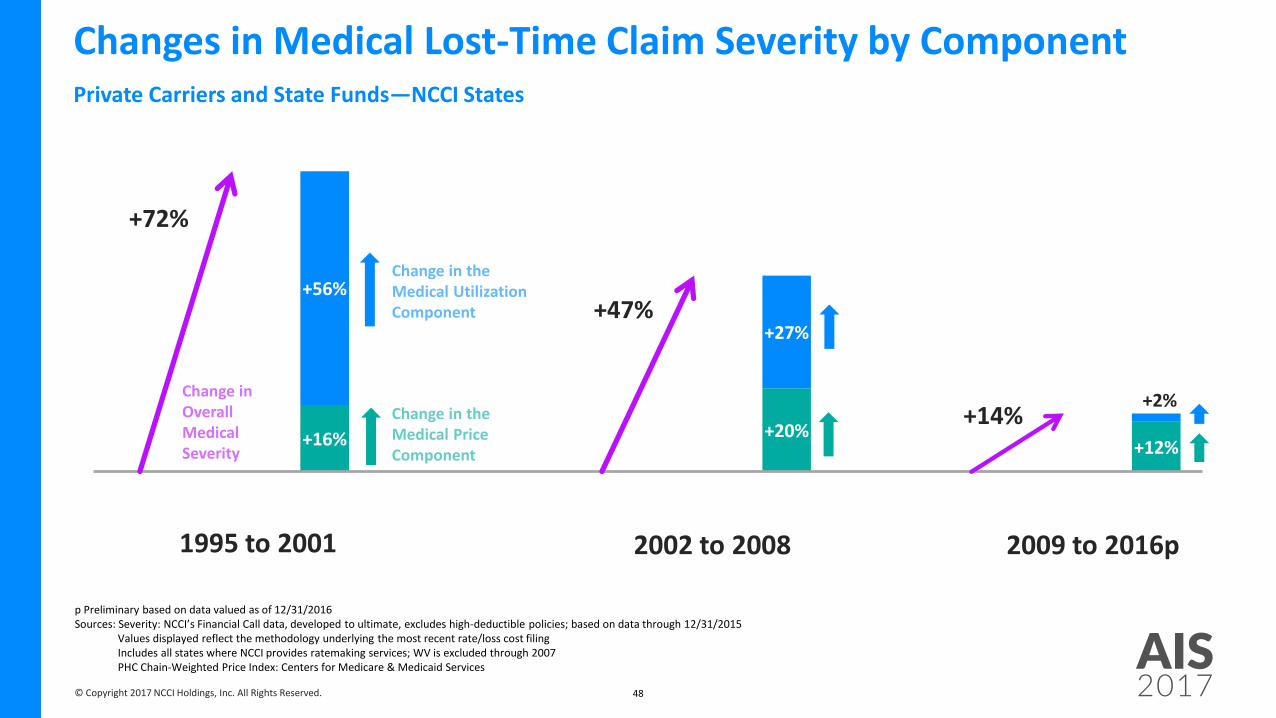
Changes in Medical Lost-Time Claim Severity by ComponentPrivate Carriers and State Funds—NCCI States
+16%
+56%
+20%
+27%
+12%
+2%
+72%
+47%
+14%
Change in theMedical UtilizationComponent
Change in OverallMedical Severity
1995 to 2001 2009 to 2016p2002 to 2008
p Preliminary based on data valued as of 12/31/2016Sources: Severity: NCCI’s Financial Call data, developed to ultimate, excludes high-deductible policies; based on data through 12/31/2015
Values displayed reflect the methodology underlying the most recent rate/loss cost filingIncludes all states where NCCI provides ratemaking services; WV is excluded through 2007PHC Chain-Weighted Price Index: Centers for Medicare & Medicaid Services
© Copyright 2017 NCCI Holdings, Inc. All Rights Reserved.
AIS201749
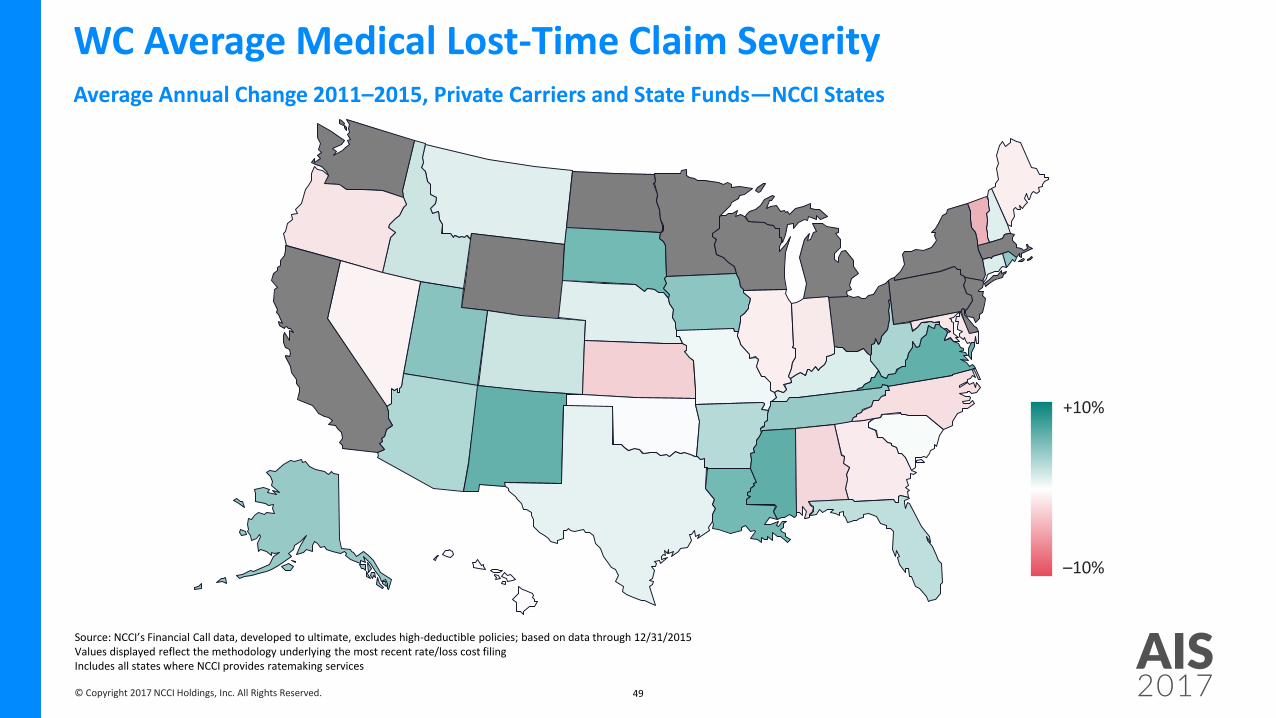
WC Average Medical Lost-Time Claim SeverityAverage Annual Change 2011–2015, Private Carriers and State Funds—NCCI States
+10%
–10%
Source: NCCI’s Financial Call data, developed to ultimate, excludes high-deductible policies; based on data through 12/31/2015Values displayed reflect the methodology underlying the most recent rate/loss cost filingIncludes all states where NCCI provides ratemaking services
© Copyright 2017 NCCI Holdings, Inc. All Rights Reserved.
AIS201750
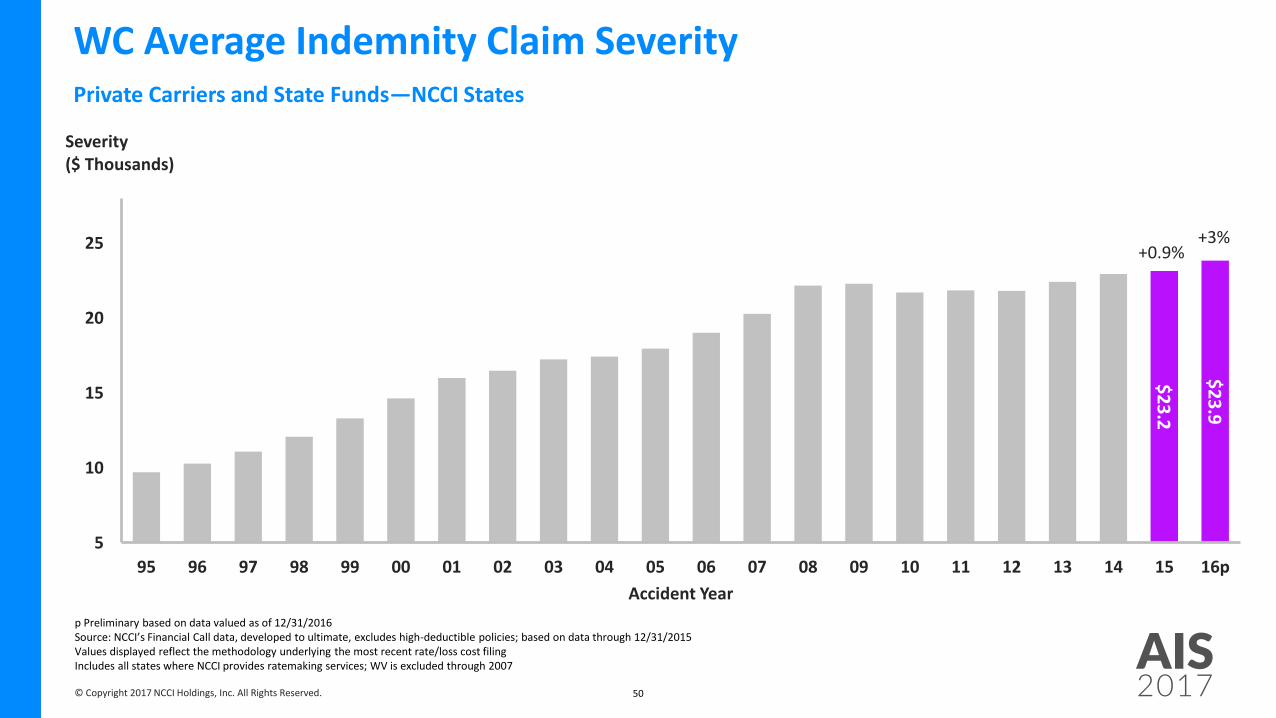
WC Average Indemnity Claim SeverityPrivate Carriers and State Funds—NCCI States
$2
3.2
$2
3.9
+0.9%+3%
5
10
15
20
25
95 96 97 98 99 00 01 02 03 04 05 06 07 08 09 10 11 12 13 14 15 16p
Severity ($ Thousands)
Accident Year
p Preliminary based on data valued as of 12/31/2016Source: NCCI’s Financial Call data, developed to ultimate, excludes high-deductible policies; based on data through 12/31/2015Values displayed reflect the methodology underlying the most recent rate/loss cost filingIncludes all states where NCCI provides ratemaking services; WV is excluded through 2007

© Copyright 2017 NCCI Holdings, Inc. All Rights Reserved.
AIS201751
WC Average Indemnity Claim SeverityPrivate Carriers and State Funds—NCCI States
95 96 97 98 99 00 01 02 03 04 05 06 07 08 09 10 11 12 13 14 15 16p
Accident Yearp Preliminary based on data valued as of 12/31/2016Sources: Severity: NCCI’s Financial Call data, developed to ultimate, excludes high-deductible policies; based on data through 12/31/2015
Values displayed reflect the methodology underlying the most recent rate/loss cost filingIncludes all states where NCCI provides ratemaking services; WV is excluded through 2007US Average Weekly Wage: 1995–2007 and 2012–2015, Quarterly Census of Employment and Wages; 2008–2011, NCCI; 2016p, NCCI and Moody’s Analytics
Cumulative Change in Indemnity Claim Severity (1995–2016p): +145%
Cumulative Change in Wage Inflation (1995–2016p): +100%

© Copyright 2017 NCCI Holdings, Inc. All Rights Reserved.
AIS201752
Relative Growth Rates—Indemnity Severity vs. Wage InflationPrivate Carriers and State Funds—NCCI States
+32%
+33%
+25%
+9%
+19%
-12%
+65%
+34%
+7%
Change inIndemnity Severity in Excess of Wage Inflation
Change in OverallIndemnity Severity
1995 to 2001 2009 to 2016p2002 to 2008
p Preliminary based on data valued as of 12/31/2016Sources: Severity: NCCI’s Financial Call data, developed to ultimate, excludes high-deductible policies; based on data through 12/31/2015
Values displayed reflect the methodology underlying the most recent rate/loss cost filingIncludes all states where NCCI provides ratemaking services; WV is excluded through 2007US Average Weekly Wage: 1995–2007 and 2012–2015, Quarterly Census of Employment and Wages; 2008–2011, NCCI; 2016p, NCCI and Moody’s Analytics

© Copyright 2017 NCCI Holdings, Inc. All Rights Reserved.
AIS201753
WC Average Indemnity Claim SeverityAverage Annual Change 2011–2015, Private Carriers and State Funds—NCCI States
Source: NCCI’s Financial Call data, developed to ultimate, excludes high-deductible policies; based on data through 12/31/2015Values displayed reflect the methodology underlying the most recent rate/loss cost filingIncludes all states where NCCI provides ratemaking services
+10%
–10%
© Copyright 2017 NCCI Holdings, Inc. All Rights Reserved.
AIS2017
ANNUALISSUES
SYMPOSIUM2017
QUESTIONS AND MORE
INFORMATION
Resources for the State of the Line Presentation
Full presentation on ncci.com
State of the Line Guide on ncci.com