annotating genes of known and unknown function by · annotating genes of known and unknown function...
TRANSCRIPT

Bioinformatics
Annotating Genes of Known and Unknown Function byLarge-Scale Coexpression Analysis1[W][OA]
Kevin Horan, Charles Jang, Julia Bailey-Serres, Ron Mittler, Christian Shelton, Jeff F. Harper,Jian-Kang Zhu, John C. Cushman, Martin Gollery, and Thomas Girke*
Department of Botany and Plant Sciences (K.H., C.J., J.B.-S., J.-K.Z., T.G.), and Department of ComputerScience and Engineering (C.S.), University of California, Riverside, California 92521; Department ofBiochemistry and Molecular Biology, University of Nevada, Reno, Nevada 89557 (R.M., J.F.H., J.C.C.);Department of Plant Science, Hebrew University of Jerusalem, Givat Ram Jerusalem 91904, Israel (R.M.);and TimeLogic, Division of Active Motif, Incline Village, Nevada 89451 (M.G.)
About 40% of the proteins encoded in eukaryotic genomes are proteins of unknown function (PUFs). Their functionalcharacterization remains one of the main challenges in modern biology. In this study we identified the PUF encoding genesfrom Arabidopsis (Arabidopsis thaliana) using a combination of sequence similarity, domain-based, and empirical approaches.Large-scale gene expression analyses of 1,310 publicly available Affymetrix chips were performed to associate the identifiedPUF genes with regulatory networks and biological processes of known function. To generate quality results, the study wasrestricted to expression sets with replicated samples. First, genome-wide clustering and gene function enrichment analysis ofclusters allowed us to associate 1,541 PUF genes with tightly coexpressed genes for proteins of known function (PKFs). Over70% of them could be assigned to more specific biological process annotations than the ones available in the current GeneOntology release. The most highly overrepresented functional categories in the obtained clusters were ribosome assembly,photosynthesis, and cell wall pathways. Interestingly, the majority of the PUF genes appeared to be controlled by the sameregulatory networks as most PKF genes, because clusters enriched in PUF genes were extremely rare. Second, large-scaleanalysis of differentially expressed genes was applied to identify a comprehensive set of abiotic stress-response genes. Thisanalysis resulted in the identification of 269 PKF and 104 PUF genes that responded to a wide variety of abiotic stresses,whereas 608 PKF and 206 PUF genes responded predominantly to specific stress treatments. The provided coexpression anddifferentially expressed gene data represent an important resource for guiding future functional characterization experimentsof PUF and PKF genes. Finally, the public Plant Gene Expression Database (http://bioweb.ucr.edu/PED) was developed aspart of this project to provide efficient access and mining tools for the vast gene expression data of this study.
Only a small percentage of the proteins encoded inanimal or plant genomes are sufficiently characterizedwith regard to their cellular functions. The functionsfor the majority of these proteins remain either com-pletely unknown (40%) or only partially understood(Gollery et al., 2006, 2007). In light of this significantknowledge deficit, our understanding about existingmolecular functions (MFs) appears to be fundamen-tally incomplete. This is even more evident when weassume that the vast space of unexplored molecularand biological functions is composed of proteins withat least comparable or even greater diversity and im-portance for cellular processes than the known space.
Efforts to narrow this knowledge gap will provide awide spectrum of opportunities for advancing ourunderstanding about plant and nonplant systems.
Two major methods are in use for defining proteinsof unknown functions (PUFs) in model organisms. Thewidely used similarity approach considers all proteinsas PUFs that show no detectable sequence or structuralsimilarities to functionally characterized proteins inreference databases (Boeckmann et al., 2003; Leinonenet al., 2004). In contrast to this, the more conservativeempirical approach defines as PUFs all proteins thatlack direct experimental evidence as support for aspecific function. Conceptually, the empirical approachincorporates most PUFs identified by the similarityapproach, as well as functionally uncharacterized se-quences that share sequence similarities with proteinsof known function (PKFs). Sequence families and or-tholog clusters are particularly affected by this funda-mental difference between the two unknown definitions.For instance, when a group of related sequences con-tains one or more members of known function, thenthe similarity approach tends to assign all of them tothe known space, whereas the empirical approachdistinguishes between functionally characterized anduncharacterized candidates within groups of related
1 This work was supported by National Science Foundationgrants 2010–0420033, 2010–0420152, and IGERT–0504249, and Na-tional Institutes of Health grant P20–RR–016464.
* Corresponding author; e-mail [email protected] author responsible for distribution of materials integral to the
findings presented in this article in accordance with the policydescribed in the Instructions for Authors (www.plantphysiol.org) is:Thomas Girke ([email protected]).
[W] The online version of this article contains Web-only data.[OA] Open Access articles can be viewed online without a sub-
scription.www.plantphysiol.org/cgi/doi/10.1104/pp.108.117366
Plant Physiology, May 2008, Vol. 147, pp. 41–57, www.plantphysiol.org � 2008 American Society of Plant Biologists 41 www.plantphysiol.orgon June 25, 2018 - Published by Downloaded from
Copyright © 2008 American Society of Plant Biologists. All rights reserved.

sequences. As a result of this difference, most similarity-based PUFs of a given genome are either singletonsor members of families that consist exclusively ofuncharacterized sequences. These performance char-acteristics of the similarity concept result in an under-estimation of the number of PUFs, because manygenes in eukaryotic organisms are members of poorlycharacterized gene families (Horan et al., 2005). Toillustrate this, all members of large families, like pro-tein kinases or cytochrome P450s, will be assigned bythe similarity approach to the known protein space,even though most of their members remain function-ally uncharacterized (Wang et al., 2003; Nelson et al.,2004; Horan et al., 2005).
Dividing gene products into only two categories ofknown and unknown sequences is an oversimplifica-tion of a complex knowledge system with incrementaland multifaceted differences. Consequently, every def-inition for drawing a strict separation line remains ar-tificial and controversial. While acknowledging thesedifficulties, this study will adopt this two-class systemmainly for practical reasons.
To advance our knowledge beyond a roadmap ofknowing what we do not know, it is important to de-velop and apply approaches for predicting putativefunctions for PUFs. Bioinformatic techniques providehere a wide spectrum of opportunities. For instance,PUFs can be associated with remotely related PKFsby using sensitive sequence and structure similaritysearch strategies (Eddy, 1996; Altschul et al., 1997). Thedetected similarities can reveal important clues fortesting their functions experimentally. Additionally,one can predict functional features from their se-quences, such as subcellular targeting signals, second-ary structures, and membrane domains (Schwackeet al., 2003; Gollery et al., 2006). Proteomics and pro-tein interaction technologies provide additional im-portant functional links (Johnson and Liu, 2006).However, for plants the required proteome resourcesare not yet available on a genome-wide level. Oneof the most promising and readily available informa-tion resources for systematic functional assignmentstudies of PUF genes represent large-scale gene ex-pression data from public microarray databases. Thesedata sets offer vast opportunities for associating PUFgenes with MFs and cellular processes of coregulatedPKF genes.
In this study we identified and analyzed thegenome-wide PUF encoding genes from Arabidopsis(Arabidopsis thaliana) using both empirical and simi-larity strategies. Large-scale analysis of publicly avail-able gene expression array data allowed us to associatePUF with PKF genes based on similarities of theirexpression and treatment response profiles. For this,cluster analysis was used to identify groups of co-regulated PUF and PKF genes based on the similarityof their expression profiles across a wide range of tis-sue and treatment samples. Subsequently, enrichmentanalysis of Gene Ontology (GO) terms was applied toannotate the obtained clusters by overrepresented
gene functions. Second, statistical analysis of differen-tially expressed genes (DEGs) allowed us to identifyPUFs that exhibit generic and specific expressionchanges in response to a large number of differentabiotic stress treatments. Finally, the Plant Gene Ex-pression Database (PED) was developed to provide tothe public efficient data mining utilities for the com-plex differential expression and clustering data of thisproject.
RESULTS AND DISCUSSION
Identification of PUFs
To obtain for this study a comprehensive set of PUFsfrom Arabidopsis, we compared three profoundlydifferent PUF identification methods. The three ap-proaches are based on GO annotations, sequence sim-ilarities, and protein domain searches.
First, we mined the GO annotations to estimate thenumber of PKFs and PUFs from a manually curatedknowledge system that combines empirical and com-putational methods for assigning gene functions(Berardini et al., 2004; Falcon and Gentleman, 2007).Alternative pathway annotation systems from KEGGand AraCyc could have been used for the same purpose(Mueller et al., 2003; Kanehisa et al., 2006). However,due to the limited number of Arabidopsis genes(,40%) assigned to pathways, the GO system, withclose to 95% genome coverage, appears to be currentlythe more efficient resource for identifying nearly com-plete PUF sets. This number includes the direct assign-ments to the root term of each ontology, which are thenew GO annotations for sequences of unknown func-tion (see ‘‘Material and Methods’’ for more details).
The evidence codes of the GO annotations specifywhich functional assignments are supported by ex-perimental evidence data from the public domain andwhich annotations are solely based on computationalprediction methods (Ashburner et al., 2000). To gaininsight into the nature of the annotations with regardto the evidence type for assigning members to theknown and unknown space, we combined in Table Ithe current set of 13 evidence codes into four customcategories. The category with the highest level of func-tional support (empirical) is based on direct evidencefrom traditional single sample experiments, the sec-ond one is based on large-scale screening data (largescale), the third one on computational predictions (se-quence), and the fourth one on the GO-based PUFentries that lack functional support from experimentsor in silico analyses. The detailed assignment schemaof the evidence codes to the four categories is providedin the legend of Table I.
According to the above strategy, 32% to 38% of theArabidopsis genes are currently annotated by the GOsystem as PUF encoding genes (Table I). This is largelyin agreement with the estimates from previous studies(Wortman et al., 2003; Gollery et al., 2006). Interestingly,
Horan et al.
42 Plant Physiol. Vol. 147, 2008 www.plantphysiol.orgon June 25, 2018 - Published by Downloaded from
Copyright © 2008 American Society of Plant Biologists. All rights reserved.
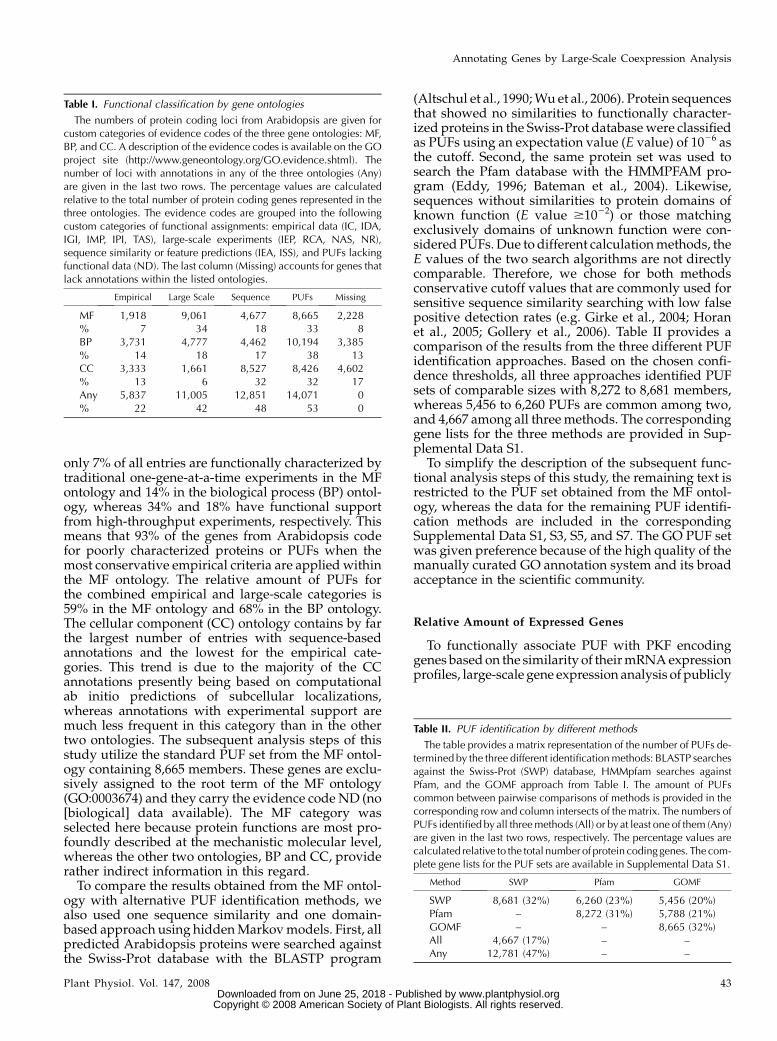
only 7% of all entries are functionally characterized bytraditional one-gene-at-a-time experiments in the MFontology and 14% in the biological process (BP) ontol-ogy, whereas 34% and 18% have functional supportfrom high-throughput experiments, respectively. Thismeans that 93% of the genes from Arabidopsis codefor poorly characterized proteins or PUFs when themost conservative empirical criteria are applied withinthe MF ontology. The relative amount of PUFs forthe combined empirical and large-scale categories is59% in the MF ontology and 68% in the BP ontology.The cellular component (CC) ontology contains by farthe largest number of entries with sequence-basedannotations and the lowest for the empirical cate-gories. This trend is due to the majority of the CCannotations presently being based on computationalab initio predictions of subcellular localizations,whereas annotations with experimental support aremuch less frequent in this category than in the othertwo ontologies. The subsequent analysis steps of thisstudy utilize the standard PUF set from the MF ontol-ogy containing 8,665 members. These genes are exclu-sively assigned to the root term of the MF ontology(GO:0003674) and they carry the evidence code ND (no[biological] data available). The MF category wasselected here because protein functions are most pro-foundly described at the mechanistic molecular level,whereas the other two ontologies, BP and CC, providerather indirect information in this regard.
To compare the results obtained from the MF ontol-ogy with alternative PUF identification methods, wealso used one sequence similarity and one domain-based approach using hidden Markov models. First, allpredicted Arabidopsis proteins were searched againstthe Swiss-Prot database with the BLASTP program
(Altschul et al., 1990; Wu et al., 2006). Protein sequencesthat showed no similarities to functionally character-ized proteins in the Swiss-Prot database were classifiedas PUFs using an expectation value (E value) of 1026 asthe cutoff. Second, the same protein set was used tosearch the Pfam database with the HMMPFAM pro-gram (Eddy, 1996; Bateman et al., 2004). Likewise,sequences without similarities to protein domains ofknown function (E value $1022) or those matchingexclusively domains of unknown function were con-sidered PUFs. Due to different calculation methods, theE values of the two search algorithms are not directlycomparable. Therefore, we chose for both methodsconservative cutoff values that are commonly used forsensitive sequence similarity searching with low falsepositive detection rates (e.g. Girke et al., 2004; Horanet al., 2005; Gollery et al., 2006). Table II provides acomparison of the results from the three different PUFidentification approaches. Based on the chosen confi-dence thresholds, all three approaches identified PUFsets of comparable sizes with 8,272 to 8,681 members,whereas 5,456 to 6,260 PUFs are common among two,and 4,667 among all three methods. The correspondinggene lists for the three methods are provided in Sup-plemental Data S1.
To simplify the description of the subsequent func-tional analysis steps of this study, the remaining text isrestricted to the PUF set obtained from the MF ontol-ogy, whereas the data for the remaining PUF identifi-cation methods are included in the correspondingSupplemental Data S1, S3, S5, and S7. The GO PUF setwas given preference because of the high quality of themanually curated GO annotation system and its broadacceptance in the scientific community.
Relative Amount of Expressed Genes
To functionally associate PUF with PKF encodinggenes based on the similarity of their mRNA expressionprofiles, large-scale gene expression analysis of publicly
Table I. Functional classification by gene ontologies
The numbers of protein coding loci from Arabidopsis are given forcustom categories of evidence codes of the three gene ontologies: MF,BP, and CC. A description of the evidence codes is available on the GOproject site (http://www.geneontology.org/GO.evidence.shtml). Thenumber of loci with annotations in any of the three ontologies (Any)are given in the last two rows. The percentage values are calculatedrelative to the total number of protein coding genes represented in thethree ontologies. The evidence codes are grouped into the followingcustom categories of functional assignments: empirical data (IC, IDA,IGI, IMP, IPI, TAS), large-scale experiments (IEP, RCA, NAS, NR),sequence similarity or feature predictions (IEA, ISS), and PUFs lackingfunctional data (ND). The last column (Missing) accounts for genes thatlack annotations within the listed ontologies.
Empirical Large Scale Sequence PUFs Missing
MF 1,918 9,061 4,677 8,665 2,228% 7 34 18 33 8BP 3,731 4,777 4,462 10,194 3,385% 14 18 17 38 13CC 3,333 1,661 8,527 8,426 4,602% 13 6 32 32 17Any 5,837 11,005 12,851 14,071 0% 22 42 48 53 0
Table II. PUF identification by different methods
The table provides a matrix representation of the number of PUFs de-termined by the three different identification methods: BLASTP searchesagainst the Swiss-Prot (SWP) database, HMMpfam searches againstPfam, and the GOMF approach from Table I. The amount of PUFscommon between pairwise comparisons of methods is provided in thecorresponding row and column intersects of the matrix. The numbers ofPUFs identified by all three methods (All) or by at least one of them (Any)are given in the last two rows, respectively. The percentage values arecalculated relative to the total number of protein coding genes. The com-plete gene lists for the PUF sets are available in Supplemental Data S1.
Method SWP Pfam GOMF
SWP 8,681 (32%) 6,260 (23%) 5,456 (20%)Pfam – 8,272 (31%) 5,788 (21%)GOMF – – 8,665 (32%)All 4,667 (17%) – –Any 12,781 (47%) – –
Annotating Genes by Large-Scale Coexpression Analysis
Plant Physiol. Vol. 147, 2008 43 www.plantphysiol.orgon June 25, 2018 - Published by Downloaded from
Copyright © 2008 American Society of Plant Biologists. All rights reserved.

available Affymetrix GeneChip microarrays was per-formed. Only experiment sets containing at least tworeplicate samples were used for this analysis to enablestatistical analysis of DEGs and to increase the confi-dence of the obtained results. In total, the study in-cluded the raw expression data from 1,310 Affymetrixchips from the AtGenExpress and Gene ExpressionOmnibus (GEO) sites (Schmid et al., 2005; Barrett et al.,2006). Table III provides a summary of the chosen ex-periment sets that covers a wide spectrum of treatmentseries and tissue samples. The complete list of the an-alyzed data is available in Supplemental Data S2.
The relative amount of expressed genes can be ex-pected to be lower in the PUF than in the PKF categorybecause many predicted PUF genes may be the result ofgenome annotation artifacts or may represent untran-scribed pseudogenes. In addition, a certain fraction ofPUF genes may be expressed below the detection limitof the GeneChip microarray technology. To estimate theextent of these limitations, the amount of detectablegenes across all experiment categories was comparedbetween the PUF and PKF sets. The present call infor-mation of the nonparametric Wilcoxon signed rank testof the MAS5 algorithm provides for this purpose rel-atively reliable estimates (Liu et al., 2002; Schmid et al.,2005; McClintick and Edenberg, 2006). According tothis test, the amount of detectable genes between thePUF and PKF sets differs 0.5% to 8% within the fivefrequency intervals plotted in Figure 1. The detaileddata set of this analysis is available in SupplementalData S3. Based on these rather small relative differ-ences, it is likely that the majority of the PUF genes areexpressed at high enough levels to obtain for themmeaningful data in the downstream cluster and differ-ential gene expression analyses of this study.
Cluster Analysis
Because many dynamic cellular processes are tightlyassociated with coordinated transcriptional changes,
cluster analysis of gene expression profiles can be usedto identify candidate sets of coregulated genes that aredirectly or indirectly involved in related processes(Steinhauser et al., 2004a; Gachon et al., 2005; Toufighiet al., 2005; Haberer et al., 2006; Jen et al., 2006;Vandepoele et al., 2006; Wei et al., 2006; Gutierrezet al., 2007). For instance, if a group of genes exhibitscorrelated expression profiles and it is significantlyenriched in genes involved in a specific process then itis reasonable to assume that some of the PUF membersof this cluster may share overlapping functions with itsfunctionally characterized members. This association-based approach was applied here on a genome-widelevel to systematically assign PUF to PKF genes basedon the similarity of their expression profiles. Despitethe great potential of this approach, it is important tokeep in mind that correlation does not prove causalrelationships. It only provides useful leads for estab-lishing hypotheses and causal links in downstreaminvestigations. Accordingly, the results of this studyneed to be interpreted as preliminary computer pre-dictions that offer useful information for guiding futuregene characterization experiments. Final evidenceabout gene and protein functions cannot be inferreddirectly from this data. Alternative network modelingapproaches were not considered for this study becauseof the lack of efficient statistical methods to efficientlyrepresent, score, and interpret the resulting networkarchitectures on a genome-wide scale (e.g. Wolfe et al.,2005; Gutierrez et al., 2007; Ma et al., 2007). At this point,the traditional clustering approach appears to be morepractical for the goals of this study.
To generate reliable and biologically relevant geneclusters form expression data, we evaluated several
Table III. Analyzed gene expression arrays
The table provides an overview of the different categories ofGeneChip microarray experiments (first column) that were analyzedin this study. The following numeric columns contain the number ofraw data (Cel) files, the amount of the corresponding biosamples(Samples), the number of performed comparisons in the DEG analysis(Comp), and the number of experiment sets (ExpSet) the raw data arederived from. A more detailed list of this data is available in Supple-mental Data S2.
Category Cel Samples Comp ExpSet
Abiotic stress 524 254 129 10Biotic stress 200 72 55 6Chemical treatment 99 46 35 9Tissue and development 237 79 40 1Genotype 86 29 28 4Hormone treatment 164 80 46 11Sum 1310 560 333 41
Figure 1. Relative amount of detectable genes. The relative amount ofpresent calls is plotted for all genes (ALL), the PKF set and the PUF setusing the five frequency intervals (bins): 0, 1 to 25, 26 to 50, 51 to 75,and 76% to 100% present calls. All experiment sets of this study wereused for generating this plot. The complete present call data set for theindividual experiment categories is available in Supplemental Data S3.
Horan et al.
44 Plant Physiol. Vol. 147, 2008 www.plantphysiol.orgon June 25, 2018 - Published by Downloaded from
Copyright © 2008 American Society of Plant Biologists. All rights reserved.

available clustering algorithms (e.g. K-means, self-organizing maps) and selected agglomerative hierar-chical clustering as the method of choice (Murtagh,1985; Eisen et al., 1998; de Hoon et al., 2004; R Devel-opment Core Team, 2006). The hierarchical clusteringmethod was chosen because of three main advantages:(1) the method requires no prior knowledge about theoptimum number of the final clusters, (2) it is extremelyrobust in joining highly similar items into proper sim-ilarity groups, and (3) it provides an information-richdata output that represents the relative distances be-tween all clustered items in a dendrogram (Becker et al.,1988). The main disadvantages of the approach are thecomplexity of its data output, the lack of predefinedboundaries between clusters, and its weaker perfor-mance in identifying local expression similarities in asmall subset of the samples (Prelic et al., 2006). How-ever, most of these challenges can be overcome byapplying efficient postprocessing methods of the ob-tained dendrograms, such as tree cutting methods(Gutierrez et al., 2007). Popular fuzzy clustering ap-proaches (Krishnapuram et al., 2001) that allow member-ships in several clusters—as opposed to strict clusteringwith unique memberships—were not considered forthis study because it is difficult to efficiently prioritizeand mine the complex cluster memberships from thesemethods in the downstream functional analysis steps.As an implementation of the hierarchical clusteringalgorithm, we used the hclust function (Murtagh, 1985)from the statistical programming environment R (RDevelopment Core Team, 2006). As distance measure-ment we used correlation coefficients and as the clusterjoining method complete linkage (see ‘‘Material andMethods’’ for more details). To obtain discrete clustersfrom the resulting dendrograms, we developed for thisstudy a novel, to our knowledge, hierarchical thresholdclustering (HTC) method. The corresponding R script isavailable in Supplemental Data S10. This method se-lects clusters in hierarchical clustering dendrogramsbased on a maximum tolerable distance between clus-ter members by applying an all-against-all distance teston all possible subtrees, while maintaining uniquecluster memberships. As the threshold we chose forthis step a minimum correlation coefficient of 0.6. Thisrelatively conservative HTC setting ensures that allmembers of any given cluster share with all othermembers of the same cluster correlation coefficientsbetween the selected cutoff of 0.6 and the highestpossible value of 1.0. The exact cutoff value of 0.6 waschosen because it resulted in the highest enrichment offunctionally related genes compared to alternativecutoff settings (Supplemental Data S4). Additionally,other gene expression correlation studies have used thesame or very similar cutoff values (Haberer et al., 2006;Wei et al., 2006).
Applying the above strategy, we calculated fourseparate clustering data sets using both the Pearsoncorrelation coefficients (PCC) and the Spearman corre-lation coefficients (SCC), in their signed and absoluteforms as distance measures. The following text will
refer to the four methods as PCC, SCC, PCCa, andSCCa, respectively (Supplemental Data S5). All fourdata sets were generated because of their complemen-tary performance characteristics. The clustering withabsolute correlation values allows the identification ofpositively and negatively correlated gene expressions,whereas the sign-specific approach joins only posi-tively correlated items into similarity groups. The rank-based Spearman approach is limited to identifyingglobal similarities in expression profiles, whereas thePearson approach is very sensitive in detecting bothglobal and local similarities. In particular, the latterdetects local similarities with wide amplitude changesrelative to the background, which can result in extremecases in coclustering of outliers. A consensus approachbetween several or all methods was not consideredbecause such a strategy would artificially deflate thecluster sizes and compromise the transparency of theresults.
The distributions of the obtained numbers of clustersincluding their sizes from the four clustering methodsare summarized in Figure 2. Because the sign removalincreases the potential pool sizes of gene pairs withcorrelation values above a given cutoff, one wouldexpect larger cluster sizes for the data sets with absolutecorrelation values compared to their signed counter-parts. This trend can be observed in the many individ-ual clusters in Supplemental Data S5, but the effect isnot very pronounced in the global representation ofFigure 2. These relative increases in cluster sizes are notas frequent as expected because of two main reasons.First, the number of highly negatively correlated gene
Figure 2. Cluster distributions. The numbers of clusters (A) and genes(B) are plotted for the cluster size intervals (bins) that are given along theabscissa. Each set of four bars, from left to right, contains the data for theclustering results using PCC, absolute PCC, SCC, and absolute SCCvalues as distance measures, respectively.
Annotating Genes by Large-Scale Coexpression Analysis
Plant Physiol. Vol. 147, 2008 45 www.plantphysiol.orgon June 25, 2018 - Published by Downloaded from
Copyright © 2008 American Society of Plant Biologists. All rights reserved.

pairs is much smaller than the number of positivelycorrelated gene pairs (data not shown; compare Habereret al. [2006]). Second, the assignment of a negativelycorrelated gene to a cluster at an earlier stage of thehierarchical clustering process can prevent other po-tential members from joining the same cluster at a givencutoff level, if they do not share the required degree ofcorrelation with the existing members. This is particu-larly the case in combination with a complete linkagejoining method that was chosen for this study to min-imize the number of false positive members in thegenerated clusters.
The most obvious differences among the four clus-tering data sets in Figure 2 are the numbers of singletgenes that do not join any clusters in the differentmethods. There are about 2,000 fewer singlet genes inthe Pearson than in the Spearman data sets. This isexpected because the latter method tends to generateslightly lower correlation values on gene expressiondata. Due to space restrictions, the subsequent textfocuses on the clustering results from the distancemethod with the signed PCC, whereas the results forthe other three methods are included in SupplementalData S5. In addition, the clustering data for individualgenes are available in the associated public database ofthis study (see below).
Functional Categorization of Gene Expression Clusters
Gene expression clusters with highly enriched func-tions provide more conclusive information about thepotential roles of their PUF encoding members thanclusters with very heterogeneous compositions. Tofunctionally annotate the obtained clusters and to selectthe most informative gene sets with overrepresentedgene functions, we performed enrichment analysis ofGO terms using the hypergeometric distribution as astatistical test (Falcon and Gentleman, 2007). Thismethod computes the enrichment test for all approxi-mately 18,000 GO nodes of the three ontology networksand ranks the results by P values (see ‘‘Material andMethods’’; Supplemental Data S9). The results of thismethod are more comprehensive and informative thangeneralized functional categorization systems, like GOslim or high-level pathway classification systems. Clus-ters with fewer than five members were excluded fromthis analysis because the predictive value of extremelysmall clusters is rather limited. The complete result setof this enrichment analysis is available in SupplementalData S6. It contains the data for 916 clusters composedof a total of 11,077 genes. To prioritize the clusters basedon the obtained enrichment data, we applied twoselection filters. First, each cluster of interest neededto contain at least one overrepresented GO term in oneof three ontologies (enrichment filter). Second, at least20% of the cluster members had to be associated withthis GO term to select clusters with relatively homoge-neous compositions (uniformity filter). An overview ofthe number of clusters that meet these filter criteria isprovided in Table IV. It contains the results for four
different P-value cutoffs of the GO term enrichmentfilter ranging from 0.05 to 1026. The corresponding GOannotations for the prioritized cluster set that passedthe most stringent selection criteria of 1026 are listed inTable V. For space and readability reasons, the tablepresents only the highest ranking GO term for each ofthe three ontologies. The full set of GO annotations canbe found in Supplemental Data S6. The followingdiscussion of selected clusters is restricted to thismost conservative data set (Table V). It contains 66clusters with a total of 1,279 genes that include 277 PUFgenes derived from 53 clusters (see Table IV). Our focuson these clusters does not indicate that the other clus-ters of this study are biologically less important. Thisselection is mainly based on the assumption that clus-ters with uniform GO annotations are particularlyinformative for functionally associating PUF withPKF genes.
Depending on the stringency of the applied prioriti-zation filters listed in Table IV, our combined clusteringand GO term enrichment strategy associated 277 to1,541 PUF genes to overrepresented GO annotations. Incomparison to the GO annotations currently availablefor these PUF genes, our method associated 216 to 1,050of them to more specific GO terms in the MF category,225 to 1,089 in the BP category, and 239 to 1,096 in theCC category (Supplemental Data S6). The large numberof PUF genes associated with functionally informativeannotations demonstrates the great potential of ourapproach for guiding future experimental studies onthese genes.
Based on enrichment P values, the most highlyoverrepresented functional categories in the obtainedcluster set are the BPs: ribosome assembly, photosyn-thesis pathways, and cell wall metabolism (Table V).This finding is largely in agreement with related gene
Table IV. Overview of GO term enrichment analysis
The amounts of clusters and genes are provided for different clusterprioritization filters that were applied to the GO term enrichment dataof Supplemental Data S6. The values in parentheses represent thecorresponding number of clusters containing PUF genes and thenumber of PUF genes in these clusters, respectively. The first rowcontains the counts for the unfiltered data set that considered onlyclusters with five or more members. The subsequent rows refer to thecounts after applying the following two-component filter with fourdifferent stringency settings. (1) To select clusters with enriched GOterms, the clusters had to contain one or more overrepresented GOterms in at least one of the three ontologies based on the Bonferronicorrected P values of the enrichment analysis. The four different P-valuecutoffs used for this filter are given in the first column. (2) In addition,$20% of the cluster members needed to be associated with theselected GO term to favor functionally homogeneous clusters.
Filter Clusters Genes
None 916 (794) 11,077 (2,884)0.05 519 (429) 6,262 (1,541)0.01 373 (301) 4,893 (1,126)0.001 212 (170) 3,315 (744)1E-06 66 (53) 1,279 (277)
Horan et al.
46 Plant Physiol. Vol. 147, 2008 www.plantphysiol.orgon June 25, 2018 - Published by Downloaded from
Copyright © 2008 American Society of Plant Biologists. All rights reserved.
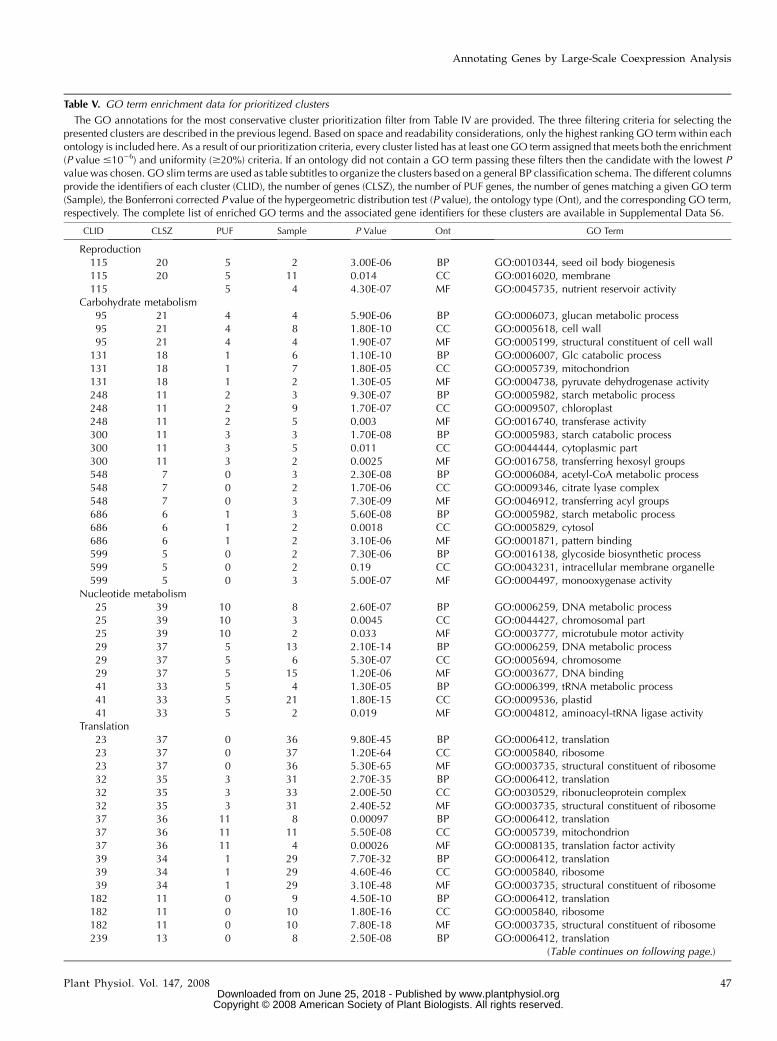
Table V. GO term enrichment data for prioritized clusters
The GO annotations for the most conservative cluster prioritization filter from Table IV are provided. The three filtering criteria for selecting thepresented clusters are described in the previous legend. Based on space and readability considerations, only the highest ranking GO term within eachontology is included here. As a result of our prioritization criteria, every cluster listed has at least one GO term assigned that meets both the enrichment(P value #1026) and uniformity ($20%) criteria. If an ontology did not contain a GO term passing these filters then the candidate with the lowest Pvalue was chosen. GO slim terms are used as table subtitles to organize the clusters based on a general BP classification schema. The different columnsprovide the identifiers of each cluster (CLID), the number of genes (CLSZ), the number of PUF genes, the number of genes matching a given GO term(Sample), the Bonferroni corrected P value of the hypergeometric distribution test (P value), the ontology type (Ont), and the corresponding GO term,respectively. The complete list of enriched GO terms and the associated gene identifiers for these clusters are available in Supplemental Data S6.
CLID CLSZ PUF Sample P Value Ont GO Term
Reproduction115 20 5 2 3.00E-06 BP GO:0010344, seed oil body biogenesis115 20 5 11 0.014 CC GO:0016020, membrane115 5 4 4.30E-07 MF GO:0045735, nutrient reservoir activity
Carbohydrate metabolism95 21 4 4 5.90E-06 BP GO:0006073, glucan metabolic process95 21 4 8 1.80E-10 CC GO:0005618, cell wall95 21 4 4 1.90E-07 MF GO:0005199, structural constituent of cell wall
131 18 1 6 1.10E-10 BP GO:0006007, Glc catabolic process131 18 1 7 1.80E-05 CC GO:0005739, mitochondrion131 18 1 2 1.30E-05 MF GO:0004738, pyruvate dehydrogenase activity248 11 2 3 9.30E-07 BP GO:0005982, starch metabolic process248 11 2 9 1.70E-07 CC GO:0009507, chloroplast248 11 2 5 0.003 MF GO:0016740, transferase activity300 11 3 3 1.70E-08 BP GO:0005983, starch catabolic process300 11 3 5 0.011 CC GO:0044444, cytoplasmic part300 11 3 2 0.0025 MF GO:0016758, transferring hexosyl groups548 7 0 3 2.30E-08 BP GO:0006084, acetyl-CoA metabolic process548 7 0 2 1.70E-06 CC GO:0009346, citrate lyase complex548 7 0 3 7.30E-09 MF GO:0046912, transferring acyl groups686 6 1 3 5.60E-08 BP GO:0005982, starch metabolic process686 6 1 2 0.0018 CC GO:0005829, cytosol686 6 1 2 3.10E-06 MF GO:0001871, pattern binding599 5 0 2 7.30E-06 BP GO:0016138, glycoside biosynthetic process599 5 0 2 0.19 CC GO:0043231, intracellular membrane organelle599 5 0 3 5.00E-07 MF GO:0004497, monooxygenase activity
Nucleotide metabolism25 39 10 8 2.60E-07 BP GO:0006259, DNA metabolic process25 39 10 3 0.0045 CC GO:0044427, chromosomal part25 39 10 2 0.033 MF GO:0003777, microtubule motor activity29 37 5 13 2.10E-14 BP GO:0006259, DNA metabolic process29 37 5 6 5.30E-07 CC GO:0005694, chromosome29 37 5 15 1.20E-06 MF GO:0003677, DNA binding41 33 5 4 1.30E-05 BP GO:0006399, tRNA metabolic process41 33 5 21 1.80E-15 CC GO:0009536, plastid41 33 5 2 0.019 MF GO:0004812, aminoacyl-tRNA ligase activity
Translation23 37 0 36 9.80E-45 BP GO:0006412, translation23 37 0 37 1.20E-64 CC GO:0005840, ribosome23 37 0 36 5.30E-65 MF GO:0003735, structural constituent of ribosome32 35 3 31 2.70E-35 BP GO:0006412, translation32 35 3 33 2.00E-50 CC GO:0030529, ribonucleoprotein complex32 35 3 31 2.40E-52 MF GO:0003735, structural constituent of ribosome37 36 11 8 0.00097 BP GO:0006412, translation37 36 11 11 5.50E-08 CC GO:0005739, mitochondrion37 36 11 4 0.00026 MF GO:0008135, translation factor activity39 34 1 29 7.70E-32 BP GO:0006412, translation39 34 1 29 4.60E-46 CC GO:0005840, ribosome39 34 1 29 3.10E-48 MF GO:0003735, structural constituent of ribosome
182 11 0 9 4.50E-10 BP GO:0006412, translation182 11 0 10 1.80E-16 CC GO:0005840, ribosome182 11 0 10 7.80E-18 MF GO:0003735, structural constituent of ribosome239 13 0 8 2.50E-08 BP GO:0006412, translation
(Table continues on following page.)
Annotating Genes by Large-Scale Coexpression Analysis
Plant Physiol. Vol. 147, 2008 47 www.plantphysiol.orgon June 25, 2018 - Published by Downloaded from
Copyright © 2008 American Society of Plant Biologists. All rights reserved.

Table V. (Continued from previous page.)
CLID CLSZ PUF Sample P Value Ont GO Term
239 13 0 6 3.30E-08 CC GO:0005840, ribosome239 13 0 6 8.40E-08 MF GO:0003735, structural constituent of ribosome299 11 1 7 3.40E-07 BP GO:0006412, translation299 11 1 7 2.40E-11 CC GO:0005840, ribosome299 11 1 7 2.40E-11 MF GO:0003735, structural constituent of ribosome
Lipid metabolism73 26 8 6 1.80E-14 BP GO:0019915, sequestering of lipid73 26 8 7 6.50E-09 CC GO:0005576, extracellular region73 26 8 4 1.60E-06 MF GO:0045735, nutrient reservoir activity
279 10 2 2 9.30E-06 BP GO:0019374, galactolipid metabolic process279 10 2 2 0.01 CC GO:0031967, organelle envelope279 10 2 5 1.90E-07 MF GO:0042578, phosphoric ester hydrolase activity
Transport47 34 8 2 0.00042 BP GO:0045036, protein targeting to chloroplast47 34 8 23 2.20E-17 CC GO:0009536, plastid47 34 8 8 1 MF GO:0003674, MF (PUF term)
288 11 4 3 2.40E-07 BP GO:0045036, protein targeting to chloroplast288 11 4 4 1.10E-07 CC GO:0009941, chloroplast envelope288 11 4 2 0.016 MF GO:0022804, transmembrane transporter activity536 7 0 5 9.20E-06 BP GO:0006810, transport536 7 0 5 3.60E-09 CC GO:0005794, Golgi apparatus536 7 0 4 7.20E-05 MF GO:0005215, transporter activity708 6 1 3 4.70E-08 BP GO:0006606, protein import into nucleus708 6 1 3 6.40E-07 CC GO:0005635, nuclear envelope708 6 1 3 2.30E-06 MF GO:0008565, protein transporter activity765 5 1 2 3.20E-05 BP GO:0006820, anion transport765 5 1 2 2.10E-05 CC GO:0005741, mitochondrial outer membrane765 5 1 2 8.80E-07 MF GO:0008308, voltage-gated ion channel activity
Biological process17 43 26 28 1.10E-08 BP GO:0008150, BP (PUF term)17 43 26 23 1.50E-05 CC GO:0005575, CC (PUF term)17 43 26 26 2.70E-09 MF GO:0003674, MF (PUF term)
Photosynthesis4 134 43 28 2.20E-37 BP GO:0015979, photosynthesis4 134 43 67 1.30E-89 CC GO:0044436, thylakoid part4 134 43 2 0.00058 MF GO:0010242, oxygen evolving activity9 88 18 6 2.00E-05 BP GO:0015979, photosynthesis9 88 18 47 4.20E-30 CC GO:0009507, chloroplast9 88 18 2 7.00E-04 MF GO:0004045, aminoacyl-tRNA hydrolase activity
45 32 5 7 2.90E-10 BP GO:0015979, photosynthesis45 32 5 21 3.10E-16 CC GO:0009507, chloroplast45 32 5 5 1 MF GO:0003674, MF (PUF term)
110 20 6 3 8.00E-05 BP GO:0015979, photosynthesis110 20 6 12 9.00E-10 CC GO:0009507, chloroplast110 20 6 2 0.00093 MF GO:0004176, ATP-dependent peptidase activity304 9 2 7 1.60E-15 BP GO:0015979, photosynthesis304 9 2 5 1.90E-11 CC GO:0009523, PSII304 9 2 3 5.10E-07 MF GO:0046906, tetrapyrrole binding428 8 2 2 0.024 BP GO:0006091, generation of metabolites and energy428 8 2 6 5.10E-07 CC GO:0005739, mitochondrion428 8 2 2 1.80E-06 MF GO:0004449, isocitrate dehydrogenase activity555 5 1 3 1.20E-06 BP GO:0015979, photosynthesis555 5 1 3 3.80E-10 CC GO:0009502, photosynthetic electron transport chain555 5 1 3 3.30E-06 MF GO:0009055, electron carrier activity923 5 2 3 5.20E-08 BP GO:0009853, photorespiration923 5 2 3 3.90E-08 CC GO:0030964, NADH dehydrogenase complex923 5 2 2 0.0047 MF GO:0003735, structural constituent of ribosome
Cell organization and biogenesis77 24 5 6 4.20E-15 BP GO:0009834, secondary cell wall biogenesis77 24 5 3 0.011 CC GO:0031225, anchored to membrane77 24 5 6 1.70E-05 MF GO:0016757, transferring glycosyl groups
(Table continues on following page.)
Horan et al.
48 Plant Physiol. Vol. 147, 2008 www.plantphysiol.orgon June 25, 2018 - Published by Downloaded from
Copyright © 2008 American Society of Plant Biologists. All rights reserved.

Table V. (Continued from previous page.)
CLID CLSZ PUF Sample P Value Ont GO Term
108 18 7 2 0.00084 BP GO:0009831, cellulose and pectin modification108 18 7 18 1.30E-09 CC GO:0016020, membrane108 18 7 2 0.0076 MF GO:0008289, lipid binding349 9 0 7 1.00E-15 BP GO:0009664, cellulose and pectin biogenesis349 9 0 6 0.00028 CC GO:0012505, endomembrane system349 9 0 7 7.60E-19 MF GO:0005199, structural constituent of cell wall953 5 1 2 9.70E-07 BP GO:0010020, chloroplast fission953 5 1 2 0.029 CC GO:0009507, chloroplast953 5 1 4 0.044 MF GO:0005488, binding
Secondary metabolism12 73 13 3 0.0076 BP GO:0046148, pigment biosynthetic process12 73 13 34 1.30E-18 CC GO:0009536, plastid12 73 13 3 0.00059 MF GO:0003746, translation elongation factor activity
143 17 2 4 8.70E-08 BP GO:0046148, pigment biosynthetic process143 17 2 8 1.40E-05 CC GO:0009536, plastid143 17 2 5 0.0023 MF GO:0016491, oxidoreductase activity347 10 2 3 1.20E-07 BP GO:0009686, GA biosynthetic process347 10 2 4 0.95 CC GO:0005575, CC (PUF term)347 10 2 5 1.80E-10 MF GO:0016706, oxidoreductase activity432 8 1 5 6.00E-13 BP GO:0009813, flavonoid biosynthetic process432 8 1 2 0.00017 CC GO:0009705, membrane of vacuole432 8 1 2 0.00023 MF GO:0016706, oxidoreductase activity600 5 0 2 9.30E-07 BP GO:0009718, anthocyanin biosynthetic process600 5 0 2 0.63 CC GO:0005575, CC (PUF term)600 5 0 4 0.00049 MF GO:0016740, transferase activity
Response to stimulus68 22 3 7 5.40E-07 BP GO:0006952, defense response68 22 3 11 0.02 CC GO:0016020, membrane68 22 3 5 1.10E-06 MF GO:0004888, transmembrane receptor activity85 23 9 10 6.70E-18 BP GO:0009408, response to heat85 23 9 10 0.21 CC GO:0005575, CC (PUF term)85 23 9 2 0.043 MF GO:0005516, calmodulin binding90 22 5 6 1.60E-09 BP GO:0009408, response to heat90 22 5 5 0.04 CC GO:0005634, nucleus90 22 5 3 0.00052 MF GO:0051082, unfolded protein binding
346 10 3 2 0.03 BP GO:0009628, response to abiotic stimulus346 10 3 9 6.20E-08 CC GO:0009536, plastid346 10 3 3 0.57 MF GO:0003674, MF (PUF term)356 9 9 8 1.10E-15 BP GO:0009733, response to auxin stimulus356 9 9 3 0.021 CC GO:0043231, intracellular membrane-bound organelle356 9 9 9 7.70E-05 MF GO:0003674, MF (PUF term)480 8 1 3 3.80E-05 BP GO:0006979, response to oxidative stress480 8 1 7 1.10E-08 CC GO:0005739, mitochondrion480 8 1 2 7.20E-05 MF GO:0046933, hydrogen ion transporting ATP synthase586 7 1 3 4.20E-05 BP GO:0009737, response to abscisic acid stimulus586 7 1 2 0.00013 CC GO:0008287, Ser/Thr phosphatase complex586 7 1 3 5.50E-07 MF GO:0015071, protein phosphatase type 2C activity748 5 0 3 6.50E-08 BP GO:0009404, toxin metabolic process748 5 0 4 0.01 CC GO:0005737, cytoplasm748 5 0 3 6.90E-08 MF GO:0004364, glutathione transferase activity912 5 0 4 7.30E-08 BP GO:0006457, protein folding912 5 0 3 1.80E-06 CC GO:0009532, plastid stroma912 5 0 3 1.20E-06 MF GO:0051082, unfolded protein binding
Physiological process36 34 6 15 0.0011 BP GO:0043170, macromolecule metabolic process36 34 6 11 2.00E-08 CC GO:0043228, nonmembrane-bound organelle36 34 6 7 3.50E-06 MF GO:0003735, structural constituent of ribosome81 24 8 3 0.0011 BP GO:0051188, cofactor biosynthetic process81 24 8 14 6.70E-08 CC GO:0009536, plastid81 24 8 8 1 MF GO:0003674, MF (PUF term)
130 15 1 3 3.80E-07 BP GO:0010119, regulation of stomatal movement(Table continues on following page.)
Annotating Genes by Large-Scale Coexpression Analysis
Plant Physiol. Vol. 147, 2008 49 www.plantphysiol.orgon June 25, 2018 - Published by Downloaded from
Copyright © 2008 American Society of Plant Biologists. All rights reserved.

coregulation studies in Arabidopsis (Haberer et al.,2006; Wei et al., 2006). With regard to ribosome assem-bly, 124 of the 410 GO annotated genes for cytosolic,plastidial, and mitochondrial ribosome componentsappear in seven clusters (see Table V; cluster identifiers23, 32, 37, 39, 182, 239, and 299); 272 ribosomal genesappear in clusters with five or more members of thenonprioritized data set. Although cluster 23 consistsexclusively of genes annotated as ribosomal genes(GO:0005840; P value 1.2 3 10264), the other six clus-ters are highly enriched in ribosomal genes and theycontain among others 16 PUF genes. Equally interest-ing is the observation that photosynthesis-related an-notations are highly overrepresented in five largeclusters (cluster identifiers 4, 9, 45, 110, and 304).These clusters represent 51 of all the 121 genes that arecurrently annotated by the GO system as photosyn-thesis components (GO:0015979). Because both pro-cesses, photosynthesis as well as ribosomal activities,require the coordinated assembly of many proteins tolarge complexes and protein-protein interaction net-works, it is not unexpected that their correspondinggenes are tightly coregulated. In alignment with the
association hypothesis of this study, several of thePUF members in these functionally extremely uniformclusters may be involved in processes that are con-nected to the enzymatic or regulatory networks ofphotosynthesis and ribosomal activities.
Interestingly, our method also identified a cluster(identifier 77) that is highly enriched in cell wall-relatedannotations (e.g. GO:0009834; P value 4.2 3 10215), suchas cellulase synthase genes. A very similar cluster ofgenes was recently described and experimentally ver-ified by two groups (Brown et al., 2005; Persson et al.,2005) who specifically mined public expression data forgenes that are coregulated with the cellulose synthasegenes CESA4, CESA7, and CESA8. In addition, compa-rable results were described by Jen et al. (2006). Thisexample demonstrates that our genome-wide expres-sion clustering approach generates biologically mean-ingful data. An additional interesting cell wall-relatedcluster is cluster 349 that contains eight genes for Pro-rich extensin domain proteins.
The majority of the clusters in our data set containone or more PUF genes (Table IV), but only a few of thelarger clusters consist predominantly of PUF genes.
Table V. (Continued from previous page.)
CLID CLSZ PUF Sample P Value Ont GO Term
130 15 1 2 1 CC GO:0005575, CC (PUF term)130 15 1 5 0.041 MF GO:0016787, hydrolase activity134 17 7 12 1.10E-20 BP GO:0006511, ubiquitin-dependent catabolic process134 17 7 12 1.70E-28 CC GO:0000502, proteasome complex134 17 7 7 6.50E-08 MF GO:0008233, peptidase activity199 13 1 9 3.90E-07 BP GO:0009058, biosynthetic process199 13 1 6 5.60E-12 CC GO:0044445, cytosolic part199 13 1 6 2.10E-08 MF GO:0003735, structural constituent of ribosome224 12 3 2 0.045 BP GO:0044249, cellular biosynthetic process224 12 3 8 1.00E-07 CC GO:0009507, chloroplast224 12 3 2 0.043 MF GO:0003723, RNA binding293 11 3 2 0.00012 BP GO:0042775, ATP synthesis coupled electron transport293 11 3 9 3.80E-11 CC GO:0005739, mitochondrion293 11 3 3 2.10E-05 MF GO:0015078, hydrogen ion transmembrane transporter366 8 1 3 7.90E-06 BP GO:0006457, protein folding366 8 1 6 4.50E-10 CC GO:0005783, endoplasmic reticulum366 8 1 2 0.0016 MF GO:0031072, heat shock protein binding406 9 1 4 1.00E-06 BP GO:0006511, ubiquitin-dependent protein catabolic406 9 1 4 6.20E-09 CC GO:0000502, proteasome complex406 9 1 3 0.00063 MF GO:0008233, peptidase activity520 7 0 2 3.00E-06 BP GO:0006121, mitochondrial electron transport520 7 0 2 3.40E-06 CC GO:0045273, respiratory chain complex II520 7 0 3 4.90E-07 MF GO:0016627, oxidoreductase for CH-CH groups728 6 0 6 5.50E-12 CC GO:0005783, endoplasmic reticulum728 6 0 2 0.0051 MF GO:0008233, peptidase activity790 5 1 3 8.60E-06 BP GO:0006511, ubiquitin-dependent catabolic process790 5 1 3 1.10E-08 CC GO:0005839, proteasome core complex790 5 1 3 0.00012 MF GO:0008233, peptidase activity895 5 0 5 0.0099 BP GO:0008152, metabolic process895 5 0 5 2.20E-07 CC GO:0005739, mitochondrion895 5 0 2 9.50E-08 MF GO:0004774, succinate-CoA ligase activity943 5 2 2 0.029 BP GO:0009058, biosynthetic process943 5 2 4 4.70E-07 CC GO:0005783, endoplasmic reticulum943 5 2 2 0.44 MF GO:0003674, MF (PUF term)
Horan et al.
50 Plant Physiol. Vol. 147, 2008 www.plantphysiol.orgon June 25, 2018 - Published by Downloaded from
Copyright © 2008 American Society of Plant Biologists. All rights reserved.

Cluster 17 represents an exception to this rule. The 43members of this cluster contain 26 PUF genes, and itscharacterized members show no clear enrichment ofspecific functions. Based on the high abundance ofPUF genes in the entire data set (approximately 32%),PUF-gene-enriched clusters occur much less frequentthan those enriched in PKF genes; clusters consistingexclusively of PUF genes are entirely absent (Table IV).One explanation for this difference could be that theexpression of most PUF genes is controlled by thesame regulatory networks as many PKF genes. If thisis the case, PUF genes are more likely to appear inexpression clusters together with PKF genes thanwithout them.
Our method also identified clusters that are enrichedin abiotic stress-response annotations. For instance,clusters 85 and 912 are highly enriched in heat stress-related genes (GO:0009408; P values 6.7 3 10218 and1.8 3 1026). Interestingly, 10 of the 23 members in thecluster 85 were identified by the subsequent DEGanalysis of this study as genes that respond specificallyto heat stress and to a much lesser extent to other typesof abiotic stresses (see Supplemental Data S7). Based onthe available coexpression data, the nine PUF genes ofthis cluster are now excellent candidates for discover-ing novel gene functions involved in heat stress-response pathways. Additionally, this example illustratesthat the two chosen approaches of this study, expres-sion clustering and DEG analysis, complement andconfirm each other. The hypoxia cluster 203 is anotherinteresting abiotic stress cluster (Supplemental Data S6;Fukao and Bailey-Serres, 2004). This cluster does notappear in the most stringently prioritized data set(Table V), because it did not pass the applied uniformityfilter. Nevertheless, it is enriched in hypoxia-responsivegenes (cluster identifier 203; GO:0001666; P value 2.0 31025), and it contains several members that are in-volved in cellular respiration processes, such as genesfor the alcohol dehydrogenase ADH1 (AT1G77120), apyruvate dehydrogenase (AT4G33070), and a hemo-globin-like oxygen binding protein that affects ATPlevels under hypoxia (AT2G16060; Hebelstrup et al.,2007). Whether the five PUF genes of this cluster arealso involved in hypoxia-response processes can beaddressed in experimental studies.
In conclusion, the combined clustering and genefunction enrichment strategy allowed us to associate aconsiderable fraction of the PUF encoding gene poolwith tightly coexpressed gene sets of known function.Depending on the chosen stringency settings, the ap-proach allowed us to assign 277 to 1,541 PUF genes(Table IV) to more specific GO terms than those avail-able in the latest GO annotation release for Arabidopsis.
Analysis of DEGs
DEG analysis can identify groups of genes that ex-hibit expression changes in response to specific treat-ments or cellular changes. Because this information isnot easily obtainable from clustering of global expres-
sion profiles, DEG analysis of publicly available ex-pression data complements the previous approach byassociating PUF with PKF encoding genes based oncommon differential expression responses to environ-mental changes, such as abiotic stresses. If a group ofgenes shares similar expression patterns across a widespectrum of treatments then it is likely that certainmembers are involved in similar or connected responsepathways to these perturbations. The association ofgenes with these response mechanisms can providevaluable information for future functional characteri-zation experiments of PUF or PKF genes.
One of the main challenges of performing system-atic DEG analyses on large and diverse gene expres-sion data sets from public sources is the identificationof the given design parameters to determine for eachexperiment set its biologically most meaningful anal-ysis strategy. This step is extremely crucial becauseevery analysis needs to focus on the specific treatmentfactors of an experiment. The alternative of perform-ing simply all possible comparisons will providemeaningless results for many experimental designsbecause it would generate a large number of illegiti-mate contrasts between biologically incomparablesamples. To define reasonable analysis strategies forpublic GeneChip microarray expression data sets, alltheir replicates and the most useful sample compari-sons need to be determined manually to provide theproper experimental design parameters to the down-stream statistical methods for identifying DEGs. TheMIAME and MGED ontology annotations (Brazmaet al., 2001; Whetzel et al., 2006) of the public micro-array depositories provide the essential informationabout the experiments, but efficient facilities to com-pletely automate the DEG analyses on a large scale arenot available at this point.
To perform large-scale DEG analysis of public ex-pression data, we chose for this study a human-supervised analysis strategy, in which we determinedfor each experiment set its optimum analysis param-eters. The goal of this analysis was to identify all PUFand PKF genes that respond to specific or a wide rangeof conditions by enumerating their significant expres-sion modulations in the corresponding experimentclasses. For this, the available experiment annotationswere manually evaluated and the most reasonable setof sample comparisons were recorded in an experi-ment definition table that contained all the requiredinput parameters to control the downstream statisticalDEG analysis in an automated manner (SupplementalData S2). Typically, we chose for each experiment set adesign strategy that focused the analysis on the pri-mary treatment as the main experimental factor. Mul-tifactorial analysis strategies were avoided as much aspossible. For instance, when an experiment containeda stress treatment as the primary experimental factorand time or different tissue types as secondary factors,then we compared only samples from identical tissuesthat were collected at the same time points. Addition-ally, comparisons between different experiment sets
Annotating Genes by Large-Scale Coexpression Analysis
Plant Physiol. Vol. 147, 2008 51 www.plantphysiol.orgon June 25, 2018 - Published by Downloaded from
Copyright © 2008 American Society of Plant Biologists. All rights reserved.

were not considered to exclude unknown variables,such as sample handling differences between labora-tories (Hong et al., 2006). It is important to stress herethat, depending on the design of a given experimentand its available annotations, it is often difficult toselect a single most meaningful analysis strategy.Thus, our chosen strategy may not provide a perfectsolution for every experiment set, but it represents apractical and reasonable compromise for performingsystematic DEG analyses on large expression data setsfrom public databases.
In total our large-scale DEG analysis survey included333 comparisons between samples with two to fourtechnical or biological replicates from 41 experimentsets of six experiment categories. Table III provides anoverview of the corresponding sample and experimentsets, and Supplemental Data S2 contains all detailedinformation including the chosen analysis strategies forthese data sets. Because the abiotic stress category is byfar the largest data set, containing 524 chip hybridiza-tions of 254 biosamples (Kilian et al., 2007), the follow-ing description of our DEG results will be restricted tothis most comprehensive treatment category (Table VI).The data for the other categories are provided in theonline database of this project (see below). As thestatistical method for identifying DEGs with the deter-mined experiment analyses strategies, we used linearmodels for microarray data (LIMMA) from Smyth(2004, 2005), using in all cases as the confidence thresh-old a false discovery rate (FDR) of #0.01 in combinationwith a minimum fold-change filter of 2.
Applying the above DEG analysis strategy, we wereable to identify 269 PKF and 104 PUF genes that showedexpression changes in the majority of the 10 consideredabiotic stress categories (Fig. 3; Supplemental Data S7).This set of a total of 373 generic stress DEGs wasdetermined by filtering the generated DEG data set formembers that showed one or more significant expres-sion changes in at least 80% of all stress categories.Interestingly, 95% of these DEGs also appear in the
generated gene expression clusters of the previousanalysis (Supplemental Data S5). The subsequent GOterm enrichment analysis revealed that stress-relatedannotations are highly overrepresented in this group ofDEGs (see Supplemental Data S8). About 48 of itsmembers (13%) are associated with the GO term ‘‘re-sponse to stress’’ from the BP ontology (GO:0006950; Pvalue 2.0 3 10213). This enrichment indicates that ourstrategy has a high selectivity for identifying stress-response genes. Therefore, many PUF encoding genesin this data set may be directly or indirectly involved ingeneric stress-response pathways. Among the differentgroups of identified stress responsive genes (see below;Fig. 3), the generic stress DEG set represents by far thelargest group.
Similarly, other studies have shown that stress-regulated genes frequently exhibit expression changesto a wide range of different abiotic stress treatmentsrather than a refined subset of stresses (Rodriguez andRedman, 2005; Kilian et al., 2007). The group of genericstress DEGs contains 48 genes that are annotated astranscription regulators in the MF ontology (GO:0030528;P value 2.5 3 1023; Supplemental Data S8). This en-richment emphasizes the central role of transcriptionfactors for the control of many stress-response path-ways. Moreover, it opens the possibility that several ofthe 104 PUF genes of this data set may be involved insimilar transcription control processes.
We also used the generated abiotic stress DEG dataset for identifying genes that respond predominantlyto a specific type of stress. These specific stress DEGswere defined as follows. Firstly, they had to show in25% of all comparisons of a given stress type signifi-cant changes. Secondly, they had to exhibit at the sametime at least four times as many changes than in theother nine stresses (Fig. 3; Supplemental Data S7). Thisfrequency-based filtering approach appeared to bemore efficient for associating DEGs with specificstresses than overly strict filtering methods. This isthe case because most stress-response genes are nothighly specific for a single type of stress (Kilian et al.,2007). As a result, strict filtering for genes respondingonly to a single stress will fail to identify any candidategenes in our comprehensive data sets. It is importantto emphasize here that the chosen filtering approach isa practical compromise, but not a perfect solution tothe problem of assigning DEGs reliably to differentstress types. Therefore, the complete DEG results areprovided in Supplemental Data S7 where users canapply their own custom filters and prioritize strate-gies.
With the chosen frequency filter we were able toidentify specific stress DEG sets within six of the 10treatment types (Table VI; Fig. 3). The data sets for thestress treatments—light, oxidative, and woundingstress—did not contain any genes that meet our filter-ing criteria, and the drought data set contained only asingle member. The lack of specific stress DEGs in thesedata sets indicates that the genome-wide expressionresponse patterns to these four stresses widely overlap
Table VI. Abiotic stress treatments
The table provides an overview of the different types of abiotic stressexperiment sets (Stress) that were used in the DEG analysis of this study.The numeric columns contain the number of the analyzed GeneChipmicroarrays (Chips), the number of the corresponding biosamples(Samples), and the number of the performed comparisons (Comp). Amore detailed list of this data is available in Supplemental Data S2.
Stress Chips Samples Comp
Heat 68 34 17Cold 48 24 12Osmotic 48 24 12Salt 48 24 12Drought 56 28 14Oxidative 48 24 12Wounding 56 28 14UV-B 56 28 14Light 48 16 10Genotoxic 48 24 12
Horan et al.
52 Plant Physiol. Vol. 147, 2008 www.plantphysiol.orgon June 25, 2018 - Published by Downloaded from
Copyright © 2008 American Society of Plant Biologists. All rights reserved.

with those from other stresses. For the remaining sixtreatment categories we identified in total 608 PKF and206 PUF genes that responded predominantly to singlestresses. The functional analysis of these specific stressDEG sets with our GO term enrichment approachshowed no outstanding enrichment of specific genefunctions. Instead, the results contained mostly mod-erately enriched GO annotations from a wide spectrumof molecular processes and BPs (Supplemental DataS8). Similar to the generic stress data, the differentgroups of specific stress DEGs included various markergenes that are characteristic for stress-related gene sets.For instance, they contained many genes that are an-notated with the GO term ‘‘response to stress’’ (see Fig.3). This term is significantly enriched in the heat stressdata set (P value 1.3 3 1022), whereas the other fivetreatment sets contain it with considerable, but notsignificantly enriched frequencies (P values of $5 31022). In addition, the heat stress and genotoxic stressdata sets showed the expected enrichment of genes thatare associated with heat response and DNA repairprocesses, respectively (GO:0009408; P value 4.9 3 1023
and GO:0006281; P value 6.1 3 1025).In summary, the above large-scale DEG study iden-
tified a comprehensive set of candidate PKF and PUFgenes that are involved in generic and specific stress-response pathways. These results suggest the existence
of one or more abiotic stress-response regulons inArabidopsis similar to the environmental stress regu-lon described in yeast (Saccharomyces cerevisiae; Gaschet al., 2000; Gasch, 2002). Furthermore, the generateddata sets represent an important resource for otherscientists who are interested in addressing more spe-cific questions relevant to abiotic stress research byquerying the generated DEG information in alternativeways (see Supplemental Data S7; online database).
Plant Unknown-eome and Gene Expression Databases
To provide efficient access to the extensive data sets ofthis study, we have developed two publicly available on-line portals: the Plant Unknown-eome Database (POND;http://bioweb.ucr.edu/scripts/unknownsDisplay.pl) andthe PED (http://bioweb.ucr.edu/PED). The POND inter-face provides query and download options for the latestPUF sets from Arabidopsis. Their predictions are basedon the three search methods used for this study: (1)BLASTP searches against the PKFs from Swiss-Prot, (2)HMM searches against the Pfam domain database, and(3) retrieval of the unknown annotations from the GOsystem (MF).
The PED integrates our diverse coexpression datawith a variety of online tools for user-friendly DEGanalysis, cluster visualization, and data mining (Fig.4). The aim of this service is not to duplicate or com-pete with the excellent Web resources that are alreadyavailable for array-based expression data from plants,such as GEO, Genevestigator, BAR, AtGenExpress,ATC, Page-Man, CSB.DB, and MetNet (Steinhauseret al., 2004b; Zimmermann et al., 2004, 2005; Schmidet al., 2005; Toufighi et al., 2005; Yang et al., 2005;Barrett et al., 2006; Grennan, 2006; Jen et al., 2006;Usadel et al., 2006). Instead PED complements theavailable resources by providing a subset of the pub-licly available Affymetrix expression data from Arabi-dopsis in preanalyzed form using various statisticalmethods for DEG identification combined with ex-pression cluster information for coregulation analysis.To provide high-confidence data, the database is re-stricted to data sets with two or more replicates. Thefollowing text provides a brief overview of the mostinteresting features of the database.
All expression data in PED were normalized with theRMA and MAS5 algorithms (Irizarry et al., 2003; Qinet al., 2006). The incorporation of the expression valuesfrom both normalization methods increases the utilityspectrum of the provided data sets. The quantile-basedRMA method generates more accurate expression mea-sures for weakly expressed genes, whereas the MAS5scaling approach is more appropriate for comparisonsbetween expression studies (Lim et al., 2007). Theoption to identify DEGs by statistical modeling is avery unique feature of this online service. For this, PEDprovides the results of experiment design-based ex-pression changes from several statistical methods, suchas LIMMA (Smyth, 2004, 2005). The corresponding
Figure 3. Generic and specific stress DEGs. The number of PUF andPKF encoding genes are plotted that were identified as generic andspecific stress DEGs. The values above the bars provide the corre-sponding numbers of genes that are currently annotated with the GOterm ‘‘response to stress’’ (GO:0006950 in BP ontology). The differentstress types are given along the abscissa. Genes responding to themajority of the 10 abiotic stresses were considered as generic stressDEGs (Generic), whereas those responding predominantly to a specifictype of stress were classified as specific stress DEGs. The followingfilters were used for assigning genes to the two stress categories. (1)Generic stress-response genes are those that showed in at least 80% ofall stress treatments one or more significant changes. (2) Specific stress-response genes are those that showed in $25% of all comparisons of agiven stress significant changes, and exhibited there $4 times as manychanges than in the other nine stresses. For both filters, the observedexpression changes were only counted when they met our confidencecriteria of a FDR #0.01 and a fold change $2. The specific stress datafor the four treatment sets—light, oxidative, drought, and wounding—are not plotted here because their data sets did not contain any DEGsthat met our specific stress criteria.
Annotating Genes by Large-Scale Coexpression Analysis
Plant Physiol. Vol. 147, 2008 53 www.plantphysiol.orgon June 25, 2018 - Published by Downloaded from
Copyright © 2008 American Society of Plant Biologists. All rights reserved.

experiment analysis strategies are available for onlineviewing and download. A combinatorial query pageallows searching for DEGs by specific treatments andfiltering by various quantitative values to obtain can-didate gene lists with strategies that resemble typicalmicroarray analysis routines. Furthermore, the expres-sion intensity and DEG data in PED are fully integratedwith a comprehensive set of gene coexpression datafrom correlation and cluster analyses. To identify for agene of interest its most positively or negatively co-regulated neighbors, the interface contains a correlationtool that provides for every gene on the arrays thePearson and Spearman correlation profiles against allother genes. Information on discrete expression clus-ters is combined with the correlation data. It containsthe four separate HTC cluster data sets that were gen-erated by this study using as distance measures the twocorrelation coefficients in their signed and absoluteforms (see previous section). An expression profileplotting tool is available for evaluating the quality ofexpression clusters or visualizing the expression pat-terns for custom gene sets across all samples in thedatabase. This utility offers convenient options for
inspecting the vast number of expression clusters ofthis study efficiently. Extensive download options forimports into local spreadsheet programs are availableon all query levels for intensity, DEG, correlation, andcluster data.
While the backend of the database is based onPostgreSQL and the web interface is implemented inJava, the framework of data analysis and online tools islargely designed around R and BioConductor utilities(Gentleman et al., 2005; R Development Core Team,2006). The latter design feature will allow us to rou-tinely add to PED’s online services in the future addi-tional useful tools from the wide spectrum of statisticaldata analysis packages that are provided by the R opensource community.
CONCLUSION
We present here one of the most comprehensive genecoregulation studies that are currently available forArabidopsis. Our study is unique, to our knowledge,by focusing on the analysis on PUF genes and their
Figure 4. The PED database. The outline illustrates important utilities of the database (http://bioweb.ucr.edu/PED).
Horan et al.
54 Plant Physiol. Vol. 147, 2008 www.plantphysiol.orgon June 25, 2018 - Published by Downloaded from
Copyright © 2008 American Society of Plant Biologists. All rights reserved.

systematic association with functional annotations ofPKF genes. By applying a combination of genome-widecluster and DEG analysis methods, we identified manyinteresting groups of potentially coregulated genesfrom a wide range of BPs and stress-response path-ways. This approach allowed us to assign 1,541 PUFgenes to relative specific and functionally informativeGO terms. These gene associations provide a valuableresource for guiding future functional characterizationexperiments of PUF and PKF genes. In addition, thedeveloped large-scale expression data analysis meth-ods and the associated database represent importantcomponents of a future open-source framework forother scientists who are interested in performing sim-ilar studies or utilizing public gene expression re-sources more efficiently. Finally, users of the provideddata sets should keep two limitations in mind. First, thegenerated associations are hypotheses and not finalproofs of gene functions. Second, even the most carefulstatistical approaches for large-scale data can onlyreduce, but not fully eliminate, errors in the decision-making processes associated with the interpretation ofmicroarray data.
MATERIALS AND METHODS
Sequence Similarity and Domain Searches
Sequence similarity searches of the Arabidopsis (Arabidopsis thaliana)
proteome against the SwissProt database were performed with the BLASTP
program (Altschul et al., 1997) using an E value of 1 3 1026 as the cutoff and
the default settings for the remaining parameters. The Arabidopsis protein
sequences were obtained from The Arabidopsis Information Resource (TAIR)
site (version 7 release; ftp://ftp.arabidopsis.org/home/tair/Sequences), and
the SwissProt sequences (Wu et al., 2006) were downloaded from the ExPASy
site (release 54.4; ftp://ftp.expasy.org/databases/uniprot). To query only the
functionally characterized protein space, all entries annotated as sequences of
unknown function were removed from the SwissProt data set.
To identify protein domains of known function in the above Arabidopsis
proteins, domain searches against the hidden Markov models of the Pfam
database (Bateman et al., 2004) were performed with the HMMPFAM pro-
gram (Eddy, 1996) using an E value of 1 3 1022 as the cutoff. The global models
of the Pfam release 22 were used for these searches (ftp://ftp.sanger.ac.uk/
pub/databases/Pfam/). Matches against domains of unknown function were
ignored in the postprocessing of the search results to identify only candidate
sequences with domains of known functions.
GO Analysis
The Arabidopsis gene-to-GO mappings from TAIR/The Institute for
Genomic Research were used for all GO analysis steps of this study. They
were downloaded from the GO site (10/12/2007 release; http://geneontology.
org). Direct assignments to the root node of each ontology were considered as
unknown function annotations. These root assignments, in combination with
the evidence code ND, are the new official GO terms for sequences of
unknown function. The former terms, MF unknown (GO:0005554), BP un-
known (GO:0000004), and CC unknown (GO:0008372), were discontinued by
the consortium on 10/17/2006. In the subsequent GO term enrichment
analysis steps, the new unknown annotations to the root were considered as
artificial terminal annotations. This was necessary because the root node is
connected with all other genes in the GO network, which makes it impossible
to obtain for the new unknown annotations meaningful enrichment data with
most GO analysis approaches. This modification does not affect the results for
any of the other GO nodes.
The hypergeometric distribution was used to test gene sets for the
overrepresentation of GO terms. To perform this test, we developed a set of
modular functions using the R language for statistical computing for their
implementation (R Development Core Team, 2006). The corresponding
GOHyperGAll script computes for a given sample population of genes the
enrichment test for all nodes in the GO network, and returns raw and adjusted
P values. As an adjustment method for multiple testing, it uses the Bonferroni
method according to Boyle et al. (2004). GOHyperGAll is based on the GOstats
package (Falcon and Gentleman, 2007) from the BioConductor project
(Gentleman et al., 2005), and it provides similar utilities as the hyperGTest
function included in this package. The main differences of our method are that
it simplifies the usage of custom gene-to-GO mappings, and it contains
various utilities for efficiently analyzing large numbers of gene sets from
cluster analyses in batch mode. All functions of the GOHyperGAll script are
available in Supplemental Data S9.
Microarray Analysis
A total of 1,310 Affymetrix raw data Cel files were downloaded from the
AtGenExpress and GEO sites (Schmid et al., 2005; Barrett et al., 2006; Kilian
et al., 2007). All of them are derived from the Affymetrix ATH1 gene
GeneChip microarray for Arabidopsis, and the corresponding samples con-
tained at least two replicate samples. A summary of the utilized experiment
sets is provided in Table III, whereas a detailed description of the analyzed
data with their experimental design parameters is provided in Supplemental
Data S2. The required probe set-to-locus mappings for the ATH1 chip were
obtained from TAIR (ftp://ftp.arabidopsis.org/home/tair/Microarrays/
Affymetrix; version 2/5/2007). All ambiguous probe sets on this chip were
treated in the gene enumeration steps of this study in the following manner:
controls and probe sets matching no or several loci in the Arabidopsis genome
were ignored in the downstream analysis steps. In addition, redundant probe
sets that represent the same locus several times were counted only once.
The normalization of the raw data Cel files was performed in R using the
MAS5 and RMA algorithms that are implemented in the affy package form the
BioConductor project (Irizarry et al., 2003, 2006; Qin et al., 2006). To allow in
the DEG analysis comparisons between the different samples of an experi-
ment set, the RMA normalization was performed in batches for entire
experiment sets (Table III). This batch normalization is only required for the
quantile-based RMA approach, but not for the MAS5 scaling approach. The
present call information of the nonparametric Wilcoxon signed rank test was
computed with the affy package to estimate the amount of unexpressed genes
(Liu et al., 2002; McClintick and Edenberg, 2006). The obtained expression
values from both normalization methods were uploaded to the PED database.
For the DEG analysis, the replicates and the most appropriate sample
comparisons were determined manually for each experiment set. The gener-
ated analysis strategies were recorded in experiment definition tables (Sup-
plemental Data S2). These tables were used to control the downstream DEG
analysis steps in an automated manner by providing all information on
replicates and sample comparisons to the statistical test methods. The actual
analysis of DEGs was performed with the LIMMA package from Smyth (2004,
2005). The Benjamini and Hochberg method was selected to adjust P values for
multiple testing and to determine FDRs (Benjamini and Hochberg, 1995). As
confidence threshold we used an adjusted P value of #0.01 in combination
with a minimum fold-change filter of 2. All DEG analyses were performed on
both the MAS5 and RMA normalized data sets. Although both DEG analysis
results were uploaded to the PED database, only the RMA set is discussed in
this study because the RMA algorithm provides more accurate measurements
on weaker expressed genes (Qin et al., 2006).
Cluster Analysis
The correlation and cluster analysis steps were performed in R on the
MAS5 normalized expression data set. For this, the mean values from
replicated biological measurements were combined in one large expression
matrix. The RMA data were not used for cluster analysis, because they are less
reliable for correlation studies than MAS5 data (Lim et al., 2007). The Pearson
and Spearman correlation coefficients were calculated with the cor function in
R. The obtained correlation coefficients were transformed into a correlation-
based distance matrix after subtracting their values from 1. Four separate
distance matrices were calculated for the Pearson and Spearman correlation
coefficients in their signed and absolute forms. The matrices were passed on to
the hclust function (Murtagh, 1985; R Development Core Team, 2006) that
performs agglomerative hierarchical clustering. Complete linkage was used as
cluster joining method.
Annotating Genes by Large-Scale Coexpression Analysis
Plant Physiol. Vol. 147, 2008 55 www.plantphysiol.orgon June 25, 2018 - Published by Downloaded from
Copyright © 2008 American Society of Plant Biologists. All rights reserved.

To obtain from hierarchical dendrograms discrete clusters, we developed,
to our knowledge, a new HTC method for this project. This method identifies
subclusters in dendrograms based on a minimum tolerable similarity cutoff
between all cluster members. This is achieved by applying an all-against-all
similarity test for the clusters from all possible subtrees. At the same time,
unique cluster memberships are maintained and all items in the processed
dendrogram are assigned to clusters with one or more members. The
corresponding HTC R script is available in Supplemental Data S10. As the
cutoff we used for this cluster selection procedure a correlation coefficient of
$0.6. This cutoff was chosen because it resulted in the highest enrichment of
functionally related genes compared to alternative cutoffs settings (Supple-
mental Data S4). As a result of this method, the members of every identified
cluster shared with all other members of the same cluster correlation coeffi-
cients between 0.6 and 1.0.
Supplemental Data
The following materials are available in the online version of this article.
Supplemental Data S1. PUF sets.
Supplemental Data S2. GeneChip microarray experiments and analysis
strategies.
Supplemental Data S3. PMA data.
Supplemental Data S4. HTC cutoff selection.
Supplemental Data S5. Cluster data.
Supplemental Data S6. GO analysis of clusters.
Supplemental Data S7. DEG analysis.
Supplemental Data S8. GO analysis of DEGs.
Supplemental Data S9. R script for GO term enrichment analysis.
Supplemental Data S10. R script for HTC clustering.
ACKNOWLEDGMENTS
We thank the community projects—R, BioConductor, TAIR, The Institute
for Genomic Research, GEO, and AtGenExpress—for providing the excellent
software and data resources that were used by this project. T.G. acknowl-
edges support from the Bioinformatics Core Facility, the Center for Plant Cell
Biology, and the Institute for Integrative Genome Biology at University of
California, Riverside.
Received February 3, 2008; accepted March 10, 2008; published March 19,
2008.
LITERATURE CITED
Altschul SF, Gish W, Miller W, Myers EW, Lipman DJ (1990) Basic local
alignment search tool. J Mol Biol 215: 403–410
Altschul SF, Madden TL, Schaffer AA, Zhang J, Zhang Z, Miller W,
Lipman DJ (1997) Gapped BLAST and PSI-BLAST: a new generation of
protein database search programs. Nucleic Acids Res 25: 3389–3402
Ashburner M, Ball CA, Blake JA, Botstein D, Butler H, Cherry JM, Davis
AP, Dolinski K, Dwight SS, Eppig JT, et al (2000) Gene ontology: tool
for the unification of biology. The Gene Ontology Consortium. Nat
Genet 25: 25–29
Barrett T, Troup DB, Wilhite SE, Ledoux P, Rudnev D, Evangelista C, Kim
IF, Soboleva A, Tomashevsky M, Edgar R (2006) NCBI GEO: mining
tens of millions of expression profiles—database and tools update.
Nucleic Acids Res 35: D760–D765
Bateman A, Coin L, Durbin R, Finn RD, Hollich V, Griffths-Jones S,
Khanna A, Marshall M, Moxon S, Sonnhammer EL, et al (2004) The
Pfam protein families database. Nucleic Acids Res 32: D138–D141
Becker RA, Chambers JM, Wilks AR (1988) The New S Language.
Wadsworth and Brooks/Cole, Pacific Grove, CA
Benjamini Y, Hochberg Y (1995) Controlling the false discovery rate—a
practical and powerful approach to multiple testing. J Roy Statist Soc Ser
B Methodological 57: 289–300
Berardini TZ, Mundodi S, Reiser L, Huala E, Garcia-Hernandez M,
Zhang P, Mueller LA, Yoon J, Doyle A, Lander G, et al (2004) Func-
tional annotation of the Arabidopsis genome using controlled vocabu-
laries. Plant Physiol 135: 745–755
Boeckmann B, Bairoch A, Apweiler R, Blatter MC, Estreicher A,
Gasteiger E, Martin MJ, Michoud K, O’Donovan C, Phan I, et al
(2003) The SWISS-PROT protein knowledgebase and its supplement
TrEMBL in 2003. Nucleic Acids Res 31: 365–370
Boyle EI, Weng S, Gollub J, Jin H, Botstein D, Cherry JM, Sherlock G
(2004) GOTTermFinder—open source software for accessing Gene
Ontology information and finding significantly enriched Gene Ontology
terms associated with a list of genes. Bioinformatics 20: 3710–3715
Brazma A, Hingamp P, Quackenbush J, Sherlock G, Spellman P, Stoeckert C,
Aach J, Ansorge W, Ball CA, Causton HC, et al (2001) Minimum
information about a microarray experiment (MIAME)-toward standards
for microarray data. Nat Genet 29: 365–371
Brown DM, Zeef LA, Ellis J, Goodacre R, Turner SR (2005) Identification
of novel genes in Arabidopsis involved in secondary cell wall formation
using expression profiling and reverse genetics. Plant Cell 17: 2281–2295
de Hoon MJ, Imoto S, Nolan J, Miyano S (2004) Open source clustering
software. Bioinformatics 20: 1453–1454
Eddy SR (1996) Hidden Markov models. Curr Opin Struct Biol 6: 361–365
Eisen MB, Spellman PT, Brown PO, Botstein D (1998) Cluster analysis and
display of genome-wide expression patterns. Proc Natl Acad Sci USA
95: 14863–14868
Falcon S, Gentleman R (2007) Using GOstats to test gene lists for GO term
association. Bioinformatics 23: 257–258
Fukao T, Bailey-Serres J (2004) Plant responses to hypoxia—is survival a
balancing act? Trends Plant Sci 9: 449–456
Gachon CM, Langlois-Meurinne M, Henry Y, Saindrenan P (2005) Tran-
scriptional co-regulation of secondary metabolism enzymes in Arabi-
dopsis: functional and evolutionary implications. Plant Mol Biol 58:
229–245
Gasch AP (2002) The environmental stress response: a common yeast
response to environmental stresses. In S Hohmann, ed, Topics in
Current Genetics, Vol. 1. Springer Verlag, Heidelberg, Germany, pp
11–70
Gasch AP, Spellman PT, Kao CM, Carmel-Harel O, Eisen MB, Storz G,
Botstein D, Brown PO (2000) Genomic expression programs in the
response of yeast cells to environmental changes. Mol Biol Cell 11:
4241–4257
Gentleman R, Carey V, Dudoit S, Irizarry R, Huber W (2005) Bioinfor-
matics and Computational Biology Solutions Using R and Bioconductor.
Springer, New York
Girke T, Lauricha J, Tran H, Keegstra K, Raikhel N (2004) The Cell
Wall Navigator database. A systems-based approach to organism-
unrestricted mining of protein families involved in cell wall metabolism.
Plant Physiol 136: 3003–3008
Gollery M, Harper J, Cushman J, Mittler T, Girke T, Zhu JK, Bailey-Serres
J, Mittler R (2006) What makes species unique? The contribution of
proteins with obscure features. Genome Biol 7: R57
Gollery M, Harper J, Cushman J, Mittler T, Mittler R (2007) POFs: what we
don’t know can hurt us. Trends Plant Sci (in press)
Grennan AK (2006) Genevestigator. Facilitating web-based gene-expression
analysis. Plant Physiol 141: 1164–1166
Gutierrez RA, Lejay LV, Dean A, Chiaromonte F, Shasha DE, Coruzzi GM
(2007) Qualitative network models and genome-wide expression data
define carbon/nitrogen-responsive molecular machines in Arabidopsis.
Genome Biol 8: R7
Haberer G, Mader MT, Kosarev P, Spannagl M, Yang L, Mayer KF (2006)
Large-scale cis-element detection by analysis of correlated expression
and sequence conservation between Arabidopsis and Brassica oleracea.
Plant Physiol 142: 1589–1602
Hebelstrup KH, Igamberdiev AU, Hill RD (2007) Metabolic effects of
hemoglobin gene expression in plants. Gene 398: 86–93
Hong F, Breitling R, McEntee CW, Wittner BS, Nemhauser JL, Chory J
(2006) RankProd: a bioconductor package for detecting differentially
expressed genes in meta-analysis. Bioinformatics 22: 2825–2827
Horan K, Lauricha J, Bailey-Serres J, Raikhel N, Girke T (2005) Genome
cluster database. A sequence family analysis platform for Arabidopsis
and rice. Plant Physiol 138: 47–54
Horan et al.
56 Plant Physiol. Vol. 147, 2008 www.plantphysiol.orgon June 25, 2018 - Published by Downloaded from
Copyright © 2008 American Society of Plant Biologists. All rights reserved.

Irizarry RA, Bolstad BM, Collin F, Cope LM, Hobbs B, Speed TP (2003)
Summaries of Affymetrix GeneChip probe level data. Nucleic Acids Res
31: e15
Irizarry RA, Gautier L, Bolstad BM, Magnus Astrand CM, Cope LM,
Gentleman R, Gentry J, Halling C, Huber W, MacDonald J, et al (2006)
affy: Methods for Affymetrix Oligonucleotide Arrays. R Package Ver-
sion 1.12.1. http://www.bioconductor.org
Jen CH, Manfield IW, Michalopoulos I, Pinney JW, Willats WG, Gilmartin
PM, Westhead DR (2006) The Arabidopsis co-expression tool (ACT): a
WWW-based tool and database for microarray-based gene expression
analysis. Plant J 46: 336–348
Johnson O, Liu J (2006) A traveling salesman approach for predicting
protein functions. Source Code Biol Med 1: 3
Kanehisa M, Goto S, Hattori M, Aoki-Kinoshita KF, Itoh M, Kawashima
S, Katayama T, Araki M, Hirakawa M (2006) From genomics to
chemical genomics: new developments in KEGG. Nucleic Acids Res
34: D354–D357
Kilian J, Whitehead D, Horak J, Wanke D, Weinl S, Batistic O, D’Angelo
C, Bornberg-Bauer E, Kudla J, Harter K (2007) The AtGenExpress
global stress expression data set: protocols, evaluation and model data
analysis of UV-B light, drought and cold stress responses. Plant J 50:
347–363
Krishnapuram R, Joshi A, Nasraoui O, Yi L (2001) Low-complexity fuzzy
relational clustering algorithms for Web mining. IEEE Trans Fuzzy Syst
9: 595–607
Leinonen R, Diez FG, Binns D, Fleischmann W, Lopez R, Apweiler R
(2004) UniProt archive. Bioinformatics 20: 3236–3237
Lim WK, Wang K, Lefebvre C, Califano A (2007) Comparative analysis of
microarray normalization procedures: effects on reverse engineering
gene networks. Bioinformatics 23: 282–288
Liu WM, Mei R, Di X, Ryder TB, Hubbell E, Dee S, Webster TA,
Harrington CA, Ho MH, Baid J, et al (2002) Analysis of high density ex-
pression microarrays with signed-rank call algorithms. Bioinformatics
18: 1593–1599
Ma S, Gong Q, Bohnert HJ (2007) An Arabidopsis gene network based on
the graphical Gaussian model. Genome Res 17: 1614–1625
McClintick JN, Edenberg HJ (2006) Effects of filtering by Present call on
analysis of microarray experiments. BMC Bioinformatics 7: 49
Mueller LA, Zhang P, Rhee SY (2003) AraCyc: a biochemical pathway
database for Arabidopsis. Plant Physiol 132: 453–460
Murtagh F (1985) Multidimensional Clustering Algorithms. COMPSTAT
Lectures 4. Physica-Verlag, Wuerzburg, Germany
Nelson DR, Schuler MA, Paquette SM, Werck-Reichhart D, Bak S (2004)
Comparative genomics of rice and Arabidopsis. Analysis of 727 cyto-
chrome P450 genes and pseudogenes from a monocot and a dicot. Plant
Physiol 135: 756–772
Persson S, Wei H, Milne J, Page GP, Somerville CR (2005) Identification of
genes required for cellulose synthesis by regression analysis of public
microarray data sets. Proc Natl Acad Sci USA 102: 8633–8638
Prelic A, Bleuler S, Zimmermann P, Wille A, Buhlmann P, Gruissem W,
Hennig L, Thiele L, Zitzler E (2006) A systematic comparison and
evaluation of biclustering methods for gene expression data. Bioinfor-
matics 22: 1122–1129
Qin LX, Beyer RP, Hudson FN, Linford NJ, Morris DE, Kerr KF (2006)
Evaluation of methods for oligonucleotide array data via quantitative
real-time PCR. BMC Bioinformatics 7: 23–23
R Development Core Team (2006) R: A Language and Environment
for Statistical Computing. R Foundation for Statistical Computing,
Vienna
Rodriguez R, Redman R (2005) Balancing the generation and elimination
of reactive oxygen species. Proc Natl Acad Sci USA 102: 3175–3176
Schmid M, Davison TS, Henz SR, Pape UJ, Demar M, Vingron M,
Scholkopf B, Weigel D, Lohmann JU (2005) A gene expression map of
Arabidopsis thaliana development. Nat Genet 37: 501–506
Schwacke R, Schneider A, van der Graaff E, Fischer K, Catoni E, Desimone
M, Frommer WB, Flugge UI, Kunze R (2003) ARAMEMNON, a novel data-
base for Arabidopsis integral membrane proteins. Plant Physiol 131: 16–26
Smyth GK (2004) Linear models and empirical bayes methods for assessing
differential expression in microarray experiments. Stat Appl Genet Mol
Biol 3: 3
Smyth GK (2005) Limma: linear models for microarray data. In R Gentle-
man, V Carey, S Dudoit, R Irizarry, W Huber, eds, Bioinformatics and
Computational Biology Solutions Using R and Bioconductor. Springer,
New York, pp 397–420
Steinhauser D, Junker BH, Luedemann A, Selbig J, Kopka J (2004a)
Hypothesis-driven approach to predict transcriptional units from gene
expression data. Bioinformatics 20: 1928–1939
Steinhauser D, Usadel B, Luedemann A, Thimm O, Kopka J (2004b)
CSB.DB: a comprehensive systems-biology database. Bioinformatics 20:
3647–3651
Toufighi K, Brady SM, Austin R, Ly E, Provart NJ (2005) The Botany Array
Resource: e-Northerns, Expression Angling, and promoter analyses.
Plant J 43: 153–163
Usadel B, Nagel A, Steinhauser D, Gibon Y, Blasing OE, Redestig H,
Sreeniva-sulu N, Krall L, Hannah MA, Poree F, et al (2006) PageMan:
an interactive ontology tool to generate, display, and annotate overview
graphs for profiling experiments. BMC Bioinformatics 7: 535
Vandepoele K, Casneuf T, Van de Peer Y (2006) Identification of novel
regulatory modules in dicot plants using expression data and compar-
ative genomics. Genome Biol 7: R103
Wang D, Harper JF, Gribskov M (2003) Systematic trans-genomic com-
parison of protein kinases between Arabidopsis and Saccharomyces
cerevisiae. Plant Physiol 132: 2152–2165
Wei H, Persson S, Mehta T, Srinivasasainagendra V, Chen L, Page GP,
Somerville C, Loraine A (2006) Transcriptional coordination of the
metabolic network in Arabidopsis. Plant Physiol 142: 762–774
Whetzel PL, Parkinson H, Causton HC, Fan L, Fostel J, Fragoso G, Game
L, Heiskanen M, Morrison N, Rocca-Serra P, et al (2006) The MGED
Ontology: a resource for semantics-based description of microarray
experiments. Bioinformatics 22: 866–873
Wolfe CJ, Kohane IS, Butte AJ (2005) Systematic survey reveals general
applicability of ‘‘guilt-by-association’’ within gene coexpression net-
works. BMC Bioinformatics 6: 227
Wortman JR, Haas BJ, Hannick LI, Smith RK, Maiti R, Ronning CM,
Chan AP, Yu C, Ayele M, Whitelaw CA, et al (2003) Annotation of the
Arabidopsis genome. Plant Physiol 132: 461–468
Wu CH, Apweiler R, Bairoch A, Natale DA, Barker WC, Boeckmann B,
Ferro S, Gasteiger E, Huang H, Lopez R, et al (2006) The Universal
Protein Resource (UniProt): an expanding universe of protein informa-
tion. Nucleic Acids Res 34: D187–D191
Yang Y, Engin L, Wurtele ES, Cruz-Neira C, Dickerson JA (2005) Integra-
tion of metabolic networks and gene expression in virtual reality.
Bioinformatics 21: 3645–3650
Zimmermann P, Hennig L, Gruissem W (2005) Gene-expression analysis and
network discovery using Genevestigator. Trends Plant Sci 10: 407–409
Zimmermann P, Hirsch-Hoffmann M, Hennig L, Gruissem W (2004)
GENEVESTIGATOR. Arabidopsis microarray database and analysis
toolbox. Plant Physiol 136: 2621–2632
Annotating Genes by Large-Scale Coexpression Analysis
Plant Physiol. Vol. 147, 2008 57 www.plantphysiol.orgon June 25, 2018 - Published by Downloaded from
Copyright © 2008 American Society of Plant Biologists. All rights reserved.