annexure-i standards of performance level by the ... · standards of performance level by the...
TRANSCRIPT
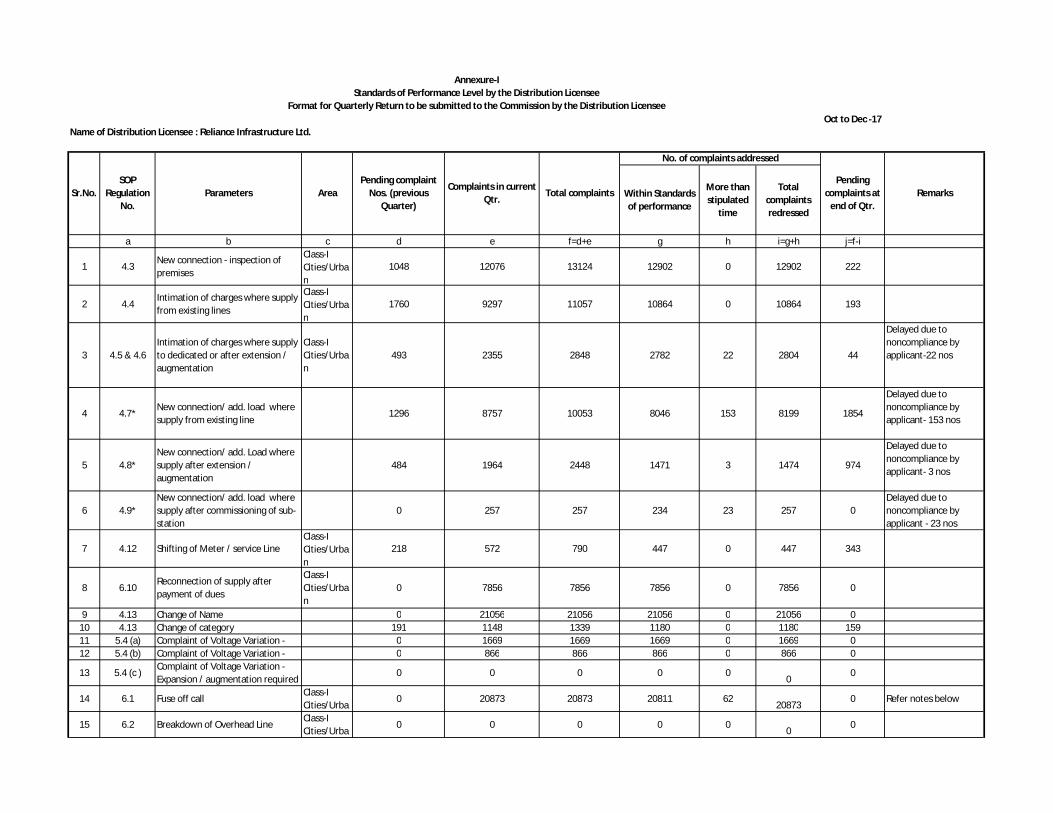
Oct to Dec -17Name of Distribution Licensee : Reliance Infrastructure Ltd.
Within Standards of performance
More than stipulated
time
Total complaints redressed
a b c d e f=d+e g h i=g+h j=f-i
1 4.3New connection - inspection of premises
Class-I Cities/Urban
1048 12076 13124 12902 0 12902 222
2 4.4Intimation of charges where supply from existing lines
Class-I Cities/Urban
1760 9297 11057 10864 0 10864 193
3 4.5 & 4.6Intimation of charges where supply to dedicated or after extension / augmentation
Class-I Cities/Urban
493 2355 2848 2782 22 2804 44
Delayed due to noncompliance by applicant-22 nos
4 4.7*New connection/ add. load where supply from existing line
1296 8757 10053 8046 153 8199 1854
Delayed due to noncompliance by applicant- 153 nos
5 4.8*New connection/ add. Load where supply after extension / augmentation
484 1964 2448 1471 3 1474 974
Delayed due to noncompliance by applicant- 3 nos
6 4.9*New connection/ add. load where supply after commissioning of sub-station
0 257 257 234 23 257 0Delayed due to noncompliance by applicant - 23 nos
7 4.12 Shifting of Meter / service LineClass-I Cities/Urban
218 572 790 447 0 447 343
8 6.10Reconnection of supply after payment of dues
Class-I Cities/Urban
0 7856 7856 7856 0 7856 0
9 4.13 Change of Name 0 21056 21056 21056 0 21056 010 4.13 Change of category 191 1148 1339 1180 0 1180 15911 5.4 (a) Complaint of Voltage Variation - 0 1669 1669 1669 0 1669 012 5.4 (b) Complaint of Voltage Variation - 0 866 866 866 0 866 0
13 5.4 (c )Complaint of Voltage Variation - Expansion / augmentation required
0 0 0 0 00
0
14 6.1 Fuse off callClass-I Cities/Urba
0 20873 20873 20811 6220873
0 Refer notes below
15 6.2 Breakdown of Overhead LineClass-I Cities/Urba
0 0 0 0 00
0
Remarks
No. of complaints addressed
Pending complaints at
end of Qtr.
Annexure-IStandards of Performance Level by the Distribution Licensee
Format for Quarterly Return to be submitted to the Commission by the Distribution Licensee
Sr.No.SOP
Regulation No.
Parameters AreaPending complaint
Nos. (previous Quarter)
Complaints in current Qtr.
Total complaints
Within Standards of performance
More than stipulated
time
Total complaints redressed
a b c d e f=d+e g h i=g+h j=f-i
Remarks
No. of complaints addressed
Pending complaints at
end of Qtr.Sr.No.
SOP Regulation
No.Parameters Area
Pending complaint Nos. (previous
Quarter)
Complaints in current Qtr.
Total complaints
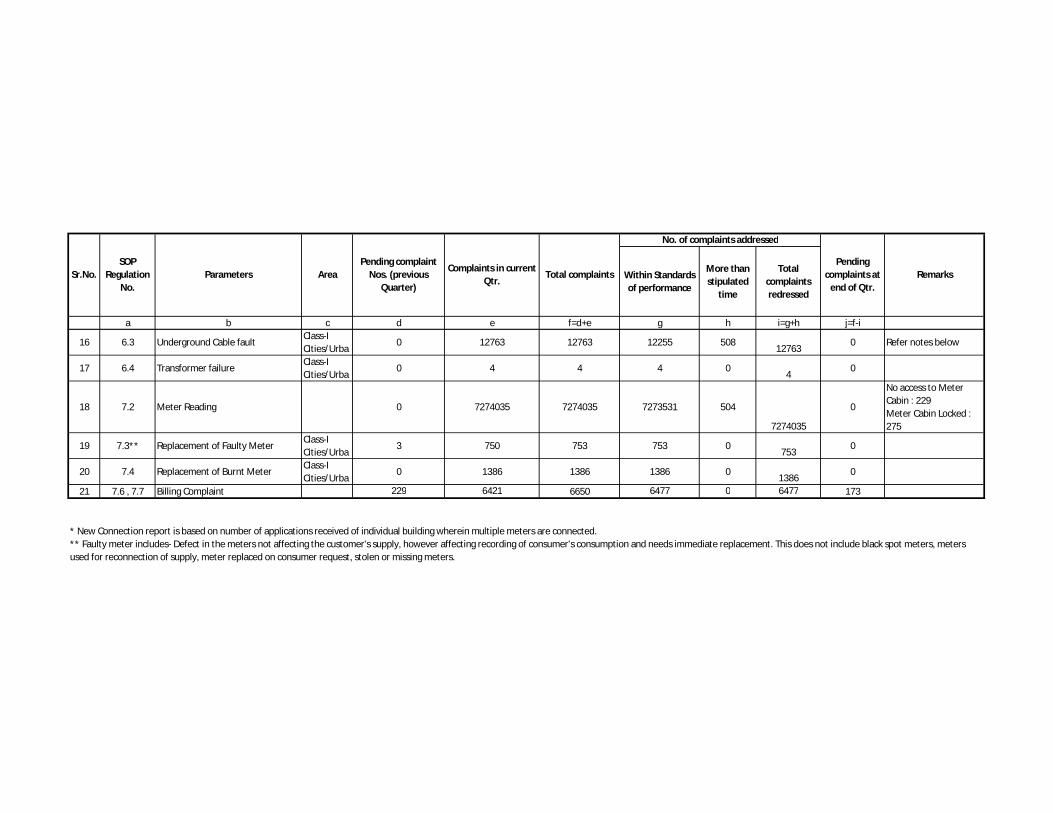
16 6.3 Underground Cable faultClass-I Cities/Urba
0 12763 12763 12255 50812763
0 Refer notes below
17 6.4 Transformer failureClass-I Cities/Urba
0 4 4 4 04
0
18 7.2 Meter Reading 0 7274035 7274035 7273531 504
7274035
0
No access to Meter Cabin : 229Meter Cabin Locked : 275
19 7.3** Replacement of Faulty MeterClass-I Cities/Urba
3 750 753 753 0753
0
20 7.4 Replacement of Burnt MeterClass-I Cities/Urba
0 1386 1386 1386 01386
0
21 7.6 , 7.7 Billing Complaint 229 6421 6650 6477 0 6477 173
* New Connection report is based on number of applications received of individual building wherein multiple meters are connected. ** Faulty meter includes- Defect in the meters not affecting the customer's supply, however affecting recording of consumer's consumption and needs immediate replacement. This does not include black spot meters, meters used for reconnection of supply, meter replaced on consumer request, stolen or missing meters.
a b c d
SOP Regulation
No.Parameters Area
Pending complaint Nos. (previous Quarter)
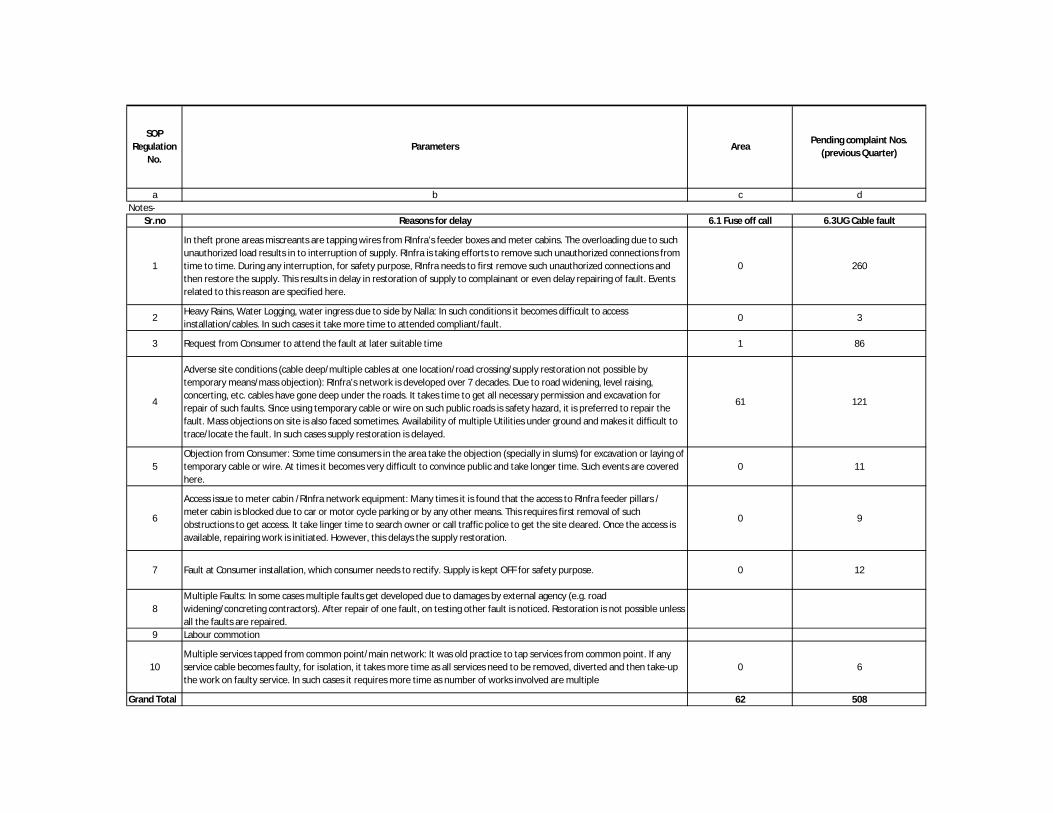
Notes-Sr.no Reasons for delay 6.1 Fuse off call 6.3UG Cable fault
1
In theft prone areas miscreants are tapping wires from RInfra’s feeder boxes and meter cabins. The overloading due to such unauthorized load results in to interruption of supply. RInfra is taking efforts to remove such unauthorized connections from time to time. During any interruption, for safety purpose, RInfra needs to first remove such unauthorized connections and then restore the supply. This results in delay in restoration of supply to complainant or even delay repairing of fault. Events related to this reason are specified here.
0 260
2Heavy Rains, Water Logging, water ingress due to side by Nalla: In such conditions it becomes difficult to access installation/cables. In such cases it take more time to attended compliant/fault.
0 3
3 Request from Consumer to attend the fault at later suitable time 1 86
4
Adverse site conditions (cable deep/multiple cables at one location/road crossing/supply restoration not possible by temporary means/mass objection): RInfra’s network is developed over 7 decades. Due to road widening, level raising, concerting, etc. cables have gone deep under the roads. It takes time to get all necessary permission and excavation for repair of such faults. Since using temporary cable or wire on such public roads is safety hazard, it is preferred to repair the fault. Mass objections on site is also faced sometimes. Availability of multiple Utilities under ground and makes it difficult to trace/locate the fault. In such cases supply restoration is delayed.
61 121
5Objection from Consumer: Some time consumers in the area take the objection (specially in slums) for excavation or laying of temporary cable or wire. At times it becomes very difficult to convince public and take longer time. Such events are covered here.
0 11
6
Access issue to meter cabin /RInfra network equipment: Many times it is found that the access to RInfra feeder pillars / meter cabin is blocked due to car or motor cycle parking or by any other means. This requires first removal of such obstructions to get access. It take linger time to search owner or call traffic police to get the site cleared. Once the access is available, repairing work is initiated. However, this delays the supply restoration.
0 9
7 Fault at Consumer installation, which consumer needs to rectify. Supply is kept OFF for safety purpose. 0 12
8Multiple Faults: In some cases multiple faults get developed due to damages by external agency (e.g. road widening/concreting contractors). After repair of one fault, on testing other fault is noticed. Restoration is not possible unless all the faults are repaired.
9 Labour commotion
10Multiple services tapped from common point/main network: It was old practice to tap services from common point. If any service cable becomes faulty, for isolation, it takes more time as all services need to be removed, diverted and then take-up the work on faulty service. In such cases it requires more time as number of works involved are multiple
0 6
Grand Total 62 508
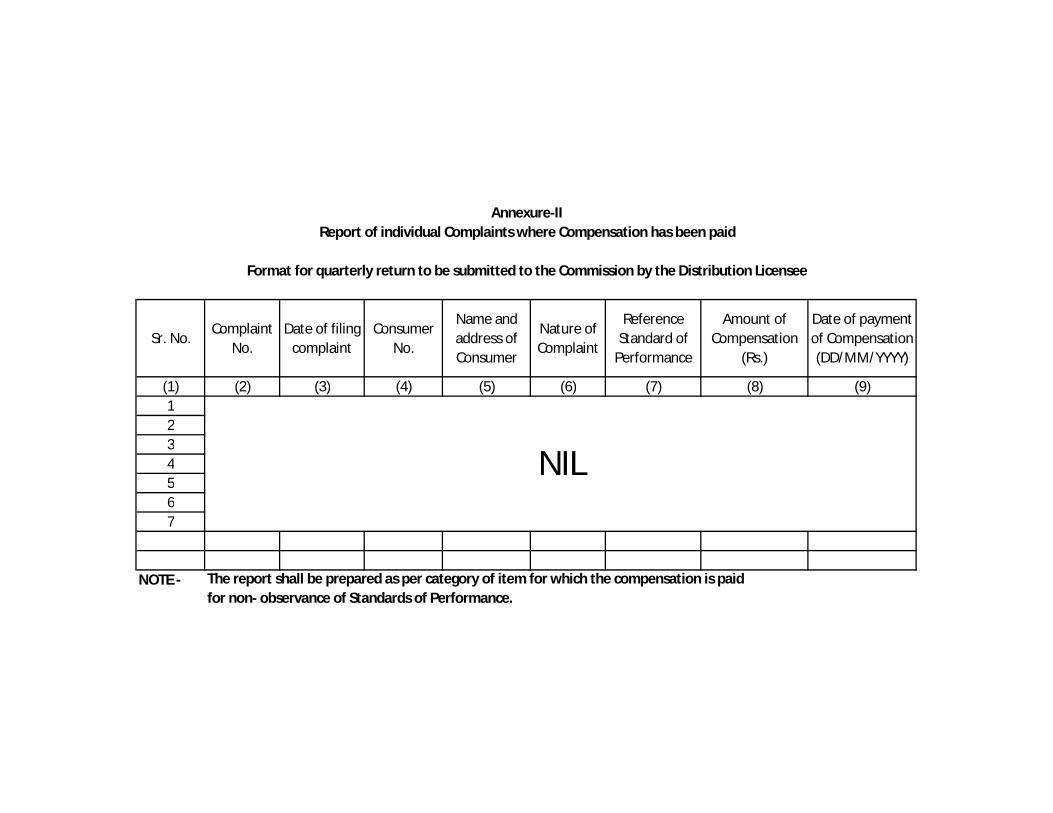
Sr. No.Complaint
No.Date of filing
complaintConsumer
No.
Name and address of Consumer
Nature of Complaint
Reference Standard of
Performance
Amount of Compensation
(Rs.)
Date of payment of Compensation (DD/MM/YYYY)
(1) (2) (3) (4) (5) (6) (7) (8) (9)1234567
NOTE -
Annexure-IIReport of individual Complaints where Compensation has been paid
Format for quarterly return to be submitted to the Commission by the Distribution Licensee
The report shall be prepared as per category of item for which the compensation is paidfor non- observance of Standards of Performance.
NIL
Sr.No.Name of
Distribution Licensee
Reference to Overall Standards
Faulty Meters at the start of the Quarter (Nos.)
Faulty Meters added during
Quarter (Nos.)
Total Faulty Meters (Nos.)
Meters rectified / replaced (Nos.)
Faulty Meters pending at end of
Quarter (Nos.)
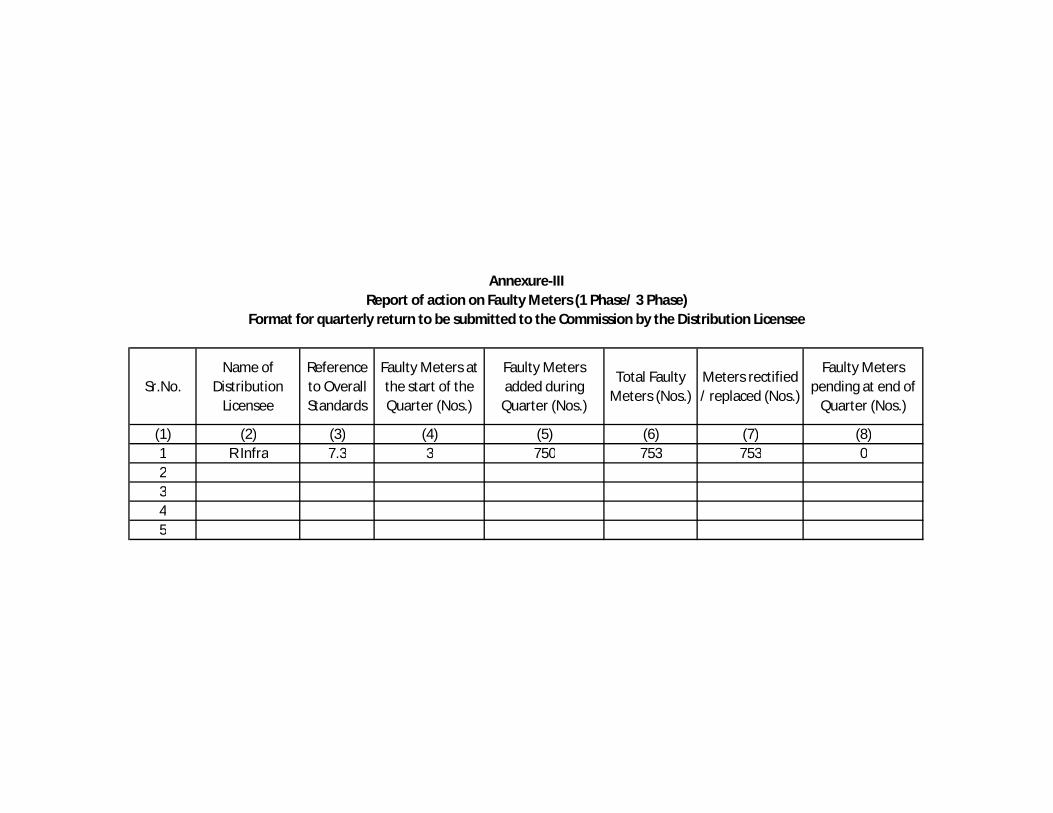
(1) (2) (3) (4) (5) (6) (7) (8)1 R Infra 7.3 3 750 753 753 02345
Annexure-IIIReport of action on Faulty Meters (1 Phase/ 3 Phase)
Format for quarterly return to be submitted to the Commission by the Distribution Licensee
Sr.No. Month
Ni = Number of consumers who experienced a
sustained interruption on
ith feeder
Ri = Restoration time for each interruption event on ith
feeder
Nt = Total number of
consumers of the distribution Licensees area
Sum(Ri*Ni) for all
feeders (excluding
agri. Feeders)
SAIDI = (6)/(5)(In minutes)
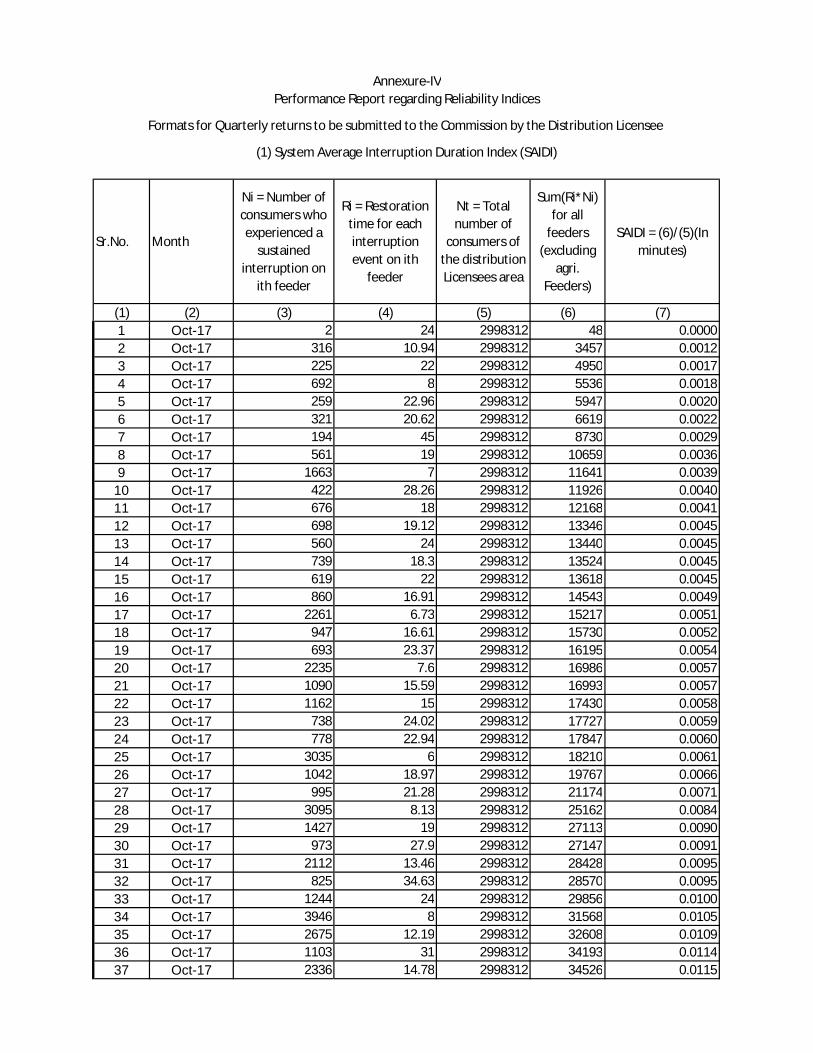
(1) (2) (3) (4) (5) (6) (7)1 Oct-17 2 24 2998312 48 0.00002 Oct-17 316 10.94 2998312 3457 0.00123 Oct-17 225 22 2998312 4950 0.00174 Oct-17 692 8 2998312 5536 0.00185 Oct-17 259 22.96 2998312 5947 0.00206 Oct-17 321 20.62 2998312 6619 0.00227 Oct-17 194 45 2998312 8730 0.00298 Oct-17 561 19 2998312 10659 0.00369 Oct-17 1663 7 2998312 11641 0.0039
10 Oct-17 422 28.26 2998312 11926 0.004011 Oct-17 676 18 2998312 12168 0.004112 Oct-17 698 19.12 2998312 13346 0.004513 Oct-17 560 24 2998312 13440 0.004514 Oct-17 739 18.3 2998312 13524 0.004515 Oct-17 619 22 2998312 13618 0.004516 Oct-17 860 16.91 2998312 14543 0.004917 Oct-17 2261 6.73 2998312 15217 0.005118 Oct-17 947 16.61 2998312 15730 0.005219 Oct-17 693 23.37 2998312 16195 0.005420 Oct-17 2235 7.6 2998312 16986 0.005721 Oct-17 1090 15.59 2998312 16993 0.005722 Oct-17 1162 15 2998312 17430 0.005823 Oct-17 738 24.02 2998312 17727 0.005924 Oct-17 778 22.94 2998312 17847 0.006025 Oct-17 3035 6 2998312 18210 0.006126 Oct-17 1042 18.97 2998312 19767 0.006627 Oct-17 995 21.28 2998312 21174 0.007128 Oct-17 3095 8.13 2998312 25162 0.008429 Oct-17 1427 19 2998312 27113 0.009030 Oct-17 973 27.9 2998312 27147 0.009131 Oct-17 2112 13.46 2998312 28428 0.009532 Oct-17 825 34.63 2998312 28570 0.009533 Oct-17 1244 24 2998312 29856 0.010034 Oct-17 3946 8 2998312 31568 0.010535 Oct-17 2675 12.19 2998312 32608 0.010936 Oct-17 1103 31 2998312 34193 0.011437 Oct-17 2336 14.78 2998312 34526 0.0115
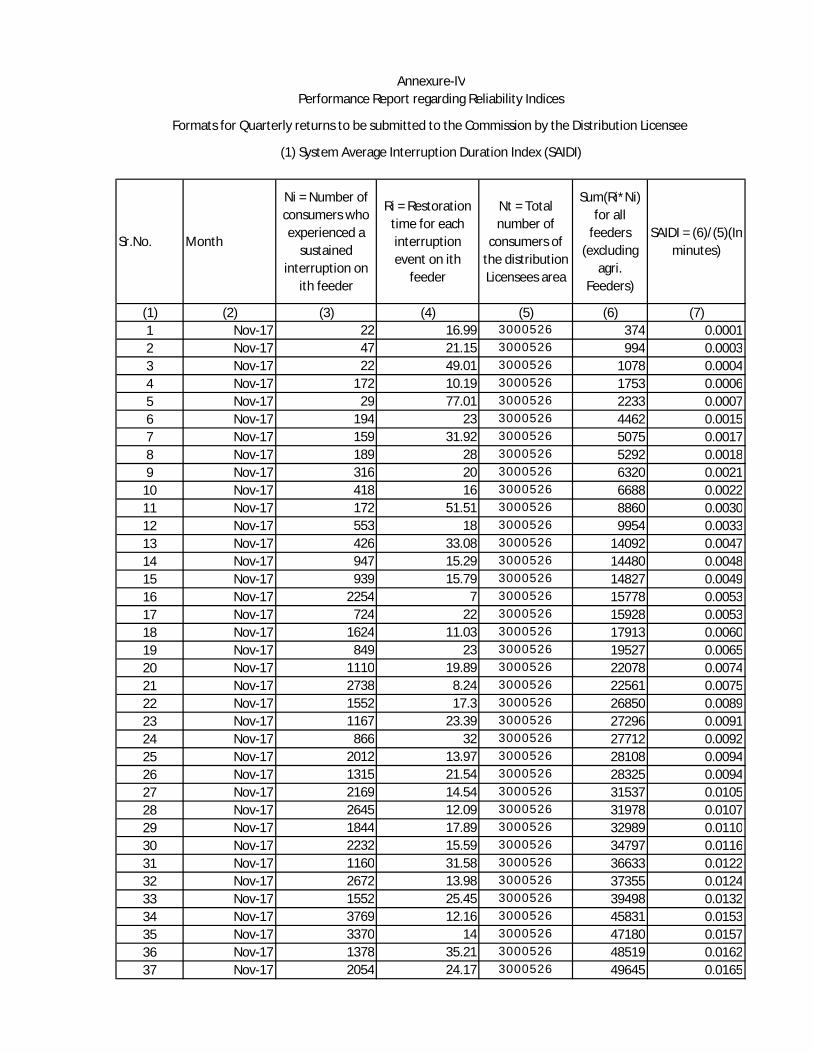
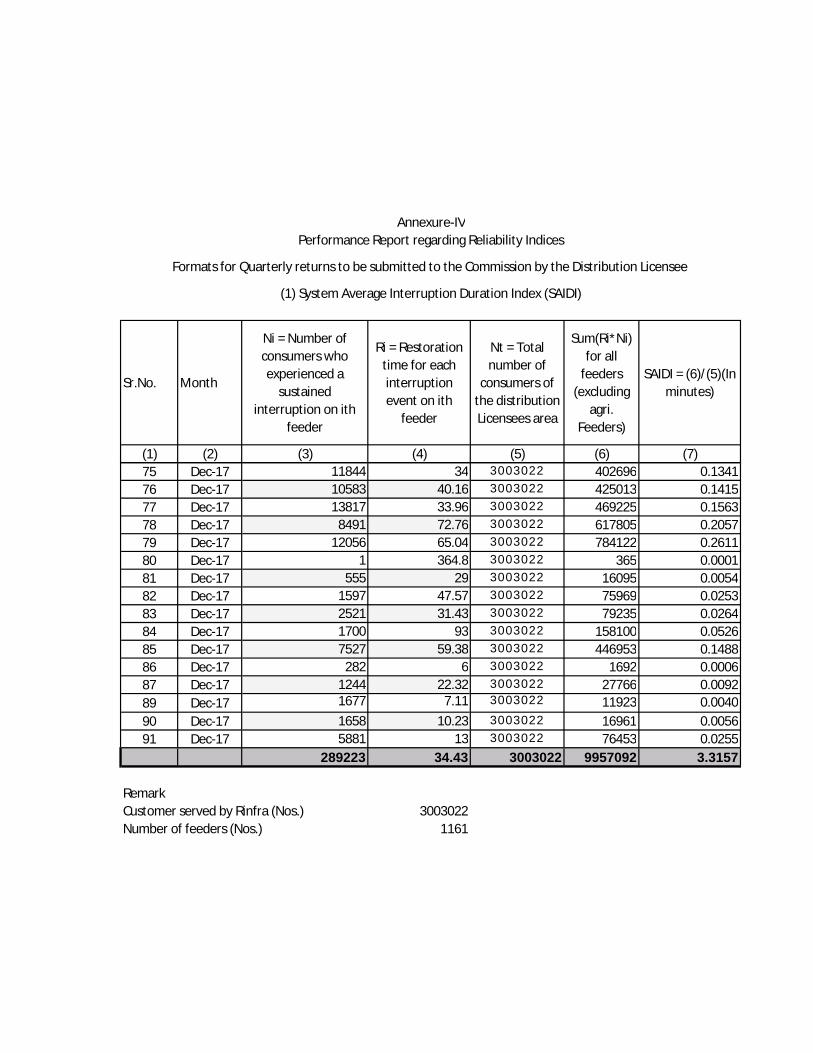
(1) System Average Interruption Duration Index (SAIDI)
Annexure-IVPerformance Report regarding Reliability Indices
Formats for Quarterly returns to be submitted to the Commission by the Distribution Licensee
Sr.No. Month
Ni = Number of consumers who experienced a
sustained interruption on
ith feeder
Ri = Restoration time for each interruption event on ith
feeder
Nt = Total number of
consumers of the distribution Licensees area
Sum(Ri*Ni) for all
feeders (excluding
agri. Feeders)
SAIDI = (6)/(5)(In minutes)
(1) (2) (3) (4) (5) (6) (7)
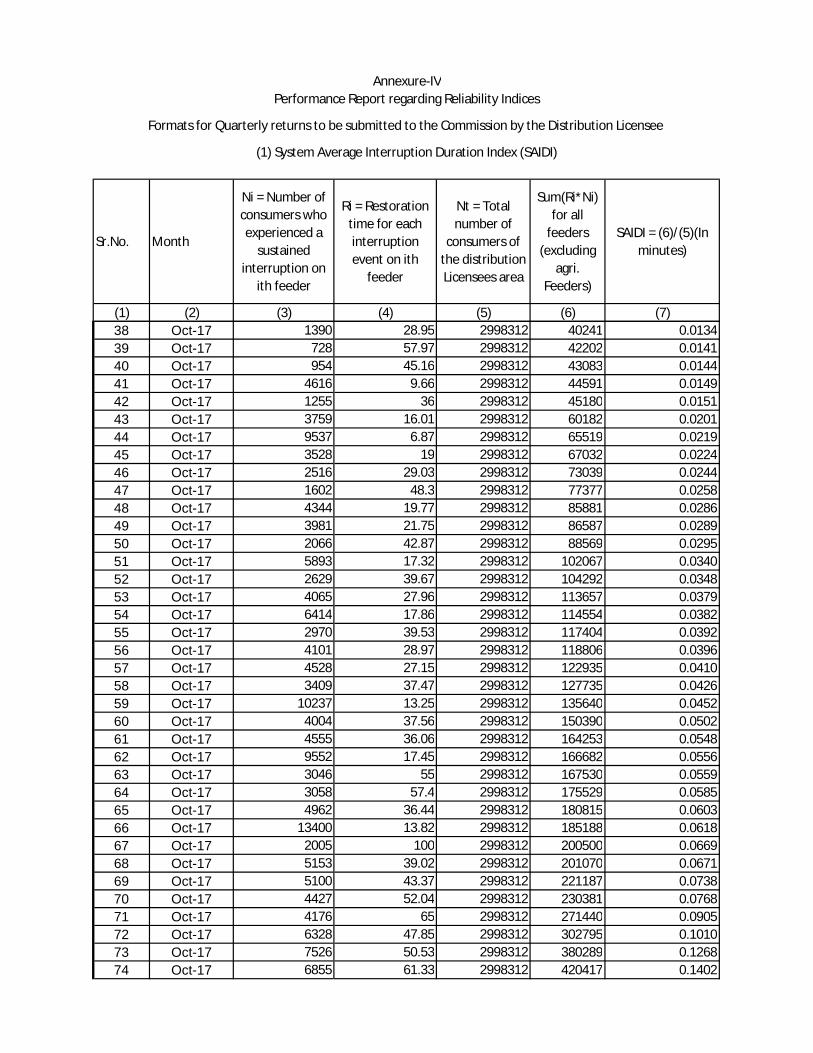
(1) System Average Interruption Duration Index (SAIDI)
Annexure-IVPerformance Report regarding Reliability Indices
Formats for Quarterly returns to be submitted to the Commission by the Distribution Licensee
38 Oct-17 1390 28.95 2998312 40241 0.013439 Oct-17 728 57.97 2998312 42202 0.014140 Oct-17 954 45.16 2998312 43083 0.014441 Oct-17 4616 9.66 2998312 44591 0.014942 Oct-17 1255 36 2998312 45180 0.015143 Oct-17 3759 16.01 2998312 60182 0.020144 Oct-17 9537 6.87 2998312 65519 0.021945 Oct-17 3528 19 2998312 67032 0.022446 Oct-17 2516 29.03 2998312 73039 0.024447 Oct-17 1602 48.3 2998312 77377 0.025848 Oct-17 4344 19.77 2998312 85881 0.028649 Oct-17 3981 21.75 2998312 86587 0.028950 Oct-17 2066 42.87 2998312 88569 0.029551 Oct-17 5893 17.32 2998312 102067 0.034052 Oct-17 2629 39.67 2998312 104292 0.034853 Oct-17 4065 27.96 2998312 113657 0.037954 Oct-17 6414 17.86 2998312 114554 0.038255 Oct-17 2970 39.53 2998312 117404 0.039256 Oct-17 4101 28.97 2998312 118806 0.039657 Oct-17 4528 27.15 2998312 122935 0.041058 Oct-17 3409 37.47 2998312 127735 0.042659 Oct-17 10237 13.25 2998312 135640 0.045260 Oct-17 4004 37.56 2998312 150390 0.050261 Oct-17 4555 36.06 2998312 164253 0.054862 Oct-17 9552 17.45 2998312 166682 0.055663 Oct-17 3046 55 2998312 167530 0.055964 Oct-17 3058 57.4 2998312 175529 0.058565 Oct-17 4962 36.44 2998312 180815 0.060366 Oct-17 13400 13.82 2998312 185188 0.061867 Oct-17 2005 100 2998312 200500 0.066968 Oct-17 5153 39.02 2998312 201070 0.067169 Oct-17 5100 43.37 2998312 221187 0.073870 Oct-17 4427 52.04 2998312 230381 0.076871 Oct-17 4176 65 2998312 271440 0.090572 Oct-17 6328 47.85 2998312 302795 0.101073 Oct-17 7526 50.53 2998312 380289 0.126874 Oct-17 6855 61.33 2998312 420417 0.1402
Sr.No. Month
Ni = Number of consumers who experienced a
sustained interruption on
ith feeder
Ri = Restoration time for each interruption event on ith
feeder
Nt = Total number of
consumers of the distribution Licensees area
Sum(Ri*Ni) for all
feeders (excluding
agri. Feeders)
SAIDI = (6)/(5)(In minutes)
(1) (2) (3) (4) (5) (6) (7)
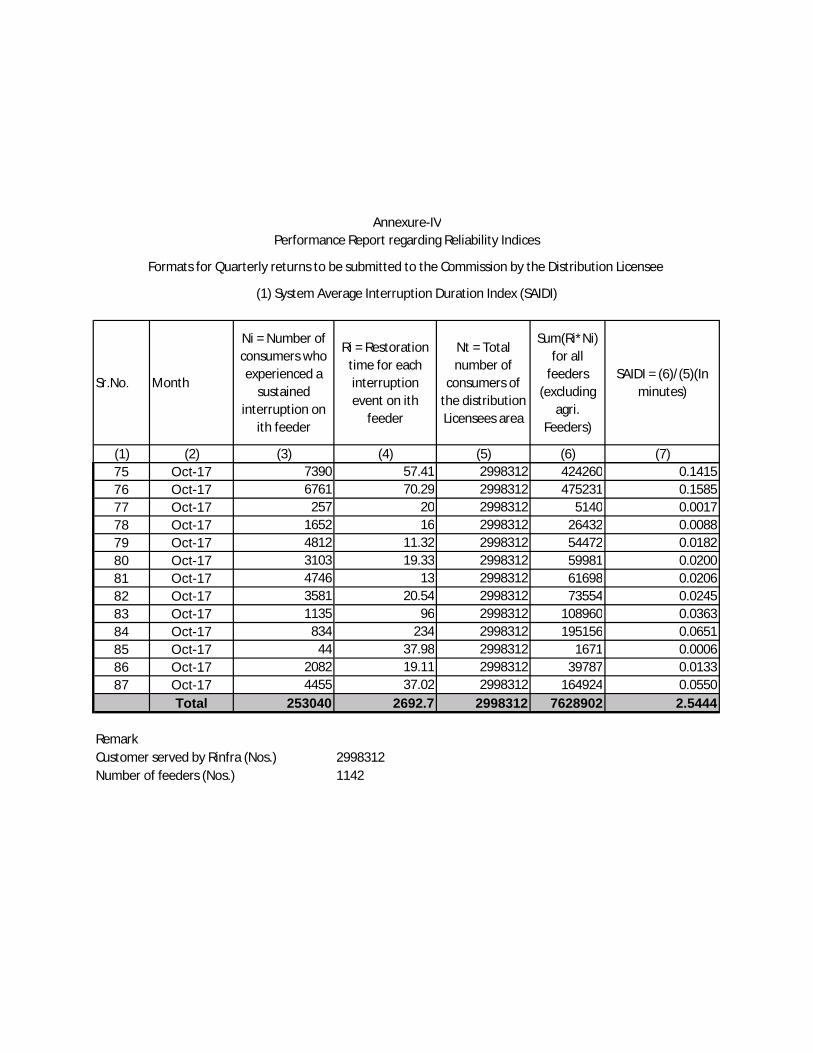
(1) System Average Interruption Duration Index (SAIDI)
Annexure-IVPerformance Report regarding Reliability Indices
Formats for Quarterly returns to be submitted to the Commission by the Distribution Licensee
75 Oct-17 7390 57.41 2998312 424260 0.141576 Oct-17 6761 70.29 2998312 475231 0.158577 Oct-17 257 20 2998312 5140 0.001778 Oct-17 1652 16 2998312 26432 0.008879 Oct-17 4812 11.32 2998312 54472 0.018280 Oct-17 3103 19.33 2998312 59981 0.020081 Oct-17 4746 13 2998312 61698 0.020682 Oct-17 3581 20.54 2998312 73554 0.024583 Oct-17 1135 96 2998312 108960 0.036384 Oct-17 834 234 2998312 195156 0.065185 Oct-17 44 37.98 2998312 1671 0.000686 Oct-17 2082 19.11 2998312 39787 0.013387 Oct-17 4455 37.02 2998312 164924 0.0550
Total 253040 2692.7 2998312 7628902 2.5444
RemarkCustomer served by Rinfra (Nos.) 2998312
Number of feeders (Nos.) 1142
Sr.No. Month
Ni = Number of consumers who experienced a
sustained interruption on
ith feeder
Ri = Restoration time for each interruption event on ith
feeder
Nt = Total number of
consumers of the distribution Licensees area
Sum(Ri*Ni) for all
feeders (excluding
agri. Feeders)
SAIDI = (6)/(5)(In minutes)
(1) (2) (3) (4) (5) (6) (7)1 Nov-17 22 16.99 3000526 374 0.00012 Nov-17 47 21.15 3000526 994 0.00033 Nov-17 22 49.01 3000526 1078 0.00044 Nov-17 172 10.19 3000526 1753 0.00065 Nov-17 29 77.01 3000526 2233 0.00076 Nov-17 194 23 3000526 4462 0.00157 Nov-17 159 31.92 3000526 5075 0.00178 Nov-17 189 28 3000526 5292 0.00189 Nov-17 316 20 3000526 6320 0.0021
10 Nov-17 418 16 3000526 6688 0.002211 Nov-17 172 51.51 3000526 8860 0.003012 Nov-17 553 18 3000526 9954 0.003313 Nov-17 426 33.08 3000526 14092 0.004714 Nov-17 947 15.29 3000526 14480 0.004815 Nov-17 939 15.79 3000526 14827 0.004916 Nov-17 2254 7 3000526 15778 0.005317 Nov-17 724 22 3000526 15928 0.005318 Nov-17 1624 11.03 3000526 17913 0.006019 Nov-17 849 23 3000526 19527 0.006520 Nov-17 1110 19.89 3000526 22078 0.007421 Nov-17 2738 8.24 3000526 22561 0.007522 Nov-17 1552 17.3 3000526 26850 0.008923 Nov-17 1167 23.39 3000526 27296 0.009124 Nov-17 866 32 3000526 27712 0.009225 Nov-17 2012 13.97 3000526 28108 0.009426 Nov-17 1315 21.54 3000526 28325 0.009427 Nov-17 2169 14.54 3000526 31537 0.010528 Nov-17 2645 12.09 3000526 31978 0.010729 Nov-17 1844 17.89 3000526 32989 0.011030 Nov-17 2232 15.59 3000526 34797 0.011631 Nov-17 1160 31.58 3000526 36633 0.012232 Nov-17 2672 13.98 3000526 37355 0.012433 Nov-17 1552 25.45 3000526 39498 0.013234 Nov-17 3769 12.16 3000526 45831 0.015335 Nov-17 3370 14 3000526 47180 0.015736 Nov-17 1378 35.21 3000526 48519 0.016237 Nov-17 2054 24.17 3000526 49645 0.0165
(1) System Average Interruption Duration Index (SAIDI)
Annexure-IVPerformance Report regarding Reliability Indices
Formats for Quarterly returns to be submitted to the Commission by the Distribution Licensee

Sr.No. Month
Ni = Number of consumers who experienced a
sustained interruption on
ith feeder
Ri = Restoration time for each interruption event on ith
feeder
Nt = Total number of
consumers of the distribution Licensees area
Sum(Ri*Ni) for all
feeders (excluding
agri. Feeders)
SAIDI = (6)/(5)(In minutes)
(1) (2) (3) (4) (5) (6) (7)
(1) System Average Interruption Duration Index (SAIDI)
Annexure-IVPerformance Report regarding Reliability Indices
Formats for Quarterly returns to be submitted to the Commission by the Distribution Licensee
38 Nov-17 1598 32 3000526 51136 0.017039 Nov-17 3097 17.06 3000526 52835 0.017640 Nov-17 1296 41.97 3000526 54393 0.018141 Nov-17 2938 19.84 3000526 58290 0.019442 Nov-17 2112 29.17 3000526 61607 0.020543 Nov-17 3285 19.52 3000526 64123 0.021444 Nov-17 1996 35.58 3000526 71018 0.023745 Nov-17 2683 28.38 3000526 76144 0.025446 Nov-17 2653 29.05 3000526 77070 0.025747 Nov-17 13242 6 3000526 79452 0.026548 Nov-17 1691 48 3000526 81168 0.027149 Nov-17 5006 17 3000526 85102 0.028450 Nov-17 3362 28.09 3000526 94439 0.031551 Nov-17 4130 22.93 3000526 94701 0.031652 Nov-17 4101 24.5 3000526 100475 0.033553 Nov-17 2694 38.8 3000526 104527 0.034854 Nov-17 3157 33.71 3000526 106422 0.035555 Nov-17 3810 33.77 3000526 128664 0.042956 Nov-17 21557 6 3000526 129342 0.043157 Nov-17 8714 15.24 3000526 132801 0.044358 Nov-17 4518 29.42 3000526 132920 0.044359 Nov-17 5852 24.48 3000526 143257 0.047760 Nov-17 5339 28 3000526 149492 0.049861 Nov-17 5276 28.95 3000526 152740 0.050962 Nov-17 4425 35.84 3000526 158592 0.052963 Nov-17 5514 29.33 3000526 161726 0.053964 Nov-17 4130 40.93 3000526 169041 0.056365 Nov-17 1945 87.02 3000526 169254 0.056466 Nov-17 9552 17.75 3000526 169548 0.056567 Nov-17 9053 18.96 3000526 171645 0.057268 Nov-17 5006 36.44 3000526 182419 0.060869 Nov-17 6196 29.71 3000526 184083 0.061470 Nov-17 6196 30.15 3000526 186809 0.062371 Nov-17 6984 27.62 3000526 192898 0.064372 Nov-17 5065 40.24 3000526 203816 0.067973 Nov-17 5514 39.28 3000526 216590 0.072274 Nov-17 5786 38.66 3000526 223687 0.0745
Sr.No. Month
Ni = Number of consumers who experienced a
sustained interruption on
ith feeder
Ri = Restoration time for each interruption event on ith
feeder
Nt = Total number of
consumers of the distribution Licensees area
Sum(Ri*Ni) for all
feeders (excluding
agri. Feeders)
SAIDI = (6)/(5)(In minutes)
(1) (2) (3) (4) (5) (6) (7)
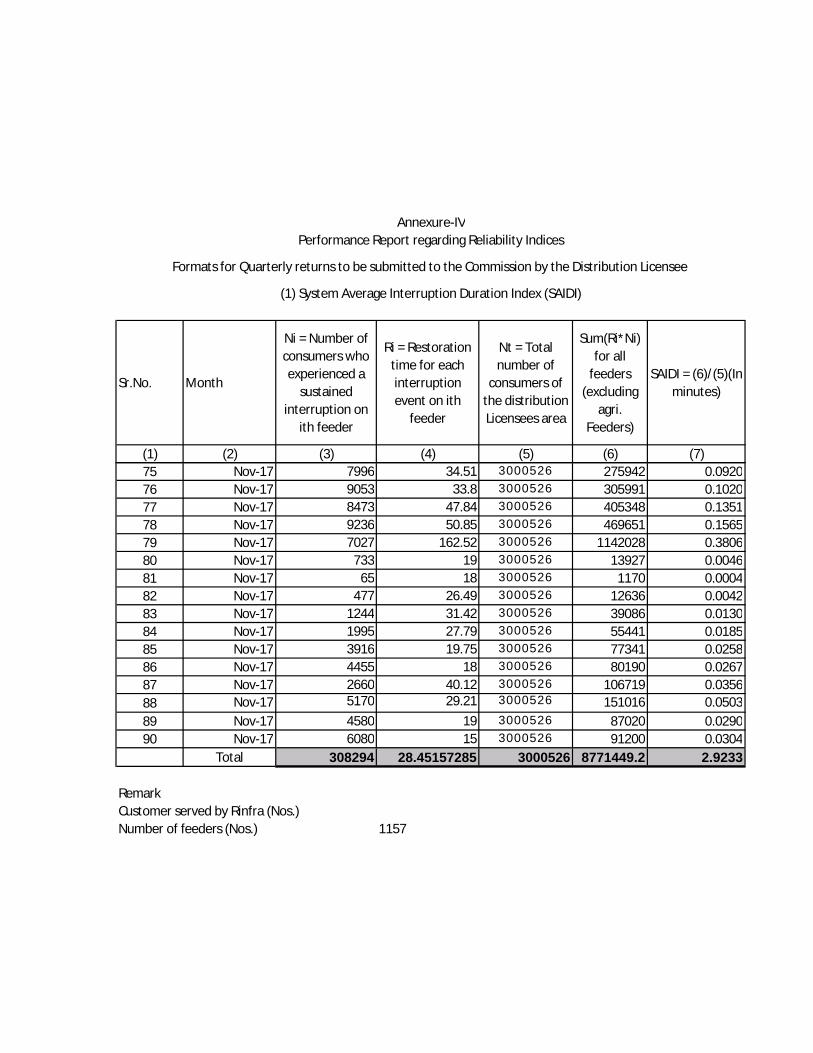
(1) System Average Interruption Duration Index (SAIDI)
Annexure-IVPerformance Report regarding Reliability Indices
Formats for Quarterly returns to be submitted to the Commission by the Distribution Licensee
75 Nov-17 7996 34.51 3000526 275942 0.092076 Nov-17 9053 33.8 3000526 305991 0.102077 Nov-17 8473 47.84 3000526 405348 0.135178 Nov-17 9236 50.85 3000526 469651 0.156579 Nov-17 7027 162.52 3000526 1142028 0.380680 Nov-17 733 19 3000526 13927 0.004681 Nov-17 65 18 3000526 1170 0.000482 Nov-17 477 26.49 3000526 12636 0.004283 Nov-17 1244 31.42 3000526 39086 0.013084 Nov-17 1995 27.79 3000526 55441 0.018585 Nov-17 3916 19.75 3000526 77341 0.025886 Nov-17 4455 18 3000526 80190 0.026787 Nov-17 2660 40.12 3000526 106719 0.035688 Nov-17 5170 29.21 3000526 151016 0.050389 Nov-17 4580 19 3000526 87020 0.029090 Nov-17 6080 15 3000526 91200 0.0304
Total 308294 28.45157285 3000526 8771449.2 2.9233
RemarkCustomer served by Rinfra (Nos.)
Number of feeders (Nos.) 1157
Sr.No. Month
Ni = Number of consumers who experienced a
sustained interruption on ith
feeder
Ri = Restoration time for each interruption event on ith
feeder
Nt = Total number of
consumers of the distribution Licensees area
Sum(Ri*Ni) for all
feeders (excluding
agri. Feeders)
SAIDI = (6)/(5)(In minutes)
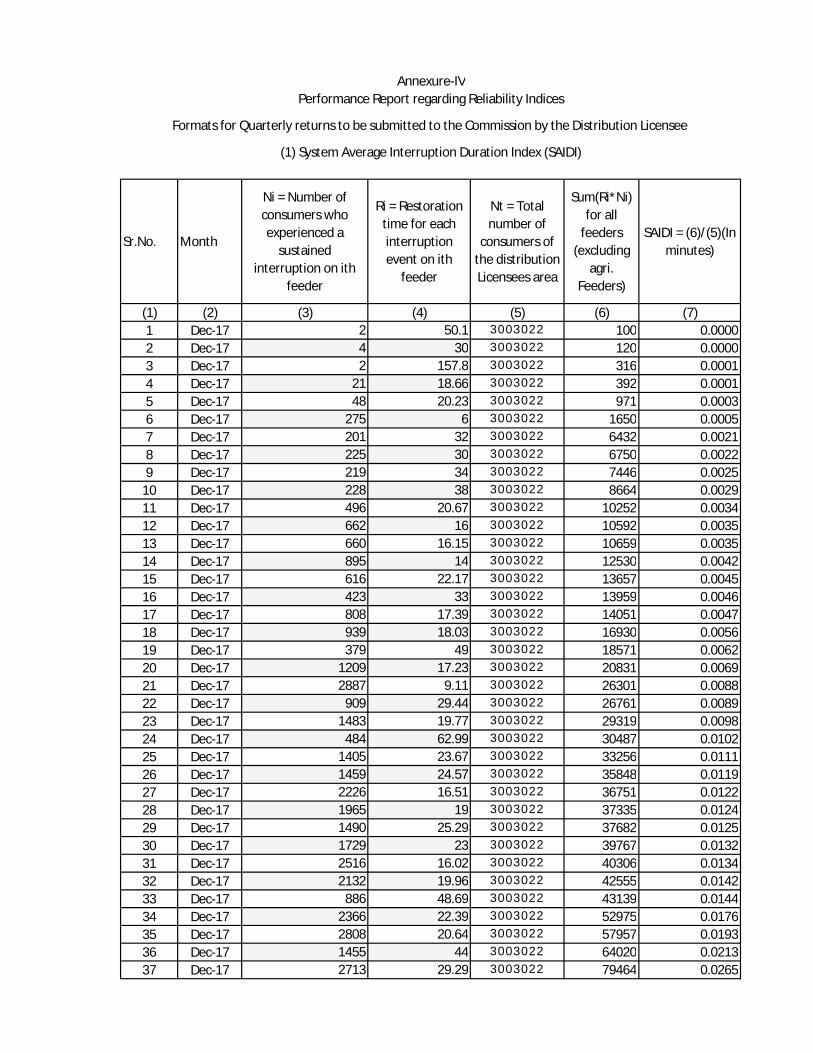
(1) (2) (3) (4) (5) (6) (7)1 Dec-17 2 50.1 3003022 100 0.00002 Dec-17 4 30 3003022 120 0.00003 Dec-17 2 157.8 3003022 316 0.00014 Dec-17 21 18.66 3003022 392 0.00015 Dec-17 48 20.23 3003022 971 0.00036 Dec-17 275 6 3003022 1650 0.00057 Dec-17 201 32 3003022 6432 0.00218 Dec-17 225 30 3003022 6750 0.00229 Dec-17 219 34 3003022 7446 0.0025
10 Dec-17 228 38 3003022 8664 0.002911 Dec-17 496 20.67 3003022 10252 0.003412 Dec-17 662 16 3003022 10592 0.003513 Dec-17 660 16.15 3003022 10659 0.003514 Dec-17 895 14 3003022 12530 0.004215 Dec-17 616 22.17 3003022 13657 0.004516 Dec-17 423 33 3003022 13959 0.004617 Dec-17 808 17.39 3003022 14051 0.004718 Dec-17 939 18.03 3003022 16930 0.005619 Dec-17 379 49 3003022 18571 0.006220 Dec-17 1209 17.23 3003022 20831 0.006921 Dec-17 2887 9.11 3003022 26301 0.008822 Dec-17 909 29.44 3003022 26761 0.008923 Dec-17 1483 19.77 3003022 29319 0.009824 Dec-17 484 62.99 3003022 30487 0.010225 Dec-17 1405 23.67 3003022 33256 0.011126 Dec-17 1459 24.57 3003022 35848 0.011927 Dec-17 2226 16.51 3003022 36751 0.012228 Dec-17 1965 19 3003022 37335 0.012429 Dec-17 1490 25.29 3003022 37682 0.012530 Dec-17 1729 23 3003022 39767 0.013231 Dec-17 2516 16.02 3003022 40306 0.013432 Dec-17 2132 19.96 3003022 42555 0.014233 Dec-17 886 48.69 3003022 43139 0.014434 Dec-17 2366 22.39 3003022 52975 0.017635 Dec-17 2808 20.64 3003022 57957 0.019336 Dec-17 1455 44 3003022 64020 0.021337 Dec-17 2713 29.29 3003022 79464 0.0265
(1) System Average Interruption Duration Index (SAIDI)
Annexure-IVPerformance Report regarding Reliability Indices
Formats for Quarterly returns to be submitted to the Commission by the Distribution Licensee
Sr.No. Month
Ni = Number of consumers who experienced a
sustained interruption on ith
feeder
Ri = Restoration time for each interruption event on ith
feeder
Nt = Total number of
consumers of the distribution Licensees area
Sum(Ri*Ni) for all
feeders (excluding
agri. Feeders)
SAIDI = (6)/(5)(In minutes)
(1) (2) (3) (4) (5) (6) (7)
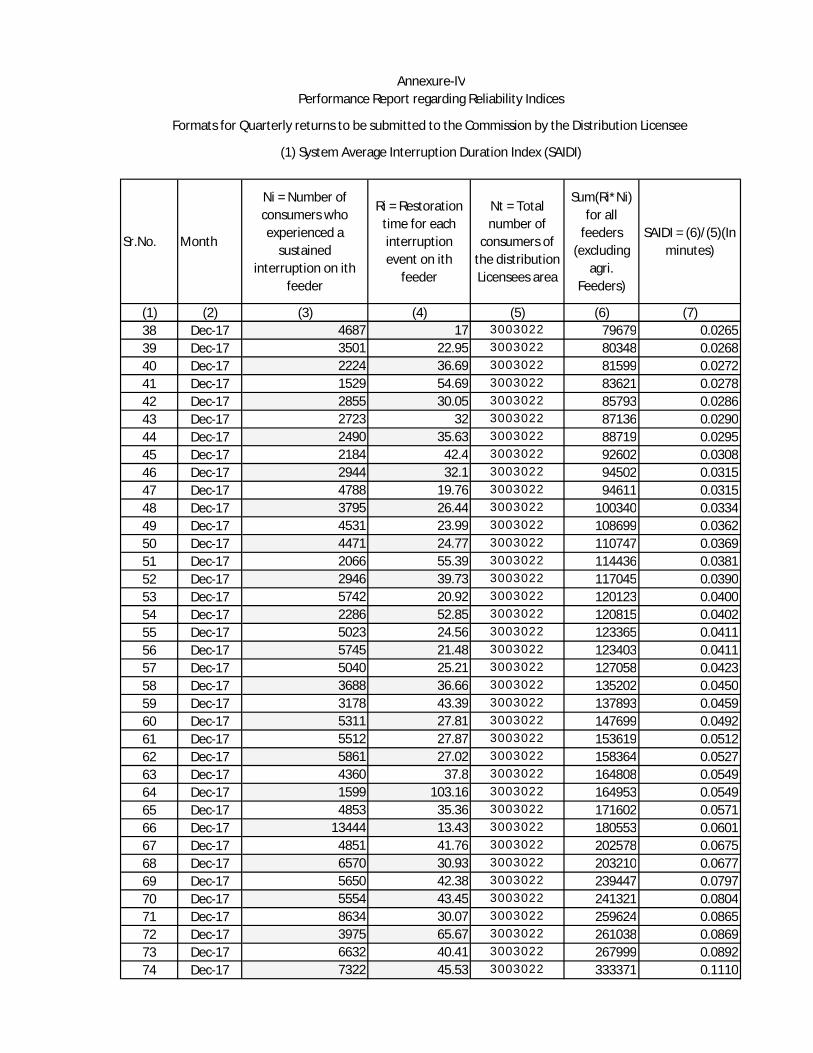
(1) System Average Interruption Duration Index (SAIDI)
Annexure-IVPerformance Report regarding Reliability Indices
Formats for Quarterly returns to be submitted to the Commission by the Distribution Licensee
38 Dec-17 4687 17 3003022 79679 0.026539 Dec-17 3501 22.95 3003022 80348 0.026840 Dec-17 2224 36.69 3003022 81599 0.027241 Dec-17 1529 54.69 3003022 83621 0.027842 Dec-17 2855 30.05 3003022 85793 0.028643 Dec-17 2723 32 3003022 87136 0.029044 Dec-17 2490 35.63 3003022 88719 0.029545 Dec-17 2184 42.4 3003022 92602 0.030846 Dec-17 2944 32.1 3003022 94502 0.031547 Dec-17 4788 19.76 3003022 94611 0.031548 Dec-17 3795 26.44 3003022 100340 0.033449 Dec-17 4531 23.99 3003022 108699 0.036250 Dec-17 4471 24.77 3003022 110747 0.036951 Dec-17 2066 55.39 3003022 114436 0.038152 Dec-17 2946 39.73 3003022 117045 0.039053 Dec-17 5742 20.92 3003022 120123 0.040054 Dec-17 2286 52.85 3003022 120815 0.040255 Dec-17 5023 24.56 3003022 123365 0.041156 Dec-17 5745 21.48 3003022 123403 0.041157 Dec-17 5040 25.21 3003022 127058 0.042358 Dec-17 3688 36.66 3003022 135202 0.045059 Dec-17 3178 43.39 3003022 137893 0.045960 Dec-17 5311 27.81 3003022 147699 0.049261 Dec-17 5512 27.87 3003022 153619 0.051262 Dec-17 5861 27.02 3003022 158364 0.052763 Dec-17 4360 37.8 3003022 164808 0.054964 Dec-17 1599 103.16 3003022 164953 0.054965 Dec-17 4853 35.36 3003022 171602 0.057166 Dec-17 13444 13.43 3003022 180553 0.060167 Dec-17 4851 41.76 3003022 202578 0.067568 Dec-17 6570 30.93 3003022 203210 0.067769 Dec-17 5650 42.38 3003022 239447 0.079770 Dec-17 5554 43.45 3003022 241321 0.080471 Dec-17 8634 30.07 3003022 259624 0.086572 Dec-17 3975 65.67 3003022 261038 0.086973 Dec-17 6632 40.41 3003022 267999 0.089274 Dec-17 7322 45.53 3003022 333371 0.1110
Sr.No. Month
Ni = Number of consumers who experienced a
sustained interruption on ith
feeder
Ri = Restoration time for each interruption event on ith
feeder
Nt = Total number of
consumers of the distribution Licensees area
Sum(Ri*Ni) for all
feeders (excluding
agri. Feeders)
SAIDI = (6)/(5)(In minutes)
(1) (2) (3) (4) (5) (6) (7)
(1) System Average Interruption Duration Index (SAIDI)
Annexure-IVPerformance Report regarding Reliability Indices
Formats for Quarterly returns to be submitted to the Commission by the Distribution Licensee
75 Dec-17 11844 34 3003022 402696 0.134176 Dec-17 10583 40.16 3003022 425013 0.141577 Dec-17 13817 33.96 3003022 469225 0.156378 Dec-17 8491 72.76 3003022 617805 0.205779 Dec-17 12056 65.04 3003022 784122 0.261180 Dec-17 1 364.8 3003022 365 0.000181 Dec-17 555 29 3003022 16095 0.005482 Dec-17 1597 47.57 3003022 75969 0.025383 Dec-17 2521 31.43 3003022 79235 0.026484 Dec-17 1700 93 3003022 158100 0.052685 Dec-17 7527 59.38 3003022 446953 0.148886 Dec-17 282 6 3003022 1692 0.000687 Dec-17 1244 22.32 3003022 27766 0.009289 Dec-17 1677 7.11 3003022 11923 0.004090 Dec-17 1658 10.23 3003022 16961 0.005691 Dec-17 5881 13 3003022 76453 0.0255
289223 34.43 3003022 9957092 3.3157
RemarkCustomer served by Rinfra (Nos.) 3003022
1161Number of feeders (Nos.)
Sr.No. Month
Ni = Number of consumers who experienced a
sustained interruption on
ith feeder
Sum of consumers of i feeders which
had experienced interruptions =
Sum Ni
Nt = Total number of
consumers of the distribution Licensees area
SAIFI = (4) / (5) (Events)
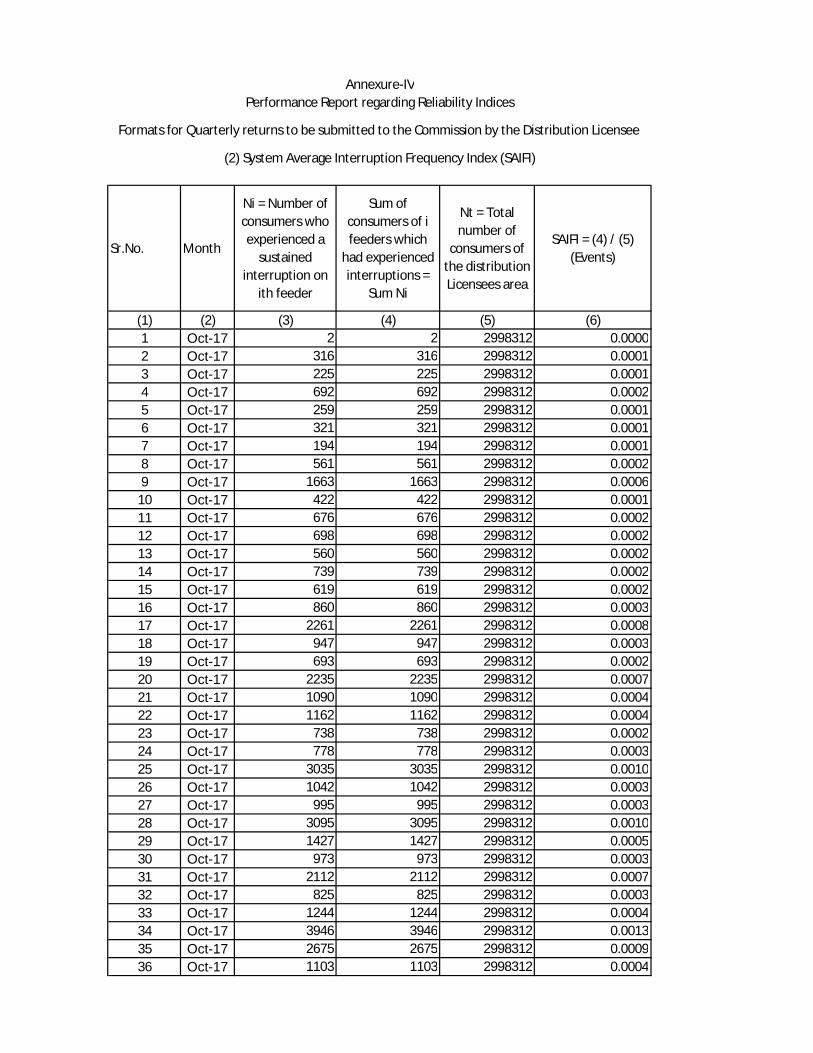
(1) (2) (3) (4) (5) (6)1 Oct-17 2 2 2998312 0.00002 Oct-17 316 316 2998312 0.00013 Oct-17 225 225 2998312 0.00014 Oct-17 692 692 2998312 0.00025 Oct-17 259 259 2998312 0.00016 Oct-17 321 321 2998312 0.00017 Oct-17 194 194 2998312 0.00018 Oct-17 561 561 2998312 0.00029 Oct-17 1663 1663 2998312 0.0006
10 Oct-17 422 422 2998312 0.000111 Oct-17 676 676 2998312 0.000212 Oct-17 698 698 2998312 0.000213 Oct-17 560 560 2998312 0.000214 Oct-17 739 739 2998312 0.000215 Oct-17 619 619 2998312 0.000216 Oct-17 860 860 2998312 0.000317 Oct-17 2261 2261 2998312 0.000818 Oct-17 947 947 2998312 0.000319 Oct-17 693 693 2998312 0.000220 Oct-17 2235 2235 2998312 0.000721 Oct-17 1090 1090 2998312 0.000422 Oct-17 1162 1162 2998312 0.000423 Oct-17 738 738 2998312 0.000224 Oct-17 778 778 2998312 0.000325 Oct-17 3035 3035 2998312 0.001026 Oct-17 1042 1042 2998312 0.000327 Oct-17 995 995 2998312 0.000328 Oct-17 3095 3095 2998312 0.001029 Oct-17 1427 1427 2998312 0.000530 Oct-17 973 973 2998312 0.000331 Oct-17 2112 2112 2998312 0.000732 Oct-17 825 825 2998312 0.000333 Oct-17 1244 1244 2998312 0.000434 Oct-17 3946 3946 2998312 0.001335 Oct-17 2675 2675 2998312 0.000936 Oct-17 1103 1103 2998312 0.0004
Annexure-IVPerformance Report regarding Reliability Indices
Formats for Quarterly returns to be submitted to the Commission by the Distribution Licensee
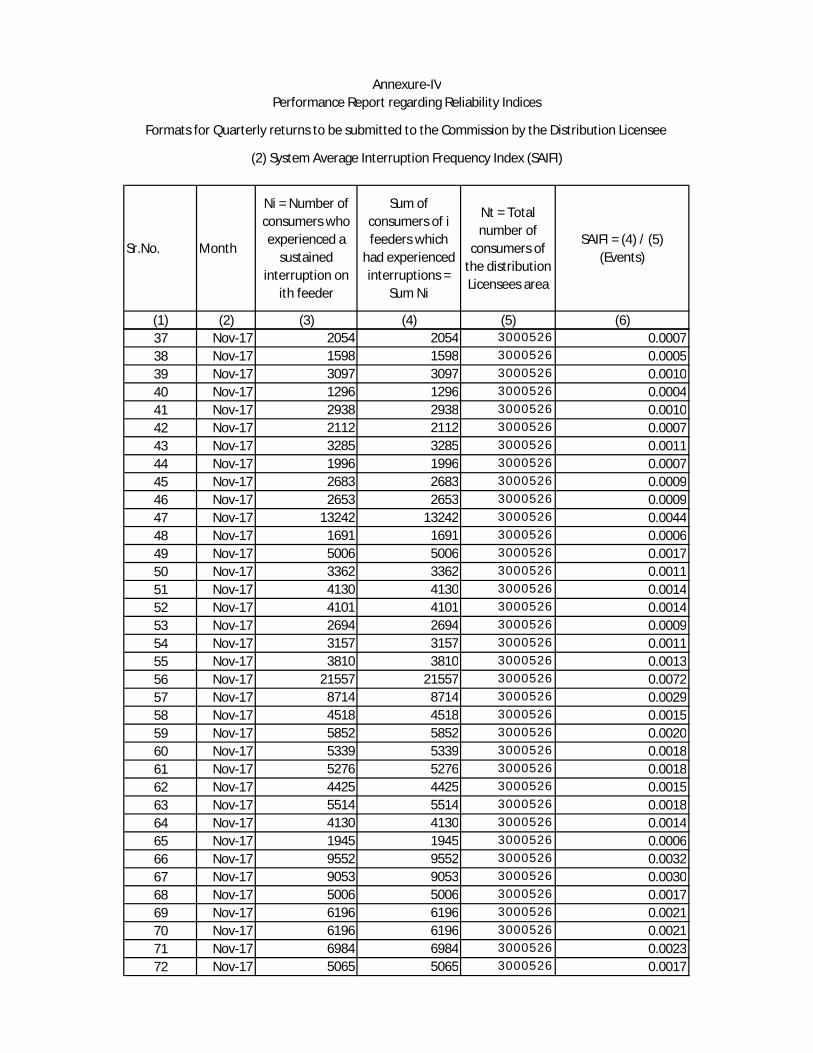
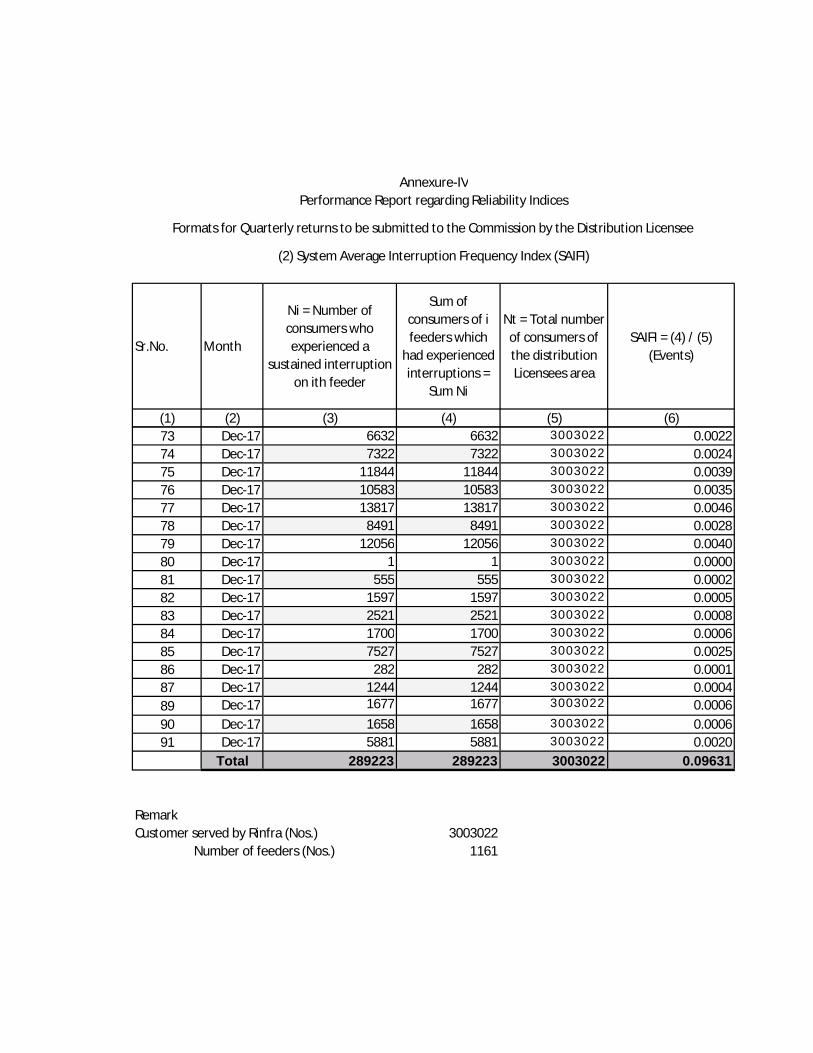
(2) System Average Interruption Frequency Index (SAIFI)
Sr.No. Month
Ni = Number of consumers who experienced a
sustained interruption on
ith feeder
Sum of consumers of i feeders which
had experienced interruptions =
Sum Ni
Nt = Total number of
consumers of the distribution Licensees area
SAIFI = (4) / (5) (Events)
(1) (2) (3) (4) (5) (6)
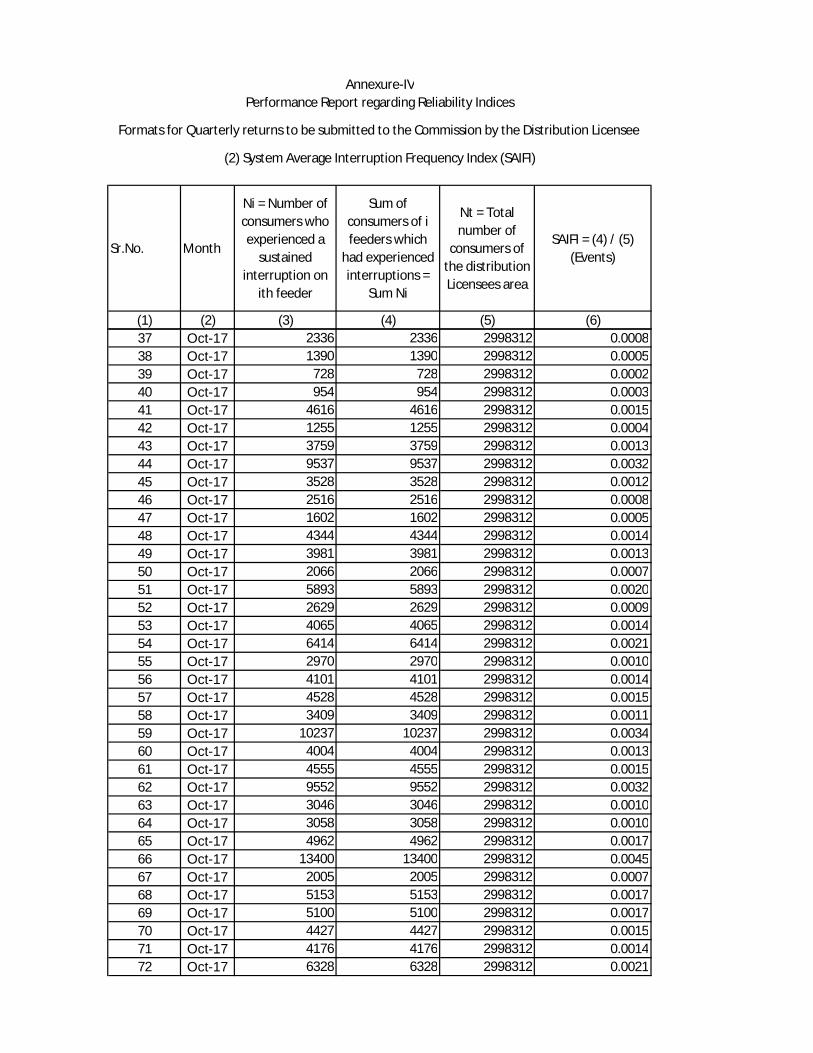
Annexure-IVPerformance Report regarding Reliability Indices
Formats for Quarterly returns to be submitted to the Commission by the Distribution Licensee
(2) System Average Interruption Frequency Index (SAIFI)
37 Oct-17 2336 2336 2998312 0.000838 Oct-17 1390 1390 2998312 0.000539 Oct-17 728 728 2998312 0.000240 Oct-17 954 954 2998312 0.000341 Oct-17 4616 4616 2998312 0.001542 Oct-17 1255 1255 2998312 0.000443 Oct-17 3759 3759 2998312 0.001344 Oct-17 9537 9537 2998312 0.003245 Oct-17 3528 3528 2998312 0.001246 Oct-17 2516 2516 2998312 0.000847 Oct-17 1602 1602 2998312 0.000548 Oct-17 4344 4344 2998312 0.001449 Oct-17 3981 3981 2998312 0.001350 Oct-17 2066 2066 2998312 0.000751 Oct-17 5893 5893 2998312 0.002052 Oct-17 2629 2629 2998312 0.000953 Oct-17 4065 4065 2998312 0.001454 Oct-17 6414 6414 2998312 0.002155 Oct-17 2970 2970 2998312 0.001056 Oct-17 4101 4101 2998312 0.001457 Oct-17 4528 4528 2998312 0.001558 Oct-17 3409 3409 2998312 0.001159 Oct-17 10237 10237 2998312 0.003460 Oct-17 4004 4004 2998312 0.001361 Oct-17 4555 4555 2998312 0.001562 Oct-17 9552 9552 2998312 0.003263 Oct-17 3046 3046 2998312 0.001064 Oct-17 3058 3058 2998312 0.001065 Oct-17 4962 4962 2998312 0.001766 Oct-17 13400 13400 2998312 0.004567 Oct-17 2005 2005 2998312 0.000768 Oct-17 5153 5153 2998312 0.001769 Oct-17 5100 5100 2998312 0.001770 Oct-17 4427 4427 2998312 0.001571 Oct-17 4176 4176 2998312 0.001472 Oct-17 6328 6328 2998312 0.0021

Sr.No. Month
Ni = Number of consumers who experienced a
sustained interruption on
ith feeder
Sum of consumers of i feeders which
had experienced interruptions =
Sum Ni
Nt = Total number of
consumers of the distribution Licensees area
SAIFI = (4) / (5) (Events)
(1) (2) (3) (4) (5) (6)
Annexure-IVPerformance Report regarding Reliability Indices
Formats for Quarterly returns to be submitted to the Commission by the Distribution Licensee
(2) System Average Interruption Frequency Index (SAIFI)
73 Oct-17 7526 7526 2998312 0.002574 Oct-17 6855 6855 2998312 0.002375 Oct-17 7390 7390 2998312 0.002576 Oct-17 6761 6761 2998312 0.002377 Oct-17 257 257 2998312 0.000178 Oct-17 1652 1652 2998312 0.000679 Oct-17 4812 4812 2998312 0.001680 Oct-17 3103 3103 2998312 0.001081 Oct-17 4746 4746 2998312 0.001682 Oct-17 3581 3581 2998312 0.001283 Oct-17 1135 1135 2998312 0.000484 Oct-17 834 834 2998312 0.000385 Oct-17 44 44 2998312 0.000086 Oct-17 2082 2082 2998312 0.000787 Oct-17 4455 4455 2998312 0.0015
Total 253040 253040 2998312 0.0844
RemarkCustomer served by Rinfra (Nos.) 2998312
Number of feeders (Nos.) 1142
Sr.No. Month
Ni = Number of consumers who experienced a
sustained interruption on
ith feeder
Sum of consumers of i feeders which
had experienced interruptions =
Sum Ni
Nt = Total number of
consumers of the distribution Licensees area
SAIFI = (4) / (5) (Events)
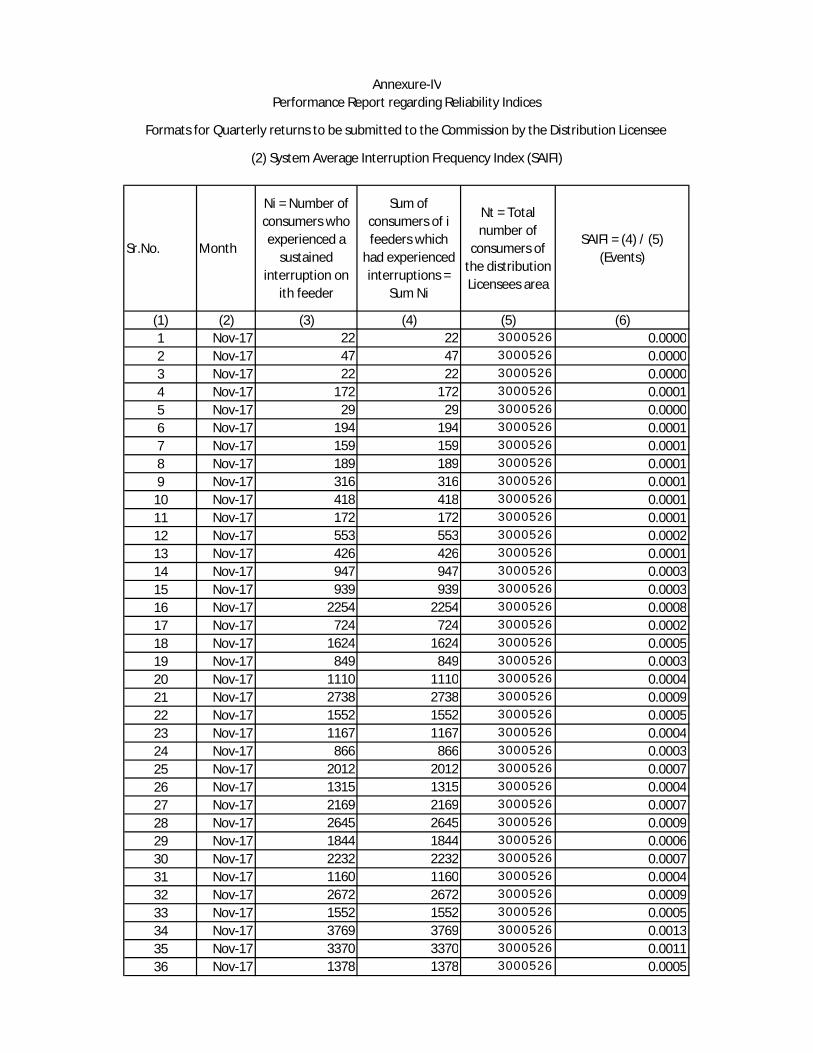
(1) (2) (3) (4) (5) (6)1 Nov-17 22 22 3000526 0.00002 Nov-17 47 47 3000526 0.00003 Nov-17 22 22 3000526 0.00004 Nov-17 172 172 3000526 0.00015 Nov-17 29 29 3000526 0.00006 Nov-17 194 194 3000526 0.00017 Nov-17 159 159 3000526 0.00018 Nov-17 189 189 3000526 0.00019 Nov-17 316 316 3000526 0.0001
10 Nov-17 418 418 3000526 0.000111 Nov-17 172 172 3000526 0.000112 Nov-17 553 553 3000526 0.000213 Nov-17 426 426 3000526 0.000114 Nov-17 947 947 3000526 0.000315 Nov-17 939 939 3000526 0.000316 Nov-17 2254 2254 3000526 0.000817 Nov-17 724 724 3000526 0.000218 Nov-17 1624 1624 3000526 0.000519 Nov-17 849 849 3000526 0.000320 Nov-17 1110 1110 3000526 0.000421 Nov-17 2738 2738 3000526 0.000922 Nov-17 1552 1552 3000526 0.000523 Nov-17 1167 1167 3000526 0.000424 Nov-17 866 866 3000526 0.000325 Nov-17 2012 2012 3000526 0.000726 Nov-17 1315 1315 3000526 0.000427 Nov-17 2169 2169 3000526 0.000728 Nov-17 2645 2645 3000526 0.000929 Nov-17 1844 1844 3000526 0.000630 Nov-17 2232 2232 3000526 0.000731 Nov-17 1160 1160 3000526 0.000432 Nov-17 2672 2672 3000526 0.000933 Nov-17 1552 1552 3000526 0.000534 Nov-17 3769 3769 3000526 0.001335 Nov-17 3370 3370 3000526 0.001136 Nov-17 1378 1378 3000526 0.0005
Formats for Quarterly returns to be submitted to the Commission by the Distribution Licensee
Annexure-IVPerformance Report regarding Reliability Indices
(2) System Average Interruption Frequency Index (SAIFI)
Sr.No. Month
Ni = Number of consumers who experienced a
sustained interruption on
ith feeder
Sum of consumers of i feeders which
had experienced interruptions =
Sum Ni
Nt = Total number of
consumers of the distribution Licensees area
SAIFI = (4) / (5) (Events)
(1) (2) (3) (4) (5) (6)
Formats for Quarterly returns to be submitted to the Commission by the Distribution Licensee
Annexure-IVPerformance Report regarding Reliability Indices
(2) System Average Interruption Frequency Index (SAIFI)
37 Nov-17 2054 2054 3000526 0.000738 Nov-17 1598 1598 3000526 0.000539 Nov-17 3097 3097 3000526 0.001040 Nov-17 1296 1296 3000526 0.000441 Nov-17 2938 2938 3000526 0.001042 Nov-17 2112 2112 3000526 0.000743 Nov-17 3285 3285 3000526 0.001144 Nov-17 1996 1996 3000526 0.000745 Nov-17 2683 2683 3000526 0.000946 Nov-17 2653 2653 3000526 0.000947 Nov-17 13242 13242 3000526 0.004448 Nov-17 1691 1691 3000526 0.000649 Nov-17 5006 5006 3000526 0.001750 Nov-17 3362 3362 3000526 0.001151 Nov-17 4130 4130 3000526 0.001452 Nov-17 4101 4101 3000526 0.001453 Nov-17 2694 2694 3000526 0.000954 Nov-17 3157 3157 3000526 0.001155 Nov-17 3810 3810 3000526 0.001356 Nov-17 21557 21557 3000526 0.007257 Nov-17 8714 8714 3000526 0.002958 Nov-17 4518 4518 3000526 0.001559 Nov-17 5852 5852 3000526 0.002060 Nov-17 5339 5339 3000526 0.001861 Nov-17 5276 5276 3000526 0.001862 Nov-17 4425 4425 3000526 0.001563 Nov-17 5514 5514 3000526 0.001864 Nov-17 4130 4130 3000526 0.001465 Nov-17 1945 1945 3000526 0.000666 Nov-17 9552 9552 3000526 0.003267 Nov-17 9053 9053 3000526 0.003068 Nov-17 5006 5006 3000526 0.001769 Nov-17 6196 6196 3000526 0.002170 Nov-17 6196 6196 3000526 0.002171 Nov-17 6984 6984 3000526 0.002372 Nov-17 5065 5065 3000526 0.0017
Sr.No. Month
Ni = Number of consumers who experienced a
sustained interruption on
ith feeder
Sum of consumers of i feeders which
had experienced interruptions =
Sum Ni
Nt = Total number of
consumers of the distribution Licensees area
SAIFI = (4) / (5) (Events)
(1) (2) (3) (4) (5) (6)
Formats for Quarterly returns to be submitted to the Commission by the Distribution Licensee
Annexure-IVPerformance Report regarding Reliability Indices
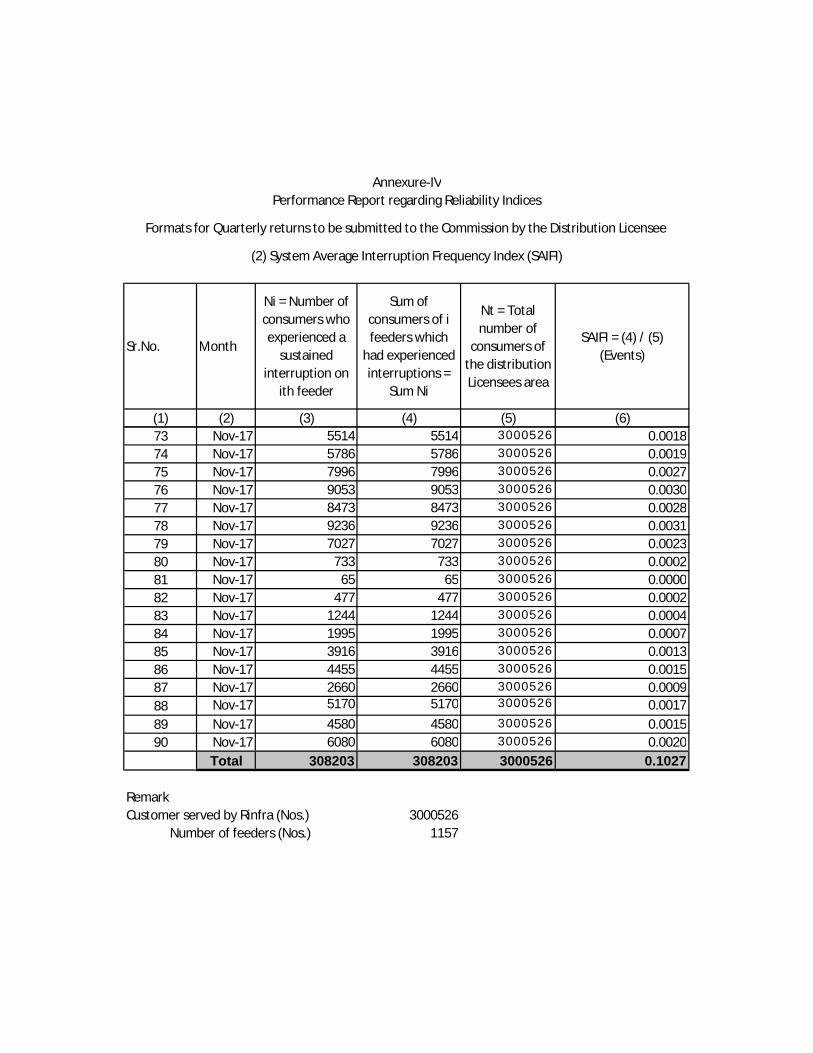
(2) System Average Interruption Frequency Index (SAIFI)
73 Nov-17 5514 5514 3000526 0.001874 Nov-17 5786 5786 3000526 0.001975 Nov-17 7996 7996 3000526 0.002776 Nov-17 9053 9053 3000526 0.003077 Nov-17 8473 8473 3000526 0.002878 Nov-17 9236 9236 3000526 0.003179 Nov-17 7027 7027 3000526 0.002380 Nov-17 733 733 3000526 0.000281 Nov-17 65 65 3000526 0.000082 Nov-17 477 477 3000526 0.000283 Nov-17 1244 1244 3000526 0.000484 Nov-17 1995 1995 3000526 0.000785 Nov-17 3916 3916 3000526 0.001386 Nov-17 4455 4455 3000526 0.001587 Nov-17 2660 2660 3000526 0.000988 Nov-17 5170 5170 3000526 0.001789 Nov-17 4580 4580 3000526 0.001590 Nov-17 6080 6080 3000526 0.0020
Total 308203 308203 3000526 0.1027
RemarkCustomer served by Rinfra (Nos.) 3000526
1157Number of feeders (Nos.)
Sr.No. Month
Ni = Number of consumers who experienced a
sustained interruption on ith feeder
Sum of consumers of i feeders which
had experienced interruptions =
Sum Ni
Nt = Total number of consumers of the distribution Licensees area
SAIFI = (4) / (5) (Events)
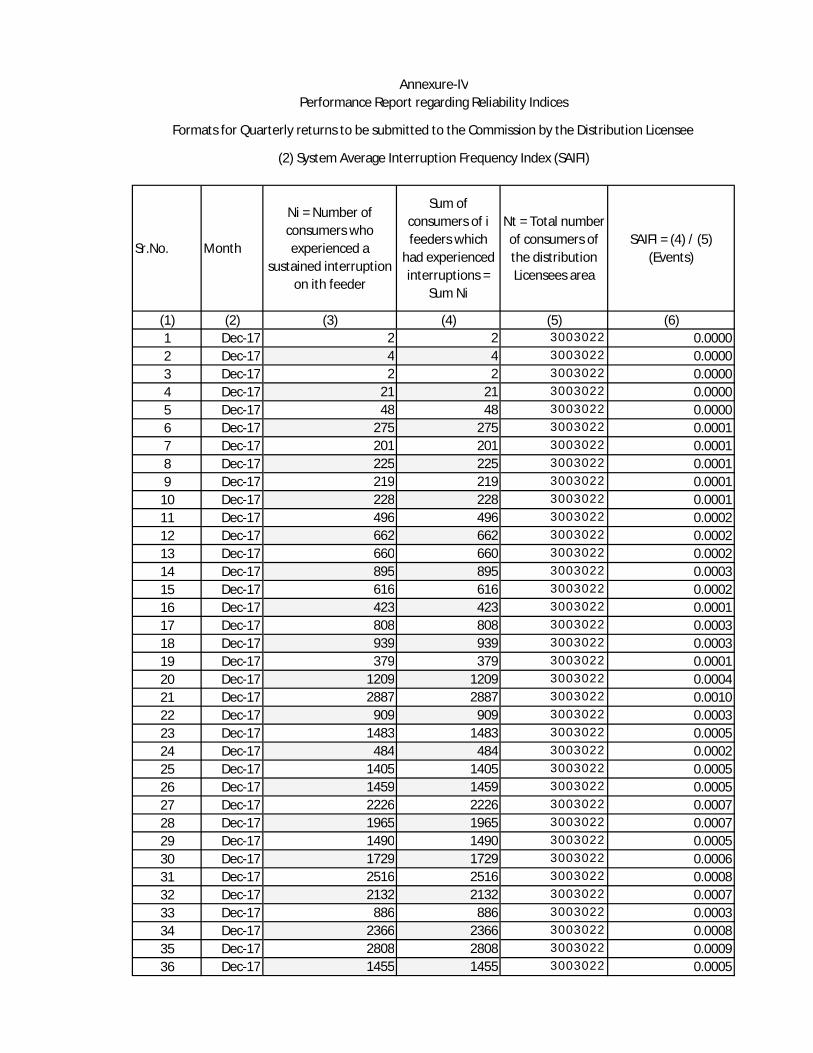
(1) (2) (3) (4) (5) (6)1 Dec-17 2 2 3003022 0.00002 Dec-17 4 4 3003022 0.00003 Dec-17 2 2 3003022 0.00004 Dec-17 21 21 3003022 0.00005 Dec-17 48 48 3003022 0.00006 Dec-17 275 275 3003022 0.00017 Dec-17 201 201 3003022 0.00018 Dec-17 225 225 3003022 0.00019 Dec-17 219 219 3003022 0.0001
10 Dec-17 228 228 3003022 0.000111 Dec-17 496 496 3003022 0.000212 Dec-17 662 662 3003022 0.000213 Dec-17 660 660 3003022 0.000214 Dec-17 895 895 3003022 0.000315 Dec-17 616 616 3003022 0.000216 Dec-17 423 423 3003022 0.000117 Dec-17 808 808 3003022 0.000318 Dec-17 939 939 3003022 0.000319 Dec-17 379 379 3003022 0.000120 Dec-17 1209 1209 3003022 0.000421 Dec-17 2887 2887 3003022 0.001022 Dec-17 909 909 3003022 0.000323 Dec-17 1483 1483 3003022 0.000524 Dec-17 484 484 3003022 0.000225 Dec-17 1405 1405 3003022 0.000526 Dec-17 1459 1459 3003022 0.000527 Dec-17 2226 2226 3003022 0.000728 Dec-17 1965 1965 3003022 0.000729 Dec-17 1490 1490 3003022 0.000530 Dec-17 1729 1729 3003022 0.000631 Dec-17 2516 2516 3003022 0.000832 Dec-17 2132 2132 3003022 0.000733 Dec-17 886 886 3003022 0.000334 Dec-17 2366 2366 3003022 0.000835 Dec-17 2808 2808 3003022 0.000936 Dec-17 1455 1455 3003022 0.0005
Annexure-IVPerformance Report regarding Reliability Indices
Formats for Quarterly returns to be submitted to the Commission by the Distribution Licensee
(2) System Average Interruption Frequency Index (SAIFI)
Sr.No. Month
Ni = Number of consumers who experienced a
sustained interruption on ith feeder
Sum of consumers of i feeders which
had experienced interruptions =
Sum Ni
Nt = Total number of consumers of the distribution Licensees area
SAIFI = (4) / (5) (Events)
(1) (2) (3) (4) (5) (6)
Annexure-IVPerformance Report regarding Reliability Indices
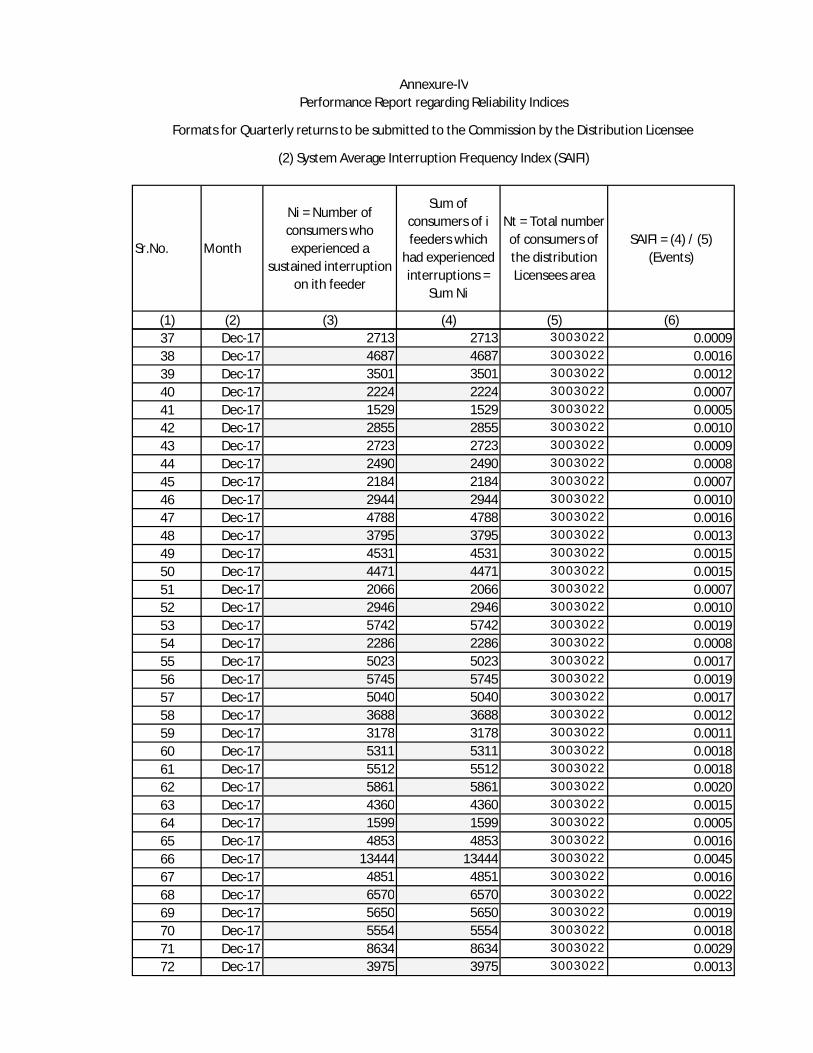
Formats for Quarterly returns to be submitted to the Commission by the Distribution Licensee
(2) System Average Interruption Frequency Index (SAIFI)
37 Dec-17 2713 2713 3003022 0.000938 Dec-17 4687 4687 3003022 0.001639 Dec-17 3501 3501 3003022 0.001240 Dec-17 2224 2224 3003022 0.000741 Dec-17 1529 1529 3003022 0.000542 Dec-17 2855 2855 3003022 0.001043 Dec-17 2723 2723 3003022 0.000944 Dec-17 2490 2490 3003022 0.000845 Dec-17 2184 2184 3003022 0.000746 Dec-17 2944 2944 3003022 0.001047 Dec-17 4788 4788 3003022 0.001648 Dec-17 3795 3795 3003022 0.001349 Dec-17 4531 4531 3003022 0.001550 Dec-17 4471 4471 3003022 0.001551 Dec-17 2066 2066 3003022 0.000752 Dec-17 2946 2946 3003022 0.001053 Dec-17 5742 5742 3003022 0.001954 Dec-17 2286 2286 3003022 0.000855 Dec-17 5023 5023 3003022 0.001756 Dec-17 5745 5745 3003022 0.001957 Dec-17 5040 5040 3003022 0.001758 Dec-17 3688 3688 3003022 0.001259 Dec-17 3178 3178 3003022 0.001160 Dec-17 5311 5311 3003022 0.001861 Dec-17 5512 5512 3003022 0.001862 Dec-17 5861 5861 3003022 0.002063 Dec-17 4360 4360 3003022 0.001564 Dec-17 1599 1599 3003022 0.000565 Dec-17 4853 4853 3003022 0.001666 Dec-17 13444 13444 3003022 0.004567 Dec-17 4851 4851 3003022 0.001668 Dec-17 6570 6570 3003022 0.002269 Dec-17 5650 5650 3003022 0.001970 Dec-17 5554 5554 3003022 0.001871 Dec-17 8634 8634 3003022 0.002972 Dec-17 3975 3975 3003022 0.0013
Sr.No. Month
Ni = Number of consumers who experienced a
sustained interruption on ith feeder
Sum of consumers of i feeders which
had experienced interruptions =
Sum Ni
Nt = Total number of consumers of the distribution Licensees area
SAIFI = (4) / (5) (Events)
(1) (2) (3) (4) (5) (6)
Annexure-IVPerformance Report regarding Reliability Indices
Formats for Quarterly returns to be submitted to the Commission by the Distribution Licensee
(2) System Average Interruption Frequency Index (SAIFI)
73 Dec-17 6632 6632 3003022 0.002274 Dec-17 7322 7322 3003022 0.002475 Dec-17 11844 11844 3003022 0.003976 Dec-17 10583 10583 3003022 0.003577 Dec-17 13817 13817 3003022 0.004678 Dec-17 8491 8491 3003022 0.002879 Dec-17 12056 12056 3003022 0.004080 Dec-17 1 1 3003022 0.000081 Dec-17 555 555 3003022 0.000282 Dec-17 1597 1597 3003022 0.000583 Dec-17 2521 2521 3003022 0.000884 Dec-17 1700 1700 3003022 0.000685 Dec-17 7527 7527 3003022 0.002586 Dec-17 282 282 3003022 0.000187 Dec-17 1244 1244 3003022 0.000489 Dec-17 1677 1677 3003022 0.000690 Dec-17 1658 1658 3003022 0.000691 Dec-17 5881 5881 3003022 0.0020
Total 289223 289223 3003022 0.09631
RemarkCustomer served by Rinfra (Nos.) 3003022
1161Number of feeders (Nos.)
Sr.No. Month SAIDI SAIFISAIDI/SAIFI (CAIDI in
Minutes)(1) (2) (3) (4) (5)1 Oct-17 0.0000 0.0000 24.00002 Oct-17 0.0012 0.0001 10.94003 Oct-17 0.0017 0.0001 22.00004 Oct-17 0.0018 0.0002 8.00005 Oct-17 0.0020 0.0001 22.96006 Oct-17 0.0022 0.0001 20.62007 Oct-17 0.0029 0.0001 45.00008 Oct-17 0.0036 0.0002 19.00009 Oct-17 0.0039 0.0006 7.0000
10 Oct-17 0.0040 0.0001 28.260011 Oct-17 0.0041 0.0002 18.000012 Oct-17 0.0045 0.0002 19.120013 Oct-17 0.0045 0.0002 24.000014 Oct-17 0.0045 0.0002 18.300015 Oct-17 0.0045 0.0002 22.000016 Oct-17 0.0049 0.0003 16.910017 Oct-17 0.0051 0.0008 6.730018 Oct-17 0.0052 0.0003 16.610019 Oct-17 0.0054 0.0002 23.370020 Oct-17 0.0057 0.0007 7.600021 Oct-17 0.0057 0.0004 15.590022 Oct-17 0.0058 0.0004 15.000023 Oct-17 0.0059 0.0002 24.020024 Oct-17 0.0060 0.0003 22.940025 Oct-17 0.0061 0.0010 6.000026 Oct-17 0.0066 0.0003 18.970027 Oct-17 0.0071 0.0003 21.280028 Oct-17 0.0084 0.0010 8.130029 Oct-17 0.0090 0.0005 19.000030 Oct-17 0.0091 0.0003 27.900031 Oct-17 0.0095 0.0007 13.460032 Oct-17 0.0095 0.0003 34.630033 Oct-17 0.0100 0.0004 24.000034 Oct-17 0.0105 0.0013 8.000035 Oct-17 0.0109 0.0009 12.190036 Oct-17 0.0114 0.0004 31.000037 Oct-17 0.0115 0.0008 14.780038 Oct-17 0.0134 0.0005 28.950039 Oct-17 0.0141 0.0002 57.970040 Oct-17 0.0144 0.0003 45.160041 Oct-17 0.0149 0.0015 9.660042 Oct-17 0.0151 0.0004 36.000043 Oct-17 0.0201 0.0013 16.010044 Oct-17 0.0219 0.0032 6.870045 Oct-17 0.0224 0.0012 19.000046 Oct-17 0.0244 0.0008 29.030047 Oct-17 0.0258 0.0005 48.300048 Oct-17 0.0286 0.0014 19.770049 Oct-17 0.0289 0.0013 21.750050 Oct-17 0.0295 0.0007 42.870051 Oct-17 0.0340 0.0020 17.320052 Oct-17 0.0348 0.0009 39.670053 Oct-17 0.0379 0.0014 27.960054 Oct-17 0.0382 0.0021 17.860055 Oct-17 0.0392 0.0010 39.530056 Oct-17 0.0396 0.0014 28.9700
Formats for Quarterly returns to be submitted to the Commission by the Distribution Licensee
Annexure-IVPerformance Report regarding Reliability Indices
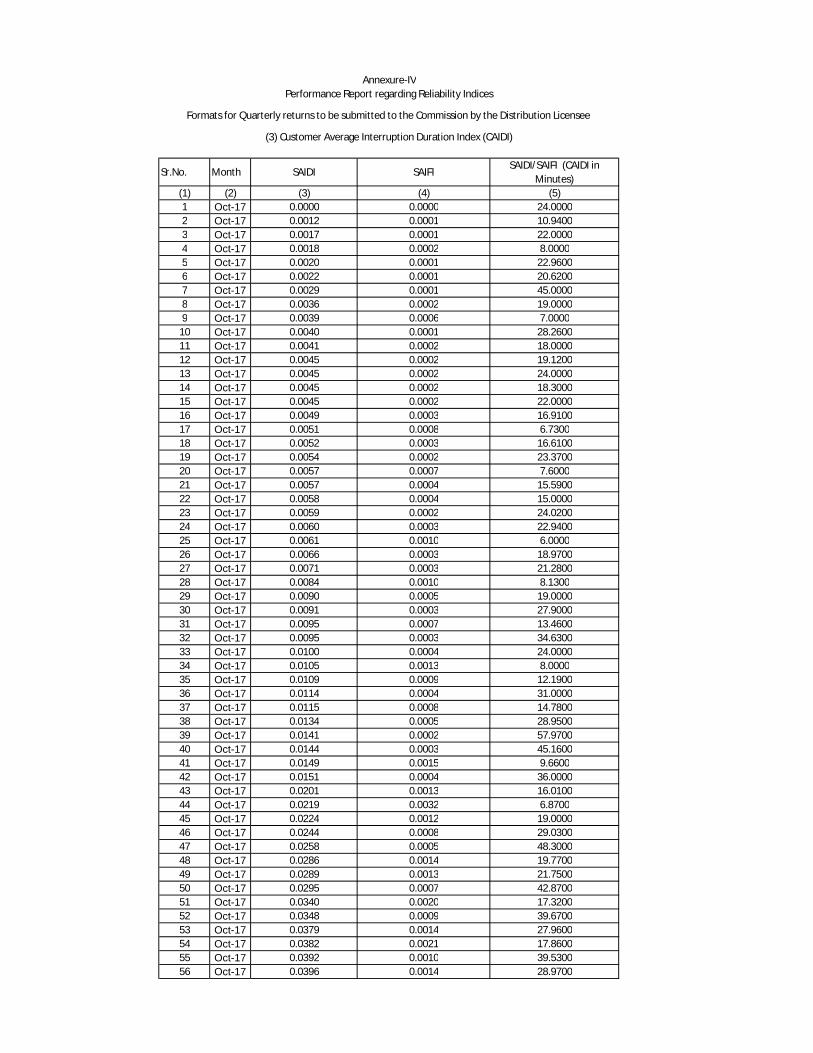
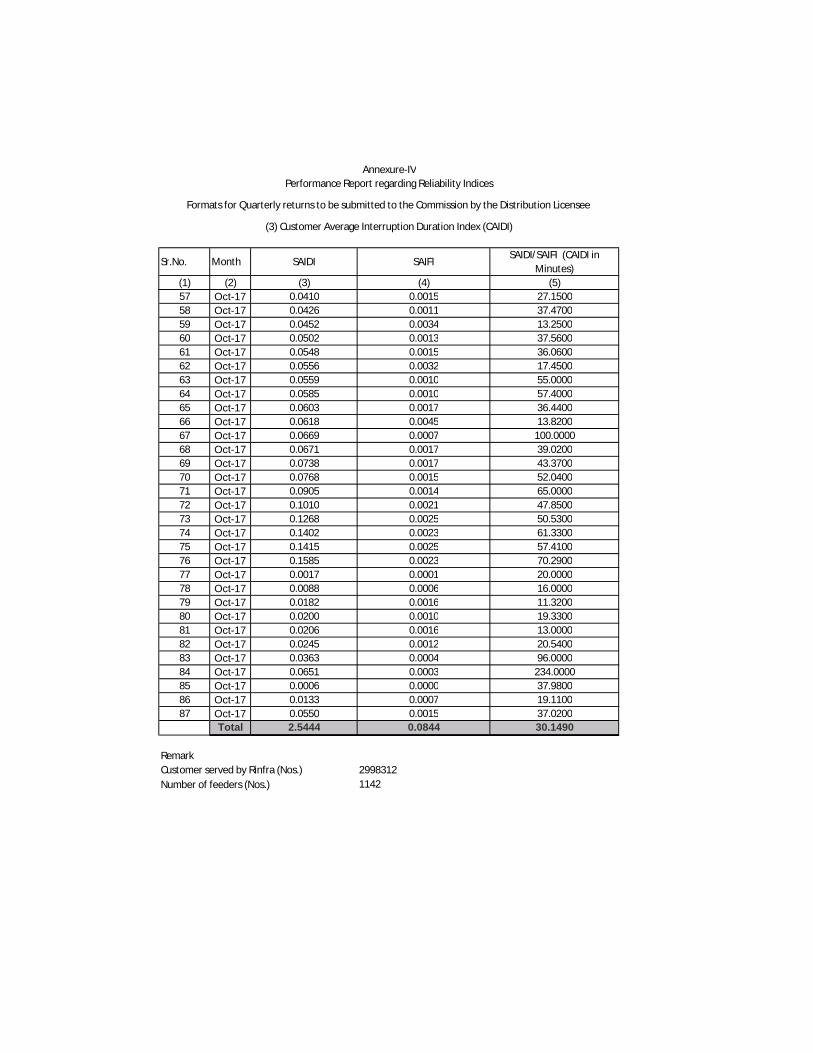
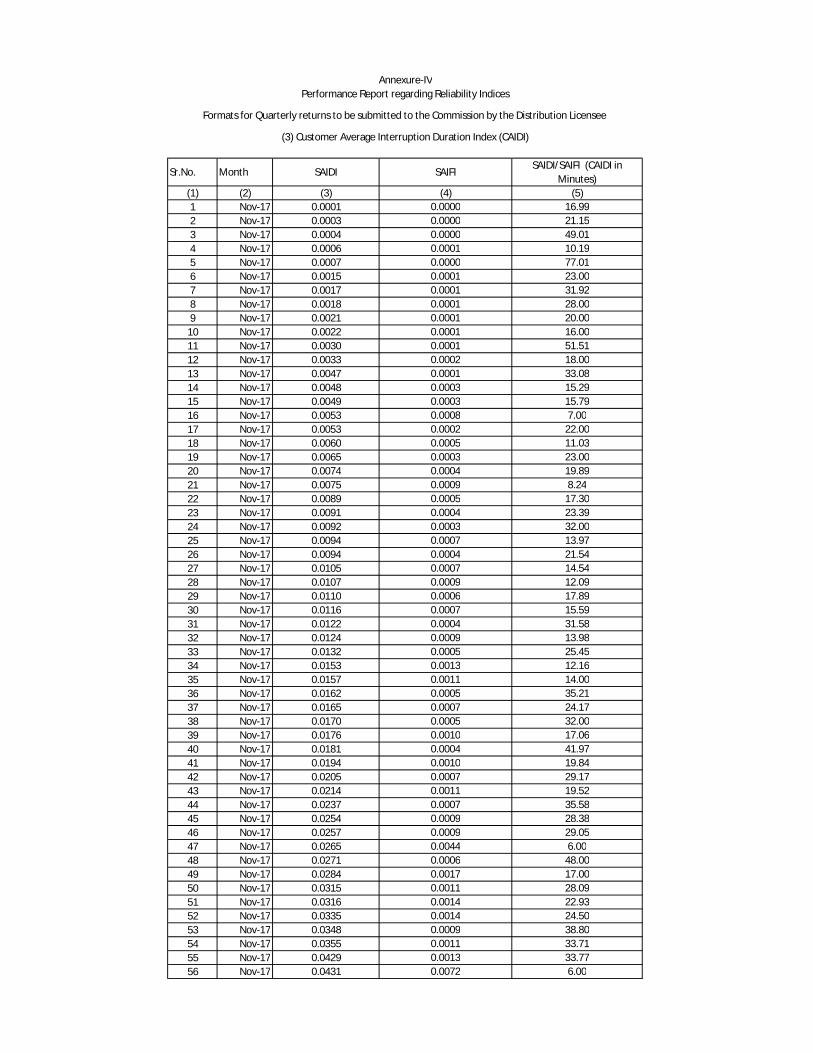
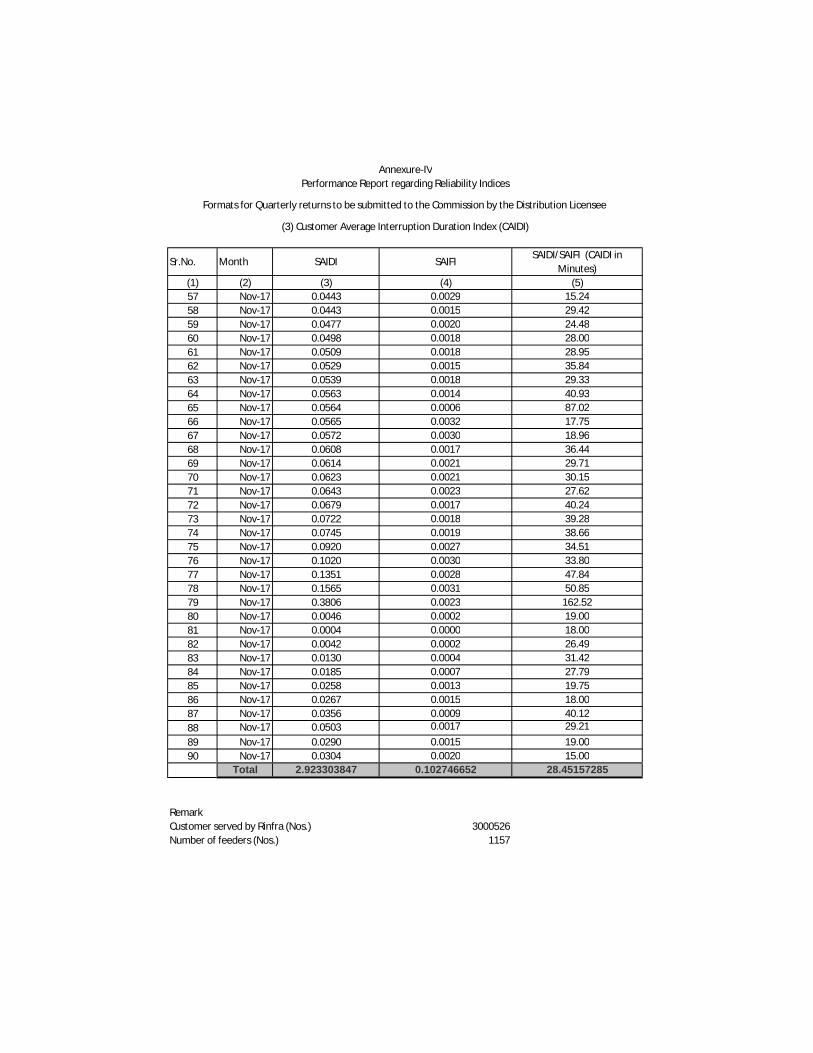
(3) Customer Average Interruption Duration Index (CAIDI)
Sr.No. Month SAIDI SAIFISAIDI/SAIFI (CAIDI in
Minutes)(1) (2) (3) (4) (5)
Formats for Quarterly returns to be submitted to the Commission by the Distribution Licensee
Annexure-IVPerformance Report regarding Reliability Indices
(3) Customer Average Interruption Duration Index (CAIDI)
57 Oct-17 0.0410 0.0015 27.150058 Oct-17 0.0426 0.0011 37.470059 Oct-17 0.0452 0.0034 13.250060 Oct-17 0.0502 0.0013 37.560061 Oct-17 0.0548 0.0015 36.060062 Oct-17 0.0556 0.0032 17.450063 Oct-17 0.0559 0.0010 55.000064 Oct-17 0.0585 0.0010 57.400065 Oct-17 0.0603 0.0017 36.440066 Oct-17 0.0618 0.0045 13.820067 Oct-17 0.0669 0.0007 100.000068 Oct-17 0.0671 0.0017 39.020069 Oct-17 0.0738 0.0017 43.370070 Oct-17 0.0768 0.0015 52.040071 Oct-17 0.0905 0.0014 65.000072 Oct-17 0.1010 0.0021 47.850073 Oct-17 0.1268 0.0025 50.530074 Oct-17 0.1402 0.0023 61.330075 Oct-17 0.1415 0.0025 57.410076 Oct-17 0.1585 0.0023 70.290077 Oct-17 0.0017 0.0001 20.000078 Oct-17 0.0088 0.0006 16.000079 Oct-17 0.0182 0.0016 11.320080 Oct-17 0.0200 0.0010 19.330081 Oct-17 0.0206 0.0016 13.000082 Oct-17 0.0245 0.0012 20.540083 Oct-17 0.0363 0.0004 96.000084 Oct-17 0.0651 0.0003 234.000085 Oct-17 0.0006 0.0000 37.980086 Oct-17 0.0133 0.0007 19.110087 Oct-17 0.0550 0.0015 37.0200
Total 2.5444 0.0844 30.1490
Customer served by Rinfra (Nos.) 2998312Number of feeders (Nos.) 1142
Remark
Sr.No. Month SAIDI SAIFISAIDI/SAIFI (CAIDI in
Minutes)(1) (2) (3) (4) (5)1 Nov-17 0.0001 0.0000 16.992 Nov-17 0.0003 0.0000 21.153 Nov-17 0.0004 0.0000 49.014 Nov-17 0.0006 0.0001 10.195 Nov-17 0.0007 0.0000 77.016 Nov-17 0.0015 0.0001 23.007 Nov-17 0.0017 0.0001 31.928 Nov-17 0.0018 0.0001 28.009 Nov-17 0.0021 0.0001 20.00
10 Nov-17 0.0022 0.0001 16.0011 Nov-17 0.0030 0.0001 51.5112 Nov-17 0.0033 0.0002 18.0013 Nov-17 0.0047 0.0001 33.0814 Nov-17 0.0048 0.0003 15.2915 Nov-17 0.0049 0.0003 15.7916 Nov-17 0.0053 0.0008 7.0017 Nov-17 0.0053 0.0002 22.0018 Nov-17 0.0060 0.0005 11.0319 Nov-17 0.0065 0.0003 23.0020 Nov-17 0.0074 0.0004 19.8921 Nov-17 0.0075 0.0009 8.2422 Nov-17 0.0089 0.0005 17.3023 Nov-17 0.0091 0.0004 23.3924 Nov-17 0.0092 0.0003 32.0025 Nov-17 0.0094 0.0007 13.9726 Nov-17 0.0094 0.0004 21.5427 Nov-17 0.0105 0.0007 14.5428 Nov-17 0.0107 0.0009 12.0929 Nov-17 0.0110 0.0006 17.8930 Nov-17 0.0116 0.0007 15.5931 Nov-17 0.0122 0.0004 31.5832 Nov-17 0.0124 0.0009 13.9833 Nov-17 0.0132 0.0005 25.4534 Nov-17 0.0153 0.0013 12.1635 Nov-17 0.0157 0.0011 14.0036 Nov-17 0.0162 0.0005 35.2137 Nov-17 0.0165 0.0007 24.1738 Nov-17 0.0170 0.0005 32.0039 Nov-17 0.0176 0.0010 17.0640 Nov-17 0.0181 0.0004 41.9741 Nov-17 0.0194 0.0010 19.8442 Nov-17 0.0205 0.0007 29.1743 Nov-17 0.0214 0.0011 19.5244 Nov-17 0.0237 0.0007 35.5845 Nov-17 0.0254 0.0009 28.3846 Nov-17 0.0257 0.0009 29.0547 Nov-17 0.0265 0.0044 6.0048 Nov-17 0.0271 0.0006 48.0049 Nov-17 0.0284 0.0017 17.0050 Nov-17 0.0315 0.0011 28.0951 Nov-17 0.0316 0.0014 22.9352 Nov-17 0.0335 0.0014 24.5053 Nov-17 0.0348 0.0009 38.8054 Nov-17 0.0355 0.0011 33.7155 Nov-17 0.0429 0.0013 33.7756 Nov-17 0.0431 0.0072 6.00
Formats for Quarterly returns to be submitted to the Commission by the Distribution Licensee
Annexure-IVPerformance Report regarding Reliability Indices
(3) Customer Average Interruption Duration Index (CAIDI)
Sr.No. Month SAIDI SAIFISAIDI/SAIFI (CAIDI in
Minutes)(1) (2) (3) (4) (5)
Formats for Quarterly returns to be submitted to the Commission by the Distribution Licensee
Annexure-IVPerformance Report regarding Reliability Indices
(3) Customer Average Interruption Duration Index (CAIDI)
57 Nov-17 0.0443 0.0029 15.2458 Nov-17 0.0443 0.0015 29.4259 Nov-17 0.0477 0.0020 24.4860 Nov-17 0.0498 0.0018 28.0061 Nov-17 0.0509 0.0018 28.9562 Nov-17 0.0529 0.0015 35.8463 Nov-17 0.0539 0.0018 29.3364 Nov-17 0.0563 0.0014 40.9365 Nov-17 0.0564 0.0006 87.0266 Nov-17 0.0565 0.0032 17.7567 Nov-17 0.0572 0.0030 18.9668 Nov-17 0.0608 0.0017 36.4469 Nov-17 0.0614 0.0021 29.7170 Nov-17 0.0623 0.0021 30.1571 Nov-17 0.0643 0.0023 27.6272 Nov-17 0.0679 0.0017 40.2473 Nov-17 0.0722 0.0018 39.2874 Nov-17 0.0745 0.0019 38.6675 Nov-17 0.0920 0.0027 34.5176 Nov-17 0.1020 0.0030 33.8077 Nov-17 0.1351 0.0028 47.8478 Nov-17 0.1565 0.0031 50.8579 Nov-17 0.3806 0.0023 162.5280 Nov-17 0.0046 0.0002 19.0081 Nov-17 0.0004 0.0000 18.0082 Nov-17 0.0042 0.0002 26.4983 Nov-17 0.0130 0.0004 31.4284 Nov-17 0.0185 0.0007 27.7985 Nov-17 0.0258 0.0013 19.7586 Nov-17 0.0267 0.0015 18.0087 Nov-17 0.0356 0.0009 40.1288 Nov-17 0.0503 0.0017 29.2189 Nov-17 0.0290 0.0015 19.0090 Nov-17 0.0304 0.0020 15.00
Total 2.923303847 0.102746652 28.45157285
RemarkCustomer served by Rinfra (Nos.) 3000526
1157Number of feeders (Nos.)
Sr.No. Month SAIDI SAIFI SAIDI/SAIFI (CAIDI in Minutes)
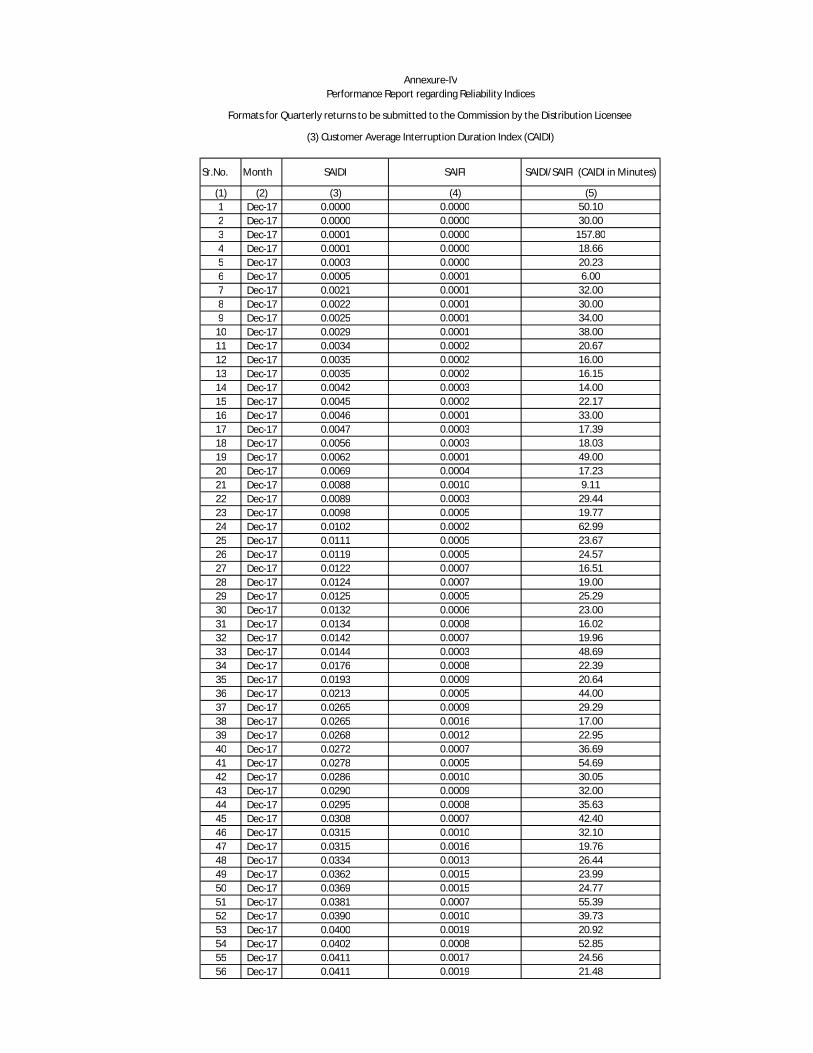
(1) (2) (3) (4) (5)1 Dec-17 0.0000 0.0000 50.102 Dec-17 0.0000 0.0000 30.003 Dec-17 0.0001 0.0000 157.804 Dec-17 0.0001 0.0000 18.665 Dec-17 0.0003 0.0000 20.236 Dec-17 0.0005 0.0001 6.007 Dec-17 0.0021 0.0001 32.008 Dec-17 0.0022 0.0001 30.009 Dec-17 0.0025 0.0001 34.00
10 Dec-17 0.0029 0.0001 38.0011 Dec-17 0.0034 0.0002 20.6712 Dec-17 0.0035 0.0002 16.0013 Dec-17 0.0035 0.0002 16.1514 Dec-17 0.0042 0.0003 14.0015 Dec-17 0.0045 0.0002 22.1716 Dec-17 0.0046 0.0001 33.0017 Dec-17 0.0047 0.0003 17.3918 Dec-17 0.0056 0.0003 18.0319 Dec-17 0.0062 0.0001 49.0020 Dec-17 0.0069 0.0004 17.2321 Dec-17 0.0088 0.0010 9.1122 Dec-17 0.0089 0.0003 29.4423 Dec-17 0.0098 0.0005 19.7724 Dec-17 0.0102 0.0002 62.9925 Dec-17 0.0111 0.0005 23.6726 Dec-17 0.0119 0.0005 24.5727 Dec-17 0.0122 0.0007 16.5128 Dec-17 0.0124 0.0007 19.0029 Dec-17 0.0125 0.0005 25.2930 Dec-17 0.0132 0.0006 23.0031 Dec-17 0.0134 0.0008 16.0232 Dec-17 0.0142 0.0007 19.9633 Dec-17 0.0144 0.0003 48.6934 Dec-17 0.0176 0.0008 22.3935 Dec-17 0.0193 0.0009 20.6436 Dec-17 0.0213 0.0005 44.0037 Dec-17 0.0265 0.0009 29.2938 Dec-17 0.0265 0.0016 17.0039 Dec-17 0.0268 0.0012 22.9540 Dec-17 0.0272 0.0007 36.6941 Dec-17 0.0278 0.0005 54.6942 Dec-17 0.0286 0.0010 30.0543 Dec-17 0.0290 0.0009 32.0044 Dec-17 0.0295 0.0008 35.6345 Dec-17 0.0308 0.0007 42.4046 Dec-17 0.0315 0.0010 32.1047 Dec-17 0.0315 0.0016 19.7648 Dec-17 0.0334 0.0013 26.4449 Dec-17 0.0362 0.0015 23.9950 Dec-17 0.0369 0.0015 24.7751 Dec-17 0.0381 0.0007 55.3952 Dec-17 0.0390 0.0010 39.7353 Dec-17 0.0400 0.0019 20.9254 Dec-17 0.0402 0.0008 52.8555 Dec-17 0.0411 0.0017 24.5656 Dec-17 0.0411 0.0019 21.48
Formats for Quarterly returns to be submitted to the Commission by the Distribution Licensee
Annexure-IVPerformance Report regarding Reliability Indices
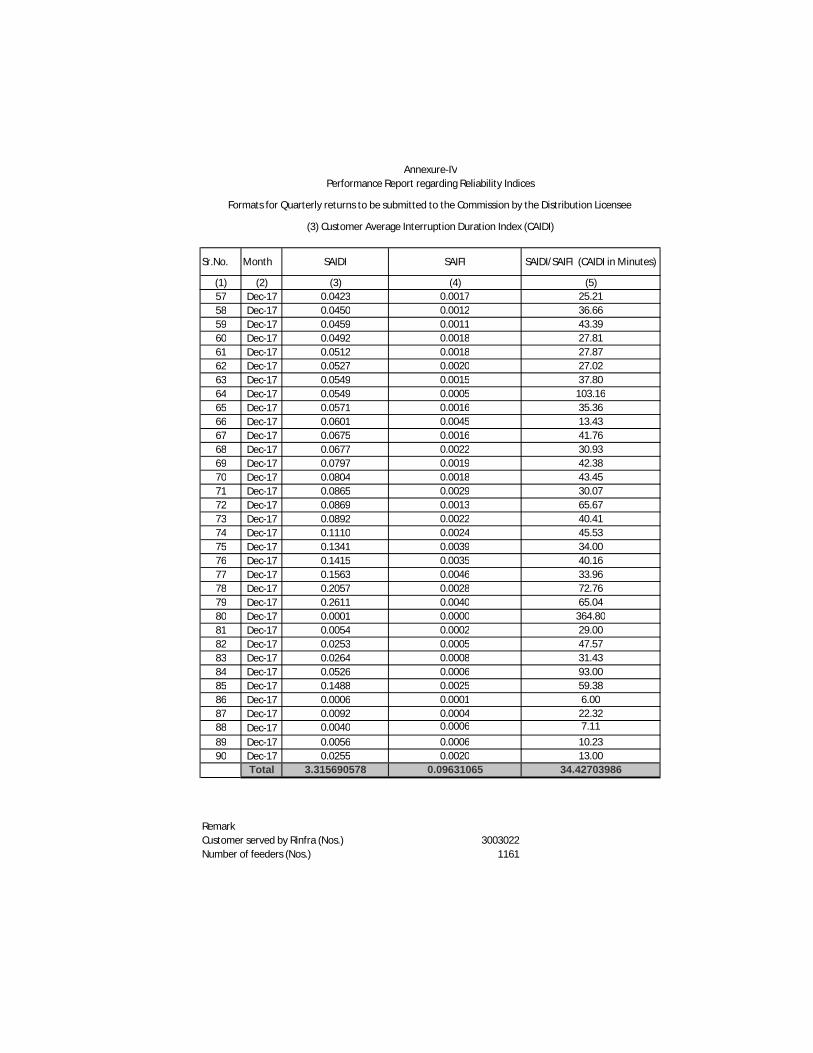
(3) Customer Average Interruption Duration Index (CAIDI)
Sr.No. Month SAIDI SAIFI SAIDI/SAIFI (CAIDI in Minutes)
(1) (2) (3) (4) (5)
Formats for Quarterly returns to be submitted to the Commission by the Distribution Licensee
Annexure-IVPerformance Report regarding Reliability Indices
(3) Customer Average Interruption Duration Index (CAIDI)
57 Dec-17 0.0423 0.0017 25.2158 Dec-17 0.0450 0.0012 36.6659 Dec-17 0.0459 0.0011 43.3960 Dec-17 0.0492 0.0018 27.8161 Dec-17 0.0512 0.0018 27.8762 Dec-17 0.0527 0.0020 27.0263 Dec-17 0.0549 0.0015 37.8064 Dec-17 0.0549 0.0005 103.1665 Dec-17 0.0571 0.0016 35.3666 Dec-17 0.0601 0.0045 13.4367 Dec-17 0.0675 0.0016 41.7668 Dec-17 0.0677 0.0022 30.9369 Dec-17 0.0797 0.0019 42.3870 Dec-17 0.0804 0.0018 43.4571 Dec-17 0.0865 0.0029 30.0772 Dec-17 0.0869 0.0013 65.6773 Dec-17 0.0892 0.0022 40.4174 Dec-17 0.1110 0.0024 45.5375 Dec-17 0.1341 0.0039 34.0076 Dec-17 0.1415 0.0035 40.1677 Dec-17 0.1563 0.0046 33.9678 Dec-17 0.2057 0.0028 72.7679 Dec-17 0.2611 0.0040 65.0480 Dec-17 0.0001 0.0000 364.8081 Dec-17 0.0054 0.0002 29.0082 Dec-17 0.0253 0.0005 47.5783 Dec-17 0.0264 0.0008 31.4384 Dec-17 0.0526 0.0006 93.0085 Dec-17 0.1488 0.0025 59.3886 Dec-17 0.0006 0.0001 6.0087 Dec-17 0.0092 0.0004 22.3288 Dec-17 0.0040 0.0006 7.1189 Dec-17 0.0056 0.0006 10.2390 Dec-17 0.0255 0.0020 13.00
Total 3.315690578 0.09631065 34.42703986
RemarkCustomer served by Rinfra (Nos.) 3003022
Number of feeders (Nos.) 1161