annexure - mpercmperc.nic.in/070116-mperc-formats-central-fy17.pdfmpmkvvcl annexure-i of arr/tariff...
TRANSCRIPT

MPMKVVCL Annexure-I of ARR/Tariff Petition FY-17
ANNEXURE - I
NAME OF DISTRIBUTION LICENSEE: MPMKVVCL Bhopal
INDEX OF ARR & TARIFF FILING FORMATS FOR DISTRIBUTION AND RETAIL SUPPLY LICENSEES
Financial Formats
1 Sheet S1 Statement of Profit & Loss2 Sheet S2 Balance Sheet3 Sheet S3 Share Capital and Reserves & Surplus4 Sheet S4 Current Assets and Liabilities5 Sheet S5 Financial Investments6 Sheet S6 Deferred Tax Asset/Liability7 Sheet S7 Other Long Term Liability8 Sheet S8 Long Term Loan & Advances
Expenses formats9 Sheet A1 Aggregate Revenue Requirement
10 Sheet F1 Power Purchase cost11 Sheet F1a Month-wise power procurement details12 Sheet F1b Energy Balance : Energy Input and Cost of Pool Power13 Sheet F1c Intra State Transmission (MPTRANSCO) Charges14 Sheet F1d Intra State Inter Discom UI details15 Sheet F1e Inter-State Transmission Charges16 Sheet F1f SLDC Charges17 Sheet F2 Gross Fixed Assets18 Sheet F2a Depreciation and provision for depreciation19 Sheet F2a(i) Fixed Assets - Historical Information20 Sheet F2b Investment Plan - Master21 Sheet F2b(i) Commissioning / Capitalisation Plan - Master22 Sheet F2b(ii) Year-wise Capital Expenditure23 Sheet F2b(iii) Financing of capitalised works24 Sheet F2c Capital Works in Progress - Summary Statement25 Sheet F2d Details of Expenses Capitalised26 Sheet F2e Contribution Grants & subsidies towards Capital assets27 Sheet F3 Interest & Finance charges28 Sheet F3a Calculation of weighted average rate of interest on actual loans29 Sheet F4 Working Capital Requirements30 Sheet F5 R&M Expenses31 Sheet F6 Employees' Cost & Provisions32 Sheet F7 Administration & General Expenses33 Sheet F8 Return on Equity34 Sheet F9 Statement of Sundry Debtors & provision for bad & doubtful debtors35 Sheet F10 Extraordinary Items36 Sheet F11 Net Prior Period Expenses/Income37 Sheet F12 Other expenses38 Sheet F13 Income Tax Provisions39 Sheet F14 Other income40 Sheet F14a Income from Miscellaneous Charges from consumers41 Sheet F14b Expenses and Income from Business other than Licensed business42 Sheet F15 Consumer Security Deposit43 Sheet F16 Lease Rental44 Sheet P1 T&D Losses in LT and HT System45 Sheet P2 Distribution Losses46 Sheet P3 Details of physical characterisitics of the network
Revenue formats47 Sheet R1 Monthly projection of sales in MU for the MYT Period48 Sheet R2 Summary of Actual / estimated Revenue from sale of power49 Sheet R3 Revenue from Current Tariff & Charges for LT consumers in urban area50 Sheet R4 Revenue from Current Tariff & Charges for LT consumers in rural area51 Sheet R5 Total Revenue from Current Tariff & Charges ( LT URBAN + RURAL AND HT)52 Sheet R6 Summary of revenues and gaps/surpluses across major categories53 Sheet R7 Income from Wheeling Charges

MPMKVVCL Annexure-I of ARR/Tariff Petition FY-17
Name of Distribution Licensee: MPMKVVCL BHOPALStatement of Profit & Loss Form No: S1
All figures in Rs Crores
Particulars Old Years PY CY
FY14 FY15 FY16 FY17 FY18 FY19
I. Revenue from operations (including Revenue Subsidy) R4a 5,391.27 6,064.38 7,092.86 8,121.28 9,228.23 10,599.07
II. Other income 304.07 155.69 190.57 191.60 209.30 187.47
III. Income from other business allocated to Licensed business F14 b - - - - - -
IV Total Revenue (I + II+III) 5,695.34 6,220.07 7,283.43 8,312.88 9,437.53 10,786.53
V Expenses:
Purchase of Power from MP Genco F1 5,775.34 6,208.66 7,204.30 8,176.70
Purchase of Power from Other Sources F1
Inter-State Transmission charges F1e 432.04 440.68 449.50 458.49
Intra-State Transmission (MP Transco) Charges F1c 657.29 - 725.07 775.82 830.13 888.24
SLDC Charges F1f 2.55 2.48 3.37 3.39 3.63 3.89
Depreciation and amortzation expenses F2a 224.33 230.50 314.23 378.40 372.12 361.49
Interest & Finance Charges F3 428.96 263.42 353.81 398.59 429.98 453.17
Repairs and Maintenance F5 49.00 33.59 151.10 177.74 206.83 237.09
Employee costs F6 644.42 808.50 970.25 883.25 957.39 1,034.57
Administration and General expenses F7 66.47 93.78 101.19 98.29 105.59 112.97
Net prior period credit charges F11 559.00 - - - - -
Other Debits, Write-offs F12 502.05 60.64 70.93 81.21 92.28 105.99
Lease Rental F16 - - - - - -Total Expenses 8,367.35 8,363.96 8,897.32 9,446.05 10,651.75 11,832.60
VI Profit before extraordinary items and tax (IV-V) (2,672.01) (2,143.89) (1,613.89) (1,133.17) (1,214.22) (1,046.06)
VII Extraordinary Items - - - - - -
VIII Profit before tax (2,672.01) (2,143.89) (1,613.89) (1,133.17) (1,214.22) (1,046.06)
IX Tax expense: - - - - - -
(1) Current tax
5,233.28
MYT 2016-17 to 2018-19
Form Ref:
6,871.06

MPMKVVCL Annexure-I of ARR/Tariff Petition FY-17
Name of Distribution Licensee: MPMKVVCL BHOPALStatement of Profit & Loss Form No: S1
All figures in Rs Crores
Particulars Old Years PY CY
FY14 FY15 FY16 FY17 FY18 FY19
MYT 2016-17 to 2018-19
Form Ref:
(2) Deferred tax
X Return on Equity 223.18 275.65 343.14 401.29 463.22 521.69
XI Profit (Loss) for the period from continuing operations (2,895.19) (2,419.54) (1,957.03) (1,534.47) (1,677.45) (1,567.76)
XII Profit/(loss) from discontinuing operations - - - - - -
XIII Tax expense of discontinuing operations - - - - - -
XIV Profit/(loss) from Discontinuing operations (after tax) - - - - - -
XIV Profit (Loss) for the period (2,895.19) (2,419.54) (1,957.03) (1,534.47) (1,677.45) (1,567.76)

MPMKVVCL Annexure-I of ARR/Tariff Petition FY-17
Name of Distribution Licensee : MPMKVVCL BHOPALBalance Sheet Form No: S2
All figures in Rs Crores
Particulars Old Years PY CY
FY14 FY15 FY16 FY17 FY18 FY19
I EQUITY AND LIABILITIES
(1) Shareholders’ funds
(a ) Share capital S3 1,834.72 2,587.00 2,587.01 2,625.20 2,625.20 2,625.20
(b ) Reserves and surplus S3 (7,394.35) (9,717.55) (11,203.87) (11,877.84) (12,957.90) (14,159.51)
(c ) Money received against share warrants - - - - - -
(2) Share application money pending allotmentS3 7.01 0.00 38.19 - - -
(3) Non-current liabilities
(a ) Long-term borrowings F3b 4,506.87 2,614.33 3,173.77 3,602.06 3,698.19 3,521.31
(b ) Deferred tax liabilities (Net) S6 - - - - - -
(c ) Other Long term liabilities S7 994.65 1,085.01 1,471.38 2,127.23 1,641.43 2,107.21
(d ) Long-term provisions S7 1,111.14 1,312.37 1,559.44 1,646.96 1,815.51 1,963.86
(e) Perpetual Loan F3b 4,485.72 8,384.82 8,920.57 9,590.57 9,590.57 9,590.57
(4) Current liabilities
(a ) Short-term borrowings S4 (0.00) 2,251.26 4,710.67 4,669.93 5,426.37 6,313.80
(b ) Trade payables S4 2,054.97 1,239.14 1,195.25 1,221.13 1,327.76 1,414.71
(c ) Other current liabilities S4 1,229.83 782.62 785.71 859.36 918.35 998.02
(d ) Short-term provisions S4 - - - - - -
(e) Consumer Contribution S4 28.48 31.79 35.10 38.41 41.72 45.03
TOTAL 8,859 10,571 13,273 14,503 14,127 14,420
II. ASSETS
(1)Non-current assets
(a) Fixed assets
Gross Block (Net of assets not in use) F2 5,404.73 6,569.44 7,727.95 8,992.54 10,308.42 11,428.88
less: Accumulated Depreciation F2a 1,768.63 1,999.13 2,313.37 2,691.77 3,063.89 3,425.38
Ref Form
MYT 2016-17 to 2018-19

MPMKVVCL Annexure-I of ARR/Tariff Petition FY-17
Name of Distribution Licensee : MPMKVVCL BHOPALBalance Sheet Form No: S2
All figures in Rs Crores
Particulars Old Years PY CY
FY14 FY15 FY16 FY17 FY18 FY19Ref Form
MYT 2016-17 to 2018-19
Net Block 3,636.10 4,570.31 5,414.59 6,300.78 7,244.53 8,003.50
Capital work-in-progress F2c 505.34 846.76 448.34 352.05 352.05 377.05
(b) Non-current investments S5 - - - - - -
(c) Deferred tax assets (net) S6 - - - - - -
(d) Long-term loans and advances given by UtilityS8 704.19 654.16 1,137.43 1,329.97 1,537.69 1,765.19
(e) Other non-current assets S8 - - - - - -
(2) Current assets
(a ) Current investments S4 - - - - - -
(b ) Inventories S4 396.18 310.30 347.66 400.94 456.65 526.03
(c ) Trade receivables S4 2,549.12 2,943.25 4,700.57 4,815.25 4,969.88 5,234.33
(d ) Cash and cash equivalents S4 630.67 754.18 708.38 718.97 (1,091.01) (2,231.33)
(e ) Short-term loans and advances S4 32.68 40.80 15.18 15.29 15.58 15.35
(f ) Other current assets S4 404.73 451.05 501.09 569.76 641.82 730.06
TOTAL 8,859 10,571 13,273 14,503 14,127 14,420

MPMKVVCL Annexure-I of ARR/Tariff Petition FY-17
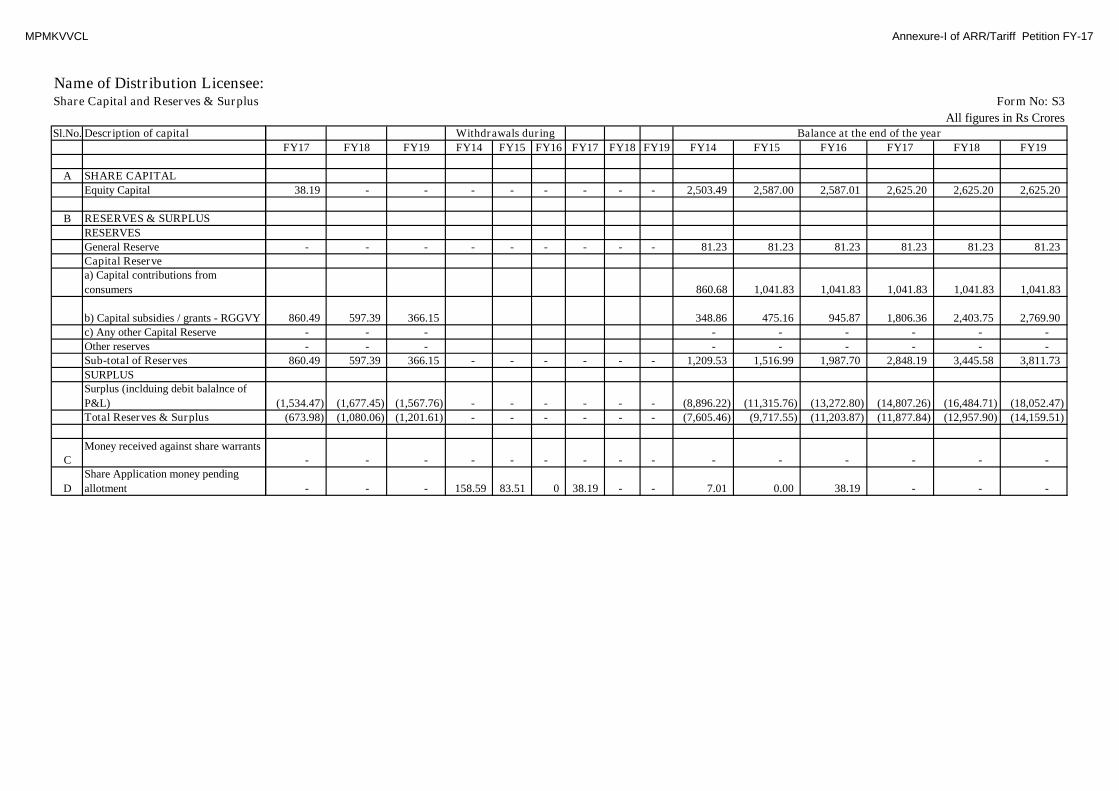
Name of Distribution Licensee: MPMKVVCL BHOPALShare Capital and Reserves & Surplus Form No: S3
All figures in Rs CroresSl.No. Description of capital
FY 11 FY 12 FY 13 FY14 FY15 FY16 FY17 FY18 FY19 FY14 FY15 FY16
A SHARE CAPITAL
Equity Capital 1,234.53 1,903.29 2,221.08 2,344.90 2,503.49 2,587.00 2,587.01 2,625.20 2,625.20 158.59 83.51 0.00
B RESERVES & SURPLUS
RESERVES
General Reserve 60.53 72.60 81.23 81.23 81.23 81.23 81.23 81.23 81.23 - - -Capital Reservea) Capital contributions from
consumers 160.95 185.95 290.41 574.41 860.68 1,041.83 1,041.83 1,041.83 1,041.83 286.26 181.16
b) Capital subsidies / grants - RGGVY 79.68 120.51 244.30 344.95 348.86 475.16 945.87 1,806.36 2,403.75 3.91 126.30 470.71
c) Any other Capital Reserve - - - - - - - - - - - -
Other reserves - - - - - - - - - - - -Sub-total of Reserves 240.64 306.46 534.71 919.36 1,209.53 1,516.99 1,987.70 2,848.19 3,445.58 290.17 307.46 470.71
SURPLUSSurplus (inclduing debit balalnce of
P&L) (2,674.69) (3,521.56) (4,976.62) (6,001.03) (8,896.22) (11,315.76) (13,272.80) (14,807.26) (16,484.71) (2,895.19) (2,419.54) (1,957.03)Total Reserves & Surplus (2,373.52) (3,142.49) (4,360.68) (5,000.44) (7,605.46) (9,717.55) (11,203.87) (11,877.84) (12,957.90) (2,605.02) (2,112.09) (1,486.32)
CMoney received against share warrants
- - - - - - - - - - - -
D
Share Application money pending
allotment 616.44 201.87 2.68 94.20 7.01 0.00 38.19 - - 71.40 76.50 38.19
Appropriation during the yearOpening Balance
MPMKVVCL Annexure-I of ARR/Tariff Petition FY-17
Name of Distribution Licensee: MPMKVVCL BHOPALShare Capital and Reserves & Surplus
Sl.No. Description of capital
A SHARE CAPITAL
Equity Capital
B RESERVES & SURPLUS
RESERVES
General ReserveCapital Reservea) Capital contributions from
consumers
b) Capital subsidies / grants - RGGVY
c) Any other Capital Reserve
Other reservesSub-total of Reserves
SURPLUSSurplus (inclduing debit balalnce of
P&L)Total Reserves & Surplus
CMoney received against share warrants
D
Share Application money pending
allotment
Form No: S3
All figures in Rs Crores
FY17 FY18 FY19 FY14 FY15 FY16 FY17 FY18 FY19 FY14 FY15 FY16 FY17 FY18 FY19
38.19 - - - - - - - - 2,503.49 2,587.00 2,587.01 2,625.20 2,625.20 2,625.20
- - - - - - - - - 81.23 81.23 81.23 81.23 81.23 81.23
860.68 1,041.83 1,041.83 1,041.83 1,041.83 1,041.83
860.49 597.39 366.15 348.86 475.16 945.87 1,806.36 2,403.75 2,769.90
- - - - - - - - -
- - - - - - - - -
860.49 597.39 366.15 - - - - - - 1,209.53 1,516.99 1,987.70 2,848.19 3,445.58 3,811.73
(1,534.47) (1,677.45) (1,567.76) - - - - - - (8,896.22) (11,315.76) (13,272.80) (14,807.26) (16,484.71) (18,052.47)
(673.98) (1,080.06) (1,201.61) - - - - - - (7,605.46) (9,717.55) (11,203.87) (11,877.84) (12,957.90) (14,159.51)
- - - - - - - - - - - - - - -
- - - 158.59 83.51 0 38.19 - - 7.01 0.00 38.19 - - -
Withdrawals during Balance at the end of the year

MPMKVVCL Annexure-I of ARR/Tariff Petition FY-17
Name of Distribution Licensee : MPMKVVCL BHOPAL
Current Assets & Liabilities Form No: S4
All figures in Rs Crores
Sl.No. Particulars Old Years PY CY
FY14 FY15 FY16 FY17 FY18 FY19
A
Current Assets, Loans and
Advances
(a ) Current investments - - - - - -
(b ) Inventories 396.18 310.30 347.66 400.94 456.65 526.03
(c ) Trade receivables 2,549.12 2,943.25 4,700.57 4,815.25 4,969.88 5,234.33
(d ) Cash and cash equivalents
630.67 754.18 708.38 718.97 (1,091.01) (2,231.33)
(e ) Short-term loans and
advances 32.68 40.80 15.18 15.29 15.58 15.35
(f ) Other current assets 404.73 451.05 501.09 569.76 641.82 730.06
TOTAL OF 'A' 4,013.38 4,499.57 6,272.88 6,520.21 4,992.92 4,274.44
B Current Liabilities
(a ) Short-term borrowings (0.00) 2,251.26 4,710.67 4,669.93 5,426.37 6,313.80
(b ) Trade payables 2,054.97 1,239.14 1,195.25 1,221.13 1,327.76 1,414.71
(c ) Other current liabilities 1,229.83 782.62 785.71 859.36 918.35 998.02
(d ) Short-term provisions - - - - - -
(e) Consumer Contribution 28.48 31.79 35.10 38.41 41.72 45.03
TOTAL OF 'B' 3,313.28 4,304.81 6,726.74 6,788.84 7,714.20 8,771.55
MYT 2016-17 to 2018-19
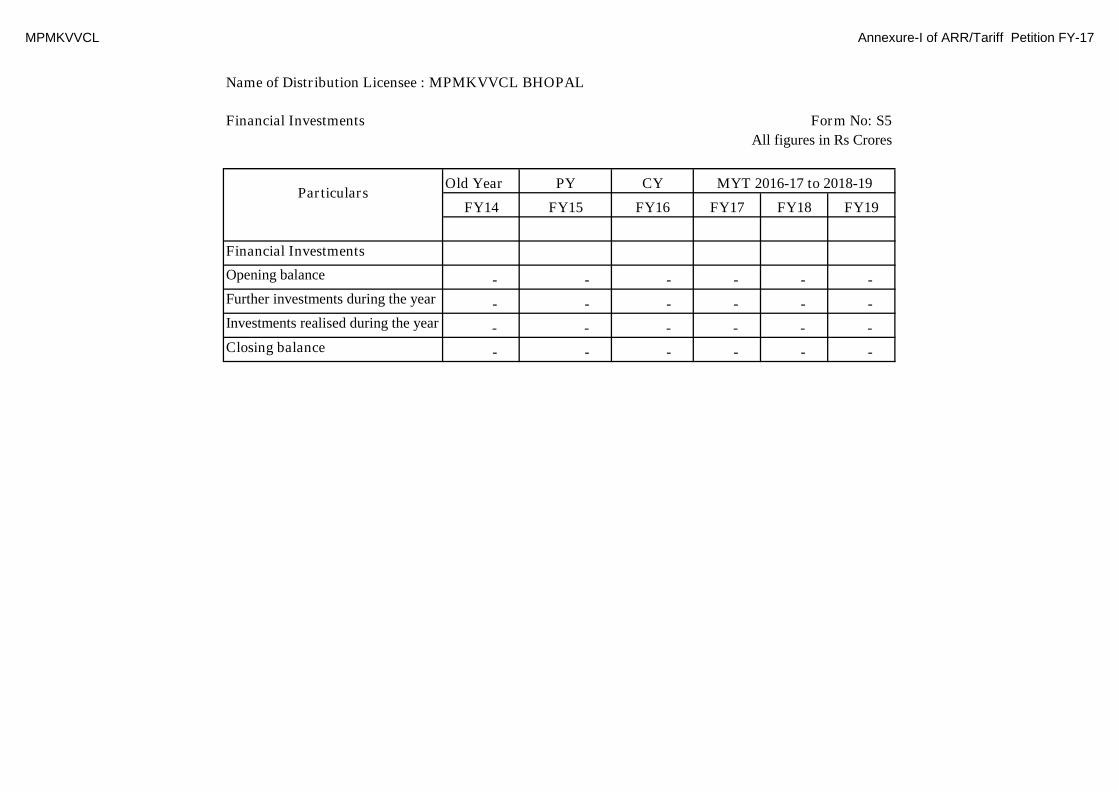
MPMKVVCL Annexure-I of ARR/Tariff Petition FY-17
Name of Distribution Licensee : MPMKVVCL BHOPAL
Financial Investments Form No: S5
All figures in Rs Crores
Old Year PY CY
FY14 FY15 FY16 FY17 FY18 FY19
Financial Investments
Opening balance - - - - - -
Further investments during the year - - - - - -
Investments realised during the year - - - - - -
Closing balance - - - - - -
ParticularsMYT 2016-17 to 2018-19
MPMKVVCL Annexure-I of ARR/Tariff Petition FY-17
Name of Distribution Licensee : MPMKVVCL BHOPAL
Deferred Tax Asset/Liability Form No: S6
All figures in Rs Crores
Sl.No. Description of capital Old Years PY CY
FY14 FY15 FY16 FY17 FY18 FY19
Deferred Tax Asset/Liability
MYT 2016-17 to 2018-19
NIL

MPMKVVCL Annexure-I of ARR/Tariff Petition FY-17
Name of Distribution Licensee : MPMKVVCL BHOPAL
Other Long Term Liability Form No: S7
All figures in Rs Crores
Sl.No. Description of capital Old Years PY CY
FY14 FY15 FY16 FY17 FY18 FY19
A Other Long term liabilities
Advance received for RGGY
project 46.621, 46,622 174.84 172.89 470.71 860.49 - -
Subsidy To Co-Operative
Fedration - - - - - -
Security Deposits From
Employees 0.01 0.00 - - - -
Wage Revision Arears 45.03 24.43 - - - -
Deposits/Retention From
Suppliers Contractors
46.100,
46.101, 46.102 95.68 163.90 280.74 480.88 823.70 1,410.92
Security Deposits from
Consumers 47.000, 48.100 679.09 723.78 719.93 785.85 817.72 696.29
Total 994.65 1,085.01 1,471.38 2,127.23 1,641.43 2,107.21
B Long-term provisions 44.110 1,111.14 1,312.37 1,559.44 1,646.96 1,815.51 1,963.86
Total * 2,105.79 2,397.38 3,030.83 3,774.19 3,456.94 4,071.07
Account Code
MYT 2016-17 to 2018-19
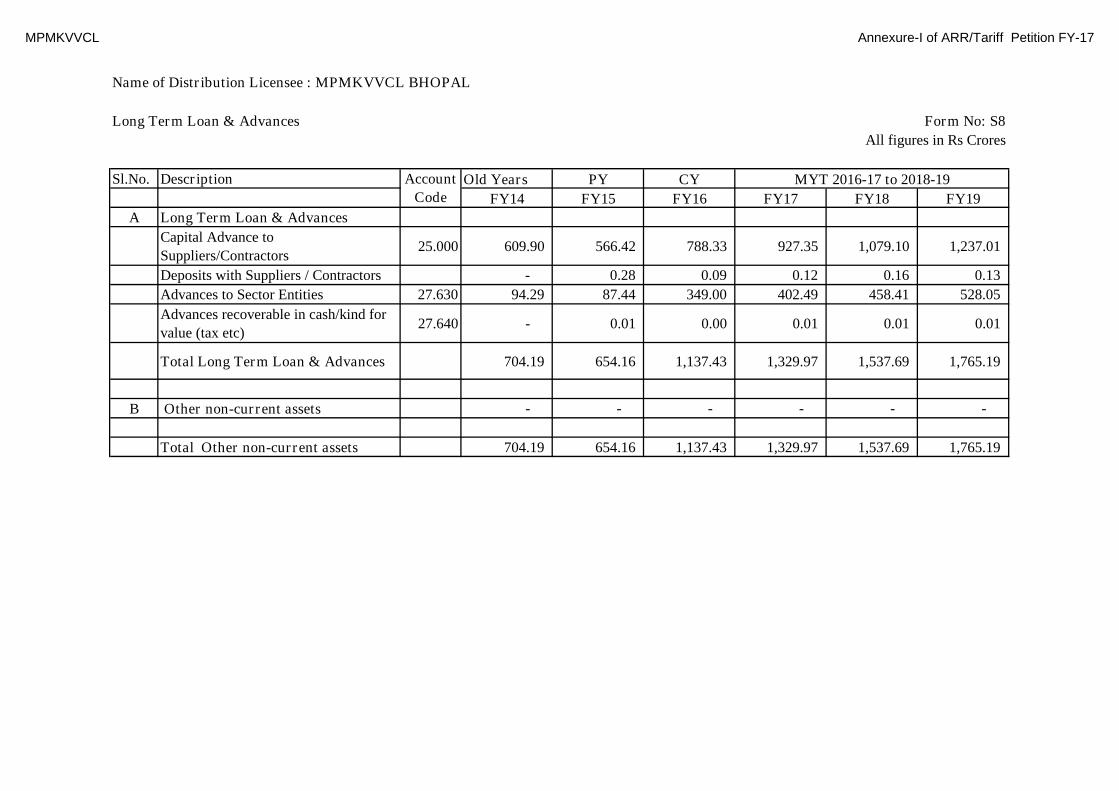
MPMKVVCL Annexure-I of ARR/Tariff Petition FY-17
Name of Distribution Licensee : MPMKVVCL BHOPAL
Long Term Loan & Advances Form No: S8
All figures in Rs Crores
Sl.No. Description Old Years PY CY
FY14 FY15 FY16 FY17 FY18 FY19
A Long Term Loan & Advances
Capital Advance to
Suppliers/Contractors25.000 609.90 566.42 788.33 927.35 1,079.10 1,237.01
Deposits with Suppliers / Contractors - 0.28 0.09 0.12 0.16 0.13
Advances to Sector Entities 27.630 94.29 87.44 349.00 402.49 458.41 528.05
Advances recoverable in cash/kind for
value (tax etc)27.640 - 0.01 0.00 0.01 0.01 0.01
Total Long Term Loan & Advances 704.19 654.16 1,137.43 1,329.97 1,537.69 1,765.19
B Other non-current assets - - - - - -
Total Other non-current assets 704.19 654.16 1,137.43 1,329.97 1,537.69 1,765.19
Account
CodeMYT 2016-17 to 2018-19

MPMKVVCL Annexure-I of ARR/Tariff Petition FY-17
Name of Distribution Licensee : MPMKVVCL BHOPAL
Aggregate Revenue Requirement Form No: A1
All figures in Rs Crores
Aggregate Revenue Requirement for Distribution and Retail Sale
Particulars Old Years PY CY
FY14 FY15 FY16 FY17 FY18 FY19
A Expenditure
I
Power Purchase expenses, including Inter-State and
Intra-State Transmission charges and wheeling
charges payable to any other Distribution Licensee
5,893.12 6,873.54 6,935.82 7,428.56 8,487.56 9,527.31
IIAggregate Revenue Requirement of Retail Supply
and Wheeling Activity2,191.21 1,610.38 2,114.08 2,227.18 2,418.12 2,639.51
Total Aggregate Revenue Requirement for
Distribution and Retail Sale (I+II+III)8,084.32 8,483.92 9,049.90 9,655.74 10,905.68 12,166.83
Aggregate Revenue Requirement for Expenses related to Purchase of power - I All figures in Rs Crores
Particulars Old Years PY CY
FY14 FY15 FY16 FY17 FY18 FY19
Power Purchase or Energy Available (MU) 15,026 17,898 16,381 18,576 20,781 23,558
Sale of Power (MU) 11,557 13,350 13,264 15,029 17,030 19,542
Loss % 23.00% 25.40% 19.00% 19.00% 18.00% 17.00%
Expenditure
Cost of power purchase, including T&D losses 6,871.06 5,775.34 6,208.66 7,204.30 8,176.70
Inter-State Transmission charges 432.04 440.68 449.50 458.49
Intra-state Transmission (MP Transco) charges 657.29 725.07 775.82 830.13 888.24
Wheeling charges payable to other distribution
licensee- - - - - -
MYT 2016-17 to 2018-19
MYT 2016-17 to 2018-19
5,233.28
MPMKVVCL Annexure-I of ARR/Tariff Petition FY-17
Name of Distribution Licensee : MPMKVVCL BHOPAL
Aggregate Revenue Requirement Form No: A1
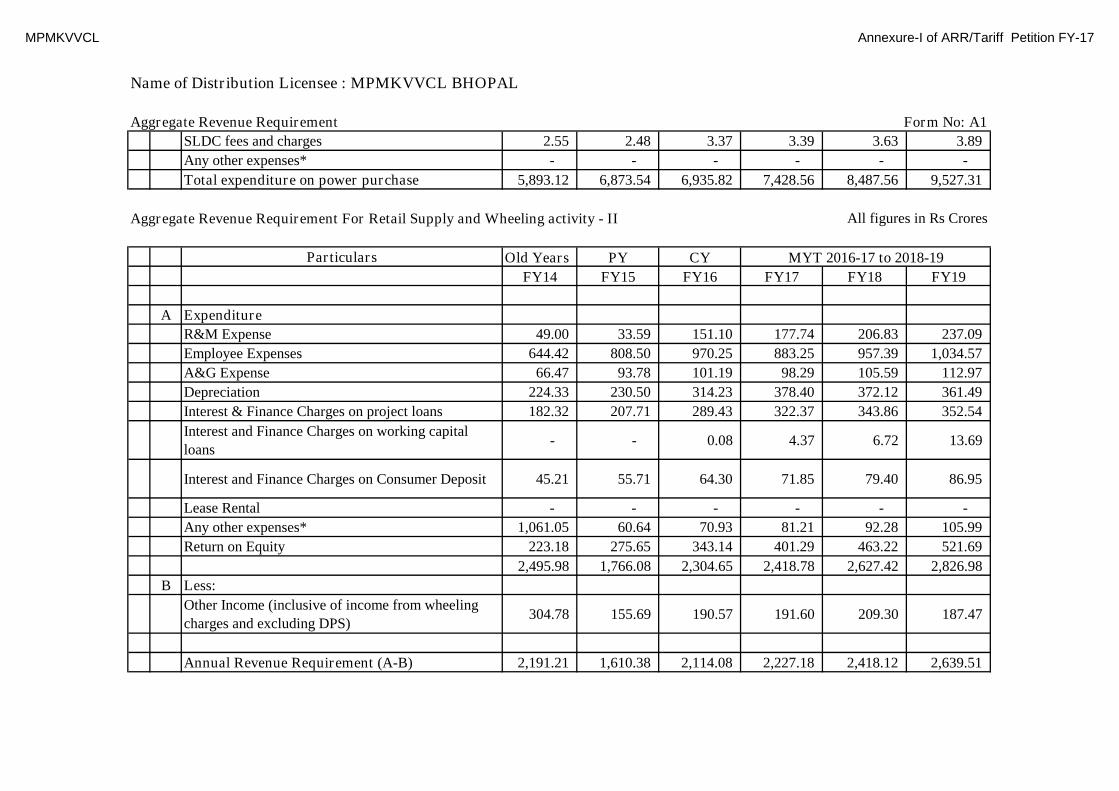
SLDC fees and charges 2.55 2.48 3.37 3.39 3.63 3.89
Any other expenses* - - - - - -
Total expenditure on power purchase 5,893.12 6,873.54 6,935.82 7,428.56 8,487.56 9,527.31
Aggregate Revenue Requirement For Retail Supply and Wheeling activity - II All figures in Rs Crores
Particulars Old Years PY CY
FY14 FY15 FY16 FY17 FY18 FY19
A Expenditure
R&M Expense 49.00 33.59 151.10 177.74 206.83 237.09
Employee Expenses 644.42 808.50 970.25 883.25 957.39 1,034.57
A&G Expense 66.47 93.78 101.19 98.29 105.59 112.97
Depreciation 224.33 230.50 314.23 378.40 372.12 361.49
Interest & Finance Charges on project loans 182.32 207.71 289.43 322.37 343.86 352.54
Interest and Finance Charges on working capital
loans- - 0.08 4.37 6.72 13.69
Interest and Finance Charges on Consumer Deposit 45.21 55.71 64.30 71.85 79.40 86.95
Lease Rental - - - - - -
Any other expenses* 1,061.05 60.64 70.93 81.21 92.28 105.99
Return on Equity 223.18 275.65 343.14 401.29 463.22 521.69
2,495.98 1,766.08 2,304.65 2,418.78 2,627.42 2,826.98
B Less:
Other Income (inclusive of income from wheeling
charges and excluding DPS)304.78 155.69 190.57 191.60 209.30 187.47
Annual Revenue Requirement (A-B) 2,191.21 1,610.38 2,114.08 2,227.18 2,418.12 2,639.51
MYT 2016-17 to 2018-19
MPMKVVCL Annexure-I of ARR/Tariff Petition FY-17
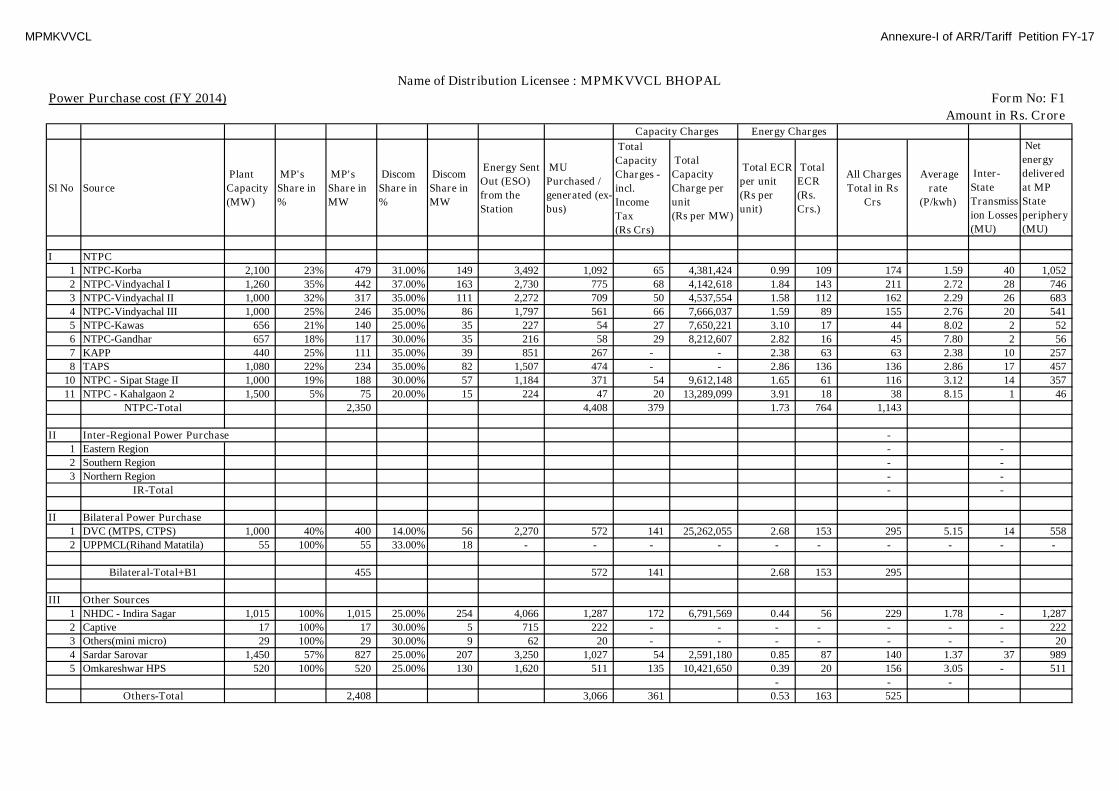
Power Purchase cost (FY 2014) Form No: F1
Amount in Rs. Crore
Sl No Source
Plant
Capacity
(MW)
MP's
Share in
%
MP's
Share in
MW
Discom
Share in
%
Discom
Share in
MW
Energy Sent
Out (ESO)
from the
Station
MU
Purchased /
generated (ex-
bus)
Total
Capacity
Charges -
incl.
Income
Tax
(Rs Crs)
Total
Capacity
Charge per
unit
(Rs per MW)
Total ECR
per unit
(Rs per
unit)
Total
ECR
(Rs.
Crs.)
All Charges
Total in Rs
Crs
Average
rate
(P/kwh)
Inter-
State
Transmiss
ion Losses
(MU)
Net
energy
delivered
at MP
State
periphery
(MU)
I NTPC
1 NTPC-Korba 2,100 23% 479 31.00% 149 3,492 1,092 65 4,381,424 0.99 109 174 1.59 40 1,052
2 NTPC-Vindyachal I 1,260 35% 442 37.00% 163 2,730 775 68 4,142,618 1.84 143 211 2.72 28 746
3 NTPC-Vindyachal II 1,000 32% 317 35.00% 111 2,272 709 50 4,537,554 1.58 112 162 2.29 26 683
4 NTPC-Vindyachal III 1,000 25% 246 35.00% 86 1,797 561 66 7,666,037 1.59 89 155 2.76 20 541
5 NTPC-Kawas 656 21% 140 25.00% 35 227 54 27 7,650,221 3.10 17 44 8.02 2 52
6 NTPC-Gandhar 657 18% 117 30.00% 35 216 58 29 8,212,607 2.82 16 45 7.80 2 56
7 KAPP 440 25% 111 35.00% 39 851 267 - - 2.38 63 63 2.38 10 257
8 TAPS 1,080 22% 234 35.00% 82 1,507 474 - - 2.86 136 136 2.86 17 457
10 NTPC - Sipat Stage II 1,000 19% 188 30.00% 57 1,184 371 54 9,612,148 1.65 61 116 3.12 14 357
11 NTPC - Kahalgaon 2 1,500 5% 75 20.00% 15 224 47 20 13,289,099 3.91 18 38 8.15 1 46
NTPC-Total 2,350 4,408 379 1.73 764 1,143
II Inter-Regional Power Purchase -
1 Eastern Region - -
2 Southern Region - -
3 Northern Region - -
IR-Total - -
II Bilateral Power Purchase
1 DVC (MTPS, CTPS) 1,000 40% 400 14.00% 56 2,270 572 141 25,262,055 2.68 153 295 5.15 14 558
2 UPPMCL(Rihand Matatila) 55 100% 55 33.00% 18 - - - - - - - - - -
Bilateral-Total+B1 455 572 141 2.68 153 295
III Other Sources
1 NHDC - Indira Sagar 1,015 100% 1,015 25.00% 254 4,066 1,287 172 6,791,569 0.44 56 229 1.78 - 1,287
2 Captive 17 100% 17 30.00% 5 715 222 - - - - - - - 222
3 Others(mini micro) 29 100% 29 30.00% 9 62 20 - - - - - - - 20
4 Sardar Sarovar 1,450 57% 827 25.00% 207 3,250 1,027 54 2,591,180 0.85 87 140 1.37 37 989
5 Omkareshwar HPS 520 100% 520 25.00% 130 1,620 511 135 10,421,650 0.39 20 156 3.05 - 511
- - -
Others-Total 2,408 3,066 361 0.53 163 525
Capacity Charges Energy Charges
Name of Distribution Licensee : MPMKVVCL BHOPAL

MPMKVVCL Annexure-I of ARR/Tariff Petition FY-17
Power Purchase cost (FY 2014) Form No: F1
Amount in Rs. Crore
Sl No Source
Plant
Capacity
(MW)
MP's
Share in
%
MP's
Share in
MW
Discom
Share in
%
Discom
Share in
MW
Energy Sent
Out (ESO)
from the
Station
MU
Purchased /
generated (ex-
bus)
Total
Capacity
Charges -
incl.
Income
Tax
(Rs Crs)
Total
Capacity
Charge per
unit
(Rs per MW)
Total ECR
per unit
(Rs per
unit)
Total
ECR
(Rs.
Crs.)
All Charges
Total in Rs
Crs
Average
rate
(P/kwh)
Inter-
State
Transmiss
ion Losses
(MU)
Net
energy
delivered
at MP
State
periphery
(MU)
Capacity Charges Energy Charges
Name of Distribution Licensee : MPMKVVCL BHOPAL
A Grand Total 5,212 8,046 882 1,081 1,963
I MP Genco - Thermal
1 ATPS - Chachai-PH 1&2 240 100% 240 40.00% 96 1,138 355 31 3,256,168 1.58 56 87 2.46 - 355
2 ATPS - Chachai-Extn 210 100% 210 40.00% 84 1,499 469 69 8,182,494 1.69 79 148 3.15 - 469
3 STPS - Sarani-PH 1, 2 & 3 830 118% 980 39.00% 382 3,570 1,046 84 2,193,247 2.21 231 315 3.01 - 1,046
4 SGTPS - Bir'pur - Extn 500 100% 500 40.00% 200 3,451 649 145 7,231,532 4.11 267 412 6.34 - 649
5 SGTPS - Bir'pur - PH 1 & 2 840 100% 840 40.00% 336 3,863 456 137 4,080,949 7.19 327 465 10.19 - 456
Thermal-Total 2,770 2,976 466 3.23 961 1,426
II MPGenco - Hydel
1 CHPS-Gandhi Sagar 115 50% 58 50.00% 29 198 62 1 469,165 0.75 5 6 0.97 - 62
2 CHPS-RP Sagar & Jawahar Sagar 271 50% 136 50.00% 68 412 131 - - 1.51 20 20 1.51 - 131
3 Pench THPS 160 67% 107 40.00% 43 283 89 3 714,796 0.46 4 7 0.80 - 89
4 Rajghat HPS 45 50% 23 40.00% 9 29 9 0 430,641 - - 0 0.42 - 9
5 Bargi HPS 90 100% 90 25.00% 23 533 168 3 1,315,404 0.41 7 10 0.59 - 168
6 Birsingpur HPS 20 100% 20 20.00% 4 45 14 1 2,586,096 0.83 1 2 1.55 - 14
7 Banasgar Tons HPS 315 100% 315 30.00% 95 1,902 598 25 2,660,415 0.80 48 73 1.22 - 598
8 Banasgar Tons HPS-Silpara 30 100% 30 30.00% 9 - - - - - - - - - -
9 Banasgar Tons HPS-Devloned 60 100% 60 30.00% 18 - - - - - - - - - -
10 Banasgar Tons HPS-Bansagar IV (Jhinna)20 100% 20 30.00% 6 123 39 2 4,063,701 1.01 4 6 1.64 - 39
11 Marhi Khera HPS 60 100% 60 20.00% 12 135 21 4 3,175,563 4.71 10 14 6.49 - 21
B Hydel Total 917 1,132 40 10.48 98 139
MP Genco GENERATION TOTAL 3,687 4,108 506 - 2.58 1,059 1,565
C
MPPMCL allocated Stations 4,182 12,070 3,773 - - 642 1.70
D
E Total (A+B+C) 13,082 15,927 1,387.67 4,170.33 2.62
F MPPMCL Other Costs 267.09
Total Cost - Ex Bus (D+E) 15,927.15 4,437.42 2.79
MPMKVVCL Annexure-I of ARR/Tariff Petition FY-17
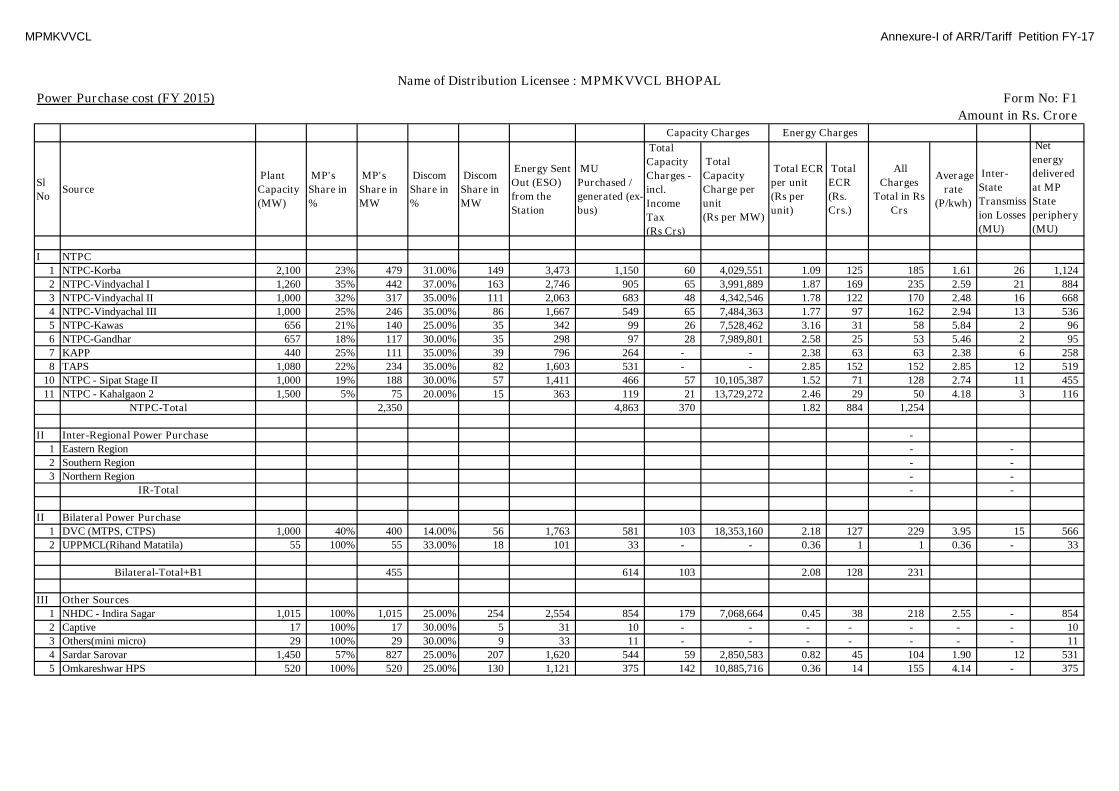
Power Purchase cost (FY 2015) Form No: F1
Amount in Rs. Crore
Sl
NoSource
Plant
Capacity
(MW)
MP's
Share in
%
MP's
Share in
MW
Discom
Share in
%
Discom
Share in
MW
Energy Sent
Out (ESO)
from the
Station
MU
Purchased /
generated (ex-
bus)
Total
Capacity
Charges -
incl.
Income
Tax
(Rs Crs)
Total
Capacity
Charge per
unit
(Rs per MW)
Total ECR
per unit
(Rs per
unit)
Total
ECR
(Rs.
Crs.)
All
Charges
Total in Rs
Crs
Average
rate
(P/kwh)
Inter-
State
Transmiss
ion Losses
(MU)
Net
energy
delivered
at MP
State
periphery
(MU)
I NTPC
1 NTPC-Korba 2,100 23% 479 31.00% 149 3,473 1,150 60 4,029,551 1.09 125 185 1.61 26 1,124
2 NTPC-Vindyachal I 1,260 35% 442 37.00% 163 2,746 905 65 3,991,889 1.87 169 235 2.59 21 884
3 NTPC-Vindyachal II 1,000 32% 317 35.00% 111 2,063 683 48 4,342,546 1.78 122 170 2.48 16 668
4 NTPC-Vindyachal III 1,000 25% 246 35.00% 86 1,667 549 65 7,484,363 1.77 97 162 2.94 13 536
5 NTPC-Kawas 656 21% 140 25.00% 35 342 99 26 7,528,462 3.16 31 58 5.84 2 96
6 NTPC-Gandhar 657 18% 117 30.00% 35 298 97 28 7,989,801 2.58 25 53 5.46 2 95
7 KAPP 440 25% 111 35.00% 39 796 264 - - 2.38 63 63 2.38 6 258
8 TAPS 1,080 22% 234 35.00% 82 1,603 531 - - 2.85 152 152 2.85 12 519
10 NTPC - Sipat Stage II 1,000 19% 188 30.00% 57 1,411 466 57 10,105,387 1.52 71 128 2.74 11 455
11 NTPC - Kahalgaon 2 1,500 5% 75 20.00% 15 363 119 21 13,729,272 2.46 29 50 4.18 3 116
NTPC-Total 2,350 4,863 370 1.82 884 1,254
II Inter-Regional Power Purchase -
1 Eastern Region - -
2 Southern Region - -
3 Northern Region - -
IR-Total - -
II Bilateral Power Purchase
1 DVC (MTPS, CTPS) 1,000 40% 400 14.00% 56 1,763 581 103 18,353,160 2.18 127 229 3.95 15 566
2 UPPMCL(Rihand Matatila) 55 100% 55 33.00% 18 101 33 - - 0.36 1 1 0.36 - 33
Bilateral-Total+B1 455 614 103 2.08 128 231
III Other Sources
1 NHDC - Indira Sagar 1,015 100% 1,015 25.00% 254 2,554 854 179 7,068,664 0.45 38 218 2.55 - 854
2 Captive 17 100% 17 30.00% 5 31 10 - - - - - - - 10
3 Others(mini micro) 29 100% 29 30.00% 9 33 11 - - - - - - - 11
4 Sardar Sarovar 1,450 57% 827 25.00% 207 1,620 544 59 2,850,583 0.82 45 104 1.90 12 531
5 Omkareshwar HPS 520 100% 520 25.00% 130 1,121 375 142 10,885,716 0.36 14 155 4.14 - 375
Capacity Charges Energy Charges
Name of Distribution Licensee : MPMKVVCL BHOPAL

MPMKVVCL Annexure-I of ARR/Tariff Petition FY-17
Power Purchase cost (FY 2015) Form No: F1
Amount in Rs. Crore
Sl
NoSource
Plant
Capacity
(MW)
MP's
Share in
%
MP's
Share in
MW
Discom
Share in
%
Discom
Share in
MW
Energy Sent
Out (ESO)
from the
Station
MU
Purchased /
generated (ex-
bus)
Total
Capacity
Charges -
incl.
Income
Tax
(Rs Crs)
Total
Capacity
Charge per
unit
(Rs per MW)
Total ECR
per unit
(Rs per
unit)
Total
ECR
(Rs.
Crs.)
All
Charges
Total in Rs
Crs
Average
rate
(P/kwh)
Inter-
State
Transmiss
ion Losses
(MU)
Net
energy
delivered
at MP
State
periphery
(MU)
Capacity Charges Energy Charges
Name of Distribution Licensee : MPMKVVCL BHOPAL
Others-Total 2,408 1,794 380 0.54 96 476
A Grand Total 5,212 7,271 852 1,108 1,961
I MP Genco - Thermal
1 ATPS - Chachai-PH 1&2 240 100% 240 40.00% 96 435 142 13 1,372,667 1.70 24 37 2.63 - 142
2 ATPS - Chachai-Extn 210 100% 210 40.00% 84 1,449 258 137 16,274,106 11.12 287 424 16.42 - 258
3 STPS - Sarani-PH 1, 2 & 3 830 118% 980 39.00% 382 3,610 1,197 - - - - - - - 1,197
4 SGTPS - Bir'pur - Extn 500 100% 500 40.00% 200 3,026 703 103 5,127,650 4.65 327 430 6.11 - 703
5 SGTPS - Bir'pur - PH 1 & 2 840 100% 840 40.00% 336 3,192 1,055 79 2,343,287 2.50 264 343 3.25 - 1,055
Thermal-Total 2,770 3,355 331 2.69 902 1,233
II MPGenco - Hydel
1 CHPS-Gandhi Sagar 115 50% 58 50.00% 29 133 44 1 355,606 1.10 5 6 1.33 - 44
2 CHPS-RP Sagar & Jawahar Sagar 271 50% 136 50.00% 68 317 105 - - 1.51 16 16 1.51 - 105
3 Pench THPS 160 67% 107 40.00% 43 258 86 3 752,601 0.48 4 7 0.86 - 86
4 Rajghat HPS 45 50% 23 40.00% 9 40 13 1 564,035 1.91 3 3 2.29 - 13
5 Bargi HPS 90 100% 90 25.00% 23 482 161 3 1,310,153 0.47 8 10 0.65 - 161
6 Birsingpur HPS 20 100% 20 20.00% 4 30 10 1 2,898,880 0.81 1 2 1.97 - 10
7 Banasgar Tons HPS 315 100% 315 30.00% 95 1,257 416 20 2,118,498 0.86 36 56 1.34 - 416
8 Banasgar Tons HPS-Silpara 30 100% 30 30.00% 9 - - 2 2,118,498 - - 2 - - -
9 Banasgar Tons HPS-Devloned 60 100% 60 30.00% 18 - - 4 2,118,498 - - 4 - - -
10 Banasgar Tons HPS-Bansagar IV (Jhinna) 20 100% 20 30.00% 6 96 32 2 3,287,863 1.05 3 5 1.67 - 32
11 Marhi Khera HPS 60 100% 60 20.00% 12 96 32 4 2,937,932 2.31 7 11 3.42 - 32
B Hydel Total 917 899 40 10.50 82 122
MP Genco GENERATION TOTAL 3,687 4,253 371 - 2.31 984 1,355
C
MPPMCL allocated Stations 6,253 21,156 7,284 - - 2,103 2.89
D
E Total (A+B+C) 15,152 18,809 1,223.73 5,418.90 2.88
F MPPMCL Other Costs (42.63)
Total Cost - Ex Bus (D+E) 18,808.50 5,376.27 2.86
MPMKVVCL Annexure-I of ARR/Tariff Petition FY-17
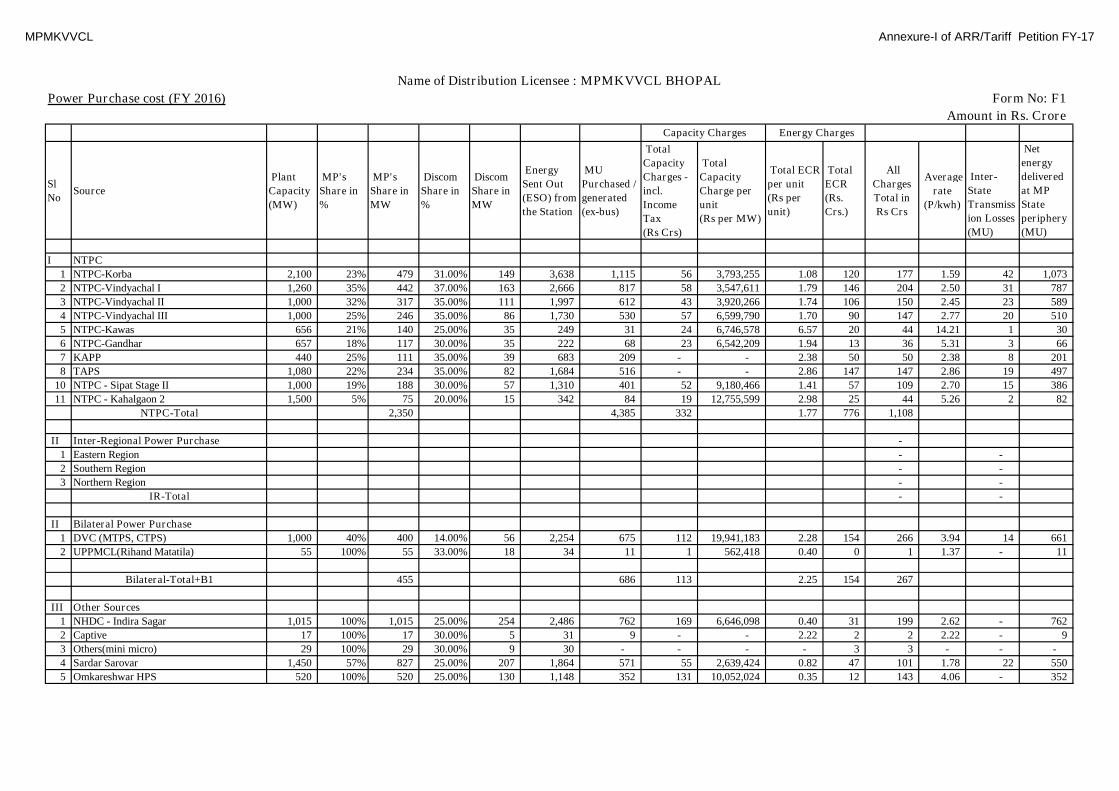
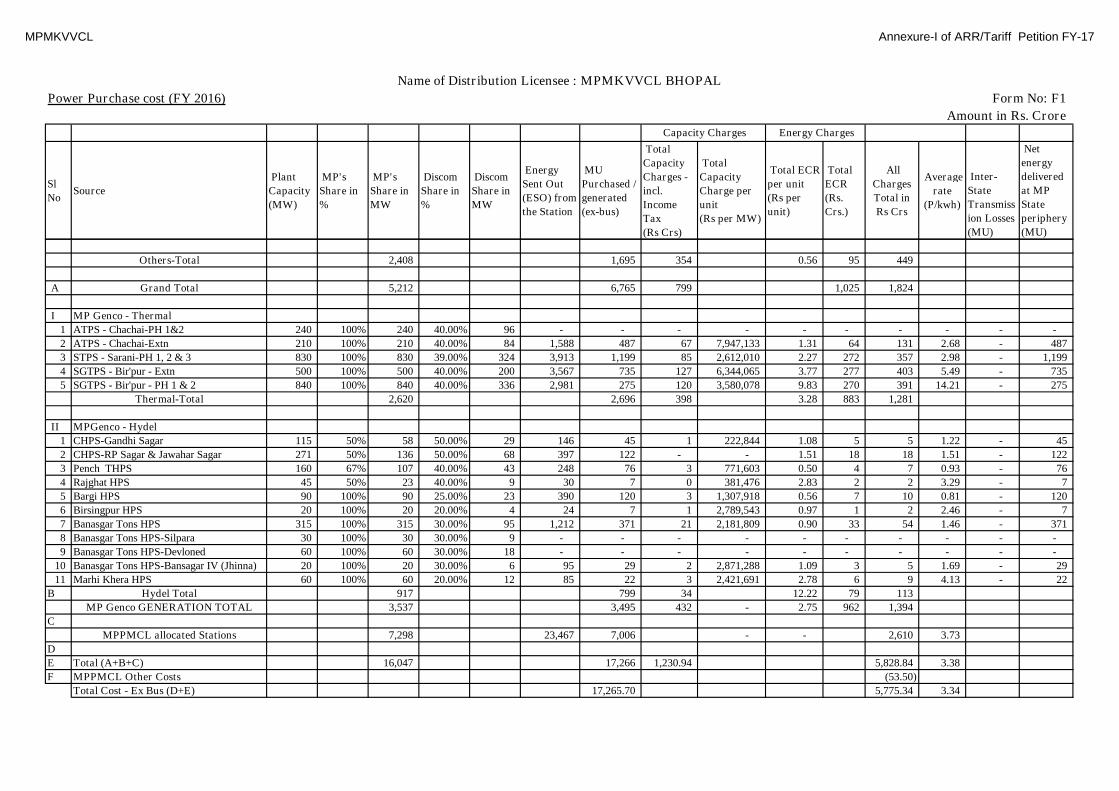
Power Purchase cost (FY 2016) Form No: F1
Amount in Rs. Crore
Sl
NoSource
Plant
Capacity
(MW)
MP's
Share in
%
MP's
Share in
MW
Discom
Share in
%
Discom
Share in
MW
Energy
Sent Out
(ESO) from
the Station
MU
Purchased /
generated
(ex-bus)
Total
Capacity
Charges -
incl.
Income
Tax
(Rs Crs)
Total
Capacity
Charge per
unit
(Rs per MW)
Total ECR
per unit
(Rs per
unit)
Total
ECR
(Rs.
Crs.)
All
Charges
Total in
Rs Crs
Average
rate
(P/kwh)
Inter-
State
Transmiss
ion Losses
(MU)
Net
energy
delivered
at MP
State
periphery
(MU)
I NTPC
1 NTPC-Korba 2,100 23% 479 31.00% 149 3,638 1,115 56 3,793,255 1.08 120 177 1.59 42 1,073
2 NTPC-Vindyachal I 1,260 35% 442 37.00% 163 2,666 817 58 3,547,611 1.79 146 204 2.50 31 787
3 NTPC-Vindyachal II 1,000 32% 317 35.00% 111 1,997 612 43 3,920,266 1.74 106 150 2.45 23 589
4 NTPC-Vindyachal III 1,000 25% 246 35.00% 86 1,730 530 57 6,599,790 1.70 90 147 2.77 20 510
5 NTPC-Kawas 656 21% 140 25.00% 35 249 31 24 6,746,578 6.57 20 44 14.21 1 30
6 NTPC-Gandhar 657 18% 117 30.00% 35 222 68 23 6,542,209 1.94 13 36 5.31 3 66
7 KAPP 440 25% 111 35.00% 39 683 209 - - 2.38 50 50 2.38 8 201
8 TAPS 1,080 22% 234 35.00% 82 1,684 516 - - 2.86 147 147 2.86 19 497
10 NTPC - Sipat Stage II 1,000 19% 188 30.00% 57 1,310 401 52 9,180,466 1.41 57 109 2.70 15 386
11 NTPC - Kahalgaon 2 1,500 5% 75 20.00% 15 342 84 19 12,755,599 2.98 25 44 5.26 2 82
NTPC-Total 2,350 4,385 332 1.77 776 1,108
II Inter-Regional Power Purchase -
1 Eastern Region - -
2 Southern Region - -
3 Northern Region - -
IR-Total - -
II Bilateral Power Purchase
1 DVC (MTPS, CTPS) 1,000 40% 400 14.00% 56 2,254 675 112 19,941,183 2.28 154 266 3.94 14 661
2 UPPMCL(Rihand Matatila) 55 100% 55 33.00% 18 34 11 1 562,418 0.40 0 1 1.37 - 11
Bilateral-Total+B1 455 686 113 2.25 154 267
III Other Sources
1 NHDC - Indira Sagar 1,015 100% 1,015 25.00% 254 2,486 762 169 6,646,098 0.40 31 199 2.62 - 762
2 Captive 17 100% 17 30.00% 5 31 9 - - 2.22 2 2 2.22 - 9
3 Others(mini micro) 29 100% 29 30.00% 9 30 - - - - 3 3 - - -
4 Sardar Sarovar 1,450 57% 827 25.00% 207 1,864 571 55 2,639,424 0.82 47 101 1.78 22 550
5 Omkareshwar HPS 520 100% 520 25.00% 130 1,148 352 131 10,052,024 0.35 12 143 4.06 - 352
Capacity Charges Energy Charges
Name of Distribution Licensee : MPMKVVCL BHOPAL
MPMKVVCL Annexure-I of ARR/Tariff Petition FY-17
Power Purchase cost (FY 2016) Form No: F1
Amount in Rs. Crore
Sl
NoSource
Plant
Capacity
(MW)
MP's
Share in
%
MP's
Share in
MW
Discom
Share in
%
Discom
Share in
MW
Energy
Sent Out
(ESO) from
the Station
MU
Purchased /
generated
(ex-bus)
Total
Capacity
Charges -
incl.
Income
Tax
(Rs Crs)
Total
Capacity
Charge per
unit
(Rs per MW)
Total ECR
per unit
(Rs per
unit)
Total
ECR
(Rs.
Crs.)
All
Charges
Total in
Rs Crs
Average
rate
(P/kwh)
Inter-
State
Transmiss
ion Losses
(MU)
Net
energy
delivered
at MP
State
periphery
(MU)
Capacity Charges Energy Charges
Name of Distribution Licensee : MPMKVVCL BHOPAL
Others-Total 2,408 1,695 354 0.56 95 449
A Grand Total 5,212 6,765 799 1,025 1,824
I MP Genco - Thermal
1 ATPS - Chachai-PH 1&2 240 100% 240 40.00% 96 - - - - - - - - - -
2 ATPS - Chachai-Extn 210 100% 210 40.00% 84 1,588 487 67 7,947,133 1.31 64 131 2.68 - 487
3 STPS - Sarani-PH 1, 2 & 3 830 100% 830 39.00% 324 3,913 1,199 85 2,612,010 2.27 272 357 2.98 - 1,199
4 SGTPS - Bir'pur - Extn 500 100% 500 40.00% 200 3,567 735 127 6,344,065 3.77 277 403 5.49 - 735
5 SGTPS - Bir'pur - PH 1 & 2 840 100% 840 40.00% 336 2,981 275 120 3,580,078 9.83 270 391 14.21 - 275
Thermal-Total 2,620 2,696 398 3.28 883 1,281
II MPGenco - Hydel
1 CHPS-Gandhi Sagar 115 50% 58 50.00% 29 146 45 1 222,844 1.08 5 5 1.22 - 45
2 CHPS-RP Sagar & Jawahar Sagar 271 50% 136 50.00% 68 397 122 - - 1.51 18 18 1.51 - 122
3 Pench THPS 160 67% 107 40.00% 43 248 76 3 771,603 0.50 4 7 0.93 - 76
4 Rajghat HPS 45 50% 23 40.00% 9 30 7 0 381,476 2.83 2 2 3.29 - 7
5 Bargi HPS 90 100% 90 25.00% 23 390 120 3 1,307,918 0.56 7 10 0.81 - 120
6 Birsingpur HPS 20 100% 20 20.00% 4 24 7 1 2,789,543 0.97 1 2 2.46 - 7
7 Banasgar Tons HPS 315 100% 315 30.00% 95 1,212 371 21 2,181,809 0.90 33 54 1.46 - 371
8 Banasgar Tons HPS-Silpara 30 100% 30 30.00% 9 - - - - - - - - - -
9 Banasgar Tons HPS-Devloned 60 100% 60 30.00% 18 - - - - - - - - - -
10 Banasgar Tons HPS-Bansagar IV (Jhinna) 20 100% 20 30.00% 6 95 29 2 2,871,288 1.09 3 5 1.69 - 29
11 Marhi Khera HPS 60 100% 60 20.00% 12 85 22 3 2,421,691 2.78 6 9 4.13 - 22
B Hydel Total 917 799 34 12.22 79 113
MP Genco GENERATION TOTAL 3,537 3,495 432 - 2.75 962 1,394
C
MPPMCL allocated Stations 7,298 23,467 7,006 - - 2,610 3.73
D
E Total (A+B+C) 16,047 17,266 1,230.94 5,828.84 3.38
F MPPMCL Other Costs (53.50)
Total Cost - Ex Bus (D+E) 17,265.70 5,775.34 3.34

MPMKVVCL Annexure-I of ARR/Tariff Petition FY-17
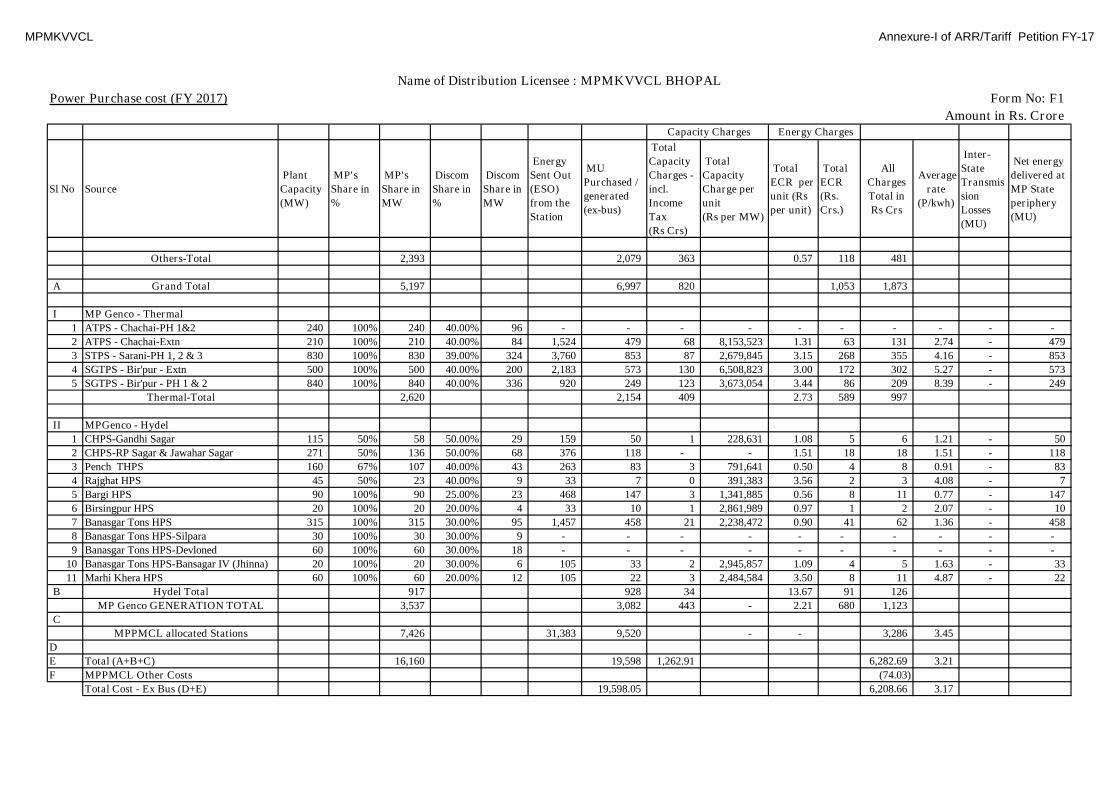
Power Purchase cost (FY 2017) Form No: F1
Amount in Rs. Crore
Sl No Source
Plant
Capacity
(MW)
MP's
Share in
%
MP's
Share in
MW
Discom
Share in
%
Discom
Share in
MW
Energy
Sent Out
(ESO)
from the
Station
MU
Purchased /
generated
(ex-bus)
Total
Capacity
Charges -
incl.
Income
Tax
(Rs Crs)
Total
Capacity
Charge per
unit
(Rs per MW)
Total
ECR per
unit (Rs
per unit)
Total
ECR
(Rs.
Crs.)
All
Charges
Total in
Rs Crs
Average
rate
(P/kwh)
Inter-
State
Transmis
sion
Losses
(MU)
Net energy
delivered at
MP State
periphery
(MU)
I NTPC
1 NTPC-Korba 2,100 23% 479 31.00% 149 3,534 1,111 58 3,891,768 1.08 120 178 1.60 42 1,070
2 NTPC-Vindyachal I 1,260 35% 442 37.00% 163 2,714 851 59 3,639,744 1.80 153 212 2.49 32 819
3 NTPC-Vindyachal II 1,000 32% 317 35.00% 111 2,111 664 45 4,022,077 1.74 115 160 2.41 25 639
4 NTPC-Vindyachal III 1,000 25% 246 35.00% 86 1,732 545 58 6,771,190 1.70 93 151 2.77 21 524
5 NTPC-Kawas 656 21% 140 25.00% 35 123 19 24 6,921,790 5.43 10 34 18.25 1 18
6 NTPC-Gandhar 657 18% 117 30.00% 35 222 63 24 6,712,113 2.15 14 37 5.89 2 61
7 KAPP 440 25% 111 35.00% 39 777 244 - - 2.38 58 58 2.38 9 235
8 TAPS 1,080 22% 234 35.00% 82 1,598 502 - - 2.86 144 144 2.86 19 484
10 NTPC - Sipat Stage II 1,000 19% 188 30.00% 57 1,302 409 53 9,418,887 1.41 58 111 2.71 15 394
11 NTPC - Kahalgaon 2 1,500 5% 75 20.00% 15 309 64 20 13,086,868 3.65 23 43 6.73 1 62
NTPC-Total 2,350 4,472 341 1.76 787 1,128
II Inter-Regional Power Purchase -
1 Eastern Region - -
2 Southern Region - -
3 Northern Region - -
IR-Total - -
II Bilateral Power Purchase
1 DVC (MTPS, CTPS) 1,000 40% 400 14.00% 56 2,096 432 115 20,459,064 3.40 147 262 6.06 9 423
2 UPPMCL(Rihand Matatila) 55 100% 55 33.00% 18 45 14 1 577,024 0.40 1 2 1.14 - 14
Bilateral-Total+B1 455 446 116 3.31 148 263
III Other Sources
1 NHDC - Indira Sagar 1,000 100% 1,000 25.00% 250 3,035 955 173 6,920,981 0.40 39 212 2.22 - 955
2 Captive 17 100% 17 30.00% 5 47 11 - - 2.99 3 3 2.99 - 11
3 Others(mini micro) 29 100% 29 30.00% 9 42 - - - - 4 4 - - -
4 Sardar Sarovar 1,450 57% 827 25.00% 207 2,245 706 56 2,707,971 0.82 58 114 1.61 27 679
5 Omkareshwar HPS 520 100% 520 25.00% 130 1,296 408 134 10,313,079 0.35 14 148 3.64 - 408
Name of Distribution Licensee : MPMKVVCL BHOPAL
Capacity Charges Energy Charges
MPMKVVCL Annexure-I of ARR/Tariff Petition FY-17
Power Purchase cost (FY 2017) Form No: F1
Amount in Rs. Crore
Sl No Source
Plant
Capacity
(MW)
MP's
Share in
%
MP's
Share in
MW
Discom
Share in
%
Discom
Share in
MW
Energy
Sent Out
(ESO)
from the
Station
MU
Purchased /
generated
(ex-bus)
Total
Capacity
Charges -
incl.
Income
Tax
(Rs Crs)
Total
Capacity
Charge per
unit
(Rs per MW)
Total
ECR per
unit (Rs
per unit)
Total
ECR
(Rs.
Crs.)
All
Charges
Total in
Rs Crs
Average
rate
(P/kwh)
Inter-
State
Transmis
sion
Losses
(MU)
Net energy
delivered at
MP State
periphery
(MU)
Name of Distribution Licensee : MPMKVVCL BHOPAL
Capacity Charges Energy Charges
Others-Total 2,393 2,079 363 0.57 118 481
A Grand Total 5,197 6,997 820 1,053 1,873
I MP Genco - Thermal
1 ATPS - Chachai-PH 1&2 240 100% 240 40.00% 96 - - - - - - - - - -
2 ATPS - Chachai-Extn 210 100% 210 40.00% 84 1,524 479 68 8,153,523 1.31 63 131 2.74 - 479
3 STPS - Sarani-PH 1, 2 & 3 830 100% 830 39.00% 324 3,760 853 87 2,679,845 3.15 268 355 4.16 - 853
4 SGTPS - Bir'pur - Extn 500 100% 500 40.00% 200 2,183 573 130 6,508,823 3.00 172 302 5.27 - 573
5 SGTPS - Bir'pur - PH 1 & 2 840 100% 840 40.00% 336 920 249 123 3,673,054 3.44 86 209 8.39 - 249
Thermal-Total 2,620 2,154 409 2.73 589 997
II MPGenco - Hydel
1 CHPS-Gandhi Sagar 115 50% 58 50.00% 29 159 50 1 228,631 1.08 5 6 1.21 - 50
2 CHPS-RP Sagar & Jawahar Sagar 271 50% 136 50.00% 68 376 118 - - 1.51 18 18 1.51 - 118
3 Pench THPS 160 67% 107 40.00% 43 263 83 3 791,641 0.50 4 8 0.91 - 83
4 Rajghat HPS 45 50% 23 40.00% 9 33 7 0 391,383 3.56 2 3 4.08 - 7
5 Bargi HPS 90 100% 90 25.00% 23 468 147 3 1,341,885 0.56 8 11 0.77 - 147
6 Birsingpur HPS 20 100% 20 20.00% 4 33 10 1 2,861,989 0.97 1 2 2.07 - 10
7 Banasgar Tons HPS 315 100% 315 30.00% 95 1,457 458 21 2,238,472 0.90 41 62 1.36 - 458
8 Banasgar Tons HPS-Silpara 30 100% 30 30.00% 9 - - - - - - - - - -
9 Banasgar Tons HPS-Devloned 60 100% 60 30.00% 18 - - - - - - - - - -
10 Banasgar Tons HPS-Bansagar IV (Jhinna) 20 100% 20 30.00% 6 105 33 2 2,945,857 1.09 4 5 1.63 - 33
11 Marhi Khera HPS 60 100% 60 20.00% 12 105 22 3 2,484,584 3.50 8 11 4.87 - 22
B Hydel Total 917 928 34 13.67 91 126
MP Genco GENERATION TOTAL 3,537 3,082 443 - 2.21 680 1,123
C
MPPMCL allocated Stations 7,426 31,383 9,520 - - 3,286 3.45
D
E Total (A+B+C) 16,160 19,598 1,262.91 6,282.69 3.21
F MPPMCL Other Costs (74.03)
Total Cost - Ex Bus (D+E) 19,598.05 6,208.66 3.17

MPMKVVCL Annexure-I of ARR/Tariff Petition FY-17
Power Purchase cost (FY 2018) Form No: F1
Amount in Rs. Crore
Sl
NoSource
Plant
Capacity
(MW)
MP's
Share in
%
MP's
Share in
MW
Discom
Share in
%
Discom
Share in
MW
Energy Sent
Out (ESO)
from the
Station
MU
Purchased /
generated
(ex-bus)
Total
Capacity
Charges -
incl.
Income
Tax
(Rs Crs)
Total
Capacity
Charge per
unit
(Rs per MW)
Total ECR
per unit
(Rs per
unit)
Total
ECR
(Rs.
Crs.)
All
Charges
Total in
Rs Crs
Average
rate
(P/kwh)
Inter-
State
Transmi
ssion
Losses
(MU)
Net
energy
delivered
at MP
State
periphery
(MU)
I NTPC
1 NTPC-Korba 2,100 23% 479 31.00% 149 3,500 1,126 59 3,984,852 1.08 122 181 1.61 42 1,083
2 NTPC-Vindyachal I 1,260 35% 442 37.00% 163 2,709 872 61 3,726,800 1.79 156 217 2.49 33 839
3 NTPC-Vindyachal II 1,000 32% 317 35.00% 111 2,057 662 46 4,118,278 1.74 115 161 2.43 25 637
4 NTPC-Vindyachal III 1,000 25% 246 35.00% 86 1,710 550 60 6,933,144 1.70 93 153 2.79 21 529
5 NTPC-Kawas 656 21% 140 25.00% 35 249 26 25 7,087,346 8.07 21 46 17.46 1 25
6 NTPC-Gandhar 657 18% 117 30.00% 35 222 72 24 6,872,654 1.94 14 38 5.31 3 69
7 KAPP 440 25% 111 35.00% 39 752 242 - - 2.38 58 58 2.38 9 233
8 TAPS 1,080 22% 234 35.00% 82 1,628 525 - - 2.86 150 150 2.86 20 505
10 NTPC - Sipat Stage II 1,000 19% 188 30.00% 57 1,341 431 55 9,644,169 1.41 61 115 2.67 16 415
11 NTPC - Kahalgaon 2 1,500 5% 75 20.00% 15 338 89 20 13,399,881 2.93 26 46 5.20 2 87
NTPC-Total 2,350 4,594 349 1.78 816 1,165
II Inter-Regional Power Purchase -
1 Eastern Region - -
2 Southern Region - -
3 Northern Region - -
IR-Total - -
II Bilateral Power Purchase
1 DVC (MTPS, CTPS) 1,000 40% 400 14.00% 56 2,038 655 117 20,948,408 2.23 146 264 4.03 14 641
2 UPPMCL(Rihand Matatila) 55 100% 55 33.00% 18 60 19 1 590,826 0.40 1 2 0.95 - 19
Bilateral-Total+B1 455 674 118 2.18 147 265
III Other Sources
1 NHDC - Indira Sagar 1,000 100% 1,000 25.00% 250 2,692 867 177 7,086,518 0.40 35 212 2.45 - 867
2 Captive 17 100% 17 30.00% 5 36 12 - - 2.22 3 3 2.22 - 12
3 Others(mini micro) 29 100% 29 30.00% 9 95 - - - - 10 10 - - -
4 Sardar Sarovar 1,450 57% 827 25.00% 207 1,910 616 57 2,772,741 0.82 51 108 1.75 23 593
5 Omkareshwar HPS 520 100% 520 25.00% 130 1,189 383 137 10,559,749 0.35 13 151 3.94 - 383
Name of Distribution Licensee : MPMKVVCL BHOPAL
Capacity Charges Energy Charges

MPMKVVCL Annexure-I of ARR/Tariff Petition FY-17
Power Purchase cost (FY 2018) Form No: F1
Amount in Rs. Crore
Sl
NoSource
Plant
Capacity
(MW)
MP's
Share in
%
MP's
Share in
MW
Discom
Share in
%
Discom
Share in
MW
Energy Sent
Out (ESO)
from the
Station
MU
Purchased /
generated
(ex-bus)
Total
Capacity
Charges -
incl.
Income
Tax
(Rs Crs)
Total
Capacity
Charge per
unit
(Rs per MW)
Total ECR
per unit
(Rs per
unit)
Total
ECR
(Rs.
Crs.)
All
Charges
Total in
Rs Crs
Average
rate
(P/kwh)
Inter-
State
Transmi
ssion
Losses
(MU)
Net
energy
delivered
at MP
State
periphery
(MU)
Name of Distribution Licensee : MPMKVVCL BHOPAL
Capacity Charges Energy Charges
Others-Total 2,393 1,878 372 0.59 112 483
A Grand Total 5,197 7,146 839 1,074 1,914
I MP Genco - Thermal
1 ATPS - Chachai-PH 1&2 240 100% 240 40.00% 96 - - - - - - - - - -
2 ATPS - Chachai-Extn 210 100% 210 40.00% 84 1,520 489 70 8,348,540 1.31 64 134 2.74 - 489
3 STPS - Sarani-PH 1, 2 & 3 830 100% 830 39.00% 324 3,761 1,210 89 2,743,941 2.27 275 363 3.00 - 1,210
4 SGTPS - Bir'pur - Extn 500 100% 500 40.00% 200 2,868 643 133 6,664,502 3.62 233 366 5.69 - 643
5 SGTPS - Bir'pur - PH 1 & 2 840 100% 840 40.00% 336 2,665 248 126 3,760,907 10.28 255 382 15.37 - 248
Thermal-Total 2,620 2,590 419 3.19 827 1,245
II MPGenco - Hydel
1 CHPS-Gandhi Sagar 115 50% 58 50.00% 29 146 47 1 234,099 1.08 5 6 1.22 - 47
2 CHPS-RP Sagar & Jawahar Sagar 271 50% 136 50.00% 68 363 117 - - 1.51 18 18 1.51 - 117
3 Pench THPS 160 67% 107 40.00% 43 256 82 3 810,576 0.50 4 8 0.92 - 82
4 Rajghat HPS 45 50% 23 40.00% 9 34 10 0 400,744 2.67 3 3 3.05 - 10
5 Bargi HPS 90 100% 90 25.00% 23 446 144 3 1,373,980 0.56 8 11 0.78 - 144
6 Birsingpur HPS 20 100% 20 20.00% 4 29 9 1 2,930,442 0.97 1 2 2.21 - 9
7 Banasgar Tons HPS 315 100% 315 30.00% 95 1,309 421 22 2,292,012 0.90 38 60 1.42 - 421
8 Banasgar Tons HPS-Silpara 30 100% 30 30.00% 9 - - - - - - - - - -
9 Banasgar Tons HPS-Devloned 60 100% 60 30.00% 18 - - - - - - - - - -
10 Banasgar Tons HPS-Bansagar IV (Jhinna) 20 100% 20 30.00% 6 99 32 2 3,016,316 1.09 3 5 1.67 - 32
11 Marhi Khera HPS 60 100% 60 20.00% 12 96 29 3 2,544,010 2.45 7 10 3.52 - 29
B Hydel Total 917 890 35 11.74 87 122
MP Genco GENERATION TOTAL 3,537 3,480 454 - 2.62 913 1,367
C
MPPMCL allocated Stations 8,545 36,408 11,305 - - 4,017 3.55
D
E Total (A+B+C) 17,279 21,932 1,293.12 7,297.80 3.33
F MPPMCL Other Costs (93.50)
Total Cost - Ex Bus (D+E) 21,931.66 7,204.30 3.28

MPMKVVCL Annexure-I of ARR/Tariff Petition FY-17
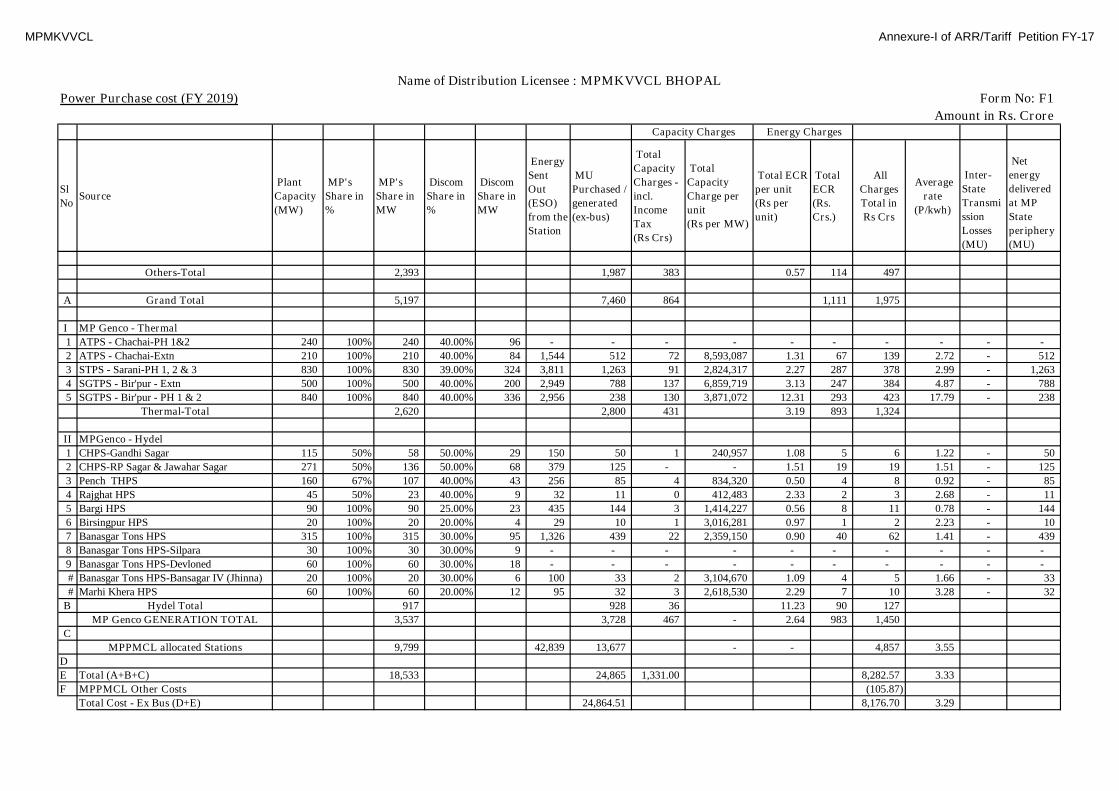
Power Purchase cost (FY 2019) Form No: F1
Amount in Rs. Crore
Sl
NoSource
Plant
Capacity
(MW)
MP's
Share in
%
MP's
Share in
MW
Discom
Share in
%
Discom
Share in
MW
Energy
Sent
Out
(ESO)
from the
Station
MU
Purchased /
generated
(ex-bus)
Total
Capacity
Charges -
incl.
Income
Tax
(Rs Crs)
Total
Capacity
Charge per
unit
(Rs per MW)
Total ECR
per unit
(Rs per
unit)
Total
ECR
(Rs.
Crs.)
All
Charges
Total in
Rs Crs
Average
rate
(P/kwh)
Inter-
State
Transmi
ssion
Losses
(MU)
Net
energy
delivered
at MP
State
periphery
(MU)
I NTPC
1 NTPC-Korba 2,100 23% 479 31.00% 149 3,537 1,172 61 4,101,576 1.08 127 187 1.60 44 1,127
2 NTPC-Vindyachal I 1,260 35% 442 37.00% 163 2,696 893 63 3,835,965 1.79 160 223 2.49 34 860
3 NTPC-Vindyachal II 1,000 32% 317 35.00% 111 2,055 681 47 4,238,911 1.74 118 165 2.43 26 655
4 NTPC-Vindyachal III 1,000 25% 246 35.00% 86 1,724 571 62 7,136,230 1.70 97 159 2.78 22 550
5 NTPC-Kawas 656 21% 140 25.00% 35 249 28 26 7,294,949 7.71 22 47 16.68 1 27
6 NTPC-Gandhar 657 18% 117 30.00% 35 222 74 25 7,073,968 1.94 14 39 5.31 3 71
7 KAPP 440 25% 111 35.00% 39 737 244 - - 2.38 58 58 2.38 9 235
8 TAPS 1,080 22% 234 35.00% 82 1,637 542 - - 2.86 155 155 2.86 20 522
# NTPC - Sipat Stage II 1,000 19% 188 30.00% 57 1,317 436 56 9,926,667 1.41 62 118 2.70 16 420
# NTPC - Kahalgaon 2 1,500 5% 75 20.00% 15 330 109 21 13,792,392 2.39 26 47 4.28 2 107
NTPC-Total 2,350 4,752 359 1.77 839 1,198
II Inter-Regional Power Purchase -
1 Eastern Region - -
2 Southern Region - -
3 Northern Region - -
IR-Total - -
II Bilateral Power Purchase
1 DVC (MTPS, CTPS) 1,000 40% 400 14.00% 56 2,129 706 121 21,562,030 2.23 157 278 3.94 15 691
2 UPPMCL(Rihand Matatila) 55 100% 55 33.00% 18 46 15 1 608,132 0.40 1 2 1.12 - 15
Bilateral-Total+B1 455 721 122 2.19 158 280
III Other Sources
1 NHDC - Indira Sagar 1,000 100% 1,000 25.00% 250 2,738 908 182 7,294,097 0.40 37 219 2.41 - 908
2 Captive 17 100% 17 30.00% 5 38 13 - - 2.22 3 3 2.22 - 13
3 Others(mini micro) 29 100% 29 30.00% 9 56 - - - - 6 6 - - -
4 Sardar Sarovar 1,450 57% 827 25.00% 207 2,006 665 59 2,853,960 0.82 55 114 1.71 25 640
5 Omkareshwar HPS 520 100% 520 25.00% 130 1,211 401 141 10,869,066 0.35 14 155 3.87 - 401
Name of Distribution Licensee : MPMKVVCL BHOPAL
Capacity Charges Energy Charges
MPMKVVCL Annexure-I of ARR/Tariff Petition FY-17
Power Purchase cost (FY 2019) Form No: F1
Amount in Rs. Crore
Sl
NoSource
Plant
Capacity
(MW)
MP's
Share in
%
MP's
Share in
MW
Discom
Share in
%
Discom
Share in
MW
Energy
Sent
Out
(ESO)
from the
Station
MU
Purchased /
generated
(ex-bus)
Total
Capacity
Charges -
incl.
Income
Tax
(Rs Crs)
Total
Capacity
Charge per
unit
(Rs per MW)
Total ECR
per unit
(Rs per
unit)
Total
ECR
(Rs.
Crs.)
All
Charges
Total in
Rs Crs
Average
rate
(P/kwh)
Inter-
State
Transmi
ssion
Losses
(MU)
Net
energy
delivered
at MP
State
periphery
(MU)
Name of Distribution Licensee : MPMKVVCL BHOPAL
Capacity Charges Energy Charges
Others-Total 2,393 1,987 383 0.57 114 497
A Grand Total 5,197 7,460 864 1,111 1,975
I MP Genco - Thermal
1 ATPS - Chachai-PH 1&2 240 100% 240 40.00% 96 - - - - - - - - - -
2 ATPS - Chachai-Extn 210 100% 210 40.00% 84 1,544 512 72 8,593,087 1.31 67 139 2.72 - 512
3 STPS - Sarani-PH 1, 2 & 3 830 100% 830 39.00% 324 3,811 1,263 91 2,824,317 2.27 287 378 2.99 - 1,263
4 SGTPS - Bir'pur - Extn 500 100% 500 40.00% 200 2,949 788 137 6,859,719 3.13 247 384 4.87 - 788
5 SGTPS - Bir'pur - PH 1 & 2 840 100% 840 40.00% 336 2,956 238 130 3,871,072 12.31 293 423 17.79 - 238
Thermal-Total 2,620 2,800 431 3.19 893 1,324
II MPGenco - Hydel
1 CHPS-Gandhi Sagar 115 50% 58 50.00% 29 150 50 1 240,957 1.08 5 6 1.22 - 50
2 CHPS-RP Sagar & Jawahar Sagar 271 50% 136 50.00% 68 379 125 - - 1.51 19 19 1.51 - 125
3 Pench THPS 160 67% 107 40.00% 43 256 85 4 834,320 0.50 4 8 0.92 - 85
4 Rajghat HPS 45 50% 23 40.00% 9 32 11 0 412,483 2.33 2 3 2.68 - 11
5 Bargi HPS 90 100% 90 25.00% 23 435 144 3 1,414,227 0.56 8 11 0.78 - 144
6 Birsingpur HPS 20 100% 20 20.00% 4 29 10 1 3,016,281 0.97 1 2 2.23 - 10
7 Banasgar Tons HPS 315 100% 315 30.00% 95 1,326 439 22 2,359,150 0.90 40 62 1.41 - 439
8 Banasgar Tons HPS-Silpara 30 100% 30 30.00% 9 - - - - - - - - - -
9 Banasgar Tons HPS-Devloned 60 100% 60 30.00% 18 - - - - - - - - - -
# Banasgar Tons HPS-Bansagar IV (Jhinna) 20 100% 20 30.00% 6 100 33 2 3,104,670 1.09 4 5 1.66 - 33
# Marhi Khera HPS 60 100% 60 20.00% 12 95 32 3 2,618,530 2.29 7 10 3.28 - 32
B Hydel Total 917 928 36 11.23 90 127
MP Genco GENERATION TOTAL 3,537 3,728 467 - 2.64 983 1,450
C
MPPMCL allocated Stations 9,799 42,839 13,677 - - 4,857 3.55
D
E Total (A+B+C) 18,533 24,865 1,331.00 8,282.57 3.33
F MPPMCL Other Costs (105.87)
Total Cost - Ex Bus (D+E) 24,864.51 8,176.70 3.29

MPMKVVCL Annexure-I of ARR/Tariff Petition FY-17
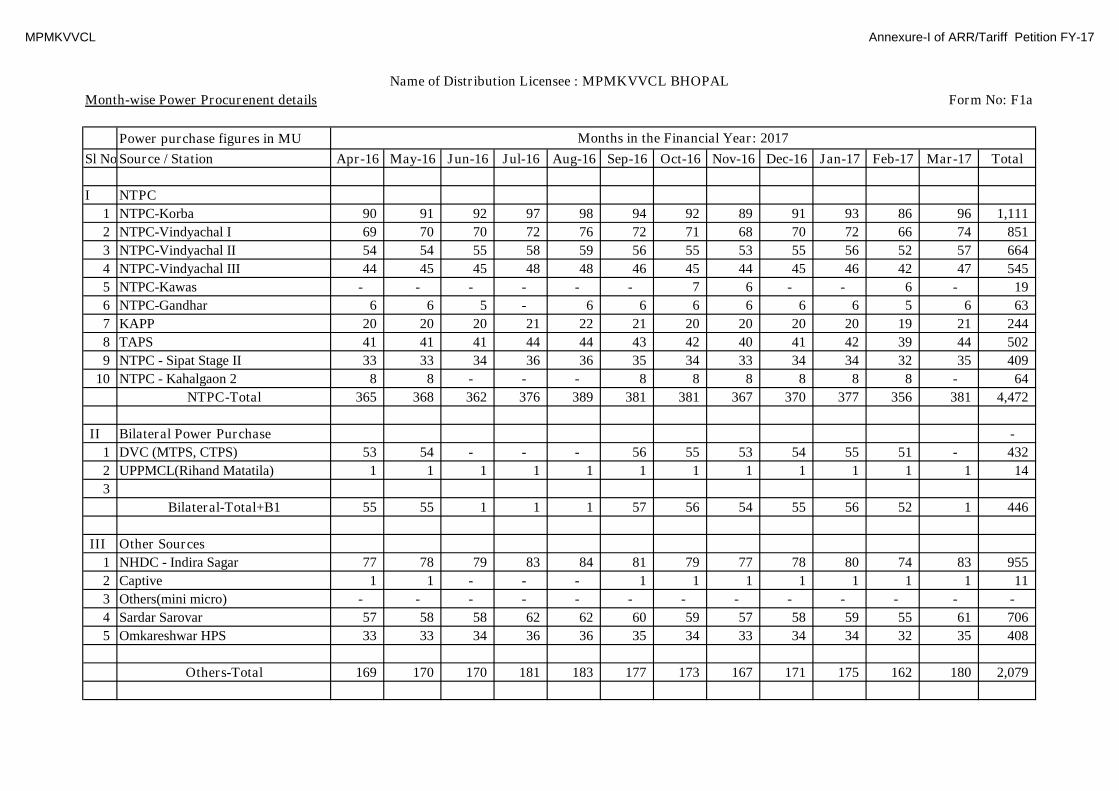
Month-wise Power Procurenent details Form No: F1a
Power purchase figures in MU
Sl NoSource / Station Apr-13 May-13 Jun-13 Jul-13 Aug-13 Sep-13 Oct-13 Nov-13 Dec-13 Jan-14 Feb-14 Mar-14 Total
I NTPC
1 NTPC-Korba 96 95 74 71 73 98 84 104 95 103 93 107 1,092
2 NTPC-Vindyachal I 74 73 59 76 63 65 55 87 88 74 62 - 775
3 NTPC-Vindyachal II 67 62 59 65 38 55 46 68 66 66 54 63 709
4 NTPC-Vindyachal III 53 51 47 33 53 43 33 51 53 50 42 51 561
5 NTPC-Kawas 10 16 3 - - - 1 3 15 5 - - 54
6 NTPC-Gandhar 10 17 3 - - - 1 3 20 3 - - 58
7 KAPP 22 21 18 22 24 23 23 22 23 24 21 23 267
8 TAPS 15 21 43 49 47 29 47 46 41 43 45 48 474
9 NTPC - Sipat Stage II 27 25 24 34 23 36 16 31 41 37 34 43 371
10 NTPC - Kahalgaon 2 5 9 3 - - - 3 8 12 7 - - 47
NTPC-Total 380 391 333 349 322 350 309 423 453 411 351 335 4,408
II Bilateral Power Purchase -
1 DVC (MTPS, CTPS) 48 69 51 54 20 18 66 67 64 62 53 - 572
2 UPPMCL(Rihand Matatila) - - - - - - - - - - - - -
3
Bilateral-Total+B1 48 69 51 54 20 18 66 67 64 62 53 - 572
III Other Sources
1 NHDC - Indira Sagar 69 49 60 192 230 151 105 101 88 88 72 82 1,287
2 Captive 19 29 25 22 22 15 16 16 14 18 17 8 222
3 Others(mini micro) 0 0 - 2 4 2 2 4 3 1 2 0 20
4 Sardar Sarovar 47 41 65 151 165 144 109 69 55 48 68 65 1,027
5 Omkareshwar HPS 32 23 31 73 61 61 43 41 37 39 33 37 511
Others-Total 167 142 181 439 482 373 274 231 197 194 192 192 3,066
Months in the Financial Year: 2014
Name of Distribution Licensee : MPMKVVCL BHOPAL

MPMKVVCL Annexure-I of ARR/Tariff Petition FY-17
Month-wise Power Procurenent details Form No: F1a
Power purchase figures in MU
Sl NoSource / Station Apr-13 May-13 Jun-13 Jul-13 Aug-13 Sep-13 Oct-13 Nov-13 Dec-13 Jan-14 Feb-14 Mar-14 Total
Months in the Financial Year: 2014
Name of Distribution Licensee : MPMKVVCL BHOPAL
A Grand Total 595 601 565 842 825 741 650 721 713 667 597 527 8,046
I MP Genco - Thermal
1 ATPS - Chachai-PH 1&2 31 30 26 15 18 26 31 34 36 36 34 36 355
2 ATPS - Chachai-Extn 36 40 38 43 44 42 40 40 40 33 34 37 469
3 STPS - Sarani-PH 1, 2 & 3 111 99 77 61 62 85 103 104 124 121 100 - 1,046
4 SGTPS - Bir'pur - Extn 99 88 83 22 - - 88 89 88 91 3 - 649
5 SGTPS - Bir'pur - PH 1 & 2 20 125 93 - - - 53 1 39 125 - - 456
Thermal-Total 298 381 317 142 125 153 315 267 327 406 172 73 2,976
II MPGenco - Hydel
1 CHPS-Gandhi Sagar 2 4 4 1 11 5 5 4 6 8 5 7 62
2 CHPS-RP Sagar & Jawahar Sagar 0 0 0 3 29 8 15 20 19 9 15 13 131
3 Pench THPS 4 3 4 7 10 14 14 9 8 6 6 5 89
4 Rajghat HPS 0 (0) (0) 0 2 0 1 2 3 0 0 (0) 9
5 Bargi HPS 12 9 13 17 20 13 16 10 13 12 14 18 168
6 Birsingpur HPS (0) (0) 0 4 5 3 2 1 0 0 0 0 14
7 Banasgar Tons HPS 39 38 40 49 69 70 69 45 43 36 40 60 598
8 Banasgar Tons HPS-Silpara - - - - - - - - - - - - -
9 Banasgar Tons HPS-Devloned - - - - - - - - - - - - -
10 Banasgar Tons HPS-Bansagar IV (Jhinna) 3 2 2 1 1 5 4 4 4 4 4 5 39
Marhi Khera HPS 0 0 0 6 - - 5 1 6 3 1 - 21
Hydel Total 59 57 65 89 146 117 131 94 102 77 87 108 1,132
B MP Genco GENERATION TOTAL 357 438 382 231 271 270 446 362 430 483 259 181 4,108
C MPPMCL allocated Stations 153 215 370 167 167 255 186 368 460 466 417 548 3,773
D Total Power requirement (A+B+C) 1,105 1,254 1,317 1,240 1,264 1,266 1,282 1,451 1,604 1,616 1,273 1,256 15,927
E Total Inter-State transmission losses
F Total energy input to MP system (D-E)

MPMKVVCL Annexure-I of ARR/Tariff Petition FY-17
Month-wise Power Procurenent details Form No: F1a
Power purchase figures in MU
Sl NoSource / Station Apr-14 May-14 Jun-14 Jul-14 Aug-14 Sep-14 Oct-14 Nov-14 Dec-14 Jan-15 Feb-15 Mar-15 Total
I NTPC
1 NTPC-Korba 95 92 93 76 87 102 105 92 89 107 107 105 1,150
2 NTPC-Vindyachal I 76 80 84 76 59 80 88 91 74 58 69 70 905
3 NTPC-Vindyachal II 71 67 32 50 49 71 51 69 55 50 58 60 683
4 NTPC-Vindyachal III 57 49 54 51 35 18 58 54 45 41 39 49 549
5 NTPC-Kawas 10 13 8 8 16 14 - 12 10 5 3 - 99
6 NTPC-Gandhar 11 15 10 10 14 14 13 9 2 0 0 0 97
7 KAPP 14 17 20 22 22 24 24 23 23 25 23 27 264
8 TAPS 46 43 39 50 51 50 50 48 37 26 42 50 531
9 NTPC - Sipat Stage II 40 41 38 41 22 34 43 41 38 42 42 43 466
10 NTPC - Kahalgaon 2 8 13 11 9 10 9 14 13 8 9 8 7 119
NTPC-Total 429 430 389 393 363 415 447 453 379 363 391 411 4,863
II Bilateral Power Purchase -
1 DVC (MTPS, CTPS) - 3 65 64 45 3 72 70 70 69 55 64 581
2 UPPMCL(Rihand Matatila) 2 3 3 3 5 6 5 2 2 3 - - 33
3
Bilateral-Total+B1 2 6 68 67 51 9 77 71 72 72 55 64 614
III Other Sources
1 NHDC - Indira Sagar 91 36 26 21 68 160 55 80 70 97 73 77 854
2 Captive 2 1 1 1 1 0 0 0 1 1 1 1 10
3 Others(mini micro) 0 0 - - 1 1 1 3 2 1 1 0 11
4 Sardar Sarovar 47 32 6 18 74 142 38 27 30 52 35 44 544
5 Omkareshwar HPS 41 18 13 13 29 64 22 33 29 42 33 35 375
Others-Total 181 87 47 53 174 367 116 143 132 194 142 158 1,794
A Grand Total 612 523 504 513 588 792 640 667 583 629 588 634 7,271
Months in the Financial Year: 2015
Name of Distribution Licensee : MPMKVVCL BHOPAL
MPMKVVCL Annexure-I of ARR/Tariff Petition FY-17
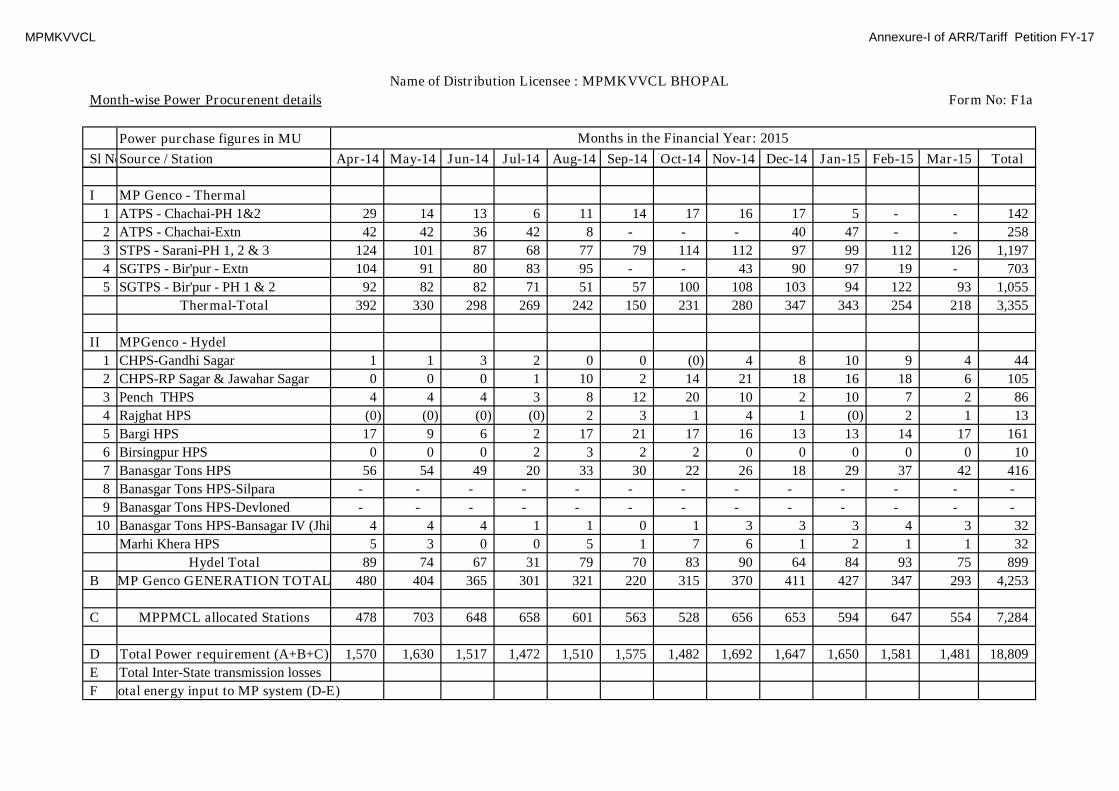
Month-wise Power Procurenent details Form No: F1a
Power purchase figures in MU
Sl NoSource / Station Apr-14 May-14 Jun-14 Jul-14 Aug-14 Sep-14 Oct-14 Nov-14 Dec-14 Jan-15 Feb-15 Mar-15 Total
Months in the Financial Year: 2015
Name of Distribution Licensee : MPMKVVCL BHOPAL
I MP Genco - Thermal
1 ATPS - Chachai-PH 1&2 29 14 13 6 11 14 17 16 17 5 - - 142
2 ATPS - Chachai-Extn 42 42 36 42 8 - - - 40 47 - - 258
3 STPS - Sarani-PH 1, 2 & 3 124 101 87 68 77 79 114 112 97 99 112 126 1,197
4 SGTPS - Bir'pur - Extn 104 91 80 83 95 - - 43 90 97 19 - 703
5 SGTPS - Bir'pur - PH 1 & 2 92 82 82 71 51 57 100 108 103 94 122 93 1,055
Thermal-Total 392 330 298 269 242 150 231 280 347 343 254 218 3,355
II MPGenco - Hydel
1 CHPS-Gandhi Sagar 1 1 3 2 0 0 (0) 4 8 10 9 4 44
2 CHPS-RP Sagar & Jawahar Sagar 0 0 0 1 10 2 14 21 18 16 18 6 105
3 Pench THPS 4 4 4 3 8 12 20 10 2 10 7 2 86
4 Rajghat HPS (0) (0) (0) (0) 2 3 1 4 1 (0) 2 1 13
5 Bargi HPS 17 9 6 2 17 21 17 16 13 13 14 17 161
6 Birsingpur HPS 0 0 0 2 3 2 2 0 0 0 0 0 10
7 Banasgar Tons HPS 56 54 49 20 33 30 22 26 18 29 37 42 416
8 Banasgar Tons HPS-Silpara - - - - - - - - - - - - -
9 Banasgar Tons HPS-Devloned - - - - - - - - - - - - -
10 Banasgar Tons HPS-Bansagar IV (Jhinna) 4 4 4 1 1 0 1 3 3 3 4 3 32
Marhi Khera HPS 5 3 0 0 5 1 7 6 1 2 1 1 32
Hydel Total 89 74 67 31 79 70 83 90 64 84 93 75 899
B MP Genco GENERATION TOTAL 480 404 365 301 321 220 315 370 411 427 347 293 4,253
C MPPMCL allocated Stations 478 703 648 658 601 563 528 656 653 594 647 554 7,284
D Total Power requirement (A+B+C) 1,570 1,630 1,517 1,472 1,510 1,575 1,482 1,692 1,647 1,650 1,581 1,481 18,809
E Total Inter-State transmission losses
F Total energy input to MP system (D-E)

MPMKVVCL Annexure-I of ARR/Tariff Petition FY-17
Month-wise Power Procurenent details Form No: F1a
Power purchase figures in MU
Sl NoSource / Station Apr-15 May-15 Jun-15 Jul-15 Aug-15 Sep-15 Oct-15 Nov-15 Dec-15 Jan-16 Feb-16 Mar-16 Total
I NTPC
1 NTPC-Korba 90 91 92 98 99 95 93 89 92 93 87 97 1,115
2 NTPC-Vindyachal I 66 67 67 72 72 69 68 66 67 68 64 71 817
3 NTPC-Vindyachal II 50 50 50 54 54 52 51 49 50 51 48 53 612
4 NTPC-Vindyachal III 43 43 44 46 47 45 44 43 44 44 41 46 530
5 NTPC-Kawas 6 - - - - - - 6 6 6 6 - 31
6 NTPC-Gandhar 6 6 6 6 6 6 6 5 6 6 5 6 68
7 KAPP 17 17 17 18 19 18 17 17 17 18 16 18 209
8 TAPS 42 42 43 45 46 44 43 41 42 43 40 45 516
9 NTPC - Sipat Stage II 33 33 33 35 36 34 33 32 33 34 31 35 401
10 NTPC - Kahalgaon 2 8 9 9 - - 9 9 8 9 9 8 7 84
NTPC-Total 361 357 360 374 378 371 364 357 366 373 346 377 4,385
II Bilateral Power Purchase -
1 DVC (MTPS, CTPS) 56 56 57 47 59 59 57 55 57 58 54 60 675
2 UPPMCL(Rihand Matatila) 1 1 1 1 1 1 1 1 1 1 1 1 11
3
Bilateral-Total+B1 57 57 58 48 60 60 58 56 58 59 55 61 686
III Other Sources
1 NHDC - Indira Sagar 62 62 63 67 68 65 63 61 63 64 59 66 762
2 Captive 1 1 1 1 1 1 1 1 1 1 1 1 9
3 Others(mini micro) - - - - - - - - - - - - -
4 Sardar Sarovar 46 47 47 50 51 48 48 46 47 48 44 50 571
5 Omkareshwar HPS 29 29 29 31 31 30 29 28 29 29 27 30 352
Others-Total 137 138 140 148 150 144 141 136 139 142 132 147 1,695
Months in the Financial Year: 2016
Name of Distribution Licensee : MPMKVVCL BHOPAL

MPMKVVCL Annexure-I of ARR/Tariff Petition FY-17
Month-wise Power Procurenent details Form No: F1a
Power purchase figures in MU
Sl NoSource / Station Apr-15 May-15 Jun-15 Jul-15 Aug-15 Sep-15 Oct-15 Nov-15 Dec-15 Jan-16 Feb-16 Mar-16 Total
Months in the Financial Year: 2016
Name of Distribution Licensee : MPMKVVCL BHOPAL
A Grand Total 555 553 558 570 589 575 563 549 563 574 533 584 6,765
I MP Genco - Thermal
1 ATPS - Chachai-PH 1&2 - - - - - - - - - - - - -
2 ATPS - Chachai-Extn 39 40 40 43 43 41 41 39 40 41 38 42 487
3 STPS - Sarani-PH 1, 2 & 3 97 98 99 105 106 102 100 96 99 100 93 104 1,199
4 SGTPS - Bir'pur - Extn 89 85 64 - - 52 90 88 90 92 85 - 735
5 SGTPS - Bir'pur - PH 1 & 2 14 - - - - - - 90 39 28 105 - 275
Thermal-Total 239 223 203 148 149 195 231 313 267 261 321 146 2,696
II MPGenco - Hydel
1 CHPS-Gandhi Sagar 4 4 4 4 4 4 4 4 4 4 3 4 45
2 CHPS-RP Sagar & Jawahar Sagar 10 10 10 11 11 10 10 10 10 10 9 11 122
3 Pench THPS 6 6 6 7 7 6 6 6 6 6 6 7 76
4 Rajghat HPS 1 1 1 - - 1 1 1 1 1 1 1 7
5 Bargi HPS 10 10 10 10 11 10 10 10 10 10 9 10 120
6 Birsingpur HPS 1 1 1 1 1 1 1 1 1 1 1 1 7
7 Banasgar Tons HPS 30 30 31 33 33 32 31 30 31 31 29 32 371
8 Banasgar Tons HPS-Silpara - - - - - - - - - - - - -
9 Banasgar Tons HPS-Devloned - - - - - - - - - - - - -
10 Banasgar Tons HPS-Bansagar IV (Jhinna) 2 2 2 3 3 2 2 2 2 2 2 3 29
Marhi Khera HPS 2 2 2 - - 2 2 2 2 2 2 2 22
Hydel Total 65 66 66 67 68 68 67 65 66 67 63 70 799
B MP Genco GENERATION TOTAL 304 289 269 215 218 263 298 377 333 328 384 216 3,495
C MPPMCL allocated Stations 529 533 537 570 577 554 542 643 659 672 625 565 7,006
D Total Power requirement (A+B+C) 1,388 1,375 1,365 1,355 1,383 1,392 1,403 1,570 1,555 1,573 1,542 1,365 17,266
E Total Inter-State transmission losses
F Total energy input to MP system (D-E)
MPMKVVCL Annexure-I of ARR/Tariff Petition FY-17
Month-wise Power Procurenent details Form No: F1a
Power purchase figures in MU
Sl No Source / Station Apr-16 May-16 Jun-16 Jul-16 Aug-16 Sep-16 Oct-16 Nov-16 Dec-16 Jan-17 Feb-17 Mar-17 Total
I NTPC
1 NTPC-Korba 90 91 92 97 98 94 92 89 91 93 86 96 1,111
2 NTPC-Vindyachal I 69 70 70 72 76 72 71 68 70 72 66 74 851
3 NTPC-Vindyachal II 54 54 55 58 59 56 55 53 55 56 52 57 664
4 NTPC-Vindyachal III 44 45 45 48 48 46 45 44 45 46 42 47 545
5 NTPC-Kawas - - - - - - 7 6 - - 6 - 19
6 NTPC-Gandhar 6 6 5 - 6 6 6 6 6 6 5 6 63
7 KAPP 20 20 20 21 22 21 20 20 20 20 19 21 244
8 TAPS 41 41 41 44 44 43 42 40 41 42 39 44 502
9 NTPC - Sipat Stage II 33 33 34 36 36 35 34 33 34 34 32 35 409
10 NTPC - Kahalgaon 2 8 8 - - - 8 8 8 8 8 8 - 64
NTPC-Total 365 368 362 376 389 381 381 367 370 377 356 381 4,472
II Bilateral Power Purchase -
1 DVC (MTPS, CTPS) 53 54 - - - 56 55 53 54 55 51 - 432
2 UPPMCL(Rihand Matatila) 1 1 1 1 1 1 1 1 1 1 1 1 14
3
Bilateral-Total+B1 55 55 1 1 1 57 56 54 55 56 52 1 446
III Other Sources
1 NHDC - Indira Sagar 77 78 79 83 84 81 79 77 78 80 74 83 955
2 Captive 1 1 - - - 1 1 1 1 1 1 1 11
3 Others(mini micro) - - - - - - - - - - - - -
4 Sardar Sarovar 57 58 58 62 62 60 59 57 58 59 55 61 706
5 Omkareshwar HPS 33 33 34 36 36 35 34 33 34 34 32 35 408
Others-Total 169 170 170 181 183 177 173 167 171 175 162 180 2,079
Months in the Financial Year: 2017
Name of Distribution Licensee : MPMKVVCL BHOPAL

MPMKVVCL Annexure-I of ARR/Tariff Petition FY-17
Month-wise Power Procurenent details Form No: F1a
Power purchase figures in MU
Sl No Source / Station Apr-16 May-16 Jun-16 Jul-16 Aug-16 Sep-16 Oct-16 Nov-16 Dec-16 Jan-17 Feb-17 Mar-17 Total
Months in the Financial Year: 2017
Name of Distribution Licensee : MPMKVVCL BHOPAL
A Grand Total 588 593 533 558 574 615 610 588 596 608 571 563 6,997
I MP Genco - Thermal
1 ATPS - Chachai-PH 1&2 - - - - - - - - - - - - -
2 ATPS - Chachai-Extn 39 39 39 42 42 41 40 38 39 40 37 42 479
3 STPS - Sarani-PH 1, 2 & 3 96 97 - - - 100 98 95 97 99 92 79 853
4 SGTPS - Bir'pur - Extn 57 9 - - - 66 90 87 89 91 84 - 573
5 SGTPS - Bir'pur - PH 1 & 2 - - - - - - 107 103 - - 39 - 249
Thermal-Total 191 145 39 42 42 207 335 323 226 230 253 120 2,154
II MPGenco - Hydel
1 CHPS-Gandhi Sagar 4 4 4 4 4 4 4 4 4 4 4 4 50
2 CHPS-RP Sagar & Jawahar Sagar 10 10 10 10 10 10 10 9 10 10 9 10 118
3 Pench THPS 7 7 7 7 7 7 7 7 7 7 6 7 83
4 Rajghat HPS 1 1 - - - 1 1 1 1 1 1 - 7
5 Bargi HPS 12 12 12 13 13 12 12 12 12 12 11 13 147
6 Birsingpur HPS 1 1 1 1 1 1 1 1 1 1 1 1 10
7 Banasgar Tons HPS 37 37 38 40 41 39 38 37 38 38 36 40 458
8 Banasgar Tons HPS-Silpara - - - - - - - - - - - - -
9 Banasgar Tons HPS-Devloned - - - - - - - - - - - - -
10 Banasgar Tons HPS-Bansagar IV (Jhinna) 3 3 3 3 3 3 3 3 3 3 3 3 33
Marhi Khera HPS 3 3 - - - 3 3 3 3 3 3 - 22
Hydel Total 76 77 74 79 80 80 78 76 78 79 73 78 928
B MP Genco GENERATION TOTAL 268 222 114 121 122 287 414 399 303 309 326 198 3,082
C MPPMCL allocated Stations 718 746 712 669 777 773 957 891 769 868 852 787 9,520
D Total Power requirement (A+B+C) 1,574 1,560 1,359 1,347 1,473 1,675 1,981 1,877 1,668 1,785 1,749 1,548 19,598
E Total Inter-State transmission losses
F Total energy input to MP system (D-E)

MPMKVVCL Annexure-I of ARR/Tariff Petition FY-17
Month-wise Power Procurenent details Form No: F1a
Power purchase figures in MU
Sl No Source / Station Apr-17 May-17 Jun-17 Jul-17 Aug-17 Sep-17 Oct-17 Nov-17 Dec-17 Jan-18 Feb-18 Mar-18 Total
I NTPC
1 NTPC-Korba 94 96 90 84 88 99 93 94 94 100 95 99 1,126
2 NTPC-Vindyachal I 71 74 77 77 71 75 76 75 73 67 66 71 872
3 NTPC-Vindyachal II 58 58 48 56 55 60 53 58 55 53 52 56 662
4 NTPC-Vindyachal III 48 47 49 50 44 37 49 47 46 44 41 47 550
5 NTPC-Kawas - - - - - - 7 6 7 7 - - 26
6 NTPC-Gandhar 6 6 6 6 6 6 6 6 6 6 6 6 72
7 KAPP 17 18 20 21 21 21 21 20 21 21 19 21 242
8 TAPS 43 43 43 48 48 46 45 43 41 38 41 45 525
9 NTPC - Sipat Stage II 35 37 36 39 32 35 37 36 36 37 35 37 431
10 NTPC - Kahalgaon 2 9 9 9 8 9 - 9 9 9 9 9 - 89
NTPC-Total 381 388 378 389 375 379 394 394 387 381 365 382 4,594
II Bilateral Power Purchase -
1 DVC (MTPS, CTPS) 38 39 61 63 56 39 61 60 62 61 54 59 655
2 UPPMCL(Rihand Matatila) 1 2 2 2 3 3 2 1 1 2 1 1 19
3
Bilateral-Total+B1 39 41 63 65 59 42 64 61 64 63 54 60 674
III Other Sources
1 NHDC - Indira Sagar 76 60 58 59 75 102 67 73 73 81 69 74 867
2 Captive 1 1 1 1 1 1 1 1 1 1 1 1 12
3 Others(mini micro) - - - - - - - - - - - - -
4 Sardar Sarovar 50 47 38 45 64 83 49 44 46 54 45 51 616
5 Omkareshwar HPS 34 27 26 28 33 43 29 32 32 35 31 33 383
Others-Total 162 136 124 132 173 229 145 149 152 171 146 160 1,878
A Grand Total 582 564 564 586 607 650 603 604 603 615 565 602 7,146
Months in the Financial Year: 2018
Name of Distribution Licensee : MPMKVVCL BHOPAL

MPMKVVCL Annexure-I of ARR/Tariff Petition FY-17
Month-wise Power Procurenent details Form No: F1a
Power purchase figures in MU
Sl No Source / Station Apr-17 May-17 Jun-17 Jul-17 Aug-17 Sep-17 Oct-17 Nov-17 Dec-17 Jan-18 Feb-18 Mar-18 Total
Months in the Financial Year: 2018
Name of Distribution Licensee : MPMKVVCL BHOPAL
I MP Genco - Thermal
1 ATPS - Chachai-PH 1&2 - - - - - - - - - - - - -
2 ATPS - Chachai-Extn 41 41 40 44 32 40 43 41 41 43 39 44 489
3 STPS - Sarani-PH 1, 2 & 3 106 101 98 95 99 95 104 102 101 101 99 109 1,210
4 SGTPS - Bir'pur - Extn 64 92 63 - 5 - 93 87 93 94 52 - 643
5 SGTPS - Bir'pur - PH 1 & 2 - - - - - - 52 61 95 40 - - 248
Thermal-Total 210 234 202 139 136 136 292 291 331 277 190 153 2,590
II MPGenco - Hydel
1 CHPS-Gandhi Sagar 3 3 4 3 3 3 3 4 5 6 5 4 47
2 CHPS-RP Sagar & Jawahar Sagar 7 7 7 8 11 8 11 13 13 12 12 9 117
3 Pench THPS 6 6 6 6 8 8 11 8 5 8 6 5 82
4 Rajghat HPS 1 1 1 1 1 - 1 2 1 1 1 1 10
5 Bargi HPS 13 10 10 9 14 15 13 12 12 12 11 13 144
6 Birsingpur HPS 1 1 1 1 2 1 1 1 1 1 1 1 9
7 Banasgar Tons HPS 41 41 41 32 36 34 31 31 30 33 34 37 421
8 Banasgar Tons HPS-Silpara - - - - - - - - - - - - -
9 Banasgar Tons HPS-Devloned - - - - - - - - - - - - -
10 Banasgar Tons HPS-Bansagar IV (Jhinna) 3 3 3 2 2 2 2 3 3 3 3 3 32
Marhi Khera HPS 3 3 2 2 4 - 4 4 2 2 2 2 29
Hydel Total 77 74 73 64 80 70 76 77 72 77 76 75 890
B MP Genco GENERATION TOTAL 287 308 274 203 215 206 369 368 402 355 266 227 3,480
C MPPMCL allocated Stations 894 874 895 931 933 912 1,029 1,022 969 1,028 915 904 11,305
D Total Power requirement (A+B+C) 1,763 1,746 1,734 1,720 1,755 1,768 2,000 1,994 1,975 1,997 1,746 1,733 21,932
E Total Inter-State transmission losses
F Total energy input to MP system (D-E)
MPMKVVCL Annexure-I of ARR/Tariff Petition FY-17
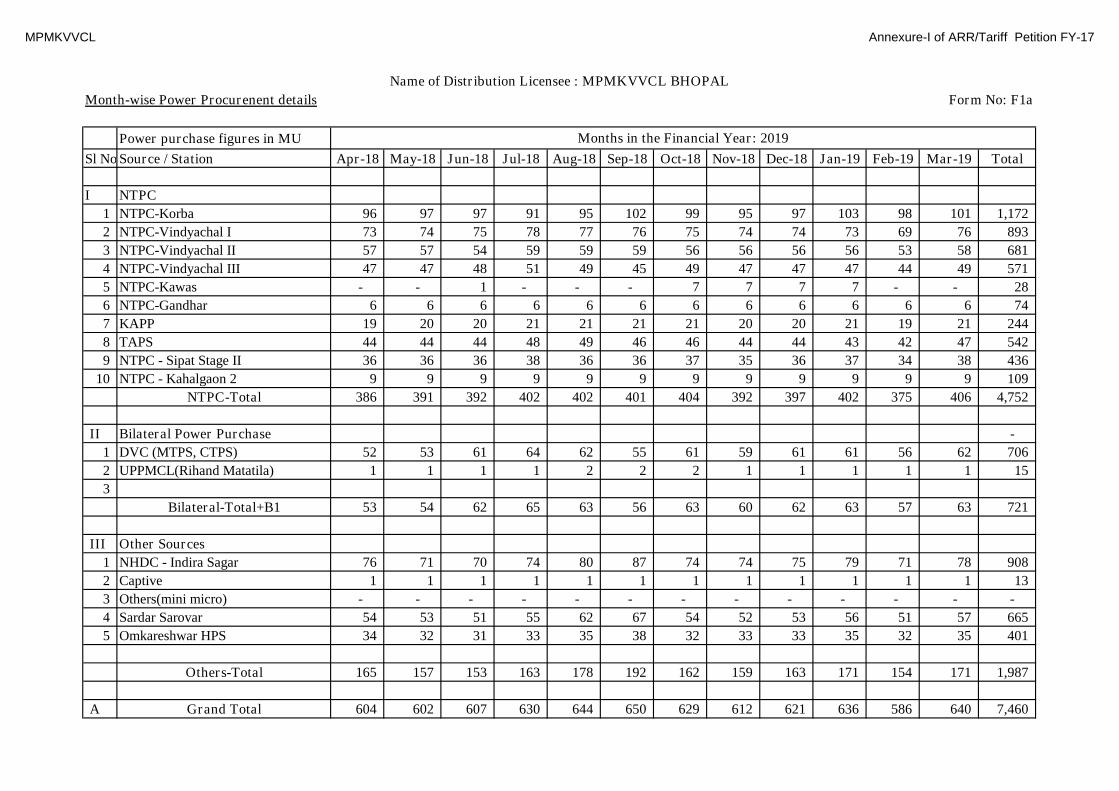
Month-wise Power Procurenent details Form No: F1a
Power purchase figures in MU
Sl No Source / Station Apr-18 May-18 Jun-18 Jul-18 Aug-18 Sep-18 Oct-18 Nov-18 Dec-18 Jan-19 Feb-19 Mar-19 Total
I NTPC
1 NTPC-Korba 96 97 97 91 95 102 99 95 97 103 98 101 1,172
2 NTPC-Vindyachal I 73 74 75 78 77 76 75 74 74 73 69 76 893
3 NTPC-Vindyachal II 57 57 54 59 59 59 56 56 56 56 53 58 681
4 NTPC-Vindyachal III 47 47 48 51 49 45 49 47 47 47 44 49 571
5 NTPC-Kawas - - 1 - - - 7 7 7 7 - - 28
6 NTPC-Gandhar 6 6 6 6 6 6 6 6 6 6 6 6 74
7 KAPP 19 20 20 21 21 21 21 20 20 21 19 21 244
8 TAPS 44 44 44 48 49 46 46 44 44 43 42 47 542
9 NTPC - Sipat Stage II 36 36 36 38 36 36 37 35 36 37 34 38 436
10 NTPC - Kahalgaon 2 9 9 9 9 9 9 9 9 9 9 9 9 109
NTPC-Total 386 391 392 402 402 401 404 392 397 402 375 406 4,752
II Bilateral Power Purchase -
1 DVC (MTPS, CTPS) 52 53 61 64 62 55 61 59 61 61 56 62 706
2 UPPMCL(Rihand Matatila) 1 1 1 1 2 2 2 1 1 1 1 1 15
3
Bilateral-Total+B1 53 54 62 65 63 56 63 60 62 63 57 63 721
III Other Sources
1 NHDC - Indira Sagar 76 71 70 74 80 87 74 74 75 79 71 78 908
2 Captive 1 1 1 1 1 1 1 1 1 1 1 1 13
3 Others(mini micro) - - - - - - - - - - - - -
4 Sardar Sarovar 54 53 51 55 62 67 54 52 53 56 51 57 665
5 Omkareshwar HPS 34 32 31 33 35 38 32 33 33 35 32 35 401
Others-Total 165 157 153 163 178 192 162 159 163 171 154 171 1,987
A Grand Total 604 602 607 630 644 650 629 612 621 636 586 640 7,460
Months in the Financial Year: 2019
Name of Distribution Licensee : MPMKVVCL BHOPAL
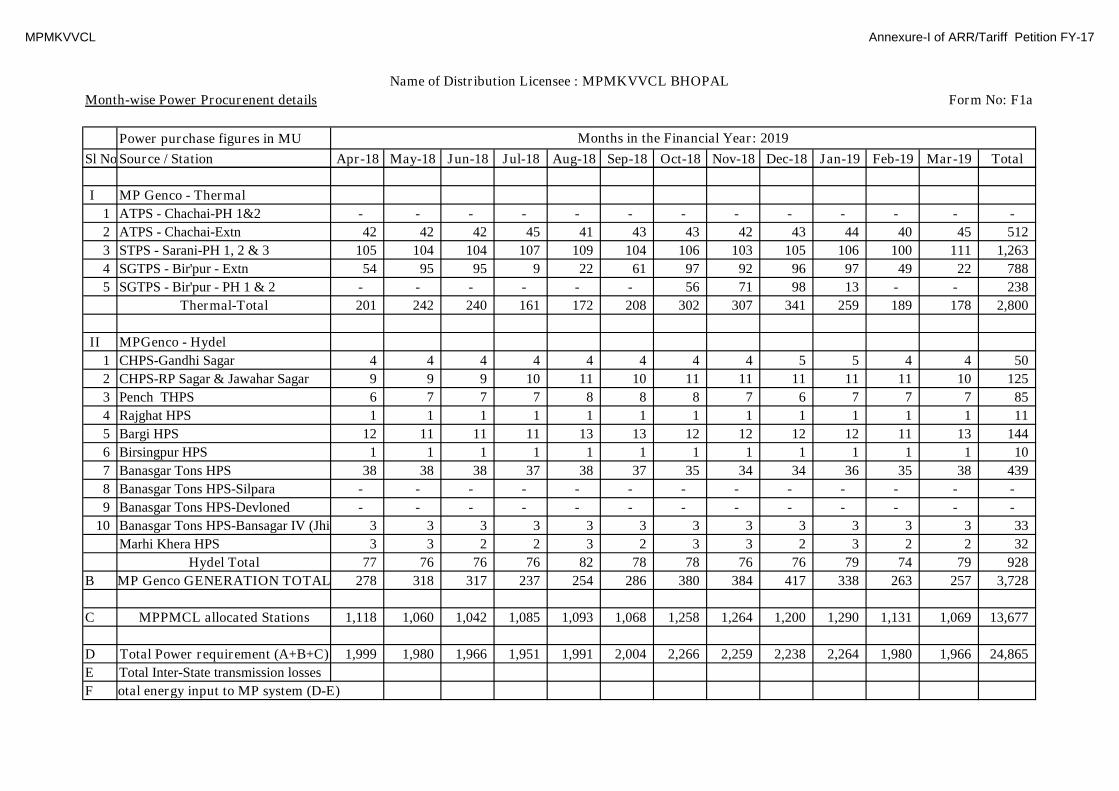
MPMKVVCL Annexure-I of ARR/Tariff Petition FY-17
Month-wise Power Procurenent details Form No: F1a
Power purchase figures in MU
Sl No Source / Station Apr-18 May-18 Jun-18 Jul-18 Aug-18 Sep-18 Oct-18 Nov-18 Dec-18 Jan-19 Feb-19 Mar-19 Total
Months in the Financial Year: 2019
Name of Distribution Licensee : MPMKVVCL BHOPAL
I MP Genco - Thermal
1 ATPS - Chachai-PH 1&2 - - - - - - - - - - - - -
2 ATPS - Chachai-Extn 42 42 42 45 41 43 43 42 43 44 40 45 512
3 STPS - Sarani-PH 1, 2 & 3 105 104 104 107 109 104 106 103 105 106 100 111 1,263
4 SGTPS - Bir'pur - Extn 54 95 95 9 22 61 97 92 96 97 49 22 788
5 SGTPS - Bir'pur - PH 1 & 2 - - - - - - 56 71 98 13 - - 238
Thermal-Total 201 242 240 161 172 208 302 307 341 259 189 178 2,800
II MPGenco - Hydel
1 CHPS-Gandhi Sagar 4 4 4 4 4 4 4 4 5 5 4 4 50
2 CHPS-RP Sagar & Jawahar Sagar 9 9 9 10 11 10 11 11 11 11 11 10 125
3 Pench THPS 6 7 7 7 8 8 8 7 6 7 7 7 85
4 Rajghat HPS 1 1 1 1 1 1 1 1 1 1 1 1 11
5 Bargi HPS 12 11 11 11 13 13 12 12 12 12 11 13 144
6 Birsingpur HPS 1 1 1 1 1 1 1 1 1 1 1 1 10
7 Banasgar Tons HPS 38 38 38 37 38 37 35 34 34 36 35 38 439
8 Banasgar Tons HPS-Silpara - - - - - - - - - - - - -
9 Banasgar Tons HPS-Devloned - - - - - - - - - - - - -
10 Banasgar Tons HPS-Bansagar IV (Jhinna) 3 3 3 3 3 3 3 3 3 3 3 3 33
Marhi Khera HPS 3 3 2 2 3 2 3 3 2 3 2 2 32
Hydel Total 77 76 76 76 82 78 78 76 76 79 74 79 928
B MP Genco GENERATION TOTAL 278 318 317 237 254 286 380 384 417 338 263 257 3,728
C MPPMCL allocated Stations 1,118 1,060 1,042 1,085 1,093 1,068 1,258 1,264 1,200 1,290 1,131 1,069 13,677
D Total Power requirement (A+B+C) 1,999 1,980 1,966 1,951 1,991 2,004 2,266 2,259 2,238 2,264 1,980 1,966 24,865
E Total Inter-State transmission losses
F Total energy input to MP system (D-E)
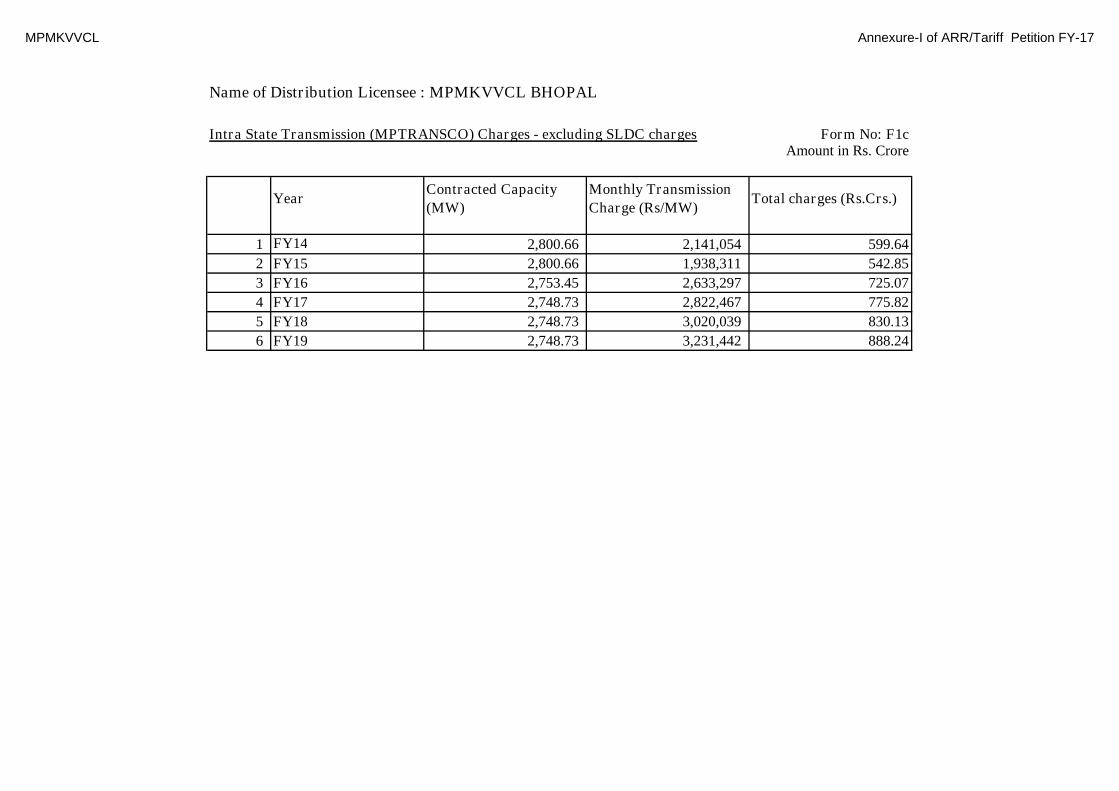
MPMKVVCL Annexure-I of ARR/Tariff Petition FY-17
Name of Distribution Licensee : MPMKVVCL BHOPAL
Intra State Transmission (MPTRANSCO) Charges - excluding SLDC charges Form No: F1cAmount in Rs. Crore
YearContracted Capacity
(MW)
Monthly Transmission
Charge (Rs/MW)Total charges (Rs.Crs.)
1 FY14 2,800.66 2,141,054 599.64
2 FY15 2,800.66 1,938,311 542.85
3 FY16 2,753.45 2,633,297 725.07
4 FY17 2,748.73 2,822,467 775.82
5 FY18 2,748.73 3,020,039 830.13
6 FY19 2,748.73 3,231,442 888.24

MPMKVVCL Annexure-I of ARR/Tariff Petition FY-17
Name of Distribution Licensee : MPMKVVCL BHOPAL
Intra-state Inter Discom UI Charges details
Form No: F1d ( R)
Month
Scheduled
Energy at Ex-
Bus
Scheduled
Energy at
Discom
periphery
Actual Drawl at
Discom
periphery
UI
Charges
Adjusted
UICap Amount
Additional
UINet UI
OAC
Embeded
to EZ
Difference of
scheduled and
drawl energy
April 1,307.70 1,313.23 1,235.44 (14.76) (14.35) 0.07 0.06 (14.22) 77.79
May 1,395.53 1,378.86 1,382.10 (1.38) (0.41) 0.00 0.00 (0.40) (3.24)
June 1,103.18 33.48 1,070.68 0.28 0.47 0.00 0.05 0.53 (1,037.21)
July 1,009.03 969.28 1,108.38 16.85 15.75 - 0.04 15.79 (139.09)
Aug 1,010.12 963.93 1,126.74 18.34 17.60 - 0.17 17.78 (162.81)
Sept 1,261.51 1,206.24 1,373.88 304.24 335.53 - 2.93 338.46 (167.64)
Oct 1,298.58 1,263.09 1,336.10 108.71 107.96 - 0.29 108.25 (73.01)
Nov 1,806.53 1,710.25 1,793.57 134.45 128.48 - 0.52 129.00 (83.32)
Dec 1,940.51 1,842.12 1,926.44 170.23 200.00 - 1.91 201.91 (84.32)
Jan 1,509.39 39.16 42.78 7.18 6.06 - - 6.06 (3.62)
Feb 1,377.25 809.07 800.64 (10.81) (12.99) - - (12.99) 8.43
March 1,243.17 1,187.54 1,296.89 234.62 215.78 0.05 23.93 239.77 (109.35)
Total 16,262.51 12,716.25 14,493.63 967.94 999.87 0.13 29.92 1,029.92 - (1,777.38)
Month
Scheduled
Energy at Ex-
Bus
Scheduled
Energy at
Discom
periphery
Actual Drawl at
Discom
periphery
UI
Charges
Adjusted
UICap Amount
Additional
UINet UI
OAC
Embeded
to EZ
Difference of
scheduled and
drawl energy
April 1,337.24 1285.31 1353.61 226.39 235.30 2.75 20.74 258.79 (68.31)
May 1,405.49 1353.51 1438.24 228.49 219.34 0.48 18.09 237.92 (84.74)
June 1,347.54 1293.91 1356.83 212.80 216.05 3.30 33.90 253.25 (62.92)
July 1,388.81 1338.72 1351.92 40.57 98.45 10.86 10.14 119.45 (13.21)
Aug 1,468.20 1401.25 1422.89 93.56 62.50 13.33 19.67 95.50 (21.64)
Sept 1,534.38 1454.29 1504.86 165.94 178.30 0.79 26.85 205.94 (50.57)
FY 2013-14
FY 2014-15

MPMKVVCL Annexure-I of ARR/Tariff Petition FY-17
Name of Distribution Licensee : MPMKVVCL BHOPAL
Intra-state Inter Discom UI Charges details
Form No: F1d ( R)
FY 2013-14Oct 1,766.46 1684.34 1717.48 113.94 162.53 0.46 8.98 171.97 (33.14)
Nov 1,949.29 1852.79 1882.48 66.77 77.01 0.12 3.70 80.84 (29.69)
Dec 1,713.54 1655.97 1679.55 102.09 96.71 4.74 23.92 125.37 (23.58)
Jan 1,461.05 1423.20 1443.53 42.00 69.95 2.25 10.61 82.81 (20.33)
Feb 1,522.58 1473.84 1501.93 59.59 75.76 2.25 5.44 83.45 (28.09)
March 1,247.67 1216.65 1216.59 0.38 -6.72 3.52 5.42 2.22 0.06
Total 18,142.25 17,433.77 17,869.92 1,352.52 1,485.17 44.88 187.47 1,717.52 - (436.14)
Month
Scheduled
Energy at Ex-
Bus
Scheduled
Energy at
Discom
periphery
Actual Drawl at
Discom
periphery
UI
Charges
Adjusted
UICap Amount
Additional
UINet UI
OAC
Embeded
to EZ
Difference of
scheduled and
drawl energy
April 1,325.92 1292.94 1301.65 11.40 22.90 1.31 6.71 30.92 (8.71)
May 1,516.16 1464.28 1489.05 82.92 125.57 6.05 13.49 145.11 (24.77)
June 1,271.21 1216.29 1274.88 110.72 107.67 0.20 5.12 112.99 (58.59)
July 1,364.12 1298.19 1334.11 77.89 83.74 1.15 4.60 89.50 (35.91)
Aug 1,469.27 1393.23 1416.77 68.91 87.13 2.18 4.70 94.02 (23.55)
Sept 1,688.86 1598.63 1675.32 219.83 204.20 0.60 38.20 243.00 (76.69)
Oct 1,940.80 1849.85 1910.41 138.26 131.03 1.30 11.01 143.34 (60.56)
Nov -
Dec -
Jan -
Feb -
March -
Total 10,576.34 10,113.42 10,402.19 709.94 762.25 12.79 83.84 858.88 - (288.77)
FY 2015-16

MPMKVVCL Annexure-I of ARR/Tariff Petition FY-17
Name of Distribution Licensee : MPMKVVCL BHOPAL
Inter State Transmission Charges Form No: F1e
Month
Contracted
Capacity
(MW)
Total
Transmissi
on/PoC
charges
(Rs.Crs.)
Contracted
Capacity
(MW)
Total
Transmissi
on/PoC
charges
(Rs.Crs.)
Contracted
Capacity
(MW)
Total
Transmissi
on/PoC
charges
(Rs.Crs.)
Contracted
Capacity
(MW)
Total
Transmissi
on/PoC
charges
(Rs.Crs.)
Contracted
Capacity
(MW)
Total
Transmissi
on/PoC
charges
(Rs.Crs.)
Contracted
Capacity
(MW)
Total
Transmissi
on/PoC
charges
(Rs.Crs.)April 34.41 31.18 31.81 32.44 33.09 33.75
May 34.58 31.34 31.96 32.60 33.26 33.92
June 36.23 32.84 33.49 34.16 34.85 35.54
July 38.21 34.63 35.32 36.03 36.75 37.48
August 37.72 34.18 34.86 35.56 36.27 37.00
September 37.93 34.37 35.06 35.76 36.48 37.21
October 37.63 34.10 34.78 35.48 36.19 36.91
November 43.14 39.09 39.87 40.67 41.49 42.32
December 40.64 36.83 37.57 38.32 39.09 39.87
January 40.41 36.62 37.35 38.10 38.86 39.64
February 39.72 36.00 36.72 37.45 38.20 38.97
March 46.77 42.39 43.24 44.10 44.98 45.88
Total 467.40 423.57 432.04 440.68 449.50 458.49
FY17 FY18 FY19
FY14 FY15
FY16(Actual Upto
available data &
Thereafter estimated)

MPMKVVCL Annexure-I of ARR/Tariff Petition FY-17
Name of Distribution Licensee : MPMKVVCL BHOPAL
SLDC Charges Form No: F1f
Amount in Rs. Crore
1 FY14 3,346.21 7,633.71 2.55
2 FY15 4,768.33 6,470.40 3.09
3 FY16 5,050.13 6,674.96 3.37
4 FY17 5,085.69 6,674.96 3.39
5 FY18 5,437.84 6,674.96 3.63
6 FY19 5,832.48 6,674.96 3.89
Sl.No. YearContracted
Capacity (MW)
Monthly
Transmission
Charge (Rs/MW)
Total charges
(Rs.Crs.)

MPMKVVCL Annexure-I of ARR/Tariff Petition FY-17
MPMKVVCL BHOPAL
Gross Fixed Assets Form F2
Amount in Rs. Crore
Sl.No Particulars
Account
Code*Addition
During Year
Adjustments
& Deduction
& assets not
in use
At End Of
Year
Addition
During Year
Adjustments
& Deduction
& assets not
in use
At End Of
Year
Addition
During Year
Adjustments
& Deduction
& assets not
in use
At End Of
Year
1 Land & Land rights 10.1 - - 8.96 - - 8.96 - - 8.96
2 Building and Civil Works 10.2 14.28 - 81.41 10.15 - 91.56 10.10 - 101.66
3 Hydraulic Works 10.3 - - 12.20 - - 12.20 - - 12.20
4 Other Civil Works 10.4 5.13 - 6.67 - - 6.67 - - 6.67
5 Plant & Machinery 10.5 302.81 - 1,964.03 382.92 - 2,346.95 380.88 - 2,727.83
6 Line Cable Networks etc. 10.6 570.44 - 2,678.15 637.91 - 3,316.07 634.52 - 3,950.59
7 Vehicles 10.7 - - 3.40 0.08 - 3.48 0.08 - 3.56
8 Furniture & fixtures 10.8 0.20 - 2.95 0.38 - 3.33 0.38 - 3.71
9 Office Equipments 10.9 27.08 - 99.20 36.02 - 135.22 35.83 - 171.05
10 Assets of Partnership projects etc. - - - - - - - - - -
11 Assets taken over & pending final
valuation
- - - - - - - - - -
12 Any other items/RGGVY Assets 11.0 216.39 - 547.75 97.25 - 644.99 96.73 - 741.72
Total (1 to 12) 1,136.33 - 5,404.73 1,164.71 - 6,569.44 1,158.51 - 7,727.95
FY15 FY16FY14

MPMKVVCL Annexure-I of ARR/Tariff Petition FY-17
MPMKVVCL BHOPAL
Gross Fixed Assets
Sl.No Particulars
Account
Code*
1 Land & Land rights 10.1
2 Building and Civil Works 10.2
3 Hydraulic Works 10.3
4 Other Civil Works 10.4
5 Plant & Machinery 10.5
6 Line Cable Networks etc. 10.6
7 Vehicles 10.7
8 Furniture & fixtures 10.8
9 Office Equipments 10.9
10 Assets of Partnership projects etc. -
11 Assets taken over & pending final
valuation
-
12 Any other items/RGGVY Assets 11.0
Total (1 to 12)
Form F2
Amount in Rs. Crore
Addition
During
Year
Adjustments
& Deduction
& assets not
in use
At End Of
Year
Addition
During
Year
Adjustments
& Deduction
& assets not
in use
At End Of
Year
Addition
During
Year
Adjustments
& Deduction
& assets not
in use
At End Of
Year
- - 8.96 - - 8.96 - - 8.96
11.02 - 112.68 11.47 - 124.14 9.76 - 133.91
- - 12.20 - - 12.20 - - 12.20
- - 6.67 - - 6.67 - - 6.67
415.75 - 3,143.58 432.61 - 3,576.19 368.37 - 3,944.56
692.62 - 4,643.21 720.71 - 5,363.91 613.68 - 5,977.60
0.09 - 3.65 0.09 - 3.74 0.08 - 3.82
0.41 - 4.12 0.43 - 4.55 0.37 - 4.92
39.11 - 210.16 40.70 - 250.86 34.65 - 285.51
- - - - - - - - -
- - - - - - - - -
105.59 - 847.31 109.87 - 957.18 93.55 - 1,050.74
1,264.59 - 8,992.54 1,315.87 - 10,308.42 1,120.46 - 11,428.88
FY18 FY19FY17
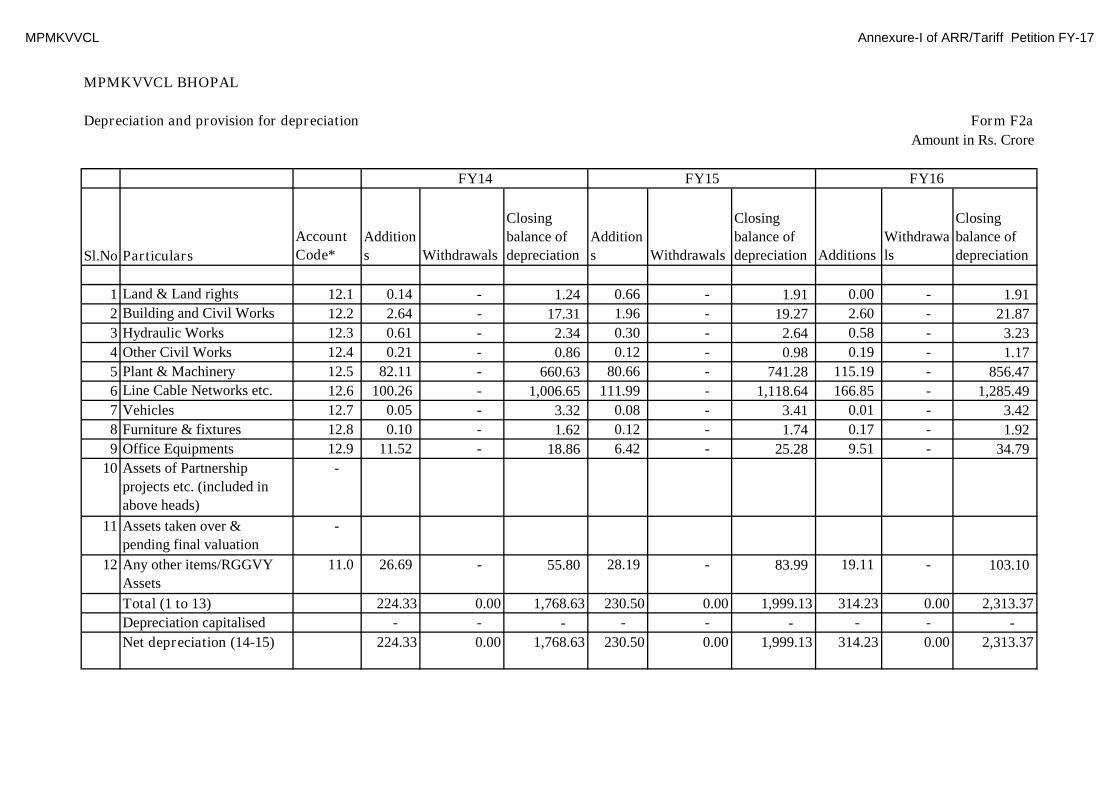
MPMKVVCL Annexure-I of ARR/Tariff Petition FY-17
MPMKVVCL BHOPAL
Depreciation and provision for depreciation Form F2a
Amount in Rs. Crore
Sl.No Particulars
Account
Code*Addition
s Withdrawals
Closing
balance of
depreciation
Addition
s Withdrawals
Closing
balance of
depreciation Additions
Withdrawa
ls
Closing
balance of
depreciation
1 Land & Land rights 12.1 0.14 - 1.24 0.66 - 1.91 0.00 - 1.91
2 Building and Civil Works 12.2 2.64 - 17.31 1.96 - 19.27 2.60 - 21.87
3 Hydraulic Works 12.3 0.61 - 2.34 0.30 - 2.64 0.58 - 3.23
4 Other Civil Works 12.4 0.21 - 0.86 0.12 - 0.98 0.19 - 1.17
5 Plant & Machinery 12.5 82.11 - 660.63 80.66 - 741.28 115.19 - 856.47
6 Line Cable Networks etc. 12.6 100.26 - 1,006.65 111.99 - 1,118.64 166.85 - 1,285.49
7 Vehicles 12.7 0.05 - 3.32 0.08 - 3.41 0.01 - 3.42
8 Furniture & fixtures 12.8 0.10 - 1.62 0.12 - 1.74 0.17 - 1.92
9 Office Equipments 12.9 11.52 - 18.86 6.42 - 25.28 9.51 - 34.79
10 Assets of Partnership
projects etc. (included in
above heads)
-
11 Assets taken over &
pending final valuation
-
12 Any other items/RGGVY
Assets
11.0 26.69 - 55.80 28.19 - 83.99 19.11 - 103.10
Total (1 to 13) 224.33 0.00 1,768.63 230.50 0.00 1,999.13 314.23 0.00 2,313.37
Depreciation capitalised - - - - - - - - -
Net depreciation (14-15) 224.33 0.00 1,768.63 230.50 0.00 1,999.13 314.23 0.00 2,313.37
FY15 FY16FY14

MPMKVVCL Annexure-I of ARR/Tariff Petition FY-17
MPMKVVCL BHOPAL
Depreciation and provision for depreciation
Sl.No Particulars
Account
Code*
1 Land & Land rights 12.1
2 Building and Civil Works 12.2
3 Hydraulic Works 12.3
4 Other Civil Works 12.4
5 Plant & Machinery 12.5
6 Line Cable Networks etc. 12.6
7 Vehicles 12.7
8 Furniture & fixtures 12.8
9 Office Equipments 12.9
10 Assets of Partnership
projects etc. (included in
above heads)
-
11 Assets taken over &
pending final valuation
-
12 Any other items/RGGVY
Assets
11.0
Total (1 to 13)
Depreciation capitalised
Net depreciation (14-15)
Form F2a
Amount in Rs. Crore
Additions
Withdraw
als
Closing
balance of
depreciatio
n Additions
Withdraw
als
Closing
balance of
depreciatio
n Additions
Withdraw
als
Closing
balance of
depreciation
0.00 - 1.92 0.00 - 1.92 0.00 - 1.93
2.95 - 24.82 3.14 - 27.96 3.14 - 31.11
0.58 - 3.81 0.58 - 4.39 0.58 - 4.98
0.19 - 1.36 0.19 - 1.56 0.19 - 1.75
136.22 - 992.69 147.64 - 1,140.33 122.14 - 1,262.48
201.89 - 1,487.38 180.35 - 1,667.73 190.60 - 1,858.33
0.02 - 3.44 0.03 - 3.47 0.03 - 3.50
0.20 - 2.11 0.12 - 2.24 0.13 - 2.37
11.88 - 46.67 12.70 - 59.36 14.34 - 73.71
24.46 - 127.56 27.36 - 154.92 30.32 - 185.23
378.40 0.00 2,691.77 372.12 0.00 3,063.89 361.49 0.00 3,425.38
- - - - - - - - -
378.40 0.00 2,691.77 372.12 0.00 3,063.89 361.49 0.00 3,425.38
FY18 FY19FY17
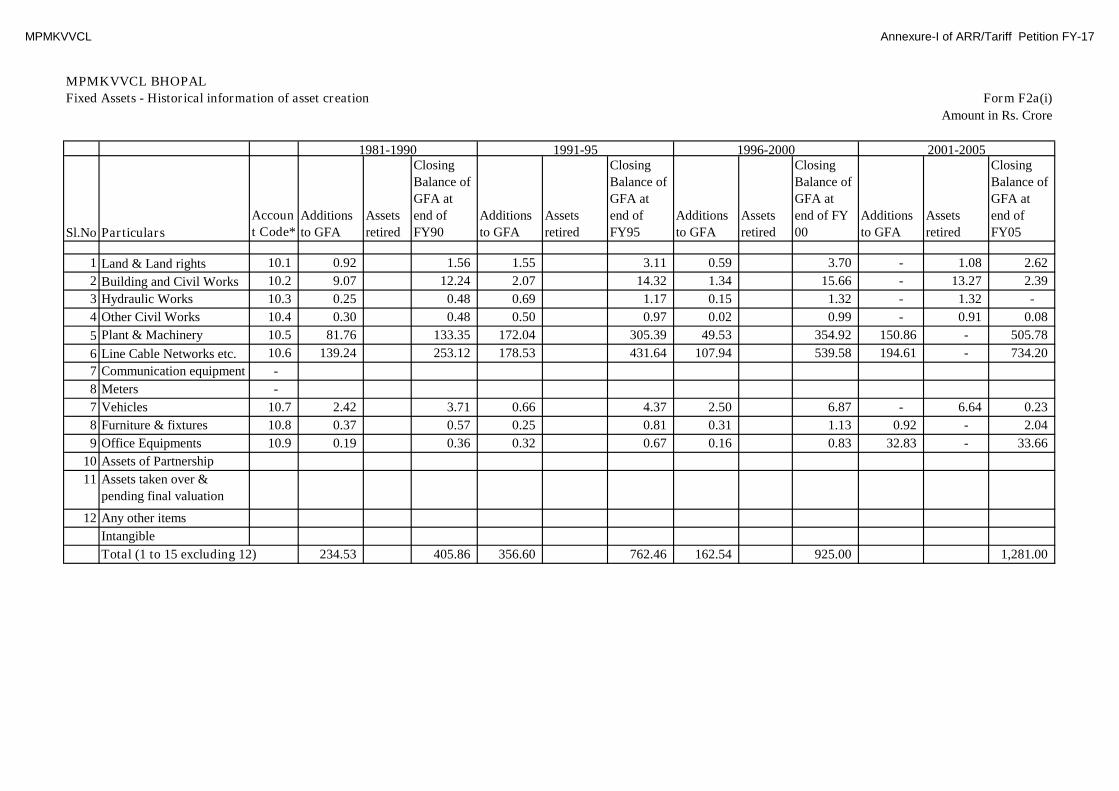
MPMKVVCL Annexure-I of ARR/Tariff Petition FY-17
MPMKVVCL BHOPAL
Fixed Assets - Historical information of asset creation Form F2a(i)
Amount in Rs. Crore
Sl.No Particulars
Accoun
t Code*Additions
to GFA
Assets
retired
Closing
Balance of
GFA at
end of
FY90
Additions
to GFA
Assets
retired
Closing
Balance of
GFA at
end of
FY95
Additions
to GFA
Assets
retired
Closing
Balance of
GFA at
end of FY
00
Additions
to GFA
Assets
retired
Closing
Balance of
GFA at
end of
FY05
1 Land & Land rights 10.1 0.92 1.56 1.55 3.11 0.59 3.70 - 1.08 2.62
2 Building and Civil Works 10.2 9.07 12.24 2.07 14.32 1.34 15.66 - 13.27 2.39
3 Hydraulic Works 10.3 0.25 0.48 0.69 1.17 0.15 1.32 - 1.32 -
4 Other Civil Works 10.4 0.30 0.48 0.50 0.97 0.02 0.99 - 0.91 0.08
5 Plant & Machinery 10.5 81.76 133.35 172.04 305.39 49.53 354.92 150.86 - 505.78
6 Line Cable Networks etc. 10.6 139.24 253.12 178.53 431.64 107.94 539.58 194.61 - 734.20
7 Communication equipment -
8 Meters -
7 Vehicles 10.7 2.42 3.71 0.66 4.37 2.50 6.87 - 6.64 0.23
8 Furniture & fixtures 10.8 0.37 0.57 0.25 0.81 0.31 1.13 0.92 - 2.04
9 Office Equipments 10.9 0.19 0.36 0.32 0.67 0.16 0.83 32.83 - 33.66
10 Assets of Partnership
11 Assets taken over &
pending final valuation
12 Any other items
Intangible
Total (1 to 15 excluding 12) 234.53 405.86 356.60 762.46 162.54 925.00 1,281.00
1981-1990 1991-95 1996-2000 2001-2005

MPMKVVCL Annexure-I of ARR/Tariff Petition FY-17
MPMKVVCL BHOPAL
Fixed Assets - Historical information of asset creation
Sl.No Particulars
Accoun
t Code*
1 Land & Land rights 10.1
2 Building and Civil Works 10.2
3 Hydraulic Works 10.3
4 Other Civil Works 10.4
5 Plant & Machinery 10.5
6 Line Cable Networks etc. 10.6
7 Communication equipment -
8 Meters -
7 Vehicles 10.7
8 Furniture & fixtures 10.8
9 Office Equipments 10.9
10 Assets of Partnership
11 Assets taken over &
pending final valuation
12 Any other items
Intangible
Total (1 to 15 excluding 12)
Form F2a(i)
Amount in Rs. Crore
Additions
to GFA
Assets
retired
Closing
Balance of
GFA at
end of
FY08
Additions
to GFA
Assets
retired
Closing
Balance of
GFA at
end of
FY10
Additions to
GFA
Assets
retired
Closing
Balance of
GFA at end of
FY13
Additio
ns to
GFA
Assets
retired
Closing
Balance of
GFA at
end of
FY15
3.97 - 6.59 1.40 - 7.99 0.05 8.96
15.63 - 18.02 6.65 - 24.67 25.05 67.13
1.10 - 1.10 0.23 - 1.33 10.87 12.20
0.76 - 0.84 0.18 - 1.02 0.46 1.54
220.78 - 726.57 242.93 - 969.49 417.01 1,661.22
189.59 - 923.78 274.40 - 1,198.18 580.12 2,107.71
2.56 - 2.79 0.59 - 3.38 - 3.40
- 0.55 1.50 0.62 - 2.12 0.58 2.75
- 26.99 6.67 3.01 - 9.69 51.38 62.70
-
-
38.86 141.34 331.35
9.42
1,687.85 2,256.72 1,226.86 4,268.38 -
2014-20152009-20102001-2008 2011-2013

MPMKVVCL Annexure-I of ARR/Tariff Petition FY-17
Name of Distribution Licensee : MPMKVVCL BHOPALInvestment Plan - Master
For wheeling activity + Retail supply
Internal
Accrual (from
free reserves
and surplus)
Equity
infused
Loan
Amount
(Rs.
Crores)
Loan
Agency
SYSTEM STRENGTHING 2.1, 2.2, 2,3 Yes
FEEDER SEPERATION6.1, 6.2, 6.3
Yes
NEW PUMP CONNECTION 5.1, 5.2, 5.3 Yes
ADB-II2.1, 2.2, 2,3
Yes
ADB-III
RGGVY 5.1, 5.2, 5.3 Yes
RAPDRP PART A 1.1, 1.2, 1.3 Yes
RAPDRP PART B 4.1, 4.2, 4.3 Yes
HUDCO 1.1, 1.2, 1.3 Yes
IPDS
DDUGJY
GROSS TOTAL 957.12 47.86 47.86 727.41 - 124.43 9.57
9.57957.12 47.86 47.86 727.41 124.43
2013-14
Total capital
expenditure
approved by
MPERC
(Rs. Crs.)
SOURCE OF FINANCING FOR SCHEMEEquity component Debt Component
Capital
Subsidies /
grants
component
Consumer
Contribution
component
Project Details
Name of schemeNature of
Project
Whether
scheme part
of approved
Business
Plan?

MPMKVVCL Annexure-I of ARR/Tariff Petition FY-17
Name of Distribution Licensee : MPMKVVCL BHOPALInvestment Plan - Master
For wheeling activity + Retail supply
SYSTEM STRENGTHING 2.1, 2.2, 2,3 Yes
FEEDER SEPERATION6.1, 6.2, 6.3
Yes
NEW PUMP CONNECTION 5.1, 5.2, 5.3 Yes
ADB-II2.1, 2.2, 2,3
Yes
ADB-III
RGGVY 5.1, 5.2, 5.3 Yes
RAPDRP PART A 1.1, 1.2, 1.3 Yes
RAPDRP PART B 4.1, 4.2, 4.3 Yes
HUDCO 1.1, 1.2, 1.3 Yes
IPDS
DDUGJY
GROSS TOTAL
Project Details
Name of schemeNature of
Project
Whether
scheme part
of approved
Business
Plan?
Internal
Accrual (from
free reserves
and surplus)
Equity
infused
Loan
Amount
(Rs.
Crores)
Loan Agency
255.00 76.50 ` GoMP
131.02 - 0.00 131.02 REC and ADB -
75.17 - - - - 75.17 -
145.16 - - 145.16ADB, REC,
PFC-
30.86 30.86
53.70 - - 2.57 REC 51.13 -
- - - - PFC -
75.91 - - 75.91 PFC, REC -
- - -
- - - - - - -
766.80 - 76.50 385.50 - 126.30 -
2014-15
Total capital
expenditure
approved by
MPERC
(Rs. Crs.)
SOURCE OF FINANCING FOR SCHEMEEquity component Debt Component
Capital
Subsidies /
grants
component
Consumer
Contribution
component

MPMKVVCL Annexure-I of ARR/Tariff Petition FY-17
Name of Distribution Licensee : MPMKVVCL BHOPALInvestment Plan - Master
For wheeling activity + Retail supply
SYSTEM STRENGTHING 2.1, 2.2, 2,3 Yes
FEEDER SEPERATION6.1, 6.2, 6.3
Yes
NEW PUMP CONNECTION 5.1, 5.2, 5.3 Yes
ADB-II2.1, 2.2, 2,3
Yes
ADB-III
RGGVY 5.1, 5.2, 5.3 Yes
RAPDRP PART A 1.1, 1.2, 1.3 Yes
RAPDRP PART B 4.1, 4.2, 4.3 Yes
HUDCO 1.1, 1.2, 1.3 Yes
IPDS
DDUGJY
GROSS TOTAL
Project Details
Name of schemeNature of
Project
Whether
scheme part
of approved
Business
Plan?
Internal
Accrual (from
free reserves
and surplus)
Equity
infused
Loan
Amount
(Rs.
Crores)
Loan
Agency
122.89 38.19 84.70
195.00 - 195.00 REC -
152.75 - - - - 152.75 -
130.06 - - 130.06 ADB -
75.00 75.00
84.86 - - 8.49 REC 76.37 -
37.19 - - 37.19 PFC -
100.00 - - 100.00 PFC -
-
10.00 - 10.00
385.47 - - 153.88 - 231.59 -
1,293.22 - 38.19 784.32 - 470.71 -
2015-16
Total capital
expenditure
approved by
MPERC
(Rs. Crs.)
SOURCE OF FINANCING FOR SCHEMEEquity component Debt Component
Capital
Subsidies /
grants
component
Consumer
Contribution
component
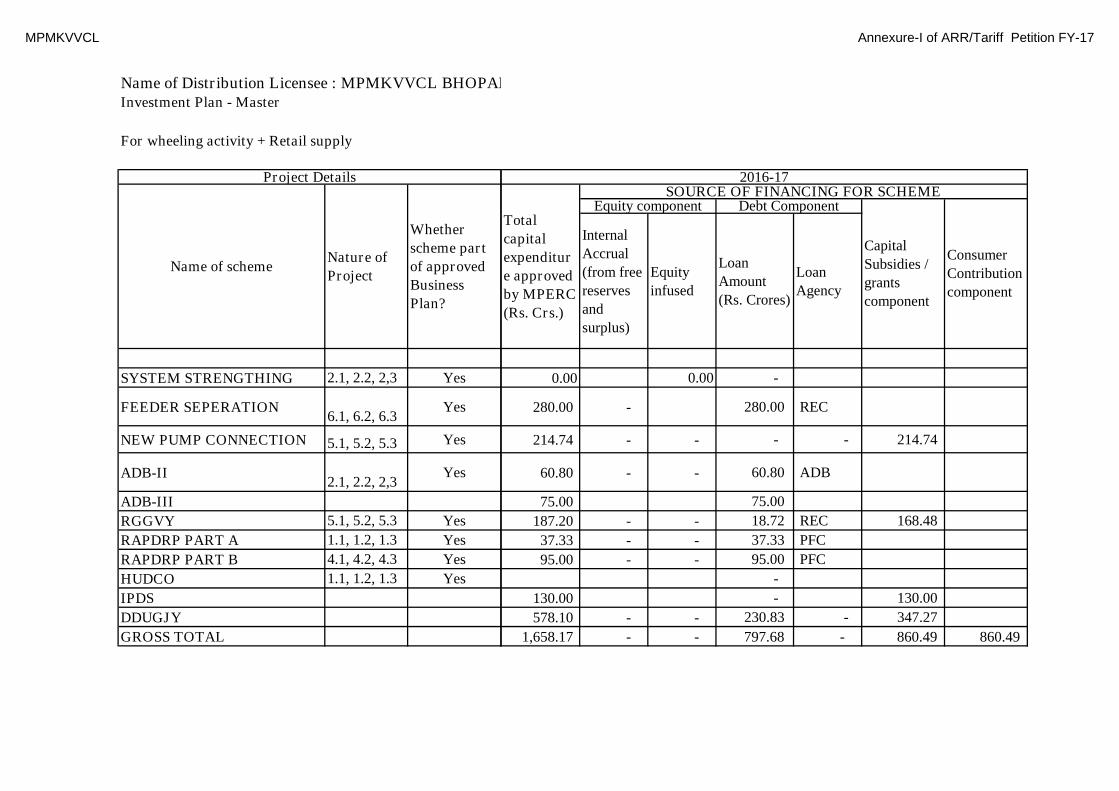
MPMKVVCL Annexure-I of ARR/Tariff Petition FY-17
Name of Distribution Licensee : MPMKVVCL BHOPALInvestment Plan - Master
For wheeling activity + Retail supply
SYSTEM STRENGTHING 2.1, 2.2, 2,3 Yes
FEEDER SEPERATION6.1, 6.2, 6.3
Yes
NEW PUMP CONNECTION 5.1, 5.2, 5.3 Yes
ADB-II2.1, 2.2, 2,3
Yes
ADB-III
RGGVY 5.1, 5.2, 5.3 Yes
RAPDRP PART A 1.1, 1.2, 1.3 Yes
RAPDRP PART B 4.1, 4.2, 4.3 Yes
HUDCO 1.1, 1.2, 1.3 Yes
IPDS
DDUGJY
GROSS TOTAL
Project Details
Name of schemeNature of
Project
Whether
scheme part
of approved
Business
Plan?
Internal
Accrual
(from free
reserves
and
surplus)
Equity
infused
Loan
Amount
(Rs. Crores)
Loan
Agency
0.00 0.00 -
280.00 - 280.00 REC
214.74 - - - - 214.74
60.80 - - 60.80 ADB
75.00 75.00
187.20 - - 18.72 REC 168.48
37.33 - - 37.33 PFC
95.00 - - 95.00 PFC
-
130.00 - 130.00
578.10 - - 230.83 - 347.27
1,658.17 - - 797.68 - 860.49 860.49
2016-17
Total
capital
expenditur
e approved
by MPERC
(Rs. Crs.)
SOURCE OF FINANCING FOR SCHEMEEquity component Debt Component
Capital
Subsidies /
grants
component
Consumer
Contribution
component
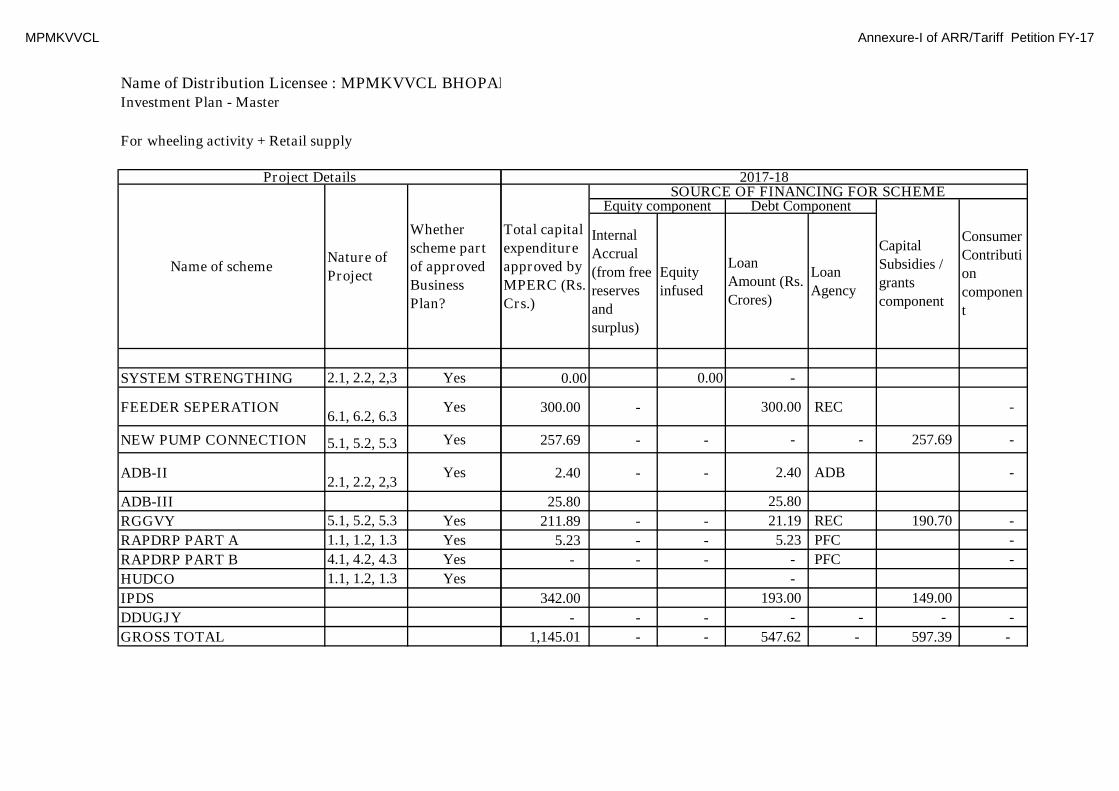
MPMKVVCL Annexure-I of ARR/Tariff Petition FY-17
Name of Distribution Licensee : MPMKVVCL BHOPALInvestment Plan - Master
For wheeling activity + Retail supply
SYSTEM STRENGTHING 2.1, 2.2, 2,3 Yes
FEEDER SEPERATION6.1, 6.2, 6.3
Yes
NEW PUMP CONNECTION 5.1, 5.2, 5.3 Yes
ADB-II2.1, 2.2, 2,3
Yes
ADB-III
RGGVY 5.1, 5.2, 5.3 Yes
RAPDRP PART A 1.1, 1.2, 1.3 Yes
RAPDRP PART B 4.1, 4.2, 4.3 Yes
HUDCO 1.1, 1.2, 1.3 Yes
IPDS
DDUGJY
GROSS TOTAL
Project Details
Name of schemeNature of
Project
Whether
scheme part
of approved
Business
Plan?
Internal
Accrual
(from free
reserves
and
surplus)
Equity
infused
Loan
Amount (Rs.
Crores)
Loan
Agency
0.00 0.00 -
300.00 - 300.00 REC -
257.69 - - - - 257.69 -
2.40 - - 2.40 ADB -
25.80 25.80
211.89 - - 21.19 REC 190.70 -
5.23 - - 5.23 PFC -
- - - - PFC -
-
342.00 193.00 149.00
- - - - - - -
1,145.01 - - 547.62 - 597.39 -
2017-18
Total capital
expenditure
approved by
MPERC (Rs.
Crs.)
SOURCE OF FINANCING FOR SCHEMEEquity component Debt Component
Capital
Subsidies /
grants
component
Consumer
Contributi
on
componen
t

MPMKVVCL Annexure-I of ARR/Tariff Petition FY-17
Name of Distribution Licensee : MPMKVVCL BHOPALInvestment Plan - Master
For wheeling activity + Retail supply
SYSTEM STRENGTHING 2.1, 2.2, 2,3 Yes
FEEDER SEPERATION6.1, 6.2, 6.3
Yes
NEW PUMP CONNECTION 5.1, 5.2, 5.3 Yes
ADB-II2.1, 2.2, 2,3
Yes
ADB-III
RGGVY 5.1, 5.2, 5.3 Yes
RAPDRP PART A 1.1, 1.2, 1.3 Yes
RAPDRP PART B 4.1, 4.2, 4.3 Yes
HUDCO 1.1, 1.2, 1.3 Yes
IPDS
DDUGJY
GROSS TOTAL
Project Details
Name of schemeNature of
Project
Whether
scheme part
of approved
Business
Plan?
Internal
Accrual
(from free
reserves
and
surplus)
Equity
infused
Loan
Amount
(Rs.
Crores)
Loan
Agency
0.00 0.00 -
50.00 - 50.00 REC - -
173.73 - - - - 173.73 -
2.40 - - 2.40 ADB -
1.00 1.00
213.80 - - 21.38 REC 192.42 -
- - - - PFC -
- - - - PFC -
-
- - -
- - - - - - -
440.93 - - 74.78 - 366.15 -
2018-19
Total
capital
expenditure
approved
by MPERC
(Rs. Crs.)
SOURCE OF FINANCING FOR SCHEMEEquity component Debt Component
Capital
Subsidies /
grants
component
Consumer
Contributi
on
componen
t

MPMKVVCL Annexure-I of ARR/Tariff Petition FY-17
Name of Distribution Licensee : MPMKVVCL BHOPAL
Commissioning / Capitalisation Plan - Master Form F2b(i)
Amount in Rs. Crore
Old Years PY CY
Name of schemeNature ofProject
Whetherscheme partof approvedBusinessPlan?
FY14 FY15 FY16 FY17 FY18 FY19
Opening CWIP for the year 321.95 505.34 846.76 943.05 943.05 943.05
AdditionsInvestment Drawn during the year
SYSTEM STRENGTHING 242.60 179.95 87.87 24.58 -
FEEDER SEPERATION 6.1, 6.2, 6.3Yes 223.36 215.46 224.70 273.00 171.00
NEW PUMP CONNECTION 5.1, 5.2, 5.3Yes 107.55 126.39 168.23 223.82 207.12
ADB-II 2.1, 2.2, 2,3Yes 191.54 158.96 98.45 45.45 14.08
ADB-III 15.43 46.76 66.17 50.40 23.24
RGGVY 5.1, 5.2, 5.3Yes 84.65 83.34 129.80 179.08 207.91
RAPDRP PART A 1.1, 1.2, 1.3Yes 22.67 29.51 29.82 21.25 9.04
RAPDRP PART B 4.1, 4.2, 4.3Yes 205.73 164.16 92.68 48.50 19.00
HUDCO - - - - -
IPDS - 5.00 68.00 212.00 128.60
DDUGJY - 192.74 404.69 250.52 115.62
Sub-Total 957.12 1,093.53 1,202.26 1,370.41 1,328.60 895.60
Previous Schemes
Other Expenses - added to CWIP 181.53 86.13
Total 1,138.65 1,179.67 1,202.26 1,370.41 1,328.60 895.60
Scheme Wise Capitalization
SYSTEM STRENGTHING - 155.82 202.29 199.39 146.44 74.64 24.95
FEEDER SEPERATION 6.1, 6.2, 6.3 Yes 142.95 208.55 226.02 221.66 247.00 212.34
NEW PUMP CONNECTION 5.1, 5.2, 5.3 Yes 68.31 101.71 117.83 143.54 187.66 204.35
ADB-II 2.1, 2.2, 2,3 Yes 215.13 174.78 175.15 135.22 84.05 40.37
ADB-III 28.01 50.20 54.40 39.97
Project Details
957.12
MYT 2016-17 to 2018-19

MPMKVVCL Annexure-I of ARR/Tariff Petition FY-17
Name of Distribution Licensee : MPMKVVCL BHOPAL
Commissioning / Capitalisation Plan - Master Form F2b(i)
Amount in Rs. Crore
Old Years PY CY
Name of schemeNature ofProject
Whetherscheme partof approvedBusinessPlan?
FY14 FY15 FY16 FY17 FY18 FY19
Project Details MYT 2016-17 to 2018-19
RGGVY 5.1, 5.2, 5.3 Yes 62.81 80.50 85.65 106.83 145.15 183.64
RAPDRP PART A 1.1, 1.2, 1.3 Yes 31.09 25.50 28.90 28.30 25.48 16.86
RAPDRP PART B 4.1, 4.2, 4.3 Yes 222.05 200.57 198.70 136.73 84.89 42.59
HUDCO - - - -
IPDS 2.50 35.50 127.40 141.50
DDUGJY 96.37 260.17 285.22 213.91
Others - - 57.09
Sub-Total 955.25 993.90 1,158.51 1,264.59 1,315.87 1,120.46
Previous Schemes - - - - - -
Other Expenses - added to CWIP
Total 955.25 993.90 1,158.51 1,264.59 1,315.87 1,120.46
Year wise break up of Capitalization of Investments during the year
Capitalization of FY13 investments 110.86 - - - -
Capitalization of FY14 investments 343.98 229.32 - - -
Capitalization of FY15 investments 383.40 230.04 153.36 - -
Capitalization of FY16 investments - 646.61 387.96 258.64 -
Capitalization of FY17 investments - - 829.09 497.45 331.63
Capitalization of FY18 investments - - - 572.51 343.50
Capitalization of FY19 investments - - - - 195.47
Capitalization of opening CWIP - - - - -
Total Capitalization of Investmentsduring the year
955.26 838.24 1,105.97 1,370.41 1,328.60 870.60
Closing CWIP 505.34 846.76 943.05 943.05 943.05 968.05

MPMKVVCL Annexure-I of ARR/Tariff Petition FY-17
MPMKVVCL BHOPALYear-wise Capital Expenditure
For wheeling activity + Retail supply
CWIP
Internal
Accrual
(from free
reserves
and
surplus)
Equity
infused
Loan
Amount
(Rs. Crores)
Loan
Agency
SYSTEM STRENGTHING
FEEDER SEPERATION 6.1, 6.2, 6.3
NEW PUMP CONNECTION 5.1, 5.2, 5.3
ADB-II 2.1, 2.2, 2,3
ADB-III
RGGVY 5.1, 5.2, 5.3
RAPDRP PART A 1.1, 1.2, 1.3
RAPDRP PART B 1.1, 1.2, 1.3
HUDCO -
IPDS
DDUGJY
Other Expenses - added to
CWIP181.53
GROSS TOTAL - 321.95 1,138.65 1,460.60 47.86 47.86 727.41 124.43 9.57 4,268.40 955.25 505.35
321.95 1,460.60 955.25 505.35
957.12
47.86 47.86 727.41 - 124.43 9.57 4,268.40
Equity component Debt Component
Capital
Subsidies /
grants
component
Consumer
Contribution
component
Cumulative
capitalisation
till beginning of
year
Balance
CWIP at end
of year
Project Details
Capex
during the
year
Total capex
till end of
yearName of scheme
Nature of
Project
2013-14
Opening
CWIP
Capitalisatio
n during the
year
SOURCE OF FINANCING FOR SCHEME Capitalisation

MPMKVVCL Annexure-I of ARR/Tariff Petition FY-17
MPMKVVCL BHOPALYear-wise Capital Expenditure
For wheeling activity + Retail supply
SYSTEM STRENGTHING
FEEDER SEPERATION 6.1, 6.2, 6.3
NEW PUMP CONNECTION 5.1, 5.2, 5.3
ADB-II 2.1, 2.2, 2,3
ADB-III
RGGVY 5.1, 5.2, 5.3
RAPDRP PART A 1.1, 1.2, 1.3
RAPDRP PART B 1.1, 1.2, 1.3
HUDCO -
IPDS
DDUGJY
Other Expenses - added to
CWIP
GROSS TOTAL -
Project Details
Name of schemeNature of
Project
CWIP
Internal
Accrual
(from free
reserves
and
surplus)
Equity
infused
Loan
Amount (Rs.
Crores)
Loan
Agency
242.60 - 76.50 ` - - 202.29
223.36 - 0.00 131.02REC and
ADB- - 208.55
107.55 - - - 75.17 - 101.71
191.54 - - 145.16ADB,
REC, PFC- - 174.78
84.65 - - 2.57 REC 51.13 - 80.50
22.67 - - 0.00 PFC - - 25.50
205.73 - - 75.91 PFC, REC - - 200.57
- -
86.13 -
1,460.60 505.35 1,164.24 1,669.59 - 76.50 354.65 - 126.30 - 5,404.73 993.90 675.69
505.351,460.60
Balance
CWIP at end
of year
Opening
CWIP
Capex during
the year
Total capex
till end of
year
SOURCE OF FINANCING FOR SCHEME CapitalisationEquity component Debt Component
Capital
Subsidies /
grants
component
Consumer
Contributio
n
component
Cumulative
capitalisatio
n till
beginning
of year
Capitalisatio
n during the
year
5,404.731,669.59 675.69
2014-15
Cumulative
expenditure
till
beginning
of year

MPMKVVCL Annexure-I of ARR/Tariff Petition FY-17
MPMKVVCL BHOPALYear-wise Capital Expenditure
For wheeling activity + Retail supply
SYSTEM STRENGTHING
FEEDER SEPERATION 6.1, 6.2, 6.3
NEW PUMP CONNECTION 5.1, 5.2, 5.3
ADB-II 2.1, 2.2, 2,3
ADB-III
RGGVY 5.1, 5.2, 5.3
RAPDRP PART A 1.1, 1.2, 1.3
RAPDRP PART B 1.1, 1.2, 1.3
HUDCO -
IPDS
DDUGJY
Other Expenses - added to
CWIP
GROSS TOTAL -
Project Details
Name of schemeNature of
Project
CWIP
Internal
Accrual
(from free
reserves
and
surplus)
Equity
infused
Loan
Amount (Rs.
Crores)
Loan
Agency
179.95 - 38.19 84.70 - - 199.39
215.46 - - 195.00REC and
ADB- - 226.02
126.39 - - - - 152.75 - 117.83
158.96 - - 130.06ADB,
REC, PFC- - 175.15
46.76 - - 75.00 - - - 28.01
83.34 - - 8.49 REC 76.37 - 85.65
29.51 - - 37.19 PFC - - 28.90
164.16 - - 100.00PFC,
REC- - 198.70
- - - - - - - -
5.00 - - - - 10.00 - 2.50
192.74 - - 153.88 - 231.59 - 96.37
- -
1,669.59 675.69 1,202.26 1,877.95 - 38.19 784.32 - 470.71 - 6,569.44 1,158.51 719.44
719.441,669.59 675.69 1,877.95 6,569.44
2015-16
Cumulative
expenditure
till
beginning
of year
Opening
CWIP
Capex during
the year
Total capex
till end of
year
SOURCE OF FINANCING FOR SCHEME CapitalisationEquity component Debt Component
Capital
Subsidies /
grants
component
Consumer
Contributio
n
component
Cumulative
capitalisation
till beginning
of year
Capitalisatio
n during the
year
Balance
CWIP at
end of year
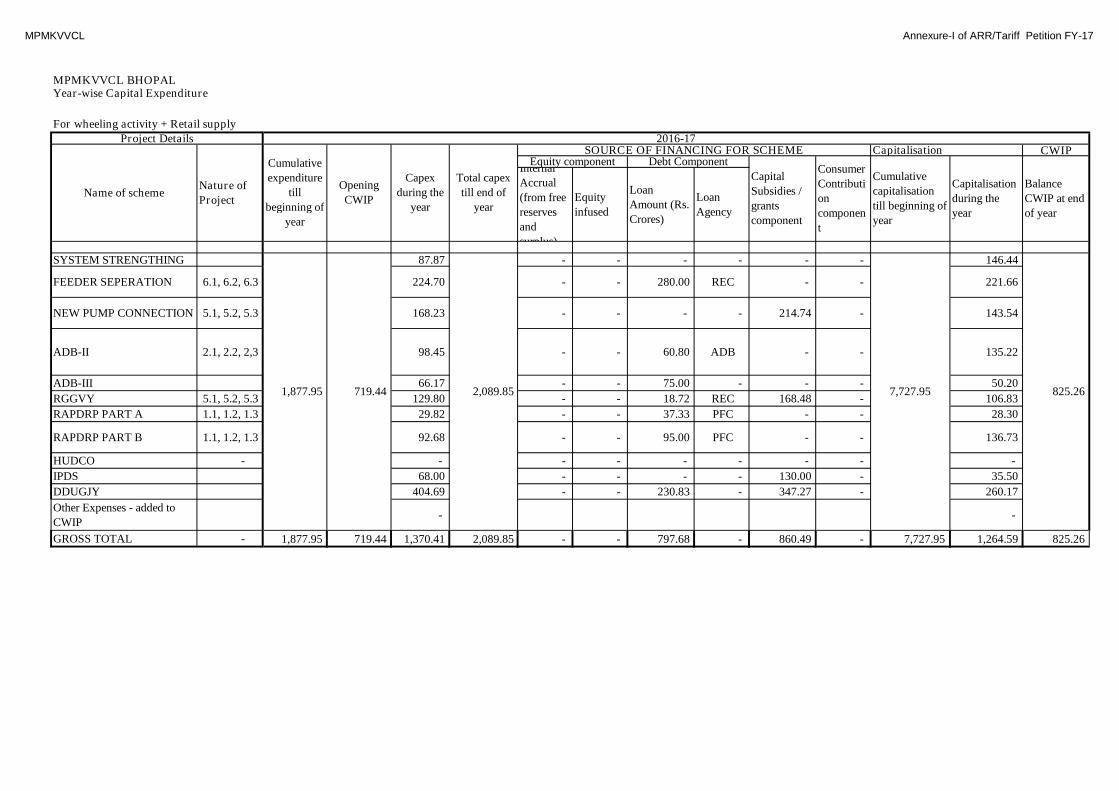
MPMKVVCL Annexure-I of ARR/Tariff Petition FY-17
MPMKVVCL BHOPALYear-wise Capital Expenditure
For wheeling activity + Retail supply
SYSTEM STRENGTHING
FEEDER SEPERATION 6.1, 6.2, 6.3
NEW PUMP CONNECTION 5.1, 5.2, 5.3
ADB-II 2.1, 2.2, 2,3
ADB-III
RGGVY 5.1, 5.2, 5.3
RAPDRP PART A 1.1, 1.2, 1.3
RAPDRP PART B 1.1, 1.2, 1.3
HUDCO -
IPDS
DDUGJY
Other Expenses - added to
CWIP
GROSS TOTAL -
Project Details
Name of schemeNature of
Project
CWIP
Internal
Accrual
(from free
reserves
and
surplus)
Equity
infused
Loan
Amount (Rs.
Crores)
Loan
Agency
87.87 - - - - - - 146.44
224.70 - - 280.00 REC - - 221.66
168.23 - - - - 214.74 - 143.54
98.45 - - 60.80 ADB - - 135.22
66.17 - - 75.00 - - - 50.20
129.80 - - 18.72 REC 168.48 - 106.83
29.82 - - 37.33 PFC - - 28.30
92.68 - - 95.00 PFC - - 136.73
- - - - - - - -
68.00 - - - - 130.00 - 35.50
404.69 - - 230.83 - 347.27 - 260.17
- -
1,877.95 719.44 1,370.41 2,089.85 - - 797.68 - 860.49 - 7,727.95 1,264.59 825.26
1,877.95 719.44 2,089.85 7,727.95 825.26
2016-17
Cumulative
expenditure
till
beginning of
year
Opening
CWIP
Capex
during the
year
Total capex
till end of
year
SOURCE OF FINANCING FOR SCHEME CapitalisationEquity component Debt Component
Capital
Subsidies /
grants
component
Consumer
Contributi
on
componen
t
Cumulative
capitalisation
till beginning of
year
Capitalisation
during the
year
Balance
CWIP at end
of year
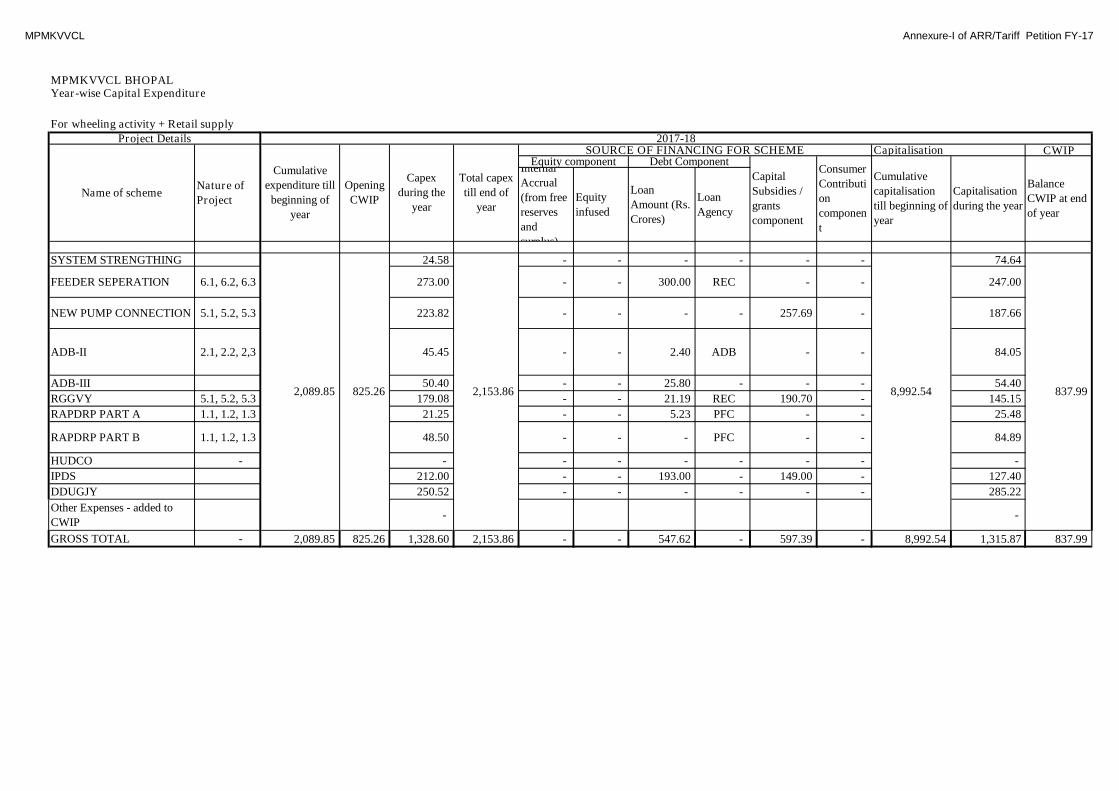
MPMKVVCL Annexure-I of ARR/Tariff Petition FY-17
MPMKVVCL BHOPALYear-wise Capital Expenditure
For wheeling activity + Retail supply
SYSTEM STRENGTHING
FEEDER SEPERATION 6.1, 6.2, 6.3
NEW PUMP CONNECTION 5.1, 5.2, 5.3
ADB-II 2.1, 2.2, 2,3
ADB-III
RGGVY 5.1, 5.2, 5.3
RAPDRP PART A 1.1, 1.2, 1.3
RAPDRP PART B 1.1, 1.2, 1.3
HUDCO -
IPDS
DDUGJY
Other Expenses - added to
CWIP
GROSS TOTAL -
Project Details
Name of schemeNature of
Project
CWIP
Internal
Accrual
(from free
reserves
and
surplus)
Equity
infused
Loan
Amount (Rs.
Crores)
Loan
Agency
24.58 - - - - - - 74.64
273.00 - - 300.00 REC - - 247.00
223.82 - - - - 257.69 - 187.66
45.45 - - 2.40 ADB - - 84.05
50.40 - - 25.80 - - - 54.40
179.08 - - 21.19 REC 190.70 - 145.15
21.25 - - 5.23 PFC - - 25.48
48.50 - - - PFC - - 84.89
- - - - - - - -
212.00 - - 193.00 - 149.00 - 127.40
250.52 - - - - - - 285.22
- -
2,089.85 825.26 1,328.60 2,153.86 - - 547.62 - 597.39 - 8,992.54 1,315.87 837.99
2,089.85 825.26 2,153.86 8,992.54 837.99
2017-18
Cumulative
expenditure till
beginning of
year
Opening
CWIP
Capex
during the
year
Total capex
till end of
year
SOURCE OF FINANCING FOR SCHEME CapitalisationEquity component Debt Component
Capital
Subsidies /
grants
component
Consumer
Contributi
on
componen
t
Cumulative
capitalisation
till beginning of
year
Capitalisation
during the year
Balance
CWIP at end
of year
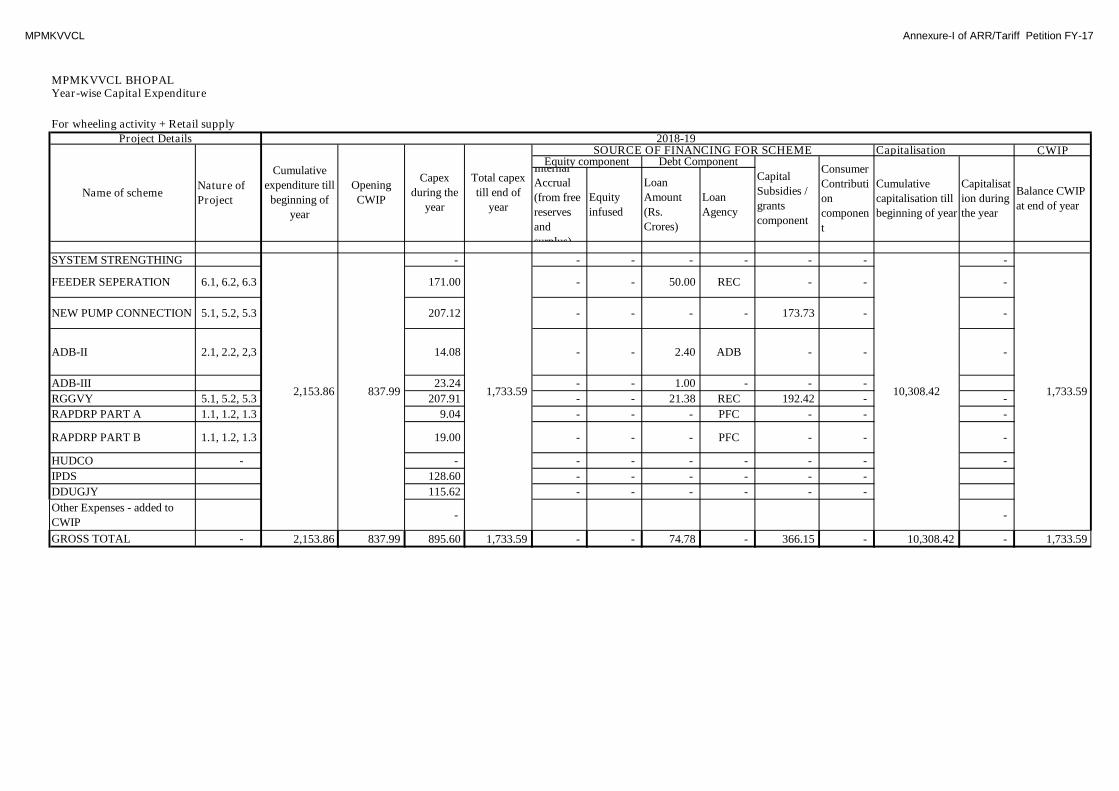
MPMKVVCL Annexure-I of ARR/Tariff Petition FY-17
MPMKVVCL BHOPALYear-wise Capital Expenditure
For wheeling activity + Retail supply
SYSTEM STRENGTHING
FEEDER SEPERATION 6.1, 6.2, 6.3
NEW PUMP CONNECTION 5.1, 5.2, 5.3
ADB-II 2.1, 2.2, 2,3
ADB-III
RGGVY 5.1, 5.2, 5.3
RAPDRP PART A 1.1, 1.2, 1.3
RAPDRP PART B 1.1, 1.2, 1.3
HUDCO -
IPDS
DDUGJY
Other Expenses - added to
CWIP
GROSS TOTAL -
Project Details
Name of schemeNature of
Project
CWIP
Internal
Accrual
(from free
reserves
and
surplus)
Equity
infused
Loan
Amount
(Rs.
Crores)
Loan
Agency
- - - - - - - -
171.00 - - 50.00 REC - - -
207.12 - - - - 173.73 - -
14.08 - - 2.40 ADB - - -
23.24 - - 1.00 - - -
207.91 - - 21.38 REC 192.42 - -
9.04 - - - PFC - - -
19.00 - - - PFC - - -
- - - - - - - -
128.60 - - - - - -
115.62 - - - - - -
- -
2,153.86 837.99 895.60 1,733.59 - - 74.78 - 366.15 - 10,308.42 - 1,733.59
2,153.86 837.99 1,733.59 10,308.42 1,733.59
2018-19
Cumulative
expenditure till
beginning of
year
Opening
CWIP
Capex
during the
year
Total capex
till end of
year
SOURCE OF FINANCING FOR SCHEME CapitalisationEquity component Debt Component
Capital
Subsidies /
grants
component
Consumer
Contributi
on
componen
t
Cumulative
capitalisation till
beginning of year
Capitalisat
ion during
the year
Balance CWIP
at end of year
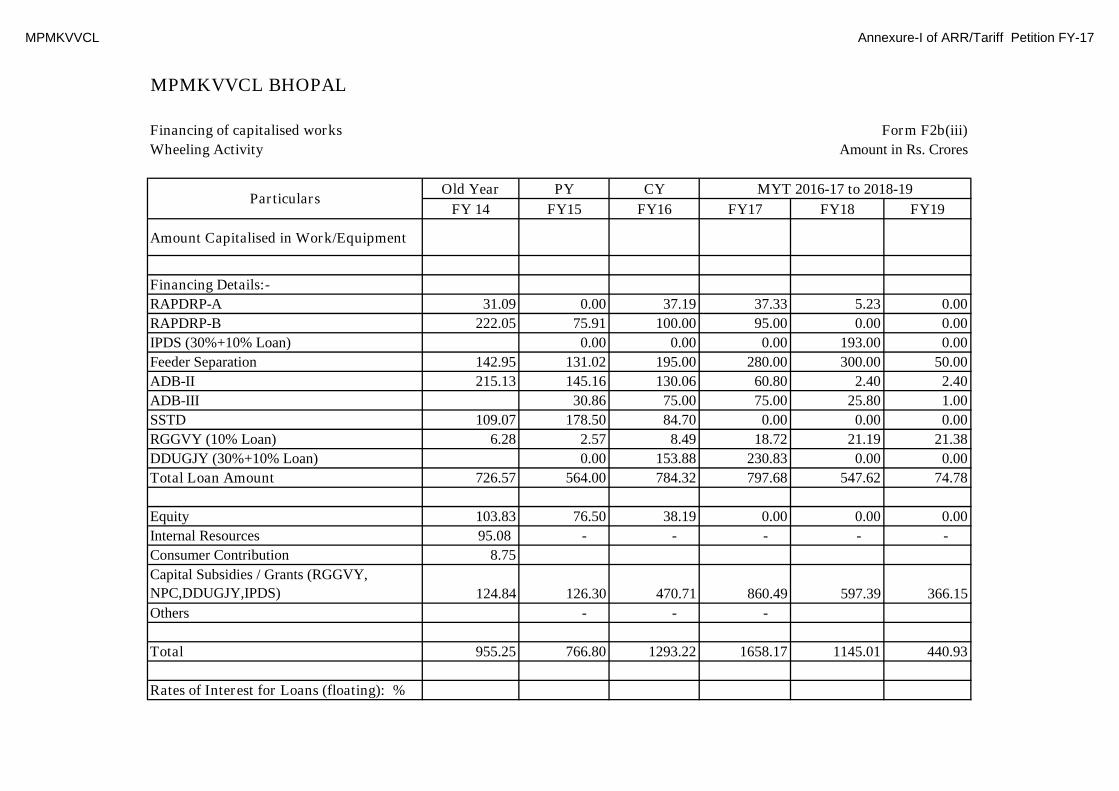
MPMKVVCL Annexure-I of ARR/Tariff Petition FY-17
MPMKVVCL BHOPAL
Financing of capitalised works Form F2b(iii)
Wheeling Activity Amount in Rs. Crores
Old Year PY CY
FY 14 FY15 FY16 FY17 FY18 FY19
Amount Capitalised in Work/Equipment
Financing Details:-
RAPDRP-A 31.09 0.00 37.19 37.33 5.23 0.00
RAPDRP-B 222.05 75.91 100.00 95.00 0.00 0.00
IPDS (30%+10% Loan) 0.00 0.00 0.00 193.00 0.00
Feeder Separation 142.95 131.02 195.00 280.00 300.00 50.00
ADB-II 215.13 145.16 130.06 60.80 2.40 2.40
ADB-III 30.86 75.00 75.00 25.80 1.00
SSTD 109.07 178.50 84.70 0.00 0.00 0.00
RGGVY (10% Loan) 6.28 2.57 8.49 18.72 21.19 21.38
DDUGJY (30%+10% Loan) 0.00 153.88 230.83 0.00 0.00
Total Loan Amount 726.57 564.00 784.32 797.68 547.62 74.78
Equity 103.83 76.50 38.19 0.00 0.00 0.00
Internal Resources 95.08 - - - - -
Consumer Contribution 8.75
Capital Subsidies / Grants (RGGVY,
NPC,DDUGJY,IPDS) 124.84 126.30 470.71 860.49 597.39 366.15
Others - - -
Total 955.25 766.80 1293.22 1658.17 1145.01 440.93
Rates of Interest for Loans (floating): %
ParticularsMYT 2016-17 to 2018-19
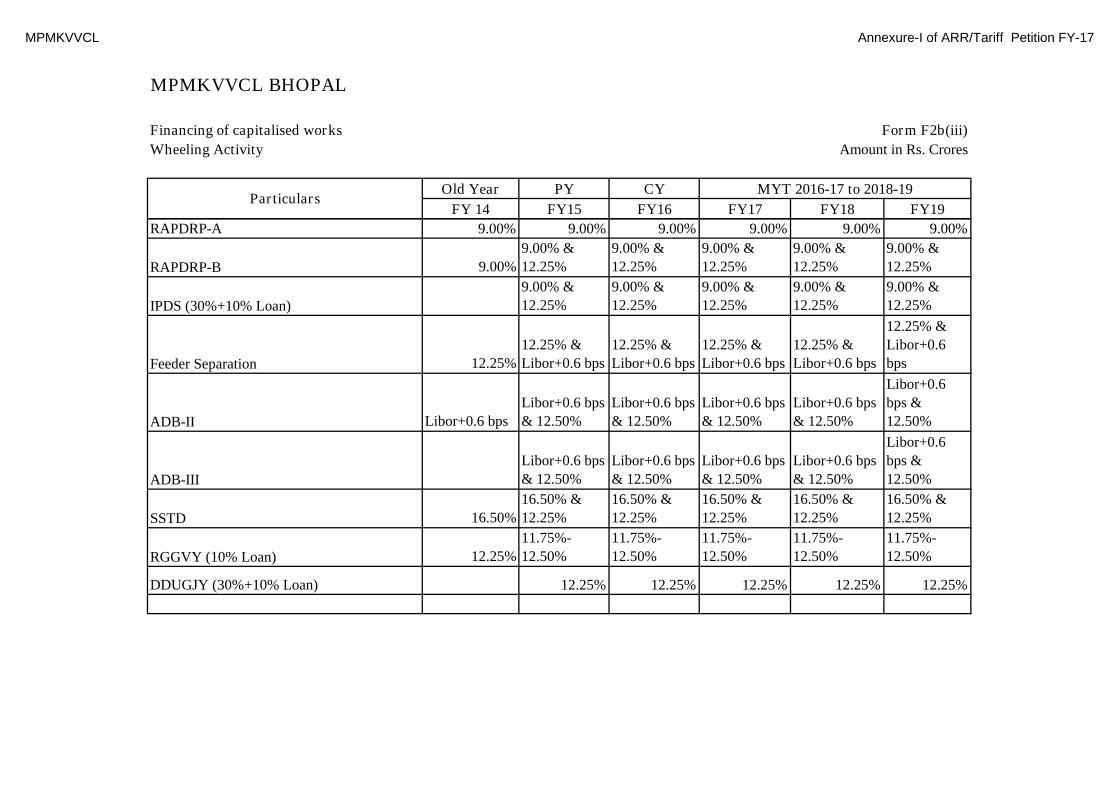
MPMKVVCL Annexure-I of ARR/Tariff Petition FY-17
MPMKVVCL BHOPAL
Financing of capitalised works Form F2b(iii)
Wheeling Activity Amount in Rs. Crores
Old Year PY CY
FY 14 FY15 FY16 FY17 FY18 FY19Particulars
MYT 2016-17 to 2018-19
RAPDRP-A 9.00% 9.00% 9.00% 9.00% 9.00% 9.00%
RAPDRP-B 9.00%
9.00% &
12.25%
9.00% &
12.25%
9.00% &
12.25%
9.00% &
12.25%
9.00% &
12.25%
IPDS (30%+10% Loan)
9.00% &
12.25%
9.00% &
12.25%
9.00% &
12.25%
9.00% &
12.25%
9.00% &
12.25%
Feeder Separation 12.25%
12.25% &
Libor+0.6 bps
12.25% &
Libor+0.6 bps
12.25% &
Libor+0.6 bps
12.25% &
Libor+0.6 bps
12.25% &
Libor+0.6
bps
ADB-II Libor+0.6 bps
Libor+0.6 bps
& 12.50%
Libor+0.6 bps
& 12.50%
Libor+0.6 bps
& 12.50%
Libor+0.6 bps
& 12.50%
Libor+0.6
bps &
12.50%
ADB-III
Libor+0.6 bps
& 12.50%
Libor+0.6 bps
& 12.50%
Libor+0.6 bps
& 12.50%
Libor+0.6 bps
& 12.50%
Libor+0.6
bps &
12.50%
SSTD 16.50%
16.50% &
12.25%
16.50% &
12.25%
16.50% &
12.25%
16.50% &
12.25%
16.50% &
12.25%
RGGVY (10% Loan) 12.25%
11.75%-
12.50%
11.75%-
12.50%
11.75%-
12.50%
11.75%-
12.50%
11.75%-
12.50%
DDUGJY (30%+10% Loan) 12.25% 12.25% 12.25% 12.25% 12.25%
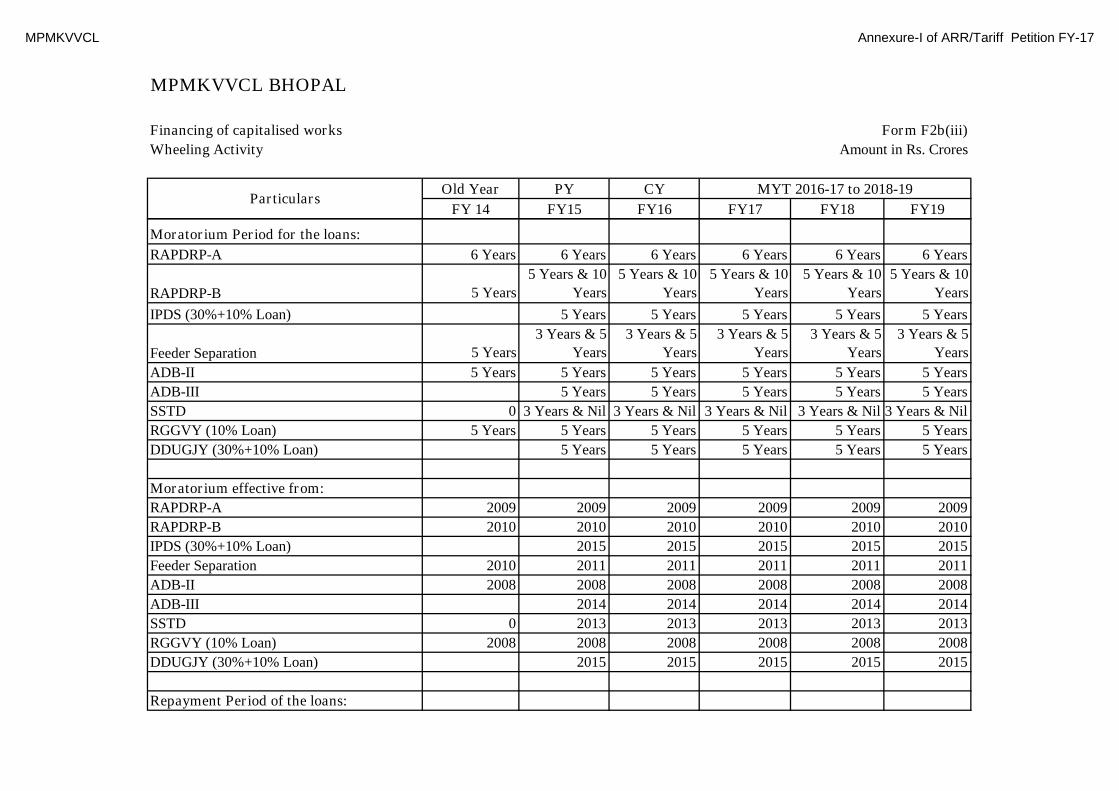
MPMKVVCL Annexure-I of ARR/Tariff Petition FY-17
MPMKVVCL BHOPAL
Financing of capitalised works Form F2b(iii)
Wheeling Activity Amount in Rs. Crores
Old Year PY CY
FY 14 FY15 FY16 FY17 FY18 FY19Particulars
MYT 2016-17 to 2018-19
Moratorium Period for the loans:
RAPDRP-A 6 Years 6 Years 6 Years 6 Years 6 Years 6 Years
RAPDRP-B 5 Years
5 Years & 10
Years
5 Years & 10
Years
5 Years & 10
Years
5 Years & 10
Years
5 Years & 10
Years
IPDS (30%+10% Loan) 5 Years 5 Years 5 Years 5 Years 5 Years
Feeder Separation 5 Years
3 Years & 5
Years
3 Years & 5
Years
3 Years & 5
Years
3 Years & 5
Years
3 Years & 5
Years
ADB-II 5 Years 5 Years 5 Years 5 Years 5 Years 5 Years
ADB-III 5 Years 5 Years 5 Years 5 Years 5 Years
SSTD 0 3 Years & Nil 3 Years & Nil 3 Years & Nil 3 Years & Nil 3 Years & Nil
RGGVY (10% Loan) 5 Years 5 Years 5 Years 5 Years 5 Years 5 Years
DDUGJY (30%+10% Loan) 5 Years 5 Years 5 Years 5 Years 5 Years
Moratorium effective from:
RAPDRP-A 2009 2009 2009 2009 2009 2009
RAPDRP-B 2010 2010 2010 2010 2010 2010
IPDS (30%+10% Loan) 2015 2015 2015 2015 2015
Feeder Separation 2010 2011 2011 2011 2011 2011
ADB-II 2008 2008 2008 2008 2008 2008
ADB-III 2014 2014 2014 2014 2014
SSTD 0 2013 2013 2013 2013 2013
RGGVY (10% Loan) 2008 2008 2008 2008 2008 2008
DDUGJY (30%+10% Loan) 2015 2015 2015 2015 2015
Repayment Period of the loans:

MPMKVVCL Annexure-I of ARR/Tariff Petition FY-17
MPMKVVCL BHOPAL
Financing of capitalised works Form F2b(iii)
Wheeling Activity Amount in Rs. Crores
Old Year PY CY
FY 14 FY15 FY16 FY17 FY18 FY19Particulars
MYT 2016-17 to 2018-19
RAPDRP-A 4 Years 4 Years 4 Years 4 Years 4 Years 4 Years
RAPDRP-B 15 Years
15 Years &
10 Years
15 Years &
10 Years
15 Years & 10
Years
15 Years & 10
Years
15 Years &
10 Years
IPDS (30%+10% Loan) 15 Years 15 Years 15 Years 15 Years 15 Years
Feeder Separation 10 Years
10 Years &
20 Years
10 Years &
20 Years
10 Years & 20
Years
10 Years & 20
Years
10 Years &
20 Years
ADB-II 20 Years 20 Years 20 Years 20 Years 20 Years 20 Years
ADB-III 20 Years 20 Years 20 Years 20 Years 20 Years
SSTD 5 Years
5 Years & 10
Years
5 Years & 10
Years
5 Years & 10
Years
5 Years & 10
Years
5 Years & 10
Years
RGGVY (10% Loan) 10 Years 10 Years 10 Years 10 Years 10 Years 10 Years
DDUGJY (30%+10% Loan) 10 Years 10 Years 10 Years 10 Years 10 Years
Repayment effective from:
RAPDRP-A 2015 2015 2015 2015 2015 2015
RAPDRP-B 2015 2015 2015 2015 2015 2015
IPDS (30%+10% Loan) 2020 2020 2020 2020 2020
Feeder Separation 2015 2015 2015 2015 2015 2015
ADB-II 2013 2013 2013 2013 2013 2013
ADB-III 2019 2019 2019 2019 2019
SSTD 2012 2015 2015 2015 2015 2015
RGGVY (10% Loan) 2012 2012 2012 2012 2012 2012
DDUGJY (30%+10% Loan) 2020 2020 2020 2020 2020
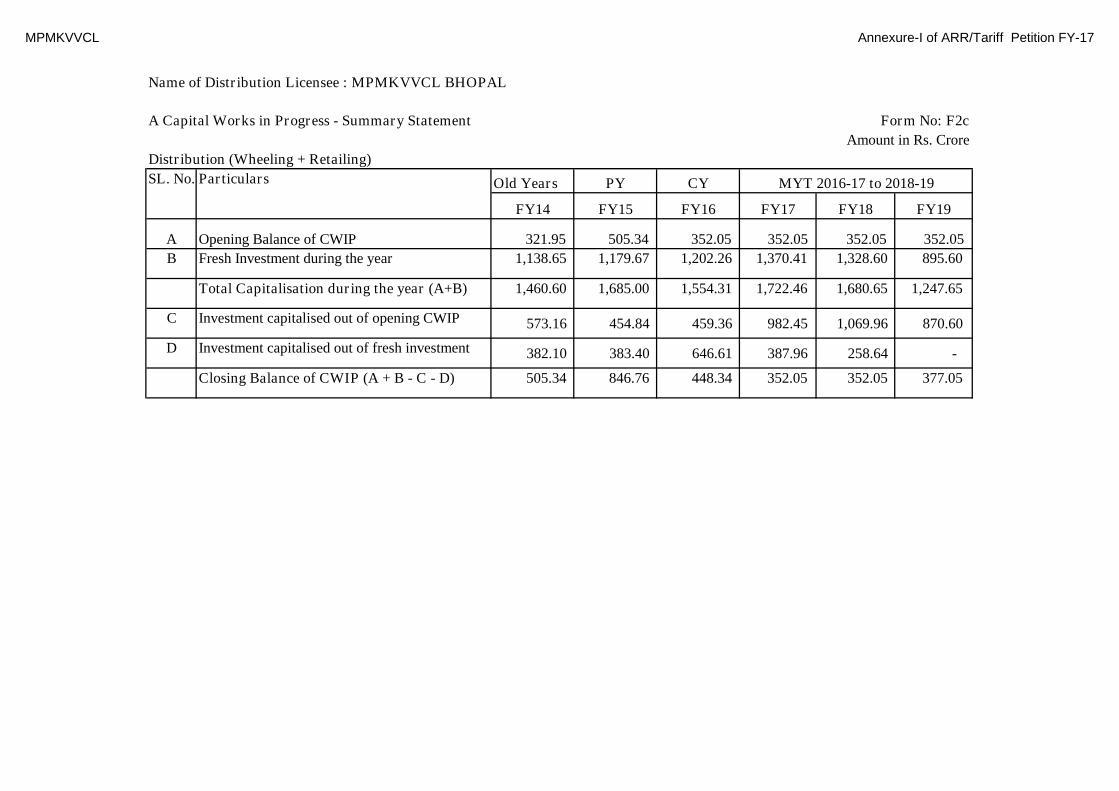
MPMKVVCL Annexure-I of ARR/Tariff Petition FY-17
Name of Distribution Licensee : MPMKVVCL BHOPAL
A Capital Works in Progress - Summary Statement Form No: F2c
Amount in Rs. Crore
Distribution (Wheeling + Retailing)
Old Years PY CY
FY14 FY15 FY16 FY17 FY18 FY19
A Opening Balance of CWIP 321.95 505.34 352.05 352.05 352.05 352.05
B Fresh Investment during the year 1,138.65 1,179.67 1,202.26 1,370.41 1,328.60 895.60
Total Capitalisation during the year (A+B) 1,460.60 1,685.00 1,554.31 1,722.46 1,680.65 1,247.65
C Investment capitalised out of opening CWIP 573.16 454.84 459.36 982.45 1,069.96 870.60
D Investment capitalised out of fresh investment 382.10 383.40 646.61 387.96 258.64 -
Closing Balance of CWIP (A + B - C - D) 505.34 846.76 448.34 352.05 352.05 377.05
SL. No. Particulars MYT 2016-17 to 2018-19

MPMKVVCL Annexure-I of ARR/Tariff Petition FY-17
Name of Distribution Licensee : MPMKVVCL BHOPAL
Details of Expenses Capitalised Form No: F2d
Amount in Rs. Crore
Wheeling +Retail Sale activity
Sl.No. Particulars Old Years PY CY
FY14 FY15 FY16 FY17 FY18 FY19
1 Interest & Finance charges Capitalised 44.07 41.94 41.94 41.94 41.94 41.94
2 Other expenses capitalised:
a. Employee expenses 120.61 39.77 47.26 47.26 47.26 47.26
b. R&M Expenses - - - - - -
c. A&G Expenses 16.85 5.31 5.95 5.95 5.95 5.95
d. Others, if any - - - - - -
Total of 2 137.46 45.08 53.21 53.21 53.21 53.21
3 Capitalisation of depreciation, if any - - - - - -
Grand Total (1+2+3) 181.53 87.03 95.15 95.15 95.15 95.15
MYT 2016-17 to 2018-19
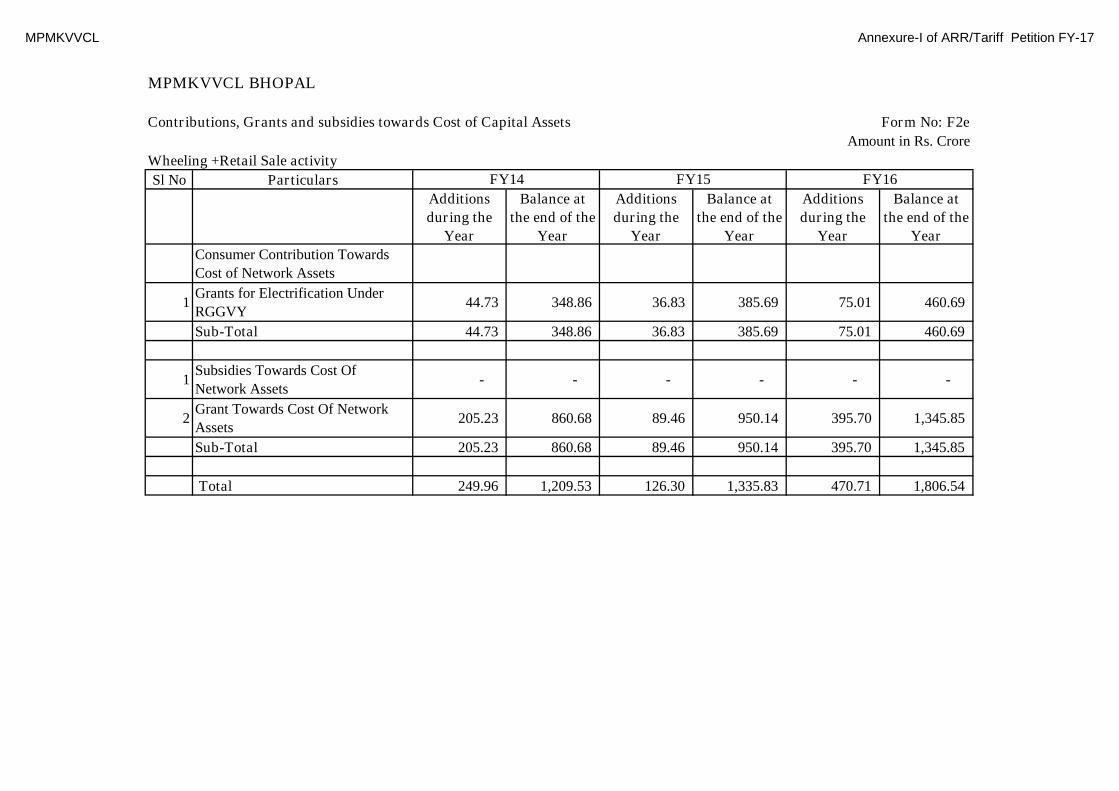
MPMKVVCL Annexure-I of ARR/Tariff Petition FY-17
MPMKVVCL BHOPAL
Contributions, Grants and subsidies towards Cost of Capital Assets Form No: F2e
Amount in Rs. Crore
Wheeling +Retail Sale activity
Sl No Particulars
Additions
during the
Year
Balance at
the end of the
Year
Additions
during the
Year
Balance at
the end of the
Year
Additions
during the
Year
Balance at
the end of the
Year
Consumer Contribution Towards
Cost of Network Assets
1Grants for Electrification Under
RGGVY44.73 348.86 36.83 385.69 75.01 460.69
Sub-Total 44.73 348.86 36.83 385.69 75.01 460.69
1Subsidies Towards Cost Of
Network Assets- - - - - -
2Grant Towards Cost Of Network
Assets205.23 860.68 89.46 950.14 395.70 1,345.85
Sub-Total 205.23 860.68 89.46 950.14 395.70 1,345.85
Total 249.96 1,209.53 126.30 1,335.83 470.71 1,806.54
FY15 FY16FY14
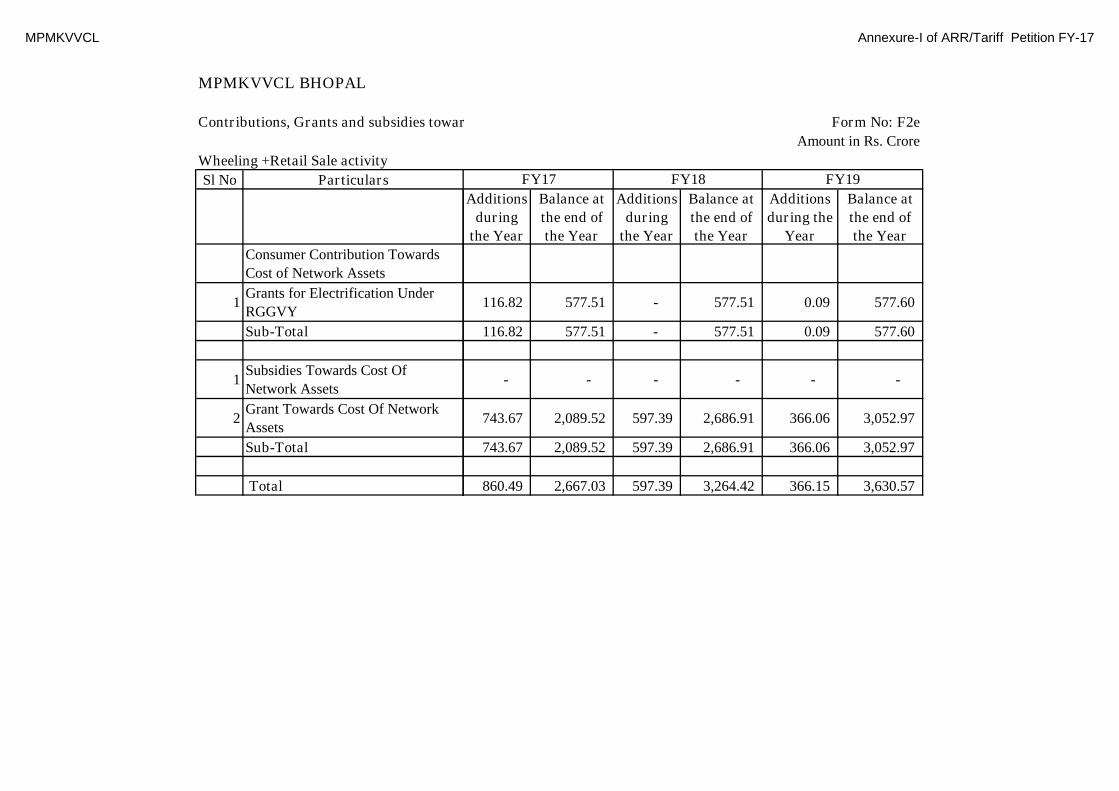
MPMKVVCL Annexure-I of ARR/Tariff Petition FY-17
MPMKVVCL BHOPAL
Contributions, Grants and subsidies towards Cost of Capital Assets
Wheeling +Retail Sale activity
Sl No Particulars
Consumer Contribution Towards
Cost of Network Assets
1Grants for Electrification Under
RGGVY
Sub-Total
1Subsidies Towards Cost Of
Network Assets
2Grant Towards Cost Of Network
Assets
Sub-Total
Total
Form No: F2e
Amount in Rs. Crore
Additions
during
the Year
Balance at
the end of
the Year
Additions
during
the Year
Balance at
the end of
the Year
Additions
during the
Year
Balance at
the end of
the Year
116.82 577.51 - 577.51 0.09 577.60
116.82 577.51 - 577.51 0.09 577.60
- - - - - -
743.67 2,089.52 597.39 2,686.91 366.06 3,052.97
743.67 2,089.52 597.39 2,686.91 366.06 3,052.97
860.49 2,667.03 597.39 3,264.42 366.15 3,630.57
FY18 FY19FY17
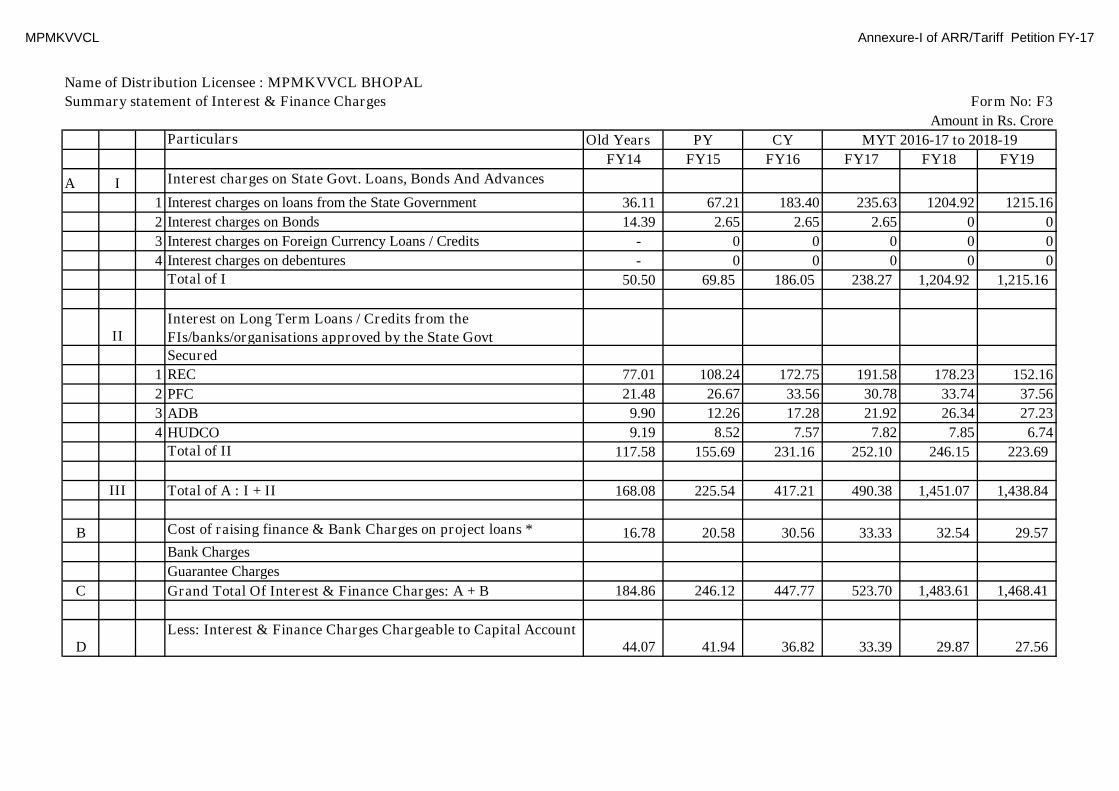
MPMKVVCL Annexure-I of ARR/Tariff Petition FY-17
Name of Distribution Licensee : MPMKVVCL BHOPAL
Summary statement of Interest & Finance Charges Form No: F3
Amount in Rs. Crore
Particulars Old Years PY CY
FY14 FY15 FY16 FY17 FY18 FY19
A I Interest charges on State Govt. Loans, Bonds And Advances
1 Interest charges on loans from the State Government 36.11 67.21 183.40 235.63 1204.92 1215.16
2 Interest charges on Bonds 14.39 2.65 2.65 2.65 0 0
3 Interest charges on Foreign Currency Loans / Credits - 0 0 0 0 0
4 Interest charges on debentures - 0 0 0 0 0
Total of I 50.50 69.85 186.05 238.27 1,204.92 1,215.16
IIInterest on Long Term Loans / Credits from the
FIs/banks/organisations approved by the State GovtSecured
1 REC 77.01 108.24 172.75 191.58 178.23 152.16
2 PFC 21.48 26.67 33.56 30.78 33.74 37.56
3 ADB 9.90 12.26 17.28 21.92 26.34 27.23
4 HUDCO 9.19 8.52 7.57 7.82 7.85 6.74
Total of II 117.58 155.69 231.16 252.10 246.15 223.69
III Total of A : I + II 168.08 225.54 417.21 490.38 1,451.07 1,438.84
B Cost of raising finance & Bank Charges on project loans * 16.78 20.58 30.56 33.33 32.54 29.57
Bank Charges
Guarantee Charges
C Grand Total Of Interest & Finance Charges: A + B 184.86 246.12 447.77 523.70 1,483.61 1,468.41
DLess: Interest & Finance Charges Chargeable to Capital Account
44.07 41.94 36.82 33.39 29.87 27.56
MYT 2016-17 to 2018-19

MPMKVVCL Annexure-I of ARR/Tariff Petition FY-17
Name of Distribution Licensee : MPMKVVCL BHOPAL
Summary statement of Interest & Finance Charges Form No: F3
Amount in Rs. Crore
ENet Total Of Interest & Finance Charges on Project Loans C-D
140.79 204.17 410.95 490.31 1,453.74 1,440.85
F Interest and Finance Charges on Working Capital Loans 242.96 41.20 141.36 186.51 195.18 203.85
G Interest on Consumer Security Deposit 45.21 55.71 64.30 71.85 79.40 86.95
H
Interest at weighted average rate of loan portfolio on excess
additional equity, if any**
I
Total interest and finance charges chargeable to revenue account
(E+F+G+H) 428.96 301.09 616.60 748.67 1,728.32 1,731.65
Interest & Finance Charges(Wheeling + Retail sales activities)* Old Years PY CY
Particulars
In Rs Crores FY14 FY15 FY16 FY17 FY18 FY19
1. Addition to GFA during the year 1,136.33 1,164.71 1,158.51 1,264.59 1,315.87 1,120.46
2. Consumer constribution during the year - - - - - -
3. Net addition to GFA during the year (1-2) 1,136.33 1,164.71 1,158.51 1,264.59 1,315.87 1,120.46
4. 30% of addition to net GFA considered as funded through equity(4=3*30%)340.90 349.41 347.55 379.38 394.76 336.14
5. Balance addition to net GFA during the year funded through debt(5=3-4)795.43 815.30 810.96 885.21 921.11 784.32
6. Debt Repayment due during the year (equal to the depreciation claim) 224.33 230.50 314.23 378.40 372.12 361.49
7. Debt associated with GFA as per tariff order FY 14-15 (Rs.
1634.34 crore as on 31st March 2014 +addition in GFA funded
through loan - debt repayment )and for subsiquent years projected as
per method adopted in tariff order of FY 13-14 1,841.74 2,219.14 2,715.86 3,222.67 3,771.66 4,194.50
8. Weighted average rate of interest % on all loans 8.99% 8.43% 9.53% 8.97% 8.25% 7.70%
9.Total Interest on project loans(9=7*8) 165.54 187.13 258.87 289.05 311.32 322.97
10. Finance Charges 16.78 20.58 30.56 33.33 32.54 29.57
11. Total Interest on project loan and Finance charges 182.32 207.71 289.43 322.37 343.86 352.54
Interest and Finance Charges on Working Capital Loans - - 0.08 4.37 6.72 13.69
Interest on Consumer Security Deposit 45.21 55.71 64.30 71.85 79.40 86.95
Total Interest and Finance charges 227.53 263.42 353.81 398.59 429.98 453.17
MYT 2016-17 to 2018-19

MPMKVVCL Annexure-I of ARR/Tariff Petition FY-17
Name of Distribution Licensee : MPMKVVCL BHOPALCalculation of weighted average rate of interest on actual loans Form No: F3a
Amount in Rs. Lakhs
PY PY CY
FY14 FY15 FY16 FY 17 FY 18 FY 19
Loan - REC (Inherited) PS
Gross Loan - Opening (Rs. lacs.) (Both current & Noncurrent portion) 6471.00 5678.89 4821.49 3893.42 2888.83 1801.44
Add: Drawals during the year (Rs. lacs.) 0.00 0.00 0.00 0.00 0.00 0.00
Less: Repayment of Loan during the year (Rs. lacs.) 792.11 857.40 928.08 1004.58 1087.39 1177.03
Closing Balance of loan (Rs. lacs.)(Both current & Noncurrent portion) 5678.89 4821.49 3893.42 2888.83 1801.44 624.42
Average loan (Rs. lacs.) 6074.95 5250.19 4357.45 3391.12 2345.14 1212.93
Rate of Interest on loan % 8.00% 8.00% 8.00% 8.00% 8.00% 8.00%
Interest on loan (Rs. lacs.) 485.83 420.53 349.85 273.35 190.54 100.90
Loan - REC(Additional Liability) PS
Gross Loan - Opening (Rs. lacs.) (Both current & Non
current portion) 5205.94 4405.03 3604.11 2803.20 2002.28 1201.37
Add: Drawals during the year (Rs. lacs.) 0.00 0.00 0.00 0.00 0.00 0.00Less: Repayment of Loan during the year (Rs. lacs.) 800.91 800.91 800.91 800.91 800.91 800.91
Closing Balance of loan (Rs. lacs.)(Both current & Non
current portion) 4405.03 3604.11 2803.20 2002.28 1201.37 400.46
Average loan (Rs. lacs.) 4805.48 4004.57 3203.66 2402.74 1601.83 800.91
Rate of Interest on loan % 8.00% 8.00% 8.00% 8.00% 8.00% 8.00%
Interest on loan (Rs. lacs.) 563.20 470.00 377.74 283.60 190.40 97.20
Loan - PFC (Inherited) PS
Gross Loan - Opening (Rs. lacs.) (Both current & Noncurrent portion) 990.27 642.33 294.38 138.26 46.08 0.00
Add: Drawals during the year (Rs. lacs.) 0.00 0.00 0.00 0.00 0.00 0.00
Less: Repayment of Loan during the year (Rs. lacs.) 347.95 347.95 156.12 92.18 46.09 0.00
Closing Balance of loan (Rs. lacs.)(Both current & Noncurrent portion) 642.33 294.38 138.26 46.08 0.00 0.00
Average loan (Rs. lacs.) 816.30 468.35 216.32 92.17 23.04 0.00
Rate of Interest on loan % 12.75% 12.75% 12.75% 12.75% 12.75% 12.75%
Interest on loan (Rs. lacs.) 96.98 55.91 26.96 13.24 2.18 0.00
Loan - PP Bonds
Gross Loan - Opening (Rs. lacs.) 2716.02 2716.02 2716.02 2716.02 0.00 0.00
Add: Drawals during the year (Rs. lacs.) 0.00 0.00 0.00 0.00 0.00 0.00
Less: Repayment of Loan during the year (Rs. lacs.) 0.00 0.00 0.00 2716.02 0 0.00
Closing Balance of loan (Rs. lacs.) 2716.02 2716.02 2716.02 0.00 0.00 0.00
Average loan (Rs. lacs.) 2716.02 2716.02 2716.02 1358.01 0.00 0.00
Rate of Interest on loan %13.70%-15.00%
13.70%-15.00%
13.70%-15.00%
13.70%-15.00%
13.70%-15.00%
13.70%-15.00%
Interest on loan (Rs. lacs.) 1439.09 264.50 264.50 264.50 0.00 0.00
Loan - ADB II PS
Gross Loan - Opening (Rs. lacs.) 31029.54 41053.16 52599.99 59595.99 59595.99 59595.99
Add: Drawals during the year (Rs. lacs.) 11096.94 11546.83 6996.00 0.00 0.00 0.00
MYT 2016-17 to 2018-19Type of Loan
( "PS" or
"WC" )
Particulars
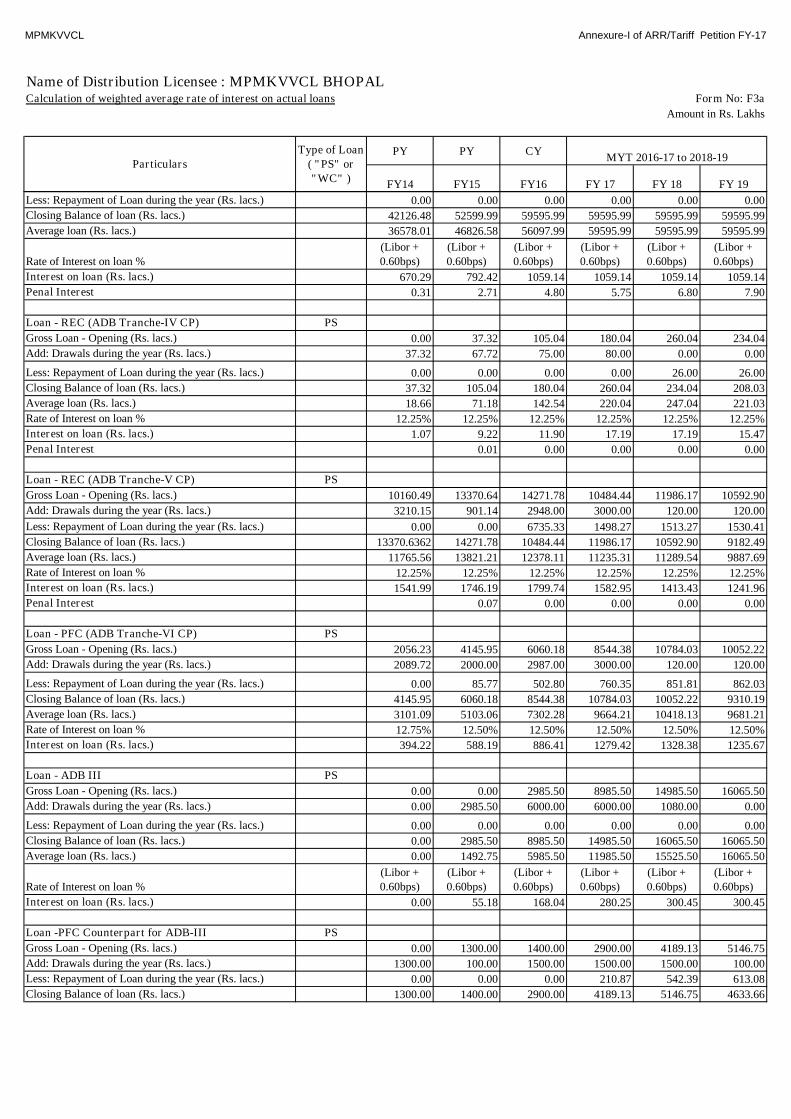
MPMKVVCL Annexure-I of ARR/Tariff Petition FY-17
Name of Distribution Licensee : MPMKVVCL BHOPALCalculation of weighted average rate of interest on actual loans Form No: F3a
Amount in Rs. Lakhs
PY PY CY
FY14 FY15 FY16 FY 17 FY 18 FY 19
MYT 2016-17 to 2018-19Type of Loan
( "PS" or
"WC" )
Particulars
Less: Repayment of Loan during the year (Rs. lacs.) 0.00 0.00 0.00 0.00 0.00 0.00
Closing Balance of loan (Rs. lacs.) 42126.48 52599.99 59595.99 59595.99 59595.99 59595.99
Average loan (Rs. lacs.) 36578.01 46826.58 56097.99 59595.99 59595.99 59595.99
Rate of Interest on loan %(Libor +0.60bps)
(Libor +0.60bps)
(Libor +0.60bps)
(Libor +0.60bps)
(Libor +0.60bps)
(Libor +0.60bps)
Interest on loan (Rs. lacs.) 670.29 792.42 1059.14 1059.14 1059.14 1059.14
Penal Interest 0.31 2.71 4.80 5.75 6.80 7.90
Loan - REC (ADB Tranche-IV CP) PS
Gross Loan - Opening (Rs. lacs.) 0.00 37.32 105.04 180.04 260.04 234.04
Add: Drawals during the year (Rs. lacs.) 37.32 67.72 75.00 80.00 0.00 0.00
Less: Repayment of Loan during the year (Rs. lacs.) 0.00 0.00 0.00 0.00 26.00 26.00
Closing Balance of loan (Rs. lacs.) 37.32 105.04 180.04 260.04 234.04 208.03
Average loan (Rs. lacs.) 18.66 71.18 142.54 220.04 247.04 221.03
Rate of Interest on loan % 12.25% 12.25% 12.25% 12.25% 12.25% 12.25%
Interest on loan (Rs. lacs.) 1.07 9.22 11.90 17.19 17.19 15.47
Penal Interest 0.01 0.00 0.00 0.00 0.00
Loan - REC (ADB Tranche-V CP) PS
Gross Loan - Opening (Rs. lacs.) 10160.49 13370.64 14271.78 10484.44 11986.17 10592.90
Add: Drawals during the year (Rs. lacs.) 3210.15 901.14 2948.00 3000.00 120.00 120.00
Less: Repayment of Loan during the year (Rs. lacs.) 0.00 0.00 6735.33 1498.27 1513.27 1530.41
Closing Balance of loan (Rs. lacs.) 13370.6362 14271.78 10484.44 11986.17 10592.90 9182.49
Average loan (Rs. lacs.) 11765.56 13821.21 12378.11 11235.31 11289.54 9887.69
Rate of Interest on loan % 12.25% 12.25% 12.25% 12.25% 12.25% 12.25%
Interest on loan (Rs. lacs.) 1541.99 1746.19 1799.74 1582.95 1413.43 1241.96
Penal Interest 0.07 0.00 0.00 0.00 0.00
Loan - PFC (ADB Tranche-VI CP) PS
Gross Loan - Opening (Rs. lacs.) 2056.23 4145.95 6060.18 8544.38 10784.03 10052.22
Add: Drawals during the year (Rs. lacs.) 2089.72 2000.00 2987.00 3000.00 120.00 120.00
Less: Repayment of Loan during the year (Rs. lacs.) 0.00 85.77 502.80 760.35 851.81 862.03
Closing Balance of loan (Rs. lacs.) 4145.95 6060.18 8544.38 10784.03 10052.22 9310.19
Average loan (Rs. lacs.) 3101.09 5103.06 7302.28 9664.21 10418.13 9681.21
Rate of Interest on loan % 12.75% 12.50% 12.50% 12.50% 12.50% 12.50%
Interest on loan (Rs. lacs.) 394.22 588.19 886.41 1279.42 1328.38 1235.67
Loan - ADB III PS
Gross Loan - Opening (Rs. lacs.) 0.00 0.00 2985.50 8985.50 14985.50 16065.50
Add: Drawals during the year (Rs. lacs.) 0.00 2985.50 6000.00 6000.00 1080.00 0.00
Less: Repayment of Loan during the year (Rs. lacs.) 0.00 0.00 0.00 0.00 0.00 0.00
Closing Balance of loan (Rs. lacs.) 0.00 2985.50 8985.50 14985.50 16065.50 16065.50
Average loan (Rs. lacs.) 0.00 1492.75 5985.50 11985.50 15525.50 16065.50
Rate of Interest on loan %(Libor +0.60bps)
(Libor +0.60bps)
(Libor +0.60bps)
(Libor +0.60bps)
(Libor +0.60bps)
(Libor +0.60bps)
Interest on loan (Rs. lacs.) 0.00 55.18 168.04 280.25 300.45 300.45
Loan -PFC Counterpart for ADB-III PS
Gross Loan - Opening (Rs. lacs.) 0.00 1300.00 1400.00 2900.00 4189.13 5146.75
Add: Drawals during the year (Rs. lacs.) 1300.00 100.00 1500.00 1500.00 1500.00 100.00
Less: Repayment of Loan during the year (Rs. lacs.) 0.00 0.00 0.00 210.87 542.39 613.08
Closing Balance of loan (Rs. lacs.) 1300.00 1400.00 2900.00 4189.13 5146.75 4633.66
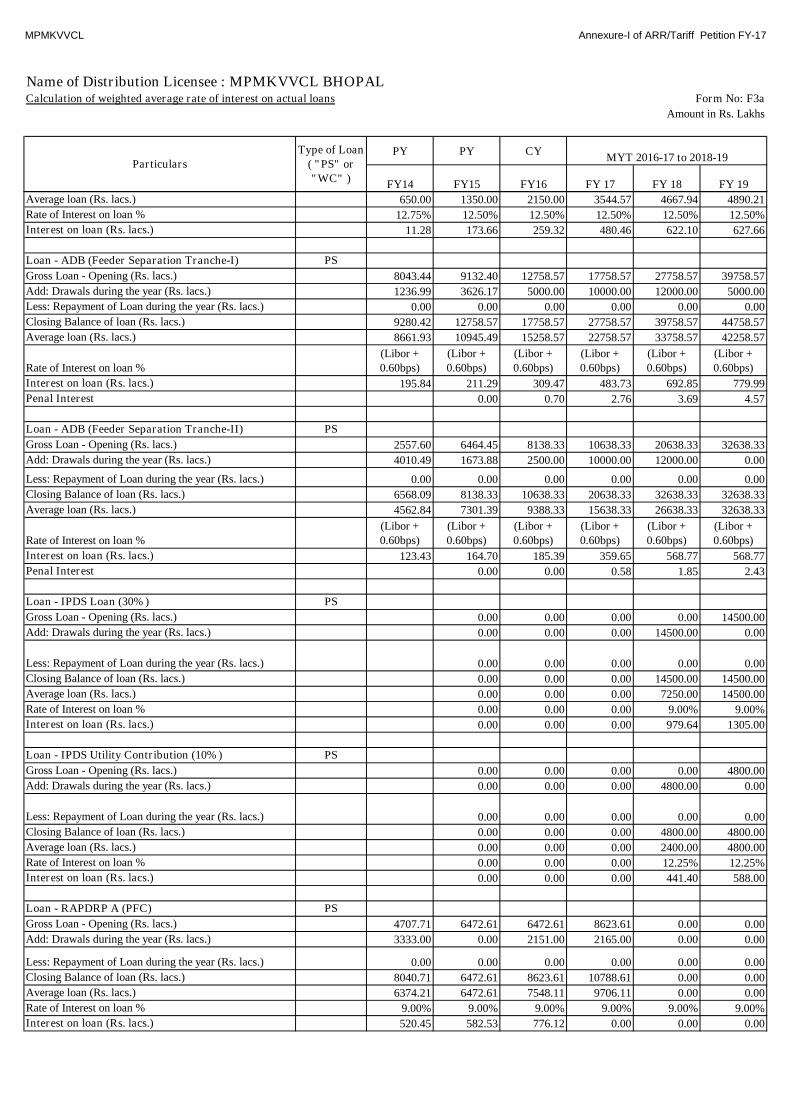
MPMKVVCL Annexure-I of ARR/Tariff Petition FY-17
Name of Distribution Licensee : MPMKVVCL BHOPALCalculation of weighted average rate of interest on actual loans Form No: F3a
Amount in Rs. Lakhs
PY PY CY
FY14 FY15 FY16 FY 17 FY 18 FY 19
MYT 2016-17 to 2018-19Type of Loan
( "PS" or
"WC" )
Particulars
Average loan (Rs. lacs.) 650.00 1350.00 2150.00 3544.57 4667.94 4890.21
Rate of Interest on loan % 12.75% 12.50% 12.50% 12.50% 12.50% 12.50%
Interest on loan (Rs. lacs.) 11.28 173.66 259.32 480.46 622.10 627.66
Loan - ADB (Feeder Separation Tranche-I) PS
Gross Loan - Opening (Rs. lacs.) 8043.44 9132.40 12758.57 17758.57 27758.57 39758.57
Add: Drawals during the year (Rs. lacs.) 1236.99 3626.17 5000.00 10000.00 12000.00 5000.00
Less: Repayment of Loan during the year (Rs. lacs.) 0.00 0.00 0.00 0.00 0.00 0.00
Closing Balance of loan (Rs. lacs.) 9280.42 12758.57 17758.57 27758.57 39758.57 44758.57
Average loan (Rs. lacs.) 8661.93 10945.49 15258.57 22758.57 33758.57 42258.57
Rate of Interest on loan %
(Libor +
0.60bps)
(Libor +
0.60bps)
(Libor +
0.60bps)
(Libor +
0.60bps)
(Libor +
0.60bps)
(Libor +
0.60bps)
Interest on loan (Rs. lacs.) 195.84 211.29 309.47 483.73 692.85 779.99
Penal Interest 0.00 0.70 2.76 3.69 4.57
Loan - ADB (Feeder Separation Tranche-II) PS
Gross Loan - Opening (Rs. lacs.) 2557.60 6464.45 8138.33 10638.33 20638.33 32638.33
Add: Drawals during the year (Rs. lacs.) 4010.49 1673.88 2500.00 10000.00 12000.00 0.00
Less: Repayment of Loan during the year (Rs. lacs.) 0.00 0.00 0.00 0.00 0.00 0.00
Closing Balance of loan (Rs. lacs.) 6568.09 8138.33 10638.33 20638.33 32638.33 32638.33
Average loan (Rs. lacs.) 4562.84 7301.39 9388.33 15638.33 26638.33 32638.33
Rate of Interest on loan %(Libor +0.60bps)
(Libor +0.60bps)
(Libor +0.60bps)
(Libor +0.60bps)
(Libor +0.60bps)
(Libor +0.60bps)
Interest on loan (Rs. lacs.) 123.43 164.70 185.39 359.65 568.77 568.77
Penal Interest 0.00 0.00 0.58 1.85 2.43
Loan - IPDS Loan (30%) PS
Gross Loan - Opening (Rs. lacs.) 0.00 0.00 0.00 0.00 14500.00
Add: Drawals during the year (Rs. lacs.) 0.00 0.00 0.00 14500.00 0.00
Less: Repayment of Loan during the year (Rs. lacs.) 0.00 0.00 0.00 0.00 0.00
Closing Balance of loan (Rs. lacs.) 0.00 0.00 0.00 14500.00 14500.00
Average loan (Rs. lacs.) 0.00 0.00 0.00 7250.00 14500.00
Rate of Interest on loan % 0.00 0.00 0.00 9.00% 9.00%
Interest on loan (Rs. lacs.) 0.00 0.00 0.00 979.64 1305.00
Loan - IPDS Utility Contribution (10%) PS
Gross Loan - Opening (Rs. lacs.) 0.00 0.00 0.00 0.00 4800.00
Add: Drawals during the year (Rs. lacs.) 0.00 0.00 0.00 4800.00 0.00
Less: Repayment of Loan during the year (Rs. lacs.) 0.00 0.00 0.00 0.00 0.00
Closing Balance of loan (Rs. lacs.) 0.00 0.00 0.00 4800.00 4800.00
Average loan (Rs. lacs.) 0.00 0.00 0.00 2400.00 4800.00
Rate of Interest on loan % 0.00 0.00 0.00 12.25% 12.25%
Interest on loan (Rs. lacs.) 0.00 0.00 0.00 441.40 588.00
Loan - RAPDRP A (PFC) PS
Gross Loan - Opening (Rs. lacs.) 4707.71 6472.61 6472.61 8623.61 0.00 0.00
Add: Drawals during the year (Rs. lacs.) 3333.00 0.00 2151.00 2165.00 0.00 0.00
Less: Repayment of Loan during the year (Rs. lacs.) 0.00 0.00 0.00 0.00 0.00 0.00
Closing Balance of loan (Rs. lacs.) 8040.71 6472.61 8623.61 10788.61 0.00 0.00
Average loan (Rs. lacs.) 6374.21 6472.61 7548.11 9706.11 0.00 0.00
Rate of Interest on loan % 9.00% 9.00% 9.00% 9.00% 9.00% 9.00%
Interest on loan (Rs. lacs.) 520.45 582.53 776.12 0.00 0.00 0.00

MPMKVVCL Annexure-I of ARR/Tariff Petition FY-17
Name of Distribution Licensee : MPMKVVCL BHOPALCalculation of weighted average rate of interest on actual loans Form No: F3a
Amount in Rs. Lakhs
PY PY CY
FY14 FY15 FY16 FY 17 FY 18 FY 19
MYT 2016-17 to 2018-19Type of Loan
( "PS" or
"WC" )
Particulars
Loan - SCADA RAPDRP-A (PFC) PS
Gross Loan - Opening (Rs. lacs.) 1568.10 1568.10 3136.20 4704.30 0.00
Add: Drawals during the year (Rs. lacs.) 0.00 1568.10 1568.10 523.00 0.00
Less: Repayment of Loan during the year (Rs. lacs.) 0.00 0.00 0.00 0.00 0.00
Closing Balance of loan (Rs. lacs.) 1568.10 3136.20 4704.30 5227.30 0.00
Average loan (Rs. lacs.) 1568.10 2352.15 3920.25 4965.80 0.00
Rate of Interest on loan % 9.00% 9.00% 9.00% 9.00% 9.00%
Interest on loan (Rs. lacs.) 141.13 282.26 0.00 0.00 0.00
Loan - RAPDRP B (PFC) PS
Gross Loan - Opening (Rs. lacs.) 12501.15 12501.15 12501.15 12501.15 16501.15 16501.15
Add: Drawals during the year (Rs. lacs.) 0.00 0.00 0.00 4000.00 0.00 0.00
Less: Repayment of Loan during the year (Rs. lacs.) 0.00 0.00 0.00 0.00 0.00 0.00
Closing Balance of loan (Rs. lacs.) 12501.15 12501.15 12501.15 16501.15 16501.15 16501.15
Average loan (Rs. lacs.) 12501.15 12501.15 12501.15 14501.15 16501.15 16501.15
Rate of Interest on loan % 9.00% 9.00% 9.00% 9.00% 9.00% 9.00%
Interest on loan (Rs. lacs.) 1125.10 1125.10 1125.10 1304.61 0.00 0.00
Loan -REC as Counterpart for RAPDRP B PS
Gross Loan - Opening (Rs. lacs.) 10309.03 26492.06 34082.80 39674.52 40155.13 35135.74
Add: Drawals during the year (Rs. lacs.) 16183.02 7590.74 10000.00 5500.00 0.00 0.00
Less: Repayment of Loan during the year (Rs. lacs.) 0.00 0.00 4408.28 5019.39 5019.39 5019.39
Closing Balance of loan (Rs. lacs.) 26492.06 34082.80 39674.52 40155.13 35135.74 30116.35
Average loan (Rs. lacs.) 18400.55 30287.43 36878.66 39914.82 37645.43 32626.04
Rate of Interest on loan % 12.25% 12.25% 12.25% 12.25% 12.25% 12.25%
Interest on loan (Rs. lacs.) 2276.69 3626.25 4785.96 5196.08 4919.00 4304.13
Penal Interest 8.12 0.00 0.00 0.00 0.00
Loan -REC for JBIC scheme PS
Gross Loan - Opening (Rs. lacs.) 5785.97 5785.97 5207.37 4628.77 4050.18 3471.58
Add: Drawals during the year (Rs. lacs.) 0.00 0.00 0.00 0.00 0.00 0.00
Less: Repayment of Loan during the year (Rs. lacs.) 0.00 578.60 578.60 578.60 578.60 578.60
Closing Balance of loan (Rs. lacs.) 5785.97 5207.37 4628.77 4050.18 3471.58 2892.98
Average loan (Rs. lacs.) 5785.97 5496.67 4918.07 4339.48 3760.88 3182.28
Rate of Interest on loan % 10.30% 10.30% 10.30% 10.30% 10.30% 10.30%
Interest on loan (Rs. lacs.) 596.57 555.94 476.76 417.17 357.57 297.98
Penal Interest 0.46 0.00 0.00 0.00 0.00
Loan -REC Feeder Separation PS
Gross Loan - Opening (Rs. lacs.) 11491.35 14352.13 19480.03 27804.47 31328.91 31996.21
Add: Drawals during the year (Rs. lacs.) 4154.78 7062.65 11800.00 8000.00 6000.00 0.00
Less: Repayment of Loan during the year (Rs. lacs.) 0.00 1934.75 3475.56 4475.56 5332.70 5332.70
Closing Balance of loan (Rs. lacs.) 15646.13 19480.03 27804.47 31328.91 31996.21 26663.51
Average loan (Rs. lacs.) 13568.74 16916.08 23642.25 29566.69 31662.56 29329.86
Rate of Interest on loan % 12.25% 12.25% 12.25% 12.25% 12.25% 12.25%
Interest on loan (Rs. lacs.) 1655.78 2125.58 3609.01 4100.65 4234.53 3583.06
Penal Interest 9.12 0.00 0.00 0.00 0.00
Loan -REC Feeder Separation (Vidisha-II) PS

MPMKVVCL Annexure-I of ARR/Tariff Petition FY-17
Name of Distribution Licensee : MPMKVVCL BHOPALCalculation of weighted average rate of interest on actual loans Form No: F3a
Amount in Rs. Lakhs
PY PY CY
FY14 FY15 FY16 FY 17 FY 18 FY 19
MYT 2016-17 to 2018-19Type of Loan
( "PS" or
"WC" )
Particulars
Gross Loan - Opening (Rs. lacs.) 1294.00 2033.00 2233.00 2009.70 1786.40Add: Drawals during the year (Rs. lacs.) 739.00 200.00 0.00 0.00 0.00Less: Repayment of Loan during the year (Rs. lacs.) 0.00 0.00 223.30 223.30 223.30Closing Balance of loan (Rs. lacs.) 2033.00 2233.00 2009.70 1786.40 1563.10Average loan (Rs. lacs.) 1663.50 2133.00 2121.35 1898.05 1674.75Rate of Interest on loan % 12.25% 12.25% 12.25% 12.25% 12.25%Interest on loan (Rs. lacs.) 208.33 273.54 272.27 244.91 217.56
Loan -REC Feeder Separation (SSTD) PS
Gross Loan - Opening (Rs. lacs.) 2529.05 6010.50 6010.50 6811.20 6054.40 5297.60
Add: Drawals during the year (Rs. lacs.) 3481.45 0.00 1557.50 0.00 0.00 0.00Less: Repayment of Loan during the year (Rs. lacs.) 0.00 0.00 756.80 756.80 756.80 756.80
Closing Balance of loan (Rs. lacs.) 6010.50 6010.50 6811.20 6054.40 5297.60 4540.80
Average loan (Rs. lacs.) 4269.77 6010.50 6410.85 6432.80 5676.00 4919.20
Rate of Interest on loan % 12.25% 12.25% 12.25% 12.25% 12.25% 12.25%
Interest on loan (Rs. lacs.) 579.72 736.29 922.76 830.05 737.35 644.64
Loan- (DDUGJY) (30%) PS
Gross Loan - Opening (Rs. lacs.) 0.00 0.00 11541.00 28853.00 28853.00
Add: Drawals during the year (Rs. lacs.) 0.00 11541.00 17312.00 0.00 0.00
Less: Repayment of Loan during the year (Rs. lacs.) 0.00 0.00 0.00 0.00 0.00
Closing Balance of loan (Rs. lacs.) 0.00 11541.00 28853.00 28853.00 28853.00
Average loan (Rs. lacs.) 0.00 5770.50 20197.00 28853.00 28853.00
Rate of Interest on loan % 0.00 12.25% 12.25% 12.25% 12.25%
Interest on loan (Rs. lacs.) 0.00 352.47 2471.23 3534.49 3534.49
Loan- (DDUGJY) (10%) PS
Gross Loan - Opening (Rs. lacs.) 0.00 0.00 3847.00 9618.00 9618.00
Add: Drawals during the year (Rs. lacs.) 0.00 3847.00 5771.00 0.00 0.00
Less: Repayment of Loan during the year (Rs. lacs.) 0.00 0.00 0.00 0.00 0.00
Closing Balance of loan (Rs. lacs.) 0.00 3847.00 9618.00 9618.00 9618.00
Average loan (Rs. lacs.) 0.00 1923.50 6732.50 9618.00 9618.00
Rate of Interest on loan % 0.00 12.25% 12.25% 12.25% 12.25%
Interest on loan (Rs. lacs.) 0.00 118.78 823.76 1178.21 1178.21
Loan -REC Medium Term Loan
Gross Loan - Opening (Rs. lacs.) 0.00 35000.00 32083.33 14583.33 0.00
Add: Drawals during the year (Rs. lacs.) 35000.00 0.00 0.00 0.00 0.00
Less: Repayment of Loan during the year (Rs. lacs.) 0.00 2916.67 17500.00 14583.33 0.00
Closing Balance of loan (Rs. lacs.) 35000.00 32083.33 14583.33 0.00 0.00
Average loan (Rs. lacs.) 17500.00 33541.67 23333.33 7291.67 0.00
Rate of Interest on loan % 12.00% 12.00% 12.00% 12.00% 12.00%
Interest on loan (Rs. lacs.) 907.77 4196.64 2890.14 805.00 0.00
Loan - Hudco PS
Gross Loan - Opening (Rs. lacs.) 8077.44 7197.30 6317.30 5937.30 6507.30 5627.30
Add: Drawals during the year (Rs. lacs.) 0.00 0.00 500.00 1450.00 0.00 0.00
Less: Repayment of Loan during the year (Rs. lacs.) 880.14 880.00 880.00 880.00 880.00 880.00
Closing Balance of loan (Rs. lacs.) 7197.30 6317.30 5937.30 6507.30 5627.30 4747.30
Average loan (Rs. lacs.) 7637.37 6757.30 6127.30 6222.30 6067.30 5187.30
Rate of Interest on loan % 12.50% 12.50% 12.50% 12.50% 12.50% 12.50%
Interest on loan (Rs. lacs.) 919.08 851.88 757.43 782.11 785.45 673.56
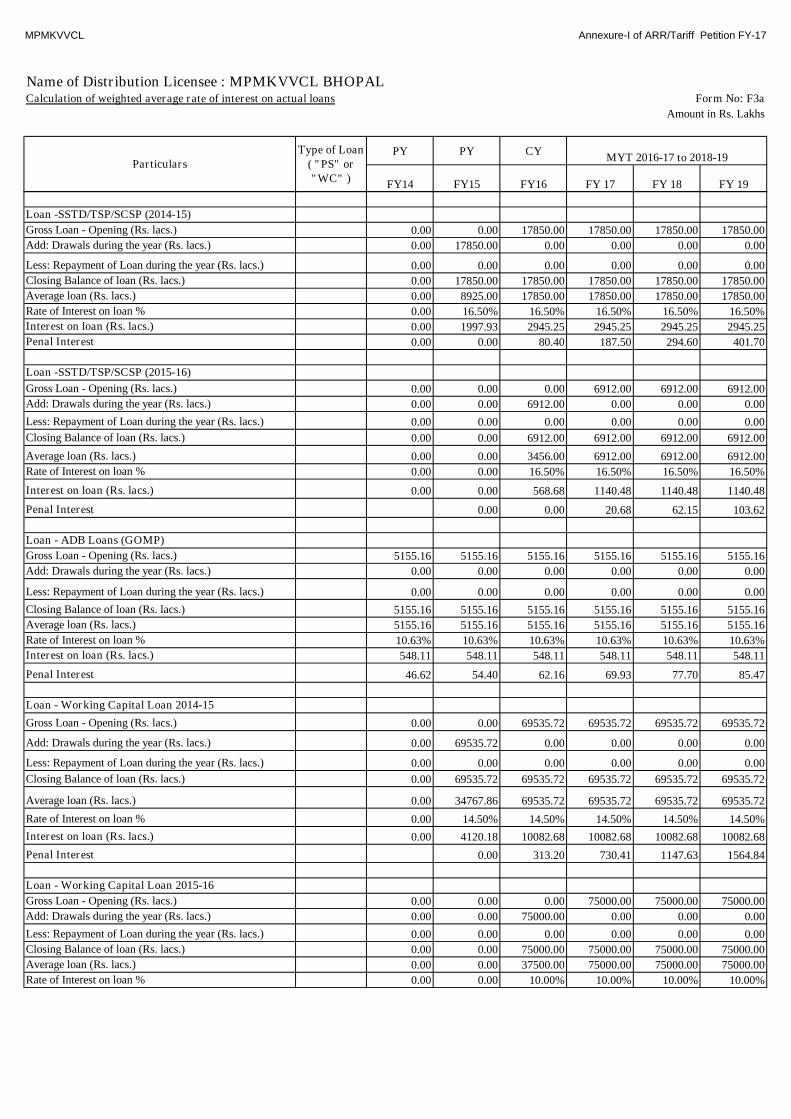
MPMKVVCL Annexure-I of ARR/Tariff Petition FY-17
Name of Distribution Licensee : MPMKVVCL BHOPALCalculation of weighted average rate of interest on actual loans Form No: F3a
Amount in Rs. Lakhs
PY PY CY
FY14 FY15 FY16 FY 17 FY 18 FY 19
MYT 2016-17 to 2018-19Type of Loan
( "PS" or
"WC" )
Particulars
Loan -SSTD/TSP/SCSP (2014-15)
Gross Loan - Opening (Rs. lacs.) 0.00 0.00 17850.00 17850.00 17850.00 17850.00
Add: Drawals during the year (Rs. lacs.) 0.00 17850.00 0.00 0.00 0.00 0.00
Less: Repayment of Loan during the year (Rs. lacs.) 0.00 0.00 0.00 0.00 0.00 0.00
Closing Balance of loan (Rs. lacs.) 0.00 17850.00 17850.00 17850.00 17850.00 17850.00
Average loan (Rs. lacs.) 0.00 8925.00 17850.00 17850.00 17850.00 17850.00
Rate of Interest on loan % 0.00 16.50% 16.50% 16.50% 16.50% 16.50%
Interest on loan (Rs. lacs.) 0.00 1997.93 2945.25 2945.25 2945.25 2945.25
Penal Interest 0.00 0.00 80.40 187.50 294.60 401.70
Loan -SSTD/TSP/SCSP (2015-16)
Gross Loan - Opening (Rs. lacs.) 0.00 0.00 0.00 6912.00 6912.00 6912.00
Add: Drawals during the year (Rs. lacs.) 0.00 0.00 6912.00 0.00 0.00 0.00
Less: Repayment of Loan during the year (Rs. lacs.) 0.00 0.00 0.00 0.00 0.00 0.00
Closing Balance of loan (Rs. lacs.) 0.00 0.00 6912.00 6912.00 6912.00 6912.00
Average loan (Rs. lacs.) 0.00 0.00 3456.00 6912.00 6912.00 6912.00
Rate of Interest on loan % 0.00 0.00 16.50% 16.50% 16.50% 16.50%
Interest on loan (Rs. lacs.) 0.00 0.00 568.68 1140.48 1140.48 1140.48
Penal Interest 0.00 0.00 20.68 62.15 103.62
Loan - ADB Loans (GOMP)
Gross Loan - Opening (Rs. lacs.) 5155.16 5155.16 5155.16 5155.16 5155.16 5155.16
Add: Drawals during the year (Rs. lacs.) 0.00 0.00 0.00 0.00 0.00 0.00
Less: Repayment of Loan during the year (Rs. lacs.) 0.00 0.00 0.00 0.00 0.00 0.00
Closing Balance of loan (Rs. lacs.) 5155.16 5155.16 5155.16 5155.16 5155.16 5155.16
Average loan (Rs. lacs.) 5155.16 5155.16 5155.16 5155.16 5155.16 5155.16
Rate of Interest on loan % 10.63% 10.63% 10.63% 10.63% 10.63% 10.63%
Interest on loan (Rs. lacs.) 548.11 548.11 548.11 548.11 548.11 548.11
Penal Interest 46.62 54.40 62.16 69.93 77.70 85.47
Loan - Working Capital Loan 2014-15
Gross Loan - Opening (Rs. lacs.) 0.00 0.00 69535.72 69535.72 69535.72 69535.72
Add: Drawals during the year (Rs. lacs.) 0.00 69535.72 0.00 0.00 0.00 0.00
Less: Repayment of Loan during the year (Rs. lacs.) 0.00 0.00 0.00 0.00 0.00 0.00
Closing Balance of loan (Rs. lacs.) 0.00 69535.72 69535.72 69535.72 69535.72 69535.72
Average loan (Rs. lacs.) 0.00 34767.86 69535.72 69535.72 69535.72 69535.72
Rate of Interest on loan % 0.00 14.50% 14.50% 14.50% 14.50% 14.50%
Interest on loan (Rs. lacs.) 0.00 4120.18 10082.68 10082.68 10082.68 10082.68
Penal Interest 0.00 313.20 730.41 1147.63 1564.84
Loan - Working Capital Loan 2015-16
Gross Loan - Opening (Rs. lacs.) 0.00 0.00 0.00 75000.00 75000.00 75000.00
Add: Drawals during the year (Rs. lacs.) 0.00 0.00 75000.00 0.00 0.00 0.00
Less: Repayment of Loan during the year (Rs. lacs.) 0.00 0.00 0.00 0.00 0.00 0.00
Closing Balance of loan (Rs. lacs.) 0.00 0.00 75000.00 75000.00 75000.00 75000.00
Average loan (Rs. lacs.) 0.00 0.00 37500.00 75000.00 75000.00 75000.00
Rate of Interest on loan % 0.00 0.00 10.00% 10.00% 10.00% 10.00%
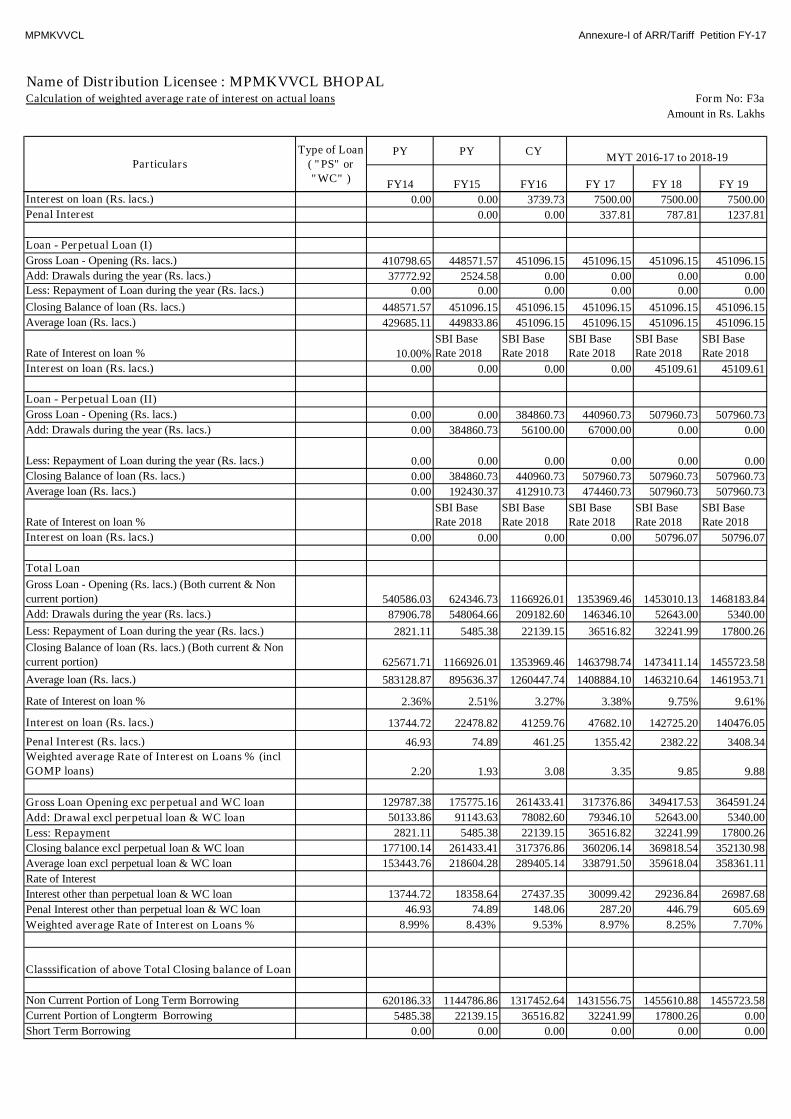
MPMKVVCL Annexure-I of ARR/Tariff Petition FY-17
Name of Distribution Licensee : MPMKVVCL BHOPALCalculation of weighted average rate of interest on actual loans Form No: F3a
Amount in Rs. Lakhs
PY PY CY
FY14 FY15 FY16 FY 17 FY 18 FY 19
MYT 2016-17 to 2018-19Type of Loan
( "PS" or
"WC" )
Particulars
Interest on loan (Rs. lacs.) 0.00 0.00 3739.73 7500.00 7500.00 7500.00
Penal Interest 0.00 0.00 337.81 787.81 1237.81
Loan - Perpetual Loan (I)
Gross Loan - Opening (Rs. lacs.) 410798.65 448571.57 451096.15 451096.15 451096.15 451096.15
Add: Drawals during the year (Rs. lacs.) 37772.92 2524.58 0.00 0.00 0.00 0.00Less: Repayment of Loan during the year (Rs. lacs.) 0.00 0.00 0.00 0.00 0.00 0.00
Closing Balance of loan (Rs. lacs.) 448571.57 451096.15 451096.15 451096.15 451096.15 451096.15
Average loan (Rs. lacs.) 429685.11 449833.86 451096.15 451096.15 451096.15 451096.15
Rate of Interest on loan % 10.00%
SBI BaseRate 2018
SBI BaseRate 2018
SBI BaseRate 2018
SBI BaseRate 2018
SBI BaseRate 2018
Interest on loan (Rs. lacs.) 0.00 0.00 0.00 0.00 45109.61 45109.61
Loan - Perpetual Loan (II)
Gross Loan - Opening (Rs. lacs.) 0.00 0.00 384860.73 440960.73 507960.73 507960.73
Add: Drawals during the year (Rs. lacs.) 0.00 384860.73 56100.00 67000.00 0.00 0.00
Less: Repayment of Loan during the year (Rs. lacs.) 0.00 0.00 0.00 0.00 0.00 0.00
Closing Balance of loan (Rs. lacs.) 0.00 384860.73 440960.73 507960.73 507960.73 507960.73
Average loan (Rs. lacs.) 0.00 192430.37 412910.73 474460.73 507960.73 507960.73
Rate of Interest on loan %
SBI Base
Rate 2018
SBI Base
Rate 2018
SBI Base
Rate 2018
SBI Base
Rate 2018
SBI Base
Rate 2018
Interest on loan (Rs. lacs.) 0.00 0.00 0.00 0.00 50796.07 50796.07
Total Loan
Gross Loan - Opening (Rs. lacs.) (Both current & Non
current portion) 540586.03 624346.73 1166926.01 1353969.46 1453010.13 1468183.84
Add: Drawals during the year (Rs. lacs.) 87906.78 548064.66 209182.60 146346.10 52643.00 5340.00
Less: Repayment of Loan during the year (Rs. lacs.) 2821.11 5485.38 22139.15 36516.82 32241.99 17800.26
Closing Balance of loan (Rs. lacs.) (Both current & Noncurrent portion) 625671.71 1166926.01 1353969.46 1463798.74 1473411.14 1455723.58
Average loan (Rs. lacs.) 583128.87 895636.37 1260447.74 1408884.10 1463210.64 1461953.71
Rate of Interest on loan % 2.36% 2.51% 3.27% 3.38% 9.75% 9.61%
Interest on loan (Rs. lacs.) 13744.72 22478.82 41259.76 47682.10 142725.20 140476.05
Penal Interest (Rs. lacs.) 46.93 74.89 461.25 1355.42 2382.22 3408.34Weighted average Rate of Interest on Loans % (inclGOMP loans) 2.20 1.93 3.08 3.35 9.85 9.88
Gross Loan Opening exc perpetual and WC loan 129787.38 175775.16 261433.41 317376.86 349417.53 364591.24
Add: Drawal excl perpetual loan & WC loan 50133.86 91143.63 78082.60 79346.10 52643.00 5340.00
Less: Repayment 2821.11 5485.38 22139.15 36516.82 32241.99 17800.26
Closing balance excl perpetual loan & WC loan 177100.14 261433.41 317376.86 360206.14 369818.54 352130.98
Average loan excl perpetual loan & WC loan 153443.76 218604.28 289405.14 338791.50 359618.04 358361.11
Rate of Interest
Interest other than perpetual loan & WC loan 13744.72 18358.64 27437.35 30099.42 29236.84 26987.68
Penal Interest other than perpetual loan & WC loan 46.93 74.89 148.06 287.20 446.79 605.69
Weighted average Rate of Interest on Loans % 8.99% 8.43% 9.53% 8.97% 8.25% 7.70%
Classsification of above Total Closing balance of Loan
Non Current Portion of Long Term Borrowing 620186.33 1144786.86 1317452.64 1431556.75 1455610.88 1455723.58
Current Portion of Longterm Borrowing 5485.38 22139.15 36516.82 32241.99 17800.26 0.00
Short Term Borrowing 0.00 0.00 0.00 0.00 0.00 0.00
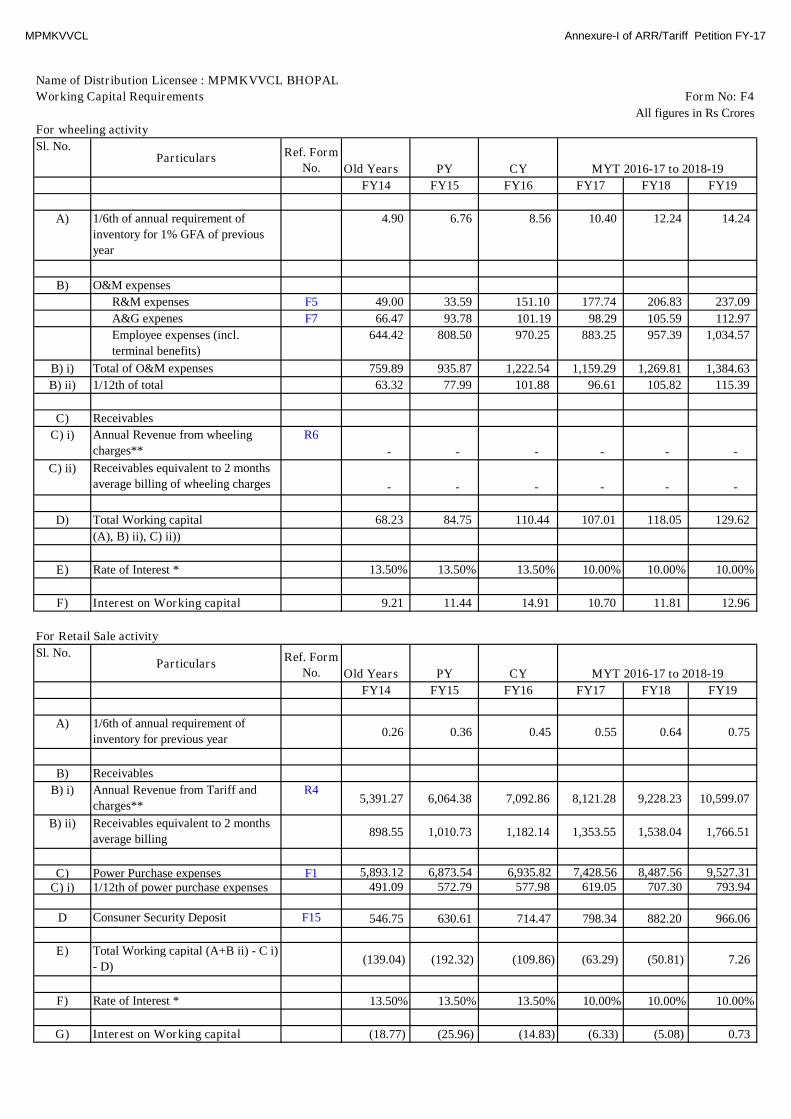
MPMKVVCL Annexure-I of ARR/Tariff Petition FY-17
Name of Distribution Licensee : MPMKVVCL BHOPAL
Working Capital Requirements Form No: F4
All figures in Rs Crores
For wheeling activity
Sl. No.Particulars Ref. Form
No. Old Years PY CY
FY14 FY15 FY16 FY17 FY18 FY19
A) 1/6th of annual requirement of
inventory for 1% GFA of previous
year
4.90 6.76 8.56 10.40 12.24 14.24
B) O&M expenses
R&M expenses F5 49.00 33.59 151.10 177.74 206.83 237.09
A&G expenes F7 66.47 93.78 101.19 98.29 105.59 112.97
Employee expenses (incl.
terminal benefits)
644.42 808.50 970.25 883.25 957.39 1,034.57
B) i) Total of O&M expenses 759.89 935.87 1,222.54 1,159.29 1,269.81 1,384.63
B) ii) 1/12th of total 63.32 77.99 101.88 96.61 105.82 115.39
C) Receivables
C) i) Annual Revenue from wheeling
charges**
R6
- - - - - -
C) ii) Receivables equivalent to 2 months
average billing of wheeling charges - - - - - -
D) Total Working capital 68.23 84.75 110.44 107.01 118.05 129.62
(A), B) ii), C) ii))
E) Rate of Interest * 13.50% 13.50% 13.50% 10.00% 10.00% 10.00%
F) Interest on Working capital 9.21 11.44 14.91 10.70 11.81 12.96
For Retail Sale activity
Sl. No.Particulars
Ref. Form
No. Old Years PY CY
FY14 FY15 FY16 FY17 FY18 FY19
A) 1/6th of annual requirement of
inventory for previous year0.26 0.36 0.45 0.55 0.64 0.75
B) Receivables
B) i) Annual Revenue from Tariff and
charges**
R45,391.27 6,064.38 7,092.86 8,121.28 9,228.23 10,599.07
B) ii) Receivables equivalent to 2 months
average billing898.55 1,010.73 1,182.14 1,353.55 1,538.04 1,766.51
C) Power Purchase expenses F1 5,893.12 6,873.54 6,935.82 7,428.56 8,487.56 9,527.31C) i) 1/12th of power purchase expenses 491.09 572.79 577.98 619.05 707.30 793.94
D Consuner Security Deposit F15 546.75 630.61 714.47 798.34 882.20 966.06
E) Total Working capital (A+B ii) - C i)
- D)(139.04) (192.32) (109.86) (63.29) (50.81) 7.26
F) Rate of Interest * 13.50% 13.50% 13.50% 10.00% 10.00% 10.00%
G) Interest on Working capital (18.77) (25.96) (14.83) (6.33) (5.08) 0.73
MYT 2016-17 to 2018-19
MYT 2016-17 to 2018-19
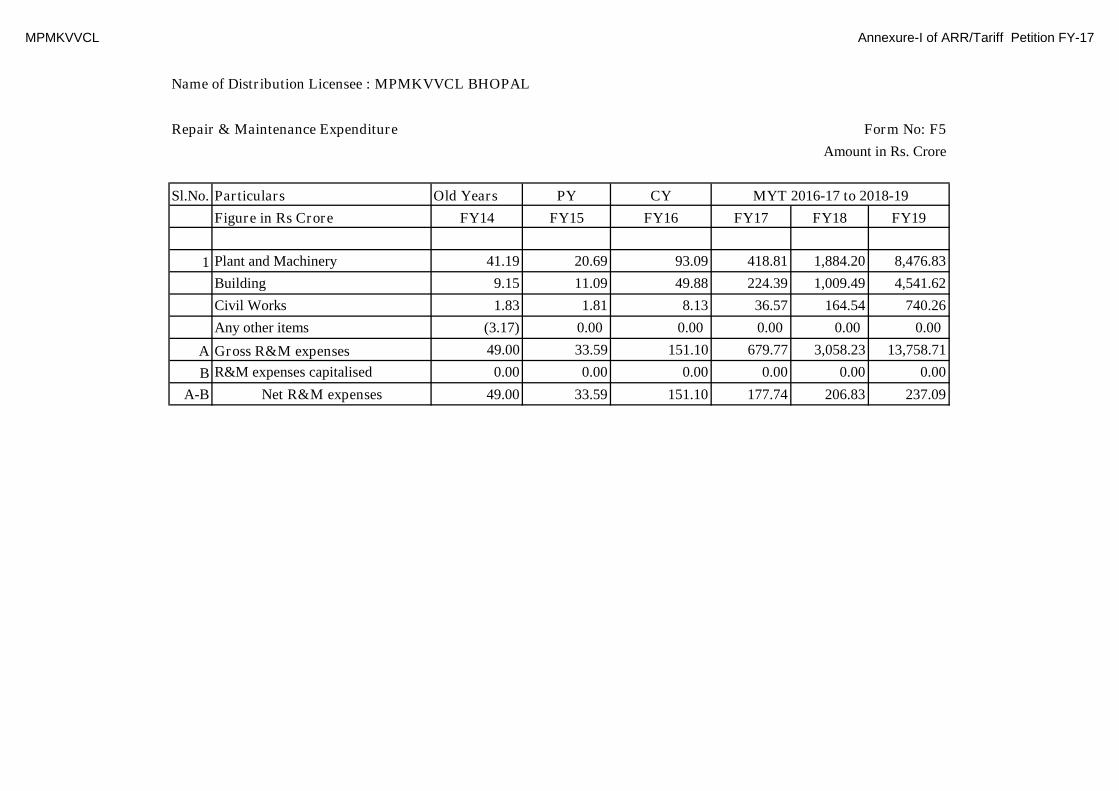
MPMKVVCL Annexure-I of ARR/Tariff Petition FY-17
Name of Distribution Licensee : MPMKVVCL BHOPAL
Repair & Maintenance Expenditure Form No: F5
Amount in Rs. Crore
Sl.No. Particulars Old Years PY CY
Figure in Rs Crore FY14 FY15 FY16 FY17 FY18 FY19
1 Plant and Machinery 41.19 20.69 93.09 418.81 1,884.20 8,476.83
Building 9.15 11.09 49.88 224.39 1,009.49 4,541.62
Civil Works 1.83 1.81 8.13 36.57 164.54 740.26
Any other items (3.17) 0.00 0.00 0.00 0.00 0.00
A Gross R&M expenses 49.00 33.59 151.10 679.77 3,058.23 13,758.71
B R&M expenses capitalised 0.00 0.00 0.00 0.00 0.00 0.00
A-B Net R&M expenses 49.00 33.59 151.10 177.74 206.83 237.09
MYT 2016-17 to 2018-19

MPMKVVCL Annexure-I of ARR/Tariff Petition FY-17
Name of Distribution Licensee : MPMKVVCL BHOPAL
Form No: F6
Amount in Rs. Crore
Particulars Old Years PY CY
FY14 FY15 FY16 FY17 FY18 FY19
A Employee StrengthWorking Strength At The Beginning Of The Year
Employee Category
1 class- I 197 190 199 178 165 155
2 class II 520 511 494 481 466 449
3 class III 7501 7650 7479 7153 6772 6416
4 class IV 6799 6903 6429 6091 5720 5292
Total 15017 15254 14601 13903 13123 12312
Sanctioned Strength At The Beginning Of The Year
Employee Category
1 class- I 281 281 281 281 281 281
2 class II 757 757 757 757 757 757
3 class III 8474 8474 8474 8474 8474 8474
4 class IV 6963 6963 6963 6963 6963 6963
Total 16475 16475 16475 16475 16475 16475
Old Years PY CY
FY14 FY15 FY16 FY17 FY18 FY19
B1
Employee Cost as per regulation (Excluding DA, Arrear,
Bonus/Ex-Gratia & Terminal Benefits)309.65 322.00 359.00 370.00 381.00
2 Additional Pay 19.46
3 Dearness Allowance 280.69 383.18 470.29 529.10 590.55
4 Other allowances and relief
5 Addl. Pay & C.Off Encashment
6 Sub-Total: (1 to 5) 609.80 705.18 829.29 899.10 971.55
7 Medical Expenses Reimbursement 0.80 0.88 0.97 1.07 1.17
MYT 2016-17 to 2018-19
MYT 2016-17 to 2018-19
Employee Cost and Provisions
Particulars

MPMKVVCL Annexure-I of ARR/Tariff Petition FY-17
Name of Distribution Licensee : MPMKVVCL BHOPAL
Form No: F6Employee Cost and Provisions
8 Travelling Allowance(Conveyance Allowance)
9 Leave Travel Assistance
10 Honorarium/Overtime
11
Incentives/Awards Including That In Partnership Project
(Specify Items)
12 Earned Leave Encashment 26.16 9.73 10.39 11.10 11.87
13 Tution Fee Re-Imbursement
14 D.L.I. Board'S Contribution
15 E.D.L.I. Administration Charges
16 E.S.I. Board'S Contribution
17 E.S.I. Administration Charges
18 Payment Under Workman'S Compensation 1.13 - - - -
19 Subsidised Electricity To Employees 4.50 4.96 5.45 6.00 6.60
20 Any Other Item 0.91 - - - -
21 Interim Relief / Wage Revision (10%)
22 Sub-Total (7 to 21) 33.50 15.57 16.81 18.16 19.64
23 Staff Welfare Expenses 2.83 3.12 3.43 3.77 4.15
C Apprentice And Other Training Expenses
D 1
Terminal Benefits provision as per Para 34.1 of the tariff
regulation read with para 2(ii) & 2(iii) of the terminal
benefit regulationa) Pension Provision 190.25 203.05 216.95 232.04
b) Gratuity Provision 24.83 26.50 28.32 30.29
c) Leave Encashment Povision
2
Terminal Benefits cash outflow -
Discom personnel retired after 31-05-2005 for services
rendered after 31-05-2005a) Pension Payments - - - -
b) Gratuity Payment - - - -
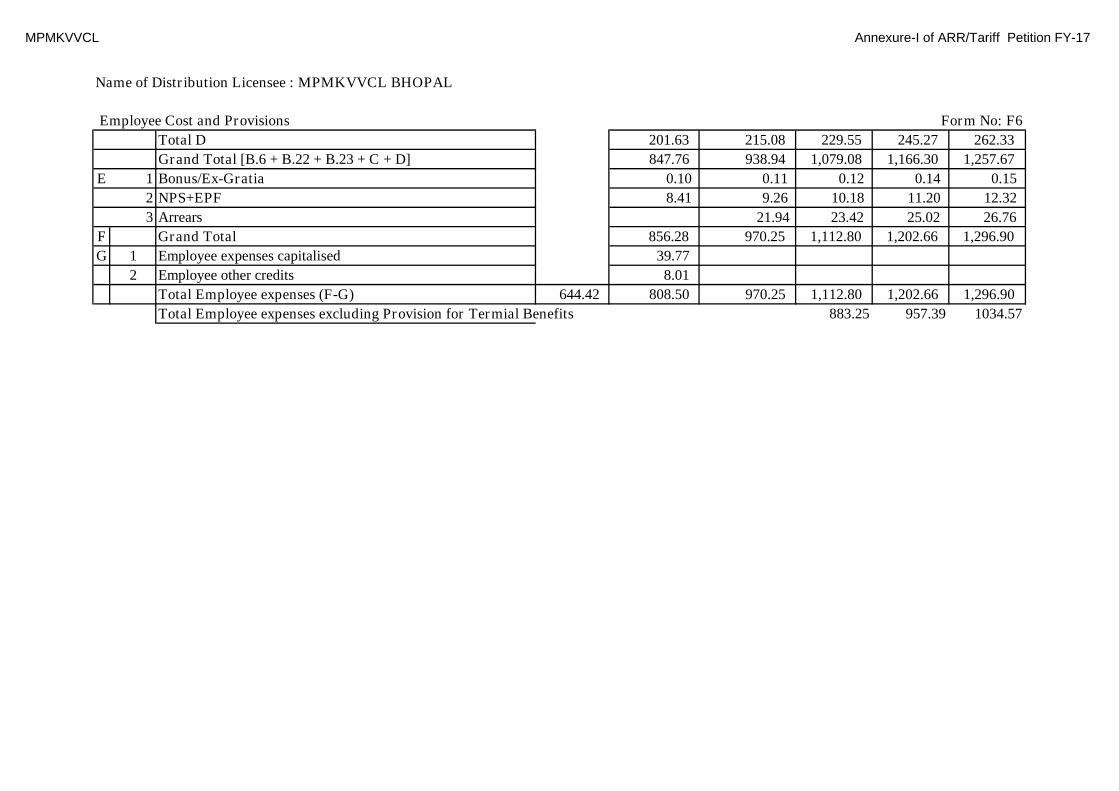
MPMKVVCL Annexure-I of ARR/Tariff Petition FY-17
Name of Distribution Licensee : MPMKVVCL BHOPAL
Form No: F6Employee Cost and Provisions
Total D 201.63 215.08 229.55 245.27 262.33
Grand Total [B.6 + B.22 + B.23 + C + D] 847.76 938.94 1,079.08 1,166.30 1,257.67
E 1 Bonus/Ex-Gratia 0.10 0.11 0.12 0.14 0.15
2 NPS+EPF 8.41 9.26 10.18 11.20 12.32
3 Arrears 21.94 23.42 25.02 26.76
F Grand Total 856.28 970.25 1,112.80 1,202.66 1,296.90
G 1 Employee expenses capitalised 39.77
2 Employee other credits 8.01
Total Employee expenses (F-G) 644.42 808.50 970.25 1,112.80 1,202.66 1,296.90
Total Employee expenses excluding Provision for Termial Benefits 883.25 957.39 1034.57

MPMKVVCL Annexure-I of ARR/Tariff Petition FY-17
Name of Distribution Licensee : MPMKVVCL BHOPAL
Adminstration & General Expenses Form No: F7Amount in Rs. Crore
S.No. Particulars Old Years PY CY
FY14 FY15 FY16 FY17 FY18 FY19
i) A&G Expenses as per regulation 91.89 99.18 96.00 103.00 110.00
ii) Rates & Taxes 1.36 1.52 1.73 1.97 2.26
ii) MPERC fee 0.54 0.49 0.56 0.62 0.71
Total A&G expenses 66.47 93.78 101.19 98.29 105.59 112.97
66.47
MYT 2016-17 to 2018-19

MPMKVVCL Annexure-I of ARR/Tariff Petition FY-17
Name of Distribution Licensee : MPMKVVCL BHOPAL
Return on Equity Form No: F8
All figures in Rs Crores
Old Years PY CY
Sl.No. Particulars FY14 FY15 FY16 FY17 FY18 FY19
A Gross Fixed Assets at the beginning of year (net of consumer contributions) 4,268.40 5,404.73 6,569.44 7,727.95 8,992.54 10,308.41
A1 Opening balance of GFA identified as funded through equity 1,280.52 1,621.42 1,970.83 2,318.38 2,697.76 3,092.52
A2 Opening balance of GFA identified as funded through debt 2,987.88 3,783.31 4,598.61 5,409.56 6,294.78 7,215.89
BProposed capitalisation of assets as per the investment plan (net of consumer
contribution) 955.25 993.90 1,158.51 1,264.59 1,315.87 1,120.46
B1 Proportion of caplitalised assets funded out of equity, internal reserves 228.68 202.80 508.90 860.49 597.39 366.15
B2 Balance Proportion of capitalised assets funded out of project loans (B - B1) 726.57 791.10 649.61 404.10 718.48 754.31
C1 Normative additional equity (30% of B) 286.58 298.17 347.55 379.38 394.76 336.14
C2 Normative additional debt (70% of B) 668.68 695.73 810.96 885.21 921.11 784.32
D1 Excess / shortfall of additional equity over normative (B1-C1) (57.90) (95.37) 161.35 481.11 202.63 30.01
D2 Excess / shortfall of additional debt over normative (B2-C2) 57.90 95.37 (161.35) (481.11) (202.63) (30.01)
E Equity eligible for Return (A1+(C1/2)) OR (A1+(B1/2)), whichever is lower 1,394.86 1,722.82 2,144.61 2,508.07 2,895.14 3,260.59
Return on Equity (16% on E) 223.18 275.65 343.14 401.29 463.22 521.69
Interest at weighted average rate of loan portfolio on additional equity, if D1 > 0*
MYT 2016-17 to 2018-19
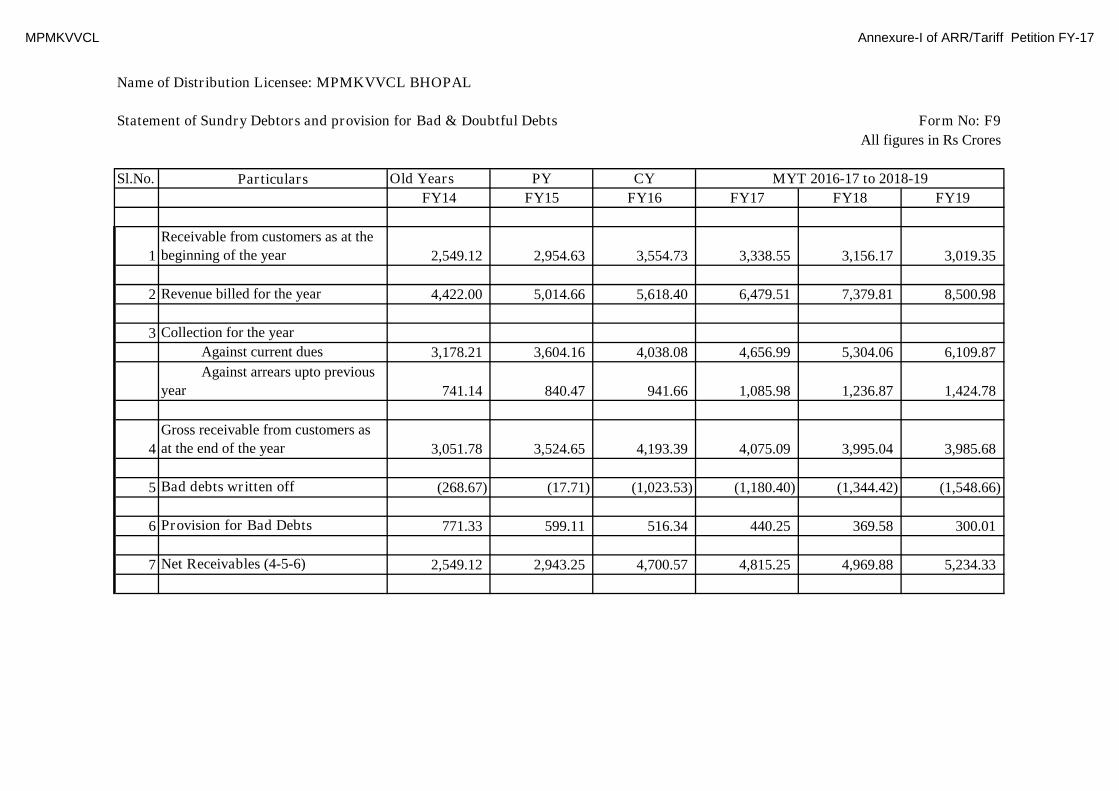
MPMKVVCL Annexure-I of ARR/Tariff Petition FY-17
Name of Distribution Licensee: MPMKVVCL BHOPAL
Statement of Sundry Debtors and provision for Bad & Doubtful Debts Form No: F9
All figures in Rs Crores
Sl.No. Particulars Old Years PY CY
FY14 FY15 FY16 FY17 FY18 FY19
1
Receivable from customers as at the
beginning of the year 2,549.12 2,954.63 3,554.73 3,338.55 3,156.17 3,019.35
2 Revenue billed for the year 4,422.00 5,014.66 5,618.40 6,479.51 7,379.81 8,500.98
3 Collection for the year
Against current dues 3,178.21 3,604.16 4,038.08 4,656.99 5,304.06 6,109.87
Against arrears upto previous
year 741.14 840.47 941.66 1,085.98 1,236.87 1,424.78
4
Gross receivable from customers as
at the end of the year 3,051.78 3,524.65 4,193.39 4,075.09 3,995.04 3,985.68
5 Bad debts written off (268.67) (17.71) (1,023.53) (1,180.40) (1,344.42) (1,548.66)
6 Provision for Bad Debts 771.33 599.11 516.34 440.25 369.58 300.01
7 Net Receivables (4-5-6) 2,549.12 2,943.25 4,700.57 4,815.25 4,969.88 5,234.33
MYT 2016-17 to 2018-19
MPMKVVCL Annexure-I of ARR/Tariff Petition FY-17
Name of Distribution Licensee : MPMKVVCL BHOPAL
Extraordinary Items Form No: F10
Amount in Rs. Crore
Sl.No. Particulars Old Years PY CY
FY14 FY15 FY16 FY17 FY18 FY19
1.00 Extraordinary Credits(incl.
subsidies against losses due to natural disasters)
TOTAL CREDITS
2.00 Extraordinary Debits (incl.
subsidies against losses due to natural disasters)
TOTAL DEBITS
Grand Total (1-2)
MYT 2016-17 to 2018-19
NIL

MPMKVVCL Annexure-I of ARR/Tariff Petition FY-17
Name of Distribution Licensee : MPMKVVCL BHOPAL
Net Prior Period Expenses / Income Form F 11
Amount in Rs. Crore
Sl.No. Particulars Old Years PY CY
FY14 FY15 FY16 FY17 FY18 FY19
A Income relating to previous years:
1 Interest income for prior periods 64.33 - - - - -
2 Income Tax prior period - - - - - -
3 Excess Provision for Depreciation - - - - - -
4 Excess Provision for Interest and Fin. Charges - - - - - -
5 Receipts from consumers - - - - - -
6 Other Excess Provision - - - - - -
7 Other Income 11.35 - - - - -
Sub-Total A 75.67 0.00 0.00 0.00 0.00 0.00
B Expenditure relating to previous years
1 Power Purchase 370.90 - - - - -
2 Operating Expenses - - - - - -
4 Employee Cost 238.72 - - - - -
5 Depreciation - - - - - -
6 Interest and Finance Charges - - - - - -
7 Admn. Expenses - - - - - -
8 Withdrawal of Revenue Demand - - - - - -
9 Material Related - - - - - -
10 Lease/hire purchase charges in assets - - - - - -
11 Others 25.05 - - - - -
Sub-Total B 634.67 - - - - -
Net prior period Credit/(Charges) : A-B (559.00) 0.00 0.00 0.00 0.00 0.00
MYT 2016-17 to 2018-19

MPMKVVCL Annexure-I of ARR/Tariff Petition FY-17
Name of Distribution Licensee : MPMKVVCL BHOPAL
Other expenses / debits / write-offs Form No: F12
All figures in Rs Crores
Sl.No. Particulars Old Years PY CY
FY14 FY15 FY16 FY17 FY18 FY19
1 Material Cost Variance - - - - - -
2 Miscellaneous Losses And Write Offs - - - - - -
3 Bad Debt Written Off/Provided For 502.05 60.64 70.93 81.21 92.28 105.99
4 Cost Of Trading & Manufacturing Activities - - - - - -
5 Net Prior period Charges 559.00 - - - - -
6 Sub-Total 1,061.05 60.64 70.93 81.21 92.28 105.99
7 Less Chargeable To Capital Expense - - - - - -
- - - - - -
Net Chargeable To Revenue 1,061.05 60.64 70.93 81.21 92.28 105.99
Net Chargeable To Revenue (as per Tariff
Order 2015-162.00 5.00 5.00 5.00
MYT 2016-17 to 2018-19
MPMKVVCL Annexure-I of ARR/Tariff Petition FY-17
Name of Distribution Licensee : MPMKVVCL BHOPAL
Income Tax Provisions Form No: F13
All figures in Rs Crores
Sl.
No.Particulars Old Years PY CY
In Rs Crores FY14 FY15 FY16 FY17 FY18 FY19
1 Provision Made/Proposed For The Year
2 As Per Return Filed For The Years
3 As Assessed For The Years
4 Credit/Debit Of Assessment Year(S) (Give Details)
Total
MYT 2016-17 to 2018-19
NIL

MPMKVVCL Annexure-I of ARR/Tariff Petition FY-17
Name of Distribution Licensee : MPMKVVCL BHOPAL
Income from investments and other non-tariff income Form No: F14
For retail supply and wheeling activity
Particulars Account Code Old Years PY CY
Figure in Rs Crore FY14 FY15 FY16 FY17 FY18 FY19
A Income from Investment, Fixed & Call Deposits
1 Interest Income from Investments 62.200 - - - - - -
2 Interest on fixed deposits 62.200 36.59 21.57 29.08 25.33 27.21 26.27
3 Interest from Banks other than Fixed Deposits 62.200 0.57 0.36 0.46 0.41 0.44 0.42
4 Interest on (any other items) 62.200 - - - - - -
Sub-Total 37.16 21.93 29.55 25.74 27.64 26.69
B Other Non Tariff Income
1 Interest on loans and Advances to staff 62.200 0.39 0.15 0.27 0.21 0.24 0.23
2 Interest on Loans and Advances to Licensee 62.200 - - - - - -
3 Interest on Loans and Advances to Lessors 62.200 - - - - - -
4 Interest on Advances to Suppliers / Contractors 62.200 11.87 8.56 10.21 9.39 9.80 9.60
7 Income/Fee/Collection against staff welfare activities 62.200 - - - - - -
8 Miscellaneous receipts 62.200 168.19 43.51 66.20 73.33 87.97 67.67
9 Meter Rent 62.200 82.17 77.68 79.93 78.81 79.37 79.09
10 Recovery from theft of energy 62.200 0.53 0.56 0.54 0.55 0.55 0.55
11 Surcharge and Additional Surcharge 62.200 - - - - - -
12 Income from Wheeling Charges 62.200 0.71 0.67 0.67 0.67 0.67 0.67
13 Misc. charges from consumers 62.200 3.77 2.62 3.19 2.91 3.05 2.98
14 Delayed payment surcharge from Retail Sale consumers 62.200 187.94 213.12 234.62 211.89 219.88 222.13
15 Any other subsidies / grants other than those u/s 65 62.200 - - - - - -
Sub-Total 455.56 346.88 395.64 377.76 401.54 382.91
Total (A+B) 492.71 368.81 425.19 403.50 429.18 409.60
Other Non tariff income net-off Delayed Payment Surcharge 304.78 155.69 190.57 191.60 209.30 187.47
MYT 2016-17 to 2018-19
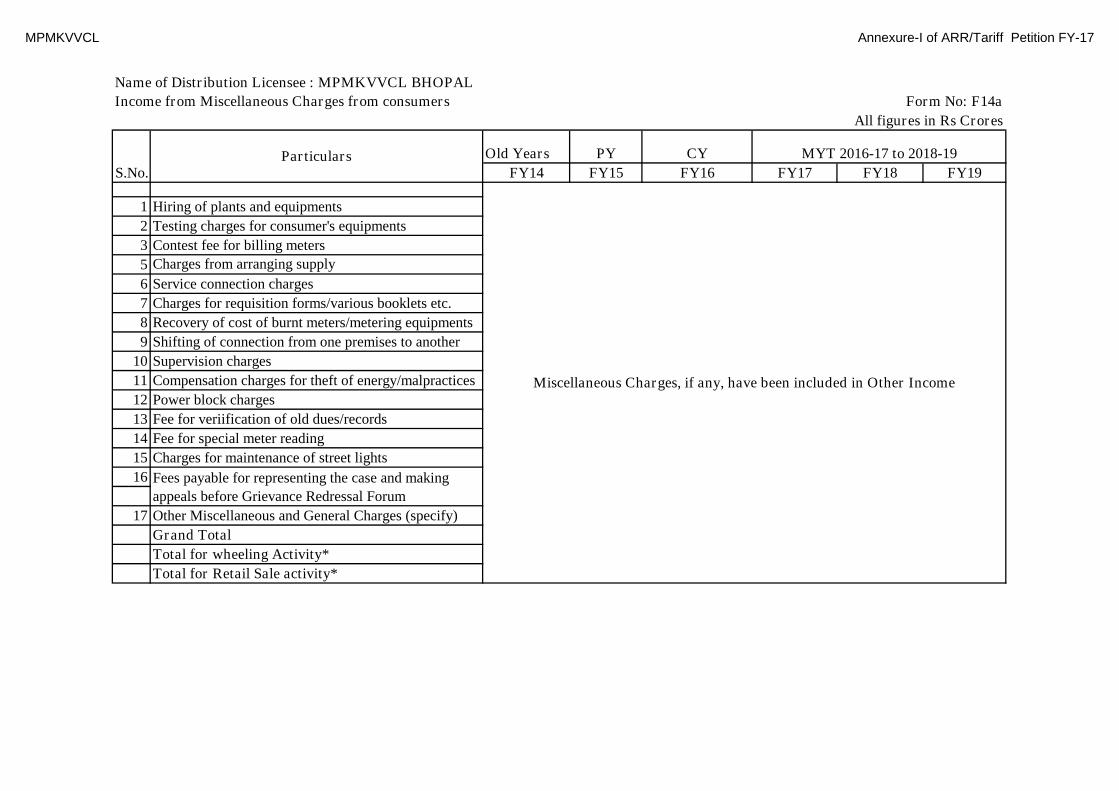
MPMKVVCL Annexure-I of ARR/Tariff Petition FY-17
Name of Distribution Licensee : MPMKVVCL BHOPAL
Income from Miscellaneous Charges from consumers Form No: F14a
All figures in Rs Crores
Old Years PY CY
FY14 FY15 FY16 FY17 FY18 FY19
1 Hiring of plants and equipments
2 Testing charges for consumer's equipments
3 Contest fee for billing meters
5 Charges from arranging supply
6 Service connection charges
7 Charges for requisition forms/various booklets etc.
8 Recovery of cost of burnt meters/metering equipments
9 Shifting of connection from one premises to another
10 Supervision charges
11 Compensation charges for theft of energy/malpractices
12 Power block charges
13 Fee for veriification of old dues/records
14 Fee for special meter reading
15 Charges for maintenance of street lights
16
17 Other Miscellaneous and General Charges (specify)
Grand Total
Total for wheeling Activity*
Total for Retail Sale activity*
MYT 2016-17 to 2018-19
Miscellaneous Charges, if any, have been included in Other Income
Fees payable for representing the case and making
appeals before Grievance Redressal Forum
S.No.Particulars
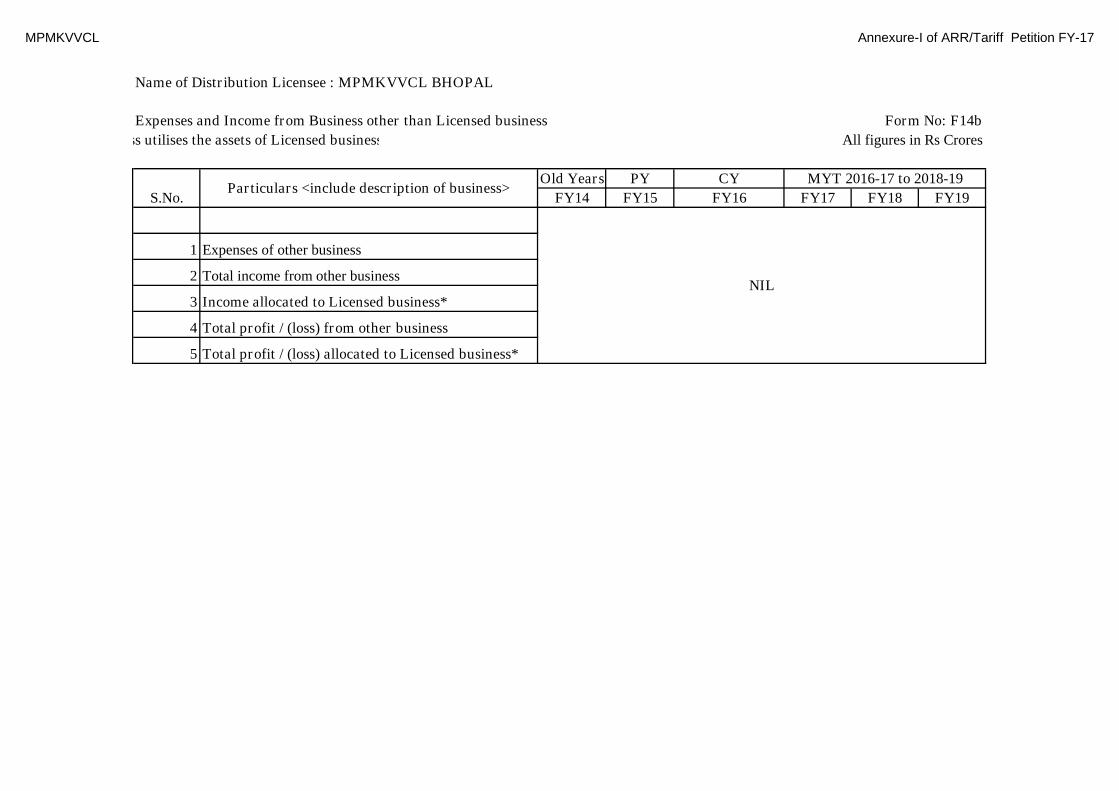
MPMKVVCL Annexure-I of ARR/Tariff Petition FY-17
Name of Distribution Licensee : MPMKVVCL BHOPAL
Expenses and Income from Business other than Licensed business Form No: F14b
(to be filled if other business utilises the assets of Licensed business) All figures in Rs Crores
Old Years PY CY
FY14 FY15 FY16 FY17 FY18 FY19
1 Expenses of other business
2 Total income from other business
3 Income allocated to Licensed business*
4 Total profit / (loss) from other business
5 Total profit / (loss) allocated to Licensed business*
MYT 2016-17 to 2018-19
NIL
S.No.Particulars <include description of business>

MPMKVVCL Annexure-I of ARR/Tariff Petition FY-17
Name of Distribution Licensee : MPMKVVCL BHOPAL
Consumer Security Deposit Form No: F15
Amount in Rs. Crore
Old Years PY CY
FY14 FY15 FY16 FY17 FY18 FY19
LT consumers
HT consumers
TOTAL LT + HT 48.00 546.75 630.61 714.47 798.34 882.20 966.06
Account
CodeCategory
MYT 2016-17 to 2018-19

MPMKVVCL Annexure-I of ARR/Tariff Petition FY-17
Name of Distribution Licensee : MPMKVVCL BHOPAL
Lease Rental Form F 16
All figures in Rs Crores
Old Years PY CY
FY14 FY15 FY16 FY17 FY18 FY19
Wheeling activity
Retail sale activity
MYT 2016-17 to 2018-19
NIL
Sl.No. Asset Description

MPMKVVCL Annexure-I of ARR/Tariff Petition FY-17
Name of Distribution Licensee : MPMKVVCL BHOPAL
T&D Losses in LT and HT system Form No: P1
All Figures in MU
Particulars Old Years PY CYFY14 FY15 FY16 FY17 FY18 FY19
A Losses in EHT System (400 kV, 220 kV, 132 kV & 66 kV)1 Scheduled Energy at Ex-Bus 15,927.15 18,808.50 17,265.70 19,598.05 21,931.76 24,864.512 Scheduled Energy at Discom Periphery 15,025.61 17,898.00 16,381.47 18,575.80 20,780.93 23,558.283 Energy Lost in PGCIL+MP Transco system (2-1) 901.54 910.50 884.23 1,022.25 1,150.83 1,306.234 Total Loss in the Transmission system [3/(2)*100]% 5.66% 4.84% 5.12% 5.22% 5.25% 5.25%5 Actual Energy Drawl at Discom periphery (at Interface point) 15,025.61 17,898.00 16,381.47 18,575.80 20,780.93 23,558.286 UI (2-3) - - - - - -7 Actual Energy input at Discom periphery (i.e. at outgoing feeders of EHV S/S)15,025.61 17,898.00 16,381.47 18,575.80 20,780.93 23,558.288 Energy Lost between interface point and outgoing feeders of EHV s/s [i.e. Bus loss = (5-7)]- - - - - -9 Total Loss in the Bus of Transmission system [8/(5)*100]% 0.00% 0.00% 0.00% 0.00% 0.00% 0.00%
10 Direct Injection at 33 kV which is not included in scheduled energy - - - - - -11 Direct Injection at 11 kV which is not included in scheduled energy - - - - - -12 Total Energy Input at Discom Periphery (7+10+11) 15,025.61 17,898.00 16,381.47 18,575.80 20,780.93 23,558.2813 Energy sold at this voltage level 1,505.97 1,709.15 2,004.87 2,338.51 2,729.18 3,186.8114 Energy transmitted to the 33 kV level 13,514.23 16,182.37 14,370.85 16,230.80 18,044.53 20,363.3215 Energy transmitted to the11 kV level - - - - - -16 Energy Lost in EHV feeders feeding EHV Consumers (12-13-14-15) 5.41 6.48 5.75 6.49 7.22 8.1517 Total Loss in EHV feeders feeding EHV Consumers 0.04% 0.04% 0.04% 0.04% 0.04% 0.04%
B System Losses At 33 KV1 Energy injection at 33 kV level from MP Transco EHV s/s 13,514.23 16,182.37 14,370.85 16,230.80 18,044.53 20,363.322 Direct Injection at 33 kV which is not included in scheduled energy - - - - - -3 Total Energy input at 33kV Voltage level (1+2) 13,514.23 16,182.37 14,370.85 16,230.80 18,044.53 20,363.324 Energy sold at this voltage level 1,662.92 1,652.98 1,752.22 1,859.69 1,976.41 2,103.375 Energy transmitted to the 11 kV voltage level 11,256.69 13,857.82 11,743.45 13,382.65 14,969.21 17,019.826 Energy Lost (3-4-5) 594.63 671.57 875.18 988.46 1,098.91 1,240.137 Total Loss in the system [6/(3)*100]% 4.40% 4.15% 6.09% 6.09% 6.09% 6.09%
C Losses At 11 KV +LT1 Energy received into the system from 33 kV system 11,256.69 13,857.82 11,743.45 13,382.65 14,969.21 17,019.822 Direct Energy injection at 11 kV level from MP Transco EHV s/s3 Direct Injection at 11 kV which is not included in scheduled energy4 Total Energy input at 11kV Voltage level (1+2+3) 11,256.69 13,857.82 11,743.45 13,382.65 14,969.21 17,019.825 Energy sold at 11 kV voltage level 153.06 173.17 189.78 208.20 229.02 252.82
MYT 2016-17 to 2018-19

MPMKVVCL Annexure-I of ARR/Tariff Petition FY-17
Name of Distribution Licensee : MPMKVVCL BHOPAL
T&D Losses in LT and HT system Form No: P1
All Figures in MU
Particulars Old Years PY CYFY14 FY15 FY16 FY17 FY18 FY19
MYT 2016-17 to 2018-19
6 Energy sold at LT voltage level 8,235.54 9,814.31 9,316.95 10,623.03 12,095.83 13,999.167 Total Energy sold at 11kV + LT level (5+6) 8,388.60 9,987.48 9,506.73 10,831.23 12,324.85 14,251.97
Energy transmitted to the next (lower) voltage level - - - - - -8 Energy Lost (4-7) 2,868.09 3,870.34 2,236.72 2,551.41 2,644.36 2,767.859 Total Loss in 11kV + LT system [8/(4)*100]% 25.48% 27.93% 19.05% 19.07% 17.67% 16.26%
D LT System Losses1 Energy received into the system2 Energy sold at this voltage level
3 Energy Lost4 Total Loss in the system (3/1)*100%
E1 Energy In (A12) 15,025.61 17,898.00 16,381.47 18,575.80 20,780.93 23,558.282 Energy Out (A13+B4+C7) 11,557.49 13,349.61 13,263.82 15,029.44 17,030.44 19,542.163 Total Distribution Losses [(1-2)/(1)*100]% 23.00% 25.40% 19.00% 19.00% 18.00% 17.00%
F Overall Losses1 Total Energy Lost (A3+A8+A16+B6+C8) 4,369.66 5,458.89 4,001.88 4,568.61 4,901.32 5,322.352 Energy Out (A13+B4+C7) 11,557.49 13,349.61 13,263.82 15,029.44 17,030.44 19,542.163 Total T&D Loss [(1)/(1+2)*100]% 27.44% 29.02% 23.18% 23.31% 22.35% 21.41%
Distribution system losses
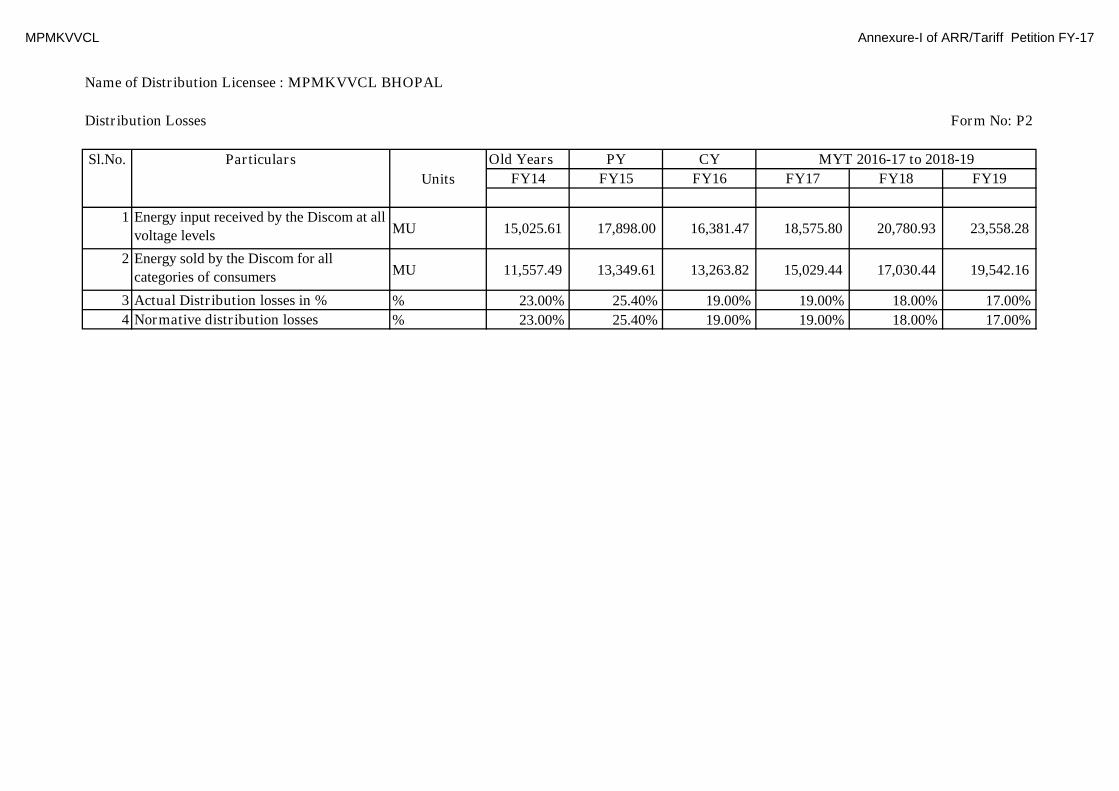
MPMKVVCL Annexure-I of ARR/Tariff Petition FY-17
Name of Distribution Licensee : MPMKVVCL BHOPAL
Distribution Losses Form No: P2
Sl.No. Particulars Old Years PY CY
Units FY14 FY15 FY16 FY17 FY18 FY19
1 Energy input received by the Discom at all
voltage levels MU 15,025.61 17,898.00 16,381.47 18,575.80 20,780.93 23,558.28
2 Energy sold by the Discom for all
categories of consumers MU 11,557.49 13,349.61 13,263.82 15,029.44 17,030.44 19,542.16
3 Actual Distribution losses in % % 23.00% 25.40% 19.00% 19.00% 18.00% 17.00%
4 Normative distribution losses % 23.00% 25.40% 19.00% 19.00% 18.00% 17.00%
MYT 2016-17 to 2018-19

MPMKVVCL Annexure-I of ARR/Tariff Petition FY-17
MPMKVVCL BHOPAL
Physical statistics of the network
At the start ofyear
Additionsduring the year
Withdrawal fromservice
At the end ofyear
Additionsduring theyear
Withdrawalfrom service
At the end ofyear
Additionsduring the year
Withdrawalfrom service
1.00Length of lines (ckt-km)- 33kV 12,662.50 1,260.00 13,923 780 14,703 1,112
- 11kV 82,000.01 10,133.00 92,133 6,760 98,893 7,845
- LT 107,346.75 1,245.00 108,592 946 109,536 4,268
Total 202,009.26 12,638.00 214,647 8,486 223,133 13,225
2.00Number of 33/11kVsubstations
864.00 102.00 966 60 1,026 70
3.00No. of PowerTransformers
1,546.00 190.00 1,736 110 1,846 122
Total MVA capacity ofpower transformers
6,983.00 917.00 7,900 597 8,498 738
3.00 Number of DistributionTransformers
125,313.00 17,031.00 142,344 16,271 158,615 17,381
Total MVA capacity ofDistribution Trfs.
8,999.00 1,100.00 10,099 1,076 11,176 1,095
FY14
Sl.No Particulars
FY13 FY15 FY16

MPMKVVCL Annexure-I of ARR/Tariff Petition FY-17
MPMKVVCL BHOPAL
Physical statistics of the network
1.00Length of lines (ckt-km)- 33kV
- 11kV
- LT
Total
2.00Number of 33/11kVsubstations
3.00No. of PowerTransformers
Total MVA capacity ofpower transformers
3.00 Number of DistributionTransformers
Total MVA capacity ofDistribution Trfs.
Sl.No Particulars
Form P3
At the end ofyear
Additionsduring theyear
Withdrawalfrom service At the end of year
Additionsduring theyear
Withdrawal fromservice
At the end ofyear
Additionsduring theyear
Withdrawal fromservice
At the end ofyear
15,815 1,474 17,289 569 17,858 481 18,339
106,738 15,765 122,503 16,372 138,875 8,427 147,302
113,804 8,462 122,266 6,866 129,132 1,300 130,432
236,358 25,701 262,059 23,807 285,866 10,208 296,074
1,096 126 1,222 120 1,342 108 1,450
1,968 195 2,163 125 2,288 108 2,396
9,236 1,127 10,363 658 11,021 540 11,561
175,996 32,659 208,655 31,513 240,168 14,990 255,158
12,271 2,058 14,329 1,985 16,314 944 17,258
FY18 FY19FY17

MPMKVVCL Annexure-I of ARR/Tariff Petition FY-17
Name of Distribution Licensee : MPMKVVCL BHOPAL
Monthly Projection of Sales Form No: R1
Month MU MU MU MU MU MU
FY 14 FY 15 FY 16 FY 17 FY 18 FY 19
April 809 1,068 1,061 1,202 1,362 1,563
May 925 1,068 1,061 1,202 1,362 1,563
June 925 1,068 1,061 1,052 1,362 1,563
July 925 1,068 1,061 1,052 1,362 1,563
August 925 1,068 1,061 1,127 1,362 1,563
September 925 1,068 1,061 1,278 1,362 1,563
October 925 1,068 1,061 1,503 1,533 1,759
November 1,040 1,201 1,194 1,428 1,533 1,759
December 1,156 1,201 1,194 1,278 1,533 1,759
January 1,156 1,201 1,194 1,353 1,533 1,759
February 925 1,201 1,194 1,353 1,362 1,563
March 925 1,068 1,061 1,202 1,362 1,563
Total 11,557 13,350 13,264 15,029 17,030 19,542
Monthly Projection of Losses - excluding MPTransCo Losses
Month % % % % % %
FY 14 FY 15 FY 16 FY 17 FY 18 FY 19
April 22.92% 29.00% 19.42% 19.42% 18.42% 17.42%
May 22.13% 29.77% 18.62% 18.62% 17.62% 16.62%
June 21.54% 25.03% 17.97% 17.97% 16.97% 15.97%
July 21.38% 23.59% 17.24% 17.24% 16.24% 15.24%
August 22.98% 26.16% 18.96% 18.96% 17.96% 16.96%
September 22.93% 29.11% 19.53% 19.53% 18.53% 17.53%
October 24.19% 24.59% 20.25% 20.25% 19.25% 18.25%
November 24.42% 25.82% 20.05% 20.05% 19.05% 18.05%
December 23.98% 23.03% 19.25% 19.25% 18.25% 17.25%
January 24.63% 23.59% 20.18% 20.18% 19.18% 18.18%
February 23.06% 20.62% 18.64% 18.64% 17.64% 16.64%
March 21.83% 24.54% 17.89% 17.89% 16.89% 15.89%
Total 23.00% 25.40% 19.00% 19.00% 18.00% 17.00%
Monthly Projection of Requirement at State Boundary
MU MU MU MU MU MU
April 1,084 1,551 1,356 1,536 1,719 1,949
May 1,226 1,568 1,342 1,521 1,703 1,930
June 1,217 1,469 1,332 1,321 1,689 1,916
July 1,214 1,441 1,320 1,309 1,675 1,899
August 1,240 1,491 1,348 1,432 1,710 1,938
September 1,239 1,553 1,358 1,635 1,722 1,952
October 1,259 1,460 1,370 1,940 1,954 2,215
November 1,421 1,670 1,537 1,839 1,949 2,210
December 1,570 1,609 1,522 1,629 1,930 2,188
January 1,583 1,621 1,540 1,745 1,953 2,213
February 1,241 1,560 1,511 1,712 1,703 1,931
March 1,221 1,459 1,331 1,508 1,688 1,914
Total 15,516 18,452 16,866 19,126 21,396 24,256
FY 16 FY 16Month FY 14 FY 15 FY 16 FY 16

MPMKVVCL Annexure-I of ARR/Tariff Petition FY-17
Name of Distribution Licensee : MPMKVVCL BHOPAL
Summary of Actual / estimated Revenue from sale of power Form R2
Rs in Crore
Particulars Old Years PY CY
FY14 FY15 FY16 FY17 FY18 FY19
LOW TENSION 3085.23 3958.96 4604.77 5385.72 6156.53 7169.69
LV 1: DOMESTIC 1348.69 1670.42 1688.25 2085.75 2393.73 2828.30
LV 2: NON-DOMESTIC 462.17 514.88 587.77 668.47 765.13 876.81
LV 3: PUBLIC WATER WORKS AND STREET LIGHTS 77.21 135.53 159.50 186.36 221.40 267.96
LV 4: LT INDUSTRY 153.78 157.71 188.90 208.52 223.89 247.74
LV 5: IRRIGATION PUMP FOR AGRICULTURE 1043.38 1480.41 1980.35 2236.62 2552.39 2948.87
HIGH TENSION 1966.27 2105.42 2488.10 2735.55 3071.70 3429.38
HV 1: RAILWAY TRACTION 507.40 539.08 655.22 727.90 828.25 934.68
HV 2: COAL MINES 27.61 25.45 26.82 27.03 27.26 27.48
HV-3: INDUSTRIAL AND NON-INDUSTRIAL 1286.62 1388.68 1641.88 1807.44 2029.67 2270.73
HV-4: SEASONAL 1.79 1.53 1.27 1.35 1.46 1.57
HV-5: HT IRRIGATION AND WATER WORKS 69.18 72.27 78.05 81.11 86.63 88.76
HV 6: BULK RESIDENTIAL USERS 73.66 78.38 84.72 90.58 98.30 106.02
HV 7: BULK SUPPLY TO EXEMPTEES 0.00 0.04 0.14 0.14 0.14 0.14
GRAND TOTAL HT + LT 5051.49 6064.38 7092.86 8121.28 9228.23 10599.07
MYT 2016-17 to 2018-19

MPMKVVCL Annexure-I of ARR/Tariff Petition FY-17
Name of Distribution Licensee : MPMKVVCL BHOPAL
Revenue from Current Tariff & Charges for LT consumers in urban area
Form R3
Unit of
measuremPY CY
FY15 FY16 FY17 FY18 FY19
LOW TENSION
LV 1: DOMESTIC
Metered
Basic Rate
0 to 30 Units Consumers Nos. 208627 221067 234307 248278 263083
Connected Load KW 247693 264533 280375 297094 314809
Sales MU 105 77 84 89 95
Revenue from Fixed Charges Rs. Crs.
Revenue from Variable Charges Rs. Crs.
Total Revenue Rs. Crs. 59 22 24 26 27
Upto 50 units
Consumers Nos. 128472 136133 144285 152889 162006
Connected Load KW 149313 159464 169014 179093 189772
Sales MU 47 78 87 92 97
Revenue from Fixed Charges Rs. Crs.
Revenue from Variable Charges Rs. Crs.
Total Revenue Rs. Crs. 21 33 36 39 41
51 to 100 units
Consumers Nos. 343912 327977 347619 368347 390311
Connected Load KW 432386 461782 489438 518623 549547
Sales MU 285 354 409 442 468
Revenue from Fixed Charges Rs. Crs.
Revenue from Variable Charges Rs. Crs.
Total Revenue Rs. Crs. 130 158 181 196 207
101 to 300 units
Consumers Nos. 380854 343029 363573 385252 408224
Particulars Parameter MYT 2016-17 to 2018-19

MPMKVVCL Annexure-I of ARR/Tariff Petition FY-17
Name of Distribution Licensee : MPMKVVCL BHOPAL
Revenue from Current Tariff & Charges for LT consumers in urban area
Form R3
Unit of
measuremPY CY
FY15 FY16 FY17 FY18 FY19
Particulars Parameter MYT 2016-17 to 2018-19
Connected Load KW 576924 616147 653048 691988 733250
Sales MU 678 967 1034 1147 1323
Revenue from Fixed Charges Rs. Crs.
Revenue from Variable Charges Rs. Crs.
Total Revenue Rs. Crs. 365 513 584 650 757
Above 300 units
Consumers Nos. 132296 237161 251365 266353 268123
Connected Load KW 335806 358636 380115 402780 405458
Sales MU 1040 854 909 959 970
Revenue from Fixed Charges Rs. Crs.
Revenue from Variable Charges Rs. Crs.
Total Revenue Rs. Crs. 624 433 531 561 567
Consumers Nos. 0 0 0 0 0
Connected Load KW 0 0 0 0 0
Sales MU 0 0 0 0 0
Revenue from Fixed Charges Rs. Crs.
Revenue from Variable Charges Rs. Crs.
Total Revenue Rs. Crs. 0 0 0 0 0
Sub-Total General
Consumers Nos. 1,194,161 1,265,367 1,341,149 1,421,120 1,491,747
Connected Load KW 1,742,122 1,860,563 1,971,991 2,089,577 2,192,836
Sales MU 2,154 2,331 2,522 2,729 2,953
Revenue from Fixed Charges Rs. Crs. - - - - -
Revenue from Variable Charges Rs. Crs. - - - - -
Total Revenue Rs. Crs. 1,198 1,159 1,357 1,471 1,599
Temporary

MPMKVVCL Annexure-I of ARR/Tariff Petition FY-17
Name of Distribution Licensee : MPMKVVCL BHOPAL
Revenue from Current Tariff & Charges for LT consumers in urban area
Form R3
Unit of
measuremPY CY
FY15 FY16 FY17 FY18 FY19
Particulars Parameter MYT 2016-17 to 2018-19
Consumers Nos. 7021 7262 7511 7769 8036
Connected Load KW 11017 10020 10364 10720 11088
Sales MU 15 16 16 17 17
Revenue from Fixed Charges Rs. Crs.
Revenue from Variable Charges Rs. Crs.
Total Revenue Rs. Crs. 12 15 16 16 17
supply through DTR meter for jhuggi/ jhopdi
Consumers Nos. 0 0 0 0 0
Connected Load KW 0 0 0 0 0
Sales MU 0 0 0 0 0
Revenue from Fixed Charges Rs. Crs. 0 0 0 0 0
Revenue from Variable Charges Rs. Crs. 0 0 0 0 0
Total Revenue Rs. Crs. 0 0 0 0 0
un- metered Consumers Nos. 299 330 0 0 0
Connected Load KW 110 302 0 0 0
Sales MU 2 2 0 0 0
Revenue from Fixed Charges Rs. Crs.
Revenue from Variable Charges Rs. Crs.
Total Revenue Rs. Crs. 1 1 - - -
Total - LV 1 Domestic
Consumers Nos. 1,201,481 1,272,959 1,348,660 1,428,889 1,499,783
Connected Load KW 1,753,249 1,870,885 1,982,354 2,100,297 2,203,924
Sales MU 2,171 2,348 2,539 2,746 2,970
Revenue from Fixed Charges Rs. Crs. - - - - -
Revenue from Variable Charges Rs. Crs. - - - - -

MPMKVVCL Annexure-I of ARR/Tariff Petition FY-17
Name of Distribution Licensee : MPMKVVCL BHOPAL
Revenue from Current Tariff & Charges for LT consumers in urban area
Form R3
Unit of
measuremPY CY
FY15 FY16 FY17 FY18 FY19
Particulars Parameter MYT 2016-17 to 2018-19
Total Revenue Rs. Crs. 1,211 1,176 1,373 1,487 1,616
LV 2.1
sanctioned load based tariff
Consumers Nos. 6,287 6,473 6,772 7,028 7,294
Connected Load KW 26,478 24,965 32,600 36,172 40,137
Sales MU 47 45 60 70 82
Revenue from Fixed Charges Rs. Crs.
Revenue from Variable Charges Rs. Crs.
Total Revenue Rs. Crs. 31 28 36 42 49
demand based tariff for for CD above 10 kw
Consumers Nos. 178 212 192 199 207
Connected Load KW 5,879 7,263 7,238 8,031 8,912
Sales MU 7 8 9 10 12
Revenue from Fixed Charges Rs. Crs.
Revenue from Variable Charges Rs. Crs.
Total Revenue Rs. Crs. 5 6 7 8 9
LV 2.2: NON-DOMESTIC
0 to 50 Units
Consumers Nos. 99,667 79,729 107,352 111,414 115,629
Connected Load KW 115,281 101,571 141,934 157,488 174,748
Sales MU 26 23 33 38 45
Revenue from Fixed Charges Rs. Crs.
Revenue from Variable Charges Rs. Crs.
Total Revenue Rs. Crs. 30 20 28 33 37
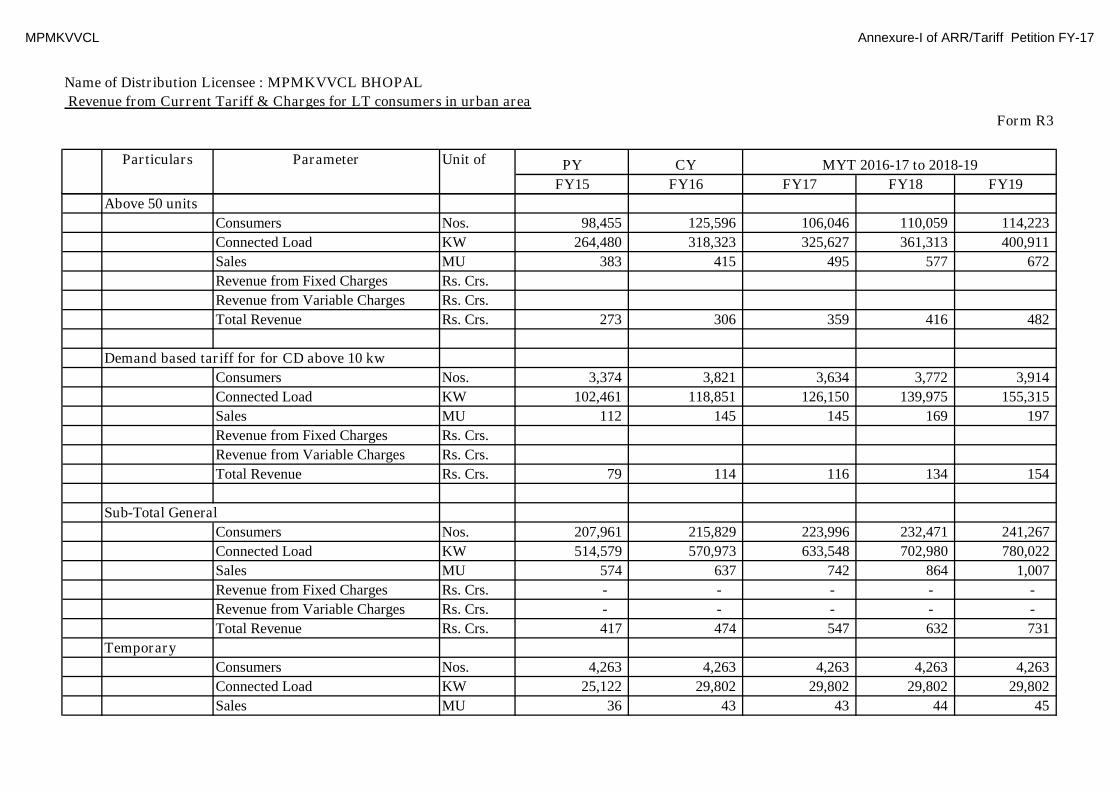
MPMKVVCL Annexure-I of ARR/Tariff Petition FY-17
Name of Distribution Licensee : MPMKVVCL BHOPAL
Revenue from Current Tariff & Charges for LT consumers in urban area
Form R3
Unit of
measuremPY CY
FY15 FY16 FY17 FY18 FY19
Particulars Parameter MYT 2016-17 to 2018-19
Above 50 units
Consumers Nos. 98,455 125,596 106,046 110,059 114,223
Connected Load KW 264,480 318,323 325,627 361,313 400,911
Sales MU 383 415 495 577 672
Revenue from Fixed Charges Rs. Crs.
Revenue from Variable Charges Rs. Crs.
Total Revenue Rs. Crs. 273 306 359 416 482
Demand based tariff for for CD above 10 kw
Consumers Nos. 3,374 3,821 3,634 3,772 3,914
Connected Load KW 102,461 118,851 126,150 139,975 155,315
Sales MU 112 145 145 169 197
Revenue from Fixed Charges Rs. Crs.
Revenue from Variable Charges Rs. Crs.
Total Revenue Rs. Crs. 79 114 116 134 154
Sub-Total General
Consumers Nos. 207,961 215,829 223,996 232,471 241,267
Connected Load KW 514,579 570,973 633,548 702,980 780,022
Sales MU 574 637 742 864 1,007
Revenue from Fixed Charges Rs. Crs. - - - - -
Revenue from Variable Charges Rs. Crs. - - - - -
Total Revenue Rs. Crs. 417 474 547 632 731
Temporary
Consumers Nos. 4,263 4,263 4,263 4,263 4,263
Connected Load KW 25,122 29,802 29,802 29,802 29,802
Sales MU 36 43 43 44 45
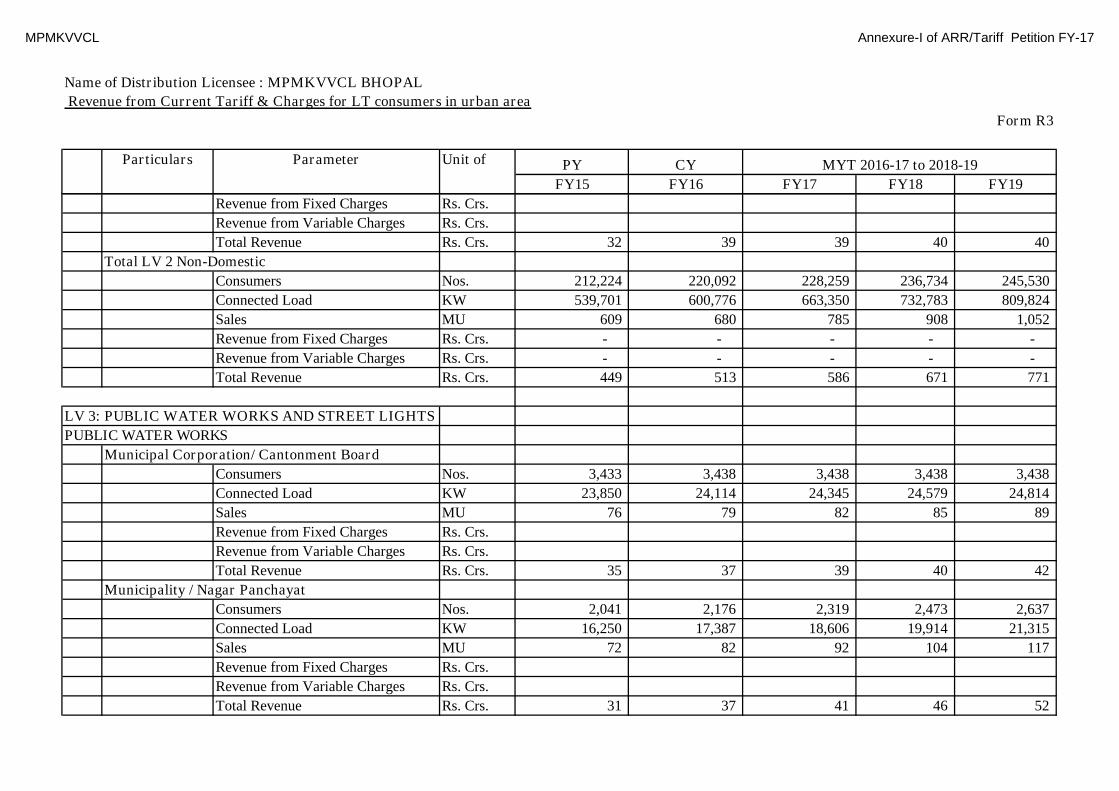
MPMKVVCL Annexure-I of ARR/Tariff Petition FY-17
Name of Distribution Licensee : MPMKVVCL BHOPAL
Revenue from Current Tariff & Charges for LT consumers in urban area
Form R3
Unit of
measuremPY CY
FY15 FY16 FY17 FY18 FY19
Particulars Parameter MYT 2016-17 to 2018-19
Revenue from Fixed Charges Rs. Crs.
Revenue from Variable Charges Rs. Crs.
Total Revenue Rs. Crs. 32 39 39 40 40
Total LV 2 Non-Domestic
Consumers Nos. 212,224 220,092 228,259 236,734 245,530
Connected Load KW 539,701 600,776 663,350 732,783 809,824
Sales MU 609 680 785 908 1,052
Revenue from Fixed Charges Rs. Crs. - - - - -
Revenue from Variable Charges Rs. Crs. - - - - -
Total Revenue Rs. Crs. 449 513 586 671 771
LV 3: PUBLIC WATER WORKS AND STREET LIGHTS
PUBLIC WATER WORKS
Municipal Corporation/ Cantonment Board
Consumers Nos. 3,433 3,438 3,438 3,438 3,438
Connected Load KW 23,850 24,114 24,345 24,579 24,814
Sales MU 76 79 82 85 89
Revenue from Fixed Charges Rs. Crs.
Revenue from Variable Charges Rs. Crs.
Total Revenue Rs. Crs. 35 37 39 40 42
Municipality / Nagar Panchayat
Consumers Nos. 2,041 2,176 2,319 2,473 2,637
Connected Load KW 16,250 17,387 18,606 19,914 21,315
Sales MU 72 82 92 104 117
Revenue from Fixed Charges Rs. Crs.
Revenue from Variable Charges Rs. Crs.
Total Revenue Rs. Crs. 31 37 41 46 52

MPMKVVCL Annexure-I of ARR/Tariff Petition FY-17
Name of Distribution Licensee : MPMKVVCL BHOPAL
Revenue from Current Tariff & Charges for LT consumers in urban area
Form R3
Unit of
measuremPY CY
FY15 FY16 FY17 FY18 FY19
Particulars Parameter MYT 2016-17 to 2018-19
Gram Panchayat
Consumers Nos.
Connected Load KW
Sales MU
Revenue from Fixed Charges Rs. Crs.
Revenue from Variable Charges Rs. Crs.
Total Revenue Rs. Crs.
Sub-Total General
Consumers Nos. 5,474 5,614 5,757 5,911 6,075
Connected Load KW 40,100 41,501 42,952 44,492 46,130
Sales MU 148 160 174 189 206
Revenue from Fixed Charges Rs. Crs. - - - - -
Revenue from Variable Charges Rs. Crs. - - - - -
Total Revenue Rs. Crs. 66 74 80 86 93
Temporary
Consumers Nos. 185 185 185 185 185
Connected Load KW 1,220 1,313 1,396 1,485 1,582
Sales MU 5 4 5 6 7
Revenue from Fixed Charges Rs. Crs.
Revenue from Variable Charges Rs. Crs.
Total Revenue Rs. Crs. 3 2 3 3 4
Sub-Total Public Water Works
Consumers Nos. 5,659 5,799 5,942 6,096 6,260
Connected Load KW 41,320 42,814 44,347 45,978 47,712
Sales MU 153 164 179 195 213
Revenue from Fixed Charges Rs. Crs. - - - - -
Revenue from Variable Charges Rs. Crs. - - - - -

MPMKVVCL Annexure-I of ARR/Tariff Petition FY-17
Name of Distribution Licensee : MPMKVVCL BHOPAL
Revenue from Current Tariff & Charges for LT consumers in urban area
Form R3
Unit of
measuremPY CY
FY15 FY16 FY17 FY18 FY19
Particulars Parameter MYT 2016-17 to 2018-19
Total Revenue Rs. Crs. 69 76 82 89 97
STREET LIGHTS (incl. Traffic Signals)
Municipal Corporation/ Cantonment Board
Consumers Nos. 1,130 1,204 1,255 1,308 1,364
Connected Load KW 10,932 11,850 12,356 12,884 13,434
Sales MU 47 48 53 57 63
Revenue from Fixed Charges Rs. Crs.
Revenue from Variable Charges Rs. Crs.
Total Revenue Rs. Crs. 24 24 26 28 31
Municipality / Nagar Panchayat
Consumers Nos. 748 801 853 909 968
Connected Load KW 11,878 12,826 13,823 14,897 16,055
Sales MU 48 57 68 81 96
Revenue from Fixed Charges
Revenue from Variable Charges
Total Revenue Rs. Crs. 22 28 32 38 44
Gram Panchayat
Consumers Nos.
Connected Load KW
Sales MU
Revenue from Fixed Charges Rs. Crs.
Revenue from Variable Charges Rs. Crs.
Total Revenue Rs. Crs.
Sub-Total Street Lights
Consumers Nos. 1,878 2,005 2,108 2,217 2,332
Connected Load KW 22,810 24,676 26,179 27,781 29,489
Sales MU 95 105 120 138 158
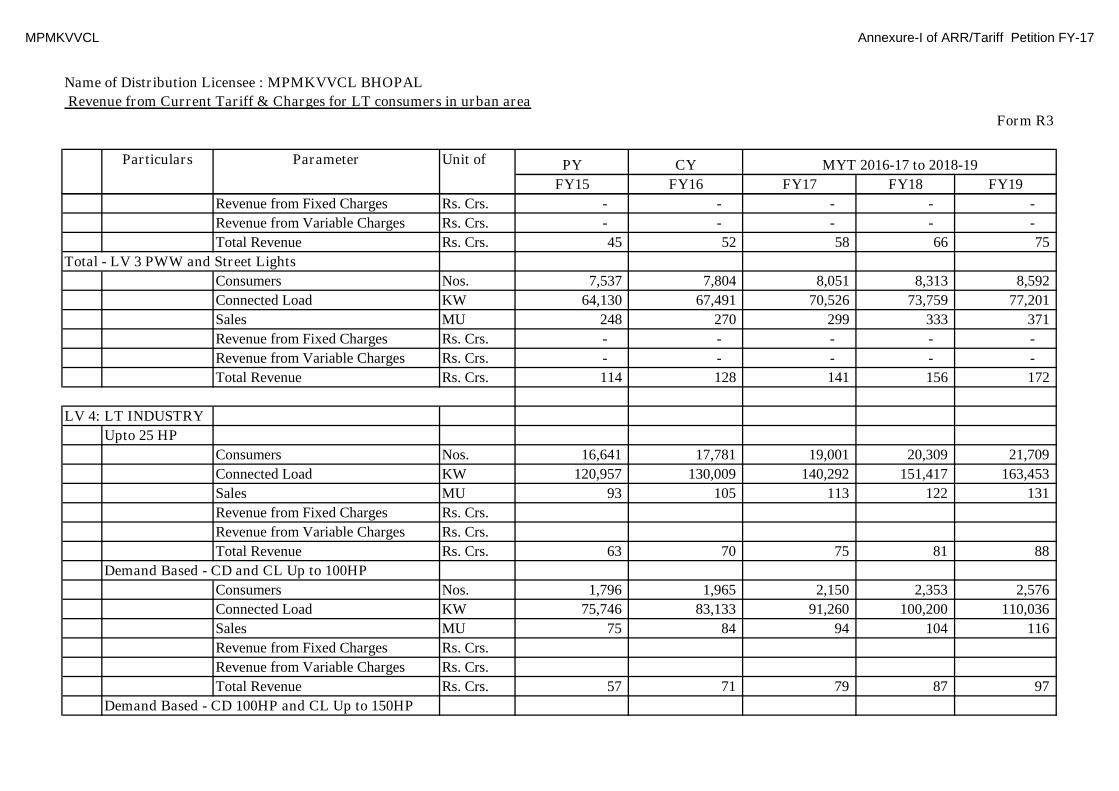
MPMKVVCL Annexure-I of ARR/Tariff Petition FY-17
Name of Distribution Licensee : MPMKVVCL BHOPAL
Revenue from Current Tariff & Charges for LT consumers in urban area
Form R3
Unit of
measuremPY CY
FY15 FY16 FY17 FY18 FY19
Particulars Parameter MYT 2016-17 to 2018-19
Revenue from Fixed Charges Rs. Crs. - - - - -
Revenue from Variable Charges Rs. Crs. - - - - -
Total Revenue Rs. Crs. 45 52 58 66 75
Total - LV 3 PWW and Street Lights
Consumers Nos. 7,537 7,804 8,051 8,313 8,592
Connected Load KW 64,130 67,491 70,526 73,759 77,201
Sales MU 248 270 299 333 371
Revenue from Fixed Charges Rs. Crs. - - - - -
Revenue from Variable Charges Rs. Crs. - - - - -
Total Revenue Rs. Crs. 114 128 141 156 172
LV 4: LT INDUSTRY
Upto 25 HP
Consumers Nos. 16,641 17,781 19,001 20,309 21,709
Connected Load KW 120,957 130,009 140,292 151,417 163,453
Sales MU 93 105 113 122 131
Revenue from Fixed Charges Rs. Crs.
Revenue from Variable Charges Rs. Crs.
Total Revenue Rs. Crs. 63 70 75 81 88
Demand Based - CD and CL Up to 100HP
Consumers Nos. 1,796 1,965 2,150 2,353 2,576
Connected Load KW 75,746 83,133 91,260 100,200 110,036
Sales MU 75 84 94 104 116
Revenue from Fixed Charges Rs. Crs.
Revenue from Variable Charges Rs. Crs.
Total Revenue Rs. Crs. 57 71 79 87 97
Demand Based - CD 100HP and CL Up to 150HP
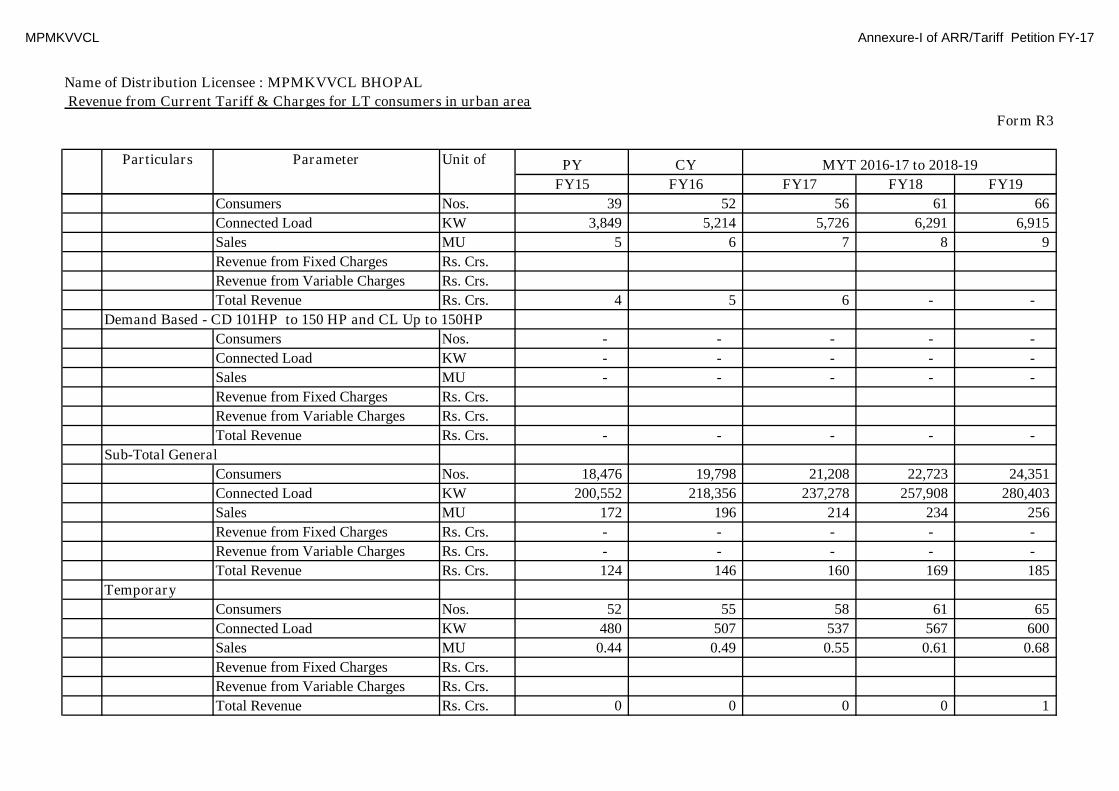
MPMKVVCL Annexure-I of ARR/Tariff Petition FY-17
Name of Distribution Licensee : MPMKVVCL BHOPAL
Revenue from Current Tariff & Charges for LT consumers in urban area
Form R3
Unit of
measuremPY CY
FY15 FY16 FY17 FY18 FY19
Particulars Parameter MYT 2016-17 to 2018-19
Consumers Nos. 39 52 56 61 66
Connected Load KW 3,849 5,214 5,726 6,291 6,915
Sales MU 5 6 7 8 9
Revenue from Fixed Charges Rs. Crs.
Revenue from Variable Charges Rs. Crs.
Total Revenue Rs. Crs. 4 5 6 - -
Demand Based - CD 101HP to 150 HP and CL Up to 150HP
Consumers Nos. - - - - -
Connected Load KW - - - - -
Sales MU - - - - -
Revenue from Fixed Charges Rs. Crs.
Revenue from Variable Charges Rs. Crs.
Total Revenue Rs. Crs. - - - - -
Sub-Total General
Consumers Nos. 18,476 19,798 21,208 22,723 24,351
Connected Load KW 200,552 218,356 237,278 257,908 280,403
Sales MU 172 196 214 234 256
Revenue from Fixed Charges Rs. Crs. - - - - -
Revenue from Variable Charges Rs. Crs. - - - - -
Total Revenue Rs. Crs. 124 146 160 169 185
Temporary
Consumers Nos. 52 55 58 61 65
Connected Load KW 480 507 537 567 600
Sales MU 0.44 0.49 0.55 0.61 0.68
Revenue from Fixed Charges Rs. Crs.
Revenue from Variable Charges Rs. Crs.
Total Revenue Rs. Crs. 0 0 0 0 1

MPMKVVCL Annexure-I of ARR/Tariff Petition FY-17
Name of Distribution Licensee : MPMKVVCL BHOPAL
Revenue from Current Tariff & Charges for LT consumers in urban area
Form R3
Unit of
measuremPY CY
FY15 FY16 FY17 FY18 FY19
Particulars Parameter MYT 2016-17 to 2018-19
Total LV 4 LT Industrial
Consumers Nos. 18,528 19,853 21,266 22,784 24,416
Connected Load KW 201,032 218,863 237,814 258,475 281,003
Sales MU 173 196 215 235 257
Revenue from Fixed Charges Rs. Crs. - - - - -
Revenue from Variable Charges Rs. Crs. - - - - -
Total Revenue Rs. Crs. 124 146 160 169 185
LV 5.1: IRRIGATION PUMP FOR AGRICULTURE
Metered
Permanent Connections - For agriculture Use
first 300 units
Consumers Nos.
Connected Load KW
Sales MU
Revenue from Fixed Charges Rs. Crs.
Revenue from Variable Charges Rs. Crs.
Total Revenue Rs. Crs.Above 300 to
750 units
Consumers Nos.
Connected Load KW
Sales MU
Revenue from Fixed Charges Rs. Crs.
Revenue from Variable Charges Rs. Crs.
Total Revenue Rs. Crs.

MPMKVVCL Annexure-I of ARR/Tariff Petition FY-17
Name of Distribution Licensee : MPMKVVCL BHOPAL
Revenue from Current Tariff & Charges for LT consumers in urban area
Form R3
Unit of
measuremPY CY
FY15 FY16 FY17 FY18 FY19
Particulars Parameter MYT 2016-17 to 2018-19
Above 750 Units
Consumers Nos.
Connected Load KW
Sales MU
Revenue from Fixed Charges Rs. Crs.
Revenue from Variable Charges Rs. Crs.
Total Revenue Rs. Crs.Temporary
Connections
Consumers Nos.
Connected Load KW
Sales MU
Revenue from Fixed Charges Rs. Crs.
Revenue from Variable Charges Rs. Crs.
Total Revenue Rs. Crs.
Sub-Total
Metered
connections
Consumers Nos. - - - - -
Connected Load KW - - - - -
Sales MU - - - - -
Revenue from Fixed Charges Rs. Crs.
Revenue from Variable Charges Rs. Crs.
Total Revenue Rs. Crs. - - - - -
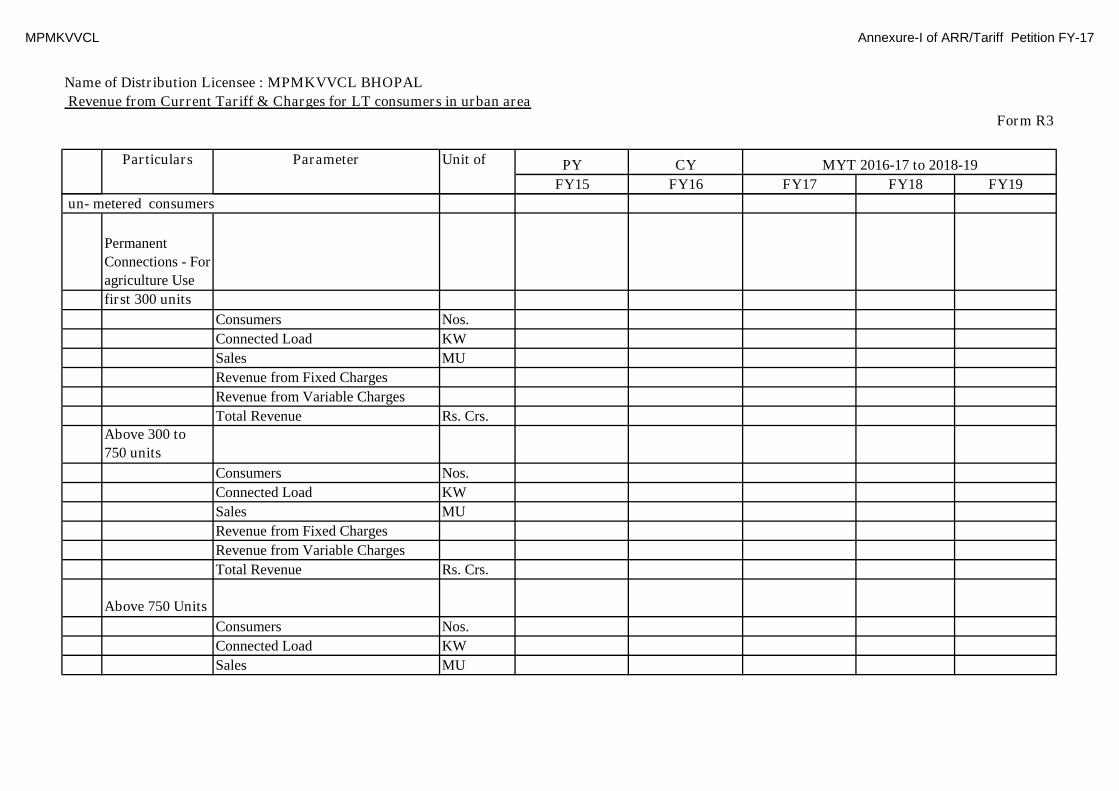
MPMKVVCL Annexure-I of ARR/Tariff Petition FY-17
Name of Distribution Licensee : MPMKVVCL BHOPAL
Revenue from Current Tariff & Charges for LT consumers in urban area
Form R3
Unit of
measuremPY CY
FY15 FY16 FY17 FY18 FY19
Particulars Parameter MYT 2016-17 to 2018-19
un- metered consumers
Permanent
Connections - For
agriculture Use
first 300 units
Consumers Nos.
Connected Load KW
Sales MU
Revenue from Fixed Charges
Revenue from Variable Charges
Total Revenue Rs. Crs.Above 300 to
750 units
Consumers Nos.
Connected Load KW
Sales MU
Revenue from Fixed Charges
Revenue from Variable Charges
Total Revenue Rs. Crs.
Above 750 Units
Consumers Nos.
Connected Load KW
Sales MU

MPMKVVCL Annexure-I of ARR/Tariff Petition FY-17
Name of Distribution Licensee : MPMKVVCL BHOPAL
Revenue from Current Tariff & Charges for LT consumers in urban area
Form R3
Unit of
measuremPY CY
FY15 FY16 FY17 FY18 FY19
Particulars Parameter MYT 2016-17 to 2018-19
Revenue from Fixed Charges
Revenue from Variable Charges
Total Revenue Rs. Crs.Temporary
Connections
Consumers Nos.
Connected Load KW
Sales MU
Revenue from Fixed Charges
Revenue from Variable Charges
Total Revenue Rs. Crs.
Sub-Total Un-
Metered
connections
Consumers Nos. - - - - -
Connected Load KW - - - - -
Sales MU - - - - -
Revenue from Fixed Charges Rs. Crs.
Revenue from Variable Charges Rs. Crs.
Total Revenue Rs. Crs. - - - - -
DTR metered group consumers
Permanent Connections
Consumers Nos.
Connected Load KW
Sales MU
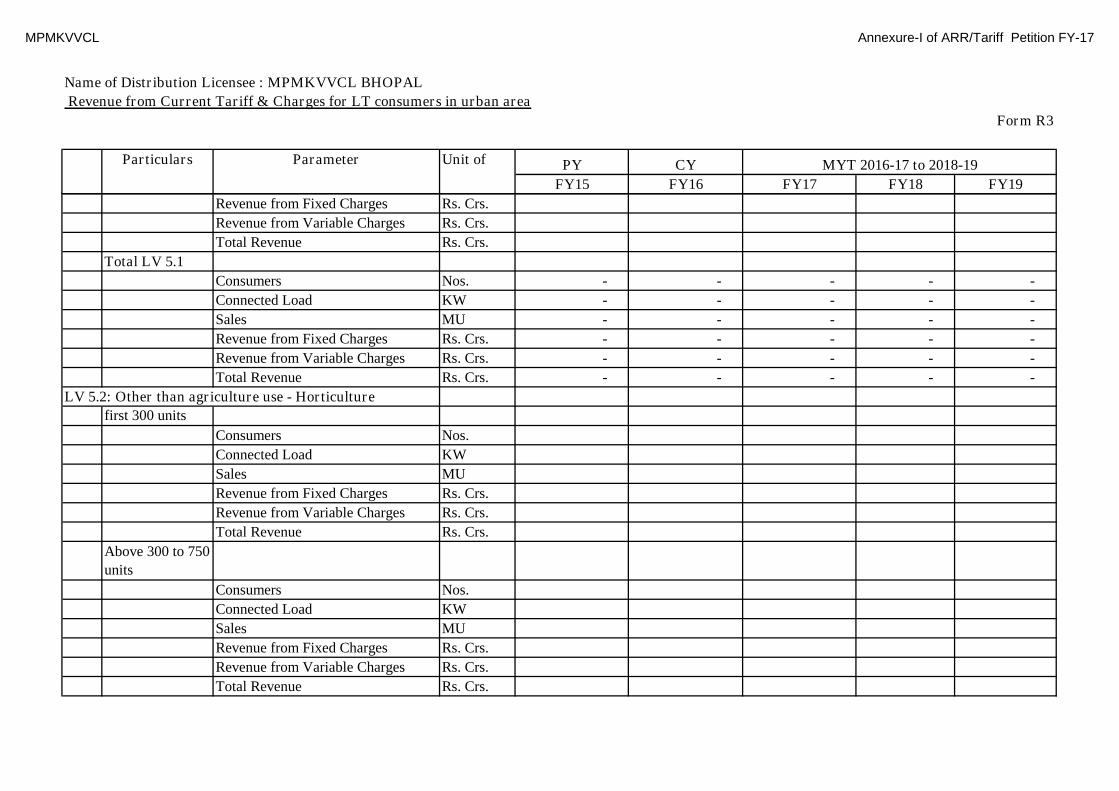
MPMKVVCL Annexure-I of ARR/Tariff Petition FY-17
Name of Distribution Licensee : MPMKVVCL BHOPAL
Revenue from Current Tariff & Charges for LT consumers in urban area
Form R3
Unit of
measuremPY CY
FY15 FY16 FY17 FY18 FY19
Particulars Parameter MYT 2016-17 to 2018-19
Revenue from Fixed Charges Rs. Crs.
Revenue from Variable Charges Rs. Crs.
Total Revenue Rs. Crs.
Total LV 5.1
Consumers Nos. - - - - -
Connected Load KW - - - - -
Sales MU - - - - -
Revenue from Fixed Charges Rs. Crs. - - - - -
Revenue from Variable Charges Rs. Crs. - - - - -
Total Revenue Rs. Crs. - - - - -
LV 5.2: Other than agriculture use - Horticulture
first 300 units
Consumers Nos.
Connected Load KW
Sales MU
Revenue from Fixed Charges Rs. Crs.
Revenue from Variable Charges Rs. Crs.
Total Revenue Rs. Crs.
Above 300 to 750
units
Consumers Nos.
Connected Load KW
Sales MU
Revenue from Fixed Charges Rs. Crs.
Revenue from Variable Charges Rs. Crs.
Total Revenue Rs. Crs.

MPMKVVCL Annexure-I of ARR/Tariff Petition FY-17
Name of Distribution Licensee : MPMKVVCL BHOPAL
Revenue from Current Tariff & Charges for LT consumers in urban area
Form R3
Unit of
measuremPY CY
FY15 FY16 FY17 FY18 FY19
Particulars Parameter MYT 2016-17 to 2018-19
Above 750 Units
Consumers Nos.
Connected Load KW
Sales MU
Revenue from Fixed Charges Rs. Crs.
Revenue from Variable Charges Rs. Crs.
Total Revenue Rs. Crs.
Temporary
Connections
Consumers Nos.
Connected Load KW
Sales MU
Revenue from Fixed Charges Rs. Crs.
Revenue from Variable Charges Rs. Crs.
Total Revenue Rs. Crs.
Sub-Total
Consumers Nos. - - - - -
Connected Load KW - - - - -
Sales MU - - - - -
Revenue from Fixed Charges Rs. Crs. - - - - -
Revenue from Variable Charges Rs. Crs. - - - - -
Total Revenue Rs. Crs. - - - - -
5.3 For other than agriculture use

MPMKVVCL Annexure-I of ARR/Tariff Petition FY-17
Name of Distribution Licensee : MPMKVVCL BHOPAL
Revenue from Current Tariff & Charges for LT consumers in urban area
Form R3
Unit of
measuremPY CY
FY15 FY16 FY17 FY18 FY19
Particulars Parameter MYT 2016-17 to 2018-19
Upto 25 HP in
Urban Area
Consumers Nos. 99 126 151 182 220
Connected Load KW 553 537 637 757 902
Sales MU 10 11 14 17 21
Revenue from Fixed Charges Rs. Crs.
Revenue from Variable Charges Rs. Crs.
Total Revenue Rs. Crs. 1 5 6 7 9
Demand base Tariff Upto 100HP- urban area
Consumers Nos. - 3 3 3 3
Connected Load KW - 104 104 104 104
Sales MU - 0 0 0 0
Revenue from Fixed Charges Rs. Crs.
Revenue from Variable Charges Rs. Crs.
Total Revenue Rs. Crs. - 0 0 0 0
Temporary Connections Urban area
Consumers Nos. 8 9 10 12 14
Connected Load KW 18 23 26 30 34
Sales MU 0 0 0 1 1
Revenue from Fixed Charges Rs. Crs.
Revenue from Variable Charges Rs. Crs.
Total Revenue Rs. Crs. 0 0 0 0 0
Sub-Total
Consumers Nos. 107 138 164 197 236
Connected Load KW 571 664 767 891 1,040
Sales MU 10 12 14 17 21
Revenue from Fixed Charges Rs. Crs. - - - - -
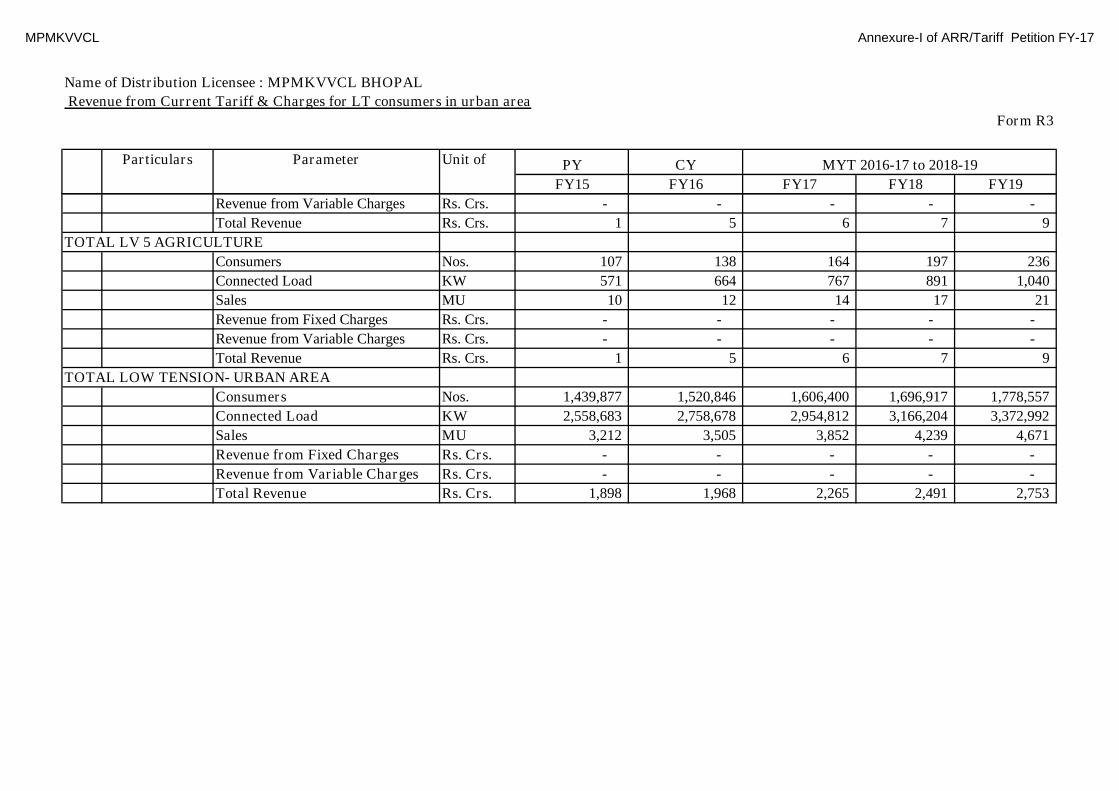
MPMKVVCL Annexure-I of ARR/Tariff Petition FY-17
Name of Distribution Licensee : MPMKVVCL BHOPAL
Revenue from Current Tariff & Charges for LT consumers in urban area
Form R3
Unit of
measuremPY CY
FY15 FY16 FY17 FY18 FY19
Particulars Parameter MYT 2016-17 to 2018-19
Revenue from Variable Charges Rs. Crs. - - - - -
Total Revenue Rs. Crs. 1 5 6 7 9
TOTAL LV 5 AGRICULTURE
Consumers Nos. 107 138 164 197 236
Connected Load KW 571 664 767 891 1,040
Sales MU 10 12 14 17 21
Revenue from Fixed Charges Rs. Crs. - - - - -
Revenue from Variable Charges Rs. Crs. - - - - -
Total Revenue Rs. Crs. 1 5 6 7 9
TOTAL LOW TENSION- URBAN AREA
Consumers Nos. 1,439,877 1,520,846 1,606,400 1,696,917 1,778,557
Connected Load KW 2,558,683 2,758,678 2,954,812 3,166,204 3,372,992
Sales MU 3,212 3,505 3,852 4,239 4,671
Revenue from Fixed Charges Rs. Crs. - - - - -
Revenue from Variable Charges Rs. Crs. - - - - -
Total Revenue Rs. Crs. 1,898 1,968 2,265 2,491 2,753
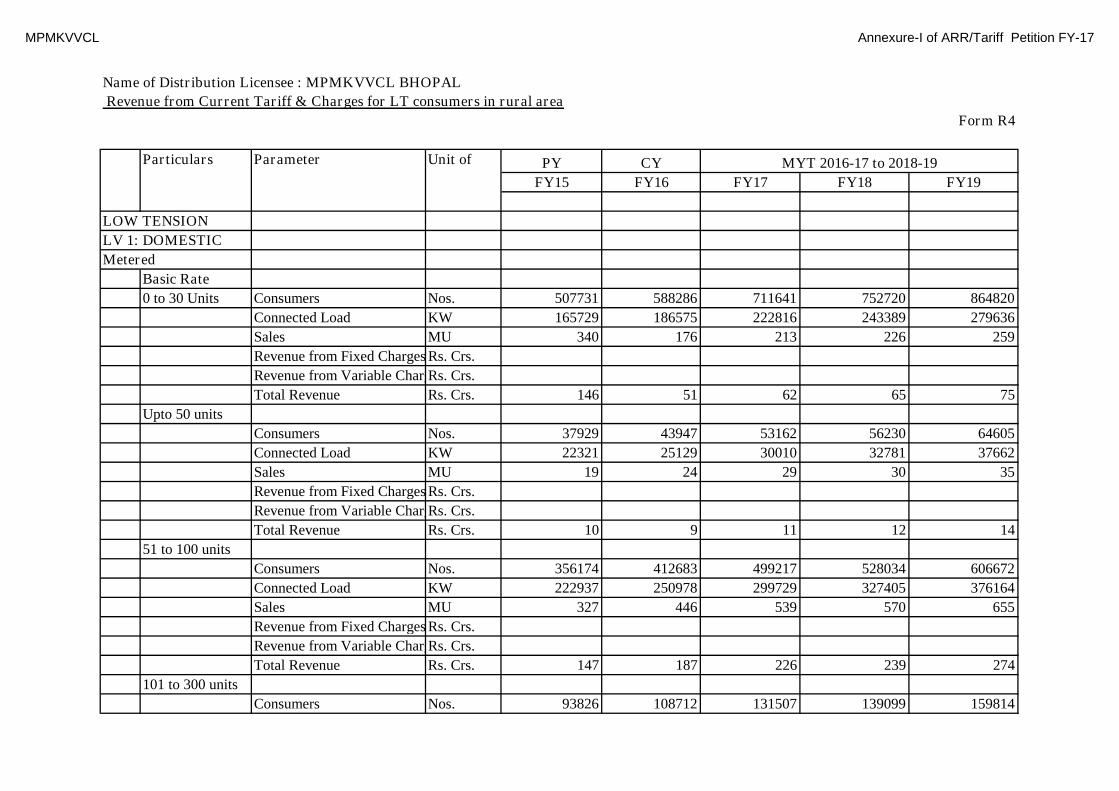
MPMKVVCL Annexure-I of ARR/Tariff Petition FY-17
Name of Distribution Licensee : MPMKVVCL BHOPAL
Revenue from Current Tariff & Charges for LT consumers in rural area
Form R4
Particulars Parameter Unit of
measuremPY CY
FY15 FY16 FY17 FY18 FY19
LOW TENSION
LV 1: DOMESTIC
Metered
Basic Rate
0 to 30 Units Consumers Nos. 507731 588286 711641 752720 864820
Connected Load KW 165729 186575 222816 243389 279636
Sales MU 340 176 213 226 259
Revenue from Fixed Charges Rs. Crs.
Revenue from Variable ChargesRs. Crs.
Total Revenue Rs. Crs. 146 51 62 65 75
Upto 50 units
Consumers Nos. 37929 43947 53162 56230 64605
Connected Load KW 22321 25129 30010 32781 37662
Sales MU 19 24 29 30 35
Revenue from Fixed Charges Rs. Crs.
Revenue from Variable ChargesRs. Crs.
Total Revenue Rs. Crs. 10 9 11 12 14
51 to 100 units
Consumers Nos. 356174 412683 499217 528034 606672
Connected Load KW 222937 250978 299729 327405 376164
Sales MU 327 446 539 570 655
Revenue from Fixed Charges Rs. Crs.
Revenue from Variable ChargesRs. Crs.
Total Revenue Rs. Crs. 147 187 226 239 274
101 to 300 units
Consumers Nos. 93826 108712 131507 139099 159814
MYT 2016-17 to 2018-19

MPMKVVCL Annexure-I of ARR/Tariff Petition FY-17
Name of Distribution Licensee : MPMKVVCL BHOPAL
Revenue from Current Tariff & Charges for LT consumers in rural area
Form R4
Particulars Parameter Unit of
measuremPY CY
FY15 FY16 FY17 FY18 FY19
MYT 2016-17 to 2018-19
Connected Load KW 64379 72477 86555 94547 108627
Sales MU 152 339 410 434 499
Revenue from Fixed Charges Rs. Crs.
Revenue from Variable ChargesRs. Crs.
Total Revenue Rs. Crs. 78 180 223 236 271
Above 300 units
Consumers Nos. 3851 4462 5398 5709 6559
Connected Load KW 5025 5657 6756 7380 8479
Sales MU 29 44 240 481 853
Revenue from Fixed Charges Rs. Crs.
Revenue from Variable ChargesRs. Crs.
Total Revenue Rs. Crs. 17 27 161 324 575
above 500 units
Consumers Nos. 0 0 0 0 0
Connected Load KW 0 0 0 0 0
Sales MU 0 0 0 0 0
Revenue from Fixed Charges Rs. Crs.
Revenue from Variable ChargesRs. Crs.
Total Revenue Rs. Crs. 0 0 0 0 0
Sub-Total General
Consumers Nos. 999,511 1,158,090 1,400,925 1,481,792 1,702,470
Connected Load KW 480,391 540,816 645,865 705,501 810,569
Sales MU 867 1,029 1,432 1,742 2,302
Revenue from Fixed Charges Rs. Crs. - - - - -
Revenue from Variable ChargesRs. Crs. - - - - -
Total Revenue Rs. Crs. 398 454 683 876 1,210
Temporary
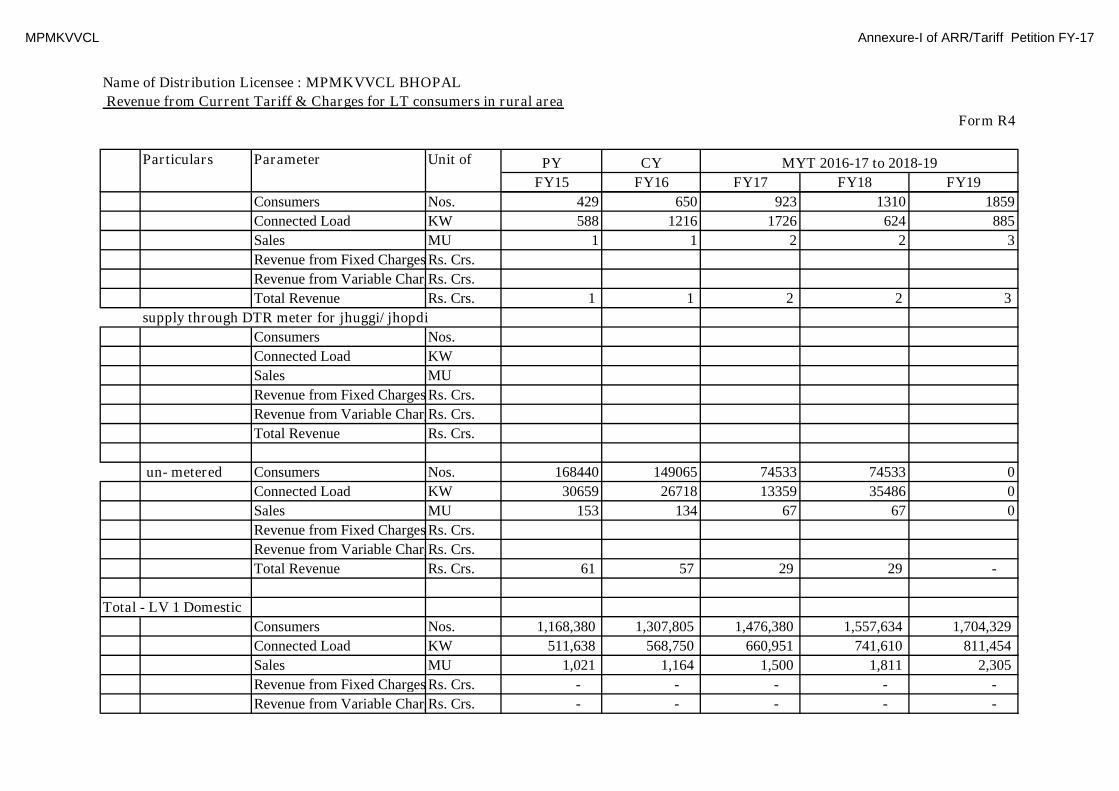
MPMKVVCL Annexure-I of ARR/Tariff Petition FY-17
Name of Distribution Licensee : MPMKVVCL BHOPAL
Revenue from Current Tariff & Charges for LT consumers in rural area
Form R4
Particulars Parameter Unit of
measuremPY CY
FY15 FY16 FY17 FY18 FY19
MYT 2016-17 to 2018-19
Consumers Nos. 429 650 923 1310 1859
Connected Load KW 588 1216 1726 624 885
Sales MU 1 1 2 2 3
Revenue from Fixed Charges Rs. Crs.
Revenue from Variable ChargesRs. Crs.
Total Revenue Rs. Crs. 1 1 2 2 3
supply through DTR meter for jhuggi/ jhopdi
Consumers Nos.
Connected Load KW
Sales MU
Revenue from Fixed Charges Rs. Crs.
Revenue from Variable ChargesRs. Crs.
Total Revenue Rs. Crs.
un- metered Consumers Nos. 168440 149065 74533 74533 0
Connected Load KW 30659 26718 13359 35486 0
Sales MU 153 134 67 67 0
Revenue from Fixed Charges Rs. Crs.
Revenue from Variable ChargesRs. Crs.
Total Revenue Rs. Crs. 61 57 29 29 -
Total - LV 1 Domestic
Consumers Nos. 1,168,380 1,307,805 1,476,380 1,557,634 1,704,329
Connected Load KW 511,638 568,750 660,951 741,610 811,454
Sales MU 1,021 1,164 1,500 1,811 2,305
Revenue from Fixed Charges Rs. Crs. - - - - -
Revenue from Variable ChargesRs. Crs. - - - - -

MPMKVVCL Annexure-I of ARR/Tariff Petition FY-17
Name of Distribution Licensee : MPMKVVCL BHOPAL
Revenue from Current Tariff & Charges for LT consumers in rural area
Form R4
Particulars Parameter Unit of
measuremPY CY
FY15 FY16 FY17 FY18 FY19
MYT 2016-17 to 2018-19
Total Revenue Rs. Crs. 459 513 713 906 1,212
LV 2.1
sanctioned load based tariff
Consumers Nos. 2,841 2,909 3,069 3,189 3,314
Connected Load KW 5,149 5,477 6,092 6,627 7,208
Sales MU 7 7 9 10 11
Revenue from Fixed Charges Rs. Crs.
Revenue from Variable ChargesRs. Crs.
Total Revenue Rs. Crs. 5 4 5 6 7
demand based tariff for for CD above 10 kw
Consumers Nos. 27 33 29 30 31
Connected Load KW 989 1,261 1,170 1,273 1,384
Sales MU 1 1 1 1 1
Revenue from Fixed Charges Rs. Crs.
Revenue from Variable ChargesRs. Crs.
Total Revenue Rs. Crs. 1 1 1 1 1
LV 2.2: NON-DOMESTIC
0 to 50 Units
Consumers Nos. 7,591 7,073 8,199 8,521 8,856
Connected Load KW 10,818 11,221 12,799 13,922 15,144
Sales MU 2 2 2 3 3
Revenue from Fixed Charges Rs. Crs.
Revenue from Variable ChargesRs. Crs.
Total Revenue Rs. Crs. 2 2 2 2 2

MPMKVVCL Annexure-I of ARR/Tariff Petition FY-17
Name of Distribution Licensee : MPMKVVCL BHOPAL
Revenue from Current Tariff & Charges for LT consumers in rural area
Form R4
Particulars Parameter Unit of
measuremPY CY
FY15 FY16 FY17 FY18 FY19
MYT 2016-17 to 2018-19
Above 50 units
Consumers Nos. 16,631 18,090 17,963 18,669 19,402
Connected Load KW 57,335 61,406 67,837 73,788 80,262
Sales MU 77 83 93 107 122
Revenue from Fixed Charges Rs. Crs.
Revenue from Variable ChargesRs. Crs.
Total Revenue Rs. Crs. 52 59 66 75 86
Demand based tariff for for CD above 10 kw
Consumers Nos. 190 245 205 213 222
Connected Load KW 4,160 5,969 4,922 5,354 5,823
Sales MU 3 4 4 5 5
Revenue from Fixed Charges Rs. Crs.
Revenue from Variable ChargesRs. Crs.
Total Revenue Rs. Crs. 3 3 3 4 4
Sub-Total General
Consumers Nos. 27,280 28,351 29,465 30,622 31,825
Connected Load KW 78,451 85,334 92,820 100,963 109,821
Sales MU 90 98 110 125 143
Revenue from Fixed Charges Rs. Crs. - - - - -
Revenue from Variable ChargesRs. Crs. - - - - -
Total Revenue Rs. Crs. 62 70 77 88 100
Temporary
Consumers Nos. 887 931 978 1,027 1,078
Connected Load KW 3,595 3,891 4,086 4,290 4,504
Sales MU 5 6 6 7 7

MPMKVVCL Annexure-I of ARR/Tariff Petition FY-17
Name of Distribution Licensee : MPMKVVCL BHOPAL
Revenue from Current Tariff & Charges for LT consumers in rural area
Form R4
Particulars Parameter Unit of
measuremPY CY
FY15 FY16 FY17 FY18 FY19
MYT 2016-17 to 2018-19
Revenue from Fixed Charges Rs. Crs.
Revenue from Variable ChargesRs. Crs.
Total Revenue Rs. Crs. 4 5 5 6 6
Total LV 2 Non-Domestic
Consumers Nos. 28,167 29,283 30,443 31,649 32,903
Connected Load KW 82,046 89,225 96,906 105,253 114,326
Sales MU 95 104 116 132 150
Revenue from Fixed Charges Rs. Crs. - - - - -
Revenue from Variable ChargesRs. Crs. - - - - -
Total Revenue Rs. Crs. 66 75 83 94 106
LV 3: PUBLIC WATER WORKS AND STREET LIGHTS
PUBLIC WATER WORKS
Municipal Corporation/ Cantonment Board
Consumers Nos.
Connected Load KW
Sales MU
Revenue from Fixed Charges Rs. Crs.
Revenue from Variable ChargesRs. Crs.
Total Revenue Rs. Crs.
Municipality / Nagar Panchayat
Consumers Nos.
Connected Load KW
Sales MU
Revenue from Fixed Charges Rs. Crs.
Revenue from Variable ChargesRs. Crs.
Total Revenue Rs. Crs.
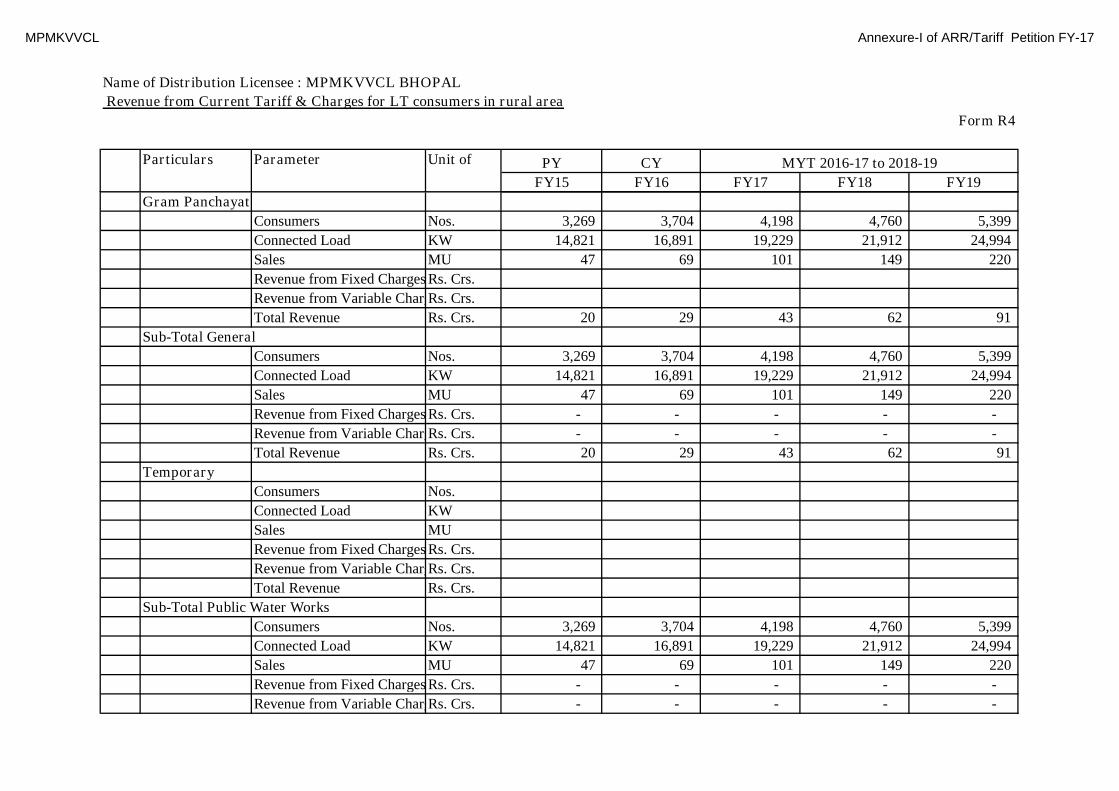
MPMKVVCL Annexure-I of ARR/Tariff Petition FY-17
Name of Distribution Licensee : MPMKVVCL BHOPAL
Revenue from Current Tariff & Charges for LT consumers in rural area
Form R4
Particulars Parameter Unit of
measuremPY CY
FY15 FY16 FY17 FY18 FY19
MYT 2016-17 to 2018-19
Gram Panchayat
Consumers Nos. 3,269 3,704 4,198 4,760 5,399
Connected Load KW 14,821 16,891 19,229 21,912 24,994
Sales MU 47 69 101 149 220
Revenue from Fixed Charges Rs. Crs.
Revenue from Variable ChargesRs. Crs.
Total Revenue Rs. Crs. 20 29 43 62 91
Sub-Total General
Consumers Nos. 3,269 3,704 4,198 4,760 5,399
Connected Load KW 14,821 16,891 19,229 21,912 24,994
Sales MU 47 69 101 149 220
Revenue from Fixed Charges Rs. Crs. - - - - -
Revenue from Variable ChargesRs. Crs. - - - - -
Total Revenue Rs. Crs. 20 29 43 62 91
Temporary
Consumers Nos.
Connected Load KW
Sales MU
Revenue from Fixed Charges Rs. Crs.
Revenue from Variable ChargesRs. Crs.
Total Revenue Rs. Crs.
Sub-Total Public Water Works
Consumers Nos. 3,269 3,704 4,198 4,760 5,399
Connected Load KW 14,821 16,891 19,229 21,912 24,994
Sales MU 47 69 101 149 220
Revenue from Fixed Charges Rs. Crs. - - - - -
Revenue from Variable ChargesRs. Crs. - - - - -

MPMKVVCL Annexure-I of ARR/Tariff Petition FY-17
Name of Distribution Licensee : MPMKVVCL BHOPAL
Revenue from Current Tariff & Charges for LT consumers in rural area
Form R4
Particulars Parameter Unit of
measuremPY CY
FY15 FY16 FY17 FY18 FY19
MYT 2016-17 to 2018-19
Total Revenue Rs. Crs. 20 29 43 62 91
STREET LIGHTS (incl. Traffic Signals)
Municipal Corporation/ Cantonment Board
Consumers Nos.
Connected Load KW
Sales MU
Revenue from Fixed Charges Rs. Crs.
Revenue from Variable ChargesRs. Crs.
Total Revenue Rs. Crs.
Municipality / Nagar Panchayat
Consumers Nos.
Connected Load KW
Sales MU
Revenue from Fixed Charges Rs. Crs.
Revenue from Variable ChargesRs. Crs.
Total Revenue Rs. Crs.
Gram Panchayat
Consumers Nos. 687 718 754 797 848
Connected Load KW 1,396 1,664 2,019 2,526 3,261
Sales MU 4 5 6 8 10
Revenue from Fixed Charges Rs. Crs.
Revenue from Variable ChargesRs. Crs.
Total Revenue Rs. Crs. 2 2 3 3 4
Sub-Total Street Lights
Consumers Nos. 687 718 754 797 848
Connected Load KW 1,396 1,664 2,019 2,526 3,261
Sales MU 4 5 6 8 10
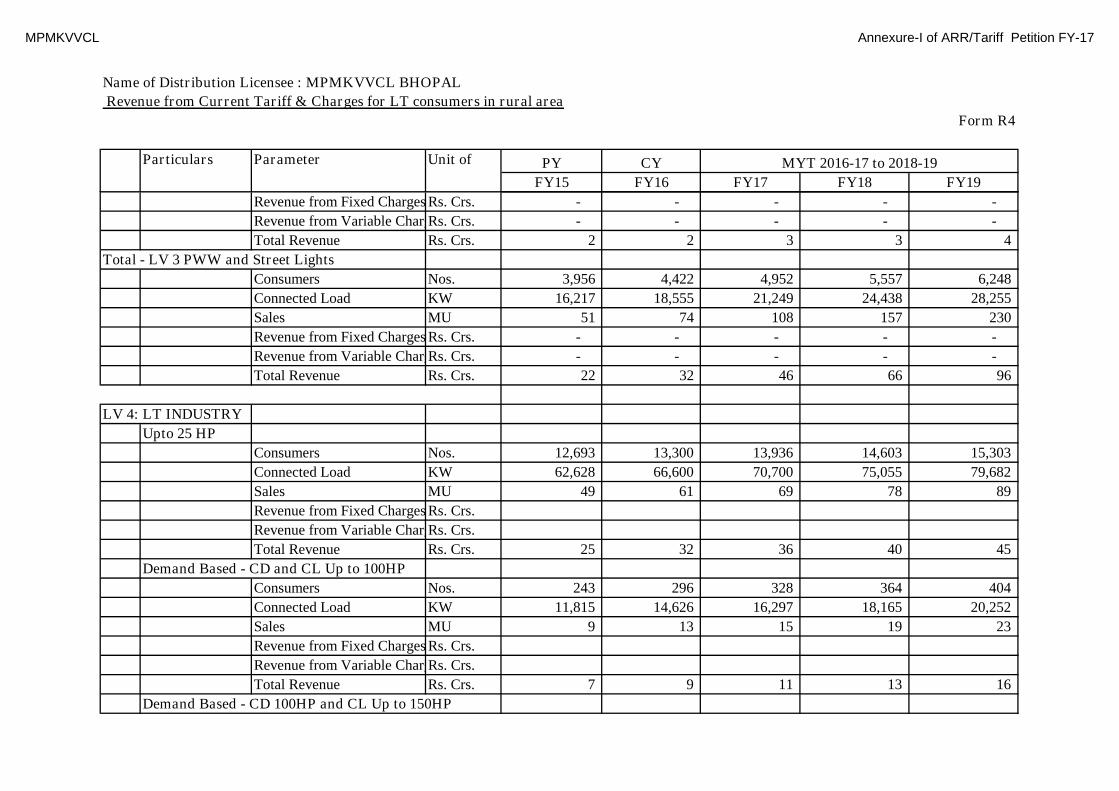
MPMKVVCL Annexure-I of ARR/Tariff Petition FY-17
Name of Distribution Licensee : MPMKVVCL BHOPAL
Revenue from Current Tariff & Charges for LT consumers in rural area
Form R4
Particulars Parameter Unit of
measuremPY CY
FY15 FY16 FY17 FY18 FY19
MYT 2016-17 to 2018-19
Revenue from Fixed Charges Rs. Crs. - - - - -
Revenue from Variable ChargesRs. Crs. - - - - -
Total Revenue Rs. Crs. 2 2 3 3 4
Total - LV 3 PWW and Street Lights
Consumers Nos. 3,956 4,422 4,952 5,557 6,248
Connected Load KW 16,217 18,555 21,249 24,438 28,255
Sales MU 51 74 108 157 230
Revenue from Fixed Charges Rs. Crs. - - - - -
Revenue from Variable ChargesRs. Crs. - - - - -
Total Revenue Rs. Crs. 22 32 46 66 96
LV 4: LT INDUSTRY
Upto 25 HP
Consumers Nos. 12,693 13,300 13,936 14,603 15,303
Connected Load KW 62,628 66,600 70,700 75,055 79,682
Sales MU 49 61 69 78 89
Revenue from Fixed Charges Rs. Crs.
Revenue from Variable ChargesRs. Crs.
Total Revenue Rs. Crs. 25 32 36 40 45
Demand Based - CD and CL Up to 100HP
Consumers Nos. 243 296 328 364 404
Connected Load KW 11,815 14,626 16,297 18,165 20,252
Sales MU 9 13 15 19 23
Revenue from Fixed Charges Rs. Crs.
Revenue from Variable ChargesRs. Crs.
Total Revenue Rs. Crs. 7 9 11 13 16
Demand Based - CD 100HP and CL Up to 150HP

MPMKVVCL Annexure-I of ARR/Tariff Petition FY-17
Name of Distribution Licensee : MPMKVVCL BHOPAL
Revenue from Current Tariff & Charges for LT consumers in rural area
Form R4
Particulars Parameter Unit of
measuremPY CY
FY15 FY16 FY17 FY18 FY19
MYT 2016-17 to 2018-19
Consumers Nos. 3 3 4 5 5
Connected Load KW 308 337 337 338 338
Sales MU 0.43 0.24 0.26 0.29 0.31
Revenue from Fixed Charges Rs. Crs.
Revenue from Variable ChargesRs. Crs.
Total Revenue Rs. Crs. 0.29 0.19 0.20 - -
Demand Based - CD 101HP to 150 HP and CL Up to 150HP
Consumers Nos.
Connected Load KW
Sales MU
Revenue from Fixed Charges Rs. Crs.
Revenue from Variable ChargesRs. Crs.
Total Revenue Rs. Crs.
Sub-Total General
Consumers Nos. 12,939 13,599 14,268 14,972 15,712
Connected Load KW 74,751 81,562 87,334 93,557 100,272
Sales MU 59 73 84 97 112
Revenue from Fixed Charges Rs. Crs. - - - - -
Revenue from Variable ChargesRs. Crs. - - - - -
Total Revenue Rs. Crs. 33 42 47 54 61
Temporary
Consumers Nos. 126 26 34 44 57
Connected Load KW 854 197 247 310 389
Sales MU 2 1 1 2 3
Revenue from Fixed Charges Rs. Crs.
Revenue from Variable ChargesRs. Crs.
Total Revenue Rs. Crs. 1 1 1 1 2
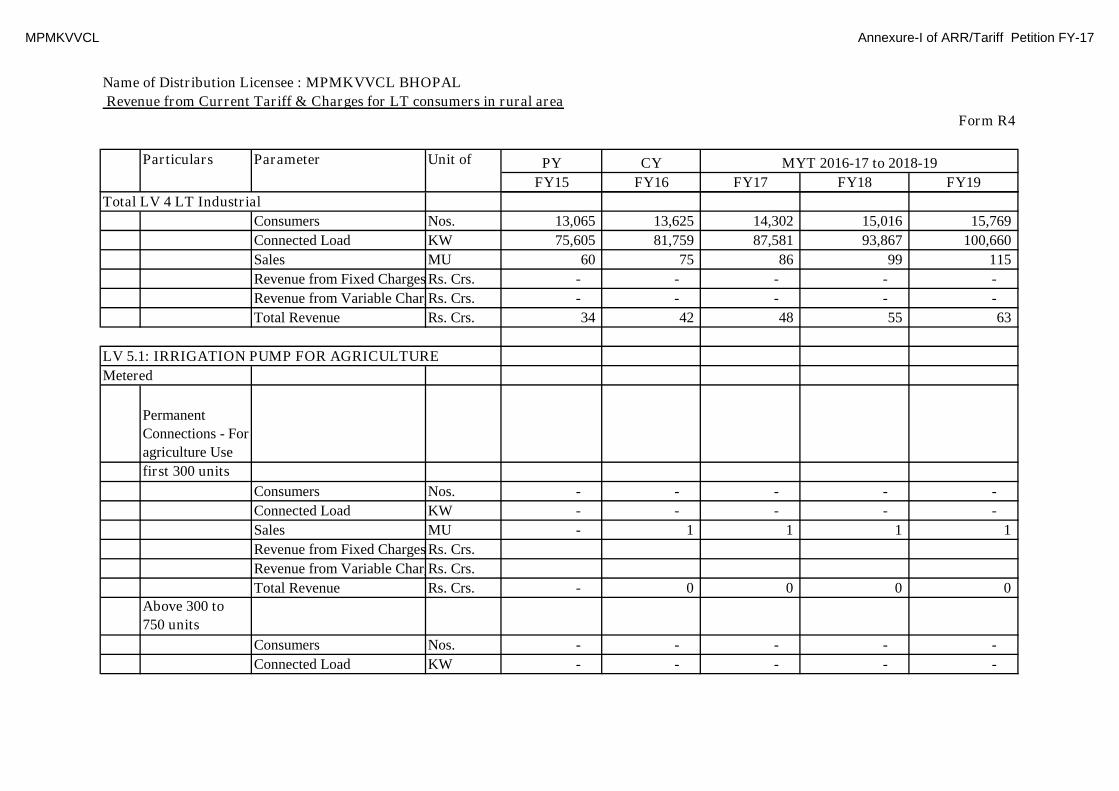
MPMKVVCL Annexure-I of ARR/Tariff Petition FY-17
Name of Distribution Licensee : MPMKVVCL BHOPAL
Revenue from Current Tariff & Charges for LT consumers in rural area
Form R4
Particulars Parameter Unit of
measuremPY CY
FY15 FY16 FY17 FY18 FY19
MYT 2016-17 to 2018-19
Total LV 4 LT Industrial
Consumers Nos. 13,065 13,625 14,302 15,016 15,769
Connected Load KW 75,605 81,759 87,581 93,867 100,660
Sales MU 60 75 86 99 115
Revenue from Fixed Charges Rs. Crs. - - - - -
Revenue from Variable ChargesRs. Crs. - - - - -
Total Revenue Rs. Crs. 34 42 48 55 63
LV 5.1: IRRIGATION PUMP FOR AGRICULTURE
Metered
Permanent
Connections - For
agriculture Use
first 300 units
Consumers Nos. - - - - -
Connected Load KW - - - - -
Sales MU - 1 1 1 1
Revenue from Fixed Charges Rs. Crs.
Revenue from Variable ChargesRs. Crs.
Total Revenue Rs. Crs. - 0 0 0 0Above 300 to
750 units
Consumers Nos. - - - - -
Connected Load KW - - - - -

MPMKVVCL Annexure-I of ARR/Tariff Petition FY-17
Name of Distribution Licensee : MPMKVVCL BHOPAL
Revenue from Current Tariff & Charges for LT consumers in rural area
Form R4
Particulars Parameter Unit of
measuremPY CY
FY15 FY16 FY17 FY18 FY19
MYT 2016-17 to 2018-19
Sales MU - 2 2 2 2
Revenue from Fixed Charges Rs. Crs.
Revenue from Variable ChargesRs. Crs.
Total Revenue Rs. Crs. - 1 1 1 1
Above 750 Units
Consumers Nos. - - - - -
Connected Load KW - - - - -
Sales MU - 28 30 33 37
Revenue from Fixed Charges Rs. Crs.
Revenue from Variable ChargesRs. Crs.
Total Revenue Rs. Crs. - 13 14 15 17Temporary
Connections
Consumers Nos. 174 238 330 463 655
Connected Load KW 643 683 724 774 834
Sales MU 2 2 2 2 2
Revenue from Fixed Charges Rs. Crs.
Revenue from Variable ChargesRs. Crs.
Total Revenue Rs. Crs. 1 1 1 1 1
Sub-Total
Metered
connections
Consumers Nos. 1,089 1,457 1,702 2,041 2,513
Connected Load KW 11,999 13,127 13,763 14,643 15,864

MPMKVVCL Annexure-I of ARR/Tariff Petition FY-17
Name of Distribution Licensee : MPMKVVCL BHOPAL
Revenue from Current Tariff & Charges for LT consumers in rural area
Form R4
Particulars Parameter Unit of
measuremPY CY
FY15 FY16 FY17 FY18 FY19
MYT 2016-17 to 2018-19
Sales MU 28 32 34 37 41
Revenue from Fixed Charges Rs. Crs.
Revenue from Variable ChargesRs. Crs.
Total Revenue Rs. Crs. 10 15 16 17 19
un- metered consumers
Permanent
Connections - For
agriculture Use
first 300 units
Consumers Nos. - - - - -
Connected Load KW - - - - -
Sales MU - 160 193 234 283
Revenue from Fixed Charges Rs. Crs.
Revenue from Variable ChargesRs. Crs.
Total Revenue Rs. Crs. - 57 69 83 100Above 300 to
750 units
Consumers Nos. - - - - -
Connected Load KW - - - - -
Sales MU - 2,476 2,733 3,019 3,335
Revenue from Fixed Charges Rs. Crs.
Revenue from Variable ChargesRs. Crs.
Total Revenue Rs. Crs. - 1,040 1,148 1,268 1,401

MPMKVVCL Annexure-I of ARR/Tariff Petition FY-17
Name of Distribution Licensee : MPMKVVCL BHOPAL
Revenue from Current Tariff & Charges for LT consumers in rural area
Form R4
Particulars Parameter Unit of
measuremPY CY
FY15 FY16 FY17 FY18 FY19
MYT 2016-17 to 2018-19
Above 750 Units
Consumers Nos. - - - - -
Connected Load KW - - - - -
Sales MU - 1,181 1,451 1,814 2,312
Revenue from Fixed Charges Rs. Crs.
Revenue from Variable ChargesRs. Crs.
Total Revenue Rs. Crs. - 532 653 817 1,040Temporary
Connections
Consumers Nos. 36,749 36,749 36,749 36,749 36,749
Connected Load KW 124,448 122,930 122,930 122,930 122,930
Sales MU 579 528 528 528 528
Revenue from Fixed Charges Rs. Crs.
Revenue from Variable ChargesRs. Crs.
Total Revenue Rs. Crs. 232 249 249 249 249
Sub-Total Un-
Metered
connections
Consumers Nos. 408,150 484,805 583,148 710,663 877,534
Connected Load KW 1,782,239 2,017,656 2,296,208 2,638,601 3,067,402
Sales MU 5,142 4,345 4,906 5,595 6,458
Revenue from Fixed Charges Rs. Crs.
Revenue from Variable ChargesRs. Crs.
Total Revenue Rs. Crs. 1,469 1,953 2,206 2,517 2,909
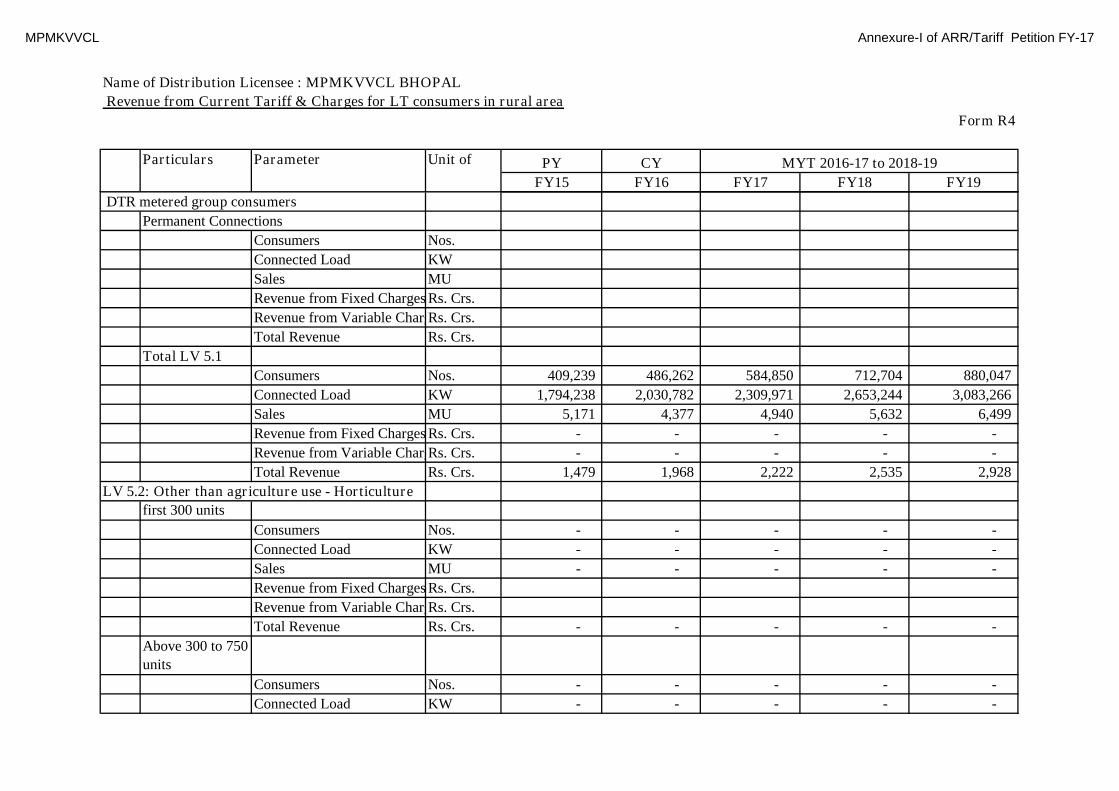
MPMKVVCL Annexure-I of ARR/Tariff Petition FY-17
Name of Distribution Licensee : MPMKVVCL BHOPAL
Revenue from Current Tariff & Charges for LT consumers in rural area
Form R4
Particulars Parameter Unit of
measuremPY CY
FY15 FY16 FY17 FY18 FY19
MYT 2016-17 to 2018-19
DTR metered group consumers
Permanent Connections
Consumers Nos.
Connected Load KW
Sales MU
Revenue from Fixed Charges Rs. Crs.
Revenue from Variable ChargesRs. Crs.
Total Revenue Rs. Crs.
Total LV 5.1
Consumers Nos. 409,239 486,262 584,850 712,704 880,047
Connected Load KW 1,794,238 2,030,782 2,309,971 2,653,244 3,083,266
Sales MU 5,171 4,377 4,940 5,632 6,499
Revenue from Fixed Charges Rs. Crs. - - - - -
Revenue from Variable ChargesRs. Crs. - - - - -
Total Revenue Rs. Crs. 1,479 1,968 2,222 2,535 2,928
LV 5.2: Other than agriculture use - Horticulture
first 300 units
Consumers Nos. - - - - -
Connected Load KW - - - - -
Sales MU - - - - -
Revenue from Fixed Charges Rs. Crs.
Revenue from Variable ChargesRs. Crs.
Total Revenue Rs. Crs. - - - - -
Above 300 to 750
units
Consumers Nos. - - - - -
Connected Load KW - - - - -
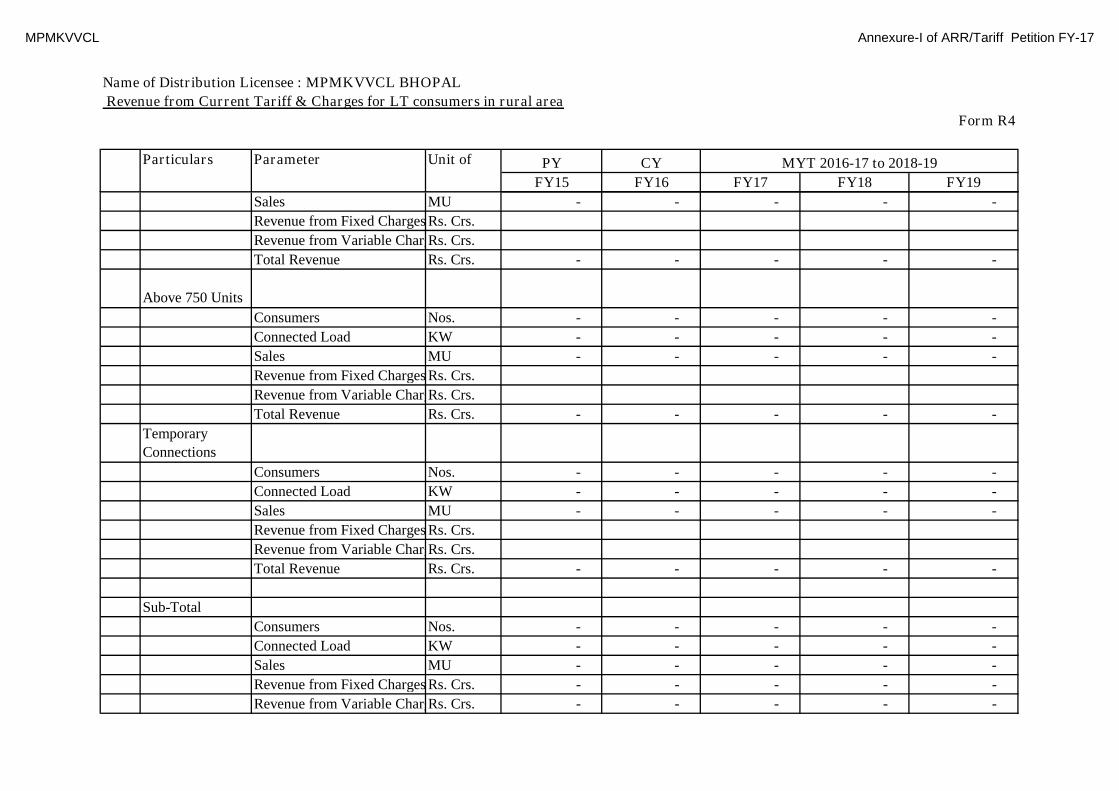
MPMKVVCL Annexure-I of ARR/Tariff Petition FY-17
Name of Distribution Licensee : MPMKVVCL BHOPAL
Revenue from Current Tariff & Charges for LT consumers in rural area
Form R4
Particulars Parameter Unit of
measuremPY CY
FY15 FY16 FY17 FY18 FY19
MYT 2016-17 to 2018-19
Sales MU - - - - -
Revenue from Fixed Charges Rs. Crs.
Revenue from Variable ChargesRs. Crs.
Total Revenue Rs. Crs. - - - - -
Above 750 Units
Consumers Nos. - - - - -
Connected Load KW - - - - -
Sales MU - - - - -
Revenue from Fixed Charges Rs. Crs.
Revenue from Variable ChargesRs. Crs.
Total Revenue Rs. Crs. - - - - -
Temporary
Connections
Consumers Nos. - - - - -
Connected Load KW - - - - -
Sales MU - - - - -
Revenue from Fixed Charges Rs. Crs.
Revenue from Variable ChargesRs. Crs.
Total Revenue Rs. Crs. - - - - -
Sub-Total
Consumers Nos. - - - - -
Connected Load KW - - - - -
Sales MU - - - - -
Revenue from Fixed Charges Rs. Crs. - - - - -
Revenue from Variable ChargesRs. Crs. - - - - -

MPMKVVCL Annexure-I of ARR/Tariff Petition FY-17
Name of Distribution Licensee : MPMKVVCL BHOPAL
Revenue from Current Tariff & Charges for LT consumers in rural area
Form R4
Particulars Parameter Unit of
measuremPY CY
FY15 FY16 FY17 FY18 FY19
MYT 2016-17 to 2018-19
Total Revenue Rs. Crs. - - - - -
5.3 For other than agriculture use
Upto 25 HP in
Rural Area
Consumers Nos. 338 385 462 555 666
Connected Load KW 2,055 1,984 2,381 2,857 3,429
Sales MU 206 17 20 24 29
Revenue from Fixed Charges Rs. Crs.
Revenue from Variable ChargesRs. Crs.
Total Revenue Rs. Crs. 1 7 8 10 12
Demand base Tariff Upto 100HP- Rural area
Consumers Nos. - 20 20 20 20
Connected Load KW - 442 442 442 442
Sales MU - 0 0 0 0
Revenue from Fixed Charges Rs. Crs.
Revenue from Variable ChargesRs. Crs.
Total Revenue Rs. Crs. - 0 0 0 0
Temporary Connections Rural area
Consumers Nos. 19 20 20 20 20
Connected Load KW 57 77 77 77 77
Sales MU 0 1 1 1 1
Revenue from Fixed Charges Rs. Crs.
Revenue from Variable ChargesRs. Crs.
Total Revenue Rs. Crs. 0 0 0 0 0
` Sub-Total
Consumers Nos. 357 425 502 595 706

MPMKVVCL Annexure-I of ARR/Tariff Petition FY-17
Name of Distribution Licensee : MPMKVVCL BHOPAL
Revenue from Current Tariff & Charges for LT consumers in rural area
Form R4
Particulars Parameter Unit of
measuremPY CY
FY15 FY16 FY17 FY18 FY19
MYT 2016-17 to 2018-19
Connected Load KW 2,112 2,503 2,900 3,376 3,948
Sales MU 206 18 21 25 30
Revenue from Fixed Charges Rs. Crs. - - - - -
Revenue from Variable ChargesRs. Crs. - - - - -
Total Revenue Rs. Crs. 1 7 9 10 12
TOTAL LV 5 AGRICULTURE
Consumers Nos. 409,596 486,687 585,353 713,299 880,753
Connected Load KW 1,796,350 2,033,286 2,312,871 2,656,621 3,087,214
Sales MU 5,376 4,395 4,961 5,657 6,528
Revenue from Fixed Charges Rs. Crs. - - - - -
Revenue from Variable ChargesRs. Crs. - - - - -
Total Revenue Rs. Crs. 1,480 1,975 2,231 2,545 2,940
TOTAL LOW TENSION- RURAL AREA
Consumers Nos. 1,623,164 1,841,823 2,111,430 2,323,155 2,640,002
Connected Load KW 2,481,856 2,791,574 3,179,557 3,621,789 4,141,909
Sales MU 6,602 5,812 6,771 7,856 9,328
Revenue from Fixed ChargesRs. Crs. - - - - -
Revenue from Variable ChargesRs. Crs. - - - - -
Total Revenue Rs. Crs. 2,061 2,637 3,120 3,666 4,416

MPMKVVCL Annexure-I of ARR/Tariff Petition FY-17
Revenue from Current Tariff & Charges
Form R5
Old Years PY CY
FY14 FY15 FY16 FY17 FY18 FY19
LOW TENSION
LV 1: DOMESTIC
Metered
Basic Rate
0 to 30 Units Consumers Nos. 638,011 716,358 809,353 945,948 1,000,998 1,127,902
Connected Load KW 369,264 413,422 451,107 503,191 540,483 594,445
Sales MU 290 445 253 298 315 354
Revenue from Fixed ChargesRs. Crs. - - - - - -
Revenue from Variable ChargesRs. Crs. - - - - - -
Total Revenue Rs. Crs. 130 205 73 86 91 103
Upto 50 units
Consumers Nos. 168,258 166,401 180,079 197,447 209,119 226,610
Connected Load KW 168,733 171,634 184,593 199,024 211,873 227,434
Sales MU 84 66 102 115 122 132
Revenue from Fixed ChargesRs. Crs. - - - - - -
Revenue from Variable ChargesRs. Crs. - - - - - -
Total Revenue Rs. Crs. 37 31 43 48 51 55
51 to 100 units
Consumers Nos. 626,021 700,086 740,661 846,837 896,381 996,984
Connected Load KW 586,758 655,323 712,761 789,168 846,027 925,711
Sales MU 533 612 800 948 1,012 1,124
Revenue from Fixed ChargesRs. Crs. - - - - - -
Revenue from Variable ChargesRs. Crs. - - - - - -
Total Revenue Rs. Crs. 231 277 345 407 434 482
101 to 300 units
Particulars Parameter Unit of
measure-
ment MYT 2016-17 to 2018-19
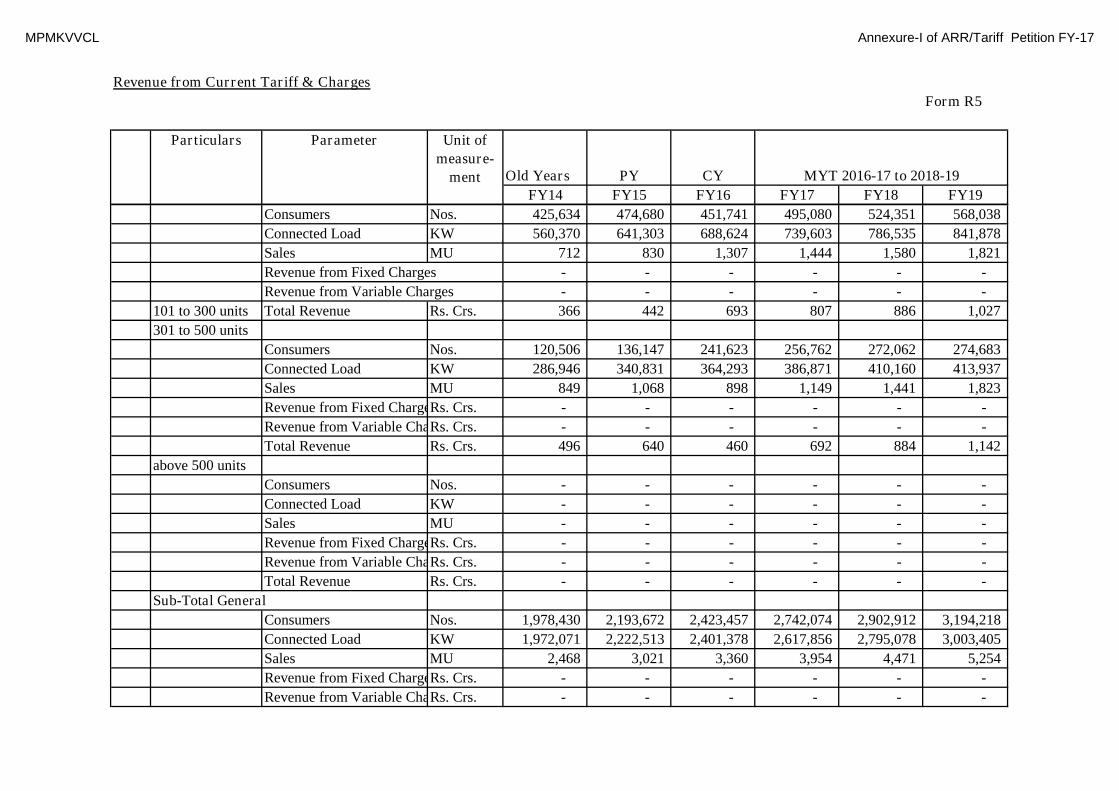
MPMKVVCL Annexure-I of ARR/Tariff Petition FY-17
Revenue from Current Tariff & Charges
Form R5
Old Years PY CY
FY14 FY15 FY16 FY17 FY18 FY19
Particulars Parameter Unit of
measure-
ment MYT 2016-17 to 2018-19
Consumers Nos. 425,634 474,680 451,741 495,080 524,351 568,038
Connected Load KW 560,370 641,303 688,624 739,603 786,535 841,878
Sales MU 712 830 1,307 1,444 1,580 1,821
Revenue from Fixed Charges - - - - - -
Revenue from Variable Charges - - - - - -
101 to 300 units Total Revenue Rs. Crs. 366 442 693 807 886 1,027
301 to 500 units
Consumers Nos. 120,506 136,147 241,623 256,762 272,062 274,683
Connected Load KW 286,946 340,831 364,293 386,871 410,160 413,937
Sales MU 849 1,068 898 1,149 1,441 1,823
Revenue from Fixed ChargesRs. Crs. - - - - - -
Revenue from Variable ChargesRs. Crs. - - - - - -
Total Revenue Rs. Crs. 496 640 460 692 884 1,142
above 500 units
Consumers Nos. - - - - - -
Connected Load KW - - - - - -
Sales MU - - - - - -
Revenue from Fixed ChargesRs. Crs. - - - - - -
Revenue from Variable ChargesRs. Crs. - - - - - -
Total Revenue Rs. Crs. - - - - - -
Sub-Total General
Consumers Nos. 1,978,430 2,193,672 2,423,457 2,742,074 2,902,912 3,194,218
Connected Load KW 1,972,071 2,222,513 2,401,378 2,617,856 2,795,078 3,003,405
Sales MU 2,468 3,021 3,360 3,954 4,471 5,254
Revenue from Fixed ChargesRs. Crs. - - - - - -
Revenue from Variable ChargesRs. Crs. - - - - - -
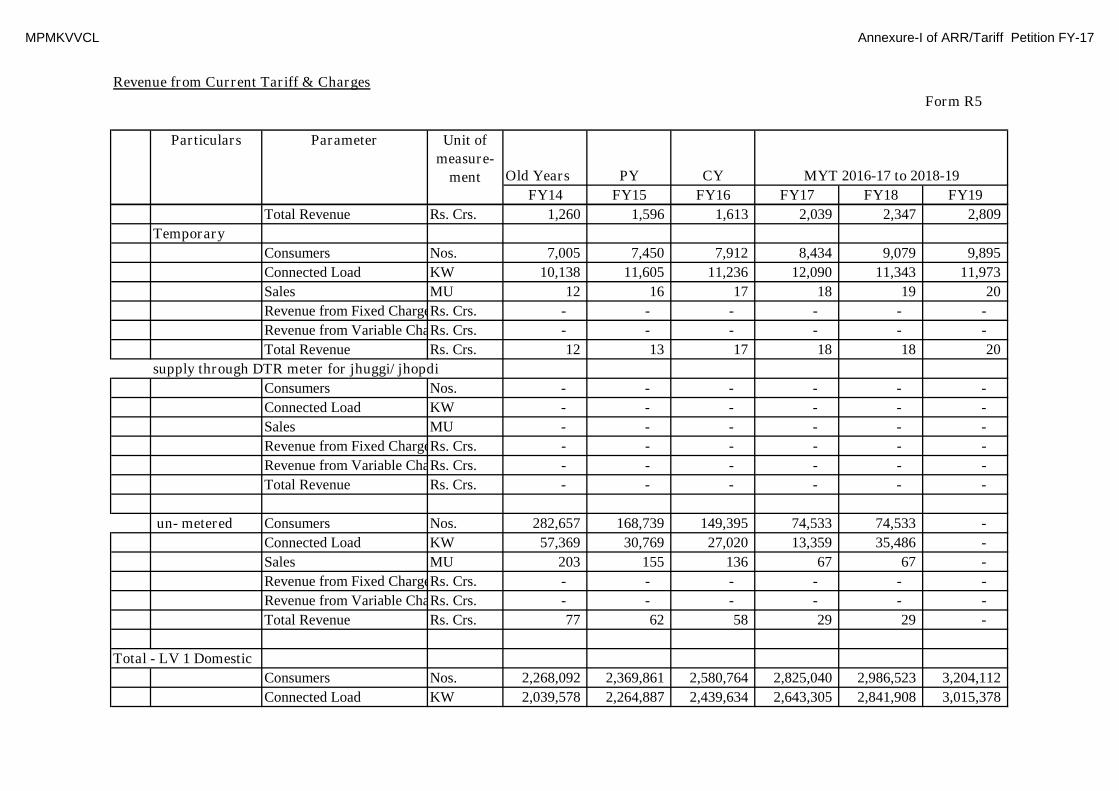
MPMKVVCL Annexure-I of ARR/Tariff Petition FY-17
Revenue from Current Tariff & Charges
Form R5
Old Years PY CY
FY14 FY15 FY16 FY17 FY18 FY19
Particulars Parameter Unit of
measure-
ment MYT 2016-17 to 2018-19
Total Revenue Rs. Crs. 1,260 1,596 1,613 2,039 2,347 2,809
Temporary
Consumers Nos. 7,005 7,450 7,912 8,434 9,079 9,895
Connected Load KW 10,138 11,605 11,236 12,090 11,343 11,973
Sales MU 12 16 17 18 19 20
Revenue from Fixed ChargesRs. Crs. - - - - - -
Revenue from Variable ChargesRs. Crs. - - - - - -
Total Revenue Rs. Crs. 12 13 17 18 18 20
supply through DTR meter for jhuggi/ jhopdi
Consumers Nos. - - - - - -
Connected Load KW - - - - - -
Sales MU - - - - - -
Revenue from Fixed ChargesRs. Crs. - - - - - -
Revenue from Variable ChargesRs. Crs. - - - - - -
Total Revenue Rs. Crs. - - - - - -
un- metered Consumers Nos. 282,657 168,739 149,395 74,533 74,533 -
Connected Load KW 57,369 30,769 27,020 13,359 35,486 -
Sales MU 203 155 136 67 67 -
Revenue from Fixed ChargesRs. Crs. - - - - - -
Revenue from Variable ChargesRs. Crs. - - - - - -
Total Revenue Rs. Crs. 77 62 58 29 29 -
Total - LV 1 Domestic
Consumers Nos. 2,268,092 2,369,861 2,580,764 2,825,040 2,986,523 3,204,112
Connected Load KW 2,039,578 2,264,887 2,439,634 2,643,305 2,841,908 3,015,378
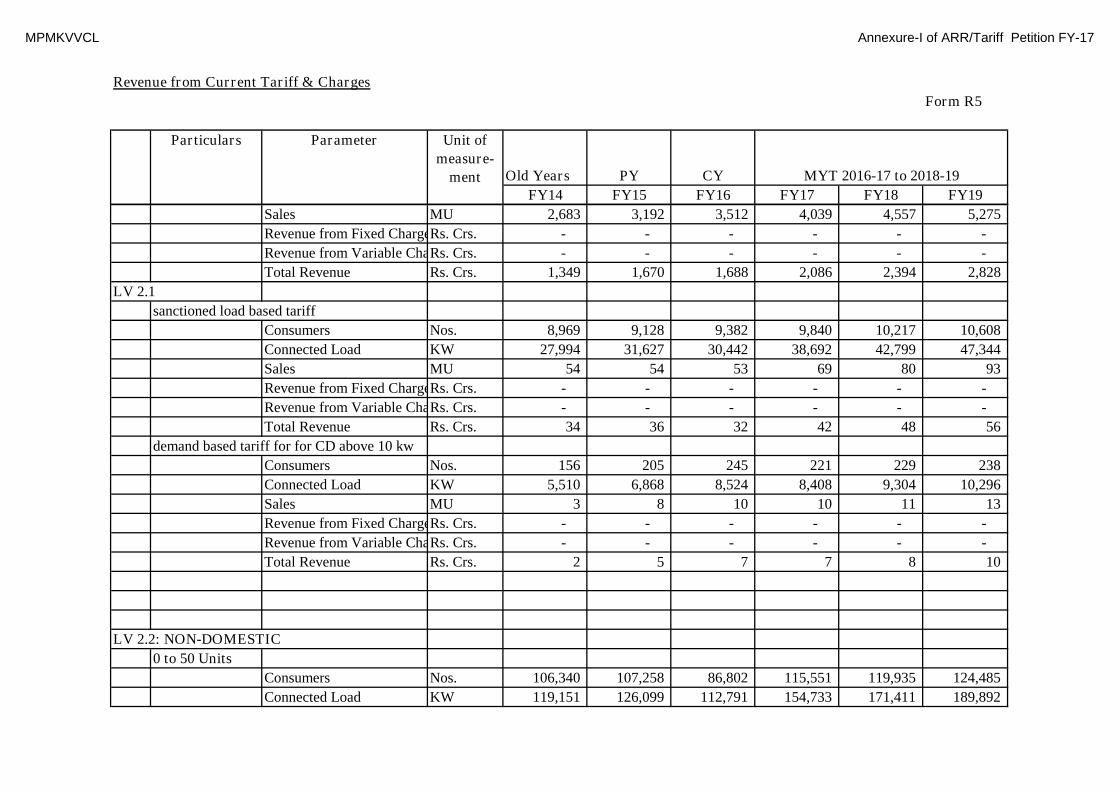
MPMKVVCL Annexure-I of ARR/Tariff Petition FY-17
Revenue from Current Tariff & Charges
Form R5
Old Years PY CY
FY14 FY15 FY16 FY17 FY18 FY19
Particulars Parameter Unit of
measure-
ment MYT 2016-17 to 2018-19
Sales MU 2,683 3,192 3,512 4,039 4,557 5,275
Revenue from Fixed ChargesRs. Crs. - - - - - -
Revenue from Variable ChargesRs. Crs. - - - - - -
Total Revenue Rs. Crs. 1,349 1,670 1,688 2,086 2,394 2,828
LV 2.1
sanctioned load based tariff
Consumers Nos. 8,969 9,128 9,382 9,840 10,217 10,608
Connected Load KW 27,994 31,627 30,442 38,692 42,799 47,344
Sales MU 54 54 53 69 80 93
Revenue from Fixed ChargesRs. Crs. - - - - - -
Revenue from Variable ChargesRs. Crs. - - - - - -
Total Revenue Rs. Crs. 34 36 32 42 48 56
demand based tariff for for CD above 10 kw
Consumers Nos. 156 205 245 221 229 238
Connected Load KW 5,510 6,868 8,524 8,408 9,304 10,296
Sales MU 3 8 10 10 11 13
Revenue from Fixed ChargesRs. Crs. - - - - - -
Revenue from Variable ChargesRs. Crs. - - - - - -
Total Revenue Rs. Crs. 2 5 7 7 8 10
LV 2.2: NON-DOMESTIC
0 to 50 Units
Consumers Nos. 106,340 107,258 86,802 115,551 119,935 124,485
Connected Load KW 119,151 126,099 112,791 154,733 171,411 189,892

MPMKVVCL Annexure-I of ARR/Tariff Petition FY-17
Revenue from Current Tariff & Charges
Form R5
Old Years PY CY
FY14 FY15 FY16 FY17 FY18 FY19
Particulars Parameter Unit of
measure-
ment MYT 2016-17 to 2018-19
Sales MU 28 27 25 35 41 48
Revenue from Fixed ChargesRs. Crs. - - - - - -
Revenue from Variable ChargesRs. Crs. - - - - - -
Total Revenue Rs. Crs. 32 32 22 30 35 40
Above 50 units
Consumers Nos. 106,911 115,086 143,686 124,009 128,727 133,625
Connected Load KW 294,947 321,815 379,729 393,463 435,101 481,172
Sales MU 447 460 499 588 683 793
Revenue from Fixed ChargesRs. Crs. - - - - - -
Revenue from Variable ChargesRs. Crs. - - - - - -
Total Revenue Rs. Crs. 311 325 366 425 491 568
Demand based tariff for for CD above 10 kw
Consumers Nos. 2,713 3,564 4,066 3,839 3,985 4,136
Connected Load KW 83,379 106,621 124,820 131,072 145,328 161,138
Sales MU 74 116 149 149 174 203
Revenue from Fixed ChargesRs. Crs. - - - - - -
Revenue from Variable ChargesRs. Crs. - - - - - -
Total Revenue Rs. Crs. 52 81 118 120 137 158
Sub-Total General
Consumers Nos. 225,089 235,241 244,181 253,461 263,093 273,092
Connected Load KW 530,981 593,030 656,307 726,368 803,944 889,843
Sales MU 606 664 735 852 990 1,150
Revenue from Fixed ChargesRs. Crs. - - - - - -
Revenue from Variable ChargesRs. Crs. - - - - - -

MPMKVVCL Annexure-I of ARR/Tariff Petition FY-17
Revenue from Current Tariff & Charges
Form R5
Old Years PY CY
FY14 FY15 FY16 FY17 FY18 FY19
Particulars Parameter Unit of
measure-
ment MYT 2016-17 to 2018-19
Total Revenue Rs. Crs. 431 479 544 624 720 831
Temporary
Consumers Nos. 5,522 5,150 5,194 5,241 5,290 5,341
Connected Load KW 32,666 28,717 33,693 33,888 34,092 34,307
Sales MU 35 40 49 50 51 52
Revenue from Fixed ChargesRs. Crs. - - - - - -
Revenue from Variable ChargesRs. Crs. - - - - - -
Total Revenue Rs. Crs. 31 36 44 44 45 46
Total LV 2 Non-Domestic
Consumers Nos. 230,611 240,391 249,375 258,702 268,383 278,433
Connected Load KW 563,647 621,747 690,000 760,256 838,036 924,150
Sales MU 640 704 784 901 1,040 1,202
Revenue from Fixed ChargesRs. Crs. - - - - - -
Revenue from Variable ChargesRs. Crs. - - - - - -
Total Revenue Rs. Crs. 462 515 588 668 765 877
LV 3: PUBLIC WATER WORKS AND STREET LIGHTS
PUBLIC WATER WORKS
Municipal Corporation/ Cantonment Board
Consumers Nos. 3,578 3,433 3,438 3,438 3,438 3,438
Connected Load KW 24,525 23,850 24,114 24,345 24,579 24,814
Sales MU 73 76 79 82 85 89
Revenue from Fixed ChargesRs. Crs. - - - - - -
Revenue from Variable ChargesRs. Crs. - - - - - -
Total Revenue Rs. Crs. 33 35 37 39 40 42
Municipality / Nagar Panchayat

MPMKVVCL Annexure-I of ARR/Tariff Petition FY-17
Revenue from Current Tariff & Charges
Form R5
Old Years PY CY
FY14 FY15 FY16 FY17 FY18 FY19
Particulars Parameter Unit of
measure-
ment MYT 2016-17 to 2018-19
Consumers Nos. 1,918 2,041 2,176 2,319 2,473 2,637
Connected Load KW 15,597 16,250 17,387 18,606 19,914 21,315
Sales MU 66 72 82 92 104 117
Revenue from Fixed ChargesRs. Crs. - - - - - -
Revenue from Variable ChargesRs. Crs. - - - - - -
Total Revenue Rs. Crs. 27 31 37 41 46 52
Gram Panchayat
Consumers Nos. 2,831 3,269 3,704 4,198 4,760 5,399
Connected Load KW 12,979 14,821 16,891 19,229 21,912 24,994
Sales MU 32 47 69 101 149 220
Revenue from Fixed ChargesRs. Crs. - - - - - -
Revenue from Variable ChargesRs. Crs. - - - - - -
Total Revenue Rs. Crs. 13 20 29 43 62 91
Sub-Total General
Consumers Nos. 8,327 8,743 9,318 9,956 10,671 11,474
Connected Load KW 53,101 54,921 58,392 62,181 66,404 71,123
Sales MU 170 195 229 275 338 426
Revenue from Fixed ChargesRs. Crs. - - - - - -
Revenue from Variable ChargesRs. Crs. - - - - - -
Total Revenue Rs. Crs. 73 86 103 123 149 185
Temporary
Consumers Nos. 242 185 185 185 185 185
Connected Load KW 1,561 1,220 1,313 1,396 1,485 1,582
Sales MU 6 5 4 5 6 7
Revenue from Fixed ChargesRs. Crs. - - - - - -
Revenue from Variable ChargesRs. Crs. - - - - - -

MPMKVVCL Annexure-I of ARR/Tariff Petition FY-17
Revenue from Current Tariff & Charges
Form R5
Old Years PY CY
FY14 FY15 FY16 FY17 FY18 FY19
Particulars Parameter Unit of
measure-
ment MYT 2016-17 to 2018-19
Total Revenue Rs. Crs. 3 3 2 3 3 4
Sub-Total Public Water Works
Consumers Nos. 8,569 8,928 9,503 10,141 10,856 11,659
Connected Load KW 54,662 56,141 59,705 63,577 67,889 72,706
Sales MU 176 200 233 280 344 433
Revenue from Fixed ChargesRs. Crs. - - - - - -
Revenue from Variable ChargesRs. Crs. - - - - - -
Total Revenue Rs. Crs. 76 89 106 125 152 189
STREET LIGHTS (incl. Traffic Signals)
Municipal Corporation/ Cantonment Board
Consumers Nos. 1,120 1,130 1,204 1,255 1,308 1,364
Connected Load KW 11,035 10,932 11,850 12,356 12,884 13,434
Sales MU 51 47 48 53 57 63
Revenue from Fixed ChargesRs. Crs. - - - - - -
Revenue from Variable ChargesRs. Crs. - - - - - -
Total Revenue Rs. Crs. 0 24 24 26 28 31
Municipality / Nagar Panchayat
Consumers Nos. 702 748 801 853 909 968
Connected Load KW 11,289 11,878 12,826 13,823 14,897 16,055
Sales MU 42 48 57 68 81 96
Revenue from Fixed ChargesRs. Crs. - - - - - -
Revenue from Variable ChargesRs. Crs. - - - - - -
Total Revenue Rs. Crs. 0 22 28 32 38 44
Gram Panchayat
Consumers Nos. 661 687 718 754 797 848
Connected Load KW 1,133 1,396 1,664 2,019 2,526 3,261
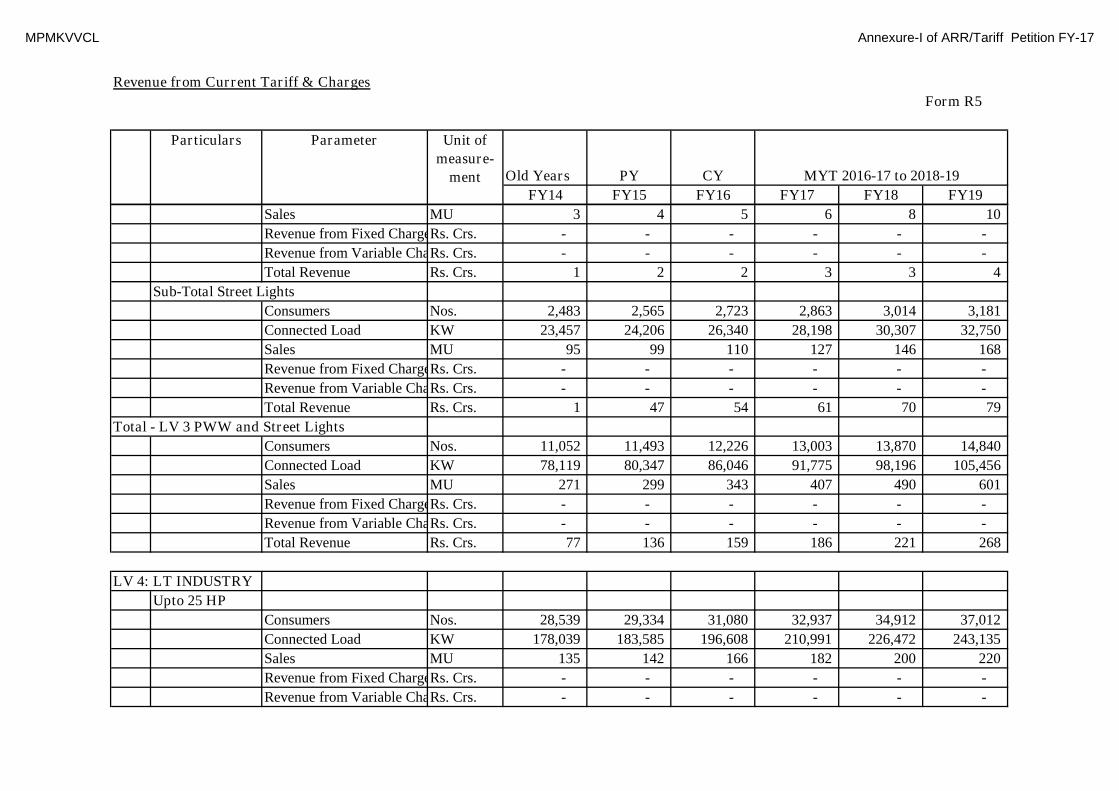
MPMKVVCL Annexure-I of ARR/Tariff Petition FY-17
Revenue from Current Tariff & Charges
Form R5
Old Years PY CY
FY14 FY15 FY16 FY17 FY18 FY19
Particulars Parameter Unit of
measure-
ment MYT 2016-17 to 2018-19
Sales MU 3 4 5 6 8 10
Revenue from Fixed ChargesRs. Crs. - - - - - -
Revenue from Variable ChargesRs. Crs. - - - - - -
Total Revenue Rs. Crs. 1 2 2 3 3 4
Sub-Total Street Lights
Consumers Nos. 2,483 2,565 2,723 2,863 3,014 3,181
Connected Load KW 23,457 24,206 26,340 28,198 30,307 32,750
Sales MU 95 99 110 127 146 168
Revenue from Fixed ChargesRs. Crs. - - - - - -
Revenue from Variable ChargesRs. Crs. - - - - - -
Total Revenue Rs. Crs. 1 47 54 61 70 79
Total - LV 3 PWW and Street Lights
Consumers Nos. 11,052 11,493 12,226 13,003 13,870 14,840
Connected Load KW 78,119 80,347 86,046 91,775 98,196 105,456
Sales MU 271 299 343 407 490 601
Revenue from Fixed ChargesRs. Crs. - - - - - -
Revenue from Variable ChargesRs. Crs. - - - - - -
Total Revenue Rs. Crs. 77 136 159 186 221 268
LV 4: LT INDUSTRY
Upto 25 HP
Consumers Nos. 28,539 29,334 31,080 32,937 34,912 37,012
Connected Load KW 178,039 183,585 196,608 210,991 226,472 243,135
Sales MU 135 142 166 182 200 220
Revenue from Fixed ChargesRs. Crs. - - - - - -
Revenue from Variable ChargesRs. Crs. - - - - - -
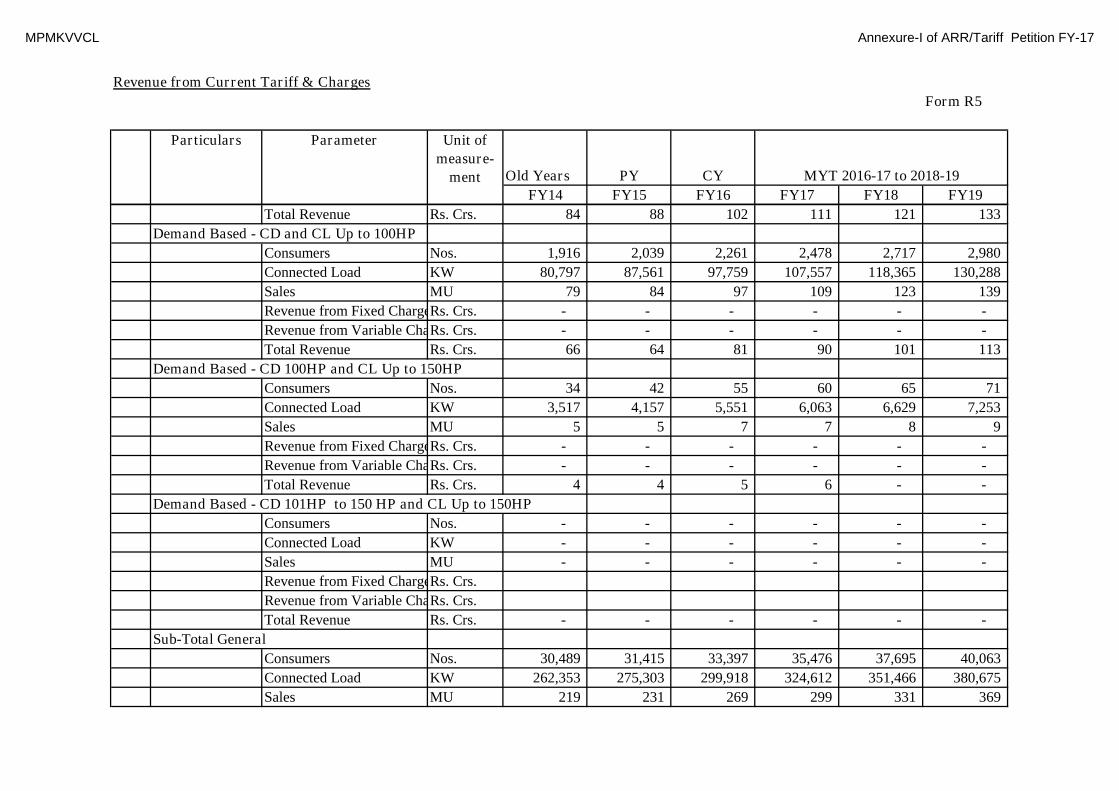
MPMKVVCL Annexure-I of ARR/Tariff Petition FY-17
Revenue from Current Tariff & Charges
Form R5
Old Years PY CY
FY14 FY15 FY16 FY17 FY18 FY19
Particulars Parameter Unit of
measure-
ment MYT 2016-17 to 2018-19
Total Revenue Rs. Crs. 84 88 102 111 121 133
Demand Based - CD and CL Up to 100HP
Consumers Nos. 1,916 2,039 2,261 2,478 2,717 2,980
Connected Load KW 80,797 87,561 97,759 107,557 118,365 130,288
Sales MU 79 84 97 109 123 139
Revenue from Fixed ChargesRs. Crs. - - - - - -
Revenue from Variable ChargesRs. Crs. - - - - - -
Total Revenue Rs. Crs. 66 64 81 90 101 113
Demand Based - CD 100HP and CL Up to 150HP
Consumers Nos. 34 42 55 60 65 71
Connected Load KW 3,517 4,157 5,551 6,063 6,629 7,253
Sales MU 5 5 7 7 8 9
Revenue from Fixed ChargesRs. Crs. - - - - - -
Revenue from Variable ChargesRs. Crs. - - - - - -
Total Revenue Rs. Crs. 4 4 5 6 - -
Demand Based - CD 101HP to 150 HP and CL Up to 150HP
Consumers Nos. - - - - - -
Connected Load KW - - - - - -
Sales MU - - - - - -
Revenue from Fixed ChargesRs. Crs.
Revenue from Variable ChargesRs. Crs.
Total Revenue Rs. Crs. - - - - - -
Sub-Total General
Consumers Nos. 30,489 31,415 33,397 35,476 37,695 40,063
Connected Load KW 262,353 275,303 299,918 324,612 351,466 380,675
Sales MU 219 231 269 299 331 369

MPMKVVCL Annexure-I of ARR/Tariff Petition FY-17
Revenue from Current Tariff & Charges
Form R5
Old Years PY CY
FY14 FY15 FY16 FY17 FY18 FY19
Particulars Parameter Unit of
measure-
ment MYT 2016-17 to 2018-19
Revenue from Fixed ChargesRs. Crs. - - - - - -
Revenue from Variable ChargesRs. Crs. - - - - - -
Total Revenue Rs. Crs. 153.12 157 188 207 222 246
Temporary
Consumers Nos. 129 178 81 92 105 122
Connected Load KW 881 1,334 704 784 877 988
Sales MU 1 2 2 2 3 3
Revenue from Fixed ChargesRs. Crs. - - - - - -
Revenue from Variable ChargesRs. Crs. - - - - - -
Total Revenue Rs. Crs. 1 1 1 1 2 2
Total LV 4 LT Industrial
Consumers Nos. 30,618 31,593 33,478 35,568 37,800 40,185
Connected Load KW 263,234 276,637 300,623 325,395 352,343 381,663
Sales MU 221 233 271 301 334 372
Revenue from Fixed ChargesRs. Crs. - - - - - -
Revenue from Variable ChargesRs. Crs. - - - - - -
Total Revenue Rs. Crs. 153.78 157.71 188.90 208.52 223.89 247.74
LV 5.1: IRRIGATION PUMP FOR AGRICULTURE
Metered
Permanent
Connections - For
agriculture Use
first 300 units
Consumers Nos. - - - - - -
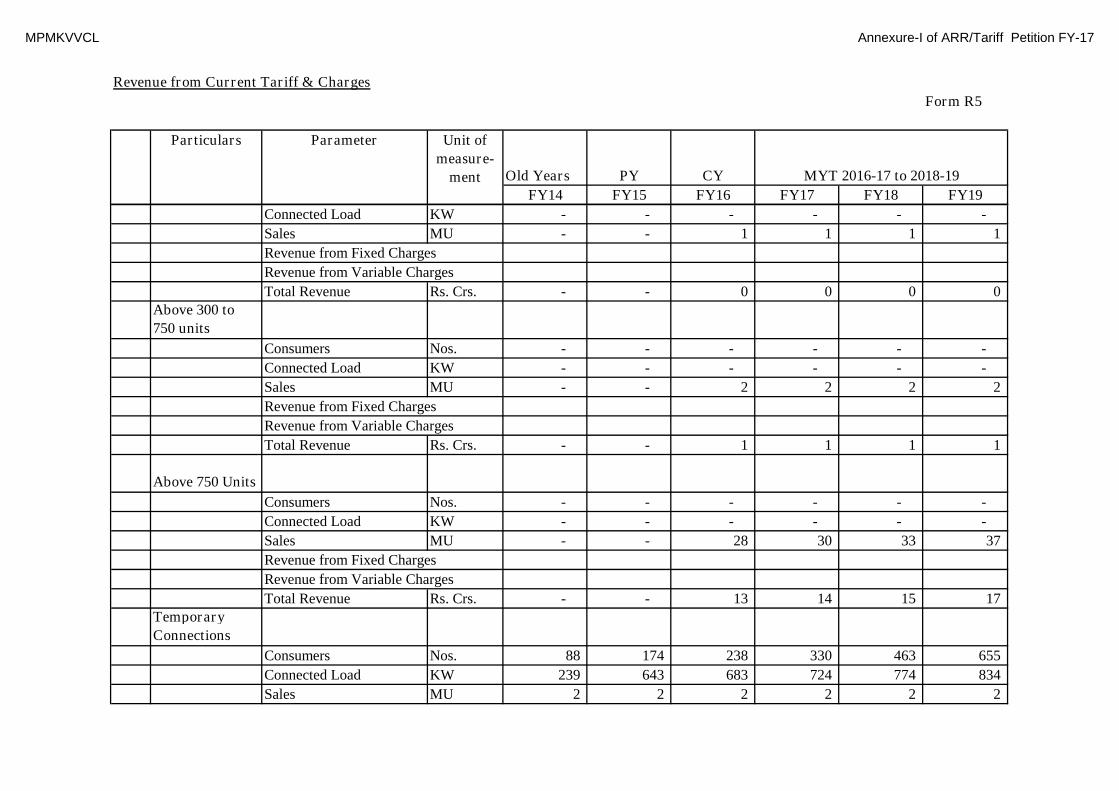
MPMKVVCL Annexure-I of ARR/Tariff Petition FY-17
Revenue from Current Tariff & Charges
Form R5
Old Years PY CY
FY14 FY15 FY16 FY17 FY18 FY19
Particulars Parameter Unit of
measure-
ment MYT 2016-17 to 2018-19
Connected Load KW - - - - - -
Sales MU - - 1 1 1 1
Revenue from Fixed Charges
Revenue from Variable Charges
Total Revenue Rs. Crs. - - 0 0 0 0Above 300 to
750 units
Consumers Nos. - - - - - -
Connected Load KW - - - - - -
Sales MU - - 2 2 2 2
Revenue from Fixed Charges
Revenue from Variable Charges
Total Revenue Rs. Crs. - - 1 1 1 1
Above 750 Units
Consumers Nos. - - - - - -
Connected Load KW - - - - - -
Sales MU - - 28 30 33 37
Revenue from Fixed Charges
Revenue from Variable Charges
Total Revenue Rs. Crs. - - 13 14 15 17Temporary
Connections
Consumers Nos. 88 174 238 330 463 655
Connected Load KW 239 643 683 724 774 834
Sales MU 2 2 2 2 2 2

MPMKVVCL Annexure-I of ARR/Tariff Petition FY-17
Revenue from Current Tariff & Charges
Form R5
Old Years PY CY
FY14 FY15 FY16 FY17 FY18 FY19
Particulars Parameter Unit of
measure-
ment MYT 2016-17 to 2018-19
Revenue from Fixed ChargesRs. Crs. - - - - - -
Revenue from Variable ChargesRs. Crs. - - - - - -
Total Revenue Rs. Crs. 1 1 1 1 1 1
Sub-Total
Metered
connections
Consumers Nos. 1,003 1,089 1,457 1,702 2,041 2,513
Connected Load KW 12,120 11,999 13,127 13,763 14,643 15,864
Sales MU 28.16 28 32 34 37 41
Revenue from Fixed Charges - - - - - -
Revenue from Variable Charges - - - - - -
Total Revenue Rs. Crs. 10.52 10 15 16 17 19
un- metered consumers
Permanent
Connections - For
agriculture Use
first 300 units
Consumers Nos. - - - - - -
Connected Load KW - - - - - -
Sales MU - - 160 193 234 283
Revenue from Fixed Charges
Revenue from Variable Charges
Total Revenue Rs. Crs. - - 57 69 83 100
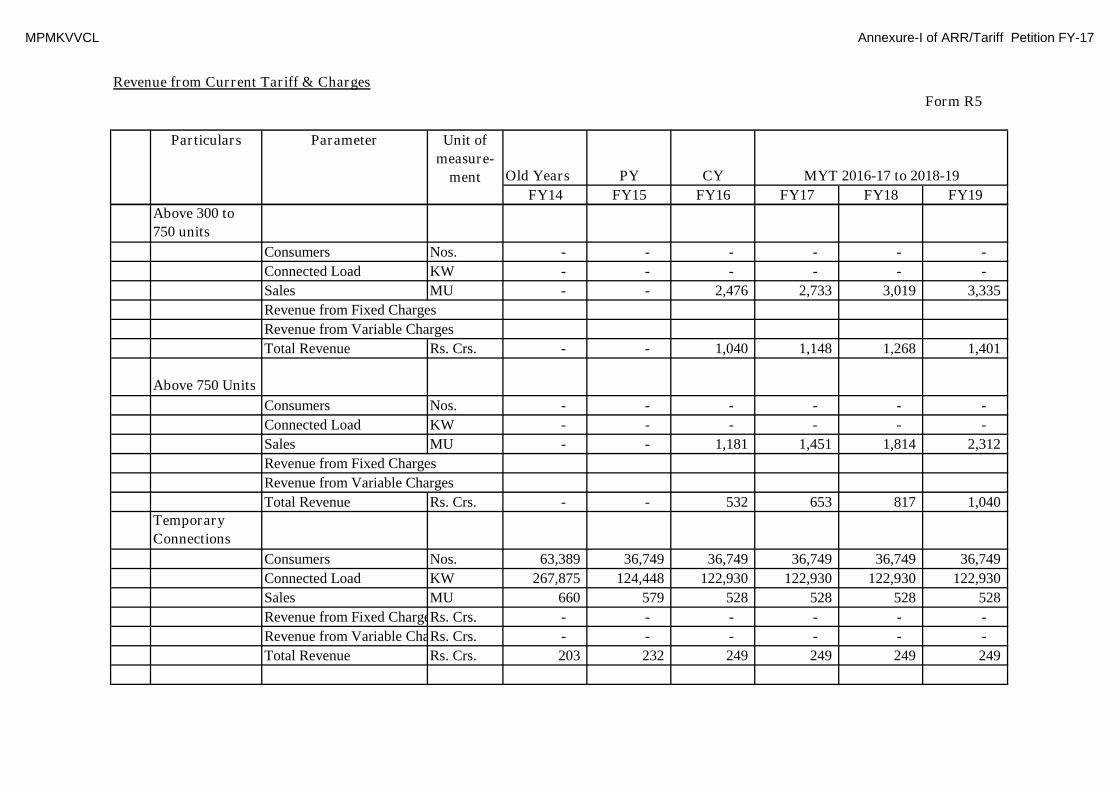
MPMKVVCL Annexure-I of ARR/Tariff Petition FY-17
Revenue from Current Tariff & Charges
Form R5
Old Years PY CY
FY14 FY15 FY16 FY17 FY18 FY19
Particulars Parameter Unit of
measure-
ment MYT 2016-17 to 2018-19
Above 300 to
750 units
Consumers Nos. - - - - - -
Connected Load KW - - - - - -
Sales MU - - 2,476 2,733 3,019 3,335
Revenue from Fixed Charges
Revenue from Variable Charges
Total Revenue Rs. Crs. - - 1,040 1,148 1,268 1,401
Above 750 Units
Consumers Nos. - - - - - -
Connected Load KW - - - - - -
Sales MU - - 1,181 1,451 1,814 2,312
Revenue from Fixed Charges
Revenue from Variable Charges
Total Revenue Rs. Crs. - - 532 653 817 1,040Temporary
Connections
Consumers Nos. 63,389 36,749 36,749 36,749 36,749 36,749
Connected Load KW 267,875 124,448 122,930 122,930 122,930 122,930
Sales MU 660 579 528 528 528 528
Revenue from Fixed ChargesRs. Crs. - - - - - -
Revenue from Variable ChargesRs. Crs. - - - - - -
Total Revenue Rs. Crs. 203 232 249 249 249 249

MPMKVVCL Annexure-I of ARR/Tariff Petition FY-17
Revenue from Current Tariff & Charges
Form R5
Old Years PY CY
FY14 FY15 FY16 FY17 FY18 FY19
Particulars Parameter Unit of
measure-
ment MYT 2016-17 to 2018-19
Sub-Total Un-
Metered
connections
Consumers Nos. 394,765 408,150 484,805 583,148 710,663 877,534
Connected Load KW 1,716,842 1,782,239 2,017,656 2,296,208 2,638,601 3,067,402
Sales MU 4,379.20 5,142 4,345 4,906 5,595 6,458
Revenue from Fixed ChargesRs. Crs. - - - - - -
Revenue from Variable ChargesRs. Crs. - - - - - -
Total Revenue Rs. Crs. 1,030.85 1,469 1,953 2,206 2,517 2,909
DTR metered group consumers
Permanent Connections
Consumers Nos. - - - - - -
Connected Load KW - - - - - -
Sales MU - - - - - -
Revenue from Fixed Charges
Revenue from Variable Charges
Total Revenue Rs. Crs. - - - - - -
Total LV 5.1
Consumers Nos. 395,768 409,239 486,262 584,850 712,704 880,047
Connected Load KW 1,728,962 1,794,238 2,030,782 2,309,971 2,653,244 3,083,266
Sales MU 4,407.37 5,170.69 4,377.20 4,940.49 5,632.46 6,498.53
Revenue from Fixed ChargesRs. Crs. - - - - - -
Revenue from Variable ChargesRs. Crs. - - - - - -
Total Revenue Rs. Crs. 1,041.37 1,478.64 1,968.16 2,221.99 2,534.80 2,927.68
LV 5.2: Other than agriculture use - Horticulture
first 300 units

MPMKVVCL Annexure-I of ARR/Tariff Petition FY-17
Revenue from Current Tariff & Charges
Form R5
Old Years PY CY
FY14 FY15 FY16 FY17 FY18 FY19
Particulars Parameter Unit of
measure-
ment MYT 2016-17 to 2018-19
Consumers Nos. - - - - - -
Connected Load KW - - - - - -
Sales MU - - - - - -
Revenue from Fixed ChargesRs. Crs.
Revenue from Variable ChargesRs. Crs.
Total Revenue Rs. Crs. - - - - - -
Above 300 to 750
units
Consumers Nos. - - - - - -
Connected Load KW - - - - - -
Sales MU - - - - - -
Revenue from Fixed ChargesRs. Crs.
Revenue from Variable ChargesRs. Crs.
Total Revenue Rs. Crs. - - - - - -
Above 750 Units
Consumers Nos. - - - - - -
Connected Load KW - - - - - -
Sales MU - - - - - -
Revenue from Fixed ChargesRs. Crs.
Revenue from Variable ChargesRs. Crs.
Total Revenue Rs. Crs. - - - - - -
Temporary
Connections
Consumers Nos. - - - - - -
Connected Load KW - - - - - -

MPMKVVCL Annexure-I of ARR/Tariff Petition FY-17
Revenue from Current Tariff & Charges
Form R5
Old Years PY CY
FY14 FY15 FY16 FY17 FY18 FY19
Particulars Parameter Unit of
measure-
ment MYT 2016-17 to 2018-19
Sales MU - - - - - -
Revenue from Fixed ChargesRs. Crs.
Revenue from Variable ChargesRs. Crs.
Total Revenue Rs. Crs. - - - - - -
Sub-Total
Consumers Nos. - - - - - -
Connected Load KW - - - - - -
Sales MU - - - - - -
Revenue from Fixed ChargesRs. Crs. - - - - -
Revenue from Variable ChargesRs. Crs. - - - - -
Total Revenue Rs. Crs. - - - - - -
5.3 For other than agriculture useUpto 25 HP -
Total Area
Consumers Nos. 499 437 511 614 737 885
Connected Load KW 2,989 2,608 2,522 3,018 3,614 4,331
Sales MU 13 215 27 33 40 49
Revenue from Fixed ChargesRs. Crs. - - - - - -
Revenue from Variable ChargesRs. Crs. - - - - - -
Total Revenue Rs. Crs. 2 2 11 14 17 20
Demand base Tariff Upto 100HP- Total Area
Consumers Nos. - - 23 23 23 23
Connected Load KW - - 546 546 546 546
Sales MU - - 1 1 1 1
Revenue from Fixed ChargesRs. Crs. - - - - - -

MPMKVVCL Annexure-I of ARR/Tariff Petition FY-17
Revenue from Current Tariff & Charges
Form R5
Old Years PY CY
FY14 FY15 FY16 FY17 FY18 FY19
Particulars Parameter Unit of
measure-
ment MYT 2016-17 to 2018-19
Revenue from Variable ChargesRs. Crs. - - - - - -
Total Revenue Rs. Crs. - - 0 0 0 0
Temporary Connections Total Area
Consumers Nos. 16 27 29 30 32 34
Connected Load KW 48 75 100 103 107 111
Sales MU 0 0 1 1 1 1
Revenue from Fixed ChargesRs. Crs. - - - - - -
Revenue from Variable ChargesRs. Crs. - - - - - -
Total Revenue Rs. Crs. 0 0 1 1 1 1
Sub-Total
Consumers Nos. 515 464 563 667 792 942
Connected Load KW 3,037 2,683 3,168 3,667 4,267 4,988
Sales MU 13 216 29 35 42 51
Revenue from Fixed ChargesRs. Crs. - - - - - -
Revenue from Variable ChargesRs. Crs. - - - - - -
Total Revenue Rs. Crs. 2 2 12 15 18 21
TOTAL LV 5 AGRICULTURE
Consumers Nos. 396,283 409,703 486,825 585,517 713,496 880,989
Connected Load KW 1,731,999 1,796,921 2,033,950 2,313,638 2,657,511 3,088,255
Sales MU 4,420 5,386 4,406 4,976 5,675 6,550
Revenue from Fixed ChargesRs. Crs. - - - - - -
Revenue from Variable ChargesRs. Crs. - - - - - -
Total Revenue Rs. Crs. 1,043 1,480 1,980 2,237 2,552 2,949
TOTAL LOW TENSION
Consumers Nos. 2,936,656 3,063,041 3,362,668 3,717,830 4,020,073 4,418,559
Connected Load KW 4,676,577 5,040,539 5,550,252 6,134,369 6,787,994 7,514,901
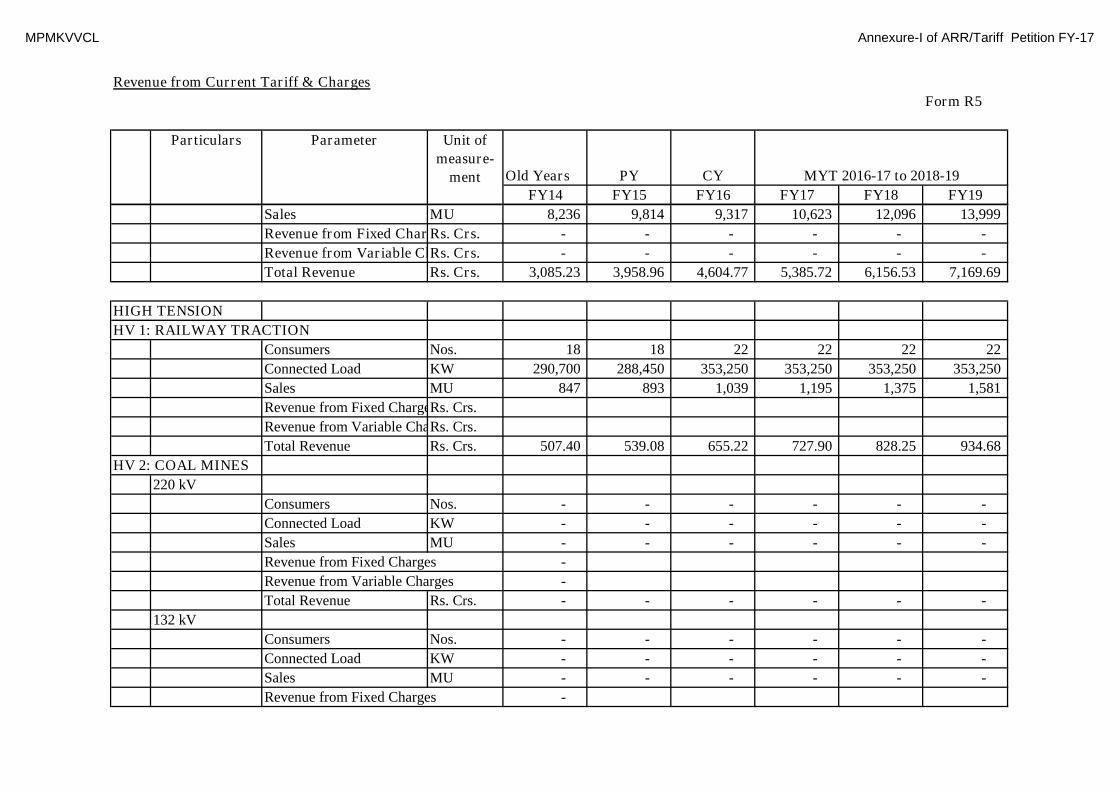
MPMKVVCL Annexure-I of ARR/Tariff Petition FY-17
Revenue from Current Tariff & Charges
Form R5
Old Years PY CY
FY14 FY15 FY16 FY17 FY18 FY19
Particulars Parameter Unit of
measure-
ment MYT 2016-17 to 2018-19
Sales MU 8,236 9,814 9,317 10,623 12,096 13,999
Revenue from Fixed ChargesRs. Crs. - - - - - -
Revenue from Variable ChargesRs. Crs. - - - - - -
Total Revenue Rs. Crs. 3,085.23 3,958.96 4,604.77 5,385.72 6,156.53 7,169.69
HIGH TENSION
HV 1: RAILWAY TRACTION
Consumers Nos. 18 18 22 22 22 22
Connected Load KW 290,700 288,450 353,250 353,250 353,250 353,250
Sales MU 847 893 1,039 1,195 1,375 1,581
Revenue from Fixed ChargesRs. Crs.
Revenue from Variable ChargesRs. Crs.
Total Revenue Rs. Crs. 507.40 539.08 655.22 727.90 828.25 934.68
HV 2: COAL MINES
220 kV
Consumers Nos. - - - - - -
Connected Load KW - - - - - -
Sales MU - - - - - -
Revenue from Fixed Charges -
Revenue from Variable Charges -
Total Revenue Rs. Crs. - - - - - -
132 kV
Consumers Nos. - - - - - -
Connected Load KW - - - - - -
Sales MU - - - - - -
Revenue from Fixed Charges -
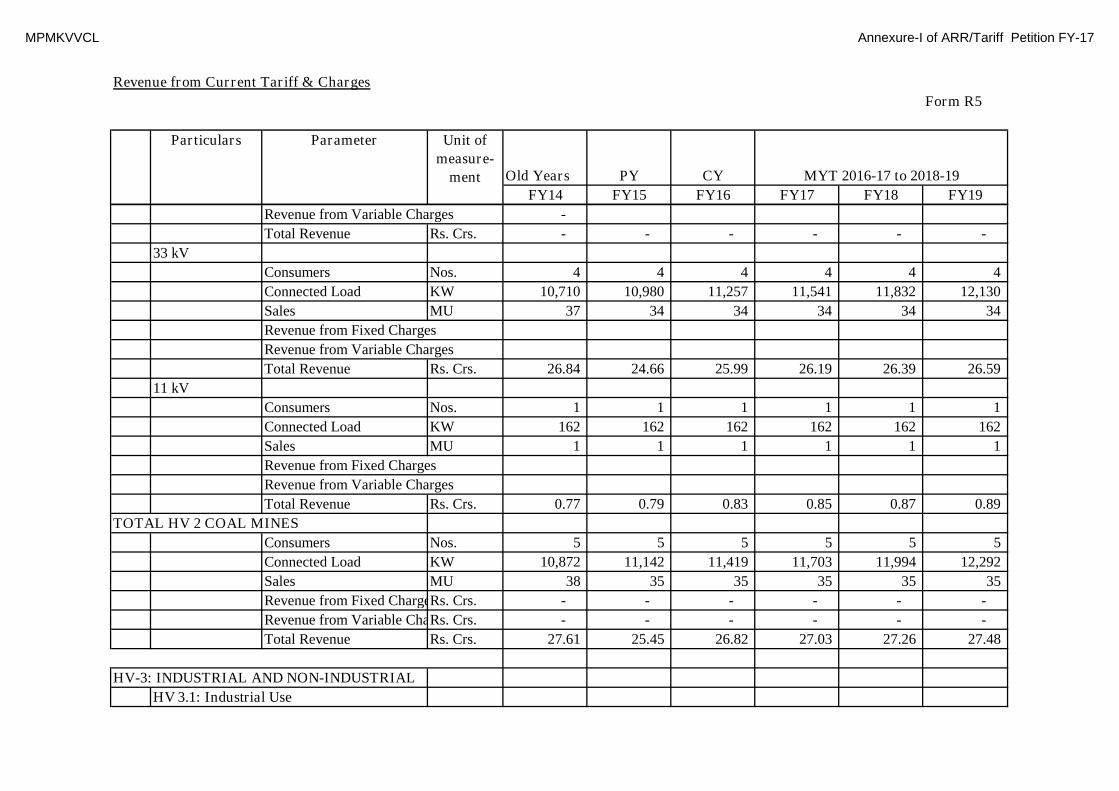
MPMKVVCL Annexure-I of ARR/Tariff Petition FY-17
Revenue from Current Tariff & Charges
Form R5
Old Years PY CY
FY14 FY15 FY16 FY17 FY18 FY19
Particulars Parameter Unit of
measure-
ment MYT 2016-17 to 2018-19
Revenue from Variable Charges -
Total Revenue Rs. Crs. - - - - - -
33 kV
Consumers Nos. 4 4 4 4 4 4
Connected Load KW 10,710 10,980 11,257 11,541 11,832 12,130
Sales MU 37 34 34 34 34 34
Revenue from Fixed Charges
Revenue from Variable Charges
Total Revenue Rs. Crs. 26.84 24.66 25.99 26.19 26.39 26.59
11 kV
Consumers Nos. 1 1 1 1 1 1
Connected Load KW 162 162 162 162 162 162
Sales MU 1 1 1 1 1 1
Revenue from Fixed Charges
Revenue from Variable Charges
Total Revenue Rs. Crs. 0.77 0.79 0.83 0.85 0.87 0.89
TOTAL HV 2 COAL MINES
Consumers Nos. 5 5 5 5 5 5
Connected Load KW 10,872 11,142 11,419 11,703 11,994 12,292
Sales MU 38 35 35 35 35 35
Revenue from Fixed ChargesRs. Crs. - - - - - -
Revenue from Variable ChargesRs. Crs. - - - - - -
Total Revenue Rs. Crs. 27.61 25.45 26.82 27.03 27.26 27.48
HV-3: INDUSTRIAL AND NON-INDUSTRIAL
HV 3.1: Industrial Use
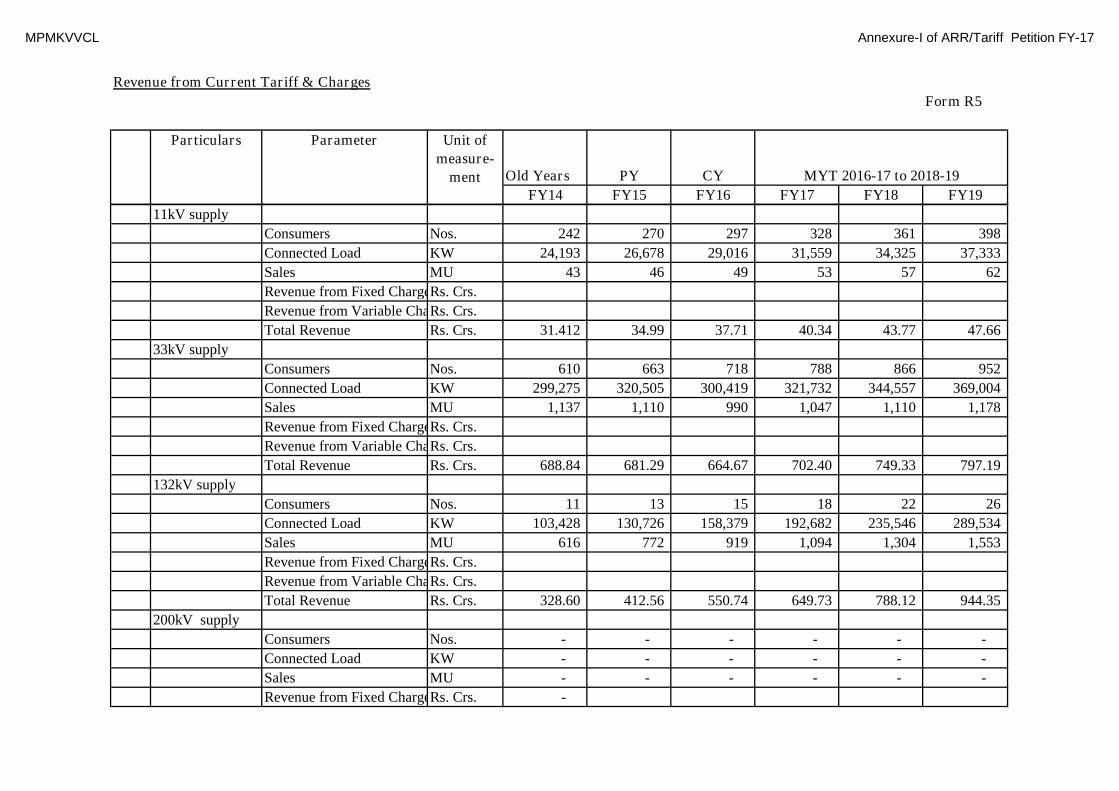
MPMKVVCL Annexure-I of ARR/Tariff Petition FY-17
Revenue from Current Tariff & Charges
Form R5
Old Years PY CY
FY14 FY15 FY16 FY17 FY18 FY19
Particulars Parameter Unit of
measure-
ment MYT 2016-17 to 2018-19
11kV supply
Consumers Nos. 242 270 297 328 361 398
Connected Load KW 24,193 26,678 29,016 31,559 34,325 37,333
Sales MU 43 46 49 53 57 62
Revenue from Fixed ChargesRs. Crs.
Revenue from Variable ChargesRs. Crs.
Total Revenue Rs. Crs. 31.412 34.99 37.71 40.34 43.77 47.66
33kV supply
Consumers Nos. 610 663 718 788 866 952
Connected Load KW 299,275 320,505 300,419 321,732 344,557 369,004
Sales MU 1,137 1,110 990 1,047 1,110 1,178
Revenue from Fixed ChargesRs. Crs.
Revenue from Variable ChargesRs. Crs.
Total Revenue Rs. Crs. 688.84 681.29 664.67 702.40 749.33 797.19
132kV supply
Consumers Nos. 11 13 15 18 22 26
Connected Load KW 103,428 130,726 158,379 192,682 235,546 289,534
Sales MU 616 772 919 1,094 1,304 1,553
Revenue from Fixed ChargesRs. Crs.
Revenue from Variable ChargesRs. Crs.
Total Revenue Rs. Crs. 328.60 412.56 550.74 649.73 788.12 944.35
200kV supply
Consumers Nos. - - - - - -
Connected Load KW - - - - - -
Sales MU - - - - - -
Revenue from Fixed ChargesRs. Crs. -

MPMKVVCL Annexure-I of ARR/Tariff Petition FY-17
Revenue from Current Tariff & Charges
Form R5
Old Years PY CY
FY14 FY15 FY16 FY17 FY18 FY19
Particulars Parameter Unit of
measure-
ment MYT 2016-17 to 2018-19
Revenue from Variable ChargesRs. Crs. -
Total Revenue Rs. Crs. - - - - - -
400kV supply
Consumers Nos. -
Connected Load KW -
Sales MU -
Revenue from Fixed ChargesRs. Crs. -
Revenue from Variable ChargesRs. Crs. -
Total Revenue Rs. Crs. -
Sub-Total HV 3.1: Industrial Use
Consumers Nos. 863 946 1,031 1,134 1,249 1,375
Connected Load KW 426,896 477,909 487,813 545,973 614,428 695,870
Sales MU 1,796 1,927 1,958 2,194 2,470 2,793
Revenue from Fixed ChargesRs. Crs. - - - - - -
Revenue from Variable ChargesRs. Crs. - - - - - -
Total Revenue Rs. Crs. 1,048.85 1,128.83 1,253.12 1,392.47 1,581.21 1,789.20
HV 3.2: Non-industrial use
11kV supply
Consumers Nos. 344 372 393 421 452 486
Connected Load KW 40,480 43,317 45,692 49,208 53,039 57,221
Sales MU 89 102 111 122 135 148
Revenue from Fixed ChargesRs. Crs.
Revenue from Variable ChargesRs. Crs.
Total Revenue Rs. Crs. 64 73 80 87 96 105
33kV supply
Consumers Nos. 358 381 396 420 446 473

MPMKVVCL Annexure-I of ARR/Tariff Petition FY-17
Revenue from Current Tariff & Charges
Form R5
Old Years PY CY
FY14 FY15 FY16 FY17 FY18 FY19
Particulars Parameter Unit of
measure-
ment MYT 2016-17 to 2018-19
Connected Load KW 94,138 97,574 94,577 98,315 102,233 106,342
Sales MU 252 271 275 297 320 345
Revenue from Fixed ChargesRs. Crs.
Revenue from Variable ChargesRs. Crs.
Total Revenue Rs. Crs. 173 186 200 213 229 245
132kV supply
Consumers Nos. 1 1 1 1 1 1
Connected Load KW 450 450 450 450 450 450
Sales MU 0 0 0 0 0 0
Revenue from Fixed ChargesRs. Crs.
Revenue from Variable ChargesRs. Crs.
Total Revenue Rs. Crs. 1 1 0 0 0 0
220kV supply
Consumers Nos. - - - - - -
Connected Load KW - - - - - -
Sales MU - - - - - -
Revenue from Fixed ChargesRs. Crs. -
Revenue from Variable ChargesRs. Crs. -
Total Revenue Rs. Crs. - - - - - -
Sub-Total HV 3.2: Non-Industrial Use
Consumers Nos. 703 754 790 843 899 960
Connected Load KW 135,068 141,341 140,719 147,973 155,721 164,014
Sales MU 341 374 386 419 455 493
Revenue from Fixed ChargesRs. Crs. - - - - - -
Revenue from Variable ChargesRs. Crs. - - - - - -
Total Revenue Rs. Crs. 237.77 259.84 279.57 299.56 324.65 350.11

MPMKVVCL Annexure-I of ARR/Tariff Petition FY-17
Revenue from Current Tariff & Charges
Form R5
Old Years PY CY
FY14 FY15 FY16 FY17 FY18 FY19
Particulars Parameter Unit of
measure-
ment MYT 2016-17 to 2018-19
HV 3.3: Shopping Mall
11kV supply
Consumers Nos. - - 6 7 7 8
Connected Load KW - - 926 997 1,074 1,159
Sales MU - - 1 2 2 2
Revenue from Fixed ChargesRs. Crs.
Revenue from Variable ChargesRs. Crs.
Total Revenue Rs. Crs. - - 1 1 1 2
33kV supply
Consumers Nos. - - 7 8 8 9
Connected Load KW - - 8,368 8,699 9,046 9,409
Sales MU - - 17 19 20 22
Revenue from Fixed ChargesRs. Crs.
Revenue from Variable ChargesRs. Crs.
Total Revenue Rs. Crs. - - 13 14 15 16
132kV supply
Consumers Nos. - - - - - -
Connected Load KW - - - - - -
Sales MU - - - - - -
Revenue from Fixed ChargesRs. Crs.
Revenue from Variable ChargesRs. Crs.
Total Revenue Rs. Crs. - - - - - -
Sub-Total HV 3.3: Shopping mall
Consumers Nos. - - 14 15 16 17
Connected Load KW - - 9,294 9,696 10,120 10,568
Sales MU - - 19 20 22 24

MPMKVVCL Annexure-I of ARR/Tariff Petition FY-17
Revenue from Current Tariff & Charges
Form R5
Old Years PY CY
FY14 FY15 FY16 FY17 FY18 FY19
Particulars Parameter Unit of
measure-
ment MYT 2016-17 to 2018-19
Revenue from Fixed ChargesRs. Crs.
Revenue from Variable ChargesRs. Crs.
Total Revenue Rs. Crs. - - 14.25 15.18 16.73 17.49
HV 3.4: Power Intensive
33kV supply
Consumers Nos. - - 13 14 16 17
Connected Load KW - - 42,823 45,861 49,115 52,600
Sales MU - - 182 193 205 217
Revenue from Fixed ChargesRs. Crs.
Revenue from Variable ChargesRs. Crs.
Total Revenue Rs. Crs. - - 95 100 107 114
132kV supply
Consumers Nos. - - - - - -
Connected Load KW - - - - - -
Sales MU - - - - - -
Revenue from Fixed ChargesRs. Crs.
Revenue from Variable ChargesRs. Crs.
Total Revenue Rs. Crs. - - - - - -
Sub-Total HV 3.4: Power Intensive
Consumers Nos. - - 13 14 16 17
Connected Load KW - - 42,823 45,861 49,115 52,600
Sales MU - - 182 193 205 217
Revenue from Fixed ChargesRs. Crs. - - - - - -
Revenue from Variable ChargesRs. Crs. - - - - - -
Total Revenue Rs. Crs. - - 95 100 107 114
TOTAL HV 3 INDUSTRIAL AND NON-INDUSTRIAL

MPMKVVCL Annexure-I of ARR/Tariff Petition FY-17
Revenue from Current Tariff & Charges
Form R5
Old Years PY CY
FY14 FY15 FY16 FY17 FY18 FY19
Particulars Parameter Unit of
measure-
ment MYT 2016-17 to 2018-19
Consumers Nos. 1,566 1,700 1,848 2,006 2,180 2,369
Connected Load KW 561,964 619,250 680,649 749,503 829,385 923,052
Sales MU 2,138 2,301 2,546 2,827 3,151 3,527
Revenue from Fixed ChargesRs. Crs. - - - - - -
Revenue from Variable ChargesRs. Crs. - - - - - -
Total Revenue Rs. Crs. 1,286.62 1,388.68 1,641.88 1,807.44 2,029.67 2,270.73
HV-4: SEASONAL
33kV supply
Consumers Nos. 6 5 5 5 5 5
Connected Load KW 963 801 801 801 801 801
Sales MU 1 1 2 2 2 2
Revenue from Fixed ChargesRs. Crs.
Revenue from Variable ChargesRs. Crs.
Total Revenue Rs. Crs. 1.22 1.26 1.02 1.10 1.21 1.32
11kV supply
Consumers Nos. 2 2 2 2 2 2
Connected Load KW 180 180 180 180 180 180
Sales MU 1 0 0 0 0 0
Revenue from Fixed ChargesRs. Crs.
Revenue from Variable ChargesRs. Crs.
Total Revenue Rs. Crs. 0.58 0.27 0.25 0.25 0.25 0.25
TOTAL HV 4 SEASONAL
Consumers Nos. 8 7 7 7 7 7
Connected Load KW 1,143 981 981 981 981 981
Sales MU 2 2 2 2 2 3
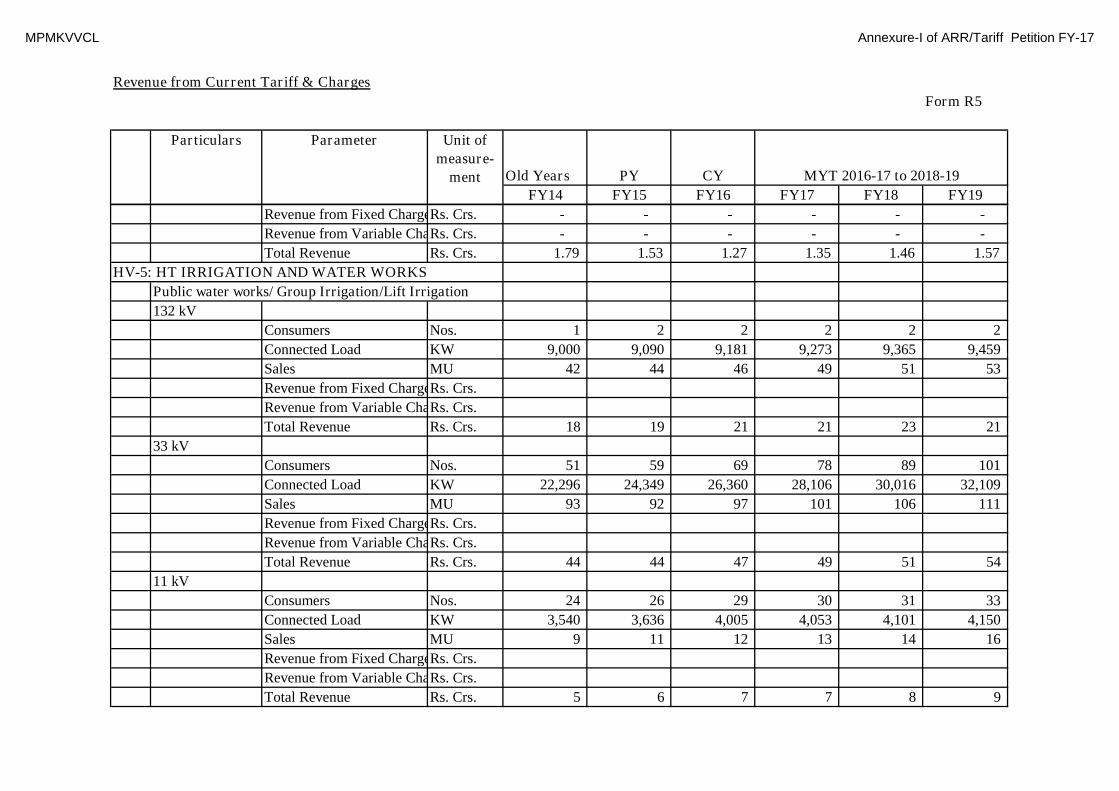
MPMKVVCL Annexure-I of ARR/Tariff Petition FY-17
Revenue from Current Tariff & Charges
Form R5
Old Years PY CY
FY14 FY15 FY16 FY17 FY18 FY19
Particulars Parameter Unit of
measure-
ment MYT 2016-17 to 2018-19
Revenue from Fixed ChargesRs. Crs. - - - - - -
Revenue from Variable ChargesRs. Crs. - - - - - -
Total Revenue Rs. Crs. 1.79 1.53 1.27 1.35 1.46 1.57
HV-5: HT IRRIGATION AND WATER WORKS
Public water works/ Group Irrigation/Lift Irrigation
132 kV
Consumers Nos. 1 2 2 2 2 2
Connected Load KW 9,000 9,090 9,181 9,273 9,365 9,459
Sales MU 42 44 46 49 51 53
Revenue from Fixed ChargesRs. Crs.
Revenue from Variable ChargesRs. Crs.
Total Revenue Rs. Crs. 18 19 21 21 23 21
33 kV
Consumers Nos. 51 59 69 78 89 101
Connected Load KW 22,296 24,349 26,360 28,106 30,016 32,109
Sales MU 93 92 97 101 106 111
Revenue from Fixed ChargesRs. Crs.
Revenue from Variable ChargesRs. Crs.
Total Revenue Rs. Crs. 44 44 47 49 51 54
11 kV
Consumers Nos. 24 26 29 30 31 33
Connected Load KW 3,540 3,636 4,005 4,053 4,101 4,150
Sales MU 9 11 12 13 14 16
Revenue from Fixed ChargesRs. Crs.
Revenue from Variable ChargesRs. Crs.
Total Revenue Rs. Crs. 5 6 7 7 8 9

MPMKVVCL Annexure-I of ARR/Tariff Petition FY-17
Revenue from Current Tariff & Charges
Form R5
Old Years PY CY
FY14 FY15 FY16 FY17 FY18 FY19
Particulars Parameter Unit of
measure-
ment MYT 2016-17 to 2018-19
Sub-Total
Consumers Nos. 76 87 100 111 123 136
Connected Load KW 34,836 37,075 39,546 41,432 43,482 45,718
Sales MU 145 148 155 163 171 180
Revenue from Fixed ChargesRs. Crs. - - - - - -
Revenue from Variable ChargesRs. Crs. - - - - - -
Total Revenue Rs. Crs. 66.968 69.30 74.57 77.31 82.37 84.01
Other agriculture users
132 kV
Consumers Nos. - - - - -
Connected Load KW - - - - -
Sales MU - - - - -
Revenue from Fixed ChargesRs. Crs.
Revenue from Variable ChargesRs. Crs.
Total Revenue Rs. Crs. - - - - -
33kV supply
Consumers Nos. 18 18 19 20 21 23
Connected Load KW 1,878 1,928 2,114 2,215 2,323 2,438
Sales MU 4 5 6 7 7 8
Revenue from Fixed ChargesRs. Crs.
Revenue from Variable ChargesRs. Crs.
Total Revenue Rs. Crs. 2 3 3 3 4 4
11kV supply
Consumers Nos. 1 2 4 4 4 4
Connected Load KW 72 185 365 467 606 797
Sales MU 0 0.47 0.70 0.90 1.16 1.50
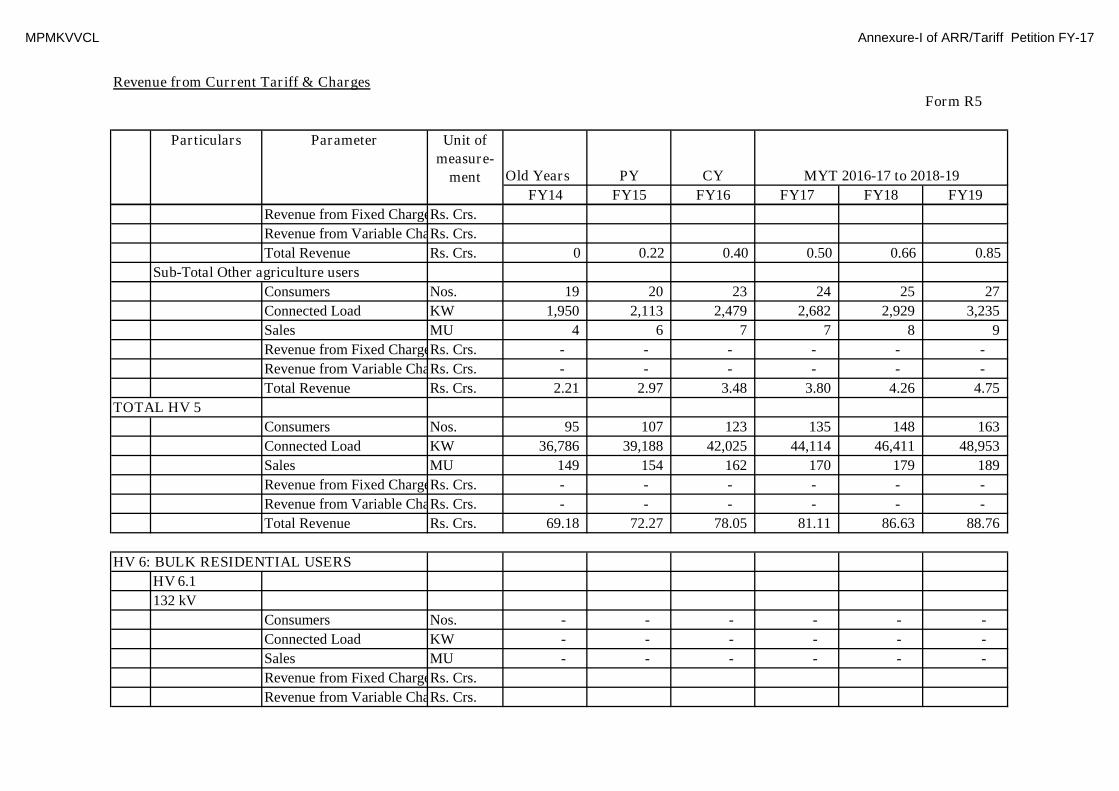
MPMKVVCL Annexure-I of ARR/Tariff Petition FY-17
Revenue from Current Tariff & Charges
Form R5
Old Years PY CY
FY14 FY15 FY16 FY17 FY18 FY19
Particulars Parameter Unit of
measure-
ment MYT 2016-17 to 2018-19
Revenue from Fixed ChargesRs. Crs.
Revenue from Variable ChargesRs. Crs.
Total Revenue Rs. Crs. 0 0.22 0.40 0.50 0.66 0.85
Sub-Total Other agriculture users
Consumers Nos. 19 20 23 24 25 27
Connected Load KW 1,950 2,113 2,479 2,682 2,929 3,235
Sales MU 4 6 7 7 8 9
Revenue from Fixed ChargesRs. Crs. - - - - - -
Revenue from Variable ChargesRs. Crs. - - - - - -
Total Revenue Rs. Crs. 2.21 2.97 3.48 3.80 4.26 4.75
TOTAL HV 5
Consumers Nos. 95 107 123 135 148 163
Connected Load KW 36,786 39,188 42,025 44,114 46,411 48,953
Sales MU 149 154 162 170 179 189
Revenue from Fixed ChargesRs. Crs. - - - - - -
Revenue from Variable ChargesRs. Crs. - - - - - -
Total Revenue Rs. Crs. 69.18 72.27 78.05 81.11 86.63 88.76
HV 6: BULK RESIDENTIAL USERS
HV 6.1
132 kV
Consumers Nos. - - - - - -
Connected Load KW - - - - - -
Sales MU - - - - - -
Revenue from Fixed ChargesRs. Crs.
Revenue from Variable ChargesRs. Crs.

MPMKVVCL Annexure-I of ARR/Tariff Petition FY-17
Revenue from Current Tariff & Charges
Form R5
Old Years PY CY
FY14 FY15 FY16 FY17 FY18 FY19
Particulars Parameter Unit of
measure-
ment MYT 2016-17 to 2018-19
Total Revenue Rs. Crs. - - - - - -
33 kV
Consumers Nos. 28 27 27 27 27 27
Connected Load KW 26,150 29,486 29,884 29,923 29,965 30,008
Sales MU 139 139 150 161 174 187
Revenue from Fixed ChargesRs. Crs.
Revenue from Variable ChargesRs. Crs.
Total Revenue Rs. Crs. 69 72 78 82 89 95
11 kV
Consumers Nos. 15 16 16 16 16 16
Connected Load KW 1,311 1,300 1,323 1,324 1,325 1,326
Sales MU 9 11 13 16 18 22
Revenue from Fixed ChargesRs. Crs.
Revenue from Variable ChargesRs. Crs.
Total Revenue Rs. Crs. 4.78 6.01 7.06 8.10 9.57 11.16
Sub-Total 6.1
Consumers Nos. 43 43 43 43 43 43
Connected Load KW 27,461 30,786 31,207 31,247 31,290 31,335
Sales MU 148 151 163 177 192 209
Revenue from Fixed ChargesRs. Crs. - - - - - -
Revenue from Variable ChargesRs. Crs. - - - - - -
Total Revenue Rs. Crs. 73.658 78.38 84.72 90.58 98.30 106.02
HV 6.2
132 kV
Consumers Nos. - - - - - -
Connected Load KW - - - - - -
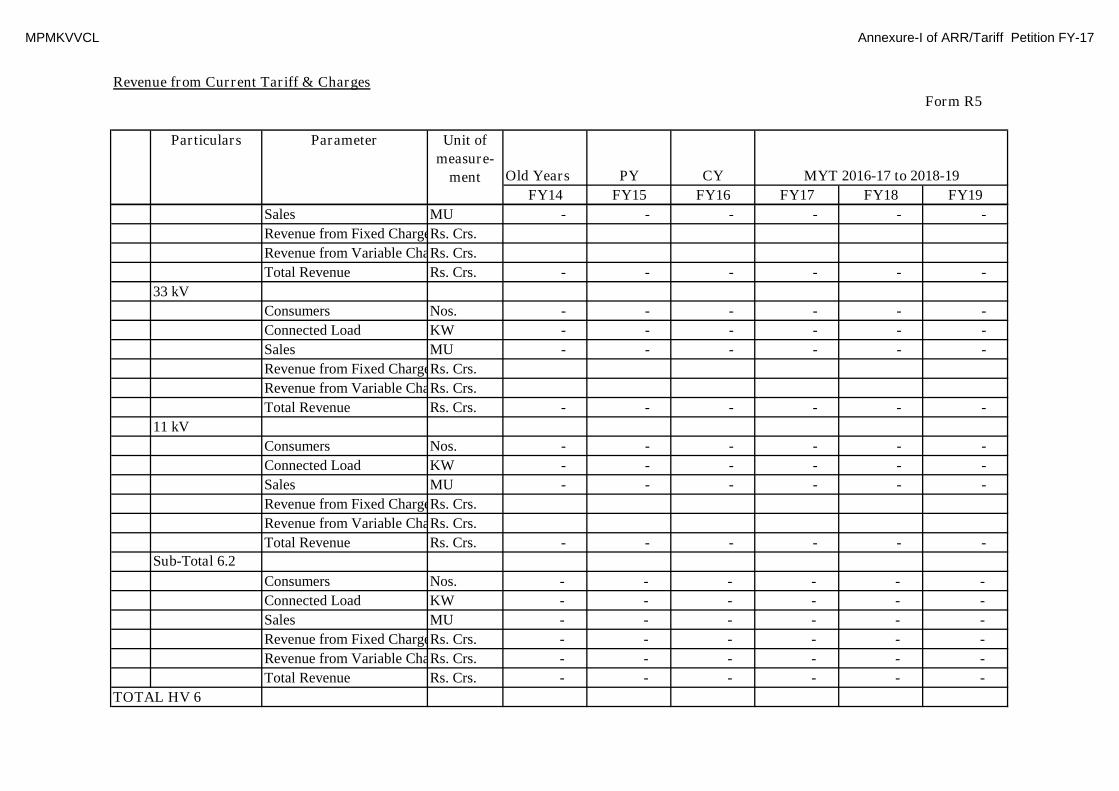
MPMKVVCL Annexure-I of ARR/Tariff Petition FY-17
Revenue from Current Tariff & Charges
Form R5
Old Years PY CY
FY14 FY15 FY16 FY17 FY18 FY19
Particulars Parameter Unit of
measure-
ment MYT 2016-17 to 2018-19
Sales MU - - - - - -
Revenue from Fixed ChargesRs. Crs.
Revenue from Variable ChargesRs. Crs.
Total Revenue Rs. Crs. - - - - - -
33 kV
Consumers Nos. - - - - - -
Connected Load KW - - - - - -
Sales MU - - - - - -
Revenue from Fixed ChargesRs. Crs.
Revenue from Variable ChargesRs. Crs.
Total Revenue Rs. Crs. - - - - - -
11 kV
Consumers Nos. - - - - - -
Connected Load KW - - - - - -
Sales MU - - - - - -
Revenue from Fixed ChargesRs. Crs.
Revenue from Variable ChargesRs. Crs.
Total Revenue Rs. Crs. - - - - - -
Sub-Total 6.2
Consumers Nos. - - - - - -
Connected Load KW - - - - - -
Sales MU - - - - - -
Revenue from Fixed ChargesRs. Crs. - - - - - -
Revenue from Variable ChargesRs. Crs. - - - - - -
Total Revenue Rs. Crs. - - - - - -
TOTAL HV 6

MPMKVVCL Annexure-I of ARR/Tariff Petition FY-17
Revenue from Current Tariff & Charges
Form R5
Old Years PY CY
FY14 FY15 FY16 FY17 FY18 FY19
Particulars Parameter Unit of
measure-
ment MYT 2016-17 to 2018-19
Consumers Nos. 43 43 43 43 43 43
Connected Load KW 27,461 30,786 31,207 31,247 31,290 31,335
Sales MU 148 151 163 177 192 209
Revenue from Fixed ChargesRs. Crs. - - - - - -
Revenue from Variable ChargesRs. Crs. - - - - - -
Total Revenue Rs. Crs. 73.66 78.38 84.72 90.58 98.30 106.02
HV 7: BULK SUPPLY TO EXEMPTEES
132 kV startup power
Consumers Nos. - - - - - -
Connected Load KW - - - - - -
Sales MU - - - - - -
Revenue from Fixed ChargesRs. Crs. -
Revenue from Variable ChargesRs. Crs. -
Total Revenue Rs. Crs. - - - - - -
33 kV startup power
Consumers Nos. - 1.00 1.00 1.00 1.00 1.00
Connected Load KW - 90.00 90.00 90.00 90.00 90.00
Sales MU - 0.01 0.08 0.08 0.08 0.08
Revenue from Fixed ChargesRs. Crs. -
Revenue from Variable ChargesRs. Crs. -
Total Revenue Rs. Crs. - 0.01 0.05 0.05 0.05 0.05
11 kV startup power -
Consumers Nos. - 1 1 1 1 1
Connected Load KW - 113 113 113 113 113
Sales MU - 0.05 0.15 0.15 0.15 0.15
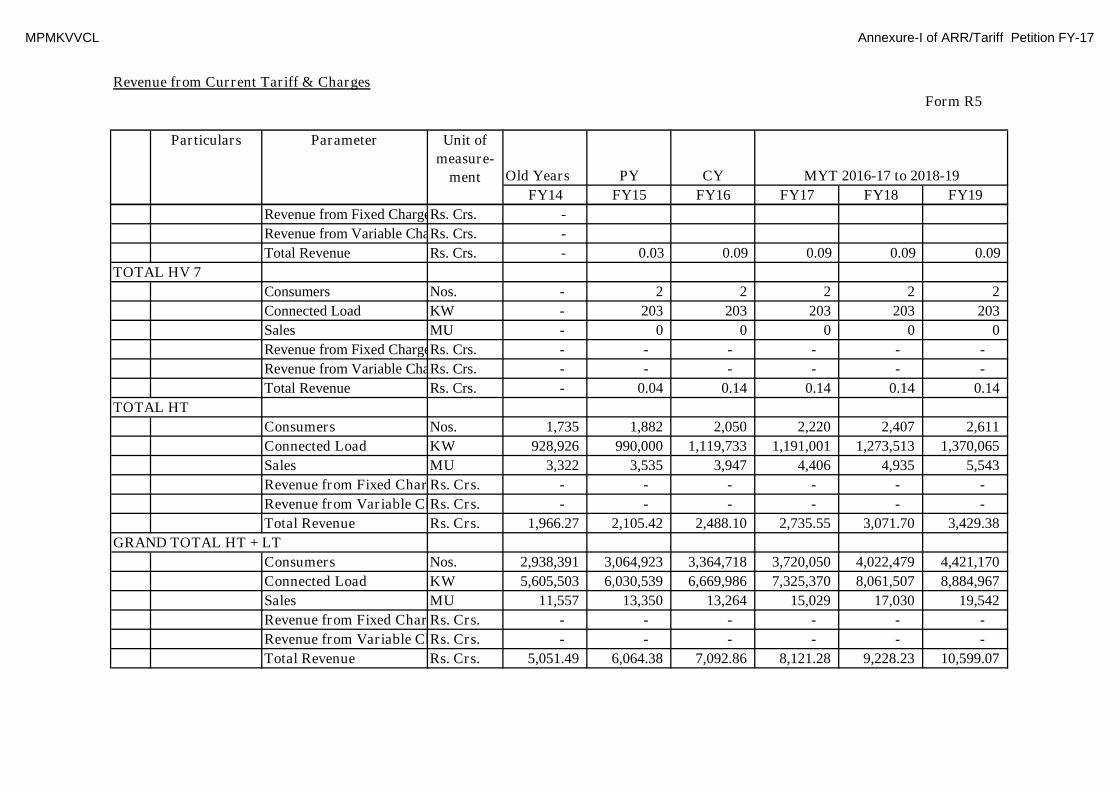
MPMKVVCL Annexure-I of ARR/Tariff Petition FY-17
Revenue from Current Tariff & Charges
Form R5
Old Years PY CY
FY14 FY15 FY16 FY17 FY18 FY19
Particulars Parameter Unit of
measure-
ment MYT 2016-17 to 2018-19
Revenue from Fixed ChargesRs. Crs. -
Revenue from Variable ChargesRs. Crs. -
Total Revenue Rs. Crs. - 0.03 0.09 0.09 0.09 0.09
TOTAL HV 7
Consumers Nos. - 2 2 2 2 2
Connected Load KW - 203 203 203 203 203
Sales MU - 0 0 0 0 0
Revenue from Fixed ChargesRs. Crs. - - - - - -
Revenue from Variable ChargesRs. Crs. - - - - - -
Total Revenue Rs. Crs. - 0.04 0.14 0.14 0.14 0.14
TOTAL HT
Consumers Nos. 1,735 1,882 2,050 2,220 2,407 2,611
Connected Load KW 928,926 990,000 1,119,733 1,191,001 1,273,513 1,370,065
Sales MU 3,322 3,535 3,947 4,406 4,935 5,543
Revenue from Fixed ChargesRs. Crs. - - - - - -
Revenue from Variable ChargesRs. Crs. - - - - - -
Total Revenue Rs. Crs. 1,966.27 2,105.42 2,488.10 2,735.55 3,071.70 3,429.38
GRAND TOTAL HT + LT
Consumers Nos. 2,938,391 3,064,923 3,364,718 3,720,050 4,022,479 4,421,170
Connected Load KW 5,605,503 6,030,539 6,669,986 7,325,370 8,061,507 8,884,967
Sales MU 11,557 13,350 13,264 15,029 17,030 19,542
Revenue from Fixed ChargesRs. Crs. - - - - - -
Revenue from Variable ChargesRs. Crs. - - - - - -
Total Revenue Rs. Crs. 5,051.49 6,064.38 7,092.86 8,121.28 9,228.23 10,599.07

MPMKVVCL Annexure-I of ARR/Tariff Petition FY-17
Name of Distribution Licensee : MPMKVVCL BHOPAL
Summary of revenues and gap/surplus across major categories Form No: R6
With
subsidy
Without
subsidy
A B C D C-D A B C B-C A B C B-C
LT SUPPLY - 400/230 V
(LV1) Domestic 1,670.42 5.23 6.36 (1.12) 1,688.25 4.81 6.82 (2.02) 2,085.75 5.16 6.42 (1.26)
(LV2) Non Domestic 514.88 7.31 6.36 0.96 587.77 7.50 6.82 0.67 668.47 7.42 6.42 0.99
(LV3) Public water works and street light 135.53 4.53 6.36 (1.82) 159.50 4.64 6.82 (2.18) 186.36 4.58 6.42 (1.84)
(LV4) Industrial 157.71 6.77 6.36 0.42 188.90 6.98 6.82 0.15 208.52 6.94 6.42 0.51
(LV5)Irrgation Pumps for Agriculture and
agriculture related use in rural areas1,480.41 2.75 6.36 (3.61) 1,980.35 4.49 6.82 (2.33) 2,236.62 4.50 6.42 (1.93)
TOTAL LT 3,958.96 4.03 6.36 (2.32) 4,604.77 4.94 6.82 (1.88) 5,385.72 5.07 6.42 (1.35)
HT SUPPLY - 11KV & above
HV-1 Railway Traction 539.08 6.04 6.36 (0.32) 655.22 6.30 6.82 (0.52) 727.90 6.09 6.42 (0.33)
HV-2 Coal Mines 25.45 7.30 6.36 0.95 26.82 7.69 6.82 0.87 27.03 7.74 6.42 1.32
HV-3 Industrial and Non Industrial 1,388.68 6.03 6.36 (0.32) 1,641.88 6.45 6.82 (0.37) 1,807.44 6.39 6.42 (0.03)
HV-4 Seasonal 1.53 8.39 6.36 2.03 1.27 6.41 6.82 (0.42) 1.35 6.29 6.42 (0.13)
HV-5HT Irrigation and Public Water
Works72.27 4.71 6.36 (1.65) 78.05 4.83 6.82 (1.99) 81.11 4.77 6.42 (1.66)
HV-6 Bulk Residential users 78.38 5.20 6.36 (1.15) 84.72 5.19 6.82 (1.64) 90.58 5.12 6.42 (1.31)
HV-7 Bulk Supply to Exemptees 0.04 6.53 6.36 0.17 0.14 0.14 6.25 6.42 (0.17)
TOTAL HT 2,105.42 2,488.10 6.30 6.82 (0.52) 2,735.55 6.21 6.42 (0.22)
GRAND TOTAL 6,064.38 4.54 6.36 (1.81) 7,092.86 5.35 6.82 (1.48) 8,121.28 5.40 6.42 (1.02)
Average
revenue
realisatio
n
Average
cost to
Serve
(Rs./unit)
(Gap) /
Surplus
(Rs / unit)
Total
Revenue
from sale of
power at
Ta
riff
Ca
teg
ory
Type of installation
FY 15Old
Current Year: FY 16
Total Revenue Rs. Crs.
MYT PeriodFirst Year: FY 17
Average
revenue
realisatio
n
Total
Revenue
from sale of
power at
Average
revenue
realisatio
n
Average
cost to
Serve
(Rs./unit)
(Gap) /
Surplus
(Rs / unit)
(Gap) /
Surplus
(Rs / unit)
Average
cost to
Serve
(Rs./unit)

MPMKVVCL Annexure-I of ARR/Tariff Petition FY-17
MPMKVVCL BHOPAL
Income from Wheeling Charges Form No: R7
ContractedCapacity
(MW)
MonthlyWheelingCharges
TotalCharges (Rs.)
ContractedCapacity
(MW)
MonthlyWheelingCharges
TotalCharges (Rs.)
ContractedCapacity
(MW)
MonthlyWheelingCharges
Total Charges(Rs.)
1 M/s Betul oil & Flour Mill Betul 1.25 32027.83 384334 1.25 23203.50 278442 1.25 23203.50 278442
2 M/s Hind Spinners Rajgarh. 0.45 5440.17 65282 0.45 5370.83 64450 0.45 5370.83 64450
3M/s Insulaters & ElectriclsLtd.,Mandideep 0.68 8146.42 97757 0.68 8056.42 96677 0.68 8056.42 96677
4M/s Itarsi oil & Flour Mill Itarsi point-1 4.11 8724.67 104696 4.11 6430.17 77162 4.11 6430.17 77162
5M/s Itarsi oil & Flour Mill Itarsi point-2 0.69 1454.00 17448 0.69 2922.50 35070 0.69 2922.50 35070
6 M/s K.S. Oil Mills Morena 8.90 176770.58 2121247 8.90 216819.58 2601835 8.90 216819.58 2601835
7M/s Engipress Indust., Disst., Morena
0.23 2715.50 32586 0.23 2685.42 32225 0.23 2685.42 32225
8 M/s K.S. Oil Mills Guna 16.00 243869.83 2926438 16.00 234284.75 2811417 16.00 234284.75 2811417
9 M/s Oswal Denim Rajgar 1.50 102692.00 1232304 1.50 46623.83 559486 1.50 46623.83 559486
10 M/s Ruchi Soya Guna 1.80 7817.42 93809 1.80 15904.00 190848 1.80 15904.00 190848
11
12
Total 35.60 589,658 7,075,901 35.60 562,301 6,747,612 35.60 562,301 6,747,612
FY 16Sl.No. Discom or Open Access Consumer
Present YearFY 14 FY 15
Old Years Previous Year
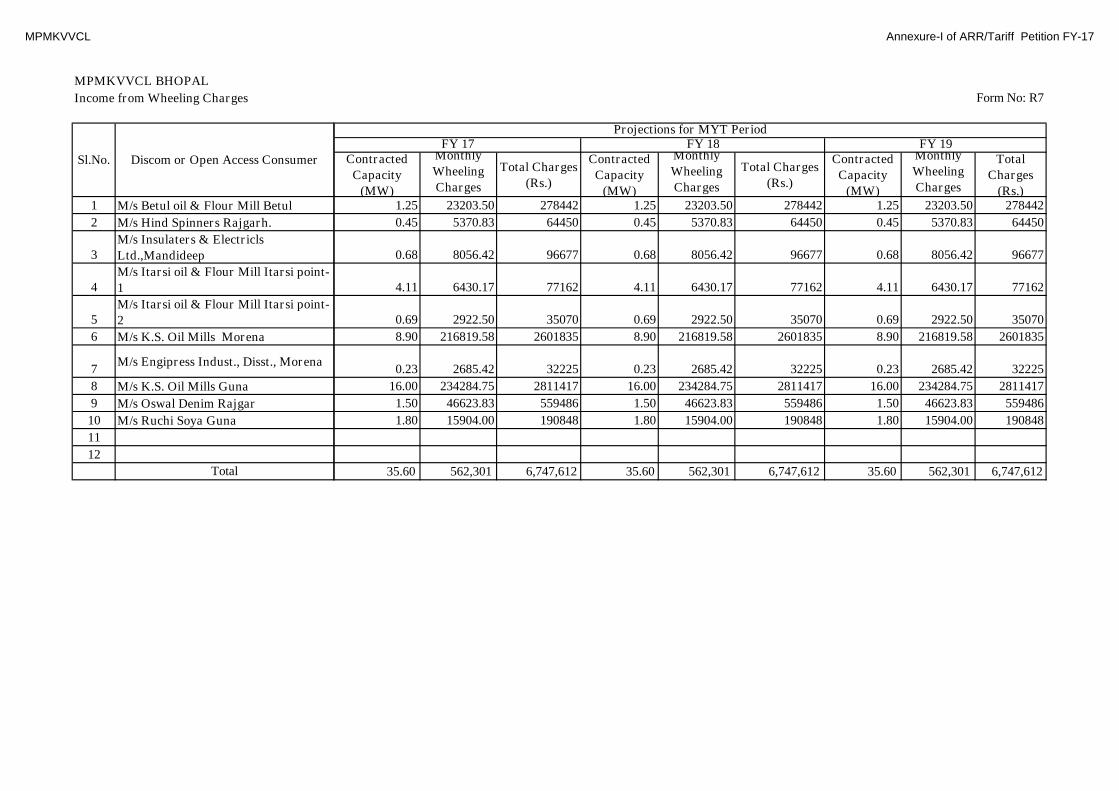
MPMKVVCL Annexure-I of ARR/Tariff Petition FY-17
MPMKVVCL BHOPAL
Income from Wheeling Charges
1 M/s Betul oil & Flour Mill Betul
2 M/s Hind Spinners Rajgarh.
3M/s Insulaters & ElectriclsLtd.,Mandideep
4M/s Itarsi oil & Flour Mill Itarsi point-1
5M/s Itarsi oil & Flour Mill Itarsi point-2
6 M/s K.S. Oil Mills Morena
7M/s Engipress Indust., Disst., Morena
8 M/s K.S. Oil Mills Guna
9 M/s Oswal Denim Rajgar
10 M/s Ruchi Soya Guna
11
12
Total
Sl.No. Discom or Open Access Consumer
Form No: R7
ContractedCapacity
(MW)
MonthlyWheelingCharges
Total Charges(Rs.)
ContractedCapacity
(MW)
MonthlyWheelingCharges
Total Charges(Rs.)
ContractedCapacity
(MW)
MonthlyWheelingCharges
TotalCharges
(Rs.)1.25 23203.50 278442 1.25 23203.50 278442 1.25 23203.50 278442
0.45 5370.83 64450 0.45 5370.83 64450 0.45 5370.83 64450
0.68 8056.42 96677 0.68 8056.42 96677 0.68 8056.42 96677
4.11 6430.17 77162 4.11 6430.17 77162 4.11 6430.17 77162
0.69 2922.50 35070 0.69 2922.50 35070 0.69 2922.50 35070
8.90 216819.58 2601835 8.90 216819.58 2601835 8.90 216819.58 2601835
0.23 2685.42 32225 0.23 2685.42 32225 0.23 2685.42 32225
16.00 234284.75 2811417 16.00 234284.75 2811417 16.00 234284.75 2811417
1.50 46623.83 559486 1.50 46623.83 559486 1.50 46623.83 559486
1.80 15904.00 190848 1.80 15904.00 190848 1.80 15904.00 190848
35.60 562,301 6,747,612 35.60 562,301 6,747,612 35.60 562,301 6,747,612
Projections for MYT PeriodFY 17 FY 18 FY 19