annex i executable test suite (ets) - europa · annex i executable test suite (ets) lpis data...
TRANSCRIPT

LPIS Quality Assurance Framework
Based on JRC IES/H04/P/PMI/pmi D(2011)(13518)
ANNEX I
Executable Test Suite (ETS)
LPIS data quality measures, version 6.2
July 2017
Developed in compliance with the guidelines and templates given in
ISO 19114, 19113 and ISO/TS 19138
1. Release notes
a. changes/updates from version 6.1 2016
Table 0. Adding a skipping variant for a parcel that already participated in an a
priori RP aggregation. Question “vii” rephrased.
Table 1 and Table 2: Setting an appropriate feasibility for measurement value for
total absence of eligible land.
Table 9, point 3.7: Note 2 is rephrased to make clear that Reference parcel with
“absence of agriculture land cover, which might represent eligible hectare" is
reported for QE2a, QE2c and QE3, but only as one weakness in QE4.
Table 9 (step 4.5) and Detailed Instruction 3: The procedure for categorization of
the causes of non-conformity is rephrased to make it clear that a separate cause
should be attributes to each of the non-conformities found within the Reference
Parcel.
Table 16. Change in calculation if the update of a LPIS QA zone/subzone was done
in the current year (same year as LPIS QA exercise).
DS/CDP/2015/07-REV1 part B
ANNEX I: LPIS quality measures, version 6.2 (July 2017)
2
2. Feasibility for inspection and measurement
The following 2 tables describe the measures related to the feasibility for inspection and
feasibility for measurement of the sampled reference parcel.
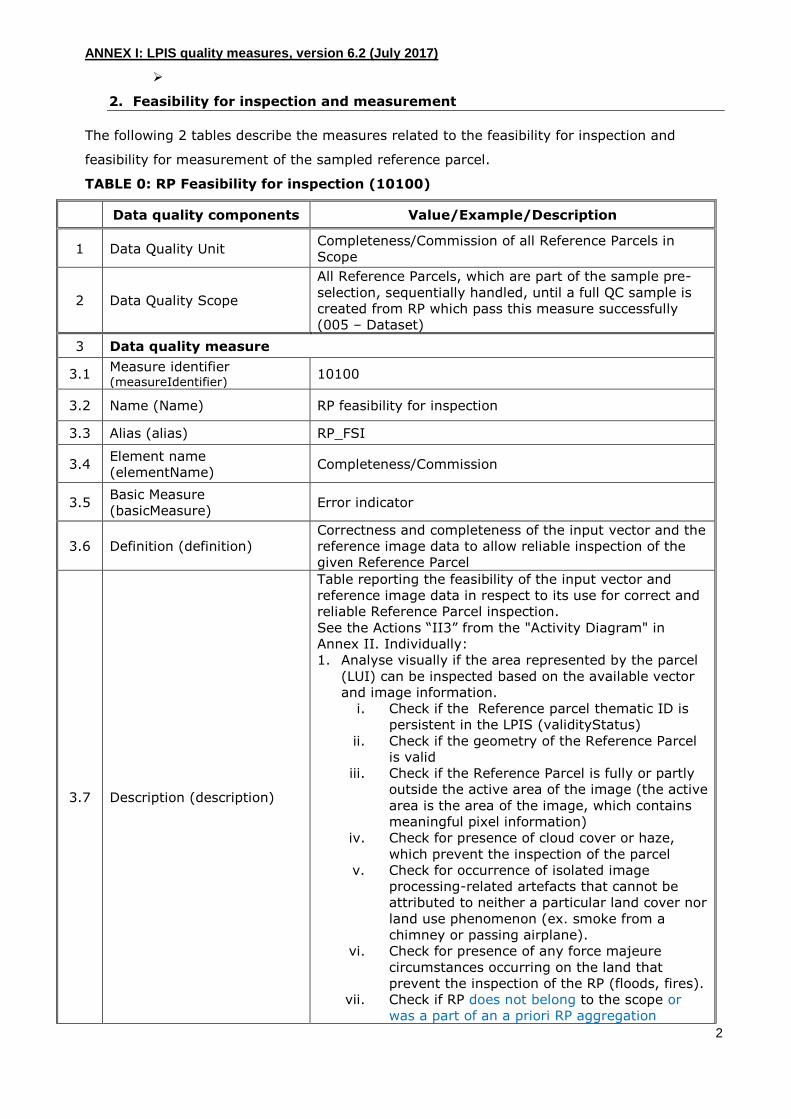
TABLE 0: RP Feasibility for inspection (10100)
Data quality components Value/Example/Description
1 Data Quality Unit Completeness/Commission of all Reference Parcels in
Scope
2 Data Quality Scope
All Reference Parcels, which are part of the sample pre-
selection, sequentially handled, until a full QC sample is
created from RP which pass this measure successfully
(005 – Dataset)
3 Data quality measure
3.1 Measure identifier (measureIdentifier)
10100
3.2 Name (Name) RP feasibility for inspection
3.3 Alias (alias) RP_FSI
3.4 Element name
(elementName) Completeness/Commission
3.5 Basic Measure
(basicMeasure) Error indicator
3.6 Definition (definition)
Correctness and completeness of the input vector and the
reference image data to allow reliable inspection of the
given Reference Parcel
3.7 Description (description)
Table reporting the feasibility of the input vector and
reference image data in respect to its use for correct and
reliable Reference Parcel inspection.
See the Actions “II3” from the "Activity Diagram" in
Annex II. Individually:
1. Analyse visually if the area represented by the parcel
(LUI) can be inspected based on the available vector
and image information.
i. Check if the Reference parcel thematic ID is
persistent in the LPIS (validityStatus)
ii. Check if the geometry of the Reference Parcel
is valid
iii. Check if the Reference Parcel is fully or partly
outside the active area of the image (the active
area is the area of the image, which contains
meaningful pixel information)
iv. Check for presence of cloud cover or haze,
which prevent the inspection of the parcel
v. Check for occurrence of isolated image
processing-related artefacts that cannot be
attributed to neither a particular land cover nor
land use phenomenon (ex. smoke from a
chimney or passing airplane).
vi. Check for presence of any force majeure
circumstances occurring on the land that
prevent the inspection of the RP (floods, fires).
vii. Check if RP does not belong to the scope or
was a part of an a priori RP aggregation

ANNEX I: LPIS quality measures, version 6.2 (July 2017)
3
2. If the population submitted is complete but it contains
extra parcels that are out of the scope as a result of
an erroneous query, the query condition can be easily
applied and verified (screened), then the skipping will
be applied to all out of scope parcels (S1).
3.8 Value Type (valueType) 1 – Boolean variable
3.9 Value Structure
(valueStructure) 4 - Table
3.10 Source Reference
(sourceReference)
Citation (the citation of the documentation of the
measure – Annex II, explanation of the Activity Diagram,
Actions “II3”)
3.11 Example (example)
Feasibility code Occurrence
Reference parcel thematic ID found not
persistent in the LPIS (A3)
false
Parcel geometry is not available (T5) false
Parcel is partially or fully not covered
by image (T2)
false
Parcel partially or fully covered by
clouds or haze (T4)
false
LUI interpretation impossible due to
observed isolated image processing
artefacts or phenomena unrelated to
land (C4)
false
Failure to inspect the reference parcel
due to force majeure circumstances,
observed on the LUI (floods, fires,) –
F1
false
Extra parcel due to error in the scope
or remaining parcel as a part of an a
priori RP aggregation (S1)
false
4 Data quality evaluation
4.1 Date (DataTime) yyyy-mm-dd
4.2 Evaluation method type
(DQ_EvaluationMethod)
(001 directInternal, 002 directExternal, 003 indirect) -
directExternal
4.3
Evaluation method type
code
(DQ_EvalMethodTypeCode)
002
4.4
Evaluation method
description
(evaluationMethodDescriptio
n)
Continue from 3.7
2. Assign a code to the Reference Parcel as a result of
the analysis, based on a pre-defined code list.
3. Report additional evidence when field "F1" is true in a
separate “Comment” field.
4. If the area represented by the parcel (LUI) is not
affected by the above technical issues (all occurrences
are set as FALSE),
a. flag the parcel as feasible for inspection
b. add the parcel to the sample and,
c. proceed with the ETS inspection for that
Reference Parcel.
Else, flag the Reference Parcel as skipped
4.5 Evaluation procedure Refer to Annex II
ANNEX I: LPIS quality measures, version 6.2 (July 2017)
4
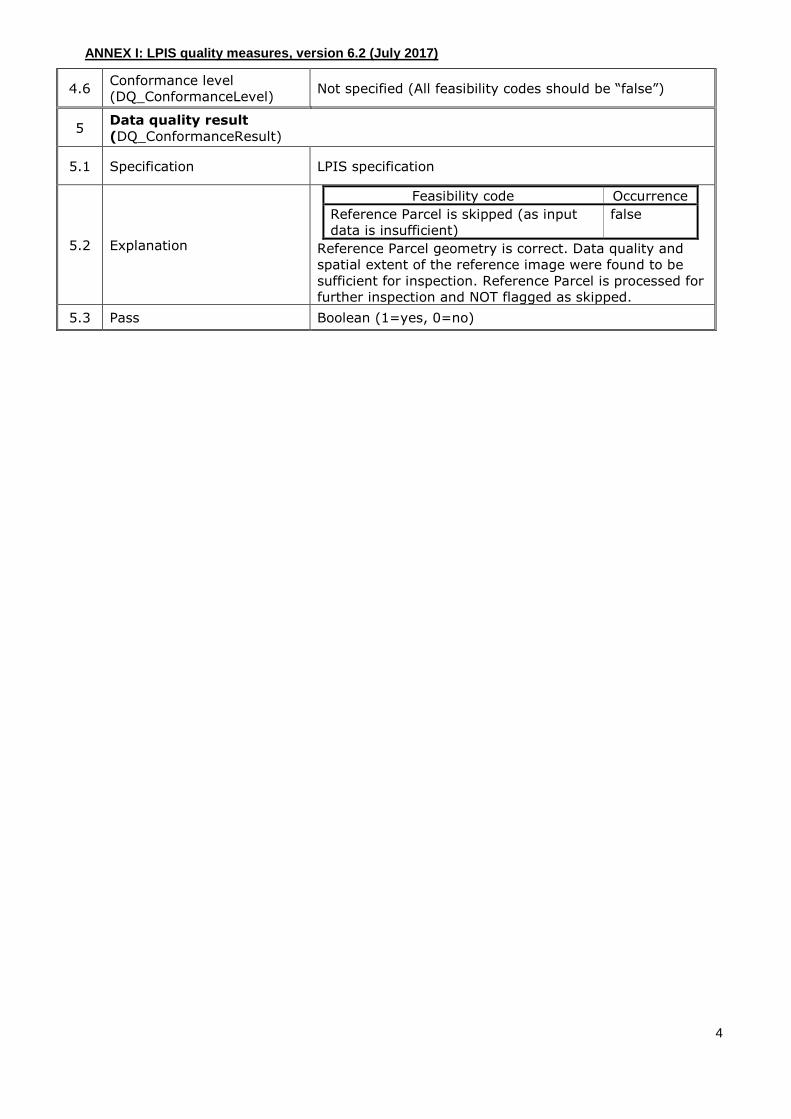
4.6 Conformance level
(DQ_ConformanceLevel) Not specified (All feasibility codes should be “false”)
5 Data quality result
(DQ_ConformanceResult)
5.1 Specification LPIS specification
5.2 Explanation
Feasibility code Occurrence
Reference Parcel is skipped (as input
data is insufficient)
false
Reference Parcel geometry is correct. Data quality and
spatial extent of the reference image were found to be
sufficient for inspection. Reference Parcel is processed for
further inspection and NOT flagged as skipped.
5.3 Pass Boolean (1=yes, 0=no)
ANNEX I: LPIS quality measures, version 6.2 (July 2017)
5
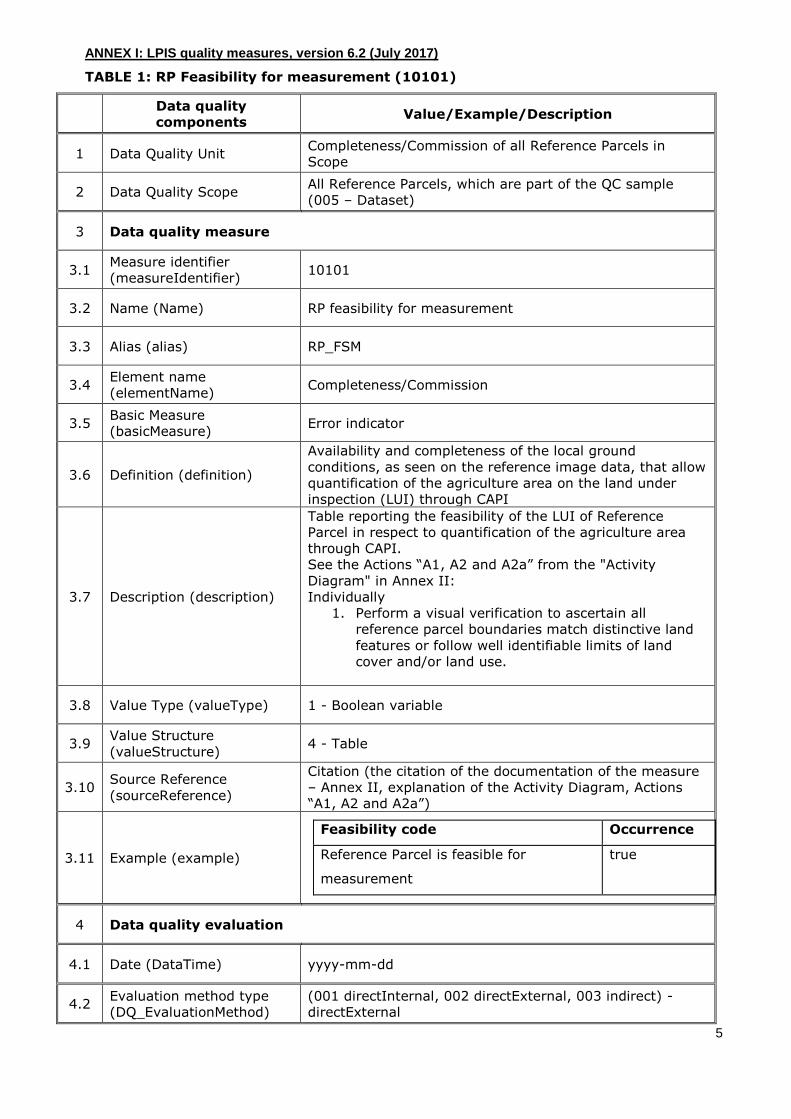
TABLE 1: RP Feasibility for measurement (10101)
Data quality
components Value/Example/Description
1 Data Quality Unit Completeness/Commission of all Reference Parcels in
Scope
2 Data Quality Scope All Reference Parcels, which are part of the QC sample
(005 – Dataset)
3 Data quality measure
3.1 Measure identifier
(measureIdentifier) 10101
3.2 Name (Name) RP feasibility for measurement
3.3 Alias (alias) RP_FSM
3.4 Element name
(elementName) Completeness/Commission
3.5 Basic Measure
(basicMeasure) Error indicator
3.6 Definition (definition)
Availability and completeness of the local ground
conditions, as seen on the reference image data, that allow
quantification of the agriculture area on the land under
inspection (LUI) through CAPI
3.7 Description (description)
Table reporting the feasibility of the LUI of Reference
Parcel in respect to quantification of the agriculture area
through CAPI.
See the Actions “A1, A2 and A2a” from the "Activity
Diagram" in Annex II:
Individually
1. Perform a visual verification to ascertain all
reference parcel boundaries match distinctive land
features or follow well identifiable limits of land
cover and/or land use.
3.8 Value Type (valueType) 1 - Boolean variable
3.9 Value Structure
(valueStructure) 4 - Table
3.10 Source Reference
(sourceReference)
Citation (the citation of the documentation of the measure
– Annex II, explanation of the Activity Diagram, Actions
“A1, A2 and A2a”)
3.11 Example (example)
Feasibility code Occurrence
Reference Parcel is feasible for
measurement
true
4 Data quality evaluation
4.1 Date (DataTime) yyyy-mm-dd
4.2 Evaluation method type
(DQ_EvaluationMethod)
(001 directInternal, 002 directExternal, 003 indirect) -
directExternal
ANNEX I: LPIS quality measures, version 6.2 (July 2017)
6
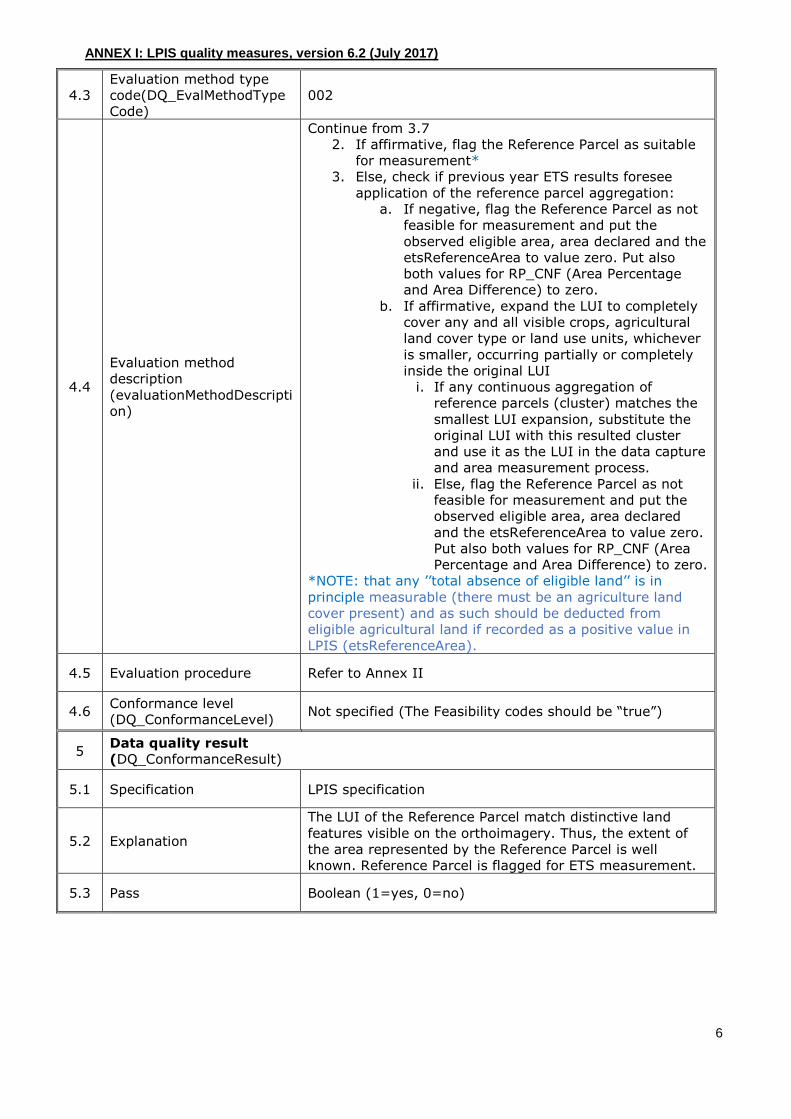
4.3
Evaluation method type
code(DQ_EvalMethodType
Code)
002
4.4
Evaluation method
description
(evaluationMethodDescripti
on)
Continue from 3.7
2. If affirmative, flag the Reference Parcel as suitable
for measurement*
3. Else, check if previous year ETS results foresee
application of the reference parcel aggregation:
a. If negative, flag the Reference Parcel as not
feasible for measurement and put the
observed eligible area, area declared and the
etsReferenceArea to value zero. Put also
both values for RP_CNF (Area Percentage
and Area Difference) to zero.
b. If affirmative, expand the LUI to completely
cover any and all visible crops, agricultural
land cover type or land use units, whichever
is smaller, occurring partially or completely
inside the original LUI
i. If any continuous aggregation of
reference parcels (cluster) matches the
smallest LUI expansion, substitute the
original LUI with this resulted cluster
and use it as the LUI in the data capture
and area measurement process.
ii. Else, flag the Reference Parcel as not
feasible for measurement and put the
observed eligible area, area declared
and the etsReferenceArea to value zero.
Put also both values for RP_CNF (Area
Percentage and Area Difference) to zero.
*NOTE: that any ’’total absence of eligible land’’ is in
principle measurable (there must be an agriculture land
cover present) and as such should be deducted from
eligible agricultural land if recorded as a positive value in
LPIS (etsReferenceArea).
4.5 Evaluation procedure Refer to Annex II
4.6 Conformance level
(DQ_ConformanceLevel) Not specified (The Feasibility codes should be “true”)
5 Data quality result
(DQ_ConformanceResult)
5.1 Specification LPIS specification
5.2 Explanation
The LUI of the Reference Parcel match distinctive land
features visible on the orthoimagery. Thus, the extent of
the area represented by the Reference Parcel is well
known. Reference Parcel is flagged for ETS measurement.
5.3 Pass Boolean (1=yes, 0=no)
ANNEX I: LPIS quality measures, version 6.2 (July 2017)
7
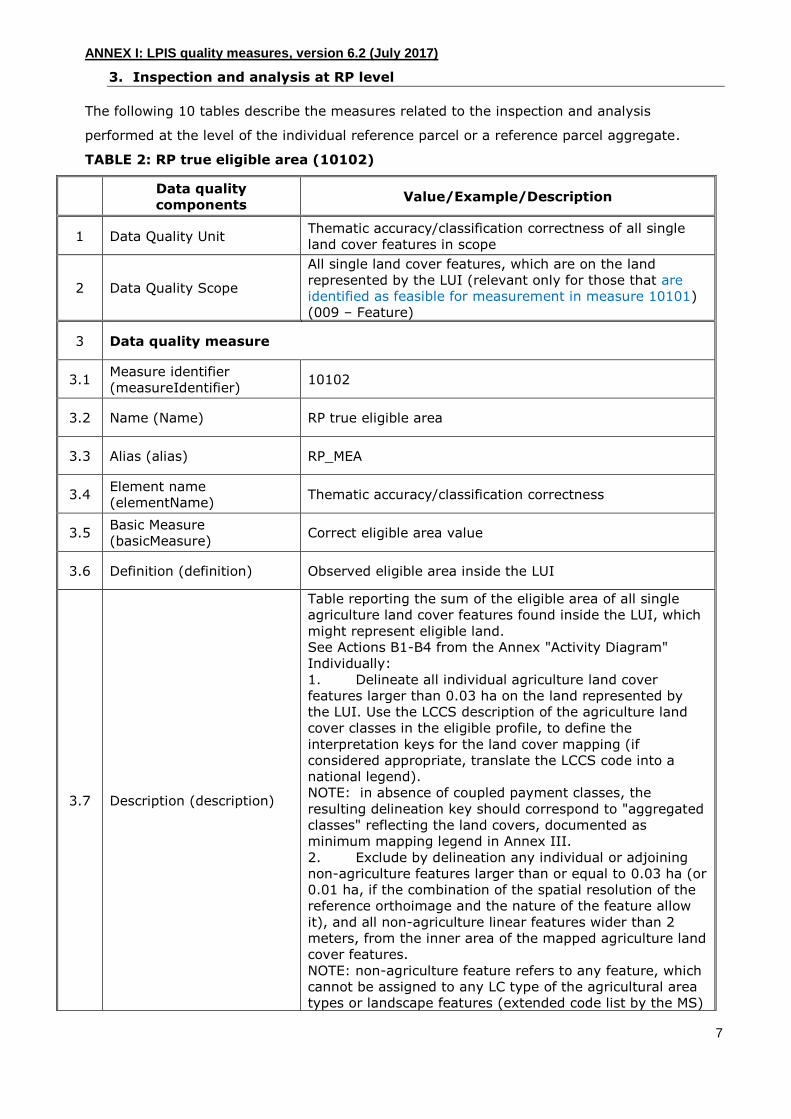
3. Inspection and analysis at RP level
The following 10 tables describe the measures related to the inspection and analysis
performed at the level of the individual reference parcel or a reference parcel aggregate.
TABLE 2: RP true eligible area (10102)
Data quality
components Value/Example/Description
1 Data Quality Unit Thematic accuracy/classification correctness of all single
land cover features in scope
2 Data Quality Scope
All single land cover features, which are on the land
represented by the LUI (relevant only for those that are
identified as feasible for measurement in measure 10101)
(009 – Feature)
3 Data quality measure
3.1 Measure identifier
(measureIdentifier) 10102
3.2 Name (Name) RP true eligible area
3.3 Alias (alias) RP_MEA
3.4 Element name
(elementName) Thematic accuracy/classification correctness
3.5 Basic Measure
(basicMeasure) Correct eligible area value
3.6 Definition (definition) Observed eligible area inside the LUI
3.7 Description (description)
Table reporting the sum of the eligible area of all single
agriculture land cover features found inside the LUI, which
might represent eligible land.
See Actions B1-B4 from the Annex "Activity Diagram"
Individually:
1. Delineate all individual agriculture land cover
features larger than 0.03 ha on the land represented by
the LUI. Use the LCCS description of the agriculture land
cover classes in the eligible profile, to define the
interpretation keys for the land cover mapping (if
considered appropriate, translate the LCCS code into a
national legend).
NOTE: in absence of coupled payment classes, the
resulting delineation key should correspond to "aggregated
classes" reflecting the land covers, documented as
minimum mapping legend in Annex III.
2. Exclude by delineation any individual or adjoining
non-agriculture features larger than or equal to 0.03 ha (or
0.01 ha, if the combination of the spatial resolution of the
reference orthoimage and the nature of the feature allow
it), and all non-agriculture linear features wider than 2
meters, from the inner area of the mapped agriculture land
cover features.
NOTE: non-agriculture feature refers to any feature, which
cannot be assigned to any LC type of the agricultural area
types or landscape features (extended code list by the MS)
ANNEX I: LPIS quality measures, version 6.2 (July 2017)
8
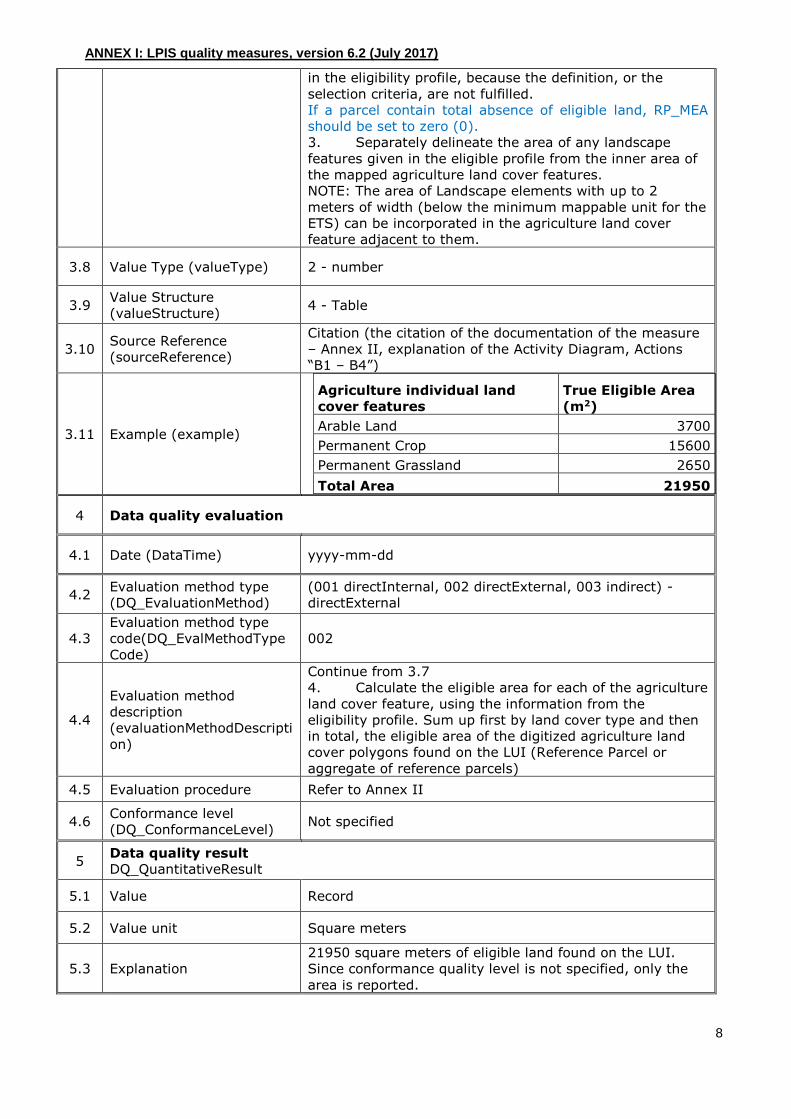
in the eligibility profile, because the definition, or the
selection criteria, are not fulfilled.
If a parcel contain total absence of eligible land, RP_MEA
should be set to zero (0).
3. Separately delineate the area of any landscape
features given in the eligible profile from the inner area of
the mapped agriculture land cover features.
NOTE: The area of Landscape elements with up to 2
meters of width (below the minimum mappable unit for the
ETS) can be incorporated in the agriculture land cover
feature adjacent to them.
3.8 Value Type (valueType) 2 - number
3.9 Value Structure
(valueStructure) 4 - Table
3.10 Source Reference
(sourceReference)
Citation (the citation of the documentation of the measure
– Annex II, explanation of the Activity Diagram, Actions
“B1 – B4”)
3.11 Example (example)
Agriculture individual land
cover features
True Eligible Area
(m2)
Arable Land 3700
Permanent Crop 15600
Permanent Grassland 2650
Total Area 21950
4 Data quality evaluation
4.1 Date (DataTime) yyyy-mm-dd
4.2 Evaluation method type
(DQ_EvaluationMethod)
(001 directInternal, 002 directExternal, 003 indirect) -
directExternal
4.3
Evaluation method type
code(DQ_EvalMethodType
Code)
002
4.4
Evaluation method
description
(evaluationMethodDescripti
on)
Continue from 3.7
4. Calculate the eligible area for each of the agriculture
land cover feature, using the information from the
eligibility profile. Sum up first by land cover type and then
in total, the eligible area of the digitized agriculture land
cover polygons found on the LUI (Reference Parcel or
aggregate of reference parcels)
4.5 Evaluation procedure Refer to Annex II
4.6 Conformance level
(DQ_ConformanceLevel) Not specified
5 Data quality result
DQ_QuantitativeResult
5.1 Value Record
5.2 Value unit Square meters
5.3 Explanation
21950 square meters of eligible land found on the LUI.
Since conformance quality level is not specified, only the
area is reported.
ANNEX I: LPIS quality measures, version 6.2 (July 2017)
9
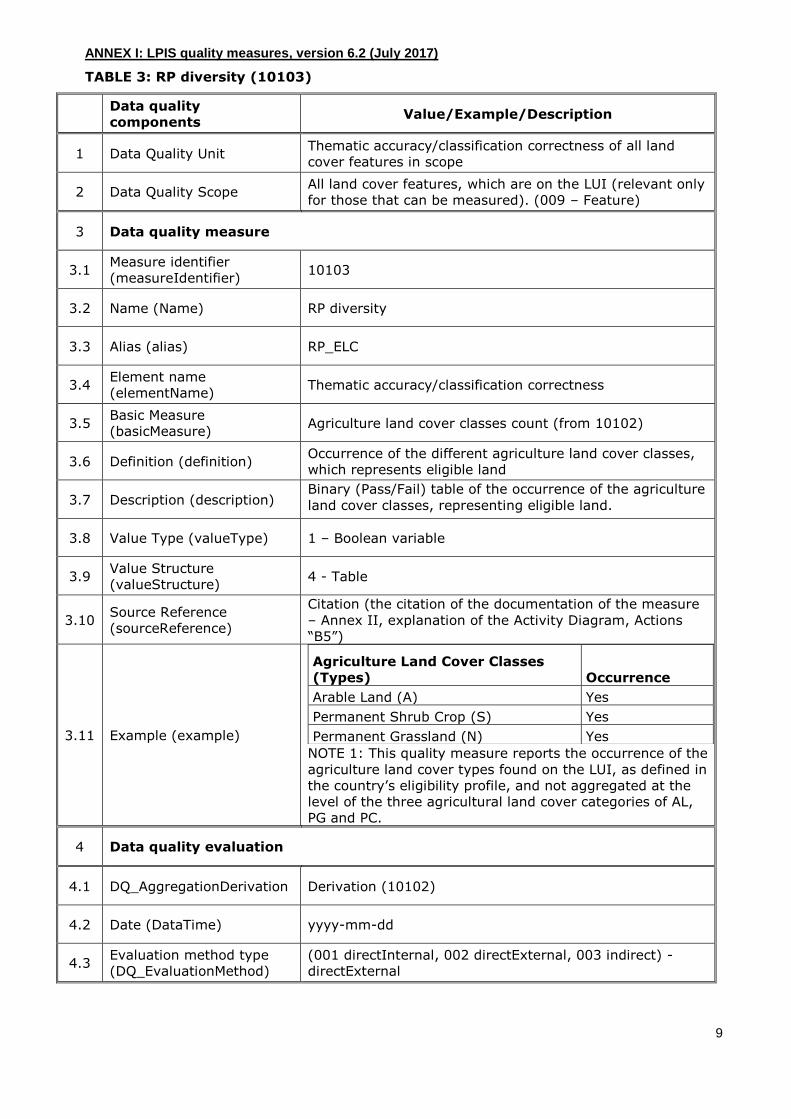
TABLE 3: RP diversity (10103)
Data quality
components Value/Example/Description
1 Data Quality Unit Thematic accuracy/classification correctness of all land
cover features in scope
2 Data Quality Scope All land cover features, which are on the LUI (relevant only
for those that can be measured). (009 – Feature)
3 Data quality measure
3.1 Measure identifier
(measureIdentifier) 10103
3.2 Name (Name) RP diversity
3.3 Alias (alias) RP_ELC
3.4 Element name
(elementName) Thematic accuracy/classification correctness
3.5 Basic Measure
(basicMeasure) Agriculture land cover classes count (from 10102)
3.6 Definition (definition) Occurrence of the different agriculture land cover classes,
which represents eligible land
3.7 Description (description) Binary (Pass/Fail) table of the occurrence of the agriculture
land cover classes, representing eligible land.
3.8 Value Type (valueType) 1 – Boolean variable
3.9 Value Structure
(valueStructure) 4 - Table
3.10 Source Reference
(sourceReference)
Citation (the citation of the documentation of the measure
– Annex II, explanation of the Activity Diagram, Actions
“B5”)
3.11 Example (example)
NOTE 1: This quality measure reports the occurrence of the
agriculture land cover types found on the LUI, as defined in
the country’s eligibility profile, and not aggregated at the
level of the three agricultural land cover categories of AL,
PG and PC.
Agriculture Land Cover Classes
(Types) Occurrence
Arable Land (A) Yes
Permanent Shrub Crop (S) Yes
Permanent Grassland (N) Yes
4 Data quality evaluation
4.1 DQ_AggregationDerivation Derivation (10102)
4.2 Date (DataTime) yyyy-mm-dd
4.3 Evaluation method type
(DQ_EvaluationMethod)
(001 directInternal, 002 directExternal, 003 indirect) -
directExternal

ANNEX I: LPIS quality measures, version 6.2 (July 2017)
10
4.4
Evaluation method type
code(DQ_EvalMethodType
Code)
002
4.5
Evaluation method
description
(evaluationMethodDescripti
on)
Actions B5 from the Annex "Activity Diagram"
Detect the observed presence of different agriculture land
cover classes representing eligible land (from 10102),
which are on the LUI. Use the correspondent class
definitions from the eligibility profile (User-defined Legend
Code).
4.6 Evaluation procedure Refer to Annex II
4.7 Conformance level
(DQ_ConformanceLevel) Not specified
5 Data quality result
DQ_QuantitativeResult
5.1 Value Table
5.2 Value unit Number
5.3 Explanation
Since conformance quality level is not specified, only the
matrix is reported (Example 3.11, Example: Arable land
and permanent grassland occurred on the LUI
ANNEX I: LPIS quality measures, version 6.2 (July 2017)
11
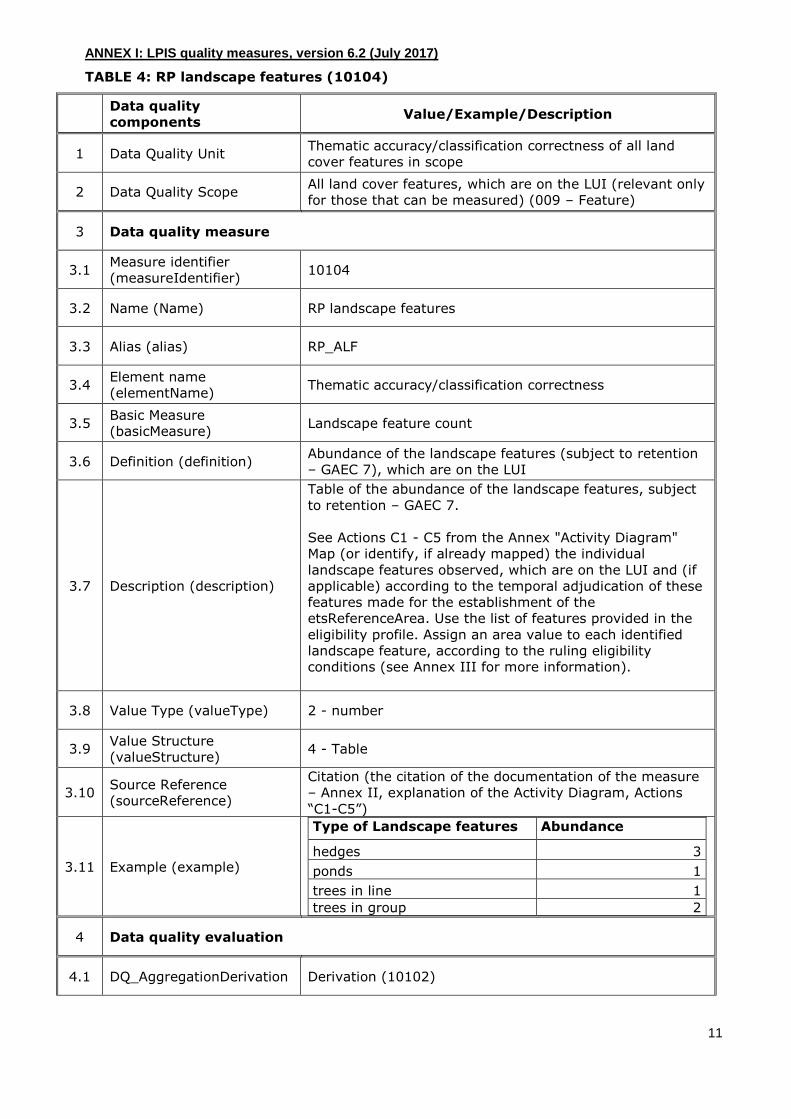
TABLE 4: RP landscape features (10104)
Data quality
components Value/Example/Description
1 Data Quality Unit Thematic accuracy/classification correctness of all land
cover features in scope
2 Data Quality Scope All land cover features, which are on the LUI (relevant only
for those that can be measured) (009 – Feature)
3 Data quality measure
3.1 Measure identifier
(measureIdentifier) 10104
3.2 Name (Name) RP landscape features
3.3 Alias (alias) RP_ALF
3.4 Element name
(elementName) Thematic accuracy/classification correctness
3.5 Basic Measure
(basicMeasure) Landscape feature count
3.6 Definition (definition) Abundance of the landscape features (subject to retention
– GAEC 7), which are on the LUI
3.7 Description (description)
Table of the abundance of the landscape features, subject
to retention – GAEC 7.
See Actions C1 - C5 from the Annex "Activity Diagram"
Map (or identify, if already mapped) the individual
landscape features observed, which are on the LUI and (if
applicable) according to the temporal adjudication of these
features made for the establishment of the
etsReferenceArea. Use the list of features provided in the
eligibility profile. Assign an area value to each identified
landscape feature, according to the ruling eligibility
conditions (see Annex III for more information).
3.8 Value Type (valueType) 2 - number
3.9 Value Structure
(valueStructure) 4 - Table
3.10 Source Reference
(sourceReference)
Citation (the citation of the documentation of the measure
– Annex II, explanation of the Activity Diagram, Actions
“C1-C5”)
3.11 Example (example)
Type of Landscape features Abundance
hedges 3
ponds 1
trees in line 1
trees in group 2
4 Data quality evaluation
4.1 DQ_AggregationDerivation Derivation (10102)
ANNEX I: LPIS quality measures, version 6.2 (July 2017)
12
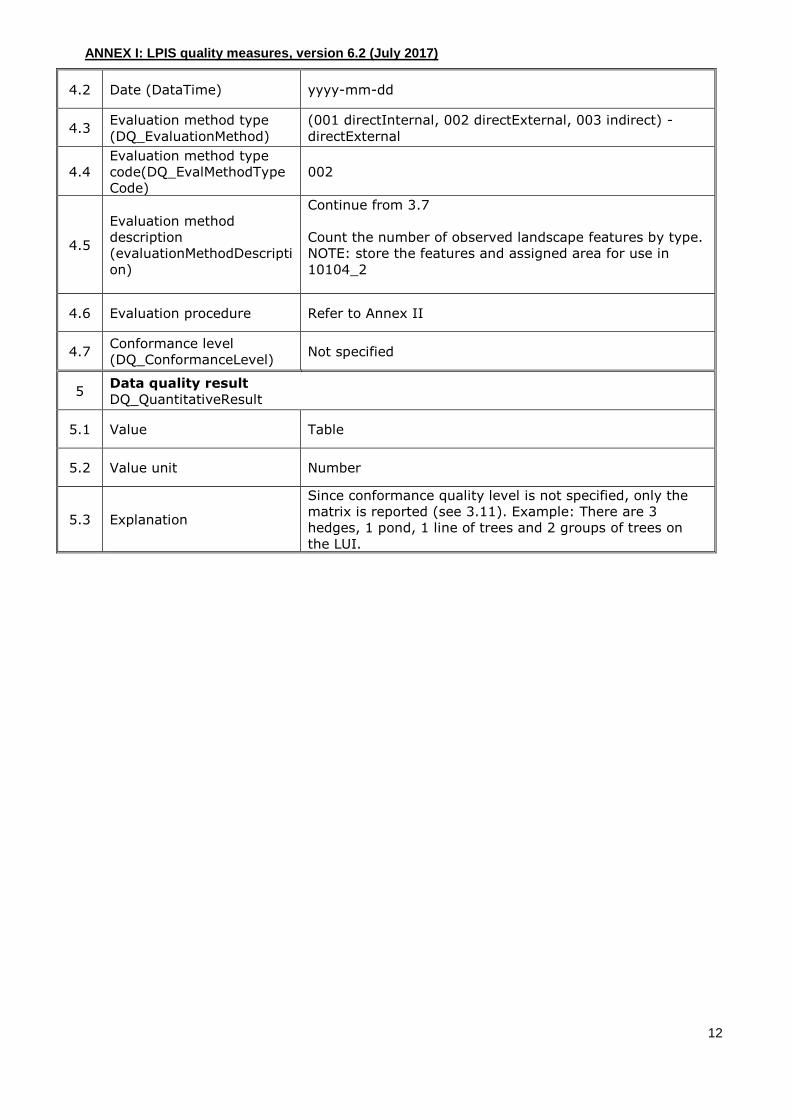
4.2 Date (DataTime) yyyy-mm-dd
4.3 Evaluation method type
(DQ_EvaluationMethod)
(001 directInternal, 002 directExternal, 003 indirect) -
directExternal
4.4
Evaluation method type
code(DQ_EvalMethodType
Code)
002
4.5
Evaluation method
description
(evaluationMethodDescripti
on)
Continue from 3.7
Count the number of observed landscape features by type.
NOTE: store the features and assigned area for use in
10104_2
4.6 Evaluation procedure Refer to Annex II
4.7 Conformance level
(DQ_ConformanceLevel) Not specified
5 Data quality result
DQ_QuantitativeResult
5.1 Value Table
5.2 Value unit Number
5.3 Explanation
Since conformance quality level is not specified, only the
matrix is reported (see 3.11). Example: There are 3
hedges, 1 pond, 1 line of trees and 2 groups of trees on
the LUI.

ANNEX I: LPIS quality measures, version 6.2 (July 2017)
13
TABLE 5: RP landscape features area (10104_2)
Data quality
components Value/Example/Description
1 Data Quality Unit Thematic accuracy/classification correctness of all land
cover features in scope
2 Data Quality Scope
All land cover features, which are on the LUI (relevant only
for those that can be measured)
(009 – Feature)
3 Data quality
measure/calculation
3.1 Measure identifier
(measureIdentifier) 10104_2
3.2 Name (Name) RP landscape features area
3.3 Alias (alias) RP_ELF
3.4 Element name
(elementName) Thematic accuracy/classification correctness
3.5 Basic Measure
(basicMeasure) Area of eligible landscape features
3.6 Definition (definition)
Area of the landscape features (subject to retention –
GAEC 7), which are inside OR are adjacent to agriculture
land, found on the LUI
3.7 Description (description)
Table reporting the sum of the eligible square meters
originating from landscape features found inside OR that
are on the immediate border of the agriculture land cover
features on the LUI.
The area of Landscape elements with up to 2 meters of
width (below the minimum mappable unit for the ETS) can
be incorporated in the agriculture land cover feature
adjacent to them.
3.8 Value Type (valueType) 2 - number
3.9 Value Structure
(valueStructure) 4 - Table
3.10 Source Reference
(sourceReference)
Citation (the citation of the documentation of the measure
– Annex II, explanation of the Activity Diagram, Actions
“C6”)
3.11 Example (example)
Eligible landscape features found
on the LUI Area (m2)
ponds 750
patches of trees 200
trees in line 300
Total 1250
4 Data quality evaluation
4.1 DQ_AggregationDerivation Derivation (10102)
4.2 Date (DataTime) yyyy-mm-dd

ANNEX I: LPIS quality measures, version 6.2 (July 2017)
14
4.3 Evaluation method type
(DQ_EvaluationMethod)
(001 directInternal, 002 directExternal, 003 indirect) -
directExternal
4.4
Evaluation method type
code(DQ_EvalMethodType
Code)
002
4.5
Evaluation method
description
(evaluationMethodDescripti
on)
NOTE: this requires stored information from measure
10104 of Annex I
See Actions C6 from the Annex "Activity Diagram"
Recover the individual delineated eligible landscape
features, which are inside OR are on the immediate border
of the agriculture land already determined in Action B.
Retrieve their eligible area using the information from the
eligibility profile. Sum up the assigned area by type of the
eligible landscape feature.
4.6 Evaluation procedure Refer to Annex II
4.7 Conformance level
(DQ_ConformanceLevel) Not specified
5 Data quality result
DQ_QuantitativeResult
5.1 Value Record
5.2 Value unit Square meters
5.3 Explanation
1250 m2 of eligible landscape features found within OR that
are adjacent to the agriculture land on the LUI. Since
conformance quality level is not specified, only the area is
reported.

ANNEX I: LPIS quality measures, version 6.2 (July 2017)
15
TABLE 6: RP Non-agriculture land cover features (10105)
Data quality
components Value/Example/Description
1 Data Quality Unit Thematic accuracy/classification correctness of all land
cover features identified in scope
2 Data Quality Scope
All land cover features identified, which are on the LUI
(relevant only for those that can be measured)
(009 – Feature)
3 Data quality measure
3.1 Measure identifier
(measureIdentifier) 10105
3.2 Name (Name) RP non-agriculture land cover features
3.3 Alias (alias) RP_ANF
3.4 Element name
(elementName) Thematic accuracy/classification correctness
3.5 Basic Measure
(basicMeasure) Error count
3.6 Definition (definition) Abundance of the non-agriculture land cover features,
which are on the LUI
3.7 Description (description) Table showing the total number of the non-agriculture land
cover features, which are on the LUI
3.8 Value Type (valueType) 2 - number
3.9 Value Structure
(valueStructure) 4 - Table
3.10 Source Reference
(sourceReference)
Citation (the citation of the documentation of the measure
– Annex II, explanation of the Activity Diagram, Actions
“D1 – D3”)
3.11 Example (example)
Non-agriculture land cover Abundance
Artificial sealed surface and
associated areas 3
Forest and Woodland 8
Scrubland 2
Water Bodies 0
Natural Bare areas 1
Waterlogged Vegetation 0
4 Data quality evaluation
4.1 DQ_AggregationDerivation Derivation (10102)
4.2 Date (DataTime) yyyy-mm-dd
4.3 Evaluation method type
(DQ_EvaluationMethod)
(001 directInternal, 002 directExternal, 003 indirect) -
directExternal
4.4
Evaluation method type
code(DQ_EvalMethodType
Code)
002

ANNEX I: LPIS quality measures, version 6.2 (July 2017)
16
4.5
Evaluation method
description
(evaluationMethodDescripti
on)
See Actions D1 - D3 from the Annex IIb "Activity Diagram"
1. Count the number of individual distinct non-agriculture
land cover features by class type, which has been already
identified/detected in Actions B and C, by type of major
land cover class, according the predefined class list.
2. Count and report the presence of any other not
delineated individual non-agriculture feature found within
the LUI
3. Provide point location for each of the individual non-
agriculture features found on the LUI.
NOTE: Only individual and distinct non-agriculture land
cover features should be considered. Small intrusions of
non-agriculture land cover at the border of the LUI, due to
imprecise matching with the reference orthoimage and
delineation artefacts are not counted.
4.6 Evaluation procedure Refer to Annex II
4.7 Conformance level
(DQ_ConformanceLevel) Not specified
5 Data quality result
DQ_QuantitativeResult
5.1 Value Record (table)
5.2 Value unit Number
5.3 Explanation
14 non-agriculture land cover features found on the LUI.
Since conformance quality level is not specified, only the
number is reported.

ANNEX I: LPIS quality measures, version 6.2 (July 2017)
17
TABLE 7: RP Critical defects (10106)
Data quality
components Value/Example/Description
1 Data Quality Unit Usability of all land cover features in scope
2 Data Quality Scope
All land cover features, which are on the land represented
by the Reference Parcel (relevant for all RPs that are part
of the QC sample)
(009 – Feature)
3 Data quality measure
3.1 Measure identifier
(measureIdentifier) 10106
3.2 Name (Name) RP Conformance Critical Defects
3.3 Alias (alias) RP_CRA
3.4 Element name
(elementName) Usability
3.5 Basic Measure
(basicMeasure) Error indicator
3.6 Definition (definition)
Occurrence of local ground conditions, which evidenced for
non-compliances (critical defects) that violate the
implementation decisions and choices made for the LPIS
under inspection (SUT) and/or obstruct the use of the
reference parcel (in the IACS processes where the LPIS
play core part).
3.7 Description (description)
See Actions E1 from the Annex "Activity Diagram".
Use the detailed instructions (No 1) for this inspection.
1. Check for the occurrence of a critical defect, starting
from the first defect listed at the top of the table (given
below) and cascade down to the bottom.
2. For each of the pre-defined critical defects from the list:
a) Verify the LPIS implementation decisions and choices
as reported in the TG IXIT (Annex X) to define the
general conditions
b) Identify and detect the occurrence of ALL local
ground conditions listed, that evidenced for non-
compliances that violate the implementation
decisions and choices of the LPIS under inspection
and obstruct the use of the reference parcel. Use the
information provided by IXIT, as part of the MTS-log
and the predefined list of local ground conditions.
Table indicating the presence or absence of local ground
conditions (expressed through the observed land cover and
land use), which evidenced for non-compliances (critical
defects) that violate the implementation decisions and
choices made for the LPIS (SUT) under inspection and/or
obstruct the use of the reference parcel. The parcel is
flagged as non-conforming, if it contains at least one
critical defect.

ANNEX I: LPIS quality measures, version 6.2 (July 2017)
18
3.8 Value Type (valueType) 1 – Boolean variable
3.9 Value Structure
(valueStructure) 4 - Table
3.10 Source Reference
(sourceReference)
Citation (the citation of the documentation of the measure
– Annex II, explanation of the Activity Diagram, Actions
“E1”)
3.11 Example (example)
Critical Defect Occurrence
Total absence of agriculture land
(totalAbsenceOfAgricultureLand) Yes
Invalid RP perimeter (invalidRpPerimeter) No
Invalid Common RP boundary
(invalidCommonRpBoundary) No
Incomplete block (incompleteBlock) No
Multi-polygon (multiPolygon) No
Multi-parcel (multiParcel) No
4 Data quality evaluation
4.1 Date (DataTime) yyyy-mm-dd
4.2 Evaluation method type
(DQ_EvaluationMethod)
(001 directInternal, 002 directExternal, 003 indirect) -
directExternal
4.3
Evaluation method type
code(DQ_EvalMethodType
Code)
002
4.4
Evaluation method
description
(evaluationMethodDescripti
on)
Continue from 3.7
3. Flag the parcel as non-conforming, if at least one critical
defect is detected.
NOTE: Detailed instruction (No 1) on how to detect the
presence of such non-compliances at the level of the
reference parcel, is provided at the end of this document
4.5 Evaluation procedure Refer to Annex II
4.6 Conformance level
(DQ_ConformanceLevel) Zero presence of Critical Defects
5 Data quality result
DQ_ConformanceResult
5.1 Specification LPIS specification
5.2 Explanation One critical defect found. Reference Parcel is not
conforming.
5.3 Pass Boolean (1=yes, 0=no)
ANNEX I: LPIS quality measures, version 6.2 (July 2017)
19
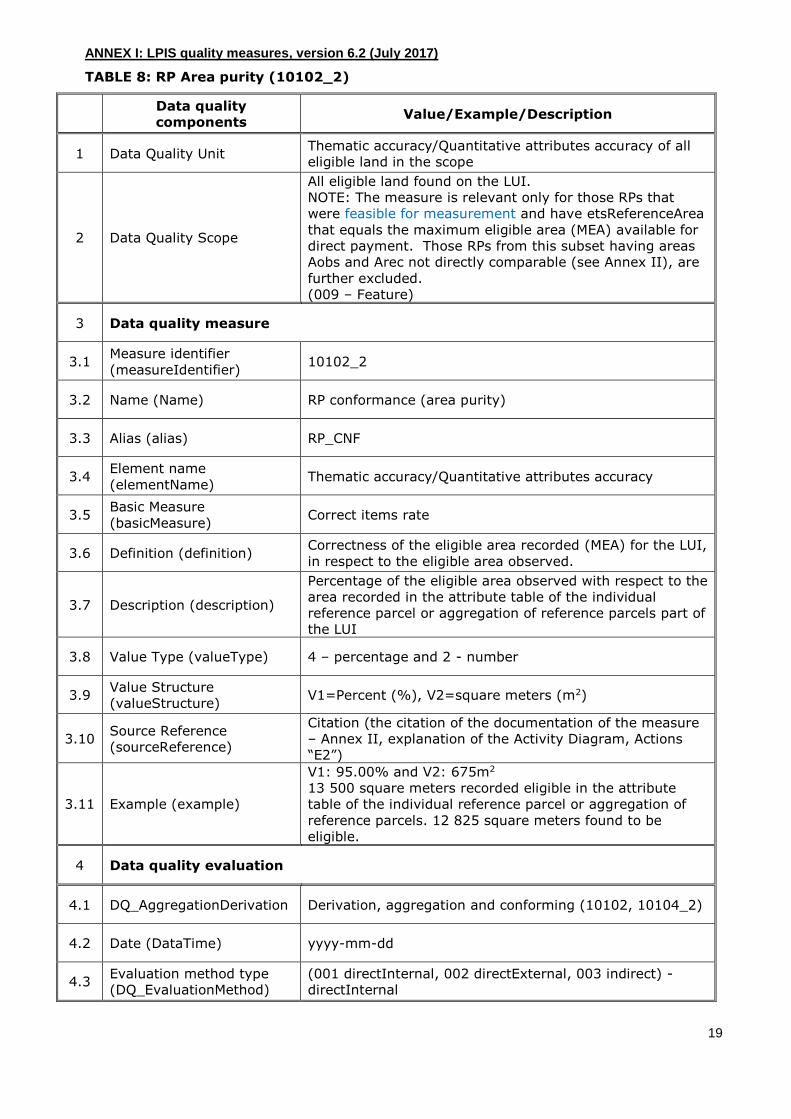
TABLE 8: RP Area purity (10102_2)
Data quality
components Value/Example/Description
1 Data Quality Unit Thematic accuracy/Quantitative attributes accuracy of all
eligible land in the scope
2 Data Quality Scope
All eligible land found on the LUI.
NOTE: The measure is relevant only for those RPs that
were feasible for measurement and have etsReferenceArea
that equals the maximum eligible area (MEA) available for
direct payment. Those RPs from this subset having areas
Aobs and Arec not directly comparable (see Annex II), are
further excluded.
(009 – Feature)
3 Data quality measure
3.1 Measure identifier
(measureIdentifier) 10102_2
3.2 Name (Name) RP conformance (area purity)
3.3 Alias (alias) RP_CNF
3.4 Element name
(elementName) Thematic accuracy/Quantitative attributes accuracy
3.5 Basic Measure
(basicMeasure) Correct items rate
3.6 Definition (definition) Correctness of the eligible area recorded (MEA) for the LUI,
in respect to the eligible area observed.
3.7 Description (description)
Percentage of the eligible area observed with respect to the
area recorded in the attribute table of the individual
reference parcel or aggregation of reference parcels part of
the LUI
3.8 Value Type (valueType) 4 – percentage and 2 - number
3.9 Value Structure
(valueStructure) V1=Percent (%), V2=square meters (m2)
3.10 Source Reference
(sourceReference)
Citation (the citation of the documentation of the measure
– Annex II, explanation of the Activity Diagram, Actions
“E2”)
3.11 Example (example)
V1: 95.00% and V2: 675m2
13 500 square meters recorded eligible in the attribute
table of the individual reference parcel or aggregation of
reference parcels. 12 825 square meters found to be
eligible.
4 Data quality evaluation
4.1 DQ_AggregationDerivation Derivation, aggregation and conforming (10102, 10104_2)
4.2 Date (DataTime) yyyy-mm-dd
4.3 Evaluation method type
(DQ_EvaluationMethod)
(001 directInternal, 002 directExternal, 003 indirect) -
directInternal

ANNEX I: LPIS quality measures, version 6.2 (July 2017)
20
4.4
Evaluation method type
code(DQ_EvalMethodType
Code)
001
4.5
Evaluation method
description
(evaluationMethodDescripti
on)
Percentage of the eligible area observed with respect to the
eligible area recorded in the attribute table of the individual
reference parcel or aggregation of reference parcels
NOTE: In order to calculate the eligible area found, sum up
the values derived in 10102 and 10104_2.
See Actions E2 from the Annex "Activity Diagram".
Compare the sum of square meters found eligible with
respect to those recorded as eligible in the attribute table
of the individual reference parcel or aggregation of
reference parcels. Sum up the area found to be eligible -
Aobs. Then:
1. Divide the result (Aobs) by the total area recorded as
eligible in the attribute table (Arec). Multiply by 100.
Report the value. (v1)
2. Subtract (Aobs) from the area recorded as eligible in
the attribute table (Arec). Report the value in absolute
terms (v2)
4.6 Evaluation procedure Refer to Annex II
4.7 Conformance level
(DQ_ConformanceLevel)
a) For individual reference parcel or aggregation of
reference parcels with area recorded greater than
5000m2.
(v1) more than (or equal to) 97.00 % and less
than (or equal to) 103.00 %
AND
(v2) Not greater than 10 000 m2.
b) For individual reference parcel or aggregation of
reference parcels with area recorded between (or equal
to) 2000m2 and 5000 m2.
(v1) more than (or equal to) 95.00 % and less than
(or equal to) 105.00 %
c) For individual reference parcel or aggregation of
reference parcels with area recorded less than 2000 m2.
(v1) more than (or equal to) 93.00 % and less than
(or equal to) 107.00 %
5 Data quality result
DQ_ConformanceResult
5.1 Specification LPIS specification
5.2 Explanation
Less than 97.00% of the square meters recorded as
eligible in the attribute table of the individual reference
parcel or aggregation of reference parcels, are found as
eligible. Reference Parcel fails.
5.3 Pass Boolean (1=yes, 0=no)

ANNEX I: LPIS quality measures, version 6.2 (July 2017)
21
TABLE 8.2: RP ”contaminated” Reference Parcels (10102_3)
Data quality
components Value/Example/Description
1 Data Quality Unit Completeness/Commission of all land cover features in
scope
2 Data Quality Scope
All land cover features, which are on the land represented
by the Reference Parcel. NOTE: The measure is applicable
only for those RPs found to be conformant in respect to
quality measure 10102_2
(009 – Feature)
3 Data quality measure
3.1 Measure identifier
(measureIdentifier) 10102_3
3.2 Name (Name) RP Conformance (“Contaminated” reference parcel)
3.3 Alias (alias) RP_CNT
3.4 Element name
(elementName) Completeness/Commission
3.5 Basic Measure
(basicMeasure) Error indicator
3.6 Definition (definition)
Occurrence of non-agriculture land cover features on the
land represented by the Reference Parcel (if the parcel is
found to be conformant in respect to 10102_2) that are
considered triggers for contamination, which violate the
relevant general and local ETS conditions for the pre-
defined waiver.
3.7 Description (description)
Table indicating the presence (occurrence) of non-
agriculture land cover features, considered as triggers for
contamination, by land cover type (as is defined by
measure 10105), on the LUI Reference Parcel (Item for
Inspection) and the conformance status of the Reference
Parcel in respect to that “contamination”.
The parcel is flagged as non-conforming, if at least one
occurrence of these triggers for contamination remains
“unwaivered”. (see Detailed Instruction 2).
3.8 Value Type (valueType) 1 – Boolean variable
3.9 Value Structure
(valueStructure) 4 - Table
3.10 Source Reference
(sourceReference)
Citation (the citation of the documentation of the measure
– Annex II, explanation of the Activity Diagram, Actions
“E3”)
3.11 Example (example)
Contamination per land cover
Present within the item for
inspection?
Waivered Waiver
Artificial sealed surface and associated areas
Yes Yes C
Forest and Woodland Yes Yes C
Scrubland Yes Yes C
Water Bodies No
Natural Bare areas Yes Yes C
ANNEX I: LPIS quality measures, version 6.2 (July 2017)
22
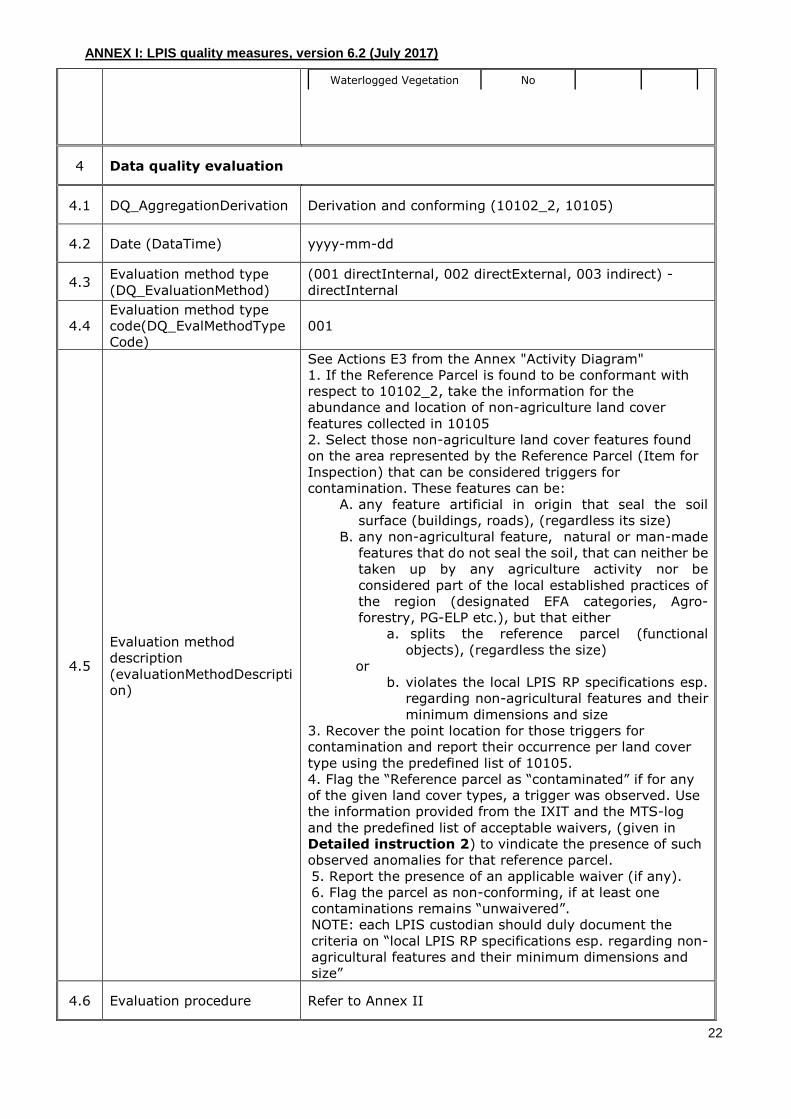
Waterlogged Vegetation No
4 Data quality evaluation
4.1 DQ_AggregationDerivation Derivation and conforming (10102_2, 10105)
4.2 Date (DataTime) yyyy-mm-dd
4.3 Evaluation method type
(DQ_EvaluationMethod)
(001 directInternal, 002 directExternal, 003 indirect) -
directInternal
4.4
Evaluation method type
code(DQ_EvalMethodType
Code)
001
4.5
Evaluation method
description
(evaluationMethodDescripti
on)
See Actions E3 from the Annex "Activity Diagram"
1. If the Reference Parcel is found to be conformant with
respect to 10102_2, take the information for the
abundance and location of non-agriculture land cover
features collected in 10105
2. Select those non-agriculture land cover features found
on the area represented by the Reference Parcel (Item for
Inspection) that can be considered triggers for
contamination. These features can be:
A. any feature artificial in origin that seal the soil
surface (buildings, roads), (regardless its size)
B. any non-agricultural feature, natural or man-made
features that do not seal the soil, that can neither be
taken up by any agriculture activity nor be
considered part of the local established practices of
the region (designated EFA categories, Agro-
forestry, PG-ELP etc.), but that either
a. splits the reference parcel (functional
objects), (regardless the size)
or
b. violates the local LPIS RP specifications esp.
regarding non-agricultural features and their
minimum dimensions and size
3. Recover the point location for those triggers for
contamination and report their occurrence per land cover
type using the predefined list of 10105.
4. Flag the “Reference parcel as “contaminated” if for any
of the given land cover types, a trigger was observed. Use
the information provided from the IXIT and the MTS-log
and the predefined list of acceptable waivers, (given in
Detailed instruction 2) to vindicate the presence of such
observed anomalies for that reference parcel.
5. Report the presence of an applicable waiver (if any).
6. Flag the parcel as non-conforming, if at least one
contaminations remains “unwaivered”.
NOTE: each LPIS custodian should duly document the
criteria on “local LPIS RP specifications esp. regarding non-
agricultural features and their minimum dimensions and
size”
4.6 Evaluation procedure Refer to Annex II

ANNEX I: LPIS quality measures, version 6.2 (July 2017)
23
4.7 Conformance level
(DQ_ConformanceLevel) Absence of “unwaivered” occurrence of contamination.
5 Data quality result
DQ_ConformanceResult
5.1 Specification LPIS specification
5.2 Explanation
Example: Reference parcel is “contaminated” by artificial
sealed surface
Reference parcel is “contaminated”, but there is no
presence of “unwaivered” occurrence of ineligible features.
Reference Parcel is conforming.
5.3 Pass Boolean (1=yes, 0=no)
ANNEX I: LPIS quality measures, version 6.2 (July 2017)
24
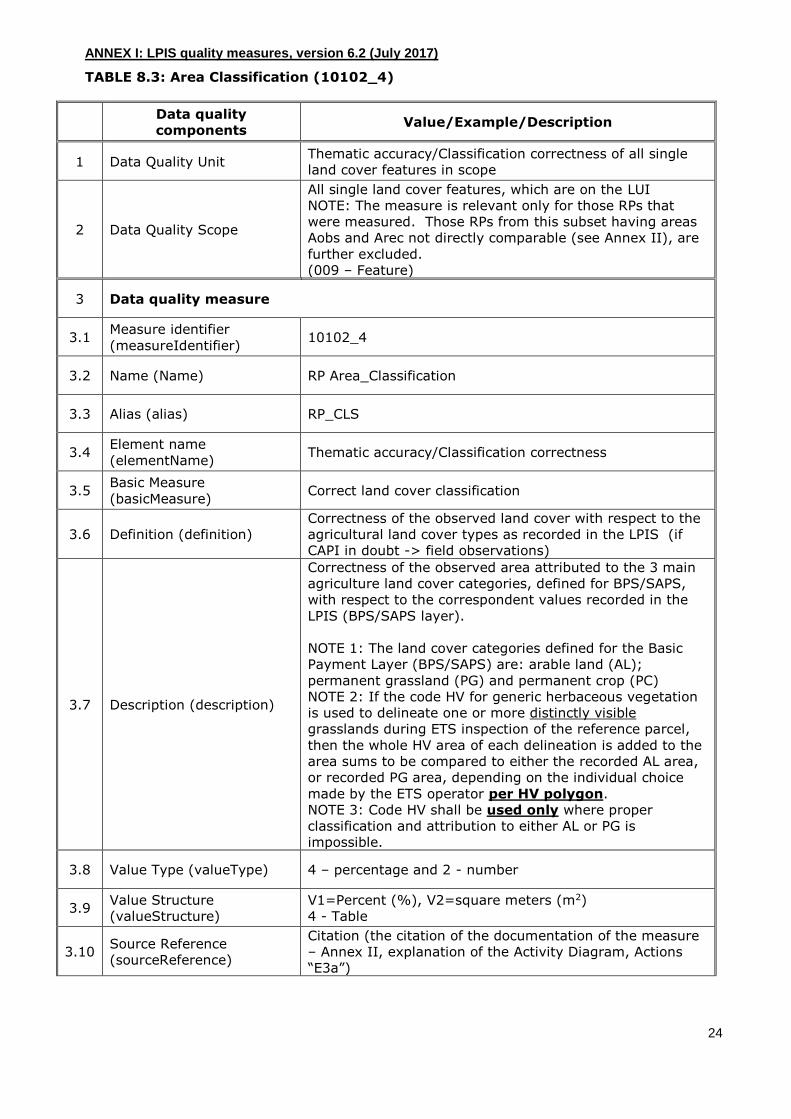
TABLE 8.3: Area Classification (10102_4)
Data quality
components Value/Example/Description
1 Data Quality Unit Thematic accuracy/Classification correctness of all single
land cover features in scope
2 Data Quality Scope
All single land cover features, which are on the LUI
NOTE: The measure is relevant only for those RPs that
were measured. Those RPs from this subset having areas
Aobs and Arec not directly comparable (see Annex II), are
further excluded.
(009 – Feature)
3 Data quality measure
3.1 Measure identifier
(measureIdentifier) 10102_4
3.2 Name (Name) RP Area_Classification
3.3 Alias (alias) RP_CLS
3.4 Element name
(elementName) Thematic accuracy/Classification correctness
3.5 Basic Measure
(basicMeasure) Correct land cover classification
3.6 Definition (definition)
Correctness of the observed land cover with respect to the
agricultural land cover types as recorded in the LPIS (if
CAPI in doubt -> field observations)
3.7 Description (description)
Correctness of the observed area attributed to the 3 main
agriculture land cover categories, defined for BPS/SAPS,
with respect to the correspondent values recorded in the
LPIS (BPS/SAPS layer).
NOTE 1: The land cover categories defined for the Basic
Payment Layer (BPS/SAPS) are: arable land (AL);
permanent grassland (PG) and permanent crop (PC)
NOTE 2: If the code HV for generic herbaceous vegetation
is used to delineate one or more distinctly visible
grasslands during ETS inspection of the reference parcel,
then the whole HV area of each delineation is added to the
area sums to be compared to either the recorded AL area,
or recorded PG area, depending on the individual choice
made by the ETS operator per HV polygon.
NOTE 3: Code HV shall be used only where proper
classification and attribution to either AL or PG is
impossible.
3.8 Value Type (valueType) 4 – percentage and 2 - number
3.9 Value Structure
(valueStructure)
V1=Percent (%), V2=square meters (m2)
4 - Table
3.10 Source Reference
(sourceReference)
Citation (the citation of the documentation of the measure
– Annex II, explanation of the Activity Diagram, Actions
“E3a”)

ANNEX I: LPIS quality measures, version 6.2 (July 2017)
25
3.11 Example (example)
For each item of inspection
LC
catego
ry
Observ
ed on
the
LUI?
(Y/N)
Record
ed in
LPIS?
(Y/N)
V1
(%)
V2
(m2)
Waive
red
Waiver
AL Y Y 93
%
100 Yes E
PG Y Y 17
%
160 No
PC N Y N/A N/A N/A N/A
4 Data quality evaluation
4.1 DQ_AggregationDerivation Derivation, aggregation and conforming (10102, 10104_2)
4.2 Date (DataTime) yyyy-mm-dd
4.3 Evaluation method type
(DQ_EvaluationMethod)
(001 directInternal, 002 directExternal, 003 indirect) -
directInternal
4.4
Evaluation method type
code(DQ_EvalMethodType
Code)
001
4.5
Evaluation method
description
(evaluationMethodDescripti
on)
See Actions E3a from the Annex "Activity Diagram".
1. For each agriculture land cover category observed:
Check if present as recorded in the LPIS.
If affirmative, sum all areas of the agriculture land
cover features mapped within the LUI as derived in
10102 belonging to that category, together with
area of the corresponding landscape features found
within or adjacent to this agriculture land as
derived in 10104 (when appropriate, use the rules
for attribution of eligible landscape features given
in DSCG/2014/33)
Divide the result (Aobs LCcat) by the area
attributed to this category as recorded in the LPIS
for the individual reference parcel or aggregation of
reference parcels (Arec LCcat). Multiply by 100.
Report the value in percentage
Calculate the difference by subtracting (Aobs
LCcat) from the area attributed to this category as
recorded in the LPIS for the individual reference
parcel or aggregation of reference parcels (Arec
LCcat). Report the value (in absolute terms)
2. Check for agriculture land cover categories not
recorded in LPIS but found on ETS
3. Verify if the land cover inventory of the LUI returns HV
polygons AND the item is non-conforming due to:
AL OR PG recorded in the LPIS is not detected
AL OR PG area values observed are not as recorded
in the LPIS
The area difference for AL or PG values is above the
conformance threshold
4. If so, retrieve the available historical records that
evidence the recorded presence of any AL over the

ANNEX I: LPIS quality measures, version 6.2 (July 2017)
26
last 5 years preceding the ETS assessment for each
HV polygon in the LUI. These records shall be either :
historical orthoimagery, less than 6 years old,
farmer’s declarations, less than 6 years old
conclusive third party evidence
5. If such evidence is present for each HV polygon
Vindicate the non-conformity found by using waiver
E (see Detailed Instruction 4)
Else, keep the non-conformity found
6. Record your findings and provide the evidence for the
use of waiver E as PDF document, including the
relevant ID of the reference parcel.
7. Flag the parcel as non-conforming, if at least one
classification error remains “unwaivered”.
NOTE 1: Once a non-conformity is vindicated, no
adjustment in the measurements (copy/pasting from
historical data or delineation from older image) is needed.
Also, there is no need to adjust the values for AL and PG
at the level of the item of inspection.
4.6 Evaluation procedure Refer to Annex II
4.7 Conformance level
(DQ_ConformanceLevel)
1. Observed agriculture land cover category on the LUI
should be present as recorded in the LPIS
AND
2. The difference between the area observed and recorded
per category should be as follows:
a) For individual reference parcel or aggregation of
reference parcels with agriculture area for a given
category recorded to be greater than 5000m2.
(v1) more than (or equal to) 97.00 % and less
than (or equal to) 103.00 %
AND
(v2) Not greater than 10 000 m2.
b) For individual reference parcel or aggregation of
reference parcels with agriculture area for a given
category recorded between (or equal to) 2000m2 and
5000 m2.
(v1) more than (or equal to) 95.00 % and less
than (or equal to) 105.00 %
c) For individual reference parcel or aggregation of
reference parcels with agriculture area for a given
category recorded less than 2000 m2.
(v1) more than (or equal to) 93.00 % and less than
(or equal to) 107.00 %
3. Each agriculture land cover category recorded in the
LPIS for individual reference parcel or aggregation of
reference parcels should be present on the LUI
5 Data quality result
DQ_QuantitativeResult
5.1 Specification LPIS specification
5.2 Explanation Two of the three agriculture land cover categories are
found on the LUI.

ANNEX I: LPIS quality measures, version 6.2 (July 2017)
27
1. The presence of AL is accounted in the LPIS the
correspondent area is correct, as the area difference
is vindicated (waivered). 2. The presence of PG is accounted in the LPIS,
however the correspondent area is incorrect. 3. There is presence of PC recorded in the LPIS, which
is not found during the ETS (omission) Two misclassification errors were found. The reference
parcel is non-conforming.
5.3 Pass Boolean (1=yes, 0=no)

ANNEX I: LPIS quality measures, version 6.2 (July 2017)
28
TABLE 9: RP cause of non-conformity (10107)
Data quality
components Value/Example/Description
1 Data Quality Unit Completeness/Commission of possible weaknesses found
on the non-conforming Reference Parcels in scope
2 Data Quality Scope
Each non-conforming Reference Parcels, which take part of
the QC sample, as identified in measures 10106, 10102_2,
10102_3 and 10102_4
(009 – Feature)
3 Data quality measure
3.1 Measure identifier
(measureIdentifier) 10107
3.2 Name (Name)
Categorization of the possible weaknesses found on the
non-conforming reference parcels (derived from 10106,
10102_2, 10102_3 and 10102_4), in the LPIS
3.3 Alias (alias) RP_CEA, ReasonForNonConformityValue
3.4 Element name
(elementName) Completeness/Commission
3.5 Basic Measure
(basicMeasure)
3.6 Definition (definition)
Categorization of the possible weaknesses found on the
non-conforming Reference Parcel, based on a pre-defined
list of causes for the non-conformity
3.7 Description (description)
Table, which verifies the occurrence of the initially pre-
defined causes for the presence of the detected problem
for each possible weaknesses found on the non-conforming
Reference Parcel. There can be more than one non-
conformity (possible weakness) found for the item for
inspection.
NOTE 1: Each individual contamination reported in quality
measure 10102_3 for the item of inspection is counted as
one non-conformity (weakness).
Note 2: The total absence of eligible land for a given
Reference Parcel is reported as critical defect, but also as
area-based and classification correctness non-conformities.
However, within the context of 10107, such observation
(no agricultural area found) is reported as one single
weakness only.
3.8 Value Type (valueType) 1 – Boolean variable
3.9 Value Structure
(valueStructure) 4 - Table
3.10 Source Reference
(sourceReference)
Citation (the citation of the documentation of the measure
– Annex II, explanation of the Activity Diagram, Actions
“E4”)
3.11 Example (example)
Non-
conformity
-
weakness
Type of non-
conformity
(weakness)
Causes/reason
for occurrence of
the non-
conformity found
Occurence

ANNEX I: LPIS quality measures, version 6.2 (July 2017)
29
P01 Critical Defect Changes of the
underlying land
where not applied
(missedUpdate)
Yes
Revisions of the
Regulations were
not applied
(missedUpgrade)
No
Incomplete
processing
(incompleteProcessi
ng)
No
Erroneous
processing
(processingError)
No
Incomplete LPIS
design
(incompatibleDesig
n)
No
P02 Contamination Changes of the
underlying land
where not applied
(missedUpdate)
No
Revisions of the
Regulations were
not applied
(missedUpgrade)
No
Incomplete
processing
(incompleteProcessi
ng)
Yes
Erroneous
processing
(processingError)
No
Incomplete LPIS
design
(incompatibleDesig
n)
No
P03 Contamination Changes of the
underlying land
where not applied
(missedUpdate)
Yes
Revisions of the
Regulations were
not applied
(missedUpgrade)
No
Incomplete
processing
No

ANNEX I: LPIS quality measures, version 6.2 (July 2017)
30
(incompleteProcessi
ng)
Erroneous
processing
(processingError)
No
Incomplete LPIS
design
(incompatibleDesig
n)
No
P04 Classification
incorrectness
Changes of the
underlying land
where not applied
(missedUpdate)
No
Revisions of the
Regulations were
not applied
(missedUpgrade)
No
Incomplete
processing
(incompleteProcessi
ng)
No
Erroneous
processing
(processingError)
Yes
Incomplete LPIS
design
(incompatibleDesig
n)
No
4 Data quality evaluation
4.1 DQ_AggregationDerivation Derivation and aggregation (10106, 10102_2, 10102_3,
and 10102_4)
4.2 Date (DataTime) yyyy-mm-dd
4.3 Evaluation method type
(DQ_EvaluationMethod)
(001 directInternal, 002 directExternal, 003 indirect) -
directExternal
4.4
Evaluation method type
code(DQ_EvalMethodType
Code)
002
4.5
Evaluation method
description
(evaluationMethodDescripti
on)
See Actions E4 from the Annex IIb "Activity Diagram".
Assign to each non-conformity (possible weakness), one
and only one given pre-defined causes. Consult the local
LPIS data model and the results from the MTS, wherever is
needed
Follow the Detailed Instruction 3 on the categorization
of the non-conformant parcels, given at the end of this
document.
4.6 Evaluation procedure Refer to Annex II

ANNEX I: LPIS quality measures, version 6.2 (July 2017)
31
4.7 Conformance level
(DQ_ConformanceLevel) Not specified
5 Data quality result
DQ_QuantitativeResult
5.1 Value Record
5.2 Value unit Number
5.3 Explanation
The Reference Parcel in this particular example has 4
causes for the presence of the non-conformity –
“missedUpdate” twice, one “erroneousProcessing” and one
“incompleteProcessing”. Since conformance quality level is
not specified, only the values are reported.

ANNEX I: LPIS quality measures, version 6.2 (July 2017)
32
1. Data consolidation and analysis at LPIS sample level
The following 9 tables describe the measures related to the data consolidation and analysis at
LPIS sample level. TABLE 10: LPIS eligible area (10201)
Data quality
components
Value/Example/Description
1 Data Quality Unit Thematic accuracy/Quantitative attribute accuracy of all
Reference parcels in scope
2 Data Quality Scope
All Reference Parcels, which are part of the QC sample and
have etsReferenceArea that equals the maximum eligible
area (MEA) available for direct payment, minus RPs that
were not measured
(005 – Dataset)
3 Data quality measure
3.1 Measure identifier
(measureIdentifier) 10201
3.2 Name (Name) LPIS maximum eligible area
3.3 Alias (alias) LPIS_RP_MEA
3.4 Element name
(elementName) Thematic accuracy/Quantitative attribute accuracy
3.5 Basic Measure
(basicMeasure) Correct items rate
3.6 Definition (definition)
Rate of correct eligible hectares found with respect to the
total number of eligible hectares currently recorded in the
LPIS.
3.7 Description (description)
No measures. For further analysis use values derived in
10102 and 10104_2.
Percentage of the eligible hectares as observed, with
respect to all eligible hectares recorded.
3.8 Value Type (valueType) 4 – Percentage
3.9 Value Structure
(valueStructure) Number (%)
3.10 Source Reference
(sourceReference)
Citation (the citation of the documentation of the measure
– Annex II, explanation of the Activity Diagram)
3.11 Example (example) 96.60%
4 Data quality evaluation
4.1 DQ_AggregationDerivation Derivation, aggregation and conformity (10102, 10104_2)
4.2 Date (DataTime) yyyy-mm-dd
4.3 Evaluation method type
(DQ_EvaluationMethod)
(001 directInternal, 002 directExternal, 003 indirect) -
directExternal
ANNEX I: LPIS quality measures, version 6.2 (July 2017)
33
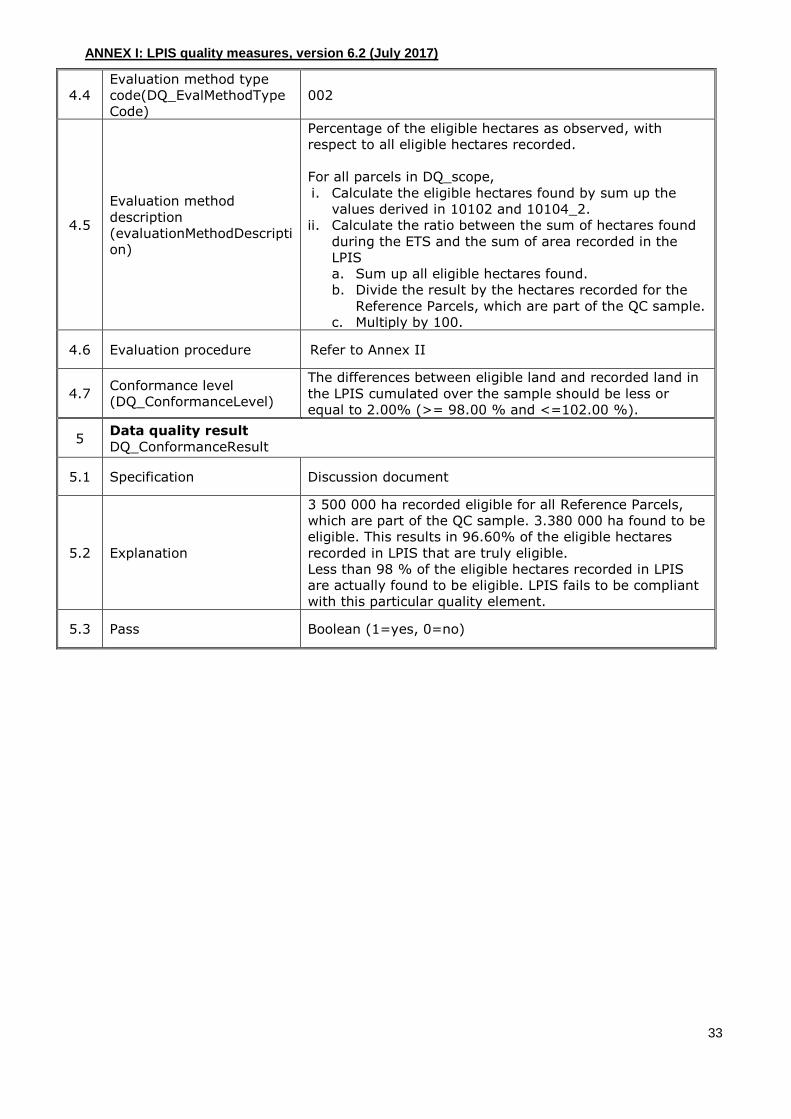
4.4
Evaluation method type
code(DQ_EvalMethodType
Code)
002
4.5
Evaluation method
description
(evaluationMethodDescripti
on)
Percentage of the eligible hectares as observed, with
respect to all eligible hectares recorded.
For all parcels in DQ_scope,
i. Calculate the eligible hectares found by sum up the
values derived in 10102 and 10104_2.
ii. Calculate the ratio between the sum of hectares found
during the ETS and the sum of area recorded in the
LPIS
a. Sum up all eligible hectares found.
b. Divide the result by the hectares recorded for the
Reference Parcels, which are part of the QC sample.
c. Multiply by 100.
4.6 Evaluation procedure Refer to Annex II
4.7 Conformance level
(DQ_ConformanceLevel)
The differences between eligible land and recorded land in
the LPIS cumulated over the sample should be less or
equal to 2.00% (>= 98.00 % and <=102.00 %).
5 Data quality result
DQ_ConformanceResult
5.1 Specification Discussion document
5.2 Explanation
3 500 000 ha recorded eligible for all Reference Parcels,
which are part of the QC sample. 3.380 000 ha found to be
eligible. This results in 96.60% of the eligible hectares
recorded in LPIS that are truly eligible.
Less than 98 % of the eligible hectares recorded in LPIS
are actually found to be eligible. LPIS fails to be compliant
with this particular quality element.
5.3 Pass Boolean (1=yes, 0=no)

ANNEX I: LPIS quality measures, version 6.2 (July 2017)
34
TABLE 10.2: LPIS lower and upper interval boundaries (10201_2)
Data quality
components
Value/Example/Description
1 Data Quality Unit Thematic accuracy/Quantitative attribute accuracy of all
Reference parcels in scope
2 Data Quality Scope
All Reference Parcels, which are part of the QC sample and
have etsReferenceArea that equals the maximum eligible
area (MEA) available for direct payment, minus RPs that
were not measured
(005 – Dataset)
3 Data quality measure
3.1 Measure identifier
(measureIdentifier) 10201_2
3.2 Name (Name) LPIS maximum eligible area – overestimates and
underestimates
3.3 Alias (alias) LPIS_RP_MEA_B
3.4 Element name
(elementName) Thematic accuracy/Quantitative attribute accuracy
3.5 Basic Measure
(basicMeasure) Area of incorrect items rate
3.6 Definition (definition)
One-sided probability boundary of the rates of the eligible
hectares that indicate overestimations and
underestimations found with respect to the total number of
eligible hectares currently recorded in the LPIS.
3.7 Description (description)
For further analysis use values derived in 10102 and
10104_2.
Percentage of the overestimate eligible hectares as
observed, with respect to all eligible hectares recorded.
3.8 Value Type (valueType) 4 – Percentage
3.9 Value Structure
(valueStructure) LIB: Percent (%), UIB: Percent (%)
3.10 Source Reference
(sourceReference)
Citation (the citation of the documentation of the measure
– Annex II, explanation of the Activity Diagram)
3.11 Example (example) LIB=7.26% , UIB=0.56%
Data quality evaluation
4.1 DQ_AggregationDerivation Derivation, aggregation and conformity (10102, 10104_2)
4.2 Date (DataTime) yyyy-mm-dd
4.3 Evaluation method type
(DQ_EvaluationMethod)
(001 directInternal, 002 directExternal, 003 indirect) -
directExternal
4.4
Evaluation method type
code(DQ_EvalMethodType
Code)
002
ANNEX I: LPIS quality measures, version 6.2 (July 2017)
35
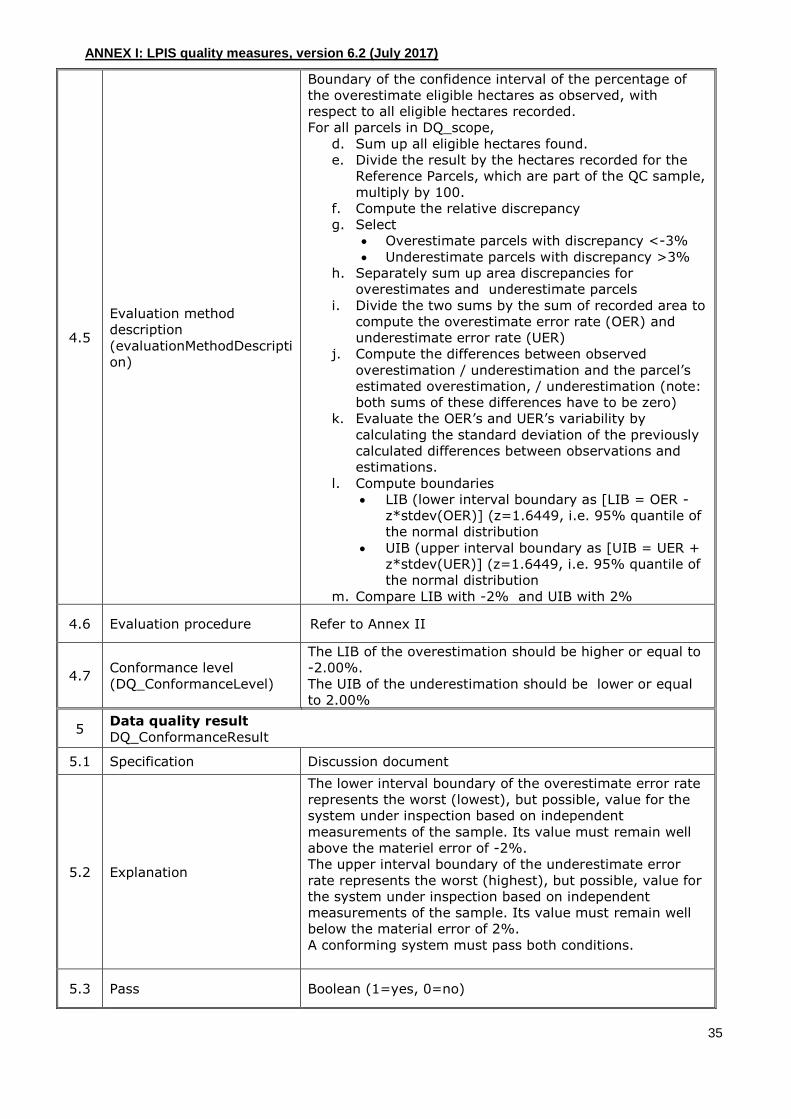
4.5
Evaluation method
description
(evaluationMethodDescripti
on)
Boundary of the confidence interval of the percentage of
the overestimate eligible hectares as observed, with
respect to all eligible hectares recorded.
For all parcels in DQ_scope,
d. Sum up all eligible hectares found.
e. Divide the result by the hectares recorded for the
Reference Parcels, which are part of the QC sample,
multiply by 100.
f. Compute the relative discrepancy
g. Select
Overestimate parcels with discrepancy <-3%
Underestimate parcels with discrepancy >3%
h. Separately sum up area discrepancies for
overestimates and underestimate parcels
i. Divide the two sums by the sum of recorded area to
compute the overestimate error rate (OER) and
underestimate error rate (UER)
j. Compute the differences between observed
overestimation / underestimation and the parcel’s
estimated overestimation, / underestimation (note:
both sums of these differences have to be zero)
k. Evaluate the OER’s and UER’s variability by
calculating the standard deviation of the previously
calculated differences between observations and
estimations.
l. Compute boundaries
LIB (lower interval boundary as [LIB = OER -
z*stdev(OER)] (z=1.6449, i.e. 95% quantile of
the normal distribution
UIB (upper interval boundary as [UIB = UER +
z*stdev(UER)] (z=1.6449, i.e. 95% quantile of
the normal distribution
m. Compare LIB with -2% and UIB with 2%
4.6 Evaluation procedure Refer to Annex II
4.7 Conformance level
(DQ_ConformanceLevel)
The LIB of the overestimation should be higher or equal to
-2.00%.
The UIB of the underestimation should be lower or equal
to 2.00%
5 Data quality result
DQ_ConformanceResult
5.1 Specification Discussion document
5.2 Explanation
The lower interval boundary of the overestimate error rate
represents the worst (lowest), but possible, value for the
system under inspection based on independent
measurements of the sample. Its value must remain well
above the materiel error of -2%.
The upper interval boundary of the underestimate error
rate represents the worst (highest), but possible, value for
the system under inspection based on independent
measurements of the sample. Its value must remain well
below the material error of 2%.
A conforming system must pass both conditions.
5.3 Pass Boolean (1=yes, 0=no)

ANNEX I: LPIS quality measures, version 6.2 (July 2017)
36
TABLE 11: LPIS area based non-conforming RP (10202)
Data quality
components Value/Example/Description
1 Data Quality Unit Thematic accuracy/Non-quantitative attribute correctness
of all Reference Parcels in scope
2 Data Quality Scope
All Reference Parcels, which are part of the QC sample and
have etsReferenceArea that equals the maximum eligible
area (MEA) available for direct payment, minus RPs that
were not feasible for measurement, minus RPs having
referenceArea that is not directly comparable (see Annex
II).
(005 – Dataset)
3 Data quality measure
3.1 Measure identifier
(measureIdentifier) 10202
3.2 Name (Name) Number of area non-conforming reference parcels in LPIS
3.3 Alias (alias) LPIS_RP_NEA
3.4 Element name
(elementName) Thematic accuracy/Non-quantitative attribute correctness
3.5 Basic Measure
(basicMeasure) Error count
3.6 Definition (definition)
Number of area-based non-conforming Reference Parcels
(as identified in measures 10102_2 and 10102_3) in
respect to all Reference Parcel from the DQ_Scope.
3.7 Description (description)
No measures. Use the values from 10102_2 and 10102_3
Total number of area non-conforming Reference Parcels
derived from measures 10102_2 and 10102_3 compared
to the total number of Reference Parcel from the
DQ_Scope.
3.8 Value Type (valueType) 2 – Number
3.9 Value Structure
(valueStructure) “Number” out of “number”
3.10 Source Reference
(sourceReference)
Citation (the citation of the documentation of the measure
– Annex II, explanation of the Activity Diagram)
3.11 Example (example) 178 out of 1250
4 Data quality evaluation
4.1 DQ_AggregationDerivation Derivation, aggregation and conformity (10102_2 and
10102_3)
4.2 Date (DataTime) yyyy-mm-dd
ANNEX I: LPIS quality measures, version 6.2 (July 2017)
37
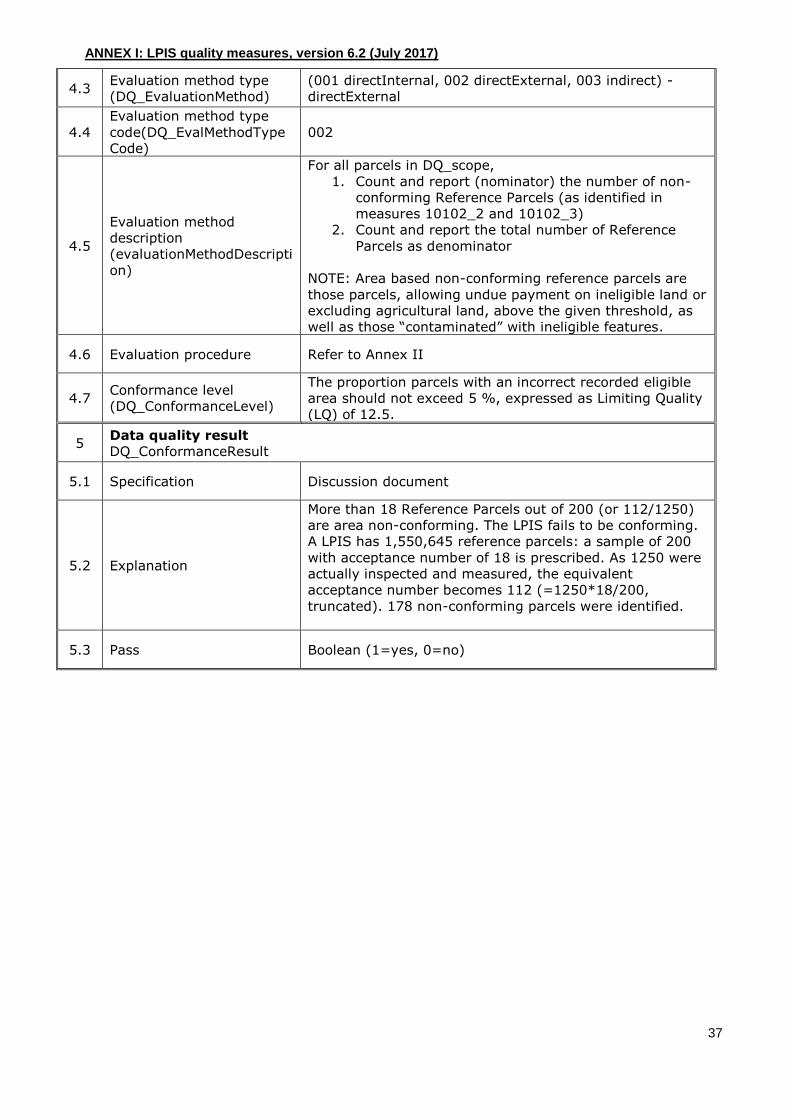
4.3 Evaluation method type
(DQ_EvaluationMethod)
(001 directInternal, 002 directExternal, 003 indirect) -
directExternal
4.4
Evaluation method type
code(DQ_EvalMethodType
Code)
002
4.5
Evaluation method
description
(evaluationMethodDescripti
on)
For all parcels in DQ_scope,
1. Count and report (nominator) the number of non-
conforming Reference Parcels (as identified in
measures 10102_2 and 10102_3)
2. Count and report the total number of Reference
Parcels as denominator
NOTE: Area based non-conforming reference parcels are
those parcels, allowing undue payment on ineligible land or
excluding agricultural land, above the given threshold, as
well as those “contaminated” with ineligible features.
4.6 Evaluation procedure Refer to Annex II
4.7 Conformance level
(DQ_ConformanceLevel)
The proportion parcels with an incorrect recorded eligible
area should not exceed 5 %, expressed as Limiting Quality
(LQ) of 12.5.
5 Data quality result
DQ_ConformanceResult
5.1 Specification Discussion document
5.2 Explanation
More than 18 Reference Parcels out of 200 (or 112/1250)
are area non-conforming. The LPIS fails to be conforming.
A LPIS has 1,550,645 reference parcels: a sample of 200
with acceptance number of 18 is prescribed. As 1250 were
actually inspected and measured, the equivalent
acceptance number becomes 112 (=1250*18/200,
truncated). 178 non-conforming parcels were identified.
5.3 Pass Boolean (1=yes, 0=no)
ANNEX I: LPIS quality measures, version 6.2 (July 2017)
38
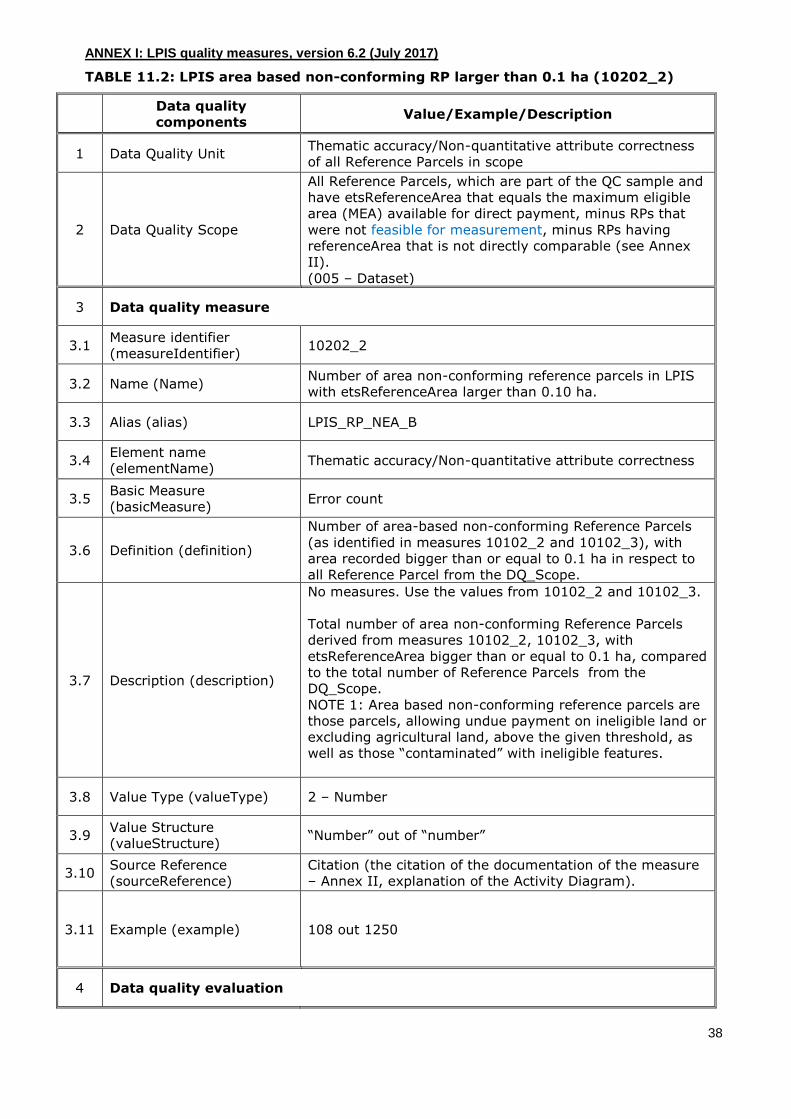
TABLE 11.2: LPIS area based non-conforming RP larger than 0.1 ha (10202_2)
Data quality
components Value/Example/Description
1 Data Quality Unit Thematic accuracy/Non-quantitative attribute correctness
of all Reference Parcels in scope
2 Data Quality Scope
All Reference Parcels, which are part of the QC sample and
have etsReferenceArea that equals the maximum eligible
area (MEA) available for direct payment, minus RPs that
were not feasible for measurement, minus RPs having
referenceArea that is not directly comparable (see Annex
II).
(005 – Dataset)
3 Data quality measure
3.1 Measure identifier
(measureIdentifier) 10202_2
3.2 Name (Name) Number of area non-conforming reference parcels in LPIS
with etsReferenceArea larger than 0.10 ha.
3.3 Alias (alias) LPIS_RP_NEA_B
3.4 Element name
(elementName) Thematic accuracy/Non-quantitative attribute correctness
3.5 Basic Measure
(basicMeasure) Error count
3.6 Definition (definition)
Number of area-based non-conforming Reference Parcels
(as identified in measures 10102_2 and 10102_3), with
area recorded bigger than or equal to 0.1 ha in respect to
all Reference Parcel from the DQ_Scope.
3.7 Description (description)
No measures. Use the values from 10102_2 and 10102_3.
Total number of area non-conforming Reference Parcels
derived from measures 10102_2, 10102_3, with
etsReferenceArea bigger than or equal to 0.1 ha, compared
to the total number of Reference Parcels from the
DQ_Scope.
NOTE 1: Area based non-conforming reference parcels are
those parcels, allowing undue payment on ineligible land or
excluding agricultural land, above the given threshold, as
well as those “contaminated” with ineligible features.
3.8 Value Type (valueType) 2 – Number
3.9 Value Structure
(valueStructure) “Number” out of “number”
3.10 Source Reference
(sourceReference)
Citation (the citation of the documentation of the measure
– Annex II, explanation of the Activity Diagram).
3.11 Example (example) 108 out 1250
4 Data quality evaluation
ANNEX I: LPIS quality measures, version 6.2 (July 2017)
39
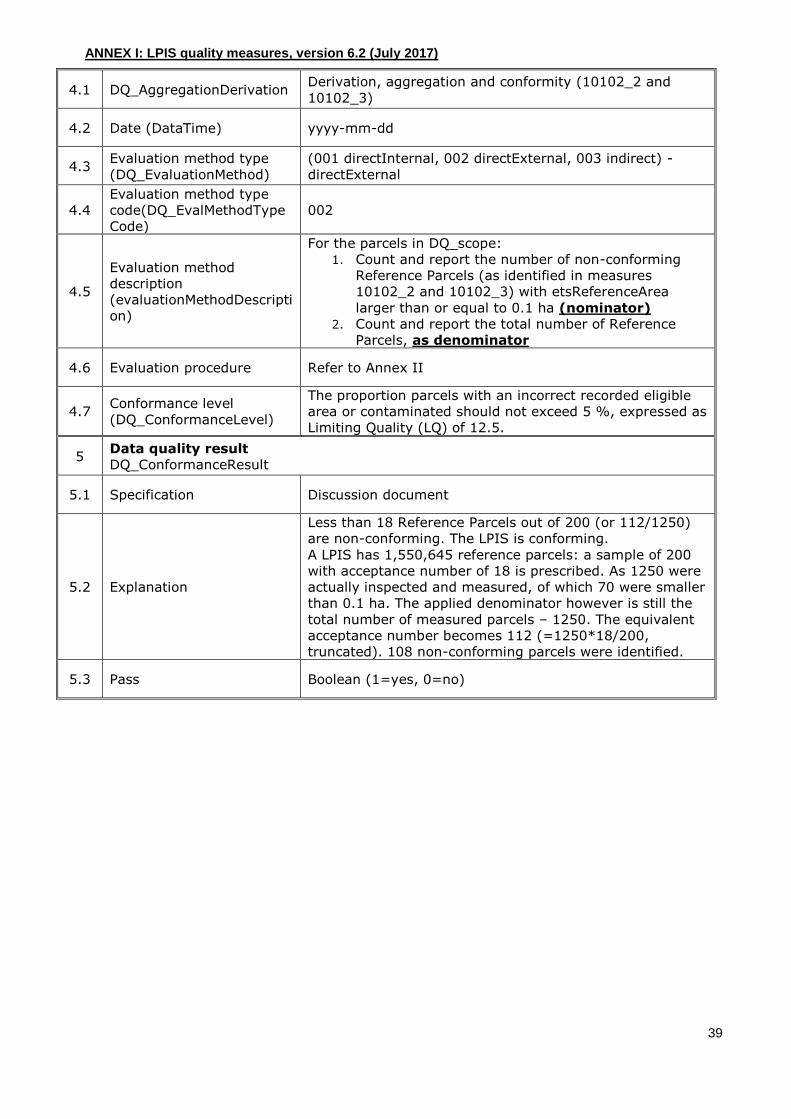
4.1 DQ_AggregationDerivation Derivation, aggregation and conformity (10102_2 and
10102_3)
4.2 Date (DataTime) yyyy-mm-dd
4.3 Evaluation method type
(DQ_EvaluationMethod)
(001 directInternal, 002 directExternal, 003 indirect) -
directExternal
4.4
Evaluation method type
code(DQ_EvalMethodType
Code)
002
4.5
Evaluation method
description
(evaluationMethodDescripti
on)
For the parcels in DQ_scope:
1. Count and report the number of non-conforming
Reference Parcels (as identified in measures
10102_2 and 10102_3) with etsReferenceArea
larger than or equal to 0.1 ha (nominator)
2. Count and report the total number of Reference
Parcels, as denominator
4.6 Evaluation procedure Refer to Annex II
4.7 Conformance level
(DQ_ConformanceLevel)
The proportion parcels with an incorrect recorded eligible
area or contaminated should not exceed 5 %, expressed as
Limiting Quality (LQ) of 12.5.
5 Data quality result
DQ_ConformanceResult
5.1 Specification Discussion document
5.2 Explanation
Less than 18 Reference Parcels out of 200 (or 112/1250)
are non-conforming. The LPIS is conforming.
A LPIS has 1,550,645 reference parcels: a sample of 200
with acceptance number of 18 is prescribed. As 1250 were
actually inspected and measured, of which 70 were smaller
than 0.1 ha. The applied denominator however is still the
total number of measured parcels – 1250. The equivalent
acceptance number becomes 112 (=1250*18/200,
truncated). 108 non-conforming parcels were identified.
5.3 Pass Boolean (1=yes, 0=no)
ANNEX I: LPIS quality measures, version 6.2 (July 2017)
40
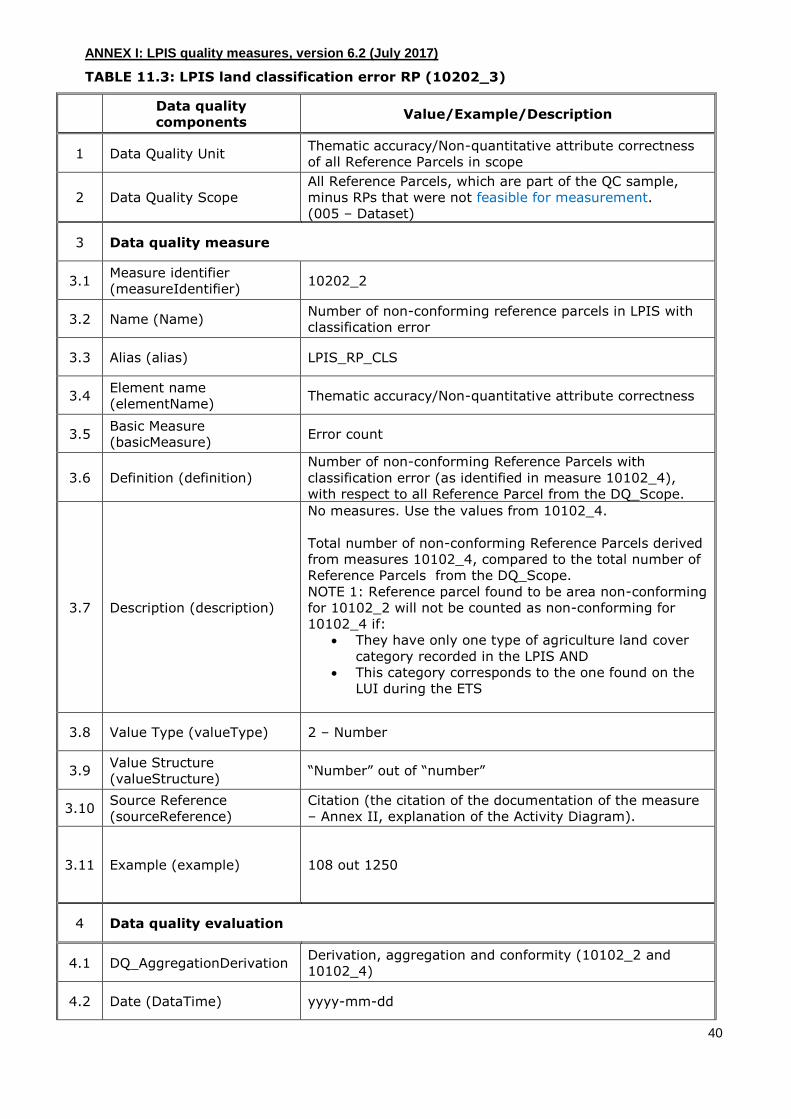
TABLE 11.3: LPIS land classification error RP (10202_3)
Data quality
components Value/Example/Description
1 Data Quality Unit Thematic accuracy/Non-quantitative attribute correctness
of all Reference Parcels in scope
2 Data Quality Scope
All Reference Parcels, which are part of the QC sample,
minus RPs that were not feasible for measurement.
(005 – Dataset)
3 Data quality measure
3.1 Measure identifier
(measureIdentifier) 10202_2
3.2 Name (Name) Number of non-conforming reference parcels in LPIS with
classification error
3.3 Alias (alias) LPIS_RP_CLS
3.4 Element name
(elementName) Thematic accuracy/Non-quantitative attribute correctness
3.5 Basic Measure
(basicMeasure) Error count
3.6 Definition (definition)
Number of non-conforming Reference Parcels with
classification error (as identified in measure 10102_4),
with respect to all Reference Parcel from the DQ_Scope.
3.7 Description (description)
No measures. Use the values from 10102_4.
Total number of non-conforming Reference Parcels derived
from measures 10102_4, compared to the total number of
Reference Parcels from the DQ_Scope.
NOTE 1: Reference parcel found to be area non-conforming
for 10102_2 will not be counted as non-conforming for
10102_4 if:
They have only one type of agriculture land cover
category recorded in the LPIS AND
This category corresponds to the one found on the
LUI during the ETS
3.8 Value Type (valueType) 2 – Number
3.9 Value Structure
(valueStructure) “Number” out of “number”
3.10 Source Reference
(sourceReference)
Citation (the citation of the documentation of the measure
– Annex II, explanation of the Activity Diagram).
3.11 Example (example) 108 out 1250
4 Data quality evaluation
4.1 DQ_AggregationDerivation Derivation, aggregation and conformity (10102_2 and
10102_4)
4.2 Date (DataTime) yyyy-mm-dd

ANNEX I: LPIS quality measures, version 6.2 (July 2017)
41
4.3 Evaluation method type
(DQ_EvaluationMethod)
(001 directInternal, 002 directExternal, 003 indirect) -
directExternal
4.4
Evaluation method type
code(DQ_EvalMethodType
Code)
002
4.5
Evaluation method
description
(evaluationMethodDescripti
on)
For the parcels in DQ_scope:
3. Count and report the number of non-conforming
Reference Parcels (as identified in measure
10102_4) (nominator)
4. Count and report the total number of Reference
Parcels, as denominator
4.6 Evaluation procedure Refer to Annex II
4.7 Conformance level
(DQ_ConformanceLevel)
The proportion parcels with an incorrect recorded eligible
area should not exceed 5 %, expressed as Limiting Quality
(LQ) of 12.5.
5 Data quality result
DQ_ConformanceResult
5.1 Specification Discussion document
5.2 Explanation
More than 18 Reference Parcels out of 200 (or 112/1250)
are non-conforming with classification error. The LPIS fails
to be conforming.
A LPIS has 1,550,645 reference parcels: a sample of 200
with acceptance number of 18 is prescribed. As 1250 were
actually inspected and measured, the equivalent
acceptance number becomes 112 (=1250*18/200,
truncated). 178 non-conforming parcels were identified.
5.3 Pass Boolean (1=yes, 0=no)
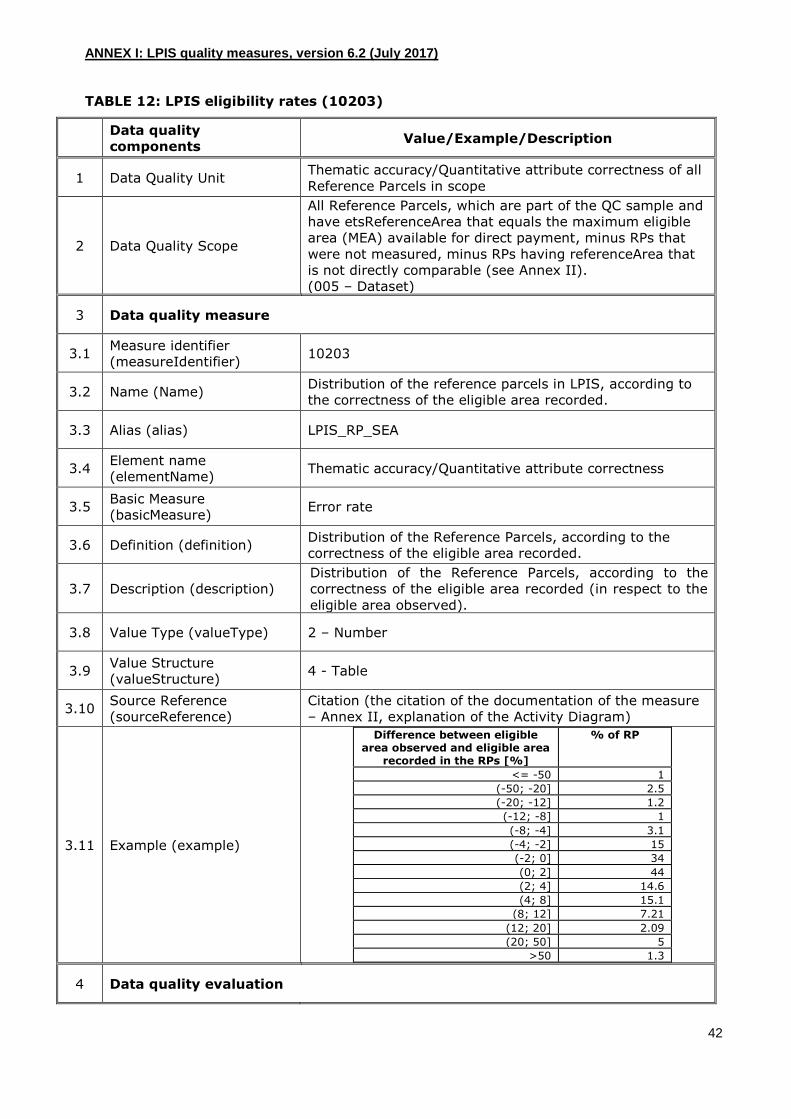
ANNEX I: LPIS quality measures, version 6.2 (July 2017)
42
TABLE 12: LPIS eligibility rates (10203)
Data quality
components Value/Example/Description
1 Data Quality Unit Thematic accuracy/Quantitative attribute correctness of all
Reference Parcels in scope
2 Data Quality Scope
All Reference Parcels, which are part of the QC sample and
have etsReferenceArea that equals the maximum eligible
area (MEA) available for direct payment, minus RPs that
were not measured, minus RPs having referenceArea that
is not directly comparable (see Annex II).
(005 – Dataset)
3 Data quality measure
3.1 Measure identifier
(measureIdentifier) 10203
3.2 Name (Name) Distribution of the reference parcels in LPIS, according to
the correctness of the eligible area recorded.
3.3 Alias (alias) LPIS_RP_SEA
3.4 Element name
(elementName) Thematic accuracy/Quantitative attribute correctness
3.5 Basic Measure
(basicMeasure) Error rate
3.6 Definition (definition) Distribution of the Reference Parcels, according to the
correctness of the eligible area recorded.
3.7 Description (description)
Distribution of the Reference Parcels, according to the
correctness of the eligible area recorded (in respect to the
eligible area observed).
3.8 Value Type (valueType) 2 – Number
3.9 Value Structure
(valueStructure) 4 - Table
3.10 Source Reference
(sourceReference)
Citation (the citation of the documentation of the measure
– Annex II, explanation of the Activity Diagram)
3.11 Example (example)
Difference between eligible area observed and eligible area
recorded in the RPs [%]
% of RP
<= -50 1
(-50; -20] 2.5
(-20; -12] 1.2
(-12; -8] 1
(-8; -4] 3.1
(-4; -2] 15
(-2; 0] 34
(0; 2] 44
(2; 4] 14.6
(4; 8] 15.1
(8; 12] 7.21
(12; 20] 2.09
(20; 50] 5
>50 1.3
4 Data quality evaluation
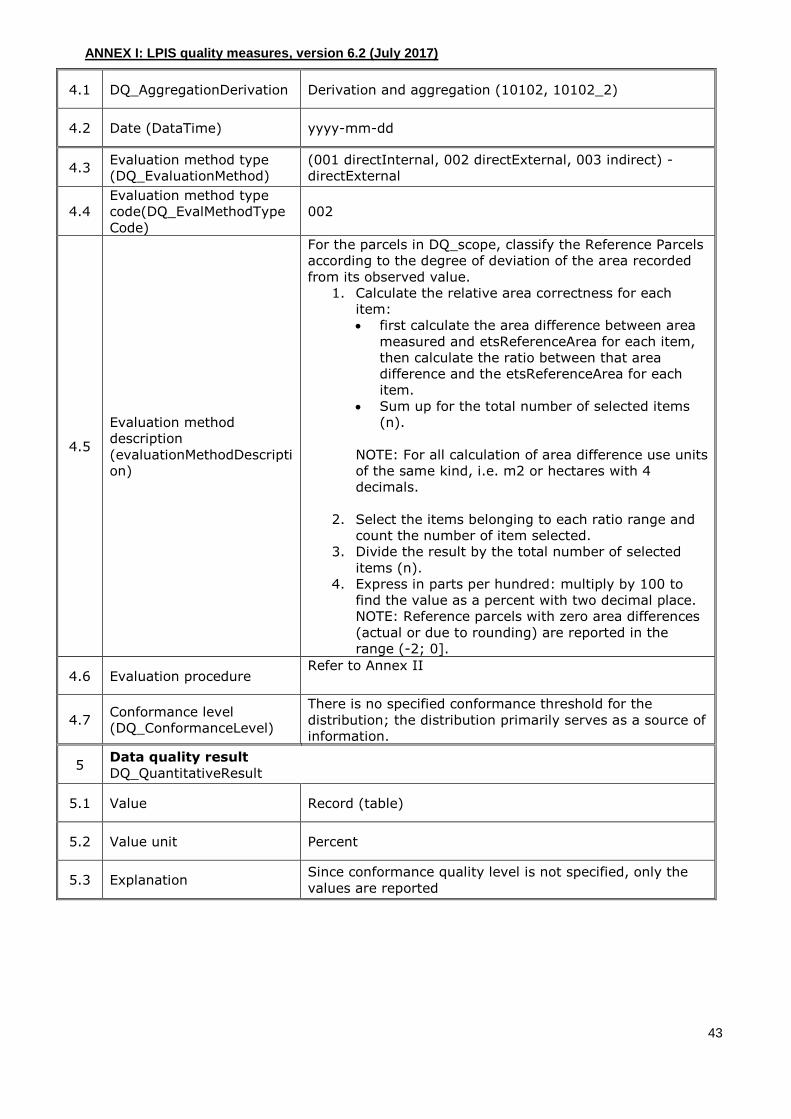
ANNEX I: LPIS quality measures, version 6.2 (July 2017)
43
4.1 DQ_AggregationDerivation Derivation and aggregation (10102, 10102_2)
4.2 Date (DataTime) yyyy-mm-dd
4.3 Evaluation method type
(DQ_EvaluationMethod)
(001 directInternal, 002 directExternal, 003 indirect) -
directExternal
4.4
Evaluation method type
code(DQ_EvalMethodType
Code)
002
4.5
Evaluation method
description
(evaluationMethodDescripti
on)
For the parcels in DQ_scope, classify the Reference Parcels
according to the degree of deviation of the area recorded
from its observed value.
1. Calculate the relative area correctness for each
item:
first calculate the area difference between area
measured and etsReferenceArea for each item,
then calculate the ratio between that area
difference and the etsReferenceArea for each
item.
Sum up for the total number of selected items
(n).
NOTE: For all calculation of area difference use units
of the same kind, i.e. m2 or hectares with 4
decimals.
2. Select the items belonging to each ratio range and
count the number of item selected.
3. Divide the result by the total number of selected
items (n).
4. Express in parts per hundred: multiply by 100 to
find the value as a percent with two decimal place.
NOTE: Reference parcels with zero area differences
(actual or due to rounding) are reported in the
range (-2; 0].
4.6 Evaluation procedure Refer to Annex II
4.7 Conformance level
(DQ_ConformanceLevel)
There is no specified conformance threshold for the
distribution; the distribution primarily serves as a source of
information.
5 Data quality result
DQ_QuantitativeResult
5.1 Value Record (table)
5.2 Value unit Percent
5.3 Explanation Since conformance quality level is not specified, only the
values are reported
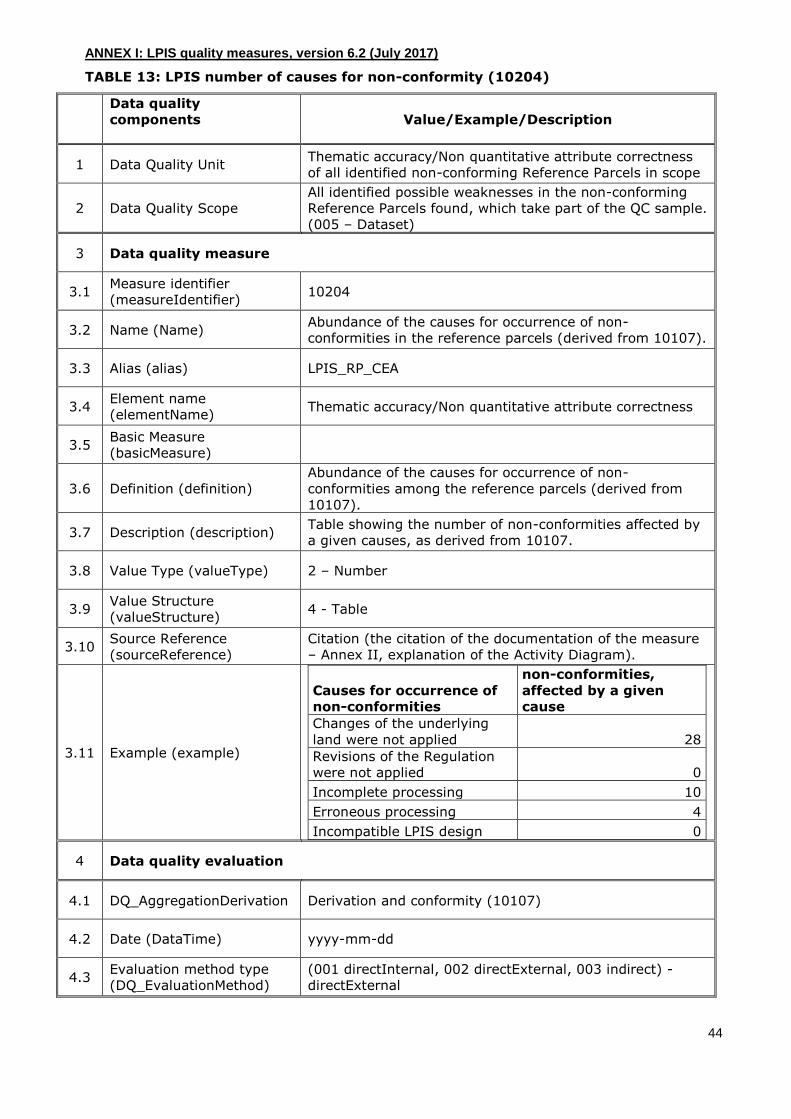
ANNEX I: LPIS quality measures, version 6.2 (July 2017)
44
TABLE 13: LPIS number of causes for non-conformity (10204)
Data quality
components
Value/Example/Description
1 Data Quality Unit Thematic accuracy/Non quantitative attribute correctness
of all identified non-conforming Reference Parcels in scope
2 Data Quality Scope
All identified possible weaknesses in the non-conforming
Reference Parcels found, which take part of the QC sample.
(005 – Dataset)
3 Data quality measure
3.1 Measure identifier
(measureIdentifier) 10204
3.2 Name (Name) Abundance of the causes for occurrence of non-
conformities in the reference parcels (derived from 10107).
3.3 Alias (alias) LPIS_RP_CEA
3.4 Element name
(elementName) Thematic accuracy/Non quantitative attribute correctness
3.5 Basic Measure
(basicMeasure)
3.6 Definition (definition)
Abundance of the causes for occurrence of non-
conformities among the reference parcels (derived from
10107).
3.7 Description (description) Table showing the number of non-conformities affected by
a given causes, as derived from 10107.
3.8 Value Type (valueType) 2 – Number
3.9 Value Structure
(valueStructure) 4 - Table
3.10 Source Reference
(sourceReference)
Citation (the citation of the documentation of the measure
– Annex II, explanation of the Activity Diagram).
3.11 Example (example)
Causes for occurrence of
non-conformities
non-conformities,
affected by a given
cause
Changes of the underlying
land were not applied 28
Revisions of the Regulation
were not applied 0
Incomplete processing 10
Erroneous processing 4
Incompatible LPIS design 0
4 Data quality evaluation
4.1 DQ_AggregationDerivation Derivation and conformity (10107)
4.2 Date (DataTime) yyyy-mm-dd
4.3 Evaluation method type
(DQ_EvaluationMethod)
(001 directInternal, 002 directExternal, 003 indirect) -
directExternal
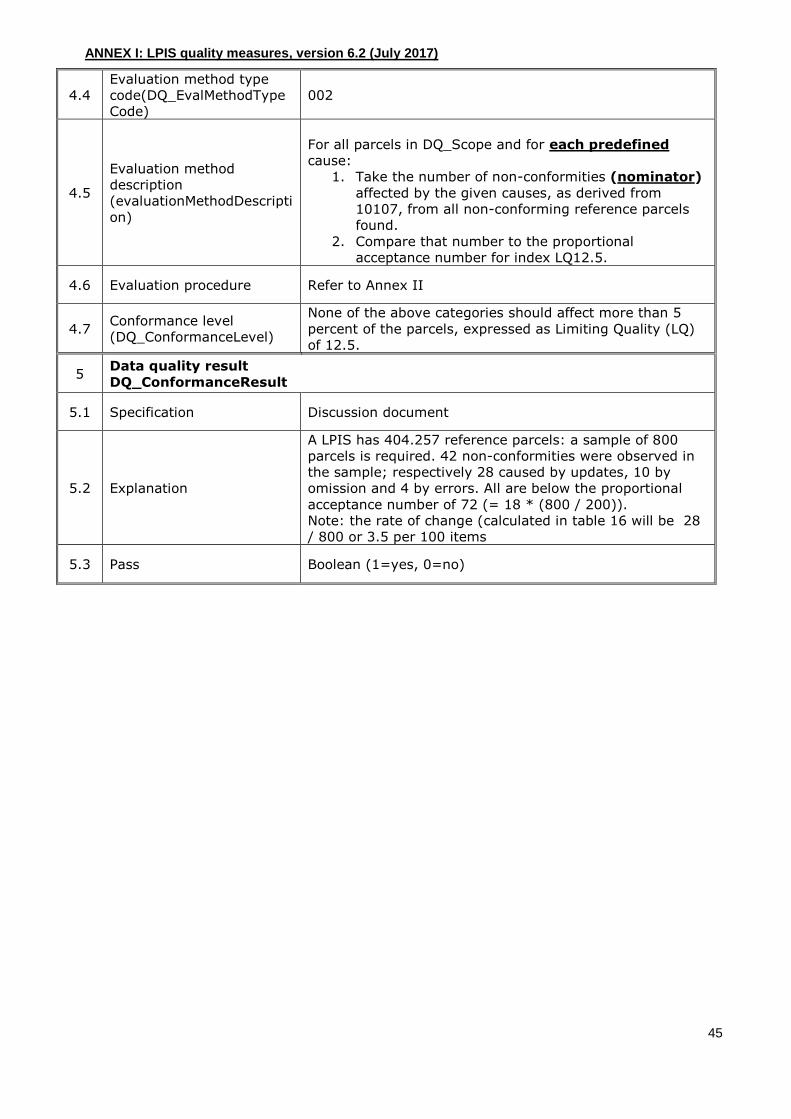
ANNEX I: LPIS quality measures, version 6.2 (July 2017)
45
4.4
Evaluation method type
code(DQ_EvalMethodType
Code)
002
4.5
Evaluation method
description
(evaluationMethodDescripti
on)
For all parcels in DQ_Scope and for each predefined
cause:
1. Take the number of non-conformities (nominator)
affected by the given causes, as derived from
10107, from all non-conforming reference parcels
found.
2. Compare that number to the proportional
acceptance number for index LQ12.5.
4.6 Evaluation procedure Refer to Annex II
4.7 Conformance level
(DQ_ConformanceLevel)
None of the above categories should affect more than 5
percent of the parcels, expressed as Limiting Quality (LQ)
of 12.5.
5 Data quality result
DQ_ConformanceResult
5.1 Specification Discussion document
5.2 Explanation
A LPIS has 404.257 reference parcels: a sample of 800
parcels is required. 42 non-conformities were observed in
the sample; respectively 28 caused by updates, 10 by
omission and 4 by errors. All are below the proportional
acceptance number of 72 (= 18 * (800 / 200)).
Note: the rate of change (calculated in table 16 will be 28
/ 800 or 3.5 per 100 items
5.3 Pass Boolean (1=yes, 0=no)

ANNEX I: LPIS quality measures, version 6.2 (July 2017)
46
TABLE 14: LPIS critical defects (10205)
Data quality
components Value/Example/Description
1 Data Quality Unit Completeness/Commission of all Reference parcels in
scope
2 Data Quality Scope All Reference Parcels, which are part of the QC sample
(005 – Dataset)
3 Data quality measure
3.1 Measure identifier
(measureIdentifier) 10205
3.2 Name (Name) LPIS critical defects
3.3 Alias (alias) LPIS_RP_CRA
3.4 Element name
(elementName) Completeness/Commission
3.5 Basic Measure
(basicMeasure) Number of commissions
3.6 Definition (definition) Total number of Reference Parcels that have critical
defects.
3.7 Description (description) Abundance of Reference Parcels with critical defects
(number of commissions).
3.8 Value Type (valueType) 2 – Number
3.9 Value Structure
(valueStructure) “Number” out of “number”
3.10 Source Reference
(sourceReference)
Citation (the citation of the documentation of the measure
– Annex II, explanation of the Activity Diagram).
3.11 Example (example) 1 out of 800
4 Data quality evaluation
4.1 DQ_AggregationDerivation Derivation and conformity (10106)
4.2 Date (DataTime) yyyy-mm-dd
4.3 Evaluation method type
(DQ_EvaluationMethod)
(001 directInternal, 002 directExternal, 003 indirect) -
directExternal
4.4
Evaluation method type
code
DQ_EvalMethodTypeCode
002
4.5
Evaluation method
description
evaluationMethodDescripti
on
For the parcels in DQ_scope,
1. Count and report the number of Reference Parcels
having critical defects (nominator), as derived
from measure 10106.
2. Report the total number of reference Parcels as
denominator

ANNEX I: LPIS quality measures, version 6.2 (July 2017)
47
4.6 Evaluation procedure Refer to Annex II
4.7 Conformance level
(DQ_ConformanceLevel)
Critical defects should not affect more than 1 percent of
the parcels, expressed as Limiting Quality (LQ) of 2.
5 Data quality result
DQ_ConformanceResult
5.1 Specification Discussion document
5.2 Explanation
An LPIS has 469,421 reference parcels: a sample of 800
parcels with acceptance number of 10 is prescribed. During
inspection 1 non-conforming parcel is found.
Less than 10 reference parcels out of 800 have critical
defects. The LPIS is conforming.
5.3 Pass Boolean (1=yes, 0=no)
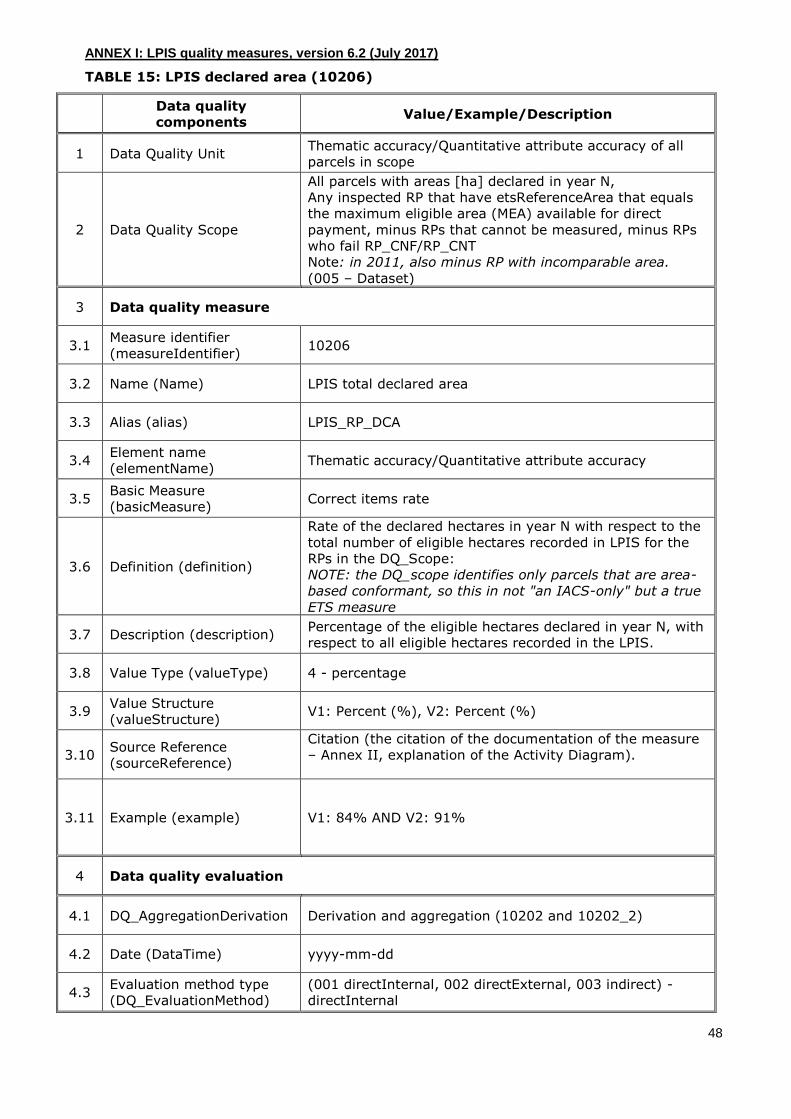
ANNEX I: LPIS quality measures, version 6.2 (July 2017)
48
TABLE 15: LPIS declared area (10206)
Data quality
components Value/Example/Description
1 Data Quality Unit Thematic accuracy/Quantitative attribute accuracy of all
parcels in scope
2 Data Quality Scope
All parcels with areas [ha] declared in year N,
Any inspected RP that have etsReferenceArea that equals
the maximum eligible area (MEA) available for direct
payment, minus RPs that cannot be measured, minus RPs
who fail RP_CNF/RP_CNT
Note: in 2011, also minus RP with incomparable area.
(005 – Dataset)
3 Data quality measure
3.1 Measure identifier
(measureIdentifier) 10206
3.2 Name (Name) LPIS total declared area
3.3 Alias (alias) LPIS_RP_DCA
3.4 Element name
(elementName) Thematic accuracy/Quantitative attribute accuracy
3.5 Basic Measure
(basicMeasure) Correct items rate
3.6 Definition (definition)
Rate of the declared hectares in year N with respect to the
total number of eligible hectares recorded in LPIS for the
RPs in the DQ_Scope:
NOTE: the DQ_scope identifies only parcels that are area-
based conformant, so this in not "an IACS-only" but a true
ETS measure
3.7 Description (description) Percentage of the eligible hectares declared in year N, with
respect to all eligible hectares recorded in the LPIS.
3.8 Value Type (valueType) 4 - percentage
3.9 Value Structure
(valueStructure) V1: Percent (%), V2: Percent (%)
3.10 Source Reference
(sourceReference)
Citation (the citation of the documentation of the measure
– Annex II, explanation of the Activity Diagram).
3.11 Example (example) V1: 84% AND V2: 91%
4 Data quality evaluation
4.1 DQ_AggregationDerivation Derivation and aggregation (10202 and 10202_2)
4.2 Date (DataTime) yyyy-mm-dd
4.3 Evaluation method type
(DQ_EvaluationMethod)
(001 directInternal, 002 directExternal, 003 indirect) -
directInternal
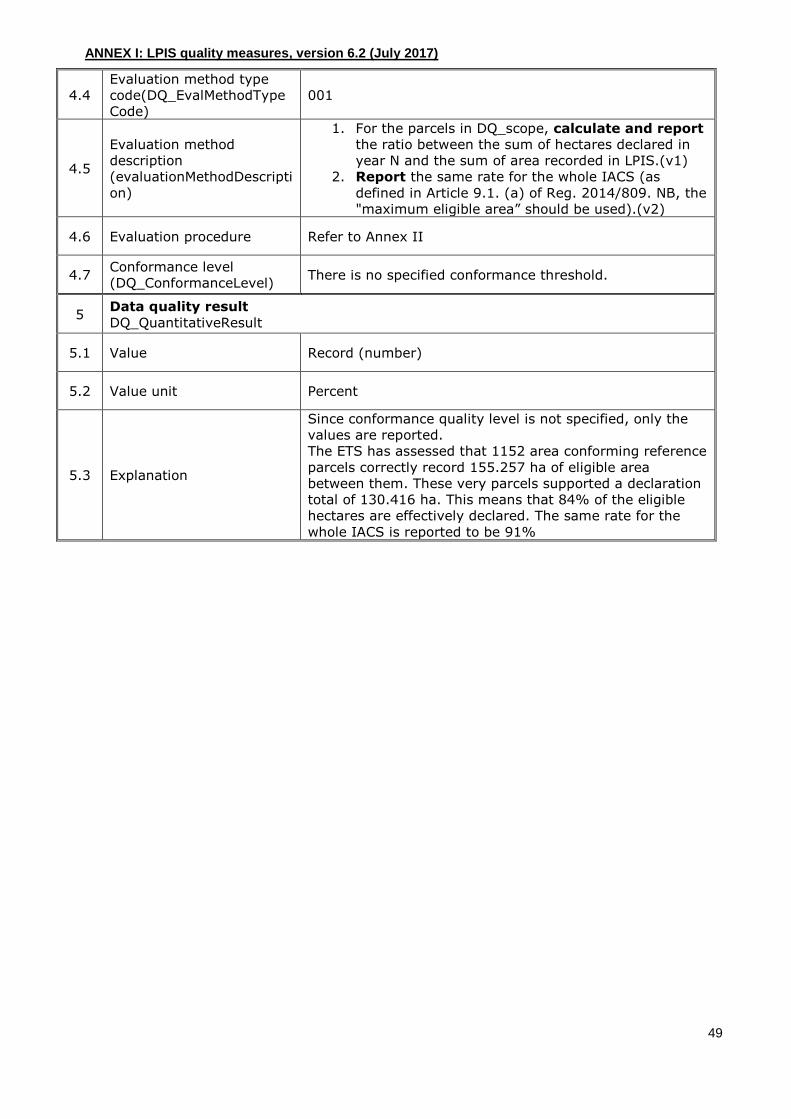
ANNEX I: LPIS quality measures, version 6.2 (July 2017)
49
4.4
Evaluation method type
code(DQ_EvalMethodType
Code)
001
4.5
Evaluation method
description
(evaluationMethodDescripti
on)
1. For the parcels in DQ_scope, calculate and report
the ratio between the sum of hectares declared in
year N and the sum of area recorded in LPIS.(v1)
2. Report the same rate for the whole IACS (as
defined in Article 9.1. (a) of Reg. 2014/809. NB, the
"maximum eligible area” should be used).(v2)
4.6 Evaluation procedure Refer to Annex II
4.7 Conformance level
(DQ_ConformanceLevel) There is no specified conformance threshold.
5 Data quality result
DQ_QuantitativeResult
5.1 Value Record (number)
5.2 Value unit Percent
5.3 Explanation
Since conformance quality level is not specified, only the
values are reported.
The ETS has assessed that 1152 area conforming reference
parcels correctly record 155.257 ha of eligible area
between them. These very parcels supported a declaration
total of 130.416 ha. This means that 84% of the eligible
hectares are effectively declared. The same rate for the
whole IACS is reported to be 91%
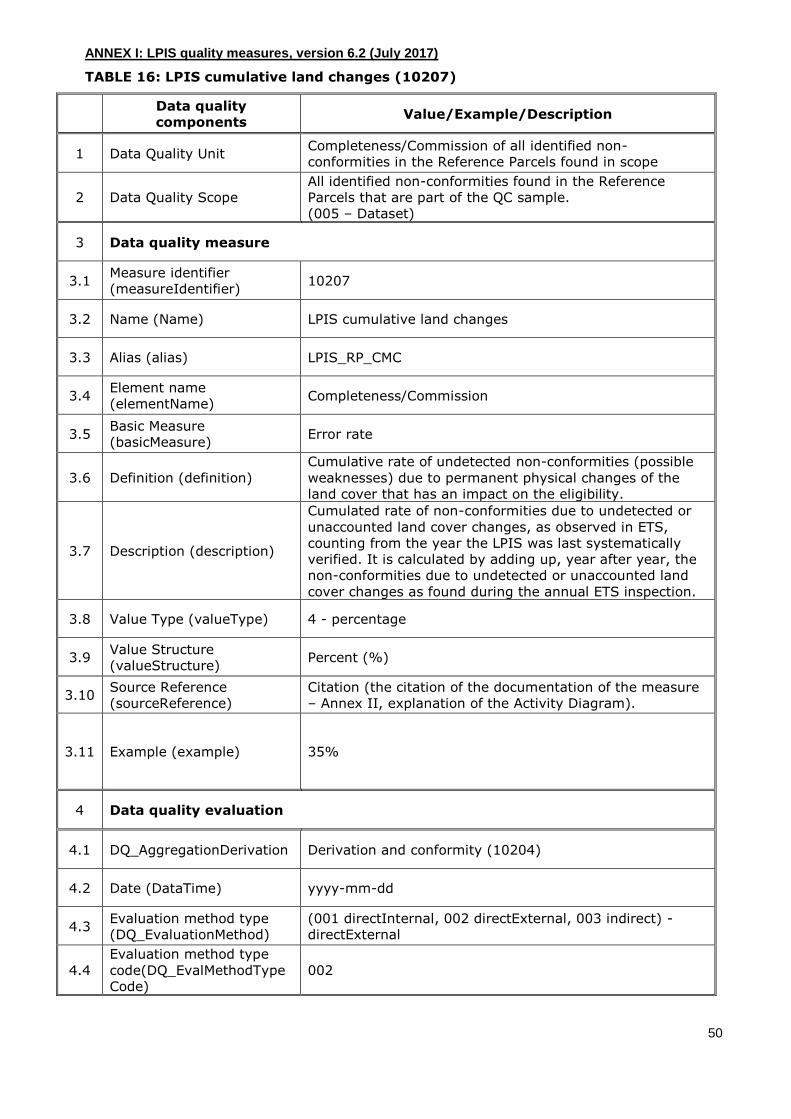
ANNEX I: LPIS quality measures, version 6.2 (July 2017)
50
TABLE 16: LPIS cumulative land changes (10207)
Data quality
components Value/Example/Description
1 Data Quality Unit Completeness/Commission of all identified non-
conformities in the Reference Parcels found in scope
2 Data Quality Scope
All identified non-conformities found in the Reference
Parcels that are part of the QC sample.
(005 – Dataset)
3 Data quality measure
3.1 Measure identifier
(measureIdentifier) 10207
3.2 Name (Name) LPIS cumulative land changes
3.3 Alias (alias) LPIS_RP_CMC
3.4 Element name
(elementName) Completeness/Commission
3.5 Basic Measure
(basicMeasure) Error rate
3.6 Definition (definition)
Cumulative rate of undetected non-conformities (possible
weaknesses) due to permanent physical changes of the
land cover that has an impact on the eligibility.
3.7 Description (description)
Cumulated rate of non-conformities due to undetected or
unaccounted land cover changes, as observed in ETS,
counting from the year the LPIS was last systematically
verified. It is calculated by adding up, year after year, the
non-conformities due to undetected or unaccounted land
cover changes as found during the annual ETS inspection.
3.8 Value Type (valueType) 4 - percentage
3.9 Value Structure
(valueStructure) Percent (%)
3.10 Source Reference
(sourceReference)
Citation (the citation of the documentation of the measure
– Annex II, explanation of the Activity Diagram).
3.11 Example (example) 35%
4 Data quality evaluation
4.1 DQ_AggregationDerivation Derivation and conformity (10204)
4.2 Date (DataTime) yyyy-mm-dd
4.3 Evaluation method type
(DQ_EvaluationMethod)
(001 directInternal, 002 directExternal, 003 indirect) -
directExternal
4.4
Evaluation method type
code(DQ_EvalMethodType
Code)
002

ANNEX I: LPIS quality measures, version 6.2 (July 2017)
51
4.5
Evaluation method
description
(evaluationMethodDescripti
on)
1. Report the number of non-conformities assigned
with the cause “Changes of the underlying land
were not applied”, as defined in 10204 per LPIS
control zone.
2. Determine the annual rate (in percentage) of these
non-conformities per zone by dividing by the total
number of inspected reference parcels, which are
part of the LPIS QA sample of any given zone and
by the number of years since the last systematic
update of that zone (exceptionally, use value 1 as
“number of years” if the update of the zone/subzone
was in the current year).
3. Average the overall annual change rate over all
LPIS control zones
4. Add to the cumulated rate from all previous years,
starting from the year of the last systematic update
of the LPIS.
5. Report the cumulative rate
NOTE: If parts (subzones) of a given LPIS control zone
were systematically updated in different years, then
step 2 is changed in the following way:
a. Determine the annual rate (in percentage) of
the non-conformities per subzone by dividing
by the total number of inspected reference
parcels, which are part of the LPIS QA sample
of any given subzone and by the number of
years since the last systematic update of that
subzone(exceptionally, use value 1 as
“number of years” if the update of the
zone/subzone was in the current year).
b. Average the overall annual change rate over
all subzones, belonging to the LPIS control
zone
4.6 Evaluation procedure Refer to Annex II
4.7 Conformance level
(DQ_ConformanceLevel)
The cumulative rate of non-conformities due to undetected
or unaccounted land cover changes shall not exceed 25
percent, counting from the year the parcels were last
systematically verified.
5 Data quality result
DQ_ConformanceResult
5.1 Specification Discussion document
5.2 Explanation
The cumulative rate of non-conformities due to undetected
or unaccounted land cover changes is more than 25% as
from 2012. LPIS fails to be conforming.
2010: 12% - cumulated: 12%
2011: 12% - cumulated: 24%
2012 : 11% - cumulated: 35%
The cumulative rate of parcels affected by land change is
35 %.
5.3 Pass Boolean (1=yes, 0=no)
ANNEX I: LPIS quality measures, version 6.2 (July 2017)
52
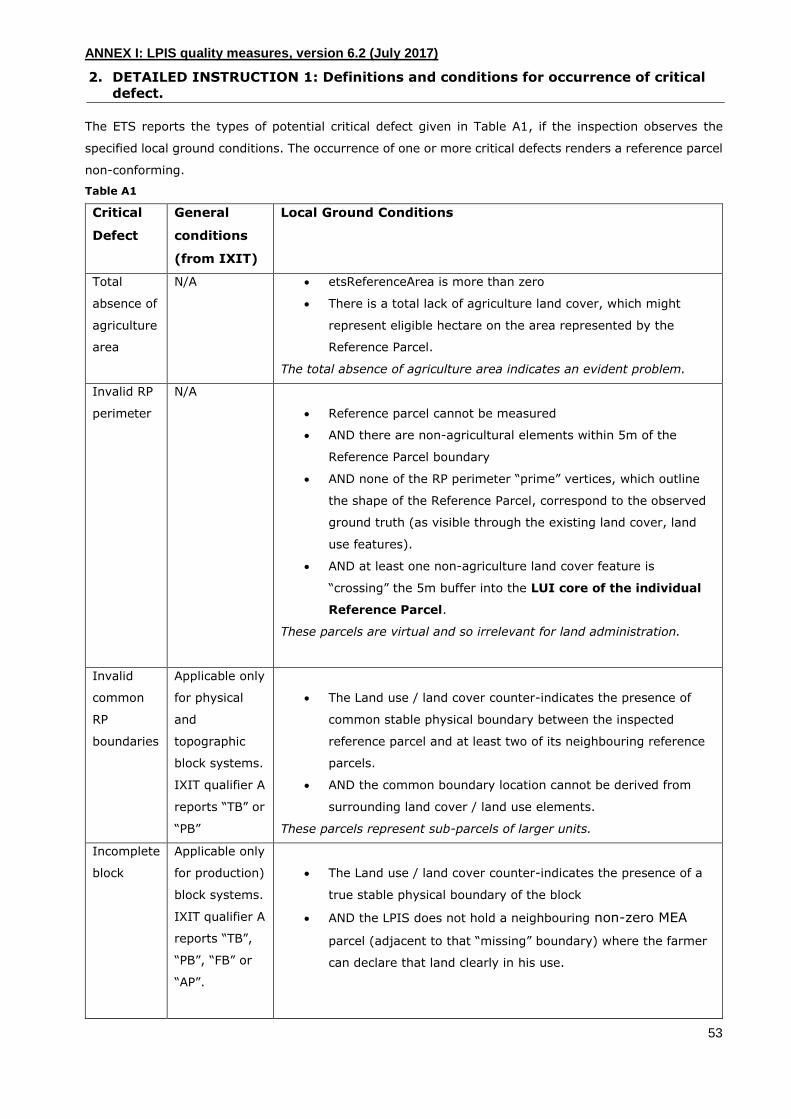
ANNEX I: LPIS quality measures, version 6.2 (July 2017)
53
2. DETAILED INSTRUCTION 1: Definitions and conditions for occurrence of critical
defect.
The ETS reports the types of potential critical defect given in Table A1, if the inspection observes the
specified local ground conditions. The occurrence of one or more critical defects renders a reference parcel
non-conforming.
Table A1
Critical
Defect
General
conditions
(from IXIT)
Local Ground Conditions
Total
absence of
agriculture
area
N/A etsReferenceArea is more than zero
There is a total lack of agriculture land cover, which might
represent eligible hectare on the area represented by the
Reference Parcel.
The total absence of agriculture area indicates an evident problem.
Invalid RP
perimeter
N/A
Reference parcel cannot be measured
AND there are non-agricultural elements within 5m of the
Reference Parcel boundary
AND none of the RP perimeter “prime” vertices, which outline
the shape of the Reference Parcel, correspond to the observed
ground truth (as visible through the existing land cover, land
use features).
AND at least one non-agriculture land cover feature is
“crossing” the 5m buffer into the LUI core of the individual
Reference Parcel.
These parcels are virtual and so irrelevant for land administration.
Invalid
common
RP
boundaries
Applicable only
for physical
and
topographic
block systems.
IXIT qualifier A
reports “TB” or
“PB”
The Land use / land cover counter-indicates the presence of
common stable physical boundary between the inspected
reference parcel and at least two of its neighbouring reference
parcels.
AND the common boundary location cannot be derived from
surrounding land cover / land use elements.
These parcels represent sub-parcels of larger units.
Incomplete
block
Applicable only
for production)
block systems.
IXIT qualifier A
reports “TB”,
“PB”, “FB” or
“AP”.
The Land use / land cover counter-indicates the presence of a
true stable physical boundary of the block
AND the LPIS does not hold a neighbouring non-zero MEA
parcel (adjacent to that “missing” boundary) where the farmer
can declare that land clearly in his use.
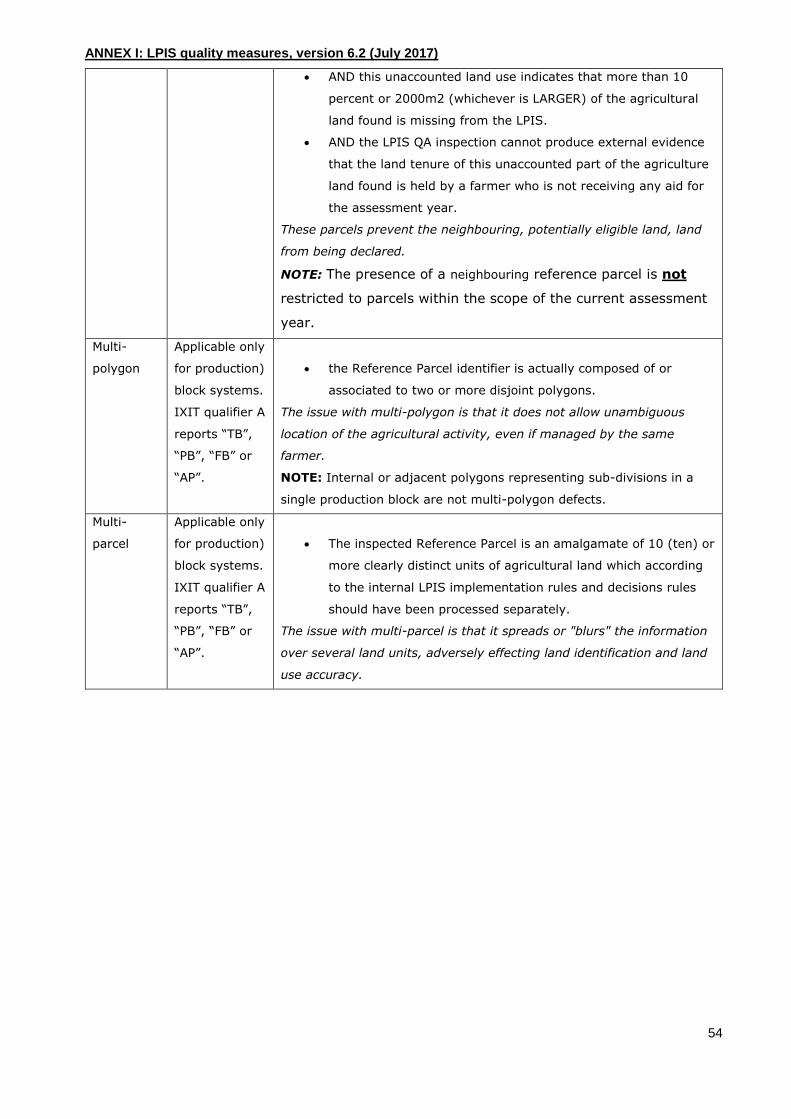
ANNEX I: LPIS quality measures, version 6.2 (July 2017)
54
AND this unaccounted land use indicates that more than 10
percent or 2000m2 (whichever is LARGER) of the agricultural
land found is missing from the LPIS.
AND the LPIS QA inspection cannot produce external evidence
that the land tenure of this unaccounted part of the agriculture
land found is held by a farmer who is not receiving any aid for
the assessment year.
These parcels prevent the neighbouring, potentially eligible land, land
from being declared.
NOTE: The presence of a neighbouring reference parcel is not
restricted to parcels within the scope of the current assessment
year.
Multi-
polygon
Applicable only
for production)
block systems.
IXIT qualifier A
reports “TB”,
“PB”, “FB” or
“AP”.
the Reference Parcel identifier is actually composed of or
associated to two or more disjoint polygons.
The issue with multi-polygon is that it does not allow unambiguous
location of the agricultural activity, even if managed by the same
farmer.
NOTE: Internal or adjacent polygons representing sub-divisions in a
single production block are not multi-polygon defects.
Multi-
parcel
Applicable only
for production)
block systems.
IXIT qualifier A
reports “TB”,
“PB”, “FB” or
“AP”.
The inspected Reference Parcel is an amalgamate of 10 (ten) or
more clearly distinct units of agricultural land which according
to the internal LPIS implementation rules and decisions rules
should have been processed separately.
The issue with multi-parcel is that it spreads or "blurs" the information
over several land units, adversely effecting land identification and land
use accuracy.

ANNEX I: LPIS quality measures, version 6.2 (July 2017)
55
3. DETAILED INSTRUCTION 2: Application of waivers, which can vindicate a
reference parcel contaminated by ineligible features.
The Commission issues the following waivers and Member States may choose to activate it to
vindicate an observed contamination of the Reference Parcel by one or more ineligible features.
The waiver is RPtype independent; all RPtypes can apply the waiver, if all waiver
conditions are met.
General conditions are assessed at LPIS level during the time of MTS and indicated
in the IXIT.
Local conditions are assessed during ETS of the parcel with an observed
contamination. The fulfilment of the conditions can be screened.
As a result, for these instructions one must interpret:
o “Verify that”: verification of conditions to be done once at the LPIS level (MTS)
o “Check that”: checking of conditions to be done at the parcel level (during ETS
inspection)
Waiver C essentially requires documentation indicating that the contamination inside
the Reference Parcel was known and dealt with appropriately.
Table A2
Waiver
General condition Local conditions to be verified
during ETS inspection
C Verify that a separate GIS layer
represents (in)eligible land cover.
A presence of such separate GIS
layer can be expected in the
following cases:
1. The IXIT qualifier D reports
any of values of q13.
2. Module M11 reports the
presence of
checkAgricultureLandGeometry
(test case 1421)
Verify, if the contamination is fully
located within the separate GIS layer
for non-eligible areas, or if it is fully
located outside the separate GIS layer
for eligible areas.
ANNEX I: LPIS quality measures, version 6.2 (July 2017)
56
4. Detailed Instruction 3: Categorization of the non-conforming reference parcels
In order to decide, if a particular cause can explain the observed non-conformity, the operator should
perform a minimum set of actions, specific for each cause. An indicative and non-exhaustive list of MTS-
related actions is given below (for each cause separately). Start with the first listed cause. If the cause is
not applicable, proceed with the next one from the cascade list. Stop when the correct cause is determined:
1. Changes of the underlying land were not applied
Check the date of validity of the reference parcel (by consulting the Module M11, test
cases “checkReferenceParcelValidFrom” and checkReferenceParcelValidTo” of the MTS)
Check the results from qualifier B of the IXIT
Check any archive reference data (orthoimagery, topomaps, cadastral plans,..)
Consult the vector and orthoimagery system metadata as part of the MTS-log
Typical examples are a newly constructed road or building that is still being considered agricultural
land or a recent conversion into agricultural land that has not been taken into account.
2. Revisions of the Regulations were not applied
Check the rules on eligibility applied for the given LPIS lot (by consulting the eligibility
profile) and the results from Module M11 “Group of tests related to the BPS/SAPS layer
feature types" of the MTS
Typical examples are an underestimate of the maximum eligible area because the abolishment of
separate schemes (olives, vineyards, decouplement,...) or a creation of new schemes (greening,
VCS, permanent grassland subject to ELP) have not been introduced in LPIS.
3. Incomplete processing
Check the availability of separate datasets or layers, which store agriculture land cover
types, or small exclusions or landscape features (by consulting Modules M11/M12 of MTS)
Check the results from qualifiers B, C and D of the IXIT
Check archive reference data (orthoimagery, topomaps, cadastral plans,..)
Typical examples are that a separate sub-parcel or eligibility layer, although foreseen in the LPIS
design, has not been produced for the full LUI or that a validation procedure, although required by
the LPIS creation specifications, has not been performed (a particular example is where a military
mask prevented photo interpretation in the past and the parcel was "cut off" at the mask).
4. Erroneous processing
Check the validity date of the reference parcel (by consulting the Module M11, test cases
“checkReferenceParcelValidFrom” and checkReferenceParcelValidTo” of the MTS)
Check archive reference data (orthoimagery, topomaps, cadastral plans,..)
Typical examples are that the operator has used inappropriate (e.g. outdated) source material or
there has been a manifest deviation from the documented instructions.
5. Incompatible LPIS design
Check the definition of the Reference Parcel (by consulting results from qualifier A of IXIT)
Consult historical data
This is the situation that has not been foreseen in the specifications and cannot be explained
by any of the above causes.
Typical example could be a reference parcel of AP type, detected during the ETS as being a multi-
polygon.

ANNEX I: LPIS quality measures, version 6.2 (July 2017)
57
5. DETAILED INSTRUCTION 4: Application of waiver “E”, which can vindicate a
classification error found on the reference parcel
The Commission issues the following waiver and Member States may choose to activate it to
vindicate an observed non-conformity on the Reference Parcel (Item of inspection) related to
the classification of the agriculture land cover categories (AL, PG, PC).
The waiver is RPtype independent; all RPtypes can apply the waiver, if all waiver local
conditions are met.
Local conditions are assessed and checked for each individual polygon classified as
HV during the ETS of the item with an observed classification error. The fulfilment of
the conditions can be screened.
Waiver E essentially requires documented evidence for the occurrence of arable land
(AL) within that HV polygon over the last 5 years preceding the ETS assessment.
Historic imagery, farmer’s declarations and third party evidence are the acceptable
sources of evidence.
Provide the evidence for the use of waiver E as PDF document, as part of the ETS
reporting package. Point out to the relevant ID of the reference parcel.
Table A3
Waiver
Local conditions to be verified
during ETS inspection
E There is sufficient evidence that:
in the last 5 years preceding
the ETS assessment part of the
HV polygon was arable land
(either physically or as part of
AECM commitment)
the area occupied by this arable
land would be delineated
separately in the ETS if it was
visible on the current
orthoimage used in the ETS