annex 1: questionnaire for collecting … 11, 2011 · annex 1 — questionnaire for collecting...
TRANSCRIPT

ANNEX 1 — QUESTIONNAIRE FOR COLLECTING AGRICULTURAL INFORMATION 59
AGRICULTURE AND RURAL DEVELOPMENT DISCUSSION PAPER
Annex 1: QUESTIONNAIRE FOR COLLECTINGAGRICULTURAL INFORMATION
GENERAL INFORMATION
Date:
Location:
Country:
Crop:
Type of coverage:
Other information:
PRODUCTION
1. What variety of maize is the most common in the area?
2. What is the average farm size for maize farmers?
3. What is the typical planting period for maize (month/week)?
4. What is the earliest date that maize can be planted?
5. What is the last date when maize can be success-fully planted (month/week)?
6. Can you provide more details on the crop calendar of maize, highlighting the main plant growth phases?
7. Is maize production in this area rain-fed or irrigated? (If both, indicate relative proportion.)
8. What is the average cost of production in the area (in total costs of inputs per hectare or other area unit—if
PHYSIOLOGICAL OR PHENOLOGICAL PHASES
WRSI PHASES
PERIOD (APPROX. DATE OF PHASE BEGINNING)
LENGTH OF PERIOD (DAYS)
Germination Planting and establishmentLeaf development
Stem elongation Vegetative
Inflorescence emerging, heading FloweringFlowering, anthesis
Development of fruitMaturation
Ripening
different, specify)? Specify if it includes labor costs and/or land rent.
9. What types of fertilizers or inputs are used by maize growers? When are they applied during the season? What are the specific costs of these inputs per hectare?
10. What is the optimal yield in the area?
11. What is the average yield in the area?
12. In which of the last 10 to 20 years do you recall hav-ing the best yields?
13. In which of the last 10 to 20 years do you recall hav-ing the worst yield?
INCOME
1. Do farmers in the area have alternative sources of income? What percentage of farmers rely only on farm income?
2. How relevant are maize revenues for households’ incomes in the area?
3. Is maize produced for commercial purposes or for self-consumption?
4. What are the main sales markets for maize?
5. On average what are the prices for maize? Give recent years’ high versus low.
ITEMS TYPE
AMOUNT (LTS, KG/HECTARE)
VALUE (IDR)
MONTH INPUTS APPLIED
Seed
Fertilizer
Chemicals (specify)
Other
YEAR SIZE OF LAND YIELD NOTES
YEAR SIZE OF LAND YIELD NOTES
AN ILLUSTRATION FOR DROUGHT COVERAGE FOR MAIZE
A&R_Risk_Annex_1.indd 59 28/10/11 12:01 PM

ANNEX 1 — QUESTIONNAIRE FOR COLLECTING AGRICULTURAL INFORMATION60
WEATHER INDEX INSURANCE FOR AGRICULTURE
6. Is there any forward contracting for maize?
7. During which month do most farmers normally sell their production?
RISK
1. What are the main risks for farmers’ income?
2. What are the primary production risks?
3. What are the specific weather risks that production faces?
4. If farmers are exposed to weather risks, how do they currently manage them?
5. In how many years out of 10 are yields reduced because of drought?
6. In which of the last 10 years do you recall having the most favorable weather for production?
7. In which of the last 10 years do you recall having the worst weather for production?
a. Pests?
b. Diseases?
c. Weather?
d. Lack of access to inputs?
e. Other?
a. Drought?
b. Excess rain?
c. Temperature?
d. Other?
YEAR SIZE OF LAND YIELD
YEAR SIZE OF LAND YIELD
RAINFALL CONTRACT PARAMETERS (IF DROUGHT OR EXCESSIVE RAIN RISKS APPLY)
1. Do farmers in the area practice dry planting or do they wait for onset of rainfall?
2. How do farmers judge when rain is sufficient for planting?
3. What do they do if rains are insufficient for planting? Plant a different crop or plant anyway? Do they ever not plant if rainfall is not good?
4. a. Which periods in the growing season are the most critical to have rainfall for a successful harvest?
KEY: Not important, somewhat important, very important, critical
b. Are there periods during the growing season when too much rain has destroyed or damaged the harvest?
KEY: Not important, somewhat important, very important, critical
5. a. In the drought years, at which growth stage(s) was the crop most affected?
b. In the excess rainfall years, at which growth stage(s) was the crop most affected?
6. Does rainfall at the reference station reflect the rainfall pattern of the area? Do parts of the area have different rainfall patterns?
PLANTING
ESTABLISHMENT (GERMINATION & LEAF DEV.)
VEGETATIVE (STEM ELONGATION) FLOWERING MATURATION
PLANTING
ESTABLISHMENT (GERMINATION & LEAF DEV.)
VEGETATIVE (STEM ELONGATION) FLOWERING MATURATION
WRSI PHASES YEAR YEAR YEAR YEAR
Planting and establishment
Vegetative
Flowering
Maturation
A&R_Risk_Annex_1.indd 60 28/10/11 12:01 PM
ANNEX 1 — QUESTIONNAIRE FOR COLLECTING AGRICULTURAL INFORMATION 61
AGRICULTURE AND RURAL DEVELOPMENT DISCUSSION PAPER
ACCESS TO FINANCE
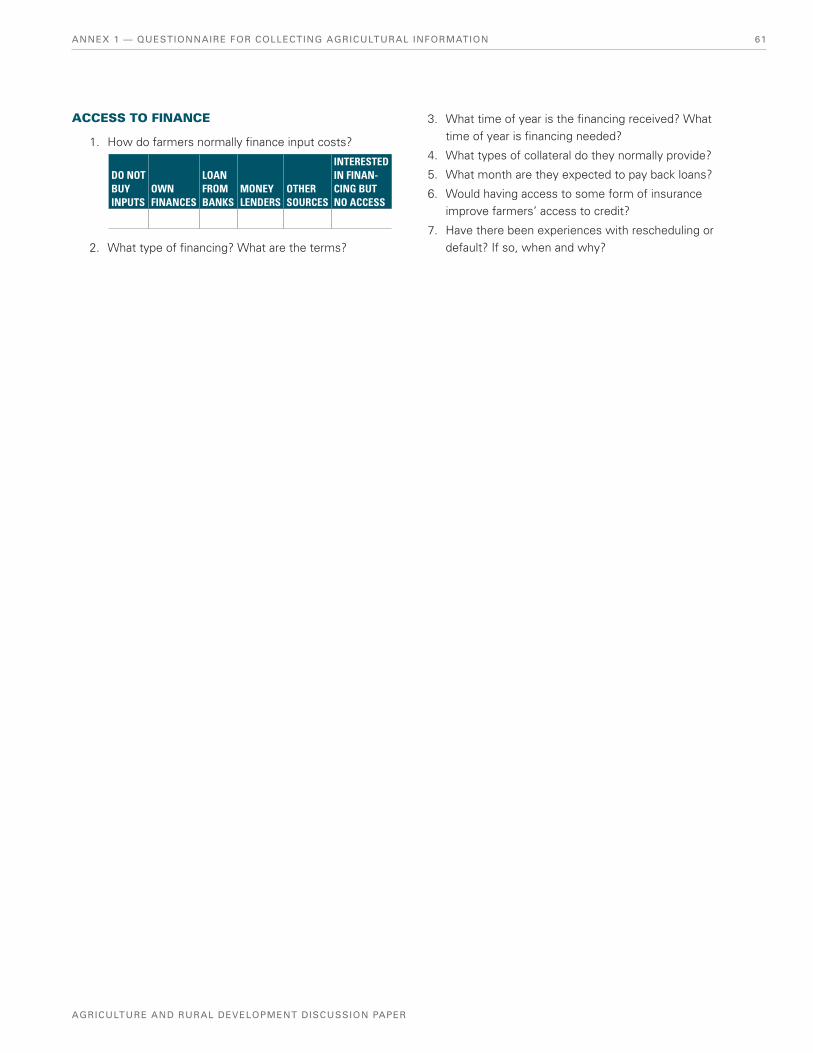
1. How do farmers normally finance input costs?
2. What type of financing? What are the terms?
DO NOT BUY INPUTS
OWN FINANCES
LOAN FROM BANKS
MONEY LENDERS
OTHER SOURCES
INTERESTED IN FINANCING BUT NO ACCESS
3. What time of year is the financing received? What time of year is financing needed?
4. What types of collateral do they normally provide?
5. What month are they expected to pay back loans?
6. Would having access to some form of insurance improve farmers’ access to credit?
7. Have there been experiences with rescheduling or default? If so, when and why?
A&R_Risk_Annex_1.indd 61 28/10/11 12:01 PM

A&R_Risk_Annex_1.indd 62 28/10/11 12:01 PM

ANNEX 2 — TERMS OF REFERENCE FOR RISK MAPPING THE AGRICULTURAL SECTOR 63
AGRICULTURE AND RURAL DEVELOPMENT DISCUSSION PAPER
Annex 2: TERMS OF REFERENCE FOR RISKMAPPING THE AGRICULTURAL SECTOR
INTRODUCTION20
The Government of Jamaica (GOJ) has requested support from the World Bank in helping the country to design and implement a strategy for managing weather risks in the agricultural sector. These terms of reference detail the objec-tives, scope of work, and products for hiring a consulting firm (the Firm) to conduct a risk mapping exercise in the island. The findings of the tasks detailed here will serve as inputs for the Government of Jamaica for designing a weather risk management (WRM) strategy in partnership with the private sector. Findings of this exercise will also be used by the World Bank to formulate a sector support project to assist the government in implementing a WRM program.
BACKGROUND AND JUSTIFICATION
The history of agricultural insurance in Jamaica has not been good. This has been partly blamed on high catastrophic ex-posure (and lack of reinsurance capacity), but in reality it is a mixed result of difficulty of designing appropriate insurance for delivery to small farm holdings, complex tropical crops, technical difficulties in modeling weather risks and flood damages to agricultural crops, and a generally uninterested local insurance market (with some exceptions). Only for a few examples has traditional named-peril insurance worked or nearly worked in the country.
Since 2006, most insurance products ceased to oper-ate, leaving agriculture highly exposed to weather risks. Moreover, given that the vast majority of farmers are small holding units, the government is highly concerned with how to protect this segment, and is interested in organizing an ef-ficient distribution channel to provide support to small farm-ers in the aftermath of a catastrophic event. The reality is that both large agricultural chains and small farmers are absorbing
20 These terms of reference (TOR) could be adapted to obtain weather risk maps at the national, regional, or pilot (localized) level, depending on the level of aggregation required. Similar TOR were actually used for risk mapping the Blue Mountain Coffee Area.
all the weather risks, without a risk transfer mechanism in place—neither publicly backed and run nor privately (re)insured.
Undoubtedly a parametric approach (if feasible) would over-come some of the above constraints and provide all the usual advantages the literature tend to highlight for these types of insurance products, but the basis risk issue is going to be ex-tremely difficult to deal with. The findings of this activity will throw light into the debate on the appropriate instruments to manage risks in agriculture.
Lately, the Government of Jamaica, with the support of the commodity boards, is organizing a registry of farmers, with the intention to improve the transparency and efficiency of the public mechanisms to channel farmer support in the event of catastrophic hurricane damages.
The Ministry of Agriculture (MOA) provides ex-post ad-hoc handouts to small farmers after a disaster and would like to move toward an ex-ante explicit program for covering vulner-able producers against adverse weather events. Such an ex-ante program could be financed, according to the risk layers, by a mix of government funds, contingent lines of credits, and reinsurance. The outputs of these terms of reference will inform the GOJ in the design of a weather risk man-agement strategy and help various stakeholders in making informed decisions regarding weather risk measures in the country.
SCOPE OF WORK AND ACTIVITIES
The Firm tasks will be limited to: (1) collect the historical weather data available in the various weather service net-works existing in the country and produce weather hazard maps for the agricultural sector and (2) conduct an exposure assessment of the most important crops to weather hazards. In order to accomplish both set of tasks, the Firm will under-take the following activities:
1. The Firm will develop an inventory of available histori-cal meteorological information that can be used by
CASE OF JAMAICA20
A&R_Risk_Annex_2.indd 63 28/10/11 12:08 PM

ANNEX 2 — TERMS OF REFERENCE FOR RISK MAPPING THE AGRICULTURAL SECTOR64
WEATHER INDEX INSURANCE FOR AGRICULTURE
the insurance industry for designing crop insurance contracts. The inventory will take the following infor-mation into account:
a. Listing of all weather stations
b. Type of station
c. Institution or agency administering
d. Localization (geo-referenced)
e. Weather variables that are registered (rainfall, temperature, wind speed, evaporation coefficient, solar light time, and so on)
f. Number of years with daily observations
g. Number of daily missing observations (or percent-age of total)
h. Type of data transmission (automatic, by radio, by telephone, and so on)
i. Current state of data (digitalized, manuscript, and so on)
2. The Firm will perform quality control and data clean-ing over the available historical weather data supplied by the weather service in order to work on a reliable set of weather data that can be used for risk hazard mapping. Having arrived at a reliable set of weather data, the Firm will assess the spatial and temporal usefulness of the weather database to be used for assessing agricultural risks, taking into account the agro-meteorological zones, distribution of farm land, and location of weather stations.
3. The Firm will draw general weather hazard maps for the various regions of the country related to the fol-lowing risks:
a. Monthly climatology of maximum temperature (May)
b. Annual climatology of rainfall
c. Mid-summer drought index
d. Daily extreme precipitation
The weather hazard maps will be layered with maps containing the density and type of producers, and type of crops for every macro agro-meteorological region. The findings of this activity plus the findings of the exposure assessment will serve as inputs for the Ministry of Agriculture to design their weather strategy framework.
4. The Firm will generate expected hazard frequen-cies of weather variables (rainfall, temperature, wind speed, and so on, depending on the identified risk) for capturing frequency and intensity of weather events in the identified macro homogeneous weather zones, based on the historical database. In other words, the experts will be trying to construct the whole range of probabilities, based on historical weather data sets, for various intensities or magnitudes of events. This is also known by insurers as the “return period.”
DELIVERABLES, DURATION, AND RESPONSIBILITY
In order to comply with the task’s objectives and make find-ings accessible to decision makers in the government, the Firm will address the issues of each consulting component and combine the analysis into a single report. To arrive at a final document, the Firm will produce the following deliverables:
1. A work plan at the beginning of the consulting tasks, detailing the team, methodology, and calendar that will be used to develop each component
2. Detailed findings for each of the components of this consulting task
3. A final report synthesizing the technical findings, including the definition of the homogeneous weather macro zones, illustrating the weather risks with maps
The Firm will develop the activities specified in these terms of reference and deliver the products in the period from July 1 to October 31, 2008.
A&R_Risk_Annex_2.indd 64 28/10/11 12:08 PM

ANNEX 3 — TERMS OF REFERENCE FOR THE CREATION OF GRIDDED WEATHER PRODUCTS 65
AGRICULTURE AND RURAL DEVELOPMENT DISCUSSION PAPER
Annex 3: TERMS OF REFERENCE FOR THE CREATIONOF GRIDDED WEATHER PRODUCTS
PURPOSE
The purpose of this consultancy is twofold, assessing the feasibility of creating regular grids of climate variables and creating the gridded weather database to be used by the lo-cal insurance industry of Guatemala for the development of agricultural index insurance products.
The creation of regular grids will be used to estimate the historical records of new or recently installed meteorologi-cal stations and allow calculating climate variables in pixels that are homogeneously distributed and have full historical records. The feasibility of creating regular grids depends on the temporal-spatial coverage of existing weather records. A minimum spatial coverage of field weather stations will be established by the Firm in order to successfully apply the gridding process; based on its analysis, it is possible to de-fine the resolution of the regular grids.
It is important to consider that the spatial density is not constant, as the number of records generally changes every day, due to stations that stop operating or simply because of the absence of records. Therefore, it is indispensable also to estimate the evolution of such coverage, which might be expressed as porosity (percentage of missing data within a given period) or its complement, percentage of valid records. The analysis of temporal coverage will therefore allow the establishment of the period covered by the regular grid.
DESCRIPTION OF THE CONSULTANCY
This consultancy will be developed by the Firm in two stages, one involving the feasibility of creating a regular grid resulting in the various options for doing so, and a second, involving the actual creation of the regular grid based on the chosen option at the end of the first stage.
First Stage: Feasibility
The Firm must assess the feasibility of creating gridded (that is, mesh-based) weather data product for rainfall and tem-perature in Guatemala that could be used by the local insur-
ance industry in the country to develop index-based weather insurance products for agriculture.
The objective of such a product would be to enable better risk mapping and greater access to risk transfer products in areas with inadequate weather infrastructure. The Firm should assess the conditions of creating the data grid to ad-dress these specific needs, outlining the benefits and limita-tions of producing the grid data as a result of the analysis in the preparatory stage. The methodology to assess this feasibility and ultimately to create such a product should be proposed by the Firm and accepted by the World Bank, and it should be based on practical experiences that has been done in similar countries.
The Firm will assess the feasibility of creating gridded weather data products in Guatemala for both rainfall and temperature (minimum and maximum) based on a blend of existing station data and existing gridded data products (for example, North American Regional Reanalysis [NARR],21 National Oceanic and Atmospheric Administration [NOAA]’s Climate Prediction Centre datasets,22 and the National Centers for Environmental Prediction/National Center for Atmospheric Research [NCEP/NCAR] Reanalysis23) to support the weather station–based data observations. The World Bank will provide the Firm with an inventory of weather stations and station data in the coun-try. The World Bank will also provide information for specific land political divisions in case it is required (for example, geo-graphic location and extension of rural and urban zones).
The minimum information for the preparatory stage includes the following:
1. Field weather station catalogue: Weather station ID, latitude and longitude of the existing field stations
21 http://www.emc.ncep.noaa.gov/mmb/rreanl/.
22 http://www.cpc.noaa.gov/products/Global_Monsoons/American_ Monsoons/SAMS_precip_monitoring.shtml.
23 http://www.cdc.noaa.gov/cdc/reanalysis/reanalysis.shtml.
CASE OF GUATEMALA
A&R_Risk_Annex_3.indd 65 28/10/11 12:03 PM

ANNEX 3 — TERMS OF REFERENCE FOR THE CREATION OF GRIDDED WEATHER PRODUCTS66
WEATHER INDEX INSURANCE FOR AGRICULTURE
2. Dataset: Weather station ID, date and readings of daily precipitation, and observations of maximum and minimum temperatures
The first deliverable of the study will be a report summa-rizing the Firm’s conclusions as to the options of creating a gridded weather product that offers higher spatial and temporal resolution coverage for rainfall and temperature index–based weather risk management than the existing weather stations network in Guatemala. Evidence and expla-nation to support this conclusion will be required. At the end of the first stage, the Firm should outline the methodology to be used to construct the gridded product based on the option the World Bank will agree on, its characteristics, necessary investments, and a timeline for completing the product.
The characteristics of the gridded product to be defined in-clude the following:
� Interpolation methodology and technical details
� Temporal resolution
� Spatial resolution
� Geographic domain
� Initial and final date
The activities for conducting the feasibility stage are outlined in table A3.1, with an approximate timetable for completion of the analysis.
Second Stage: Creating the Product
The second step will consist of creating the product. The Firm will reproduce the methodology that was proposed dur-ing the feasibility stage and accepted by the World Bank for the generation of the gridded dataset and for evaluating its precision.
The gridded analysis from the Firm is based on the Cressman methodology (Cressman, 1959). The methodology consists of correcting a preliminary field based on observations. The preliminary field used by the Firm is the NARR (Messinger et al., 2006) developed by the NOAA. The Firm has gridded analysis for the following variables: precipitation, maximum temperature, minimum temperature, potential evapotrans-piration by Hargreaves Method. The gridded analysis has the following characteristics: temporal resolution is daily, pixel size equal to 0.2° (~20 km), and the initial date is January 1, 1979. The final date is as current as the last cli-matological information available, and the last NARR data published.
The evaluation will consist of comparing the gridded dataset with the field weather dataset to estimate the error associ-ated with the interpolation. In case a second independent network (that is, not included in the Cressman analysis) is provided by the World Bank, a second comparison between this network and the gridded dataset will be performed. The World Bank will select up to two temporal resolutions (for example, daily or monthly) for the analysis.
Finally, a graphic user interface (GUI) will be created to ac-quire individual time series from the gridded dataset in a friendly manner. The user will be able to define interactively the following parameters:
1. The pixel of interest by geographic coordinates, or a drop-down catalogue of stations
2. Variable of interest
3. Period of interest
4. Up to two temporal resolutions (for example, daily or monthly)
Additionally, the GUI will provide:
1. A few basic statistics (defined by the World Bank in agreement with the Firm)
2. A time series plot
3. Optionally, an interface for a daily surface contour map of a climate variable
The GUI will be designed so it can be installed and executed on any PC with Windows XP without the acquisition of any additional software by the user. The selection of the develop-ment environment for the GUI depends entirely on the Firm.
The deliverables of the second stage include the gridded data-set in text format, a report, installation discs, and tutorial of the GUI, among other activities as it can be seen in table A3.2.
TABLE A3.1: Timetable for the Feasibility Stage of the Project
ID ACTIVITY
MONTH 1 MONTH 2 MONTH 3
1 2 3 4 1 2 3 4 1 2 3 4
1 Analysis of the temporal coverage
2 Analysis of the spatial coverage
3 Analysis of possible preliminary fields
4 Elaboration of report and presentation
Source: Authors.
A&R_Risk_Annex_3.indd 66 28/10/11 12:03 PM

ANNEX 3 — TERMS OF REFERENCE FOR THE CREATION OF GRIDDED WEATHER PRODUCTS 67
AGRICULTURE AND RURAL DEVELOPMENT DISCUSSION PAPER
DELIVERABLES, DURATION, AND RESPONSIBILITY
In order to comply with the objectives of this consulting as-signment, the Firm will produce the following deliverables:
1. A work plan at the beginning of the consulting tasks, detailing the team, methodology, and calendar that will be used to develop each component
2. A document with detailed findings for the feasibility stage, outlining the options for proceeding with the
second stage for the creation of the grid weather database
3. A final report synthesizing the technical findings
4. The regular grid database for Guatemala with the agreed spatial and temporal resolution, plus the soft-ware for the GUI with its respective manual for use
The Firm will develop the activities specified in these terms of reference and deliver the products in the period from February 1 to November 30, 2008.
TABLE A3.2: Activities and Calender for the Second Stage of the Project
ID ACTIVITY
MONTH 1 MONTH 2 MONTH 3 MONTH 4 MONTH 5
1 2 3 4 1 2 3 4 1 2 3 4 1 2 3 4 1 2 3 4
1 Acquire three-hourly data from NARR
2 Estimate daily cumulative rainfall and maximum and minimum temperatures in agreement with the times of reading on the local climatological network
3 Format the local climatological dataset
4 Apply Cressman analysis
5 Evaluate the gridded analysis by comparison with a second independent local climatological network
6 Develop the GUI
7 Elaborate report and presentation
Source: Authors.
A&R_Risk_Annex_3.indd 67 28/10/11 12:03 PM

A&R_Risk_Annex_3.indd 68 28/10/11 12:03 PM

ANNEX 4 — INFORMATION CHECKLIST FOR A PREFEASIBILITY PILOT PROJECT 69
AGRICULTURE AND RURAL DEVELOPMENT DISCUSSION PAPER
Annex 4: INFORMATION CHECKLIST FORA PREFEASIBILITY PILOT PROJECT
OBJECTIVE QUESTIONS REQUIRED INFORMATION
Definition of insurable interest �What are the objectives of the government or champion organization in respect to agricultural insurance?
�Political definition
�What do you intend to cover with the insur-ance? A contingent fund against catastrophic events, aggregated risk, or individual farms?
�Political definition
�What types of producers are your target group? Commercial farmers, subsistence farmers, small commercial producers?
�Political definition �Definition of the segment of producers to be protected �Quantity of producers within the selected area or provinces �Description of productive systems �Average area cultivated in crops within the selected segment of farmers �Geographical distribution with the greatest level of disaggregation as far as number of producers and are to be protected
�What level of coverage will be offered? Income? Costs of production? Rural credit? An income compensation estimate in catastrophic events?
For insuring income losses: �Structure of agricultural produce markets �Commercialization system of agricultural products � Information systems of agricultural products �Monthly statistics of farm gate prices for agricultural products to be insured �Statistics of cultivated areas, sown areas, production and yields, with the greatest possible desegregation for each one of the crops that will be insured
For insuring production costs: �Description of agricultural models for each of the crops to be insured, and areas �Production costs for each of the crops to be insured, and areas, indicating the dates for agricultural activities �Gross margins for each of the crops to be insured �Statistics of cultivated areas, sown areas, production and yields, with the greatest possible desegregation for each of the crops to be insured
For an income compensation type of insurance in cata-strophic events:
�Description of agricultural models for each of the crops to be insured, and areas �Production costs for each of the crops to be insured, and areas, indicating the dates for agricultural activities �Current government expenditures used to support farmers in the event of catastrophic events �Statistics of cultivated areas, sown areas, production and yields, with the greatest possible desegregation for each of the crops to be insured
A&R_Risk_Annex_4.indd 69 28/10/11 12:03 PM

ANNEX 4 — INFORMATION CHECKLIST FOR A PREFEASIBILITY PILOT PROJECT70
WEATHER INDEX INSURANCE FOR AGRICULTURE
OBJECTIVE QUESTIONS REQUIRED INFORMATION
Definition of the insurance beneficiary (or target group)
Who is the policyholder? The state? At what level? If an aggregator, who? Individual farmers?
�Political definition �Defining the parameters to be used for declaring a catastrophe for payouts: weather indexes, area yield indexes, ad-hoc declaration �Defining the level of weather events that will kick-start the payments �Operational scale of the insurance: farmer, group of farmers, province, department, national �Who pays the premium? The government? Producers? The government with producers share? Producers with government subsidies? An aggregator (processor, exporter)? �What are government resources to finance a catastrophic insurance for agriculture? Is there any premium subsidy for commercial insurance? �What type of system will be in place for farmers’ participation? Voluntary, compulsory? Compulsory for obtaining credit? In this case, how many (segment) producers have access to credit? �How will the premium-collecting channel work? (in case farmers participate in premium payments total or partially) �What is the system for channeling the payouts? �What are the mechanisms for controlling subscription in case insurance is individual? Are there information systems in place? �Are there farmer registries? �Can a farmer pay for the insurance? If yes, how much could they pay and what type of coverage?
Definition of the crops and areas to insure �Annual food crops? Annual cash crops? Perennial agricultural crops? �What are the risks to be covered? �What districts, provinces, departments? �What level of coverage will be offered? �Which definition of losses will be used? Named perils? Multi-risks? Indexed risks?
� Identification of crop cycles and phenological phases for each of the crops to be insured, and crop calendars for each area �Description of each zone or area to be insured, includ-ing type of soils, topography, percentage of agriculture under irrigation and rain-fed, frequency and intensity of each risk that will be covered by the insurance, for each month of the crop cycle �Overlapping production zones with maps of frequency and intensity of adverse weather events � Information on average cultivated areas for last three years of each of the crops to be insured for each of the districts, provinces, or departments �Recompilation of recommended agronomic practices for each of the crops to be insured in each zone. Sowing limit dates, sowing density, agronomic activi-ties, and so on �Prioritization of crops and zones to start piloting a program
Definition of product to be offered Which product could be offered? �Damage insurance �Multi-peril insurance � Index weather insurance �Area yield insurance �Other
�Policy contract to be used �Conditions and criteria to activate coverage � Level of coverage �Subscription capacity and loss adjustment. Experience and capacity (for damage and multi-peril insurance) �Statistics of cultivated areas, sown areas, production and yields, with the greatest possible disaggrega-tion for each of the crops to be insured. The level of disaggregation will depend on the scale of operation (district, province, department). Reinsurers usually need 10 years of data up to last agricultural year �Agricultural information systems. What institutions are responsible for these tasks? What methodology they use for estimating results? How long it takes to publish agricultural results? �Weather data, description of weather stations and localization, inventory of weather data for at least last 20 years
A&R_Risk_Annex_4.indd 70 28/10/11 12:03 PM

ANNEX 4 — INFORMATION CHECKLIST FOR A PREFEASIBILITY PILOT PROJECT 71
AGRICULTURE AND RURAL DEVELOPMENT DISCUSSION PAPER
OBJECTIVE QUESTIONS REQUIRED INFORMATION
Mechanisms to reach farmers �Which channels will be used to collect premiums from farmers? �Which channels will be used for channeling payouts to farmers?
�Government agencies �Partnership with other institutions (cooperatives, processors, exporters, and so on) �Banks and other financial service providers �Possibility to link insurance with other agricultural services �Audit and controls
Risk evaluation �Which is the intensity and frequency of each risk that affects crops to be insured in each of the regions where the insurance will operate?
�History of government assistance for each of the crops to be insured, identifying the causes and regions where support was provided �Determination of potential losses for each of the identified risks to be insured. The exercise is to identify the vulnerability curves of crops �Estimation of maximum probable loss. This activity can be done by a consultant or the reinsurers based on the information that has been provided
Institutional evaluation �Which institutions will operate the insurance? �Who will subscribe the risks and what is the capacity? �What is the operational capacity? �What are the information systems in place?
�Who will be responsible for operating the insur-ance? Insurance companies? The government? Mixed system? �Description of operator resources and capacity in managing agricultural insurance �Staff: Professional qualification and experience in agricultural insurance �Underwriter: experience in agricultural insurance � Loss adjusters: experience in agricultural insurance and availability �Operational costs and resources
Risk financing �What part of the risk will be assumed by farmers, public sector, insurance, and reinsurance? �Who will pay the cost of the insurance?
�How much of the risks will be retained by the insur-ance companies? �How much of the risk will be retained by the public sector? �How much of the risk will be transferred to the reinsur-ance? What type of transfer method will be used? Proportional or not proportional? �How much public resources are available for subsidiz-ing the premiums? Assume part of the catastrophic layer?
Source: Authors.
A&R_Risk_Annex_4.indd 71 28/10/11 12:03 PM

A&R_Risk_Annex_4.indd 72 28/10/11 12:03 PM

ANNEX 5 — TERMS OF REFERENCE FOR A WEATHER INSURANCE FEASIBILITY STUDY 73
AGRICULTURE AND RURAL DEVELOPMENT DISCUSSION PAPER
Annex 5: TERMS OF REFERENCE FOR A WEATHERINSURANCE FEASIBILITY STUDY
A. TERMS OF REFERENCE: AGRICULTURAL SECTOR EXPERT
BACKGROUND
The agricultural sector plays a major role in the Bangladesh economy. The main sources of livelihood for the rural popula-tion are agriculture and rural nonfarm sectors, which directly or indirectly depend on agriculture. Agriculture is dominated by small and subsistence farmers. A large share of the rural population consists of landless laborers (about 34 percent of rural households) and subsistence farmers with less than 0.5 hectares of land (about 41 percent); they depend on agriculture and the rural nonfarm sectors for employment. At the same time, agriculture accounts for about 22 percent of GDP. The rural nonfarm sector, which is driven primarily by agriculture, accounts for another 35 percent of GDP.
Agriculture is particularly exposed to natural disasters. Bangladesh is one of the world’s most vulnerable countries to natural hazards, such as floods, droughts, and cyclones, which affect particularly the rural areas and the agricultural sector. Flooding is a recurrent event in Bangladesh. Most of its territory consists of floodplains, and up to 30 percent of the country experiences annual flooding during the monsoon season—while periodic extreme floods affect 60 percent of the national territory. Although annual flooding is beneficial, severe flooding hurts the population and causes major losses in rice production.
Recent major flooding occurred in 2007, which directly af-fected over 14 million people, caused over 1,000 deaths, affected over 2 million acres of agricultural land, and dam-aged and destroyed infrastructure (over 30,000 km of roads) and social and educational facilities as well as private as-sets, including housing, crops, livestock, and fisheries. The preliminary damage and loss assessment24 for the crops, livestock, and fisheries subsectors were estimated at about
24 2007 Floods in Bangladesh: Damage and Needs Assessment and Proposed Recovery Program—a joint report by the World Bank and the Asian Development Bank, November 2007.
US$648 million. The country subsequently experienced an-other natural disaster, Cyclone Sidr, in November 2007, which caused estimated damages and losses of BDT 115.6 billion (US$1.7 billion)25—equivalent to 2.8 percent of Bangladesh’s gross domestic product.
Bangladesh is also vulnerable to recurrent droughts. Some 2.3 million hectares are prone to drought, and between 1960 and 1991 droughts occurred 19 times. Western regions are especially vulnerable to droughts. During the Rabi season 1.2 million hectares of cropland face droughts of various mag-nitudes, and a severe drought can damage more than 40 per-cent of broadcast output. During the Kharif season drought causes significant damage to the transplanted aman crop on about 2.3 million hectares. In addition to causing agricultural losses, droughts significantly increase land degradation.
The impact of adverse events, therefore, turns out to be significantly large for the poor people and negatively affects their household income and consumption levels. With the scarcity of affordable and suitable risk management tools, when exposed to adverse shocks low-income households may be forced to reduce food consumption, take children out of school, and sell productive assets, which jeopardizes their economic and human development prospects. Expanding financial access, particularly to insurance services, will help the poor deal more effectively with their financial vulnerabil-ity and will reduce the impoverishment experienced by the household under adverse shocks (Roth, McCord, and Liber, 2007). With a vast majority of farmers growing rain-fed crops and therefore being vulnerable to the vagaries of the mon-soon rains and floods, agricultural risk management products become particularly important for Bangladesh.
25 Cyclone Sidr in Bangladesh: Damage, Loss, and Needs Assess-ment for Disaster Recovery and Reconstruction—a report (draft) prepared by the Government of Bangladesh Assisted by World Bank, United Nations Agencies, and the International Develop-ment Community with Financial Support from the European Commission, February 2008.
LOCAL AND INTERNATIONAL CONSULTANTS CASE OF BANGLADESH
A&R_Risk_Annex_5.indd 73 28/10/11 12:02 PM

ANNEX 5 — TERMS OF REFERENCE FOR A WEATHER INSURANCE FEASIBILITY STUDY74
WEATHER INDEX INSURANCE FOR AGRICULTURE
The study is in response to a request from the government of Bangladesh. Key counterparts for the study include the Department of Insurance (Ministry of Commerce), Ministry of Finance, Ministry of Fisheries and Livestock, Ministry of Agriculture and its relevant agencies (Department of Agriculture Extension [DAE], Bangladesh Agricultural Research Council [BARC], Department of Livestock Services [DLS], and so on), Ministry of Food & Disaster Management, Bangladesh Bureau of Statistics, Palli Karma Sahayak Foundation [PKSF], and its partner organizations, Bangladesh Insurance Association, and private or state-owned insurance companies. Other counterparts include meteorological and research institutions preserving weather and agricultural data, donors, and possible beneficiaries (farmers and micro-credit borrowers).
ACTIVITIES
The consultant will support the World Bank team and inter-national agricultural insurance expert in their tasks (see draft terms of reference of the international agricultural insurance expert in Section B). In particular, he will perform the follow-ing tasks:
1. Work independently and continue dialogue during the assignment with key counterparts on possible risk insurance products for Bangladesh agricultural sector and help them conceptualize the role they need to play at designing and implementation stages based on international experience of different insurance models.
2. Prepare background papers on Bangladesh agricul-ture and cooperative sectors including cropping sys-tem; geographical variations; emerging issues; role of regulations, regulators, and apex bodies; key players; farmers’ risk profiles, risk-coping mechanism, and government’s role.
3. Assist in analyzing the possibility of market-based insurance product in Bangladesh and public-private partnership in financing agricultural insurance.
4. Collect data and statistics as per data sheet to be supplied by international consultant (a sample of data sheet of similar study is attached)—translate data and wordings where necessary.
5. Organize and arrange field visits, meetings, focus group discussions, and workshops in coordination with the World Bank team or other consultants (during the study as well as during its dissemination).
6. Collaborate with other consultants on data analysis using Excel spreadsheet.
7. Liaise with the potential stakeholders (individuals or institutions) of this study.
8. Help the team identify the main counterpart, whether that be the Department of Insurance, PKSF, BRAC, or a possible advisory committee comprising multi-party stakeholders and act as the focal point to run the secretary.
9. Work closely with other consultants and the World Bank team in exploring the dynamics of partnership among microfinance institutions and insurance com-panies, possible challenges (for example, reinsurance mechanism), institutional framework, and the role of regulations or regulator and apex bodies, such as PKSF, insurance association, and so on.
10. Work closely with other consultants and the World Bank team in drafting and finalizing the background reports and follow up with institutions and individu-als to ensure that these reports reflect the realities on the ground. In addition, significantly contribute in drafting different chapters of the final report based on an outline to be discussed mutually later on.
11. Assist in disseminating the study objectives and findings to the stakeholders (including government, agricultural, microfinance, and insurance sector) both at the time of preparation and finalization of the study.
The data and information to be collected are described in Annex 5A.
The assignment is expected not to exceed 40 days, from November 1, 2008, to June 30, 2009.
This assignment will involve travel within Bangladesh (outside Dhaka). Prior to traveling the consultant must seek clearance from the Bank on the purpose and duration of the trips. The consultant will be reimbursed at cost, the legitimate expenses for travel, accommodations, subsistence, and other approved study-related expenses in the field, upon presenta-tion of appropriate receipts. No expenses will be reimbursed for any visit inside Dhaka and engaging any other person (for example, enumerators) in this assignment. The consultant has to independently arrange the travel and any other logistics required in this assignment.
Assignment Budget
ITEMS RATE (TK.) UNIT (DAY) TOTAL
Daily fees XX 40 XX
Source: Authors.
A&R_Risk_Annex_5.indd 74 28/10/11 12:02 PM

ANNEX 5 — TERMS OF REFERENCE FOR A WEATHER INSURANCE FEASIBILITY STUDY 75
AGRICULTURE AND RURAL DEVELOPMENT DISCUSSION PAPER
B. TERMS OF REFERENCE: INTERNATIONAL AGRICULTURAL INSURANCE EXPERT
Activity 1: Agricultural and Weather Risk Assessment
The consultant will provide an agriculture (livestock and ma-jor crops) risk assessment and a basic weather risk assess-ment in Bangladesh. The specific components of this task are as follows:
1. Develop a list of data to be collected by the local consultant.
2. Assess the quality of agricultural data collected.
3. Assess the agricultural data collection system in light of international best practices and propose an action plan to further improve the system for insurance purposes.
4. Data building and data cleaning (using data collected during the identification phase and, where necessary and possible, obtain additional data during field trip) for crop data (yield, area, production, cause of loss) for major crops, livestock data, and weather data.
5. Loss risk assessment
a. To carry out a statistical analysis of agricultural risks and weather risks, including, but not limited to, average annual loss, loss exceedance curve, and so on, for each agro-climatic zone/weather station/administrative unit.
b. To analyze the impact of catastrophic losses on
i. The crop portfolio
ii. The livestock portfolio
iii. The aggregate crop portfolio
6. Develop an insurance portfolio model (for example, Excel spreadsheet) to assess the potential exposure of stakeholders (for example, farmers, local insurance companies, government) to natural disasters (for example, drought, floods).
Activity 2: Challenges in Developing Market-based Agricultural Insurance
The consultant will review the current agricultural insurance products offered by the domestic insurance market and will identify the technical and operational challenges for the emergence of an agricultural insurance market:
1. To review technical, operational, and financial practices and agricultural insurance products of local insurance companies, including:
a. Underwriting techniques (crops and livestock)
b. Loss adjustment techniques (crops and livestock)
c. Pricing methodology
d. Risk financing strategy (for example, reinsurance treaties, reserves)
e. Organizational structure
2. Recommendations on how to improve the current insurance practices and products based on international experience.
3. Review the agriculture reinsurance market in Bangladesh.
a. Local and international players
b. Conditions for increasing traditional reinsurance capacity
c. Conditions for increasing nontraditional (for example, weather index) reinsurance capacity
d. Market efficiency
4. Conduct demand analysis corresponding to level of risks: Identify what level of risk each group of stake-holders (farmers, insurance companies, government) is ready to assume. In particular, setting the appropri-ate level of premium for the targeted farmers would require demand analysis to understand the dynamics of the customer base and create a more bankable product. Some of the factors to consider include the willingness to pay, perceptions of risk, and the type of features that farmers would be attracted to as well as structure of the tenancy.
5. Revisit the idea of full-scale market-based insurance and study whether this is a viable option in an envi-ronment like Bangladesh where the fiscal sustainabil-ity is low and the pricing of the product is a challenge.
6. Identify areas for agriculture insurance product development.
a. Identify crops, livestock, and hazards that may be feasible for agricultural insurance, and particularly index/parametric insurance.
b. Identify the constraints and challenges of the current legal and regulatory framework and come up with recommendations for an enabling environ-ment for agricultural insurance, particularly the role of MFIs as delivery channel.
c. Develop a detailed action plan (including terms of reference) for both the pilot and implementation phases of crop and livestock insurance products.
Activity 3: Public-Private Partnership in the Financing of Agricultural Insurance
The consultant/s will analyze options for a public-private part-nership in agricultural insurance. The specific tasks for this assignment are:
A&R_Risk_Annex_5.indd 75 28/10/11 12:02 PM

ANNEX 5 — TERMS OF REFERENCE FOR A WEATHER INSURANCE FEASIBILITY STUDY76
WEATHER INDEX INSURANCE FOR AGRICULTURE
1. Review relevant public-private partnerships in agricul-ture insurance in selected countries (with a particular focus on India). This review will be presented in a synthetic way to highlight benefits and challenges of each model.
2. Analyze the current public support to agricultural credit.
3. Identify the role of the government in the support to the domestic agriculture insurance market through a clear distinction between social insurance and market-based insurance.
4. Propose options for a public-private partnership in agricultural insurance, aiming to:
a. Foster the development of the domestic agricul-ture insurance market.
b. Promote the development of affordable and effec-tive agriculture insurance products to farmers and others exposed to the impact of agricultural risks.
c. Protect the domestic insurance industry against catastrophic losses.
d. Facilitate access to private (traditional and non-traditional) reinsurance capacity.
5. Review agriculture insurance subsidy programs and their associated costs and benefits.
Activity 4: Design and Rate Prototype Agricultural Insurance
The consultant will design and rate prototype agricultural insurance (for both crop and livestock on selected regions) products that can be piloted in a next phase.
EXPECTED OUTPUTS
The outputs expected of the consultant include:
1. List of data/information to be collected in the context of this assignment
2. A report on agricultural and weather risk assessment in Bangladesh
3. A database of information collected during this assignment
4. An interactive portfolio risk model (for crops and livestock)
5. A report on the technical and operational review of current agriculture insurance practices and a detailed discussion of challenges and potential solutions
6. A report on public-private partnerships in agriculture insurance in Bangladesh
7. A report on prototype agricultural risk insurance (for both crop and livestock on selected regions) products that can be piloted in a next phase
It is noted that the outputs of this consultancy are dependent on the availability and quality of data.
All outputs are required in English and to be prepared using standard PC-compatible software.
The consultants will be expected to bring their own laptop computer while on mission in Bangladesh.
TIMETABLE
The World Bank report needs to be published by May 2009. Therefore, most of the consultants’ inputs are expected to be received by March 2009.
A&R_Risk_Annex_5.indd 76 28/10/11 12:02 PM

ANNEX 5A — BANGLADESH: DATA AND INFORMATION TO BE COLLECTED 77
AGRICULTURE AND RURAL DEVELOPMENT DISCUSSION PAPER
Annex 5A: BANGLADESH: DATA AND INFORMATIONTO BE COLLECTED
The local consultant will collect data as available, according to the list to be provided by the international consultant–World Bank team. The sample data requirement includes but is not limited to the following:
1. Geographic and land use regions
Identify the broad classification of geographic and agricultural land-use regions, such as Mountains/Hills (X percent of area), lowland plains (X percent of area), and so on. Find out the following key information for each region:
• Climatic data for key representative stations, including mean monthly rainfall; mean, maximum, and minimum monthly temperatures; frost-free days, and so on
• Rural household data: Number of crop and live-stock households per region, average farm size, and so on
• Cropping calendar for each region, including plant-ing dates and harvest dates for each season and major crop type
• Crop production data 2007: Key crops, planted area and average yields, irrigated versus rain-fed agriculture
• Summary of livestock numbers by class of animal 2007 or latest census by region
2. Agricultural cropping
It is important to access crop production statistics for the major regions listed above as well as data at the district level or even down to the individual subdis-trict. Check at what level data are available. For each district, the following data would be needed:
• Number of arable farm households per district• Total arable area: irrigated area and rain-fed area,
2007 or latest year
• Total cropped area per district per season (rabi and kharif) and by crop for latest year available (2007?)
• For the most important crops, district-level time-series crop production and yields ideally for the
past 15 to 20 years—the data to include sown area, harvested area (whichever available), produc-tion, and average yield
• Gross margin costs of production and return data for key crops in each of the regions
Which organizations are responsible for measur-ing and estimating crop sown area, production, and yields? What methods are used for estimating aver-age yields in each district or subdistrict?
3. Crop risk assessment and production loss data
Find out whether the Ministry of Agriculture, Department of Agricultural Extension, or any other agency record crop damage or loss data on an an-nual basis for major events in each department by crop and by cause of loss. Is such data available for the past 15 to 20 years? This data is very useful to assess risks to crop production in each region or department.
4. Livestock
Assuming livestock statistics are recorded at district level:
• Number of households owning livestock by class of animal: cattle, buffalo, sheep and goats, pigs, horses, mules, poultry, and so on, in 2007 or latest census year
• Total numbers of livestock by class per district for most recent year 2007
• Average market values for livestock by class, 2007
• Trends in livestock ownership over time
5. Livestock mortality statistics
It is hoped that the Ministry of Fisheries and Livestock or any other government ministry or agency records mortality data in livestock by type of animal and by cause of loss in each department. If so, please access for as many years as possible.
6. Meteorological service data availability
• Which public and private organizations are responsible for recording meteorological data in
A&R_Risk_Annex_5A.indd 77 28/10/11 12:01 PM

ANNEX 5A — BANGLADESH: DATA AND INFORMATION TO BE COLLECTED78
WEATHER INDEX INSURANCE FOR AGRICULTURE
Bangladesh? One is Bangladesh Meteorological Department (BMD). What are others?
• Density of and location of meteorological stations in Bangladesh (automatic and manual stations, of-ficial WMO stations, and other stations)
• For each station, how long a time series exists of daily rainfall data and daily average, maximum, and minimum temperatures? (Note we do not need to access this data at this stage.)
• Are daily meteorological data records saved in electronic format?
• What is the protocol in Bangladesh for the World Bank to access daily meteorological data (that is, area costs involved)?
• For selected representative stations in the main cropping regions, can we access annual and monthly rainfall and temperature data for the past 20 to 30 years?
7. Data and information to be collected for any other possible areas of agriculture sector and agricul-tural insurance that are identified critical during this assignment.
8. Support and work very closely with the financial sector expert in collecting and analyzing the following data:
a. Insurance market
It is hoped that general information on the insurance market can be obtained through the Department of Insurance or the Insurance Association. An overview of the key players and degree of insurance market development is needed.
• AnoverviewofInsuranceRegulatoryauthority(ies)? Governing ministry? What is the reporting arrangement?
• AnoverviewofinsurancecompaniesinBangladesh—public and private, life and gen-eral classes
• Insurancestatistics—marketpenetrationformajor classes and premium volumes
• Reinsurancearrangementsandkeylocaland international players and reinsurance regulations
• Doesagriculturalinsurancelegislationexist?If so obtain copy of any law governing the agricultural insurance.
• Anoverviewofinsuranceproductsand regulatory framework in microfinance sector
b. Agricultural crop and livestock insurance in Bangladesh
It is essential that the team understands that there is no crop insurance in practice in Bangladesh. Livestock insurance:
• Hasbeenimplementedsince1980bythestate-owned insurance company Sadharan Bima Corporation (SBC). An overview of this program, with current status, is necessary.
Key data to be collected from Ministry of Livestock & Fisheries, SBC, and relevant research organizations:
• Nationallivestockdevelopmentpolicywording
• SBClivestockinsuranceprogramwording(including all modifications)
• Termsandconditionsforinsurance—tagging,health inspections, certificates, and so on
• Deliverychannels—bankbranchoffices
• Insuredclassesandsumsinsuredperanimal
• Premiumratesforeachclassanimal
• Livestockresultsforasmanyyearsaspossible(for example, number of policies, number of livestock by class, premiums, sums insured, claims and loss ratio)
• Whobenefitsfromlivestockinsurance—typesof producer?
• Whatpercentageoflivestockproducersby class of animal have access to livestock insurance?
• Organizationsresponsibleforlossassessment(veterinary service)
• Operationalsystems,procedures,and administrative costs
• Reinsurancearrangements
Overview of the self-insurance scheme of Milk Vita and The Community Livestock and Dairy DevelopmentProjectfortheircooperative members and farmer groups and associations
• Government(orprivate-sector)initiativefordevelopment of livestock insurance
• Issuesandoptionsandfuturedirectionsforlivestock insurance in Bangladesh
c. Rural services: Banking and microfinance, input suppliers, output marketing, farmer organizations
An overview is needed of the organization of small-scale Bangladeshi crop and livestock
A&R_Risk_Annex_5A.indd 78 28/10/11 12:01 PM

ANNEX 5A — BANGLADESH: DATA AND INFORMATION TO BE COLLECTED 79
AGRICULTURE AND RURAL DEVELOPMENT DISCUSSION PAPER
producers into cooperatives or associations or microfinance groups with a view to examining options for the future delivery of agricultural insur-ance on a group basis.
Equally we need to obtain an overview (listing by organization) in each region of the range of credit and input service organizations available to farm-ers. Analytically evaluate the current structure and operation of the credit and input service organiza-tions for determining if the same can again be used to channel and administer crop and livestock insurance.
For rural banks and microfinance organizations data on the following is required:
• Typesofcredit
• Lendingtermstocropproducersandlivestockowners
• Volumeoflending(numberofbeneficiaries)
• Repaymentratesandcausesofdelayedrepay-ment or default
Details of agricultural crop and livestock extension services?
d. Government support to agriculture
Does government pay any premium subsidy for livestock insurance? In past, did government pay any premium subsidy for crop insurance? If so:
• Whichgovernmentdepartmentprovidesorused to provide premium subsidies, and annual costs of premium subsidies?
• Otherformsofgovernmentsupporttolive-stock or crop insurance (for example, subsidies on administration costs, or excess claims compensation)?
• Government disaster relief program:
Organization(s) responsible for implementing
Events for which compensation is paid
Criteria for assessing losses and compensa-tion levels
Compensation payments past 10 years
• Inputpricesubsidies:Ifso,details
• Outputpricesupport—minimumprices:Ifso,details
• Otherformsofgovernmentsupporttocropand livestock producers (for example, taxation policy)
e. Demand for crop, livestock, and other agricultural insurance
Are there any studies that exist in Bangladesh on the potential demand by farmers for crop, livestock, fisheries, or any other agricultural risk insurance? If not, then the consultant, with support from the team, will have to try to assess this at an early stage of assignment by talking to key producer representatives or organizations.
The consultant needs to meet other key stake-holders who are keen to promote crop, livestock, and any other agricultural insurance including government departments, banking or microfinance sector, development organizations, and so on to define their objectives for insurance and target farm sectors in Bangladesh and to consider the product design options available—for crops, tra-ditional and index covers; for livestock, individual animal versus group animal insurance; and so on
f. Commentary on the viability of developing agricultural risk insurance market
Critically evaluate and comment on the crop or livestock loss data over the years. The comments should include the potential impact on the farmers for not having a vibrant agricultural risk insurance market in Bangladesh. Also need to highlight, in line with the data, collected the advantages of developing such a market.
A&R_Risk_Annex_5A.indd 79 28/10/11 12:01 PM

A&R_Risk_Annex_5A.indd 80 28/10/11 12:01 PM

ANNEX 6 — INDEX INSURANCE CONTRACT DESIGN 81
AGRICULTURE AND RURAL DEVELOPMENT DISCUSSION PAPER
Annex 6: INDEX INSURANCE CONTRACT DESIGN
FEASIBILITY
Having successfully completed the prefeasibility stage and made the decision to progress with a WII approach, the next step is to create a product that can be used to manage weather risk. The design process aims to create a contract based on a weather index that will sufficiently quantify the fiscal impact of the weather risk on clients and adequately provide compensation for those risks. Creating an index that serves as an accurate proxy for loss is the first step in the process, followed by defining the contract parameters based on that index (for example, insured amount, risk retention levels, and the triggers per phase for the insurance contract).
SELECTING AN INDEX
In order to design a contract, it is critical to have an index that accurately reflects losses. There is no one single way to design an index, and indices can vary significantly. An ap-propriate index for a client will predict loss events and their magnitude with a sufficient level of accuracy. In some cases simple indices such as the amount of total cumulative rainfall in a season will be appropriate, while in other cases much more complicated indices such as dynamic crop models will be appropriate. In all cases once a robust index that accu-rately captures the losses faced by clients is determined, one can go on to design and structure an appropriate index-based weather insurance contract or simply analyze the weather exposure of a client, thereby guiding investment decisions, business plans, and actions for various entities exposed to weather risk.
Many considerations go into selecting an appropriate index depending on what the index will be used for and its target audience. Ultimately the index selected must:
� Identify the critical weather risks at various stages of the crop cycle
� Quantify the value of exposure to weather risks at different phases during cycle
� Provide information for assigning weights to given weather risks
� Quantify the farmer’s weather exposure per unit of the defined index
� Quantify the yield volume lost per unit index
In order to achieve this, the experts are seeking answers to the following questions:
� What weather risks are critical in causing yield variability?
� Which are the critical periods for the crop in terms of weather risks?
� Is there sufficient scientific research on the crop cycle and resilience of the crop to weather risks to be able to design an index that can proxy with sufficient accuracy?
� What is the right weight to assign to critical and noncritical phases for the index?
� What are the exposed values at various phases of the crop cycle?
� Does the proposed index capture the risk in question?
One particular feature of creating an index for index insur-ance in agriculture, unlike other insurances, is that there is an additional need to understand how a crop behaves in re-sponse to changes in weather variables at different stages of plant development. A plant will react differently to weather stress depending on what stage of growth it has reached. Therefore in many cases it is important that the contract designed quantify potential losses or reductions in yields at various phases of the crop cycle. Assistance of a crop expert or agronomist who knows the phenology of the identified crop can be very helpful in the design and selection of an appropriate index.
Figure A6.1 and figure A6.2 provide two examples of how crop phenology can be used in determining the critical growth periods of a crop and the effects of adverse weather during these periods. This information is also useful for esti-mating the increasing accumulated production costs where the insured amount is defined in terms of production costs.
A&R_Risk_Annex_6.indd 81 28/10/11 12:16 PM

ANNEX 6 — INDEX INSURANCE CONTRACT DESIGN82
WEATHER INDEX INSURANCE FOR AGRICULTURE
FIGURE A6.2: Example of Maize Farmer Cropping Calendar
Emer-gence
Establishment (0) Vegetative (1)
25−40 days15−25 days
Planting April
Tassel Silk
Flowering (2)
15−20 days35−45 days
YieldFormation
10−15 days
Ripening
April−May Vegetative Growth June−July Tasseling & Cob Formation August−September Ripening
October−November Harvest
Maize yields are particularly sensitive torainfall during the tasseling stage and the yield
formation stage; rainfall during the latterphase determines the size of the maize grain.
Sowing andestablishment
period is also criticalto crop survival.
TasselSilk
(3) (4)
FIGURE A6.1: Example of Rice Crop Cycles
June July Aug Sep Oct Nov Dec
1 2 3 4 1 2 3 4 1 2 3 4 1 2 3 4 1 2 3 4 1 2 3 4 1 2 3 4Rice crop cycle 1 Seeding Tillering Booting Flowering Grain Filling Harvest
Rice crop cycle 2 Seeding Tillering Booting Flowering Grain Filling Harvest
Rice crop cycle 3 Seeding Tillering Booting Flowering Grain Filling Harvest
Rice crop cycle 4 Seeding Tillering Booting Flowering Grain Filling Harvest
21 days 5 days 49–70 days 14 days 14 days 21 days depends on available machines and labors
Average rice growth stage Seeding Transplant Tillering Growing Booting Flowering Grain Filling Harvest
Average rice height (cm) 0–25 25–50 50–70 50–70 70–110 110–160 160 160
Critical water depth (cm) 25 25 40 70 20 160 160 160
Critical flooding time (days) > 3 > 3 > 4 > 4 > 4 > 4 > 4
Source: ASDECON 2008.
Transp
lant
Source: FAO.
A&R_Risk_Annex_6.indd 82 28/10/11 12:16 PM

ANNEX 6 — INDEX INSURANCE CONTRACT DESIGN 83
AGRICULTURE AND RURAL DEVELOPMENT DISCUSSION PAPER
Figure A6.1 is an example of rice crop cycles from seeding in June until harvest in December in a rice-producing district in Thailand. Figure A6.2 shows a maize crop cycle from plant-ing in April until harvest in November, with the identification of critical periods of rainfall at various phases in a particular location.
APPROACHES TO INDEX SELECTION
Different approaches and information sources can be used to select an appropriate index. The three primary sources of information that can be used to assess the underlying rela-tionship between weather data and production risk are as follows:
Historical Yield Data
A common approach to selecting and verifying the appropri-ateness of a given index is to analyze historical yield data. Historic district-level yield data is usually available from a government agency but possibly from local agricultural re-search institutions. In addition, individual farmers or groups of farmers, such as cooperatives and agribusinesses that
have been involved in producing a crop, will also keep re-cords of historical yields by season and production region. While historical yield data is the most obvious source of data to assist in defining an index, this data can often be noisy depending on the consistency of record keeping, the length of historical data sets, and the level of resolution at which the data is kept.
An example of how an index could be tested against histori-cal yield data is shown in figure A6.3.
As can be seen, the index in this situation does appear to provide a relatively close correlation between the index and the actual yields. Only in one year (1998) was there a notable departure in yields. If the correlations are not very strong, then the first option may be to revisit the proposed weightings in the index to assess whether they need to be adjusted. While this may increase the correlation, care needs to be taken to avoid a phenomenon known as “overfitting.” This is where an index is weighted in a certain way and variables are then constructed to ensure a high level of correlation.
FIGURE A6.3: Illustration of Index Versus Historical Yields
Actual Yield (Q/Hct)
0
20
40
60
80
100
120
140
160200520042003200220012000199919981997199619951994
0
5
10
15
20
25
30Alaba Wereda Maize Yields vs. Farmer’s Maize Rainfall Index
year
mai
ze y
ield
(Q
/Hct
)
ind
ex o
f d
efic
it r
ain
fall
(mm
)
Weighted Index
Source: Authors.
A&R_Risk_Annex_6.indd 83 28/10/11 12:16 PM

ANNEX 6 — INDEX INSURANCE CONTRACT DESIGN84
WEATHER INDEX INSURANCE FOR AGRICULTURE
Farmer and Local Expert Interviews
A second approach to selecting a weather index is to uti-lize farmer or local expert recollections of difficult years. It is particularly valuable if these actors can recall the growing seasons when the crop faced particular difficulties in a cer-tain year due to weather or some other risk. Such interviews can also be very useful for verifying other sources of data, such as historical yield data, and understanding the under-lying causes for and ramifications of the variations in such composite data sources. As with the historic yields data, this information is likely to be noisy, and it can be difficult to discern the impact of specific events. However, it also pro-vides important information that could distinguish a robustly performing index from one that is inappropriately designed. In some cases, this may be the only information one may have to identify an appropriate index.
Crop Model Output
A third approach to verifying a weather index is to compare the index against the output of a crop model that has been run to generate synthetic yield information based on varying weather inputs. In addition, crop models, in many cases, can be used as the underlying index. Crop models can be simple water-balanced crop models, such as WRSI or AquaCrop, for deficit rainfall risk introduced in the last module, or more sophisticated process-based crop models can also be used to generate synthetic yield information and check whether an index works well. The key benefit of crop models is that weather data is the only varying input; therefore, variations in their output are only driven by weather fluctuations and not other sources of production risk.
The final decision as to the acceptability of an index will obvi-ously lie with the task manager or promoter of the WII initia-tive. While the experts will be hired to provide their input, they will not be taking responsibility for the final product. This is a challenging situation, as most task managers will not have sufficient technical knowledge to enable them to assess the accuracy of the index. However, for assessment of the index’s performance in terms of assessing yield it is important to test the degree to which they match or correlate with the risk that the clients face and demonstrate how ef-ficient the index is at providing a proxy for yield. Ideally, a cross-check against several sources of information to select an index is important as each has an information source that will have its own limitations and unique characteristics.
QUANTIFYING THE FINANCIAL IMPACT
While an index can provide information on yield deviations, for the purposes of insurance these changes in yield need to
be quantified in terms of financial loses. This can be done, for example, by considering a producer’s production and in-put costs per hectare planted or by considering his expected revenue from the sale of the crop at harvest. By running a regression analysis against historical or simulated production data or simply by looking at historical financial worst and best years, available information can be used to establish the rela-tionship between different values of a weather index and the financial loss or gain a farmer can expect.
Once the index has been identified, it must be calibrated to capture the financial impact of the specified weather ex-posure as measured by the index. In order to do this, the variation in crop yield predicted by the index must be con-verted into a financial equivalent that mirrors the producer’s exposure. Once a weather index has been developed, it is relatively straightforward to use financial information to cal-culate the financial impact of this weather risk for producers.
Three approaches can be used:
� Identifying the financial exposure per unit of the defined index
� Identifying the financial exposure to a specific weather event
� Establishing the limit (in the case of calibrating an index for an index-based insurance contract) or the total financial protection required per risk period. In this approach, a limit is set on the maximum payout necessary in a worst-case scenario. Then the payout per unit of the defined index is assessed by working back from this limit.
The approach that is chosen depends on the nature of the underlying index and the weather event. The first two ap-proaches are best when using an index to perform a risk analysis. The third approach is most often used. This ap-proach requires identifying the maximum protection required per risk period and then using that to inform the financial exposure per unit index for the contract that has been de-signed. Most often, the value that is insured by the farmer in index-based weather insurance programs is typically the value of the farmer’s initial inputs or the credit he has taken out to secure these inputs and not necessarily the full value of the expected production (revenue) that is insured.
STRUCTURING THE CONTRACT
Once an index has been designed that appropriately proxies potential losses due to weather risk, this index must then be used to structure a contract. A wide range of contracts
A&R_Risk_Annex_6.indd 84 28/10/11 12:16 PM

ANNEX 6 — INDEX INSURANCE CONTRACT DESIGN 85
AGRICULTURE AND RURAL DEVELOPMENT DISCUSSION PAPER
can be designed based on that index. The contract selected must perform an insurance function for the buyer (that is, the index must capture the risk in question and perform well from an agro-meteorological point of view), thereby satisfy-ing both client and regulatory requirements. The specific details, values, and combinations of these features (and the resulting contract) depend on the risk profile and demands of the clients, and the context in which the insurance contract is being introduced to manage weather risk.
All index-based risk management solutions that offer client protection in exchange for a premium share key features and characteristics:
1. The index: The complete specification of the index and data used to construct it, which has already been discussed.
2. The protection period: The risk protection period of the contract, including the start and end date of the contract. This is the “length” of coverage.
3. The trigger level(s): The attachment level (or strike) at which the weather protection begins and financial compensation is received.
4. The payout rate: The financial compensation per unit index deviation above or below the trigger(s). Also known commonly as a “tick.”
5. The maximum payout: The maximum payout of the index insurance contract in each risk protection period.
Different clients will require different payout rates, maximum payouts, and trigger levels. It is, however, the trigger level that has the most influence on the premium rate for a con-tract since the trigger level identifies how much risk the client will retain and how much they want to insure. By controlling the frequency of payments and a client’s risk retention level, which are key statistical properties of the contract payouts, the trigger level or levels largely determine the premium for the insurance provided (figure A6.4).
Once contract design is finished, this contract should again be checked against available information to determine if it accurately captures potential losses. Similar to the way in which the underlying index was checked, the contract it-self can be checked by looking to see if historical payouts from the contract correlate with loss years as indicated by
Maximum payout
Financial payoutincrementper mm
pay
ou
t (u
nit
per
ha)
deficit rainfall index (mm)
00
1000
2000
3000
4000
5000
6000
7000
8000
9000
10 20 30 40 50 60 70
Trigger rainfall level
Long-term averagerainfall
Source: Authors.
FIGURE A6.4: Contract Parameters in an Indexed Contract
A&R_Risk_Annex_6.indd 85 28/10/11 12:16 PM

ANNEX 6 — INDEX INSURANCE CONTRACT DESIGN86
WEATHER INDEX INSURANCE FOR AGRICULTURE
historical yield data, farmer information, and crop model outputs. Some critical questions to ask about the contract include the following:
� Does the contract capture local conditions and crop specific agro-meteorological risk?
� Does the contract adequately cover the major identi-fied risks?
� Is the risk retention fixed in the contract acceptable to farmers?
� How often and how much the prototype contract will be paying out?
� Do various levels of payouts respond to farmers preferences?
� Cost-benefit of such a contract versus other alterna-tives to manage risks (for example, irrigation)?
� Will farmers be paying too much premium for too little coverage?
� Does the prototype contract meet the project stated objective?
A&R_Risk_Annex_6.indd 86 28/10/11 12:16 PM

ANNEX 7 — WATER REQUIREMENT SATISFACTION INDEX (WRSI) 87
AGRICULTURE AND RURAL DEVELOPMENT DISCUSSION PAPER
Annex 7: WATER REQUIREMENT SATISFACTIONINDEX (WRSI)
BACKGROUND
Studies by the FAO have shown that WRSI can be related to crop yield deviations, and these water-balance crop growth models have been extensively tested in many climates. Indeed the WRSI model was initially developed for use with weather station data to monitor the supply and demand of water for a rain-fed crop during the growing season.
WRSI is expressed as a percentage and is defined as the ratio of seasonal actual evapotranspiration experienced by a crop to the crop’s seasonal water requirement; hence it monitors water deficits throughout the growing season, tak-ing into account the phenological stages of a crop’s evolution and the periods when water is most critical to growth. A de-scription of this agro-meteorological modeling and forecast-ing approach used by FAO in national food security systems can be found at the FAO website.
The model is also currently used by the Famine Early Warning Network (FEWS-NET) to monitor agricultural areas around the world for signs of drought on a near-real-time, spatial, and continuous basis using a combination of satellite-derivative rainfall estimates and rain station data to compute WRSI values. There are many more robust and data-inten-sive physically based crop models available, but FEWS-NET adapted the FAO WRSI model for implementation in 2002 because of its limited data requirements and simplicity in op-erational use. These models also form the backbone of most crop production early warning systems run by government agencies in nonhumid tropics, particularly in Africa.
TECHNICAL DETAIL
The WRSI measures crop performance based on the bal-ance between water supply and demand during the growing season. Usually, the computation of the water balance is updated on a dekadal basis.26 During each dekad, the WRSI
26 A “dekad” is a conventional way of dividing a month in three intervals. The first two dekads of each month go, respectively, from the first to the tenth day and from the eleventh to the
is computed as the ratio between evapotranspiration27 and the water requirement of the crop.
If “actual evapotranspiration”—a function of water avail-ability in the soil—is identified as AET and the “water requirement”—a function of atmospheric conditions and plant growth phases—as WR, WRSI is determined by the following relationship:
WRSI(i) = 100 * AET(i) / WR(i)
The underlying conceptual scheme is that of a bucket that is replenished by rainfall and depleted by evapotranspiration. A critical step in the computation of WRSI is in the update of the soil water content. If during a given dekad the sum of soil water content plus the cumulated rainfall is less than the plant water requirement, then a water deficit is recorded. In more specific terms, if AET is less than the WR deter-mined by atmospheric conditions and by the plant’s growing phase, the plant suffers a determined level of water stress. Conversely, if the sum of soil water content plus the cumu-lated rainfall exceeds the plant water requirement there is no water deficit.
The WR can be calculated by adjusting “potential evapo-transpiration” (PET) to the condition of a specific plant in a given growing phase.
PET (also known as “ETo” in FAO terminology) can be de-fined as the evapotranspiration rate from a reference surface (a hypothetical grass reference crop with specific character-istics), not short of water,28 and is a function of local weather
twentieth day of the month in object, while the third dekad goes from the twenty-first to the last day of each month. Hence, the third dekad may be composed of more or less than 10 days. Dekadal rainfall is the sum of rainfall measured in each dekad.
27 FAO documentation defines evapotranspiration as the combina-tion of two separate processes whereby water is lost from the soil surface by evaporation and from the crop by transpiration (http://www.fao.org/docrep/x0490E/x0490e04.htm).
28 http://www.fao.org/docrep/X0490E/x0490e04.htm#reference %20crop%20evapotranspiration%20.
A TECHNICAL NOTE
A&R_Risk_Annex_7.indd 87 28/10/11 12:17 PM

ANNEX 7 — WATER REQUIREMENT SATISFACTION INDEX (WRSI)88
WEATHER INDEX INSURANCE FOR AGRICULTURE
parameters, such as solar radiation, air temperature, wind speed, and humidity. As PET depends mainly on solar radia-tion, which is fundamentally an astronomical parameter, cli-matological tables for this parameter are usually considered as representative of the actual value.
Using PET values, the WR of a specific plant in a particular growing phase can be computed as follows:
WR(i) = PET(i) * Kc(i),
where i indicates the dekad, PET the potential evapotranspi-ration during the considered period, and Kc a crop coefficient, dependent not only on the crop in object but also on the par-ticular growing phase the crop is in.29
The WRSI calculation also requires start-of-season (SOS) and end-of-season (EOS) times and hence the length of growing period (LGP) for each crop considered and a potential sowing window for a crop. The LPG for the particular variety of crop should be verified by local agro-meteorological experts. The SOS dekad is the dekad when the crop is planted. This can be the actual dekad in which the crop is usually planted in the area if known or, if in an area where the planting depends on the start of the rainfall season, an objective method must be defined to identify the timing of a farmer’s sowing decision if it is not fixed every year.
In Malawi, for example, assuming a farmer will sow his crop once the rainy season begins, usually in November, and when there is enough moisture in the soil to plant his crop and secure good probability of seed germination. According to agro-meteorological experts at the Malawi Meteorological Office, successful sowing is usually associated with the first occurrence of 25 to 30 mm of rainfall within a 10-day period, anytime from the middle of November to the middle of the following January. This definition has been used in Malawi to trigger the start of index-based weather insurance contracts for groundnut and maize farmers.
WRSI can then be related to crop production or yield esti-mate by using the following linear yield-reduction function:
Actual Yield = 1 – ( 1 – WRSI ) * Seasonal Ky
* Maximum Potential Yield
29 Kc crop values are available in table 12 of the FAO Irrigation and Drainage paper no. 56 (http://www.fao.org/docrep/X0490E/X0490E00.htm).
However, FAO also encourages users to establish their own Ky30 through linear regression of WRSI against their own local yield data. The beauty of using a model such as the WRSI is that as it only uses rainfall as a variable input pa-rameter, it is the only nonconstant parameter in the system. Therefore when looking over several rainfall seasons, by us-ing historical rainfall data from the weather station, one can observe the impact due to rainfall deficit and deviation only on a crop’s yield from year to year. In other words the model does not capture other aspects that can impact yield levels, such as management practices, technological changes, and pest attacks. These other risks are captured in the historical yield data, and because of this, using historical yield data can lead to misleading results when one is trying to quantify the risk and impact of only rainfall on a crop’s performance. By considering the variations in WRSI from the long-term aver-age, from the previous year or some other baseline, one can quantify the relative difference in yield from that baseline due to the impact of rainfall alone. It is this quality that we can exploit to inform the design of weather insurance contracts.
REFERENCES
FAO. 1998. Crop Evapotranspiration: Guidelines for Computing Crop Water Requirements. Irrigation and Drainage Paper No. 56. Rome.
FAO. 1986. Yield Response to Water. Irrigation and Drainage Paper No. 33. Rome.
Frere, M. & Popov, G. 1986. Early Agrometeorological Crop Yield Assessment. Production and Protection Paper No. 73. Rome, FAO.
Senay, G. & Verdin, J. 2003. Characterization of Yield Reduction in Ethiopia using a GIS-Based Crop Water Balance Model. In Remote Sensing, 29(6): 687–692.
Verdin, J. & Klaver, R. 2002. Grid cell based crop water accounting for the famine early warning system. In Hydrological Processes, 16: 1617–1630.
Many of these reports can be found online. AgroMetShell is free software that can be downloaded to run WRSI water balance calculations. Some of the information can be found online; other pieces of information (such as water holding capacity of the soil) need to be collected from local experts, such as local agricultural research stations, Ministry of Agriculture, local universities, or the agro-meteorology division on the National Meteorological Services Department.
30 Seasonal yield-response factors (Ky) for each crop to convert WRSI values to yield estimates (Source: FAO, confirmed by lo-cal agro-meteorological experts).
A&R_Risk_Annex_7.indd 88 28/10/11 12:17 PM

ANNEX 8 — EXAMPLE OF INFORMATION TO INSURED FARMERS 89
AGRICULTURE AND RURAL DEVELOPMENT DISCUSSION PAPER
Annex 8: EXAMPLE OF INFORMATION TOINSURED FARMERS
WEATHER INSURANCE
The weather is unreliable. It impacts agricultural production in many ways. Poor yields and crop damage due to adverse weather can lead to lower revenues and difficulty in paying back loans and meeting household expenses. Weather in-surance is a new way that farmers, banks, and sponsors in Malawi can minimize the financial impact of bad weather.
WHAT IS WEATHER INSURANCE?
� It is a new type of insurance that covers crop production losses caused by excessive and deficit rainfall.
� It is not based on changes in a yield on a farmer’s field, but rather measures changes of rainfall amounts received at his nearest weather station.
� It does not cover losses related to pests, flood, localized storms, hail, temperature, or poor farm management.
HOW DOES THE PRODUCT WORK?
� The insurance is sold as part of a loan package, and payouts from the insurance automatically contribute to paying off the loan.
� Rainfall is measured throughout the season at the farmer’s nearest weather station.
� The coverage starts when the rainfall received is adequate for transplanting and ends when the crop is ready for harvesting.
� If the rainfall is deficit or excessive for healthy crop growth during any part of the growing period, the
farmer will receive an insurance payout that will be offset against his outstanding loan amount.
� The insurance payout amount is calculated using a formula that is specified in the insurance contract and made automatically if rainfall amounts are above or below given levels.
� The more extreme the rainfall compared to historical averages, the larger the payout and more of the loan is paid down.
� To get the product, you must pay a premium to the insurance company.
• Premiums are included as part of the loan package.
• Premiums are not refundable if there is no payout.
• No matter what happens you must always repay your loan fully.
WHY SHOULD YOU CONSIDER BUYING WEATHER INSURANCE?
� All farmers know that rainfall is unpredictable, which creates risk for farmers, their sponsors, agribusiness-es, and banks.
� If it does not rain or there is too much rain, yields can drop, resulting in losses to your income and making it difficult to repay your loans.
� Weather insurance is a new insurance product de-signed to help you repay your loans in times of rainfall stress and access credit again the next year.
If you are interested in weather insurance and want to know more contact:
YOUR LOCAL REPRESENTATIVE
CASE OF MALAWI
A&R_Risk_Annex_8.indd 89 28/10/11 12:17 PM

A&R_Risk_Annex_8.indd 90 28/10/11 12:17 PM

ANNEX 9 — MONITORING THE PERFORMANCE OF AN INDEX INSURANCE CONTRACT 91
AGRICULTURE AND RURAL DEVELOPMENT DISCUSSION PAPER
Annex 9: MONITORING THE PERFORMANCE OF ANINDEX INSURANCE CONTRACT
Crop: Hypothetical Crop
Location: Kasungu Weather Station
Transplanting Window: 15 November–20 December 2008 (inclusive)
Coverage Period: 17 weeks (119 days) from and including transplanting date
Maximum Payout: 231,000 MKW per hectare
Premium: 12,239 MKW per hectare
HOW DO I CALCULATE THE TRANSPLANTING DATE?
� For every day in the transplanting window, accumu-late the total daily rainfall received on that day and the previous two days to calculate the total rainfall received in that three-day block.
� The transplanting date is defined as the last day of the first three-day block within the transplanting window to receive greater than or equal to 35 mm of cumulative rainfall.
� If none of the blocks has cumulative rainfall total greater or equal to 35 mm, the transplanting date becomes the last day of the three-day block with the highest cumulative rainfall total.
� If there is no rainfall during the transplanting window, the transplanting date is 20 December 2008.
HOW DO I CALCULATE THE DEFICIT RAINFALL PAYOUT?
� Use the calculation table provided to write down the answers to each step below.
� From and including the transplanting date, accumulate the total rainfall received within each week (seven-day block) for 17 consecutive weeks.
� Calculate the average rainfall received within each pair of consecutive weeks, so that there are 16 values of two-week average rainfall completed in the calculation table.
� For each average value write the following result in the deficit rainfall column:
• If the value is greater than or equal to 25 mm, the result is 0 mm.
• If the value is less than 25 mm, the result is equal to the difference between 25 mm and the average value, multiplied by the appropriate weighting factor given in the table.
� Sum these results over all 16 two-week average rainfall values to calculate the total deficit rainfall.
� If this value is less than or equal to 85 mm, no payout is due.
� If this value is greater than 85 mm, a payout equal to the difference between 85 mm and the total deficit rainfall value multiplied by 357 MKW is due to the farmer.
HOW DO I CALCULATE THE EXCESS RAINFALL PAYOUT?
� For each average value write the following result in the excess rainfall column:
• If the value is less than or equal to 80 mm, the result is 0 mm.
• If the value is greater than 80 mm, the result is equal to the difference between 80 mm and the av-erage value, multiplied by the appropriate weighting factor given in the table.
� Sum these results over all 16 two-week average rainfall values to calculate the total excess rainfall.
� If this value is less than or equal to 110 mm, no payout is due.
� If this value is greater than 110 mm, a payout equal to the difference between 110 mm and the total excess rainfall value multiplied by dollars, but amounts would appear too inflated.
HOW DO I CALCULATE THE TOTAL PAYOUT DUE?
� The total payout due to the farmer is the sum of the deficit rainfall payout and the excess rainfall payout up to the maximum payout.
ILLUSTRATION OF A WEATHER INSURANCE PAYOUT CALCULATION IN MALAWI
A&R_Risk_Annex_9.indd 91 28/10/11 12:18 PM

ANNEX 9 — MONITORING THE PERFORMANCE OF AN INDEX INSURANCE CONTRACT92
WEATHER INDEX INSURANCE FOR AGRICULTURE
WEATHER INSURANCE PAYOUT CALCULATION TABLES
Rainfall data will be given to you by your bank or sponsor
TABLE A9.1: To Help you Find the Transplanting Date
3-DAY BLOCK DATESCUMULATIVE RAINFALL
TRANSPLANTING DATE 3-DAY BLOCK DATES
CUMULATIVE RAINFALL
TRANSPLANTING DATE
1 13 Nov–15 Nov 15-Nov 19 1 Dec–3 Dec 03-Dec
2 14 Nov–16 Nov 16-Nov 20 2 Dec–4 Dec 04-Dec
3 15 Nov–17 Nov 17-Nov 21 3 Dec–5 Dec 05-Dec
4 16 Nov–18 Nov 18-Nov 22 4 Dec–6 Dec 06-Dec
5 17 Nov–19 Nov 19-Nov 23 5 Dec–7 Dec 07-Dec
6 18 Nov–20 Nov 20-Nov 24 6 Dec–8 Dec 08-Dec
7 19 Nov–21 Nov 21-Nov 25 7 Dec–9 Dec 09-Dec
8 20 Nov–22 Nov 22-Nov 26 8 Dec–10 Dec 10-Dec
9 21 Nov–23 Nov 23-Nov 27 9 Dec–11 Dec 11-Dec
10 22 Nov–24 Nov 24-Nov 28 10 Dec–12 Dec 12-Dec
11 23 Nov–25 Nov 25-Nov 29 11 Dec–13 Dec 13-Dec
12 24 Nov–26 Nov 26-Nov 30 12 Dec–14 Dec 14-Dec
13 25 Nov–27 Nov 27-Nov 31 13 Dec–15 Dec 15-Dec
14 26 Nov–28 Nov 28-Nov 32 14 Dec–16 Dec 16-Dec
15 27 Nov–29 Nov 29-Nov 33 15 Dec–17 Dec 17-Dec
16 28 Nov–30 Nov 30-Nov 34 16 Dec–18 Dec 18-Dec
17 29 Nov–1 Dec 01-Dec 35 17 Dec–19 Dec 19-Dec
18 30 Nov–2 Dec 02-Dec 36 18 Dec–20 Dec 20-Dec
If none of the blocks has cumulative rainfall total greater or equal to 35 mm, the transplanting date becomes the last day of the three-day block with the highest cumulative rainfall total. If there is no rainfall during the transplanting window, the transplanting date is 20 December.
The transplanting date is defined as the last day of the first 3-day block to receive greater than or equal to 35 mm of cumulative rainfall.
Source: Authors.
A&R_Risk_Annex_9.indd 92 28/10/11 12:18 PM

ANNEX 9 — MONITORING THE PERFORMANCE OF AN INDEX INSURANCE CONTRACT 93
AGRICULTURE AND RURAL DEVELOPMENT DISCUSSION PAPER
TABLE A9.2: To Help You Calculate the Total Payout Due (Fill-in Shaded Cells)
DAYS FROM TRANSPLANTING DATE
WEEKLY CUMULATIVE DAILY RAINFALL TOTAL
TWO-WEEK AVERAGE
DEFICIT RAINFALL (< 25 mm) EXCESS RAINFALL (> 80 mm)
WEIGHT FACTOR RESULT
WEIGHT FACTOR RESULT
Week 1: Days 0 to 6
1 1
Week 2: Days 7 to 13
1.5 1.5
Week 3: Days 14 to 20
1.5 1.5
Week 4: Days 21 to 27
1.5 1.5
Week 5: Days 28 to 34
1 1.5
Week 6: Days 35 to 41
1 1.5
Week 7: Days 42 to 48
1.5 1.5
Week 8: Days 49 to 55
1.5 1
Week 9: Days 56 to 62
1 1
Week 10: Days 63 to 69
1 1
Week 11: Days 70 to 76
1 1
Week 12: Days 77 to 83
1 1
Week 13: Days 84 to 90
1 1
Week 14: Days 91 to 97
0.75 1
Week 15: Days 98 to 104
0.75 1
Week 16: Days 105 to 111
0.75 1
Week 17: Days 112 to 118
Total Deficit Rainfall:
Total Excess Rainfall:
Deficit Rainfall Payout:
Excess Rainfall Payout:
Total Payout:
Source: Authors.
A&R_Risk_Annex_9.indd 93 28/10/11 12:18 PM

A&R_Risk_Annex_9.indd 94 28/10/11 12:18 PM

ANNEX 10 — ILLUSTRATION OF A WORK PLAN 95
AGRICULTURE AND RURAL DEVELOPMENT DISCUSSION PAPER
Annex 10: ILLUSTRATION OF A WORK PLAN
TAB
LE A
10
.1: S
amp
le W
ork
Pla
n f
or
Ind
ex-B
ased
Wea
ther
Insu
ran
ce P
rog
ram
JAN
FEB
MA
RA
PRM
AYJU
NJU
LA
UG
12
34
12
34
12
34
12
34
12
34
12
34
12
34
12
INIT
IAL
BA
CKG
ROU
ND
RES
EARC
H
Phase 0
Sele
ct c
rops
that
are
pot
entia
l can
dida
tes
for t
he p
ilot p
rogr
am
START OF SEASON START OF SEASON START OF SEASON
Sele
ct g
eogr
aphi
cal a
reas
that
hav
e po
tent
ial
Iden
tify
wea
ther
sta
tions
with
suf
ficie
nt d
ata
and
qual
ity d
ata
Iden
tify
pote
ntia
l ins
uran
ce p
artn
ers
Map
the
risks
pro
file
of th
e cr
ops,
pot
entia
l clie
nts/
bene
ficia
ries,
and
are
as b
eing
co
nsid
ered
Phase 1
IDEN
TIFI
CATI
ON
OF
CLIE
NTS
AN
D D
ELIV
ERY
CHA
NN
ELS
Iden
tify
the
clie
nt -
indi
vidu
al fa
rmer
s, fi
nanc
ial i
nstit
utio
n, o
ther
?
Dete
rmin
e th
e ris
k pr
ofile
of t
he p
oten
tial c
lient
s/be
nefic
iarie
s
SELE
CTIO
N O
F RE
GIO
N C
LIM
ATIC
FA
CTO
RS
Desc
ribe
the
prod
uctio
n fu
nctio
n (in
clud
ing
the
phen
olog
ical
ste
ps)
Find
his
toric
al y
ield
dat
a fo
r eac
h cr
op a
nd a
rea
Defin
e th
e ne
cess
ary
tech
nolo
gica
l pac
kage
and
flow
s fo
r pro
duct
ion
(incl
udin
g in
puts
, fe
rtiliz
ers,
mac
hine
ry, e
tc.)
Dete
rmin
e th
e pr
ofita
bilit
y of
the
plan
t at d
iffer
ent y
ield
and
pric
e le
vels
(cos
ts o
f in
puts
, lab
ors,
pot
entia
l mar
kets
)
Quan
tify
yiel
d va
riatio
n (in
clud
ing
the
use
of h
isto
rical
dat
a an
d m
odel
s of
sim
ulat
ion)
IDEN
TIFY
RIS
K TA
KER
OR
INTE
RMED
IARY
FO
R TH
E RI
SK
Disc
uss
pote
ntia
l con
tract
s w
ith in
sura
nce
com
pany
or r
isk
take
r
Disc
uss
size
of i
nitia
l pilo
t pro
gram
Iden
tify
risk
taki
ng c
apac
ity o
f the
insu
rer
Defin
e pa
rtner
ship
s fo
r rea
chin
g en
d us
ers
Calc
ulat
e po
tent
ial fi
nanc
ial e
xpos
ure
of th
e ris
k ta
ker
Estim
ate
cost
s of
pilo
t pro
ject
COM
PILE
AN
D M
AN
AG
E TH
E M
ETEO
ROLO
GIC
AL
INFO
RMAT
ION
Esta
blis
h ac
cess
to a
ll hi
stor
ical
dat
a fro
m th
e M
et O
ffice
for p
ilot a
reas
Chec
k qu
ality
of h
isto
rical
dat
a fo
r pilo
t site
s
Chec
k th
e se
curit
y of
pot
entia
l sta
tions
Esta
blis
h th
e pl
an o
f coo
pera
tion
with
the
Met
Offi
ce th
at d
efine
s ho
w d
aily,
wee
kly,
and
quar
terly
repo
rts w
ill b
e re
ceiv
ed
Iden
tify
any
pote
ntia
l com
mun
icat
ion
or c
apac
ity is
sues
obs
tacl
es fo
r the
pro
gram
A&R_Risk_Annex_10.indd 95 28/10/11 12:18 PM

ANNEX 10 — ILLUSTRATION OF A WORK PLAN96
WEATHER INDEX INSURANCE FOR AGRICULTURE
TAB
LE A
10
.1: S
amp
le W
ork
Pla
n f
or
Ind
ex-B
ased
Wea
ther
Insu
ran
ce P
rog
ram
JAN
FEB
MA
RA
PRM
AYJU
NJU
LA
UG
12
34
12
34
12
34
12
34
12
34
12
34
12
34
12
Phase 2
DES
IGN
OF
PRO
TOTY
PE C
ON
TRA
CTS
Defin
e th
e pa
ram
eter
s of
the
cont
ract
(ind
ex in
sura
nce)
- de
fine
an in
dex
whi
ch m
ost
clos
ely
refle
cts
the
risk
to th
e pi
lot a
rea
or c
lient
ele
START OF SEASON START OF SEASON START OF SEASON
"Bac
k-te
stin
g" o
f the
con
tract
vs.
exp
ecte
d pa
yout
s
Defin
e th
e lim
its a
nd s
ched
ule
of p
ayou
ts fo
r the
con
tract
s
Quan
tify
the
hist
oric
al p
ayou
ts
Estim
ate
the
indi
cativ
e pr
emiu
ms
(pur
e ris
k pr
emiu
m)
MA
RKET
RES
EARC
H
Test
the
appl
icab
ility
of t
he c
ontra
cts
with
clie
nts/
bene
ficia
ries
– th
at is
, doe
s th
e pr
opos
ed in
dex
real
ly m
atch
risk
?
Test
the
cont
ract
par
amet
ers
incl
udin
g pa
yout
stru
ctur
e an
d tri
gger
leve
ls
Confi
rm d
istri
butio
n an
d m
arke
ting
chan
nels
for t
he p
ilot i
f app
licab
le
Phase 3
FIN
ALI
ZE IN
SURA
NCE
CO
NTR
ACT
S
Base
d on
sta
keho
lder
inpu
t, fin
alize
the
desi
gn a
nd c
ontra
ct s
truct
ure
of th
e pr
oduc
t
Fina
lize
cont
ract
s be
twee
n pa
rtici
patin
g pa
rties
FIN
ALI
ZE IN
SURA
NCE
ARR
AN
GEM
ENTS
Anal
ysis
of th
e co
mpa
rativ
e ef
ficie
ncy b
etw
een
diffe
rent
alte
rnat
ives f
or th
e tra
nsfe
r of r
isk
Dete
rmin
e ris
k re
tent
ion
capa
city
of l
ocal
insu
rer o
r ris
k ta
ker
Fina
lize
cont
ract
wor
ding
and
term
s
If ap
plic
able
beg
in d
iscu
ssio
ns w
ith re
insu
rers
rega
rdin
g ris
k tra
nsfe
r
DIS
TRIB
UTI
ON
OF
PAYO
UTS
Fina
lize
mec
hani
sms
for d
istri
butio
n of
pay
out
MA
RKET
ING
AN
D C
APA
CITY
BU
ILD
ING
FO
R TH
E PI
LOT
PRO
JECT
Deve
lop
the
com
mun
icat
ion
stra
tegy
and
act
iviti
es fo
r pro
mot
ing
the
prod
uct i
n th
e pi
lot
Deve
lop
mat
eria
ls to
com
mun
icat
e th
e pr
oduc
ts to
par
ticip
ants
Trai
n on
how
the
prod
uct w
orks
for p
artic
patin
g or
gani
zatio
ns
Phase 4
SALE
OF
CON
TRA
CTS
FOR
THE
PILO
T PR
OJE
CT
Self
cont
ract
thro
ugh
iden
tified
cha
nnel
s
IF A
PPLI
CAB
LE, T
RAN
SFER
RIS
K TO
TH
E M
ARK
ET
If ap
plic
able
neg
otia
te th
e ris
k tra
nsfe
r sch
eme
with
insu
rers
Phase 5
EVA
LUAT
ION
OF
THE
RESU
LTS
OF
THE
PILO
T PR
OJE
CT
Desi
gn c
riter
ia fo
r rev
iew
ing
the
tech
nica
l, op
erat
iona
l, fin
anci
al a
nd p
erce
ptio
n of
the
sche
me
of in
dex
insu
ranc
e
Carry
out
an
eval
uatio
n of
the
pilo
t pro
gram
Sou
rce:
Aut
hors
.
(co
nti
nu
ed)
A&R_Risk_Annex_10.indd 96 28/10/11 12:18 PM

ANNEX 11 — AGRI-INSURANCE SYSTEM DEVELOPMENT IN UKRAINE 97
AGRICULTURE AND RURAL DEVELOPMENT DISCUSSION PAPER
Annex 11: AGRI-INSURANCE SYSTEMDEVELOPMENT IN UKRAINE
International Financial Corporation (IFC) launched its activities in agri-insurance in Ukraine (2007–2013) in partnership with the Canadian International Devel-opment Agency (CIDA). Strategies and methodo-logies developed in Ukraine are extended to other IFC programs.
WHY UKRAINE?
At the start of the project, Ukraine’s agri-insurance potential was underdeveloped and lacked capacity. It represented a system in early stages of development. At the same time, Ukraine had the potential to be a world leader in agricultural exports. Its agricultural production is exposed to many natural perils that are beyond producers’ control. As shown by global experience and particularly that of Canada—IFC’s partner in the project—agri-insurance is well placed to become an ef-ficient risk management tool to protect producers against weather risks, stabilize their incomes, improve access to fi-nance, and help restore production after unfavorable climatic events.
OVERALL OBJECTIVE AND STRATEGIES TO ACHIEVE OBJECTIVE
The IFC Agri-Insurance Project was designed to boost the use of agri-insurance as a risk management tool by estab-lishing a sustainable agri-insurance system based on the public-private partnership, enhancing technical capacity of insurance companies and fostering access to finance due to use of insured crops as collateral (figure A11.1).
Leveraging Canadian and U.S. experience in North America, a threefold strategy was developed. First, human resource development was necessary to underpin development. For development to take place, sufficient capacity is required in government ministries, the insurance regulator, private insur-ance companies, and farmer organizations. The challenges to develop agri-insurance are unique, technically and operation-ally distinct from other kinds of insurance, as evidenced by the need for separate legislation in countries with developed systems. Successful agri-insurance systems throughout the world are characterized by public-private partnerships (figure A11.2).
FIGURE A11.1: Human Resource Development to Sustainability
effic
ienc
y of
the
sys
tem
Sustainablesystem
Capacitybuilding
Humandevelopment
timeSource: IFC.
A&R_Risk_Annex_11.indd 97 29/10/11 7:58 AM

ANNEX 11 — AGRI-INSURANCE SYSTEM DEVELOPMENT IN UKRAINE98
WEATHER INDEX INSURANCE FOR AGRICULTURE
FIGURE A11.2: System Development
• Procedure improvement • Developing cash flows • Technical capacity • Management capacity • Training • Gender awareness and
advise on ensuring gender-balanced approach
• Public awareness and educationalcampaigns
• Lobby for legal and regulatorychanges through mass media
• Extension publications
• Gap analysis • Development of agri-insurance law
• Development of otherelements of the legal andregulatory framework
• Promoting the establishment ofprivate-public partnership, includinga risk management agency and apool of insurance companies
• Establishing a database(depository) for actuarial analysisand premium rating
Efficient agri-insurance system
Establishingagri-insurance
system: strategy
Publicawareness
and education
Access tofinance
through agri-insurance
Legal andregulatoryframework
Produceradvocacy andempowerment
Improvinginsuranceprograms
Strengtheninginsurers’capacity
• Consumer survey • Workshops for farmersproducers
• Participation in decisionmaking
• Advocacy
• New standard products andprograms
• Standardized procedures• Actuarial calculations• Staff training in using standard
procedures• Catastrophic insurance• Re-insurance
• Reinforcing the linkage between agri-lending and agri-insurance
• Development of internal procedures forbanks to extend loans backed by agri-insurance
• Development of insurance productsacceptable for banks
• Training programs for banks on riskmanagement
Agri-insurance is a highly technical discipline, requiring not only considerable expertise on the part of insurance compa-nies and well-designed insurance products and programs but also thorough understanding and active participation on the part of producers who need to play a role in program design if the insurance program is to address their needs.
Second, agri-insurance involves a system, the elements of which need to work in coordination and the performance can be determined by the weakest link. Private insurance compa-nies must transfer a significant part of the risk to international reinsurers, requiring technical and business competence often beyond the capacity of individual insurance companies (vol-umes of business are also a big question for reinsurance com-panies). In Ukraine, similar to other countries, an agri- insurance pool of companies was formed. Government support enables
the development of an insurance product; lack of support or data can block its development. Farmer activism is the main driver to obtain government support for agri-insurance. Banks and input supplier involvement is a main commercial driver for the sale of agri-insurance because it minimizes the credit risk, thereby improving farmer access to finance. The regulator can encourage innovation or stifle it. International reinsurers have confirmed their support of a system development approach for steady and sustainable growth.
Third, the work in Ukraine demonstrated the difficulty to develop human resources and the system if the approach was too academic. Training and system development were actualized by concrete work to develop agri-insurance prod-ucts and launch them in the market. This approach was very successful. Market standard insurance products for nine
Source: IFC.
A&R_Risk_Annex_11.indd 98 29/10/11 7:58 AM

ANNEX 11 — AGRI-INSURANCE SYSTEM DEVELOPMENT IN UKRAINE 99
AGRICULTURE AND RURAL DEVELOPMENT DISCUSSION PAPER
agricultural crops were developed and launched in the mar-ket during the course of the project and sales are increasing year by year. New standard insurance products are a plat-form for all stakeholders work together and create win-win scenarios (figure A11.3).
THE IFC APPROACH
� Develop legislation in close cooperation with govern-ment agencies to implement a public-private part-nership as a prerequisite for efficient regulation and implementation of well-designed agri-insurance pro-grams, protect agricultural produce against weather risks, and enable them to regain production capacity after catastrophic events. Provide training and consul-tations to increase government expertise in managing insurance programs at the regulatory level. The most efficient way for agri-insurance to be sustainable is through a public-private partnership, where govern-ment sets clear rules for the game, ensures good regulation, and supports producers by subsidizing premium rates while private-sector insurers do their job by offering good insurance products to producers and paying indemnities.
� Standard products. Countries with developed agri-insurance invariably unite around the need for standard products, where competition between insur-ance companies is focused on the services that are provided and not distinguished by the products being sold. The necessity for standard products is justified by a wide spectrum of reasons, from reinsurance procedures and costs to farmer understanding and acceptance (figure A11.4).
� Support establishment of the agri-insurance pool. An association of companies active in agri-insurance will manage the data depository, design new pro-grams (including setting product standards, defining the methodology for underwriting and loss adjust-ment, and actuarial-based premium rating), prepare reinsurance submissions, undertake third-party arbitra-tion, and provide training and consultation to member insurance companies. Individual insurance companies have neither the capacity nor the investment resourc-es required for the agri-insurance requirements, thus the need to pool.
Since agricultural risks are highly systemic and tend to cover considerable territories, insurance companies
FIGURE A11.3: Unity Through Program Development and Market Launch
Human resourcedevelopment
Rally around avalue activity
Buildingtrust
Establishment ofinstitutionalstructures
Training modules covering all subjectsfrom data management throughactuarial, reinsurance, and clientrelationship
Product development iswhat every insurancecompany needs but no onehas resources to do on itsown
� Agri-insurance pool (representation ofthe sector’s interests, data depository,product development, implementationof best practices, arbitration,reinsurance submissions)
� Program administrator (at the AgMinistry level)
� Insurance regulator (licensing, datacollection)
� Loss adjusting certification capacities � Farmer education through extension
services
In parallel, workingwith the governmentto create legislation
Mandatory principles: � Providing data for data
depository
� Use of standard products
� Reinsurance
� Code of conduct
Source: IFC.
A&R_Risk_Annex_11.indd 99 29/10/11 7:58 AM

ANNEX 11 — AGRI-INSURANCE SYSTEM DEVELOPMENT IN UKRAINE100
WEATHER INDEX INSURANCE FOR AGRICULTURE
FIG
UR
E A
11
.4: S
tep
s to
Dev
elo
p a
Sta
nd
ard
Pro
du
ct/P
rog
ram
0
Det
erm
ine
Rol
e of
Gov
ernm
ent,
Priv
ate
Com
pani
es
Sub
sidy
Pol
icy
and
Com
mitm
ent
from
Gov
ernm
ent
Dat
a Id
entif
icat
ion
and
Sta
ndar
d R
atin
g M
etho
d
Sta
ndar
dize
d D
ata
Man
agem
ent
Syst
em (M
IS)
Dev
elop
Pre
miu
m R
ates
for
Pilo
t
Sta
ndar
d Pr
ogra
m D
esig
n (Is
sues
)
Ris
k-B
earin
g S
trat
egy
(Far
mer
s, P
rimar
y In
sura
nce
Com
pany
, Rei
nsur
ance
, Gov
ernm
ent)
Prim
ary
Insu
ranc
e C
ompa
ny R
evie
w P
roce
dure
s
Ris
k-S
harin
g M
etho
ds (D
educ
tabl
e, C
o-pa
y, S
top
Loss
, Per
il, P
rogr
am D
esig
n)
Reg
ulat
ory
Polic
y an
d R
equi
rem
ents
Com
mod
ity P
ricin
g Po
licy
(Cle
arly
Def
ine
Met
hod
of D
eter
min
ing
the
Mar
ket
Pric
e)
Dis
pute
Res
olut
ion
Proc
edur
es
Inde
mni
ty P
aym
ents
(Pol
icy,
Dea
dlin
es, P
roce
dure
s)
Prem
ium
Bill
ing
(Pol
icy,
Dea
dlin
es, P
roce
dure
s)
Sta
ndar
d Lo
ss A
djus
ting
Proc
edur
es
Rep
ortin
g Po
licie
s an
d Pr
oced
ures
(Pro
duce
rs, I
nsur
ance
Com
pani
es)
Insu
ranc
e C
ontr
act
Polic
y D
esig
n an
d W
ritin
g
Polic
y on
Gro
und
(Mon
itor
Sal
es, P
rodu
cer
Info
Mat
eria
ls)
Prod
ucer
Not
ifica
tion
Proc
edur
es
Aud
iting
Pol
icy
and
Publ
ic A
ccou
ntab
ility
Ope
ratio
ns, T
rain
ing
Nee
ds, R
oles
, Res
pons
ibili
ties,
Aut
horit
y (P
erso
nnel
Req
uire
men
ts)
Age
nt Tr
aini
ng
Sta
keho
lder
Fee
dbac
k Pr
oced
ures
Rei
nsur
ance
Sub
mis
sion
Mon
itor
Perf
orm
ance
and
Mod
ify a
s A
ppro
pria
te
1020
3040
5060
wee
ks
7080
9010
0
Sou
rce:
IFC
.
A&R_Risk_Annex_11.indd 100 29/10/11 7:58 AM

ANNEX 11 — AGRI-INSURANCE SYSTEM DEVELOPMENT IN UKRAINE 101
AGRICULTURE AND RURAL DEVELOPMENT DISCUSSION PAPER
TABLE A11.1: Agri-Insurance as an A2F Product
Status �Product fully developed, in use by Ukrainian banks and insurance companies, ready to be offered
Objective �Reduction of credit risk through crop yield insurance leading to improved lending conditions for agri-producers
Instruments �Reinforcing the linkage between agri-lending and agri-insurance �Helping design an insurance product aligned with the lending program �Training and certification of bank staff (and partnering insurance companies) � Improvement of banking credit risk assessment procedures �Development of internal procedures for banks to extend loans backed by agri-insurance
Source: IFC.
TABLE A11.2: Standard Insurance Products Developed by IFC Ukraine Agri-Insurance Team
Products by crop �winter wheat �winter rye �winter barley �winter rapeseed �winter triticale � summer wheat � summer barley � corn � sunflower
Products by season �whole cycle �winter kill � spring-summer risks
Specifics of the products � standard contract �actuarial techniques for rates calculation (1980–2010 database) �flexible rates—price and coverage levels can be opted � standard loss-adjusting procedures � international reinsurance �adopted for subsidy programs (if available) �adopted for banks’ and input suppliers’ products
Source: IFC.
need to pool and reinsure the largest part of these risks internationally to spread the risks efficiently.
� Increase awareness about agri-insurance among Ukrainian producers through extension and media campaigns as well as dissemination of information and training events.
� Work with Ukrainian banks and input suppliers to help them increase expertise in rural lending, as well as to develop and market financially viable loan products with the use of insurance as collateral. Agri-insurance can be instrumental to increase access to finance as producers can use the insurance policy as collateral and get a loan easier or at better terms (table A11.1).
PROJECT PARTNERS AND PARTICIPANTS
� National and local government agencies responsible for agricultural insurance
� Senior management and specialists of insurance companies, agricultural enterprises, agricultural input suppliers, food processing companies, and banks
� Producer associations, extension services, consulting firms, NGOs, and experts working on agri-insurance issues
� Media
� International reinsurers, international consultants from countries with developed agri-insurance system
RESULTS OF IMPLEMENTED STRATEGY AS OF JULY 1, 2011
� Facilitated development of the concept of agri- insurance development and the law on agri-insurance with government support
� Established a data depository for developing new insurance products on the basis of actuarially sound calculations
� Provided 564 consultations to 180 entities and 58 training events (totally 526 attendees) for insurers
� The project developed and launched in the market standard insurance products for nine agricultural crops (table A11.2)
� On February 1, 2011, fifteen leading companies providing agri-insurance coverage established the Agri-Insurance Bureau under the project’s coordination
� Works with banks and input suppliers to develop and improve the quality of collateral to improve access to finance for agricultural producers
� Implemented an education campaign: 2,311 produc-ers took part in 70 training events all over Ukraine (figure A11.5)
A&R_Risk_Annex_11.indd 101 29/10/11 7:58 AM

ANNEX 11 — AGRI-INSURANCE SYSTEM DEVELOPMENT IN UKRAINE102
WEATHER INDEX INSURANCE FOR AGRICULTURE
A FARMER TESTIMONIAL: AGRI-INSURANCE HELPS MITIGATE RISKS AND IMPROVE ACCESS TO FINANCE
The IFC Ukraine Agri-Insurance Development Project aims to improve the quality of products offered by Ukrainian in-surance companies, advise insurance firms how to develop better products, and consult the public and private sectors on developing a regulatory environment to foster agri-business insurance. The resulting agri-insurance infrastructure will help farmers make better use of their resources and enable them to obtain bank financing more easily, as banks have greater comfort lending if they know farmers’ future yield or income is insured against losses. This way the project helps mitigate risks and increases access to finance for local producers.
Olexiy Samoilenko runs a large farm in Ukraine’s Poltava region. While the farm has traditionally produced well, he still worries year to year about how it will fare. “The last yield is history—we have to survive from what we have this year,” he says, adding, “We would like to ensure the yield, not the field.” Samoilenko has been insuring for five years, and when a drought in 2008 wrecked sugar beet yields in Ukraine, his insurance company paid out nearly $3 million.
Supporting and developing agribusiness is one of IFC’s key global priorities. By addressing risk mitigation and financing needs in Ukraine—one of the world’s largest agri-producing countries—IFC is making a major contribution to its wider strategy in this area.
FIGURE A11.5: Helping Ukraine Realize Its Full Agricultural Potential
Helping governmentenact legislation: Law onState Support of Agriculture
Development of agri-insurance,as part of a broad, programmaticapproach, helps unlock Ukraine’spotential to become a leading worldproducer of agri-products.
Developing newproducts to the market:Standard Insurance Productsfor 9 crops
Building a coalition ofstakeholders: Public−Private Partnership
Educatingfarmers and insurers:2311 producers and173 companies trained
Increasingpublic awareness:about 1400 mediaappearances
Privatesectorinvestmentenabled
Laying the groundwork for the sector’s development
Source: IFC.
A&R_Risk_Annex_11.indd 102 29/10/11 7:58 AM

A G R I C U LT U R E A N D R U R A L D E V E L O P M E N T D I S C U S S I O N PA P E R 5 0
AGRICULTURE AND RURAL DEVELOPMENT
ARDAgriculture and Rural Development (ARD)
1818 H Street, NW
Washington, D.C. 20433 USA
Telephone: 202-477-1000
Internet: www.worldbank.org/ard European CommissionAll ACP Agricultural Commodities Programme
ACP Group of States
A&R_Risk_Cover.indd 1 01/11/11 2:21 PM