anna rappaport consulting strategies for a secure retirement sm disability: the challenges it...
TRANSCRIPT

ANNA RAPPAPORT CONSULTINGSTRATEGIES FOR A SECURE RETIREMENTSM
Disability: the Challenges it Presents to Successful Retirement
Task Force on Women and AgingAugust, 2013

Agenda
Anna’s learning experiences Disability benefit issues Forms of long term disability coverage Regulation of coverage Anna’s policy recommendations Appendix
– ERISA Advisory Council– More data
Task Force on Women and Aging, August 2013 2
Anna’s learning experiences: it is more complicated than I thought
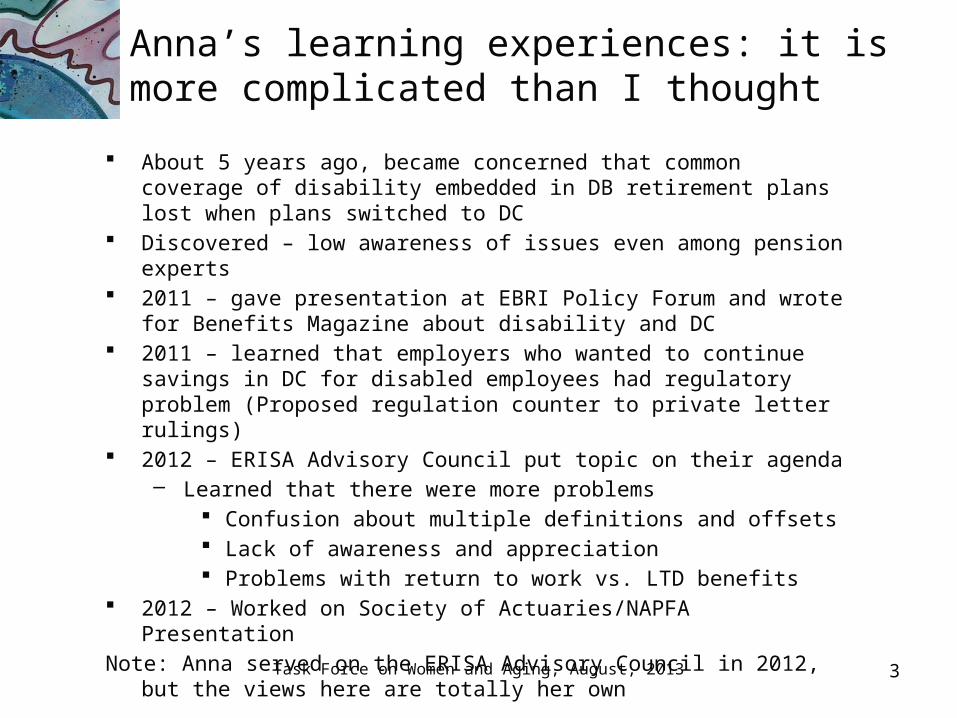
About 5 years ago, became concerned that common coverage of disability embedded in DB retirement plans lost when plans switched to DC
Discovered – low awareness of issues even among pension experts 2011 – gave presentation at EBRI Policy Forum and wrote for Benefits
Magazine about disability and DC 2011 – learned that employers who wanted to continue savings in DC for
disabled employees had regulatory problem (Proposed regulation counter to private letter rulings)
2012 – ERISA Advisory Council put topic on their agenda– Learned that there were more problems
Confusion about multiple definitions and offsets Lack of awareness and appreciation Problems with return to work vs. LTD benefits
2012 – Worked on Society of Actuaries/NAPFA Presentation
Note: Anna served on the ERISA Advisory Council in 2012, but the views here are totally her own
Task Force on Women and Aging, August, 2013 3

The Importance of Disability
Retired Disabled Other Reasons
Men (14% of Population)
% of Not in Labor Force 32% 64% 4%
% Poor 15% 24% NA
Women (24%)
% of Not in Labor Force 26% 40% 34%
% Poor 14% 34% 10%
Tax Force on Women and Aging, August, 2013 4
Source: CBO, Disability and Retirement: The Early Exit of the Baby Boomers from the Labor Force, November 2004
Status of Americans Age 50-61 Not in Labor Force

The Importance of Disability
Retired Disabled In Labor Force
Men
Median Annual Family Income $30,000 $20,000 $62,000
Median Net Worth $231,000 $19,000 $148,000
Women
Median Annual Family Income $34,000 $19,000 $54,000
Median Net Worth $218,000 $14,000 $132,000
Task Force on Women and Aging, August, 2013 5
Source: CBO, Disability and Retirement: The Early Exit of the Baby Boomers from the Labor Force, November 2004 ( CBO analysis based on 2001 SIPP)
Economic Status of Americans Age 50-61
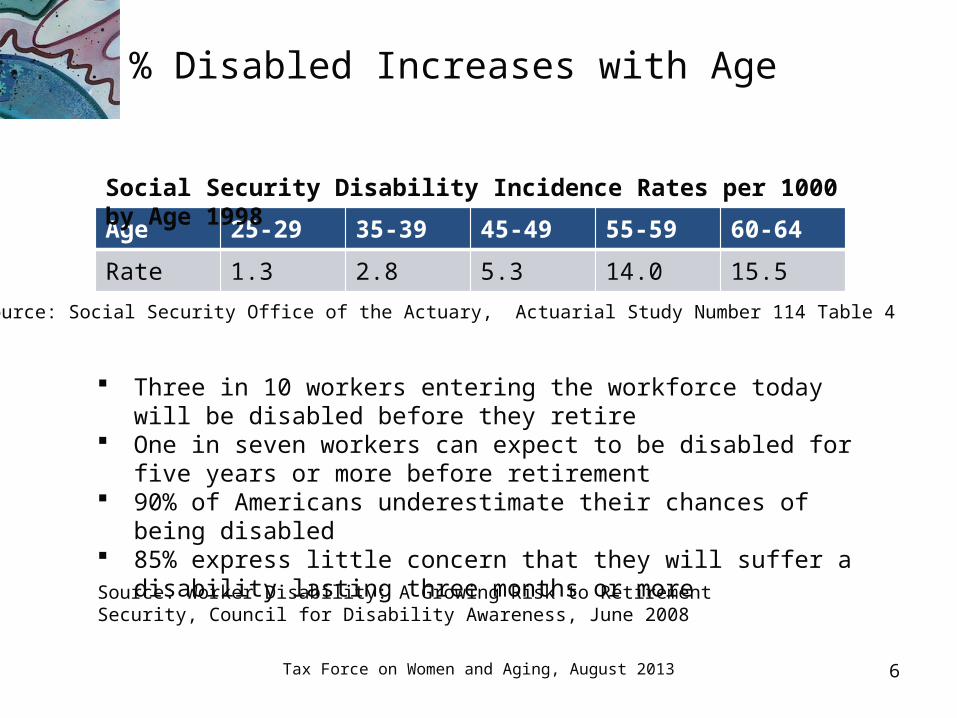
% Disabled Increases with Age
Age 25-29 35-39 45-49 55-59 60-64
Rate 1.3 2.8 5.3 14.0 15.5
Tax Force on Women and Aging, August 2013 6
Social Security Disability Incidence Rates per 1000 by Age 1998
Source: Social Security Office of the Actuary, Actuarial Study Number 114 Table 4
Three in 10 workers entering the workforce today will be disabled before they retire
One in seven workers can expect to be disabled for five years or more before retirement
90% of Americans underestimate their chances of being disabled 85% express little concern that they will suffer a disability lasting
three months or moreSource: Worker Disability: A Growing Risk to Retirement Security, Council for Disability Awareness, June 2008

Disability issues: Gaps in Disability Coverage Today
Disability in 40s and 50s means– Loss of income– Loss of new retirement savings– Possibility of added expenses—medical and care-giving– Stress on family members
Only 31% of civilian labor force have employer sponsored LTD DC plans and disability – the usual situation
– No continued accrual of benefits– Pay out lump sum on disability– Funds may be spent too early– Regulations are a barrier to fixing this challenge
Task Force on Women and Aging, August 2013 7

More Disability Issues
Auto-enrollment – used frequently for 401(k), but not much for disability (Confusion about regulations)
Offsets – LTD benefits normally offset for Social Security benefits, but other offsets also used– Don’t know how often– Some seem counter to the purpose of the plan
Definitions of disability – create confusion Helping people work vs. paying benefits – benefits vs. ADA
– Not well coordinated Fragmented regulations People not working outside of the home have NO disability
coverage
Task Force on Women and Aging, August, 2013 8

Sources of longer-term disability coverage
Social Security Employer LTD DB Pension Individual Plan
Employer role Pay tax Sponsor plan Sponsor plan Mostly none
Prevalence All in Soc. Sec,; not for homemakers
Common in large cos., 31% of civilian labor force
Minority of employees today and dropping
Small minority; highest amount higher-paid professionals, self-employed
Definition of disability*
Very strict – total and permanent, but variable administration
Depends: your occupation, any occupation, blend and variations
Depends on plan; may mirror LTD
Depends: your occupation, any occupation, blend and variations
Task Force on Women and Aging, August 2013
9
*Americans with Disabilities Act has entirely different definition.

Integrating Disability with Other Benefits
Benefit Disability coverage
Life Insurance Waiver of Premium
Health Benefits Some employers provide for continued medical coverage, Medicare after 2 years if on SSDI
DB Pensions Traditional Many plans continue crediting service (like waiver of premium); some plans pay disability pension
DB Cash Balance Plans Could continue crediting service or pay out benefit
DC Plans Logical approach would be to continue making contribution (like a waiver of premium), but regulatory barriersCan offer special LTD benefit as an investment option Can offer stand-alone disability make-up benefit
Task Force on Women and Aging, August, 2013 10

Regulation of longer-term disability coverage
Social Security Employer LTD DB Pension Individual Plan
Who’s in charge
Congress Employer, subject to law
Employer, subject to law
Ins. Co’s offer plans
Regulation of benefits
Soc. Sec. Adm. Benefits – Federal (ERISA)Insurance – State ins. laws
Federal law (ERISA) DOL, IRS, PBGC
State insurance laws
Taxation Depends on household income level
Depends on whether pre-tax of post-tax plan
Benefits are taxable
Benefits generally not taxable
Tax Force on Women and Aging, August, 2013 11
In addition Americans with Disabilities Act – regulates employment
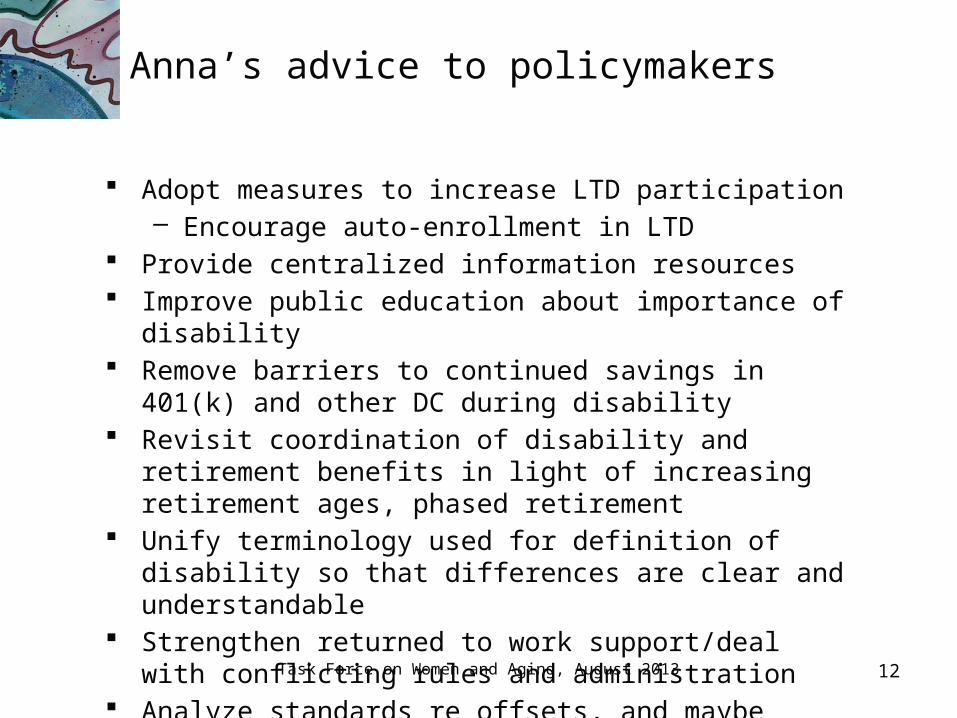
Anna’s advice to policymakers
Adopt measures to increase LTD participation– Encourage auto-enrollment in LTD
Provide centralized information resources Improve public education about importance of disability Remove barriers to continued savings in 401(k) and other
DC during disability Revisit coordination of disability and retirement benefits in
light of increasing retirement ages, phased retirement Unify terminology used for definition of disability so that
differences are clear and understandable Strengthen returned to work support/deal with conflicting
rules and administration Analyze standards re offsets, and maybe revise
Task Force on Women and Aging, August 2013 12
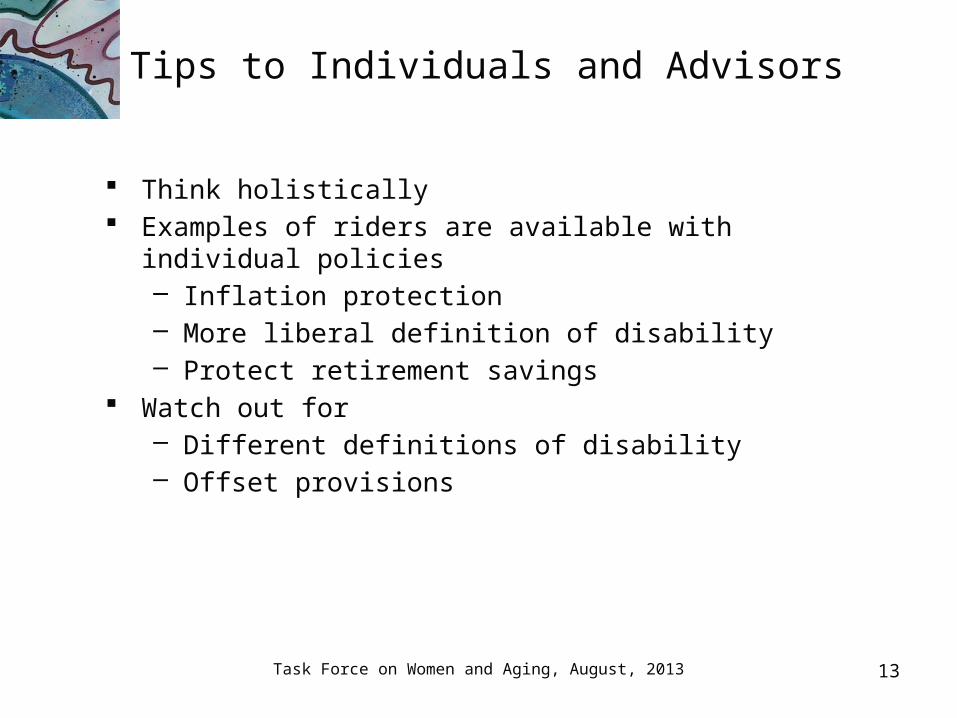
Tips to Individuals and Advisors
Think holistically Examples of riders are available with individual policies
– Inflation protection– More liberal definition of disability– Protect retirement savings
Watch out for – Different definitions of disability– Offset provisions
Task Force on Women and Aging, August, 2013 13

APPENDIX: 2012 ERISA ADVISORY COUNCIL TOPIC:MANAGING DISABILITY RISKS IN AN ENVIRONMENT OF INDIVIDUAL RESPONSIBILITY
Note that Anna Rappaport served on the Council in 2012 and participated in this project. The views presented today are her own and not those of the Council or the Department of Labor.
14

Managing Disability RisksQuestions studied
What long term disability benefits are offered to employees? What retirement income gaps are created during periods of
disability? How can DOL assist participants in managing disability
risks? How can DOL assist employers in establishing effective
disability benefit designs?
15
Managing Disability RisksFindings
Testimony confirmed: Major gaps in employer and employee knowledge about
disability coverage Many individuals do not fully understand the risk of
becoming disabled or appreciate the value of disability coverage
Disability coverage is often lost in the shift from DB plans to DC plans
Disability can derail retirement income planning for DC participants – contributions cease and retirement savings are spent prematurely
16

Managing Disability RisksFindings
17
Testimony confirmed:
Tax regulations are a barrier to plan designs promoting continued savings in DC plans during periods of disability
Complexity, misunderstandings and lack of disclosure of offsets have led to unexpected outcomes for participants
Differing definitions of disability can create barriers to retraining or returning to work

Managing Disability RisksRecommendations
The Advisory Council recommends that DOL:
1. Develop educational materials for employers, employees, participants and beneficiaries addressing:– The likelihood of becoming disabled – The impact of disability on retirement benefits – Types of disability coverage – Options for securing replacement income during
periods of disability
18

Managing Disability RisksRecommendations
2. Review and modify current claims regulations regarding disability benefits, drawing upon recent health care regulations where appropriate, including: – The content for denial of disability claims – The rule regarding full and fair review,
addressing what is an adequate opportunity to develop the record and address retroactive rescission of an approved benefit
19

Managing Disability RisksRecommendations
20
– Resolution of conflicts between the administrative claims and appeals process and the participants’ ability to timely bring suit
– Applicability of the ERISA claim procedures to offsets and eligibility determinations

Managing Disability RisksRecommendations
3. Issue guidance for plan sponsors and plan administrators on the following: – Permissibility of auto-enrollment for employee
contributory long-term disability plans – Characterization of long-term disability
benefits as welfare benefits without regard to retirement age
– Payment of insurance premiums for continuing retirement contributions during periods of long-term disability in DC plans, including whether a default feature is appropriate
21

Appendix – more data
Task Force on Women and Aging, August, 2013 22

23
Primary Causes of Disability
Source: HIAA Source Book of Insurance Data, 1999-2000
Impairment % of Claims
Back 18.2
Emotional/psychiatric
12.7
Neurological 11.3
Extremities 9.0
Cardiovascular 4.1
Diabetes 3.6
TOTAL 58.9

Odds One Person Will Become Disabled
Total Number of Employees
Age 2 Employees 5 Employees 10 Employees
27 66.3% 93.4% 99.6%
37 62.4% 91.3% 99.2%
47 54.4% 85.9% 98.0%
57 35.4% 66.4% 88.7%
Based on 1985 Commissioner’s Individual Disability Table B - Equally Weighted 90 Day Elimination Period