animal left the tracks
TRANSCRIPT

1
2
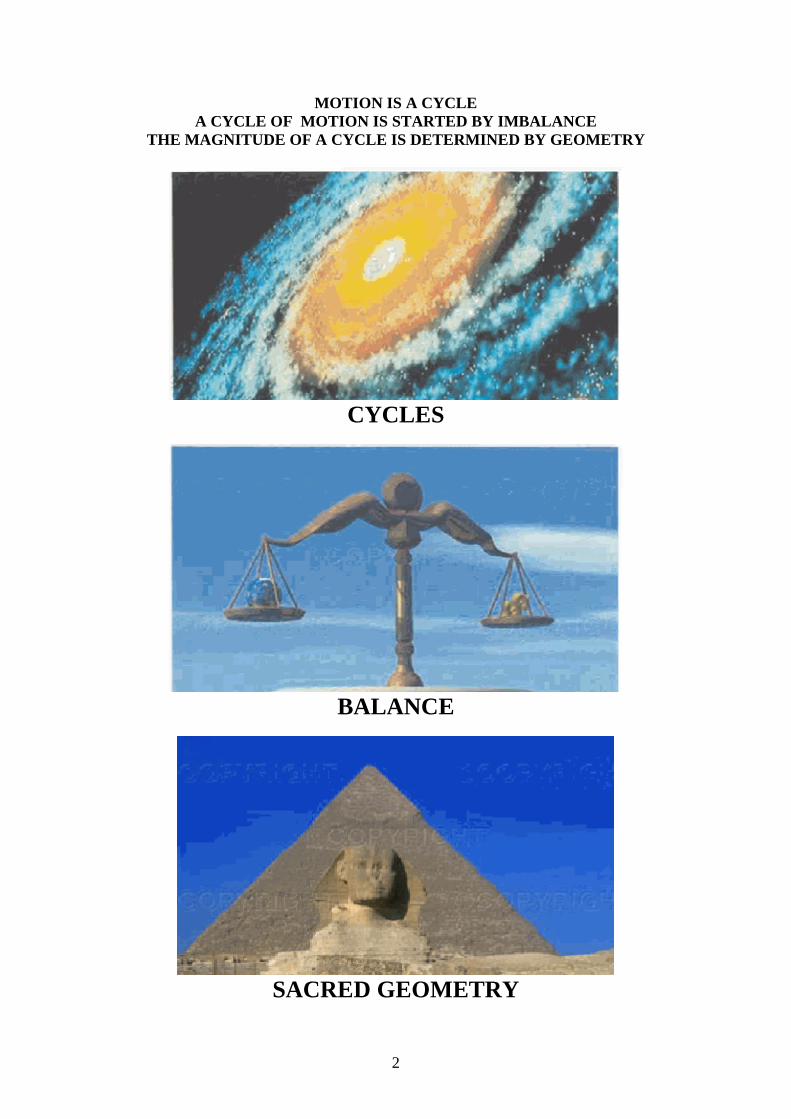
MOTION IS A CYCLE A CYCLE OF MOTION IS STARTED BY IMBALANCE
THE MAGNITUDE OF A CYCLE IS DETERMINED BY GEOMETRY
CYCLES
BALANCE
SACRED GEOMETRY

3
THIS IS WHAT A MARKET CHART LOOKS LIKE TO YOU NOW:
AFTER READING THIS BOOK A MARKET CHART WILL LOOK LIKE THIS:
YOU CAN TELL BY THE FOOTPRINTS WHAT KIND OF ANIMAL LEFT THE TRACKS:

4
SECTION CONTENTS 1. NATURE'S THREE LAWS
• man and market are one. • The matrix • What is money
2. UNIVERSAL LAWS OF MOTION • Balance • Cycles • Sacred geometry
3. WHO IS THE MAN ON THE CHARTS
• why the man appears on the charts... • what is the man doing on the charts… • when does the man appear on the charts… • where does the man appear on the charts…
4. REACTIONS OF THE MAN ON THE CHARTS
• A parable of the man of the charts 5. HOW TO WIN ON 70% OF YOUR TRADES
• how to trade like a business... • the importance of ratios... • the power of compounding...
6. CYCLES OF A WALKING MARKET
• Out of balance • Cycles of a walking market II • overview… • trend… • why there is support and resistance… • the balance of supply and demand • historical support and resistance
7. TREND
• why the trend is as strong as the tide 8. THE BATTLE BETWEEN SUPPORT AND RESISTANCE
• Why is there Resistance: • Why is there Support: • The balance of supply and demand • What is support? • What is resistance? • Where is Resistance Established? • Methods to establish support and resistance?

5
• Support = Resistance • Trading Range • Support and Resistance Zones
9. TREND LINES
• Where to draw trend lines • Up-trend lines • Down-trend lines • Validation • Angles
10. PROJECTED SUPPORT AND RESISTANCE
• fibonacci • first rise first failure • parabola hunts • continuation gaps • second high second low • pattern cycles
11. TIME FRAME ANALYSIS
• Time trading • Trend Relativity • Time Frame Divergence
12. WHY TRADE THE HEAD AND SHOULDERS
• How Would You Define Balance? • How to know when trend has changed • Head and shoulders top • Trading the head and shoulders top • Inverted Head and shoulders bottom • Trading the inverted head and shoulders bottom
13. MECHANICS OF A MARKET SWING
• What Is A Swing • Stop Placement
14. FOOT PRINTS OF THE MARKET
• Stride • A tracker can tell a lot from footprints • Anatomy of a footprint • Market footprints
15. THE RELATIONSHIP BETWEEN PRICE BARS AND FOOTPRINTS
• Anatomy of a price bar 16. THE LAWS OF CHARTS AND MEN
• Probabilities, turns, momentum, similarities, energy • One mind, balance, angles

6
• Support, Resistance, forces, reaction, retracements 17. PRINCIPLES OF COMPOUNDING
• How to compound $500 into $100,000 in six months • Money management System
18. MARKET PHYSICS
• Exploring market physics • An object in motion tends to remain in motion • For every action there is an equal and opposite reaction • Flaming stars burn out • Energy sources leave signatures
19. MARKET OPERATORS
• what are market makers • ripping off the little guy • rise of the wholesaler • the power of aggregation • price improvements • online brokers
20. CONSTRUCTING THE MAN ON THE CHARTS
• His head and shoulders • The see-saw • Center of gravity • His legs • Sacred Geometry • His feet • His Pivot • Illustrations
21. TRADING MISTAKES
• Food chain ignorance, improper trade entry, shorting, Improper stops • No discipline, trading against the trend, don't' cut losses short, overtrading
22. THE GREATEST TRADER THE WORLD HAS EVER KNOWN
• W. D. Gann • Newspaper article
23. TRADE MANAGEMENT

7
REGISTERED SECTION
24. HOW TO TRADE THE MAN ON THE CHARTS WITH 90% ACC URACY:
• TRADING PIVOT REVERSALS - When the man pivots the law of momentum is on your side.
• ENTRY AND EXIT RULES - That keep your stops safe, gives you maximum profit, in the shortest time.
• TRADING CONTINUATION MOVES -How to know if current move will continue, use sacred geometry to project length of current swing.
• RECOGNIZING SWING FAILURE -So you can exit early if wrong and reverse directions quickly.
• RECOGNIZING FAILED BREAKOUTS -To avoid bull and bear traps.
• ONE BAR REVERSALS AND COMPLEX PIVOTS -Give more players time to enter the market to fuel the next swing.
• FIRST HIGHER BOTTOM FIRST LOWER TOP -Signals 1st reversal in in the balance of supply and emand. Provides largest profits.
• THE CYCLE OF SWINGS -Give you a roadmap of where the man is planning to go.
• FIBONACCI PROJECTIONS
• CONFIRMING INDICATORS -Line up like a cross-hairs or scope on a rifle to give you the right timing.
• PREDATOR ZONES -Alert you to areas where predators lie in wait to ambush you.
• WHY USING PHYSICAL STOP-LOSS ORDERS - Puts you in the predator zone and makes you a target.
• TRADING THE NEWS -How predators use news to spook the herd into panic.
• PRE-TRADE CHECK LIST -How he system is like a robot that automatically tells you when and where to enter and exit. Mechanical trading keeps you from emotional, panic decisions with the herd.
• IF YOU MUST DAY-TRADE THE FOREX MARKET -Why you should day- trade within the context of the pivots on the daily chart.
• KNOWING WHEN A GAP MEANS BUSINESS -How to know when a gap open signals an explosive up-move or a shooting star about to flame out.

8
INTRODUCTION TO THE MAN ON THE CHARTS
"WELCOME TO THE REAL WORLD NEO…" (Morpheous to Neo in the movie "The Matrix.")
MAN AND MARKET ARE ONE
There is the image of a man on the financial charts. He appears at different times in every market to signal an imbalance of supply and demand. He is not a thing separate from the market, he is the market. He and market are one. The shape of his form and the shape of the market are one. He can be seen by the shadow of human fear and greed that he casts. The footprints he leaves on the shifting sands of market charts can track his movements. The angle of his imbalance and market imbalance are one. He appears each time with different body dimensions. He has a different height, width, and lean to his body posture upon each appearance. His dimensions and body posture signal the direction and magnitude of the next market trend. The pivots of his joints signal his every change in direction like turn signals on a car. We all know a market is always rising or falling. Well, there are universal laws of rising and falling. Everything that rises or falls must follow the same laws of rising and falling. Markets must follow the laws of rising and falling just like everything else in creation. If you know the natural laws of rising and falling, then you understand that certain conditions must be present in order for something to rise or fall. Instead of asking yourself, "Will the market rise or will it fall?", it is more conducive to ask, "can the market rise or can it fall?" Instead of viewing a market as jumping up and falling down, it would be more accurate to see it as walking a steep hill and stumbling down that hill. Turn left to walk up the hill and turn right to stumble down the hill. A market turns before rising. A market turns before falling. Price action is not just a matter of up and down movements, but instead follow the mechanics of a man walking a zigzag, turning left or right. When walking to the left, he is climbing a steep hill and subject to the effects of gravity. When walking to the right, he is stumbling and falling downhill and also subject to the effects of gravity.

9
THE MATRIX 97% of the wealth of the world is owned by only 3% of the people. Only 5% of traders are successful. What is it that the successful 5% know that the others don't? They don't run with the herd…! Almost everything you've been taught about trading and investing is a head fake. Just a marketing spin to get you to keep buying industry products and services. I'm sure you've noticed: As soon as you enter a trade, the price seems to immediately go against you and as soon as your stop loss order is hit, the price will go back in your original direction. Why is it that when a market changing news event is announced, prices go against trader's expectations. The first thing you need to do is understand where you are on the food chain. Sheep should not listen to wolves, but as you know, wolves dress in sheep's clothing. You will soon discover who the wolves are and how to use them to your advantage. The wolves have always told you that the markets move at random. As Einstein show through the Brownian movement principle, even particle movement is not random. Just a small amount of research will show you that nothing in creation is random. Only the perceptions of mankind are random. For markets to be random would be a defiance of the laws of physics and nature. You do not have to learn these Universal Laws in order to trade "The laws of charts and men" successfully. Part 1 of the book deals with the methodology and science behind the system, showing you why the system works. If you understand the rules behind the system, you will never look at markets or life the same again. Part 2 of the book is the actual system and how to trade it. It's the easiest and most simple trading system you've ever seen. Much of the system is drawn from work of legendary trader, W.D. Gann. Widely recognized as the greatest trader who ever lived, Gann was a mathematical genius and most people cannot approach the level of his mathematical skill to master his techniques. Gann attributed his success to understanding the natural laws of nature. I have included a copy of a newspaper article that is a fascinating look into the mind of this legendary trading genius. Even during the great depression, Gann gave trading seminars at $5,000 per person and still turned people away. The trading percentage of his documented trades are reported to have been 92%. Gann's public predictions are to this day, unmatched in the annuals of trading history. Gann was a gifted mathematician and his techniques are complicated to those not so inclined. This work is not a Gann system. Gann just put me on the right track.

10
Even Gann's system was not a Gann system. It is God's system and systems created by God never change. With this system you only need a 6th grade math aptitude. You will be able to trade what you see, not what you think. The laws of charts and men is a visual system that has taken out all the complex mathematics and enables you to simply trade what you see on the charts. If you can count to 7 you are qualified to understand and successfully trade this system. Know one thing very clearly. Markets, like everything in the manifested universe, are governed by natural laws. Natural laws are universal. They govern all known systems, from galaxies down to atoms. You already know this because you have observed it all your life. The fact is, universal laws like gravity, act the same on the mental level as they do on the physical level. Space, light and even time itself is bent by gravity, so don't you think gravity bends the puny markets of man? What does this have to do with trading markets? Everything...because markets are part of the interconnectedness of the whole of creation and cannot be separated from everything else. Understand that you are not trading markets, you are trading people. You are betting on their imbalanced reactions to fear and greed. Why don't I just keep this information to myself and only make myself rich? To begin with, the more people jumping into a trade with me, generates a higher probability that my trade will be successful. Secondly, I am a business man. I would prefer to take advantages of other opportunities while I am waiting for market setups. Third, I love to teach. It is one of my passions. And yes, I want to earn money for the ten years it has taken me to research, compile and organize this knowledge. But the information is not mine, it belongs to the world. It is through me, but not of me. So, it is not enough for me to make money. I must make money while maintaining my spiritual or karmic balance… while helping to maintain the balance of universal consciousness. If everyone felt this way, earth would be heaven. So if money is given to me in one hand, I have a need to help people make money with the other hand while maintaining spiritual, mental and physical balance. Money is nothing more than a form of energy and energy flows like water. A closed fist is a valve that has been closed to block the flow. When water cannot flow, it ceases to move and becomes a stagnant sewer unable to maintain life. Let me relate to you a life lesson that shows how the universe works. For example: When I was a child growing up on a farm in Tennessee, my mother sent my little brother and I to the well to get water so she could wash. We didn't yet have running water, so we each grabbed a bucket and walked to the well. We filled up our buckets and began making our way back. I was only 10 years old and he was 8.

11
Once filled with water, the buckets were very heavy for us to carry, but especially so for my brother. He was half my size. We were stumbling and bumbling back to the house because the weight of the buckets would drag us down to whichever side we would hold it. First we would hold the bucket on the right and the weight would throw us off balance and we'd stumble to the right... then switch to the left when the right side got tired and then stumble to the left. Sometimes the weight would cause us to lose balance completely and fall. So...at some point, I stopped thinking about myself and felt sorry for my brother. I put my bucket in my right hand and told him, "Give me your bucket." Well, what do you know? When he put his bucket in my left hand, the weight of the bucket yanked my left shoulder down. My right shoulder reacted by immediately rising up, lifting the bucket in my right hand along with it. The weight of the bucket on my left side balanced out the weight of the bucket on the right, and the result balanced out my entire body. Carrying two buckets, one on each side, was actually easier than carrying the one bucket. I could carry more weight and yet, walk straight and without stumbling because I now had balance or equilibrium.

12
WHAT IS MONEY?
Did you ever stop to ask yourself what money is…? I mean what money really is. Money is nothing more than a form of energy. You think not? What do you have to do to get money? You have to work for it, don't you? And what do you do when you work? Yes, you expend energy. When you get your pay check, you have traded units of energy (hours) for a piece of paper that the collective population has agreed to accept as money. That piece of paper has no other value except as a medium of exchange. Let's look at that term "medium of exchange." What is a medium? A medium is a thing that something travels through. An ocean wave travels through the medium of water. Electricity travels through a medium of wire. Energy travels through the medium of money. You have converted your energy to money to make your energy easier to exchange for products and services. If not for money we would be stuck with the barter system. In the barter system, if you were a carpenter you could only exchange your energy with those whom had need of a carpenter. But what if you needed medicine or clothing and no one with medicine or clothing needed carpentry work done? So, now we have a medium of exchange called money. That paper bill you have in your wallet is not money. It is one form of money. Real money is in the form of a physical commodity. Precious metals, food produce, land or materials that can be made into clothing. Paper money, stocks, currencies are an agreement between the collective mass of mankind to accept these papers as money. History has shown many times how a country's economy has imploded and the paper money of that country becomes worthless because there is no real wealth to back up or guarantee the paper. Money is not real. It is a concept that we have all agreed to accept. So we could say that money is an ocean of energy composed of the labor and collective consciousness of mankind. Your energy is broken down into units called "dollars" for purposes of exchange. Everyone has agreed to accept everyone else's energy as long as its in one of the accepted forms of money. This opens the way for more sophisticated transactions than could be accomplished with the barter system. Now you can accumulate and store energy for future use. Not only that but, you can also accumulate and trade the energy of others. But the main thing about energy is this… Energy leaves a heat signature. Each entity leaves a heat signature according to it's form or (GEOMETRY).

13
Universal laws of motion
"IF I HAVE SEEN FARTHER THAN OTHERS IT IS BECAUSE I STOOD UPON THE SHOULDERS OF GIANTS."
SIR ISAAC NEWTON (1642--1727 )
PHYSICIST
• BALANCE-- THE PRIME LAW OF MOTION
• CYCLES -- THE PATTERN OF MOTION
• SACRED GEOMETRY-- THE ROAD UPON WHICH MOTION WALKS

14
THREE UNIVERSAL LAWS DIRECT MARKET MOVEMENTS:
1. BALANCE
2. CYCLES
3. SACRED GEOMETRY
INTRODUCTION TO THE UNIVERSAL LAWS OF MOTION Gravitational, electrical, and magnetic forces are all of what we call forces of nature which exist to support and enforce the compliance of the one law by every particle and biological organism in the universe. Everything in existence is instinctively seeking to comply with this law. And why not? Non-compliance means pain, death, or extinction. Ancient man knew this One law and gave it a name... GOD!!! The One law rules the eco-systems of the universe, galaxies, solar systems, the stars, the planets, biological organisms, subatomic particles and systems as yet undiscovered by the limited mind of man. The One law governs all physical, mental and spiritual processes known to man. It is the law that directs all motion. It is the law of causes, which is responsible for all effects.
BALANCE I'm talking about the LAW OF BALANCE OR EQUILIBRUM, which is simply the law of net forces. Contained within the ONE LAW are forces which are effects of the ONE LAW. We mistakenly call forces 'laws of nature'. Every force has laws that it must operate under, so we have the laws of forces. But a force is not "the" law. We have military and police forces to maintain or enforce the laws of society. These forces have rules under which they must operate. They are not the law itself, but are directed by the law or laws of society. In the same way the law of balance directs the forces of nature. Balance is universal. Everything created interacts with everything else in a balanced system. Without balance there can be no order and without order there can be no stability, and without stability, there could be no life. The universe is one giant eco-system. The ancients knew this and this is why we think of them as primitive compared to modern culture. They had the knowledge to produce many of the technologies we have today and in some cases did. We are just now discovering what has already been known. Modern man has not discovered anything, we are in a process of re-discovery. As it says in the Bible, "There is nothing new under the sun. Everything that is here now has been here before and shall be again." In essence, The Bible is telling us about the cycles of mankind.

15
CYCLES
The Law of Cycles: The world of nature exists within a larger pattern of cycles, such as day and night and the passing of the seasons. The seasons do not push one another. Neither do clouds race the wind across the sky. All things happen in its cycle of time. Everything has a time to rise, and a time to fall. Whatever rises falls, and whatever falls, shall rise again. That is the principle of cycles. Market prices swing up and down in cycles like a pendulum. The swings fall in a predictable cycle of highs and lows. This is because of market psychology. Markets are composed of the collective mind of man. The mind of man has not changed since time began. Markets will move in cycles because they always have. Just as man will always make war... have fear and greed...because he always has. How do cycles relate to the man on the charts? The process of walking is nothing more than a cycle. The science of bio-mechanics shows that a walk is a succession of pushes and near falls, putting the body alternatively out of balance and in balance. In other words a walk is a succession of controlled falls. Since this is the case, the length of a step can be calculated in advance based on the proportions of whomever is doing the walking. This fact that walking is a cycle that can be represented by mathematics makes the science of animatronics possible. The science of animatronics creates the real life motions we see in movies and video games as opposed to the cartoon type motions we grew up with.
SACRED GEOMETRY AT THE HEART OF CREATION
All objects in manifestation are energy or packets of consciousness wearing a skin of numbers. These numerical skins can take infinite variety and form. The profound thing is that this infinite variety and form is created from only 8 geometric shapes. On all scales, from the universally big to the microscopically small, all expressions of form, thought, or motion in existence on all levels... spiritual, mental, and physical are locked into the geometric train tracks that make up the lines and angles of their shapes. Your body is just a pattern of energy. Everything is energy and when energy is projected into a geometric pattern, you have a form. Market energy is projected into geometric patterns that create recognizable forms. All conscious forms are mathematical and geometric. Once again we can take some wisdom from the Bible where it says, "The very hairs on your head are numbered." The Bible also contains "The Book of Numbers." The universe displays a mysterious mathematical order. There is a web of connection at levels that lie beneath the surface of the most educated scientific minds in the world today. Everything is deeper than it first appears. A primary example of this is the Fibonacci number sequence. A set of numbers that is interwoven into all levels of creation. They are everywhere. Italian mathematician, Leonardo Fibonacci, re-discovered these numbers to the

16
western world in the 13th Century. A form is nothing more than a game of connect the dots of energy to create a conscious form or body. The ancient Egyptians and later Greeks discovered Fibonacci numbers. The Great Pyramid of Giza, a structure that modern man cannot reproduce, reflects these numbers throughout its dimensions. Both the Egyptians and Greeks based most of their buildings and art on Fibonacci numbers. The proportions of the human face and limbs are Fibonaccicly numbered. These proportions are called THE GOLDEN RATIO. Examples in the human body include: the nose, the tip of the jaw to where the eyebrows meet, the length of the mouth/nose, the width of the nose, the distance between pupils of eyes, the distance between eyebrows, the tip of the shoulders to the tip of the fingers, shoulder to elbow, elbow to wrist, the base of neck to bottom of feet. These numbers will serve us well when projecting the movements of the man on the charts.

17
Who is the man on the charts?
• WHY THE MAN APPEARS ON THE CHARTS...
• WHAT IS THE MAN DOING ON THE CHARTS…
• WHEN DOES THE MAN APPEAR ON THE CHARTS…
• WHERE DOES THE MAN APPEAR ON THE CHARTS…

18
WHO IS THE MAN ON THE CHARTS?
When we watch TV we see images of people moving about on the screen, but actually they do not move. Electrons hitting the screen constantly reconstruct them. Even this is not entirely correct, because the moving electron is also an illusion of energy, but that's another story. The essential nature of matter is that wave energy arrives wave after wave, at a central location which may even be moving and after that, passing through the center... traveling out again as the other half of the standing wave makes it seem like a thing wobbling in place. Markets also move in waves! What if you could see the market, any market, in the shape of a human form? You can look at the position of a man and see the condition of his balance at a glance. You can look at a chart and see the condition of market balance at a glance. Is he stable enough to rise, or is he so off balance that he can only fall? Well, now you can. You will discover how to use certain knowledge like an infrared camera to see the unseen...TO SEE THE MAN ON THE CHARTS!
THE REALITY OF THE MAN ON THE CHARTS
Can you hold time in your hands? Can you see time? Can you taste or smell time? You can't do any of those things with time, but no one can convince you that time is not real. The only thing you can do is mark your perception of time passing or moving forward. You mark time on a clock, calendar, sundial, etc… and because time is in motion, you can also mark time on a graph or chart. Consciousness or thoughts flow like time. That is to say, consciousness is in motion. Therefore, you can chart it on a graph or chart. Just as charted time takes a circular form or shape, so does consciousness take the shape or form of the organism directing the consciousness. The financial markets are directed by the consciousness of an organism that has a head, shoulders, two arms, two legs and moves/walks in the cyclic manner of an organism with those bi-pedal characteristics. A financial chart is simply the visual representation of the consciousness of an organism in motion. The limits of this motion can be projected according to the science of what we call "bio-mechanics". You don't have to wonder who the man on the chart is, for he is YOU! The man or woman on the financial charts of all markets is a result of the collective mind of man. The collective mind is a group of minds together acting as one mind. The collective mind acts according to the herd principle. Like a school of fish, a flock of birds, or a herd of grazing animals.

19
The reactions of the collective mind are based on fear and greed, not unlike the reactions of a herd. The reactions of a single animal is unpredictable, but the reactions of a herd are very predictable under certain conditions. As much as we hate to admit it, mankind as a collective, reacts exactly like the other animals on planet earth and the principal motivations are fear and greed. The fear of loss and the greed for pleasure. This phenomena manifests itself on every historical price chart. You can see the same cycle of fear and greed over and over again. It is the cause of market manias (bubbles) and the subsequent panic selling that causes market crashes. Just as herds have predators that prey upon the characteristics of the herd by causing them to panic. Financial markets also have predators and they are called operators. We will talk more about them later.
From ABC News On-line... "Scientists Track Footprints of Thoughts"
"Australian scientists have discovered a way to track the electronic footpath of a single thought traveling through the human brain. The discovery has implications for everything from education to planning the safest way to undertake brain surgery. The latest developments in scanning techniques allow brain experts to track responses in the brain from particular movements and thoughts in real time. "If we ask them to read a sentence, we can actually look at them processing a single sentence. In other words, we can look at the footprint of a single thought", Professor Keith Thulborn of Chicago's Center for Magnetic Resonance Imaging, said. The technique can be used to monitor how stroke patients are responding to rehabilitation and how well children are learning new concepts. "This gives you great control over how to plan the intervention and how you can make it most advantageous to the subject to achieve their full potential as quickly as possible." With this technology doctors can tell precisely what is happening during epileptic seizures. "It can lead to ideas for new treatments and even the possibility of a surgical cure", Professor Graeme Jackson of Melbourne's Brain Research Institute, said. Researchers say the technique can be used to help surgeons map out which parts of the brain to avoid during operations.

20
"With functional MRI, we can see where their language is and we can see where their motor function is and if we are doing surgery, we can keep well away from that," Professor Jackson said. So far, the new scanning technique is only available in Victoria, but doctors believe it will be widely available within five years.
WHY DOES THE MAN ON THE CHART APPEAR?
The man on the charts appears because conscious thoughts are matter or actual physical substance. The collective mind is matter in motion, and anything in motion can be represented on a graph or chart. The creator of coordinate geometry, René Descartes, said it best. The following paragraph is from his conclusions.
WHAT IS MATTER?
"Whatever has spatial extension is matter and matter, by definition, is that which has spatial extension. Spatial extension, then, constitutes matter. What is spatial extension? It is length, breadth and thickness... the three straight lines that constitute Euclidean space. So that which has length, breadth and thickness is matter and all matter, on this definition has length, breadth and thickness. When we perform the operation of measurement, we have matter. Matter is measurable extension in space and all questions of form, essence and substance can be disregarded."
PARTICLES
We cannot predict what individual particles will do. We cannot even know where exactly they are or how fast they're going. There is an absolute concrete limit to the amount of data we can have about matter. This limit is stronger than the speed of light. It is stronger than time and space. It is absolute. An individual particle is fundamentally unknowable. It is also not a particle, but let's stay focused. What this means is that particles are unpredictable. They do their own thing. We have no way of knowing what they decide to do. Bunches of particles, on the other hand, are very predictable.

21
Even if we can only say that 51% of the time a particle will go one way and 49% of the time it will go the other way... when you have a trillion particles bunched together as a group, they will go in the direction of the 51% every single time. OR YOU COULD SAY… Even if we can only say that 51% of the time a thought will go one way and 49% of the time it will go the other way, when you have a trillion thoughts bunched together as a group, they will go in the direction of the 51% every single time. OR YOU COULD SAY… Even if we can only say that 51% of the time a human will go one way and 49% of the time it will go the other way, when you have a 6 billion humans bunched together as a group, they will go in the direction of the 51% every single time. There is no gulf between the laws that govern the motion of the world and human consciousness. A financial market fits René Descartes definition of matter. It has length, breath and depth. A market is the manifestation of human consciousness. Therefore, a market is a manifestation of matter and a chart is the visual representation of matter in motion. This is why you have the man on the charts.
WHAT IS THE MAN ON THE CHARTS DOING?
The man on the charts is trying to maintain his balance. It is instinctive. All of our sciences have shown that everything that exists is trying to maintain a state of balance against the interaction of forces against it. The great scientist Sir Isaac Newton stated this fact. Isaac Newton re-discovered what he called, "THE LAWS OF MOTION". Newton's first law of motion states, "A BODY AT REST TENDS TO STAY AT REST AND A BODY IN MOTION TENDS TO STAY IN MOTION WITH T HE SAME SPEED AND IN THE SAME DIRECTION UNLESS ACTED UPON B Y AN UNBALANCED FORCE." In other words, if something is moving in a certain direction at a certain speed, it will maintain that direction and speed until it runs into something or something runs into it. As you will learn, a market moves in one direction until it runs into support or resistance. In other words, everything is trying to stay still and will only move if it is motivated into action by a force that throws it off balance. The reason for the movements of a body are the steps it must take to regain its balance. Just as balance is the universal law, the process or steps it must take to regain balance once lost, is also universal.

22
As you will later see, the most efficient way for a body to correct its balance is a process of steps. Every manifestation in creation must follow this law of correction. Albert Einstein said, "You can neither create nor destroy energy and matter. Energy and matter can only be transformed from one to the other." Your labor energy is transformed into matter ( paper money ) or your matter is transformed into energy when you pay for labor energy. Here, we have a repeating cycle. Energy to matter, matter to energy, back and forth. That is of course, if you agree that Einstein knew a couple of things. The market body, which takes the shape of the man on the charts, must also go through stages of correction. But the amazing thing is, the stages follow certain mathematical laws that are universal. This is the law of proportions or ratios, that we will discuss in Sacred Geometry. The point is, anything that follows definable mathematical laws is predictable. You see, when market numbers manifest outside the boundaries of universal law, this causes imbalance in the universe. I have many times been in utter amazement when I think the system of market balance is about to fail and then, WHAM! Out of the blue, there will be a breaking news announcement that will propel the market in the direction of balance. The universe will create circumstances to start a reaction which will impel the process of correction. The universe, by using the force of gravity, has and always will prevail. A news event may move the market, but what causes the actual event... that shapes the news. If you are standing still and I run into you, there is no doubt you will stumble. I am the unbalanced force because I am in motion, and anything in motion is unbalanced. This results in your stumble or imbalance causing your motion. But you are not going to just fall. You will fight to maintain your balance or equilibrium to keep from falling and to do this you must move. This is the interaction that goes on between everything in nature and this interaction is the cause for all motion. If everything was always in perfect balance there would be no reason for motion or life. Anything that has no motion we call dead, lifeless or inanimate ( not conscious ). The man on the charts is constantly stumbling trying to maintain or regain his balance against the market forces of supply, demand and gravity.
WHEN DOES THE MAN ON THE CHARTS APPEAR?
The man appears on a chart when the market is about to correct its balance or equilibrium. This happens when there is an imbalance between supply and demand. When there is more demand for an item than there is supply, the price on the financial unit or anything that is perceived as having value, goes up. When an item, financial unit, or anything that is perceived as having value is plentiful and demand for it is low, the price will go down. The price will go up until supply is in balance with demand; just as the price will go down until supply is in balance with demand. In balance, meaning equal or equilibrium.

23
WHERE DOES THE MAN ON THE CHARTS APPEAR?
The man appears at the top of the chart after an up-trend to signal an impending reversal to a down-trend. The man appears at the bottom of the chart after a down-trend to signal an impending reversal to an up-trend. Common market chatter among the so-called experts say that you can't predict tops or bottoms. I agree with that. But you don't need to predict a top or bottom, you only need to be able to recognize a top or bottom once it has formed. Also, you can project the most logical location where a top or bottom is most likely to occur.
HOW TO TRADE THE MAN ON THE CHARTS?
The man will start to show himself when this imbalance starts to occur. His appearance is like the turn signal on a car in front of you signaling a left turn or a right turn. Now, nine times out of ten, the car in front of you will turn in the direction signaled. But once in a while, as you know, the driver will not turn in the direction signaled. Now if you were to bet every time that the car will turn in the direction signaled, you would become a very rich man, indeed. Let's say you bet 10 times and each time you bet $100. You would win 9 times, so you win $900. You would lose one time, so you lose $100. That's $900 won - $100 lost = $800 net profit. In fact, for you to lose money you would have to be wrong 6 times out of 10. That is how you trade markets like a business. Not like the hit a lick approach taken by most amateurs who trade once in a while off of a hot tip and hope they are right. Just like in the wild, predators single out the weak individuals in the herd to feed off. The market predators called operators single out and feed off the weak hands of the market. Just like any business, you have overhead. The typical business owner has to pay rent, utilities, insurance, labor, etc… and this is simply the cost of doing business. The few trades that you lose money on are your cost of doing business. Being human we all want something for nothing if we can get it, but the reality is there is no free lunch. If you want to make money trading markets you have to learn one thing. Experience and history has taught me that humans hate to learn anything. Almost everything we know has been handed down to us and we call that learning. I call it programming. You want to make money, spending your time before you spend your money. The Forex market allows you the opportunity to change your life for a mere $300 to open an account. For most people I know, that is beer money for a month. So don't complain about your lot in life if you are not trying anything different or even educating yourself. People go to college for years and accumulate extraordinary debt just to be able to attain a certain income level but the average person feels they have failed as a trader just because they miss on a couple of trades which may cost them around $100. As I said, the mind of man has not changed since time began.

24
REACTIONS OF THE MAN ON THE CHARTS
• A PARABLE OF THE MAN ON THE CHARTS…

25
THE LAW OF PROBABILITIES
When you set up your trading correctly you are not really betting on the market. You are betting on the laws of mathematical probability, the laws of numbers. You are betting that at a given point, the price will move up $100 before it falls to $50. Or, the price will fall $100 before it rises to $50. You don't have to predict the market. You only need to identify high probability situations of momentum.
INTRODUCING THE MAN ON THE CHARTS
I'm making a claim. There is a figure of a man on the financial charts. He is seen when you connect the dots of data like a stick figure. When you draw him, the posture of his body will tell you the condition of his balance and by proxy, the condition of market balance. Let's say you are watching a man running in an eastward direction. A moving wall that is right behind him is chasing the man. He is running in a zigzag pattern. The man keeps turning left, or north and then turning right, or south while steadily heading eastward all the time. He cannot turn and run back west because there is a wall closing in behind him, pushing him eastward. Every time he moves, the west wall behind him also moves, while staying on his heels all the time. You wonder to yourself… why does he keep changing direction? Then, you take a closer look. You notice that there is a wall both to his left, or north and to his right, or south. When the man turns north, he will continue north until he runs into the north wall. He tries to break through the north wall, but it is too strong, so he turns around and starts running to his right, or to the south. He will keep running south until he runs into the south wall. He will try to break through the south wall, but the wall is too strong. So once again, he turns back to his left and heads north until he hits the north wall again. And the cycle repeats over and over. Now the man is running down MARKET STREET . The wall chasing behind him is called TIME . The north wall is called RESISTANCE, and the south wall is called SUPPORT. The man is trying to break out of the triangular shaped box of Time, Resistance and Support. It is not possible for him to break through time, so he is trying to breakout through either the wall of support or through the wall of resistance.

26
In the above illustration figure ( 1) may not rise up to the resistance level, but is capable of doing so because of he is rising off a base of support with perfect balance. Figure (2 ) definitely cannot rise because he is off balance and will fall down to support. Have you ever tried to rise while off balance and falling? No, you haven't because when falling, all you can think of is gaining balance. And if you don't think of it, your body will do it automatically. A financial market moves exactly like a man because it is a man. The man's name is Mr. Mind. Full name… Mr. Collective Mind. There is something important about the directions the man is running and turning towards. When the man is traveling to his left, or to the north, he is climbing up a hill. The higher he climbs, the steeper the hill gets. When the man is traveling to his right, or south, he is going down a hill that gets more level the further down the hill he goes. The hill has a name and the name of the hill is PRICE HILL . Sometimes the man succeeds in breaking through the wall of SUPPORT or RESISTANCE. When the man is running north or uphill, or south downhill, sometimes he is running so fast, he hits the wall with so much momentum he will crash through it… or the wall is too thin or becomes weakened from him running into it so many times. However, a funny thing happens when the man crashes through the north wall. He has used up so much energy crashing through the wall that he needs to catch his breath. Since the hill is getting steeper the higher he goes, and the breaking of the wall has caused him to slow down and lose momentum, he starts to slide back down the hill. He will slide down the hill until he hits the wall he just broke through (the wall that is now

27
below or south of him). It used to be the north wall. It was above his head. Now he is standing on top of it. It is now the new wall to his right (the south wall). The man can now use the old north wall (which is now the new south wall) to push off like sprinters blocks so he can gain enough speed and momentum to break through the next north wall. Sometimes he will sit and rest on the new south wall before continuing his upward climb. When Mr. Mind is traveling downhill (south) he goes through the same process of breaking through the south wall, only to encounter another south wall. When the man is headed down toward the south wall, he moves faster than he does when traveling north. This is due to the force of gravity constantly pushing down on him. When he moves downhill he is less under control because he is off balance. Whenever the north wall rejects him, the force of the impact spins him around south and before he can gather his balance to head back north, gravity has already swung his momentum south. So the man will stumble and fall down the hill until he hits a south wall of support, which is the same as saying somewhere to set/plant his feet. Have you ever tried to rise up with nothing to stand on? It can't be done. Another way to say it is this: If you are falling, you will continue to fall until you hit something. Also, you can't stand up unless you have something to stand upon.

28
IT IS MORE THAN A SIDE-NOTE THAT A MAN MUST HAVE BALANCE TO BE ABLE TO RISE. WITHOUT BALANCE, THE MAN MUST STUMBL E OR FALL; ANOTHER ITEM OF IMPORTANCE IS THE FACT THAT THE MAN REQUIRES ENERGY TO RUN UPHILL AGAINST THE FORCE OF GRAVITY, BUT NEEDS NO ENERGY TO FALL BECAUSE GRAVITY WILL FORCE HIM TO FALL IF HE RUNS OUT OF ENERGY. You start to notice a pattern here. You notice that the man's reactions are predictable. Not his actions, but his REACTION S. You notice that whenever Mr. Mind runs into a wall of support or a wall of resistance, he reacts in certain predictable ways. He will either break through the wall and continue to the next wall, or the force of the impact will bounce him off the wall and force him to turn. The pattern of Mr. Mind at support or resistance will be covered in the section under THE LAWS OF CHARTS . The most predictable point in the man's travels is when he is involved in the process of turning. At a precise point in the turn, Mr. Mind will hit a TRIANGULATION POINT. Covered in the section under THE LAWS OF BALANCE. You can look at the man's feet and shoulders to see when he has reached a triangulation point or point just before momentum kicks in. When the man's body has crossed the triangulation point, the physical laws of gravity and momentum kick in. The man may yet recover and continue in his original direction, but before he can do so, gravity and momentum will force him a certain minimum distance that is easy to calculate before he can regain his balance. If you were to make a bet on which way the man was going to travel, the safest time to bet would be when he crosses the triangulation point. At this point you are not betting on the direction of the man. You are betting that the universal laws of nature bind the man. You are betting on natural law...the beginning of time laws. If it were dark and cloudy with lots of wind, thunder and lightening, would you bet that it's going to rain? If you did, you would win. Maybe not every time, but you would be right at least 7 out of 10 times, wouldn't you?

29
BELOW IS A SIMPLE BALANCE BEAM SCALE. THE WEIGHT S CALES YOU SEE AT YOUR DOCTOR'S OFFICE WORKS EXACTLY LIKE THIS, AND IS GIV EN THE MODERN NAME OF "TRIPLE BEAM SCALE." BUT WHEN ITS ALL SAID AND DO NE, IT IS NOTHING BUT A SEE-SAW...SAME AS THE ONE WE PLAYED ON AS A CHILD. YOU SEE, YOU ALREADY KNOW HOW BALANCE WORKS, YOU JUST NEVER CONSCIOUSLY BROKE BALANCE DOWN INTO PARTS. YOU NEVER HAD A REASON TO.
If both arms of the scale are holding equal weight and the angle of the arms are level (or balanced) there is no movement or motion. There is an equal force of gravity on each arm so the forces are in equilibrium. The weight of both sides cancel each other out so there is no movement.
But whenever the weight on one arm becomes heavier than the weight on the opposite arm, the load becomes unbalanced and this imbalance starts the downward motion of the heavier arm. This is to say that motion is started by a gravity imbalance. The force of gravity will start motion by pushing the heavier arm (load) downward while at the same time swinging the lighter arm (load) upward. So, imbalance is the action or mechanism for motion. It must happen this way according to the laws of nature. The law of gravity. There is no guess work. No complex calculations? How powerful is gravity? The gravity of a black hole in space will even bend light! This process describes the cause of all motion. Motion on the physical, mental, and spiritual level all work this way because gravity causes all motion.

30
HOW TO WIN AT LEAST 7 OUT OF 10 TRADES
• HOW TO TRADE LIKE A BUSINESS...
• THE IMPORTANCE OF RATIOS...
• THE POWER OF COMPOUNDING...
• CYCLES OF A WALKING MARKET PART I...

31
HOW TO TRADE LIKE A BUSINESS
Most traders have no game plan. They enter the markets with a swing for the fences approach. They either hit a home run or they strike out. But, just like the sport of baseball, the home run hitters have more strikeouts than home runs. However, the batters that hit for average have a much better success rate. If a player gets a hit 4 out of 10 times, for their career, they are a sure bet for the Hall of Fame. As a trader, 4 out of 10 successful trades will earn you a living, 5 out of 10 will earn you a high standard of living, and 6 out of 10 will make you rich. 95% of all new traders lose their startup capital within 6 months. So, logic would dictate that you find out what the 95% are doing and do exactly the opposite, and find out what the successful 5% are doing and do what they do. If you are to be successful you need an approach that will give you an edge. The casino industry profits billions every year from a 3% house edge. They know that they are going to lose money to some gamblers but, over time, the law of probabilities is in their favor. Most traders are like gamblers. Even when they win they eventually lose it back through their greed. You cannot trade with rent money because you will trade out of fear. The rent is due next week but the market is moving slowly. Now you will begin to force trades before the market is set up for the trade. The market moves when it moves. It doesn't care if the rent is due or baby needs a new pair of shoes. You should trade with money you can afford to lose so you can build up your account to a level that you can comfortably withdraw funds. If you are a small trader starting with $500 or less and you make $100 on a trade then immediately withdraw your profit to pay a bill, how can you build your account to a level to where you can make the big money. Because, on your next trade you may lose $100 drawing your account down to $400. Now you are saying to yourself, "I am in the hole $100. If I lose $100 on my next trade, I will then be down to $300." Now you will trade with fear of loss instead of the prospect for gain. And as the old saying goes " scared money don't win." In order to eliminate fear and greed from you trading you need to have confidence in your trades. Confidence can only be gained from the knowledge that you have a repeatable process.

32
IF YOU CAN PREDICT AN EVENT CORRECTLY 7 OUT OF EVERY 10 TRIES YOU CAN BECOME RICH .
You can become rich fast if you parley your winnings into bigger bets.
To do this you must profit $2 when you win a bet and only lose $1 when you lose a bet. Let's flip a coin. You get $2 every time you guess corretly that the coin will come down heads or tails. But you lose $1 every time you guess wrong. This is called a 2 to 1 profit to loss ratio. We will flip the coin 10 times and you'll start with $10. Now say you guessed correctly on only 4 of the 10 coin flips, and guessed incorrectly on 6 of the 10 coin flips. Guess what? You still made a profit. You made $8 from the 4 times you guessed correctly and lost $6 from the 6 times you guessed incorrectly. This result is due to your 2 to 1 profit to loss ratio. Now remember. Every time that coin is flipped you have a 50/50 chance of guessing right. But, what if you could improve your odds of guessing right to 80-90% ? But we'll be conservative and only improve your odds to, say 70%. So, say you've got a trick coin and you know that it will come up heads 7 out of every 10 coin flips. So, you bet heads every time. Now, you know that the coin is going to come up tails three times and you will lose $1 each time for a total of $3 lost. but you also know that you're going to win 7 times at $2 a pop for a total of $14. You just made $14 and lost $3 and that leaves you with a total of $11 profit. Is it safe to say if there was a coin flipping market, and you could use this trick coin, that comes up heads 7 out of 10 times with this 70% coin, wouldn't you be in the coin flipping market as much as you could? You would want to make bigger bets and make bets more often to make money faster. This is what a 3 to 1 win loss ratio does for you. That means that you guessed correctly 3 times for every 1 time you guess incorrectly. With a 2 to 1 profit to loss ratio and a 3 to 1 win loss ratio, you can become rich quickly through the power and magic of compounding.

33
THE POWER OF COMPOUNDING
If you started with 1 penny and doubled it every day for one month you would have $10 million dollars at the end of the month. Go ahead. Take out your calculator and do the math. Just punch .01 into your calculator and hit, X 2, thirty consecurive times. $1 doubled =$2. $2 doubled =$4. $4 doubled =$8. $8 doubled =$16. $16 doubled =$32. $32 doubled =$64. $64 doubled =$128. $128 doubled =256. $256 doubled = $512. $512 doubled =1,024. $1,024 doubled =$2,048. $2,048 doubled =4,096. $4,096 doubled =$8,192. $8,192 doubled =$16,384. And it continues on. This type of growth is called geometric progression. Whether it's flipping a coin, horse racing, sports, playing the casinos or trading financial markets it is all the same thing. The same system of probabilities at work. If you have a 2 to 1 profit to loss ratio and a 3 to 1 win loss ratio, you can compound your winning trades into wealth within one year. Assuming you had at least 50 trading opportunities over that time period. In fact, with a 2 to 1 profit to lose ratio you would have to be wrong 7 out of 10 time to lose money. So, if you are only right 4 out of 10 times you will still make money. You just won't make it as fast. Therefore, if you're going to trade the market like a pro and earn consistant profits you need a system that will give you:
• A minimum 2 to 1 profit to loss ratio
• A minimum 2 to 1 wins to losses ratio
• Allows you to compound earnings
• Allows for affordable drawdowns
How do you know a system will give you all these things? Historical performance that you can backtest. Visually or mathematicly.

34
You can look at charts for any time frame in history. Any liquid and free market. A system with a track record that has delivered. A system you can check without doing complex mathematics. For a system that will give you a 3 to 1 win loss ratio. So you can profit on 7 out of every 10 trades. For a system that has a proven 2 to 1 profit to loss ratio so you earn $2 for every $1 you lose. For a system that allows you to compound earnings fast by allowing you to control $200 for every $1 invested. For a system that manages your losses so you can stay in the game long term. You need a system you can visually inspect for historical performance just
by looking at charts for 15 minutes.
A system that can spot setups with an 80% success probability, that will generate a 2 to 1 Profit to loss ratio, So you can profit on 8 out of every 10
trades…
• If, price movements are a reflection of a changes in supply and demand.
• And you could see where the balance of supply and demand had changed.
• Then you could predict the direction of the market with a high degree of probability.
If you know supply and demand moves in cycles, and you know where the market is within that cycle, then you know where the market is headed at least 80% of the time.

35
CYCLES OF A WALKING MARKET
As we said earlier, everything in manifested creation moves in cycles. Time, the motion of planets, weather, tides etc… For every cycle there are smaller cycles within the larger. Example; Time has cycles within cycles. If you start with a 1 year cycle, contained within it are monthly, weekly, daily, hourly, minutes, seconds, nano seconds so forth and so on. For purposes of our discussion we will start with the most basic human cycle. You probably never thought of walking as a cycle. You probably never even thought about the mechanics of walking at all. You just do it. If you can understand how a human walks you can see how it correlates to the walk of a market. To explain to you the mechanics of the human walk I will let an expert explain it. Read the following article by an animatronics expert. A person that designs animitations to exactly mimic the human walking process. "Gravity is the key Let me define the technical basics of what 3D animation exactly is. As I said earlier, in a believable universe we have to consider laws of nature. The main law that directly affects any movement in a believable universe is gravity. Every motion in a 3D space either is created by gravity or is a reaction to gravity. For example, you are probably sitting while reading this article. Try to stand up and visualize what keeps you standing. Mostly, it is the muscles in your legs (especially the thighs), and possibly the muscles in your arms if you are using the table to lift you up, that produce a force strong enough to counterbalance the effect of gravity. The creation of a force is the basis for motion in a 3Dspace. However dry this topic may sound, bear with me, because understanding the basics often makes the difference between good and bad animations. If you keep in mind that your character has to create a force to counterbalance the effects of gravity every time you want to move it, you will avoid many of the common mistakes. What does it really mean? A quick example can illustrate my point. If you want to have a standing character going from point A to point B, you have two ways of solving the problem: You can select the mesh of the character, or his center of gravity, and move it from A to B. Here, you are creating an artificial force that allows you to move the body.
36
You can create the motions (the forces) that will move this center of gravity from A to B. This is done by replicating the way a body moves in the real world. In the first solution, you are creating the illusion of movement. The second solution means you are understanding and reproducing the way physical laws create a movement. Some people will disagree with this because it makes inverse kinematics invalid. The truth is, inverse kinematics is a bit of a monster. Making a character walk by moving its feet is wrong; it is the total opposite of a natural walk to imply that the feet are moving because the legs are moving. Rather, it is simulating a motion, instead of reproducing a motion, and trying to create an effect without knowing what forces produce it. You should be only interested in knowing what make things move, because if you understand what you do, you can control it. Gravity, and how it is used to create movement, is the first rule of three-axis animation. The two other rules are balance, tilt and twist. Let me explain to you how those rules are tied together and can be used to create a complex animation.”

37
OUT OF BALANCE
I already said that every motion is related to gravity and, in a way, created by it. Actually, it is known as being in balance or out of balance. Almost every move starts by putting the body out of balance and ends by regaining balance before falling down. To explain this, let me try to define two very important concepts: the center of gravity, and the idea of balance. The center of gravity is a point situated between the hips (higher or lower depending of the body mass). This center of gravity is usually the first bone or root point of a character skeleton. To move the body, the limbs have to move the position of the center of gravity. A body is in balance when you can trace a vertical line from the pit of the neck (upper torso), the ankle of the supporting foot (if the character is supporting his weight on one leg), or to a line that joins the two ankles (if the character is supporting his weight equally with his two legs). If this line is not perfectly vertical, the body is out of balance. You will notice that the center of gravity can be positioned anywhere in relation to that line. The only important points are the pit of the neck and the ankles. The amount of unbalance is relative to the angle of the line. The body is more likely to fall if the angle between the body and the ground is increased.
A body is in balance when you can trace a vertical line from the pit of the neck, the ankle of the supporting foot,
or to a line that joins the two ankles.
The human walk is a great example to illustrate these two concepts and show how they are related. When starting from a standing position, (assuming our subject is right handed) the first movement of the walk is the forward rotation of the right leg around the hipbone, lifting the right foot up in front of the body. At the same time, the left leg rotates around the knee (the thigh is almost locked in place, the calf muscles produce all the force), and the left foot follows by rotating around the ankle. The body pushes forward as a result of the left leg rotation, and since the right foot is not in contact with the ground at that moment, the center of gravity is displaced. The whole body moves forward. This forward movement suddenly stops when the center of gravity passes in front of the supporting left leg (the balance line is not vertical anymore). The body becomes totally out of balance and falls forward. This is when

38
the right leg makes contact with the ground, and becomes the supporting leg and stops the fall. The body continues its forward motion. The whole movement repeats, however, this time the right leg is producing the forward thrust and the left leg is lifting to catch the fall. A walk is a succession of pushes and near falls, putting the body alternatively out of balance and in balance. We are using the effects of gravity to move our body mass on a linear path, with our legs simultaneously producing the thrust force and support. A walk is a succession of controlled falls. As you can see, trying to animate a walk without knowing that you have to move the center of gravity by putting the body out of balance is very difficult. If you do not know why each part of the body moves, you cannot understand how they move. The good news is that there is an easy rule to remember: every movement of the body is based on a thrust (from the calves, thighs, arms, etc.), moving the center of gravity out of balance, and then a catch by a leg or an arm, putting the body back in balance. The amount of thrust and the time between the thrust and the catch determine the amplitude of the movement. Of course the more nimble the character is, the more extreme his movements will be. Moving a body means playing with gravity and playing with balance. If you remember that rule before starting any animation, you will have more control on what you can create. We have to twist the shoulders in the opposite direction of the hips to keep the body in balance. The head will also have to twist a little in the same direction as the hips.
Now that you really understand the process of walking you are prepared to
Understand how a market walks. The market is collective man so it walks like a man.
39
CYCLES OF A WALKING MARKET PART II
JUST PLAY THE TURNS BABY JUST PLAY THE TURNS!
• OVERVIEW...
• TREND…
• WHY THERE IS SUPPORT AND RESISTANCE...
• THE BALANCE OF SUPPLY AND DEMAND
• HISTORICAL SUPPORT AND RESISTANCE
• TRENDLINES
• PROJECTED SUPPORT AND RESISTANCE

40
THE CYCLES OF A WALKING MARKET
Steps turn into swings. Swings move to test support/resistance. The strength of support/resistance is with the trend. Back and forth this is the cycle of a market. Or… That
is how a market walks.
• Trend-is the box that contains price movements • Support/resistance-historical and projected-are the walls of the box • Swings-are the turns that price makes while trying to break out of the box • Steps-Each price bar is a footstep of the market.
No one can predict when the market will turn but you can know if the market has turned. When a market turns it must obey the physical laws of turns. Once an object in motion is in the process of turning it reachs a triangulation point. A point where once crossed, the turn must be completed or the object in motion will lose balance and fall. A simple 3 bar chart pattern occurs each time the market hits a triangulation point of supply and demand with an accuracy of at least 8 out of 10 appearancess. For instance; Say you are walking and right in the middle of your stride you decide you want to turn and go back the way you came. There occurred a point somewhere in your stride that was your point of no return. The point where it was impossible to turn around until you completed that last stride and your foot hits the ground. You are in a position of balance where the laws of gravity and momentum kick in and if you try to turn at this point and you will fall on your butt.
Markets react the same way. Markets must follow the same laws of motion as everything
else in creation.

41
TREND
In this section, we'll discuss "trends." A trend represents a consistent change in prices (i.e., a change in investor expectations). Trends differ from support/resistance levels in that trends represent change, whereas support/resistance levels represent barriers to change. A rising trend is defined by successively higher low-prices. A rising trend can be thought of as a rising support level--the bulls are in control and are pushing prices higher.
Why the trend is as strong as the tide: Think of a market as fluid in motion like an ocean. When the tide comes in it does not rush in all at one time. The tide comes in a series of ebbs and flows. Each incoming wave comes in further and further towards shore while each outgoing wave is going out a shorter and shorter distance until we have high tide. It works in reverse on the way out until we have low tide. Market trends are just tides in an ocean of human consciousness. When the tide is coming in you can see that during the ebbing and flowing of the waves that
there are smaller waves within the bigger waves. Some of the waves are on the way out while the waves from the main tide is coming in. All is well until the outgoing waves crash into the in coming waves. When this happens the out going waves are swept away with the main tide
which is incoming.
This process happens in reverse when the tide is going out.
Market trends occur in precisely the same manner. There are smaller waves of price movement occurring within the bigger trend. A price move or wave can only last until it hits the main wave. The tide. When a price movement goes against the tide of the main trend it will be swept away by the main tide at a point of support or resistance. But trend can only be understood in the context of support and resistance. In the following sections trends will be discussed in more detail.

42
THE BATTLE BETWEEN SUPPORT AND RESISTANCE
Markets cycle between support and resistance. Support is a wall of buyers while resistance is a wall of sellers. Why is there Resistance: A market goes up until it hits a wall of sellers. This wall is composed of people who bought the market before it went down, so they are losing money and are just waiting until the price comes back up to the price where they bought. Then, when price comes back up to their buying price, they sell so they can break even. Then there are those buyers who bought at the lower price and wait for price to hit the wall of sellers so they can sell and take profits. Add to those, the people who sell short at the wall, attempting to profit from price bouncing back down off the wall of sellers. In summary the wall of sellers is composed of three elements of traders. Those trying to break even, profit takers and short sellers. Why is there Support: A market goes down until it hits a wall of buyers. This wall is composed of people who sold short the market before it went up, so they are losing money and are just waiting until the price comes back down to the price where they sold short. When, price comes back down to their selling price, they buy back their position so they can break even. Then there are those sellers who sold at the higher price and wait for price to hit the wall of buyers so they can buy back and take profits. Add to those, the people who buy at the wall, attempting to profit from price bouncing back up off the wall of buyers. In summary the wall of buyers is composed of three elements of traders. Those trying to break even, profit takers and buyers looking to profit from the upward bounce.

43
THE BALANCE OF SUPPLY AND DEMAND
The picture above is a balance scale. You can see how the process of supply and demand operates. On the right arm of the scale you have buyers of a market. On the left arm of the scale you have sellers of the market. Both arms are balanced at equal levels because the weight of buyers and sellers are the same which results in a balanced market. In a balanced there is no price movement. On the left arm of the picture is the price axis of the market. If you add a buyer to the buyer side what would happen on the left arm? Of course the left arm (price) will go up. It must go up, wouldn't you agree. In fact, the more buyers you add to the buy side the higher the left arm must move up. If the arms are in balance and you add a seller to the left arm what would happen? Yep. The left arm (price) must go down. If the arms are in balance and you subtract a buyer from the right arm what would happen? Correct. Gravity will push the suddenly heavier left arm down while pulling the right arm up.. If the arms are in balance and you subtract a seller from the left arm what would happen? Bingo! The force of gravity pushing on the right side will pull the left arm (price) upward. This is how a market operates. In a back and forth cycle. The cycle of supply and demand.

44
All of the motion in these scenarios is started by imbalance. You could go as far to say that imbalance is the ignition for all motion. The physical level, the mental level, and the spiritual level. But that is an issue for another book. When looking for trading opportunities what you are really doing is looking for situations with a supply and demand imbalance. The man on the charts will alert you to supply and demand imbalances in any market.
HISTORICAL SUPPORT AND RESISTANCE
The support level of a stock is the lower end of its recent trading range (BOTTOM). The resistance level of a stock is the upper end of its recent trading range (TOP). The Dow theory suggests buying or selling when a price is near its support or resistance
level - buy low, sell high.
The foundation of most technical analysis tools is rooted in the concept of supply and demand. There is nothing mysterious about support and resistance--it is classic supply and demand. Remembering "Econ 101" class, supply/demand lines show what the supply and demand will be at a given price. Resistance is equivalent to a "supply" line. When prices increase, the quantity of sellers also increases, as more investors are willing to sell at these higher prices. When too much selling occurs, however, prices retreat. When this happens repeatedly near a specific price level, resistance forms at that price level. Support is equivalent to a "demand" line. When prices decrease, the quantity of buyers increases, as more investors are willing to buy at lower prices. When too much buying occurs, however, prices rise. When this happens repeatedly near a specific price level, support forms at that price level. Following the penetration of a support/resistance level, it is common for traders to question the new price levels. For example, after a breakout above a resistance level, buyers and sellers may both question the validity of the new price and may decide to sell. This creates a phenomena referred to as "traders' remorse" where prices return to a support/resistance level following a price breakout. The price action following this remorseful period is crucial. One of two things can happen. Either the consensus of expectations will be that the new price is not warranted and prices will move back to their previous level; or investors will accept the new price and prices will continue to move in the direction of the penetration.

45
When a resistance level is successfully penetrated, that level becomes a support level. Similarly, when a support level is successfully penetrated, that level becomes a resistance level. Support and resistance represent key junctures where the forces of supply and demand meet. In the financial markets, prices are driven by excessive supply (down) and demand (up). Supply is synonymous with bearish, bears and selling. Demand is synonymous with bullish, bulls and buying. These terms are used interchangeably throughout this book. As demand increases, prices advance and as supply increases, prices decline. When supply and demand are equal, prices move sideways as bulls and bears fight for control.
What is Support? Support is the price level at which demand is thought to be strong enough to prevent the price from declining further. The logic dictates that as the price declines towards support and gets cheaper, buyers become more inclined to buy and sellers become less inclined to sell. By the time the price reaches the support level, it is believed that demand will overcome supply and prevent the price from falling below support.
Resistance does not always hold and a break above resistance signals that the bulls have won this battle with the bears. A break above resistance shows a new willingness to buy and/or a lack of incentive to sell. Resistance breaks and new highs indicate buyers have increased their expectations and are willing to buy at even higher prices. In addition, sellers could not be coerced into selling until prices rose above resistance or above the previous high. Once resistance is broken, another resistance level will have to be established at a higher level.

46
Where is Resistance Established?
Resistance levels are usually above the current price, but it is common for a market to trade at or near resistance. In addition, price movements can be volatile and rise above resistance briefly. Sometimes it does not seem logical to consider a resistance level broken if the price closes a couple above the established resistance level. For this reason, some traders and investors establish resistance zones.
Methods to Establish Support and Resistance?
Support and resistance are like mirror images and have many common characteristics. Highs and Lows: Support can be established with the previous reaction lows. Resistance can be established by using the previous reaction highs.
The chart for HAL shows a large trading range between Dec-99 and Mar-00. Support was established with the October low around 33. In December, the stock returned to support in the mid-thirties and formed a low around 34. Finally, in February the stock again returned to the support scene and formed a low around 33 1/2. After each bounce off support, the stock traded all the way up to resistance. Resistance was first established by the September support break at 42.5. After a support level is broken, it can turn into a resistance level. From the October lows, the stock advanced to the new support-turned-resistance level around 42.5. When the stock failed to move past 42.5, the resistance level was confirmed. The stock subsequently traded up to 42.5 two more times after that and failed to surpass resistance both times.

47
Support = Resistance Another principle of technical analysis stipulates that support can turn into resistance and visa versa. Once the price breaks below a support level, the broken support level can turn into resistance. The break of support signals that the forces of supply have overcome the forces of demand. Therefore, if the price returns to this level, there is likely to be an increase in supply, and hence resistance. The other turn of the coin is resistance turning into support. As price moves above resistance, it signals changes in supply and demand. The breakout above resistance proves that the forces of demand have overwhelmed the forces of supply. If the price returns to this level, there is likely to be an increase in demand and support will be found.
In the $NDX example, the market broke resistance at 935 in May-97 and traded just above this resistance level for over a month. The ability to remain above resistance established 935 as a new support level. The stock then rose to 1150, but then fell back to test support at 935. After the second test of support at 935, this level is well established.

48
From the PSFT example, we can see that support can turn into resistance and then back into support. PSFT found support at 18 from Oct-98 to Jan-99 (green oval), but broke below support in Mar-99 as the bears overpowered the bulls. When the stock rebounded (red oval), there was still overhead supply at 18 and resistance was met from Jun-99 to Oct-99. Where does this overhead supply come from? Demand was obviously increasing around 18 from Oct-98 to Mar-99 (green oval). Therefore, there were a lot of buyers in the stock around 18. When the price declined past 18 and to around 14, many of these buyers were probably still holding the stock. This left a supply overhang (commonly known as resistance) around 18. When the stock rebounded to 18, many of the green-oval-buyers (who bought around 18) probably took the opportunity to sell. When this supply was exhausted, the demand was able to overpower supply and advance above resistance at 18.

49
Trading Range Trading ranges can play an important role in determining support and resistance as turning points or as continuation patterns. A trading range is a period of time when prices move within a relatively tight range. This signals that the forces of supply and demand are evenly balanced. When the price breaks out of the trading range, above or below, it signals that a winner has emerged. A break above is a victory for the bulls (demand) and a break below is a victory for the bears (supply).
After an extended advance from 27 to 64, WCOM entered into a trading range between 55 and 63 for about 5 months. There was a false breakout in mid-June when the stock briefly poked its head above 62 (red oval). This did not last long and a gap down a few days later nullified the breakout (gray arrow). The stock then proceeded to break support at 55 in Aug-99 and trade as low as 50. Here is another example of support turned resistance as the stock bounced off 55 two more times before heading lower. While this does not always happen, a return to the new resistance level offers a second chance for longs to get out and shorts to enter the fray.

50
In Nov/Dec-99, the LU formed a trading range that resembled a head and shoulders pattern (red oval). When the market broke support at 60, there was little or no time to exit. Even though the there is a long black candlestick indicating an open at 59, the stock fell so fast that it was impossible to exit above 44. looking back, the support line could have been drawn as an upward sloping neckline (blue line) and the support break would have come at 61. This is only 1 point higher and a trader would have had to take action immediately to avoid a sharp fall. However, the lows match up rather nicely on the neckline and it is something to consider when drawing support lines. After LU declined, a trading range was established between 40.5 and 47.5 for almost two months (green oval). The resistance level of the trading range was well marked by three reaction peaks at 47.5. The support level was not as clearly marked, but appeared to be between 40 and 41. Some buying interest began to become evident around 44 in mid to late February. Notice the array of candlesticks with long lower shadows, or hammers as they are known. The market then proceeded to form two up gaps on 24-Feb and 25-Feb, and close above resistance at 48. This was a clear indication of demand winning out over supply. There were still two more opportunities (days) to get in on the action. On the third day after the breakout, the stock gapped up and moved above 56.

51
Support and Resistance Zones Because technical analysis is not an exact science, sometimes it's better to create support and resistance zones. This is contrary to the strategy mapped out for LU, but it is sometimes the case. Each market has its own characteristics and the analysis should reflect the personality of the market. Sometimes exact support and resistance levels are best and sometimes zones work better. Generally, the tighter the trading range, the more exact the level. If the trading range spans less than 2 months and the price range is tight, then more exact support and resistance levels may be better. If a trading range spans several months and the price range is relatively large, then it is probably best to use support and resistance zones. These are only meant as general guidelines and each trading range should be judged on its own merit.
Returning to the analysis of HAL, we can see that the November high of the trading range (33 to 44) extended more than 20% past the low, making the range quite large relative to the price. Because the September support break forms our first resistance level, we are ready to set up a resistance zone after the November high is formed, probably around early December. At this point though, we are still unsure if a large trading range will develop. The subsequent low in December, which was just higher than the October low, offers evidence that a trading range is forming and we are ready to set the support zone. As long as the stock trades within the boundaries set by the support and resistance zone, we will consider the trading range to be valid. Support may be looked upon as an opportunity to buy and resistance as an opportunity to sell. In the preceding section, we saw how support and resistance levels can be penetrated by a change in investor expectations (which results in shifts of the supply/demand lines). This type of a change is often sudden and based on a news event.

52
TREND LINES
Draw trend-lines at pivots
Technical analysis is built on the assumption that prices trend. Trend Lines are an important tool in technical analysis for both trend identification and confirmation. A trend line is a straight line that connects two or more price points and then extends into the future to act as a line of support or resistance. Many of the principles applicable to support and resistance levels can be applied to trend lines as well. It is important that you understand all of the concepts presented in our Support and Resistance article before you continue.
Up trend Line An up trend line has a positive slope and is formed by connecting two of more low points. The second low must be higher than the first for the line to have a positive slope. Up trend lines act as support and indicate that net-demand (demand less supply) is increasing even as the price rises. A rising price combined with increasing demand is very bullish and shows a strong determination on the part of the buyers. As long as prices remain above the trend line, the up trend is considered solid and intact. A break below the up trend line indicates that net-demand has weakened and a change in trend could be imminent.

53
Downtrend line A downtrend line has a negative slope and is formed by connecting two or more high points. The second high must be lower than the first for the line to have a negative slope. Downtrend lines act as resistance, and indicate that net-supply (supply less demand) is increasing even as the price declines. A declining price combined with increasing supply is very bearish and shows the strong resolve of the sellers. As long as prices remain below the downtrend line, the downtrend is considered solid and intact. A break above the downtrend line indicates that net-supply is decreasing and a change of trend could be imminent. For a detailed explanation of trend changes, which are different than just trend line breaks, please see our series on the Dow Theory.

54
Validation It takes two or more points to draw a trend line The more points used to draw the trend line, the more validity attached to the support or resistance level represented by the trend line. It can sometimes be difficult to find more than 2 points from which to construct a trend line Even though trend lines are an important aspect of technical analysis, it is not always possible to draw trend lines on every price chart. Sometimes the lows or highs just don't match up, and it is best not to force the issue. The general rule in technical analysis is that it takes two points to draw a trend line and the third point confirms the validity.
The chart of MSFT shows an up trend line that has been touched 4 times. After the third touch in Nov-99, the trend line was considered a valid line of support. Now that the stock has bounced off of this level a fourth time, the soundness of the support level is enhanced even more. As long as the stock remains above the trend line (support), the trend will remain in control of the bulls. A break below would signal that net-supply was increasing and a change in trend could be imminent.

55
Angles As the steepness of a trend line increases, the validity of the support or resistance level decreases. A steep trend line results from a sharp advance (or decline) over a brief period of time. The angle of a trend line created from such sharp moves is unlikely to offer a meaningful support or resistance level. Even if the trend line is formed with three seemingly valid points, attempting to play a trend line break or use the support and resistance level that has been established will often prove difficult.
The trend line for YHOO was touched four times over a 5-month period. The spacing between the points appears OK, but the steepness of the trend line is unsustainable and the price is more likely than not to drop below the trend line. However, trying to time this drop or make a play after the trend line is broken is a difficult task. The amount of data displayed and chart size can also affect the angle of a trend line. Short and wide charts are less likely to have steep trend lines than long and narrow charts. Keep this in mind when assessing the validity and sustainability of a trend line.
Conclusion Trend lines can offer great insight, but if used improperly, they can also produce false signals. Other items - such as horizontal support and resistance levels or peak-and-trough analysis - should be employed to validate trend line breaks. While trend lines have become a very popular aspect of technical analysis, they are merely one tool for establishing, analyzing, and confirming a trend. Trend lines should not be the final arbiter, but should serve merely as a warning that a change in trend may be imminent. By using trend line breaks for warnings, investors and traders can pay closer attention to other confirming signals for a potential change in trend.

56
PROJECTED SUPPORT AND RESISTANCE
• FIBONACCI
• FIRST RISE FIRST FAILURE
• PARABOLA HUNTS
• CONTINUATION GAPS
• SECOND HIGH SECOND LOW
• PATTERN CYCLES
In prior sections we have talked about historical support and resistance. Historical support and resistance is based on actual highs and lows the market has made in the past. Projected support and resistance is predicted to occur at a level that has yet to occur but has been calculated mathematically using what has come to be called "SACRED GEOMETRY." In this section we will explore some of the components of projected support and resistance levels. You will learn about fibonacci numbers and how they structure the shape of the market by defining the limits of a retracement.

57
PROJECTED SUPPORT AN RESISTANCE
While historical support and resistance are based on prior price action of a market, there is another type of support/resistance level. They are projected based on mathematics. FIBONACCI TRADING W.D. Gann, R.N. Elliott and others who traded according to universal physical laws, spent years studying the market's mystical side, trying to figure out how obscure ideas could tap hidden profits. Most traders believe Fibonacci fits in the category of market witchcraft, but this arcane science has a basis in fact. A 12th century monk known as Fibonacci discovered a logical sequence that appears throughout nature. Beginning with 1 + 1, the sum of the last two numbers that precede it creates another Fibonacci number. For example: 1+1=2, 1+2=3, 2+3=5, 3+5=8, 5+8=13, 8+13=21, 13+21=34, 21+34=55, etc.
Major ratios between Fibonacci numbers identify expected retracement levels, as markets pull back after rallies or sell offs. The most common Fib retracements are 38%, 50% and 62% of the principal price movement. These are price levels where many traders expect important reversals and bounces. For obvious reasons, these also represent entry signals in many short-term strategies. Fibonacci patterns and Elliott Waves are cousins. According to Elliott, major rallies or sell offs occur in three primary waves, with two countertrend waves in between. These waves are often boxed into major retracement levels.
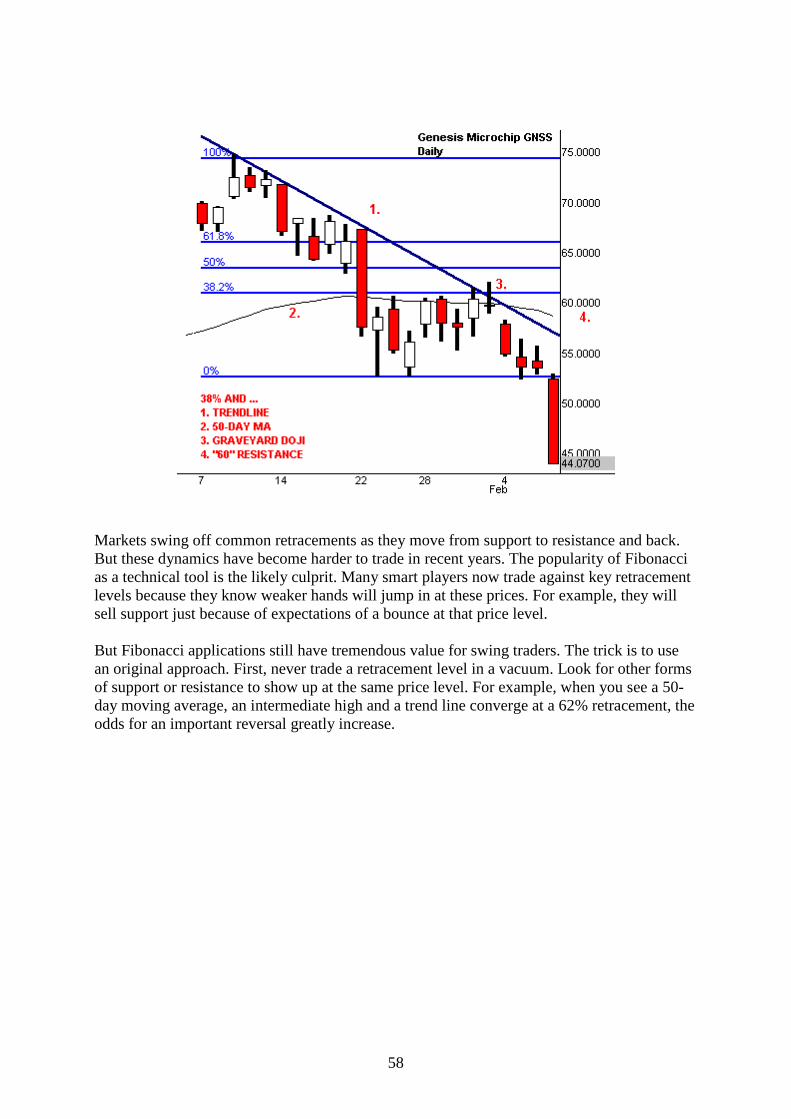
58
Markets swing off common retracements as they move from support to resistance and back. But these dynamics have become harder to trade in recent years. The popularity of Fibonacci as a technical tool is the likely culprit. Many smart players now trade against key retracement levels because they know weaker hands will jump in at these prices. For example, they will sell support just because of expectations of a bounce at that price level. But Fibonacci applications still have tremendous value for swing traders. The trick is to use an original approach. First, never trade a retracement level in a vacuum. Look for other forms of support or resistance to show up at the same price level. For example, when you see a 50-day moving average, an intermediate high and a trend line converge at a 62% retracement, the odds for an important reversal greatly increase.

59
You can also learn to trade the Fibonacci whipsaw. Stand aside when price pulls back to a deep retracement level. Let other traders take the bait and get shaken out when price breaks through the number. Then let the market reverse and jump back across the retracement level. Use this crossing as your entry signal. The markets usually punish only one side of the action at a time. Fibonacci Tricks Fibonacci jumped into the technical mainstream late in the bull market. Futures traders had it all to themselves until real-time software ported it over to the equity markets. Its popularity exploded as retail traders experimented with its arcane math and discovered its many virtues. Fibonacci ratios describe the interaction between trend and countertrend markets -- 38%, 50% and 62% retracements form the primary pullback levels. Apply these percentages after a trend in either direction to predict the extent of the countertrend swing. Stretch a grid over the most obvious up or down wave, and see how percentages cross key price levels. Convergence between pattern and retracement can point to excellent trading opportunities. Keep in mind that retracements work poorly in a vacuum. Always examine highs, lows and moving averages to confirm the importance of a specific level. Discord between retracement and the underlying pattern generates noise instead of profit. Move on to a new chart when nothing lines up correctly. This divergence generates most of the whipsaw in a price chart. Alternatively, strong phasing between Fibonacci and pattern exposes highly predictive reversals at narrow price levels.

60
First Rise/First Failure Let's look at five tricks to improve your Fibonacci skills. Add these twists and turns to your toolbox and apply them to your next trade. I promise they'll serve you very well in the years ahead.
First Rise/First Failure marks the first 100% retracement of a trend within your time frame of interest. It provides an early reversal warning after a new high or low. The 100% retracement violates the major price direction and terminates the trend it corrects. From this level, the old trend can reestablish itself if it breaks through the old 38% level. More often, traders will use that level to enter low-risk positions against the old trend.

61
Parabola Hunt
Parabolic movement tends to occur between the 0%-to-38% and 62%-to-100% Fibonacci levels in all trends. This tendency offers a great tool for finding the big moves when looking for trades. Watch for congestion to form at the 38% or 62% level. Then use a simple breakout or breakdown strategy when price moves past it. The next thrust can be dramatic, with price moving like a magnet back to an old high or low. Of course, the strategy only works when you can find these levels in advance.
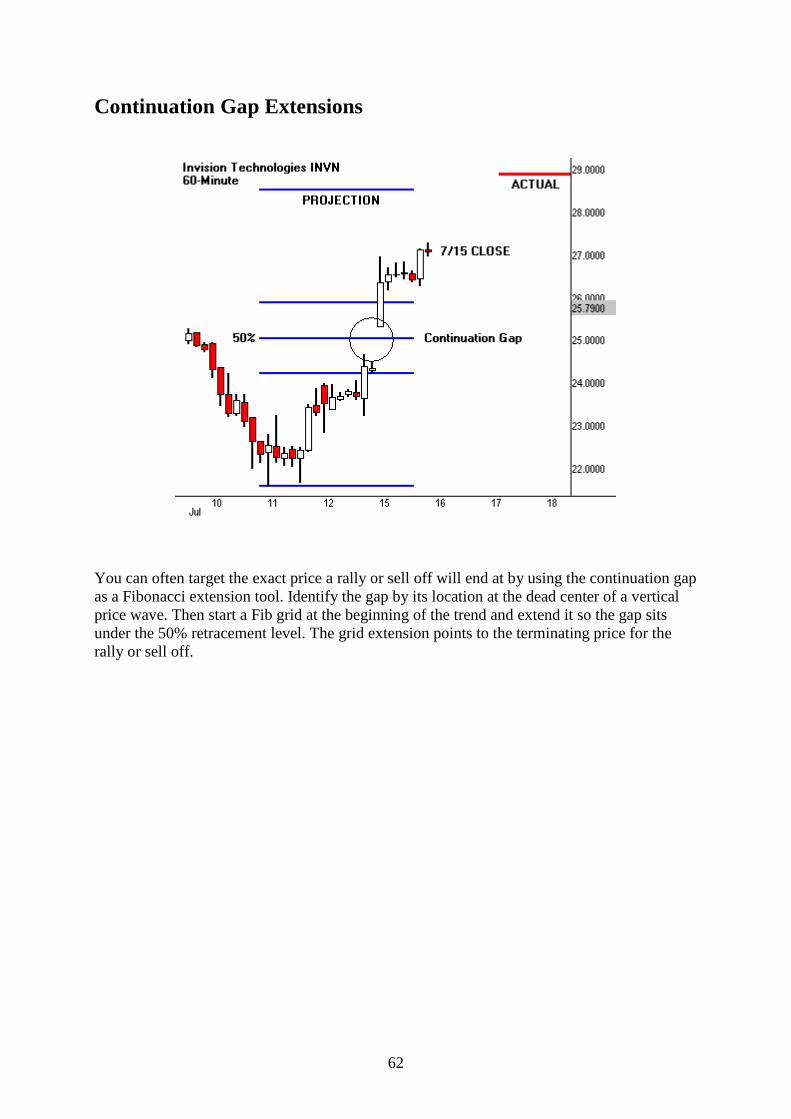
62
Continuation Gap Extensions
You can often target the exact price a rally or sell off will end at by using the continuation gap as a Fibonacci extension tool. Identify the gap by its location at the dead center of a vertical price wave. Then start a Fib grid at the beginning of the trend and extend it so the gap sits under the 50% retracement level. The grid extension points to the terminating price for the rally or sell off.

63
Second High/Low

64
PATTERN CYCLES: AT TOPS
No trend lasts forever. Inevitably, crowd enthusiasm outpaces a market's fundamentals and rallies stall. But topping formations do not end up trends all by themselves. These stopping points may only signal short pauses that lead to higher prices. Then again, they could be long-term highs just before a major breakdown. What hidden patterns can you use to identify and trade reversals before your competition sees them? Successful short-term traders get in the reversal door early and allow the herd to trigger sharp price movement. Familiar trend-change formations, such as the Head & Shoulders and Double Tops, take so long to develop that many profitable entries pass before they finally signal an impending break to the waiting crowd. First Rise/First Failure offers traders an early method to identify reversals following new highs or lows in any time frame. First Rise/First Failure identifies the first 100% retracement of a dynamic trend move within the time frame of interest. In order for any trend to continue, price movement should find support near a 62% retracement, measured from the starting point of the last thrust that pushed price to the new high or low. From this pullback, trend must base and test its extension before it can break out to further continuation highs or lows. 100% retracement violates the major price direction and terminates the trend it corrects. Completion also provides significant support/resistance, where bounce trades can be initiated with low risk. From this point, continuation trends may reawaken in the next larger time frame by a new break through the 38% (prior 62%) S/R and continued push past the 62% retracement, toward a test of the high/low extension. Bounce reversals represent superb entry points when the 100% violation coincides with a 38% or 62% retracement of the next higher dynamic time frame. However risk: reward requires careful measurement, as the trade may develop more slowly than expected. In other words, a successful position must be held through expected congestion at the 38%-62% zone before it can access a profitable retest of the double top/double bottom extreme. Allow minor testing violations for all major Fibonacci retracements before taking positions. Specialists and Market Makers know these hidden turning points and conduct stop-gunning exercises to take out volume just beyond the breaks. And watch out for trend relativity errors. Bull and bear markets exist simultaneously through different time frames. Limit First Rise/First Failure trades to the time frame for which the retracement occurs unless cross-verification supports other setups. Every popular topping formation has its own unique pattern features. But all tell a common tale of crowd disillusionment. Whether printed in the manic highs and lows of the Head & Shoulders or the slow capitulation of the Rising Wedge, the final result remains the same. Price breaks sharply to lower levels while unhappy shareholders unload positions as quickly as they can. Early in a rally, value and improving fundamentals attract knowledgeable holders. But as an up trend develops, the motivation for new participants becomes vastly different. News of a market's rise generates excitement and pulls in the greed crowd. These momentum players slowly outnumber the value investors and stock movement becomes more volatile. The issue

65
continues upward as this frantic buying crowd feeds on itself well beyond most reasonable price targets. Both fire and ice will kill up-trends. As long as the greater fool mechanism holds, each new long allows the previous one to turn a profit. Eventually changing conditions will force an end to the upside action. A shock event, such as a major news story, can suddenly kill the buying enthusiasm, forcing a sharp and immediate reversal. Or the trend's fuel just runs out as the last interested buyer enters one last position. Many traders mistakenly assume bulls turn into bears immediately following a dramatic, high volume reversal. They enter short sales well before the physics of topping and decline rob the crowd of its momentum. In fact, these early shorts provide fuel for the sharp covering rallies seen in most topping formations. Skilled traders wait and measure the process of crowd disillusionment before they enter large short sales. Decline characteristics can be predicted with great accuracy using pattern analysis. While they wait, the repeating character of the topping event provides a natural playground for swing positions.

66
TIME FRAME ANALYSIS
Any attempt to analyze price action must be relative to the time period for which you are trading. Some traders invest over the long term, several weeks to several months, and even years. Then you have short term traders or speculators. Speculator have a much shorter time frame and attempt to profit from short term price gyrations over a few minutes to a few days. If you are a long term investor you should be looking at monthly and weekly charts for your analysis. If you are a swing or day trader you need to be looking at the daily and intra-day charts. Like the waves of the tide, the bigger waves take longer to take shape than the smaller waves but also move a lot farther while undergoing larger swings. The point is. You must stay relative to the time frame you are trading and the time frame you are trading should reflect the amount of capital you are working with. An intra-day chart may have swing of 100 points either way. A weekly chart may display 300 point swings. A monthly chart may show 600 point swings. So, can you afford a 100 point, 300 point, or 600 point draw-down to your trading capital. The good thing is that markets are fractal. The same trade signal patterns show up on every time frame. Cycles within cycles. The more capital you have, the larger the cycle that you can trade, and the larger the potential profit or loss on the trade. The less capital you have, the smaller the cycle you can afford to trade and the smaller potential profit or loss. In this section we will discuss the issue of TREND RELATIVITY.

67
TIME TRADING
Sophisticated technical indicators evolve from simple data inputs of price and time. While most traders understand how price patterns reveal hidden opportunity, many fail to comprehend how time impacts both tactics and results. Lacking a skilled understanding of opportunity cost, they misinterpret signals and waste valuable resources. Or, trapped in common trend relativity errors, they prepare trades in one time frame but execute them in another. Opportunity cost defines how the trader manipulates working capital. For example, this important concept reveals why cutting losses efficiently is so important for long term survival. By its nature, taking any market position dictates that those funds will not be available for another trade. This becomes a critical issue on account draw-downs when individual trades can dictate success or failure for the trader. All trends in the markets are time frame specific. For example, the existence of an up-trend in a daily chart says nothing about the trend in the monthly or intra-day chart. This highlights the importance of correct time input in preparing technical indicators or reading chart patterns. While improperly time-tuned technical analysis loses its effectiveness, proper time readings will prove to be startlingly accurate with otherwise mediocre data input. Time Summation of indicators falls into three general categories: . - Moving averages of elements such as price or volume - Relationships between the open, close, high and/or low of individual bars - Repeating cycles of price or volume behavior Time Period of indicators falls into three general categories: - Short Term - Intermediate Term - Long Term

68
Individual units of time are best viewed as relative periods, as opposed to daily, weekly or monthly lengths. Since no two traders trade in exactly the same time frame, patterns and indicators must serve a broad range of uses. Fortunately, technical analysis studies a fractal market. Valid predictions may be made with indicators developed from 5-min bars or monthly ones in exactly the same manner. But don't be fooled: prediction can only be made in the same time frame as the tools being used to study it.
Trend Relativity: Trends are dependent on the time frame in which you are viewing them. While IBM shows a promising reversal taking place on the intraday, the daily and weekly show a major correction in progress. Notice how the weekly reveals an excellent buy point at the top of the multiyear price channel, a support level completely missed on the daily chart. Keep in mind that markets often move in 1-2-3 patterns. Countertrends follow a natural tendency to pullback, bounce and then pullback again before finding support. Traders often fool themselves by jumping on the first bounce rather than waiting for the corrective move to unwind. The deeper a stock corrects, the less likely it will take out the old trend high and break into another wave. For this reason, only tight and small 1-2-3 patterns signal new trend movement. You have seen how trend is the tide that that pushes the major price movement and how price establishes support and resistance zones at tops and bottoms all occurring in the direction of, and reacting within the major trend or tide.

69
Time Frame Divergence: Price action in 3 time frames generates different support-resistance considerations while Qualcomm tries to halt a sharp decline. The daily chart prints a hammer reversal near a 6-month low. The 60-minute chart shows a bearish pullback into an ugly down gap, while the 5-minute chart offers short-term traders excellent profits through a midday bounce near whole numbers. Any analysis should be done within the context of, at least the next longest time frame. An intra-day analysis Should consider the daily price action. A daily analysis should consider the weekly price action. A weekly analysis should consider the monthly price action. Monthly analysis Should consider yearly price action.

70
WHY YOU SHOULD TRADE IN THE DIRECTION OF THE HEAD AND SHOULDERS
How would you define balance? Imbalances cause predictable deviations in a persons posture. The first definition of balance is comparable to that of stability or the ability to control your body's center of mass. Postural sway demonstrates a deviation of the center of gravity from balance When encountering by a force that dislocates balance, a body must turn or fall backwards. There are mechanics of turning in such a way as to maintain balance.
THE BALANCE MECHANICS OF A STANDING HUMAN OPERATE EXACTLY LIKE A BALANCE BEAM SCALE: The shoulders are the first key to balance. When the shoulders are level balance is maintained. When the shoulders become uneven past an angle of 45 degrees, an area of critical mass is reached. Critical mass is a point of no return. Once past critical mass is reached a body must fall due to the severity of the imbalance . A point which once past, a body will instinctively react or take steps to regain balance. This reaction is called motion.

71
When you see a man in this position he has reached a triangulation point. Even a child can see that this man is off balance and is about to fall. If you bet on a resulting fall from this body posture, don't you think you'd be right at least 7 out of 10 times.
It is obvious in this illustration that the man is about to fall. The reactions of an off balance man are predictable. Now, look at the arms of the man. As you can see his arms swing upward. That is because balance begins at the head and shoulders the first reaction is to swing the arms up in an effort to level the shoulders. This reaction will temporarily slow the momentum of the fall and then the downward momentum will continue. After the first reaction of swinging the arms fails to reestablish balance, how far will the man fall? He will fall until he can find support. In the illustration above the table is the first level of support. Before the man falls all the way to the floor he will reach out and grab the table to catch and support his weight. If the table is strong enough it will stop his fall. The fall must stop before he can reestablish his balance. A man can only rise from a position of balance and support. you cannot rise unless you have some type of support to push off of. Well, I'm sure you've never lost your balance and fell, but for those of us who have, the first thing we do is start flailing our arms in an attempt to grab something to break our fall (catch our balance). The concept of support and resistance is so important to trading markets that the theme will be repeated throughout this manual.

72
The illustration below represents the apparatus of balance for everything in creation. When you draw a circle around a man what you get is not an exact circle. What you get is called an
elliptic circle or an elliptical orbit.
Did you know that the orbits of planets are non circular but elliptical. You may be thinking, "what does this have to do with markets. Listen, markets are a part of the universal wholeness of creation. A planet is in balance with it's solar system. A solar system is in balance with it's galaxy. A galaxy is in balance with it's universe and a universe is in balance with it's dimension. As it says in the bible and has been proven with the discovery of fractals, " As above, so below. Most solar system objects that we are familiar with like the planets, asteroids, even the particles in the rings of Saturn are all in elliptical orbits. Most of these orbits are very nearly circular, but once again, to be considered "circular" they have to be perfectly circular. To my knowledge, there is nothing in a truly circular orbit around the Sun. Anything in a circular orbit crashes into the sun and burns up. A more down to earth description of an ellipse is to say it forms the shape of an Egg. We all know what comes from eggs and it is life.

73
But more to the point of our discussion lets look at the motion of an egg. If you push a circle it will roll but, if you push an egg from one end it will rock back and forth like a see-saw. A circle has no beginning or end. Like the universe, and man himself, a market is just another egg of creation and thus the birth of motion springs from this shape.
In the meantime take a look at this ellipse or egg and discover how it relates to TREND. The force is pushing that end of the egg upward. However, even though the current motion of the egg is upward the trend is still down because the weight and angle of gravity. So, if the momentum of the upward force slows down, The gravitational force will push the egg back down. This is exactly the way it works in a financial market. If you think markets are not subject to gravity tell me why markets fall faster than they rise? Why does it take more buying energy for a market to rise than it does to fall. The fact is that it takes no energy to fall. A body will fall due to it's own weight unless it has support. This, my friend, is basic gravity.
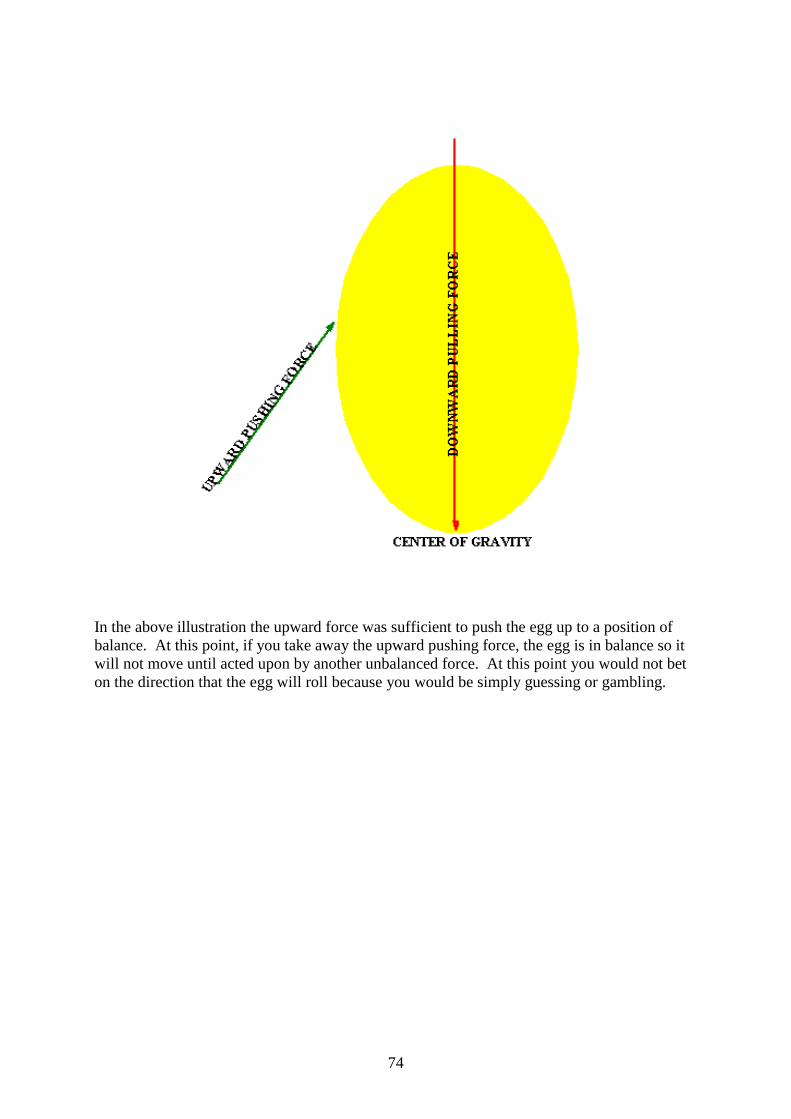
74
In the above illustration the upward force was sufficient to push the egg up to a position of balance. At this point, if you take away the upward pushing force, the egg is in balance so it will not move until acted upon by another unbalanced force. At this point you would not bet on the direction that the egg will roll because you would be simply guessing or gambling.

75
As we can see in this illustration the upward force has pushed the egg past the point of perfect balance. The first angle of support is 45 degrees. This is the angle of triangulation. It is the point of no return. Once a body has passed this point it cannot go back in the opposite direction until it reaches the next angle of support which is 90 degrees. The trend has now changed. The egg may react or retrace to the 45 degree angle and bounce back down. The balance of the egg has now shifted to the new direction. Once past the triangulation point or 45 degree angle, man or market becomes predictable. From here on we will refer to the triangulation point as the pivot point.
Once again, this is how balance works for all things in creation.
In our illustrations the upward force was sufficient to push the egg up to a position of balance. At this point, if you take away the upward pushing force, the egg is in balance so it will not move until acted upon by another unbalanced force. At this point you would not bet on the direction that the egg will roll because you would be simply guessing or gambling. But once past the pivot point You have predictability.

76
As a side note to all of this, scientists call an equation a "Law" when they discover something that they see as fundamental to the way entire universe works and that has never been contradicted by other empirical evidence that can't be explained. The whole strength behind Kepler's First Law was that it allowed for the future positions of the planets to be predicted precisely far into the future, something that had never been possible before with the previously proposed complicated schemes. The elliptical orbit idea was so simple while neatly explaining and predicting planetary motion extremely well that it was seen as a fundamental revolution in scientific thinking. His laws explained the facts of how scientists knew the universe behaved. If we can predict the precise position a planet will be in far into the future, don't you think the precise position of a market can be predicted also. What is more preeminent? The universe or a market. So, if you think I'm wrong you are saying that man and his markets are stronger than the forces of nature. Or market forces are stronger than nature's forces.

77
HOW TO KNOW WHEN TREND HAS CHANGED?
There is one chart pattern that makes an appearance whenever a major trend change takes place. If you want to know where the trend began look back for the most recent head and shoulders pattern. If you want to know when the trend will end, just wait for the next head and shoulders pattern.
HEAD AND SHOULDERS PATTERNS
HEAD AND SHOULDERS TOP: A head and shoulders pattern consists of a peak followed by a higher peak and a lower peak with a break below the neckline. The neckline is drawn through the points of the two intervening troughs and may slope upward or downward. A sloping neckline is more reliable as a signal.
The extent of the breakout move can be estimated by measuring from the top of the middle peak down to the neckline. This target is then projected downwards from the point of the breakout.

78
Volume Confirmation:
• High volume during formation the first peak,
• Moderate volume during formation the middle peak,
• Low volume during formation of the third peak, and a sharp increase in volume on the break below the neckline.
Trading Signals:
• Sell (go short) at breakout below the neckline.
• Place a stop - loss just above the last peak.
After the breakout, price often rallies back to the neckline, which then acts as resistance level. Sell (go short) on a reversal signal and place a stop - loss one tick above the resistance level.

79
HEAD AND SHOULDERS BOTTOM Inverted Head and Shoulders: With inverted head and shoulders the neckline is drawn through the highest point of the two intervening peaks. A downward sloping neckline signals continuing weakness and is less reliable as a reversal signal. The extent of the breakout move can be estimated by measuring from the top of the middle trough up to the neckline. This target is then projected upwards from the point of the breakout.
Volume Confirmation:
• High volume during formation of the first trough,
• Moderate volume during formation of the second trough,
• High volume during formation of the third trough, and
• A sharp increase in volume at the breakout

80
Trading Signals:
• Buy (go long) at breakout above the neckline.
• Place a stop - loss one tick below the last trough.
There is frequently a correction back to the neckline, which then acts as a support level. Buy (go long) on a reversal signal and place a stop - loss one tick below the support. Never trust an inverted head and shoulders pattern where the neckline is clearly descending (the second peak being lower than the first). The more level the neckline, the more reliable the pattern.
Summary: Completion of a head and shoulders pattern signals a reversal in the Balance of power from long to short or from short to long.
Now you know what a head and shoulders pattern is, whether you should trade long or short, how to confirm the pattern with volume and angle of the neck line, where to enter your trade, where to take your profits, and where to place your stop loss.

81
THE MAN ON THE CHARTS:
• By now you can see the head and shoulders pattern is a reproduction of the head, shoulders and neck of the man on the charts. But there is more!
• The amazing thing is that the head and shoulders pattern is not only a visual representation of a man. It is a mathematical reproduction of a man.
• The word "Representation" means symbol, image, depiction, illustration, demonstration, or sign.
• The word "Reproduction" means original, copy, duplicate, facsimile, or replica.
• The angle of his shoulders tells you his state of balance. But there is more!
• A man has more than the body parts discussed above. He also has legs and feet.
• The length of the move from the top of the right shoulder to the target price represent the leg he is striding with. Each price bar represents a footstep, and he will pivot before each turn (high or low).

82
MECHANICS OF A MARKET SWING
• WHAT IS A SWING
• STOP PLACEMENT
The up and down movements of market price are called swings. The most profitable time to enter a trade is when the swing reverses. When the swing reverses there is a stampede of buying and selling activity from which momentum is gained for the next directional price thrust. Like the pendulum on a grandfather clock, once a swing has started, it will continue to the next support or resistance level. In this section we will discuss what a swing is and how it helps you place your stop loss. There is a specific chart pattern which alerts with high probability that a market swing has occurred. After a swing has started, momentum will carry price to the next support or resistance level. The mechanics of a market swing are exactly like the mechanics of a man executing turns or swings while walking. A market swings on temporary imbalances of supply and demand. In this section you will see what a market swing is, and how knowing when a market swings has occurred tips you to the most likely direction of the next price wave. You will see how knowledge of a market swing shows you the best places for your stops.

83
MARKET SWINGS
Within the major trends are occurring smaller trends called swings. Like the smaller waves that are going out against the tide there are smaller price waves occurring within the tide called trend. A market swings up to resistance and swings down to support. After a trend has been established price will swing up and down in the direction of the trend. Prices will move up and down between short term highs and lows, support and resistance, all within the context of the trend. So next we need to talk about swings.
• What is a market swing
• When has the market swung
• Where will the market swing
• How does a market swing
• Why does a market swing
• Who makes the market swing
To understand the where's and why's of stop loss placement, we must first understand market movement. A brief explanation of this is called Swing Movement. It's been better popularized as the Fibonacci Retracements.
A Swing is a movement from low to high, or high to low. For example, a 1-2-3 bottom consists of 4 swings. The move which ends at the #1 point low is a down swing. The rally up to the #2 point is an upward swing, while the swing down to the #3 point is a swing, and the rally which penetrates the #2 point is the 4th and final swing.

84
So when you examine charts you should look at the swings and look for markets which are making higher highs and higher lows to buy, while you look for markets which are making lower highs and lower lows to sell. After the trend has been defined, you must figure out where the trend would change. For a Bull Market it would be the last swing low (point #1 on the above chart). For a Bear Market it would be the last swing high. In other words, the basic rule is to trade in the direction of the trend and risk the trade to where the trend is no longer valid, as a maximum stop loss. When the #2 point is penetrated, the market is making lower lows. This pattern is the very definition of a Bull Market turning to a Bear Market. Therefore we place our stop order to enter the market on a break out or any penetration of the #2 point. If the market then turns around and breaks back past the #3 point, it would have just broke the Bear Market rule. (The market would no longer be making lower highs.)
you should place your stop loss order more conservatively, just behind the #3 point as opposed to waiting for the market to break the #1 point. Each extreme of a swing, should act as support or resistance. The same rules apply for a 123 Top formation, are also good for a 123 Bottom formation. The price bars on a chart are nothing more than the footprints of the man on the charts. They share the same anatomy of a human footprint and thus, can be tracked the same way a lost camper in the wilderness can be tracked. Have you ever seen footprints in the snow? Have you ever followed footprints while looking for you friends playing hide and seek? Can't you look at the footprints and tell what kind of animal left the tracks? In the next section we will begin to learn how to track the man on the charts.

85
In the illustration above the weightlifter can lift the weights as long as the weights are evenly balanced. But what happens if we add more weight to one side and not the other. For sake of example we will say that the weightlifter cannot release the weights. They are an extension of his body.
The unbalanced weight would force the other side of his body to turn or swing around TO THE UNBALANCED SIDE. The market operates according to these same principles. The weightlifter did not chose to turn, the force of gravity or weight forces him to swing. In a market there are three forces. Buyers, Sellers, and gravity. These forces cause man and market into cyclic swings of balance and imbalance, action and reaction, up and down.

86
FOOTPINTS OF THE MARKET
Stride - Two steps right -left-right (R-L-R) or left-right-left (L-R-L) that is the distance between one footprint and the next footprint made by that same foot. Key track-way measurements include pace, stride, and pace angle. The terms "pace" and "stride" were often used inconsistently in the past. However, today the term pace (or step) refers to the distance from one footprint to a corresponding point on the next succeeding print (in other words, from a right to a left, or a left to a right). The stride is the distance from one footprint to a corresponding point on the next print of the same foot (say, from a right to the next right print). Pace angle (the same as step angle) is the angle formed between two successive paces. One popular exercise using track-way measurements is to estimate the speed of the track-maker. Generally, if the pace distance is four or more times the track length, one can describe the gait as "running." The estimated speed of travel can be calculated using formulas developed by R. M. Alexander and others (Alexander, 1989). An experienced tracker can tell a lot just by footprints Merlin, who previously tracked continued lion presence in Tucson's Saguaro National Park West, says animal tracks "tell you all kinds of things, including the gender and mood of an animal, whether it's playful and frisky or in a hunting mode." "If you look at this track, you can see energy," said Mac Stewart, the tracker at that station, pointing to a track with sand sort of pushed into a ridge along one edge. "It's a slowdown and a direction change. It's a decision." Trackers also measure the distance between tracks to help determine the animal's speed and gait, as well as noting how the feet fell in relation to each other.

87
If the footprints are deep and the pace is long, the party is moving rapidly. Very long strides and deep prints, with toe prints deeper than heel prints, indicate that the party is running. If the prints are deep, short, and widely spaced, with signs of scuffing or shuffling, a heavy load is probably being carried by the person who left the prints. You can also determine a person's sex by studying the size and position of the footprints. Women generally tend to be pigeon-toed, while men usually walk with their feet pointed straight ahead or slightly to the outside. Women's prints are usually smaller than men's, and their strides are usually shorter. If a party knows that it is being followed, it may attempt to hide its tracks. Persons walking backward have a short, irregular stride. The prints have an unusually deep toe. The soil will be kicked in the direction of movement.

88
HEAL, TOE, AND BALL OF FOOT - (Anatomy of human foot and market price bar) PACE, STRIDE, AND PACE ANGLE - (Units of measurements for tracking footprints of animals and markets) These combination of elements allow a tracker to determine the prior actions of the animal being tracked, such as, if the animal was; WALKING, RUNNING, JUMPING, FALLING, TURNING, STUMBL ING, OR RESTING (PREVIOUS ACTIONS OF AN ORGANISM THAT CAN BE DETERMINED BY FOOTPRINT ANALYSIS)
From this position, what would happen if the person tried to suddenly turn in the opposite direction? Of course, he/she would lose balance and fall. Before the person can even begin to turn. the foot that is in the air must touch the ground or balance will be lost and a stumble and/or fall must occur. Ensuing actions of the organism can also be projected by this type of analysis. Let's assume you are tracking a person and you are only one footstep behind them. Based on their last footprint you are trying to guess where their next footstep will fall. Depending upon where the last footprint fell, you can determine, based on the rules of balance, where the foot can fall. The first and easiest thing to figure is Where the foot cannot fall. For example; In the figure below can the person make a 180 degree turn and step in the opposite direction with the next step? Obviously not! Even when the foot does touch down it must touch down in a certain location to make the 180 degree maneuver possible. You see, the foot has to touch down with at least the toes farther ahead of the foot that is still on the ground or balance will be lost and a stumble and/or fall will ensue. Would you place a bet on these biomechanical facts? I would. That's a slam-dunk bet if I ever saw one. You would not be betting on what the person will or will not do. You would be betting on what the person can or cannot do based on physical laws of nature. Like, gravity, balance and momentum.

89
The illustration above shows the correlation between the human foot and a market Price bar. In other words, a price bar is the footprint of the market.

90
MARKET FOOTPRINTS
Price action is the footprint of the market. Each bar represents a footprint. Let's start with the basics. The bars on the chart below are labeled as traders commonly referred to them.
Up Bar: is a bar with a higher high and higher low than the previous bar. The bars marked off are in an up trend. Notice how the close is higher than the open until what turns out to be the last bar of the trend where the close is lower than the open. There were more sellers then buyers on the last bar. Down Bar: is a bar with a lower high and lower low than the previous bar. The bars marked off are in a down trend. Notice how the close is lower than the open until what turns out to be the last bar of the trend where the close is higher than the open. There were more buyers then sellers on the last bar. Inside Bar: also called a narrow range bar, is a bar with the high that is lower than the previous bar and low that is higher than the previous bar. Some traders do not consider an inside bar that has either an equal high or an equal low as an inside bar, others do. Inside bars usually represent market indecision. As on any bar, the closer the open and close are to each
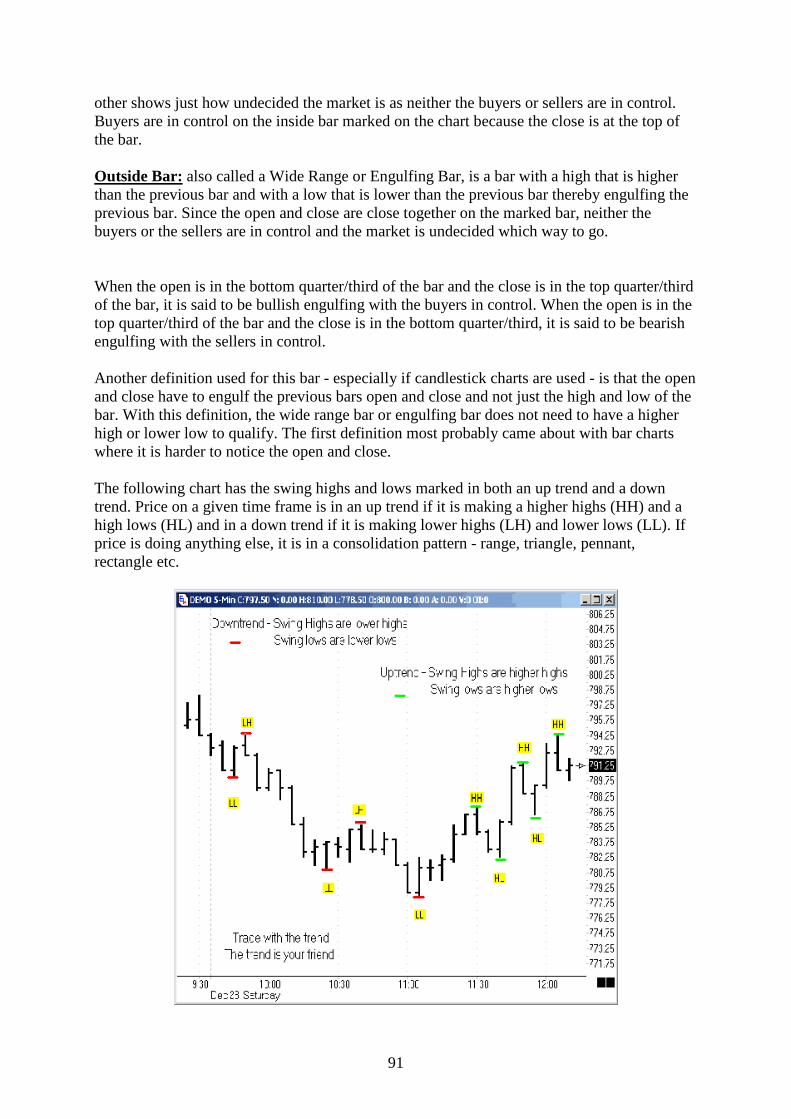
91
other shows just how undecided the market is as neither the buyers or sellers are in control. Buyers are in control on the inside bar marked on the chart because the close is at the top of the bar. Outside Bar: also called a Wide Range or Engulfing Bar, is a bar with a high that is higher than the previous bar and with a low that is lower than the previous bar thereby engulfing the previous bar. Since the open and close are close together on the marked bar, neither the buyers or the sellers are in control and the market is undecided which way to go. When the open is in the bottom quarter/third of the bar and the close is in the top quarter/third of the bar, it is said to be bullish engulfing with the buyers in control. When the open is in the top quarter/third of the bar and the close is in the bottom quarter/third, it is said to be bearish engulfing with the sellers in control. Another definition used for this bar - especially if candlestick charts are used - is that the open and close have to engulf the previous bars open and close and not just the high and low of the bar. With this definition, the wide range bar or engulfing bar does not need to have a higher high or lower low to qualify. The first definition most probably came about with bar charts where it is harder to notice the open and close. The following chart has the swing highs and lows marked in both an up trend and a down trend. Price on a given time frame is in an up trend if it is making a higher highs (HH) and a high lows (HL) and in a down trend if it is making lower highs (LH) and lower lows (LL). If price is doing anything else, it is in a consolidation pattern - range, triangle, pennant, rectangle etc.

92
The trend is considered in place until price is no longer making higher highs and higher lows in an up trend or lower highs and lower lows in a down trend. After a trend is broken, there is usually a period of consolidation that is easier to see on a lower time frame. With practice, you will be able to visualize this going on without looking at the lower time frame. When price is in a consolidation pattern that is often referred to as chop, it is usually in a range with no trend pattern to the swing highs and lows.
The above chart shows how an exact test of high or low may mean a change in trend as it failed to make a higher high on test of last swing high or a lower low on test of last swing low. A. Price was making HHs and HLs until price tested the prior swing high at B. Price made a LL and LH until price tested the prior swing low at B. C. Price made a LH (The bar that does not touch line at C) until price tested the prior swing
low at C. D. Price was making HHs and HLs until price tested the prior swing high at

93
It is possible for one time frame to be in one trend and another time frame to be in a different trend or show consolidation. This is where the phrase 'trend within a trend' and swing within a swing regarding price action and the different time frames comes from. An example would be that while price may be rising on a daily chart, the intra-day chart will show retracements, corrections of various types and consolidation periods. The true meaning of this and how it can influence your trading, eludes many. The following exercise is an excellent way to learn what the phrase 'trend within trend' means visually.
Pull up a 15 minutes chart and mark the highs as higher high (HH) or lower high (LH) and the lows as lower low (LL) or higher low (HL). (The note tool was used in Ensign to mark these charts.) You can also print out the chart and mark it by hand. Use red lines if price in a down trend and green lines if price in an up trend. Remember price is in an up trend if it is making HH - and HL and in a down trend if it is making LH and LL. If price is doing anything else, it can be a consolidation pattern - range, triangle, pennant, rectangle etc. Points labeled 1-4 on the example chart are in a down trend. Points labeled 5-8 are in an up trend.

94
Now take the same chart and change the time frame to a 5 minutes chart, keeping the colored notes and numbers from the 15 minute by using the padlock with the L to lock lines in Ensign. Mark the new highs and lows with green numbers for an up trend and red numbers for a down trend.
Now we can see by the yellow HH and LL what trend is on the 15 minute at the same time we are able to see the trend on the 5 minute. Both charts are in a down trend until the 5 minute makes a HH at the first green #1. The down trend is broken when the LH at black #3 is exceeded. Price then goes on to make a HL starting an up trend that continues until price makes a lower high at the red #1. The 15 minute just made a HH at the black #5 and will not make a HL until black #6. At this point, we are expecting a HL on the 15 minute, and are waiting for a long signal on the 5 minute. Some traders would take the entry on the pair of reversal bars at red #2, others would wait until the last swing high at red #1 is exceeded. The time frames are now in agreement (shown by green #1-#4) up to the black #7 HH. After the HH at #7, the 5 minute goes into a down trend (shown by red #1-#6) to what is still a HL on the 15 minute at #8. So, while the 15 minute price action shows only two trends, the 5 minute shows five different trends! While you may trade the trends on the smaller time frame, waiting for price action to show it is going to move in the same direction as the larger time frame is trading with the trend. The
trend is your friend!

95
THE RELATIONSHIP BETWEEN PRICE BARS AND FOOTPRINTS
http://www.gamasutra.com/features/20010727/ringuet_pfv.htm
A body is in balance when you can trace a vertical line
from the pit of the neck, the ankle of the supporting foot, or to a line that joins the two ankles.

96
The twisting motions of the body are designed to give more amplitude to any motion, while at the same time
being very cost effective in terms of energy.

97
• The body of the candlestick is called the real body, and represents the range between the open and closing prices.
• A black or filled-in body represents that the close during that time period was lower than the open, (normally considered bearish) and when the body is open or white, that means the close was higher than the open (normally bullish).
• The thin vertical line above and/or below the real body is called the upper/lower shadow, representing the high/low price extremes for the period.

98
The Black Candlestick -- when the close is lower than the open.
The White Candlestick -- when the close is higher than the open.
The Shaven Head -- a candlestick with no upper shadow.
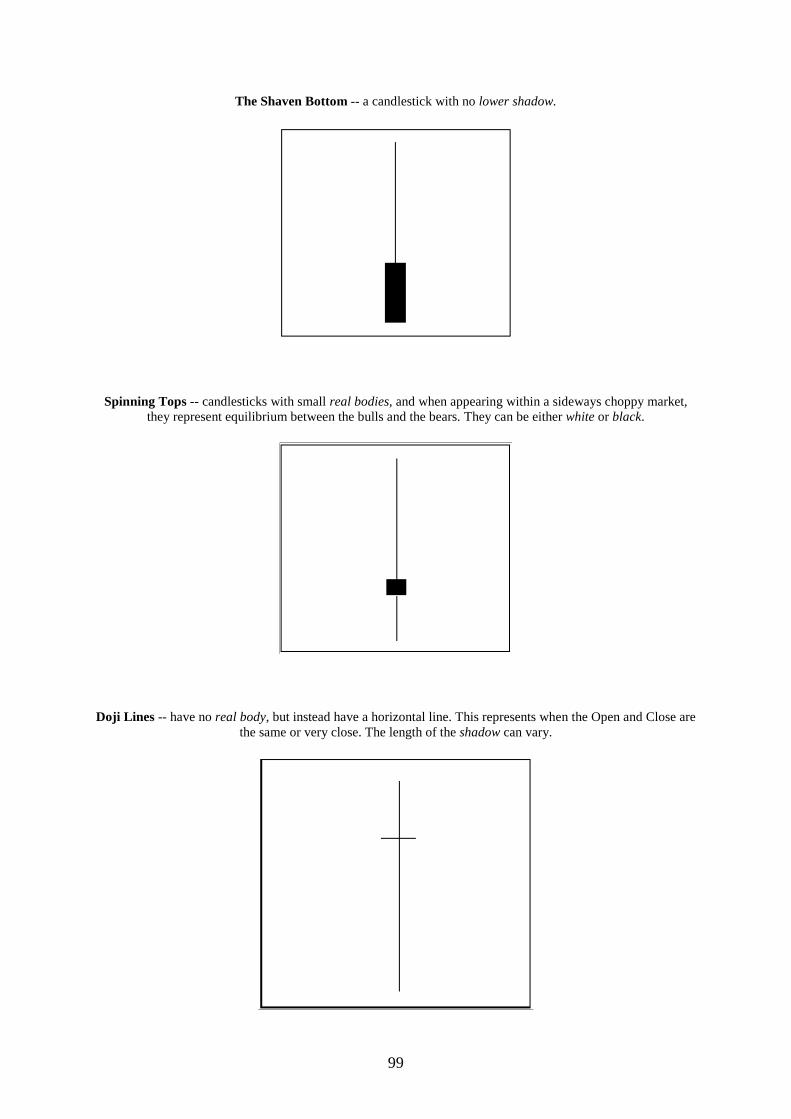
99
The Shaven Bottom -- a candlestick with no lower shadow.
Spinning Tops -- candlesticks with small real bodies, and when appearing within a sideways choppy market, they represent equilibrium between the bulls and the bears. They can be either white or black.
Doji Lines -- have no real body, but instead have a horizontal line. This represents when the Open and Close are
the same or very close. The length of the shadow can vary.

100
THE LAWS OF CHARTS AND MEN
There are laws of men and laws of nature. The laws of man change from generation to generation and culture to culture. Has the law of gravity ever changed? I think not! Gravity is the supreme law of motion. In this section we will discuss the lesser laws that fall under the government of gravity. These lesser laws react to gravity And are produced by the effects of a body's reaction to gravity. Newton's first law of motion states that if the forces of an object are in balance, the speed and direction of the object will not change. This means that if an object is not moving it will stay still. If the object is moving it will continue in a straight line at a constant speed. ( In other words, if left alone an object will continue doing whatever it is doing) But, what if forces are not in balance? What happens then? If forces are not in balance the object or body will accelerate, which may mean, speeding up,
slowing down, or changing direction.
• If we apply an unbalanced force to an object it will accelerate. • If we apply twice the force we get twice the acceleration. • If we apply the same force to twice the mass we would only get half the
acceleration. I say it again. Imbalance causes motion on the physical, mental and spiritual levels. This fact has been shown by our greatest scientific minds. Market price movements are caused by an unbalanced supply and demand situation. This fact has been shown by our greatest economic scientists. These same laws are reflected on a chart if you know how to interpret the signals. The same natural laws or forces that work on man must also work on anything created by man. Markets are a man made creation. A chart is a snapshot of these laws and forces in effect.
In this section we will discuss some of the physical and mental laws of charts and men...

101
THE LAWS OF CHARTS AND MEN
THE LAW OF PROBABILITIES When you set up your trading this way you are not really betting on the market. You are betting on the laws of mathematical probability. The laws of numbers. You are betting that at a given point, price will move up $100 before it falls $50. Or… price will fall $100 before if rises $50. You don't have to predict the market. You only need to identify high probability situations of momentum.
THE LAW OF TURNS Once an object has turned, the laws of motion dictate that, momentum must carry it in the direction turned for a minimum distance before the object can turn and go in the opposite direction. When you are running you can't instantly stop and run back in the opposite direction. You must go through the process of stopping and turning before you can head in the opposite direction. Markets must go through this same process, and so does everything that is in motion. When you are driving down the street and you want to go in the opposite direction the car can't turn and instantly go in the other direction. You must step on the breaks, and then turn the steering wheel, etc.... It is a process.
THE LAW OF MOMENTUM Now, when you are running and you are in the middle of turning, what if you changed your mind and decided you didn't want to turn after all? But, you have already started to turn. Your center of balance is already in the new direction. You can still turn back in your original direction but your momentum will carry you a certain distance before you can do it. If you slam on the brakes you will Skid before coming to a stop. Markets follow the same process. There is a certain point in the turn where your center of balance shifts over to the new direction. It is at this point where the laws of momentum take over. After momentum kicks there are a minimum number of steps required to enable you to turn back without losing you balance. If you stop without taking the additional steps needed to break down.
THE LAW OF SIMILARITIES Man and market are one. Man walks on two feet. A market walks on two feet. A man has a head and two shoulders. A market has a head and two shoulders. Man reacts to fear and greed. A market reacts to fear and greed.

102
Man has a center of gravity. Market has a center of gravity. A man walks on two feet. The market walks on two feet. A man must have balance to rise. A market must have balance to rise. A man must go through a process before turning. A market must go through a process before turning. The proportions of a man follow sacred geometry. The proportions of a market follow sacred geometry.
THE LAW OF ENERGY There can be no force without energy. A force is a "push or pull upon an object or body." A force must draw energy from somewhere to fulfill it's function. Energy comes from many sources, including the sun, moon, earth, nature, water, food, wind, storms, fire, emotions, and movement. People carry energy with them at all times. Energy creates forces. Forces generate temporary imbalances from their interactions. Imbalances must, by all laws of nature, result in motion. In a market, each buy and sell transaction represents a unit of energy. Energy creates forces. Think of each buy and sell transaction as a lightening strikes of energy into and out of the market. The bolts are hitting either left or right arm of the market.
THE LAW OF ONE MIND A market chart/graph is nothing more than, the television receiver that is displaying the moving body of the collective mind of man in motion. A market moves as one organism with one mind. The picture you see on your television screen is not the actual person is it? No. The camera is gathering bits of photons and electrons and sending them to your television box, which arranges the bits of information into patterns that you can recognize. These patterns are called images. A chart is a television receiver that is receiving and arranging bits of price data and displaying the data to you as an image. Whatever the camera is recording will be the image that is displayed on the receiver. Just like a TV signal, if you are tuned in to the wrong channel all you may see is a bunch of fuzzy dots and lines. But turn to the right station and you will see recognizable images. You cannot see the man on the charts because you don't know what channel to tune to. If the camera is recording a man walking, running and turning, then the television receiver will display the image of the man walking, running and turning but, you can't see him unless you're tuned in to the station that is broadcasting the signal. Since the market camera is recording the collective consciousness of man in motion, the television receiver, that is the charts, must display the image of a man in motion. The only reason you can't see him is you haven't been looking for him. Now you're tuned to the correct channel.

103
A chart is like a moving video of a man walking and running. Turning left then turning right. He is forced to turn because he keeps running into walls of fear and greed that knock him off balance from time to time. Just as a camera records billions of bite of digital data and send the data to your television receiver, which puts the bites of data back together to display recognizable patterns or images. A chart is the receiver that receives billions of bites of market data more commonly known as buy and sell transactions, and reconstructs market data into recognizable patterns or images.
THE LAW OF BALANCE In the ancient sport of martial arts there is a term called "The Triangulation Point." Triangulation is the positioning of the human body at an angle where it cannot recover from force being applied to it. Or… The point where you are so off balance there is nothing you can do to prevent from falling. A market also has triangulation points. It works exactly the same for market as it does for man. Everything in existence has a center of gravity. Neither your center of gravity nor a market's center of gravity can be moved it can only be rotated. When your body or a market has reached a triangulation point that means the center of gravity has rotated to the new direction and momentum must carry man or market for a distance that can be mathematically calculated.
THE LAW OF ANGLES Just as you can take one look at a man and tell if he is at a triangulation point, you can look at a market chart and do the some thing. Have you ever seen a high-wire trapeze artist at work? Even the little kids ooh and aah whenever they think the man is about to fall. And when does he look like he's going to fall? Based on the angle of his body. Every time it looks like he has hit the point of triangulation you think he's going to fall. You don't need any mathematical ability. You can see his imbalance based on the angle of his body. You can do the same thing with the angle of the market body. The man on the charts.
THE LAW OF SUPPORT A falling man will continue to fall until he finds support. A market will fall until it finds support. Think about this. When you lose your balance and start to fall what's t the first thing you do. You instinctively reach out with your arms to try to grab something to give you support. If you can't grab anything for support on the way down you will fall until you hit the ground, which is the ultimate support. The point is, when you are falling you cannot rise again until you get to some kind of support. You must have support to have something to push off of in order to rise. The fact is,

104
all the way down to the ground you are trying to rise but you are not in position to rise. A market is the same way. A market always wants to rise but isn't always in a position to do so. For the most part it is not a question of will the market go up, it is a question of can the market go up. Is it in a position of balance, which will enable it to rise?
THE LAW OF RESISTANCE A rising man will continue to rise until he meets resistance or runs out of energy. A market will rise until it meets resistance or runs out of energy. Think of a ceiling. A rising man will continue to rise unless he hits a ceiling or runs out of energy. A market will continue to rise until it hits a ceiling of sellers. A market will fall until it hits a floor of buyers.
THE LAW OF FORCES Forces can change the speed, direction and shape of an object or body. Weight is a force. Weight is nothing more than the force of gravity. The gravitational pull of the earth is what gives a body it's weight. If we say something weighs 100 pounds, what we are really saying is that the force of gravity is 100 pounds. There is no such thing as weight. Weight is a man made unit of measurement to help us measure the force of gravity. If the forces on a body or object are not in a straight line, we must use other techniques, such as a " triangle of forces", to find the resultant.
THE LAW OF REACTION Every action has an equal and opposite reaction. In other words, when you push or pull something, it pushes or pulls back at you. Forces are two-way affairs, they're about the way that objects affect each other. For example, you're pushing down on your chair with a force of, maybe, 500N, and the chair is pushing back with a force of 500N. The forces are balanced, and as you're already sitting still, you stay that way.
THE LAW OF RETRACEMENTS Do a little experiment. Stand up with your feet evenly spaced apart. Now, take one step forward. If you pay close attention you will notice that before you could take a step forward you had to back up just a little. In order to gain support for your forward step you had to push off and in order to do that you had to rock back on your heels. You had to gain enough momentum to propel yourself forward.

105
HOW TO COMPOUND YOUR WINNING TRADES FOR EXPLOSIVE GROWTH:
HOW TO COMPOUND $500 INTO $100,000 IN 6 MONTHS TRADING CURRENCIES
IF YOU COULD BE RIGHT ON 7 OUT OF EVERY 10 TRADES Y OU CAN BECOME RICH AND THIS IS HOW: (Casinos have 3% advantage that allows them consistently win millions. What could you do with a 40% advantage?) Price action cannot be predicted but it can be recognized. FORGET ABOUT COMPLICATED INDICATORS. THE ONLY INDI CATORS YOU NEED ARE PRICE, VOLUME, AND TIME. This book will introduce you to a trading and money management system that can compound your trading capital up to 200 times when using 200 to 1 leverage in a $500 mini account. The system is based on the undisputable fact that a market has structure. Price movements may be random but reactions to price movements are not. You can achieve the advertised results with only a 70% accuracy rate. When you back test the system on any liquid market you will find that it is more likely to produce a 90% accuracy rate. To lose money with this system you would have to be wrong on 7 out of 10 trades. That means, to be profitable, you only need to be right on 4 out of 10 trades. 4 out of 10 won't get you $100,000 in 6 months but you will make decent money.
HOW TO COMPOUND $500 INTO $100,000 WITHIN 6 MONTHS?
By making a profit on 7 out of every 10 trades through the use of a method that gives you a probability of success of 90% on each Trade. And then compounding your winning trades to an amount you desire.
BY TRADING IMBALANCES OF SUPPLY AND DEMAND : Price movements are a reflection of changes in supply and demand. This is the one iron fact that no one can dispute. Economists disagree on many things but never that. Anything else
that you have been told is moving the market is only an effect of one universal law of. " BALANE OF SUPPLY AND DEMAND , " It does not matter what you hear on the news. It
does not matter what the talking heads are saying on your favorite mass manipulation TV channel or any other kind of fake out the market manipulators feed you. If demand is greater than supply, prices will rise. It is irrefutable. But, if supply is greater than demand prices will
fall. Other than this, the study of market prices and volume is all you need.

106
THE CAUSE OF ALL MARKET MOVEMENT IS AN IMBALANCE OF SUPPLY AND DEMAND.
• If, price movements are a reflection of a changes in supply and demand.
• And, you knew the moment the balance of supply and demand has changed.
• Then, you could predict when the market is about to move with a high degree of probability
MONEY MANAGEMENT SYSTEM
Here's what could happen with a $500 mini account that requires $50 margin per contract.
SEGRAGATE Separate your money into ten equal sections. You will separate you trading into campaigns of 10 trades. You should earn a minimum of 100 pips on your winning trades and lose a maximum of 50 pips on your losing trades. That is a 2 to 1 profit to loss ratio. In other words, you need to earn $2 on your winning trades for every $1 you lose on your losing trades. NET GAIN If you could win on 70% of your trades you would net $400 profit every 10 trades? 7 winning trades x $100 gained per trade = $700 earned. 3 losing trades x $50 lost per trade = $150 lost. Take the $700 you earned - and subtract the $300 you lost over the 10-trade campaign and you make $400. A market will produce about 10 good trading opportunities every month. That's $400 every month.
THE MAGIC OF COMPOUNDING You can't get rich on $400 every month, or can you!!! What $400 every month will do for you is this. It will increase your margin and with more margin you can buy more contracts. You don't touch the money you make. You use it to buy more contracts on your next trade. You can parlay your original stake into wealth.

107
FIRST MONTH (10 TRADES) So, let's say you are starting with a $500 mini account and you make $400 the first month trading 1 contract on each trade. Now you can afford enough margin and have enough cushion to trade 3 contracts per trade on your next 10-trade campaign. SECOND MONTH (10 TRADES) So now you're trading 3 contracts what you get is 7 winning trades winning trades x $300 profit per trade = $2100 profit. 3 losing trades times $150 lost per trade = $450 lost. $2100 profit- $450 lost = $1650 net profit. After two months you have profited a total of $2450. You made $400 the first month and $2050 the second month, for a total of $2450. THIRD MONTH (10 TRADES) Now things really get heated. With $2450 you can afford to trade 10 mini contracts. That means that for the next monthly campaign, trading 10 contracts per trade, you will profit $1000 on every winning trade and lose $500 on every losing trade. 7 winning trades at $1000 profit per trade = $7000 profit. 3 losing trades x $500 per trade = $1500 in losses. $7000 total profits - $1500 total loss = $5500 net profit. Now look what we have here! Only 3 months have passed and you have made $5600. You made $400 the first month. $2050 the second month and $5500 the third month for a total of $7950 over 3 months. FOURTH MONTH (10 TRADES) My, my, my! With $7950 you can now afford to trade 20 contracts per trade. So, now you make $2000 every winning trade and lose $1000 on every losing trade. If you win 7 times and lose 3 times you have a net profit of $11,000 over the month. We're talking about after only four months you have $18,950 that works out to $400 the first month. $2050 the second month. $5500 the third month and $11,000 on the fourth month. That's a total of $18,950 over four months. By now point I hope you get the point. FIFTH MONTH (10 TRADES) Sticking with your formula look at what you have. During the fifth month you would make an incredible $27,500 because, now you can afford to trade 50 mini contracts on every trade. On each winning trade you make $5,000 while on every losing trade you lose $2,500. On 7 trades you make $5,000 on each trade for a total of $35,000. But you lost $2,500 three times for a total of $7,500 lost. If you take the $7,500 you lost from the $35,000 you won, you are left with a $27,500 net profit over the two-week period. Add this to the $18,950 you have already earned and you have a total of $46,450 at the end of 10 weeks. SIXTH MONTH (10 TRADES) At the beginning of this period you have $46,450 working capital. You can now afford margin for 100 mini contracts per trade. So, you will now make $10,000 profit per winning trade and lose $5,000 on every losing trade.

108
7 winning trades earn you $70,000. 3 Losing trades lose you $15,000. $70,000 you profited - $15,000 lost = $55,000 profit over the month. Add this to the $46,450 you've already got, and your total profits are $101,450 IN SIX months. BREAK EVEN With this money management system you only need to be right on 4 out of every 10 trades to make money. If you win on only 4 of 10 trades you will make $100 for every 10 trades.
STARTING WITH $500.00!!!
If you were right on only 3 of 10 trades you would only lose a total of $50 for the 10-trade period.

109
MARKET PHYSICS
TIME PRODEEDS, GRAVITY ATTRACTS, INERTIA GOVERNS, MATTER EXISTS, AND ENERGY FLOWS.
This is the flow of the universe since the beginning. As time proceeds, gravity exudes its attracting force. While inertia governs by being the alpha and omega. The beginning and the end. All things start and end with inertia, spending the time of its existence in the cycle of losing inertia then finding it, this is the dance of matter during the time of its existence. This dance of inertia occurs within an ocean of energy which we call "World." Energy flows like water in wave after wave of tidal actions that flood everything in existence. This next section is related to the physics of a moving market. We have already discussed how markets are subject to "Newton's Laws of Motion:
1. AN OBJECT IN MOTION TENDS TO REMAIN IN MOTION
2. FOR EVERY ACTION, THERE IS AN EQUAL AND OPPOSITE RE ACTION
In this section we will explore some physics of nature and see how these apply to market motion. Markets need energy to survive just like any organism. The energy of the market is buying and selling energy and like anything that uses energy, markets leave an energy or heat signature. Market movements that burn the brightest also use energy and burn out at a faster rate. The point is that, for every physical law that we know of, we find the financial markets corresponding to these laws. Financial markets are nothing more than organisms of collective consciousness that move and have the same motivations as any organism and that is to survive. In order to survive, any organism must follow the laws of nature or perish. Survival dictates following the universal laws of nature because the laws of nature operating together collectively come together to create one organism. The name of that organism is God!

110
EXPLORING MARKET PHYSICS
A trader faces a challenge mastering the puzzle of market movement. While most of us recognize conflict and resolution within the price chart, we fail to utilize these dependable mechanics in our trading strategies. Fortunately, repeating elements of the charting landscape offer a powerful context to understand and manage these critical aspects of trend development. Reoccurring dynamics of crowd behavior and price action tends to imitate classic rules that scientists have always applied to the physical universe. This is no accident of nature. Nature has no accidents. Emotion and mathematics interact continuously while they draw the Fibonacci retracements that we see every day through our chart analysis. This spellbinding relationship offers a peek into the intense order beneath common price movement. At its core, the balance between these two forces helps us to understand and trade the market swing. For example, we may search the chart for a reversal or breakout pattern that spells opportunity, but we also watch the ticker tape to gauge the crowd's emotional intensity, and to predict where it will burn out or shift gears. Successful traders draw intuitively upon these two-sided market mechanics as they master the art of speculation. Their advanced skills correspond with the strange logic required to tie left and right brain functions into a focused trading tactic. Perhaps future technicians will measure these profound interactions between herd behavior and physical law, and even open up a new branch of technical price prediction. In the meantime, let's explore some basic characteristics of these underlying market physics. 1. AN OBJECT IN MOTION TENDS TO REMAIN IN MOTION New trends awaken within the low volatility of a range-bound market and are characterized by directional price momentum. During the early phases of new trends, volatility rises but inertia tends to slow down price rate of change. This often generates a series of tests or congestion mini-patterns while price tries to escape the influence of the old range. Eventually, momentum overcomes inertia and price movement takes on a more vertical appearance. This freedom of motion actually lowers volatility as friction eases and a one-sided market assumes control. New trends can be very difficult to stop once they are underway. As with any object in motion, trends feed on themselves because they draw in fresh energy (from cash and emotions on the sidelines). This causes price movement to travel well beyond uninformed barriers, such as targets set by outside forces. But no trend can last forever or travel to infinity. Just like its physical counterpart, intervening market forces will eventually stop or reverse directional price movement. Simple friction slows down a rolling ball. Active trends experience friction in the form of market gravity. Classic trading wisdom notes that rallies take buyers, but that markets will "fall from their own weight" under the right c ircumstances. If this is true, then why don't all markets fall to zero as soon as buying and selling dried up? The fact that markets retain value suggests that each one has a hidden center of gravity

111
that price development will reach if all participants step aside at simultaneously. This "central gravitational tendency" gently pulls market movement toward a hidden midpoint during quiet times, but can act with violent intensity when price action generates strong imbalances during extreme market conditions. The distance from the current price bar to this subtle value measures the degree of market inefficiency at each point in time. It also defines most opportunity for the swing trader. Bollinger Bands present a common tool to measure tension on this hidden spring. But other indicators that rely upon deviation from center of gravity perform an adequate job as well. And don't overlook simple chart patterns. Certain formations can reveal major inefficiency through a simple set of price bars. For example, a Shooting Star candle after a strong rally signals an invisible wall to the observant speculator. 2. FOR EVERY ACTION, THERE IS AN EQUAL AND OPPOSITE
REACTION. Traders at all levels must deal with the wavelike motion on price charts. These define underlying cycles that strategies must align with, or risk failure. At their core, these waves reflect constant battles between bulls and bears, and the underlying trend-range axis. Price thrusts forward in a surge of participation but then pauses to test prior boundaries and dissipate volatility. Price bars contract, volume drops significantly, and the trend pulls against its primary direction. But just as that market returns to balance, the action-reaction cycle suddenly regenerates and volatility surges. Fresh momentum carries the reawakened trend toward a new price level, or reverses it back toward its origins. But why aren't markets stuck between two horizontal extremes if trend and countertrend act with equal force, and are polar opposites? The answer lies in how active markets disperse directional force. Every buyer must eventually sell and every short seller must eventually cover. This induces layers of cycles that equalize price action and reaction over time. Swing traders observe this dynamic process in the trend relativity of different length charts for the same trading instrument. In other words, a single market may print a strong rally on the daily chart, a bear market on the 60-minute chart, and sideways congestion on the 5-minute chart, all at the same time. While this phasing process may seem chaotic, it actually reflects the dissipation of underlying action-reaction energy. This 3-D trend-range axis also carries an added benefit: its alignment generates many of the setups in the swing trader's playbook. Locate these important opportunities in the convergence of specific action-reaction imbalances through several layers of price activity. This logical analysis also supports the contrary attitude that leads to successful swing trading. For example, while the crowd sees a buying opportunity when price surges on heavy participation, the swing trader sees selling power increasing in that market due to the entrance of a new crowd of buyers. Fortunes are made through this type of counterintuitive logic, generated by recognition of the underlying power in market physics.

112
In other words, buyers make a market go down and sellers make a market go up. Think of a see-saw you played on as a child. One side of the see-saw has many more kids. The combined weight of the heavier side forces the heavier side all the way down to the ground (support). The opposite side rises up until the heavy side reaches support (the ground). If one kid jumps off of the heavy side of the see-saw, The heavy side will rise off the ground a little. But what happens if all the kids on the heavy side jump off at the same time? The opposite side now becomes the heavy side and the force of gravity will violently push the opposite side to the ground. I had my but bruised this way on several occasions when I was a child. The kids on the heavy side are like buyers. The kids on the opposite side are like sellers. The more buyers that jump on means more potential sellers at the top of the market move. At the top, you have those who bought earlier now selling (jumping off). Combine this with new short sellers jumping on and you have a shift in the balance of supply and demand that starts the downward momentum. This process works the same way in reverse with short sellers causing price to go up when they buy back their positions (cover). Combine this with new buyers jumping on and this starts the upward momentum. 3. THE STAR THAT BURNS BRIGHTEST BURNS OUT FASTER THAN
THE STAR THAT EMITS A COOLER, DARKER LIGHT
We measure the health of a rally or weakness of a sell off by the angle of its rise or fall. Logic dictates that more vertical price bars reflect more powerful price moves. But how does the intensity of price change interact with the perseverance of the trend itself? To answer this question, we can call upon the characteristics of central tendency (center of balance) discussed earlier. If each market carries an underlying fair value at each point in time, a dynamic move should reach that price in less time (fewer bars) than a slow hike in the same direction. In other words, vertical trend bars should burn out and end their movement much sooner than slower trend bars. Apply this charting method to locate parabolas that are ready for strong reversals. In the contrary view of the swing trader, vertical price movement is seen as a preface to a reaction of the same passion in the opposite direction. Like a supernova signals the impending death of an aging star, the parabola tells the market that its trend fuel is about to run out, and likely cause a violent reaction. Isolate those markets with the tallest price bars and visible trends in excess of 45 degrees. You will notice that these markets will burn out their move with the same passion and intensity in the opposite direction once the market turns. A trend that moves at a shallow angle also predicts its own demise, but for different reasons. This reversal follows the mechanics of the rising or falling wedge patterns seen on many price charts. Both traders and investors want excitement in their lives. They buy or sell so they can watch price jump to new levels. Shallow trends rarely fulfill this need for indulgence. For example, traders see price rise in an up-trend to a minor new high over and over again, but never gain enough momentum to quicken the rate of ascent. Traders eventually lose interest in this type of price action and jump off the see-saw in search of more exciting trading opportunities. The market loses participation and finally drops off a cliff.

113
4. ENERGY SOURCES LEAVE ILLUMINATING SIGNATURES IN THE FORM OF EXHAUST OR RADIATION This is a principle of physics that requires a little translation for the financial markets. Real trading opportunities look like opportunities because they discharge an exhaust characteristic of a looming directional price movement. This exposes itself in crowd participation, price action at known support and resistance barriers, the creation of habitual price patterns, and the union of technical indicators. Interpret these assortment of market signatures correctly and book consistent profits as a swing trader. Engineers build machines that investigate exhaust emissions and measure their internal characteristics. For example, a hose attached to a vehicle's exhaust pipe tells the auto mechanic the current condition of the internal machinery. Swing traders build similar measuring tools to evaluate the internal state of supply and demand. But just as the engineer designs instruments to examine a very defined range of physical information, swing traders must limit data intake to specific market characteristics and filter out many noise levels that can defeat profits. Chart patterns with true prophetic power secrete evidence that market engineers can detect and measure. The radiation of opportunity builds through convergence of defined elements at slender intersections of price and time. Each individual signal sketched into this small space raises the odds that a trade setup will produce a projected result. Heat builds strongly at these important levels and tells the swing trader to jump on board or off quickly. Modern traders have problems organizing market movement into a convenient feedback and execution system. They ignore important chart data because it doesn't fit into a convenient system of vertical price boundaries. This fixation with dry pattern recognition make a trader unable to grasp the more powerful workings of price prophecy. Unfortunately, concentrating on a narrow execution strategy is like trying to play music with a single note. It works only when a short-lived moment of opportunity demands a single, flat tone. Upgrade your trading knowledge through the application of market physics. Each new aspect improves your ability to profit from subtle features of crowd behavior. These natural forces rely upon mechanics that many traders will miss. This will give you an important edge on the road to victorious trading. It might take a lifetime to investigate these complex interactions between evolving price and the emotional crowd. But each piece of this captivating puzzle adds new levels of confidence to your trading performance.

114
CONCLUSION Identification of key support and resistance levels is an essential ingredient to successful technical analysis. Even though it is sometimes difficult to establish exact support and resistance levels, being aware of their existence and location can greatly enhance analysis and forecasting abilities. If a security is approaching an important support level, it can serve as an alert to be extra vigilant in looking for signs of increased buying pressure and a potential reversal. If a security is approaching a resistance level, it can act as an alert to look for signs of increased selling pressure and potential reversal. If a support or resistance level is broken, it signals that the relationship between supply and demand has changed. A resistance breakout signals that demand (bulls) has gained the upper hand and a support break signals that supply (bears) has won the battle.

115
MARKET OPERATORS
• WHAT ARE MARKET MAKERS
• RIPPING OFF THE LITTLE GUY
• RISE OF THE WHOLESALER
• THE POWER OF AGGREGATION • PRICE IMPROVEMENTS
• ONLINE BROKERS
If you have been trading for any length of time I bet you have noticed an interesting little quirk of the market. Does it ever seem like whenever you enter a trade the price immediately goes against you. Not every single time but I mean way more times than the law of averages should allow. Does it seem like you pick the direction of the market correctly on most of your trades but, before price moves to your target price, it will first back up to take out your stop. I have personally conducted trades as an experiment to test my theory. More times than not, the market can be in the middle of a rapid run up or down. A down to earth break out! As soon as I enter my trade the price move stops dead in it's tracks. Price will start to swing in the opposite direction of my trade. I would immediately start questioning my analysis as price starts closing in on my stop-loss. No sooner than my stop is taken out price will turn and continue in the direction of my trade. THERE ARE BIG PLAYERS IN THE MARKET--THEY ARE KNOWN AS OPERATORS Operators are groups of big money people and business entities that cause unexpected market swings by using triggers like news releases, the release of economic data indicators, breaking news, fundamental indicators, political events and others to induce price fluctuations in the market. This section is about the operators...who they are, and how they operate. How they stampede the herd in one direction or the other depending upon the situation. Any balanced ecosystem must have predators. In the market ecosystem, operators fulfill this important function of predator. They are neither bad nor good. They are only bad if you don't know they are there. If you don't know they are there they will take your money. If you know they are there you can trade with them and take money from others.

116
MARKET OPERATORS
Market Maker - the guy that has the secret video camera set up behind you and takes the other side of every one of your losing trades. I am not a supporter of physical sell stops due to the fact that market makers can manipulate these stops during the day. A market maker can drive the price down artificially during trading hours setting off physical stop after physical stop only to allow the stock to rebound and close for a slight loss or a possible gain. The market makers that drive down the price are the same individuals that grab shares at the new intra-day price lows, giving themselves an instant profit at the expense of traders like you and me. I have fallen victim to this trap many times before figuring out what was going on. Moat trading days get underway with a daily exercise called running the stops. Market makers know that most of the stops are at historical resistance levels. The most recent top or bottom. At the open of trading, operators will manipulate market price past the level of a most recent high or low on the intra-day chart. They can see where the orders are so they will take price to a level that will spook as many traders as possible out of their winning positions. The target of these manipulations are the traders called weak hands. A weak hand is an undercapitalized trading account. A market is sustained by the new energy or new money that is coming into the market. The idea is to bankrupt as many accounts as possible so those accounts can re-supply with fresh money. Now think about this. If you have $5,000 in your trading account and Your position goes $50 against you, you are not close to panic. However, If you only have $300 in your account you are getting nervous. Why? If you have $5,000 you are only down 1%. But if you only have $300 you are down 16.6%. The thing is, operators have sophisticated computer systems that respond automatically when a weak hand enters the market. The computers recognize you as a weak hand when you enter a position using more than 25% of your account equity. This is a form of what is known as, "program trading." When you are flagged as a weak hand you become a shakeout target. If price goes against you or worse yet, goes past most recent intra-day support/resistance you will have to exit your position if you are wise. If the position goes $100 against you with a $300 account, that's a 33% draw-down against your trading capital. But the trader with the $5,000 account will only be down 2%.

117
I have established positions in currencies, stocks and futures. I would set a sell stop about 7-10% lower to protect from a larger loss. I would come home or take a break only to see that I was automatically sold out of the market due to a brief drop that only lasted a few minutes to a few hours. The market would drop anywhere from 15% to 25% intra-day only to rebound and close in my original direction. I took my anger and quickly converted it into a research effort that would help me understand what had happened and why it had happened and most importantly: What can I do to prevent it from happening to me again? I started to study the occasions where this action happened to me and I researched other stocks that I did not own but showed the same type of false intra-day movements. After reading about market makers and my individual research, I came up with a solution to the problem. If I could determine where the market makers Did not want the market to go I could place my stops there. Contained within this material is the secret to proper stop placement. You need to understand that in every market there is a daily exercise in every market called stop-running. Usually during the first hour of trading, market makers will run price to the nearest support and resistance levels before the market makes its real move. The information you are reading now will educate you to a trading style that factors stop running out of the equation. You see, if price goes to certain levels, market makers loose money. This happens when more money enters the market than they can counter with their massive bankrolls. Market makers have the responsibility of keeping liquidity in the market. If you want to buy the market but there are no sellers, the market maker must take the other side of your trade and sell to you, even if he knows the market is about to go up. When the market goes up the market maker loses money to you. Now, do you think the market maker wants the price to go up? Of course not. Would you? So now you have a heavily bankrolled operator trading against you. Have you ever wondered why, as soon as you enter a trade the price almost always immediately goes against you? Well now you know. Especially if you entered a market order. A market order is usually filled by a market maker. On the flip side a limit order is usually filled by another trader like yourself. A market maker can most times manipulate the order so that it is filled by another limit order from someone trading with his/her firm. Now you don't have to fight king kong. I have tested this to my own satisfaction and know it to be true. I have done experimental trades just to see what would happen. Several times I have entered a market while it was running. Moving up or down very fast. As soon as I enter a position the market stopped dead in its tracks and started to move against me. Too many time to be mere chance. When the market has been running and I tried to enter with a limit order it has never been hit. Never! The law of averages dictate that sometimes my limit order should be filled and most of the time a running market should continue to run. Especially if price is not bouncing off a support or resistance levels.

118
Market makers advertise that they make their money on the bid/ask spreads but here is a dirty little secret. These market makers/operators buy options just above and below support and resistance levels. They run the market up to hit their long option position and run the market down to profit on their short option positions. Too many times during the initial stages of a breakout, market makers will wipe out all of the physical stops and restart the movement without the heavy domino load below. These market makers know about CANSLIM, TURTLE TRADING and other stop loss systems and they can see where these stops are placed; so they wipe them out, allowing themselves to get in at a lower price and they release the possible sell-off due to hundreds, if not thousands of stops that have been set due to a specific system strategy such as CANSLIM.
RIPPING OFF THE LITTLE GUY, ONE TRADE AT A TIME
If your currency, futures, commodities, or stock broker has a dealing desk, guess who they are dealing against? That's right…YOU. And yes, it's legal. You broker knows where everyone is looking to sell or buy because you, the retail investor places their order with the broker. Retail Investors, Especially Internet Investors, are having their own trades used against them. Every working day, hundreds of thousands of retail investors enter orders to buy and sell stocks and then put their faith in a system that they believe is set up to get them the best price. However, the dark secret of Wall Street and every other market is that retail investors are getting far from the best prices and almost everyone on Wall Street knows it. While this issue affects almost all retail investors, it affects Internet investors in particular as they trade in some of the most active and volatile markets on the planet and this activity provides ample room for middlemen to make plenty of money, often at the expense of their own customers. These practices are legal even though it seems fundamentally unfair to individual investors and highly questionable from both a legal and moral perspective. So, now you know why a market will reverse directions after your stop is hit. To combat this you need to know the zone where the market maker has control. If a market operator drives price past a certain level it will cause a stampede of buyers and sellers in a direction the operator doesn't want it to go or he she will lose money. I know what you're thinking. I am so small and the market is so huge, my little order is chump change to a market operator. But it is apparent that markets are set up to take the largest amount of money from the most people possible. These operators have computer systems that rival N.A.S.A. space center and are probably better funded. The have computerized buy and sell programs that can probably predict your trade before you even thought of it. It is not just your order. These computer systems are like virtual fish nets. I was recently reading an article written by 2 traders who extracted enough money from the markets to start their own brokerage business. They stated that when they started interviewing vendors who sell these computer systems main pitch was how their systems took

119
money from the clients of the broker. Not about what it would do for their client. Simplicity, speed, etc… The Rise of the Wholesaler While there are a number of trends that have pushed these practices to the forefront, the most important has been the rise of the so-called "wholesalers". Wholesalers are large trading firms that aggregate orders from retail brokers and then execute those orders on behalf of the brokers and, by extension, their retail clients. Indeed, many retail investors are often surprised to learn that their trade is not completed by their own brokerage, but instead is "outsourced" to one of a handful of powerful wholesalers. Today these wholesalers have become the primary means by which almost all retail investor orders are executed in the market. Many of the largest wholesalers now account for 30, 40, even greater than 50% of the trading volume in particular securities and markets and wholesalers often dominate trading in the hottest trading markets. Orders = Information When brokerages send their customers' orders to a wholesaler, they are sending them valuable information. That's because these orders represent intentions to buy or sell stocks at specific prices. Professional investors, such as mutual fund managers, guard such intentions to buy and sell stocks very carefully. After all, if anyone in the market were to find out that a large mutual funds, or massive traders like Warren Buffet or George Soros, was trying to sell a big position in a market, the market's price could fall dramatically. While professional investors take strong precautions to ensure that no one in general finds out about their intentions, they take particular care to prevent their own brokerage firm from finding out their true intentions . That's because professional investors realize that if the trader at their brokerage firm knew that they wanted to sell a large amount of stock, the trader would likely try to make a profit for their firm by buying or selling stock in advance of completing the investor's order. They wanted to sell a large amount of stock, the trader would likely try to make a profit for their firm by buying or selling stock in advance of completing the investor's order. Thus, in the professional investing world, if an investor planned on selling 10,000,000 shares they would, in all likelihood, never tell their broker their true intentions, but instead would " parcel out" the trade in smaller increments, while always trying to keep the brokerage firm's trader guessing as to whether or not there was more to come.

120
The Power of Aggregation At first blush it seems as though retail investors don't have the same problem. After all, a decision to sell 100 or 1000 shares in most cases isn't going to move the market. However, with the rise of the wholesalers it's become possible for one firm to aggregate tens of thousands of orders in a particular market. By aggregating all of the individual retail investor orders, wholesalers are able to get some pretty valuable information, information that is often better than anything they can learn from professional investors. As the wholesalers get more and more orders, in many cases over 50% of the orders in a particular market, it gets easier and easier for them to determine whether or not a market will go up or down. Just imagine a market as a giant jig-saw puzzle. If you have 5% of a puzzle's pieces it's tough to guess what the picture is, but if you have 40 or 50% of the pieces, it's a no-brainer. In a similar way, once an experienced wholesaler controls 30-50% of the order flow in a particular market, taking advantage of this information to make money for their own account is like shooting fish in a barrel. The most disturbing part of all this is that the information that wholesaler is using to make money for themselves is coming from retail customers who have no idea that the their information is being used to make someone else rich and often at their expense! Indeed, there are now a whole series of widely accepted trading techniques used on Wall Street and other markets that are explicitly based on supposedly confidential customer information. Good Morning, You're Screwed One of the most basic examples of such techniques occurs just before a market opens for trading. Let's say a major wholesaler, one that typically is the #1 trader in a market, has a large number of market orders to buy the market at the open. Then, just prior to the market opening, they would signal to the rest of the market that they had a lot of stock to buy by raising the quote that they publicly display to the rest of the market. (The most blatant way to accomplish is to do what's called "crossing & locking" the market, which essentially means aggressively moving a quote up or down so fast that the whole market has to reset.) Given that this particular wholesaler is the #1 trader in the market, the other traders in the market are likely to stand aside and let him continue raising the quote as the other firms can only assume that he has a lot of orders buy the stock. The wholesaler's goal is to increase the opening price of the stock to the point where it is significantly higher than the price of the stock that they just bought. This way they can easily flip the stock they just bought to the individual investors for a significantly higher price than

121
they just paid for it. Not bad for a few minutes work. Of course, the wholesaler will claim they are merely doing what the retail investors wanted, which is selling them stock at the opening market price, but it's probably safe to say that 100% of the retail investors would have preferred to get the cheaper price. What's more, the opening price would never have been higher if the wholesaler hadn't acted on the information provided to it by the retail investors. Talk about paying for your own participation! Beware of Price Improvement It gets worse. Examples like "managing" the open price are common knowledge on Wall Street, and other markets but they still entail some risk. In the pursuit of almost risk less arbitrage profits, many wholesalers are now using a tactic called "price improvement". "Price improvement" results when a wholesaler actually pays more for a contract or share than the current market price. This means that if a market is being quoted at a $50 bid (buy) and a $50 1/2 ask (sell) and a customer wants to sell a contract or share, the wholesaler will actually "price improve" their order and allow them to sell for $50 1/16. For the seller, this seems like great news as they appear to have gotten an even better price than the best offer to buy (or bid) in the market. The reality of the situation is a lot less rosy, for both the seller AND the buyer in the transaction. What typically happens in "price improvement" is that the wholesaler currently has a limit order on its book that is "at the market". Limit orders are instructions from customers to buy or sell only at a specific price. In this case, that would mean that the wholesaler has a limit order from a retail investor to buy the stock at $50. You might ask yourself, if the wholesaler had an "at the market" limit order to buy at $50 from a customer, why didn't they just match the limit order to buy with the original market order to sell? That's a good question and the tip-off that "price improvement" is not what it's cracked up to be. Rather than match the orders, what wholesalers typically do is that they unilaterally increase the bid by 1/16 (the minimum allowed by law) and then they execute the trade, not on behalf of a customer, but on behalf of their own account. In our example, it means that the wholesaler would buy the stock being sold at 50 1/16, rather than simply crossing the order with the open limit order at $50. At first look, this strategy makes no sense: Why would the market maker buy the stock at $50 1/16 for their own account and take on the risk that the stock would fall, when they could simply do a risk less cross of the trades? It seems like wild speculation. But in reality, the market maker is not speculating at all, and in fact they are executing the trading equivalent of a "slam dunk". How could this be? First off, the market maker's maximum loss on the share or unit is actually limited to 1/16, that's because they still have a valid limit order at $50. If the price ever started

122
to fall, and they know it's not going to fall or they would not execute the trade this way, they would simply sell their contract or share to the customer who has the limit order. While their downside is limited to 1/16, the market maker never would have made the trade in the first place if they didn't have a very good idea that the market was in fact going up. How would they know that? Once again, given that they control a large portion of the trading volume in the market and have been given hundreds, perhaps thousands, of open orders to buy or sell at specific prices, the market maker has at their disposal a virtual treasure trove of information that only they can look at. For example, if the market maker saw a huge number of open buy orders and a decreasing amount of open sell orders, they might be reasonably confident that the stock was going up. Thus in our "price improvement" example, the seller didn't really get the best price, because in all likelihood the market was about to move sharply higher, while the customer with the open limit order to buy never even got a chance to buy as the market maker simply "stepped in front" of their order and then used them as a backstop in case the market turned. How's that for a customer friendly trading strategy? I could go on and on with more examples of how wholesalers routinely use customer information to improve their own trading profits, but suffice it to say that this is a widespread practice throughout markets today that is generally accepted as part of the business. Online Brokers to the Rescue? One would think that if Individual investors were really being taken advantage of so badly, that their brokerages would come to the rescue. After all, they do have a moral and legal responsibility to see that customers get the best execution possible. Problem is, the online brokers are in on the action. In return for directing their trades to these wholesalers, Online Brokers receive "payments for order flow" (also know as rebates). These rebates are little more than kickbacks of the excess profits that wholesalers are able to achieve by using the information unwittingly provided to them by retail investors. Thus, the online brokerages have very little incentive to cry foul because many of them are getting millions of dollars in payments a month from the wholesalers. Unwilling to shoot themselves in foot by questioning the legality or morality of the current gravy train, the online brokers prefer to look the other way and collect their checks. Indeed, several of the largest online brokers actually own major wholesalers. By owning the wholesalers, these brokers capture 100% of the profits from the "information arbitrage" that is, disturbingly, perpetrated on their own customers. This strategy in essence enables them to secretly "charge" far more per trade than their publicly quoted prices.

123
What Retail Investors Can Do Given that almost all of the established interests on Wall Street don't seem to care that much of the market has degenerated into what appears to be an organized front-running operation, what can individual investors do to protect themselves? Unfortunately, as long as wholesalers and traders in general are allowed to use customer order information to benefit their own trading activities, retail investors will be still be at their mercy. There are however a few things that investors can do to protect themselves, short of getting the SEC and Congress to ban the current practices. These include:
1. Don't Enter a Market Order To be Executed at the Open: As we covered earlier, market orders at the open are like a license to steal for wholesalers because the wholesalers can trade for their own account prior to the opening and then influence the opening price.
2. Don't Trade Within The First Hour of The Open: Given the tremendous games that go on during the open, I would recommend that, if they can help it, most investors not trade at all within the first hour or so of trading as it takes that long for much of the market open gamesmanship to play itself out.

124
CONSTRUCTING THE MAN ON THE CHARTS
The man on the charts is constructed of two well known chart patterns. The head and shoulders and the swing pivot patterns. These two patterns trace out the outline of a man walking along the chart. The state of balance of the man, by proxy signals the state of balance of the market. The balance of supply and demand. The head and shoulders pattern on the chart represents the head and shoulders of a man. The key to a mans' balance is the slope and angle of his shoulders. Like the arms on the balance scale, as long as the shoulders are even the man has balance and can be still. But, when the angle of the shoulders become uneven the man will lose balance and must react or move to recover balance A swing pivot represents the footsteps of a man. Each bar on a price chart represents a footprint of the mind of man. By analyzing the footprints of an animal you can tell what type of animal it is, where it's been and where it's likely to go, based on the pattern of their footprints. Each price thrust or wave is the leg of a man. The distance that price moves in one direction before turning is the length of a leg. You always hear price waves talked about in terms of "legs." In this section we will construct the man on the charts so that you can see him in order to track, analyze, and project his past and future movements. His balance is market balance. The balance of supply and demand. The angle of his posture is the posture of the market. • Since, market moves are caused by supply and demand imbalance
• And you can see when imbalance has occurred
• Then you can predict market movements as a response to imbalance

125
Illustrated above is the commonly reoccurring "Head and Shoulders" pattern. The head and shoulders pattern signals a change in the balance of supply and demand for the time frame in which it occurs. The head and shoulders is a reliable indicator for signaling trend. Before a man can turn he must first swing his head and shoulders in the direction he wants to go.
The head and shoulders pattern breaks down to the man on the charts in this pose illustrated above. Take the picture of the man above. Now what would happen if you added more weight to one arm (sellers) and not the other? The extra weight will force the shoulder downward which causes the opposite (buyers) arm to swing upward. In fact, if the man doesn't take steps or react to correct his balance the heavier shoulder will cause him to the ground. The added weight has caused a weight imbalance that started an action/ reaction trend of motion in the direction of the imbalance.

126
If we add equal weight to the (buyers) arm the weight of gravity will force the buyers arm down, causing the (sellers) arm to swing up to where both arms are level or balanced. But if we add more weight to the (buyers) arm than we do to the (sellers) arm the seller arm will swing up past level and the imbalance has switched from the sellers arm to the buyers arm. This is how it works for man...this is how it works for markets. A head and shoulders top signals a change from up-trend to down-trend. A head and shoulders bottom signals a change from a downtrend to up-trend. Like a man, the market must swing it's head and shoulders before it can turn. Or forcing the head and shoulders to turn through the force of gravity will force man or market to turn.
The mechanics of balance of man and charts operate according to this most ancient mechanism for measuring weights, "THE BALANCE BEAM SCALE." This is nature's scale. Man cannot create a more accurate scale today. Why? Because it works on the principles of universal laws.

127
What man, markets, and beam scales all have in common is they all break down to the simple mechanics of a see-saw. Ultimately, this is what you are trading. You are trading the see-saw action of supply and demand. This child's toy that anyone can understand. When you peel away all of The creator, in his/her wisdom made the most simple things as the only real truths.
A center of balance sitting upon the exact center of a perfectly flat table top, which is resting upon a pivot. This is how balance or inertia works for all bodies in existence. An object is forced into motion, and moves in relation to it's center of gravity. Every other part of a body that relates to motion, exists to support the movements of the center of gravity. Your body is the vehicle and your center of gravity is the passenger. Your head represents the ball or center of gravity. Your outstretched arms and shoulders is the table top, and your waist is the pivot. If you were described in terms of balance you could say that you are a consciousness riding around in a vehicle called a see-saw.

128
This is what you look like when you are still. In a state of inertia. All forces are balanced.
When you add more weight to one side the structure becomes out of balance. Gravity forces the heavy side down. The center of gravity must react by rolling down due to the steep angle created by the imbalance. In the market, the right arm with 2 kg. is the price arm. When the supply demand situation looks like this the trend of motion is downward. When you can see the market like this you are in position to make some high probability projections concerning the movement of the center of gravity (price).
Let's make a bet on the motion illustrated above. I'll bet you $100 that the ball (center of gravity) will roll to the target before it rolls back to the stop. I don't think you will take me up on that bet will you? Why not? Is it, because even if you know nothing about markets you instinctively understand this illustration. Yes, I said instinctive. When you were a child did anyone have to teach you how to play on a see-saw? No! You instinctively understood by simple observation.

129
Above you can immediately see That the forces of gravity and momentum are on the side of the ball hitting the target before backing up far enough to pass the stop. If you took this bet then you would be betting against gravity and momentum and I would be betting on the side of gravity and momentum. I'll take my chances on gravity and momentum every time. Even if more weight (another 1 kg) were placed on the stop side to balance things out, momentum will still carry the ball a certain distance in it's current direction before it can turn around and roll back in the opposite direction. This is a high probability bet if I could find someone to bet me on this. I'm sure I would be right at least 7 out of 10 bets. When you can see the market this way you will always make high probability trades because you will be trading in harmony with universal laws of nature. When trading markets do not bet on whether the market is going to go up or down. It would be better to project that price will reach a certain level in one direction before it will reach a certain level in the opposite direction. You are then trading levels or zones. You don't have to be precise in your projections. So, the balance of man begins with the level and angle of the head and shoulders and the balance of the market rests upon the shoulders of man, therefore the balance of man and market are one.

130
Now that you understand that balance of man and market begins with the angle of the head and shoulders it is time to talk about the legs upon which the market walks.
Now that the head and shoulders pattern has formed lets determine how far the market can walk in one step or wave. How far one can step is limited by the length of the leg. It just so happens that the length of a leg is directly proportional to the ratio between the shoulders and the tip of the fingers. All order in the universe is based on geometric ratios and proportions. Everything is related to everything else by geometry so that what you end up with is this. The Universe works like a giant see-saw. These ratios and proportions that shape creation have been given the unofficial name of
"Sacred Geometry."
Why do we call it "Sacred" Geometry? Because it is a philosophy that separates this form of mathematics from the more mundane measurement of the Earth. It involves a philosophy of life, our place in the universe, and everything around us. Plato considered this form of geometry and number the most ideal philosophical language, because it can become a vehicle for contemplation on different levels - even a mathematical level, if you will. Pythagoras said that everything is numbers. St. Bernard of Clairvaux, when asked, "What is God?" answered, "Length, Breadth, Height and Depth." The "G" in the center of the divider and square of the Freemasonic symbol stands not only for God, but also for Geometry and the Geo-Creator.

131
The ratio of phi also known as the golden section is manifested in the structure of the human body. If the length of the hand has the value of 1, then the combined length of the arm and hand has the value of phi. Also, the proportion of the upper arm + forearm + hand is the same ratio of 1: Phi:
The human face is full of examples of the golden section. The head forms a golden rectangle with eyes in the middle. The mouth and nose are both situated at golden sections of the distance from eyes to the bottom of the chin. Phi defines the dimensions of the human profile. Even when seen from the side the human face still exhibits the golden portion.
The human body is based on phi and the number 5. There are 5 appendages attached to the torso. The arms, the legs and the head. And each of these appendages have 5 appendages. The fingers on the hands and the toes on the feet to go with 5 openings on the face.

132
The DNA cross-section is based on phi. A cross-section view from the top of the DNA double helix forms a decagon. A decagon is two pentagons, with one rotated by 36 degrees from the other so each spiral of the double helix must trace out the shape of a pentagon. The ratio of the diagonal of a pentagon to it's side is phi: 1. Even the most basic elements DNA, and life is constructed of the sacred geometry of phi and the golden section.
There are many examples of the divine proportion or golden section in nature. For example, the eyes, fins, and tail all fall at golden sections of the length of a dolphin's body. Phi is often expressed in many of nature's creations. Plants illustrate the fibonacci number series in the numbers of arrangements of petals, leaves, sections, and seeds. Plants that grow in spirals such as pinecones, pineapples, and sunflowers illustrate fibonacci numbers. Many plants produce new branches in quantities based on fibonacci numbers.

133
In section 12 when we discussed the head and shoulders pattern we discussed how to project the length of the leg. But the question is why it works out that way. The reason is that the length of the leg is related by phi, the golden section, to the ratio of the distance from the top of the head to the nape of the neck.
So, when trying to determine the direction of the trend the best place to start is the most recent head and shoulders pattern. A head and shoulders top means the trend is down and a head and shoulders bottom is means that the trend is up.
Look at the points labeled 1 and 2 on the chart above. Both points show the downward price movement stop and reverse up for a time before heading back down. The trend is clearly down. These moves against the main trend are called retracements. As we covered in section 10 on projected support and resistance, retracements travel a distance related to phi or the golden portion of the last movement with the trend. A move with the trend is called an impulse movement while a move against the trend is called a retracement.
134
If the current price move is in the direction of the trend or impulse the projected phi or Fibonnaci ratios for the next move are .618% ,1%, 1.272%, 1.5% or 1.618% of the length of the last impulse move. If the current move is a retracement against the direction of the impulse move then the phi or fibonacci ratios for the extent of the move are 32.8%, 50%, .618% and 78.6% against the length of the last impulse move before continuing in the direction of the impulse move. A retracement is normal for any body or object which has lost balance. The retracement is a reaction by the body back towards balance. For every action there is an equal and opposite reaction. The reaction to a loss of balance is a move attempting to regain balance. Before executing any trades you should know if the trend is up or down. You should know if the current move is an impulse (with trend) or a retracement (against trend). The most simple way to determine trend is to look at the most recent head and shoulders of the man on the chart. You can then call upon sacred geometry to project the extent of the current market move. We have revealed the head, shoulders, and legs of the man on the charts but the man must have something to catch his steps. He must have feet.

135
As we saw in section 6 cycles of a walking market, a walk is a succession of near falls. When walking you push yourself off balance with a thrust or impulse from one leg and catch your fall when the other foot hits the ground. So, now you know why you must have at least two legs. Legs are helpful for propelling a walker in a desired direction but there is very little control of the landing leg unless a foot is attached to it. We've discussed what a market leg is. Now we need to add feet to the legs. The feet of the market are price bars. A price bar may not look like a foot to you that doesn't matter. If it quacks like a duck, walks like a duck, and looks like a duck it is a duck! The anatomy of a price bar can be seen in the illustrations below. A single price bar represents one footstep/footprint of the market for the time frame you are viewing.
Illustrated above is a human footprint next to a market footprint. As you can see the human foot has three distinguishing characteristics. Toes, the ball of the foot and the heel. A market footprint also has three distinguishing characteristics. An upper shadow, a real body and lower shadow. The upper shadow functions like the toes on a human foot. The real body functions like the Ball of the foot, and the lower shadow functions as the heel. Now that we know the anatomy of a human footprint and a market footprint, let's take a look at the similar stories these two footprints tell us.
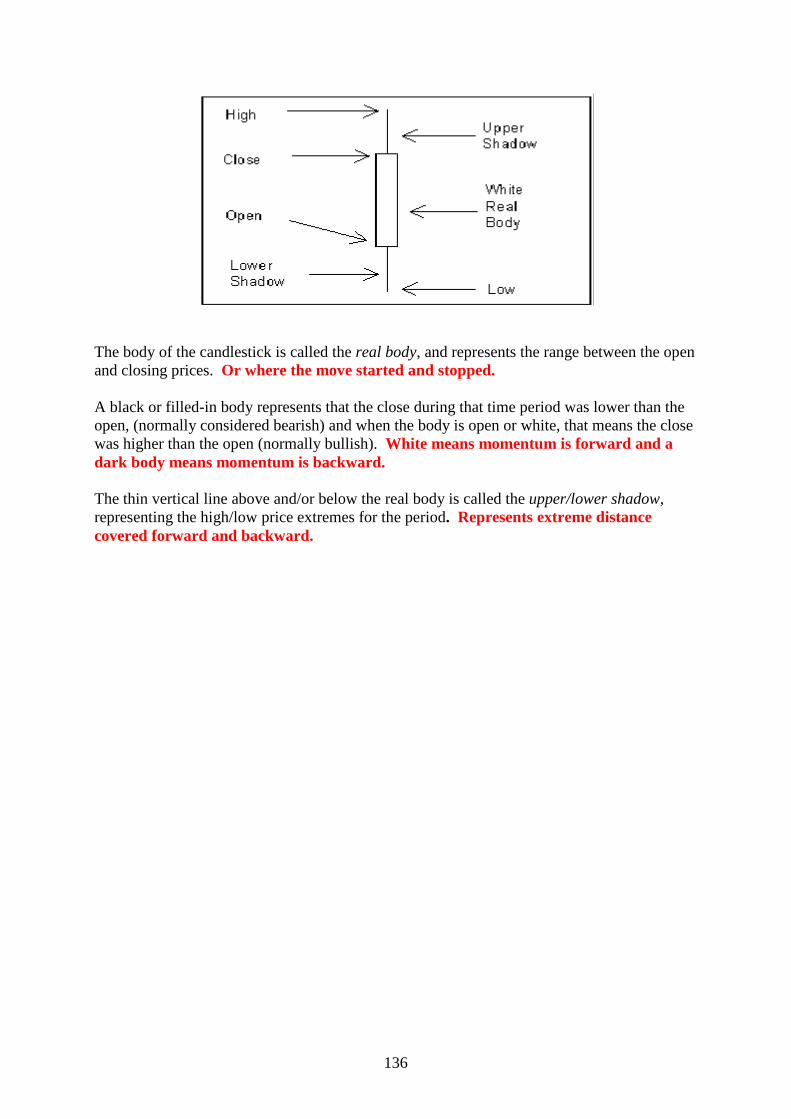
136
The body of the candlestick is called the real body, and represents the range between the open and closing prices. Or where the move started and stopped. A black or filled-in body represents that the close during that time period was lower than the open, (normally considered bearish) and when the body is open or white, that means the close was higher than the open (normally bullish). White means momentum is forward and a dark body means momentum is backward. The thin vertical line above and/or below the real body is called the upper/lower shadow, representing the high/low price extremes for the period. Represents extreme distance covered forward and backward.

137
In the above diagram you can see the regions of a market footprint and see the corresponding regions of the human footprint. The market footprint is for a bar that closed up or the closing price is higher than the opening price. The illustration below shows the market footprint for a price bar that closed down or lower than the opening price. As you can see, the human footprint is now also, pointing in the opposite direction.
Why does a market footprint have upper and lower shadows. Well, that gets into section 8 where we talked about the principles of support and resistance. When you start from a standing position and take a step forward you must have traction or something to push off of. Before you can start your forward motion you must rock back on your heels to gain traction for your push off step. In order to push off you must have something to push off of, some support which is usually the ground or a floor. It is almost imperceptible unless you pay attention to it. This is why when you step on something slippery you fall backwards instead of forward. You can't step off of water or air because you would have no support from which you could gain traction.

138
On an up bar (market footprint) the lower shadow is the man on the charts rocking back on his heels to gain traction. On a down bar the lower shadow is the toe and the upper shadow is the heel. A foot-strike while walking is a heel to toe process. When your step strikes the ground the heel touches first and the toe touches last. The toe represents the extreme range of the foot-strike before it comes to rest. So, to take a step, you rock back on your heels for traction and the step extends as far as the tip of the toes. But when the foot comes to rest your weight will be resting on the balls of your feet and the forward half of your heel. So, the human footprint also has upper and lower shadows.
On the human footprint above, the white area where you see the red line is where the weight of the body is supported when the body is standing still. This is the area called the body on a market footprint. All the other regions of the footprint are the shadows. The same shadows you see on a market footprint. We have now constructed the man on the charts. You have seen his head and shoulders and how they are the keys to balance and direction. You have seen his legs and how they relate to sacred geometry and you have seen his feet and how they tell you where he's been and where he is now. Now that you know what he is made of it's time to take a look at how he moves or his biomechanics for it is in the nature of his biomechanics which allows you to predict his next step.

139
The illustration on the left shows the location of your center of gravity when you are standing flat footed. The illustration on the right shows the location of your center of gravity when you are standing on the balls of your feet. Like a tripod, lower body balance is composed of three elements. Left foot, right foot and center of gravity. Take a close look and you can see that the figure on the left takes on the configuration of a see-saw or balance beam scale. Now, let's see what this arrangement of balance looks like for the posture of the man on the charts. Look at the illustration on the next page.

140
Look at the chart above. It does not matter what kind of market. Stock market, currency markets, indices, futures or the weather. When you place the data on a Chart it displays the principles of universal balance. The man on the charts will appear. Go to the arrows above and take a look at the three bar configurations at each point. You will notice that at each arrow is at a reversal point and at each reversal point you see the pivot point pattern that you learned about in section (19). The definition of a pivot is, "a point on which something turns or rotates."

141
As we have discussed, a see-saw moves on a pivot. A balance beam scale moves on a pivot and every joint on a human body is nothing more than a pivot point. Since man has pivots to enable rotation of his joints, the man on the charts must also have pivots. Not only that, while walking, the most efficient way to change direction is to step and pivot. Therefore, by proxy, the man on the charts must step and pivot to change directions. Every pivot of the man on the charts corresponds with a pivot on the joints of a human body.

142
Now let's go back to the chart. The red and green lines are resistance and support respectively. You can see that the lines are drawn at the highest and lowest price over the three month period. If you need further clarification refer back to section (8) on support and resistance. We've already discussed in section (19) how to trade a pivot. The main thing you need to understand is that a pivot signals a swing in the balance of supply and demand. The see-saw has become imbalanced. Time to do a little research. Look up some charts of any liquid market for any time period in history. You will see the pivot at support and resistance at least 70% of the time. If you can get a chart of weather temperatures you will observe the same phenomena. The other 30% of the time a pivot does not form is because the pivot is occurring on the chart but in a longer time frame. You may be analyzing the hourly chart but the pivot is occurring on the daily chart. You may be analyzing the daily charts but the pivot occurred on the weekly chart. Once again, a cycle within a cycle. When two cycles bump heads the stronger cycle wins. The longer the time frame the stronger the cycle. NOTE: Do not enter a trade unless you know where the pivot is located on the monthly, weekly, daily, and intra-day charts. When you see a pivot on the daily or weekly charts, wait for a pivot on the hourly chart. Now the cycles are lined up and also will keep your stop-loss small. That's because a pivot bar on a daily chart may have a 100 point range. The pivot bar on an hourly chart may have a range of 15 to 50 points. If price should go against you past the extreme range of the pivot bar it's time to exit the trade because market balance is attempting to swing back in the opposite direction.

143

144
The two illustrations above are of a man walking uphill. Can you look at each set of tracks and predict where the next footprint will fall. Figure (A) shows the set of tracks of a man walking in perfect balance. If you want to predict where the next footstep will land the most logical guess would be directly ahead of the last footstep. His trend is up and his steps show no indication that anything is about to change. Figure (B) also shows the set of tracks of a man walking in perfect balance. If you want to predict where the next footstep will land the most logical guess would be that the man has started to turn so, his next step will put him in position to complete the turn. The last footstep in figure (B) has set up a pivot point for the walking man. He may still change his mind and continue in his current direction but that would put him off balance because he would have to cross his legs to do so. Whenever you cross your legs while walking or running you lose balance because of the tendency to trip over your legs. A market reacts in exactly the same way.
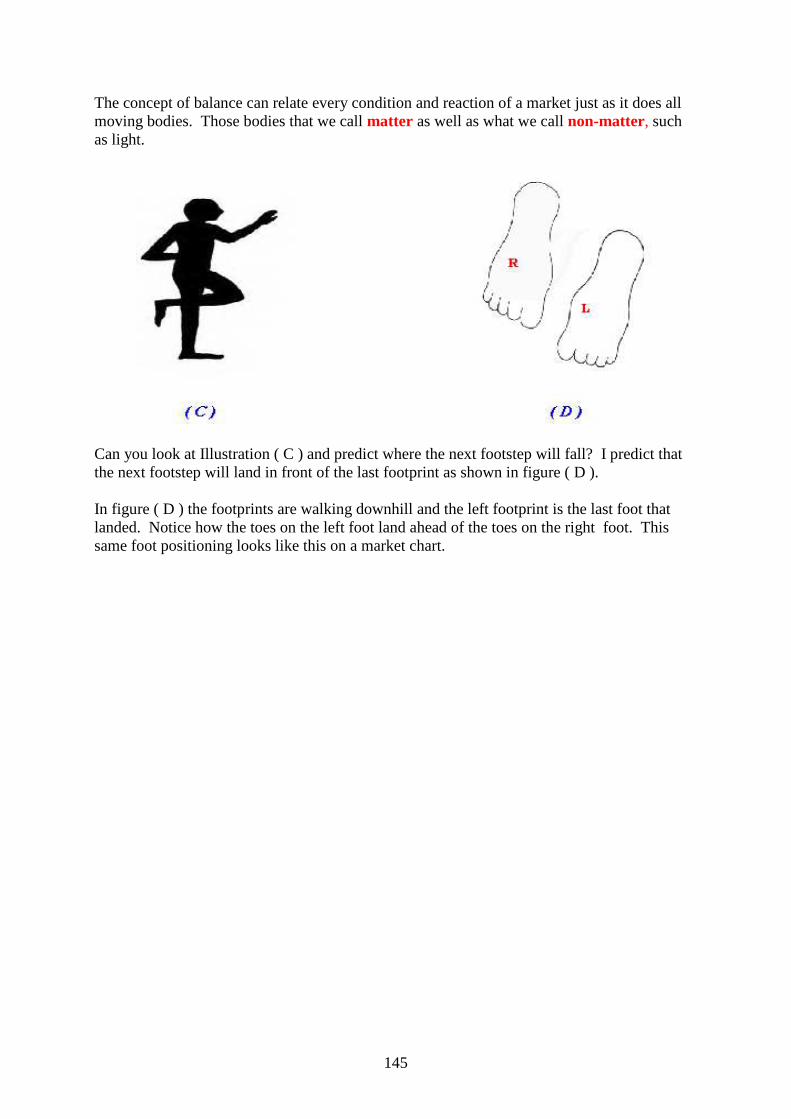
145
The concept of balance can relate every condition and reaction of a market just as it does all moving bodies. Those bodies that we call matter as well as what we call non-matter, such as light.
Can you look at Illustration ( C ) and predict where the next footstep will fall? I predict that the next footstep will land in front of the last footprint as shown in figure ( D ). In figure ( D ) the footprints are walking downhill and the left footprint is the last foot that landed. Notice how the toes on the left foot land ahead of the toes on the right foot. This same foot positioning looks like this on a market chart.

146
BUT NOW WHAT HAPPENS IF THE LANDING FOOT FAILS TO LAND IN FRONT OF THE PRIOR FOOTSTEP? TRY IT FOR YOURSELF. YOU WILL EITHER STUMBLE OR FALL OR BOTH. IF YOU FALL PAY AT TENTION TO HOW YOU INSTINCTIVELY REACH OUT AND GRAB THE CLOSES T OBJECT OF SUPPORT.

147
TRADING MISTAKES
Although there are many mistakes a trader can make but there are certain mistakes that are common to all losing traders. Everyone goes through their trading mistakes unless they have a mentor taking them step by step through all aspects of trading. Becoming a successful trader is a process. You must educate yourself so that you may avoid pitfalls in the process. Some mistakes are basic like not knowing when to take profits thereby turning a winning trade into a losing trade. Or not knowing the proper place to put your stop loss resulting in getting whipsawed out of winning trades. And most fail because they don't know when not to trade.

148
THE TOP 10 MISTAKES TRADERS MAKE AND HOW TO AVOID THEM
Achieving success in market trading requires avoiding numerous pitfalls as much, or more, than it does seeking out and executing winning trades. In fact, most professional traders will tell you that it's not any specific trading methods that make traders successful, but instead it's the overall rules to which those traders strictly adhere that keep them "in the game" long enough to achieve success. Following are 10 of the more prevalent mistakes I believe traders make in futures trading. This list is in no particular order of importance.
1. DON'T KNOW THEIR PLACE IN THE MARKET FOOD CHAIN Trading is a zero sum game. The traders that make money earn their money from the traders who lose money. There are large operators in every market . Learn to follow in the elephant's footsteps and she will clear a path for you.
2. IMPROPER TRADE ENTRY Don't realize that trading is a zero sum game. The people on the winning side of the trade make their money from the traders on the losing side of the trade. There is always someone on the other side of the trade. For every buyer there must be as seller and for every seller there must be a buyer. You don't want some large operators taking the other side of your trade because they will manipulate the price to your stop-loss and whipsaw you out of your trade. The way you enter a trade has a lot to do with who you go up against.
3. DON'T KNOW BOTH SIDES OF THE MARKET . Many traders don't understand that a market operates like a balance scale used for weights and measures. a two way mechanism that operates like a see-saw. Yes, the playground teeter-totter we all played on as children. The creator in his/her infinite wisdom made certain things so simple, like you can't see your finger when you hold it to your lips because, it's to close to your face. The big secret is that buyers make a market go down and sellers make a market go up. A market is made up of long buyers and short sellers. The common term is bulls and bears. Without a working knowledge of the interaction between these two groups and how the laws of gravity affect them you will fail.
When you think of sellers you need to think short sellers. Short sellers are people who enter the market by selling and make their profit by buying back the unit at a lower price than they sold it for. Yes! You can sell before you buy. So, when you think of buyers and sellers don't think of sellers as people who sold their unit after buying. Sellers are people who enter a trade with a bet that price will fall. This is what the terms bulls and bears mean. Bulls are buyers and bears are short sellers.
4. FAILURE TO USE PROTECTIVE STOPS . Using protective buy stops or sell stops upon entering a trade provide a trader with a good idea of about how much money he or she is risking on that particular trade, should it turn out to be a loser. Protective stops are a good money-management tool, but are not perfect. There are no perfect money-management tools in trading. I prefer to use mental stops so I don't give

149
operators a target stop to shoot for.
5. LACK OF " PATIENCE " AND " DISCIPLINE ." While these two virtues are over-worked and very often mentioned when determining what unsuccessful traders lack, not many will argue with their merits. Indeed. Don't trade just for the sake of trading or just because you haven't traded for a while. Let those very good trading "set-ups" come to you, and then act upon them in a prudent way. The market will do what the market wants to do -- and nobody can force the market's hand.
6. TRADING AGAINST THE TREND --OR TRYING TO PICK TOPS AND BOTTOMS IN
MARKETS . It's human nature to want to buy low and sell high (or sell high and buy low for short-side traders). Unfortunately, that's not at all a proven means of making profits in futures trading. Top pickers and bottom-pickers usually are trading against the trend, which is a major mistake.
7. LETTING LOSING POSITIONS RIDE TOO LONG . Most successful traders will not sit on a losing position very long at all. They'll set a tight protective stop, and if it's hit they'll take their losses (usually minimal) and then move on to the next potential trading set up. Traders who sit on a losing trade, "hoping" that the market will soon turn around in their favor, are usually doomed.
8. "O VER-TRADING ." Trading too many markets at one time is a mistake -- especially if you are racking up losses. If trading losses are piling up, it's time to cut back on trading, even though there is the temptation to make more trades to recover the recently lost trading assets. It takes keen focus and concentration to be a successful futures trader. Having "too many irons in the fire" at one time is a mistake.
9. FAILURE TO ACCEPT COMPLETE RESPONSIBILITY FOR YOUR O WN ACTIONS . When you have a losing trade or are in a losing streak, don't blame your broker or someone else. You are the one who is responsible for your own success or failure in trading. You make the trading decisions. If you feel you are not in firm control of your own trading, then why do you feel that way? You should make immediate changes that put you in firm control of your own trading destiny.
10. NOT GETTING A BIGGER -PICTURE PERSPECTIVE ON A MARKET . One can look at a daily bar chart and get a shorter-term perspective on a market trend. But a look at the longer-term weekly or monthly chart for that same market can reveal a completely different perspective. It is prudent to examine longer-term charts, for that bigger-picture perspective, when contemplating a trade.
150
W. D. GANN THE GREATEST TRADER THE WORLD HAS EVER KNOWN
W. D. GANN THE GREATEST TRADER THE WORLD HAS EVER KNOW ATTRIBUTED HIS SUCCESS TO HIS UNDERSTANDING OF THE UNIVERSAL LAW OF VIBRATION... The Law of Vibration. Nothing rests; everything moves; everything vibrates. This is the law of progress, of movement and of rotation. This Principle explains that the differences between manifestations of matter, energy, mind and spirit, result largely from varying rates in vibration. All that exists is in constant vibration and motion. Atoms always vibrate with such great rapidity that they seem motionless to the physical eye. At the other end of the scale are things that vibrate so slowly that they also appear to be motionless or non-existent. In between are the various vibrations of living entities, which range from consciousness all the way down to the lowly dust particle that plays an important role in the food chain. Still there are things even lower then dust. If we were to follow the scale of life all the way down to the utmost regions of the negative pole (undifferentiated matter), we again would find ourselves in the realm of spirit - the Alpha, and the Omega. All that is, begins in spirit and ends in spirit completing a single cycle of evolution that will be repeated countless numbers of times through eternity.

151
Reprinted From
"The Ticker and Investment Digest"
(later became the Wall Street Journal)
December of 1909
William D. Gann An Operator Whose Science and Ability Place
Him in the Front Rank His Remarkable Predictions and Trading Records
Sometime ago the attention of this magazine was attracted by certain long pull Stock Market predictions, which were being made by William D. Gann. In a large number of cases Mr. Gann gave us, in advance, the exact points at which certain stocks and commodities would sell, together with prices close to the then prevailing figures which would not be touched. For instance, when the New York Central was 131 he predicted that it would sell at 145 before 129. So repeatedly did his figures prove to be accurate, and so different did his work appear from that of any expert whose methods we had examined, that we set about to investigate Mr. Gann and his way of figuring out these predictions, as well as the particular use which he was making of them in the market. The results of this investigation are remarkable in many ways. It appears to be a fact Mr. W, D. Gann has developed an entirely new idea as to the principles governing stock market movements. He bases his operations upon certain natural laws, which, though existing since the world began, have only in recent years been subjected to the will of man and added to the list of so-called modern discoveries. We have asked Mr. Gann for an outline of his work, and have secured some remarkable evidence as to the results obtained there from. We submit this in full recognition of the fact that in Wall Street a man with a new idea, an idea which violates the traditions and encourages a scientific view of the Proposition, is not usually welcomed by the majority, for the reason that he stimulates thought and research. These activities the said majority abhors. W. D. Gann's description of his experience and methods is given herewith. It should be read with recognition of the established fact that Mr. Gann's predictions have proved correct in a large majority of instances. "For the past ten years I have devoted my entire time and attention to the speculative markets. Like many others, I lost thousands of dollars and experienced the usual ups and downs incidental to the novice who enters the market without preparatory knowledge of the subject."

152
"I soon began to realize that all successful men, whether Lawyers, Doctors or Scientists, devoted years of time to the study and investigation of their particular pursuit or profession before attempting to make any money out of it." "Being in the Brokerage business myself and handling large accounts, I had opportunities seldom afforded the ordinary man for studying the cause of success and failure in the speculations of others. I found that over ninety percent of the traders who go into the market without knowledge or study usually lose in the end." "I soon began to note the periodical recurrence of the rise and fall in stocks and commodities. This led me to conclude that natural law was the basis of market movements. I then decided to devote ten years of my life to the study of natural law as applicable to the speculative markets and to devote my best energies toward making speculation a profitable profession. After exhaustive researches and investigations of the known sciences, I discovered that the law of vibration enabled me to accurately determine the exact points at which stocks or commodities should rise and fall within a given time." The working out of this law determines the cause and predicts the effect long before the street is aware of either. Most speculators can testify to the fact that it is looking at the effect and ignoring the cause that has produced their losses. "It is impossible here to give an adequate idea of the law of vibrations as I apply it to the markets. However, the layman may be able to grasp some of the principles when I state that the law of vibration is the fundamental law upon which wireless telegraphy, wireless telephone and phonographs are based. Without the existence of this law the above inventions would have been impossible." "In order to test the efficiency of my idea I have not only put in years of labor in the regular way, but I spent nine months working night and day in the Astor Library in New York and in the British Museum of London, going over the records of stock transactions as far back as 1820. I have incidentally examined the manipulations of Jay Gould, Daniel Drew, Commodore Vanderbilt & all other important manipulators from that time to the present day. I have examined every quotation of Union Pacific prior to & from the time of E. H. Harriman, Mr. Harriman's was the most masterly. "In going over the history of markets and the great mass of related statistics, it soon becomes apparent that certain laws govern the changes and variations in the value of stocks, and that there exists a periodic or cyclic law which is at the back of all these movements. Observation has shown that there are regular periods of intense activity on the Exchange followed by periods of inactivity." Mr. Henry Hall in his recent book devoted much space to "Cycles of Prosperity and Depression," which he found recurring at regular intervals of time. The law, which I have applied, will not only give these long cycles or swings, but the daily and even hourly movements of stocks. By knowing the exact vibration of each individual stock I am able to determine at what point each will receive support and at what point the greatest resistance is to be met.

153
"Those in close touch with the market have noticed the phenomena of ebb and flow, or rise and fall, in the value of stocks. At certain times a stock will become intensely active, large transactions being made in it; at other times this same stock will become practically stationary or inactive with a very small volume of sales. I have found that the law of vibration governs and controls these conditions. I have also found that certain phases of this law govern the rise in a stock and an entirely different rule operates on the decline." "While Union Pacific and other railroad stocks which made their high prices in August were declining, United States Steel Common was steadily advancing. The law of vibration was at work, sending a particular stock on the upward trend whilst others were trending downward." "I have found that in the stock itself exists its harmonic or inharmonious relationship to the driving power or force behind it. The secret of all its activity is therefore apparent. By my method I can determine the vibration of each stock and also, by taking certain time values into consideration, I can, in the majority of cases, tell exactly what the stock will do under given conditions." "The power to determine the trend of the market is due to my knowledge of the characteristics of each individual stock and a certain grouping of different stocks under their proper rates of vibration. Stocks are like electrons, atoms and molecules, which hold persistently to their own individuality in response to the fundamental law of vibration. Science teaches that 'an original impulse of any kind finally resolves itself into a periodic or rhythmical motion; also, just as the pendulum returns again in its swing, just as the moon returns in its orbit, just as the advancing year over brings the rose of spring, so do the properties of the elements periodically recur as the weight of the atoms rises." "From my extensive investigations, studies and applied tests, I find that not only do the various stocks vibrate, but that the driving forces controlling the stocks are also in a state of vibration. These vibratory forces can only be known by the movements they generate on the stocks and their values in the market. Since all great swings or movements of the market are cyclic, they act in accordance with periodic law." "Science has laid down the principle that the properties of an element are a periodic function of its atomic weight. A famous scientist has stated that 'we are brought to the conviction that diversity in phenomenal nature in its different kingdoms is most intimately associated with numerical relationship. The numbers are not intermixed accidentally but are subject to regular periodicity. The changes and developments are seen to be in many cases as somewhat odd." Thus, I affirm every class of phenomena, whether in nature or on the stock market, must be subject to the universal law of causation and harmony. Every effect must have an adequate cause. "If we wish to avert failure in speculation we must deal with causes. Everything in existence is based on exact proportion and perfect relationship. There is no chance in nature, because mathematical principles of the highest order lie at the foundation of all things. Faraday said, "There is nothing in the universe but mathematical points of force." "Vibration is fundamental: nothing is exempt from this law. It is universal, therefore applicable to every class of phenomena on the globe."

154
Through the law of vibration every stock in the market moves in its own distinctive sphere of activities, as to intensity, volume and direction; all the essential qualities of its evolution are characterized in its own rate of vibration. Stocks, like atoms, are really centers of energy; therefore, they are controlled mathematically. Stocks create their own field of action and power: power to attract and repel, which principle explains why certain stocks at times lead the market and 'turn dead' at other times. Thus, to speculate scientifically it is absolutely necessary to follow natural law. "After years of patient study I have proven to my entire satisfaction, as well as demonstrated to others, that vibration explains every possible phase and condition of the market." In order to substantiate Mr. W. D. Gann's claims as to what he has been able to do under his method, we called upon Mr. William E. Gilley, an Inspector of Imports, 16 Beaver Street, New York. Mr. Gilley is well known in the downtown district. He himself has studied stock market movements for twenty-five years, during which time he has examined every piece of market literature that has been issued & procurable in Wall Street. It was he who encouraged Mr. Gann to study the scientific and mathematical possibilities of the subject. When asked what had been the most impressive of Mr. Gann's work and predictions, he replied as follows : results show that, whether unconsciously or not, Mr. Harriman worked strictly in accordance with natural law." "It is very difficult for me to remember all the predictions and operations of W. D. Gann which may be classed as phenomenal, but the following are a few. "In 1908 when the Union Pacific was 168-1/8, he told me it would not touch 169 before it had a good break. We sold it short all the way down to 152-5/8, covering on the weak spots and putting it out again on the rallies, securing twenty-three points profit out of an eighteen-point market wave." "He came to me when United States Steel was selling around 50, and said, "This steel will run up to 58 but it will not sell at 59. From there it should break 16 points." We sold it short around 58 with a stop at 59. The highest it went was 58. From there it declined to 41-17 points." "At another time, wheat was selling at about 89¢. Gann predicted that the May option would sell at $1.35. We bought it and made large profits on the way up. It actually touched $1.35." "When Union Pacific was 172, he said it would go to 184-7/8 but not an eighth higher until it had a good break. It went to 184-7/8 and came back from there eight or nine times. We sold it short repeatedly, with a stop at 185, and were never caught. It eventually came back to 17." "Mr. Gann's calculations are based on natural law. I have followed Gann and his work closely for years. I know that he has a firm grasp of the basic principles which govern stock market movements, and I do not believe any other man can duplicate the idea or his method at the present time." "Early this year, he figured that the top of the advance would fall on a certain day in August and calculated the prices at which the Dow Jones Averages would then stand. The market culminated on the exact day and within four-tenths of one percent of the figures predicted."

155
"You and W D Gann must have cleaned up considerable money on all these operations," was suggested. "Yes, we have made a great deal of money. Gann has taken half-million dollars out of the market in the past few years. I once saw him take $130, and in less than one month run it up to over $12,000. Gann can compound money faster than any man I have ever met." "One of the most astonishing calculations made by Mr. Gann was during last summer [1909] when he predicted that September Wheat would sell at $1.20. This meant that it must touch that figure before the end of the month of September. At twelve o'clock, Chicago time, on September 30th (the last day) the option was selling below $1.08, and it looked as though his prediction would not be fulfilled. Mr. Gann said, 'If it does not touch $1.20 by the close of the market it will prove that there is something wrong with my whole method of calculation. I do not care what the price is now, it must go there.' It is common history that September Wheat surprised the whole country by selling at $1.20 and no higher in the very last hour of trading, closing at that figure." So much for what W D Gann has said and done as evidenced by himself & others. Now as to what demonstrations have taken place before our representative : During the month of October, 1909, in twenty-five market days, W D Gann made, in the presence of our representative, two hundred and eighty-six transactions in various stocks, on both the long and short side of the market. Two hundred and sixty-four of these transactions resulted in profits ; twenty-two in losses. The capital with which he operated was doubled ten times, so that at the end of the month he had one thousand percent of his original margin. In our presence Mr. William D. Gann sold Steel common short at 94-7/8, saying that it would not go to 95. It did not. On a drive, which occurred during the week ending October 29, Mr. Gann bought U.S. Steel common stock at 86-1/4, saying that it would not go to 86. The lowest it sold was 86-1/3. We have seen gann give in one day sixteen successive orders in the same stock, eight of which turned out to be at either the top or the bottom eighth of that particular swing. The above we can positively verify. Such performances as these, coupled with the foregoing, are probably unparalleled in the history of the Street. James R. Koene has said, "The man who is right six times out of ten will make a fortune." Gann is a trader who, without any attempt to not know the results were to be published, established a record of over ninety-two percent profitable trades. Mr. W. D. Gann has refused to disclose his method at any price, but to those scientifically inclined he has unquestionably added to the stock of Wall Street knowledge and pointed out infinite possibilities. make a showing, for he did not know the results were to be published,

156
established a record of over ninety-two percent profitable trades. Mr. W. D. Gann has refused to disclose his method at any price, but to those scientifically inclined he has unquestionably added to the stock of Wall Street knowledge and pointed out infinite possibilities. We have requested Mr. Gann to figure out for the readers of the Ticker a few of the most striking indications, which appear in his calculations. In presenting these we wish it understood that no man, in or out of Wall Street, is infallible. William D Gann's figures at present indicate that the trend of the stock market should, barring the usual rallies, be toward the lower prices until March or April 1910. He calculates that May Wheat, which is now selling at $1.02, should not sell below 99¢, and should sell at $1.45 next spring. On Cotton, which is now at about 15¢ level, he estimates that after a good reaction from these prices the commodity should reach 18¢ in the spring of 1910. He looks for a corner in the March or May option. Whether these figures prove correct or not will in no way detract from the record which W. D. Gann has already established. William Delbert Gann was born in Lufkin, Texas, and is thirty-one years of age. He is a gifted mathematician, has an extraordinary memory for figures, and is an expert Tape Reader. Take away his science and he would beat the market on his intuitive tape reading alone. Endowed as he is with such qualities, we have no hesitation in predicting that, within a comparatively few years, William D. Gann will receive recognition as one of Wall Street's leading operators. Note: Since the market forecast was made, Coffee has suffered the expected decline, the extreme break having been 120 points. The lowest on the May wheat thus far has been $1.01-5/8. It is now selling at $1.06-1/4.

157
HOW IS FX TRADED http://www.fxcm.com/tradingguide/how-is-fx-traded.htm
• Example of an FX Trade • Currency Pairs • Leverage • Margin • Trading Costs
FUNDAMENTAL ANALYSIS http://www.fxcm.com/tradingguide/fundamental-analysis.htm
• Techniques • Know your currency pairs
TECHNICAL ANALYSIS http://www.fxcm.com/tradingguide/technical-analysis.htm
• Support & Resistance • In Range-bound markets • In Momentum • Market Oscillators
RISK MANAGEMENT/TRADING PHYCHOLOGY http://www.fxcm.com/tradingguide/risk-management.htm
• Risk Management Basics • What should trader psychology be?
ACCOUNT SIZE http://www.fxcm.com/tradingguide/mini-account.htm

158
TRADE MANAGEMENT
Time stops - If after 3 days, price has neither stopped you out or reached the profit target, you will close the trade at the end of the third trading day after a swing pivot test or the pullback test of a support/resistance level breakout. Enter when an intra-day pivot has been created around the swing pivot. Place your stop below the intra-day pivot. This could decrease you risk by more than half. There are cycles within cycles. The way you have daily cycles, which are contained within weekly cycles, which are contained within monthly Cycles, which are contained within yearly cycles. If the daily cycle runs into the annual cycle, the annual cycle is stronger because it is the larger or more dominant cycle. In nature the more dominant cycle always has its way. On price charts there are pivots within pivots. intra-day pivots contained within daily pivots, which are contained within weekly pivots. Weekly pivots contained within monthly pivots. And because, the more dominant cycle always has its way. A support or resistance level on a monthly chart will always be stronger than a support or resistance level on a daily or weekly chart. A support or resistance level on the daily chart is always Stronger than support or resistance levels on an intra-day chart.
BOOK CONVERTED TO PDF BY KAROL JANUS