animal feeding operations technical workgroup report
TRANSCRIPT
Animal Feeding Operations Technical Workgroup Report
On: Air Emissions Characterization, Dispersion Modeling, and Best Management Practices
Prepared by:
The Iowa Department of Natural Resources Animal Feeding Operations Technical Workgroup
12/15/04
Table of Contents 1.0 Introduction ...................................................................................................................................................................... 1
1.1 Purpose ...................................................................................................................................................................... 1 1.2 Process ....................................................................................................................................................................... 1 1.3 Report Organization ................................................................................................................................................... 2
2.0 Best Management Practices ............................................................................................................................................. 3 2.1 Introduction ............................................................................................................................................................... 3 2.2 Bmp Fact Sheets ......................................................................................................................................................... 3 2.3 Bmp Flow Charts ........................................................................................................................................................ 8 2.4 Potential Negative Environmental Impacts ............................................................................................................... 8 2.5 Bmp Dissemination and Updates ............................................................................................................................... 8 2.6 Closing Comments ..................................................................................................................................................... 8
3.0 Air Emissions Characterization ....................................................................................................................................... 14 3.1 Introduction ............................................................................................................................................................. 14 3.2 Purpose .................................................................................................................................................................... 14 3.3 Methodology ............................................................................................................................................................ 14 3.4 Emission Factor Background .................................................................................................................................... 14 3.5 How to Estimate Emissions Using an Emission Factor ............................................................................................. 15 3.6 Emission Factor Use ................................................................................................................................................. 16 3.7 Conclusion ................................................................................................................................................................ 16
4.0 Dispersion Modeling ....................................................................................................................................................... 35 4.1 Executive Summary .................................................................................................................................................. 35 4.2 Purpose .................................................................................................................................................................... 35 4.3 Methodology ............................................................................................................................................................ 36 4.4 Candidate Models .................................................................................................................................................... 38 4.5 Conclusion ................................................................................................................................................................ 42
5.0 Conclusion ...................................................................................................................................................................... 45 Table 1-1. Contributors to the Iowa Department of Natural Resources Animal Feeding Operations Technical Workgroup 2 Table 2-1. Potential Negative Environmental Impacts of Bmp’s: ........................................................................................... 9 Table 3-1. Hydrogen Sulfide Emission Factors - Housing ...................................................................................................... 17 Table 3-2. Hydrogen Sulfide Emission Factors – Manure Storage ........................................................................................ 17 Table 3-3. Ammonia Emission Factors .................................................................................................................................. 19 Table 3-4. Odor Emission Factors ......................................................................................................................................... 29 Table 3-5. Particulate Matter (PM10) Emission Factors ....................................................................................................... 34 Table 4-1. List of Candidate Models ...................................................................................................................................... 43 Chart 2-1. Flow Chart for Odor Control Practices ................................................................................................................. 10 Chart 2-2. Flow Chart for Ammonia Control Practices.......................................................................................................... 11 Chart 2-3. Flow Chart for Hydrogen Sulfide Control Practices ............................................................................................. 12 Chart 2-4. Flow Chart for Dust/Particulate Control Practices ............................................................................................... 13
1
1.0 Introduction In recent years, livestock production in Iowa has undergone a dramatic shift, as fewer farms produce greater numbers of animals at each farm. As the number of animals at a given farm has increased, so have the air emissions from these farms. Some of the rural neighbors of these animal feeding operations (AFOs) have expressed concern that the increasing amount of air contaminants present at their homes and on their property is decreasing their quality of life. To increase the understanding and awareness of this issue, the Iowa Department of Natural Resources (DNR) Animal Feeding Operations Technical Workgroup was convened on February 5th, 2004, with the following mission: “To determine air emissions characterization tools and techniques, ambient air modeling methodologies, and best management practices that can be used to estimate and mitigate air quality impacts that may occur as a result of air emissions from animal feeding operations, and to provide this information to the public.” For the workgroup, the DNR solicited participation from organizations with working knowledge of agricultural practices and technical expertise, including agricultural commodity groups, industrial associations, environmental organizations, academia, and government agencies. Workgroup participant organizations included:
Iowa Air Emissions Assistance Program
Iowa Chapter of Sierra Club
Iowa Citizens for Community Improvement
Iowa Department of Economic Development
Iowa Department of Natural Resources
Iowa Department of Public Health
Iowa State Association of Counties
Iowa State University
Izaac Walton League
National Soil Tilth Laboratory
The University of Iowa
U.S. Environmental Protection Agency A list of all individual contributors to the workgroup is located in Table 1-1.
1.1 Purpose Currently, there are a number of technologies and methods available that have been designed to reduce odor and gas emissions from AFOs, and these are commonly referred to as “best management practices.” Although best management practices themselves are extremely useful in mitigating emissions of air contaminants, it is sometimes unclear if the practices will sufficiently reduce concentrations at a nearby residence. One tool that is available to predict whether or not a best management practice will be effective at various distances away from the livestock facility is dispersion modeling. Dispersion models are routinely used to estimate the concentration of pollutants emitted into the atmosphere. However, the ability of the model to accurately estimate downwind pollutant concentrations remains highly dependent on an accurate estimate of pollutant emission rates from each source. Therefore, it is necessary to have what are called “emission factors”, which are an estimate of the rate at which a pollutant is released from a source Emission factors are determined scientifically through research using instruments that can monitor the speed of a pollutants release. This workgroup provided an opportunity for the DNR to gain valuable insight and expertise from individuals with technical knowledge in these areas has part of a continuing effort to develop a working understanding of the complex technical issues involved in air quality issues associated with AFOs. To complete the mission of the workgroup it was necessary to subdivide the workgroup into three smaller workgroups focusing on the areas of air emissions characterization, ambient air modeling, and best management practices. This report contains a compilation of the findings and recommendations of the three workgroups.
1.2 Process The initial workgroup meeting was held on February 5th, 2004. Each of the three smaller workgroups consisted of seven to ten individuals, including a group facilitator and technical support staff from the DNR. A list of issues developed by DNR was presented to each workgroup that outlined specific topics that each workgroup was to consider. The workgroups were given the option to further refine the list as the process moved forward. The workgroups met periodically from February through August, 2004. A joint meeting of the workgroups was held on August 11, 2004 to allow the individual workgroups to update each other on their progress and activities. On November 1, 2004, another joint meeting of the workgroups was held to present and discuss comments on a draft of this report. These comments
2
were incorporated as appropriate into a revised draft workgroup report that was issued for workgroup review and comment on November 24, 2004. Comments received on the revised draft workgroup report were reviewed by the workgroup facilitators and technical support staff and incorporated as appropriate into this final report.
1.3 Report Organization This report summarizes the processes, assumptions, data, and recommendations of each of the three workgroups. Chapter 2 summarizes the findings and recommendations of the Best Management Practices workgroup. Chapters 3 and 4 summarize the findings and recommendations of the Air Emissions Characterization and Dispersion Modeling workgroups, respectively.
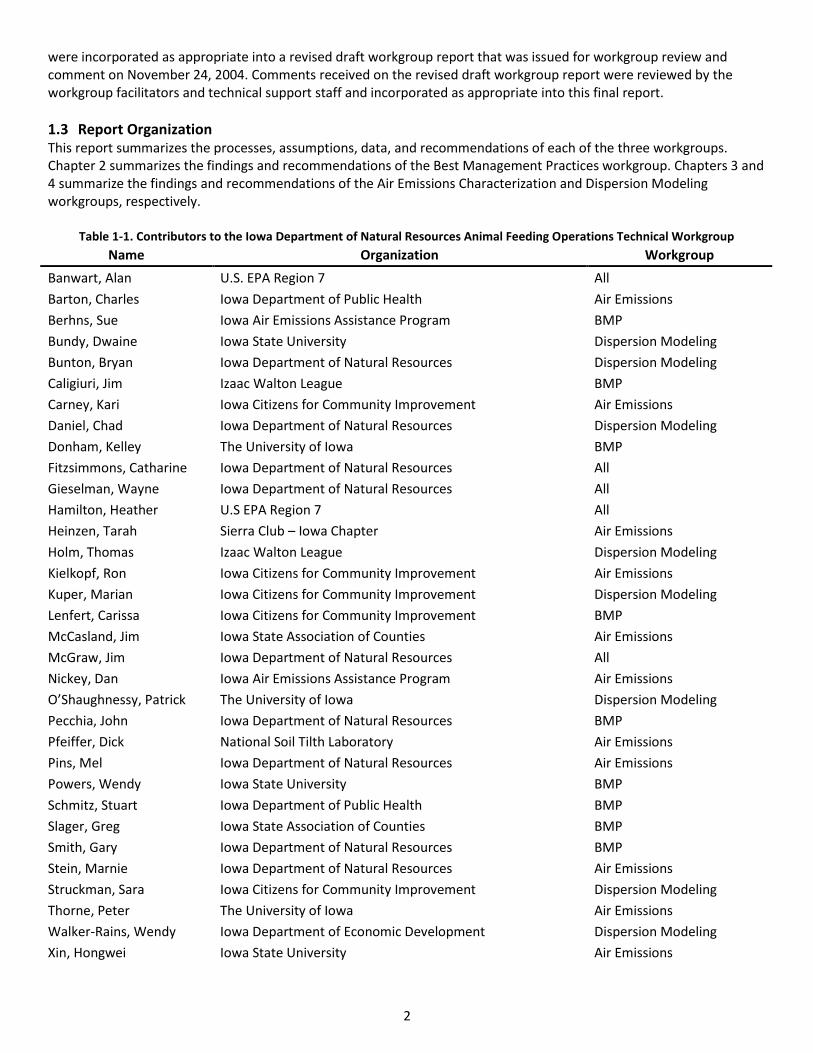
Table 1-1. Contributors to the Iowa Department of Natural Resources Animal Feeding Operations Technical Workgroup
Name Organization Workgroup
Banwart, Alan U.S. EPA Region 7 All
Barton, Charles Iowa Department of Public Health Air Emissions
Berhns, Sue Iowa Air Emissions Assistance Program BMP
Bundy, Dwaine Iowa State University Dispersion Modeling
Bunton, Bryan Iowa Department of Natural Resources Dispersion Modeling
Caligiuri, Jim Izaac Walton League BMP
Carney, Kari Iowa Citizens for Community Improvement Air Emissions
Daniel, Chad Iowa Department of Natural Resources Dispersion Modeling
Donham, Kelley The University of Iowa BMP
Fitzsimmons, Catharine Iowa Department of Natural Resources All
Gieselman, Wayne Iowa Department of Natural Resources All
Hamilton, Heather U.S EPA Region 7 All
Heinzen, Tarah Sierra Club – Iowa Chapter Air Emissions
Holm, Thomas Izaac Walton League Dispersion Modeling
Kielkopf, Ron Iowa Citizens for Community Improvement Air Emissions
Kuper, Marian Iowa Citizens for Community Improvement Dispersion Modeling
Lenfert, Carissa Iowa Citizens for Community Improvement BMP
McCasland, Jim Iowa State Association of Counties Air Emissions
McGraw, Jim Iowa Department of Natural Resources All
Nickey, Dan Iowa Air Emissions Assistance Program Air Emissions
O’Shaughnessy, Patrick The University of Iowa Dispersion Modeling
Pecchia, John Iowa Department of Natural Resources BMP
Pfeiffer, Dick National Soil Tilth Laboratory Air Emissions
Pins, Mel Iowa Department of Natural Resources Air Emissions
Powers, Wendy Iowa State University BMP
Schmitz, Stuart Iowa Department of Public Health BMP
Slager, Greg Iowa State Association of Counties BMP
Smith, Gary Iowa Department of Natural Resources BMP
Stein, Marnie Iowa Department of Natural Resources Air Emissions
Struckman, Sara Iowa Citizens for Community Improvement Dispersion Modeling
Thorne, Peter The University of Iowa Air Emissions
Walker-Rains, Wendy Iowa Department of Economic Development Dispersion Modeling
Xin, Hongwei Iowa State University Air Emissions
3
2.0 Best Management Practices
2.1 Introduction There are a number of technologies and methods that have been designed to reduce odor and gas emissions from AFOs. Collectively, these technologies and methods are referred to as “best management practices” (bmp’s). Bmp’s are available to producers to reduce airborne emissions from livestock buildings, manure storage structures and manure application. Available bmp’s may include chemical treatment, physical barriers or technologies and operational practices that can be implemented by the producer. For example, there are a variety of different products designed to cover earthen manure storage structures and trap gasses, thereby minimizing odor emissions. Recent studies have also shown that diet manipulation to reduce nutrient contents of manures may reduce gas emissions associated with manure storage and handling. The DNR best management practices workgroup was charged with addressing the following issues related to bmps:
1. What types of bmp’s are there to mitigate the emissions of pollutants from AFOs? 2. What is the effectiveness of the bmp’s? 3. What are the associated costs (installation, maintenance, operation) of the bmp’s? 4. What is the availability of the bmp’s? 5. Will the bmp’s have other environmental impacts that may need to be considered? 6. How should information be provided to producers on the availability of bmp’s? 7. How will future technologies be approved and ranked?
The workgroup addressed these questions over the course of four meetings. During the meetings, it was identified that Iowa State University was in the process of publishing four fact sheets and associated flow charts on bmp’s for reducing air emissions from AFOs. After review, the workgroup decided that these fact sheets addressed many of the issues and questions that the workgroup was assigned to review and were therefore adopted by the workgroup. The fact sheets have since been published. The fact sheets and flow charts are discussed below.
2.2 Bmp Fact Sheets The Best Management Practices workgroup recommends adoption of the following four fact sheets: PM 1970a Practices to Reduce Odor from Livestock Operations PM 1971a Practices to Reduce Ammonia Emissions from Livestock Operations PM 1972a Practices to Reduce Hydrogen Sulfide from Livestock Operations PM 1973a Practices to Reduce Dust and Particulates from Livestock Operations The fact sheets briefly describe the potential bmp’s to reduce air pollutants from livestock operations. The fact sheets mention some potential drawbacks as well as benefits of each practice. A producer would not be able to develop and implement one of the bmp’s described in the fact sheet based solely on the information found in these publications. The fact sheets have been developed as an educational tool to make producers aware of scientifically proven practices. If a producer is interested in implementing one of these practices they would have to contact an expert such as representatives from either the Iowa State University Extension office, the United States Department of Agriculture (USDA) Natural Resource Conservation Service (NRCS), equipment vendors, or private consultants who specialize in this area for details as they may pertain to their specific operation. The bmp’s found in the fact sheets (and associated flow charts) have been included only if scientific evidence supports the practice. There are many practices being marketed by private companies that do not yet have second party scientific evidence to support emission reduction claims, therefore, they have been excluded from these publications.
4
2.2.1 Practices to Reduce Odor from Livestock Operations Document PM 1970a, contained on the following pages, is being used with permission from Iowa State University Extension.
1
Practices to Reduce Odor from Livestock Operations
Odor Control Strategies
for Livestock Housing
Odors generated in livestock housing can exit the
facility and make their way to downwind neighbors.
Even systems that utilize external manure storage will
have some manure within the housing itself, creating
odor. Additionally, there will be odors and dust
particles from feed and animals themselves. Odorous
compounds tend to be carried on dust particles and
therefore, strategies to reduce odors from animal
housing focus primarily on housekeeping measures
that reduce dust emissions.
Filtration and Biofiltration
Some odors travel attached to particles. By effectively
trapping particle emissions, odorous compounds can
also be trapped. Mechanical filtration traps approxi-
mately 45 percent of particles between 5 and 10 µm
and 80 percent of particles greater than 10 µm from
animal housing areas. Mechanical filtration reduces
the odor dilution threshold by 40 to 70 percent.
Biofilters trap particulates and also provide an
environment for biological degradation of the trapped
compounds. Biofilters have been developed to reduce
odorous emissions from deep-pit, manure ventilation
exhaust. Although mechanical filtration may be costly,
biofiltration methods can inexpensively and effectively
reduce exhaust odors. Biofiltration costs for a 700-head
farrow-to-wean swine facility are estimated at $0.25 per
piglet produced, amortized over a three-year life of
the biofilter. Odor reductions at the facility exceeded
90 percent with similar reductions in hydrogen sulfide
(90 percent) and ammonia emissions (74 percent).
Similar odor and hydrogen sulfide reductions were
observed using biofiltration on a dairy facility. The
dust generated in a poultry facility, however, led
to a poorer biofilter performance, with odor and
hydrogen sulfide reductions of less than 40 percent.
Biofilters must be designed to provide suitable
conditions for the growth of a mixture of aerobic
bacteria within the biofilter. These bacteria will
degrade the odorous compounds into less odorous
end products. Oxygen concentration, temperature,
residence time, and moisture content are among the
parameters that must be considered when building a
biofilter. Although management must be taken into
consideration, it is clear that low-cost biofiltration
systems ($150–200 per 1,000 cfm of air treated)
can be implemented in livestock housing facilities.
Impermeable Barriers
Following the concept that odor is transmitted on
dust particles, an alternative to filtering particles
during air movement is to stop the movement
altogether. Windbreak walls or air dams have proven
effective in reducing both downwind dust particle
concentrations and odor concentration. Windbreak
walls have been constructed with 10-foot X 10-foot
pipe frames and tarpaulins, and placed at the end of
swine-finishing buildings, immediately downwind of
the exhaust fans. Downwind dust and odor concentra-
tions were reduced on demonstration facilities, in areas
with the windbreak walls, due to plume deflection.
PM 1970a July 2004
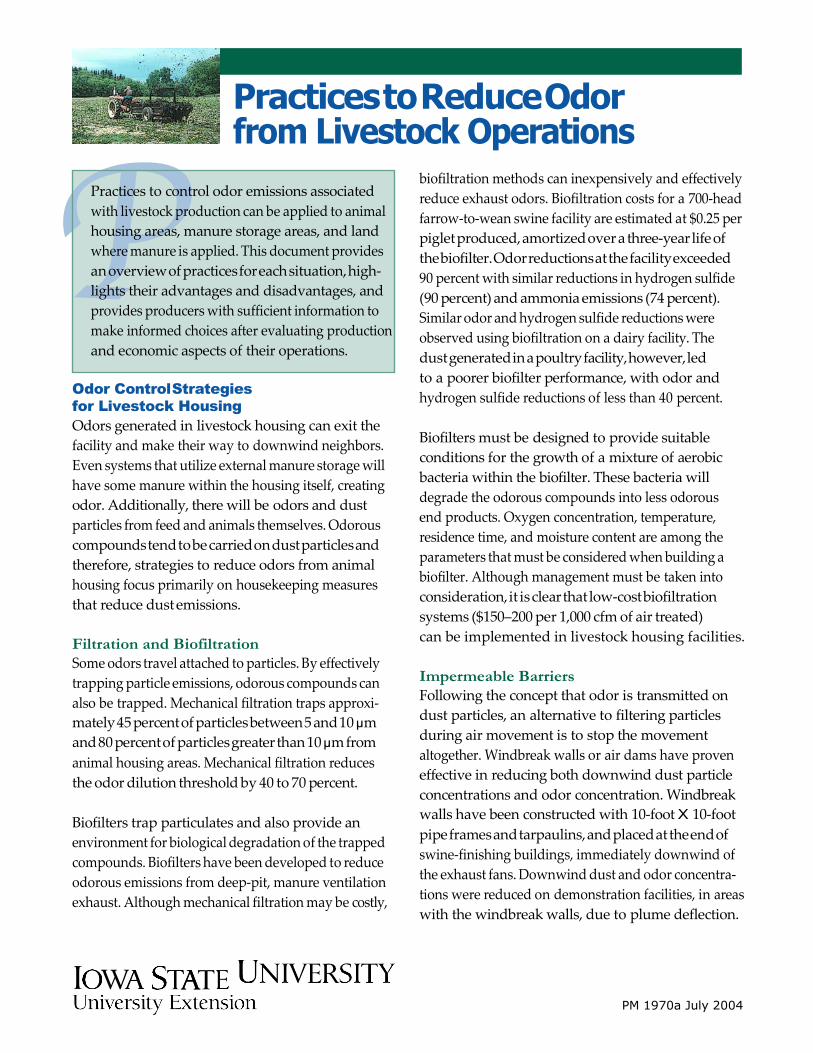
Practices to control odor emissions associated
with livestock production can be applied to animal
housing areas, manure storage areas, and land
where manure is applied. This document provides
an overview of practices for each situation, high-
lights their advantages and disadvantages, and
provides producers with sufficient information to
make informed choices after evaluating production
and economic aspects of their operations.
Dietary manipulation can reduce
manure odors prior to excretion . . .
Depending on the materials used for the barriers
(tarpaulins on a frame or solid wood, for example)
barrier life can be from a few years to decades
before replacement is needed.
Oil Sprinkling
Coating surfaces to control dust has involved the
use of vegetable oil, either sprayed or sprinkled in
animal pens. A Minnesota study reported a 40 to
70 percent reduction in odor, following a detailed
protocol for oil application. Hydrogen sulfide
concentrations were reduced 40 to 60 percent in
the oil-sprinkled rooms. No effect on ammonia
concentration was observed. The practice involves
safety issues such as the slippery conditions of
pens and alleys following repeated oil applications.
Costs are minimal for the vegetable oil, and other
costs involve a sprayer and the labor needed for
the daily oil application.
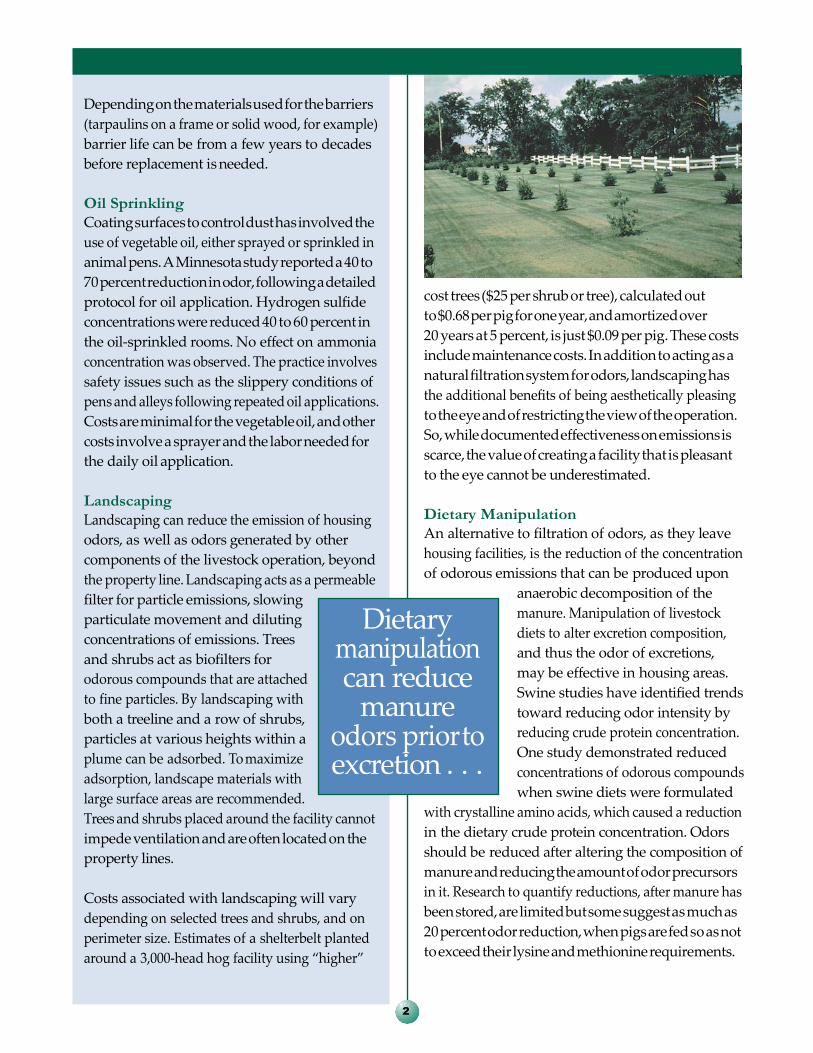
Landscaping
Landscaping can reduce the emission of housing
odors, as well as odors generated by other
components of the livestock operation, beyond
the property line. Landscaping acts as a permeable
filter for particle emissions, slowing
particulate movement and diluting
concentrations of emissions. Trees
and shrubs act as biofilters for
odorous compounds that are attached
to fine particles. By landscaping with
both a treeline and a row of shrubs,
particles at various heights within a
plume can be adsorbed. To maximize
adsorption, landscape materials with
large surface areas are recommended.
Trees and shrubs placed around the facility cannot
impede ventilation and are often located on the
property lines.
Costs associated with landscaping will vary
depending on selected trees and shrubs, and on
perimeter size. Estimates of a shelterbelt planted
around a 3,000-head hog facility using “higher”
cost trees ($25 per shrub or tree), calculated out
to $0.68 per pig for one year, and amortized over
20 years at 5 percent, is just $0.09 per pig. These costs
include maintenance costs. In addition to acting as a
natural filtration system for odors, landscaping has
the additional benefits of being aesthetically pleasing
to the eye and of restricting the view of the operation.
So, while documented effectiveness on emissions is
scarce, the value of creating a facility that is pleasant
to the eye cannot be underestimated.
Dietary Manipulation
An alternative to filtration of odors, as they leave
housing facilities, is the reduction of the concentration
of odorous emissions that can be produced upon
anaerobic decomposition of the
manure. Manipulation of livestock
diets to alter excretion composition,
and thus the odor of excretions,
may be effective in housing areas.
Swine studies have identified trends
toward reducing odor intensity by
reducing crude protein concentration.
One study demonstrated reduced
concentrations of odorous compounds
when swine diets were formulated
with crystalline amino acids, which caused a reduction
in the dietary crude protein concentration. Odors
should be reduced after altering the composition of
manure and reducing the amount of odor precursors
in it. Research to quantify reductions, after manure has
been stored, are limited but some suggest as much as
20 percent odor reduction, when pigs are fed so as not
to exceed their lysine and methionine requirements.
2
Reduced odor emissions . . . are the result of improved
decomposition.
Odor Control Strategies
for Manure Storage Facilities
Malodor (an odor that is undesirable) is the result
of incomplete anaerobic decomposition of stored
manure. During the decomposition process,
malodorous intermediate compounds are
produced and can accumulate if the populations
of bacteria that degrade these compounds are
insufficient. These accumulations result in odor
nuisance. Following is a summary of practices
that can be used to reduce odors from manure
storage facilities.
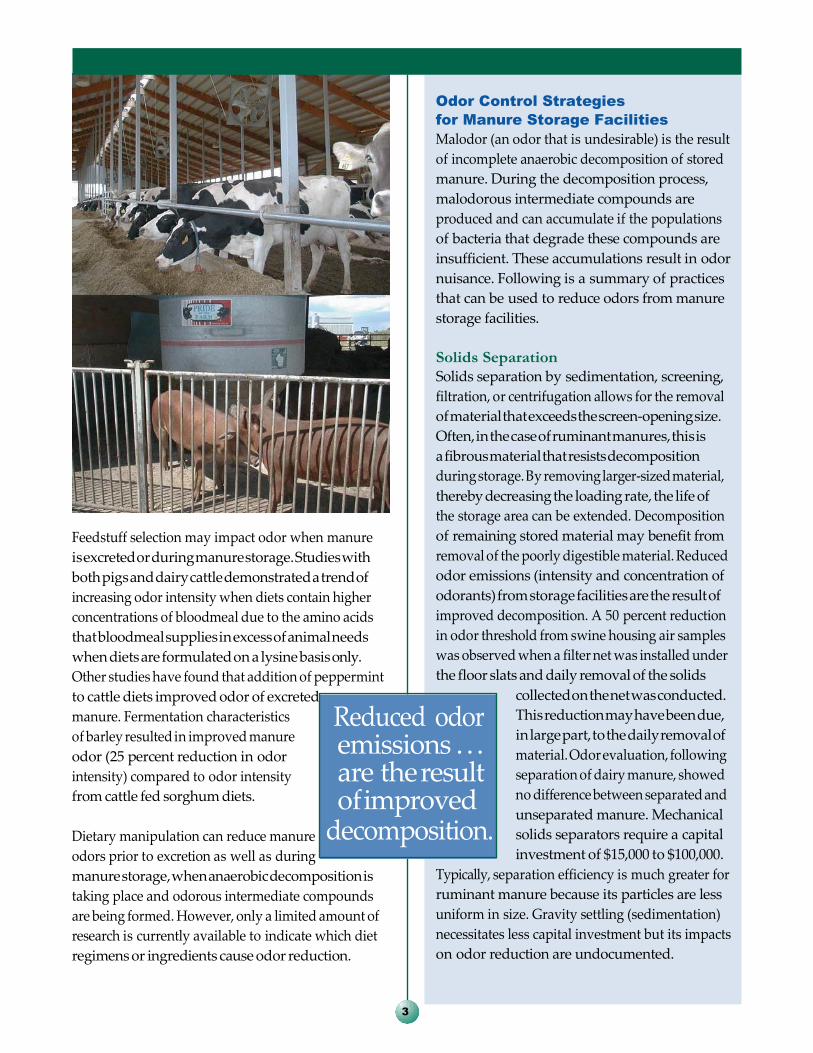
Feedstuff selection may impact odor when manure
is excreted or during manure storage. Studies with
both pigs and dairy cattle demonstrated a trend of
increasing odor intensity when diets contain higher
concentrations of bloodmeal due to the amino acids
that bloodmeal supplies in excess of animal needs
when diets are formulated on a lysine basis only.
Other studies have found that addition of peppermint
to cattle diets improved odor of excreted
manure. Fermentation characteristics
of barley resulted in improved manure
odor (25 percent reduction in odor
intensity) compared to odor intensity
from cattle fed sorghum diets.
Dietary manipulation can reduce manure
odors prior to excretion as well as during
manure storage, when anaerobic decomposition is
taking place and odorous intermediate compounds
are being formed. However, only a limited amount of
research is currently available to indicate which diet
regimens or ingredients cause odor reduction.
Solids Separation
Solids separation by sedimentation, screening,
filtration, or centrifugation allows for the removal
of material that exceeds the screen-opening size.
Often, in the case of ruminant manures, this is
a fibrous material that resists decomposition
during storage. By removing larger-sized material,
thereby decreasing the loading rate, the life of
the storage area can be extended. Decomposition
of remaining stored material may benefit from
removal of the poorly digestible material. Reduced
odor emissions (intensity and concentration of
odorants) from storage facilities are the result of
improved decomposition. A 50 percent reduction
in odor threshold from swine housing air samples
was observed when a filter net was installed under
the floor slats and daily removal of the solids
collected on the net was conducted.
This reduction may have been due,
in large part, to the daily removal of
material. Odor evaluation, following
separation of dairy manure, showed
no difference between separated and
unseparated manure. Mechanical
solids separators require a capital
investment of $15,000 to $100,000.
Typically, separation efficiency is much greater for
ruminant manure because its particles are less
uniform in size. Gravity settling (sedimentation)
necessitates less capital investment but its impacts
on odor reduction are undocumented.
3
The use of anaerobic digestion has proven very effective in reducing manure
odors . . .
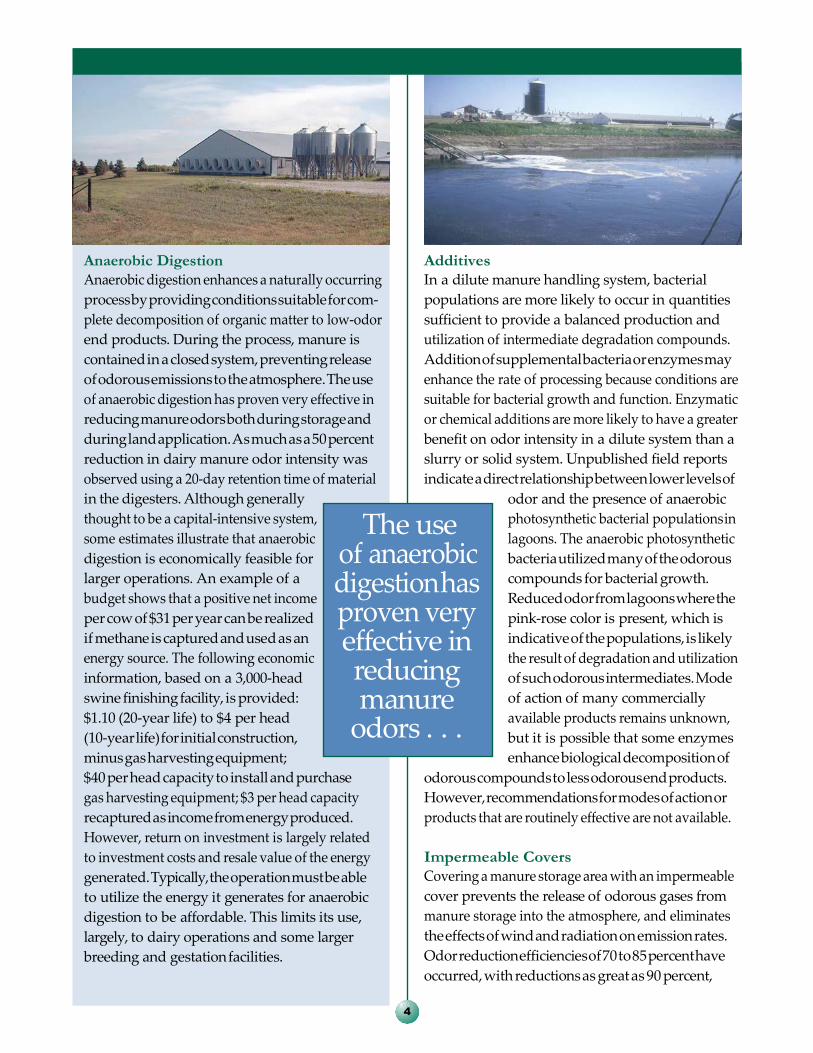
Anaerobic Digestion
Anaerobic digestion enhances a naturally occurring
process by providing conditions suitable for com-
plete decomposition of organic matter to low-odor
end products. During the process, manure is
contained in a closed system, preventing release
of odorous emissions to the atmosphere. The use
of anaerobic digestion has proven very effective in
reducing manure odors both during storage and
during land application. As much as a 50 percent
reduction in dairy manure odor intensity was
observed using a 20-day retention time of material
in the digesters. Although generally
thought to be a capital-intensive system,
some estimates illustrate that anaerobic
digestion is economically feasible for
larger operations. An example of a
budget shows that a positive net income
per cow of $31 per year can be realized
if methane is captured and used as an
energy source. The following economic
information, based on a 3,000-head
swine finishing facility, is provided:
$1.10 (20-year life) to $4 per head
(10-year life) for initial construction,
minus gas harvesting equipment;
$40 per head capacity to install and purchase
gas harvesting equipment; $3 per head capacity
recaptured as income from energy produced.
However, return on investment is largely related
to investment costs and resale value of the energy
generated. Typically, the operation must be able
to utilize the energy it generates for anaerobic
digestion to be affordable. This limits its use,
largely, to dairy operations and some larger
breeding and gestation facilities.
Additives
In a dilute manure handling system, bacterial
populations are more likely to occur in quantities
sufficient to provide a balanced production and
utilization of intermediate degradation compounds.
Addition of supplemental bacteria or enzymes may
enhance the rate of processing because conditions are
suitable for bacterial growth and function. Enzymatic
or chemical additions are more likely to have a greater
benefit on odor intensity in a dilute system than a
slurry or solid system. Unpublished field reports
indicate a direct relationship between lower levels of
odor and the presence of anaerobic
photosynthetic bacterial populations in
lagoons. The anaerobic photosynthetic
bacteria utilized many of the odorous
compounds for bacterial growth.
Reduced odor from lagoons where the
pink-rose color is present, which is
indicative of the populations, is likely
the result of degradation and utilization
of such odorous intermediates. Mode
of action of many commercially
available products remains unknown,
but it is possible that some enzymes
enhance biological decomposition of
odorous compounds to less odorous end products.
However, recommendations for modes of action or
products that are routinely effective are not available.
Impermeable Covers
Covering a manure storage area with an impermeable
cover prevents the release of odorous gases from
manure storage into the atmosphere, and eliminates
the effects of wind and radiation on emission rates.
Odor reduction efficiencies of 70 to 85 percent have
occurred, with reductions as great as 90 percent,
4
when surfaces are completely covered by impermeable
covers. Polyethylene covers typically range in price
from $1.00 to $1.40 per square foot, installed. Wind
and snow-load damage present the greatest challenges
with respect to implementation of the extended use
of impermeable covers. Damage due to weather alters
the life of the cover, impacting the capital investment
required over time. Many manufacturers list a useful
life of 10 years if the storage area is constructed to
prevent snow accumulation on the cover, but no
guarantee against wind damage is provided.
Permeable Covers
Permeable covers, or biocovers, act as biofilters on
the top of manure storage areas. Materials often used
as covers include straws, cornstalks, peat moss, foam,
geotextile fabric, and Leka rock. Permeable biocovers
reduce odor, in part, by reducing both the radiation
onto the manure storage surface and the wind velocity
over the surface of the storage area. Covers act as a
barrier to these forces. At the solution/air interface,
humidity is relatively high, which creates a stabilized
boundary that slows the emission rate of odorous
volatiles. The aerobic zone within the biocover allows
the growth of aerobic microorganisms that utilize
carbon, nitrogen, and sulfur for growth. By further
degrading and making use of these compounds prior
to exiting the biocover, odors emitted above the
biocover are altered and reduced. Reports of odor
reductions of 40 to 50 percent are common when
various straw materials are used. An 85 percent odor
reduction efficiency was noted following the use of a
floating mat or corrugated materials.
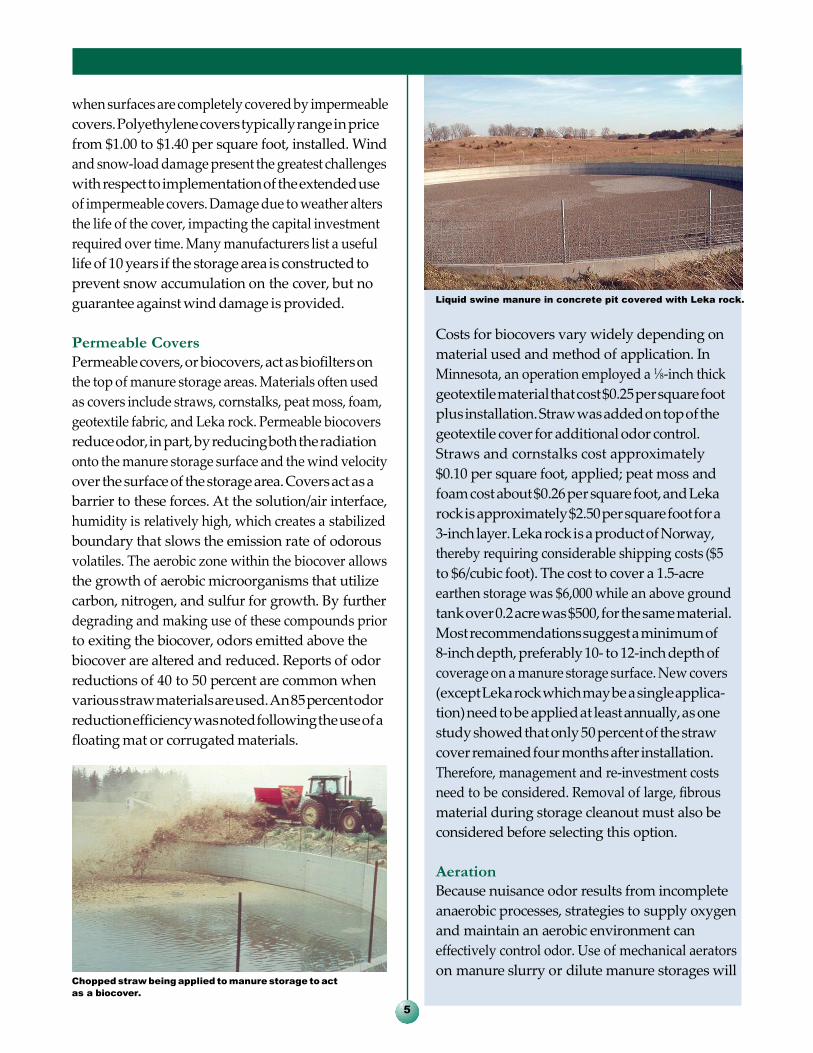
Chopped straw being applied to manure storage to act
as a biocover.
5
Liquid swine manure in concrete pit covered with Leka rock.
Costs for biocovers vary widely depending on
material used and method of application. In
Minnesota, an operation employed a 1⁄8-inch thick
geotextile material that cost $0.25 per square foot
plus installation. Straw was added on top of the
geotextile cover for additional odor control.
Straws and cornstalks cost approximately
$0.10 per square foot, applied; peat moss and
foam cost about $0.26 per square foot, and Leka
rock is approximately $2.50 per square foot for a
3-inch layer. Leka rock is a product of Norway,
thereby requiring considerable shipping costs ($5
to $6/cubic foot). The cost to cover a 1.5-acre
earthen storage was $6,000 while an above ground
tank over 0.2 acre was $500, for the same material.
Most recommendations suggest a minimum of
8-inch depth, preferably 10- to 12-inch depth of
coverage on a manure storage surface. New covers
(except Leka rock which may be a single applica-
tion) need to be applied at least annually, as one
study showed that only 50 percent of the straw
cover remained four months after installation.
Therefore, management and re-investment costs
need to be considered. Removal of large, fibrous
material during storage cleanout must also be
considered before selecting this option.
Aeration
Because nuisance odor results from incomplete
anaerobic processes, strategies to supply oxygen
and maintain an aerobic environment can
effectively control odor. Use of mechanical aerators
on manure slurry or dilute manure storages will
Composting is a better
option for . . . solid manure
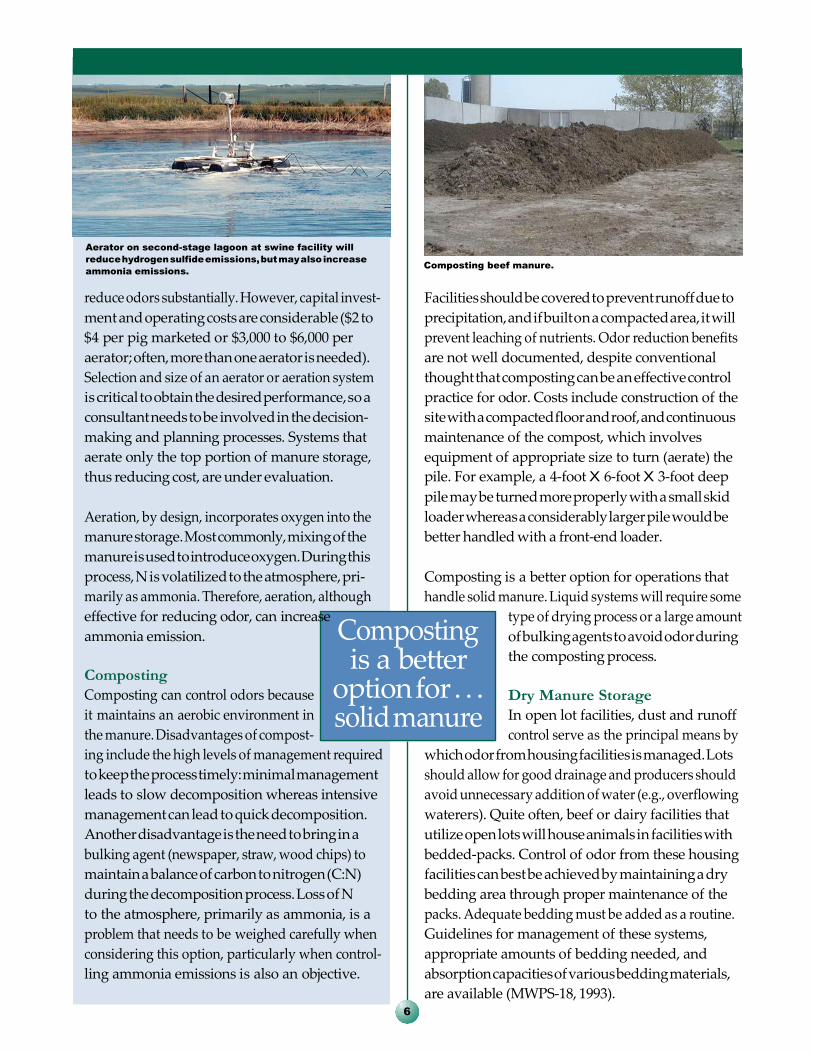
Aerator on second-stage lagoon at swine facility will
reduce hydrogen sulfide emissions, but may also increase
ammonia emissions.
reduce odors substantially. However, capital invest-
ment and operating costs are considerable ($2 to
$4 per pig marketed or $3,000 to $6,000 per
aerator; often, more than one aerator is needed).
Selection and size of an aerator or aeration system
is critical to obtain the desired performance, so a
consultant needs to be involved in the decision-
making and planning processes. Systems that
aerate only the top portion of manure storage,
thus reducing cost, are under evaluation.
Aeration, by design, incorporates oxygen into the
manure storage. Most commonly, mixing of the
manure is used to introduce oxygen. During this
process, N is volatilized to the atmosphere, pri-
marily as ammonia. Therefore, aeration, although
effective for reducing odor, can increase
ammonia emission.
Composting
Composting can control odors because
it maintains an aerobic environment in
the manure. Disadvantages of compost-
ing include the high levels of management required
to keep the process timely: minimal management
leads to slow decomposition whereas intensive
management can lead to quick decomposition.
Another disadvantage is the need to bring in a
bulking agent (newspaper, straw, wood chips) to
maintain a balance of carbon to nitrogen (C:N)
during the decomposition process. Loss of N
to the atmosphere, primarily as ammonia, is a
problem that needs to be weighed carefully when
considering this option, particularly when control-
ling ammonia emissions is also an objective.
Composting beef manure.
Facilities should be covered to prevent runoff due to
precipitation, and if built on a compacted area, it will
prevent leaching of nutrients. Odor reduction benefits
are not well documented, despite conventional
thought that composting can be an effective control
practice for odor. Costs include construction of the
site with a compacted floor and roof, and continuous
maintenance of the compost, which involves
equipment of appropriate size to turn (aerate) the
pile. For example, a 4-foot X 6-foot X 3-foot deep
pile may be turned more properly with a small skid
loader whereas a considerably larger pile would be
better handled with a front-end loader.
Composting is a better option for operations that
handle solid manure. Liquid systems will require some
type of drying process or a large amount
of bulking agents to avoid odor during
the composting process.
Dry Manure Storage
In open lot facilities, dust and runoff
control serve as the principal means by
which odor from housing facilities is managed. Lots
should allow for good drainage and producers should
avoid unnecessary addition of water (e.g., overflowing
waterers). Quite often, beef or dairy facilities that
utilize open lots will house animals in facilities with
bedded-packs. Control of odor from these housing
facilities can best be achieved by maintaining a dry
bedding area through proper maintenance of the
packs. Adequate bedding must be added as a routine.
Guidelines for management of these systems,
appropriate amounts of bedding needed, and
absorption capacities of various bedding materials,
are available (MWPS-18, 1993). 6
7
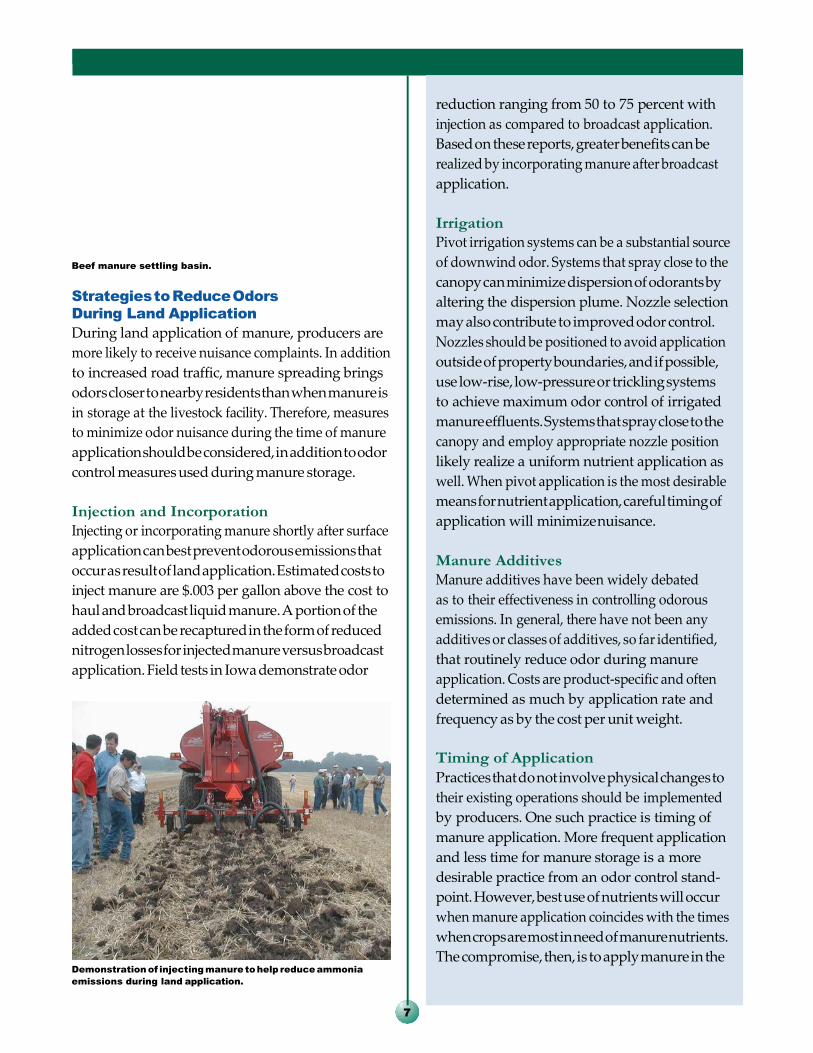
Beef manure settling basin.
Strategies to Reduce Odors
During Land Application
During land application of manure, producers are
more likely to receive nuisance complaints. In addition
to increased road traffic, manure spreading brings
odors closer to nearby residents than when manure is
in storage at the livestock facility. Therefore, measures
to minimize odor nuisance during the time of manure
application should be considered, in addition to odor
control measures used during manure storage.
Injection and Incorporation
Injecting or incorporating manure shortly after surface
application can best prevent odorous emissions that
occur as result of land application. Estimated costs to
inject manure are $.003 per gallon above the cost to
haul and broadcast liquid manure. A portion of the
added cost can be recaptured in the form of reduced
nitrogen losses for injected manure versus broadcast
application. Field tests in Iowa demonstrate odor
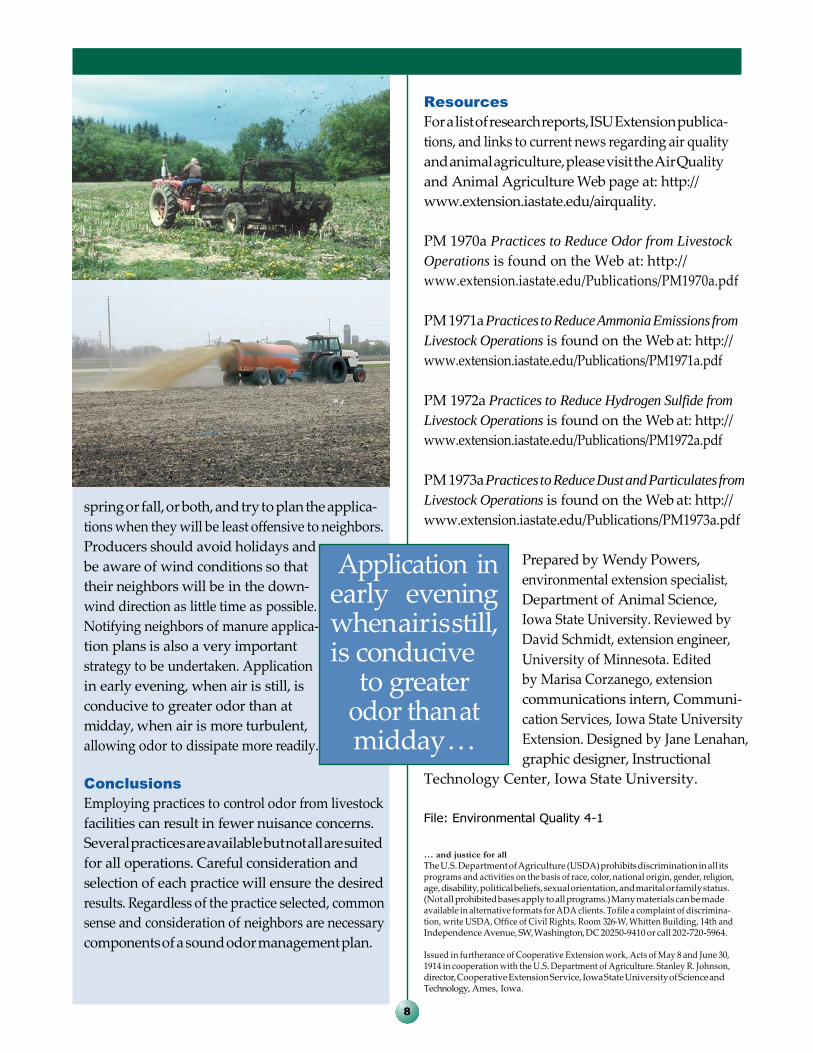
Demonstration of injecting manure to help reduce ammonia
emissions during land application.
reduction ranging from 50 to 75 percent with
injection as compared to broadcast application.
Based on these reports, greater benefits can be
realized by incorporating manure after broadcast
application.
Irrigation
of downwind odor. Systems that spray close to the
canopy can minimize dispersion of odorants by
altering the dispersion plume. Nozzle selection
may also contribute to improved odor control.
Nozzles should be positioned to avoid application
outside of property boundaries, and if possible,
use low-rise, low-pressure or trickling systems
to achieve maximum odor control of irrigated
manure effluents. Systems that spray close to the
canopy and employ appropriate nozzle position
likely realize a uniform nutrient application as
well. When pivot application is the most desirable
means for nutrient application, careful timing of
application will minimize nuisance.
Pivot irrigation systems can be a substantial source
Manure Additives
Manure additives have been widely debated
as to their effectiveness in controlling odorous
emissions. In general, there have not been any
additives or classes of additives, so far identified,
that routinely reduce odor during manure
application. Costs are product-specific and often
determined as much by application rate and
frequency as by the cost per unit weight.
Timing of Application
Practices that do not involve physical changes to
their existing operations should be implemented
by producers. One such practice is timing of
manure application. More frequent application
and less time for manure storage is a more
desirable practice from an odor control stand-
point. However, best use of nutrients will occur
when manure application coincides with the times
when crops are most in need of manure nutrients.
The compromise, then, is to apply manure in the
Resources
For a list of research reports, ISU Extension publica-
tions, and links to current news regarding air quality
and animal agriculture, please visit the Air Quality
and Animal Agriculture Web page at: http://
www.extension.iastate.edu/airquality.
PM 1970a Practices to Reduce Odor from Livestock
Operations is found on the Web at: http://
www.extension.iastate.edu/Publications/PM1970a.pdf
PM 1971a Practices to Reduce Ammonia Emissions from
Livestock Operations is found on the Web at: http://
www.extension.iastate.edu/Publications/PM1971a.pdf
PM 1972a Practices to Reduce Hydrogen Sulfide from
Livestock Operations is found on the Web at: http://
www.extension.iastate.edu/Publications/PM1972a.pdf
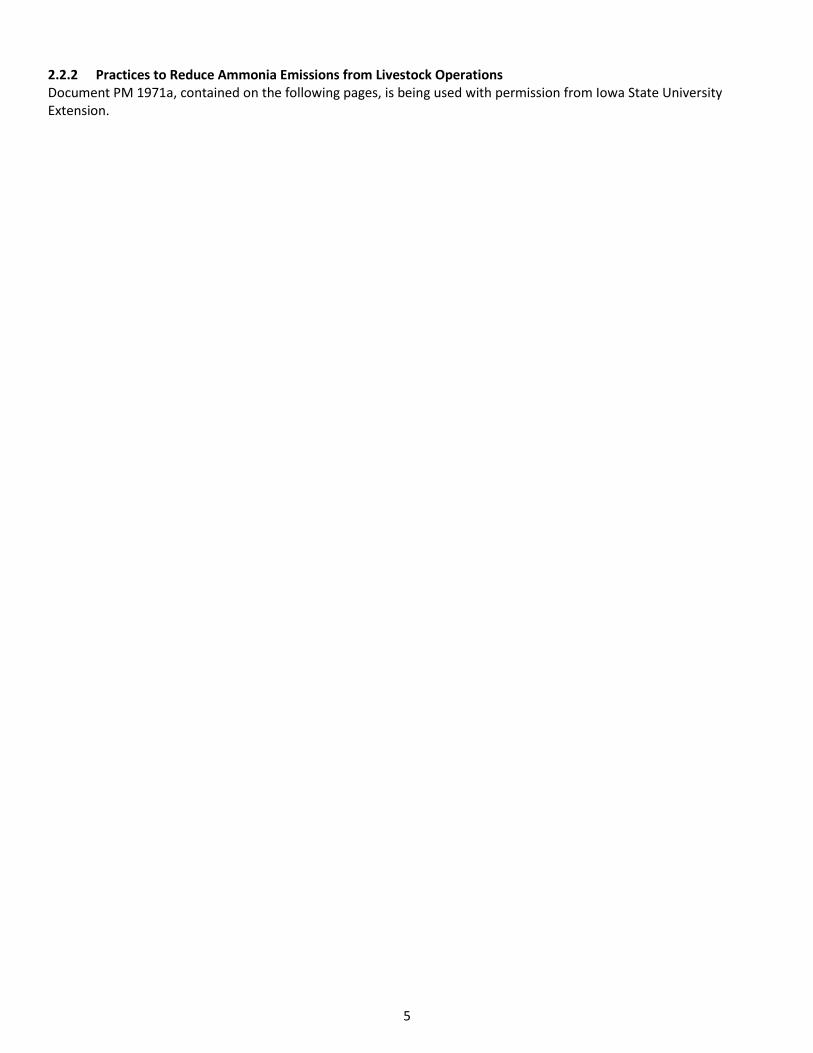
spring or fall, or both, and try to plan the applica-
tions when they will be least offensive to neighbors.
Producers should avoid holidays and
be aware of wind conditions so that
their neighbors will be in the down-
wind direction as little time as possible.
Notifying neighbors of manure applica-
tion plans is also a very important
strategy to be undertaken. Application
in early evening, when air is still, is
conducive to greater odor than at
midday, when air is more turbulent,
allowing odor to dissipate more readily.
Conclusions
Employing practices to control odor from livestock
facilities can result in fewer nuisance concerns.
Several practices are available but not all are suited
for all operations. Careful consideration and
selection of each practice will ensure the desired
results. Regardless of the practice selected, common
sense and consideration of neighbors are necessary
components of a sound odor management plan.
PM 1973a Practices to Reduce Dust and Particulates from
Livestock Operations is found on the Web at: http://
www.extension.iastate.edu/Publications/PM1973a.pdf
Prepared by Wendy Powers,
environmental extension specialist,
Department of Animal Science,
Iowa State University. Reviewed by
David Schmidt, extension engineer,
University of Minnesota. Edited
by Marisa Corzanego, extension
communications intern, Communi-
cation Services, Iowa State University
Extension. Designed by Jane Lenahan,
graphic designer, Instructional
Technology Center, Iowa State University.
File: Environmental Quality 4-1
… and justice for all
The U.S. Department of Agriculture (USDA) prohibits discrimination in all its programs and activities on the basis of race, color, national origin, gender, religion, age, disability, political beliefs, sexual orientation, and marital or family status. (Not all prohibited bases apply to all programs.) Many materials can be made available in alternative formats for ADA clients. To file a complaint of discrimina- tion, write USDA, Office of Civil Rights, Room 326-W, Whitten Building, 14th and Independence Avenue, SW, Washington, DC 20250-9410 or call 202-720-5964.
Issued in furtherance of Cooperative Extension work, Acts of May 8 and June 30, 1914 in cooperation with the U.S. Department of Agriculture. Stanley R. Johnson, director, Cooperative Extension Service, Iowa State University of Science and Technology, Ames, Iowa.
8
Application in early evening when air is still, is conducive
to greater odor than at midday . . .
5
2.2.2 Practices to Reduce Ammonia Emissions from Livestock Operations Document PM 1971a, contained on the following pages, is being used with permission from Iowa State University Extension.
1
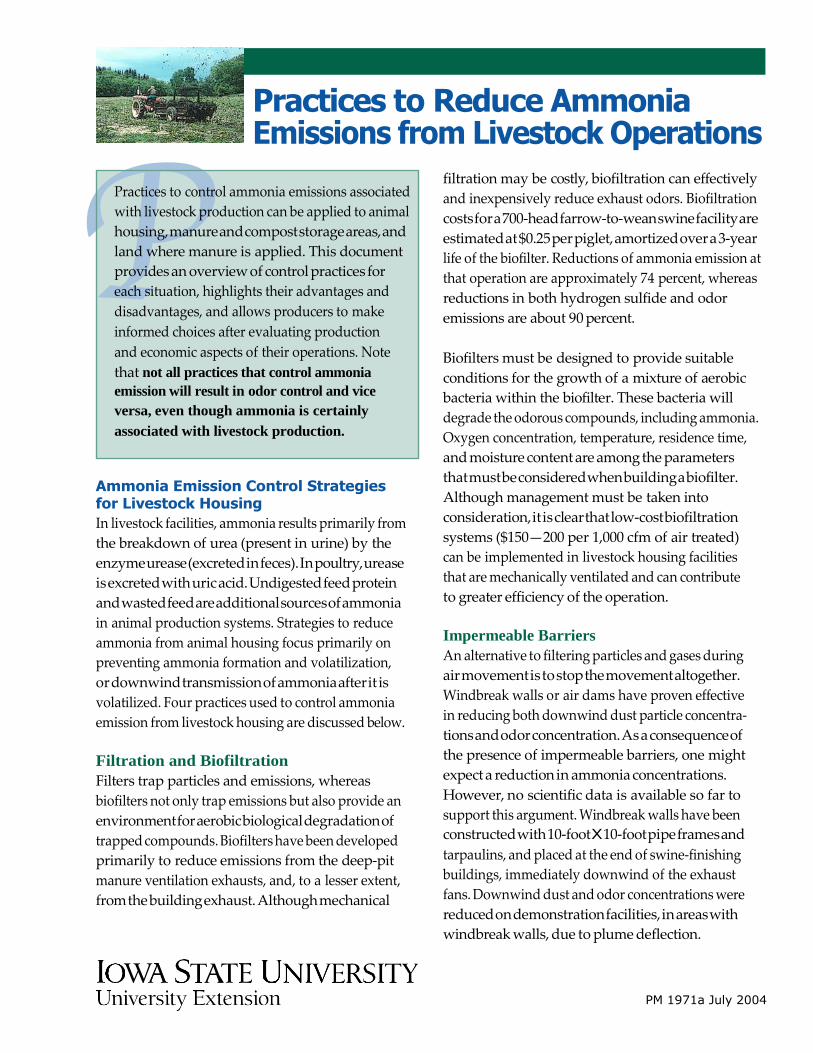
Practices to Reduce Ammonia Emissions from Livestock Operations
Ammonia Emission Control Strategies for Livestock Housing
In livestock facilities, ammonia results primarily from
the breakdown of urea (present in urine) by the
enzyme urease (excreted in feces). In poultry, urease
is excreted with uric acid. Undigested feed protein
and wasted feed are additional sources of ammonia
in animal production systems. Strategies to reduce
ammonia from animal housing focus primarily on
preventing ammonia formation and volatilization,
or downwind transmission of ammonia after it is
volatilized. Four practices used to control ammonia
emission from livestock housing are discussed below.
Filtration and Biofiltration
Filters trap particles and emissions, whereas
biofilters not only trap emissions but also provide an
environment for aerobic biological degradation of
trapped compounds. Biofilters have been developed
primarily to reduce emissions from the deep-pit
manure ventilation exhausts, and, to a lesser extent,
from the building exhaust. Although mechanical
filtration may be costly, biofiltration can effectively
and inexpensively reduce exhaust odors. Biofiltration
costs for a 700-head farrow-to-wean swine facility are
estimated at $0.25 per piglet, amortized over a 3-year
life of the biofilter. Reductions of ammonia emission at
that operation are approximately 74 percent, whereas
reductions in both hydrogen sulfide and odor
emissions are about 90 percent.
Biofilters must be designed to provide suitable
conditions for the growth of a mixture of aerobic
bacteria within the biofilter. These bacteria will
degrade the odorous compounds, including ammonia.
Oxygen concentration, temperature, residence time,
and moisture content are among the parameters
that must be considered when building a biofilter.
Although management must be taken into
consideration, it is clear that low-cost biofiltration
systems ($150—200 per 1,000 cfm of air treated)
can be implemented in livestock housing facilities
that are mechanically ventilated and can contribute
to greater efficiency of the operation.
Impermeable Barriers
An alternative to filtering particles and gases during
air movement is to stop the movement altogether.
Windbreak walls or air dams have proven effective
in reducing both downwind dust particle concentra-
tions and odor concentration. As a consequence of
the presence of impermeable barriers, one might
expect a reduction in ammonia concentrations.
However, no scientific data is available so far to
support this argument. Windbreak walls have been
constructed with 10-foot X 10-foot pipe frames and
tarpaulins, and placed at the end of swine-finishing
buildings, immediately downwind of the exhaust
fans. Downwind dust and odor concentrations were
reduced on demonstration facilities, in areas with
windbreak walls, due to plume deflection.
PM 1971a July 2004
Practices to control ammonia emissions associated
with livestock production can be applied to animal
housing, manure and compost storage areas, and
land where manure is applied. This document
provides an overview of control practices for
each situation, highlights their advantages and
disadvantages, and allows producers to make
informed choices after evaluating production
and economic aspects of their operations. Note
that not all practices that control ammonia
emission will result in odor control and vice
versa, even though ammonia is certainly
associated with livestock production.
The kind of materials used for the barriers
(tarpaulins on a frame or solid wood, for example)
will determine the life of barriers, which can be
from a few years to decades before replacement
is needed.
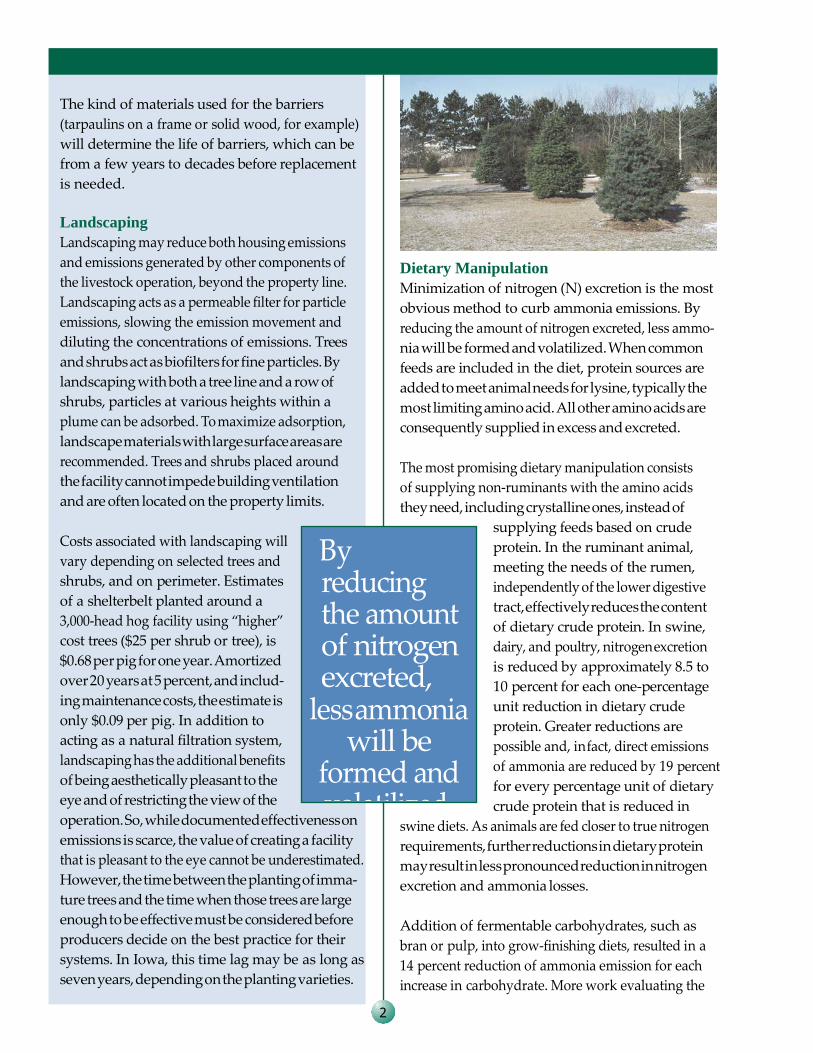
Landscaping
Landscaping may reduce both housing emissions
and emissions generated by other components of
the livestock operation, beyond the property line.
Landscaping acts as a permeable filter for particle
emissions, slowing the emission movement and
diluting the concentrations of emissions. Trees
and shrubs act as biofilters for fine particles. By
landscaping with both a tree line and a row of
shrubs, particles at various heights within a
plume can be adsorbed. To maximize adsorption,
landscape materials with large surface areas are
recommended. Trees and shrubs placed around
the facility cannot impede building ventilation
and are often located on the property limits.
Costs associated with landscaping will
vary depending on selected trees and
shrubs, and on perimeter. Estimates
of a shelterbelt planted around a
3,000-head hog facility using “higher”
cost trees ($25 per shrub or tree), is
$0.68 per pig for one year. Amortized
over 20 years at 5 percent, and includ-
ing maintenance costs, the estimate is
only $0.09 per pig. In addition to
acting as a natural filtration system,
landscaping has the additional benefits
of being aesthetically pleasant to the
eye and of restricting the view of the
operation. So, while documented effectiveness on
emissions is scarce, the value of creating a facility
that is pleasant to the eye cannot be underestimated.
However, the time between the planting of imma-
ture trees and the time when those trees are large
enough to be effective must be considered before
producers decide on the best practice for their
systems. In Iowa, this time lag may be as long as
seven years, depending on the planting varieties.
Dietary Manipulation
Minimization of nitrogen (N) excretion is the most
obvious method to curb ammonia emissions. By
reducing the amount of nitrogen excreted, less ammo-
nia will be formed and volatilized. When common
feeds are included in the diet, protein sources are
added to meet animal needs for lysine, typically the
most limiting amino acid. All other amino acids are
consequently supplied in excess and excreted.
The most promising dietary manipulation consists
of supplying non-ruminants with the amino acids
they need, including crystalline ones, instead of
supplying feeds based on crude
protein. In the ruminant animal,
meeting the needs of the rumen,
independently of the lower digestive
tract, effectively reduces the content
of dietary crude protein. In swine,
dairy, and poultry, nitrogen excretion
is reduced by approximately 8.5 to
10 percent for each one-percentage
unit reduction in dietary crude
protein. Greater reductions are
possible and, in fact, direct emissions
of ammonia are reduced by 19 percent
for every percentage unit of dietary
crude protein that is reduced in
swine diets. As animals are fed closer to true nitrogen
requirements, further reductions in dietary protein
may result in less pronounced reduction in nitrogen
excretion and ammonia losses.
Addition of fermentable carbohydrates, such as
bran or pulp, into grow-finishing diets, resulted in a
14 percent reduction of ammonia emission for each
increase in carbohydrate. More work evaluating the
2
By reducing the amount of nitrogen excreted,
less ammonia will be
formed and volatilized.
. . . particulates are of concern
for human health.
balance of carbohydrate and protein in diets is needed.
The reduction may be due to a pH effect, to the shift
from urinary to fecal nitrogen excretion, or both.
Additives that bind ammonia have shown reductions
in ammonia emission (26 percent over a period of
seven weeks in swine fed a yucca extract).
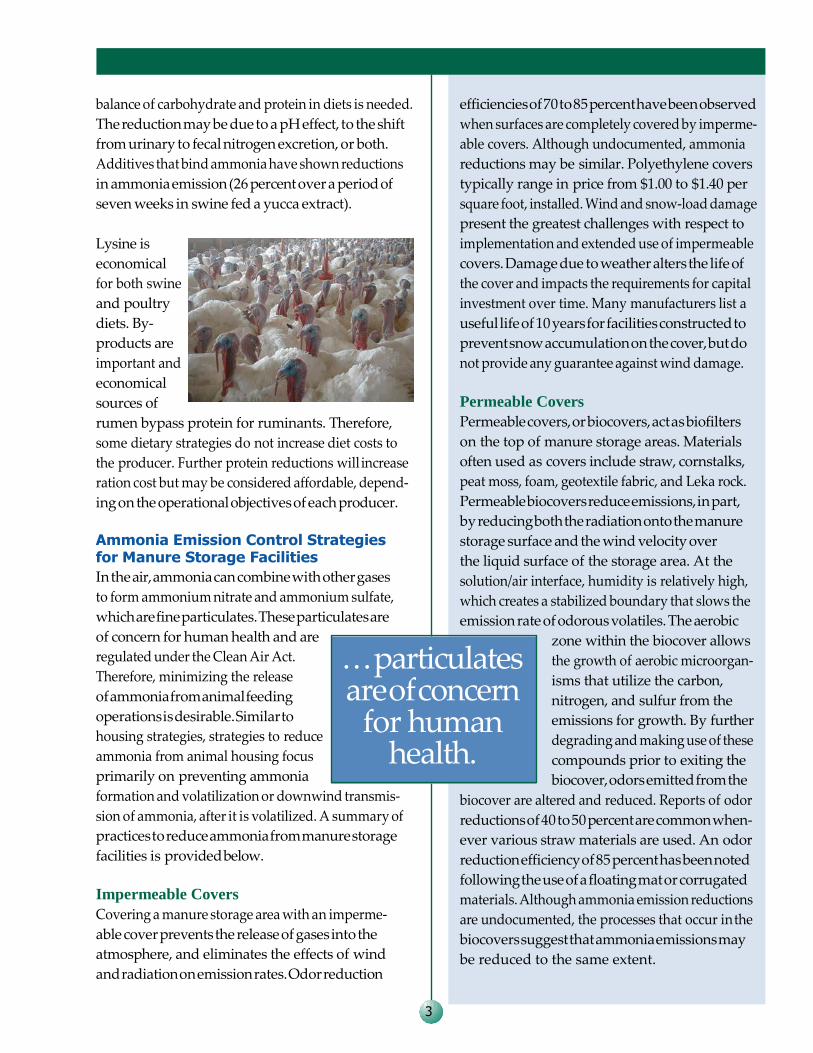
Lysine is
economical
for both swine
and poultry
diets. By-
products are
important and
economical
sources of
rumen bypass protein for ruminants. Therefore,
some dietary strategies do not increase diet costs to
the producer. Further protein reductions will increase
ration cost but may be considered affordable, depend-
ing on the operational objectives of each producer.
Ammonia Emission Control Strategies for Manure Storage Facilities
In the air, ammonia can combine with other gases
to form ammonium nitrate and ammonium sulfate,
which are fine particulates. These particulates are
of concern for human health and are
regulated under the Clean Air Act.
Therefore, minimizing the release
of ammonia from animal feeding
operations is desirable. Similar to
housing strategies, strategies to reduce
ammonia from animal housing focus
primarily on preventing ammonia
formation and volatilization or downwind transmis-
sion of ammonia, after it is volatilized. A summary of
practices to reduce ammonia from manure storage
facilities is provided below.
Impermeable Covers
Covering a manure storage area with an imperme-
able cover prevents the release of gases into the
atmosphere, and eliminates the effects of wind
and radiation on emission rates. Odor reduction
efficiencies of 70 to 85 percent have been observed
when surfaces are completely covered by imperme-
able covers. Although undocumented, ammonia
reductions may be similar. Polyethylene covers
typically range in price from $1.00 to $1.40 per
square foot, installed. Wind and snow-load damage
present the greatest challenges with respect to
implementation and extended use of impermeable
covers. Damage due to weather alters the life of
the cover and impacts the requirements for capital
investment over time. Many manufacturers list a
useful life of 10 years for facilities constructed to
prevent snow accumulation on the cover, but do
not provide any guarantee against wind damage.
Permeable Covers
Permeable covers, or biocovers, act as biofilters
on the top of manure storage areas. Materials
often used as covers include straw, cornstalks,
peat moss, foam, geotextile fabric, and Leka rock.
Permeable biocovers reduce emissions, in part,
by reducing both the radiation onto the manure
storage surface and the wind velocity over
the liquid surface of the storage area. At the
solution/air interface, humidity is relatively high,
which creates a stabilized boundary that slows the
emission rate of odorous volatiles. The aerobic
zone within the biocover allows
the growth of aerobic microorgan-
isms that utilize the carbon,
nitrogen, and sulfur from the
emissions for growth. By further
degrading and making use of these
compounds prior to exiting the
biocover, odors emitted from the
biocover are altered and reduced. Reports of odor
reductions of 40 to 50 percent are common when-
ever various straw materials are used. An odor
reduction efficiency of 85 percent has been noted
following the use of a floating mat or corrugated
materials. Although ammonia emission reductions
are undocumented, the processes that occur in the
biocovers suggest that ammonia emissions may
be reduced to the same extent.
3

Mineral and chemical
amendments have been
used to reduce ammonia emissions
from animal manures.
Liquid swine manure in concrete pit covered with Leka rock.
Costs for biocovers vary widely depending on
the material used and the method of application.
In Minnesota, an operation employed a 1⁄8-inch
thick geotextile material that cost $0.25 per square
foot, plus installation costs. Straw was added on
top of the geotextile cover for additional odor
control. Straws and cornstalks cost approximately
$0.10 per square foot, applied; peat moss and
foam cost about $0.26 per square foot, and Leka
rock is approximately $2.50 per square foot for a
3-inch depth. All costs depend on the depth of the
material used. Leka is a product of Norway, thereby
requiring considerable shipping costs of $5—$6 per
cubic foot. The cost to cover a 1.5-acre earthen
storage was $6,000 whereas an above ground tank
over 0.2 acre was $500, for the same material.
Most recommendations suggest a minimum of
8-inch and preferably 10- to 12-inch depth of
coverage on a manure storage surface.
New covers (except Leka rock) may
need to be applied at least annually, and
one study showed that only 50 percent
of the straw cover remained four
months after installation. Therefore,
management and re-investment costs
need to be considered. Removal of
large, fibrous material during storage
cleanout must also be considered
before selecting this option. One
disadvantage of both permeable and
impermeable covers is a probable
increase in ammonia emissions
and odors during land application.
Urine/feces Segregation
Because ammonia results from the interaction of urine
and feces in swine and ruminants, efforts to separate
them immediately upon excretion have reduced
ammonia emissions successfully. Manure handling
systems designed to prevent urease from coming in
contact with urea are under investigation. Most
systems employ a separator or a belt conveyor whereby
feces, containing urease, are captured on the belt and
urine is stored below. As much as 80 percent reduction
in ammonia emissions is expected from using this
system but the practice has not yet been commercially
implemented. However, several urine/feces segregation
systems are in the developmental phase at this time.
Acidification
Depending on the pH, N can exist in different forms.
Reducing the pH maintains more nitrogen in the
form of ammonium, which is not released as a gas.
Therefore, strategies that acidify manure (reducing
the pH) can be used to trap ammonium and prevent
its release as ammonia. Among these strategies are
dietary practices used to acidify urine by including
phosphoric acid. However, ammonia emissions are
more related to the buffering capacity, or alkalinity,
of the manure than to pH, suggesting that pH of
excretions may increase during storage, therefore
reducing the effectiveness of this strategy. A disadvan-
tage of acidification is that although it traps ammonia,
the reduced pH is conducive to volatilization of
hydrogen sulfide, another odorous
compound produced from the
anaerobic decomposition of manure.
Costs associated with this practice
include the acid and the equipment
to apply and mix the acid with the
stored manure.
Additives
Additives to control ammonia
emission predominantly function
by either binding ammonia or by
inhibiting urease, the enzyme that
breaks urea down to ammonia. Two
inhibitors, thiophosphoric triamide
4
and cyclohexylphosphoric triamide, restrained the
production of urease following application to cattle
feedlot pens (0.32 oz. per pound of manure).
Similarly, weekly additions of phenyl
phosphorodiamidate to cattle and
swine slurries prevented the urea
from being hydrolyzed up to 70 and
92 percent, respectively. Because
urease occurs widely in nature, the
inhibitor must be applied routinely
to prevent future emissions. Routine
application, however, may pose problems once the
manure is land-applied, unless plants can quickly use
the nitrogen. Urease inhibitors are not widely available
commercially, and the above-mentioned compounds
are chemical rather than products. However, one
product, manufactured by Agrotain, is distributed
throughout the United States.
Mineral and chemical amendments have been used
to reduce ammonia emissions from animal manures.
Phosphates and gypsum reduced ammonia losses
from dairy manure storage by 28 and 14 percent,
respectively. Triple superphosphate, superphosphate,
calcium chloride, and gypsum treatments reduced
ammonia losses by 33, 24, 13, and 8 percent,
respectively, when surface-applied to dairy manure.
All additives involve the cost of the products
themselves and the application equipment
associated with them. Continuous application is
likely needed in manure storage whereas a single
application of the additive may suffice during
manure application if manure is then incorporated.
Strategies that focus on source reduction, such as
diet manipulation, are applicable and may prove
to be the best control measure. Covering manure
can be effective as well. Similarly,
practices that involve binding
ammonia or altering the pH,
so that ammonia is less volatile,
can control its emission.
Calcium chloride and triple
superphosphate treatments
are effective in reducing losses
when surface applied to poultry manure (19 and
17 percent, respectively).
Strategies to Reduce Ammonia Emissions
During Land Application Estimates of
whole-farm ammonia emissions suggest that as
much as 35 percent of the total ammonia
emissions may occur during land application of
manure. Therefore, control strategies beyond those
implemented in housing and manure storage
areas should be considered, as reported below
for injection and manure amendments.
Dry Manure Storage
In open lot facilities and facilities that store dry
manure, ammonia control can be a greater challenge.
Ammonia loss during composting depends on the
carbon to nitrogen (C:N) ratio: ammonia volatilization
is significant below 15:1. Increased use of bedding
will help maintain a higher C:N ratio but also results
in a dryer product that will not compost as readily
without the addition of moisture. Application of a
layer of 38 percent zeolite, placed on the surface of
the composting poultry manure, reduced ammonia losses by 44 percent.
. . . dry manure, ammonia control can be a greater
challenge.
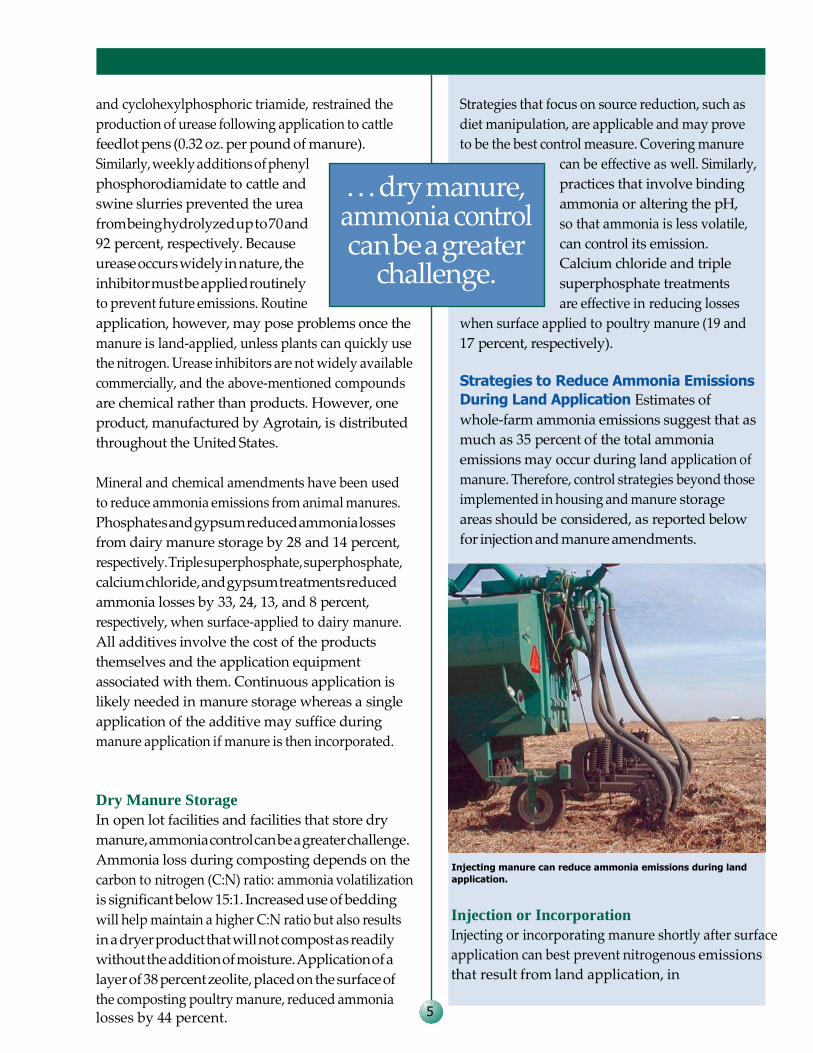
Injecting manure can reduce ammonia emissions during land
application.
Injection or Incorporation
Injecting or incorporating manure shortly after surface
application can best prevent nitrogenous emissions
that result from land application, in
5
addition to reducing odorous emissions. Costs
to inject manure are estimated to be $0.003 per
gallon above the cost to haul and spread liquid
manure. A portion of the added cost can be
recaptured, agronomically, in the form of reduced
nitrogen losses for injected manure versus broad-
cast application. The benefits of reduced nitrogen
losses through volatilization can also be realized
by incorporation, after broadcast application.
Resources
For a list of research reports, ISU Extension publica-
tions, and links to current news regarding air quality
and animal agriculture, please visit the Air Quality
and Animal Agriculture Web page at:
http://www.extension.iastate.edu/airquality.
PM 1970a Practices to Reduce Odor from Livestock
Operations is found on the Web at: http://
www.extension.iastate.edu/Publications/PM1970a.pdf
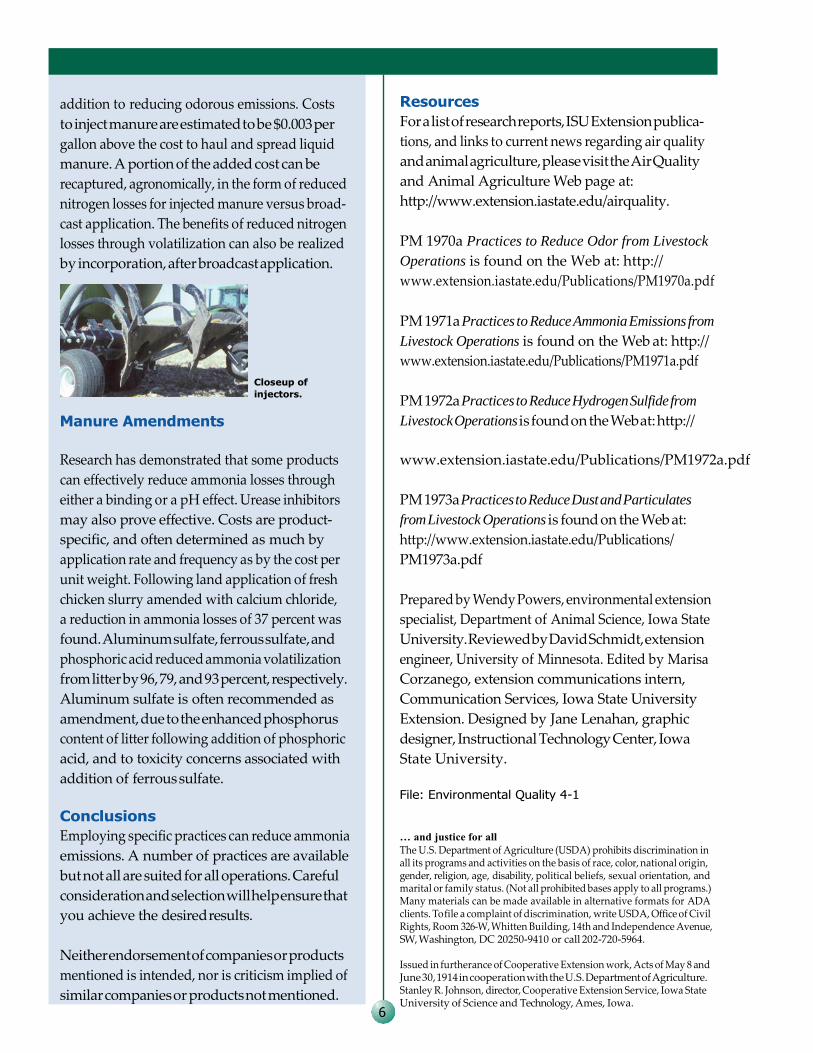
Manure Amendments
Closeup of
injectors.
PM 1971a Practices to Reduce Ammonia Emissions from
Livestock Operations is found on the Web at: http://
www.extension.iastate.edu/Publications/PM1971a.pdf
PM 1972a Practices to Reduce Hydrogen Sulfide from
Livestock Operations is found on the Web at: http://
Research has demonstrated that some products
can effectively reduce ammonia losses through
either a binding or a pH effect. Urease inhibitors
may also prove effective. Costs are product-
specific, and often determined as much by
application rate and frequency as by the cost per
unit weight. Following land application of fresh
chicken slurry amended with calcium chloride,
a reduction in ammonia losses of 37 percent was
found. Aluminum sulfate, ferrous sulfate, and
phosphoric acid reduced ammonia volatilization
from litter by 96, 79, and 93 percent, respectively.
Aluminum sulfate is often recommended as
amendment, due to the enhanced phosphorus
content of litter following addition of phosphoric
acid, and to toxicity concerns associated with
addition of ferrous sulfate.
Conclusions
Employing specific practices can reduce ammonia
emissions. A number of practices are available
but not all are suited for all operations. Careful
consideration and selection will help ensure that
you achieve the desired results.
Neither endorsement of companies or products
mentioned is intended, nor is criticism implied of
similar companies or products not mentioned.
www.extension.iastate.edu/Publications/PM1972a.pdf
PM 1973a Practices to Reduce Dust and Particulates
from Livestock Operations is found on the Web at:
http://www.extension.iastate.edu/Publications/
PM1973a.pdf
Prepared by Wendy Powers, environmental extension
specialist, Department of Animal Science, Iowa State
University. Reviewed by David Schmidt, extension
engineer, University of Minnesota. Edited by Marisa
Corzanego, extension communications intern,
Communication Services, Iowa State University
Extension. Designed by Jane Lenahan, graphic
designer, Instructional Technology Center, Iowa
State University.
File: Environmental Quality 4-1
… and justice for all
The U.S. Department of Agriculture (USDA) prohibits discrimination in all its programs and activities on the basis of race, color, national origin, gender, religion, age, disability, political beliefs, sexual orientation, and marital or family status. (Not all prohibited bases apply to all programs.) Many materials can be made available in alternative formats for ADA clients. To file a complaint of discrimination, write USDA, Office of Civil Rights, Room 326-W, Whitten Building, 14th and Independence Avenue, SW, Washington, DC 20250-9410 or call 202-720-5964.
Issued in furtherance of Cooperative Extension work, Acts of May 8 and June 30, 1914 in cooperation with the U.S. Department of Agriculture. Stanley R. Johnson, director, Cooperative Extension Service, Iowa State University of Science and Technology, Ames, Iowa.
6
6
2.2.3 Practices to Reduce Hydrogen Sulfide from Livestock Operations Document PM 1972a, contained on the following pages, is being used with permission from Iowa State University Extension.
1
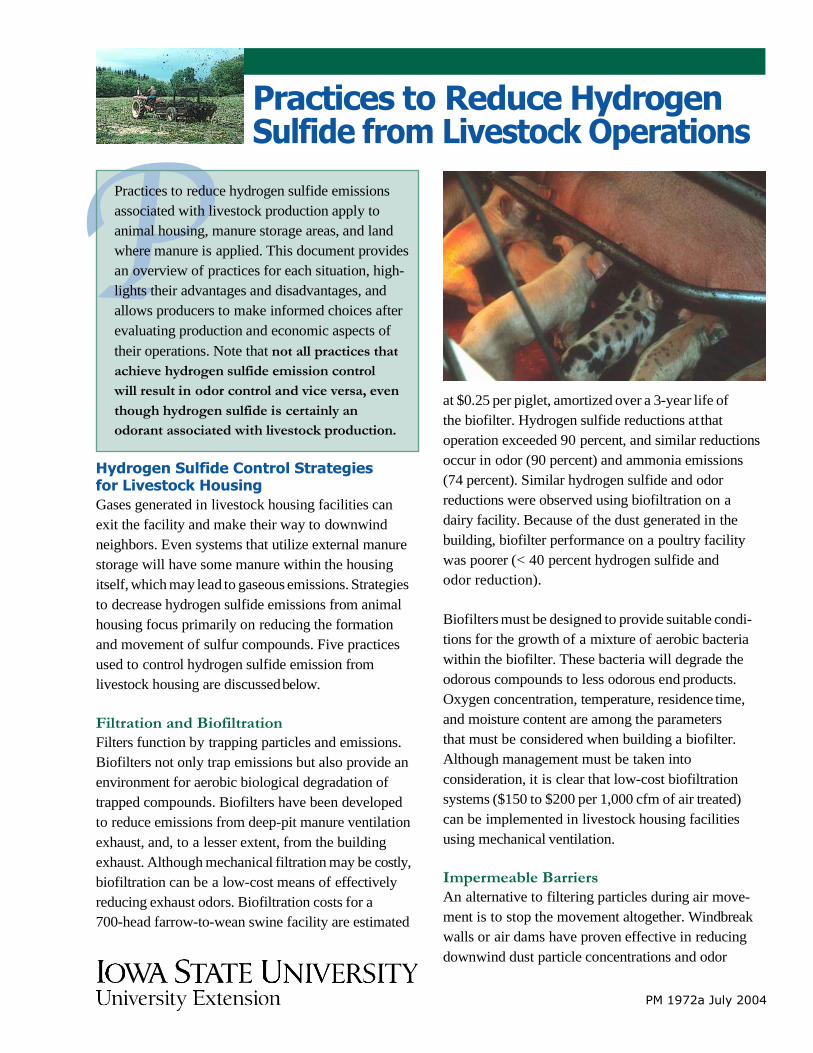
Practices to Reduce Hydrogen Sulfide from Livestock Operations
Hydrogen Sulfide Control Strategies for Livestock Housing
Gases generated in livestock housing facilities can
exit the facility and make their way to downwind
neighbors. Even systems that utilize external manure
storage will have some manure within the housing
itself, which may lead to gaseous emissions. Strategies
to decrease hydrogen sulfide emissions from animal
housing focus primarily on reducing the formation
and movement of sulfur compounds. Five practices
used to control hydrogen sulfide emission from
livestock housing are discussed below.
Filtration and Biofiltration
Filters function by trapping particles and emissions.
Biofilters not only trap emissions but also provide an
environment for aerobic biological degradation of
trapped compounds. Biofilters have been developed
to reduce emissions from deep-pit manure ventilation
exhaust, and, to a lesser extent, from the building
exhaust. Although mechanical filtration may be costly,
biofiltration can be a low-cost means of effectively
reducing exhaust odors. Biofiltration costs for a
700-head farrow-to-wean swine facility are estimated
at $0.25 per piglet, amortized over a 3-year life of
the biofilter. Hydrogen sulfide reductions at that
operation exceeded 90 percent, and similar reductions
occur in odor (90 percent) and ammonia emissions
(74 percent). Similar hydrogen sulfide and odor
reductions were observed using biofiltration on a
dairy facility. Because of the dust generated in the
building, biofilter performance on a poultry facility
was poorer (< 40 percent hydrogen sulfide and
odor reduction).
Biofilters must be designed to provide suitable condi-
tions for the growth of a mixture of aerobic bacteria
within the biofilter. These bacteria will degrade the
odorous compounds to less odorous end products.
Oxygen concentration, temperature, residence time,
and moisture content are among the parameters
that must be considered when building a biofilter.
Although management must be taken into
consideration, it is clear that low-cost biofiltration
systems ($150 to $200 per 1,000 cfm of air treated)
can be implemented in livestock housing facilities
using mechanical ventilation.
Impermeable Barriers
An alternative to filtering particles during air move-
ment is to stop the movement altogether. Windbreak
walls or air dams have proven effective in reducing
downwind dust particle concentrations and odor
PM 1972a July 2004
Practices to reduce hydrogen sulfide emissions
associated with livestock production apply to
animal housing, manure storage areas, and land
where manure is applied. This document provides
an overview of practices for each situation, high-
lights their advantages and disadvantages, and
allows producers to make informed choices after
evaluating production and economic aspects of
their operations. Note that not all practices that
achieve hydrogen sulfide emission control
will result in odor control and vice versa, even
though hydrogen sulfide is certainly an
odorant associated with livestock production.
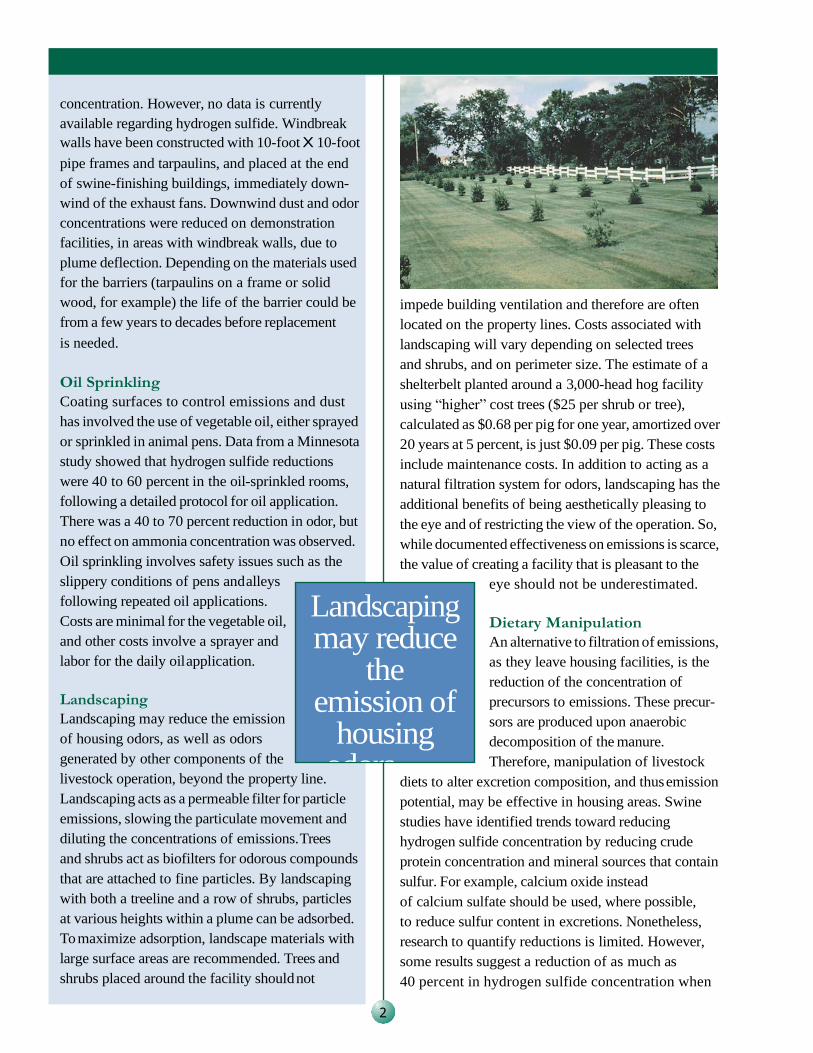
Landscaping may reduce
the emission of
housing odors . . .
concentration. However, no data is currently
available regarding hydrogen sulfide. Windbreak
walls have been constructed with 10-foot X 10-foot
pipe frames and tarpaulins, and placed at the end
of swine-finishing buildings, immediately down-
wind of the exhaust fans. Downwind dust and odor
concentrations were reduced on demonstration
facilities, in areas with windbreak walls, due to
plume deflection. Depending on the materials used
for the barriers (tarpaulins on a frame or solid
wood, for example) the life of the barrier could be
from a few years to decades before replacement
is needed.
Oil Sprinkling
Coating surfaces to control emissions and dust
has involved the use of vegetable oil, either sprayed
or sprinkled in animal pens. Data from a Minnesota
study showed that hydrogen sulfide reductions
were 40 to 60 percent in the oil-sprinkled rooms,
following a detailed protocol for oil application.
There was a 40 to 70 percent reduction in odor, but
no effect on ammonia concentration was observed.
Oil sprinkling involves safety issues such as the
slippery conditions of pens and alleys
following repeated oil applications.
Costs are minimal for the vegetable oil,
and other costs involve a sprayer and
labor for the daily oil application.
Landscaping
Landscaping may reduce the emission
of housing odors, as well as odors
generated by other components of the
livestock operation, beyond the property line.
Landscaping acts as a permeable filter for particle
emissions, slowing the particulate movement and
diluting the concentrations of emissions. Trees
and shrubs act as biofilters for odorous compounds
that are attached to fine particles. By landscaping
with both a treeline and a row of shrubs, particles
at various heights within a plume can be adsorbed.
To maximize adsorption, landscape materials with
large surface areas are recommended. Trees and
shrubs placed around the facility should not
impede building ventilation and therefore are often
located on the property lines. Costs associated with
landscaping will vary depending on selected trees
and shrubs, and on perimeter size. The estimate of a
shelterbelt planted around a 3,000-head hog facility
using “higher” cost trees ($25 per shrub or tree),
calculated as $0.68 per pig for one year, amortized over
20 years at 5 percent, is just $0.09 per pig. These costs
include maintenance costs. In addition to acting as a
natural filtration system for odors, landscaping has the
additional benefits of being aesthetically pleasing to
the eye and of restricting the view of the operation. So,
while documented effectiveness on emissions is scarce,
the value of creating a facility that is pleasant to the
eye should not be underestimated.
Dietary Manipulation
An alternative to filtration of emissions,
as they leave housing facilities, is the
reduction of the concentration of
precursors to emissions. These precur-
sors are produced upon anaerobic
decomposition of the manure.
Therefore, manipulation of livestock
diets to alter excretion composition, and thus emission
potential, may be effective in housing areas. Swine
studies have identified trends toward reducing
hydrogen sulfide concentration by reducing crude
protein concentration and mineral sources that contain
sulfur. For example, calcium oxide instead
of calcium sulfate should be used, where possible,
to reduce sulfur content in excretions. Nonetheless,
research to quantify reductions is limited. However,
some results suggest a reduction of as much as
40 percent in hydrogen sulfide concentration when
2
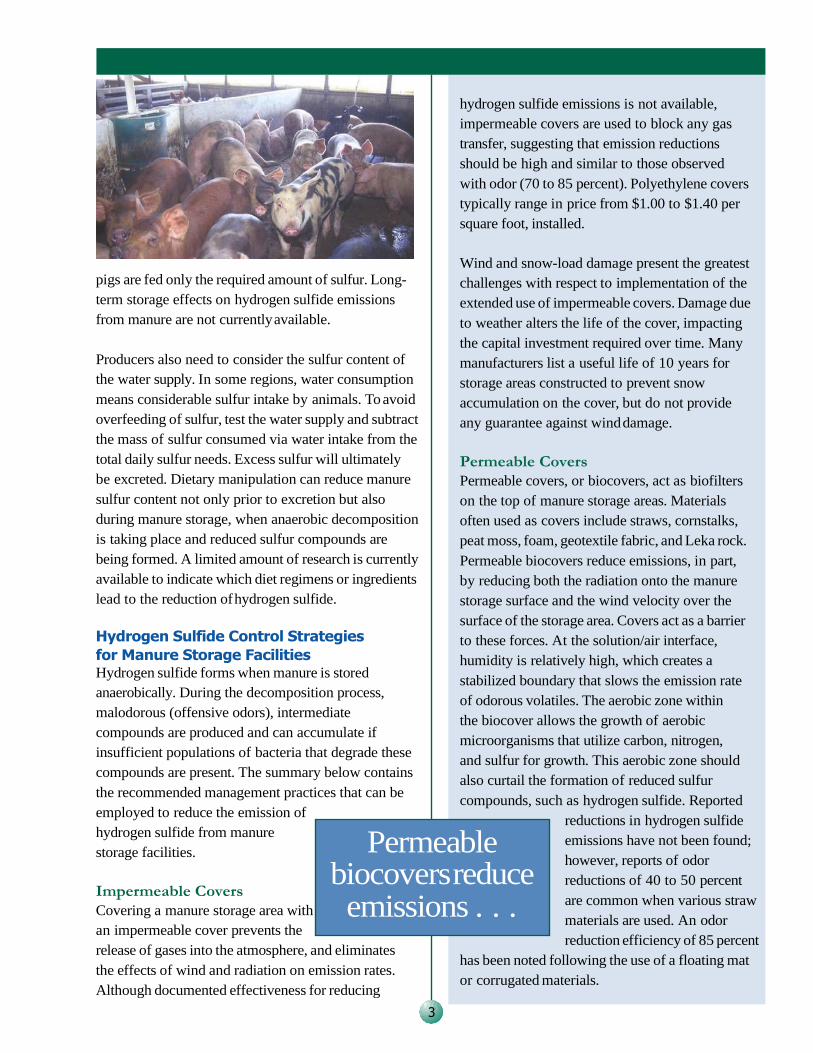
Permeable biocovers reduce emissions . . .
hydrogen sulfide emissions is not available,
impermeable covers are used to block any gas
transfer, suggesting that emission reductions
should be high and similar to those observed
with odor (70 to 85 percent). Polyethylene covers
typically range in price from $1.00 to $1.40 per
square foot, installed.
pigs are fed only the required amount of sulfur. Long-
term storage effects on hydrogen sulfide emissions
from manure are not currently available.
Producers also need to consider the sulfur content of
the water supply. In some regions, water consumption
means considerable sulfur intake by animals. To avoid
overfeeding of sulfur, test the water supply and subtract
the mass of sulfur consumed via water intake from the
total daily sulfur needs. Excess sulfur will ultimately
be excreted. Dietary manipulation can reduce manure
sulfur content not only prior to excretion but also
during manure storage, when anaerobic decomposition
is taking place and reduced sulfur compounds are
being formed. A limited amount of research is currently
available to indicate which diet regimens or ingredients
lead to the reduction of hydrogen sulfide.
Hydrogen Sulfide Control Strategies
for Manure Storage Facilities Hydrogen sulfide forms when manure is stored
anaerobically. During the decomposition process,
malodorous (offensive odors), intermediate
compounds are produced and can accumulate if
insufficient populations of bacteria that degrade these
compounds are present. The summary below contains
the recommended management practices that can be
employed to reduce the emission of
hydrogen sulfide from manure
storage facilities.
Impermeable Covers
Covering a manure storage area with
an impermeable cover prevents the
release of gases into the atmosphere, and eliminates
the effects of wind and radiation on emission rates.
Although documented effectiveness for reducing
3
Wind and snow-load damage present the greatest
challenges with respect to implementation of the
extended use of impermeable covers. Damage due
to weather alters the life of the cover, impacting
the capital investment required over time. Many
manufacturers list a useful life of 10 years for
storage areas constructed to prevent snow
accumulation on the cover, but do not provide
any guarantee against wind damage.
Permeable Covers
Permeable covers, or biocovers, act as biofilters
on the top of manure storage areas. Materials
often used as covers include straws, cornstalks,
peat moss, foam, geotextile fabric, and Leka rock.
Permeable biocovers reduce emissions, in part,
by reducing both the radiation onto the manure
storage surface and the wind velocity over the
surface of the storage area. Covers act as a barrier
to these forces. At the solution/air interface,
humidity is relatively high, which creates a
stabilized boundary that slows the emission rate
of odorous volatiles. The aerobic zone within
the biocover allows the growth of aerobic
microorganisms that utilize carbon, nitrogen,
and sulfur for growth. This aerobic zone should
also curtail the formation of reduced sulfur
compounds, such as hydrogen sulfide. Reported
reductions in hydrogen sulfide
emissions have not been found;
however, reports of odor
reductions of 40 to 50 percent
are common when various straw
materials are used. An odor
reduction efficiency of 85 percent
has been noted following the use of a floating mat
or corrugated materials.
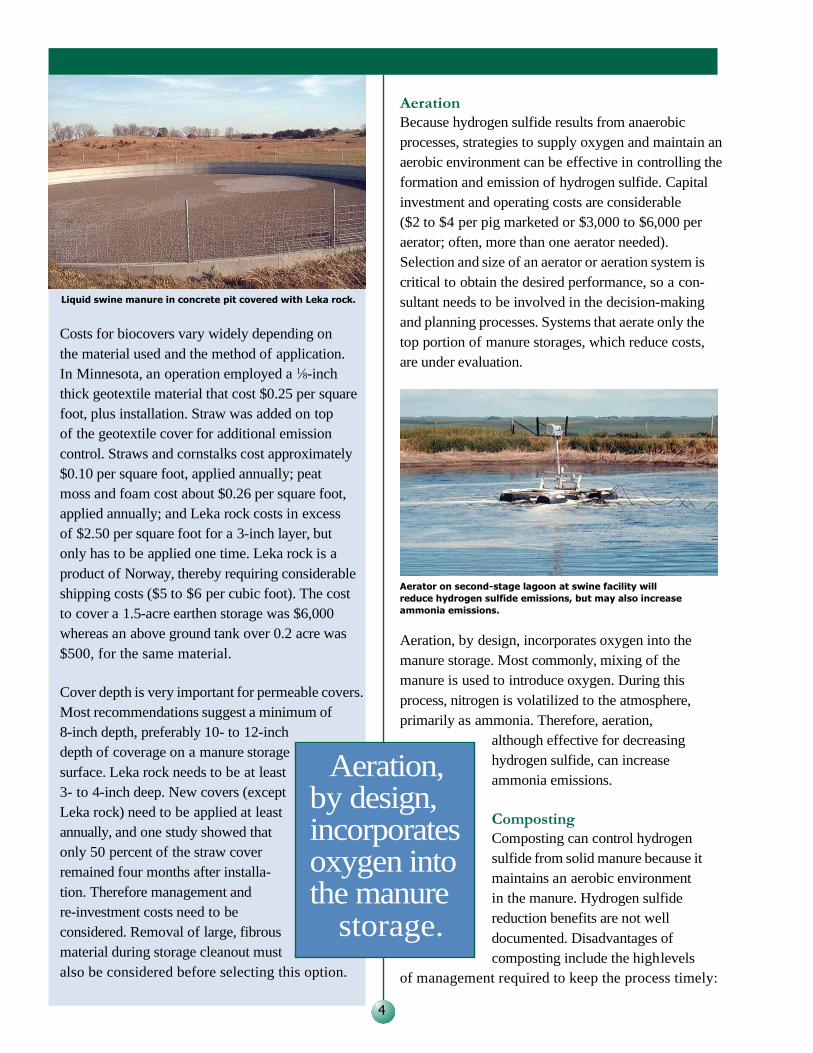
Liquid swine manure in concrete pit covered with Leka rock.
Costs for biocovers vary widely depending on
the material used and the method of application.
In Minnesota, an operation employed a 1⁄8-inch
thick geotextile material that cost $0.25 per square
foot, plus installation. Straw was added on top
of the geotextile cover for additional emission
control. Straws and cornstalks cost approximately
$0.10 per square foot, applied annually; peat
moss and foam cost about $0.26 per square foot,
applied annually; and Leka rock costs in excess
of $2.50 per square foot for a 3-inch layer, but
only has to be applied one time. Leka rock is a
product of Norway, thereby requiring considerable
shipping costs ($5 to $6 per cubic foot). The cost
to cover a 1.5-acre earthen storage was $6,000
whereas an above ground tank over 0.2 acre was
$500, for the same material.
Cover depth is very important for permeable covers.
Most recommendations suggest a minimum of
8-inch depth, preferably 10- to 12-inch
depth of coverage on a manure storage
surface. Leka rock needs to be at least
3- to 4-inch deep. New covers (except
Leka rock) need to be applied at least
annually, and one study showed that
only 50 percent of the straw cover
remained four months after installa-
tion. Therefore management and
re-investment costs need to be
considered. Removal of large, fibrous
material during storage cleanout must
also be considered before selecting this option.
Aeration
Because hydrogen sulfide results from anaerobic
processes, strategies to supply oxygen and maintain an
aerobic environment can be effective in controlling the
formation and emission of hydrogen sulfide. Capital
investment and operating costs are considerable
($2 to $4 per pig marketed or $3,000 to $6,000 per
aerator; often, more than one aerator needed).
Selection and size of an aerator or aeration system is
critical to obtain the desired performance, so a con-
sultant needs to be involved in the decision-making
and planning processes. Systems that aerate only the
top portion of manure storages, which reduce costs,
are under evaluation.
Aerator on second-stage lagoon at swine facility will
reduce hydrogen sulfide emissions, but may also increase
ammonia emissions.
Aeration, by design, incorporates oxygen into the
manure storage. Most commonly, mixing of the
manure is used to introduce oxygen. During this
process, nitrogen is volatilized to the atmosphere,
primarily as ammonia. Therefore, aeration,
although effective for decreasing
hydrogen sulfide, can increase
ammonia emissions.
Composting
Composting can control hydrogen
sulfide from solid manure because it
maintains an aerobic environment
in the manure. Hydrogen sulfide
reduction benefits are not well
documented. Disadvantages of
composting include the high levels
of management required to keep the process timely:
4
Aeration, by design, incorporates oxygen into the manure
storage.
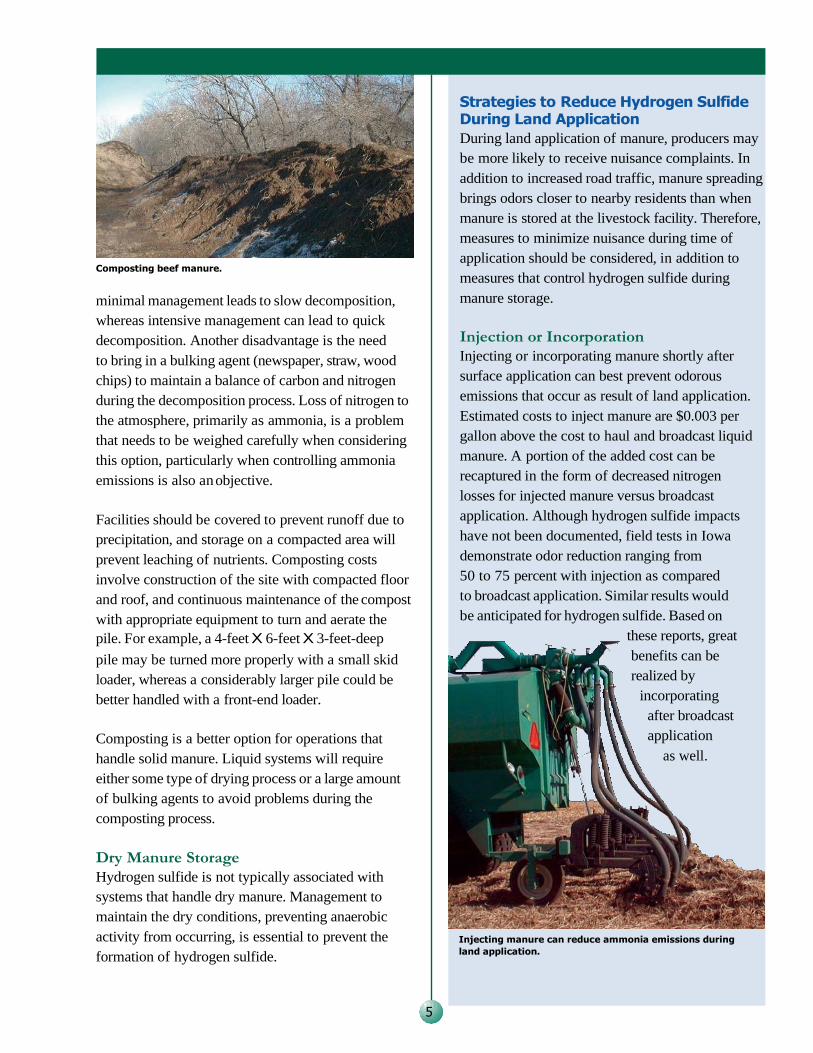
Composting beef manure.
minimal management leads to slow decomposition,
whereas intensive management can lead to quick
decomposition. Another disadvantage is the need
to bring in a bulking agent (newspaper, straw, wood
chips) to maintain a balance of carbon and nitrogen
during the decomposition process. Loss of nitrogen to
the atmosphere, primarily as ammonia, is a problem
that needs to be weighed carefully when considering
this option, particularly when controlling ammonia
emissions is also an objective.
Facilities should be covered to prevent runoff due to
precipitation, and storage on a compacted area will
prevent leaching of nutrients. Composting costs
involve construction of the site with compacted floor
and roof, and continuous maintenance of the compost
with appropriate equipment to turn and aerate the
pile. For example, a 4-feet X 6-feet X 3-feet-deep
pile may be turned more properly with a small skid
loader, whereas a considerably larger pile could be
better handled with a front-end loader.
Composting is a better option for operations that
handle solid manure. Liquid systems will require
either some type of drying process or a large amount
of bulking agents to avoid problems during the
composting process.
Dry Manure Storage
Hydrogen sulfide is not typically associated with
systems that handle dry manure. Management to
maintain the dry conditions, preventing anaerobic
activity from occurring, is essential to prevent the
formation of hydrogen sulfide.
Strategies to Reduce Hydrogen Sulfide During Land Application
During land application of manure, producers may
be more likely to receive nuisance complaints. In
addition to increased road traffic, manure spreading
brings odors closer to nearby residents than when
manure is stored at the livestock facility. Therefore,
measures to minimize nuisance during time of
application should be considered, in addition to
measures that control hydrogen sulfide during
manure storage.
Injection or Incorporation
Injecting or incorporating manure shortly after
surface application can best prevent odorous
emissions that occur as result of land application.
Estimated costs to inject manure are $0.003 per
gallon above the cost to haul and broadcast liquid
manure. A portion of the added cost can be
recaptured in the form of decreased nitrogen
losses for injected manure versus broadcast
application. Although hydrogen sulfide impacts
have not been documented, field tests in Iowa
demonstrate odor reduction ranging from
50 to 75 percent with injection as compared
to broadcast application. Similar results would
be anticipated for hydrogen sulfide. Based on
these reports, great
benefits can be
realized by
incorporating
after broadcast
application
as well.
Injecting manure can reduce ammonia emissions during
land application.
5
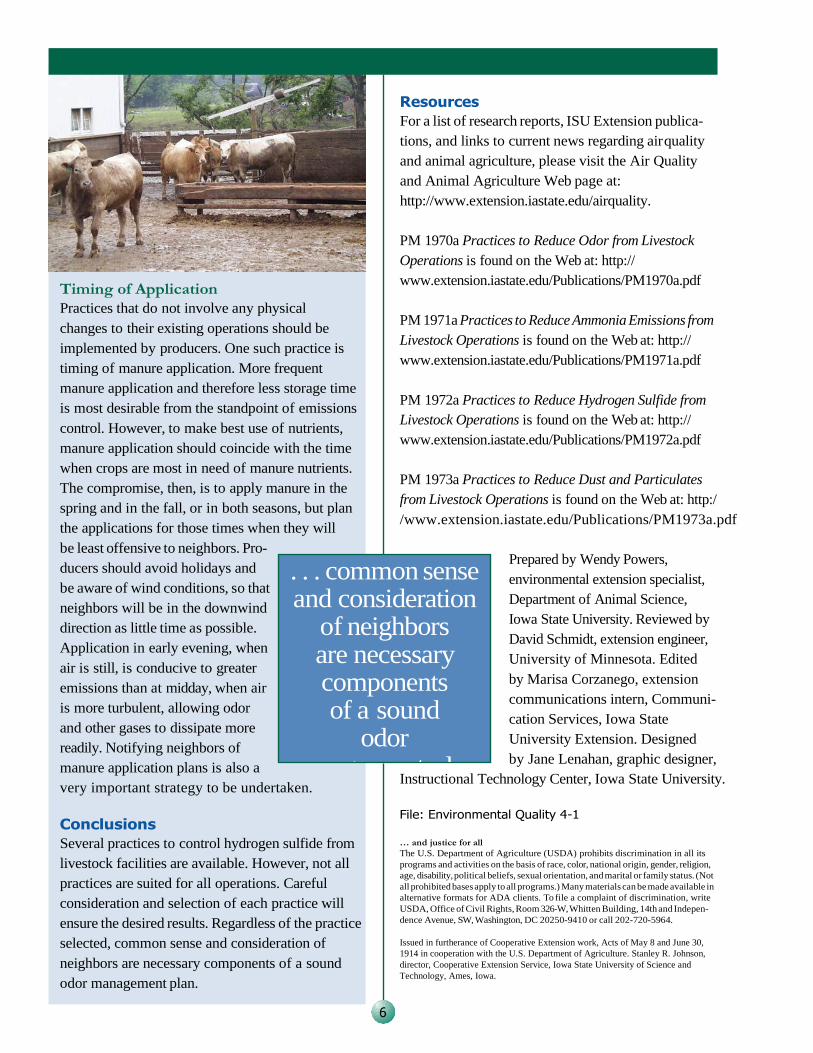
. . . common sense and consideration
of neighbors are necessary components of a sound
odor management plan.
Resources
For a list of research reports, ISU Extension publica-
tions, and links to current news regarding air quality
and animal agriculture, please visit the Air Quality
and Animal Agriculture Web page at:
http://www.extension.iastate.edu/airquality.
Timing of Application
Practices that do not involve any physical
changes to their existing operations should be
implemented by producers. One such practice is
timing of manure application. More frequent
manure application and therefore less storage time
is most desirable from the standpoint of emissions
control. However, to make best use of nutrients,
manure application should coincide with the time
when crops are most in need of manure nutrients.
The compromise, then, is to apply manure in the
spring and in the fall, or in both seasons, but plan
the applications for those times when they will
be least offensive to neighbors. Pro-
ducers should avoid holidays and
be aware of wind conditions, so that
neighbors will be in the downwind
direction as little time as possible.
Application in early evening, when
air is still, is conducive to greater
emissions than at midday, when air
is more turbulent, allowing odor
and other gases to dissipate more
readily. Notifying neighbors of
manure application plans is also a
very important strategy to be undertaken.
Conclusions
Several practices to control hydrogen sulfide from
livestock facilities are available. However, not all
practices are suited for all operations. Careful
consideration and selection of each practice will
ensure the desired results. Regardless of the practice
selected, common sense and consideration of
neighbors are necessary components of a sound
odor management plan.
PM 1970a Practices to Reduce Odor from Livestock
Operations is found on the Web at: http://
www.extension.iastate.edu/Publications/PM1970a.pdf
PM 1971a Practices to Reduce Ammonia Emissions from
Livestock Operations is found on the Web at: http://
www.extension.iastate.edu/Publications/PM1971a.pdf
PM 1972a Practices to Reduce Hydrogen Sulfide from
Livestock Operations is found on the Web at: http://
www.extension.iastate.edu/Publications/PM1972a.pdf
PM 1973a Practices to Reduce Dust and Particulates
from Livestock Operations is found on the Web at: http:/
/www.extension.iastate.edu/Publications/PM1973a.pdf
Prepared by Wendy Powers,
environmental extension specialist,
Department of Animal Science,
Iowa State University. Reviewed by
David Schmidt, extension engineer,
University of Minnesota. Edited
by Marisa Corzanego, extension
communications intern, Communi-
cation Services, Iowa State
University Extension. Designed
by Jane Lenahan, graphic designer,
Instructional Technology Center, Iowa State University.
File: Environmental Quality 4-1
… and justice for all
The U.S. Department of Agriculture (USDA) prohibits discrimination in all its
programs and activities on the basis of race, color, national origin, gender, religion,
age, disability, political beliefs, sexual orientation, and marital or family status. (Not
all prohibited bases apply to all programs.) Many materials can be made available in
alternative formats for ADA clients. To file a complaint of discrimination, write
USDA, Office of Civil Rights, Room 326-W, Whitten Building, 14th and Indepen-
dence Avenue, SW, Washington, DC 20250-9410 or call 202-720-5964.
Issued in furtherance of Cooperative Extension work, Acts of May 8 and June 30,
1914 in cooperation with the U.S. Department of Agriculture. Stanley R. Johnson,
director, Cooperative Extension Service, Iowa State University of Science and
Technology, Ames, Iowa.
6
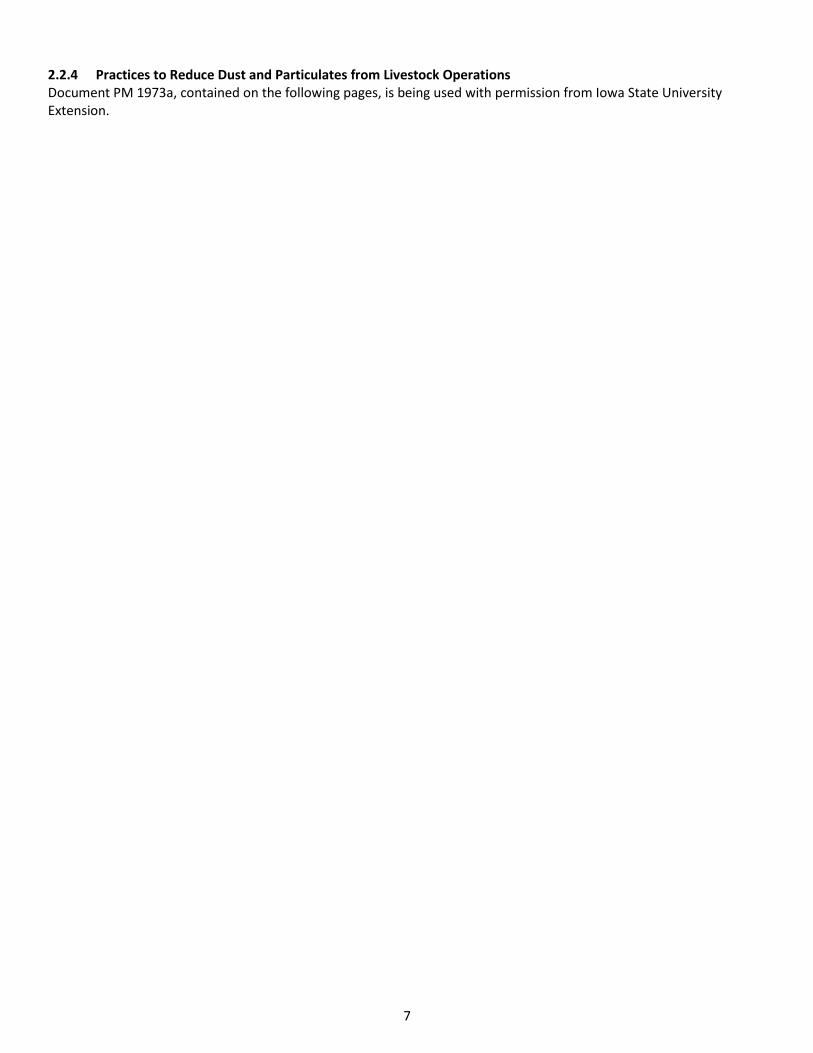
7
2.2.4 Practices to Reduce Dust and Particulates from Livestock Operations Document PM 1973a, contained on the following pages, is being used with permission from Iowa State University Extension.
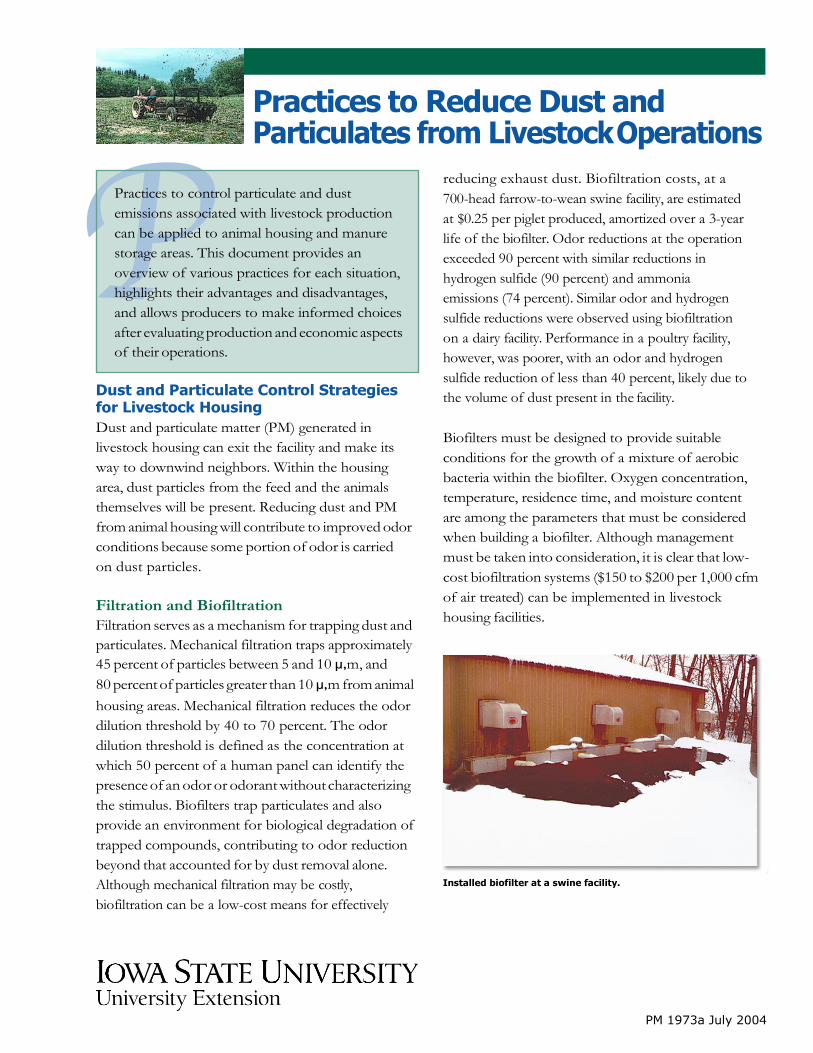
1
Practices to Reduce Dust and Particulates from Livestock Operations
Dust and Particulate Control Strategies for Livestock Housing
Dust and particulate matter (PM) generated in
livestock housing can exit the facility and make its
way to downwind neighbors. Within the housing
area, dust particles from the feed and the animals
themselves will be present. Reducing dust and PM
from animal housing will contribute to improved odor
conditions because some portion of odor is carried
on dust particles.
Filtration and Biofiltration
Filtration serves as a mechanism for trapping dust and
particulates. Mechanical filtration traps approximately
45 percent of particles between 5 and 10 µ,m, and
80 percent of particles greater than 10 µ,m from animal
housing areas. Mechanical filtration reduces the odor
dilution threshold by 40 to 70 percent. The odor
dilution threshold is defined as the concentration at
which 50 percent of a human panel can identify the
presence of an odor or odorant without characterizing
the stimulus. Biofilters trap particulates and also
provide an environment for biological degradation of
trapped compounds, contributing to odor reduction
beyond that accounted for by dust removal alone.
Although mechanical filtration may be costly,
biofiltration can be a low-cost means for effectively
reducing exhaust dust. Biofiltration costs, at a
700-head farrow-to-wean swine facility, are estimated
at $0.25 per piglet produced, amortized over a 3-year
life of the biofilter. Odor reductions at the operation
exceeded 90 percent with similar reductions in
hydrogen sulfide (90 percent) and ammonia
emissions (74 percent). Similar odor and hydrogen
sulfide reductions were observed using biofiltration
on a dairy facility. Performance in a poultry facility,
however, was poorer, with an odor and hydrogen
sulfide reduction of less than 40 percent, likely due to
the volume of dust present in the facility.
Biofilters must be designed to provide suitable
conditions for the growth of a mixture of aerobic
bacteria within the biofilter. Oxygen concentration,
temperature, residence time, and moisture content
are among the parameters that must be considered
when building a biofilter. Although management
must be taken into consideration, it is clear that low-
cost biofiltration systems ($150 to $200 per 1,000 cfm
of air treated) can be implemented in livestock
housing facilities.
Installed biofilter at a swine facility.
PM 1973a July 2004
Practices to control particulate and dust
emissions associated with livestock production
can be applied to animal housing and manure
storage areas. This document provides an
overview of various practices for each situation,
highlights their advantages and disadvantages,
and allows producers to make informed choices
after evaluating production and economic aspects
of their operations.
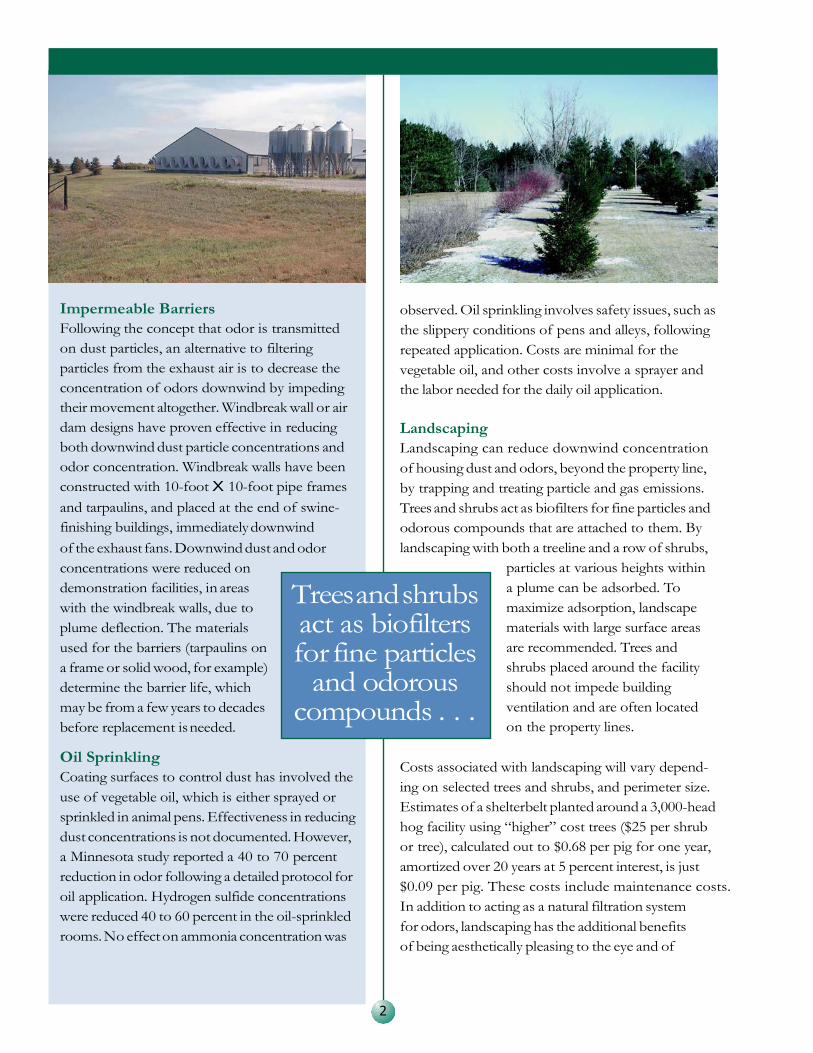
Trees and shrubs act as biofilters for fine particles
and odorous compounds . . .
Impermeable Barriers
Following the concept that odor is transmitted
on dust particles, an alternative to filtering
particles from the exhaust air is to decrease the
concentration of odors downwind by impeding
their movement altogether. Windbreak wall or air
dam designs have proven effective in reducing
both downwind dust particle concentrations and
odor concentration. Windbreak walls have been
constructed with 10-foot X 10-foot pipe frames
and tarpaulins, and placed at the end of swine-
finishing buildings, immediately downwind
of the exhaust fans. Downwind dust and odor
concentrations were reduced on
demonstration facilities, in areas
with the windbreak walls, due to
plume deflection. The materials
used for the barriers (tarpaulins on
a frame or solid wood, for example)
determine the barrier life, which
may be from a few years to decades
before replacement is needed.
Oil Sprinkling
Coating surfaces to control dust has involved the
use of vegetable oil, which is either sprayed or
sprinkled in animal pens. Effectiveness in reducing
dust concentrations is not documented. However,
a Minnesota study reported a 40 to 70 percent
reduction in odor following a detailed protocol for
oil application. Hydrogen sulfide concentrations
were reduced 40 to 60 percent in the oil-sprinkled
rooms. No effect on ammonia concentration was
observed. Oil sprinkling involves safety issues, such as
the slippery conditions of pens and alleys, following
repeated application. Costs are minimal for the
vegetable oil, and other costs involve a sprayer and
the labor needed for the daily oil application.
Landscaping
Landscaping can reduce downwind concentration
of housing dust and odors, beyond the property line,
by trapping and treating particle and gas emissions.
Trees and shrubs act as biofilters for fine particles and
odorous compounds that are attached to them. By
landscaping with both a treeline and a row of shrubs,
particles at various heights within
a plume can be adsorbed. To
maximize adsorption, landscape
materials with large surface areas
are recommended. Trees and
shrubs placed around the facility
should not impede building
ventilation and are often located
on the property lines.
Costs associated with landscaping will vary depend-
ing on selected trees and shrubs, and perimeter size.
Estimates of a shelterbelt planted around a 3,000-head
hog facility using “higher” cost trees ($25 per shrub
or tree), calculated out to $0.68 per pig for one year,
amortized over 20 years at 5 percent interest, is just
$0.09 per pig. These costs include maintenance costs.
In addition to acting as a natural filtration system
for odors, landscaping has the additional benefits
of being aesthetically pleasing to the eye and of
2
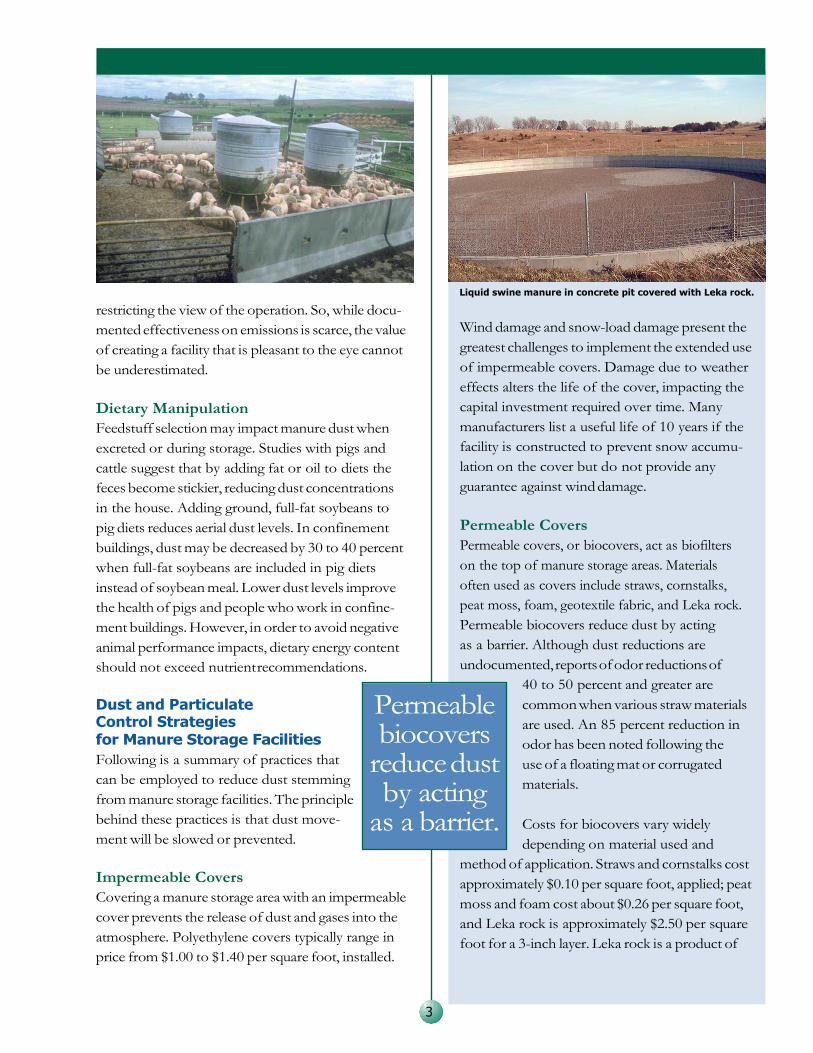
restricting the view of the operation. So, while docu-
mented effectiveness on emissions is scarce, the value
of creating a facility that is pleasant to the eye cannot
be underestimated.
Dietary Manipulation
Feedstuff selection may impact manure dust when
excreted or during storage. Studies with pigs and
cattle suggest that by adding fat or oil to diets the
feces become stickier, reducing dust concentrations
in the house. Adding ground, full-fat soybeans to
pig diets reduces aerial dust levels. In confinement
buildings, dust may be decreased by 30 to 40 percent
when full-fat soybeans are included in pig diets
instead of soybean meal. Lower dust levels improve
the health of pigs and people who work in confine-
ment buildings. However, in order to avoid negative
animal performance impacts, dietary energy content
should not exceed nutrient recommendations.
Dust and Particulate Control Strategies for Manure Storage Facilities
Following is a summary of practices that
can be employed to reduce dust stemming
from manure storage facilities. The principle
behind these practices is that dust move-
ment will be slowed or prevented.
Impermeable Covers
Covering a manure storage area with an impermeable
cover prevents the release of dust and gases into the
atmosphere. Polyethylene covers typically range in
price from $1.00 to $1.40 per square foot, installed.
Liquid swine manure in concrete pit covered with Leka rock.
Wind damage and snow-load damage present the
greatest challenges to implement the extended use
of impermeable covers. Damage due to weather
effects alters the life of the cover, impacting the
capital investment required over time. Many
manufacturers list a useful life of 10 years if the
facility is constructed to prevent snow accumu-
lation on the cover but do not provide any
guarantee against wind damage.
Permeable Covers
Permeable covers, or biocovers, act as biofilters
on the top of manure storage areas. Materials
often used as covers include straws, cornstalks,
peat moss, foam, geotextile fabric, and Leka rock.
Permeable biocovers reduce dust by acting
as a barrier. Although dust reductions are
undocumented, reports of odor reductions of
40 to 50 percent and greater are
common when various straw materials
are used. An 85 percent reduction in
odor has been noted following the
use of a floating mat or corrugated
materials.
Costs for biocovers vary widely
depending on material used and
method of application. Straws and cornstalks cost
approximately $0.10 per square foot, applied; peat
moss and foam cost about $0.26 per square foot,
and Leka rock is approximately $2.50 per square
foot for a 3-inch layer. Leka rock is a product of
Permeable biocovers
reduce dust by acting
as a barrier.
3
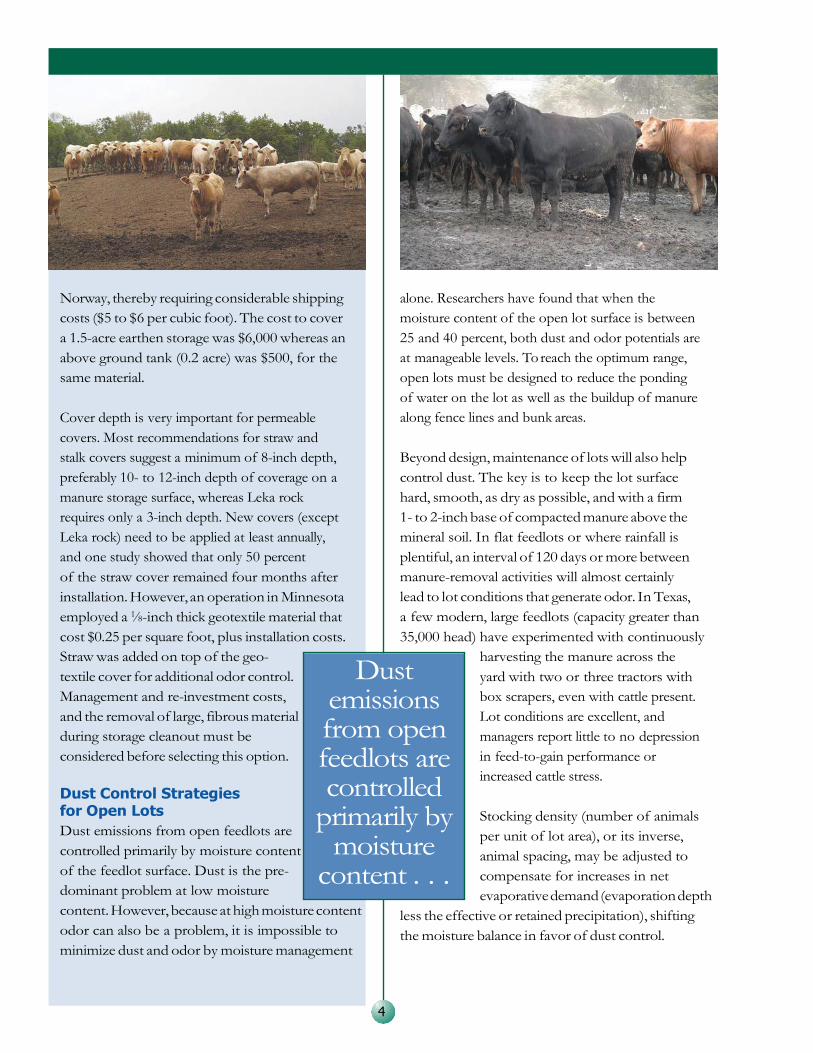
Dust emissions from open feedlots are controlled
primarily by moisture
content . . .
Norway, thereby requiring considerable shipping
costs ($5 to $6 per cubic foot). The cost to cover
a 1.5-acre earthen storage was $6,000 whereas an
above ground tank (0.2 acre) was $500, for the
same material.
Cover depth is very important for permeable
covers. Most recommendations for straw and
stalk covers suggest a minimum of 8-inch depth,
preferably 10- to 12-inch depth of coverage on a
manure storage surface, whereas Leka rock
requires only a 3-inch depth. New covers (except
Leka rock) need to be applied at least annually,
and one study showed that only 50 percent
of the straw cover remained four months after
installation. However, an operation in Minnesota
employed a 1⁄8-inch thick geotextile material that
cost $0.25 per square foot, plus installation costs.
Straw was added on top of the geo-
textile cover for additional odor control.
Management and re-investment costs,
and the removal of large, fibrous material
during storage cleanout must be
considered before selecting this option.
Dust Control Strategies for Open Lots
Dust emissions from open feedlots are
controlled primarily by moisture content
of the feedlot surface. Dust is the pre-
dominant problem at low moisture
content. However, because at high moisture content
odor can also be a problem, it is impossible to
minimize dust and odor by moisture management
alone. Researchers have found that when the
moisture content of the open lot surface is between
25 and 40 percent, both dust and odor potentials are
at manageable levels. To reach the optimum range,
open lots must be designed to reduce the ponding
of water on the lot as well as the buildup of manure
along fence lines and bunk areas.
Beyond design, maintenance of lots will also help
control dust. The key is to keep the lot surface
hard, smooth, as dry as possible, and with a firm
1- to 2-inch base of compacted manure above the
mineral soil. In flat feedlots or where rainfall is
plentiful, an interval of 120 days or more between
manure-removal activities will almost certainly
lead to lot conditions that generate odor. In Texas,
a few modern, large feedlots (capacity greater than
35,000 head) have experimented with continuously
harvesting the manure across the
yard with two or three tractors with
box scrapers, even with cattle present.
Lot conditions are excellent, and
managers report little to no depression
in feed-to-gain performance or
increased cattle stress.
Stocking density (number of animals
per unit of lot area), or its inverse,
animal spacing, may be adjusted to
compensate for increases in net
evaporative demand (evaporation depth
less the effective or retained precipitation), shifting
the moisture balance in favor of dust control.
4
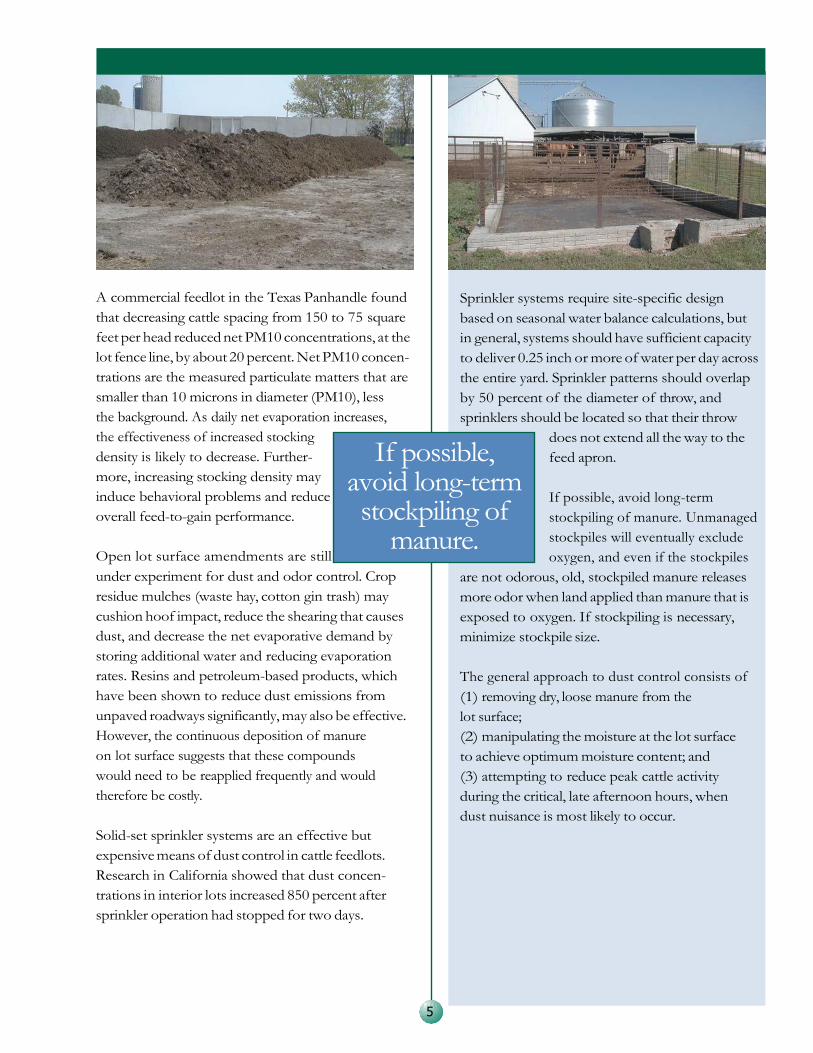
If possible, avoid long-term stockpiling of
manure.
A commercial feedlot in the Texas Panhandle found
that decreasing cattle spacing from 150 to 75 square
feet per head reduced net PM10 concentrations, at the
lot fence line, by about 20 percent. Net PM10 concen-
trations are the measured particulate matters that are
smaller than 10 microns in diameter (PM10), less
the background. As daily net evaporation increases,
the effectiveness of increased stocking
density is likely to decrease. Further-
more, increasing stocking density may
induce behavioral problems and reduce
overall feed-to-gain performance.
Open lot surface amendments are still
under experiment for dust and odor control. Crop
residue mulches (waste hay, cotton gin trash) may
cushion hoof impact, reduce the shearing that causes
dust, and decrease the net evaporative demand by
storing additional water and reducing evaporation
rates. Resins and petroleum-based products, which
have been shown to reduce dust emissions from
unpaved roadways significantly, may also be effective.
However, the continuous deposition of manure
on lot surface suggests that these compounds
would need to be reapplied frequently and would
therefore be costly.
Solid-set sprinkler systems are an effective but
expensive means of dust control in cattle feedlots.
Research in California showed that dust concen-
trations in interior lots increased 850 percent after
sprinkler operation had stopped for two days.
Sprinkler systems require site-specific design
based on seasonal water balance calculations, but
in general, systems should have sufficient capacity
to deliver 0.25 inch or more of water per day across
the entire yard. Sprinkler patterns should overlap
by 50 percent of the diameter of throw, and
sprinklers should be located so that their throw
does not extend all the way to the
feed apron.
If possible, avoid long-term
stockpiling of manure. Unmanaged
stockpiles will eventually exclude
oxygen, and even if the stockpiles
are not odorous, old, stockpiled manure releases
more odor when land applied than manure that is
exposed to oxygen. If stockpiling is necessary,
minimize stockpile size.
The general approach to dust control consists of
(1) removing dry, loose manure from the
lot surface;
(2) manipulating the moisture at the lot surface
to achieve optimum moisture content; and
(3) attempting to reduce peak cattle activity
during the critical, late afternoon hours, when
dust nuisance is most likely to occur.
5
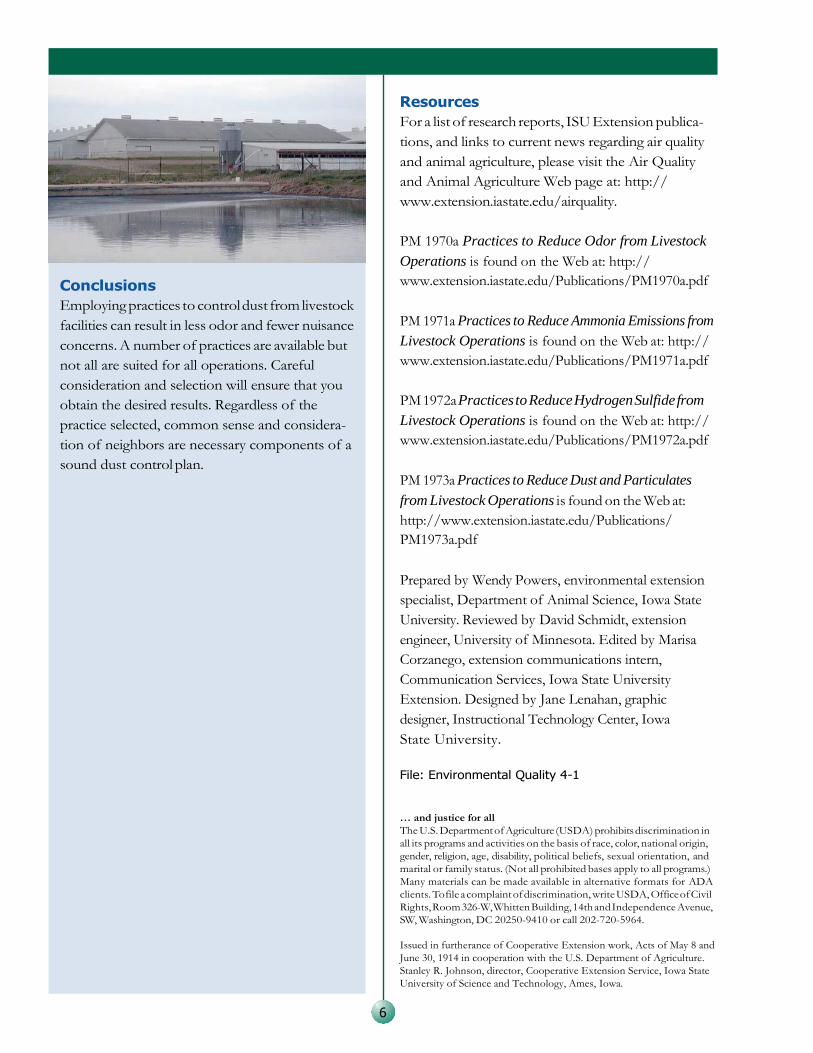
Resources
For a list of research reports, ISU Extension publica-
tions, and links to current news regarding air quality
and animal agriculture, please visit the Air Quality
and Animal Agriculture Web page at: http://
www.extension.iastate.edu/airquality.
Conclusions
Employing practices to control dust from livestock
facilities can result in less odor and fewer nuisance
concerns. A number of practices are available but
not all are suited for all operations. Careful
consideration and selection will ensure that you
obtain the desired results. Regardless of the
practice selected, common sense and considera-
tion of neighbors are necessary components of a
sound dust control plan.
PM 1970a Practices to Reduce Odor from Livestock
Operations is found on the Web at: http://
www.extension.iastate.edu/Publications/PM1970a.pdf
PM 1971a Practices to Reduce Ammonia Emissions from
Livestock Operations is found on the Web at: http://
www.extension.iastate.edu/Publications/PM1971a.pdf
PM 1972a Practices to Reduce Hydrogen Sulfide from
Livestock Operations is found on the Web at: http://
www.extension.iastate.edu/Publications/PM1972a.pdf
PM 1973a Practices to Reduce Dust and Particulates
from Livestock Operations is found on the Web at:
http://www.extension.iastate.edu/Publications/
PM1973a.pdf
Prepared by Wendy Powers, environmental extension
specialist, Department of Animal Science, Iowa State
University. Reviewed by David Schmidt, extension
engineer, University of Minnesota. Edited by Marisa
Corzanego, extension communications intern,
Communication Services, Iowa State University
Extension. Designed by Jane Lenahan, graphic
designer, Instructional Technology Center, Iowa
State University.
File: Environmental Quality 4-1
… and justice for all
The U.S. Department of Agriculture (USDA) prohibits discrimination in
all its programs and activities on the basis of race, color, national origin,
gender, religion, age, disability, political beliefs, sexual orientation, and
marital or family status. (Not all prohibited bases apply to all programs.)
Many materials can be made available in alternative formats for ADA
clients. To file a complaint of discrimination, write USDA, Office of Civil
Rights, Room 326-W, Whitten Building, 14th and Independence Avenue,
SW, Washington, DC 20250-9410 or call 202-720-5964.
Issued in furtherance of Cooperative Extension work, Acts of May 8 and
June 30, 1914 in cooperation with the U.S. Department of Agriculture.
Stanley R. Johnson, director, Cooperative Extension Service, Iowa State
University of Science and Technology, Ames, Iowa.
6
8
2.3 Bmp Flow Charts Flow charts for odor, ammonia, hydrogen sulfide, and dust and particulates have been developed as one-page overviews which break the bmp’s down by both liquid versus dry manure, and further by housing, storage and application practices. Each bmp has a relative cost and effectiveness associated with it. The costs are represented based on a ranking system of 1 through 3 dollar signs ($=low cost, $$=moderate cost, $$$=high cost). The costs include capital investment plus operations costs. The emission reduction effectiveness is represented as a percentage based on estimated reductions as found in the literature (conservative estimates recognizing that observed reductions may vary from site to site). The flow charts are located at the end of this chapter as Charts 2-1 through 2-4.
2.4 Potential Negative Environmental Impacts After completion of the fact sheets and flow charts the group compiled a list of potential negative environmental impacts associated with the bmp’s (Table 2-1). One concern of interest is that several of the proposed bmp’s for the reduction of one pollutant may actually increase the emissions of others (ex: aeration and composting may reduce hydrogen sulfide emissions but may increase ammonia emissions and acidification may reduce ammonia emissions but may increase hydrogen sulfide emissions).
2.5 Bmp Dissemination and Updates With the completion of a compilation of current acceptable bmp’s, the group discussed possible ways to disseminate the information to the producers. The group came up with a list of four suggested methods to distribute the information:
1) Create pamphlets summarizing the bmp’s (including web links) 2) Create a display at State and County Fairs 3) Present information at different producer group meetings 4) Develop regional workshops with field days at sites currently utilizing different bmp’s
The workgroup also suggested that the DNR conduct periodic literature reviews to stay abreast of new technologies as they develop. However, the group did not discuss how new technologies would be assessed as an acceptable bmp.
2.6 Closing Comments One thing that is important to remember while reviewing the bmp’s is that they will be site specific for each operation. Differences in operation management, structure size and design and location may all play roles in which practice would be best for a specific operation. For example, biofilters are an effective practice to reduce odors from a confined AFO, however, they may not be applicable to an operation that is using natural ventilation without major modification to their air handling system. Another important thing to be aware of while evaluating the effectiveness of bmp’s is that minimal data is currently available on how implementation of multiple practices would reduce emissions of the different pollutants. For example, by implementing both diet manipulation and biofilters the odor reduction may not be a direct additive effect of the two practices working independently. Much research is still needed and is ongoing in the field of air emission reductions associated with AFOs. However, the findings of this task force demonstrate that current technologies are available to producers to reduce air emissions from livestock operations.
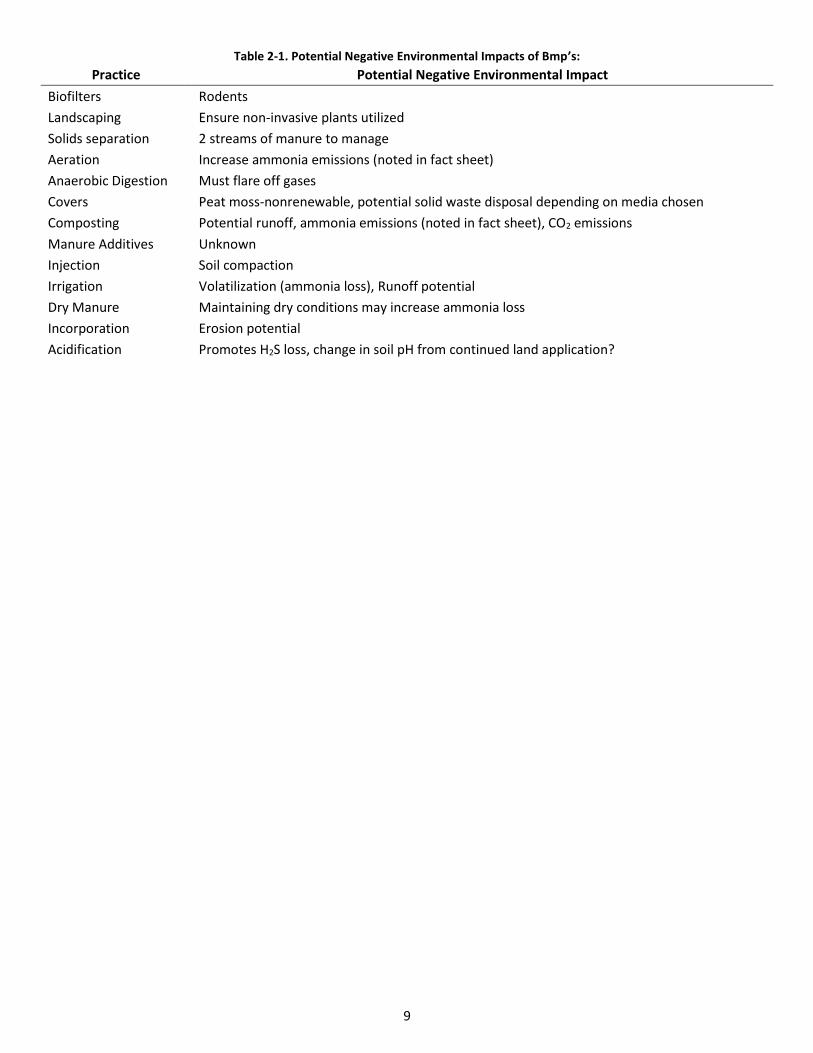
9
Table 2-1. Potential Negative Environmental Impacts of Bmp’s:
Practice Potential Negative Environmental Impact
Biofilters Rodents
Landscaping Ensure non-invasive plants utilized
Solids separation 2 streams of manure to manage
Aeration Increase ammonia emissions (noted in fact sheet)
Anaerobic Digestion Must flare off gases
Covers Peat moss-nonrenewable, potential solid waste disposal depending on media chosen
Composting Potential runoff, ammonia emissions (noted in fact sheet), CO2 emissions
Manure Additives Unknown
Injection Soil compaction
Irrigation Volatilization (ammonia loss), Runoff potential
Dry Manure Maintaining dry conditions may increase ammonia loss
Incorporation Erosion potential
Acidification Promotes H2S loss, change in soil pH from continued land application?
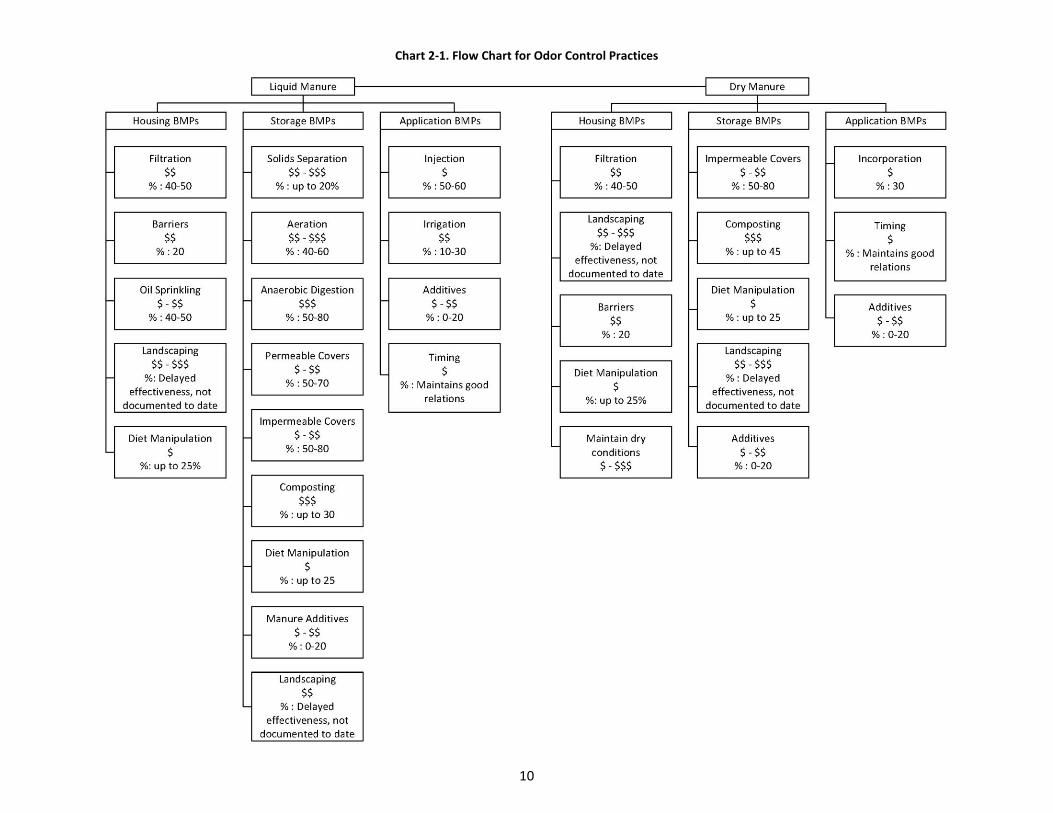
10
Chart 2-1. Flow Chart for Odor Control Practices
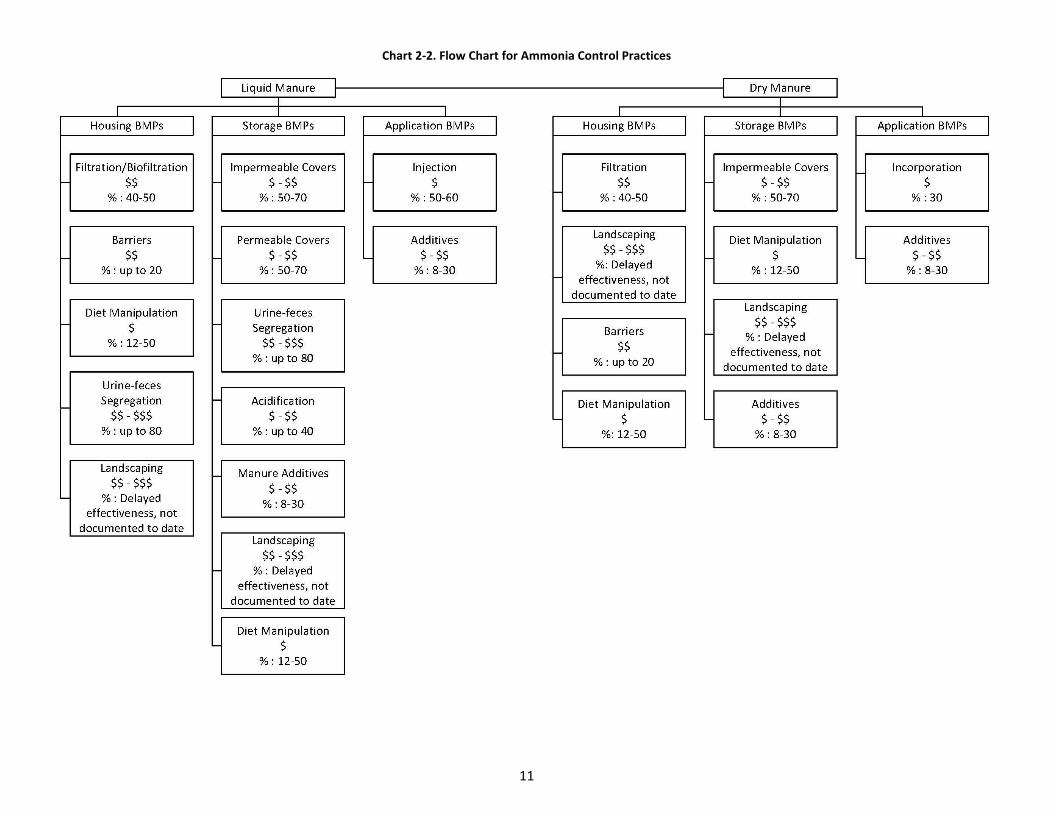
11
Chart 2-2. Flow Chart for Ammonia Control Practices
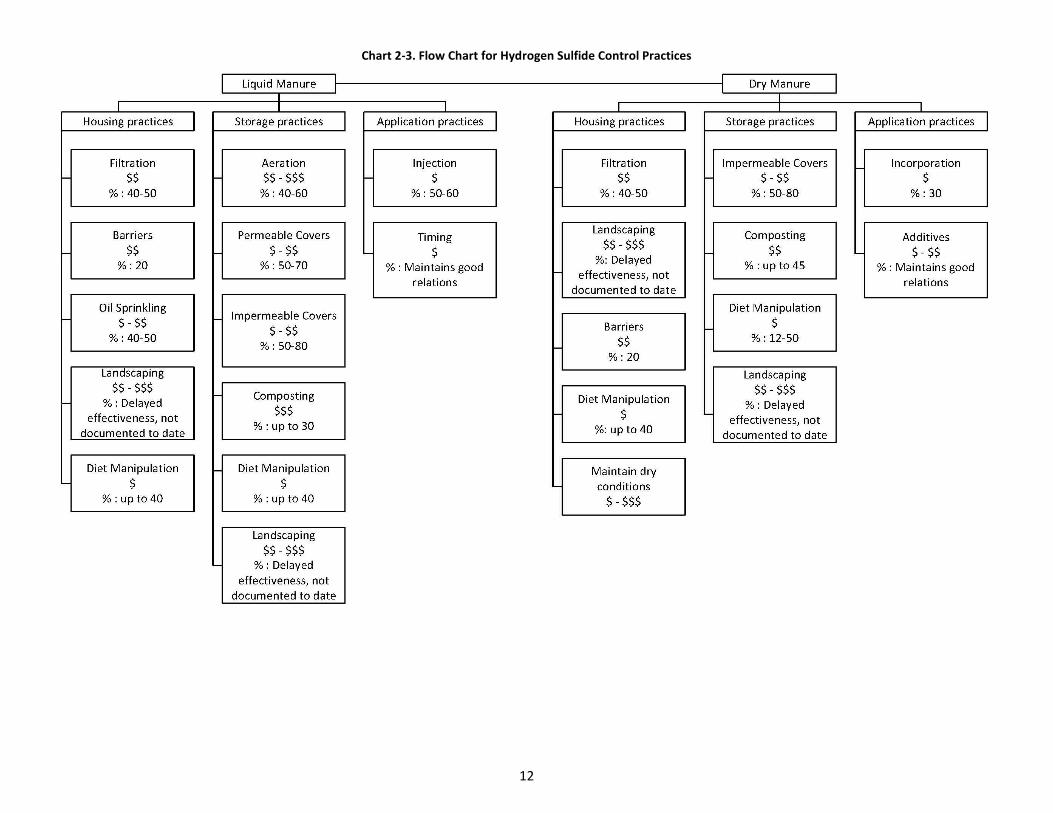
12
Chart 2-3. Flow Chart for Hydrogen Sulfide Control Practices
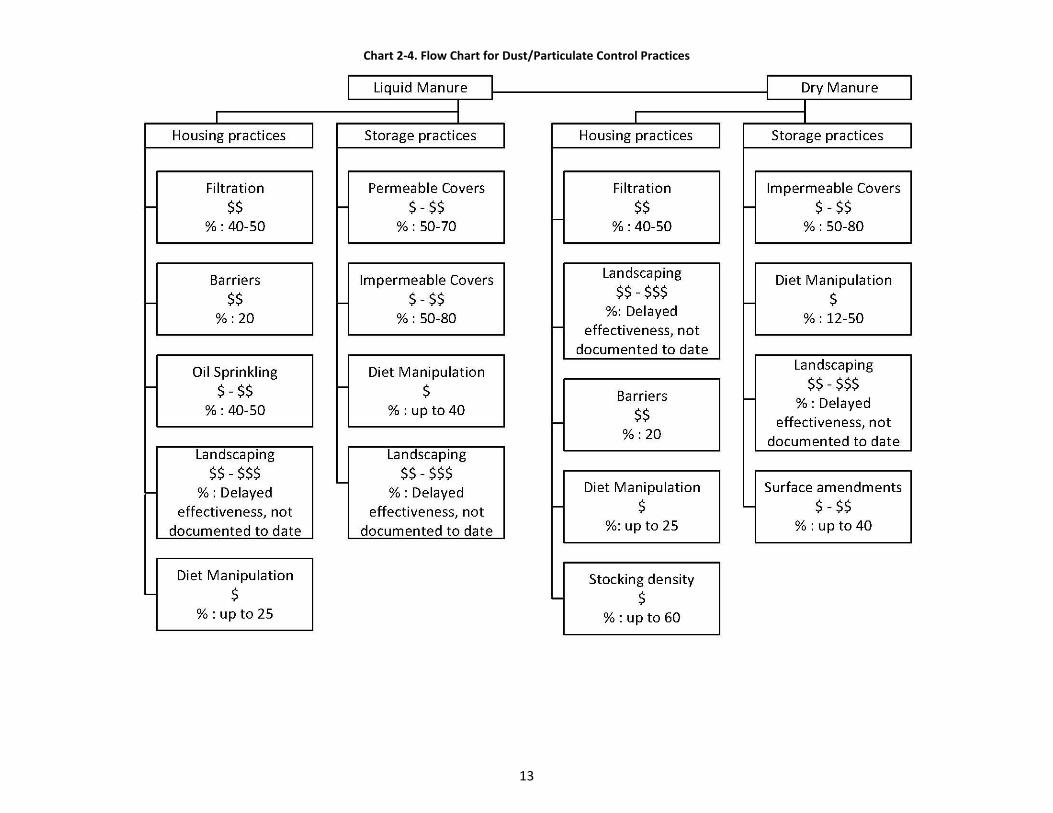
13
Chart 2-4. Flow Chart for Dust/Particulate Control Practices
14
3.0 Air Emissions Characterization
3.1 Introduction The Air Emissions Characterization workgroup performed a review of current literature on emission factors and techniques for the estimation of hydrogen sulfide, ammonia, odor, and particulate matter emissions from AFOs. Emission factor data for each of these pollutants is summarized in Tables 3-1 through 3-4 by pollutant. Inclusion of an emission factor in the tables does not mean that the workgroup is advocating the use of that emissions factor. The intent of the workgroup was to provide enough information for users to choose the best emission factor for a specific situation.
3.2 Purpose The charge of the Air Emissions Characterization workgroup was to identify emission factors currently available that can be used to estimate emissions of hydrogen sulfide, ammonia, and odor emissions from AFOs. In addition, particulate matter with an aerodynamic diameter less than or equal to 10 microns (PM10) was studied by the workgroup because fine particulate matter can be a carrier for odor. Additionally, PM10 can be easily inhaled by humans, causing adverse health effects.
3.3 Methodology The workgroup started with seven questions provided by the DNR and added an eighth question of their own:
1. What are the sources of pollutants at an AFO? 2. What source/s contribute the most to the atmosphere? 3. What emission factors are available that accurately characterize emissions from sources at AFOs, and are they
applicable to Iowa? 4. What process models are available to characterize emissions from AFOs? 5. What animal types are sources of pollutants and how do they vary? 6. What characteristics of building structures impact the emission of pollutants? 7. What characteristics of waste storage structures impact the emissions of pollutants? 8. What land application types are sources of pollutants and how do they vary?
After a general discussion of these questions, the workgroup decided to focus on emission factors. The workgroup chose not to address the fourth question regarding process models because many process models are currently still in development and because these models were beyond the technical expertise of the majority of the workgroup members. The workgroup then conducted a literature review of available emission factors. When possible, the workgroup tried to focus on emission factors that had been published in studies included in the “Iowa Concentrated Animal Feeding Operations Air Quality Study” final report of 2002 or published after it was released. The review focused on four pollutants: hydrogen sulfide, ammonia, odor, and particulate matter. Each pollutant was then assigned to either a single individual or small subgroup, and a standardized emission factor table was designed for group use. A draft emission factor summary for each pollutant was provided by each subgroup to the workgroup for review and comment before being finalized.
3.4 Emission Factor Background There are several ways to estimate emissions from a process. The preferred methods are continuous emissions monitoring, which provides constant measurement of a pollutant, and emissions testing, which provides an exact measurement of a pollutant during a set time period, because these methods are the most representative of the tested source’s emissions. However, test data from individual sources are not always available and, even if they are available, they may not reflect the variability of actual emissions over time. Thus, emission factors are frequently the best or only method available for estimating emissions, in spite of their limitations.1
1 Compilation of Air Pollutant Emission Factors, AP-42, Fifth Edition, Volume 1: Stationary Point and Area Sources, Jan. 1995, p. 1.
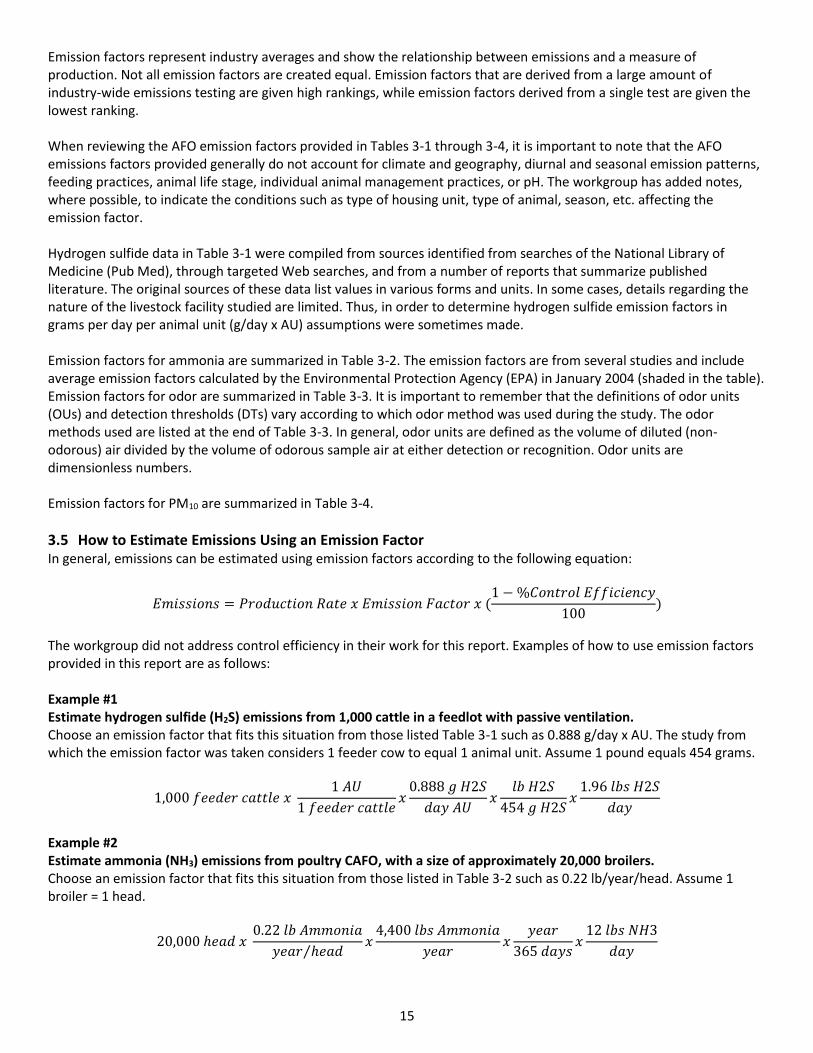
15
Emission factors represent industry averages and show the relationship between emissions and a measure of production. Not all emission factors are created equal. Emission factors that are derived from a large amount of industry-wide emissions testing are given high rankings, while emission factors derived from a single test are given the lowest ranking. When reviewing the AFO emission factors provided in Tables 3-1 through 3-4, it is important to note that the AFO emissions factors provided generally do not account for climate and geography, diurnal and seasonal emission patterns, feeding practices, animal life stage, individual animal management practices, or pH. The workgroup has added notes, where possible, to indicate the conditions such as type of housing unit, type of animal, season, etc. affecting the emission factor. Hydrogen sulfide data in Table 3-1 were compiled from sources identified from searches of the National Library of Medicine (Pub Med), through targeted Web searches, and from a number of reports that summarize published literature. The original sources of these data list values in various forms and units. In some cases, details regarding the nature of the livestock facility studied are limited. Thus, in order to determine hydrogen sulfide emission factors in grams per day per animal unit (g/day x AU) assumptions were sometimes made. Emission factors for ammonia are summarized in Table 3-2. The emission factors are from several studies and include average emission factors calculated by the Environmental Protection Agency (EPA) in January 2004 (shaded in the table). Emission factors for odor are summarized in Table 3-3. It is important to remember that the definitions of odor units (OUs) and detection thresholds (DTs) vary according to which odor method was used during the study. The odor methods used are listed at the end of Table 3-3. In general, odor units are defined as the volume of diluted (non-odorous) air divided by the volume of odorous sample air at either detection or recognition. Odor units are dimensionless numbers. Emission factors for PM10 are summarized in Table 3-4.
3.5 How to Estimate Emissions Using an Emission Factor In general, emissions can be estimated using emission factors according to the following equation:
𝐸𝑚𝑖𝑠𝑠𝑖𝑜𝑛𝑠 = 𝑃𝑟𝑜𝑑𝑢𝑐𝑡𝑖𝑜𝑛 𝑅𝑎𝑡𝑒 𝑥 𝐸𝑚𝑖𝑠𝑠𝑖𝑜𝑛 𝐹𝑎𝑐𝑡𝑜𝑟 𝑥 (1 − %𝐶𝑜𝑛𝑡𝑟𝑜𝑙 𝐸𝑓𝑓𝑖𝑐𝑖𝑒𝑛𝑐𝑦
100)
The workgroup did not address control efficiency in their work for this report. Examples of how to use emission factors provided in this report are as follows: Example #1 Estimate hydrogen sulfide (H2S) emissions from 1,000 cattle in a feedlot with passive ventilation. Choose an emission factor that fits this situation from those listed Table 3-1 such as 0.888 g/day x AU. The study from which the emission factor was taken considers 1 feeder cow to equal 1 animal unit. Assume 1 pound equals 454 grams.
1,000 𝑓𝑒𝑒𝑑𝑒𝑟 𝑐𝑎𝑡𝑡𝑙𝑒 𝑥 1 𝐴𝑈
1 𝑓𝑒𝑒𝑑𝑒𝑟 𝑐𝑎𝑡𝑡𝑙𝑒𝑥
0.888 𝑔 𝐻2𝑆
𝑑𝑎𝑦 𝐴𝑈𝑥
𝑙𝑏 𝐻2𝑆
454 𝑔 𝐻2𝑆𝑥
1.96 𝑙𝑏𝑠 𝐻2𝑆
𝑑𝑎𝑦
Example #2 Estimate ammonia (NH3) emissions from poultry CAFO, with a size of approximately 20,000 broilers. Choose an emission factor that fits this situation from those listed in Table 3-2 such as 0.22 lb/year/head. Assume 1 broiler = 1 head.
20,000 ℎ𝑒𝑎𝑑 𝑥 0.22 𝑙𝑏 𝐴𝑚𝑚𝑜𝑛𝑖𝑎
𝑦𝑒𝑎𝑟 ℎ𝑒𝑎𝑑⁄𝑥
4,400 𝑙𝑏𝑠 𝐴𝑚𝑚𝑜𝑛𝑖𝑎
𝑦𝑒𝑎𝑟𝑥
𝑦𝑒𝑎𝑟
365 𝑑𝑎𝑦𝑠𝑥
12 𝑙𝑏𝑠 𝑁𝐻3
𝑑𝑎𝑦
16
3.6 Emission Factor Use Emission factors can be used in emissions inventories and atmospheric dispersion modeling analyses. Inventories provide a method of tracking emission trends over time. Inventories are created by applying emission factors to a set of activity data or production data for a certain time period. Atmospheric dispersion models are routinely used to estimate the ground level concentration of pollutants emitted into the atmosphere. These models use mathematical representations of physical and chemical atmospheric processes in combination with characterization of air pollutant emissions to simulate the transport and diffusion of pollutants from a source of release. Emission factors are used to estimate the rate that a substance is released into the atmosphere from a source. The Dispersion Modeling workgroup recommends application of the American Meteorological Society / Environmental Protection Agency Regulatory Model (AERMOD)2 for estimation of odor, hydrogen sulfide and ammonia concentrations from AFOs. To read more about their recommendations, please refer to Chapter 4.0 of this report.
3.7 Conclusion The emission factors in Tables 3-1 through 3-4 are reported by the workgroup with the intent of providing the public with one centralized location to find emission factors that may be used to estimate emissions from AFOs. Users should consider the animal type, housing type, any geographic or seasonal information, and whether the data was peer-reviewed or not. When evaluating emission factors from other countries, users should also consider how the feeding and housing practices in that country differ from those in Iowa. Finally, users should note that using an emission factor to calculate emissions results in an estimation of pollution over a certain amount of time (hour, day, and year). It will not provide the concentration of a pollutant in the ambient air.
2 http://www.epa.gov/scram001/7thconf/aermod/aermodug.pdf
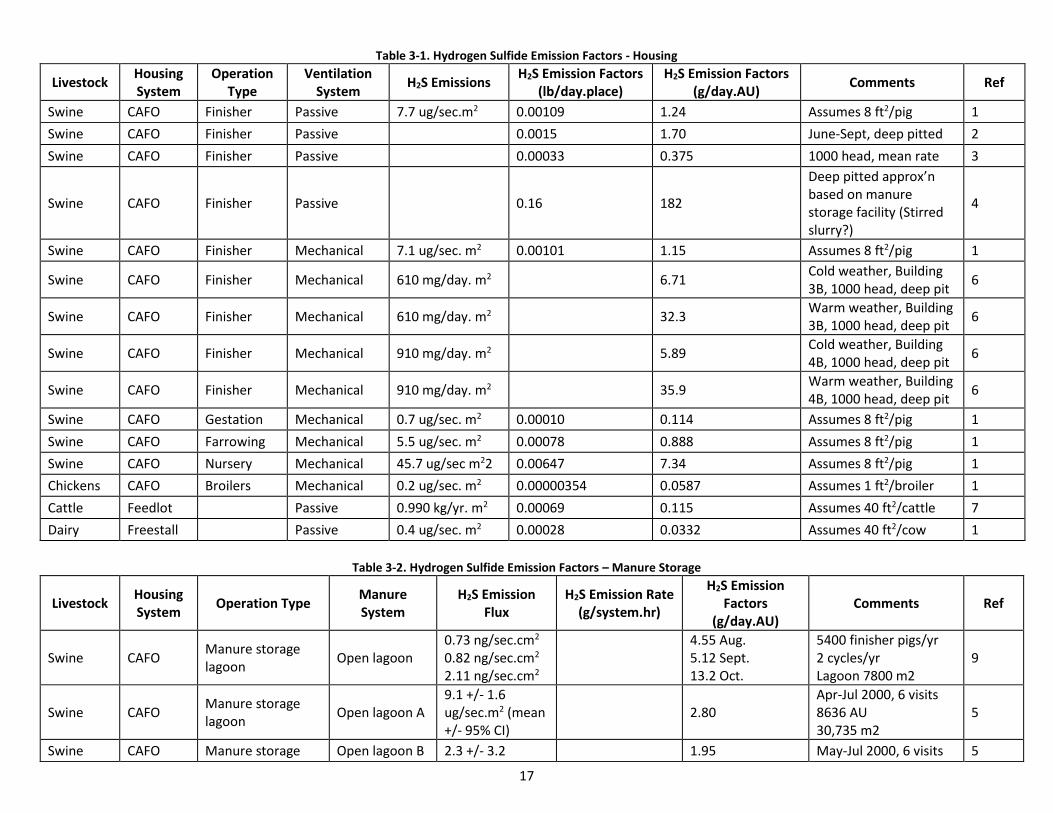
17
Table 3-1. Hydrogen Sulfide Emission Factors - Housing
Livestock Housing System
Operation Type
Ventilation System
H2S Emissions H2S Emission Factors
(lb/day.place) H2S Emission Factors
(g/day.AU) Comments Ref
Swine CAFO Finisher Passive 7.7 ug/sec.m2 0.00109 1.24 Assumes 8 ft2/pig 1
Swine CAFO Finisher Passive 0.0015 1.70 June-Sept, deep pitted 2
Swine CAFO Finisher Passive 0.00033 0.375 1000 head, mean rate 3
Swine CAFO Finisher Passive 0.16 182
Deep pitted approx’n based on manure storage facility (Stirred slurry?)
4
Swine CAFO Finisher Mechanical 7.1 ug/sec. m2 0.00101 1.15 Assumes 8 ft2/pig 1
Swine CAFO Finisher Mechanical 610 mg/day. m2 6.71 Cold weather, Building 3B, 1000 head, deep pit
6
Swine CAFO Finisher Mechanical 610 mg/day. m2 32.3 Warm weather, Building 3B, 1000 head, deep pit
6
Swine CAFO Finisher Mechanical 910 mg/day. m2 5.89 Cold weather, Building 4B, 1000 head, deep pit
6
Swine CAFO Finisher Mechanical 910 mg/day. m2 35.9 Warm weather, Building 4B, 1000 head, deep pit
6
Swine CAFO Gestation Mechanical 0.7 ug/sec. m2 0.00010 0.114 Assumes 8 ft2/pig 1
Swine CAFO Farrowing Mechanical 5.5 ug/sec. m2 0.00078 0.888 Assumes 8 ft2/pig 1
Swine CAFO Nursery Mechanical 45.7 ug/sec m22 0.00647 7.34 Assumes 8 ft2/pig 1
Chickens CAFO Broilers Mechanical 0.2 ug/sec. m2 0.00000354 0.0587 Assumes 1 ft2/broiler 1
Cattle Feedlot Passive 0.990 kg/yr. m2 0.00069 0.115 Assumes 40 ft2/cattle 7
Dairy Freestall Passive 0.4 ug/sec. m2 0.00028 0.0332 Assumes 40 ft2/cow 1
Table 3-2. Hydrogen Sulfide Emission Factors – Manure Storage
Livestock Housing System
Operation Type Manure System
H2S Emission Flux
H2S Emission Rate (g/system.hr)
H2S Emission Factors
(g/day.AU) Comments Ref
Swine CAFO Manure storage lagoon
Open lagoon 0.73 ng/sec.cm2
0.82 ng/sec.cm2
2.11 ng/sec.cm2
4.55 Aug. 5.12 Sept. 13.2 Oct.
5400 finisher pigs/yr 2 cycles/yr Lagoon 7800 m2
9
Swine CAFO Manure storage lagoon
Open lagoon A 9.1 +/- 1.6 ug/sec.m2 (mean +/- 95% CI)
2.80 Apr-Jul 2000, 6 visits 8636 AU 30,735 m2
5
Swine CAFO Manure storage Open lagoon B 2.3 +/- 3.2 1.95 May-Jul 2000, 6 visits 5

18
Livestock Housing System
Operation Type Manure System
H2S Emission Flux
H2S Emission Rate (g/system.hr)
H2S Emission Factors
(g/day.AU) Comments Ref
lagoon ug/sec. m2 (mean +/- 95% CI)
1252 AU 12,310 m2
Swine CAFO Feeder to finisher, mechanically ventilated
Deep pit, under-slat, short term or long term
0.37 ng/sec.cm2 5.9 (0.052) 13,680 pigs/yr 8
Swine CAFO Farrow to finisher, Manure Storage
Earthen concrete, or metal-lined storage basins
1.10 ng/sec.cm2 12.5 (0.183) 8,200 pigs/yr 8
Swine CAFO Feeder to finisher, Manure Storage
Lagoon, without anoxic photosynthetic blooms
0.32 ng/sec. cm2 22.7 (0.192) 14,170 pigs/yr 8
Swine CAFO Farrow to feeder, Manure Storage
Lagoon, with anoxic photosynthetic blooms
0.24 ng/sec. cm2 16.9 (0.110) 18,500 pigs/yr 8
Animal Units (AU) Tables 3-1 and 3-2 assume 2.5 swine > 25 kg = 1 AU, 1 feeder cattle = 1 AU. 1 dairy cow = 1.4 AU, 100 Broilers = 1 AU References for Tables 3-1 and 3-2 1. Zhu J, Jacobson LD, Nicolai R, Schmidt D. 1998. Unpublished data, University of Minnesota, Dept. of Biosystems and Agricultural Engineering. 2. Ni J, Lim TT, Heber AJ, et al. 1998. Ammonia emission from a large mechanically ventilated swine building during warm weather, St. Joseph, MI. ASAE Paper
No. 98-4051. 3. Heber AJ, Duggirala RK, Ni J. et al. 1997. Manure treatment to reduce gas emissions from large swine houses. In Voermans JAM, Monteny G, eds. Procs.
Intern. Symp. On Ammonia and Odor Control from Animal Production Facilities, Vinkeloord, The Netherlands, Rosmalen, The Netherlands, NVTL 2, pg 449-457.
4. Hobbs PJ, Misselbrook TH, Cumby TR. 1999. Production of emission of odors and gases from ageing pig waste J Ag Engr Research 72(3):291- 198. 5. Lim TT, Heber AJ, Ni J-Q, Sutton AL, Shao P. 2003. Odor and gas release from anaerobic treatment lagoons for swine manure. J Environ Qual 32:406-416. 6. Ni J, Heber AJ, Lim TT, et al. 1999. Continuous measurement of hydrogen sulfide emission from two large swine finishing buildings. ASAE Paper No. 99-4132. 7. Baek, B, Koziel J, Kiehl L, Spinhirne J, Cole N. 2003. Integrated management regimens that minimize environmental impact of livestock manure. Proc ASAE,
2003. 8. Zahn JA, Hatfield JL, Laird DA, Hart TT, Do YS, DiSpirito AA. 2001. Functional classification of swine manure management systems based on effluent and gas
emission characteristics. J Environ Qual 30:635-647.
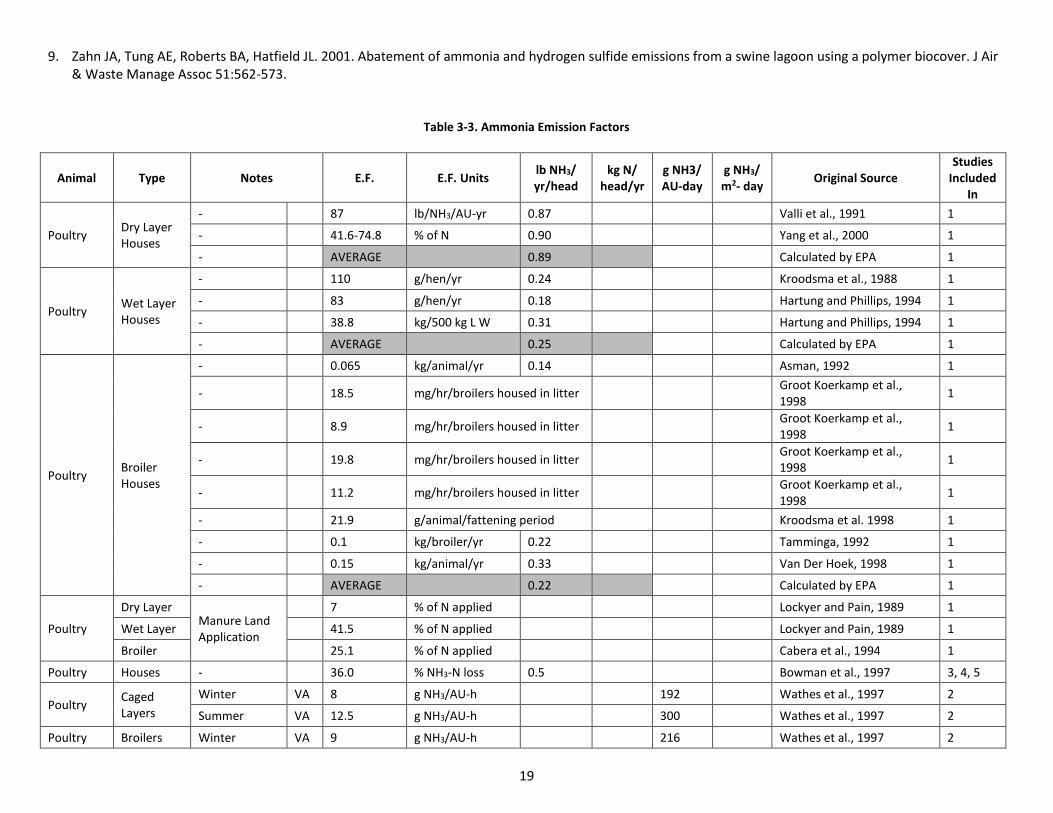
19
9. Zahn JA, Tung AE, Roberts BA, Hatfield JL. 2001. Abatement of ammonia and hydrogen sulfide emissions from a swine lagoon using a polymer biocover. J Air & Waste Manage Assoc 51:562-573.
Table 3-3. Ammonia Emission Factors
Animal Type Notes E.F. E.F. Units lb NH3/ yr/head
kg N/ head/yr
g NH3/ AU-day
g NH3/ m2- day
Original Source Studies
Included In
Poultry Dry Layer Houses
- 87 lb/NH3/AU-yr 0.87 Valli et al., 1991 1
- 41.6-74.8 % of N 0.90 Yang et al., 2000 1
- AVERAGE 0.89 Calculated by EPA 1
Poultry Wet Layer Houses
- 110 g/hen/yr 0.24 Kroodsma et al., 1988 1
- 83 g/hen/yr 0.18 Hartung and Phillips, 1994 1
- 38.8 kg/500 kg L W 0.31 Hartung and Phillips, 1994 1
- AVERAGE 0.25 Calculated by EPA 1
Poultry Broiler Houses
- 0.065 kg/animal/yr 0.14 Asman, 1992 1
- 18.5 mg/hr/broilers housed in litter Groot Koerkamp et al., 1998
1
- 8.9 mg/hr/broilers housed in litter Groot Koerkamp et al., 1998
1
- 19.8 mg/hr/broilers housed in litter Groot Koerkamp et al., 1998
1
- 11.2 mg/hr/broilers housed in litter Groot Koerkamp et al., 1998
1
- 21.9 g/animal/fattening period Kroodsma et al. 1998 1
- 0.1 kg/broiler/yr 0.22 Tamminga, 1992 1
- 0.15 kg/animal/yr 0.33 Van Der Hoek, 1998 1
- AVERAGE 0.22 Calculated by EPA 1
Poultry
Dry Layer Manure Land Application
7 % of N applied Lockyer and Pain, 1989 1
Wet Layer 41.5 % of N applied Lockyer and Pain, 1989 1
Broiler 25.1 % of N applied Cabera et al., 1994 1
Poultry Houses - 36.0 % NH3-N loss 0.5 Bowman et al., 1997 3, 4, 5
Poultry Caged Layers
Winter VA 8 g NH3/AU-h 192 Wathes et al., 1997 2
Summer VA 12.5 g NH3/AU-h 300 Wathes et al., 1997 2
Poultry Broilers Winter VA 9 g NH3/AU-h 216 Wathes et al., 1997 2
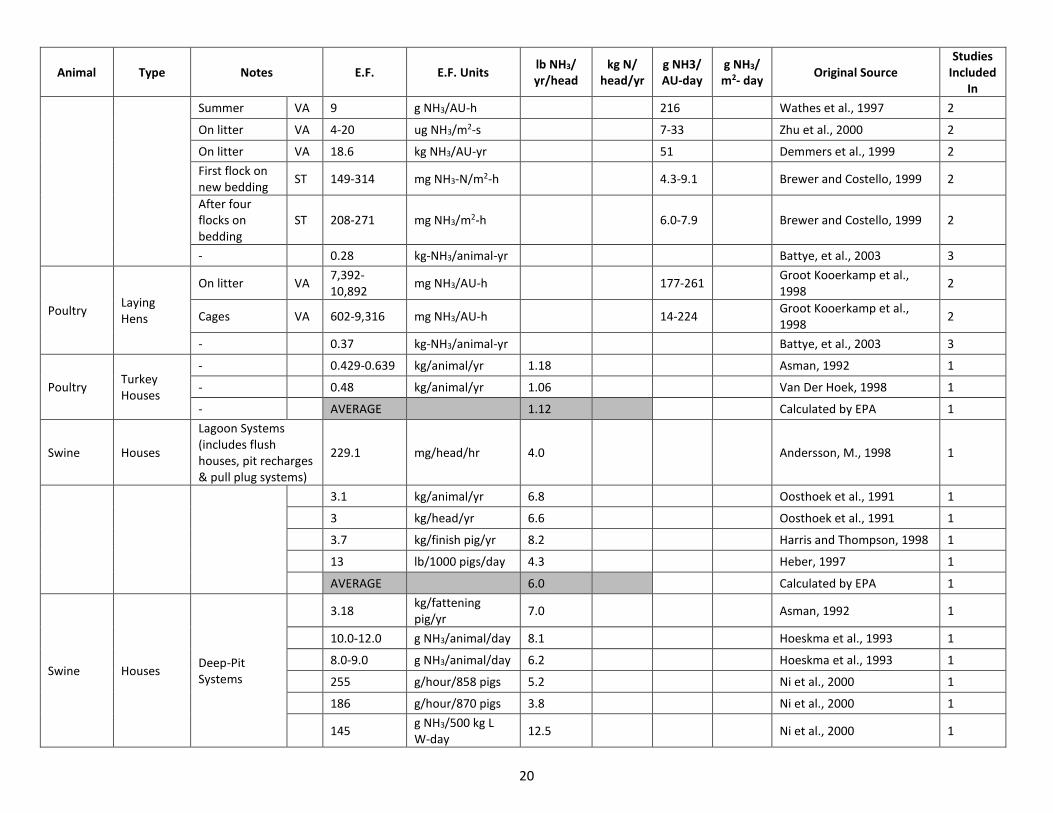
20
Animal Type Notes E.F. E.F. Units lb NH3/ yr/head
kg N/ head/yr
g NH3/ AU-day
g NH3/ m2- day
Original Source Studies
Included In
Summer VA 9 g NH3/AU-h 216 Wathes et al., 1997 2
On litter VA 4-20 ug NH3/m2-s 7-33 Zhu et al., 2000 2
On litter VA 18.6 kg NH3/AU-yr 51 Demmers et al., 1999 2
First flock on new bedding
ST 149-314 mg NH3-N/m2-h 4.3-9.1 Brewer and Costello, 1999 2
After four flocks on bedding
ST 208-271 mg NH3/m2-h 6.0-7.9 Brewer and Costello, 1999 2
- 0.28 kg-NH3/animal-yr Battye, et al., 2003 3
Poultry Laying Hens
On litter VA 7,392-10,892
mg NH3/AU-h 177-261 Groot Kooerkamp et al., 1998
2
Cages VA 602-9,316 mg NH3/AU-h 14-224 Groot Kooerkamp et al., 1998
2
- 0.37 kg-NH3/animal-yr Battye, et al., 2003 3
Poultry Turkey Houses
- 0.429-0.639 kg/animal/yr 1.18 Asman, 1992 1
- 0.48 kg/animal/yr 1.06 Van Der Hoek, 1998 1
- AVERAGE 1.12 Calculated by EPA 1
Swine Houses
Lagoon Systems (includes flush houses, pit recharges & pull plug systems)
229.1 mg/head/hr 4.0 Andersson, M., 1998 1
3.1 kg/animal/yr 6.8 Oosthoek et al., 1991 1
3 kg/head/yr 6.6 Oosthoek et al., 1991 1
3.7 kg/finish pig/yr 8.2 Harris and Thompson, 1998 1
13 lb/1000 pigs/day 4.3 Heber, 1997 1
AVERAGE 6.0 Calculated by EPA 1
Swine Houses Deep-Pit Systems
3.18 kg/fattening pig/yr
7.0 Asman, 1992 1
10.0-12.0 g NH3/animal/day 8.1 Hoeskma et al., 1993 1
8.0-9.0 g NH3/animal/day 6.2 Hoeskma et al., 1993 1
255 g/hour/858 pigs 5.2 Ni et al., 2000 1
186 g/hour/870 pigs 3.8 Ni et al., 2000 1
145 g NH3/500 kg L W-day
12.5 Ni et al., 2000 1
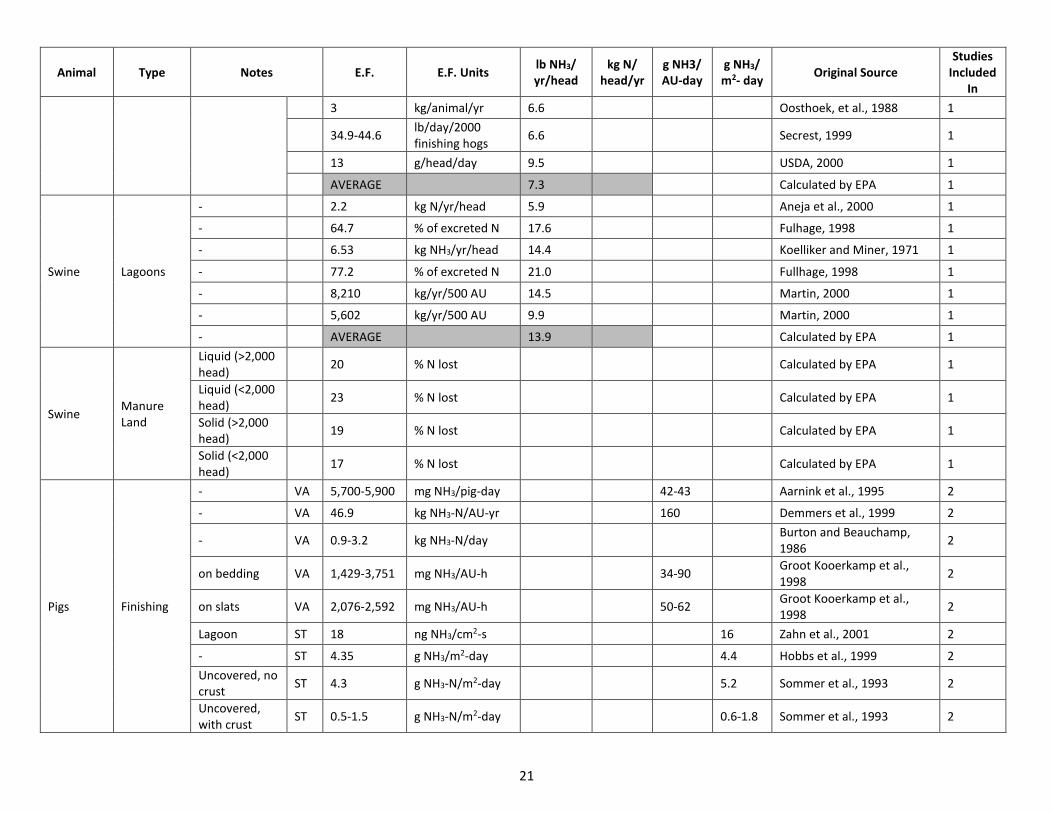
21
Animal Type Notes E.F. E.F. Units lb NH3/ yr/head
kg N/ head/yr
g NH3/ AU-day
g NH3/ m2- day
Original Source Studies
Included In
3 kg/animal/yr 6.6 Oosthoek, et al., 1988 1
34.9-44.6 lb/day/2000 finishing hogs
6.6 Secrest, 1999 1
13 g/head/day 9.5 USDA, 2000 1
AVERAGE 7.3 Calculated by EPA 1
Swine Lagoons
- 2.2 kg N/yr/head 5.9 Aneja et al., 2000 1
- 64.7 % of excreted N 17.6 Fulhage, 1998 1
- 6.53 kg NH3/yr/head 14.4 Koelliker and Miner, 1971 1
- 77.2 % of excreted N 21.0 Fullhage, 1998 1
- 8,210 kg/yr/500 AU 14.5 Martin, 2000 1
- 5,602 kg/yr/500 AU 9.9 Martin, 2000 1
- AVERAGE 13.9 Calculated by EPA 1
Swine Manure Land
Liquid (>2,000 head)
20 % N lost Calculated by EPA 1
Liquid (<2,000 head)
23 % N lost Calculated by EPA 1
Solid (>2,000 head)
19 % N lost Calculated by EPA 1
Solid (<2,000 head)
17 % N lost Calculated by EPA 1
Pigs Finishing
- VA 5,700-5,900 mg NH3/pig-day 42-43 Aarnink et al., 1995 2
- VA 46.9 kg NH3-N/AU-yr 160 Demmers et al., 1999 2
- VA 0.9-3.2 kg NH3-N/day Burton and Beauchamp, 1986
2
on bedding VA 1,429-3,751 mg NH3/AU-h 34-90 Groot Kooerkamp et al., 1998
2
on slats VA 2,076-2,592 mg NH3/AU-h 50-62 Groot Kooerkamp et al., 1998
2
Lagoon ST 18 ng NH3/cm2-s 16 Zahn et al., 2001 2
- ST 4.35 g NH3/m2-day 4.4 Hobbs et al., 1999 2
Uncovered, no crust
ST 4.3 g NH3-N/m2-day 5.2 Sommer et al., 1993 2
Uncovered, with crust
ST 0.5-1.5 g NH3-N/m2-day 0.6-1.8 Sommer et al., 1993 2
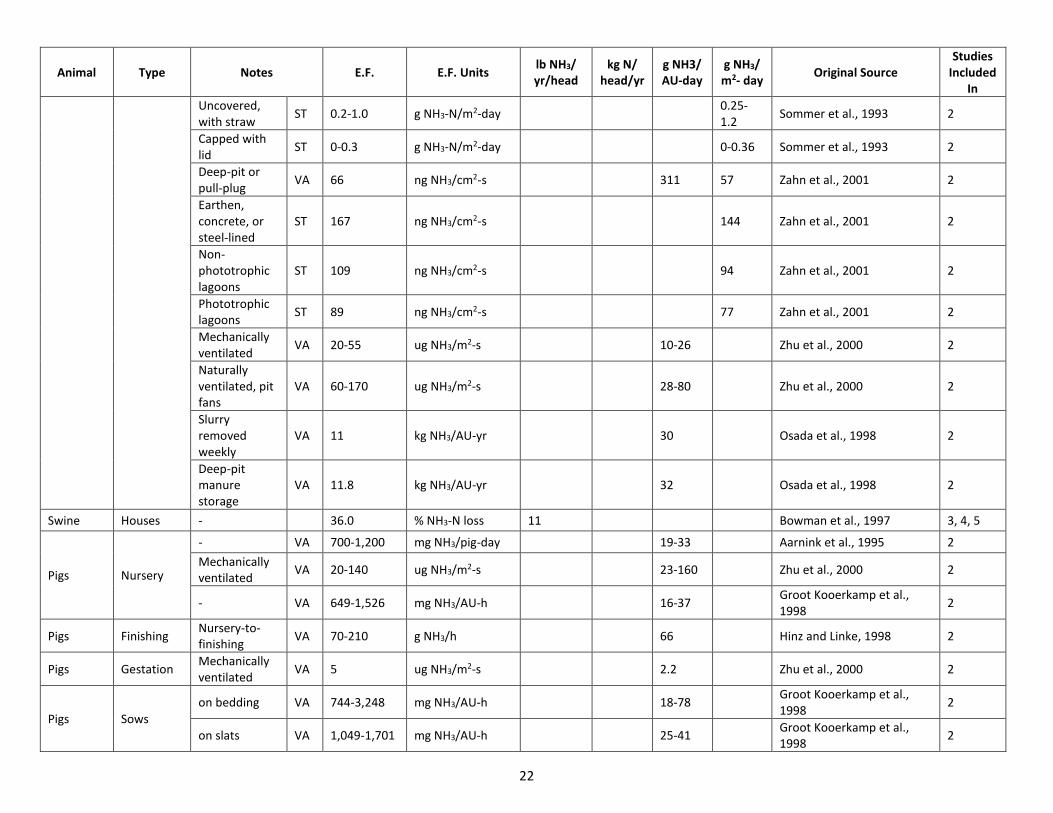
22
Animal Type Notes E.F. E.F. Units lb NH3/ yr/head
kg N/ head/yr
g NH3/ AU-day
g NH3/ m2- day
Original Source Studies
Included In
Uncovered, with straw
ST 0.2-1.0 g NH3-N/m2-day 0.25-1.2
Sommer et al., 1993 2
Capped with lid
ST 0-0.3 g NH3-N/m2-day 0-0.36 Sommer et al., 1993 2
Deep-pit or pull-plug
VA 66 ng NH3/cm2-s 311 57 Zahn et al., 2001 2
Earthen, concrete, or steel-lined
ST 167 ng NH3/cm2-s 144 Zahn et al., 2001 2
Non-phototrophic lagoons
ST 109 ng NH3/cm2-s 94 Zahn et al., 2001 2
Phototrophic lagoons
ST 89 ng NH3/cm2-s 77 Zahn et al., 2001 2
Mechanically ventilated
VA 20-55 ug NH3/m2-s 10-26 Zhu et al., 2000 2
Naturally ventilated, pit fans
VA 60-170 ug NH3/m2-s 28-80 Zhu et al., 2000 2
Slurry removed weekly
VA 11 kg NH3/AU-yr 30 Osada et al., 1998 2
Deep-pit manure storage
VA 11.8 kg NH3/AU-yr 32 Osada et al., 1998 2
Swine Houses - 36.0 % NH3-N loss 11 Bowman et al., 1997 3, 4, 5
Pigs Nursery
- VA 700-1,200 mg NH3/pig-day 19-33 Aarnink et al., 1995 2
Mechanically ventilated
VA 20-140 ug NH3/m2-s 23-160 Zhu et al., 2000 2
- VA 649-1,526 mg NH3/AU-h 16-37 Groot Kooerkamp et al., 1998
2
Pigs Finishing Nursery-to-finishing
VA 70-210 g NH3/h 66 Hinz and Linke, 1998 2
Pigs Gestation Mechanically ventilated
VA 5 ug NH3/m2-s 2.2 Zhu et al., 2000 2
Pigs Sows
on bedding VA 744-3,248 mg NH3/AU-h 18-78 Groot Kooerkamp et al., 1998
2
on slats VA 1,049-1,701 mg NH3/AU-h 25-41 Groot Kooerkamp et al., 1998
2
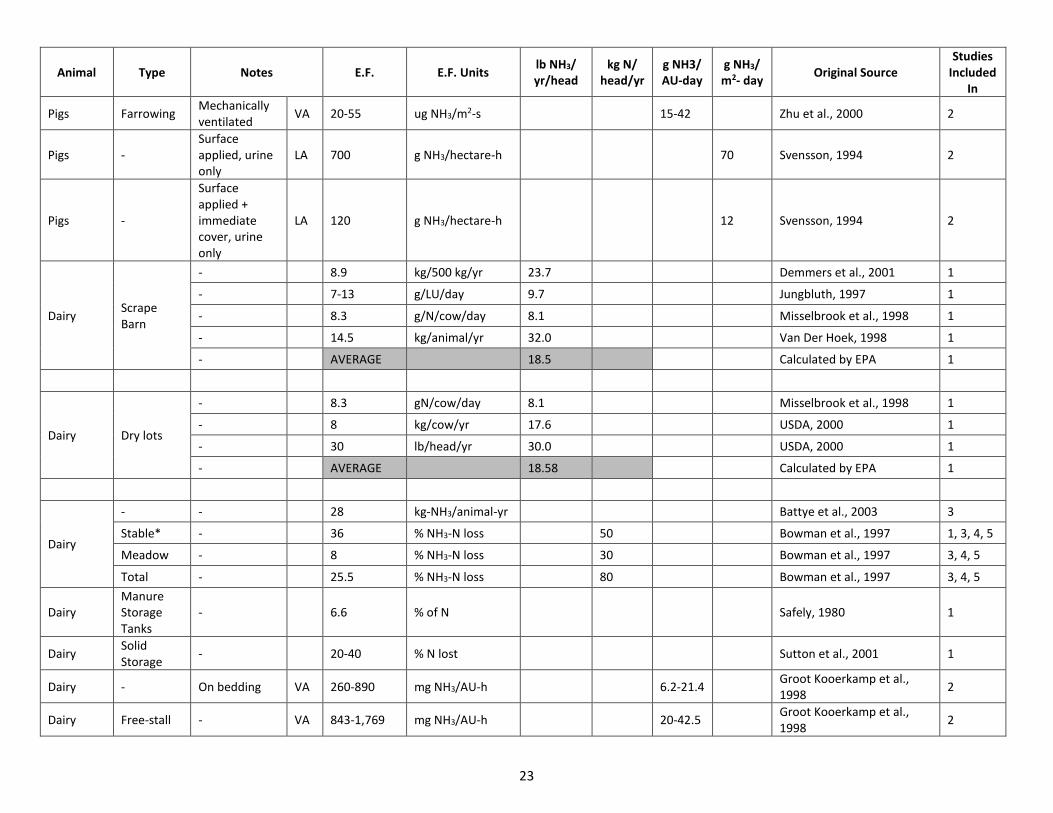
23
Animal Type Notes E.F. E.F. Units lb NH3/ yr/head
kg N/ head/yr
g NH3/ AU-day
g NH3/ m2- day
Original Source Studies
Included In
Pigs Farrowing Mechanically ventilated
VA 20-55 ug NH3/m2-s 15-42 Zhu et al., 2000 2
Pigs - Surface applied, urine only
LA 700 g NH3/hectare-h 70 Svensson, 1994 2
Pigs -
Surface applied + immediate cover, urine only
LA 120 g NH3/hectare-h 12 Svensson, 1994 2
Dairy Scrape Barn
- 8.9 kg/500 kg/yr 23.7 Demmers et al., 2001 1
- 7-13 g/LU/day 9.7 Jungbluth, 1997 1
- 8.3 g/N/cow/day 8.1 Misselbrook et al., 1998 1
- 14.5 kg/animal/yr 32.0 Van Der Hoek, 1998 1
- AVERAGE 18.5 Calculated by EPA 1
Dairy Dry lots
- 8.3 gN/cow/day 8.1 Misselbrook et al., 1998 1
- 8 kg/cow/yr 17.6 USDA, 2000 1
- 30 lb/head/yr 30.0 USDA, 2000 1
- AVERAGE 18.58 Calculated by EPA 1
Dairy
- - 28 kg-NH3/animal-yr Battye et al., 2003 3
Stable* - 36 % NH3-N loss 50 Bowman et al., 1997 1, 3, 4, 5
Meadow - 8 % NH3-N loss 30 Bowman et al., 1997 3, 4, 5
Total - 25.5 % NH3-N loss 80 Bowman et al., 1997 3, 4, 5
Dairy Manure Storage Tanks
- 6.6 % of N Safely, 1980 1
Dairy Solid Storage
- 20-40 % N lost Sutton et al., 2001 1
Dairy - On bedding VA 260-890 mg NH3/AU-h 6.2-21.4 Groot Kooerkamp et al., 1998
2
Dairy Free-stall - VA 843-1,769 mg NH3/AU-h 20-42.5 Groot Kooerkamp et al., 1998
2
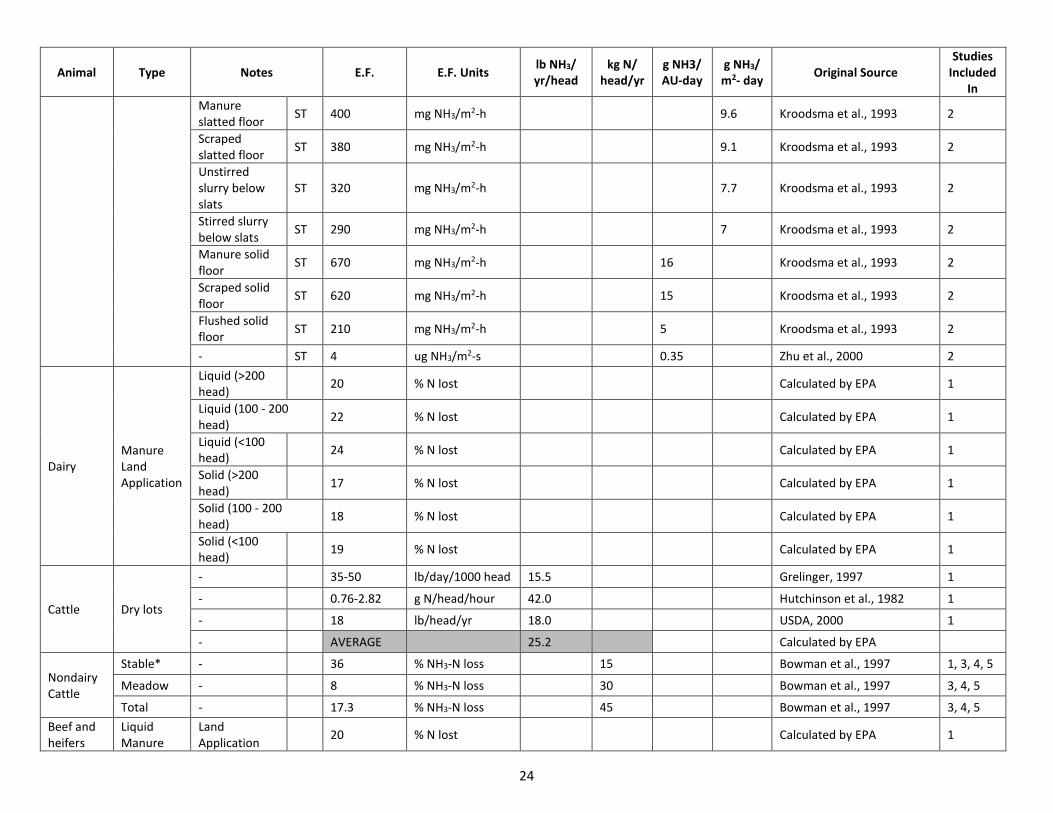
24
Animal Type Notes E.F. E.F. Units lb NH3/ yr/head
kg N/ head/yr
g NH3/ AU-day
g NH3/ m2- day
Original Source Studies
Included In
Manure slatted floor
ST 400 mg NH3/m2-h 9.6 Kroodsma et al., 1993 2
Scraped slatted floor
ST 380 mg NH3/m2-h 9.1 Kroodsma et al., 1993 2
Unstirred slurry below slats
ST 320 mg NH3/m2-h 7.7 Kroodsma et al., 1993 2
Stirred slurry below slats
ST 290 mg NH3/m2-h 7 Kroodsma et al., 1993 2
Manure solid floor
ST 670 mg NH3/m2-h 16 Kroodsma et al., 1993 2
Scraped solid floor
ST 620 mg NH3/m2-h 15 Kroodsma et al., 1993 2
Flushed solid floor
ST 210 mg NH3/m2-h 5 Kroodsma et al., 1993 2
- ST 4 ug NH3/m2-s 0.35 Zhu et al., 2000 2
Dairy Manure Land Application
Liquid (>200 head)
20 % N lost Calculated by EPA 1
Liquid (100 - 200 head)
22 % N lost Calculated by EPA 1
Liquid (<100 head)
24 % N lost Calculated by EPA 1
Solid (>200 head)
17 % N lost Calculated by EPA 1
Solid (100 - 200 head)
18 % N lost Calculated by EPA 1
Solid (<100 head)
19 % N lost Calculated by EPA 1
Cattle Dry lots
- 35-50 lb/day/1000 head 15.5 Grelinger, 1997 1
- 0.76-2.82 g N/head/hour 42.0 Hutchinson et al., 1982 1
- 18 lb/head/yr 18.0 USDA, 2000 1
- AVERAGE 25.2 Calculated by EPA
Nondairy Cattle
Stable* - 36 % NH3-N loss 15 Bowman et al., 1997 1, 3, 4, 5
Meadow - 8 % NH3-N loss 30 Bowman et al., 1997 3, 4, 5
Total - 17.3 % NH3-N loss 45 Bowman et al., 1997 3, 4, 5
Beef and heifers
Liquid Manure
Land Application
20 % N lost Calculated by EPA 1
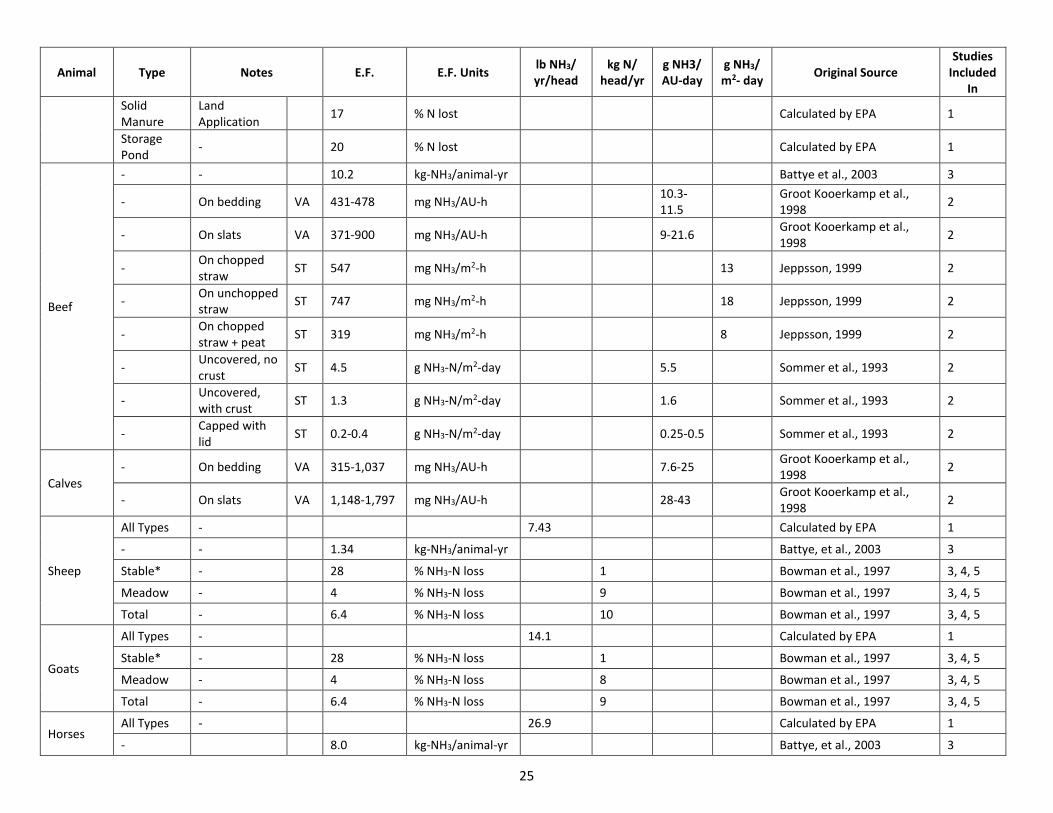
25
Animal Type Notes E.F. E.F. Units lb NH3/ yr/head
kg N/ head/yr
g NH3/ AU-day
g NH3/ m2- day
Original Source Studies
Included In
Solid Manure
Land Application
17 % N lost Calculated by EPA 1
Storage Pond
- 20 % N lost Calculated by EPA 1
Beef
- - 10.2 kg-NH3/animal-yr Battye et al., 2003 3
- On bedding VA 431-478 mg NH3/AU-h 10.3-11.5
Groot Kooerkamp et al., 1998
2
- On slats VA 371-900 mg NH3/AU-h 9-21.6 Groot Kooerkamp et al., 1998
2
- On chopped straw
ST 547 mg NH3/m2-h 13 Jeppsson, 1999 2
- On unchopped straw
ST 747 mg NH3/m2-h 18 Jeppsson, 1999 2
- On chopped straw + peat
ST 319 mg NH3/m2-h 8 Jeppsson, 1999 2
- Uncovered, no crust
ST 4.5 g NH3-N/m2-day 5.5 Sommer et al., 1993 2
- Uncovered, with crust
ST 1.3 g NH3-N/m2-day 1.6 Sommer et al., 1993 2
- Capped with lid
ST 0.2-0.4 g NH3-N/m2-day 0.25-0.5 Sommer et al., 1993 2
Calves - On bedding VA 315-1,037 mg NH3/AU-h 7.6-25
Groot Kooerkamp et al., 1998
2
- On slats VA 1,148-1,797 mg NH3/AU-h 28-43 Groot Kooerkamp et al., 1998
2
Sheep
All Types - 7.43 Calculated by EPA 1
- - 1.34 kg-NH3/animal-yr Battye, et al., 2003 3
Stable* - 28 % NH3-N loss 1 Bowman et al., 1997 3, 4, 5
Meadow - 4 % NH3-N loss 9 Bowman et al., 1997 3, 4, 5
Total - 6.4 % NH3-N loss 10 Bowman et al., 1997 3, 4, 5
Goats
All Types - 14.1 Calculated by EPA 1
Stable* - 28 % NH3-N loss 1 Bowman et al., 1997 3, 4, 5
Meadow - 4 % NH3-N loss 8 Bowman et al., 1997 3, 4, 5
Total - 6.4 % NH3-N loss 9 Bowman et al., 1997 3, 4, 5
Horses All Types - 26.9 Calculated by EPA 1
- 8.0 kg-NH3/animal-yr Battye, et al., 2003 3
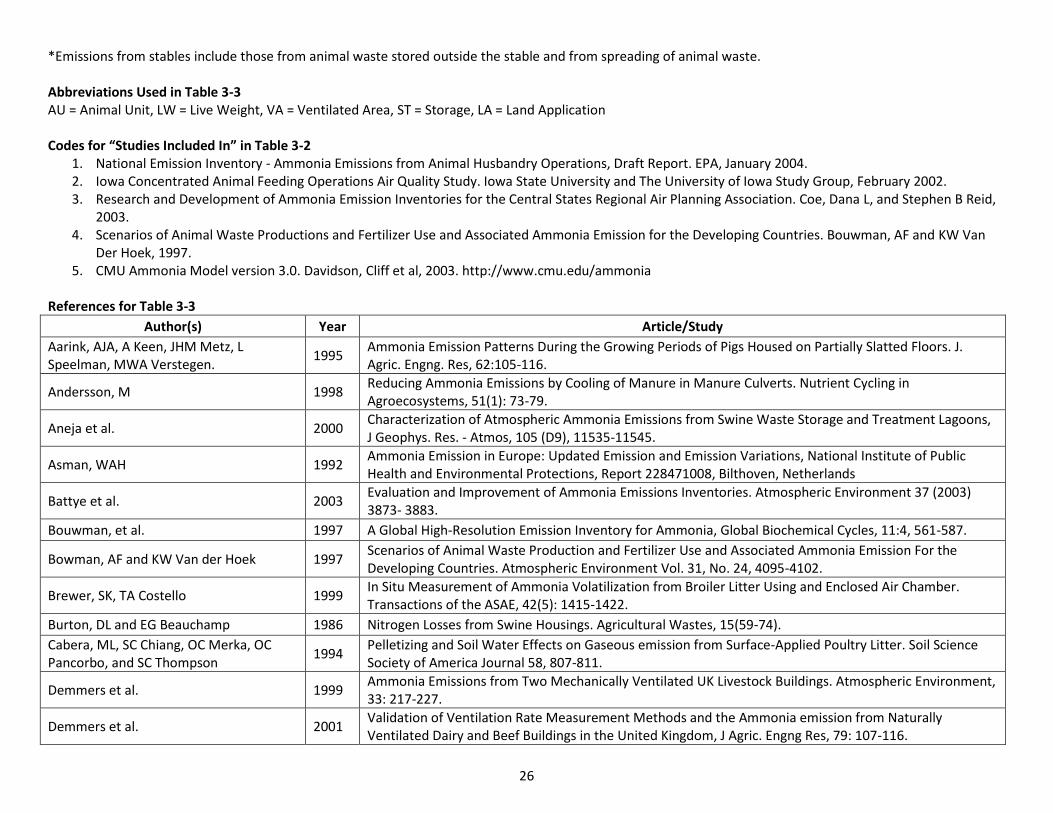
26
*Emissions from stables include those from animal waste stored outside the stable and from spreading of animal waste. Abbreviations Used in Table 3-3 AU = Animal Unit, LW = Live Weight, VA = Ventilated Area, ST = Storage, LA = Land Application Codes for “Studies Included In” in Table 3-2
1. National Emission Inventory - Ammonia Emissions from Animal Husbandry Operations, Draft Report. EPA, January 2004. 2. Iowa Concentrated Animal Feeding Operations Air Quality Study. Iowa State University and The University of Iowa Study Group, February 2002. 3. Research and Development of Ammonia Emission Inventories for the Central States Regional Air Planning Association. Coe, Dana L, and Stephen B Reid,
2003. 4. Scenarios of Animal Waste Productions and Fertilizer Use and Associated Ammonia Emission for the Developing Countries. Bouwman, AF and KW Van
Der Hoek, 1997. 5. CMU Ammonia Model version 3.0. Davidson, Cliff et al, 2003. http://www.cmu.edu/ammonia
References for Table 3-3
Author(s) Year Article/Study
Aarink, AJA, A Keen, JHM Metz, L Speelman, MWA Verstegen.
1995 Ammonia Emission Patterns During the Growing Periods of Pigs Housed on Partially Slatted Floors. J. Agric. Engng. Res, 62:105-116.
Andersson, M 1998 Reducing Ammonia Emissions by Cooling of Manure in Manure Culverts. Nutrient Cycling in Agroecosystems, 51(1): 73-79.
Aneja et al. 2000 Characterization of Atmospheric Ammonia Emissions from Swine Waste Storage and Treatment Lagoons, J Geophys. Res. - Atmos, 105 (D9), 11535-11545.
Asman, WAH 1992 Ammonia Emission in Europe: Updated Emission and Emission Variations, National Institute of Public Health and Environmental Protections, Report 228471008, Bilthoven, Netherlands
Battye et al. 2003 Evaluation and Improvement of Ammonia Emissions Inventories. Atmospheric Environment 37 (2003) 3873- 3883.
Bouwman, et al. 1997 A Global High-Resolution Emission Inventory for Ammonia, Global Biochemical Cycles, 11:4, 561-587.
Bowman, AF and KW Van der Hoek 1997 Scenarios of Animal Waste Production and Fertilizer Use and Associated Ammonia Emission For the Developing Countries. Atmospheric Environment Vol. 31, No. 24, 4095-4102.
Brewer, SK, TA Costello 1999 In Situ Measurement of Ammonia Volatilization from Broiler Litter Using and Enclosed Air Chamber. Transactions of the ASAE, 42(5): 1415-1422.
Burton, DL and EG Beauchamp 1986 Nitrogen Losses from Swine Housings. Agricultural Wastes, 15(59-74).
Cabera, ML, SC Chiang, OC Merka, OC Pancorbo, and SC Thompson
1994 Pelletizing and Soil Water Effects on Gaseous emission from Surface-Applied Poultry Litter. Soil Science Society of America Journal 58, 807-811.
Demmers et al. 1999 Ammonia Emissions from Two Mechanically Ventilated UK Livestock Buildings. Atmospheric Environment, 33: 217-227.
Demmers et al. 2001 Validation of Ventilation Rate Measurement Methods and the Ammonia emission from Naturally Ventilated Dairy and Beef Buildings in the United Kingdom, J Agric. Engng Res, 79: 107-116.
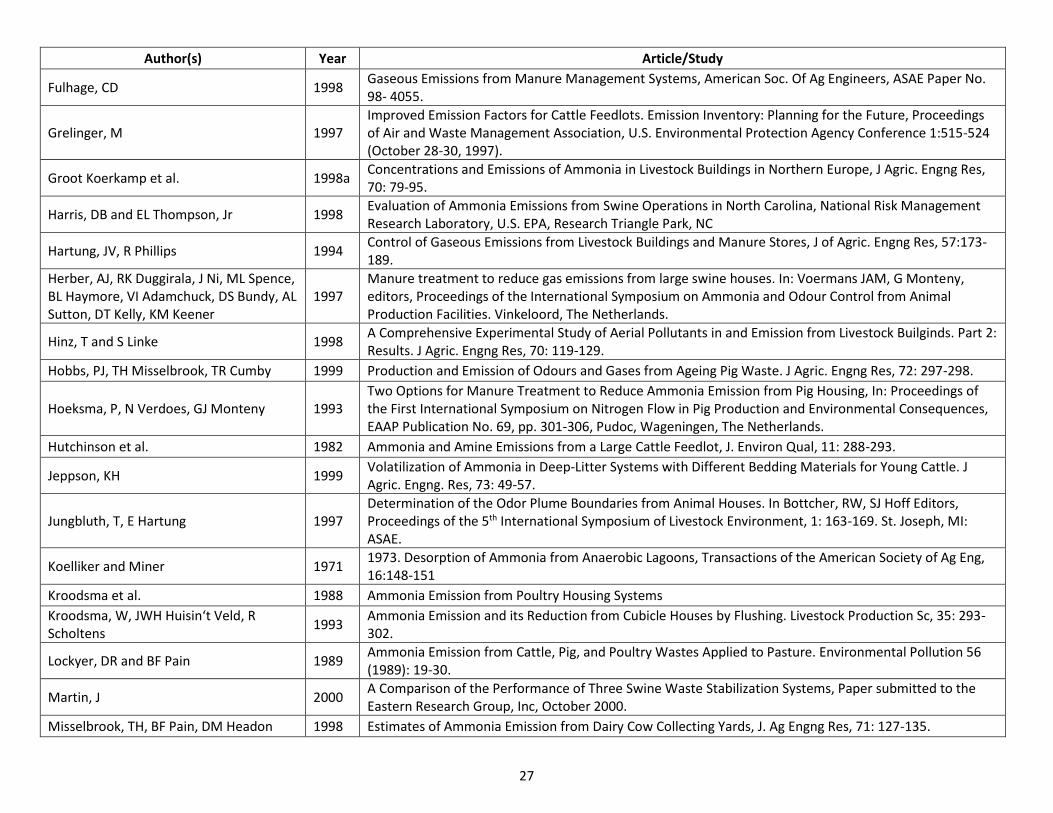
27
Author(s) Year Article/Study
Fulhage, CD 1998 Gaseous Emissions from Manure Management Systems, American Soc. Of Ag Engineers, ASAE Paper No. 98- 4055.
Grelinger, M 1997 Improved Emission Factors for Cattle Feedlots. Emission Inventory: Planning for the Future, Proceedings of Air and Waste Management Association, U.S. Environmental Protection Agency Conference 1:515-524 (October 28-30, 1997).
Groot Koerkamp et al. 1998a Concentrations and Emissions of Ammonia in Livestock Buildings in Northern Europe, J Agric. Engng Res, 70: 79-95.
Harris, DB and EL Thompson, Jr 1998 Evaluation of Ammonia Emissions from Swine Operations in North Carolina, National Risk Management Research Laboratory, U.S. EPA, Research Triangle Park, NC
Hartung, JV, R Phillips 1994 Control of Gaseous Emissions from Livestock Buildings and Manure Stores, J of Agric. Engng Res, 57:173- 189.
Herber, AJ, RK Duggirala, J Ni, ML Spence, BL Haymore, VI Adamchuck, DS Bundy, AL Sutton, DT Kelly, KM Keener
1997 Manure treatment to reduce gas emissions from large swine houses. In: Voermans JAM, G Monteny, editors, Proceedings of the International Symposium on Ammonia and Odour Control from Animal Production Facilities. Vinkeloord, The Netherlands.
Hinz, T and S Linke 1998 A Comprehensive Experimental Study of Aerial Pollutants in and Emission from Livestock Builginds. Part 2: Results. J Agric. Engng Res, 70: 119-129.
Hobbs, PJ, TH Misselbrook, TR Cumby 1999 Production and Emission of Odours and Gases from Ageing Pig Waste. J Agric. Engng Res, 72: 297-298.
Hoeksma, P, N Verdoes, GJ Monteny 1993 Two Options for Manure Treatment to Reduce Ammonia Emission from Pig Housing, In: Proceedings of the First International Symposium on Nitrogen Flow in Pig Production and Environmental Consequences, EAAP Publication No. 69, pp. 301-306, Pudoc, Wageningen, The Netherlands.
Hutchinson et al. 1982 Ammonia and Amine Emissions from a Large Cattle Feedlot, J. Environ Qual, 11: 288-293.
Jeppson, KH 1999 Volatilization of Ammonia in Deep-Litter Systems with Different Bedding Materials for Young Cattle. J Agric. Engng. Res, 73: 49-57.
Jungbluth, T, E Hartung 1997 Determination of the Odor Plume Boundaries from Animal Houses. In Bottcher, RW, SJ Hoff Editors, Proceedings of the 5th International Symposium of Livestock Environment, 1: 163-169. St. Joseph, MI: ASAE.
Koelliker and Miner 1971 1973. Desorption of Ammonia from Anaerobic Lagoons, Transactions of the American Society of Ag Eng, 16:148-151
Kroodsma et al. 1988 Ammonia Emission from Poultry Housing Systems
Kroodsma, W, JWH Huisin‘t Veld, R Scholtens
1993 Ammonia Emission and its Reduction from Cubicle Houses by Flushing. Livestock Production Sc, 35: 293- 302.
Lockyer, DR and BF Pain 1989 Ammonia Emission from Cattle, Pig, and Poultry Wastes Applied to Pasture. Environmental Pollution 56 (1989): 19-30.
Martin, J 2000 A Comparison of the Performance of Three Swine Waste Stabilization Systems, Paper submitted to the Eastern Research Group, Inc, October 2000.
Misselbrook, TH, BF Pain, DM Headon 1998 Estimates of Ammonia Emission from Dairy Cow Collecting Yards, J. Ag Engng Res, 71: 127-135.
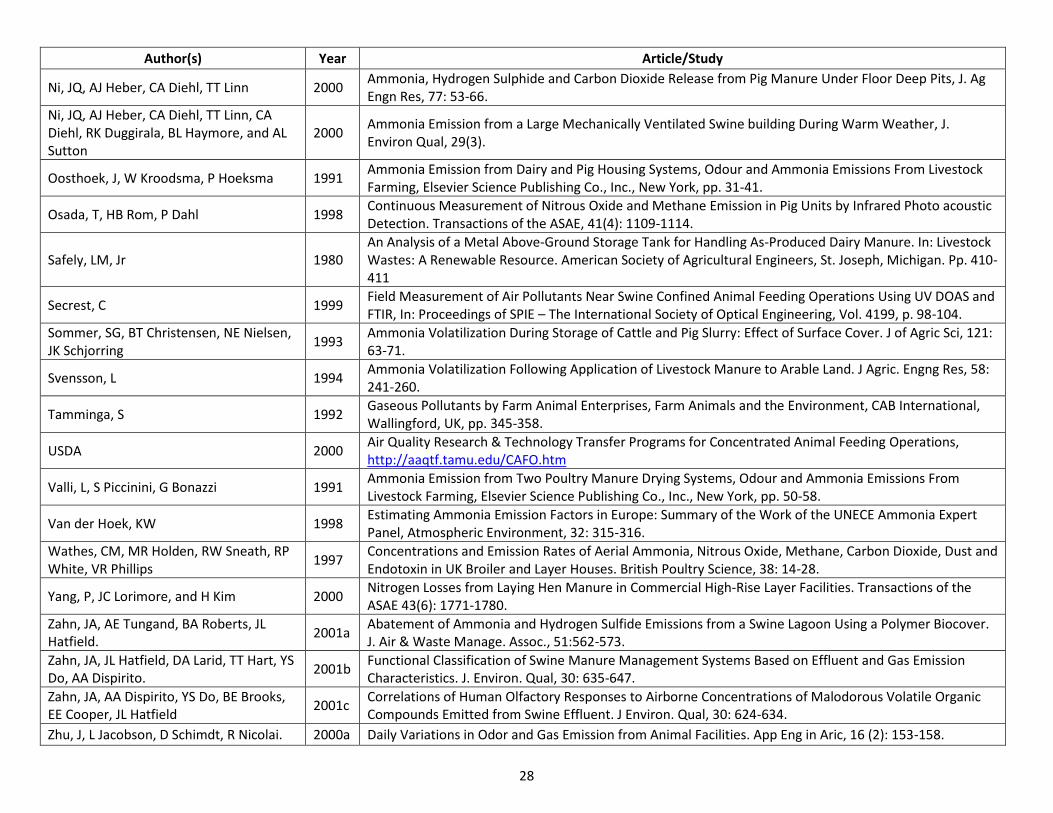
28
Author(s) Year Article/Study
Ni, JQ, AJ Heber, CA Diehl, TT Linn 2000 Ammonia, Hydrogen Sulphide and Carbon Dioxide Release from Pig Manure Under Floor Deep Pits, J. Ag Engn Res, 77: 53-66.
Ni, JQ, AJ Heber, CA Diehl, TT Linn, CA Diehl, RK Duggirala, BL Haymore, and AL Sutton
2000 Ammonia Emission from a Large Mechanically Ventilated Swine building During Warm Weather, J. Environ Qual, 29(3).
Oosthoek, J, W Kroodsma, P Hoeksma 1991 Ammonia Emission from Dairy and Pig Housing Systems, Odour and Ammonia Emissions From Livestock Farming, Elsevier Science Publishing Co., Inc., New York, pp. 31-41.
Osada, T, HB Rom, P Dahl 1998 Continuous Measurement of Nitrous Oxide and Methane Emission in Pig Units by Infrared Photo acoustic Detection. Transactions of the ASAE, 41(4): 1109-1114.
Safely, LM, Jr 1980 An Analysis of a Metal Above-Ground Storage Tank for Handling As-Produced Dairy Manure. In: Livestock Wastes: A Renewable Resource. American Society of Agricultural Engineers, St. Joseph, Michigan. Pp. 410- 411
Secrest, C 1999 Field Measurement of Air Pollutants Near Swine Confined Animal Feeding Operations Using UV DOAS and FTIR, In: Proceedings of SPIE – The International Society of Optical Engineering, Vol. 4199, p. 98-104.
Sommer, SG, BT Christensen, NE Nielsen, JK Schjorring
1993 Ammonia Volatilization During Storage of Cattle and Pig Slurry: Effect of Surface Cover. J of Agric Sci, 121: 63-71.
Svensson, L 1994 Ammonia Volatilization Following Application of Livestock Manure to Arable Land. J Agric. Engng Res, 58: 241-260.
Tamminga, S 1992 Gaseous Pollutants by Farm Animal Enterprises, Farm Animals and the Environment, CAB International, Wallingford, UK, pp. 345-358.
USDA 2000 Air Quality Research & Technology Transfer Programs for Concentrated Animal Feeding Operations, http://aaqtf.tamu.edu/CAFO.htm
Valli, L, S Piccinini, G Bonazzi 1991 Ammonia Emission from Two Poultry Manure Drying Systems, Odour and Ammonia Emissions From Livestock Farming, Elsevier Science Publishing Co., Inc., New York, pp. 50-58.
Van der Hoek, KW 1998 Estimating Ammonia Emission Factors in Europe: Summary of the Work of the UNECE Ammonia Expert Panel, Atmospheric Environment, 32: 315-316.
Wathes, CM, MR Holden, RW Sneath, RP White, VR Phillips
1997 Concentrations and Emission Rates of Aerial Ammonia, Nitrous Oxide, Methane, Carbon Dioxide, Dust and Endotoxin in UK Broiler and Layer Houses. British Poultry Science, 38: 14-28.
Yang, P, JC Lorimore, and H Kim 2000 Nitrogen Losses from Laying Hen Manure in Commercial High-Rise Layer Facilities. Transactions of the ASAE 43(6): 1771-1780.
Zahn, JA, AE Tungand, BA Roberts, JL Hatfield.
2001a Abatement of Ammonia and Hydrogen Sulfide Emissions from a Swine Lagoon Using a Polymer Biocover. J. Air & Waste Manage. Assoc., 51:562-573.
Zahn, JA, JL Hatfield, DA Larid, TT Hart, YS Do, AA Dispirito.
2001b Functional Classification of Swine Manure Management Systems Based on Effluent and Gas Emission Characteristics. J. Environ. Qual, 30: 635-647.
Zahn, JA, AA Dispirito, YS Do, BE Brooks, EE Cooper, JL Hatfield
2001c Correlations of Human Olfactory Responses to Airborne Concentrations of Malodorous Volatile Organic Compounds Emitted from Swine Effluent. J Environ. Qual, 30: 624-634.
Zhu, J, L Jacobson, D Schimdt, R Nicolai. 2000a Daily Variations in Odor and Gas Emission from Animal Facilities. App Eng in Aric, 16 (2): 153-158.
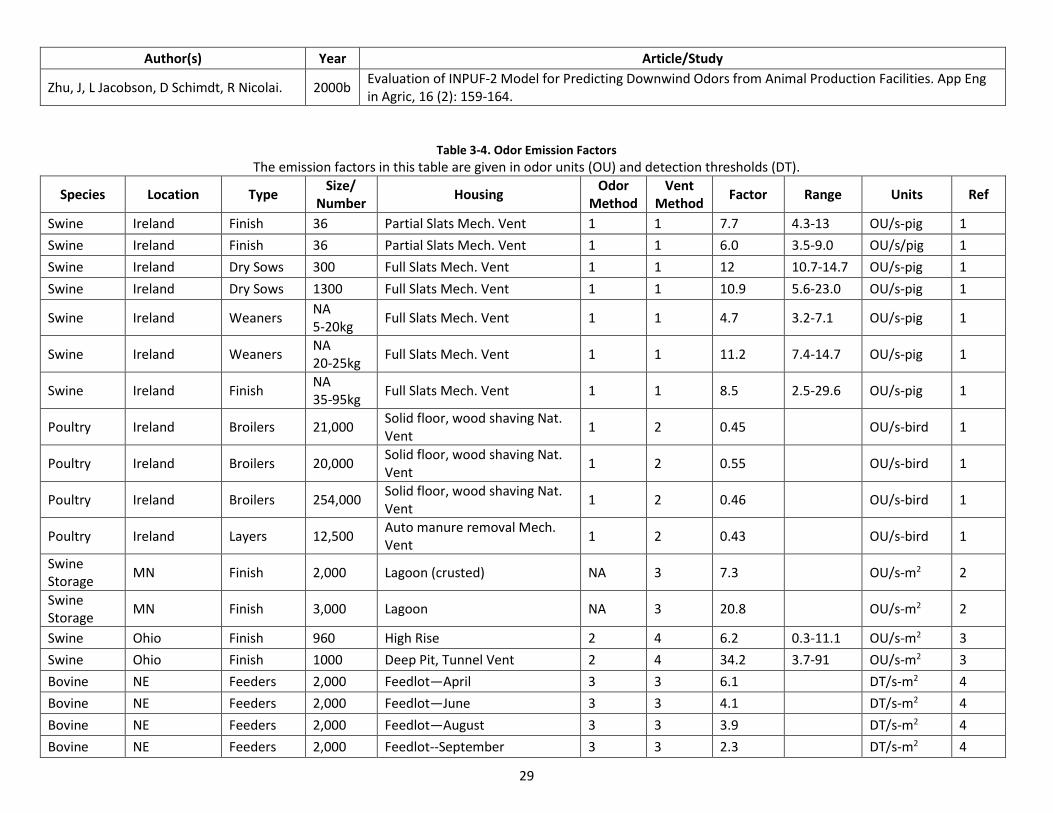
29
Author(s) Year Article/Study
Zhu, J, L Jacobson, D Schimdt, R Nicolai. 2000b Evaluation of INPUF-2 Model for Predicting Downwind Odors from Animal Production Facilities. App Eng in Agric, 16 (2): 159-164.
Table 3-4. Odor Emission Factors
The emission factors in this table are given in odor units (OU) and detection thresholds (DT).
Species Location Type Size/
Number Housing
Odor Method
Vent Method
Factor Range Units Ref
Swine Ireland Finish 36 Partial Slats Mech. Vent 1 1 7.7 4.3-13 OU/s-pig 1
Swine Ireland Finish 36 Partial Slats Mech. Vent 1 1 6.0 3.5-9.0 OU/s/pig 1
Swine Ireland Dry Sows 300 Full Slats Mech. Vent 1 1 12 10.7-14.7 OU/s-pig 1
Swine Ireland Dry Sows 1300 Full Slats Mech. Vent 1 1 10.9 5.6-23.0 OU/s-pig 1
Swine Ireland Weaners NA 5-20kg
Full Slats Mech. Vent 1 1 4.7 3.2-7.1 OU/s-pig 1
Swine Ireland Weaners NA 20-25kg
Full Slats Mech. Vent 1 1 11.2 7.4-14.7 OU/s-pig 1
Swine Ireland Finish NA 35-95kg
Full Slats Mech. Vent 1 1 8.5 2.5-29.6 OU/s-pig 1
Poultry Ireland Broilers 21,000 Solid floor, wood shaving Nat. Vent
1 2 0.45 OU/s-bird 1
Poultry Ireland Broilers 20,000 Solid floor, wood shaving Nat. Vent
1 2 0.55 OU/s-bird 1
Poultry Ireland Broilers 254,000 Solid floor, wood shaving Nat. Vent
1 2 0.46 OU/s-bird 1
Poultry Ireland Layers 12,500 Auto manure removal Mech. Vent
1 2 0.43 OU/s-bird 1
Swine Storage
MN Finish 2,000 Lagoon (crusted) NA 3 7.3 OU/s-m2 2
Swine Storage
MN Finish 3,000 Lagoon NA 3 20.8 OU/s-m2 2
Swine Ohio Finish 960 High Rise 2 4 6.2 0.3-11.1 OU/s-m2 3
Swine Ohio Finish 1000 Deep Pit, Tunnel Vent 2 4 34.2 3.7-91 OU/s-m2 3
Bovine NE Feeders 2,000 Feedlot—April 3 3 6.1 DT/s-m2 4
Bovine NE Feeders 2,000 Feedlot—June 3 3 4.1 DT/s-m2 4
Bovine NE Feeders 2,000 Feedlot—August 3 3 3.9 DT/s-m2 4
Bovine NE Feeders 2,000 Feedlot--September 3 3 2.3 DT/s-m2 4
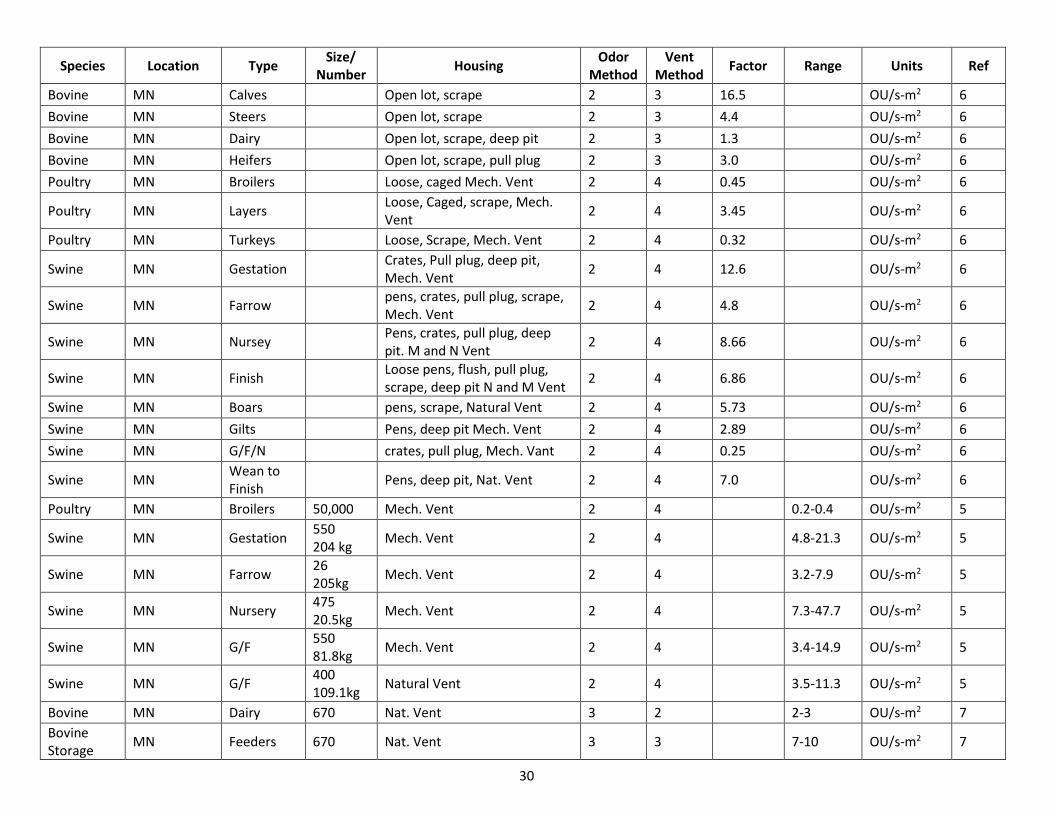
30
Species Location Type Size/
Number Housing
Odor Method
Vent Method
Factor Range Units Ref
Bovine MN Calves Open lot, scrape 2 3 16.5 OU/s-m2 6
Bovine MN Steers Open lot, scrape 2 3 4.4 OU/s-m2 6
Bovine MN Dairy Open lot, scrape, deep pit 2 3 1.3 OU/s-m2 6
Bovine MN Heifers Open lot, scrape, pull plug 2 3 3.0 OU/s-m2 6
Poultry MN Broilers Loose, caged Mech. Vent 2 4 0.45 OU/s-m2 6
Poultry MN Layers Loose, Caged, scrape, Mech. Vent
2 4 3.45 OU/s-m2 6
Poultry MN Turkeys Loose, Scrape, Mech. Vent 2 4 0.32 OU/s-m2 6
Swine MN Gestation Crates, Pull plug, deep pit, Mech. Vent
2 4 12.6 OU/s-m2 6
Swine MN Farrow pens, crates, pull plug, scrape, Mech. Vent
2 4 4.8 OU/s-m2 6
Swine MN Nursey Pens, crates, pull plug, deep pit. M and N Vent
2 4 8.66 OU/s-m2 6
Swine MN Finish Loose pens, flush, pull plug, scrape, deep pit N and M Vent
2 4 6.86 OU/s-m2 6
Swine MN Boars pens, scrape, Natural Vent 2 4 5.73 OU/s-m2 6
Swine MN Gilts Pens, deep pit Mech. Vent 2 4 2.89 OU/s-m2 6
Swine MN G/F/N crates, pull plug, Mech. Vant 2 4 0.25 OU/s-m2 6
Swine MN Wean to Finish
Pens, deep pit, Nat. Vent 2 4 7.0 OU/s-m2 6
Poultry MN Broilers 50,000 Mech. Vent 2 4 0.2-0.4 OU/s-m2 5
Swine MN Gestation 550 204 kg
Mech. Vent 2 4 4.8-21.3 OU/s-m2 5
Swine MN Farrow 26 205kg
Mech. Vent 2 4 3.2-7.9 OU/s-m2 5
Swine MN Nursery 475 20.5kg
Mech. Vent 2 4 7.3-47.7 OU/s-m2 5
Swine MN G/F 550 81.8kg
Mech. Vent 2 4 3.4-14.9 OU/s-m2 5
Swine MN G/F 400 109.1kg
Natural Vent 2 4 3.5-11.3 OU/s-m2 5
Bovine MN Dairy 670 Nat. Vent 3 2 2-3 OU/s-m2 7
Bovine Storage
MN Feeders 670 Nat. Vent 3 3 7-10 OU/s-m2 7
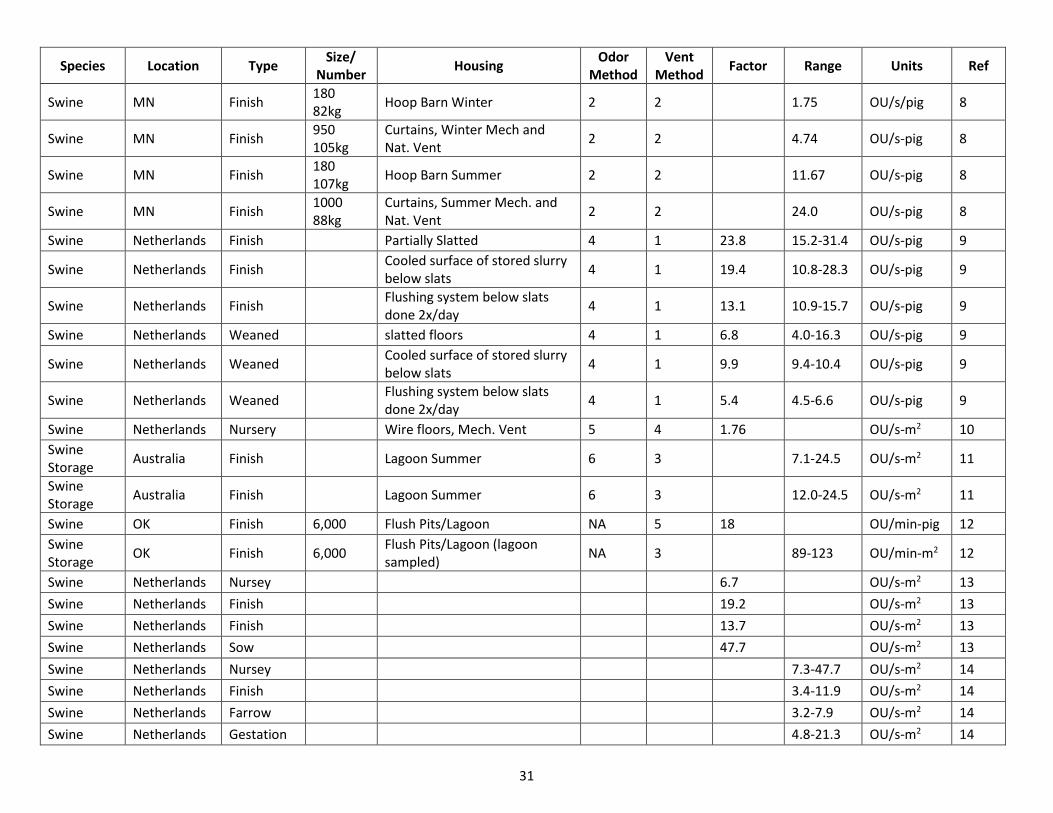
31
Species Location Type Size/
Number Housing
Odor Method
Vent Method
Factor Range Units Ref
Swine MN Finish 180 82kg
Hoop Barn Winter 2 2 1.75 OU/s/pig 8
Swine MN Finish 950 105kg
Curtains, Winter Mech and Nat. Vent
2 2 4.74 OU/s-pig 8
Swine MN Finish 180 107kg
Hoop Barn Summer 2 2 11.67 OU/s-pig 8
Swine MN Finish 1000 88kg
Curtains, Summer Mech. and Nat. Vent
2 2 24.0 OU/s-pig 8
Swine Netherlands Finish Partially Slatted 4 1 23.8 15.2-31.4 OU/s-pig 9
Swine Netherlands Finish Cooled surface of stored slurry below slats
4 1 19.4 10.8-28.3 OU/s-pig 9
Swine Netherlands Finish Flushing system below slats done 2x/day
4 1 13.1 10.9-15.7 OU/s-pig 9
Swine Netherlands Weaned slatted floors 4 1 6.8 4.0-16.3 OU/s-pig 9
Swine Netherlands Weaned Cooled surface of stored slurry below slats
4 1 9.9 9.4-10.4 OU/s-pig 9
Swine Netherlands Weaned Flushing system below slats done 2x/day
4 1 5.4 4.5-6.6 OU/s-pig 9
Swine Netherlands Nursery Wire floors, Mech. Vent 5 4 1.76 OU/s-m2 10
Swine Storage
Australia Finish Lagoon Summer 6 3 7.1-24.5 OU/s-m2 11
Swine Storage
Australia Finish Lagoon Summer 6 3 12.0-24.5 OU/s-m2 11
Swine OK Finish 6,000 Flush Pits/Lagoon NA 5 18 OU/min-pig 12
Swine Storage
OK Finish 6,000 Flush Pits/Lagoon (lagoon sampled)
NA 3 89-123 OU/min-m2 12
Swine Netherlands Nursey 6.7 OU/s-m2 13
Swine Netherlands Finish 19.2 OU/s-m2 13
Swine Netherlands Finish 13.7 OU/s-m2 13
Swine Netherlands Sow 47.7 OU/s-m2 13
Swine Netherlands Nursey 7.3-47.7 OU/s-m2 14
Swine Netherlands Finish 3.4-11.9 OU/s-m2 14
Swine Netherlands Farrow 3.2-7.9 OU/s-m2 14
Swine Netherlands Gestation 4.8-21.3 OU/s-m2 14
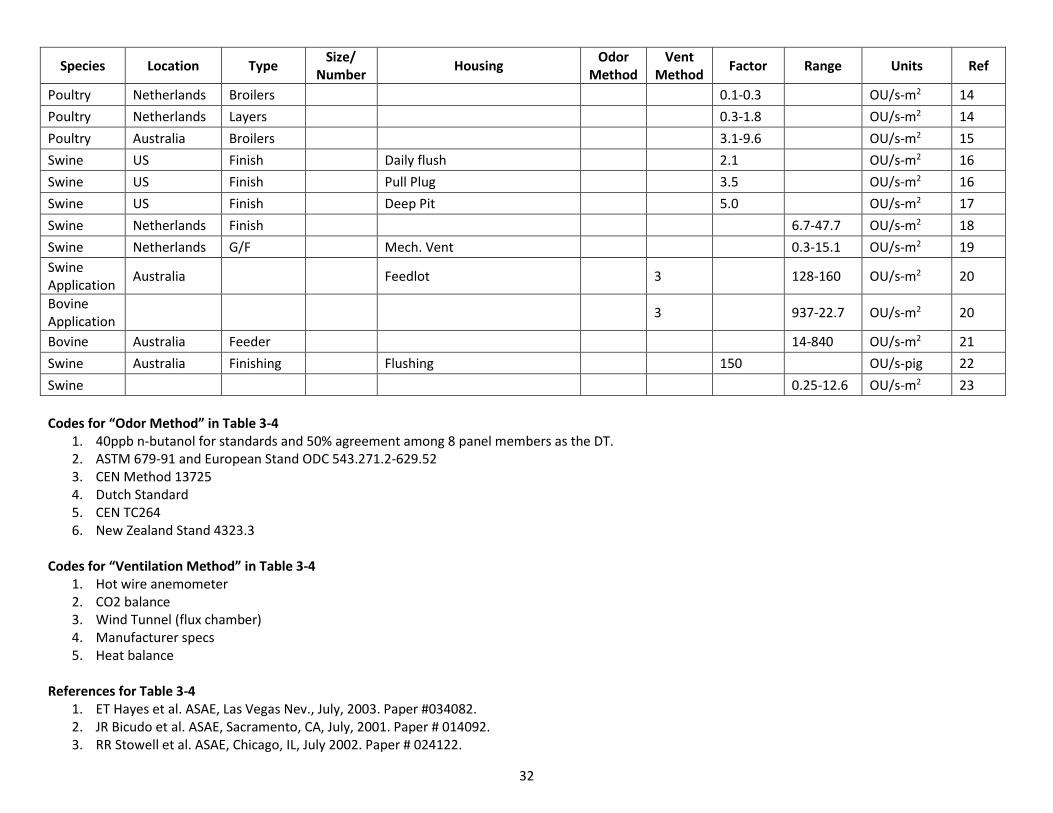
32
Species Location Type Size/
Number Housing
Odor Method
Vent Method
Factor Range Units Ref
Poultry Netherlands Broilers 0.1-0.3 OU/s-m2 14
Poultry Netherlands Layers 0.3-1.8 OU/s-m2 14
Poultry Australia Broilers 3.1-9.6 OU/s-m2 15
Swine US Finish Daily flush 2.1 OU/s-m2 16
Swine US Finish Pull Plug 3.5 OU/s-m2 16
Swine US Finish Deep Pit 5.0 OU/s-m2 17
Swine Netherlands Finish 6.7-47.7 OU/s-m2 18
Swine Netherlands G/F Mech. Vent 0.3-15.1 OU/s-m2 19
Swine Application
Australia Feedlot 3 128-160 OU/s-m2 20
Bovine Application
3 937-22.7 OU/s-m2 20
Bovine Australia Feeder 14-840 OU/s-m2 21
Swine Australia Finishing Flushing 150 OU/s-pig 22
Swine 0.25-12.6 OU/s-m2 23
Codes for “Odor Method” in Table 3-4
1. 40ppb n-butanol for standards and 50% agreement among 8 panel members as the DT. 2. ASTM 679-91 and European Stand ODC 543.271.2-629.52 3. CEN Method 13725 4. Dutch Standard 5. CEN TC264 6. New Zealand Stand 4323.3
Codes for “Ventilation Method” in Table 3-4
1. Hot wire anemometer 2. CO2 balance 3. Wind Tunnel (flux chamber) 4. Manufacturer specs 5. Heat balance
References for Table 3-4
1. ET Hayes et al. ASAE, Las Vegas Nev., July, 2003. Paper #034082. 2. JR Bicudo et al. ASAE, Sacramento, CA, July, 2001. Paper # 014092. 3. RR Stowell et al. ASAE, Chicago, IL, July 2002. Paper # 024122.
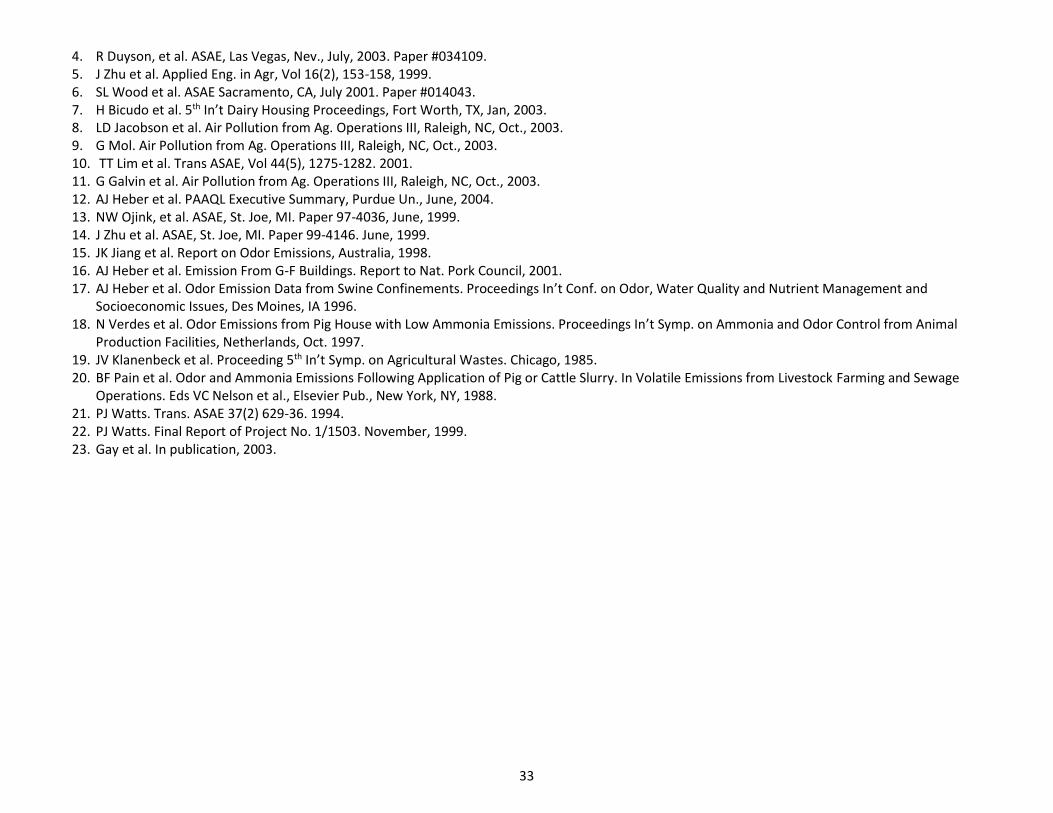
33
4. R Duyson, et al. ASAE, Las Vegas, Nev., July, 2003. Paper #034109. 5. J Zhu et al. Applied Eng. in Agr, Vol 16(2), 153-158, 1999. 6. SL Wood et al. ASAE Sacramento, CA, July 2001. Paper #014043. 7. H Bicudo et al. 5th In’t Dairy Housing Proceedings, Fort Worth, TX, Jan, 2003. 8. LD Jacobson et al. Air Pollution from Ag. Operations III, Raleigh, NC, Oct., 2003. 9. G Mol. Air Pollution from Ag. Operations III, Raleigh, NC, Oct., 2003. 10. TT Lim et al. Trans ASAE, Vol 44(5), 1275-1282. 2001. 11. G Galvin et al. Air Pollution from Ag. Operations III, Raleigh, NC, Oct., 2003. 12. AJ Heber et al. PAAQL Executive Summary, Purdue Un., June, 2004. 13. NW Ojink, et al. ASAE, St. Joe, MI. Paper 97-4036, June, 1999. 14. J Zhu et al. ASAE, St. Joe, MI. Paper 99-4146. June, 1999. 15. JK Jiang et al. Report on Odor Emissions, Australia, 1998. 16. AJ Heber et al. Emission From G-F Buildings. Report to Nat. Pork Council, 2001. 17. AJ Heber et al. Odor Emission Data from Swine Confinements. Proceedings In’t Conf. on Odor, Water Quality and Nutrient Management and
Socioeconomic Issues, Des Moines, IA 1996. 18. N Verdes et al. Odor Emissions from Pig House with Low Ammonia Emissions. Proceedings In’t Symp. on Ammonia and Odor Control from Animal
Production Facilities, Netherlands, Oct. 1997. 19. JV Klanenbeck et al. Proceeding 5th In’t Symp. on Agricultural Wastes. Chicago, 1985. 20. BF Pain et al. Odor and Ammonia Emissions Following Application of Pig or Cattle Slurry. In Volatile Emissions from Livestock Farming and Sewage
Operations. Eds VC Nelson et al., Elsevier Pub., New York, NY, 1988. 21. PJ Watts. Trans. ASAE 37(2) 629-36. 1994. 22. PJ Watts. Final Report of Project No. 1/1503. November, 1999. 23. Gay et al. In publication, 2003.
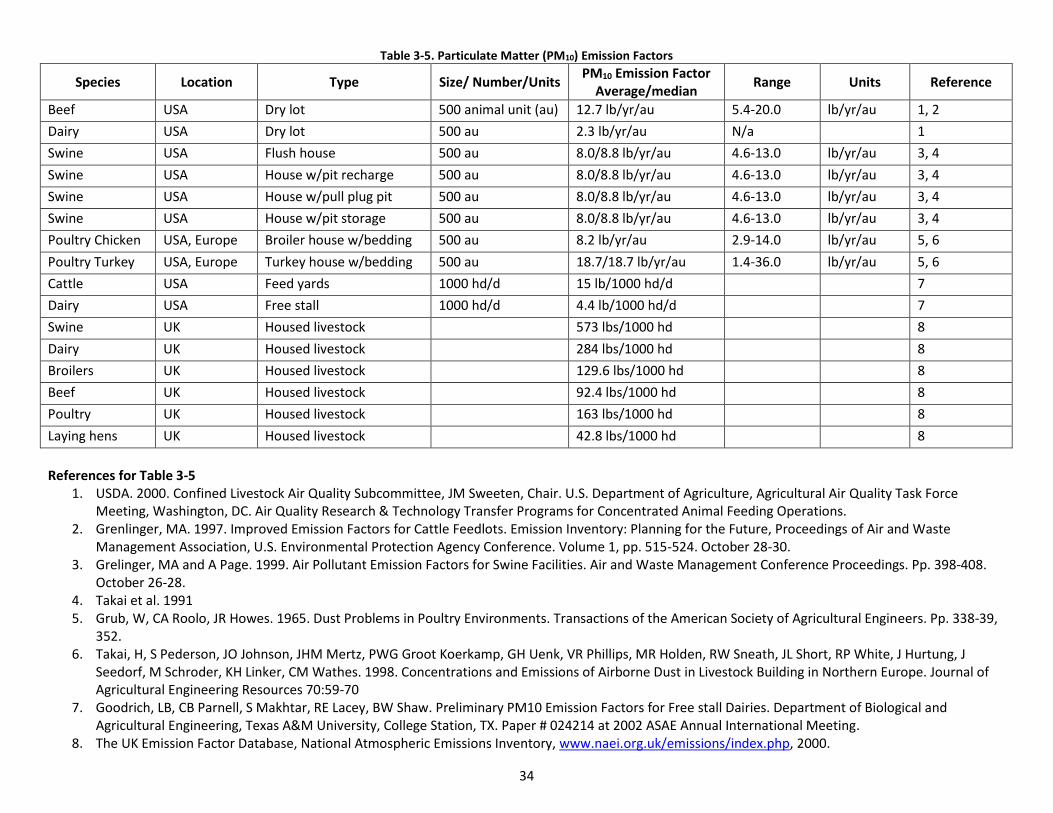
34
Table 3-5. Particulate Matter (PM10) Emission Factors
Species Location Type Size/ Number/Units PM10 Emission Factor
Average/median Range Units Reference
Beef USA Dry lot 500 animal unit (au) 12.7 lb/yr/au 5.4-20.0 lb/yr/au 1, 2
Dairy USA Dry lot 500 au 2.3 lb/yr/au N/a 1
Swine USA Flush house 500 au 8.0/8.8 lb/yr/au 4.6-13.0 lb/yr/au 3, 4
Swine USA House w/pit recharge 500 au 8.0/8.8 lb/yr/au 4.6-13.0 lb/yr/au 3, 4
Swine USA House w/pull plug pit 500 au 8.0/8.8 lb/yr/au 4.6-13.0 lb/yr/au 3, 4
Swine USA House w/pit storage 500 au 8.0/8.8 lb/yr/au 4.6-13.0 lb/yr/au 3, 4
Poultry Chicken USA, Europe Broiler house w/bedding 500 au 8.2 lb/yr/au 2.9-14.0 lb/yr/au 5, 6
Poultry Turkey USA, Europe Turkey house w/bedding 500 au 18.7/18.7 lb/yr/au 1.4-36.0 lb/yr/au 5, 6
Cattle USA Feed yards 1000 hd/d 15 lb/1000 hd/d 7
Dairy USA Free stall 1000 hd/d 4.4 lb/1000 hd/d 7
Swine UK Housed livestock 573 lbs/1000 hd 8
Dairy UK Housed livestock 284 lbs/1000 hd 8
Broilers UK Housed livestock 129.6 lbs/1000 hd 8
Beef UK Housed livestock 92.4 lbs/1000 hd 8
Poultry UK Housed livestock 163 lbs/1000 hd 8
Laying hens UK Housed livestock 42.8 lbs/1000 hd 8
References for Table 3-5
1. USDA. 2000. Confined Livestock Air Quality Subcommittee, JM Sweeten, Chair. U.S. Department of Agriculture, Agricultural Air Quality Task Force Meeting, Washington, DC. Air Quality Research & Technology Transfer Programs for Concentrated Animal Feeding Operations.
2. Grenlinger, MA. 1997. Improved Emission Factors for Cattle Feedlots. Emission Inventory: Planning for the Future, Proceedings of Air and Waste Management Association, U.S. Environmental Protection Agency Conference. Volume 1, pp. 515-524. October 28-30.
3. Grelinger, MA and A Page. 1999. Air Pollutant Emission Factors for Swine Facilities. Air and Waste Management Conference Proceedings. Pp. 398-408. October 26-28.
4. Takai et al. 1991 5. Grub, W, CA Roolo, JR Howes. 1965. Dust Problems in Poultry Environments. Transactions of the American Society of Agricultural Engineers. Pp. 338-39,
352. 6. Takai, H, S Pederson, JO Johnson, JHM Mertz, PWG Groot Koerkamp, GH Uenk, VR Phillips, MR Holden, RW Sneath, JL Short, RP White, J Hurtung, J
Seedorf, M Schroder, KH Linker, CM Wathes. 1998. Concentrations and Emissions of Airborne Dust in Livestock Building in Northern Europe. Journal of Agricultural Engineering Resources 70:59-70
7. Goodrich, LB, CB Parnell, S Makhtar, RE Lacey, BW Shaw. Preliminary PM10 Emission Factors for Free stall Dairies. Department of Biological and Agricultural Engineering, Texas A&M University, College Station, TX. Paper # 024214 at 2002 ASAE Annual International Meeting.
8. The UK Emission Factor Database, National Atmospheric Emissions Inventory, www.naei.org.uk/emissions/index.php, 2000.
35
4.0 Dispersion Modeling
4.1 Executive Summary The Dispersion Modeling workgroup recommends application of the American Meteorological Society / Environmental Protection Agency Regulatory Model (AERMOD)3 for estimation of odor, hydrogen sulfide and ammonia impacts from AFOs. Additionally, the workgroup makes two sub- recommendations:
1. Review of new or enhanced dispersion modeling systems should be conducted on an annual basis in order to take advantage of emerging scientific advances associated with estimation of the dispersion of odor, hydrogen sulfide and ammonia emissions from AFOs.
2. Investigation of proper model configuration and setting selection is necessary to more fully evaluate the suitability of the AERMOD dispersion modeling system for estimating odor, hydrogen sulfide and ammonia concentrations at separated locations.
Development of these recommendations was accomplished through the voluntary participation of interested stakeholders and staff from the DNR.
4.2 Purpose The charge of the workgroup on dispersion modeling was to identify modeling tools currently available that can be used to assess ambient concentrations of odor, hydrogen sulfide and ammonia from AFOs. Dispersion models are routinely used to estimate the concentration of pollutants emitted into the atmosphere. These models use mathematical representations of physical and chemical atmospheric processes in combination with characterization of air pollutant emissions to simulate the transport and diffusion of pollutants from a source of release. Various types of dispersion models have been developed to represent different types of emission release scenarios. The most commonly used types of dispersion model are those based on proven Gaussian dispersion methodology. Employed as the preferred type of model for simulating air pollutant emissions from industrial sources, this class of model has undergone significant scientific scrutiny and peer review for application in assessing pollutants with National Ambient Air Quality Standards. The resulting user base and development community includes federal, state, private and educational entities. Additional classes of models have been developed to assess a range of requirements for estimating pollutant concentrations. These models include emergency release models used to estimate danger zones from the accidental or intentional release of hazardous substances to models designed to evaluate the transport of pollutants on a global scale. Independent of the type or class of model employed in a particular study, models allow users to evaluate the results of multiple scenarios on multiple locations in a manner where variables can be controlled. In the case of dispersion modeling for the protection of air quality in the vicinity of an industrial facility, model simulations allow the facility and regulatory agency to evaluate air quality concerns for multiple configurations prior to construction or changes at the facility. In this way, models are capable of helping to mitigate not only adverse air quality but also unnecessary expenses associated with identifying and rectifying problems after an air pollution source is constructed and operating. Though models produce estimates based on a simplified representation of real world conditions, they in effect establish “virtual” monitors, or receptors that can be located in the model as specified by the user. In reality, siting of ambient air quality monitors is limited by the need for nearby resources such as electricity and surrounding land use or ownership issues. Additionally, the acquisition, siting and continued operation and maintenance of ambient air quality monitors is resource intensive whereas hundreds or thousands of model receptors can be easily established in a model. Unlike actual measurements of air pollutant concentrations at ambient air monitoring sites, model results are estimates of pollutant concentrations. As such, the accuracy of these estimates is vulnerable to errors resulting from inadequate scientific formulation or inaccurate input and runtime parameters. As noted above, for application to industrial sources of certain air pollutants various models have been thoroughly investigated as to the accuracy for estimating resulting
3 http://www.epa.gov/scram001/7thconf/aermod/aermodug.pdf
36
concentrations. However, less information is available for the application of models for estimating downwind concentrations of odor, hydrogen sulfide or ammonia from AFOs. This is complicated by the fact that the science of air quality issues associated with AFOs continues to evolve. Of critical importance to the ability of any dispersion model to accurately estimate downwind concentrations of odor, hydrogen sulfide or ammonia is the availability of accurate and realistic estimates of pollutant emission rates from multiple types of sources. A single downwind pollutant concentration, whether measured or modeled, represents the sum of pollutant concentrations at that point which have been transported from multiple sources at differing locations. For an AFO this may include sources such as multiple exhaust fans and a lagoon, each of which may have different individual impacts at a downwind location. Many models are capable of simulating multiple types and numbers of pollutant emission sources simultaneously. However, the ability of the model to accurately estimate downwind pollutant concentrations remains highly dependent on an accurate estimate of pollutant emission rates from each source. The Dispersion Modeling workgroup was formed to assess general issues such as those discussed above and provide answers for several specific questions. The following list of questions was provided as a starting point for the group’s consideration:
1. What models are available that can accurately predict concentrations of pollutants downwind from a source? 2. What is the best model available that most accurately predicts concentrations of pollutants downwind from a
source? 3. How difficult is the model to use? 4. What type of computer hardware and software is required to run the model? 5. How is the model obtained? 6. What are the inputs into the model and how easily are they obtained? 7. Are there any associated costs with purchasing or running the model (such as purchasing meteorological data)? 8. What physical mechanisms are represented within the model, what physical mechanisms are needed? 9. What atmospheric chemical processes affect odor, hydrogen sulfide and ammonia? 10. How far can odor, hydrogen sulfide and ammonia be expected to be transported?
Participants in the workgroup answered these questions and completed the group’s charge of recommending a model or models that could be used to evaluate pollutant concentrations downwind from AFOs. It should be noted that while this group worked to identify a model proven for validity and accuracy specific to odor, hydrogen sulfide and ammonia from AFOs, the group concluded that the present scientific evidence is insufficient to identify such a model. Instead, the recommendation of this group identified the leading candidate for such air quality studies. Additional effort on comparing model predictions to observations is necessary. In the interim, the AERMOD dispersion modeling system can provide insight into not only the dispersion of odor, hydrogen sulfide and ammonia from AFOs, but possibly more important, insight into the relative efficacy of best management practices.
4.3 Methodology The workgroup initiated efforts with a review of the goals for the group. In particular, participants identified the need to align the goals of the group with feasible deliverables. Development of new dispersion modeling systems and testing of existing systems for accuracy was considered beyond the scope of this effort. As a result, investigation by the group was directed toward identifying the best dispersion modeling system currently available which could estimate the relative change in pollutant concentrations resulting from changes in site management such as application of various best management practices. Focus was directed toward two primary areas; reviews of literature concerning dispersion modeling of odor, hydrogen sulfide and ammonia and model characteristics identified as critical to successfully simulating pollutant emissions from AFOs. Four fields of generalized capabilities for candidate dispersion modeling systems were identified. These fields are:
Emissions representation
Physical atmospheric processes
Chemical atmospheric processes
Receptor / concentration (output) representation
37
4.3.1 Emissions Representation AFOs contain multiple sources and types of sources of emissions of odor, hydrogen sulfide and ammonia. To be successful in estimating pollutant concentrations or the relative efficacy of best management practices, a dispersion modeling system must be able to represent the applicable types of sources. Examples of source types include indoors versus outdoors pits, above ground versus below ground, mechanical exhaust vents and naturally or curtain ventilated operations. Additionally, candidate models must have the ability to vary emission rates with time individually. The emission source types existing at an AFO can be represented by several standard model representation schemes. Exhaust fans, for example, can be treated in a manner similar to how stacks at industrial sources are modeled. Lagoons and pits can be treated as area sources where the emissions are originating from a surface layer. In addition the height above ground of these release points or areas must be variable. 4.3.2 Physical Atmospheric Processes Fundamentally, dispersion models represent how pollutants are transported by the wind from one point to another. During this transport, atmospheric mixing processes change the original pollutant concentration through dilution and/or deposition. As pollutants are transported further from their point of release this dispersion continues to reduce the per unit concentration for the particular set of pollutants released from that point at a particular time. In addition, multiple releases from multiple locations may be mixed and transported in such a way as to converge at a downwind receptor point, and the per unit concentration at that point may not necessarily be less than that at the initial release points. These are examples of the physical processes that a candidate dispersion model must account for. 4.3.3 Chemical Atmospheric Processes Changes in the downwind concentration of pollutants may be affected by atmospheric chemical process in addition to the physical process discussed above. For example, sulfur dioxide, a common pollutant emitted from combustion, undergoes various atmospheric chemical processes during its atmospheric lifetime. Over time, sulfur dioxide may react with ammonia to produce ammonia sulfate particulate matter. As part of the efforts of the workgroup, the need and availability of model formularizations that address atmospheric chemical processes for odor, hydrogen sulfide and ammonia were reviewed. Complicating this review is the short spatial and temporal scales at which a candidate model for estimating downwind pollutant concentrations or relative efficacy of best management practices is expected to perform. The types of issues targeted for modeling analysis, such as estimated odor reduction from application of a specific best management practice, are generally local, or within approximately 3.1 miles (5 kilometers). At this distance, a light breeze of seven miles per hour will transport pollutants beyond five kilometers in approximately 30 minutes or more than a mile in ten minutes. As such, any chemical process must act on a time scale of minutes to be critical to the type of near-field concentration estimates that are the focus of this type of modeling effort. Review of applicable literature identified pertinent discussion of treatment of chemical processes associated with emissions from AFOs. A study conducted by Earth Tech Inc.4, confirms that for short spatial and temporal scales significant chemical transformation of pollutants from AFOs is negligible. As such, the need for mechanisms for treatment of atmospheric chemical processes was determined not to be critical at this time in the selection of a candidate modeling system. However, while the chemical formulation was not used as a determining factor in the final model selection, such model capabilities were reviewed throughout the process. 4.3.4 Receptor / Concentration (Output) Representation Atmospheric dispersion models are designed to provide estimates of pollutant concentrations at a given location for a given time period. In regulatory applications the time periods in question are established in the National Ambient Air Quality Standards. For example, concentrations of sulfur dioxide considered harmful vary depending on the duration of exposure. These duration’s are expressed as concentrations during a specific averaging period. For the example of sulfur
4 Earth Tech, Inc. Final Technical Work Paper for Air Quality and Odor Impacts. Prepared for the “Generic Environmental Impact Statement on Animal Agriculture.” Earth Tech, Inc., Minneapolis, MN, March 2001.
38
dioxide, concentrations are evaluated on a 3- hour, 24-hour and annual basis. For odor, hydrogen sulfide and ammonia, various averaging periods could be applicable depending on the purpose of the application. For the purpose of this workgroup, model criteria concerning utility of model output was based on the ability of a model to be configured to assess multiple averaging periods. Using these general criteria as a guide, the workgroup reviewed available models. A three phase approach was applied sequentially to eliminate candidate models from further consideration with the purpose of identifying one or more models that could be used to estimate downwind concentrations of odor, hydrogen sulfide and ammonia, and assess the relative efficacy of best management practices. Application and the resulting decisions are further discussed in the following sections of this document.
4.4 Candidate Models The Environmental Protection Agency (EPA) Support Center for Regulatory Air Models (SCRAM) website5 provided the initial list of candidate models. The website, operated and maintained by EPA, provides documentation and guidance on atmospheric dispersion models that support regulatory programs required by the Clean Air Act. Source codes and technical data, including information on basic design and purpose, are also provided for most models. EPA classifies models as either preferred or recommended. Models deemed by EPA to be the most appropriate models available for regulatory applications are classified as “preferred”, and are listed in Appendix A of the Guideline on Air Quality Models (published as Appendix W of 40 CFR Part 51)6. Refined air quality models for use on a case-by-case basis for individual regulatory applications are classified as “recommended”. A justification for using a recommended model must be submitted prior to use for regulatory purposes. The list of candidate models contained the complete set of both preferred and recommended models. In addition to those models found on the SCRAM website, several research-grade models were placed on the list of candidate models, including CAM7, Farm Emissions Model & National Practices Model (FEM- NPM)8 and STINK9. These proprietary models have typically been developed at colleges and universities to suit a specific need or purpose. Several models that are used in foreign countries to support regulatory programs were also added to the list, and these included Austrian Odour Dispersion Model (AODM)10, Australian Plume Model (AUSPLUME)11, and Fine Resolution Atmospheric Multi-Pollutant Exchange (FRAME)12. Although not recommended for use by EPA, these models have also undergone analysis and peer-review, and may have similar capabilities to air dispersion models used in the United States. Finally, the Integrated Puff (INPUFF-2)13 and Computer-Aided Management of Emergency Operations/Arial Locations of Hazardous Atmospheres (CAMEO-ALOHA)14 models were added to the list based on information provided in available
5 http://www.epa.gov/ttn/scram/ 6 U.S. EPA. Revision to the Guideline on Air Quality Models: Adoption of a Preferred Long Range Transport Model and Other Revisions; Final Rule. 40 CFR Part 51, 2003. 7 Bundy, DS, and S Hoff. Personal Communication. 2004 8 Pinder, RW, N Anderson, R Strader, C Davidson, and P Adams. Ammonia Emissions from Dairy Farms: Development of a Farm Model and Estimation of Emissions from the United States. 12th International Emission Inventory Conference “Emissions Inventories – Applying New Technologies,” San Diego, CA, April 29 – May 1, 2003. 9 Smith, R.J. and P.J. Watts. Determination of Odour Emission Rates from Cattle Feedlots: Part 2, Evaluation of Two Wind Tunnels of Different Size. Journal of Agricultural Engineering Research, 58: 231-240, 1994. 10 Schaugerger, G, M Piringer, and E Petz. Diurnal and Annual Variation of the Sensation Distance of Odour Emitted by Livestock Buildings Calculated by the Austrian Odour Dispersion Model (AODM). Atmospheric Environment, 34: 4839- 4851, 2000. 11 EPAV (Victorian Environmental Protection Agency). AUSPLUME Gaussian Plume Dispersion Model User Manual. Environment Protection Authority, Government of Victoria, Melbourne, Australia, 2000. 12 Dore, Anthony, et. Al. Modeling the Transport and Deposition of Sulphur and Reduced and Oxidised Nitrogen in the UK. Status Report to DEFRA, as a contribution to Long Range Transport of Pollutants in the UK. July, 2003. Available at: http://www.frame.ceh.ac.uk/reports.html. 13 Petersen, WB and LG Lavdas. INPUFF 2.0 A Multiple Source Gaussian Puff Dispersion Algorithm – User’s Guide. EPA/600/8-86-024. August, 1986. 14 http://response.restoration.noaa.gov/cameo/cameo.html
39
literature. The model OFFSET15, developed by the University of Minnesota, was not included on the list of candidate models because it is designed primarily as a tool used to site new facilities for construction. OFFSET is not capable of predicting concentrations downwind of a facility. The complete list of fifty-seven candidate models identified for consideration can be found in Table 4-1. The list was not intended to be an all-inclusive, comprehensive list of air dispersion models, but rather a list of those models supported by EPA or those where literature was readily available that indicated the model may be appropriate. After the list was finalized, a three phase approach was used to eliminate models from the list until only the most appropriate model(s) able to accurately predict the dispersion of ammonia, hydrogen sulfide, and/or odors from AFOs remained. 4.4.1 Phase 1 Thirty-three models were eliminated from consideration during Phase 1. During this phase, models whose cursory descriptions indicated that they would not be suitable or relevant for the purposes of the workgroup were removed. Only the basic capability of the model, or what the model could actually be expected to accomplish, was considered. For example, the Buoyant Line and Point Source Model (BLP)16, a model designed to handle unique situations associated with aluminum reduction plants, and the Assessment System for Population Exposure Nationwide (ASPEN)17 model, which is used to estimate toxic air pollutant concentrations over a large scale domains, were both removed. Models were also eliminated if the basic descriptions indicated that one model was superior over another. For example, some models are designed as “screening models” and are used to provide a rough, conservative estimate of concentrations prior to completing a more refined and accurate analysis. Therefore, a screening model was removed if a similar refined model was also on the list. Finally, models often improve over time, with some features of an older model being absorbed into newer, more accurate models. For this reason, only the most recent version of a model was considered during this process. A complete list of the models that were considered in Phase 2 is found in Table 4-1. 4.4.2 Phase 2 During Phase 2, the remaining twenty-four models were researched and reviewed to determine if they would be suitable for predicting concentrations of ammonia, hydrogen sulfide, and/or odors downwind of a source. Basic criteria, such as what the models require for full implementation in terms of license fees, training costs, hardware, data inputs and also purpose and capability, were used to evaluate the models. The resulting evaluations identified six remaining models that required more extensive research to determine their applicability towards AFOs. The list of remaining models included AERMOD, ADMS 318, AODM, CALPUFF19, INPUFF-2, and STINK. During phase 2, the Industrial Source Complex – Short-Term Model 3 (ISC-ST3) was removed from consideration. Although ISC-ST3 is currently EPA’s preferred model for use in most regulatory analyses, the group found AERMOD to be superior in several key areas, such as advanced meteorological profiles, concentration distribution, and treatment of complex terrain, when compared directly to ISC-ST3. 4.4.3 Phase 3 A detailed list of criteria was developed in Phase 3 of the evaluation to aid both in determining if the model has the capability to produce the desired output types, and also to compare the models amongst themselves. The list of criteria included:
1. Is the model user-friendly? Do you need to know a computer language? Does the model have a user interface, etc.?
15 Jacobson, L, D Schmidt, and S Wood. OFFSET Odor From Feedlots Setback Estimation Tool. University of Minnesota Extension Service, 2002. Available at: http://www.extension.umn.edu/distribution/livestock systems/DI7680.html 16 Schulman, L and J Scire. Buoyant Line and Point Source (BLP) Dispersion Model User’s Guide. Environmental Research & Technology, Inc., 1980. 17 U.S. EPA. User’s Guide for the Assessment System for Population Exposure Nationwide (ASPEN, Version 1.1) Model. EPA-454/R-00-017, April, 2000. 18 Cambridge Environmental Research Consultants Ltd. (CERC). ADMS 2 User Guide Version 3.2. CERC, 3 Kings Parade, Cambridge, CB2 1SJ, UK. July, 2004. 19 Earth Tech, Inc. CALPUFF Training Course Manual. Central States Air Resource Agencies Association (CenSARA), Kansas City, KS, November 17-19, 2003.
40
2. What type of computer(s) is/are needed to run the model? Can the model run on a personal computer or does it need additional hardware, etc.?
3. Can in-house experience or skills be used to run the model? Will the model take extensive training to run? 4. What is the cost of the model? Is the software free or are there associated costs? 5. Does the model adequately characterize AFO emission source types? Does the model allow more than one
source to be input? Does the model allow for different types of sources (point, area, line, pit, etc.)? 6. Does the model allow for wet and/or dry deposition? 7. Does the model adequately represent atmospheric chemical processes? Does the model provide specific
processes for NH3, H2S, or odor, or does it treat all pollutants the same? 8. Are the format and/or type of model output usable for the evaluation of best management practices? 9. Is the model EPA approved? Preferred? 10. Does the model have both short and long term averaging periods? 11. Is the model designed for the appropriate size scale (1-5 km)? 12. What is the model’s input data needs (meteorological data, terrain, etc.)? 13. Does the model account for building downwash? 14. Has the model been used previously for an AFO application? Is there any research that documents the use of the
model for predicting NH3, H2S or odors from AFOs?
Each model was then extensively researched to determine to what extent it met the aforementioned criteria, to the extent possible. 4.4.3.1 AERMOD The American Meteorological Society / Environmental Protection Agency Regulatory Model (AERMOD) exhibited the best collection of features of the six models that underwent extensive review. As such, the workgroup recommends application of AERMOD for estimation of odor, hydrogen sulfide and ammonia emissions from AFOs. Specific AERMOD features that make it suitable for this purpose include:
1. User-friendliness, 2. Able to run on a personal computer, 3. Does not take extensive training to operate, 4. Software available at no cost, 5. Able to characterize point, volume, area, area-polygon and area-circle source types, 6. Sophisticated in its handling of near-surface atmospheric mixing, 7. Could be used for the evaluation of best management practices, 8. Capable of handling both short and long term averaging periods, 9. Applicable to appropriate spatial scale, 10. Able to account for complex terrain (where downwind terrain is higher than the release height), and 11. Able to account for building downwash.
In addition to these features, Koppulu et al20 compared AERMOD to STINK, and found the models comparable for the dispersion of odorous compounds. One drawback to AERMOD is that the model is limited in its capability to treat atmospheric chemical processes, and odors are not explicitly part of the model. There are no specific processes included for treating ammonia or hydrogen sulfide. Only reactions involving sulfur dioxide are modeled using a simple chemistry scheme. However, AERMOD still compared well to the other models in this regard. In addition, the current publicly available version of AERMOD does not have the ability to calculate wet and dry deposition. However, this functionality is currently being incorporated and beta testing is underway. It is anticipated that both wet and dry deposition will be included as a standard feature in future versions of AERMOD.
20 Koppolu, L, DD Schulte, S Lin, MJ Rinkol, DP Billesbach, and SB Verma. Comparison of AERMOD and STINK for Dispersion Modeling of Odorous Compounds. Paper No. 024015. ASAE Annual International Meeting, Chicago, Illinois, July, 2002.
41
4.4.3.2 ADMS 3 The Atmospheric Dispersion Modeling System (ADMS 3) is maintained by Cambridge Environmental Research Consultants Ltd. (CERC) and contains several features that demonstrated potential usefulness for the purposes of the workgroup. ADMS 3 has the ability to handle both hourly sequential and statistical meteorological data, was classified as user friendly, provided for both wet and dry deposition, performed analyses on the appropriate scale, allowed for appropriate source types, and was able to account for complex terrain. However, the model also contained several inherent limitations, including:
1. Would require extensive training to operate, 2. Limitations on the number of area, line, and volume sources that could be used in the model for a single run (6 is
the maximum), and 3. Potential cost concerns with both software (roughly $3,000) and training courses, which are only offered in the
United Kingdom. Despite the limitations, ADMS 3 does compare well with AERMOD in the treatment of dispersion and complex effects, and provides a variety of other options that are unavailable in AERMOD (short term fluctuations for odors, condensed plume visibility, puff release, and special treatment for coastline areas). However, the model did not compare well when considering the potential costs involved for both software and training. 4.4.3.3 AODM The Austrian Odour Dispersion Model (AODM) uses standard Gaussian plume equations coupled with an emission module and a module to calculate instantaneous odor concentrations to evaluate downwind odor concentrations. The assessment of AODM indicated that the model would not be appropriate to use for the purposes of the workgroup, with respect to odor. In addition to being proprietary and therefore possibly unavailable to the public, AODM’s drawbacks included:
1. The inability to predict concentrations from other than a single point source, 2. The inability to handle either wet or dry deposition, 3. A lack of reliability for distances less than 100 meters, 4. The ability to handle only short, half-hour averaging periods, 5. An inability to deal with complex terrain or building downwash, 6. A lack of preferred or approved status with the EPA, and 7. A need for continuous fan exhaust rate data as a proxy for confinement temperatures.
While the model did demonstrate user-friendliness and minimal training requirements, AODM suffered from too many limitations to be used for the purposes of the workgroup. 4.4.3.4 CALPUFF The non-steady state Lagrangian California Puff Model (CALPUFF) was recently elevated to EPA preferred model status based on its ability to simulate long-range phenomena such as visibility and acid deposition. In addition to backing by EPA, CALPUFF’s strengths include:
1. Software is available at no cost, 2. Allows for both wet and dry deposition, 3. Contemplates appropriate source types and averaging periods, and 4. Handles building downwash and complex terrain.
Although CALPUFF can be used to predict downwind concentrations of ammonia, hydrogen sulfide and odors, the model is designed primarily for spatial scales beyond 5 kilometers, and therefore required more sophisticated meteorological data inputs than any of the other models reviewed. Previous applications of CALPUFF for AFOs focused on gauging the impact of a group of facilities over a county-wide area, rather than just a single facility on a local scale.21 In addition, Jacobson et al22, states that CALPUFF is recommended for multi-facility applications, based on the technical advantages
21 Pratt, G. Recommendations on the Combined Impact of Air Emissions from Multiple Feedlots – Draft. Minnesota Pollution Control Agency, November, 1999. 22 Jacobson LD, R Moon, and J Bicudo, et al. Generic Environmental Impact Statement on Animal Agriculture: Summary of the
42
it provided for near-calm scenarios. The goal of this workgroup was to identify a model or models that could accurately predict concentrations of ammonia, hydrogen sulfide or odors from a single facility. If future needs dictate a cumulative analysis over a geographic area containing multiple AFOs, CALPUFF may be a candidate model for such an exercise. 4.4.3.5 INPUFF -2 EPA developed the Integrated Puff (INPUFF-2) model to simulate the dispersion of buoyant or neutrally buoyant gas releases from both stationary and moving point sources. Although the effectiveness of INPUFF-2 in predicting odor concentrations downwind of a source or sources has been demonstrated23, the model was found to be limited in several key aspects necessary for the accurate prediction of ammonia, hydrogen sulfide, or odors from an AFO. These limitations include:
1. Limited to point sources only, and unable to account for area or volume sources, 2. Unable to account for dry deposition, 3. Output is average of release durations, so unable to produce concentrations for various averaging periods, 4. Not recommended for modeling dense gas dispersions (such as hydrogen sulfide), and 5. Unable to account for complex terrain or building downwash.
As the limitations indicate, more flexibility is needed within the model to evaluate the full range of diverse animal facility types. 4.4.3.6 STINK STINK is a research-grade, Gaussian plume model that was developed in Australia24. The workgroup was unable to obtain enough information on the specific features of STINK to make a practical decision on this model possible. Therefore, the model was dropped from consideration until more information becomes available or is brought to the attention of the workgroup.
4.5 Conclusion AERMOD represents the state of the science in local scale dispersion modeling and therefore application of the AERMOD computer modeling system for atmospheric dispersion modeling of ammonia, hydrogen sulfide and odor from AFOs on a spatial scale of 5 kilometers or less is recommended at this time. Additional investigation into the absolute accuracy of modeled pollutant concentrations is also suggested. Review of model applicability for estimating pollutant concentrations of ammonia, hydrogen sulfide and odor from AFOs yield many similarities to other, more common, dispersion modeling applications. These similarities include the release characteristics of pollutant emission sources at AFOs in addition to spatial and temporal scales commonly reviewed for industrial applications. Less correlation with common applications exist for unique pollutant specific characteristics and emission factor information. In general, the field of dispersion modeling of ammonia, hydrogen sulfide and odor from AFOs is relatively new as compared to application of atmospheric dispersion models for federally mandated criteria pollutant emissions from industrial sources. It should be noted however, that the fundamental atmospheric processes of pollutant dispersion and transport are common to all sources and species of pollutant emissions regardless of the nature of the emitting process. This similarity allows future evaluation of absolute model performance for ammonia, hydrogen sulfide and odor to take advantage of the thirty plus years of advances in computational representation of atmospheric pollutant dispersion processes.
Literature Related to Air Quality and Odor. University of Minnesota, College of Agriculture, Food, and Environmental Sciences, 1999. Available at: http://www.mnplan.state.mn.us/pdf/1999/eqb/scoping/aircha.pdf 23 Zhu, J, L Jacobson, D Schmidt, and R Nicolai. Evaluation of INPUFF-2 Model for Predicting Downwind Odors from Animal Production Facilities. Applied Engineering in Agriculture, 16(2): 159-164, 2000. 24 Smith, RJ and PJ Watts. Determination of Odour Emission Rates from Cattle Feedlots: Part 2, Evaluation of Two Wind Tunnels of Different Size. Journal of Agricultural Engineering Research, 58:231-240, 1994.
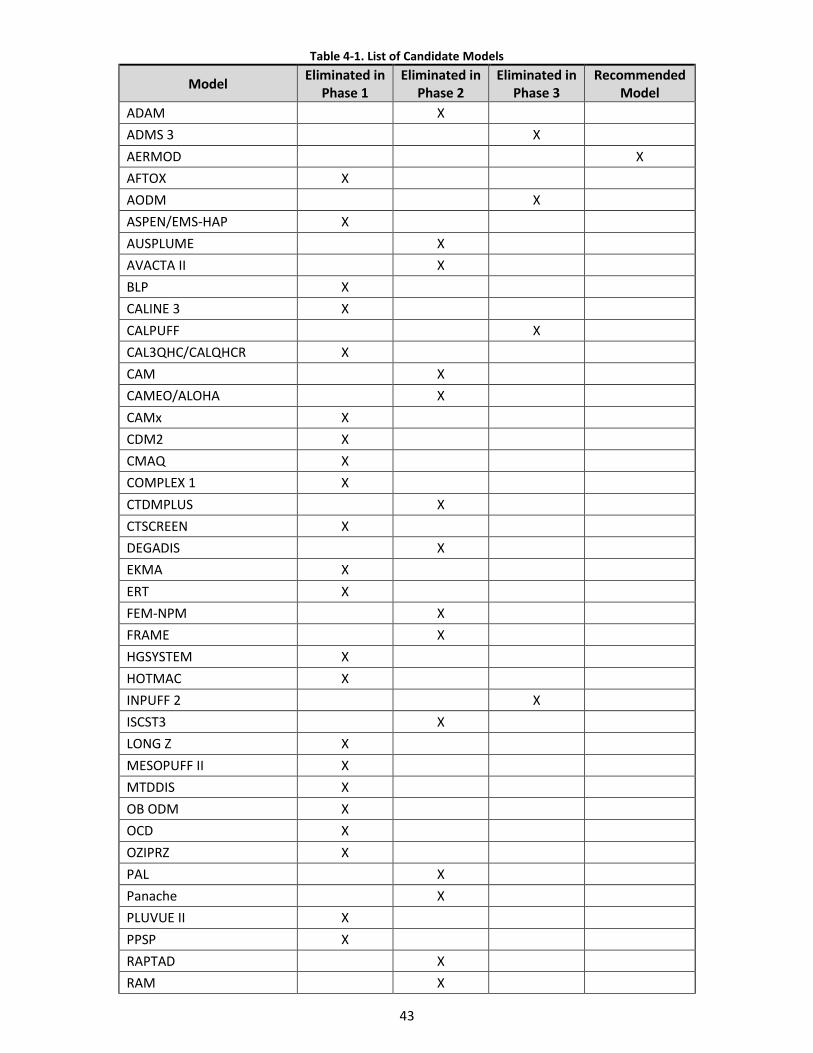
43
Table 4-1. List of Candidate Models
Model Eliminated in
Phase 1 Eliminated in
Phase 2 Eliminated in
Phase 3 Recommended
Model
ADAM X
ADMS 3 X
AERMOD X
AFTOX X
AODM X
ASPEN/EMS-HAP X
AUSPLUME X
AVACTA II X
BLP X
CALINE 3 X
CALPUFF X
CAL3QHC/CALQHCR X
CAM X
CAMEO/ALOHA X
CAMx X
CDM2 X
CMAQ X
COMPLEX 1 X
CTDMPLUS X
CTSCREEN X
DEGADIS X
EKMA X
ERT X
FEM-NPM X
FRAME X
HGSYSTEM X
HOTMAC X
INPUFF 2 X
ISCST3 X
LONG Z X
MESOPUFF II X
MTDDIS X
OB ODM X
OCD X
OZIPRZ X
PAL X
Panache X
PLUVUE II X
PPSP X
RAPTAD X
RAM X
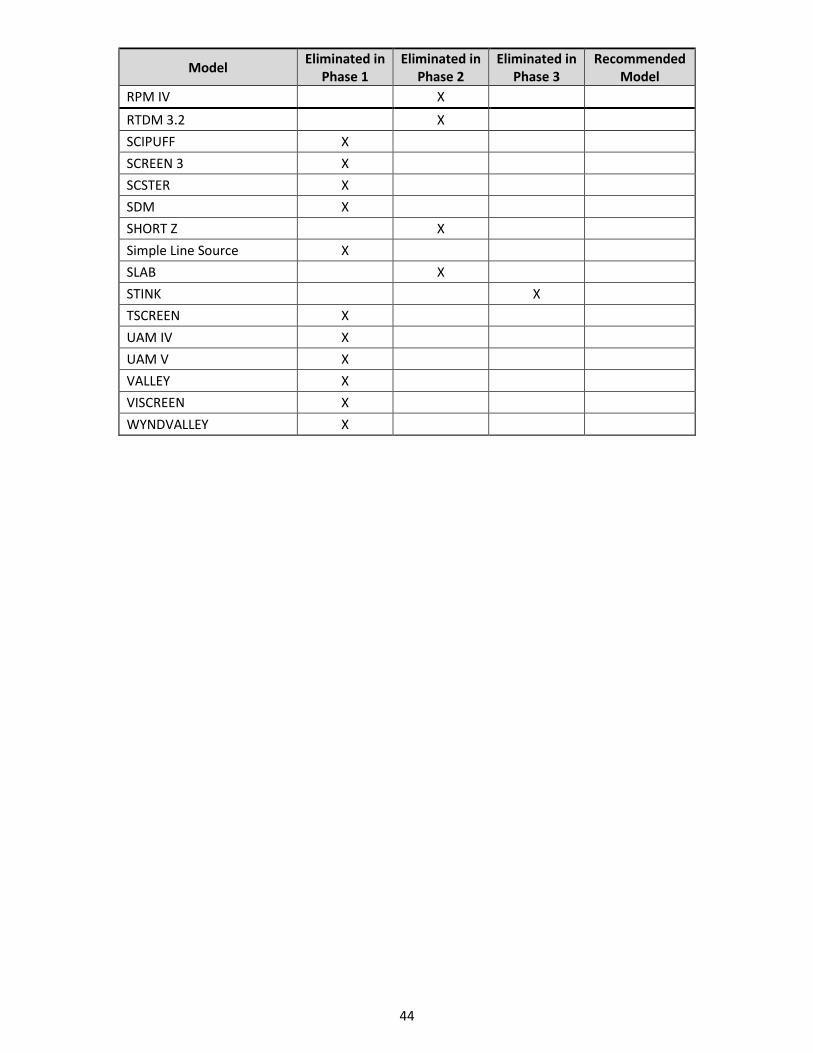
44
Model Eliminated in
Phase 1 Eliminated in
Phase 2 Eliminated in
Phase 3 Recommended
Model
RPM IV X
RTDM 3.2 X
SCIPUFF X
SCREEN 3 X
SCSTER X
SDM X
SHORT Z X
Simple Line Source X
SLAB X
STINK X
TSCREEN X
UAM IV X
UAM V X
VALLEY X
VISCREEN X
WYNDVALLEY X
45
5.0 Conclusion The Iowa Department of Natural Resources Animal Feeding Operations Technical Workgroup was convened on February 5th and concluded December, 2004. This workgroup allowed the Iowa Department of Natural Resources an opportunity to gain valuable insight and expertise from individuals with technical knowledge as part of a continuing effort to develop a working understanding of the complex technical issues involved in air quality issues associated with animal feeding operations (AFOs). This report summarizes the processes, assumptions, data, and recommendations of each of the three workgroups in the areas of best management practices (bmp’s), air emissions characterization, and dispersion modeling. The findings of the bmp workgroup indicate that current technologies are available to producers to reduce air emissions from livestock operations. These technologies are summarized in Chapter 2.0 of this report, and can also be found at the following web address: http://extension.agron.iastate.edu/immag/pubsodors.html. Adoption of these technologies by producers will benefit the air quality on the farms themselves, at nearby residences, and the overall environment by reducing air emissions. The Air Emissions Characterization workgroup summarized available emission factors for ammonia, hydrogen sulfide, particulate matter, and odors. The emission factors are listed in Tables 3-1 through 3-4 to provide the public with one centralized location to find emission factors that may be used to estimate emissions from AFOs. The Dispersion Modeling workgroup recommends application of the American Meteorological Society / Environmental Protection Agency Regulatory Model (AERMOD) for estimation of odor, hydrogen sulfide and ammonia impacts from AFOs. Additionally, the workgroup recommends continual review of new or enhanced dispersion modeling systems, and further evaluation of AERMOD through investigation of proper model configuration and setting selection.