angus leader local development...
TRANSCRIPT

EMFF
1
Angus Local Action Group and Fisheries Local Action Group
Contact: Shelley Hague, Senior External Funding Officer,Angus Council, Chief Executive’s Unit, Angus House, Forfar, DD8 4WD. email [email protected]: 01307 473222 Mobile 07979 054694
COMMUNITY LED LOCAL DEVELOPMENT
Angus Local Development Strategy
2014-2020
APPENDICESApril 2015

COMMUNITY LED LOCAL DEVELOPMENT: ANGUS LOCAL DEVELOPMENT STRATEGY
Contents
GLOSSARY: 2
Appendix 1: Previous LEADER and EMFF Axis 4 Programmes 3
Appendix 2: The 2007-2013 Rural Tayside LEADER Programme (Angus) 4
Appendix 3: EMFF – Coastal Profile 14
Appendix 4: Socio-Economic profile of Angus 27
Appendix 5: Sub-LA Geographies Used in Angus 58
Appendix 6: Populations and Areas by Datazone 59
Appendix 7: SIC 2007 Codes in Sustainable Tourism Sector 62
Appendix 8: Most deprived datazones by SIMD domains 63
Appendix 9: Recent consultations with communities and residents 67
Appendix 10: The online survey 72
1
COMMUNITY LED LOCAL DEVELOPMENT: ANGUS LOCAL DEVELOPMENT STRATEGY
GLOSSARY:EAFRD European Agricultural Fund for Rural DevelopmentEMFF European Maritime and Fisheries FundEC European CommissionEU European UnionCLLD Community Led Local DevelopmentLDS Local Development Strategy LAG Local Action GroupLP Lead PartnerSG Scottish GovernmentSRDP Scottish Rural Development Programme FLAG Fisheries Local Action group
These Appendices should be read as part of the Angus Local Development Strategy which has been produced by and on behalf of the Angus Shadow Local Action Group
2

COMMUNITY LED LOCAL DEVELOPMENT: ANGUS LOCAL DEVELOPMENT STRATEGY
Appendix 1: Previous LEADER and EMFF Axis 4 Programmes
Figure 1: Past Boundaries of LEADER and EMFF Axis 4 Programmes in Angus. Note that some wards featured in both the LEADER and EMFF Axis 4 programmes.
3

COMMUNITY LED LOCAL DEVELOPMENT: ANGUS LOCAL DEVELOPMENT STRATEGY
Appendix 2: The 2007-2013 Rural Tayside LEADER Programme (Angus)
The 2007-2013 Rural Tayside LEADER Programme operated across Perth and Kinross and Angus. The target groups were women, young people, migrant workers and the economically inactive, and the overall programme themes were Progressive Rural Economy and Revitalising Rural Communities. There were eight expected outcomes overall, some of which would be achieved by more than one Main Activity, as presented in Table 1.
Theme Main Activity Expected OutcomesProgressive Rural Economy
Economic Development
1. Improved local economy2. Improved social enterprise sector3. Improved collaborative working.4. Improved local facilities and services.5. Improved local skills6. Improved rural environment.7. Improved visitor experience.
Revitalising Rural Communities
Community Development
1. Improved rural community capacity.2. Improved collaborative working3. Improved local facilities and services.4. Improved local skills
Natural and Cultural Heritage
1. Improved rural environment.2. Improved collaborative working.3. Improved local facilities and services.4. Improved local skills5. Improved visitor experience.
Table 1: Themes, Main Activity and Expected Outcomes of the 2007-2013 LEADER Programme1
Here we report only on the programme profile across Angus.
39 projects were funded in Angus, and of these 37 are now completed with 2 projects still live. An additional three projects had their approved funding de-committed, and a further 12 project applications were rejected.
To those projects which are now either live or completed, the programme approved just under £1.1m of grant funding towards total project costs of just under £2.1m2.
Projects used a mix of public, private and in-kind contributions for the shortfall. Approximately £100,000 of grant funding was returned to LEADER. Detailed data were recorded on the types and locations of projects that were funded. Project types were broken down by SRDP theme as well as by “main activity” and “category”. Of the two SRDP Themes which were chosen for the 2007-2013 programme, the majority of funded projects were for “Revitalising Communities”, the main type of activity of funded projects was community development, and the main category of projects was on infrastructure. A prominent secondary category of projects was tourism.
1 From Rural Tayside LEADER Local Development Strategy – 2009 Revision2 Rural Tayside LEADER Project Database
4

COMMUNITY LED LOCAL DEVELOPMENT: ANGUS LOCAL DEVELOPMENT STRATEGY
Figure 2: The number of projects and total grant approved by SRDP Theme, for completed/live projects in Angus.
Figure 4: The number of projects and total grant approved by Main Activity, for completed/live projects in Angus.
Figure 5: The number of projects and total grant approved by Main Category, for 28 projects in Angus (all recorded). This shows that infrastructure and training projects dominated in terms of funding approved.
5

COMMUNITY LED LOCAL DEVELOPMENT: ANGUS LOCAL DEVELOPMENT STRATEGY
Figure 6: The number of projects (above) and total grant approved (below) by Main Category, Second Category and Third Category for 28 recorded projects in Angus
6

COMMUNITY LED LOCAL DEVELOPMENT: ANGUS LOCAL DEVELOPMENT STRATEGY
The geographic location of projects across Angus were recorded by the LEADER team in two ways; firstly, by the location of the main project contact, and secondly by the agricultural parish or parishes that were intended to be served by the project. The latter is more directly linked to on the ground impact, and so we have mapped these out in Figure . If projects delivered as intended in these areas, then there has been good coverage across the proposed LEADER area.
Figure 7: Agricultural parishes in which funded, completed LEADER projects were targeted.
7
COMMUNITY LED LOCAL DEVELOPMENT: ANGUS LOCAL DEVELOPMENT STRATEGY
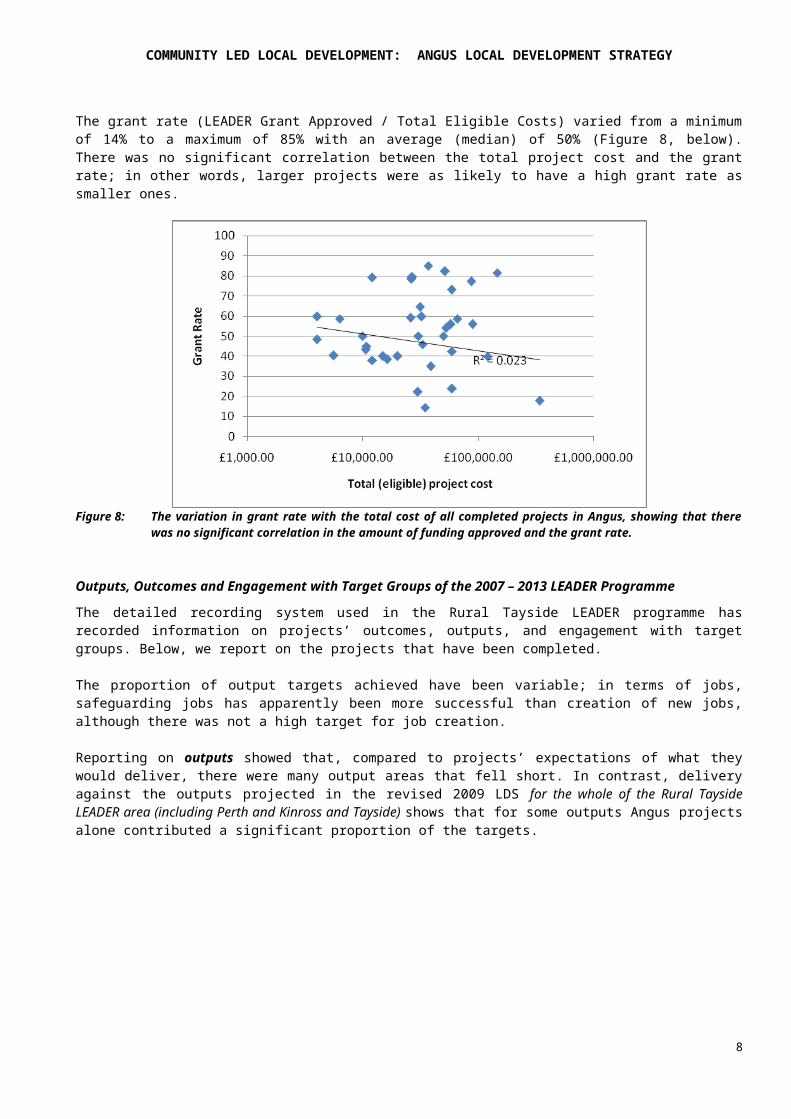
The grant rate (LEADER Grant Approved / Total Eligible Costs) varied from a minimum of 14% to a maximum of 85% with an average (median) of 50% (Figure 8, below). There was no significant correlation between the total project cost and the grant rate; in other words, larger projects were as likely to have a high grant rate as smaller ones.
Figure 8: The variation in grant rate with the total cost of all completed projects in Angus, showing that there was no significant correlation in the amount of funding approved and the grant rate.
Outputs, Outcomes and Engagement with Target Groups of the 2007 – 2013 LEADER ProgrammeThe detailed recording system used in the Rural Tayside LEADER programme has recorded information on projects’ outcomes, outputs, and engagement with target groups. Below, we report on the projects that have been completed.
The proportion of output targets achieved have been variable; in terms of jobs, safeguarding jobs has apparently been more successful than creation of new jobs, although there was not a high target for job creation.
Reporting on outputs showed that, compared to projects’ expectations of what they would deliver, there were many output areas that fell short. In contrast, delivery against the outputs projected in the revised 2009 LDS for the whole of the Rural Tayside LEADER area (including Perth and Kinross and Tayside) shows that for some outputs Angus projects alone contributed a significant proportion of the targets.
8

COMMUNITY LED LOCAL DEVELOPMENT: ANGUS LOCAL DEVELOPMENT STRATEGY
However, a complete assessment of success is very difficult as there is not a one-to-one read across from all outputs in the LDS to all outputs that were actually recorded, and further that the evidence base for recording particular outputs as being achieved was open to different interpretation by projects3.
Engagement with potential beneficiary groups is described in Table . There appear to be relatively low engagement with some groups that were considered important, such as:
Males and females under 16 and over 25 Ethnic workers Unemployed and under-employed Migrant workers, and Economically inactive.
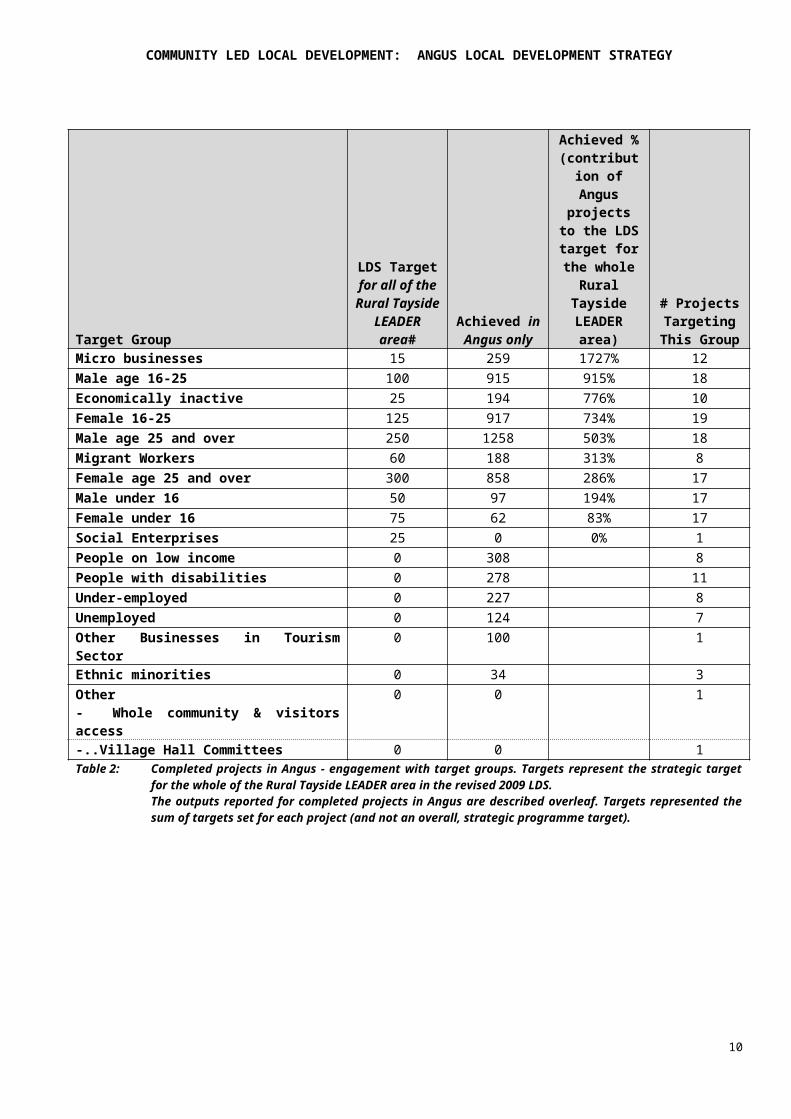
However, in comparison with the target numbers that were laid out in the revised 2009 LDS, the engagement with target groups was good for all categories except social enterprises (Table 2).
Beneficiaries Group
Project target
numbers Achieved
Achieved vs Project Targets
%
Number of projects
targeting this group
Female 16-25 866 917 106% 19Male age 16-25 888 915 103% 18Other: Businesses in Tourism Sector
100 100 100% 1
Micro businesses 314 259 82% 12People on low income 441 308 70% 8People with disabilities 415 278 67% 11Under-employed 495 227 46% 8Economically inactive 474 194 41% 10Migrant Workers 470 188 40% 8Unemployed 315 124 39% 7Female age 25 and over 6969 858 12% 17Male age 25 and over 11834 1258 11% 18Ethnic minorities 360 34 9% 3Male under 16 2738 97 4% 17Female under 16 2642 62 2% 17Other:- Whole community & visitors access 2000 0 0% 1- Village Hall Committees 8 0 0% 1Social Enterprises 0 0 0% 1Table 2: Completed projects in Angus - engagement with beneficiary groups. Targets
represented the sum of targets set for each project (and not an overall, strategic programme target).
Target Group LDS Target for all of the Rural
Achieved in Angus
only
Achieved %
(contributi
# Projects Targeting This Group
3 Personal communication with RT LEADER Team.
9
COMMUNITY LED LOCAL DEVELOPMENT: ANGUS LOCAL DEVELOPMENT STRATEGY
Tayside LEADER area#
on of Angus
projects to the LDS
target for the whole
Rural Tayside LEADER
area)Micro businesses 15 259 1727% 12Male age 16-25 100 915 915% 18Economically inactive 25 194 776% 10Female 16-25 125 917 734% 19Male age 25 and over 250 1258 503% 18Migrant Workers 60 188 313% 8Female age 25 and over 300 858 286% 17Male under 16 50 97 194% 17Female under 16 75 62 83% 17Social Enterprises 25 0 0% 1People on low income 0 308 8People with disabilities 0 278 11Under-employed 0 227 8Unemployed 0 124 7Other Businesses in Tourism Sector
0 100 1
Ethnic minorities 0 34 3Other- Whole community & visitors access
0 0 1
-..Village Hall Committees 0 0 1Table 2: Completed projects in Angus - engagement with target groups. Targets represent the
strategic target for the whole of the Rural Tayside LEADER area in the revised 2009 LDS.The outputs reported for completed projects in Angus are described overleaf. Targets represented the sum of targets set for each project (and not an overall, strategic programme target).
10

COMMUNITY LED LOCAL DEVELOPMENT: ANGUS LOCAL DEVELOPMENT STRATEGY
Output Target Achieved Achieved %Amenity access improvement 5 3 60%Amenity, Access or environmental improvement activities 3 1 33%Awareness raising/promotional event 43 31 72%Business Networks established/supported 17 4 24%Community group established/assisted 81 51 63%Community network developed or supported 8 4 50%Community-led project/s developed 25 22 88%Development Plans produced 9 4 44%Example of Best Practice transferred 5 5 100%Existing community facility/service/resource improved 22 13 59%Feasibility Studies produced 4 4 100%L 2 1 50%Individuals gaining a qualification 189 125 66%Individuals trained, gaining new skills or re-trained 386 242 63%Jobs created (Craft) 5 0 0%Jobs created (Other) 4.5 1 22%Jobs created (Voluntary sector) 2 1 50%Jobs Safeguarded 34 31 91%Micro Business established/supported 291 252 87%New (innovative) methods introduced which improve quality of life 19 11 58%New (innovative) methods of adding value to local products 7 5 71%New community facility/service/resource created 12 9 75%New Markets accessed 7 17 243%New product/s developed 11 9 82%New/enhanced community event 74 47 64%New/enhanced marketing activity 42 37 88%New/enhanced tourism activity 56 66 118%New/Improved community facility/resource 5 5 100%Other (add in comment) 153 1 1%Participants in Actions 85 85 100%Social Enterprise established/supported 1 0 0%Training Courses developed/delivered 30 27 90%Workshops delivered 32 37 116%
11
COMMUNITY LED LOCAL DEVELOPMENT: ANGUS LOCAL DEVELOPMENT STRATEGY
Challenges in understanding the impact of the 2007-2013 ProgrammeAs part of the review of the 2007-2013 Programme, the LEADER team recognise that there have been difficulties with the way that engagement with target groups and project outputs has been recorded. For example, while there were four specific target groups for the programme, projects were not required to focus their project on a particular target group4. Although women were one of the target groups for the 2007-2013 programme, there were not projects in Angus that were specifically targeted at women5. Further, the evidence base for some achieved outputs and target group engagement has not been consistent across projects, with only anecdotal evidence used by some projects6.
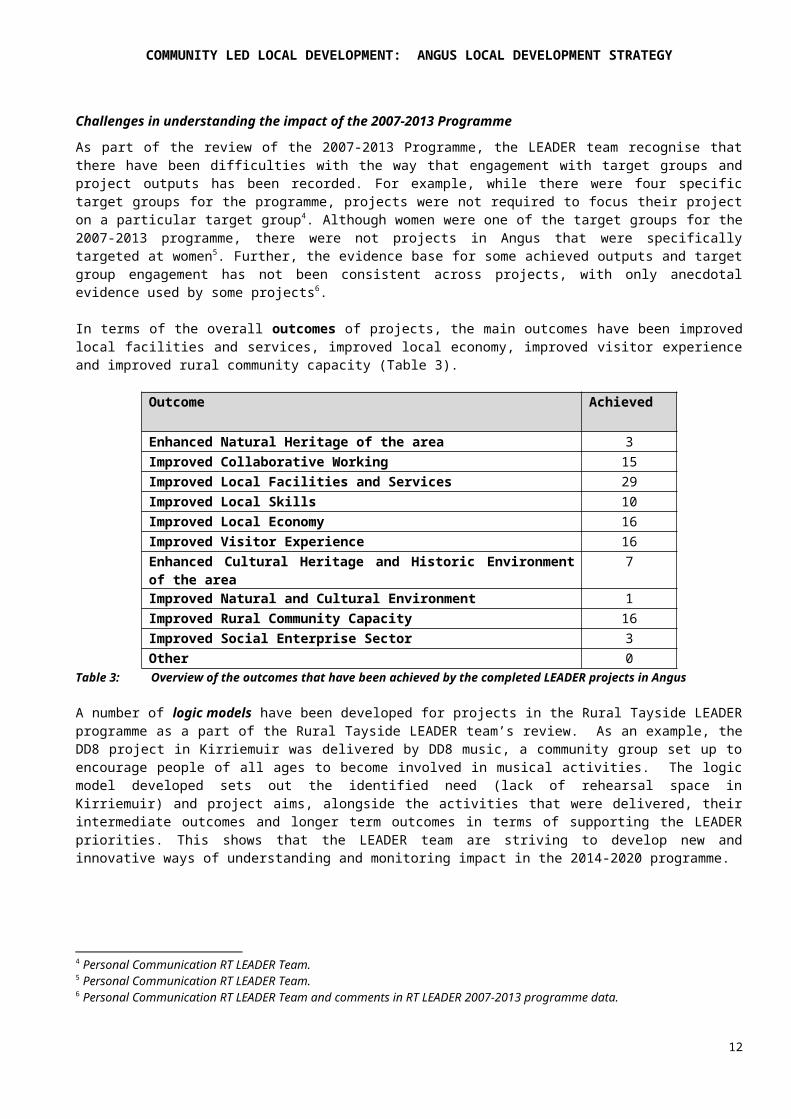
In terms of the overall outcomes of projects, the main outcomes have been improved local facilities and services, improved local economy, improved visitor experience and improved rural community capacity (Table 3).
Outcome Achieved
Enhanced Natural Heritage of the area 3Improved Collaborative Working 15Improved Local Facilities and Services 29Improved Local Skills 10Improved Local Economy 16Improved Visitor Experience 16Enhanced Cultural Heritage and Historic Environment of the area
7
Improved Natural and Cultural Environment 1Improved Rural Community Capacity 16Improved Social Enterprise Sector 3Other 0
Table 3: Overview of the outcomes that have been achieved by the completed LEADER projects in Angus
A number of logic models have been developed for projects in the Rural Tayside LEADER programme as a part of the Rural Tayside LEADER team’s review. As an example, the DD8 project in Kirriemuir was delivered by DD8 music, a community group set up to encourage people of all ages to become involved in musical activities. The logic model developed sets out the identified need (lack of rehearsal space in Kirriemuir) and project aims, alongside the activities that were delivered, their intermediate outcomes and longer term outcomes in terms of supporting the LEADER priorities. This shows that the LEADER team are striving to develop new and innovative ways of understanding and monitoring impact in the 2014-2020 programme.
4 Personal Communication RT LEADER Team.5 Personal Communication RT LEADER Team.6 Personal Communication RT LEADER Team and comments in RT LEADER 2007-2013 programme data.
12

COMMUNITY LED LOCAL DEVELOPMENT: ANGUS LOCAL DEVELOPMENT STRATEGY
2011-2013 EMFF Axis 4 Programme
The 2011-2014 EMFF Axis 4 programme aimed to support 5/6 projects in the coastal areas of Angus, with a budget of approximately £85,0007. The projects needed to be co-financed by the Local Authority and/or other public bodies.
The programme faced a number of challenges, which were interrelated:
The programme was delayed and did not start in 2011. Monies that had been ring-fenced in the Angus Council for co-financing were then not carried
forward and made available for projects when the programme did start, and finding money for co-financing was then a major barrier to the progression of a number of eligible project ideas8. Although there were 13 eligible applications, only 3 were eventually funded.
Alongside a lack of public finance, other projects ideas were rejected based on the type of activity proposed, for example not being directly linked to the coast, sea or fisheries.
The projects that were funded, and their approximate funding received, are set out in Table 4. Note that the large majority of the budget was allocated to one of the projects.
Project Outline EMFF Axis 4 Funding
Outcomes
Equipment purchase for Montrose Academy, in support of SVQ in Maritime Skills, Montrose.
~£700 5-6 pupils trained in the SVQ (supported by the equipment purchase); now a waiting list to get onto the course.
Support for the training of an apprentice boat builder at Mackay’s Boatbuilders in Arbroath.
~£3500 Project on-going.
Improvements to Arbroath Harbour (installing a winch and hard standing area for easier boat maintenance for all users of the harbour).
~£80,000 Project on-going.
Table 4: Funded projects under the EMFF Axis 4 Programme9
7 Angus Coastal FLAG, Note for EMFF Networking Event - Edinburgh8 Personal Communication, Angus Council EMFF Axis 4 Team9 Personal Communication, Angus Council EMFF Axis 4 Team
13
COMMUNITY LED LOCAL DEVELOPMENT: ANGUS LOCAL DEVELOPMENT STRATEGY
Appendix 3: EMFF – Coastal Profile
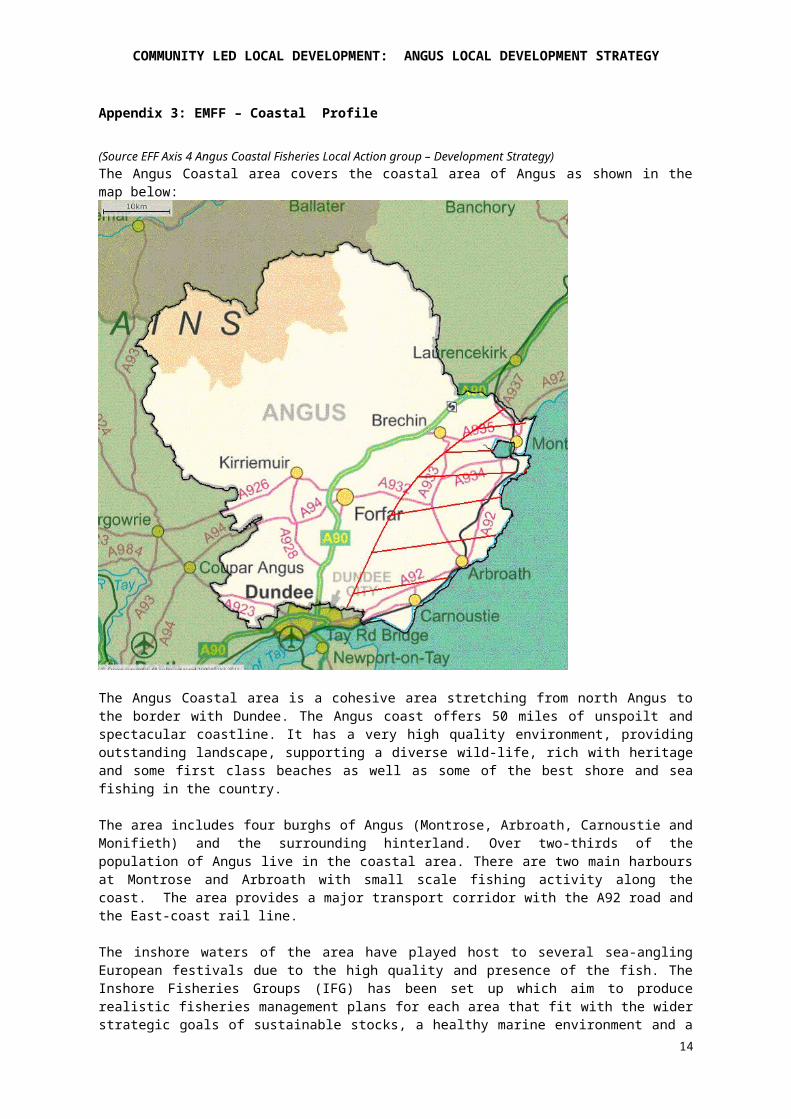
(Source EFF Axis 4 Angus Coastal Fisheries Local Action group – Development Strategy)The Angus Coastal area covers the coastal area of Angus as shown in the map below:
The Angus Coastal area is a cohesive area stretching from north Angus to the border with Dundee. The Angus coast offers 50 miles of unspoilt and spectacular coastline. It has a very high quality environment, providing outstanding landscape, supporting a diverse wild-life, rich with heritage and some first class beaches as well as some of the best shore and sea fishing in the country.
The area includes four burghs of Angus (Montrose, Arbroath, Carnoustie and Monifieth) and the surrounding hinterland. Over two-thirds of the population of Angus live in the coastal area. There are two main harbours at Montrose and Arbroath with small scale fishing activity along the coast. The area provides a major transport corridor with the A92 road and the East-coast rail line.
The inshore waters of the area have played host to several sea-angling European festivals due to the high quality and presence of the fish. The Inshore Fisheries Groups (IFG) has been set up which aim to produce realistic fisheries management plans for each area that fit with the wider strategic goals of sustainable stocks, a healthy marine environment and a profitable fishing sector that supports strong coastal communities. Angus is part of the South-East IFG.
14

COMMUNITY LED LOCAL DEVELOPMENT: ANGUS LOCAL DEVELOPMENT STRATEGY
Angus Coastal Area Key Facts The population of the area is 40,200 of which over 50% are working age. The area is valued for its distinctive environment, the attractiveness and diversity
of its use and the opportunities available to develop this area. The area has been traditionally dependent on the service sector, retail,
food production and processing, fishing, agriculture and textile industries. The development of technology and the energy sector in the northeast has enabled diversification into engineering, oil, gas and pharmaceuticals.
Despite a dramatic downturn in the fishing industry, there is a stable creel industry and signs of diversification and even increased employment in the industry. There is also a buoyant fish processing industry.
The food and drink sector is well represented in the area, with several well-known companies operating locally. The traditional Arbroath Smokie and Aberdeen Angus beef have been joined by frozen foods, microwave meals, sea and river fish, spring water and soft fruits manufacturing.
There are several companies which operate in the oil and gas sub sector including multinational companies and local companies. In 2008, this sub sector employed over 2,000 staff in Angus. The FLAG area is well placed to take advantage of developments in the energy sector given it is geographically close to the North Sea Oil fields, the large number of companies currently engaged in the sector, and consequently a highly skilled staff base.
There is a rapidly growing tourism sector with golf tourism representing a key growth area given the importance of Carnoustie Golf Course and its role on the Open circuit and important links courses at Montrose and Monifieth.
There are 4 Special Areas of Conservation (SACs), 2 Special Protection Areas (SPAs), 1 RAMSAR site and 9 Sites of Special Scientific Interest (SSSIs) in the FLAG area
The area has key tourism attractions such as the world famous 200 year old Stevenson’s Bell Rock lighthouse, the oldest surviving sea washed lighthouse, Pictish relics, Arbroath Abbey etc. the coastal path network attracts walkers and cyclists.
The area displays the highest relative increase in migrants since 2002/03 of all Scottish local authorities, recording levels of three times the Scottish average, and four times that of the GB increase.
There is a lower level of people who have no qualifications and a higher percentage of people educated to NVQ 1, 2, 3 and 4 than national averages.
Average earnings in the area are consistently below the Scottish average. The levels of self-employment are higher in the area than the Scottish average.
15

COMMUNITY LED LOCAL DEVELOPMENT: ANGUS LOCAL DEVELOPMENT STRATEGY
BURGH PROFILESARBROATH
Arbroath, the largest town in Angus, is an ancient port dating back to Pictish times. The founding of the Abbey in 1174 began the recording of the town and the first harbour dated from 1394. Arbroath also has a Royal Charter from 1599. Perhaps most famous for being where the Declaration of Arbroath was signed in 1320, this has resulted in the Tartan Day festivities in Angus with Arbroath as the figurehead for this. The town is a popular holiday destination with caravan facilities and the oldest miniature railway in Scotland for people attracted by the seaside location or the world famous Bell Rock lighthouse and Arbroath Abbey or large annual festivals and events. Arbroath hosts an annual festival celebrating the sea and age-old dependency on the sea. Established in 1997 with funding from the Tayside and Fife PESCA Programme, Sea Fest is a popular celebration of Arbroath’s maritime heritage.
Arbroath is no longer a designated port for landing fish and although can sell fish but no sales take place in the fishmarket. There are however creel boats landing shellfish.
The fish processing market in Arbroath is very buoyant and more resilient than fishing since it can use fish from a number of sources. Arbroath Smokies, for which Arbroath is well-known nationally and internationally, are made solely in Arbroath following the award of Protected Geographical Indication in 2004, which limits Arbroath Smokie production to within 8 km of Arbroath Town Centre. The home of the Smokie however is perched on an exposed cliff 50 m above its tiny harbour - the small red sandstone fishing village of Auchmithie.
Auchmithie, once popular with smugglers who made use of local caves in the red sandstone cliffs, was the Musselcrag that featured in Sir Walter Scott's 'The Antiquary'.
Arbroath harbour is also used for tourism with trips out to world famous 200 year old Stevenson’s Bell Rock lighthouse, the oldest surviving sea washed lighthouse and Sea Angling also becoming more popular with cod, mackerel and ling all being caught. Large scale investment in the area has provided a new visitor centre and visitor orientated area including 59 floating finger pontoons which have a security entrance and are serviced with electricity and fresh water, to accommodate all types of leisure craft offering permanent or visiting berth facilities. The development of coastal path networks attracts walkers and cyclists to the area. There is also a strong maritime heritage which can be fostered and further developed.
Arbroath is also home to a campus of Angus and Dundee College, the only further education establishment in Angus. The College’s Angus Centre for Enterprise opened its doors in September 2011 to foster and encourage business start up and support. The College also has over 200 Modern Apprenticeships in high level Engineering (making them one of the biggest engineering trainers in the East of Scotland) with most positions being in the strategic Energy sector. This training asset is highly relevant to the growing Renewables sector.
16

COMMUNITY LED LOCAL DEVELOPMENT: ANGUS LOCAL DEVELOPMENT STRATEGY
MONTROSE
Montrose is the most northerly town situated between the mouths of the rivers South and North Esk. There are excellent road links to the A92 dual carriageway. There is a two-mile tidal lagoon, Montrose Basin, which is considered a nature reserve of international importance with over 50,000 migratory birds a year. It is also the largest inland salt water basin in the UK and lies at the mouth of the River South Esk, which has been designated a Special Area of Conservation (SAC) under the European Habitat’s Directive as it is home to internationally important populations of Atlantic Salmon and the Freshwater Pearl Mussel. The town is a popular tourism destination with camping and caravan facilities, various golf courses including the 5th oldest in the world and was until September 2011 an Open qualifying course. There is a rich history and heritage including William Lamb, Bamse and Montrose Air Station Heritage Centre.
Montrose is linked to the greater part of Angus through the natural corridor of the river South Esk Catchment, an inland waterway that offers a natural complement to the many environmental, recreational, tourist and cultural activities of the coastal areas.
In 2011 Angus Council commissioned a Strategic Review and Development Master-plan to support the regeneration of South Montrose - the area located south of the town centre leading to the north harbour area. The Strategic Review, identifies significant potential business opportunities and investment going forward. Once the draft Development Master-plan is ready, there will be full consultation with key stakeholders, landowners and local organisations, such as the community councils. The master-plan will take account of land use, development opportunities and access routes and will provide the comprehensive framework needed for the future development of the area.
More a port than a harbour, Montrose used to be popular with visiting trawlers but still maintains creel vessels. Until 1986 Montrose Harbour was solely used as an offshore support facility but now caters for both commercial and oil related shipping. The harbour lies within a mile of open sea and provides a sheltered haven almost half a mile long. There are no tidal restrictions to any of the berths in Montrose which offers around 1000 metres of riverside quay
Ferryden separated by the river but joined by a bridge was once a major fishing port. The Ferryden fishing fleet continued to grow throughout the 18th and 19th centuries. The establishment of salmon fishers boosted the trade while a Ferryden and Usans Fishermen’s Association managed the beds at Rossie. But by the 1920’s the fleet was in serious decline. Today however Usan Salmon Fisheries Ltd are now one of the last salmon companies in Scotland operating several netting stations along the Angus Coast from Montrose to Arbroath.
17
COMMUNITY LED LOCAL DEVELOPMENT: ANGUS LOCAL DEVELOPMENT STRATEGY
CARNOUSTIE
The town was founded in the late 18th century and grew rapidly throughout the 19th century due to the expansion of the local textile industry. It was popular as a tourist resort from the early Victorian era up to the latter half of the 20th century, due to its seaside location. It is best known for its associations with golf as a host venue for the Open. Golf tourism is a major contributor to the local economy. The Carnoustie Country Campaign has been highly successful in promoting golf particularly now in China where it is the second best known brand after St Andrews. However years ago salmon used to be caught in the salmon nets on the beach and the small fishing fleets of Westhaven and Easthaven caught cod for export and haddock. Today there is still some small scale creel fishing at Easthaven which continues to be a popular destination for visitors seeking out the rugged coastline and beautiful beaches of the Angus coast. Easthaven is also listed as the world’s oldest fishing village and in 2014 celebrates its 800th birthday with a Maritime Heritage celebration and in creating a Beechgrove community garden.
MONIFIETH
Monifieth, once part of Dundee, has many relics and sites of archaeological interest. The people of Monifieth played their part in the whale and sea industry which thrived in the eighteenth and mid-nineteenth century and the area was famous for its mussel beds. Presently current practices of gathering whelks and mussels for commercial purposes has drastically reduced the different types of seabirds/wildlife fowl that used to habitat the area all year round. Local initiatives to try and have this ceased are in progress. As the adjacent area is a SSRI at Barry Buddon it would be appropriate to have the opportunity to allow nature to replenish itself.
Today the town suffers from its close locality to a large city but lack of any community facilities. Nevertheless it is a holiday destination with two large caravan parks and is noted as a golfing centre with the Scottish Amateur Golf Championship and the qualifying rounds for the Open Championships held here. The beach and dunes are a major attraction and there are a broad range of sites designated for their natural heritage value.
Sectoral Structure of the Angus Coastal area The area was traditionally dependent on the service sector, retail, food production and processing, fishing and textile industries. The development of technology and the energy sector in the northeast has enabled diversification into engineering, oil, gas and pharmaceuticals. There is also a rapidly growing tourism sector.
In 2008, employment in the Angus area was dependent on the service sector, which accounted for 72% of jobs, the most significant sectors being public administration, education and health (29% of employees in employment) and retail, wholesale and hotels (23%). In 2009, employment in Angus was dependent on the service sector, which accounted for 77% of jobs, the most significant sectors being ‘retail, wholesale, accommodation and food’, which accounted for 24% of jobs. This was only exceeded by ‘’Other Services’’ which includes public administration, health, and education, which accounted for 36% of jobs. (Source: Scottish Government Analytical Services division, April 2011).
Distinctive features of the Angus economy are its relatively high and increasing share of employment in manufacturing and its reliance on primary industries, in particular agriculture and fishing at 5% compared with 2% for Scotland as a whole. Research conducted by DTZ Pieda suggests that Angus has an over-dependence on some slow growing/declining sectors while having a relative lack of growth activities (such as business services and electronics) with the economy showing relatively few signs of overall dynamism.
18

COMMUNITY LED LOCAL DEVELOPMENT: ANGUS LOCAL DEVELOPMENT STRATEGY
Approximately 3,600 (9.7%) people are employed in the tourism sector in Angus. This is higher than the Scottish average of 8.9%. Tourism expenditure in Angus has been increasing since 2004.
Previous trends show that the only growth in employment in Angus has been in the service sector, however due to budget constraints growth has stopped and 2010 could possibly reveal a decline. The reduction in the primary sector has contributed to some of the population decline and the current difficulties faced by agriculture may well place already fragile areas under further pressure. It is useful to bear in mind, that whilst the number of employees in Scotland grew by 10%, the number of employees in Angus grew by 16.1%.
Fishing
Fishing is an important part of the Angus economy offering direct employment in catching, aquaculture and processing. Fishing has been one of Angus' key industries from as far back as Viking times with its ideal concentration of coastal areas. T
The Angus Coastal FLAG area has always had a major involvement with the sea with fishing centred on near and middle-distance waters including the North Sea and further afield in the Norwegian waters. These distant-ground catches were landed by Angus fishermen at Aberdeen. The pattern however changed in the mid-1970’s when countries began to declare Exclusive Economic Zones (EEZ) extending to 200 miles and, in consequence, the distant grounds became closed to UK fishermen. For many fishing areas, the large deep-sea vessels could not operate economically in home waters. Today, in the league table of UK landings, Scottish ports make up eight of the top twelve by weight, and nine by value and although Scotland has only 8.6% of the UK population, the Scottish fish catching sector accounted for 62% of the value of fish landed in the UK in 2002.
Considering jobs dependent on fishing in activities such as ship repair, equipment supplies, marketing and transport, the industry equates to about half employment dependent on North Sea oil when that operation was at its peak. Moreover, like agriculture but unlike many other industries that are more transient, it is an industry that has contributed to the Angus economy since the earliest times.
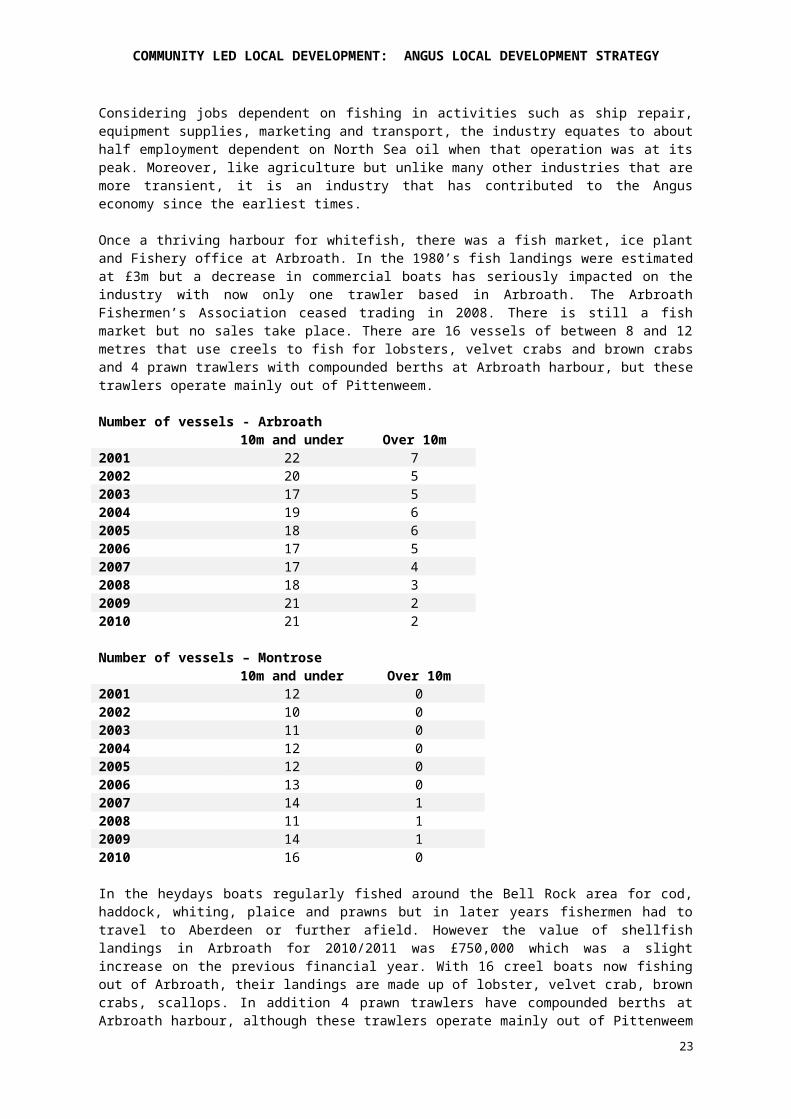
Once a thriving harbour for whitefish, there was a fish market, ice plant and Fishery office at Arbroath. In the 1980’s fish landings were estimated at £3m but a decrease in commercial boats has seriously impacted on the industry with now only one trawler based in Arbroath. The Arbroath Fishermen’s Association ceased trading in 2008. There is still a fish market but no sales take place. There are 16 vessels of between 8 and 12 metres that use creels to fish for lobsters, velvet crabs and brown crabs and 4 prawn trawlers with compounded berths at Arbroath harbour, but these trawlers operate mainly out of Pittenweem.
Number of vessels - Arbroath10m and
underOver 10m
2001 22 72002 20 52003 17 52004 19 62005 18 62006 17 52007 17 42008 18 32009 21 22010 21 2
19

COMMUNITY LED LOCAL DEVELOPMENT: ANGUS LOCAL DEVELOPMENT STRATEGY
Number of vessels – Montrose10m and
underOver 10m
2001 12 02002 10 02003 11 02004 12 02005 12 02006 13 02007 14 12008 11 12009 14 12010 16 0
In the heydays boats regularly fished around the Bell Rock area for cod, haddock, whiting, plaice and prawns but in later years fishermen had to travel to Aberdeen or further afield. However the value of shellfish landings in Arbroath for 2010/2011 was £750,000 which was a slight increase on the previous financial year. With 16 creel boats now fishing out of Arbroath, their landings are made up of lobster, velvet crab, brown crabs, scallops. In addition 4 prawn trawlers have compounded berths at Arbroath harbour, although these trawlers operate mainly out of Pittenweem in Fife. Much of the catch is exported to Europe. In addition more boats are now being attracted to the area from Fraserburgh and further afield to fish for squid, a catch that is more in demand
The lobster stock is exceptionally strong in the area with big landings in the last ten years. This is despite a steady increase in creel vessels/creels. The creel fleet fishes from not only Arbroath but also Montrose and Carnoustie.
There is also a well established fishery in the area for brown crab. Velvet crab, a higher value unit than brown crab are generally exported to Spain. There was a marked increase in numbers of landings between 2006-2008 but a noticeable drop in landings in Arbroath/Montrose in 2009.
Recently more time and effort has been diverted to handline mackerel fishing, a high quality product, offering opportunities for diversification into low impact sustainable fishing with low operating costs.
Montrose Harbour continues to have creel boats and one trawler and is also regularly used for scallop landings.
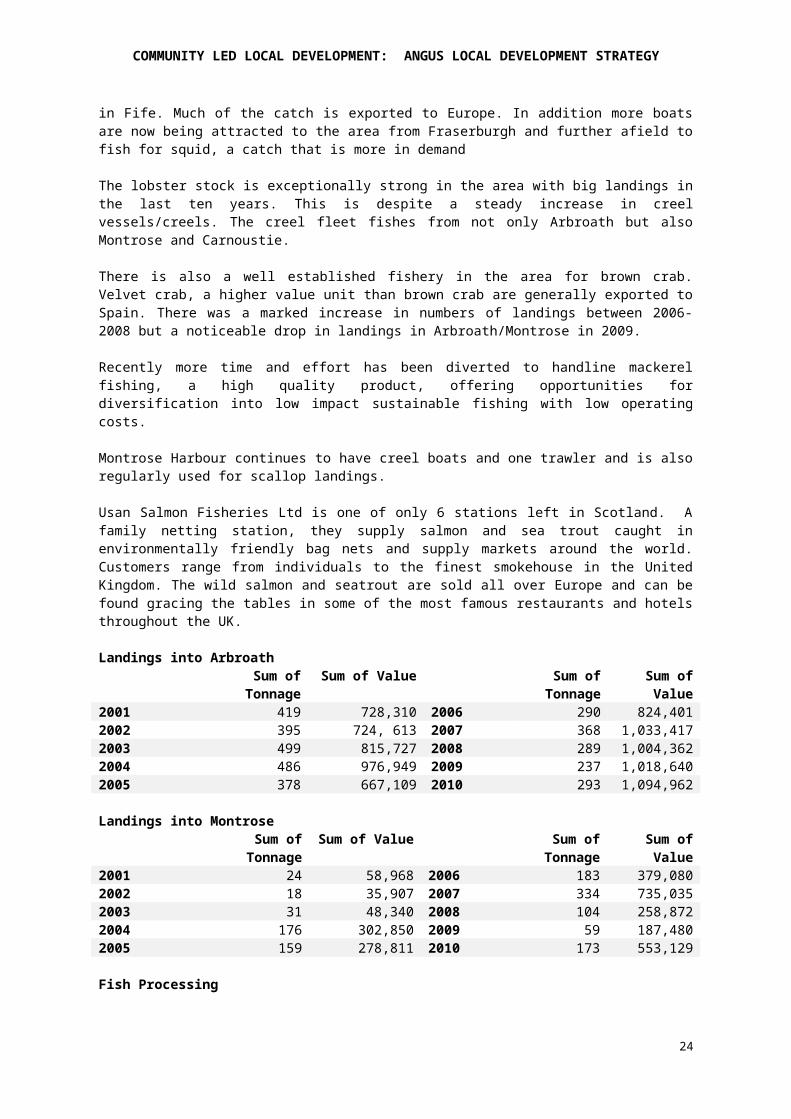
Usan Salmon Fisheries Ltd is one of only 6 stations left in Scotland. A family netting station, they supply salmon and sea trout caught in environmentally friendly bag nets and supply markets around the world. Customers range from individuals to the finest smokehouse in the United Kingdom. The wild salmon and seatrout are sold all over Europe and can be found gracing the tables in some of the most famous restaurants and hotels throughout the UK.
Landings into ArbroathSum of
TonnageSum of Value Sum of
TonnageSum of
Value2001 419 728,310 2006 290 824,4012002 395 724, 613 2007 368 1,033,4172003 499 815,727 2008 289 1,004,3622004 486 976,949 2009 237 1,018,6402005 378 667,109 2010 293 1,094,962
Landings into MontroseSum of
TonnageSum of
ValueSum of
TonnageSum of
Value2001 24 58,968 2006 183 379,080
20

COMMUNITY LED LOCAL DEVELOPMENT: ANGUS LOCAL DEVELOPMENT STRATEGY
2002 18 35,907 2007 334 735,0352003 31 48,340 2008 104 258,8722004 176 302,850 2009 59 187,4802005 159 278,811 2010 173 553,129
Fish Processing
The fish processing market in Arbroath is very buoyant and more resilient than fishing since it can use fish from a number of sources. To remain competitive, some Arbroath fish processors such as RR Spink & Son have diversified into smoking salmon and trout as well as haddock using the same equipment and skills. RR Spink & Son is Angus' largest processing company employing around 90 people with a turnover of over £5.5 million in 2002. The Spink family handed down their smoking, seasoning and curing techniques through three centuries of generations using that knowledge to make the best use of fish harvests and to produce the best fish in the world. These techniques now contribute to the area’s tourism industry.
Niche Market - Arbroath Smokies
Arbroath Smokies, for which Arbroath is well-known nationally and internationally, are made solely in Arbroath following the award of Protected Geographical Indication in 2004, which limits Arbroath Smokie production to within 4 km of Arbroath. Smokies are made from haddock using traditional methods dating back to the late 19th century where the fish are first salted overnight to preserve them before being left tied in pairs to dry. Next, the dried fish are hung in a special barrel containing a hardwood fire and covered with a lid. After around an hour of smoking, the fish are golden brown and ready to eat. The preparation of Smokies remains a cottage industry in Arbroath, centred almost exclusively at the harbour area, though one larger processor, RR Spink, supplies Arbroath Smokies to several UK supermarket chains and to HM Queen Elizabeth II for which the company holds a Royal Warrant.
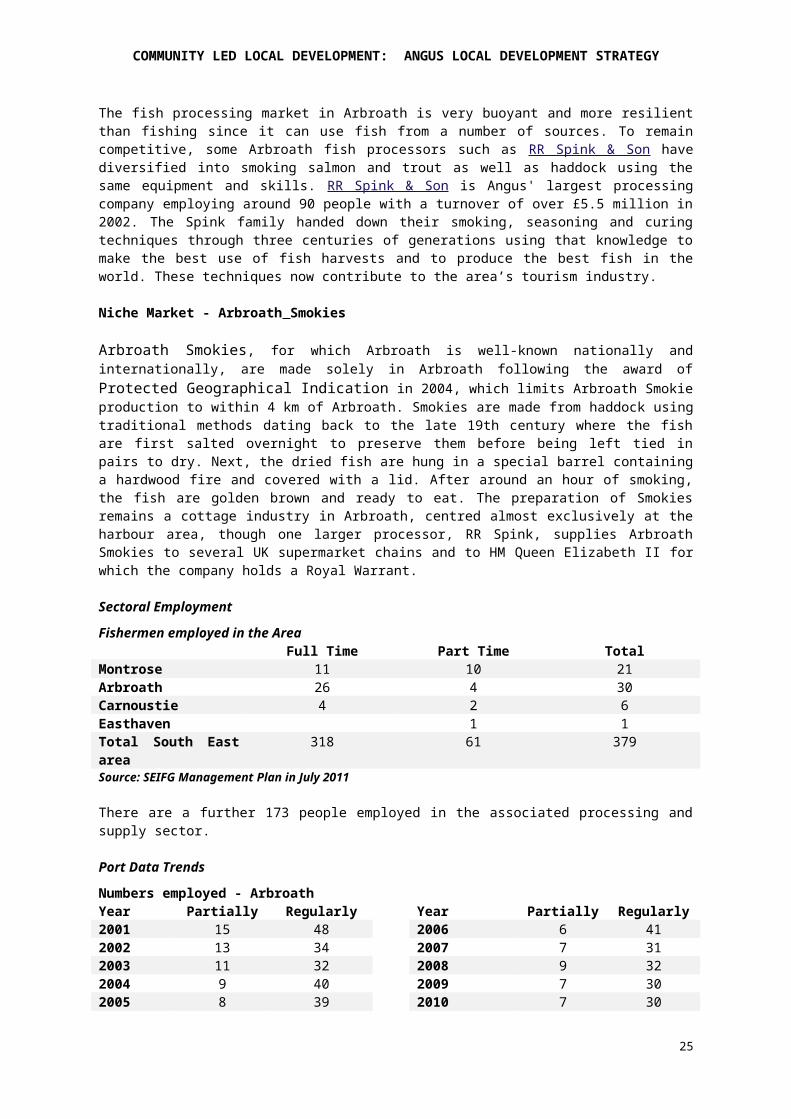
Sectoral EmploymentFishermen employed in the Area
Full Time Part Time TotalMontrose 11 10 21Arbroath 26 4 30Carnoustie 4 2 6Easthaven 1 1Total South East area
318 61 379
Source: SEIFG Management Plan in July 2011
There are a further 173 people employed in the associated processing and supply sector.
Port Data TrendsNumbers employed - ArbroathYear Partially Regularly Year Partially Regularly2001 15 48 2006 6 412002 13 34 2007 7 312003 11 32 2008 9 322004 9 40 2009 7 302005 8 39 2010 7 30
Numbers employed - MontroseYear Partially Regularly Year Partially Regularly2001 11 2 2006 9 52002 10 3 2007 15 92003 12 3 2008 7 13
21

COMMUNITY LED LOCAL DEVELOPMENT: ANGUS LOCAL DEVELOPMENT STRATEGY
2004 12 4 2009 7 132005 14 3 2010 10 11
22
COMMUNITY LED LOCAL DEVELOPMENT: ANGUS LOCAL DEVELOPMENT STRATEGY
Arbroath Harbour Arbroath Harbour is located at 56° 33’ N, 2° 35’ W. Usage of the port is from a mixture of commercial fishing vessels and small craft offering day trips to anglers and sightseers, and leisure craft. All harbour users regardless of type are actively encouraged to make use of the harbour and available support services.
Half height dock gates with a walkway are located between the inner and outer harbours maintaining a minimum of 2.5m of water in the inner harbour at all times. This allows the 59 floating finger pontoons which have a security entrance and are serviced with electricity and fresh water to accommodate all types of leisure craft offering permanent or visiting berth facilities.
Outer harbour Water area 33⁄4 acres Length 550ft (167.64m) Width 260ft (79.24m) Depth at entrance M.H.W.S 15ft (4.57m) Depth at entrance M.H.W.N 111⁄2 ft (3.50m) Depth at entrance M.L.W.N 4ft (1.21m) Depth at entrance M.L.W.S 2ft (0.60m) Depth at entrance H.W. Highest Springs 18ft (5.48m) Depth at entrance H.W. Lowest Neaps 11ft (3.35m) Length of quayage 1,480ft (451.10m) Depth of quayside at ordinary springs H.W 15ft (4.57m) Depth of quayside at ordinary springs L.W 2ft (0.61m)Inner harbour Water area 21⁄2 acres Length of dock 420ft (128.02m) Width of dock 260ft (79.25m) Length of quayage 880ft (266.93m) Length of entrance 70ft (21.37m) Width of entrance 40ft (12.2m)Patent slip (only vessels up to 25m accepted for washdown purposes) Extreme length 446ft (136m) Length of cradle 110ft (33.53m) Draught on keel blocks at H.W. OST Fore: 11ft (3.44m) Aft: 15ft (4.66m) Lifting capacity 250 tonnes Difference between H.W. at OST and ONT 4ft (1.22m) Capable of taking ships up to 100 ft (30.49m) A lifeboat and an inshore rescue craft are stationed at the harbour.
23
COMMUNITY LED LOCAL DEVELOPMENT: ANGUS LOCAL DEVELOPMENT STRATEGY
The move to a more leisure craft based activity at the harbour has been very successful with a waiting list of 50 for pontoons. Compounded berths, which are available to vessels tying up along the quaysides, are also operating at capacity. Priority for compounded berths has historically been given to commercial or fishing vessels and only if there is berthing space available within the harbour. The current waiting list for a compounded berth is made up of approximately 70 non-commercial vessels. The marina, which opened in 2004, has also grown to become a popular destination for yachts and cruisers on longer voyages. The number of visiting craft is on the increase and this year included a number of high-profile multi-million pound vessels. The numbers of visiting craft to the harbour from October 1, 2009 up to 30 September 2010 was 249 an increase of 16% on the previous year and is a positive trend in representing the attractiveness of the harbour for visitors
Montrose HarbourMontrose Harbour is very central with good road and rail communication links with other major cities and its storage facilities make it the ideal centre for international trade and distribution throughout Scotland and Northern England.
The harbour lies within a mile of open sea and provides a sheltered refuge almost half a mile long. There are no tidal restrictions to any of the berths in Montrose which offer around 1000 metres of riverside quay. The North Sea Oil and Gas industry which is now well established is an important trade in the port. This is fully under control of the Port Authority and consists of "One Stop" berths for offshore support vessels with open storage, office accommodation and over 10,000sq. metres of warehousing immediately adjacent to the berths.
The Port Authority is responsible for the development of the offshore supply base and has successfully combined both commercial and offshore operations, giving greater flexibility to all its customers.
The Authority provides or arranges through agents most port services including round the clock pilotage, bunkering by road tanker, waste removal from ships and quays, craneage.
Offshore Support and ConstructionThe South Quay of the Port was custom built in 1974 to meet the demands of the offshore industry. Until 1986 it was solely used as an offshore support facility but now caters for both commercial and oil related shipping.
Facilities available include fabrication and engineering workshops, open storage, fabrication yards, office accommodation, warehousing, silo pads, waste oil reclamation.
A wide range of companies have used the facilities on South Quay, including Shell, Hamilton Brothers, Brown & Root, Deminex, Marathon, Total AOCI, Amoco, Britoil, Chevron, Coflexip, Drexel, Merpro, Monsanto, Mobil, Occidental, Ranger, Texaco, BP, Viking Marine, Vetco, Transocean and Dowell Schlumberger.
Projects undertaken during this time include the hook-ups of the MCPO1 (Total) Brent 'C' (Shell) and the Fulmar 'A' (Shell) and the fabrication and load outs of offshore accommodation modules including the load out of a 615 tonne two-storey module with heli-deck for Arco's Thames project. Other projects handled on the South Quay include pipe laying, support, the servicing, fabrication and load out of risers, pipe spools, jointing testing and load out of umbilicals, mobilising/de-mobilising of vessels and general offshore shipping operations
CargoesThe port of Montrose is the largest pulp handling port in Scotland and one of the largest in the UK. Its prime location, midway between Scotland's main papermaking centres of Aberdeen and Fife, make it the obvious destination for pulp producers shipping their products from North and South America, Scandinavia, Spain, Portugal and France.
24
COMMUNITY LED LOCAL DEVELOPMENT: ANGUS LOCAL DEVELOPMENT STRATEGY
Montrose's expertise in the handling of pulp has been built up over many years of handling the product landed at the port. A modern fleet of forklift trucks equipped with clamp attachments take care of the physical handling of the pulp blocks. Craneage with a comprehensive range of lifting capacities is also available.
Equally important is the availability of extensive storage facilities. Over 375,000 square feet of warehouse space on the Montrose docks provides the shelter essential for safe storage of pulp.
As well as pulp Montrose handles the export of forestry products. This trade embraces the export of timber rounds, originating in the well-stocked woodlands and forests of the North East of Scotland, and generally bound for the pulp mills of Sweden.
Forest products are handled on all quays. Computerised weighbridges ensure accurate and fast weighing and recording of loads. This greatly facilitates the smooth flow of vehicles through the docks, resulting in reduced transit time and costs.
The Port of Montrose has excellent facilities for the handling of a wide range of dry bulk commodities for export and import. Malting barley, feed barley, oats, rapeseed and wheat - grown in the rich agricultural hinterland of East Coast of Scotland - are exported to destinations around the world. The volume of grain which can be accommodated has dramatically increased.
Grain is handled on both the north and south quays, where computerised weighbridges ensure accurate recording of weights and instant calculation of tonnage charges, facilitating fast throughput of vehicles.
Cargo handling for discharge is by means of mobile cranes and grain elevators with loading capabilities of up to 400 tonnes per hour. Transport for movement of grain is readily available on site or through local companies. Local firms provide complete agency, stevedoring and haulage services. With substantial tonnages of grain moving through the Port, there is considerable expertise in grain handling.
Trade in paper is also a significant cargo for Montrose Harbour. Most cargoes originate from Scandinavia but there are also regular shipments from America.
All types of paper products are handled, although sack kraft for paper bag manufacturers and fluting paper for the corrugators have been regular trades. Proper attention to the handling and storage of paper is a vital consideration for shippers. At Montrose a range of specialised equipment ensure that reels are handled quickly and with care.
TourismThe tourism sector in the Angus Coastal area is very diverse but with key priorities of Food and Drink, Golf Tourism, Outdoor Tourism and Ancestral Tourism. Supporting events and cultural and heritage tourism are also priorities for the Angus Tourism Strategy.
The importance of maritime heritage is acknowledged from cultural facilities such as traditional communities and buildings, the Bell Rock Lighthouse and boatbuilding and repair to oral tradition and organisations interested in the preservation of the maritime heritage. Maritime heritage can create employment and tourism growth as well as conservation and awareness of heritage.
Food and DrinkAngus participates well in this sector at present having the largest percentage of growth in the Tayside wide area. It is important that this growth is continued and is managed in a sustainable manner. Soft fruit, vegetables, grain, potatoes, beef and lamb are all produced in the FLAG area. Fishing has been one of the most important local industries for centuries. High quality jams and marmalades are exported worldwide from Arbroath.
25

COMMUNITY LED LOCAL DEVELOPMENT: ANGUS LOCAL DEVELOPMENT STRATEGY
Angus food production and processing businesses attribute their success to the ability to source raw materials locally, a skilled labour force and effective transport links to their markets. It is vitally important that these resources and skills are nurtured and developed.
There are currently a range of Food & Drink sector initiatives being developed in Angus, including product development, marketing, training, innovative “local” distribution systems and the sharing of best practice models.
26

COMMUNITY LED LOCAL DEVELOPMENT: ANGUS LOCAL DEVELOPMENT STRATEGY
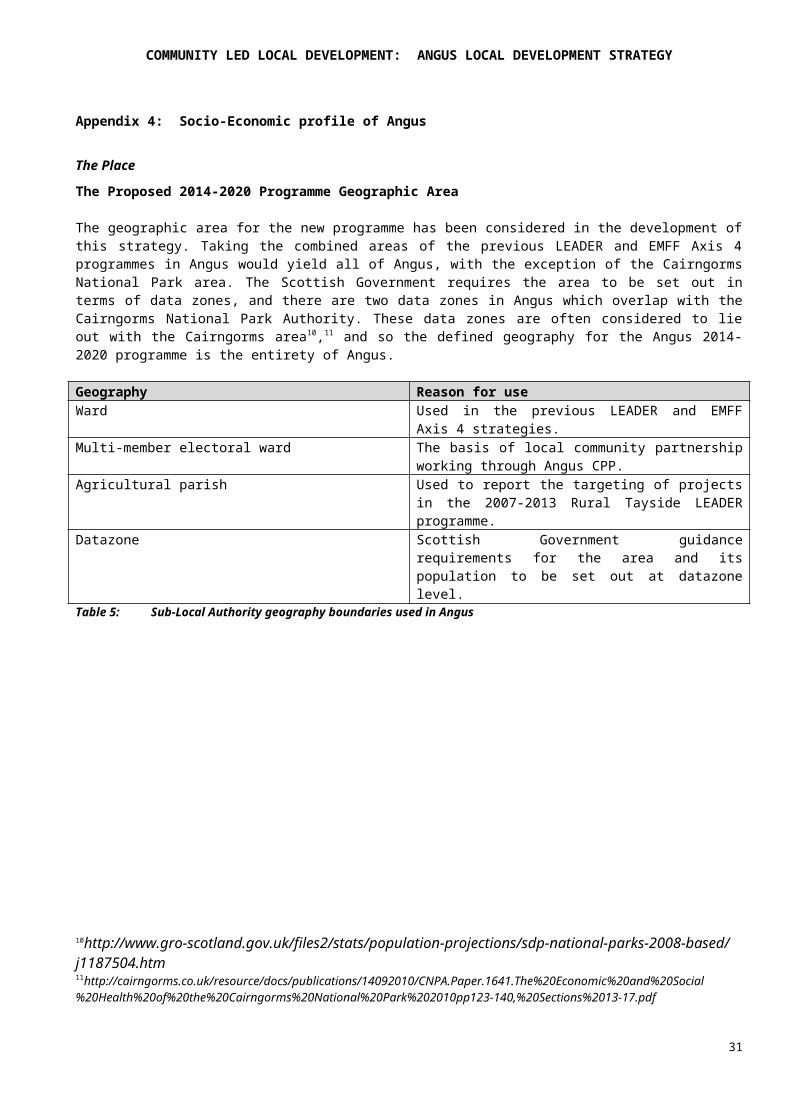
Appendix 4: Socio-Economic profile of Angus
The PlaceThe Proposed 2014-2020 Programme Geographic Area
The geographic area for the new programme has been considered in the development of this strategy. Taking the combined areas of the previous LEADER and EMFF Axis 4 programmes in Angus would yield all of Angus, with the exception of the Cairngorms National Park area. The Scottish Government requires the area to be set out in terms of data zones, and there are two data zones in Angus which overlap with the Cairngorms National Park Authority. These data zones are often considered to lie out with the Cairngorms area10,11 and so the defined geography for the Angus 2014-2020 programme is the entirety of Angus.
Geography Reason for useWard Used in the previous LEADER and EMFF Axis 4
strategies.Multi-member electoral ward The basis of local community partnership
working through Angus CPP.Agricultural parish Used to report the targeting of projects in the
2007-2013 Rural Tayside LEADER programme.Datazone Scottish Government guidance requirements for
the area and its population to be set out at datazone level.
Table 5: Sub-Local Authority geography boundaries used in Angus
10http://www.gro-scotland.gov.uk/files2/stats/population-projections/sdp-national-parks-2008-based/j1187504.htm11http://cairngorms.co.uk/resource/docs/publications/14092010/CNPA.Paper.1641.The%20Economic%20and%20Social%20Health%20of%20the%20Cairngorms%20National%20Park%202010pp123-140,%20Sections%2013-17.pdf
27
COMMUNITY LED LOCAL DEVELOPMENT: ANGUS LOCAL DEVELOPMENT STRATEGY
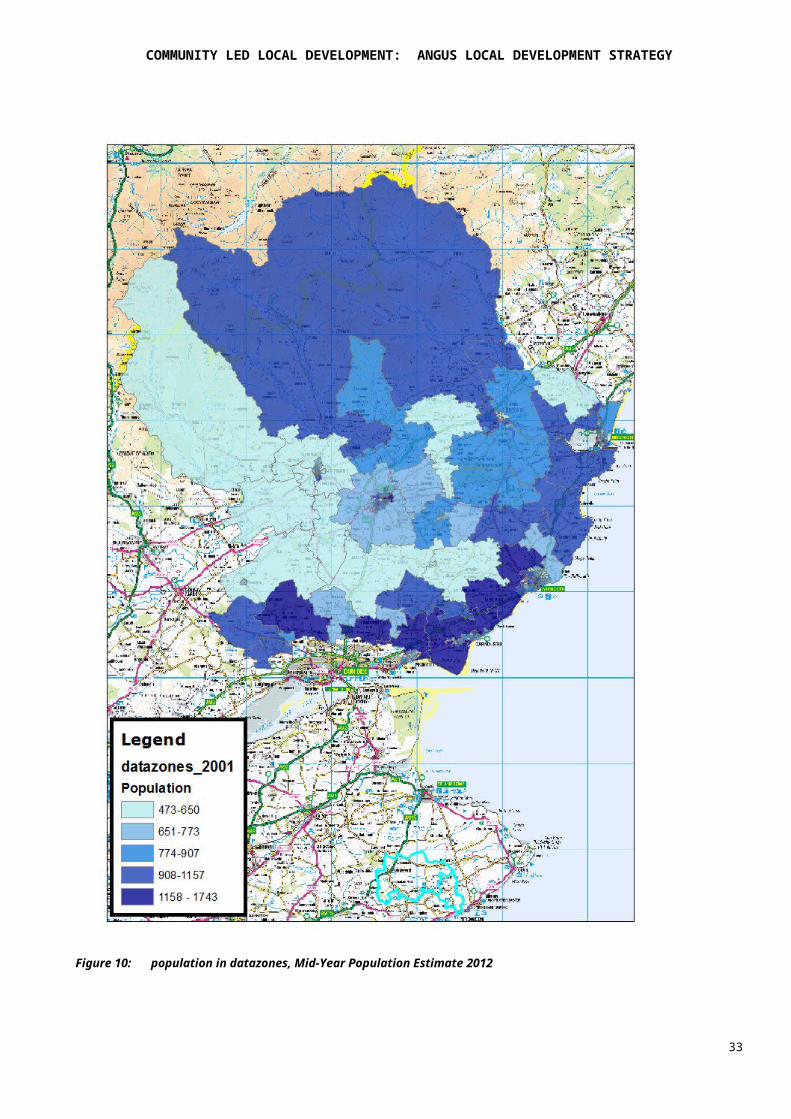
Population and Population DensityAngus has approximately 116,200 residents12. The population and commerce centres are the seven towns of Arbroath, Forfar, Montrose, Carnoustie, Brechin, Monifieth and Kirriemuir. Almost two thirds of the population live in the coastal area of Angus, approximately one third in the Strathmore valley and just a small percentage in the Glens13.
Figure 9: Populations of localities in Angus 201014
The populations are also mapped out by datazone, and presented as a table in the appendices (Appendix 6, page 99).
12 ONS mid-year population estimate, 201213 State of the Environment, Report for Angus 201114 Mid-Year Population Estimate 2010 (latest), General Register Office for Scotland
28

COMMUNITY LED LOCAL DEVELOPMENT: ANGUS LOCAL DEVELOPMENT STRATEGY
Figure 10: population in datazones, Mid-Year Population Estimate 2012
29
Monifieth
Carnoustie
Arbroath
Montrose
Brechin
Kirriemuir
Forfar
COMMUNITY LED LOCAL DEVELOPMENT: ANGUS LOCAL DEVELOPMENT STRATEGY
The urban/rural make-up of Angus is notable for the lack of extremes; the small percentage of large urban area is from the parts of Angus in Dundee, and there is only a very small percentage of remote rural areas. Indeed, as remarked in the 2010 Angus Economic Digest, Angus as a whole is “regarded as neither remote rural nor urban”. It is interesting to note that while over half of the population live in urban settlements, the rural datazones comprise a significant proportion of the geographic area of Angus and there is a much larger percentage of the population living in accessible rural areas in Angus than Scotland overall. The importance of towns maintaining and building strong relationships with their rural hinterland is essential for ensuring that rural Angus can continue to develop.
Large urban (%)
Other urban (%)
Accessible small towns
(%)
Remote small towns
(%)
Accessible rural (%)
Remote rural (%)
Angus 7.8 52.9 11.6 0.0 27.0 0.8Scotland 39.1 30.4 8.7 3.7 11.6 6.5
Table 6: Urban Rural Classification, 2011-201215 - proportion of the population classified in each of six urban/rural categories.
15 Scottish Government Urban Rural Classification, 2011-2012
30
COMMUNITY LED LOCAL DEVELOPMENT: ANGUS LOCAL DEVELOPMENT STRATEGY
Figure 11: Urban / Rural Classification of Data Zones in Angus
Despite the lack of extremes in terms of urban/rural classification, the density of the population is highly variable across the different datazones (Figure 12)
31
Monifieth
Carnoustie
Arbroath
Montrose
Brechin
Kirriemuir
Forfar

COMMUNITY LED LOCAL DEVELOPMENT: ANGUS LOCAL DEVELOPMENT STRATEGY
Figure 12: Population density in datazones, Mid-Year Population Estimate 2012
32
Monifieth
Carnoustie
Arbroath
Montrose
Brechin
Kirriemuir
Forfar
COMMUNITY LED LOCAL DEVELOPMENT: ANGUS LOCAL DEVELOPMENT STRATEGY
Infrastructure and TransportApart from the East Coast Main Railway Line, which links the coastal towns of Angus to Edinburgh, Glasgow, Aberdeen and the rest of the UK, the network of public transport in Angus is based mainly on bus services. Compared with Scotland, more people in Angus access their place of work by foot or by car but fewer people use the train or the bus16. Many people in Angus (18,00017) travel out of Angus to work, most of these travelling to Dundee. Car use and car ownership has been on a steady increase in Angus, and is anticipated to continue increasing18.
Although linking the towns in Angus well, in rural areas, particularly the glens, accessibility through the bus services remains very challenging. The 2012 Angus Economic profile also notes that high fares for public transport can be problematic for some people on lower income. In terms of the Scottish Index of Multiple Deprivation, nearly a quarter (24.6%) of the datazones in Angus are in the 15% most access deprived in Scotland19 (Figure 14). The most deprived datazone in Angus is in the Angus Glens, and this datazone is in the 5% most access deprived areas in Scotland.
Volumes of traffic have increased significantly since 1998, most notably the volume of light goods vehicles having increased by 35%20. A weakness in the transport infrastructure in Angus is that roads in rural areas are often insufficient for acting as a major route for freight, such as timber transport.
In terms of public paths, networks of sign-posted paths, tracks and minor roads have been developed in Angus in recent years, notably around Arbroath, Brechin, Forfar, Kirriemuir and Monifieth. Cycle lanes have also been developed over the last decade.
In the coastal region, Montrose port deals with approximately 700,000 tonnes of cargo each year, including agricultural cargo, timber and chemical products21.
16 Scottish Census 201117 Angus Economic Profile 201218 Angus Economic Profile 201219 Scottish Index of Multiple Deprivation 2012 (http://www.scotland.gov.uk/Resource/0041/00410718.pdf)20 State of the Environment, Report for Angus 201121 Angus Economic Digest 2010
33

COMMUNITY LED LOCAL DEVELOPMENT: ANGUS LOCAL DEVELOPMENT STRATEGY
Information and Communications TechnologyThere has been a year-on-year increase in home internet access across Scotland, with 74% of households having access in 2011. The recent announcement of rollout of superfast broadband across Scotland through Digital Scotland should see a marked increase in access across Angus during this programme, although this a significant proportion of Angus which is still “Under Evaluation” in terms of the timeframe for access22.
The risk of a rural/urban divide being formed in terms of access to broadband is significant, and this is important for both individuals and businesses in Angus23. There is a “challenge facing rural areas in how best to facilitate the development of these technologies”24. Continued improvements in access to broadband across Angus will be important for maximising the impact that business and community organisations can have in rural and fisheries areas.
22http://www.digitalscotland.org/media/16354/ros_171013.pdf, accessed 26/02/1423 Angus Economic Digest 201024 Angus Economic Digest 2010
34

COMMUNITY LED LOCAL DEVELOPMENT: ANGUS LOCAL DEVELOPMENT STRATEGY
-Figure 13 Geographic Access Deprivation (SIMD) across Angus.
35

COMMUNITY LED LOCAL DEVELOPMENT: ANGUS LOCAL DEVELOPMENT STRATEGY
Environment
The diverse landscape and environment in Angus is host to a diverse set of habitats and species, with 3825 recognised national and international natural heritage sites. This includes Sites of Special Scientific Interest across Angus, such as the Montrose Basin, Auchterhouse Hill and Monifieth Bay.
There are also a number of cultural heritage sites, including almost 400 Scheduled Ancient Monuments26 , and there are over 200 listed buildings. Over 90 buildings are listed on the 2009 “Buildings at Risk” register, with residential and farming buildings being the most numerous amongst these.
In 2011, a “State of the Environment” report was produced by Angus Council, which described environmental changes in Angus since the previous similar report in 2006, i.e. around the time at which the previous LEADER programme started. The main changes of environmental indicators noted in the State of the Environment report were:
Improving Satisfaction with the quality of surroundings in Angus Public concern about noise Visitor numbers to key/selected sites Coastal water quality Bathing water quality Vacant and derelict land New development split between Greenfield and Brownfield sites Air quality complaints Mode of travel for school children Dedicated cycle lanes in Angus Path structure in Angus Recycling of household and commercial waste
Worsening Quality of lochs Flooding Nitrate vulnerable zones Potentially contaminated land Traffic volume in Angus Mode of traffic to work in Angus Angus’ changing climate Extreme weather events in Angus Waste arising in Angus
25 State of the Environment, Report for Angus 201126 State of the Environment, Report for Angus 2011
36

COMMUNITY LED LOCAL DEVELOPMENT: ANGUS LOCAL DEVELOPMENT STRATEGY
The Angus Economic Profile, 2012, highlights climate change as being of central importance for the environment, and anticipates that some of the probable major changes to the landscape could be more intense agricultural activity due to improved climate conditions (drier, warmer summers and longer growing season) but increased risk from coastal flooding due to sea level rises. Another central factor which could have an impact on the landscape is the development of renewable energy production (small/medium wind farms, biomass and electrical infrastructure).
HousingOver the recession, the supply of new housing has decreased across Scotland and Angus. There are four Housing Market Areas (HMAs) in Angus: Arbroath; Montrose and Brechin; Carnoustie, Monifieth and the Sidlaws; and Forfar, Kirriemuir and the Angus Glens. The Angus Economic Digest27 highlighted that in Carnoustie, Monifieth and the Sidlaws, the need for social housing is much greater than the supply and there is still a need there for affordable housing options. However, there has been recent investment in council housing around Carnoustie28. There is “moderate demand” for social housing in Forfar, Kirriemuir and the Angus Glens. As in other parts of Scotland, first time buyers in Angus are finding it more and more difficult to buy property29. Nearly half of houses built between 2002 and 2006 in Angus were sold to people from outside Angus.
Average house prices in Angus (149,936 for Oct-Dec 201330) remain below the Scottish average. In terms of the Scottish Index of Multiple Deprivation, none of the datazones in Angus were in the 15% most deprived datazones in Scotland; the most deprived datazone is amongst Scotland’s 25% most deprived and is found in Letham and Glamis.
Figure 14: Supply of new housing in Scotland and Angus31
27 Angus Economic Digest 201028 Angus Economic Profile 201229 Angus Economic Digest 201030 Registers of Scotland Executive Agency, Quarterly House Price Statistical Report31 Scottish Government, Supply of new housing in Scotland: local authority time series tables
37
COMMUNITY LED LOCAL DEVELOPMENT: ANGUS LOCAL DEVELOPMENT STRATEGY
CrimeAccording the 2012 Scottish Index of Multiple Deprivation, just over 9% of Angus’ datazones were in the 15% most deprived in Scotland. This is slightly higher than the figure of 7.7% in 2006. The most deprived datazone is in the Arbroath Harbour Intermediate Zone.
The PeopleAngus has 116,200 residents32, of whom 62% (72,000) are of working age (16-64), slightly lower than the national (Scottish) average of 65.4%. Like the rest of Scotland, Angus has an ageing population; the median age of both males (43) and females (45) are higher than for Scotland and in Angus more than 10% of the population are 65 or over, compared to approximately 8% over Scotland33. In the time up to 2035, the age group expected to increase the most is 75+ (as per the rest of Scotland), yet the under 16 population is set to decline slightly34. In Angus, the decrease in the proportion of working age population could mean that there is a shortage of local labour to meet employment needs. Further, the rise in the number of older people could mean increased pressure on services.
Figure 15: Age profile in Angus35
32 ONS mid-year population estimate, 201233 Scotland Census 201134 National Records of Scotland – Angus Council Area Demographic Factsheet35 ONS mid-year population estimate, 2012
38

COMMUNITY LED LOCAL DEVELOPMENT: ANGUS LOCAL DEVELOPMENT STRATEGY
Some important other key facts about the people in Angus from the 2011 Census are shown below:
Marital status: Relative to the rest of Scotland, there is a high proportion of people in Angus who are married or in a registered same-sex civil partnership (51.4% vs. 45.4% nationally36).
Scottish identity: There is a strong sense of Scottish identity in Angus, with nearly 67% identifying themselves as Scottish only (compared to 62% across Scotland).
Length of residence and migration: There is a large population base in Angus – nearly half of all residents (49%) - that have resided in the UK for more than 10 years, compared to only 37% across Scotland. In recent years (2009-2011) there has been an average net influx of 230 people migrating to Angus per year (3628 in, 3398 out). Young people (16-29) are the biggest movers, both into and out of Angus37. The 2011 Census found that there were 4999 people in Angus (approximately 4.3% of the population) who were born outside the UK or Ireland, and that compared to Scotland a greater proportion of these (32%) were from EU accession countries.
Health: General health across Angus is good, with 84.1% reporting good or very good health, compared to 82.2% across Scotland.
Economic Activity and Employment Rates
As expected for an economy with significant rural population38, the employment rate has remained higher in Angus than the rest of Scotland, although there has been a marked reduction in the last few years, from nearly 78% in 200939 to 73% in 201340. Importantly, the difference between the Angus employment rate and Scottish employment rate has decreased since 2007 (Figure 16). Similarly, the proportion of working age people who are economically active has declined dramatically in Angus since the last LEADER programme began in 2007 (Figure 17).
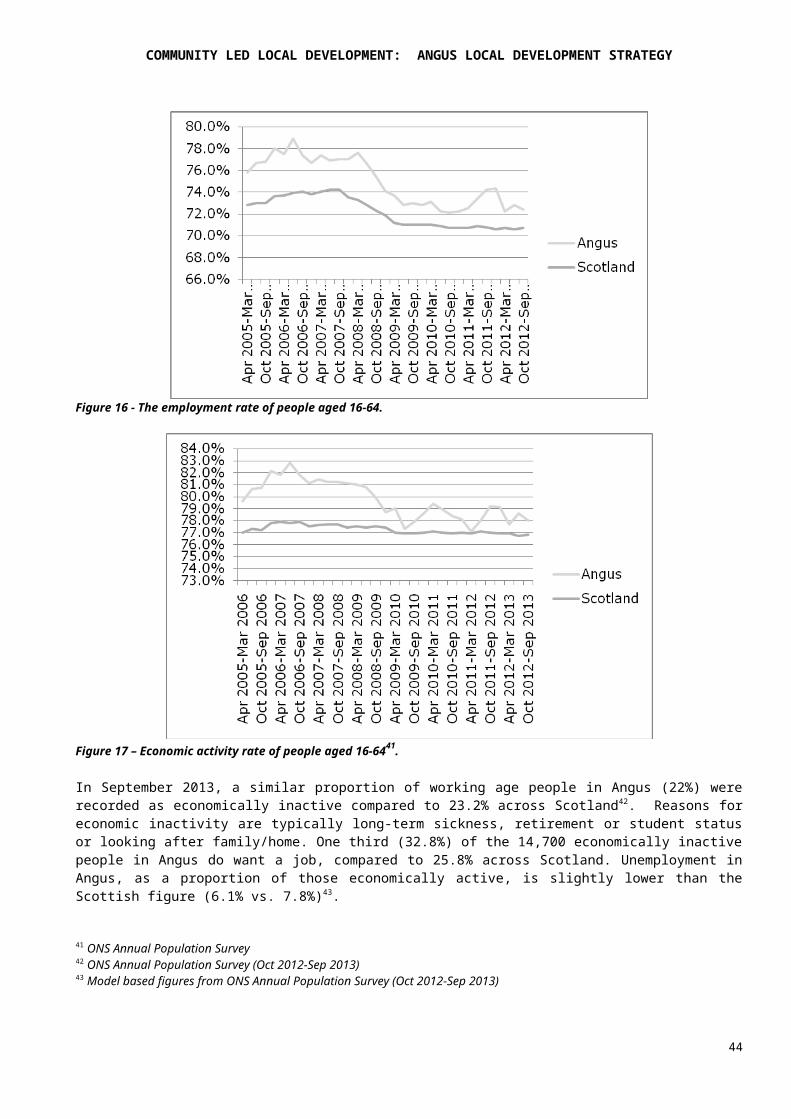
Figure 16 - The employment rate of people aged 16-64.
36 Scottish Census 201137 National Records of Scotland – Angus Council Area Demographic Factsheet38 Angus Economic Profile 201039 Angus Economic Profile 201240 ONS Annual Population Survey Oct 2012-Sep 2013
39

COMMUNITY LED LOCAL DEVELOPMENT: ANGUS LOCAL DEVELOPMENT STRATEGY
Figure 17 – Economic activity rate of people aged 16-6441.
In September 2013, a similar proportion of working age people in Angus (22%) were recorded as economically inactive compared to 23.2% across Scotland42. Reasons for economic inactivity are typically long-term sickness, retirement or student status or looking after family/home. One third (32.8%) of the 14,700 economically inactive people in Angus do want a job, compared to 25.8% across Scotland. Unemployment in Angus, as a proportion of those economically active, is slightly lower than the Scottish figure (6.1% vs. 7.8%)43.
Figure 18 - Rates of employment, unemployment and economic inactivity in Angus and Scotland44.
Skills, Employment by Occupation and Earnings
41 ONS Annual Population Survey42 ONS Annual Population Survey (Oct 2012-Sep 2013)43 Model based figures from ONS Annual Population Survey (Oct 2012-Sep 2013)
44 ONS Annual Population Survey Oct 2012-Sep 2013
40

COMMUNITY LED LOCAL DEVELOPMENT: ANGUS LOCAL DEVELOPMENT STRATEGY
The qualifications profile of people in Angus as a whole is similar to Scotland. The proportion of people with no qualification in Angus (11.3%) is very slightly higher than the Scottish figure of 10.7%45 and the proportion with NVQ4 qualifications (36.6%) or higher is also very slightly lower than for Scotland (38.5%). The proportion of working age people with qualification across all levels in Angus has been increasing since 2007 (Figure ).
Figure 19 - Qualifications in Angus, 2007 to 201246.
In terms of occupations, the proportion of employed people in Angus who work in skilled trades occupations (14.7%) is notably higher than the figure of 11.1% for Scotland.
% all in employment who are Angus 2013
Scotland 2013
Angus 2007
1: managers, directors and senior officials (SOC2010)
7.3 8.5 6.2
2: professional occupations (SOC2010) 17.6 19.9 16.13: associate prof and tech occupations (SOC2010) 13.2 12.7 11.54: administrative and secretarial occupations (SOC2010)
10.7 10.9 12.8
5: skilled trades occupations (SOC2010) 14.7 11.1 15.86: caring, leisure and other service occupations (SOC2010)
9.4 9.3 8.1
7: sales and customer service occupations (SOC2010)
7.2 9.1 7.6
8: process, plant and machine operatives (SOC2010)
7.8 6.4 9.7
9: elementary occupations (SOC2010) 11.8 11.4 11.9Table 7: Employment by Occupation47
45 ONS Annual Population Survey (Jan 2012-Dec 2012)46 ONS Annual Population Survey47 ONS Annual Population Survey (Oct 2012-Sep 2013 and Oct 2006 – Sep 2007)
41

COMMUNITY LED LOCAL DEVELOPMENT: ANGUS LOCAL DEVELOPMENT STRATEGY
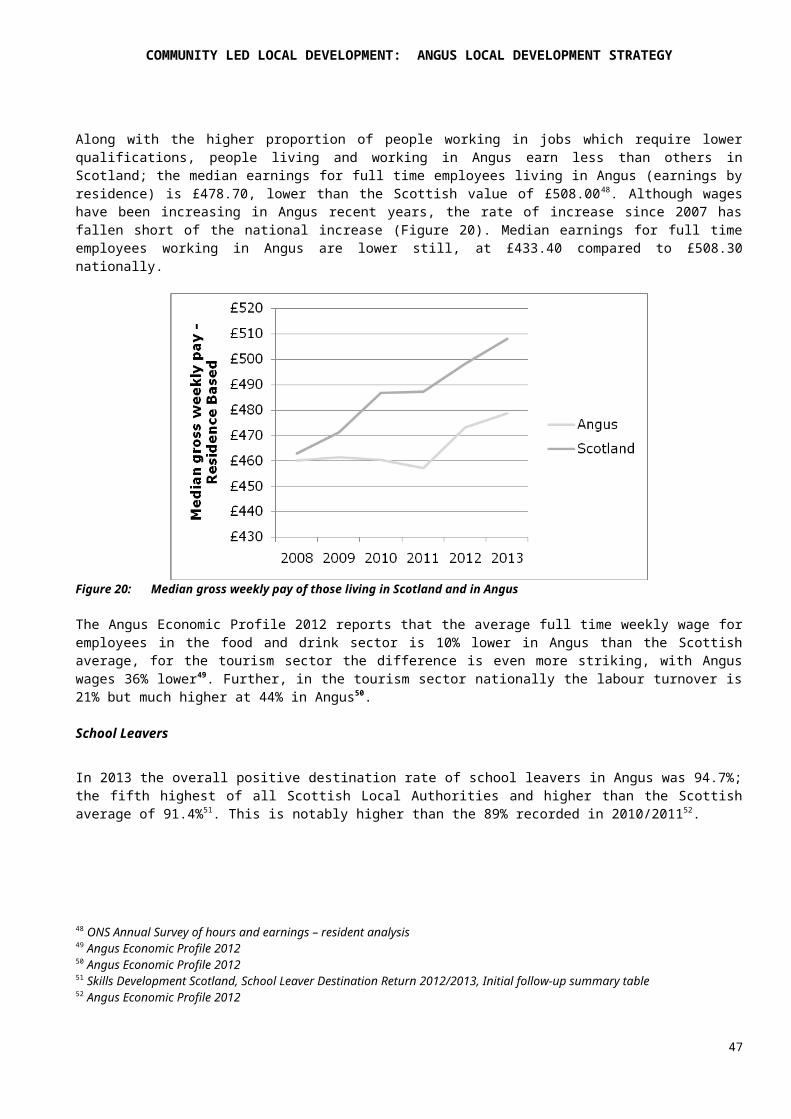
Along with the higher proportion of people working in jobs which require lower qualifications, people living and working in Angus earn less than others in Scotland; the median earnings for full time employees living in Angus (earnings by residence) is £478.70, lower than the Scottish value of £508.0048. Although wages have been increasing in Angus recent years, the rate of increase since 2007 has fallen short of the national increase (Figure 20). Median earnings for full time employees working in Angus are lower still, at £433.40 compared to £508.30 nationally.
Figure 20: Median gross weekly pay of those living in Scotland and in Angus
The Angus Economic Profile 2012 reports that the average full time weekly wage for employees in the food and drink sector is 10% lower in Angus than the Scottish average, for the tourism sector the difference is even more striking, with Angus wages 36% lower49. Further, in the tourism sector nationally the labour turnover is 21% but much higher at 44% in Angus50.
School Leavers
In 2013 the overall positive destination rate of school leavers in Angus was 94.7%; the fifth highest of all Scottish Local Authorities and higher than the Scottish average of 91.4%51. This is notably higher than the 89% recorded in 2010/201152.
48 ONS Annual Survey of hours and earnings – resident analysis49 Angus Economic Profile 201250 Angus Economic Profile 201251 Skills Development Scotland, School Leaver Destination Return 2012/2013, Initial follow-up summary table52 Angus Economic Profile 2012
42

COMMUNITY LED LOCAL DEVELOPMENT: ANGUS LOCAL DEVELOPMENT STRATEGY
The proportions entering Higher and Further education were 38.9% and 30.8%, both higher than the Scottish average. However, the figure of 30.8% for Further Education is far below the 36.6% recorded in 2010/11, which may be related to significant funding cuts and restructuring in Further Education53. 20% of leavers enter into employment in Angus, similar to the figure of 20.4% across Scotland, and an increase from 15.8% in 2009/10. Notably, the proportion of school leavers in Angus who are unemployed and seeking employment is only 4.1%, a dramatic reduction from 9% in 2010/2011.
Benefits
Of the 32 Local Authority areas, Angus has only the 19 th highest proportion of working age people claiming any benefits overall. The profile of benefit claimants can be viewed in terms of DWPs statistical typologies, and this shows a similar profile to the Scottish profile overall, with almost half of benefit claimant being primarily classified as claiming ESA or incapacity benefits.
Figure 21: DWP Working Age Client Group Statistical Typologies54
Like Scotland overall, the proportion of working age people claiming JSA has increased in recent years and has seen more recent decline up to January 2014. The proportion remains lower in Angus than Scotland overall.
53 Angus Economic Profile 201254DWP Working Age Client Group Statistical Typologies, NOMIS
43
COMMUNITY LED LOCAL DEVELOPMENT: ANGUS LOCAL DEVELOPMENT STRATEGY
Figure 22: Claimant count (JSA) as a proportion of the working age population55
Across Angus, there are pockets of high proportions of the population who claim JSA (particularly in and around the towns) or ESA). We also analyse the geographic profile of deprivation across Angus in Section 5 below.
MigrationUntil 2010/11, Angus continued to show a year-on-year increase in the number of National Insurance number registrations to adult overseas nationals, contrasted with a fall in the number of registrations across Scotland since 2007/2008. This affects the number and profile of working age people in Angus, although there are important caveats to the data, such as NINo registrations not capturing out-migration, giving no indication of length of stay and not capturing movement within the UK56.
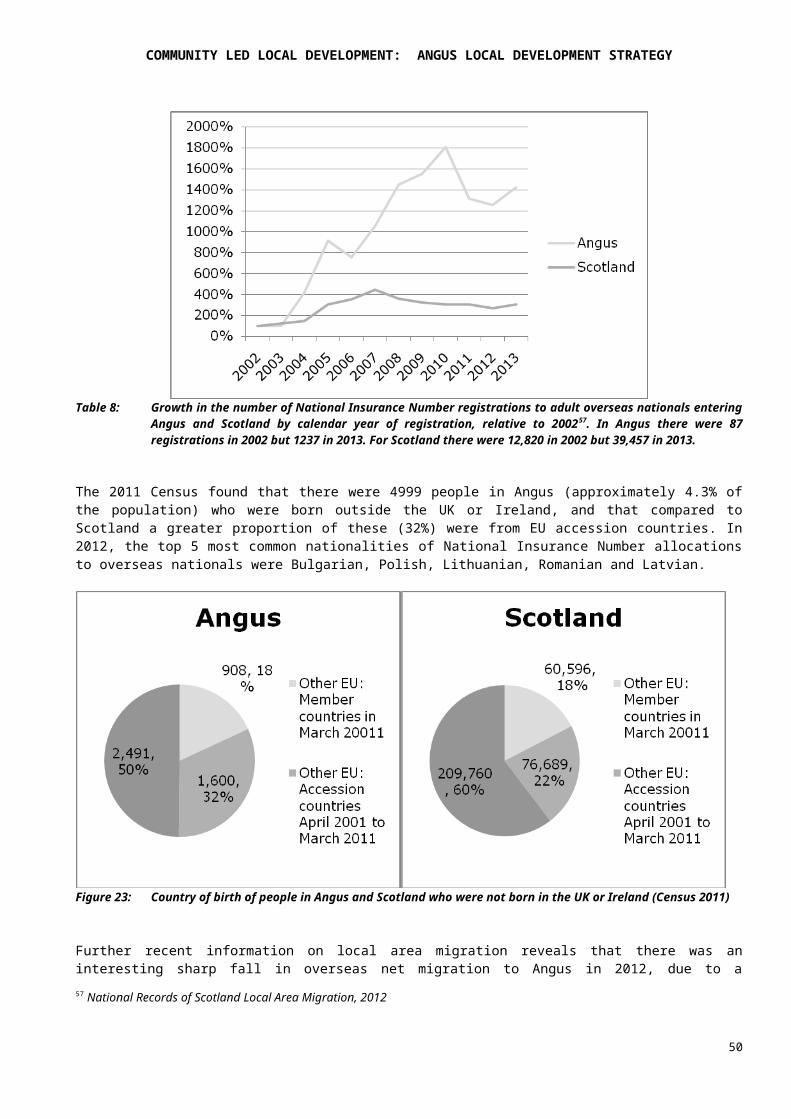
Table 8: Growth in the number of National Insurance Number registrations to adult overseas nationals entering Angus and Scotland by calendar year of registration, relative to 200257. In Angus there were 87 registrations in 2002 but 1237 in 2013. For Scotland there were 12,820 in 2002 but 39,457 in 2013.
55 Claimant Count with Rates and Proportions, NOMIS56http://migrationobservatory.ox.ac.uk/data-and-resources/data-sources-and-limitations/national-insurance-numbers57 National Records of Scotland Local Area Migration, 2012
44

COMMUNITY LED LOCAL DEVELOPMENT: ANGUS LOCAL DEVELOPMENT STRATEGY
The 2011 Census found that there were 4999 people in Angus (approximately 4.3% of the population) who were born outside the UK or Ireland, and that compared to Scotland a greater proportion of these (32%) were from EU accession countries. In 2012, the top 5 most common nationalities of National Insurance Number allocations to overseas nationals were Bulgarian, Polish, Lithuanian, Romanian and Latvian.
Figure 23: Country of birth of people in Angus and Scotland who were not born in the UK or Ireland (Census 2011)
Further recent information on local area migration reveals that there was an interesting sharp fall in overseas net migration to Angus in 2012, due to a combination of a fall of in-migration and rise of out-migration (more recent data are not yet available):
Figure 24: Migration between Angus and overseas58.
58 National Records of Scotland Local Area Migration, 2012
45

COMMUNITY LED LOCAL DEVELOPMENT: ANGUS LOCAL DEVELOPMENT STRATEGY
In 2007, the Rural Tayside LEADER strategy highlighted that the fact that the falling unemployment and number of notified vacancies at local Jobcentre Plus offices in Angus suggested that migrant workers are filling a gap in the labour supply; the same conclusion was reached in the 2012 Angus Economic Profile59.
Indeed, the 2010 Angus Economic Digest highlighted the importance of positive effects of migrant workers in Angus, as they tend to be younger than the rest of the population in general, and supply an important local labour force. Also noted there, the types of jobs that migrant workers take up have often been low skilled jobs in agriculture, tourism, hospitality and food processing sectors and in rural areas60. Therefore, the importance of migrant workers to the rural economy in Angus must not be underestimated.
An interesting and important indicator which reflects the recent trend for migration to Angus is the number of pupils with English as an additional language in Angus, which has shown a rapid and continued year-on-year increase in recent years, with no sign of slowing up to 2012. Since 2007, this figure has increased in Angus by a factor of 3.5 – the highest increase of any Local Authority in Scotland.
Figure 25: Pupils with English as an additional language in Angus61.
59 Angus Economic Profile 201260 Angus Economic Digest 201061 National Records of Scotland Local Area Migration, 2012
46
COMMUNITY LED LOCAL DEVELOPMENT: ANGUS LOCAL DEVELOPMENT STRATEGY
Figure 26: Proportion of population claiming JSA in datazones across Angus
47
Monifieth
Carnoustie
Arbroath
Montrose
Brechin
Kirriemuir
Forfar

COMMUNITY LED LOCAL DEVELOPMENT: ANGUS LOCAL DEVELOPMENT STRATEGY
Figure 27: Proportion of population claiming ESA in datazones across Angus
48
Monifieth
Carnoustie
Arbroath
Montrose
Brechin
Kirriemuir
Forfar

COMMUNITY LED LOCAL DEVELOPMENT: ANGUS LOCAL DEVELOPMENT STRATEGY
The EconomyBusiness DemographySince 2009, the number of active enterprises has increased across Scotland; this has been echoed by a similar increase in Angus, although Angus still lags behind the national number of active enterprises per 10,000 people aged 16 or over. Both across Scotland and in Angus, this has been driven by a rise in the number of new business start-ups
Figure 28 - Number of active enterprises in Angus and Scotland per 10,000 people aged 16 or over62
Figure 29 - Births of new enterprises per 10,000 people aged 16 or over63.
Over the years of the recession the survival rates of businesses in Angus has dropped. However, businesses that started in 2010 and 2011 have fared slightly better, which hints at a recently improved local economy for supporting new businesses (Figure ). In 2011 the Angus Centre for Enterprise was established to provide a “one-stop-shop” for people in Angus to learn more about enterprise and entrepreneurship and receive business support64.
62 ONS Business Demography 2012; Population estimates from Mid-Year Population Estimates (NOMIS)63 ONS Business Demography 2012; Population estimates from Mid-Year Population Estimates (NOMIS)64 Angus Economic Profile 2012
49
COMMUNITY LED LOCAL DEVELOPMENT: ANGUS LOCAL DEVELOPMENT STRATEGY
Figure 30 - Business survival rates, for businesses started in the year shown65
Enterprise SizeThere is a larger proportion of small businesses in Angus than in Scotland overall, and the proportion of VAT registered businesses that are micro-businesses is higher in Angus than in Scotland. There are only approximately 10 businesses that employ more than 250 people in Angus, and none that employs more than 500. In terms of the proportion of all employees employed by small or medium enterprises, Angus is much higher than Scotland overall66.
There is also a high rate of self-employment in Angus; in 2013, Angus was 9 th out of the 32 Local Authorities in terms of the proportion self-employed (10.0%67%). This figure is higher than the Scottish figure of 7.7%, which has been the case in Angus since 200068. However, since 2007 the gap between the proportion of people self-employed in Scotland and Angus has closed significantly.
65 ONS Business Demography 201266 Angus Economic Digest 201067 ONS Annual Population Survey (Oct 2012 – Sep 2013)68 Angus Economic Profile 2012
50

COMMUNITY LED LOCAL DEVELOPMENT: ANGUS LOCAL DEVELOPMENT STRATEGY
0 - 4 5 - 9 10 - 19
20 - 49
50 - 99
100 - 249
250 - 499
500 - 999
1,000 +
SCOTLAND 63.4% 16.8% 9.9% 6.2% 2.0% 1.1% 0.3% 0.1% 0.1% Angus 65.0% 17.3% 9.6% 5.2% 1.7% 0.9% 0.2% 0.0% 0.0%
Table 9 - VAT registered businesses by size of enterprise69.
Key Sectors in the Angus EconomyThe Angus Economic Profile 2012 identifies the following main sectors of Angus’ economy highlighting tourism and food and drink as Angus’s key sectors:
Tourism Food and Drink Retail Manufacturing Renewable Energy Service sector Agriculture
69 ONS Annual Population Survey (Oct 2012-Sep 2013 and Oct 2006-Sep 2007)
51

COMMUNITY LED LOCAL DEVELOPMENT: ANGUS LOCAL DEVELOPMENT STRATEGY
Figure 31 - The proportion of working age people (16-64) in employment in Angus who work in each industry sector. (Above) – 2007; (Below) - 2013.70
Service SectorIn terms of the proportion of people working in each industry sector, public sector services is the dominant industry. 34% of all employees are employed in public administration, education and health; 2.8% higher than the Scottish figure. In light of rapid shrinking of the public sector workforce across Scotland, Angus could face significant employment challenges. However, the Angus Economic Strategy 2013-2020 highlights the opportunities for employment, now and in the future, for public, private and third sector in care for the ageing population.
In Angus, the service sector as a whole (75.8% of all employees) is relatively small compared to elsewhere in Scotland; overall Scotland has 79.5% of its workforce employed in the service sector.
70 ONS Annual Population Survey (Oct 2012-Sep 2013 and Oct 2006-Sep 2007)
52

COMMUNITY LED LOCAL DEVELOPMENT: ANGUS LOCAL DEVELOPMENT STRATEGY
Angus 2006/7 (% of
employed working age population)
Angus 2012/13 (% of
employed working age population)
Scotland 2012/13 (% of
employed working age population)
Agriculture and fishing 3.4 2.5 0.9Energy and water 3.5 2.6 1.8Manufacturing 12.3 11.7 9.8Construction 12.0 6.7 7.1Distribution, hotels and restaurants 17.2 18.0 18.6Transport and communications 5.6 5.0 8.9Banking, finance and insurance 9.1 12.9 16.4Public admin. education and health 30.5 33.9 30.1Other services 6.1 6.0 5.4Total services 68.5 75.8 79.4
Sector
Angus 2007 (#)
Angus 2013 (#)
% Change (but note that survey
numbers are estimates)
Agriculture and fishing 1,800 1,200 -33%Energy and water 1,800 1,300 -28%Manufacturing 6,500 5,700 -12%Construction 6,300 3,300 -48%Distribution, hotels and restaurants 9,100 8,800 -3%Transport and communications 2,900 2,400 -17%Banking, finance and insurance 4,800 6,300 31%Public admin. education and health 16,000 16,500 3%Other services 3,200 2,900 -9%Total services 36,000 36,800 2%
Table 10 – Estimates of employment by sector. (Top table) - The proportion of working age people (16-64) in employment who work in each industry sector; (Bottom table) - numbers in employment by sector71.
71 ONS Annual Population Survey
53

COMMUNITY LED LOCAL DEVELOPMENT: ANGUS LOCAL DEVELOPMENT STRATEGY
Construction and ManufacturingSince 2007, the proportion of working age people in employment working in the construction industry has fallen by over 5%, exceeding the drop of 2.4% experienced across Scotland overall72. The proportion of people working in manufacturing has remained high in Angus, despite contraction nationally. Lending to the ongoing success of manufacturing in Angus will be its continued diversity – with a range including engineering companies, agricultural equipment manufacturers, pharmaceutical, food and drink to industrial textiles – as well as the opportunities around manufacturing for the renewables sector73.
Agriculture and FishingThe rich and fertile soil and favourable climate in Angus have meant that it is an ideal place for growing soft fruit, vegetables and potatoes. Arable farming comprises three quarters of farms in Angus, and there is livestock farming in the Glens. Angus has 40% of the Class 1 agricultural land in Scotland74 and nearly 30% of the potato crop in Scotland is located in Angus. Growing oilseed rape is also a major land use in Angus75.
In terms of the proportion of Angus’ workforce, the agriculture and fishing sector is small but important in Angus. In 2007 there were approximately 1,800 people (3.4% of the working age population) who worked in agriculture or fishing; this has now dropped by around one third to a figure of only 1,200 people (2.5%).
TourismIn 2011 there were approximately 2,500 total employees (estimate of full and part time employees on a set day in September) in the Angus Sustainable Tourism growth sector; a sector with a turnover of £83m and GVA at Basic Prices of £38.5m (2011, latest data)76. (The list of Standard Industrial Classification codes within this sector are given in the Appendices, page61).
Figure 32 - Total turnover and GVA at basic prices of the Sustainable Tourism sector in Angus.
Tourism in Angus is driven by the Angus Ahead campaign, and is focussed on golf tourism, food and drink tourism, outdoor tourism such as mountain biking, coastal path networks and wildlife tourism, cultural and heritage and festivals and events77,78.
72 ONS Annual Population Survey (Oct 2012-Sep 2013 and Oct 2006-Sep 2007)73 Angus Economic Profile 201274 Angus Economic Profile 201275 2011 State of the Environment76 Scottish Government, Scottish Annual Business Statistics, Local Authority Tables77 Angus Economic Profile 201278 Angus Economic Strategy 2013-2020
54
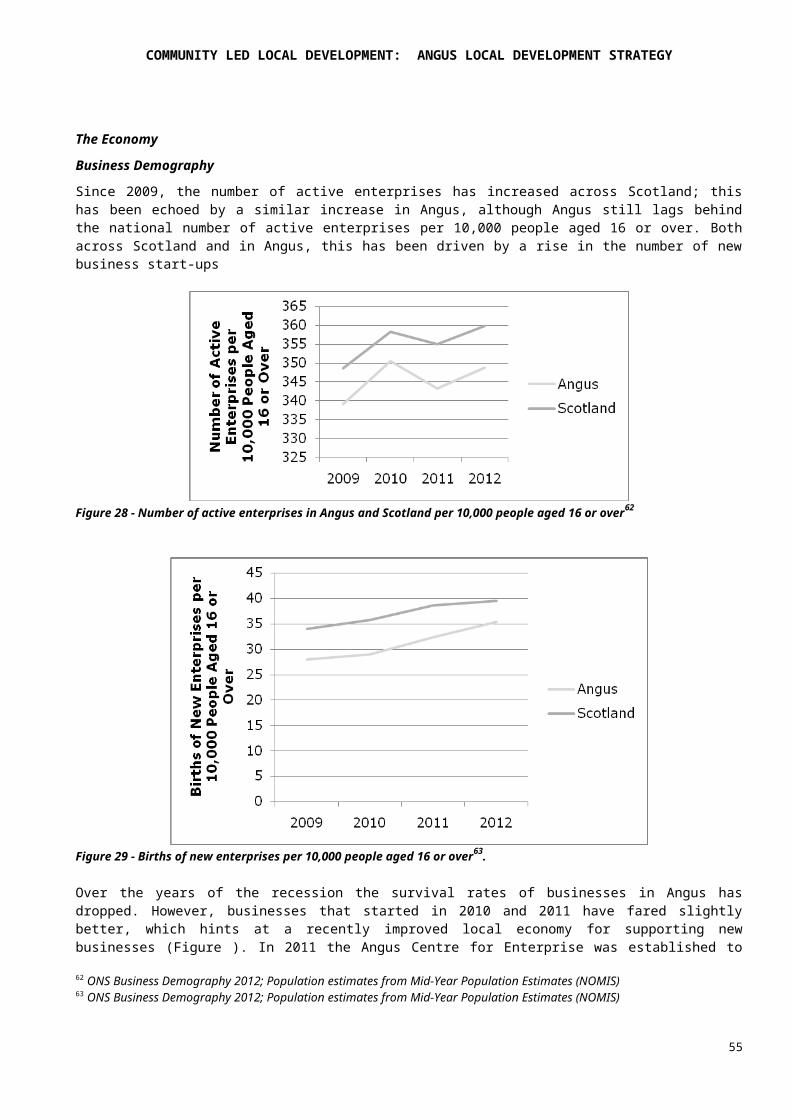
COMMUNITY LED LOCAL DEVELOPMENT: ANGUS LOCAL DEVELOPMENT STRATEGY
The Bell Rock lighthouse is the oldest sea-washed lighthouse still surviving. Forfar Loch Country Park was the third most visited attraction in Dundee and Angus in 2011, with over 200,000 visitors79. There are also tourism attractions based around the Pictish cultural heritage in Angus. The golf sector has been recognised as needing continued investment80, and provision of high quality local hotel accommodation is hoped to support this. Other developments which are being considered by Angus Council are a walking route between Aberdeen and Pitlochry. Another tourism attraction is dolphin watching along the Angus coast, which has increased in popularity 81, and opportunities to encourage even more visitors to Angus for river and loch fishing are also seen as important. An “Angus Heritage” brand was created in 201282.
Upcoming events of importance for Angus are sporting events such as the Commonwealth Games and the Ryder Cup in 2014, establishment of a new golf course at Kingennie in 2015 and the signing of the Declaration of Arbroath in 202083.
Compared to the rest of Scotland, there is a higher proportion of British visitors in Angus and Dundee who are from Scotland (by both the number of trips and expenditure)84. Interestingly, data from the 2008-2011 International Passenger Survey revealed that the top four countries of residence of overseas visitors to Dundee and Angus in terms of the number of trips made were Ireland, USA, Germany and Spain, but the country which had by far the most expenditure in Dundee and Angus was Denmark85.
Food and DrinkThe food and drink industries play an important role in Angus, from the famous Arbroath Smokie, which was awarded Protected Geographical Indication in 2004, and Aberdeen Angus beef to newer products, including frozen food, sea and river fish, spring water and soft fruit manufacture 86. In 2010, 5.7% of the working age population were employed in this sector87. The Angus Economic Strategy 2013-2020 recognises the importance of this sector as a major opportunity for Angus in the years ahead, in particular developing “niche markets” around Angus’ unique products.
Renewable EnergiesHighlighted as one of Angus’s main opportunities in the 2013-2020 Economic Strategy, Angus has strengths in terms of its availability of natural resource (biomass, hydro and offshore wind) and infrastructure88. These could help Angus make a major contribution to Scotland’s target of producing 100% of electricity consumption from renewables by 202089.
Continuing to upskill people in Angus and provide them with employment opportunities will be essential in the years ahead. For example, the Angus Economic Profile 2012 highlights the growth of the Renewables sector as a key opportunity, for which appropriate training programmes will need to be developed.
OpportunitiesThe Angus Economic Digest in 2010 highlighted that “the Angus economy has been slow to embrace new opportunities”, and identifies opportunities for employment in forestry, food and
79 Visit Scotland, Tourism in Eastern Scotland 201180 Angus Council Infrastructure Services Committee, 16/04/13, National Tourism Development Plan Public Consultation, Report by the Chief Executive81 Angus Council Infrastructure Services Committee, 16/04/13, National Tourism Development Plan Public Consultation, Report by the Chief Executive82 Angus Economic Strategy 2013-202083 Angus Economic Strategy 2013-202084 Visit Scotland, Tourism in Eastern Scotland 201185 Visit Scotland, Tourism in Eastern Scotland 20118687 Angus Economic Profile 201288 Angus Economic Strategy 2013-202089 Angus Economic Strategy 2013-2020
55
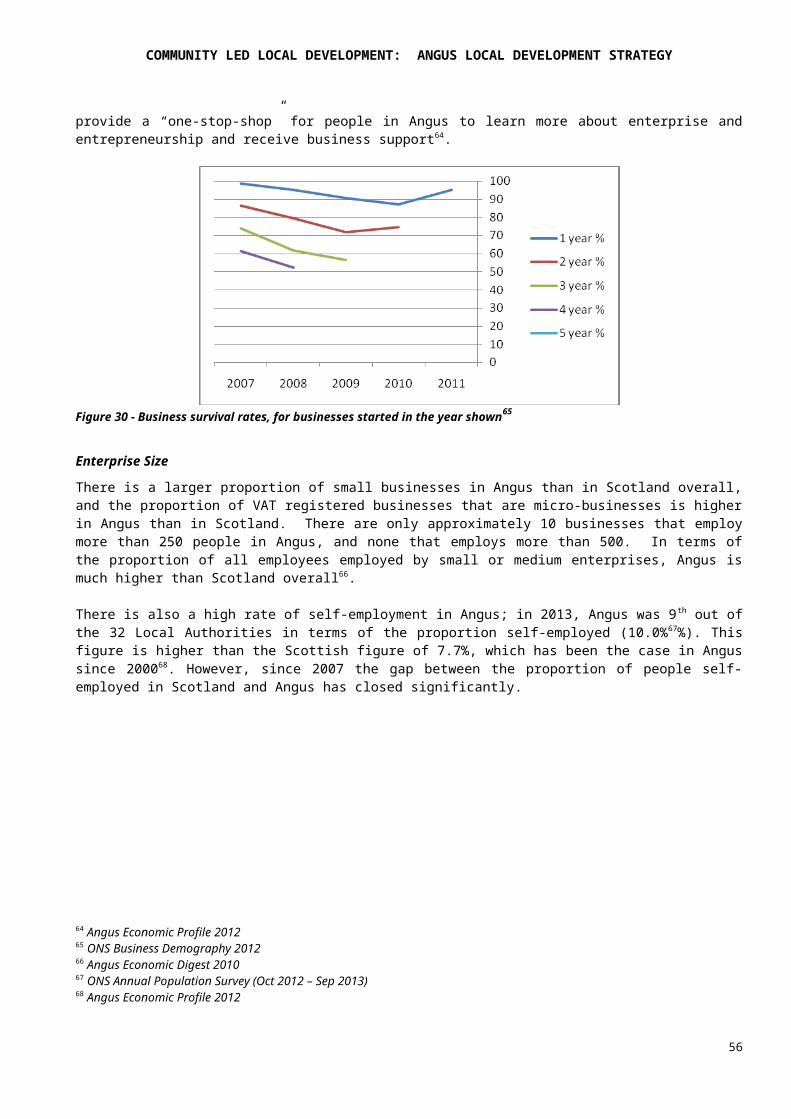
COMMUNITY LED LOCAL DEVELOPMENT: ANGUS LOCAL DEVELOPMENT STRATEGY
drink, tourism, biotechnology and life sciences, digital media, creative industries and contact centres.
Deprivation across Rural and Coastal Areas in AngusThe 2014-2020 CLLD programme has a key priority of “promoting social inclusion, poverty reduction and economic development”. As such, it is important to consider the areas across Angus which face particular challenges. The 2012 Scottish Index of Multiple Deprivation describes a number of different measures of deprivation, at a datazone level.
The overall deprivation measure from the SIMD shows deprivation hotspots focussed in and around the townships, including the coastal townships, as shown in Figure . However, an important consideration for rural areas in Angus is Geographic Access deprivation. In terms of the urban/rural classification, Angus’s rural areas are described as “accessible” and not “remote”. However, this belies the significant deprivation in terms of access to services, with many of the datazones in Angus amongst the 15% most deprived for access to services in Scotland (Figure 13). The 30 most deprived datazones in Angus for geographic access are located in:
Angus Glens Friockheim Hillside Kirriemuir Landward Letham and Glamis Lunan Monikie South Angus
56

COMMUNITY LED LOCAL DEVELOPMENT: ANGUS LOCAL DEVELOPMENT STRATEGY
Figure 33 - Overall SIMD Deprivation Measure - Ranking Percentiles90.
90 Scottish Index of Multiple Deprivation 2012
57
Monifieth
Carnoustie
Arbroath
Montrose
Brechin
Kirriemuir
Forfar

COMMUNITY LED LOCAL DEVELOPMENT: ANGUS LOCAL DEVELOPMENT STRATEGY
Appendix 5: Sub-LA Geographies Used in Angus
Geography Reason for useWard Used in the previous LEADER and EMFF Axis 4 strategies.Multi-member electoral ward The basis of local community partnership working
through Angus CPP.Agricultural parish Used to report the targeting of projects in the 2007-2013
Rural Tayside LEADER programme.Datazone Scottish Government guidance requirements for the area
and its population to be set out at datazone level.
58

COMMUNITY LED LOCAL DEVELOPMENT: ANGUS LOCAL DEVELOPMENT STRATEGY
Appendix 6: Populations and Areas by Datazone
Scottish Data ZonePopulation
Area (hectares)
Density (persons per hectare)
S01000569 757 19.77 38.30S01000570 876 47.96 18.26S01000571 773 20.30 38.09S01000572 696 14.55 47.85S01000573 529 13.33 39.70S01000574 755 32.48 23.25S01000575 641 10.89 58.85S01000576 528 12.45 42.40S01000577 553 16.11 34.33S01000578 647 13.49 47.96S01000579 857 33.14 25.86S01000580 945 1087.52 0.87S01000581 676 25.70 26.30S01000582 659 18.96 34.75S01000583 956 19.11 50.04S01000584 862 23.99 35.93S01000585 1238 42.26 29.30S01000586 723 34.68 20.85S01000587 706 19.23 36.71S01000588 558 12.05 46.31S01000589 700 20.19 34.66S01000590 864 26.69 32.37S01000591 835 162.90 5.13S01000592 897 40.37 22.22S01000593 1609 3585.32 0.45S01000594 1351 1598.21 0.85S01000595 744 18.65 39.90S01000596 794 62.83 12.64S01000597 958 26.43 36.25S01000598 1353 1344.33 1.01S01000599 1152 2864.96 0.40S01000600 767 693.48 1.11S01000601 1224 3398.11 0.36S01000602 744 2008.16 0.37S01000603 1009 3020.27 0.33S01000604 952 93.64 10.17S01000605 807 76.84 10.50S01000606 817 18.92 43.18S01000607 727 24.61 29.54S01000608 1212 17.34 69.88S01000609 1018 17.05 59.70S01000610 842 29.07 28.96S01000611 610 11.95 51.04S01000612 1049 28.71 36.54S01000613 1058 41.98 25.20S01000614 674 36.92 18.26S01000615 840 28.24 29.74
59

COMMUNITY LED LOCAL DEVELOPMENT: ANGUS LOCAL DEVELOPMENT STRATEGY
Scottish Data ZonePopulation
Area (hectares)
Density (persons per hectare)
S01000616 1743 3868.98 0.45S01000617 591 15.67 37.73S01000618 828 24.04 34.44S01000619 662 17.20 38.48S01000620 1142 24.77 46.11S01000621 1071 27.69 38.68S01000622 824 14.34 57.46S01000623 765 13.33 57.40S01000624 618 9.95 62.14S01000625 630 10.06 62.61S01000626 759 10.62 71.44S01000627 847 24.79 34.17S01000628 581 13.22 43.96S01000629 977 95.28 10.25S01000630 721 26.32 27.39S01000631 599 28.71 20.87S01000632 607 6210.31 0.10S01000633 544 12.52 43.46S01000634 730 58.40 12.50S01000635 622 12.64 49.20S01000636 514 6037.83 0.09S01000637 634 4316.49 0.15S01000638 665 1449.20 0.46S01000639 573 3158.05 0.18S01000640 710 3342.49 0.21S01000641 826 2077.15 0.40S01000642 988 3251.59 0.30S01000643 658 1460.31 0.45S01000644 710 26.16 27.14S01000645 982 3774.17 0.26S01000646 785 24.58 31.93S01000647 760 14.07 54.03S01000648 895 12.58 71.17S01000649 586 5525.70 0.11S01000650 713 13.61 52.39S01000651 843 46.59 18.09S01000652 752 60.88 12.35S01000653 1053 24.97 42.18S01000654 896 28.22 31.75S01000655 790 9.39 84.16S01000656 885 27.33 32.39S01000657 814 16.78 48.51S01000658 597 12.32 48.46S01000659 1314 77.09 17.04S01000660 1022 45.66 22.38S01000661 811 33.73 24.04S01000662 756 2394.81 0.32S01000663 806 55.46 14.53S01000664 865 3501.61 0.25S01000665 673 2483.83 0.27
60

COMMUNITY LED LOCAL DEVELOPMENT: ANGUS LOCAL DEVELOPMENT STRATEGY
Scottish Data ZonePopulation
Area (hectares)
Density (persons per hectare)
S01000666 511 620.55 0.82S01000667 971 32.80 29.60S01000668 862 16.14 53.40S01000669 793 24.52 32.34S01000670 681 22.73 29.97S01000671 581 27.00 21.52S01000672 822 27.99 29.36S01000673 730 31.95 22.85S01000674 1095 3048.05 0.36S01000675 690 46.42 14.87S01000676 473 4577.30 0.10S01000677 807 5439.68 0.15S01000678 881 46.24 19.05S01000679 753 19.62 38.38S01000680 990 62.28 15.90S01000681 990 19.23 51.49S01000682 754 26.75 28.19S01000683 539 48.90 11.02S01000684 731 9.37 78.03S01000685 907 28.18 32.19S01000686 768 15.45 49.70S01000687 817 21.97 37.19S01000688 715 25.60 27.92S01000689 606 4526.85 0.13S01000690 1014 30.42 33.33S01000691 782 21.36 36.61S01000692 749 33.97 22.05S01000693 1067 20.95 50.93S01000694 685 16.84 40.67S01000695 789 31.54 25.02S01000696 751 17.93 41.89S01000697 978 2012.21 0.49S01000698 650 18.06 36.00S01000699 645 43.93 14.68S01000700 838 616.34 1.36S01000701 984 719.51 1.37S01000702 504 16.74 30.10S01000703 736 13.76 53.50S01000704 882 8086.40 0.11S01000705 1143 135.96 8.41S01000706 878 3484.35 0.25S01000707 630 2865.60 0.22S01000708 598 27287.98 0.02S01000709 1004 2010.36 0.50S01000710 1157 77573.38 0.01Total (average density) 116210 218458.76 0.53
61

COMMUNITY LED LOCAL DEVELOPMENT: ANGUS LOCAL DEVELOPMENT STRATEGY
Appendix 7: SIC 2007 Codes in Sustainable Tourism SectorThe following is a list of the Standard Industrial Classification codes (2007) contained in the Sustainable Tourism sector:
SIC 55.1: Hotels and similar accommodationSIC 55.2: Holiday and other short-stay accommodationSIC 55.3: Camping grounds, recreational vehicle parks and trailer parksSIC 56.1: Restaurants and mobile food service activitiesSIC 56.3: Beverage serving activitiesSIC 79.12: Tour operator activitiesSIC 79.9: Other reservation service and related activitiesSIC 91.02: Museum activitiesSIC 91.03: Operation of historical sites and buildings and similar visitor attractionsSIC 91.04: Botanical and zoological gardens and nature reserve activitiesSIC 93.11: Operation of sports facilitiesSIC 93.199: Other sports activities (not including activities of racehorse owners) necSIC 93.21: Activities of amusement parks and theme parksSIC 93.29: Other amusement and recreation activities
62

COMMUNITY LED LOCAL DEVELOPMENT: ANGUS LOCAL DEVELOPMENT STRATEGY
Appendix 8: Most deprived datazones by SIMD domains
Each datazone sits within a larger “Intermediate Geography”; these are named in Angus, making it easier to understand the locations of the most challenged areas. Below, for each SIMD aspect, we set out the Intermediate Zones within which the top 30 most deprived datazones in Angus are located. Most importantly for the planning of the current programme, some of these areas are more rural, e.g., those which face geographic access deprivation, whereas a number of the locations which suffer from deprivation across a number of factors are located in coastal town areas.
Geographic AccessThe top 30 most deprived datazones for geographic access are located in:
Angus Glens Friockheim Hillside Kirriemuir Landward Letham and Glamis Lunan Monikie South Angus
CrimeThe top 30 most deprived datazones for crime are located in:
Arbroath Cliffburn Arbroath Harbour Arbroath Keptie Arbroath Kirkton Arbroath Warddykes Brechin East Brechin West Forfar Central Forfar West Kirriemuir Kirriemuir Landward Monifieth East Montrose South
EmploymentThe top 30 most deprived datazones for employment are located in:
Arbroath Warddykes
63

COMMUNITY LED LOCAL DEVELOPMENT: ANGUS LOCAL DEVELOPMENT STRATEGY
Arbroath Cliffburn Arbroath Harbour Arbroath Kirkton Brechin East Carnoustie West Forfar Central Forfar West Kirriemuir Montrose North Montrose South
HealthThe top 30 most deprived datazones for health are located in:
Arbroath Warddykes Arbroath Cliffburn Arbroath Harbour Arbroath Kirkton Brechin East Carnoustie West Forfar Central Forfar West Kirriemuir Monifieth East Montrose North Montrose South
64

COMMUNITY LED LOCAL DEVELOPMENT: ANGUS LOCAL DEVELOPMENT STRATEGY
IncomeThe top 30 most deprived datazone for income are located in:
Arbroath Warddykes Arbroath Cliffburn Arbroath Harbour Arbroath Kirkton Brechin East Brechin West Forfar Central Forfar West Kirriemuir Montrose North Montrose South
Education, Skills and TrainingThe top 30 most deprived datazones for education, skills and training are located in:
Arbroath Warddykes Arbroath Cliffburn Arbroath Harbour Arbroath Kirkton Brechin East Carnoustie West Forfar Central Forfar West Friockheim Montrose North Montrose South
65
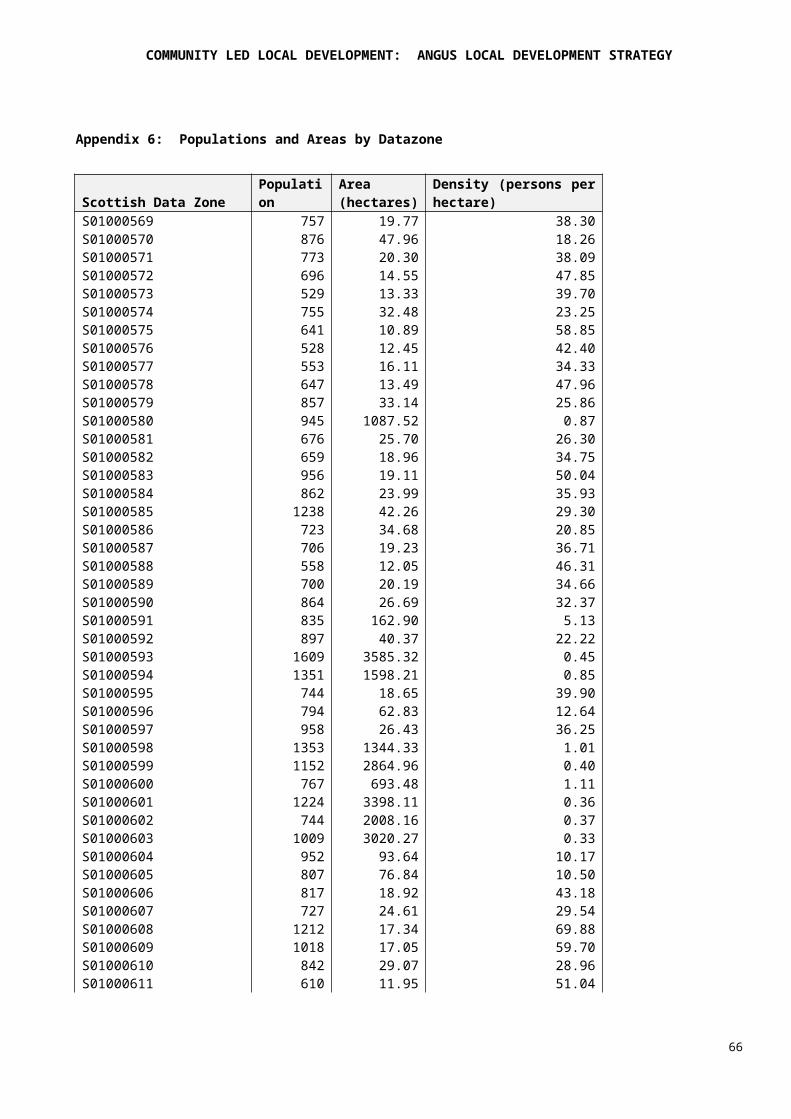
COMMUNITY LED LOCAL DEVELOPMENT: ANGUS LOCAL DEVELOPMENT STRATEGY
HousingThe top 30 most deprived datazones for housing are located in:
Arbroath Warddykes Arbroath Cliffburn Arbroath Harbour Arbroath Kirkton Brechin East Carnoustie West Forfar Central Forfar West Friockheim Hillside Kirriemuir Landward Letham and Glamis Monifieth East Monikie Montrose North Montrose South
66

COMMUNITY LED LOCAL DEVELOPMENT: ANGUS LOCAL DEVELOPMENT STRATEGY
Appendix 9: Recent consultations with communities and residents
Angus has several existing types of community engagement activity operating at both regional and local levels. At the regional level, Angus Council organises the Angus Citizens’ Survey every 2 years, surveying a representative sample of the Angus population on quality of life, and satisfaction with public services.
The Angus Citizens’ Panelis an opt-in community survey series, running several surveys a year on a broad range of topics. Since individuals choose to join ACP, the results of ACP surveys may be prone to selection bias, but they still have great value as an important outlet for community views.
The Angus Council website also hosts consultations on regional and local decisions; at the time of writing 10 consultations have been completed in January and February 2014 so far, and one consultation (on the Draft Renewable Energy Community Benefit Policy) is currently open.
At the local level, Local Community Planning Partnerships organise a range of different community engagement activities. Most LCPPs held a Community Conference in 2013, in which individuals and local community groups agreed on a shared “vision” and community priorities for their area. In addition, some LCPPs have held community appraisals, focusing on the needs of an individual village or neighbourhood.
Each electoral ward in Angus has shown its own distinctive local character and distinct priorities for community development, and some LCPPs appear to have been more active than others.
However, the Local Community Plans drawn up at Community Conferences have some common features: in general, people everywhere in Angus are concerned about:
Improving facilities for young people Reclaiming or improving premises for community activities Increasing community engagement Signage.
Rural communities appear, in general, to be less concerned about prioritising antisocial behaviour, and tend to be more concerned about traffic issues such as speeding and heavy goods vehicles.
67

COMMUNITY LED LOCAL DEVELOPMENT: ANGUS LOCAL DEVELOPMENT STRATEGY
Angus Citizens’ Survey 2011
The results of the Angus Citizens’ Survey in 201191 showed improvements since the 2009 survey92 across the board, in quality of life, community cohesion and satisfaction with public services. However, the results also showed that there is room for further improvement in community involvement.
NeighbourhoodsPerceptions of neighbourhoods in Angus are improving: in 2011 4% of Angus residents believed their neighbourhood had improved in the last 5 years and 4% believed it had worsened. This is an improvement on 2009, when 29% of respondents believed their neighbourhood had worsened. Residents believing that their neighbourhood had worsened cited “undesirable people moving in” (25%) and “drug problems” (24%) as the most common reasons (in 2009, the top worsening factors were drug problems- 25% and unfriendly people– 16%). However, drug problems have reduced as a proportion of the things people like the least about their neighbourhood, between 2009 and 2011 (10% to 2%). Brechin and Edzell residents were the most likely to think that their neighbourhood had worsened in the last 5 years, a factor which may be attributable to a widening social divide: the survey notes that those believing their neighbourhood had declined “tended to be outwith the most deprived datazone”.
ServicesSatisfaction in local services and facilities was both high and improved since 2009. The facility showing lowest satisfaction, but also the greatest improvement in satisfaction, was in local youth facilities (78%, up from 49%). Lack of facilities for youths was also the most common form of unprompted comment made about local services and facilities (23%). Participation in “organised social, leisure activities, classes and clubs” was slightly higher in urban areas (19%) than in rural areas (15%).
Community InfluenceRespondents were asked whether they felt that both they individually, and people in their community in general, had influence over decisions affecting their neighbourhood. 30% believe they had some influence, compared to 19% believing they have no influence - a big improvement since 2009, when 13% believed they had some influence and 66% believed they had no influence. Perceptions of the influence that people in general can have were very slightly better than individual influence- 34% / 16% compared to 30% / 19%. Only 1% believed that people in general could have a “great” influence.
Awareness of community development activities was relatively low - only 24% were aware of Local Area Partnerships, 26% were aware of local consultation activities and events, while 67% were aware of Community Councils. Awareness of local area partnerships was higher in urban areas (27%) than rural areas (18%). Awareness of community festivals and events were also higher in urban than rural areas (57% to 47%) - probably reflecting the actual distribution of community festivals and events.Environment
Satisfaction with the quality of the local environment, both the built environment and the natural environment, are high overall (98% and 99% respectively) and improved since 2009 (both up from 94%): however, there is strong local variation in respondents reporting being “very satisfied” rather than just “satisfied”- with the highest levels in Arbroath East and Lunan and Arbroath West and Letham (76%/77% and 61%/65%) and the lowest levels in Carnoustie and District followed by Kirriemuir and Dean (20%/27% and 37%/41%). Unsurprisingly, respondents almost everywhere are
91 Angus Citizens’ Survey 2011 https://www.angus.gov.uk/ccmeetings/reports-committee2012/StrategicPolicy/Angus%20Council%20Citizens%20Survey%20FINAL%20Report%20.pdf
92 Angus Citizens’ Survey 2009 https://www.angus.gov.uk/ac/documents/CitizenSurvey09.pdf
68

COMMUNITY LED LOCAL DEVELOPMENT: ANGUS LOCAL DEVELOPMENT STRATEGY
more satisfied with the natural environment than the built environment. Interestingly, the rank of locations is the same for each- which is to say, the best natural environments also have the best buildings.
Insights from Local Community Partnerships
Arbroath East and West
The Arbroath East and West Local Community Plan for 2011 – 201393 noted their intention to seek Leader funding to consult the community on local priorities in rural communities in 2011. Other priority areas identified by the LCPP at the time included town centre regeneration, tourism, and cliff-top safety. Angus Community Safety Partnership94 noted that people in Arbroath in 2009 were concerned about dog fouling (30%) drugs and alcohol problems (22%), young people hanging around (22%) and rubbish lying around (21%), while in rural areas the biggest causes for concern were rubbish and dog fouling.
93 Arbroath East and West Local Community Plan 2011 http://www.angus.org.uk/pdfs/communityplans/Arbroath.pdf
94 Angus Community Safety Partnership Survey, 2009 http://www.angus.org.uk/pdfs/CommunitySafetySurvey2009.pdf
69

COMMUNITY LED LOCAL DEVELOPMENT: ANGUS LOCAL DEVELOPMENT STRATEGY
Brechin and Edzell
“A vibrant, happy, progressive, warm, peaceful, harmonious and ‘braw’ place to live; a happy place for families to enjoy together” – community vision, Brechin Community Conference March 201395
Brechin and Edzell has a relatively active Local Community Planning Partnership, with a number of active community organizations, and 3 Community Councils in the ward. The LCPP undertook two neighbourhood-level community appraisals in 2012 and planned two further appraisals in 2013. The LCPP applies some proactive community engagement methods, including comment postcards in public spaces, questionnaires and interviews with community leaders.
Priority areas in Brechin and Edzell include flood prevention, HGV traffic, use of town centre buildings, and supporting specialist retailers.
Carnoustie and District
Carnoustie Development Group took over from Carnoustie Forward as the LCPP for Carnoustie in 2011. CDG focuses on town centre regeneration, economic development and tourism. A consultation process is planned to investigate Carnoustie becoming a “Business Improvement District”96, and plans to develop the Seafront Leisure Centre are ongoing but a public consultation has been ruled out “due to timescales”.
Forfar and District
“Forfar will be a strong community and a vibrant town that looks after its people, serves the surrounding area, and attracts visitors.” – Community vision, Your Forfar event January 2013.97
Forfar is served by two community councils and an LCPP established in 2006. Priority areas identified by participants at Forfar and Area’s Community Conference, Your Forfar, included: premises for community activities, addressing social and environmental issues in certain neighbourhoods, sports and play facilities, and increasing the influence of local groups on service planning.
95Brechin and Edzell Community Plan 2013 http://www.angus.org.uk/pdfs/communityplans/BrechinandEdzellCommunityPlanSummary.pdf
96Carnoustie Development Group Action Plan, Jan 2014 http://www.angus.org.uk/pdfs/CarnoustieActionPlan.pdf
97 Forfar and District Community Plan 2013 http://www.angus.org.uk/pdfs/communityplans/ForfarCommunityPlanSummary.pdf
70

COMMUNITY LED LOCAL DEVELOPMENT: ANGUS LOCAL DEVELOPMENT STRATEGY
Kirriemuir and District
“Kirriemuir will be an attractive and vibrant town with a strong community spirit, a sense of global awareness, working together, valuing and serving the surrounding area and attracting visitors” - Community vision, Kirriemuir and Dean Community Conference March 2013.98
Kirriemuir and Dean LCPP held two neighbourhood-level community appraisals in 2012. Priority issues identified in the more rural neighbourhood of the two (Newtyle) were communication across the village, facilities for young people, and speeding. Priorities in the less rural neighbourhood (Knowehead, in Kirriemuir) were antisocial behaviour, poorly maintained gardens, and parking.
Community aspirations identified at the Kirriemuir and Dean Community Conference included: Improved communication within Kirriemuir to better know what events are on and avoid clashes; concern about vacant heritage buildings; developing a new business association; find ways to increase visitor accommodation; greater involvement of young people in volunteering and creating a safe place for them to relax. In the year since the Vision was agreed progress has seen an online community calendar resource being tested; the inaugural Christmas Market take place; discussions of a Business Association started; The Vault open for young people two nights each week and, critically, to join up organisations in the big picture a new Kirriemuir+Dean Area Partnership was constituted in July 2014. There is also active exploration of bringing heritage buildings back into use and increasing visitor beds.
Monifieth and Sidlaw
Monifieth and Sidlawlocal community planning partnership operates under the name “M-Factor”, and consists of a Youth Group, a Beach Group and a Town Centre Promotion Group, as well as the Monifieth Community Centre Steering group.
Community priorities identified in the Monifieth and Sidlaw Local Community Plan 201199 include intentions to improve community engagement by supporting Community Councils to apply their Better Community Engagement training, and using Rural Tayside Leader funding to perform consultations in Sidlaw and identify community priorities.
Montrose and District
“Our people are friendly and enlivened and take responsibility to help ensure that our town is fresh and clean, our economy is vigorous and our community is able to develop Montrose, in keeping with its heritage” – Community vision, from Montrose Together’s Nov 2013 Action Plan100
Montrose Together is the LCPP for Montrose and District. Current community priorities listed in the Nov 2013 action plan focus on traffic and signage, facilities for sports, the arts and young people. Montrose Together also highlight a wish to allow young people’s voices to be heard in decision making, and also for elderly people to pass on their skills to young people.
98 Kirriemuir and Dean Community Plan, April 2013 http://www.angus.org.uk/pdfs/communityplans/KirriemuirCommunityPlanSummary.pdf
99Monifieth and Sidlaw Community Plan 2011 – 2013 http://www.angus.org.uk/pdfs/communityplans/Monifieth.pdf
100 Montrose Together Action Plan Nov 2013 http://www.angus.org.uk/pdfs/montroseactionplans/MontroseActionPlanNov2013.pdf
71

COMMUNITY LED LOCAL DEVELOPMENT: ANGUS LOCAL DEVELOPMENT STRATEGY
Appendix 10: The online survey
An e-survey was distributed through community channels during early March 2014. 146 individuals responded to the survey, including 29 who did not complete the survey. Incomplete responses are included in the survey analysis; obvious duplicates were removed. Most of the responses to the e-survey came from individuals (69%), while a few people responded on behalf of either a community group (13%) voluntary organization (8%) or a private sector business (2%), and one person on behalf of a social enterprise. (n=144).
What do you see as the strengths of Angus that communities can build on?
All seven of the suggested strengths for communities to build on in Angus were rated as important or very important by the majority of respondents (73% +). The factors rated as most important were that Angus is a good place to live and bring up a family (90% important or very important), agriculture and local produce (88%) and landscape and the natural environment (87%) (n=140). When asked to say more about their choices, several respondents made further comments about the value of Angus’ coastal environment, arts and culture, and about care of the elderly.
“Angus has a varied and interesting coast line in terms of habitat and diversity of wildlife, flora and fauna. It is not exploited as the valuable resource it is. At Carnoustie, for example, there is a stretch of coastal pathway utterly devoid of any interpretation material. Angus countryside rangers lead walks in country parks, but ignore the beaches, sand dunes and rock pools of the Angus coast”
What are the biggest problems facing communities in Angus?The most highly rated problem facing communities in Angus was the lack of good jobs (78% important or very important). Lack of support both for older people (73%) and for younger people (67%) were also rated as important. Poor broadband reach is also of considerable concern, with the highest score for “very important” (36%). The least important problem was rated as the lack of initiatives to tackle climate change, with 33% of respondents rating this as either unimportant or insignificant. Comments focused around tourism and fishing, although there was no strong consensus on whether either was the problem or the solution. (n=129)
72

COMMUNITY LED LOCAL DEVELOPMENT: ANGUS LOCAL DEVELOPMENT STRATEGY
“Creating activities appealing to visitors will create jobs and bring money into Angus. Better to look ahead than try and prop up fishing when the seas are over-fished anyway.”
What kinds of things do you think communities should be helped to take forward?The clear priorities for communities requiring help to take forward were related to employment and business: helping young people to get jobs (91% very high or high priority), supporting the creation of new jobs (88%), skills and training to help people gain jobs (83%), and helping small businesses to grow (82%). The lowest priority issue was helping migrant workers to settle in communities; only 5% felt this was a very high priority. However, the majority (70%) felt it was at least a medium priority. (n=128)
Opinions were strongly divided (votes were evenly spread from high to low priority) on community ownership of local land and buildings, and initiatives to tackle climate change. Recurring issues in the comments included work-based education in schools, and prioritizing quality of life and pride of place for locals ahead of tourists.
73
COMMUNITY LED LOCAL DEVELOPMENT: ANGUS LOCAL DEVELOPMENT STRATEGY
74

COMMUNITY LED LOCAL DEVELOPMENT: ANGUS LOCAL DEVELOPMENT STRATEGY
To what extent do you think communities across Angus are well placed to respond to the opportunity to bid for funding for local initiatives and put them into practice?The majority of respondents (64%) felt that at least some communities were not well-placed to bid for funding and then put initiatives into practice. However, 20% also felt that some communities were well-placed. (n=126).
What kind of support do communities need to develop and take forward their own initiatives to make their communities better places?
Respondents rated support with cash flow management (39% very high priority), writing applications (39%), managing implementation (29%) and help with business plans (31%) as among the highest priorities for communities. Although community consultation and surveys rated relatively low, a recurring issue in the comments was the need for a higher quality of community consultation, with action taken as a result. (n=122)
75

COMMUNITY LED LOCAL DEVELOPMENT: ANGUS LOCAL DEVELOPMENT STRATEGY
76