angus genetic evaluation update update_ncangusfieldday.pdf · •single step genomics •improved...
TRANSCRIPT
Angus Genetic Evaluation Update
Dan Moser, AGI President and AAA Director of Performance Programs
Stephen Miller, AGI Genetic Research Director
Kelli Retallick, AGI Genetic Services Director
North Carolina Angus Field Day

Key Topics
I. Genetic Evaluation update
A. Enhancements
B. Validation
C. Changes
II. $Values, Economic Assumptions
III. Questions & Discussion

Angus Genetics Inc.
• Wholly-owned subsidiary of the American Angus Association
– Four geneticists
– Seven customer service representatives
– Receive significant support from AAA Information Systems, Angus Media
– Strategic partnerships

Genetic Evaluation Services
• AGI is the world’s leading provider of beef genetic information
• Deliver genetic evaluation services to the American Angus Association, and five other breed organizations

Dan Moser, Ph.DAGI President
Stephen Miller, Ph.DAGI Genetic Research
Director
Kelli Retallick, M.S.AGI Genetic Service
Director
Lizhen Wang, Ph.DAGI Research
Geneticist
Lou Ann AdamsDirector of
Information Systems
Janice BlairProgrammer
Gayle BillupsProgrammer
Marg DressmanSoftware Engineer
Jason KenyonAssistant Director of Information Systems

Ignacy Misztal, Ph.D Daniela Lourenco, Ph.D
Yutaka Masuda, Ph.D Shogo Tsruuta, Ph.D
Romdhane Rekaya, Ph. D
J. Keith Bertrand, Ph.D

New and Improved Angus Genetic
Evaluation Released 7/7/17
JULY 2017"Different isn’t always better, but better is always different." - Author Unknown

The Evolution of Livestock Measurement
WEANING AND YEARLING WEIGHTS
WITHIN HERD RATIOS
EXPECTED PROGENY DIFFERENCES
$ VALUES: BIO-ECONOMIC INDEXES
GENOMICALLY ENHANCED EPDs
and INDEXES and INDEXES

Enhancements to Angus
Evaluation on 7/7/17• Single Step Genomics• Improved models for carcass
traits• Additional genotypes and
data• Updated heritability and
genetic correlation estimates• Annual update of economic
assumptions for $Values
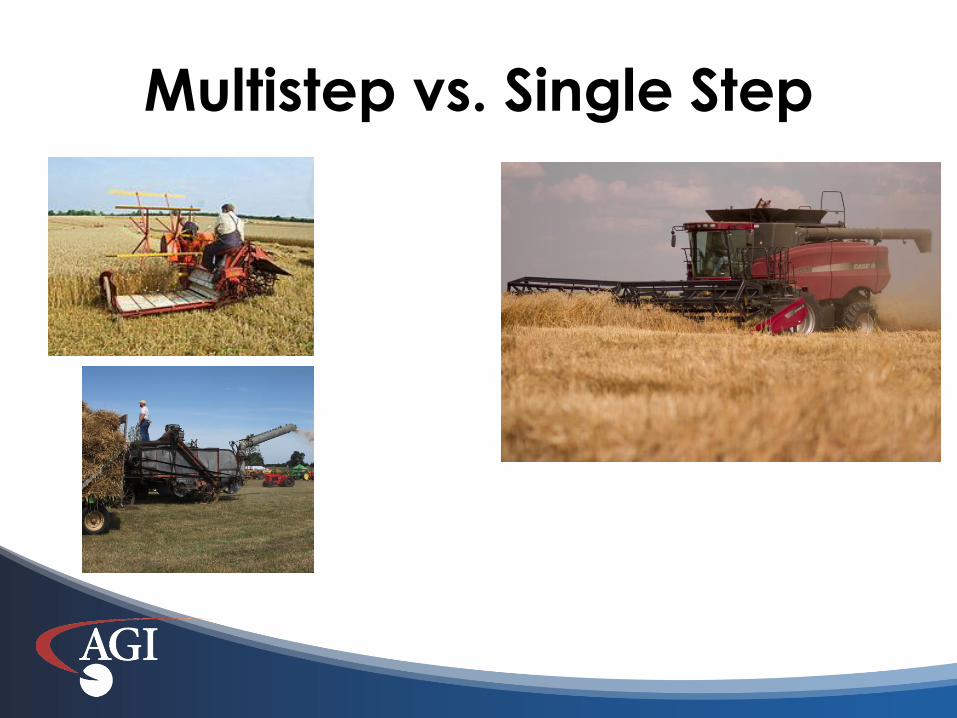
Multistep vs. Single Step

GE-EPDs Combine Multiple
Sources of Information
GE-EPD
Pedigree
PerformanceGenomic Testing
Progeny Data
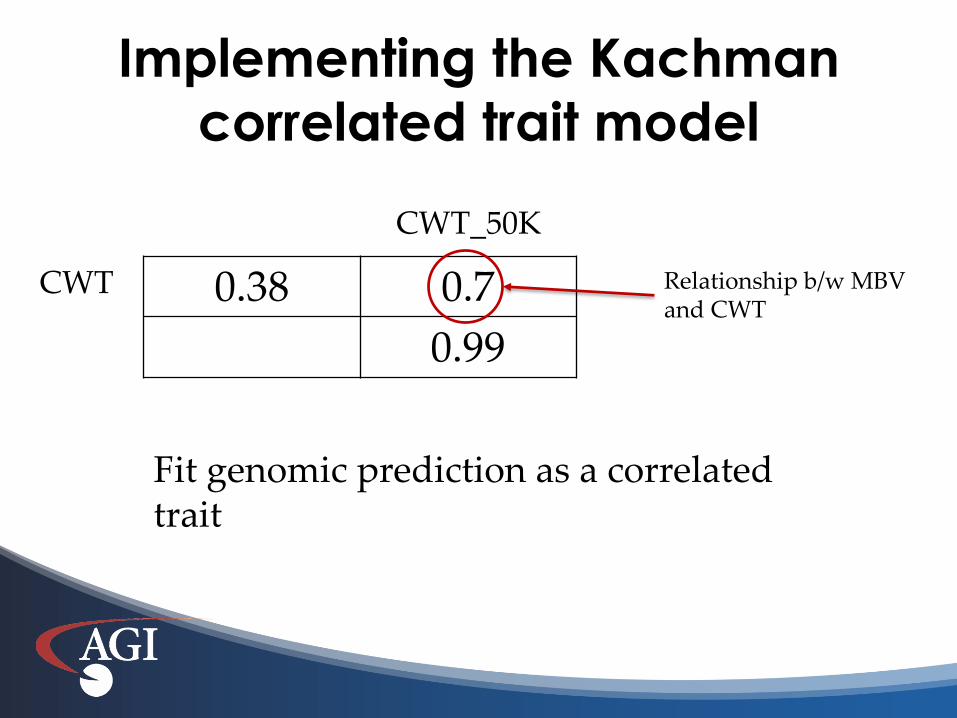
Implementing the Kachman
correlated trait model
0.38 0.7
0.99
CWT
CWT_50K
Fit genomic prediction as a correlated trait
Relationship b/w MBV and CWT

h2+rg RIB CWT LWT URIB_B URIB_C URIB_S CWT_M1 RIB_M1 CWT_M2 RIB_M2 CWT_50K RIB_50K
RIB X X X X X X X X X X X X
CWT X X X X X X X X X X X
LWT X X X X X X X X X X
URIB_B X X X X X X X X X
URIB_C X X X X X X X X
URIB_SX
X X X X X X
CWT_M1 X X X X X X
RIB_M! X X X X X
CWT_M2 X X X X
RIB_M2 X X X
CWT_50K X X
RIB_50K
X

Single-Step Approach
• Redefines pedigree relationships among animals based on genetic markers
PGS
S
PGD
X
MGS
D
MGDAguilar et al, 2010

Single-Step Approach
• Redefines pedigree relationships among animals based on genetic markers
PGS
S
50% PGD
X
MGS
25% D
MGDAguilar et al, 2010

Genomics captures more
variation in relationships
6 - Full Sibs
• Pedigree – 0.59
• Genomics 0.49 – 0.65
232 – ½ sibs
• Pedigree min = 0.29
• Genomic min = 0.19
Dr. Daniela Laurenco, UGA

h2+rg RIB CWT LWT URIB_B URIB_C URIB_S
RIB X X X X X X
CWT X X X X X
LWT X X X X
URIB_B X X X
URIB_C X X
URIB_SX
Single Step allows a more
DIRECT model

h2+rg RIB CWT LWT URIB_B URIB_C WWT UFAT_B UFAT_C FAT
RIB X X X X X X X X X
CWT X X X X X X X X
LWT X X X X X X X
URIB_B X X X X X X
URIB_C X X X X X
WWTX
X X X
UFAT_B X X X
UFAT_C! X X
FAT X
Single Step allows a more COMPLETE model

Adding weaning weight reduces
selection biasA selected group is
chosen to be scanned:
Above average for
growth a weaning time
Half are below average
for ultrasound scan
weight – even though
all were pre-selected high performers
Penalized unfairly for
carcass weight
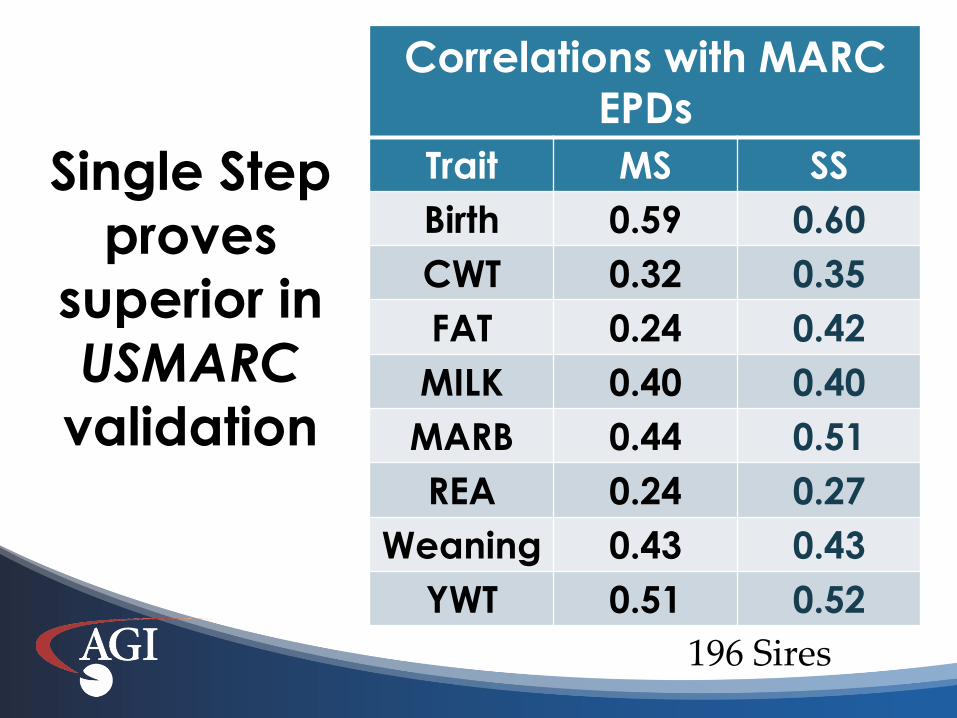
Single Step
proves
superior in
USMARC
validation
Correlations with MARC
EPDs
Trait MS SS
Birth 0.59 0.60
CWT 0.32 0.35
FAT 0.24 0.42
MILK 0.40 0.40
MARB 0.44 0.51
REA 0.24 0.27
Weaning 0.43 0.43
YWT 0.51 0.52
196 Sires
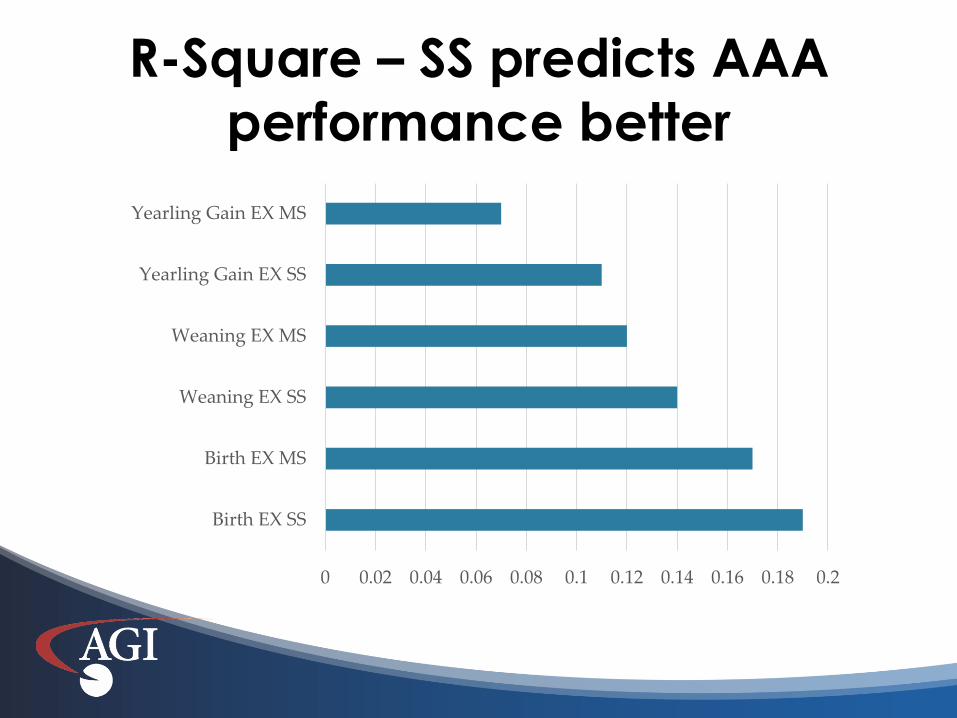
R-Square – SS predicts AAA
performance better
0 0.02 0.04 0.06 0.08 0.1 0.12 0.14 0.16 0.18 0.2
Birth EX SS
Birth EX MS
Weaning EX SS
Weaning EX MS
Yearling Gain EX SS
Yearling Gain EX MS

Single Step Weights Genomics
Variably Across the Population
• Multi-step = “One size fits all”
• Single Step• Weights genomics more for animals genetically
“closer” to the data
• Like having an accuracy value for the genomic component of the EPD
• Animals distant from data will change less from DNA testing, and have lower EPD accuracy

h2 SS Prog Equiv
Ave. SS. Acc
CED 0.19 28 0.36BW 0.46 21 0.48WW 0.28 26 0.42YW 0.27 21 0.38Milk 0.12 33 0.30DMI 0.34 8 0.24HP 0.15 14 0.20SC 0.48 13 0.40YHT 0.51 11 0.39Doc 0.44 10 0.34MW 0.37 11 0.31MH 0.62 8 0.36CWT 0.44 9 0.32MARB 0.48 9 0.34REA 0.32 12 0.30Fat 0.33 10 0.29
Angus Progeny Equivalents with SS EPD
Genotyped non-parent animals (2014-2016 born). Average accuracy and number of progeny required to reach that accuracy.

Genotypes in Angus Genetic
EvaluationDate Genotypes
Oct. 2012 11,000
Oct. 2013 42,000
Oct. 2014 89,000
Oct. 2015 159,000
Oct. 2016 262,000
Current 355,000

Data + DNA = Selection Tools that Work
• 7.8M birth weights• 8.6M weaning weights• 4.2M post-weaning gain records• 1.5M heifer calving ease scores• 115K carcass records• 1.9M ultrasound records• 20K individual intake records• 256K docility scores• 60K heifer pregnancy observations• 203K mature cow weights• 355K Genotypes
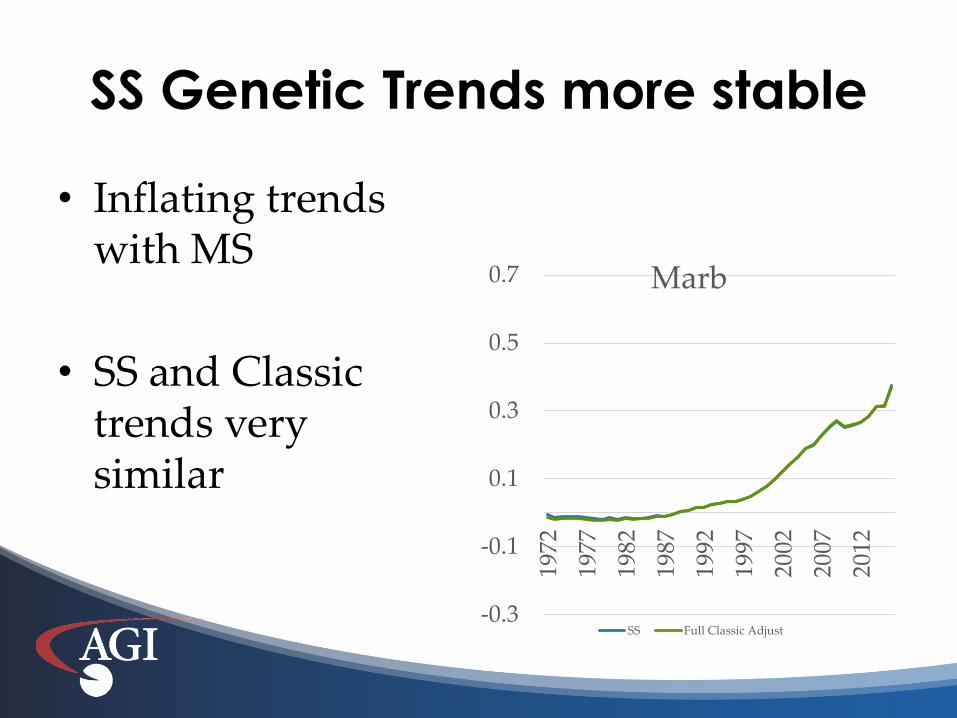
SS Genetic Trends more stable
• Inflating trends with MS
• SS and Classic trends very similar
-0.3
-0.1
0.1
0.3
0.5
0.7
1972
1977
1982
1987
1992
1997
2002
2007
2012
Marb
SS Full Classic Adjust

-4
-3
-2
-1
0
1
2
319
72
1974
1976
1978
1980
1982
1984
1986
1988
1990
1992
1994
1996
1998
2000
2002
2004
2006
2008
2010
2012
2014
2016
MS SSNewBase
Birth EPD Trend is Flatter

Yearling EPD Trend is Steeper
-60
-40
-20
0
20
40
60
80
10019
72
1974
1976
1978
1980
1982
1984
1986
1988
1990
1992
1994
1996
1998
2000
2002
2004
2006
2008
2010
2012
2014
2016
MS SSNewBase

Milk EPD Trend is Flatter
-5
0
5
10
15
20
25
3019
72
1974
1976
1978
1980
1982
1984
1986
1988
1990
1992
1994
1996
1998
2000
2002
2004
2006
2008
2010
2012
2014
2016
MS SSNewBase

h2+rg RIB CWT LWT URIB_B URIB_C WWT UFAT_B UFAT_C FAT
RIB X X X X X X X X X
CWT X X X X X X X X
LWT X X X X X X X
URIB_B X X X X X X
URIB_C X X X X X
WWTX
X X X
UFAT_B X X X
UFAT_C! X X
FAT X
Single Step allows a more COMPLETE model
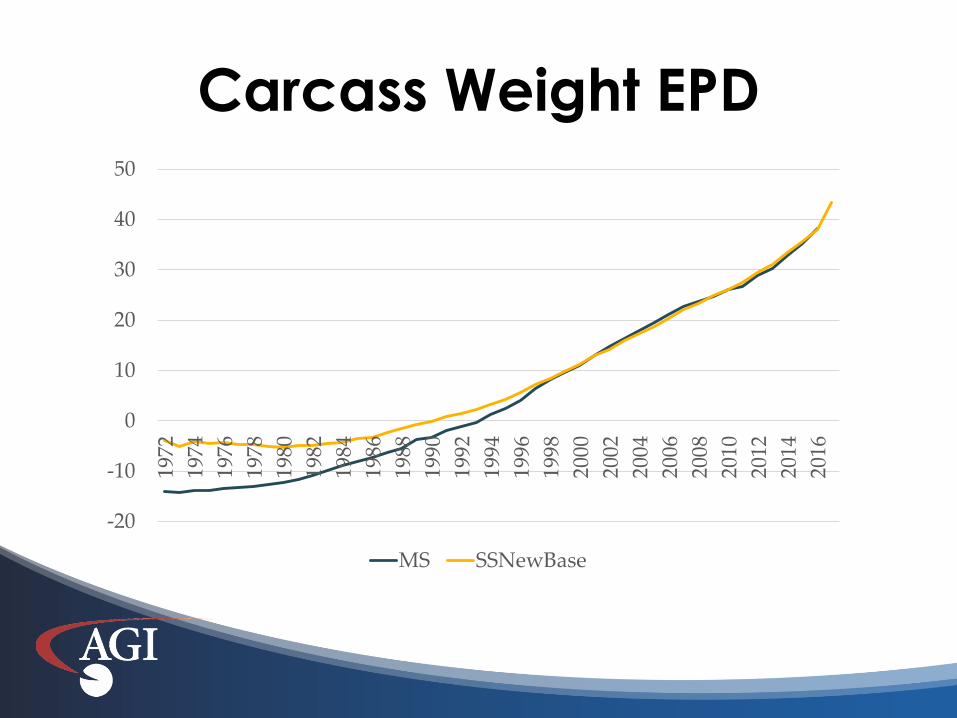
Carcass Weight EPD
-20
-10
0
10
20
30
40
5019
72
1974
1976
1978
1980
1982
1984
1986
1988
1990
1992
1994
1996
1998
2000
2002
2004
2006
2008
2010
2012
2014
2016
MS SSNewBase

Recent $B Trend very similar
-40
-20
0
20
40
60
80
100
120
140
1972 1974 1976 1978 1980 1982 1984 1986 1988 1990 1992 1994 1996 1998 2000 2002 2004 2006 2008 2010 2012 2014 2016
SS $B MS $B

Recent $W Trend very similar
-60
-40
-20
0
20
40
60
1972 1974 1976 1978 1980 1982 1984 1986 1988 1990 1992 1994 1996 1998 2000 2002 2004 2006 2008 2010 2012 2014 2016
$W SS $W MS

DMI EPD
-0.8
-0.6
-0.4
-0.2
0
0.2
0.419
72
1974
1976
1978
1980
1982
1984
1986
1988
1990
1992
1994
1996
1998
2000
2002
2004
2006
2008
2010
2012
2014
2016
MS SSNewBase

Summary of Changes
• More variation in DMI EPD• Narrower ranges for some traits, greater ranges
for others• More variation among half- and full-sibs• More current, real-time use of genomic
information• More accurate prediction of progeny performance• Friday data cut-off for weekly evaluation

A New Angus-CattleFax
Partnership
• Lance Zimmerman and Mike Murphy of CattleFax provided data and insight for this year’s economic updates
• Long-term partner, for consistency going forward

Economic assumptions for $Weaned
Dec-13 Dec-14 Jul-15 Jul-16 Jul-17
Ranch Assumptions:Base Calf Price 145 180 205 185 185Cow/Heifer Mix 80%/20% 80%/20% 80%/20% 80%/20% 80%/20%Cow Weight 1300 lb 1300 lb 1300 lb 1300 lb 1300 lbFeed energy cost 0.090 0.115 0.115 0.095 0.090

Economic assumptions for $BeefDec-13 Dec-14 Jul-15 Jul-16 Jul-17
Feedlot assumptions:Time on feed (days) 160 160 165 170 170Ration cost (per dry ton) 305 305 305 275 250Fed market (per cwt. Live) 115 130 140 135 130
Grid assumptions:Quality components:
Prime premium (above Choice) $14.00 $14.00 $14.00 $14.00 $14.00 CAB premium (above Choice) $4.00 $4.00 $4.00 $4.00 $4.00 Choice-Select spread $10.00 $10.00 $10.00 $10.00 $10.00 Standard discount ($22.00) ($22.00) ($22.00) ($22.00) ($25.00)
Yield components:YG 1 premium $4.50 $4.50 $4.50 $4.50 $4.50 YG 2 premium $2.25 $2.25 $2.25 $2.25 $2.25 YG 3 base $0.00 $0.00 $0.00 $0.00 $0.00 YG 4 & 5 discount ($18.00) ($18.00) ($18.00) ($18.00) ($18.00)Avg. carcass wt., lb. 816 816 816 836 861Heavyweight discount ($20.00) ($20.00) ($20.00) ($20.00) ($23.00)Discount weight 950 950 1,000 1,000 1,050

More Spread in $B, $WSlight increase in average values
Old $W New $W Old $B New $B
Max 102 102 198 215
25% 56 56 127 130
50% 46 46 107 108
75% 36 36 85 84
Min -55 -55 -105 -80

Rebuilding Angus $Values
• Propose a frame-off restoration
• Complete Model Rebuild for all $Values
• $W
– CEM
– HP
– DMI
• $Total Profit – from Long-Range Strategic Plan

Changes Coming in 2018
• Economic updates implemented in June, instead of first of July
• Comprehensive review and updating of $Value definitions, traits included, additional $Values

Birth without weaning
implemented on August 8th
• Birth weights submitted before this date will be processed as normal
• Basic principles still apply: – Set of 2 or more animals; best to work towards a
CG of at least 10
– CG of 1, not useful for NCE
– Registered vs. commercial recipient dams
• Birth growth-correlations now in NCE
• Separate sex at birth contemporary grouping.

• Weights, ultrasound scans, calving ease scores, scrotal measurements, etc. are more important than ever.
Genomic technologies are only as strong as our database. It is important to feed this database in order to continue critiquing and improving these technologies.
In the era of genomics,
PHENOTYPE is king.

Questions?Dan W. Moser, Ph.D. AGI [email protected] 816-383-5196
Kelli Retallick, M.S. Genetic Service [email protected] 816-383-5190
Stephen Miller, Ph.D. Genetic Research [email protected] 816-383-5157