angelina riverexercise final
TRANSCRIPT

Drainage Basin of
Angelina River
near Alto, Texas
Hydroclimatic Relationships
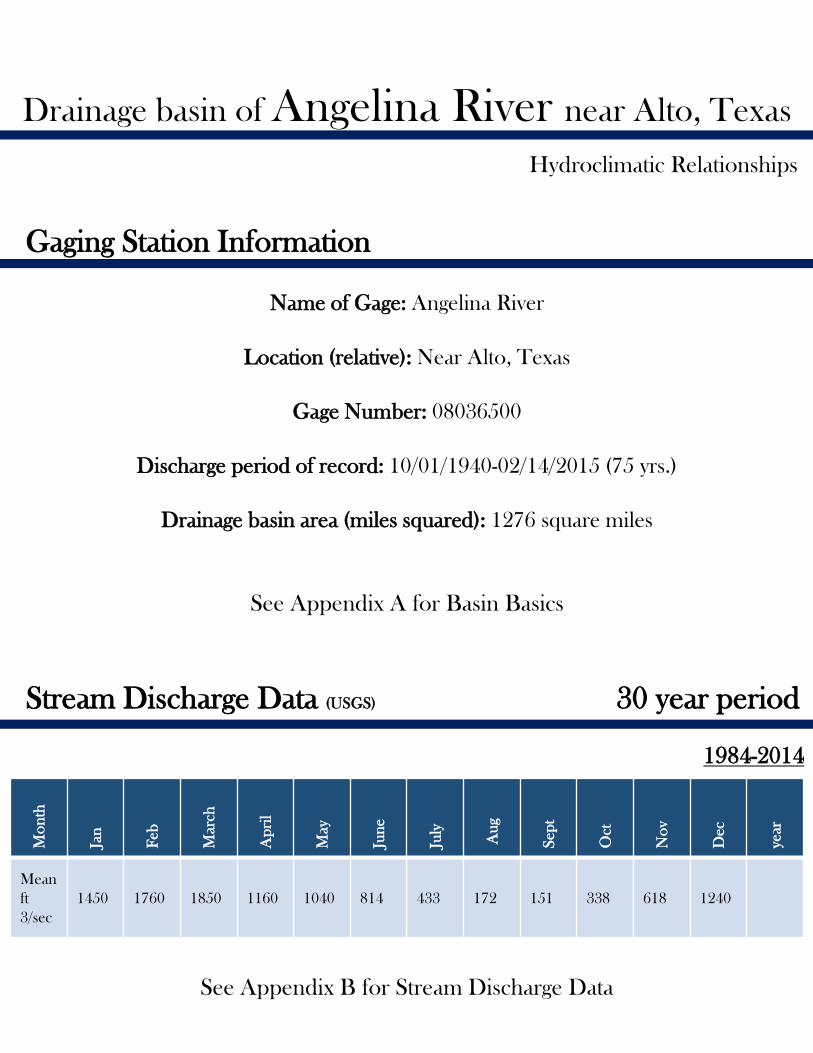
Drainage basin of Angelina River near Alto, Texas
Hydroclimatic Relationships
Name of Gage: Angelina River
Location (relative): Near Alto, Texas
Gage Number: 08036500
Discharge period of record: 10/01/1940-02/14/2015 (75 yrs.)
Drainage basin area (miles squared): 1276 square miles
Gaging Station Information
Stream Discharge Data (USGS) 30 year period
See Appendix A for Basin Basics
Mo
nth
Jan
Feb
Marc
h
Ap
ril
May
Jun
e
July
Au
g
Sep
t
Oct
No
v
Dec
year
Mean
ft
3/sec
1450 1760 1850 1160 1040 814 433 172 151 338 618 1240
1984-2014
See Appendix B for Stream Discharge Data
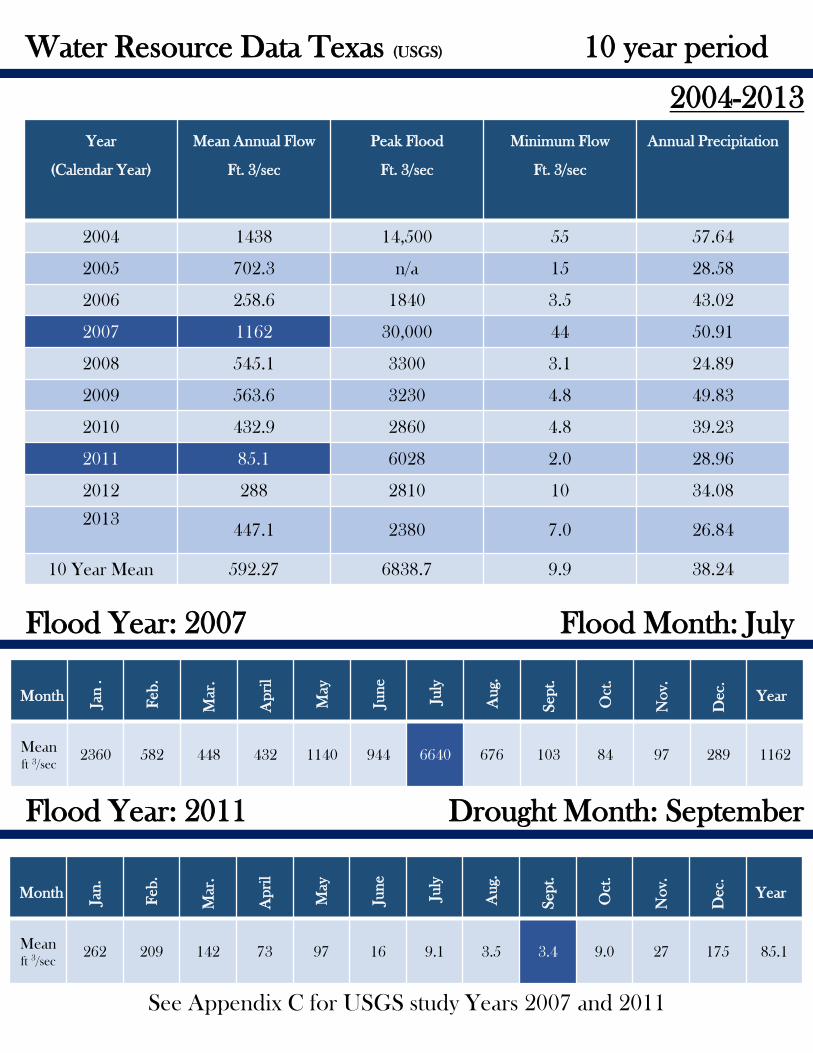
Water Resource Data Texas (USGS) 10 year period
2004-2013
Flood Year: 2007 Flood Month: July
Year
(Calendar Year)
Mean Annual Flow
Ft. 3/sec
Peak Flood
Ft. 3/sec
Minimum Flow
Ft. 3/sec
Annual Precipitation
2004 1438 14,500 55 57.64
2005 702.3 n/a 15 28.58
2006 258.6 1840 3.5 43.02
2007 1162 30,000 44 50.91
2008 545.1 3300 3.1 24.89
2009 563.6 3230 4.8 49.83
2010 432.9 2860 4.8 39.23
2011 85.1 6028 2.0 28.96
2012 288 2810 10 34.08
2013447.1 2380 7.0 26.84
10 Year Mean 592.27 6838.7 9.9 38.24
Month
Jan
.
Feb
.
Mar.
Ap
ril
May
Jun
e
July
Au
g.
Sep
t.
Oct
.
No
v.
Dec.
Year
Meanft 3/sec
2360 582 448 432 1140 944 6640 676 103 84 97 289 1162
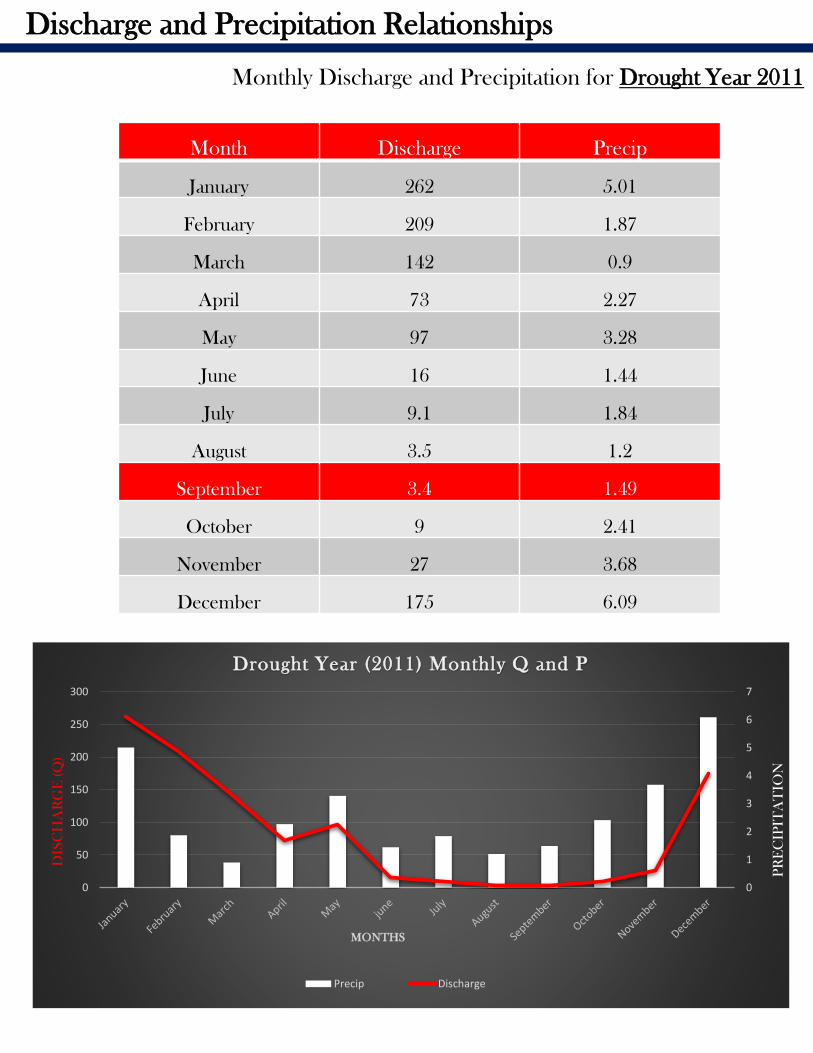
Flood Year: 2011 Drought Month: September
Month
Jan
.
Feb
.
Mar.
Ap
ril
May
Jun
e
July
Au
g.
Sep
t.
Oct
.
No
v.
Dec.
Year
Meanft 3/sec
262 209 142 73 97 16 9.1 3.5 3.4 9.0 27 175 85.1
See Appendix C for USGS study Years 2007 and 2011
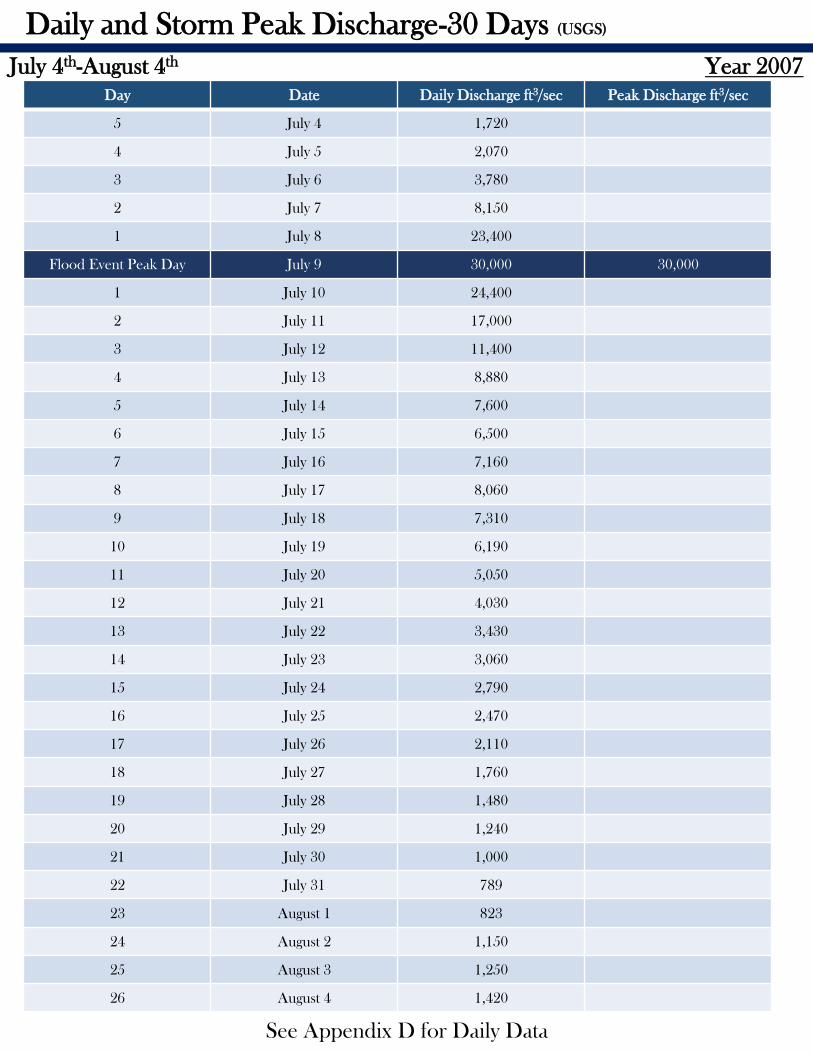
Day Date Daily Discharge ft3/sec Peak Discharge ft3/sec
5 July 4 1,720
4 July 5 2,070
3 July 6 3,780
2 July 7 8,150
1 July 8 23,400
Flood Event Peak Day July 9 30,000 30,000
1 July 10 24,400
2 July 11 17,000
3 July 12 11,400
4 July 13 8,880
5 July 14 7,600
6 July 15 6,500
7 July 16 7,160
8 July 17 8,060
9 July 18 7,310
10 July 19 6,190
11 July 20 5,050
12 July 21 4,030
13 July 22 3,430
14 July 23 3,060
15 July 24 2,790
16 July 25 2,470
17 July 26 2,110
18 July 27 1,760
19 July 28 1,480
20 July 29 1,240
21 July 30 1,000
22 July 31 789
23 August 1 823
24 August 2 1,150
25 August 3 1,250
26 August 4 1,420
See Appendix D for Daily Data
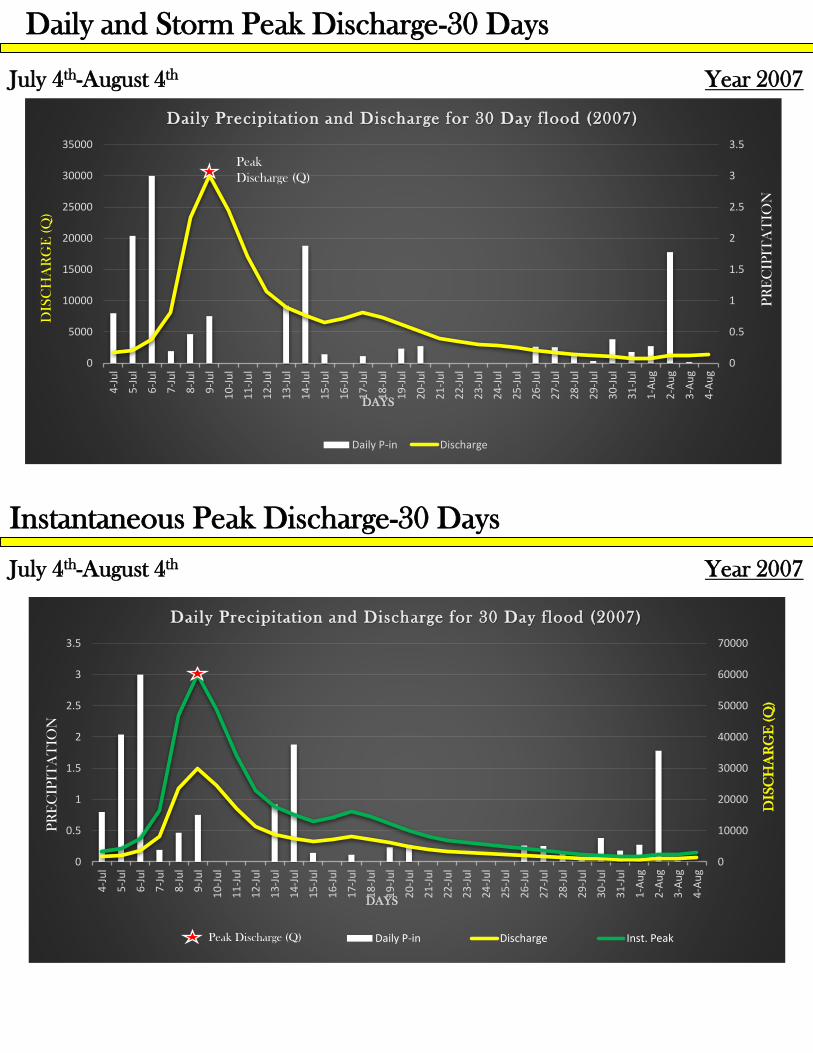
Daily and Storm Peak Discharge-30 Days (USGS)
July 4th-August 4th Year 2007

Add four stations with map and polygon Thiessen from other Power Point
• http://waterdata.usgs.gov/nwis/monthly?referred_module=sw&site_no=08036500&por_08036500_4=301,00060,4,1940-10,2014-12&start_dt=1984-01&end_dt=2014-12&format=html_table&date_format=YYYY-MM-DD&rdb_compression=value&submitted_form=parameter_selection_list (monthly long term data years 1984-2014)
• http://waterdata.usgs.gov/nwis/annual/?referred_module=sw&site_no=08036500&por_08036500_4=301,00060,4,1941,2015&start_dt=1984&end_dt=2014&year_type=W&format=html_table&date_format=YYYY-MM-DD&rdb_compression=file&submitted_form=parameter_selection_list (annual long term stats 1984-2014-water year)
• http://waterdata.usgs.gov/nwis/annual/?referred_module=sw&site_no=08036500&por_08036500_4=301,00060,4,1941,2015&start_dt=1984&end_dt=2014&year_type=C&format=html_table&date_format=YYYY-MM-DD&rdb_compression=file&submitted_form=parameter_selection_list (annual long term stats 1984-2014-cal year)
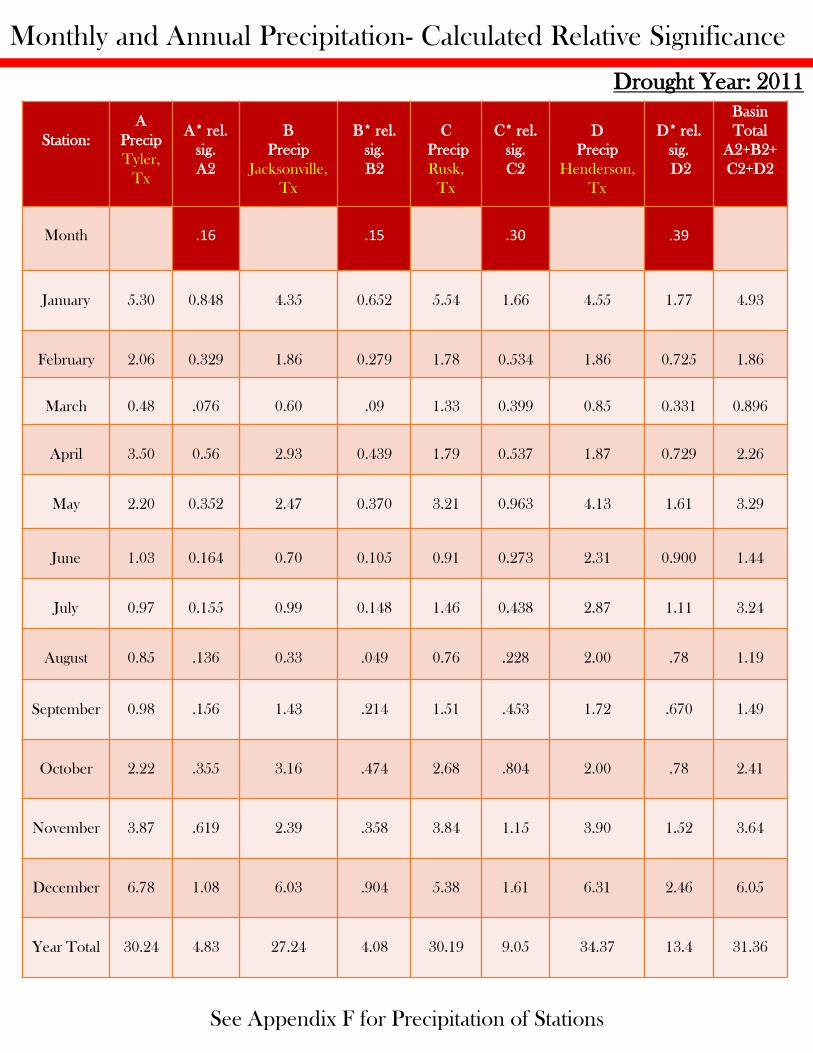
Station:
A
Precip
Tyler,
Tx
A* rel.
sig.
A2
B
Precip
Jacksonville,
Tx
B* rel.
sig.
B2
C
Precip
Rusk,
Tx
C* rel.
sig.
C2
D
Precip
Henderson,
Tx
D* rel.
sig.
D2
Basin
Total
A2+B2+
C2+D2
Month .16 .15 .30 .39
January 8.79 1.40 5.96 0.894 6.30 1.89 7.78 3.03 7.24
February 1.41 0.225 0.70 0.105 1.54 0.462 2.22 0.865 1.65
March 2.19 0.350 3.20 0.48 2.66 0.798 3.22 1.25 2.87
April 5.56 0.889 3.83 0.575 2.03 0.609 2.83 1.10 3.17
May 8.33 1.33 7.27 1.09 7.39 2.21 8.28 3.22 7.85
June 8.57 1.37 7.67 1.15 7.05 2.11 6.13 2.39 7.02
July 13.8 2.20 14.61 2.19 2.97 0.891 9.32 3.63 8.91
August 1.03 0.164 2.07 0.310 1.20 0.36 0.84 0.327 1.16
September 0.54 0.086 1.91 0.286 2.30 0.69 1.61 0.627 1.68
October 1.19 0.190 1.92 0.288 2.46 0.734 2.74 1.06 2.27
November 2.37 0.379 2.45 0.367 2.26 0.678 2.40 0.936 2.36
December 3.48 0.556 2.76 0.414 3.43 1.02 3.40 1.32 3.31
Year Total 57.21 9.15 54.35 8.15 51.89 15.6 50.77 19.8 52.8
Monthly and Annual Precipitation- Calculated Relative Significance
Flood Year: 2007
See Appendix E for Precipitation of Stations
Station:
A
Precip
Tyler,
Tx
A* rel.
sig.
A2
B
Precip
Jacksonville,
Tx
B* rel.
sig.
B2
C
Precip
Rusk,
Tx
C* rel.
sig.
C2
D
Precip
Henderson,
Tx
D* rel.
sig.
D2
Basin
Total
A2+B2+
C2+D2
Month .16 .15 .30 .39
January 5.30 0.848 4.35 0.652 5.54 1.66 4.55 1.77 4.93
February 2.06 0.329 1.86 0.279 1.78 0.534 1.86 0.725 1.86
March 0.48 .076 0.60 .09 1.33 0.399 0.85 0.331 0.896
April 3.50 0.56 2.93 0.439 1.79 0.537 1.87 0.729 2.26
May 2.20 0.352 2.47 0.370 3.21 0.963 4.13 1.61 3.29
June 1.03 0.164 0.70 0.105 0.91 0.273 2.31 0.900 1.44
July 0.97 0.155 0.99 0.148 1.46 0.438 2.87 1.11 3.24
August 0.85 .136 0.33 .049 0.76 .228 2.00 .78 1.19
September 0.98 .156 1.43 .214 1.51 .453 1.72 .670 1.49
October 2.22 .355 3.16 .474 2.68 .804 2.00 .78 2.41
November 3.87 .619 2.39 .358 3.84 1.15 3.90 1.52 3.64
December 6.78 1.08 6.03 .904 5.38 1.61 6.31 2.46 6.05
Year Total 30.24 4.83 27.24 4.08 30.19 9.05 34.37 13.4 31.36
Monthly and Annual Precipitation- Calculated Relative Significance
Drought Year: 2011
See Appendix F for Precipitation of Stations
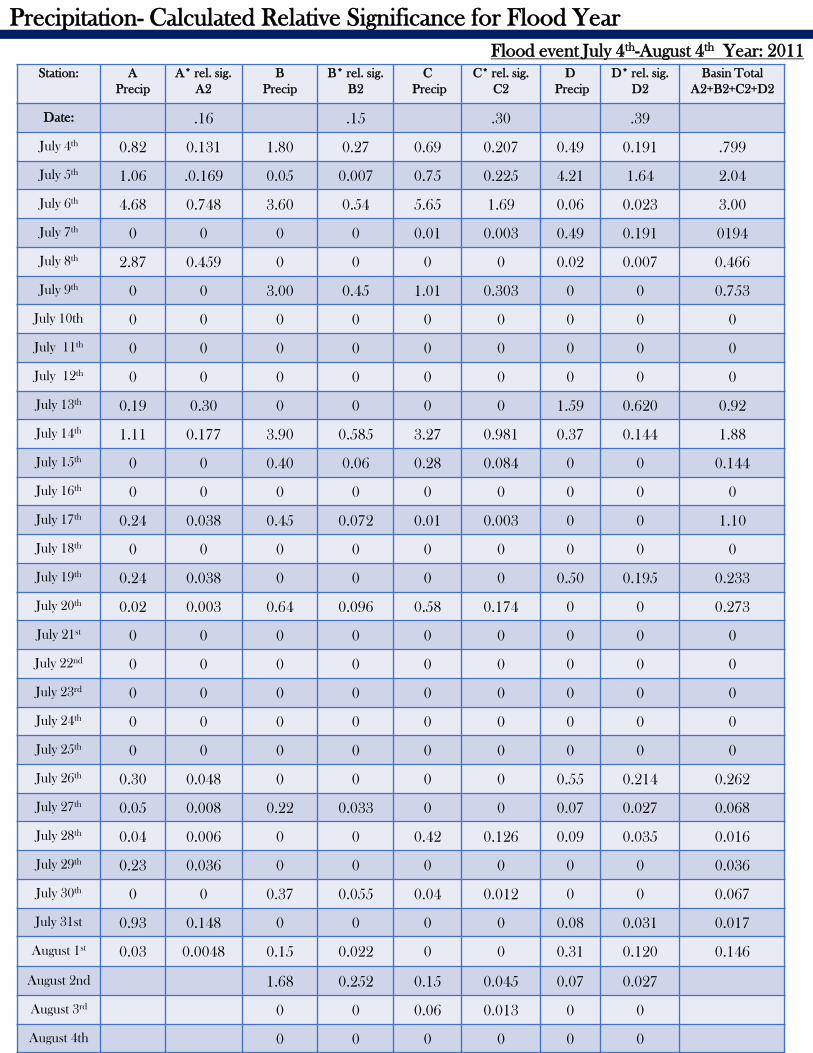
Precipitation- Calculated Relative Significance for Flood Year
Flood event July 4th-August 4th Year: 2011
Station: A
Precip
A* rel. sig.
A2
B
Precip
B* rel. sig.
B2
C
Precip
C* rel. sig.
C2
D
Precip
D* rel. sig.
D2
Basin Total
A2+B2+C2+D2
Date: .16 .15 .30 .39
July 4th 0.82 0.131 1.80 0.27 0.69 0.207 0.49 0.191 .799
July 5th 1.06 .0.169 0.05 0.007 0.75 0.225 4.21 1.64 2.04
July 6th 4.68 0.748 3.60 0.54 5.65 1.69 0.06 0.023 3.00
July 7th 0 0 0 0 0.01 0.003 0.49 0.191 0194
July 8th 2.87 0.459 0 0 0 0 0.02 0.007 0.466
July 9th 0 0 3.00 0.45 1.01 0.303 0 0 0.753
July 10th 0 0 0 0 0 0 0 0 0
July 11th 0 0 0 0 0 0 0 0 0
July 12th 0 0 0 0 0 0 0 0 0
July 13th 0.19 0.30 0 0 0 0 1.59 0.620 0.92
July 14th 1.11 0.177 3.90 0.585 3.27 0.981 0.37 0.144 1.88
July 15th 0 0 0.40 0.06 0.28 0.084 0 0 0.144
July 16th 0 0 0 0 0 0 0 0 0
July 17th 0.24 0.038 0.45 0.072 0.01 0.003 0 0 1.10
July 18th 0 0 0 0 0 0 0 0 0
July 19th 0.24 0.038 0 0 0 0 0.50 0.195 0.233
July 20th 0.02 0.003 0.64 0.096 0.58 0.174 0 0 0.273
July 21st 0 0 0 0 0 0 0 0 0
July 22nd 0 0 0 0 0 0 0 0 0
July 23rd 0 0 0 0 0 0 0 0 0
July 24th 0 0 0 0 0 0 0 0 0
July 25th 0 0 0 0 0 0 0 0 0
July 26th 0.30 0.048 0 0 0 0 0.55 0.214 0.262
July 27th 0.05 0.008 0.22 0.033 0 0 0.07 0.027 0.068
July 28th 0.04 0.006 0 0 0.42 0.126 0.09 0.035 0.016
July 29th 0.23 0.036 0 0 0 0 0 0 0.036
July 30th 0 0 0.37 0.055 0.04 0.012 0 0 0.067
July 31st 0.93 0.148 0 0 0 0 0.08 0.031 0.017
August 1st 0.03 0.0048 0.15 0.022 0 0 0.31 0.120 0.146
August 2nd 1.68 0.252 0.15 0.045 0.07 0.027
August 3rd 0 0 0.06 0.013 0 0
August 4th 0 0 0 0 0 0
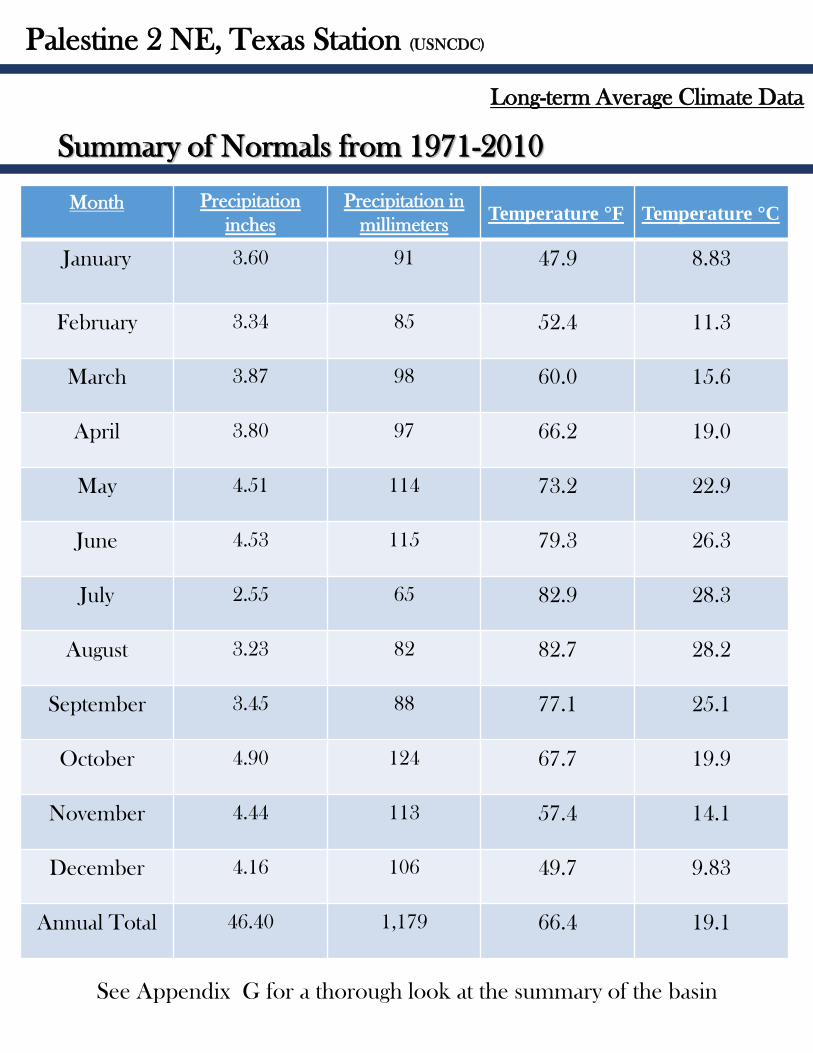
Palestine 2 NE, Texas Station (USNCDC)
Long-term Average Climate Data
Summary of Normals from 1971-2010
Month Precipitation
inches
Precipitation in
millimetersTemperature °F Temperature °C
January 3.60 91 47.9 8.83
February 3.34 85 52.4 11.3
March 3.87 98 60.0 15.6
April 3.80 97 66.2 19.0
May 4.51 114 73.2 22.9
June 4.53 115 79.3 26.3
July 2.55 65 82.9 28.3
August 3.23 82 82.7 28.2
September 3.45 88 77.1 25.1
October 4.90 124 67.7 19.9
November 4.44 113 57.4 14.1
December 4.16 106 49.7 9.83
Annual Total 46.40 1,179 66.4 19.1
See Appendix G for a thorough look at the summary of the basin
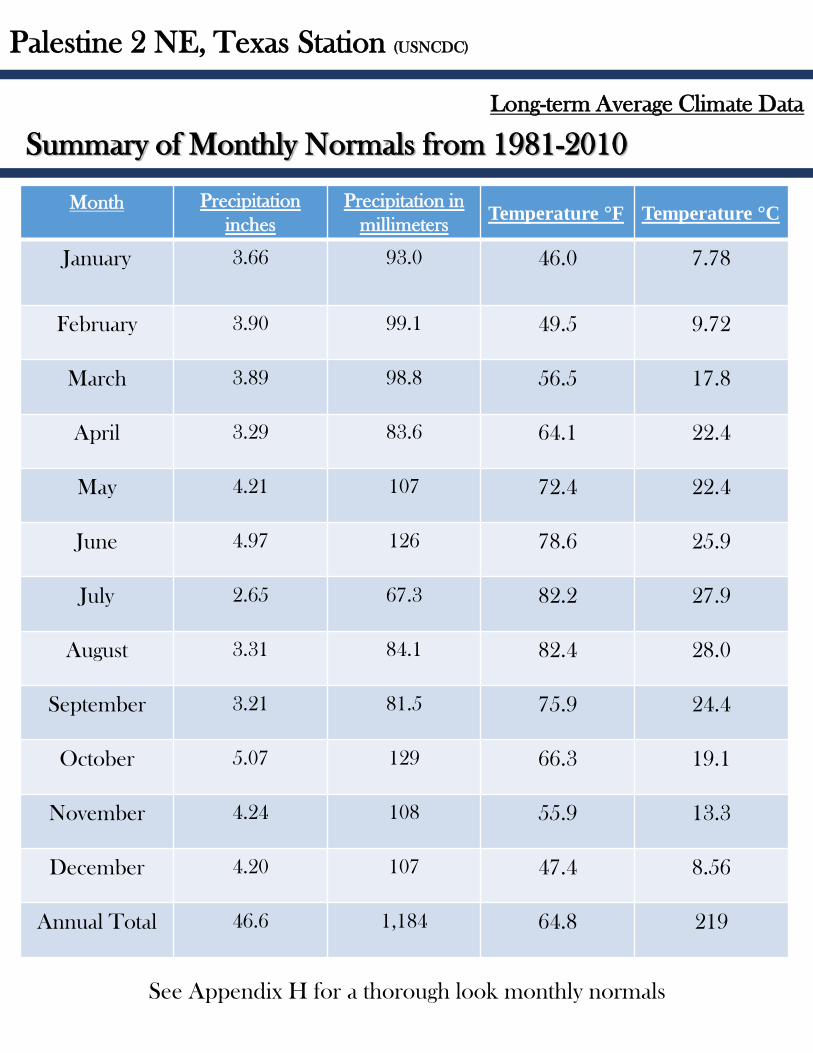
Palestine 2 NE, Texas Station (USNCDC)
Long-term Average Climate Data
Month Precipitation
inches
Precipitation in
millimetersTemperature °F Temperature °C
January 3.66 93.0 46.0 7.78
February 3.90 99.1 49.5 9.72
March 3.89 98.8 56.5 17.8
April 3.29 83.6 64.1 22.4
May 4.21 107 72.4 22.4
June 4.97 126 78.6 25.9
July 2.65 67.3 82.2 27.9
August 3.31 84.1 82.4 28.0
September 3.21 81.5 75.9 24.4
October 5.07 129 66.3 19.1
November 4.24 108 55.9 13.3
December 4.20 107 47.4 8.56
Annual Total 46.6 1,184 64.8 219
See Appendix H for a thorough look monthly normals
Summary of Monthly Normals from 1981-2010
Discharge and Precipitation Relationships
0
1
2
3
4
5
6
0
200
400
600
800
1000
1200
1400
PR
EC
IPIT
AIT
ION
MONTHS
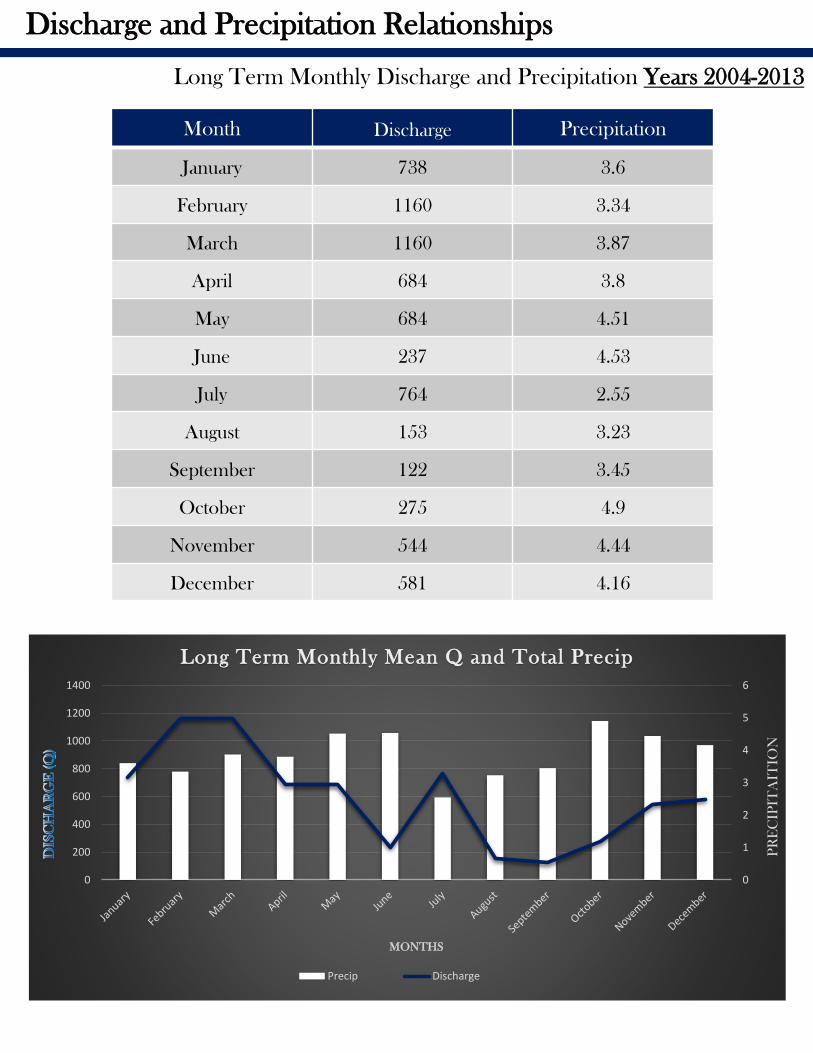
Long Term Monthly Mean Q and Total Precip
Precip Discharge
Month Discharge Precipitation
January 738 3.6
February 1160 3.34
March 1160 3.87
April 684 3.8
May 684 4.51
June 237 4.53
July 764 2.55
August 153 3.23
September 122 3.45
October 275 4.9
November 544 4.44
December 581 4.16
Long Term Monthly Discharge and Precipitation Years 2004-2013
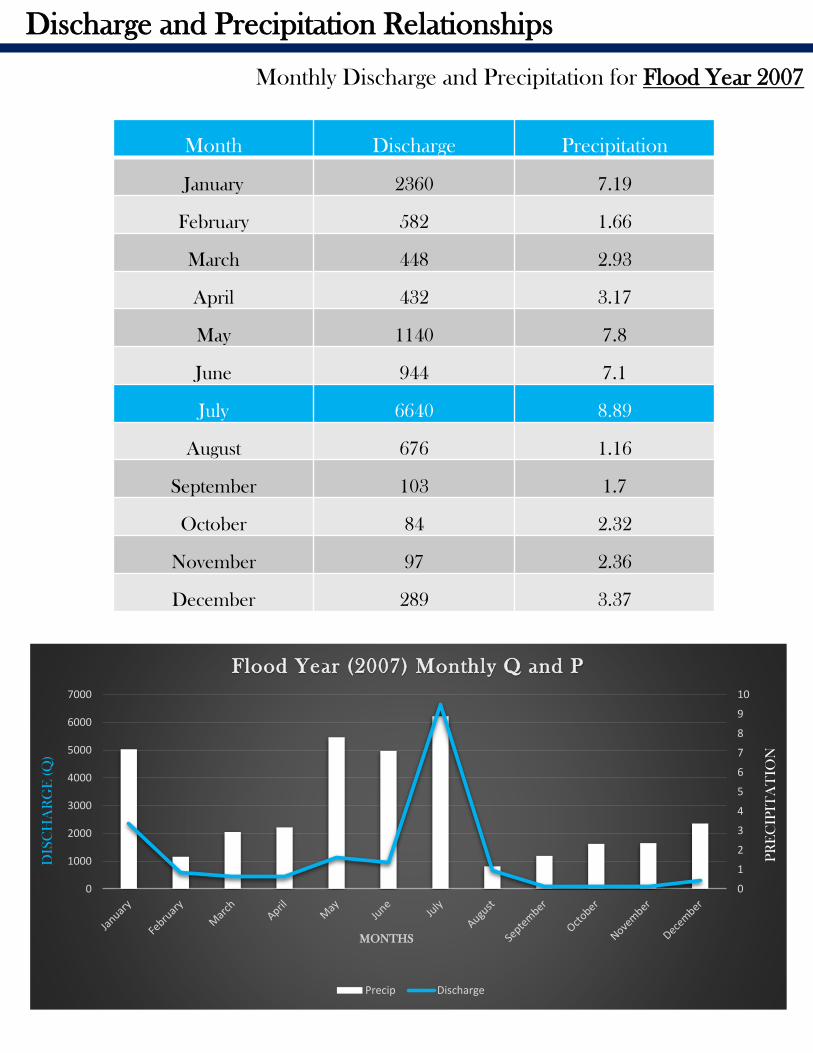
Month Discharge Precipitation
January 2360 7.19
February 582 1.66
March 448 2.93
April 432 3.17
May 1140 7.8
June 944 7.1
July 6640 8.89
August 676 1.16
September 103 1.7
October 84 2.32
November 97 2.36
December 289 3.37
Discharge and Precipitation Relationships
0
1
2
3
4
5
6
7
8
9
10
0
1000
2000
3000
4000
5000
6000
7000
PR
EC
IPIT
AT
ION
DIS
CH
AR
GE
(Q
)
MONTHS
Flood Year (2007) Monthly Q and P
Precip Discharge
Monthly Discharge and Precipitation for Flood Year 2007
Discharge and Precipitation Relationships
Monthly Discharge and Precipitation for Drought Year 2011
Month Discharge Precip
January 262 5.01
February 209 1.87
March 142 0.9
April 73 2.27
May 97 3.28
June 16 1.44
July 9.1 1.84
August 3.5 1.2
September 3.4 1.49
October 9 2.41
November 27 3.68
December 175 6.09
0
1
2
3
4
5
6
7
0
50
100
150
200
250
300
PR
EC
IPIT
AT
ION
DIS
CH
AR
GE
(Q
)
MONTHS
Drought Year (2011) Monthly Q and P
Precip Discharge
Total Precipitation and Discharge Flood Year: 2007
Date Daily Discharge
ft3/sec
Daily Q——a.f. Daily P— in Daily P—a.f. Q/P
July 4 1,720 3412 0.799 54375 2153
July 5 2,070 4106 2.04 138829 1015
July 6 3,780 7498 3 204160 1260
July 7 8,150 16165 0.194 13202 42010
July 8 23,400 46413 0.466 31713 50215
July 9 30,000 59504 0.753 51244 39841
July 10 24,400 48397 0 0 0
July 11 17,000 33719 0 0 0
July 12 11,400 22612 0 0 0
July 13 8,880 17613 0.92 62609 9652
July 14 7,600 15074 1.88 127940 4043
July 15 6,500 12893 0.144 9800 45139
July 16 7,160 14202 0 0 0
July 17 8,060 15987 0.113 7690 71327
July 18 7,310 14499 0 0 0
July 19 6,190 12278 0.233 15856 26567
July 20 5,050 10017 0.273 18579 18498
July 21 4,030 7993 0 0 0
July 22 3,430 6803 0 0 0
July 23 3,060 6069 0 0 0
July 24 2,790 5534 0 0 0
July 25 2,470 4899 0 0 0
July 26 2,110 4185 0.262 17830 8053
July 27 1,760 3491 0.255 17354 6902
July 28 1,480 2936 0.167 11365 8862
July 29 1,240 2460 0.036 2450 34444
July 30 1,000 1983 0.382 25996 2618
July 31 789 1565 0.179 12182 4408
August 1 823 1632 0.274 18647 3004
August 2 1,150 2281 1.78 121135 646
August 3 1,250 2479 0.018 1225 69444
August 4 1,420 2817 0 0 0
See Appendix I for Daily Discharge Data
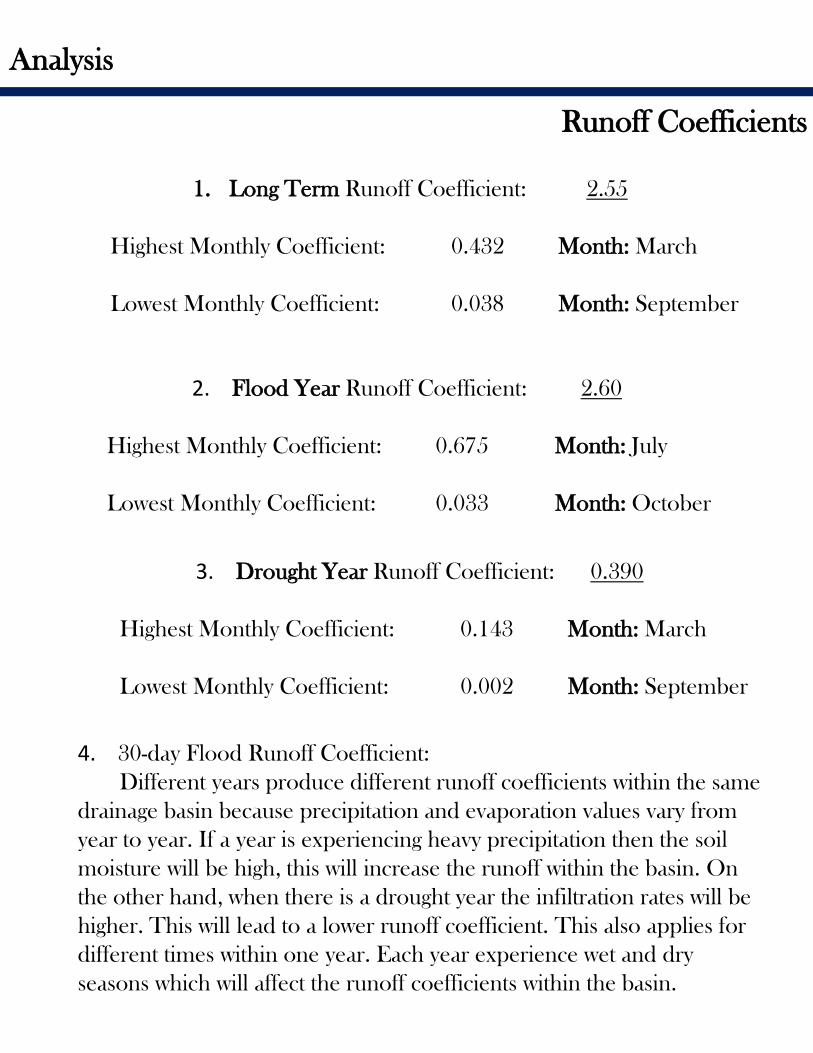
0
0.5
1
1.5
2
2.5
3
3.5
0
5000
10000
15000
20000
25000
30000
35000
4-J
ul
5-J
ul
6-J
ul
7-J
ul
8-J
ul
9-J
ul
10
-Ju
l
11
-Ju
l
12
-Ju
l
13
-Ju
l
14
-Ju
l
15
-Ju
l
16
-Ju
l
17
-Ju
l
18
-Ju
l
19
-Ju
l
20
-Ju
l
21
-Ju
l
22
-Ju
l
23
-Ju
l
24
-Ju
l
25
-Ju
l
26
-Ju
l
27
-Ju
l
28
-Ju
l
29
-Ju
l
30
-Ju
l
31
-Ju
l
1-A
ug
2-A
ug
3-A
ug
4-A
ug
PR
EC
IPIT
AT
ION
DIS
CH
AR
GE
(Q
)
DAYS
Daily Precipitat ion and Discharge for 30 Day flood (2007)
Daily P-in Discharge
Peak
Discharge (Q)
Daily and Storm Peak Discharge-30 Days
July 4th-August 4th Year 2007
0
10000
20000
30000
40000
50000
60000
70000
0
0.5
1
1.5
2
2.5
3
3.5
4-J
ul
5-J
ul
6-J
ul
7-J
ul
8-J
ul
9-J
ul
10
-Ju
l
11
-Ju
l
12
-Ju
l
13
-Ju
l
14
-Ju
l
15
-Ju
l
16
-Ju
l
17
-Ju
l
18
-Ju
l
19
-Ju
l
20
-Ju
l
21
-Ju
l
22
-Ju
l
23
-Ju
l
24
-Ju
l
25
-Ju
l
26
-Ju
l
27
-Ju
l
28
-Ju
l
29
-Ju
l
30
-Ju
l
31
-Ju
l
1-A
ug
2-A
ug
3-A
ug
4-A
ug
DIS
CH
AR
GE
(Q
)
PR
EC
IPIT
AT
ION
DAYS
Daily Precipitat ion and Discharge for 30 Day flood (2007)
Daily P-in Discharge Inst. PeakPeak Discharge (Q)
Instantaneous Peak Discharge-30 Days
July 4th-August 4th Year 2007

Mean Annual Discharge
Years: 2004-2013
Year Mean Annual Q—ft3/sec Annual Q—a.f. % 10 Year Mean
2004 1438 1,041,663 24.3
2005 702.3 508,734.51 11.9
2006 258.6 187,325.57 4.4
2007 1162 841,733.60 19.6
2008 545.1 394,861.43 9.2
2009 563.6 408,262.52 9.5
2010 432.9 303,585.61 7.3
2011 85.1 61,645.03 1.4
2012 288 208,622.44 4.9
2013 447.1 323,871.85 7.5
10 year Mean 592.27 429,030.56 100%
See Appendix J for Mean Annual Discharge
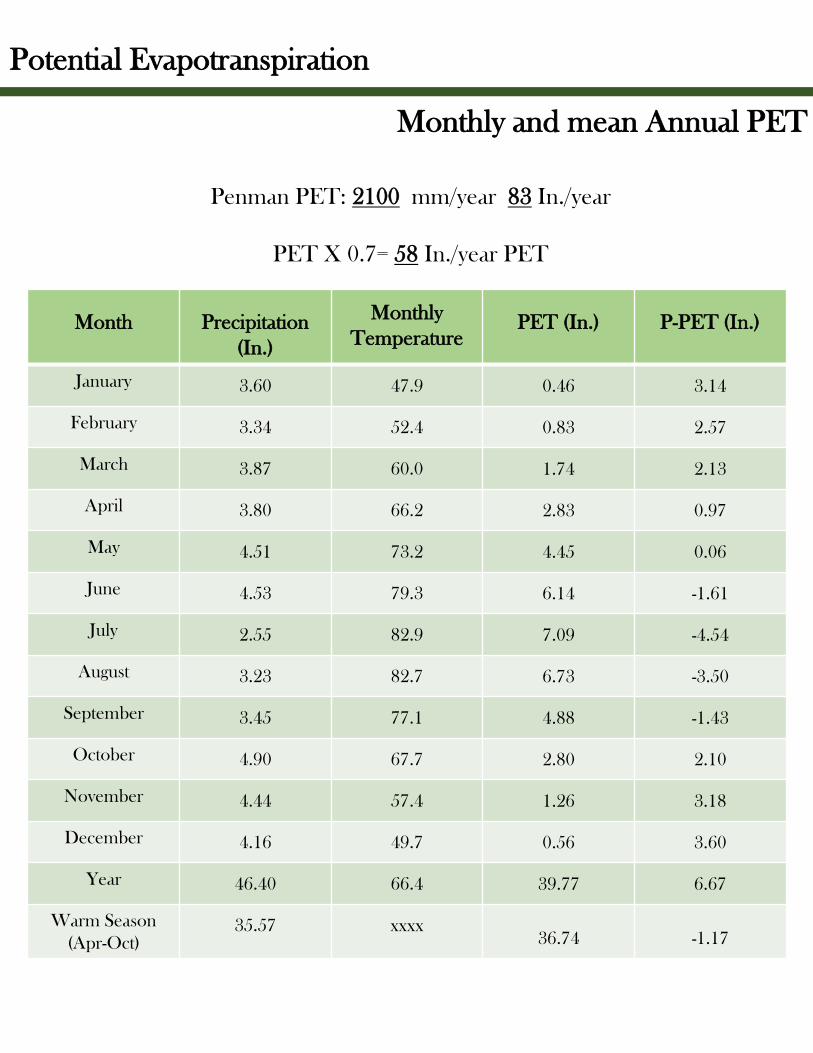
Analysis
Runoff Coefficients
1. Long Term Runoff Coefficient: 2.55
Highest Monthly Coefficient: 0.432 Month: March
Lowest Monthly Coefficient: 0.038 Month: September
2. Flood Year Runoff Coefficient: 2.60
Highest Monthly Coefficient: 0.675 Month: July
Lowest Monthly Coefficient: 0.033 Month: October
3. Drought Year Runoff Coefficient: 0.390
Highest Monthly Coefficient: 0.143 Month: March
Lowest Monthly Coefficient: 0.002 Month: September
4. 30-day Flood Runoff Coefficient:
Different years produce different runoff coefficients within the same
drainage basin because precipitation and evaporation values vary from
year to year. If a year is experiencing heavy precipitation then the soil
moisture will be high, this will increase the runoff within the basin. On
the other hand, when there is a drought year the infiltration rates will be
higher. This will lead to a lower runoff coefficient. This also applies for
different times within one year. Each year experience wet and dry
seasons which will affect the runoff coefficients within the basin.
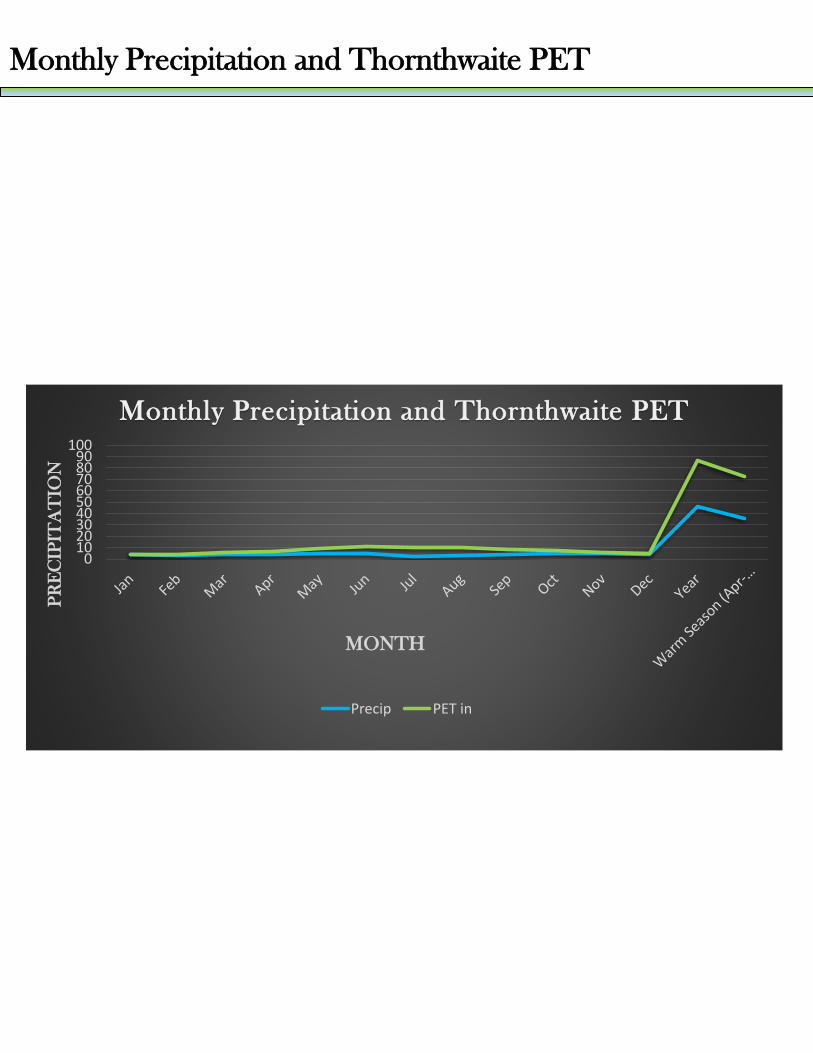
Potential Evapotranspiration
Monthly and mean Annual PET
Month Precipitation
(In.)
Monthly
TemperaturePET (In.) P-PET (In.)
January 3.60 47.9 0.46 3.14
February 3.34 52.4 0.83 2.57
March 3.87 60.0 1.74 2.13
April 3.80 66.2 2.83 0.97
May 4.51 73.2 4.45 0.06
June 4.53 79.3 6.14 -1.61
July 2.55 82.9 7.09 -4.54
August 3.23 82.7 6.73 -3.50
September 3.45 77.1 4.88 -1.43
October 4.90 67.7 2.80 2.10
November 4.44 57.4 1.26 3.18
December 4.16 49.7 0.56 3.60
Year 46.40 66.4 39.77 6.67
Warm Season
(Apr-Oct)35.57 xxxx
36.74 -1.17
Penman PET: 2100 mm/year 83 In./year
PET X 0.7= 58 In./year PET
0102030405060708090
100
PR
EC
IPIT
AT
ION
MONTH
Monthly Precipitation and Thornthwaite PET
Precip PET in
Monthly Precipitation and Thornthwaite PET
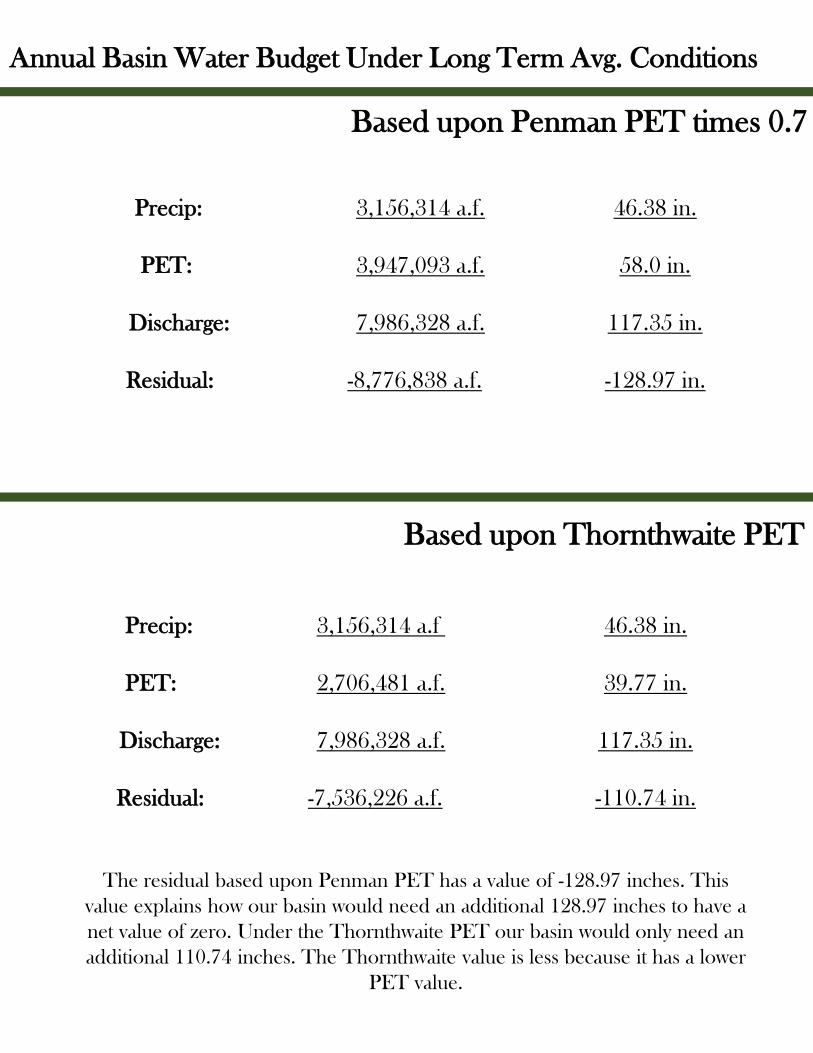
Annual Basin Water Budget Under Long Term Avg. Conditions
Based upon Penman PET times 0.7
Based upon Thornthwaite PET
Precip: 3,156,314 a.f. 46.38 in.
PET: 3,947,093 a.f. 58.0 in.
Discharge: 7,986,328 a.f. 117.35 in.
Residual: -8,776,838 a.f. -128.97 in.
Precip: 3,156,314 a.f 46.38 in.
PET: 2,706,481 a.f. 39.77 in.
Discharge: 7,986,328 a.f. 117.35 in.
Residual: -7,536,226 a.f. -110.74 in.
The residual based upon Penman PET has a value of -128.97 inches. This
value explains how our basin would need an additional 128.97 inches to have a
net value of zero. Under the Thornthwaite PET our basin would only need an
additional 110.74 inches. The Thornthwaite value is less because it has a lower
PET value.