andy yung, p.e., cfm duane barrett, p.e., engineering, … rainfall the storm event of october 1994...
TRANSCRIPT
1
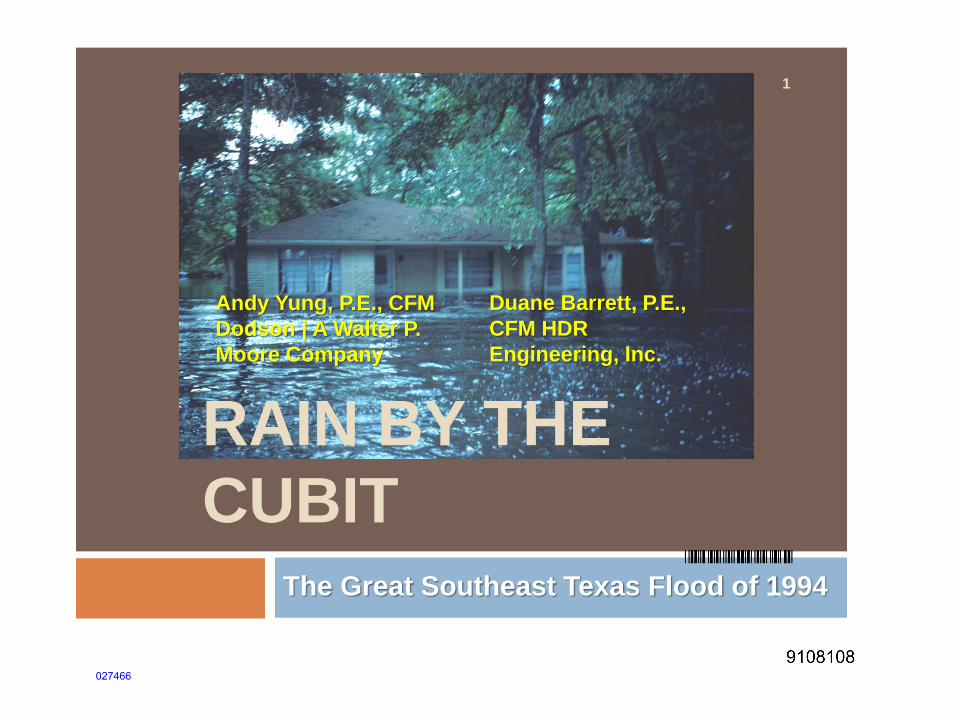
RAIN BY THE
CUBIT The Great Southeast Texas Flood of 1994
Andy Yung, P.E., CFM
Dodson | A Walter P.
Moore Company
Duane Barrett, P.E.,
CFM HDR
Engineering, Inc.
027466

Llanite is found only in the vicinity of Llano, Texas. Although Llanite is an igneous rock, co-author Duane Barrett will always associate it with water!
LLanite 2
027467

General Timeline
October 15, 1994 (Saturday)
Pacific Hurricane Rosa Meets a Gulf Coast Warm Front Over Texas
Rainfall Begins
October 16, 1994 (Sunday)
Rainfall Abates in the Early Morning
Begins to Rebuild and Intensify in the Evening
October 17, 1994 (Monday)
Large Cell Develops Southwest of Waller, Texas - Early Morning
Flooding Overtops U.S. Highway 290 near Waller
HCFCD Mobilizes Flood ALERT Activities
October 18, 1994 (Tuesday)
Jet Stream Southward & Heavy Rainfall Comes to Harris County
Most Bayous and Creeks in Harris County Report Major Flooding
October 19, 1994 (Wednesday)
Aerial Reconnaissance Conducted Across Harris County
The Sun Appears!
3
1
2
3
027468
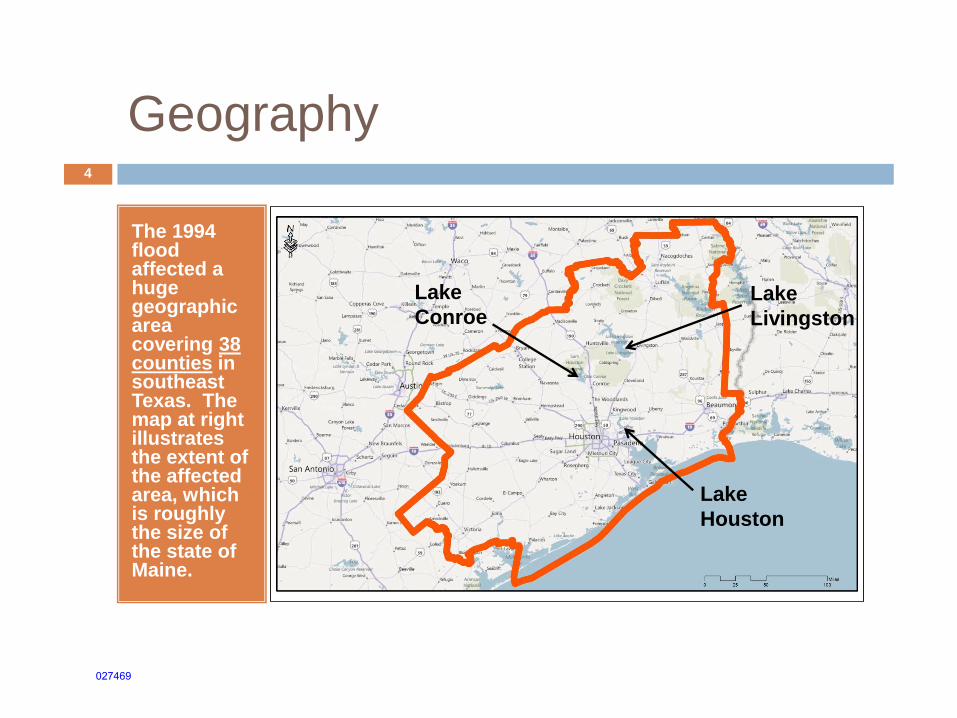
Geography
The 1994 flood affected a huge geographic area covering 38 counties in southeast Texas. The map at right illustrates the extent of the affected area, which is roughly the size of the state of Maine.
Lake
Conroe
Lake
Houston
Lake
Livingston
4
027469
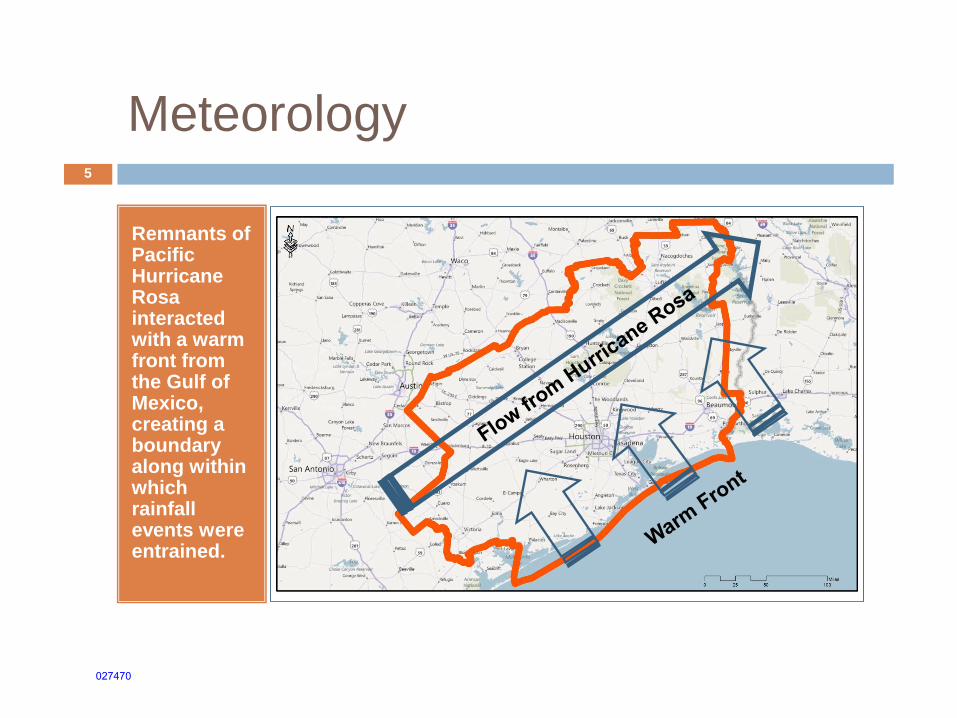
Meteorology
Remnants of Pacific Hurricane Rosa interacted with a warm front from the Gulf of Mexico, creating a boundary along within which rainfall events were entrained.
5
027470
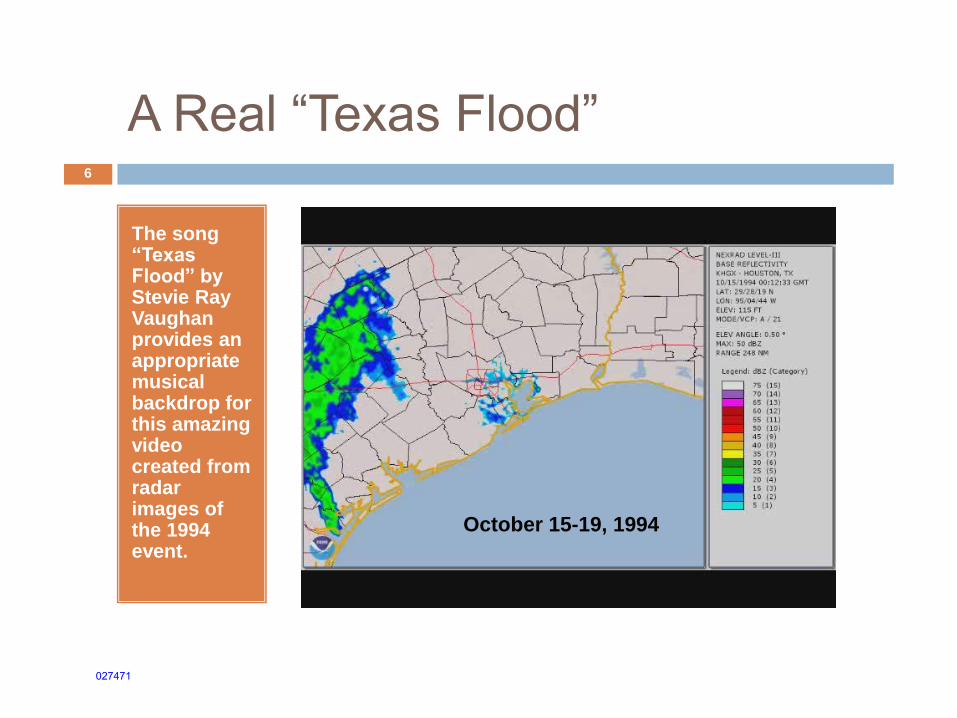
A Real “Texas Flood”
The song “Texas Flood” by Stevie Ray Vaughan provides an appropriate musical backdrop for this amazing video created from radar images of the 1994 event.
6
October 15-19, 1994
027471
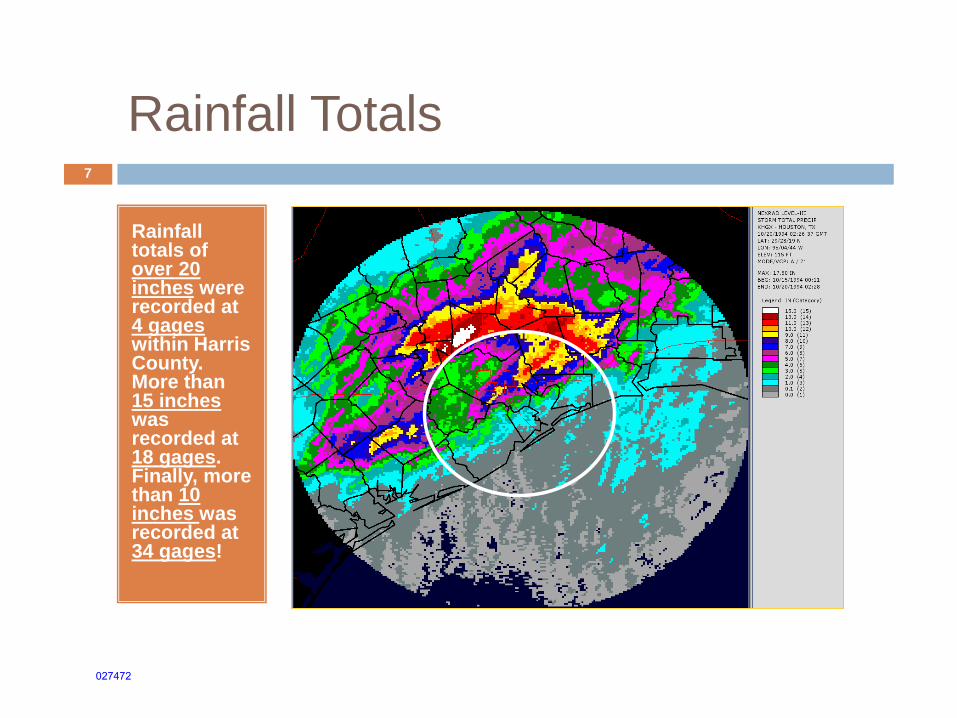
Rainfall Totals
Rainfall totals of over 20 inches were recorded at 4 gages within Harris County. More than 15 inches was recorded at 18 gages. Finally, more than 10 inches was recorded at 34 gages!
7
027472
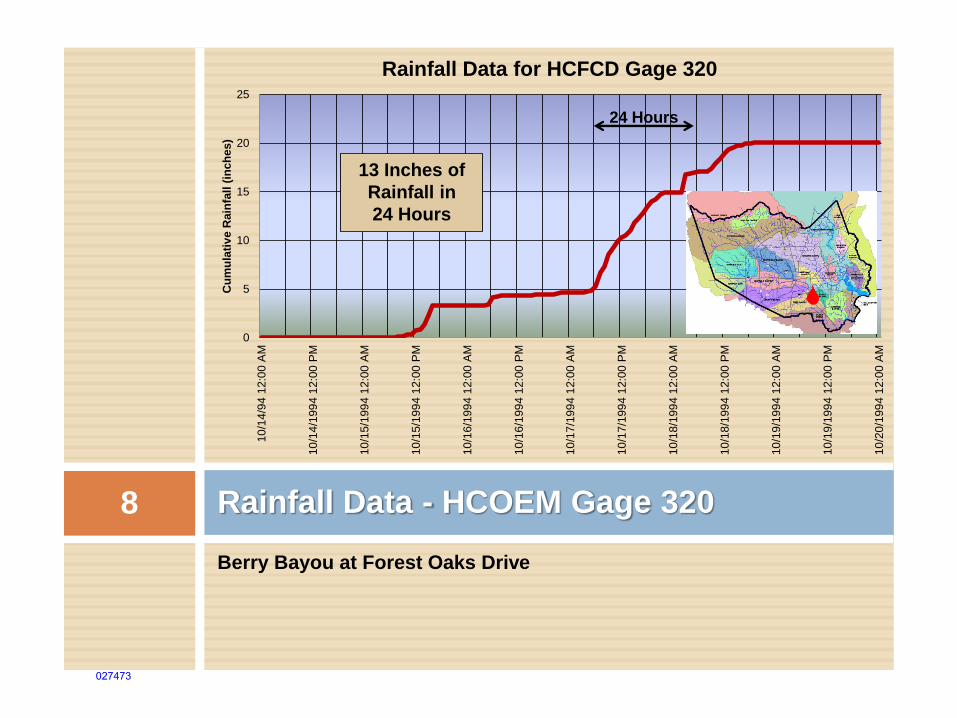
Berry Bayou at Forest Oaks Drive
Rainfall Data - HCOEM Gage 320
0
5
10
15
20
25
10
/14
/94 1
2:0
0 A
M
10
/14
/199
4 1
2:0
0 P
M
10
/15
/199
4 1
2:0
0 A
M
10
/15
/199
4 1
2:0
0 P
M
10
/16
/199
4 1
2:0
0 A
M
10
/16
/199
4 1
2:0
0 P
M
10
/17
/199
4 1
2:0
0 A
M
10
/17
/199
4 1
2:0
0 P
M
10
/18
/199
4 1
2:0
0 A
M
10
/18
/199
4 1
2:0
0 P
M
10
/19
/199
4 1
2:0
0 A
M
10
/19
/199
4 1
2:0
0 P
M
10
/20
/199
4 1
2:0
0 A
M
Cu
mu
lati
ve R
ain
fall (
inch
es)
Rainfall Data for HCFCD Gage 320
24 Hours
13 Inches of
Rainfall in
24 Hours
8
027473
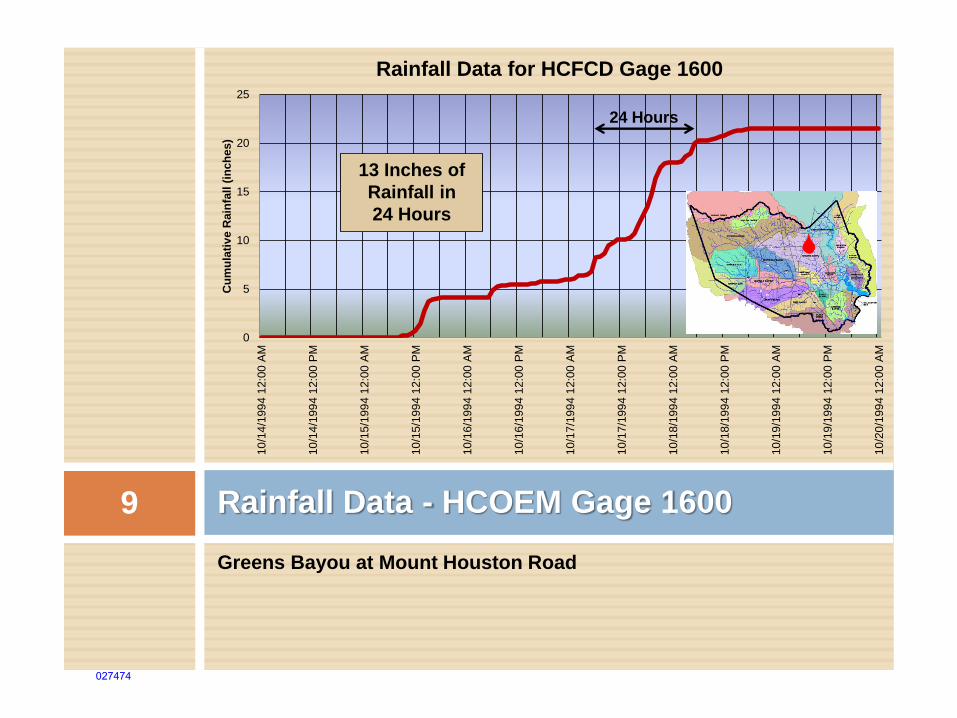
Greens Bayou at Mount Houston Road
Rainfall Data - HCOEM Gage 1600
0
5
10
15
20
25
10
/14
/199
4 1
2:0
0 A
M
10
/14
/199
4 1
2:0
0 P
M
10
/15
/199
4 1
2:0
0 A
M
10
/15
/199
4 1
2:0
0 P
M
10
/16
/199
4 1
2:0
0 A
M
10
/16
/199
4 1
2:0
0 P
M
10
/17
/199
4 1
2:0
0 A
M
10
/17
/199
4 1
2:0
0 P
M
10
/18
/199
4 1
2:0
0 A
M
10
/18
/199
4 1
2:0
0 P
M
10
/19
/199
4 1
2:0
0 A
M
10
/19
/199
4 1
2:0
0 P
M
10
/20
/199
4 1
2:0
0 A
M
Cu
mu
lati
ve R
ain
fall (
inch
es)
Rainfall Data for HCFCD Gage 1600
13 Inches of
Rainfall in
24 Hours
24 Hours
9
027474
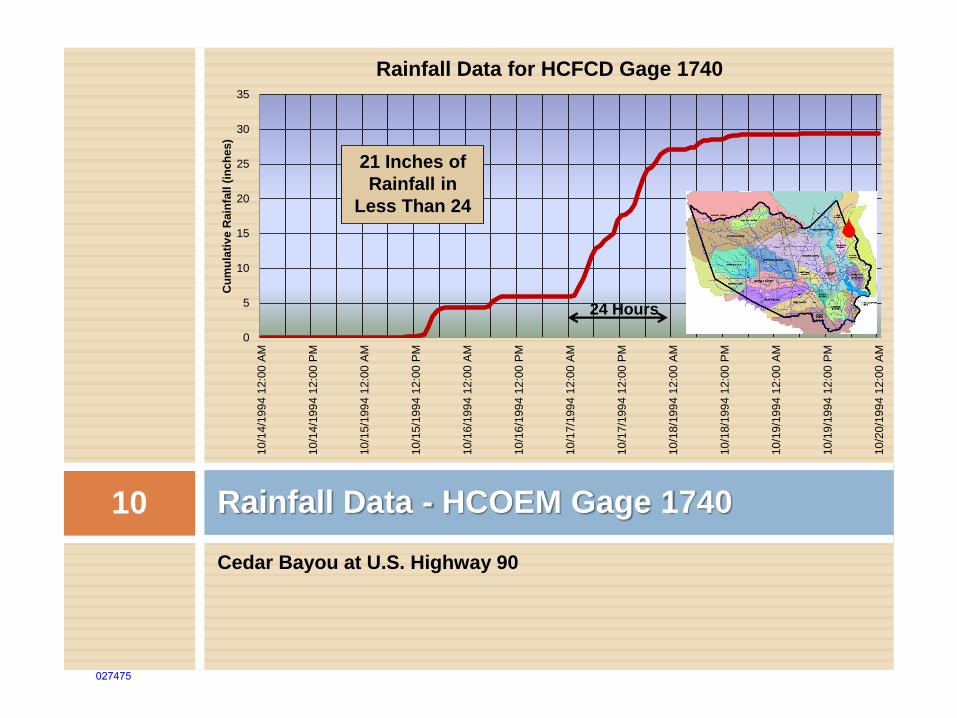
Cedar Bayou at U.S. Highway 90
Rainfall Data - HCOEM Gage 1740
0
5
10
15
20
25
30
35
10
/14
/199
4 1
2:0
0 A
M
10
/14
/199
4 1
2:0
0 P
M
10
/15
/199
4 1
2:0
0 A
M
10
/15
/199
4 1
2:0
0 P
M
10
/16
/199
4 1
2:0
0 A
M
10
/16
/199
4 1
2:0
0 P
M
10
/17
/199
4 1
2:0
0 A
M
10
/17
/199
4 1
2:0
0 P
M
10
/18
/199
4 1
2:0
0 A
M
10
/18
/199
4 1
2:0
0 P
M
10
/19
/199
4 1
2:0
0 A
M
10
/19
/199
4 1
2:0
0 P
M
10
/20
/199
4 1
2:0
0 A
M
Cu
mu
lati
ve R
ain
fall (
inch
es)
Rainfall Data for HCFCD Gage 1740
21 Inches of
Rainfall in
Less Than 24
24 Hours
10
027475
Watershed-Wide Rainfall
The storm event of October 1994 produced staggering rainfall amounts, especially considering the size of the area affected.
Source: Steve Johnson, P.E.
The average rainfall depth over the 2,880-square mile San Jacinto River watershed was 19.5 inches.
The 1% annual chance rainfall 4-day rainfall is 14.9 inches.
A total of 1.9 million acre-feet of runoff passed through Lake Houston.
The average runoff over the watershed was 12.7 inches.
11
027476
Area-Wide Rainfall 12
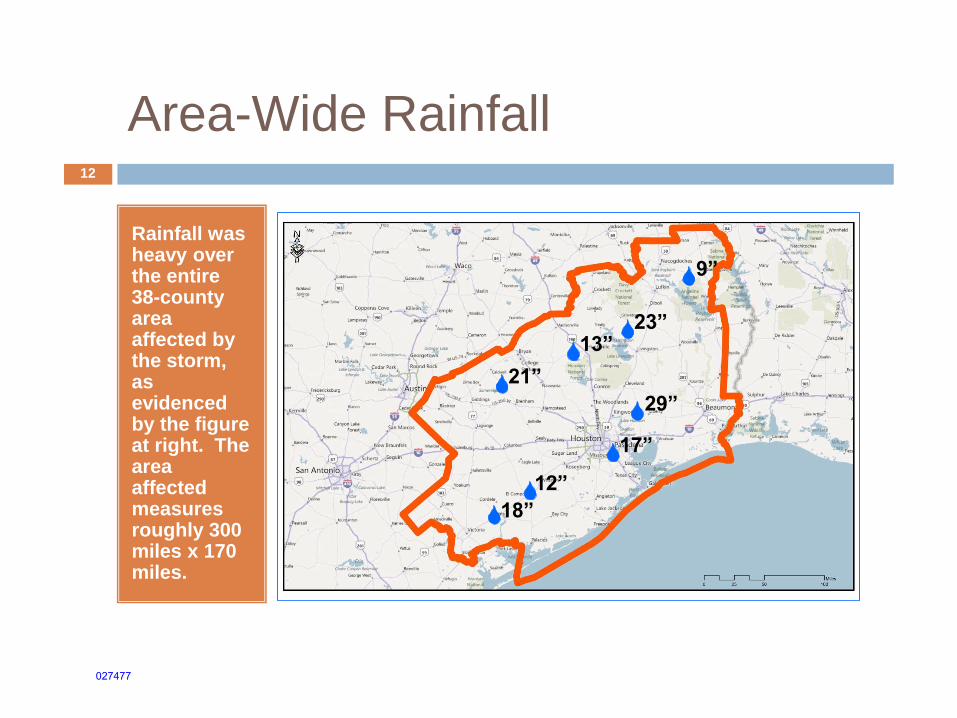
Rainfall was heavy over the entire 38-county area affected by the storm, as evidenced by the figure at right. The area affected measures roughly 300 miles x 170 miles.
18”
12”
21”
13” 23”
9”
29”
17”
027477
Reservoirs React
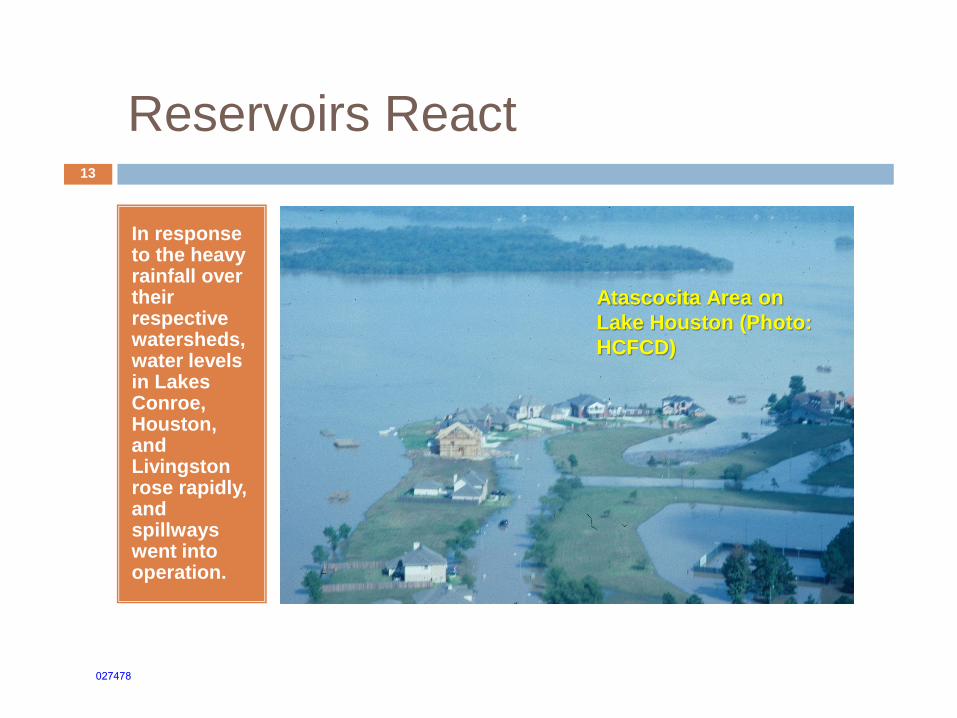
In response to the heavy rainfall over their respective watersheds, water levels in Lakes Conroe, Houston, and Livingston rose rapidly, and spillways went into operation.
Atascocita Area on
Lake Houston (Photo:
HCFCD)
13
027478
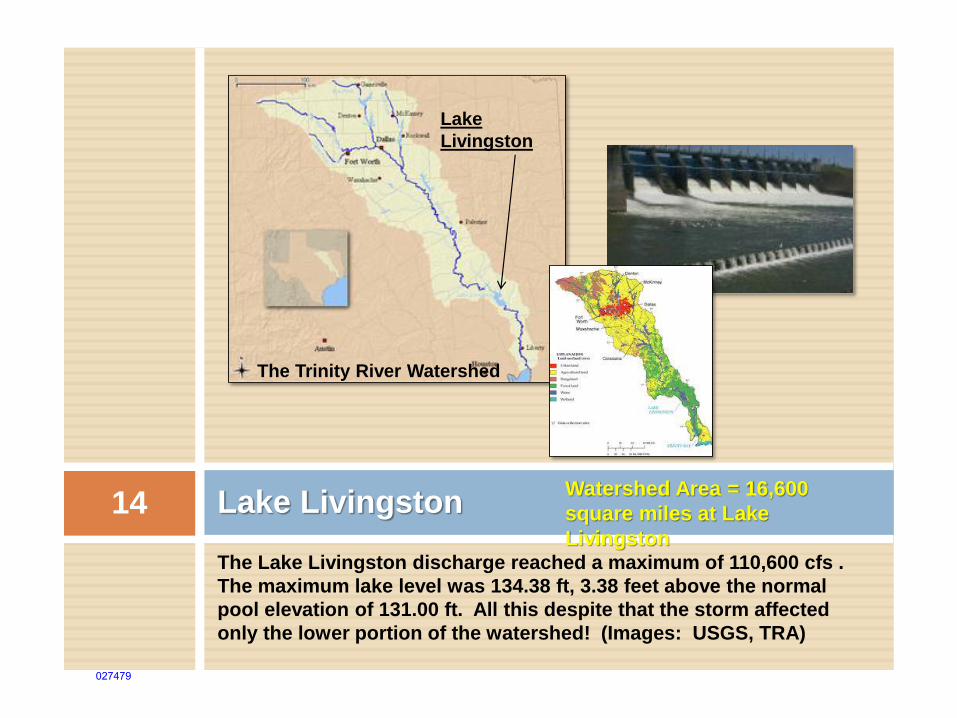
The Lake Livingston discharge reached a maximum of 110,600 cfs .
The maximum lake level was 134.38 ft, 3.38 feet above the normal
pool elevation of 131.00 ft. All this despite that the storm affected
only the lower portion of the watershed! (Images: USGS, TRA)
Lake Livingston Watershed Area = 16,600
square miles at Lake
Livingston
The Trinity River Watershed
Lake
Livingston
14
027479
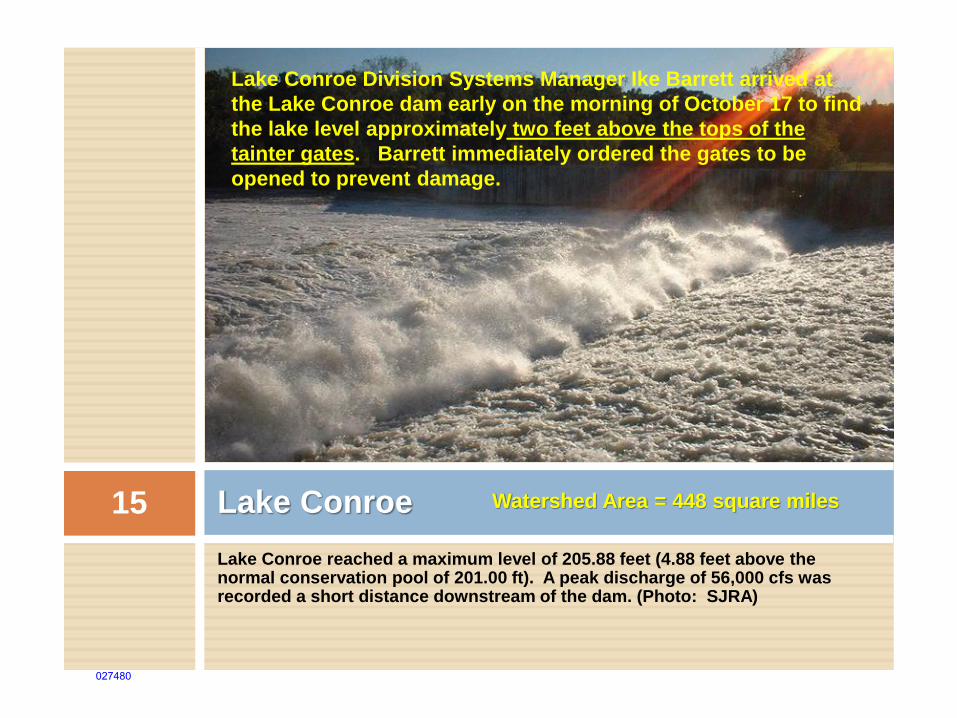
Lake Conroe reached a maximum level of 205.88 feet (4.88 feet above the normal conservation pool of 201.00 ft). A peak discharge of 56,000 cfs was recorded a short distance downstream of the dam. (Photo: SJRA)
Lake Conroe Watershed Area = 448 square miles
Lake Conroe Division Systems Manager Ike Barrett arrived at
the Lake Conroe dam early on the morning of October 17 to find
the lake level approximately two feet above the tops of the
tainter gates. Barrett immediately ordered the gates to be
opened to prevent damage.
15
027480
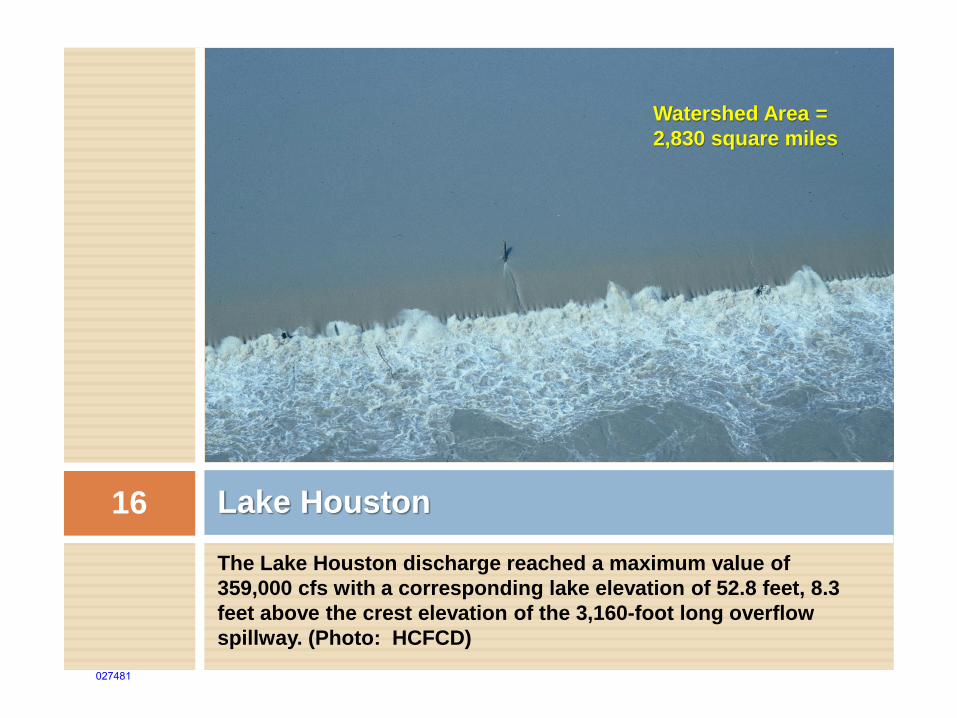
The Lake Houston discharge reached a maximum value of
359,000 cfs with a corresponding lake elevation of 52.8 feet, 8.3
feet above the crest elevation of the 3,160-foot long overflow
spillway. (Photo: HCFCD)
Lake Houston
Watershed Area =
2,830 square miles
16
027481
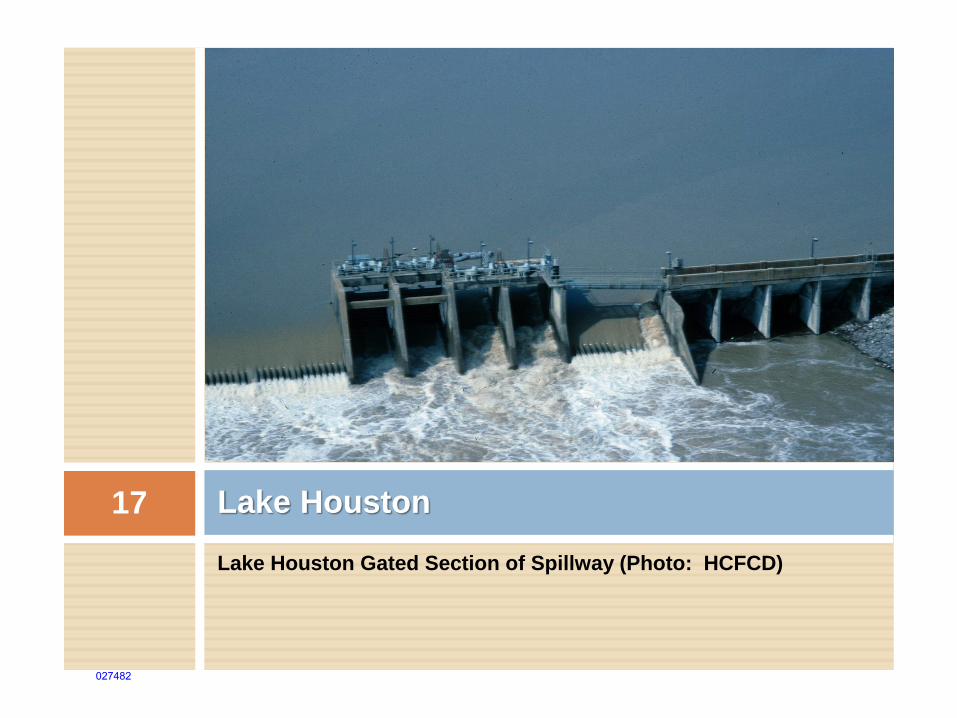
Lake Houston Gated Section of Spillway (Photo: HCFCD)
Lake Houston 17
027482
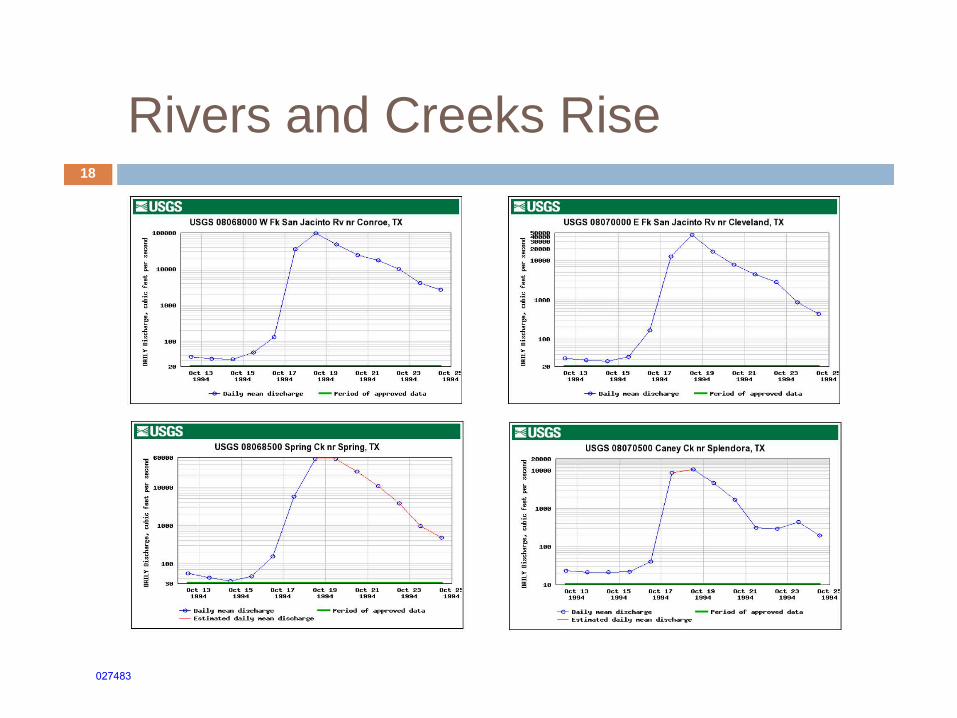
Rivers and Creeks Rise 18 -
i:iiUSGS
l l 1.0000 ... " ~ .. ...
"B 1000
100
i:iiUSGS
USGS 08068000 W Fk San Jacinto Rv nr Conroe, TX
Oct 13 1994
Oct :1.5 1994
Oct 17 1994
--e-- Dail.y n ean discharge
Oct :1.9 1994
Oct 21. 1994
Oct 23 1994
- Period of approved data
USGS 08068500 Spring Ck nr Spring, TX
Oct 2! 1994
l 60000 r-----------------------------~==~r------------------------.
c.. 8. 10000
... ~ " .... .g " " .. ~ ~
1.000
c: :100 ,_
~ Oct 13
1.994 Oct 1:5
1994 Oct 17
1994 Oct 19
1994 Oct 21
1994 Oct 23
1.994
--e-- Dail~_:~ nean d ischarge - Period of approved data - Estinated dail.y t'lean discharge
Oct 2! 1.994
i:iiUSGS USGS 08070000 E Fk San Jacinto Rv nr Cleveland, TX
~RRBB .---------------,-------------, -g 30000
i 2 0000
t 10000
1 000
100
Oct 13 1994
Oct :1.5 1994
Oct 17 1994
--e-- Dail.y t'lean discharge
Oct 19 1994
Oct 21. 1994
Oct 23 1994
- Period of approved data
i:iiUSGS
1 20000
~ 10000
t t ~ 1000 .. . .. "B ~
] ~
~
100
USGS 08070500 Caney Ck nr Splendora, TX
Oct 1.3 1994
Oct 1.5 1994
Oct 17 1994
Oct :19 1.994
Oct 21 1994
Oct 23 1994
--e-- Dai ly nean disc harge - Period of approved da ta - Es tina ted dai.ly ~tean dis c h a rge
Oct 2! 1994
Oct 2! 1994
027483
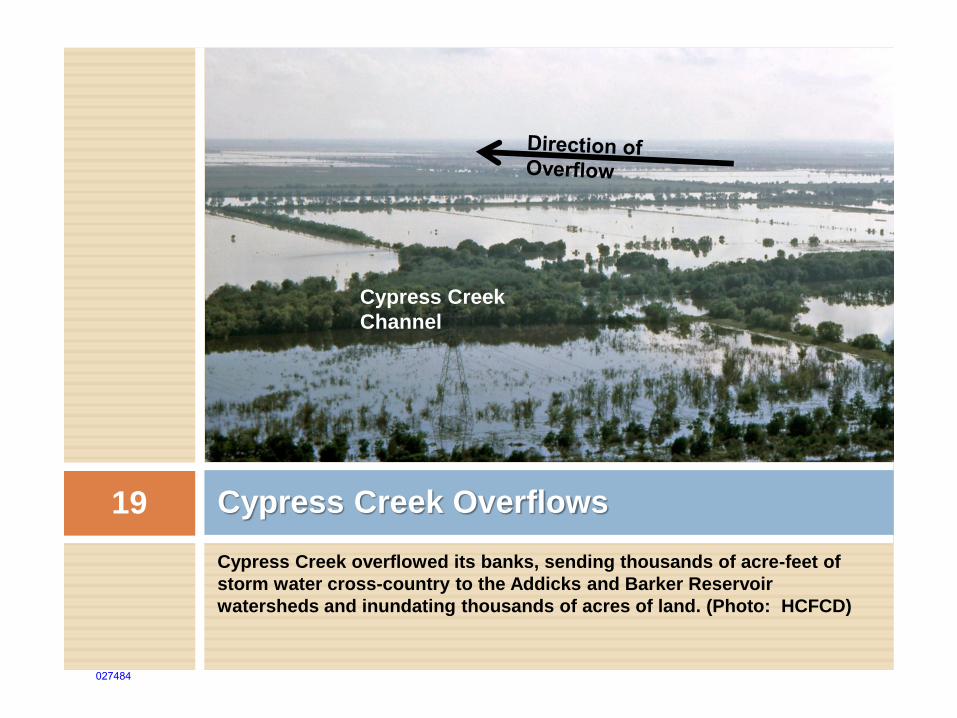
Cypress Creek overflowed its banks, sending thousands of acre-feet of
storm water cross-country to the Addicks and Barker Reservoir
watersheds and inundating thousands of acres of land. (Photo: HCFCD)
Cypress Creek Overflows
Cypress Creek
Channel
19
027484
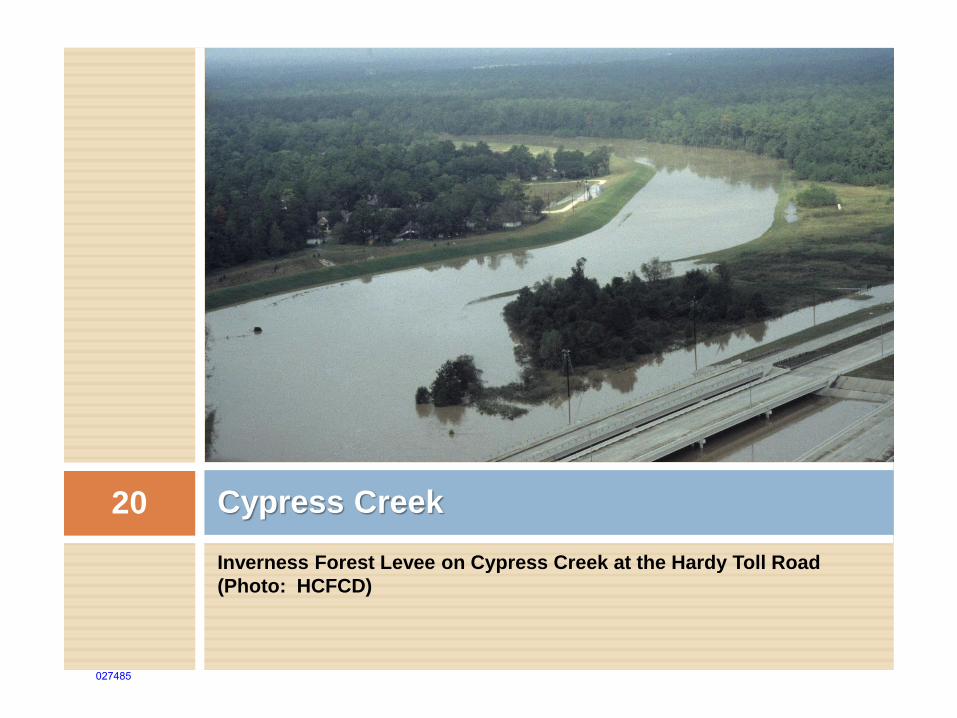
Inverness Forest Levee on Cypress Creek at the Hardy Toll Road
(Photo: HCFCD)
Cypress Creek 20
027485
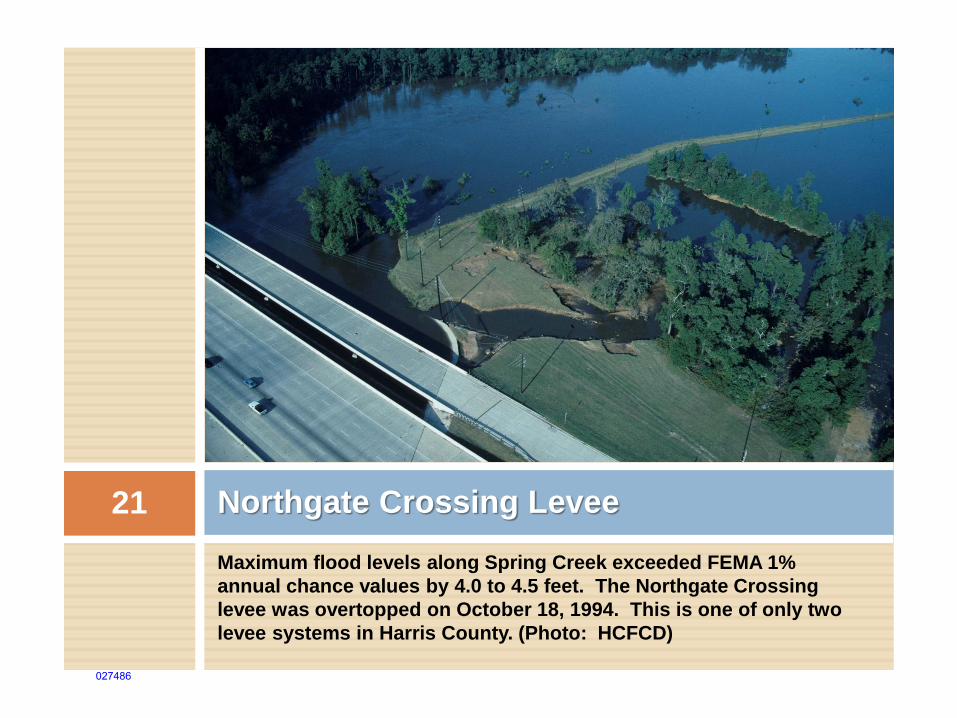
Maximum flood levels along Spring Creek exceeded FEMA 1%
annual chance values by 4.0 to 4.5 feet. The Northgate Crossing
levee was overtopped on October 18, 1994. This is one of only two
levee systems in Harris County. (Photo: HCFCD)
Northgate Crossing Levee 21
027486
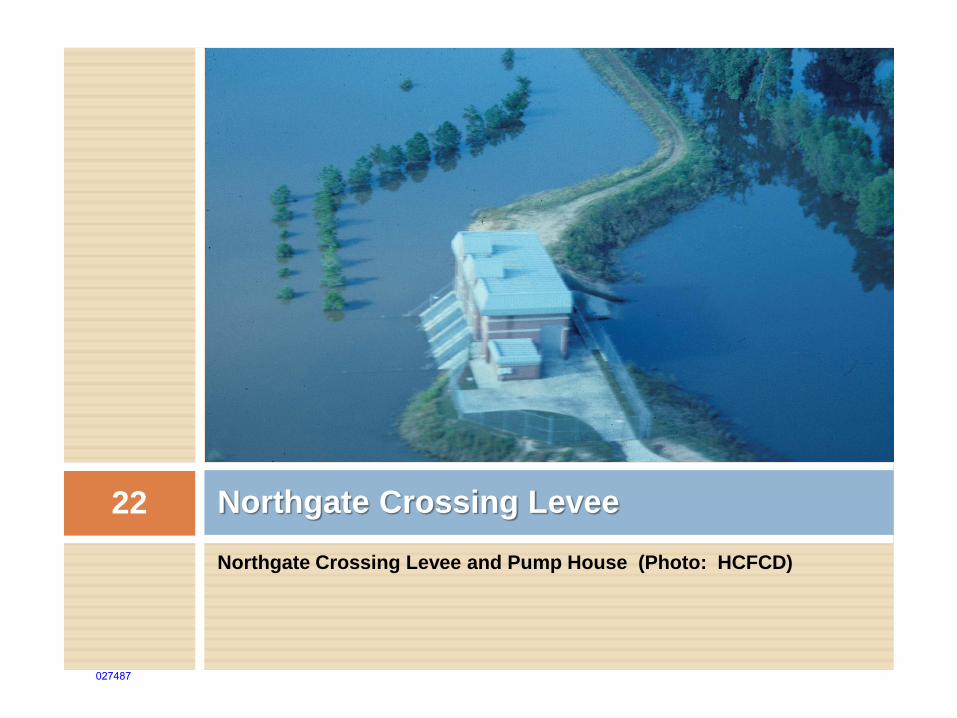
Northgate Crossing Levee and Pump House (Photo: HCFCD)
Northgate Crossing Levee 22
027487
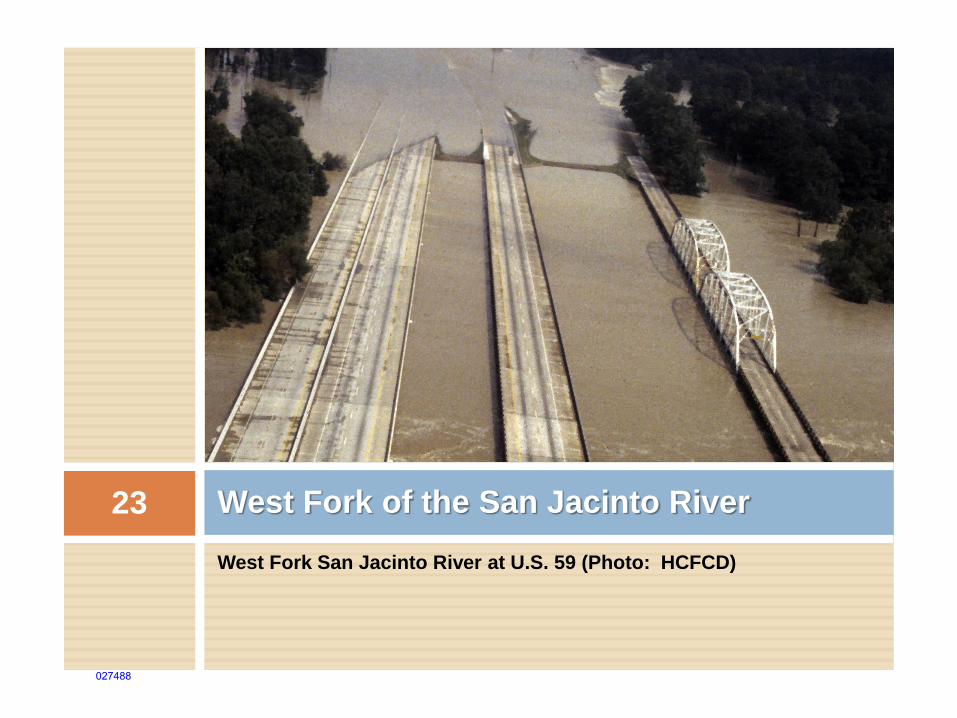
West Fork San Jacinto River at U.S. 59 (Photo: HCFCD)
West Fork of the San Jacinto River 23
027488
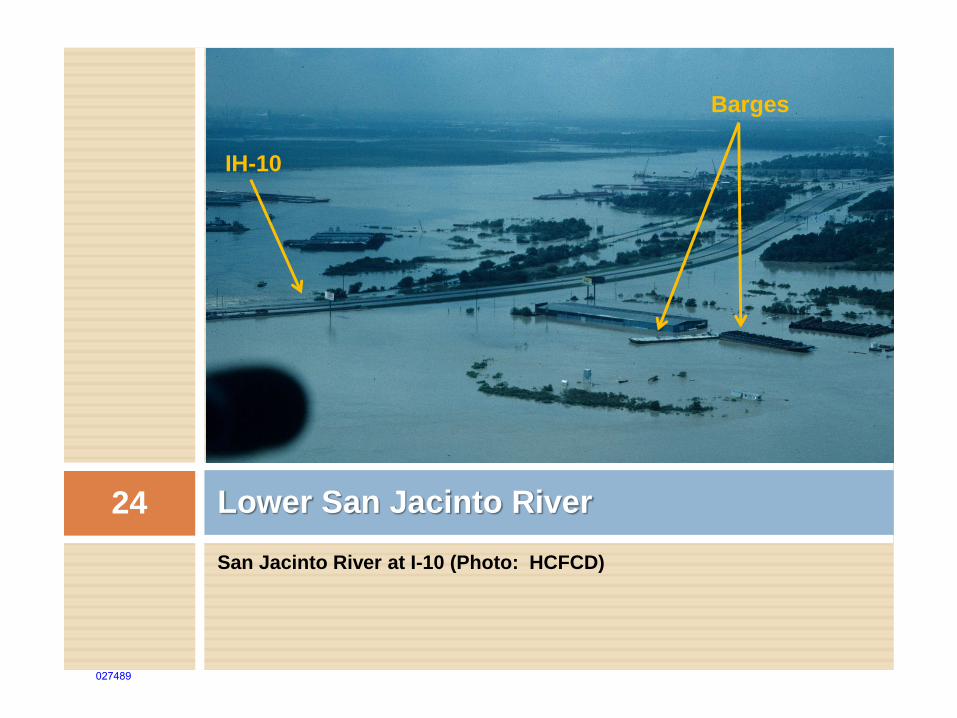
San Jacinto River at I-10 (Photo: HCFCD)
Lower San Jacinto River 24
IH-10
Barges
027489
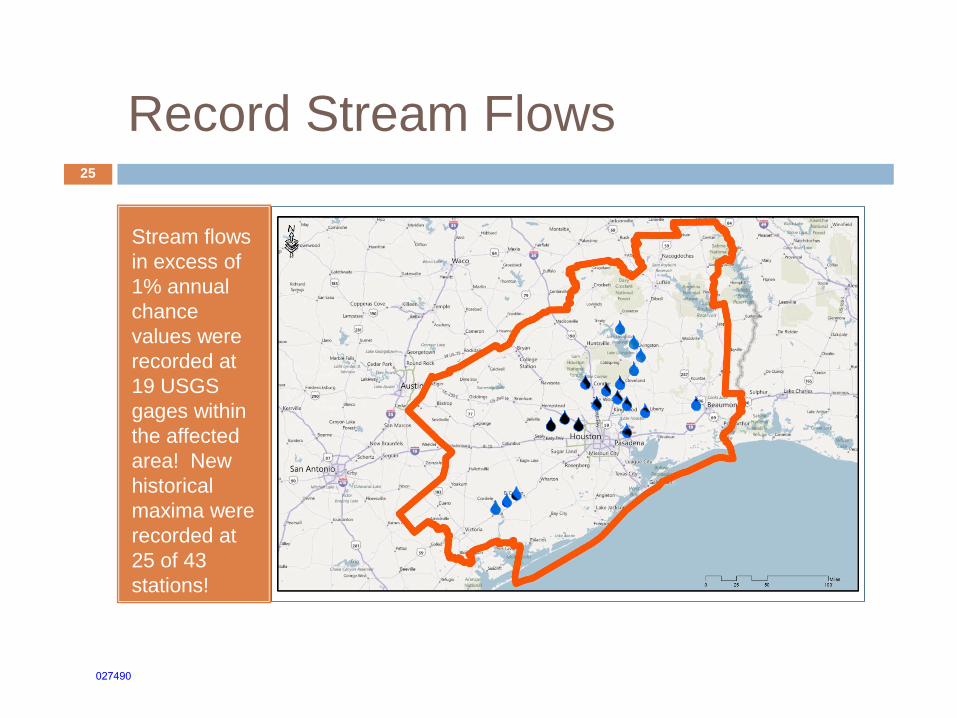
Record Stream Flows
Stream flows
in excess of
1% annual
chance
values were
recorded at
19 USGS
gages within
the affected
area! New
historical
maxima were
recorded at
25 of 43
stations!
25
027490
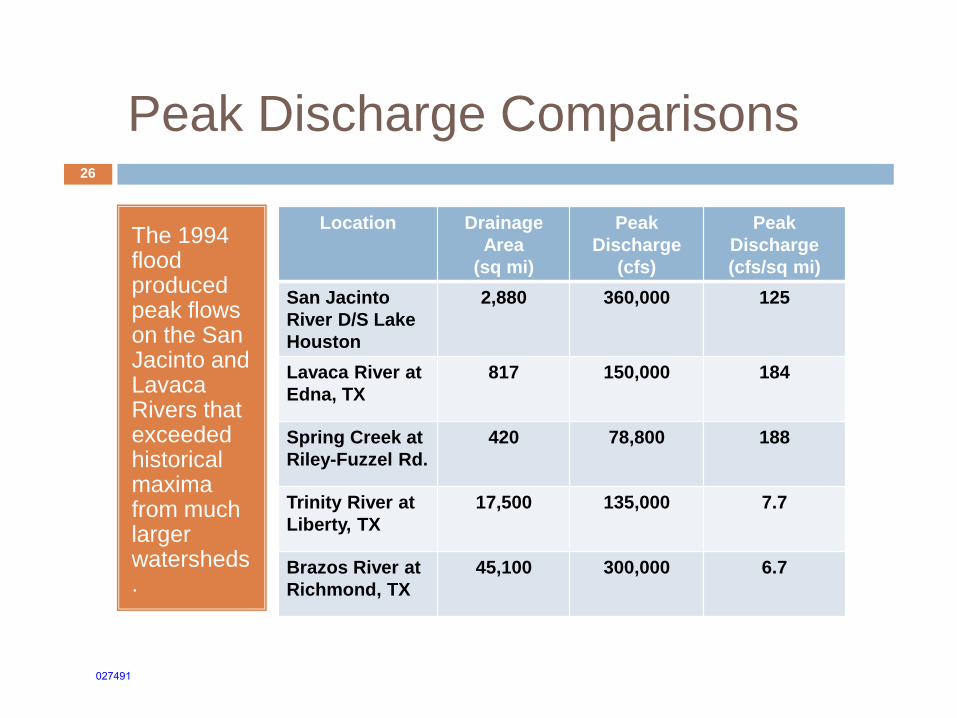
Peak Discharge Comparisons
The 1994 flood produced peak flows on the San Jacinto and Lavaca Rivers that exceeded historical maxima from much larger watersheds.
Location Drainage
Area
(sq mi)
Peak
Discharge
(cfs)
Peak
Discharge
(cfs/sq mi)
San Jacinto
River D/S Lake
Houston
2,880 360,000 125
Lavaca River at
Edna, TX
817 150,000 184
Spring Creek at
Riley-Fuzzel Rd.
420 78,800 188
Trinity River at
Liberty, TX
17,500 135,000 7.7
Brazos River at
Richmond, TX
45,100 300,000 6.7
26
027491
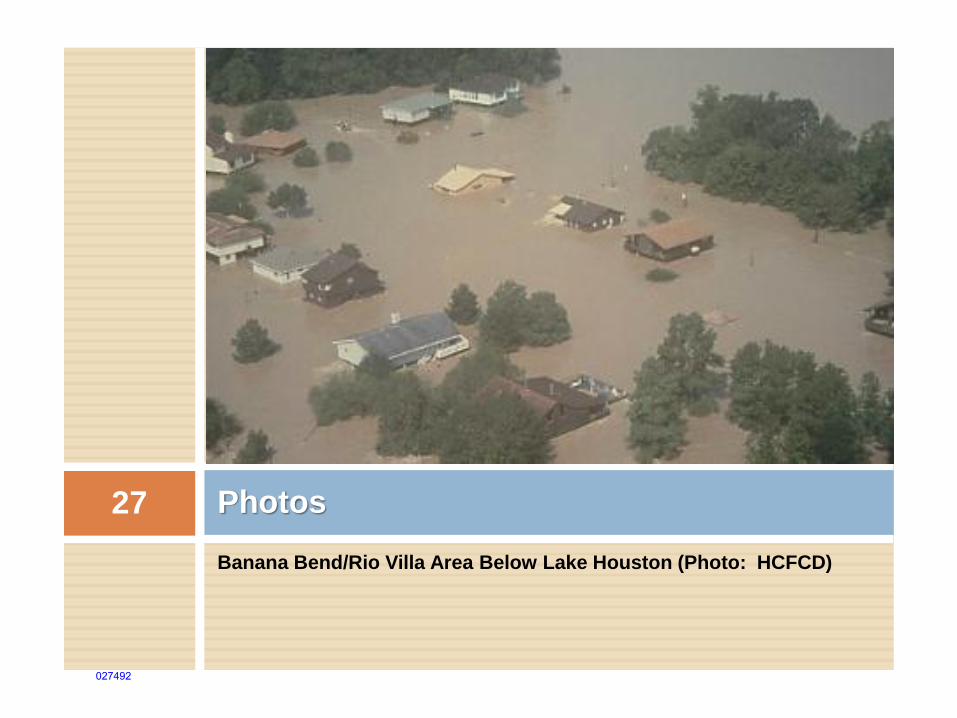
Banana Bend/Rio Villa Area Below Lake Houston (Photo: HCFCD)
Photos 27
027492
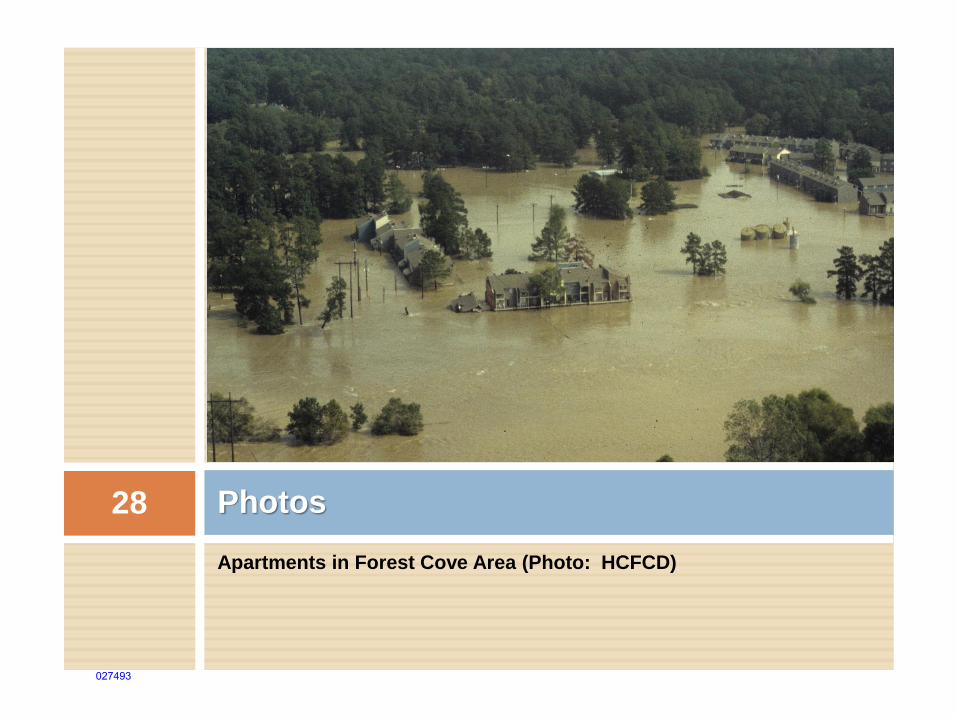
Apartments in Forest Cove Area (Photo: HCFCD)
Photos 28
027493
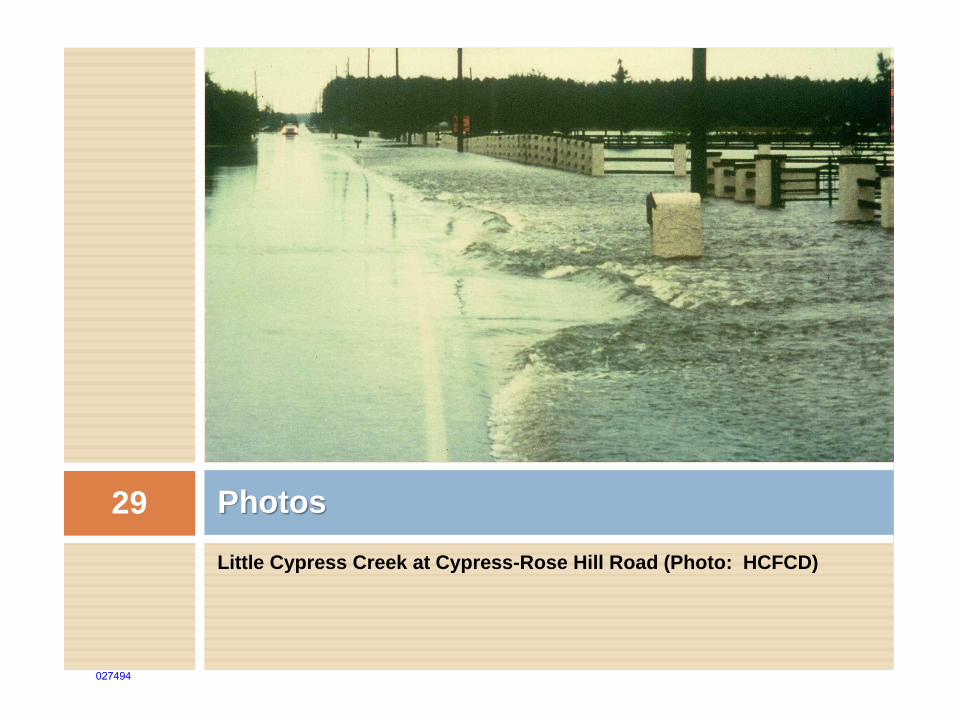
Little Cypress Creek at Cypress-Rose Hill Road (Photo: HCFCD)
Photos 29
027494
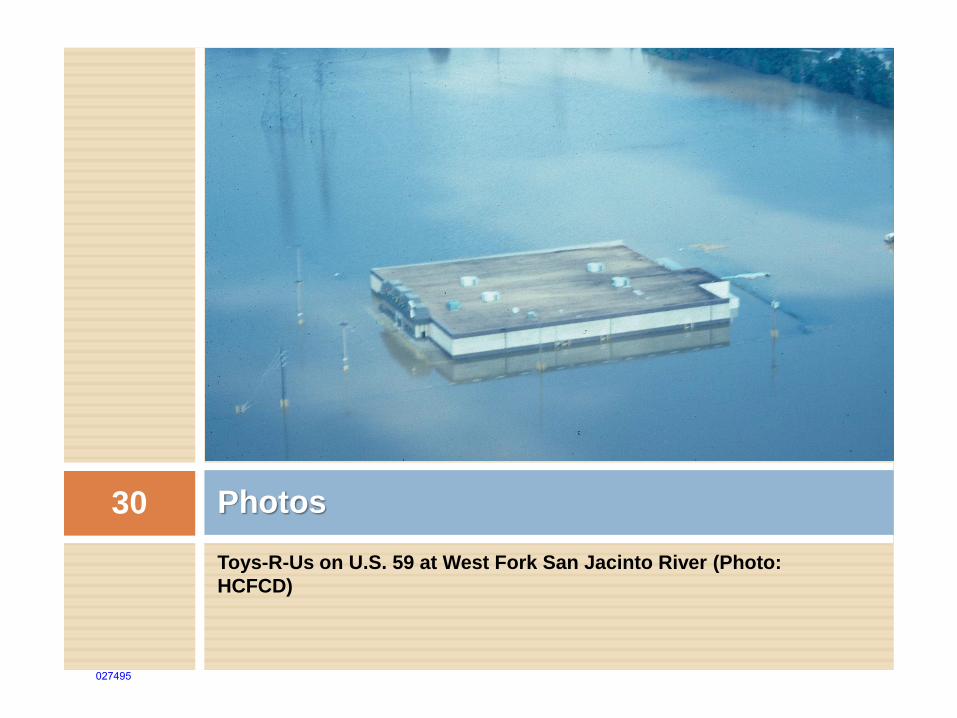
Toys-R-Us on U.S. 59 at West Fork San Jacinto River (Photo:
HCFCD)
Photos 30
027495
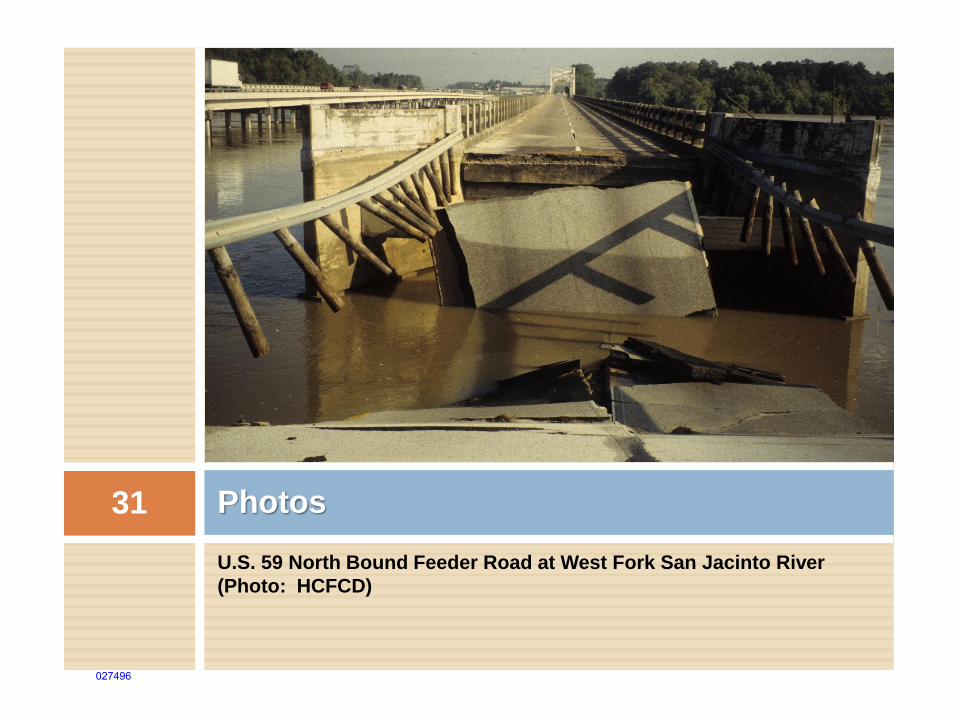
U.S. 59 North Bound Feeder Road at West Fork San Jacinto River
(Photo: HCFCD)
Photos 31
027496
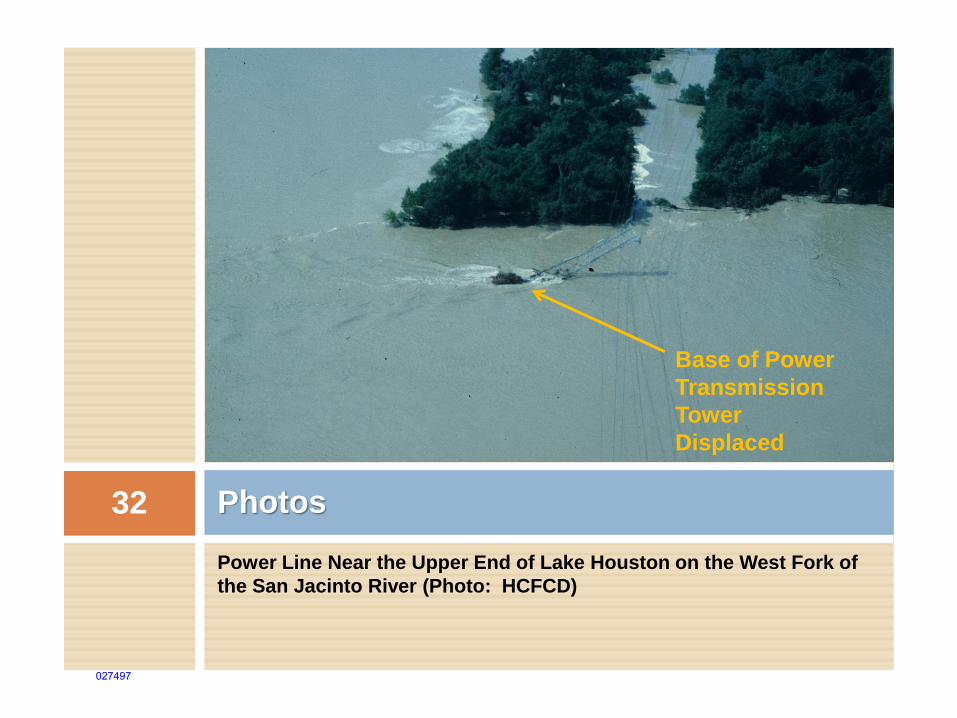
Power Line Near the Upper End of Lake Houston on the West Fork of
the San Jacinto River (Photo: HCFCD)
Photos 32
Base of Power
Transmission
Tower
Displaced
027497
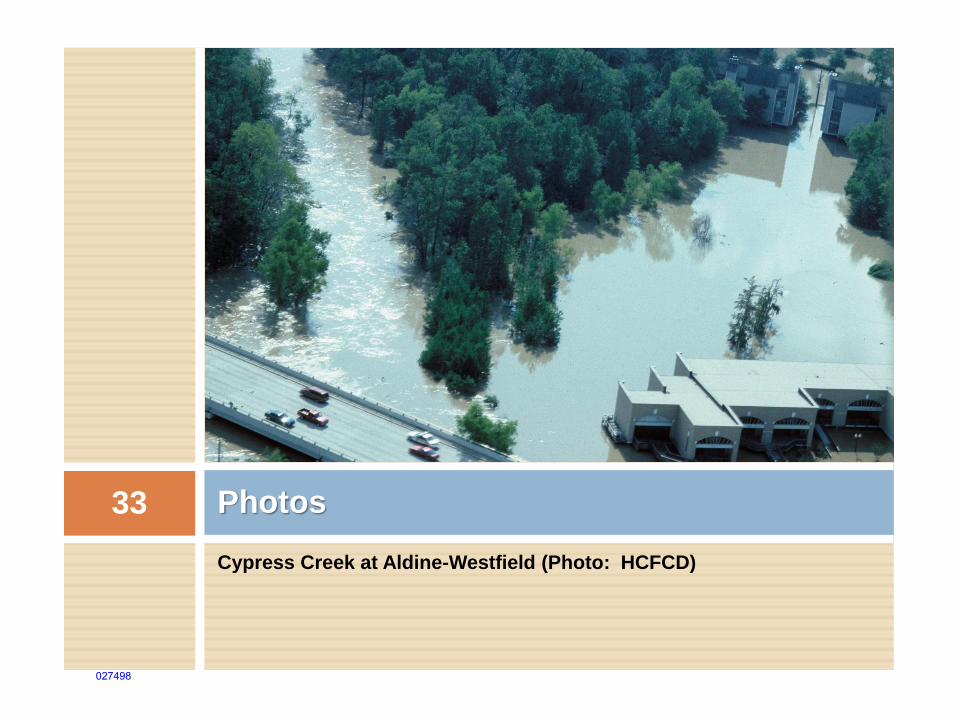
Cypress Creek at Aldine-Westfield (Photo: HCFCD)
Photos 33
027498
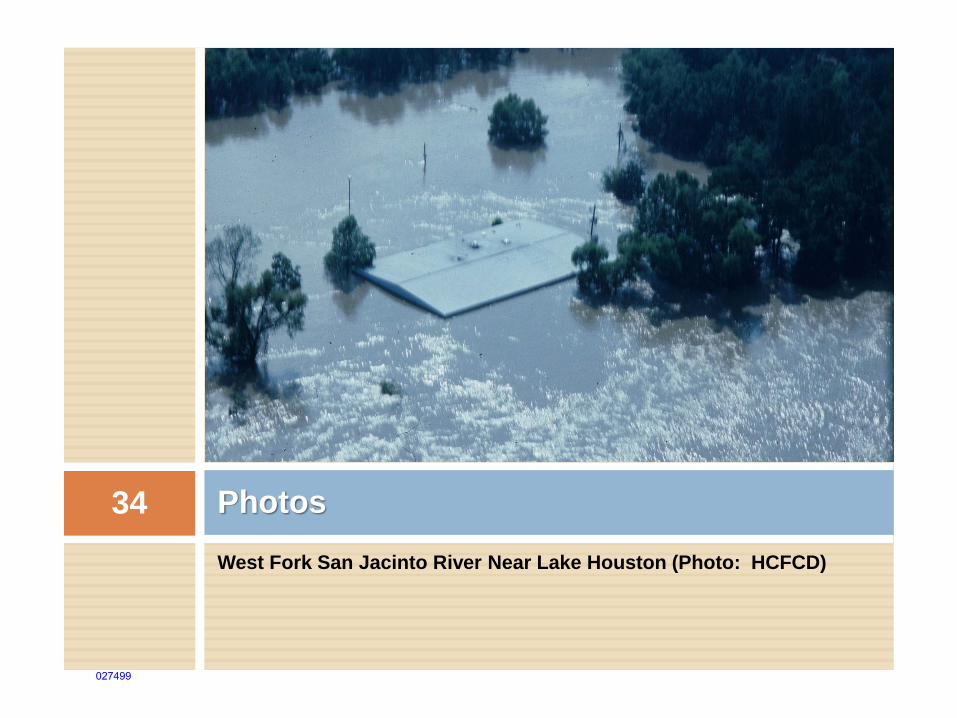
West Fork San Jacinto River Near Lake Houston (Photo: HCFCD)
Photos 34
027499
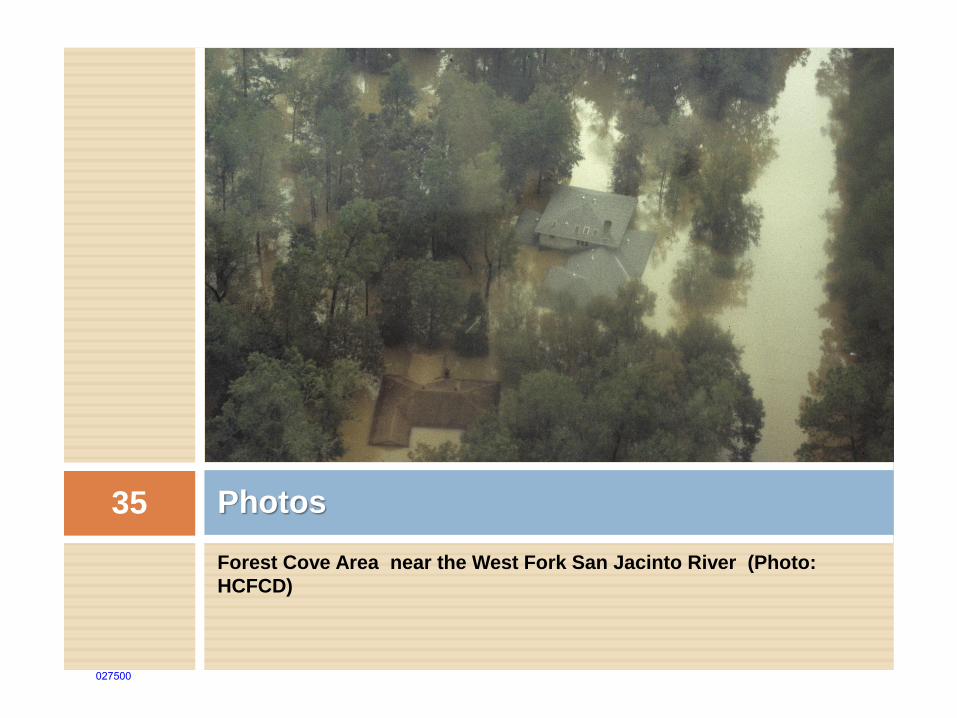
Forest Cove Area near the West Fork San Jacinto River (Photo:
HCFCD)
Photos 35
027500
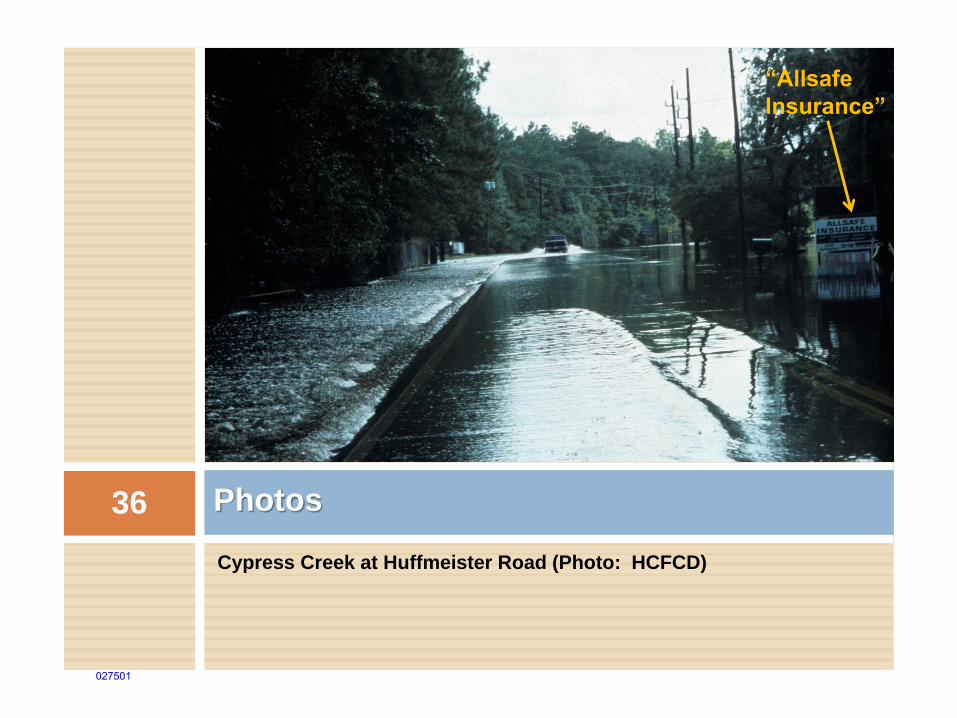
Cypress Creek at Huffmeister Road (Photo: HCFCD)
Photos 36
“Allsafe
Insurance”
027501
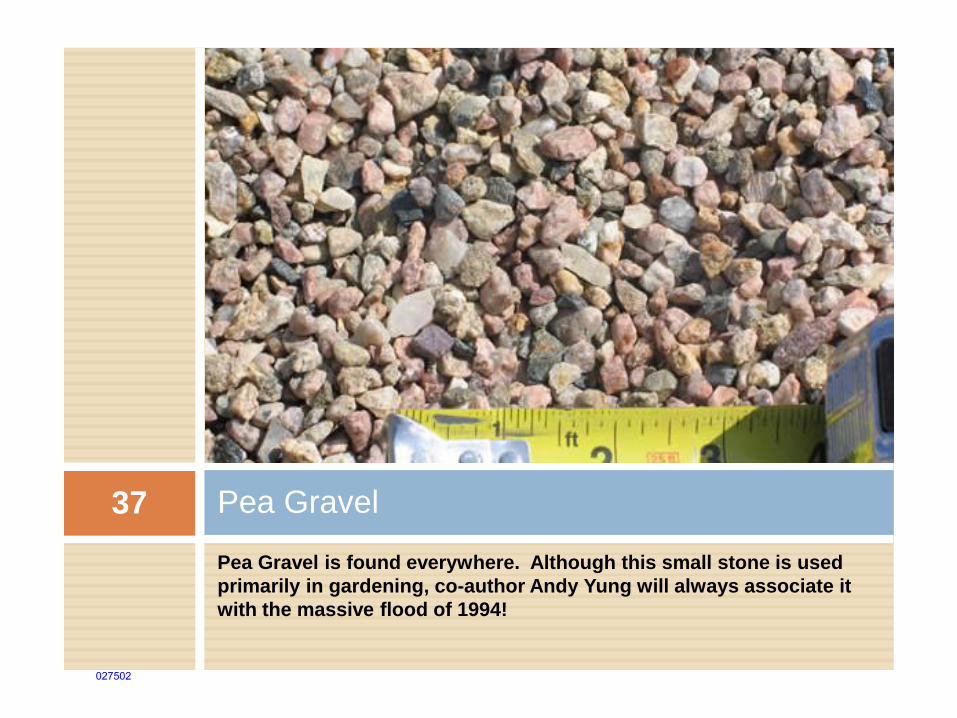
Pea Gravel is found everywhere. Although this small stone is used
primarily in gardening, co-author Andy Yung will always associate it
with the massive flood of 1994!
Pea Gravel 37
027502
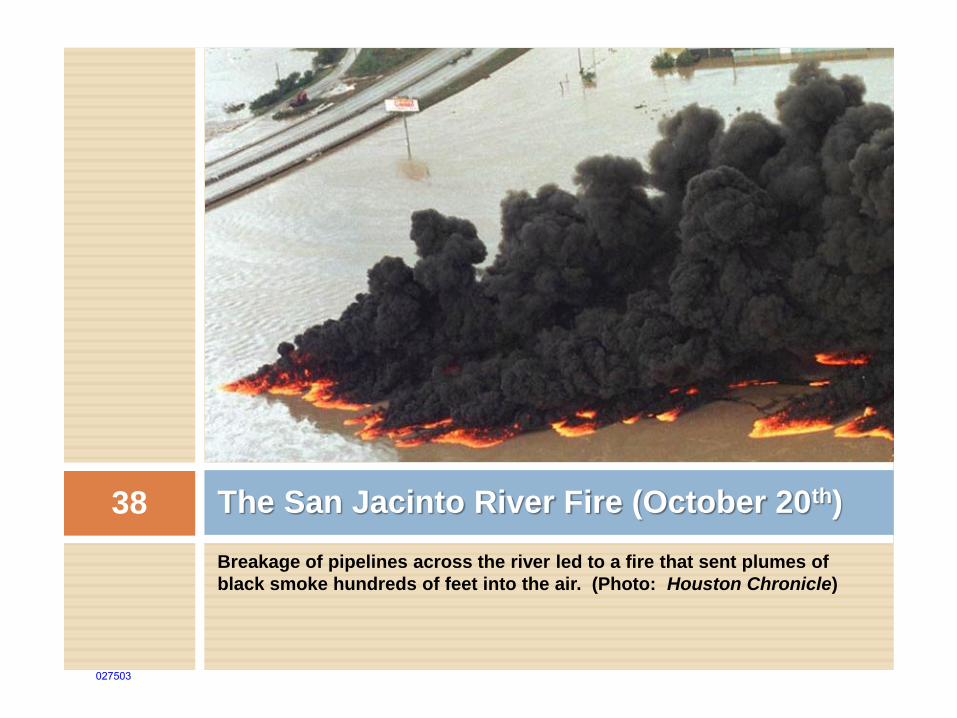
Breakage of pipelines across the river led to a fire that sent plumes of
black smoke hundreds of feet into the air. (Photo: Houston Chronicle)
The San Jacinto River Fire (October 20th) 38
027503
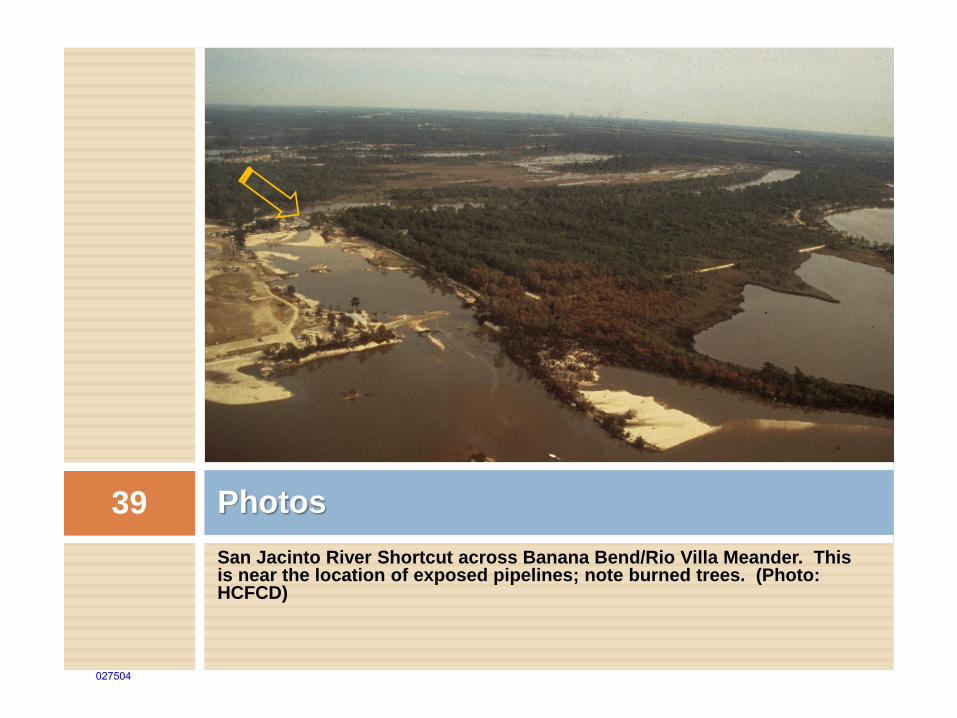
San Jacinto River Shortcut across Banana Bend/Rio Villa Meander. This is near the location of exposed pipelines; note burned trees. (Photo: HCFCD)
Photos 39
027504
Conclusions 40
Extreme rainfall events will continue to occur.
Are they “acts of God” that may be ignored, or should
they be considered when establishing flood protection
requirements?
The adoption of criteria that exceed FEMA minimum
requirements should be considered by communities to
guard against severe events.
Design of critical facilities should consider such extreme
events.
We must study and learn from these events.
Improvements in predictive technology and warning
systems must continue in order to reduce the loss of life
that occurs during such extreme weather events.
027505
References
U.S. Geological Survey
(USGS)
National Oceanic &
Atmospheric
Administration (NOAA)
Harris County Flood
Control District (HCFCD)
San Jacinto River Authority
(SJRA)
Trinity River Authority
(TRA)
Harris County Office of
Emergency Management
(HCOEM)
The Houston Chronicle
Steve Johnson, P.E., CFM
Public Agencies Private Sources
41
027506