andy kirk's talk at the acehp 2015 conference
TRANSCRIPT

COMMUNICATING THROUGH DATA: VISUALISING YOUR STORY
Andy Kirk
@visualisingdata www.visualisingdata.com

Data visualisation specialist: Blogger, trainer, lecturer, researcher, author, design consultant, speaker, twitterer...

Superstar technicians
Everyday practitioners

WHAT IS IT AND WHY IS IT RELEVANT?

The visual analysis of and communication of data
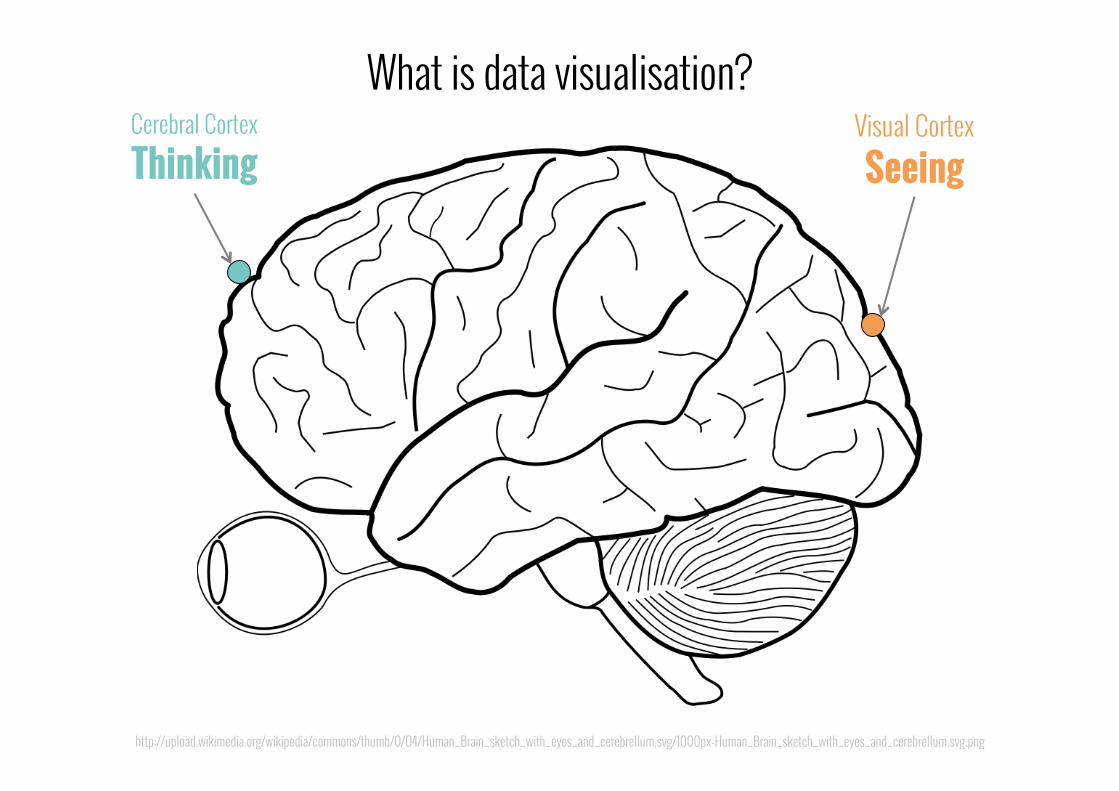
What is data visualisation?
For us
For others
http://upload.wikimedia.org/wikipedia/commons/thumb/0/04/Human_Brain_sketch_with_eyes_and_cerebrellum.svg/1000px-Human_Brain_sketch_with_eyes_and_cerebrellum.svg.png
Visual Cortex Seeing
Cerebral Cortex
Thinking
What is data visualisation?

Images from http://psychology.about.com/od/sensationandperception/ss/gestaltlaws.htm
What is data visualisation?

The best visualisation makes understanding accessible
http://www.nytimes.com/interactive/2014/11/04/upshot/senate-maps.html?_r=0

http://porostocky.prosite.com/6517/114057/work/infographics http://viz.wtf/post/107628689945/all-your-database-are-belong-to-us | http://viz.wtf/post/107440754050/how-payday-loans-add-up
The worst visualisation makes understanding inaccessible

The best visualisation adds value to the data
http://mbtaviz.github.io/

The worst visualisation adds no value to the data
http://www.bloomberg.com/news/2014-12-19/wall-street-firms-endure-lost-decade-after-goldman-peak-in-2007.html?hootPostID=32a4ad8c4a1454db9676f05959b22c09
http://www.nytimes.com/interactive/2014/10/19/upshot/peyton-manning-breaks-touchdown-passing-record.html?abt=0002&abg=0
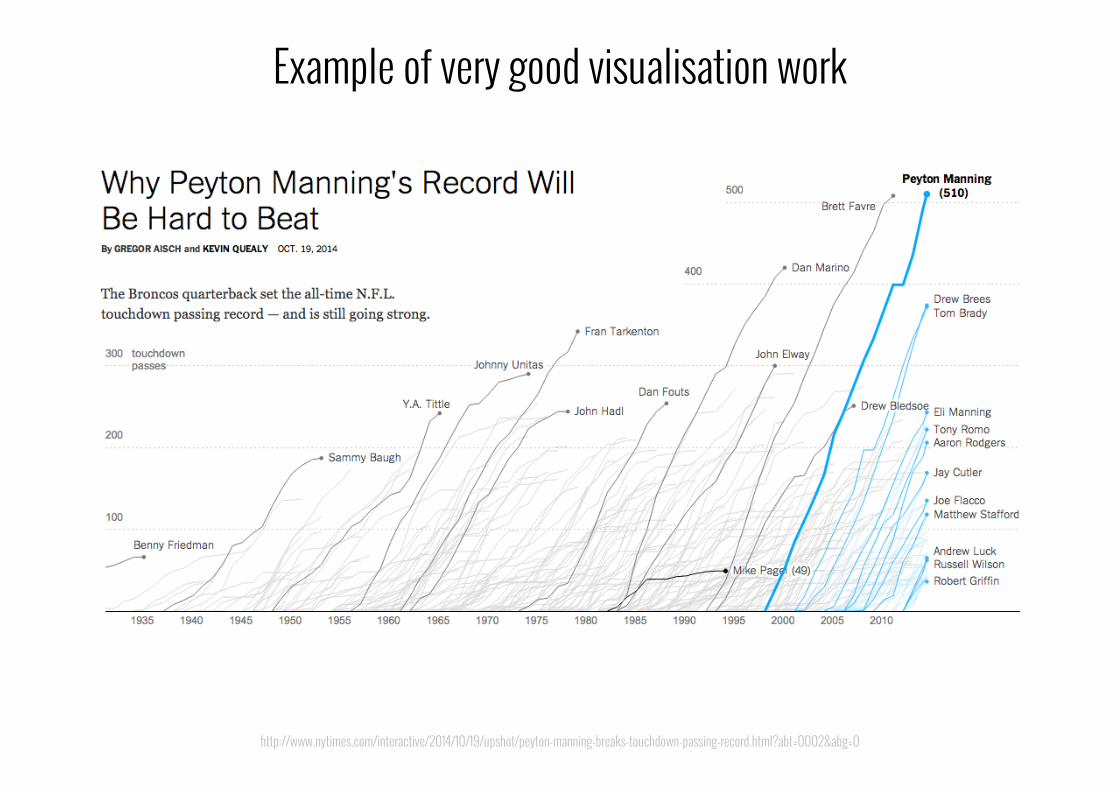
Example of very good visualisation work

http://www.nytimes.com/interactive/2014/10/19/upshot/peyton-manning-breaks-touchdown-passing-record.html?abt=0002&abg=0
Packs a lot of data into a single display, yet not overwhelming

http://www.nytimes.com/interactive/2014/10/19/upshot/peyton-manning-breaks-touchdown-passing-record.html?abt=0002&abg=0
Provides opportunity to explore and find our own patterns
Current players
Career trajectory
Injuries & form

http://www.nytimes.com/interactive/2014/10/19/upshot/peyton-manning-breaks-touchdown-passing-record.html?abt=0002&abg=0
Only uses colours that it needs, not those that it can
http://www.nytimes.com/interactive/2014/10/19/upshot/peyton-manning-breaks-touchdown-passing-record.html?abt=0002&abg=0
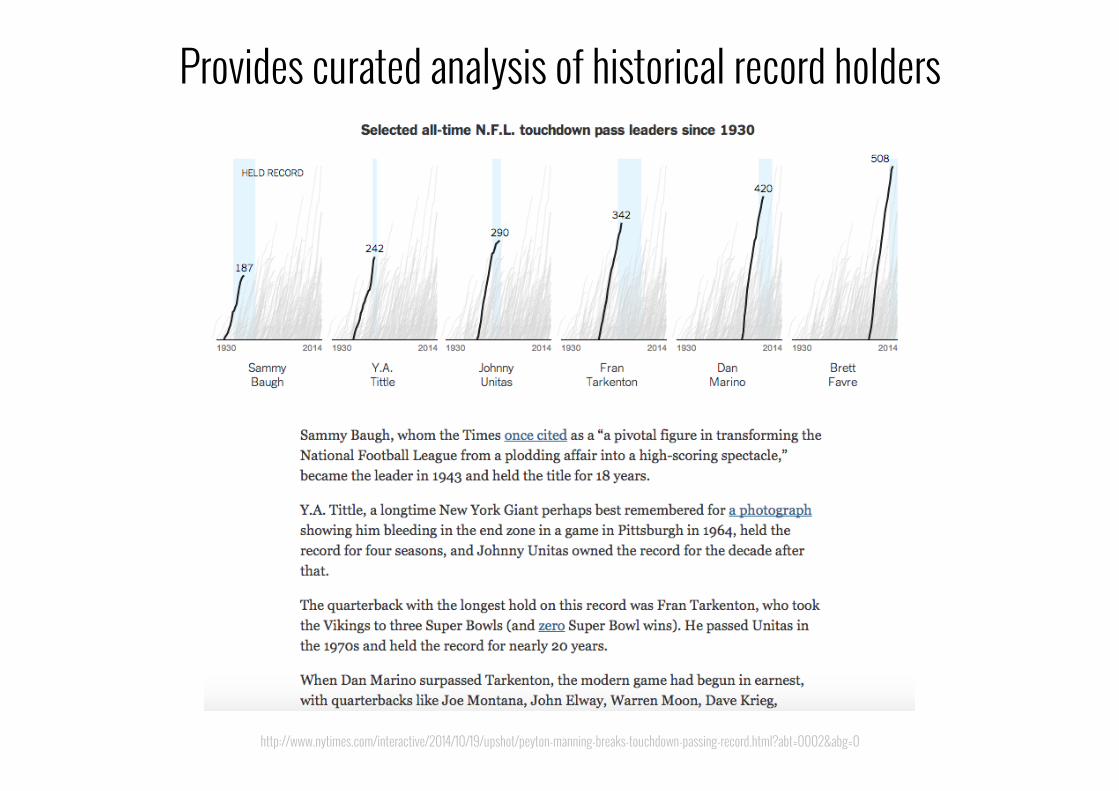
Provides curated analysis of historical record holders

http://www.nytimes.com/interactive/2014/10/19/upshot/peyton-manning-breaks-touchdown-passing-record.html?abt=0002&abg=0
Provides additional angles of analysis to help form conclusion
Plotted by age

Visualisation literacy: 21st Century skillset Subject neutral: Entirely portable craft
For all: Creator, consumer, commissioner ROI not easy: Pursuit of ‘better’
Why relevant?

EMBRACING FRESH THINKING

Data visualisation is a recipe of many ingredients

http://images.wikia.com/marvel_dc/images/9/93/Adventures_of_Superman_424.jpg | http://www.adobenido.com/blog/wp-content/uploads/2012/01/wonder_woman.jpg

TALENT
THINKING

http://earth.nullschool.net/
Technical abilities

Technical abilities (~300 data and visualisation tools)

http://www.guardian.co.uk/world/interactive/2012/nov/05/you-decide-the-presidential-election-interactive
Creative talent

http://www.scmp.com/infographics/article/1193675/remembering-kowloon-walled-city | http://apps.washingtonpost.com/g/page/world/mount-moriah-the-most-contested-real-estate-on-earth/626/
Artistic flair

http://www.nytimes.com/interactive/2014/11/04/upshot/senate-maps.html?_r=0
Data handling capabilities

TALENT
THINKING

CONTEXTUAL JOURNALISTIC IMAGINATIVE
CRITICAL ORGANISED
Embrace fresh thinking!

#1 CONTEXTUAL Framing our thinking


YOU ARE KAYAKING ALONG THE COAST OF GREENLAND AND YOU
NEED A ‘CHART’ TO NAVIGATE
The influence of context
(HT to Mark Daggett @heavysixer)

Three options: Which is best?
http://www.visualisingdata.com/index.php/2013/03/tactile-visualisations-inuit-wood-maps/

It needs to cope with being wet
http://www.visualisingdata.com/index.php/2013/03/tactile-visualisations-inuit-wood-maps/

It needs to float
http://www.visualisingdata.com/index.php/2013/03/tactile-visualisations-inuit-wood-maps/
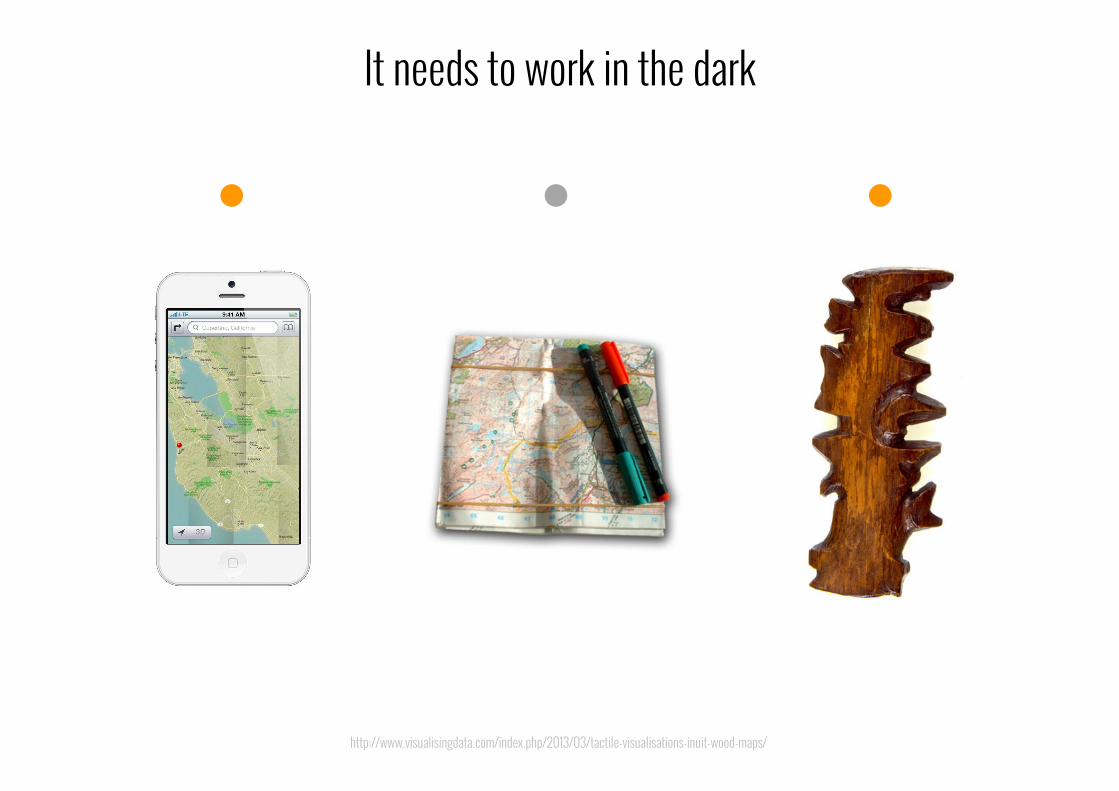
It needs to work in the dark
http://www.visualisingdata.com/index.php/2013/03/tactile-visualisations-inuit-wood-maps/
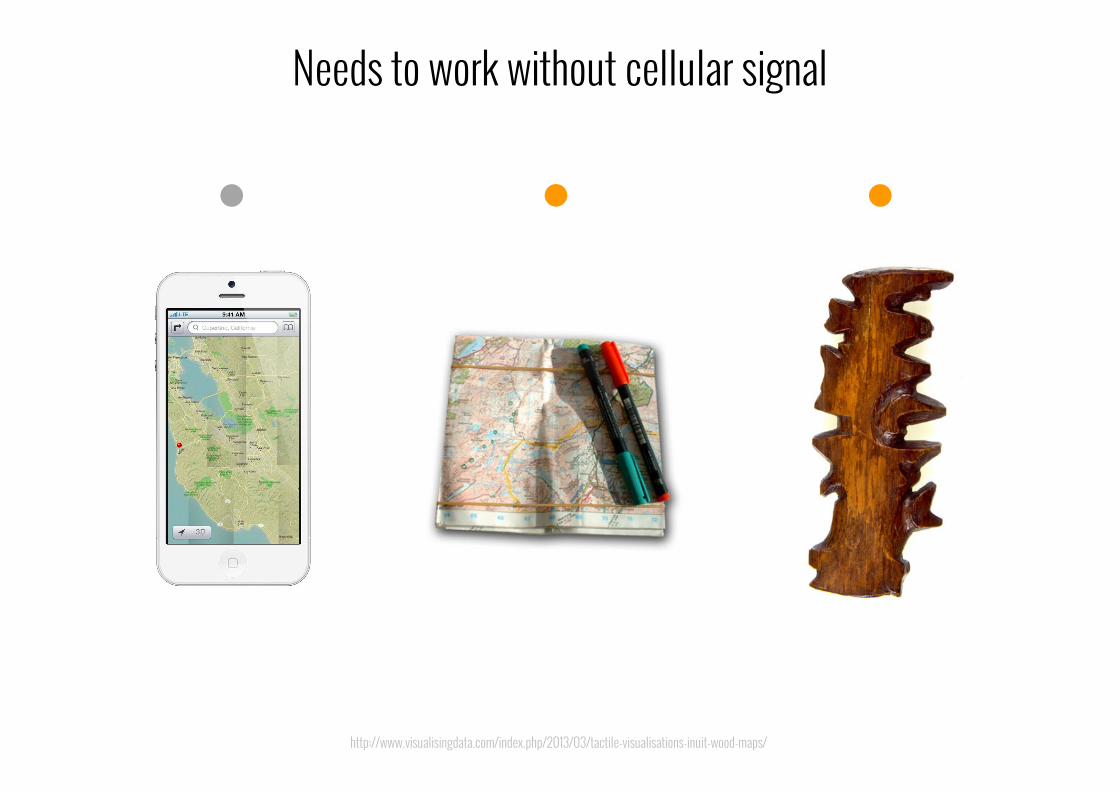
Needs to work without cellular signal
http://www.visualisingdata.com/index.php/2013/03/tactile-visualisations-inuit-wood-maps/

It shouldn’t be cumbersome to use
http://www.visualisingdata.com/index.php/2013/03/tactile-visualisations-inuit-wood-maps/

We can’t rely on anything that needs power
http://www.visualisingdata.com/index.php/2013/03/tactile-visualisations-inuit-wood-maps/

It is too cold to work without gloves
http://www.visualisingdata.com/index.php/2013/03/tactile-visualisations-inuit-wood-maps/

Final score
http://www.visualisingdata.com/index.php/2013/03/tactile-visualisations-inuit-wood-maps/

http://www.amazon.com/gp/product/0123740371/ref=as_li_tf_il?ie=UTF8&tag=visuadata-20&linkCode=as2&camp=217145&creative=399369&creativeASIN=0123740371

“...this example reinforces my thesis that in order to design a tool, we must make our best efforts to
understand the larger social and physical context within which it is intended to function.”
Bill Buxton, “Sketching User Experiences”
“...this example reinforces my thesis that in order to design a tool, we must make our best efforts to
understand the larger social and physical context within which it is intended to function.”
Bill Buxton, “Sketching User Experiences”
http://www.amazon.com/gp/product/0123740371/ref=as_li_tf_il?ie=UTF8&tag=visuadata-20&linkCode=as2&camp=217145&creative=399369&creativeASIN=0123740371

http://style.org/tapestry/
Who are the intended audiences?

http://youtu.be/hVimVzgtD6w?t=1m1s
Presented or distributed?

http://www.rvbookthai.com/wp-content/uploads/2013/05/6289048257_162d65958b_z.jpg | http://www.thetrafalgar.com/uploads/2010/10/boardroom.jpg |
http://en.wikipedia.org/wiki/Glass_cockpit
“Slow thinking”, “fast thinking” or combined?
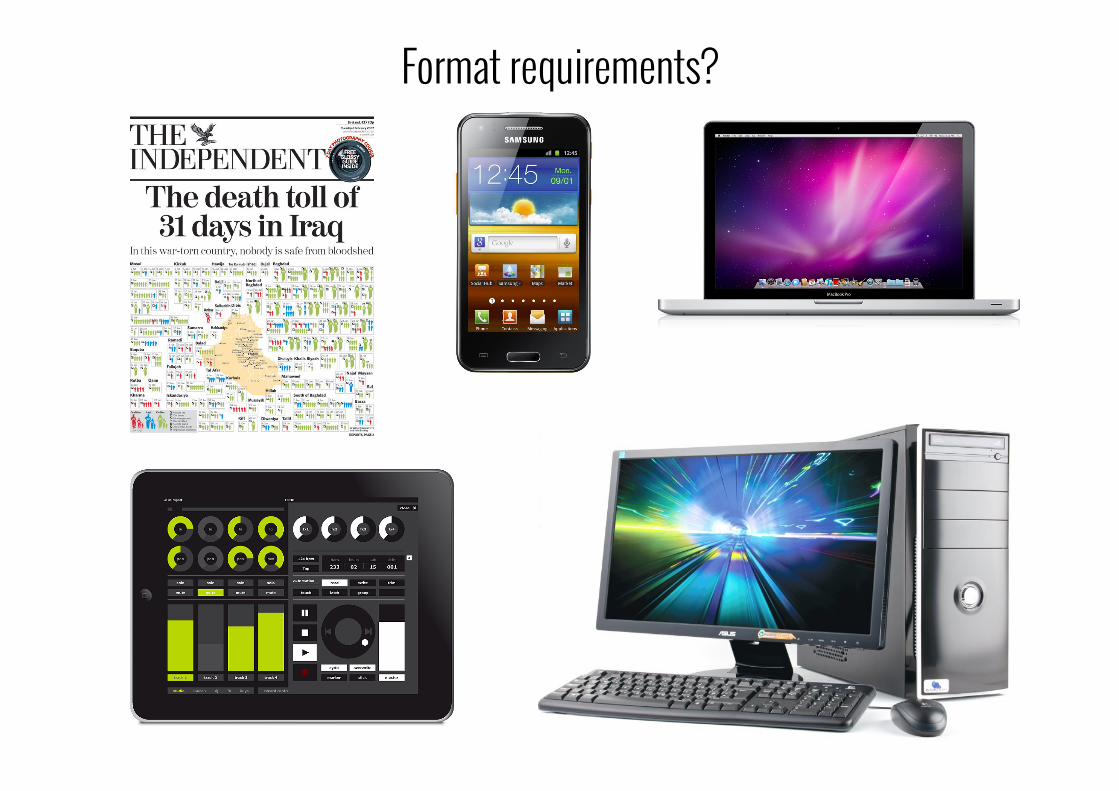
Format requirements?

Timescales?
http://comicsidontunderstand.com/wordpress/category/new-yorker/

Layout, colour, branding etc.?
http://www.smashingmagazine.com/2008/02/11/award-winning-newspaper-designs/ | http://dmindless.blogspot.com/2011/04/how-to-make-presentation-that-rocks.html

What’s the best visualisation solution? It always depends. Get your contextual
thinking established first.
Takeaway #1: Contextual thinking

#2 JOURNALISTIC Harnessing curiosity
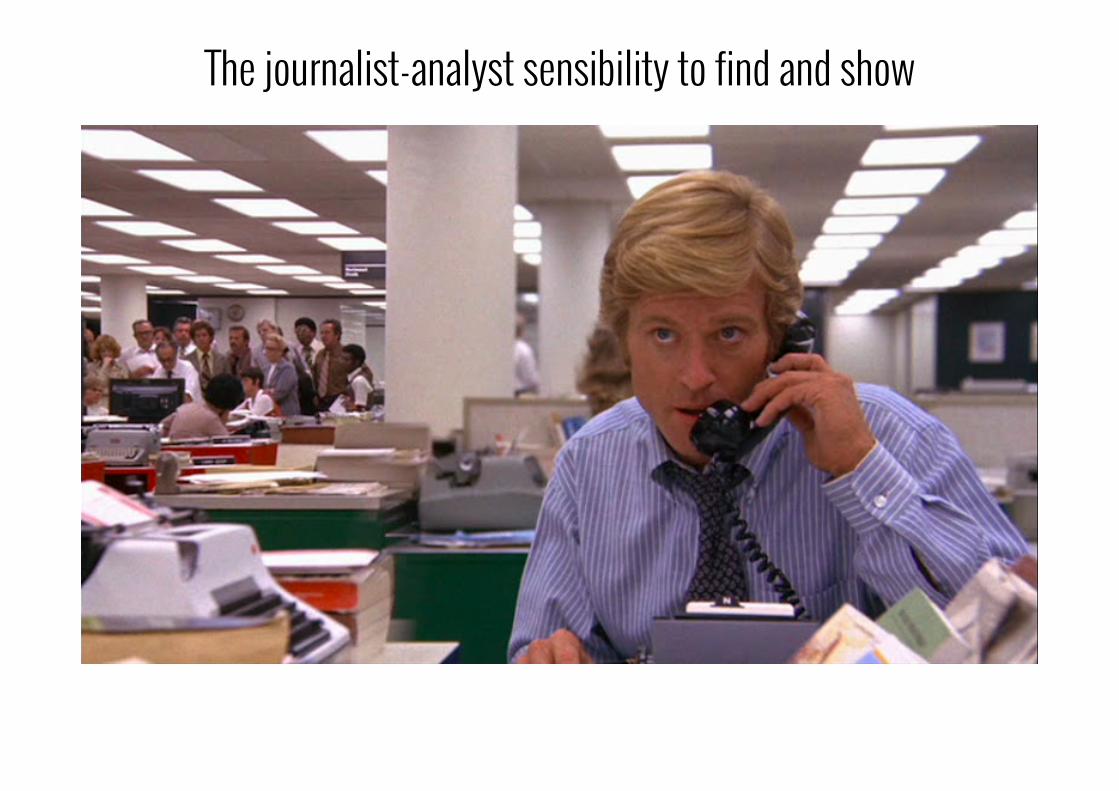
The journalist-analyst sensibility to find and show

http://cdn0.cosmosmagazine.com/wp-content/uploads/20080314_sherlock_holmes.jpg | http://www.idahogoldprospectors.org/wp-content/uploads/2011/10/Gold-Panning.jpg
Pursuing a data-driven curiosity

http://en.wikipedia.org/wiki/August_Landmesser
Pattern matching, sense-making, sniffing out the story

Pattern matching, sense-making, sniffing out the story
Haiti
Afghanistan
S. Africa
Kuwait
Vietnam
Nauru
North Korea
Tajikistan
Ethiopia

http://www.bloomberg.com/billionaires/latest
Pattern matching, sense-making, sniffing out the story

“A photo is never an objective reflection, but always an interpretation of reality... I see data visualization as sort of
a new photojournalism – a highly editorial activity.”
Moritz Stefaner
“A photo is never an objective reflection, but always an interpretation of reality... I see data visualization as sort of
a new photojournalism – a highly editorial activity.”
Moritz Stefaner
http://well-formed-data.net/archives/1027/worlds-not-stories

http://i.imgur.com/RmXbrDZ.jpg
Photo-journalistic: Filtering

http://i.imgur.com/RmXbrDZ.jpg
Photo-journalistic: Filtering

https://twitter.com/toddlerlex/status/440393501810118656/photo/1
Photo-journalistic: Consider all angles

https://twitter.com/toddlerlex/status/440393501810118656/photo/1
Photo-journalistic: Consider all angles

http://13pt.com/projects/nyt071211/
What is the duration of a single lunge feed?
How deep do whale’s dive when feeding?
What is a whale’s speed during lunge feeding?
What are the mechanics of the lunge feeding action?
How many tons of krill are consumed in each feed?
How long can a whale maintain the lunge cycle?
Photo-journalistic: Angles included

http://13pt.com/projects/nyt071211/
In which seas/oceans do fin whales tend to exist?
What is the population of fin whales?
Is this feeding pattern leading to reduction in krill?
Do all whales follow a similar feeding action?
Does it differ between male/female, young/old?
Have these actions changed over time?
Photo-journalistic: Angles excluded
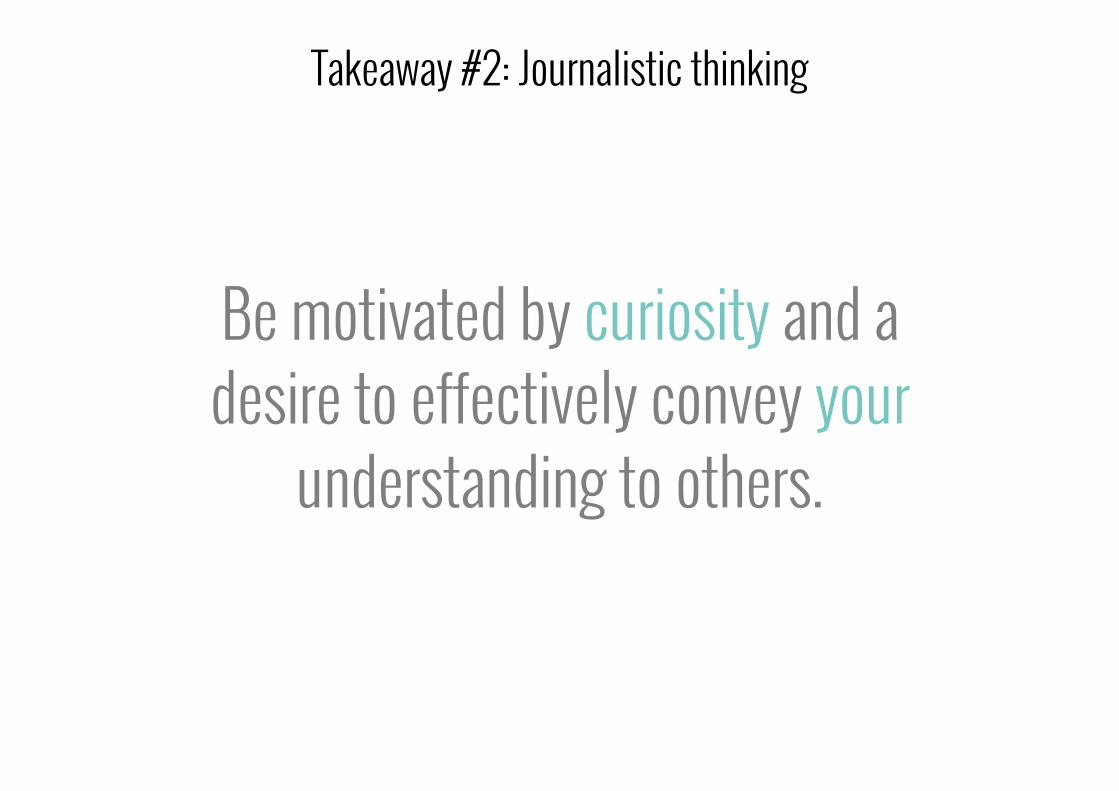
Be motivated by curiosity and a desire to effectively convey your
understanding to others.
Takeaway #2: Journalistic thinking
#3 IMAGINATIVE Empathy & creativity

If I was them, what would I want to know? How would I want to it be presented?
Audience empathy
http://zeldalily.com/wp-content/uploads/2012/11/guess-who.jpg

http://moritz.stefaner.eu/projects/musli-ingredient-network/
“I chose the chord diagram over the possibly more revealing matrix design because the matrix doesn't look ‘tasty’ and muesli
shouldn't look like ‘fungi’”
Subject empathy

http://graphics-info.blogspot.hk/2012/09/malofiej-20-look-at-our-participation.html
Subject empathy

http://melbourneurbanforestvisual.com.au/bigmap.html | https://twitter.com/NatGeopix/status/364914136594911233
Subject empathy

http://blogs.reuters.com/data-dive/2013/12/10/gms-new-ceo-is-another-small-crack-in-the-glass-ceiling/ http://www.chezvoila.com/blog/glass-ceiling
Subject empathy
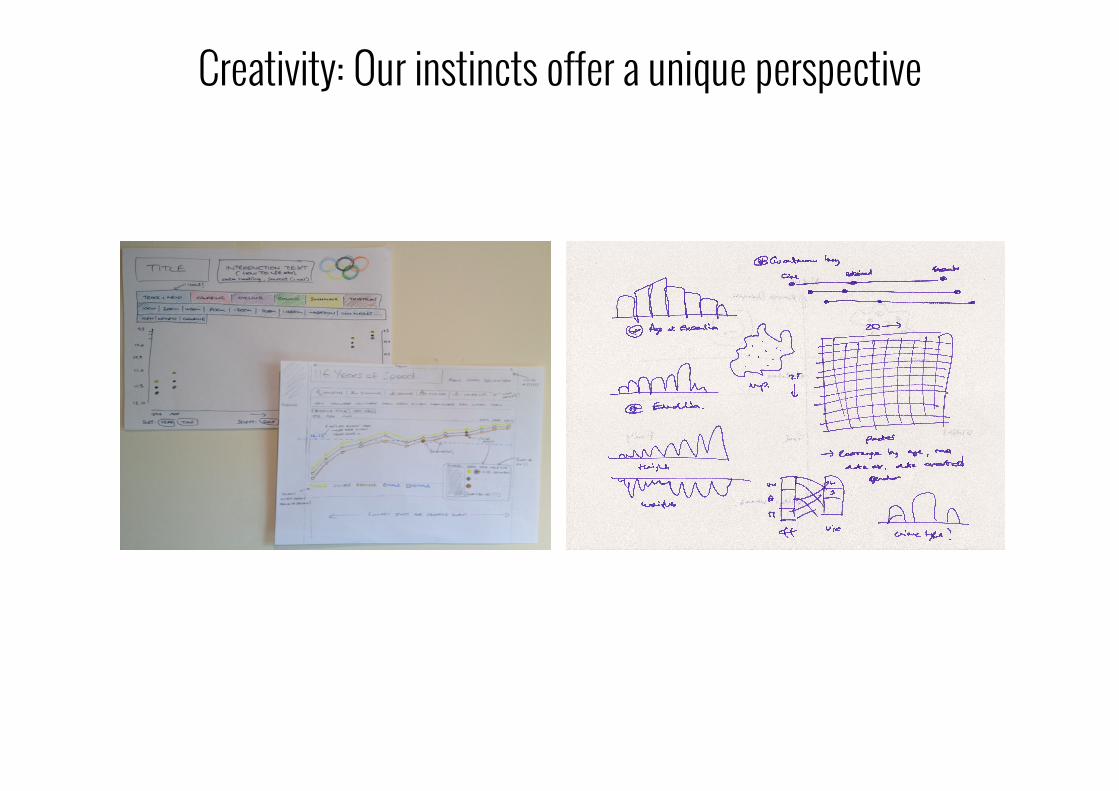
Creativity: Our instincts offer a unique perspective

https://www.google.co.uk/search?q=Argyle+(pattern)&safe=off&espv=2&source=lnms&tbm=isch&sa=X&ei=8_a7U_3LLYOV7AagwIHICA&ved=0CAYQ_AUoAQ&biw=1946&bih=1234#imgdii=_
Creativity: Be inspired by the world around you

Creativity: Be inspired by the world around you

What mental visualisations – instinctive keywords and imagery – form when you
think about a task: its intended recipients, the subject matter and its data?
Takeaway #3: Imaginative thinking

#4 CRITICAL
Justified decision making

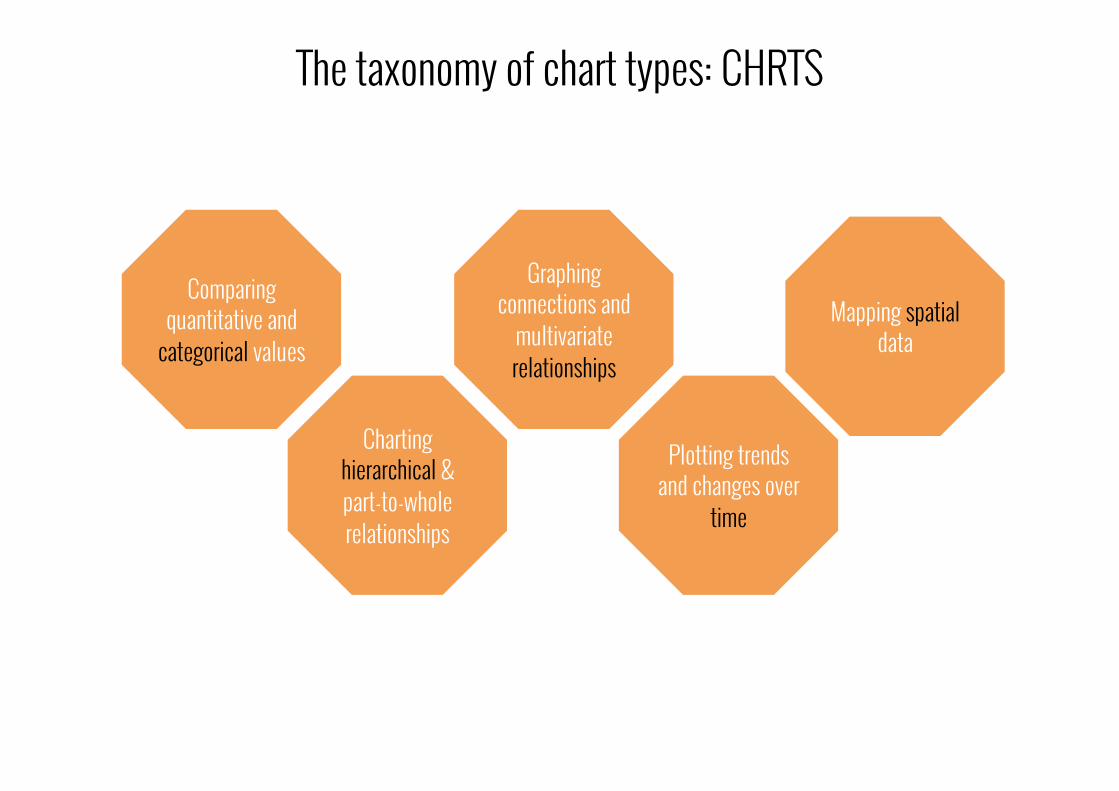
The taxonomy of chart types: CHRTS
C T H
S R
Comparing quantitative and
categorical values
Plotting trends and changes over
time
Charting hierarchical & part-to-whole relationships
Mapping spatial data
Graphing connections and
multivariate relationships
The taxonomy of chart types: CHRTS
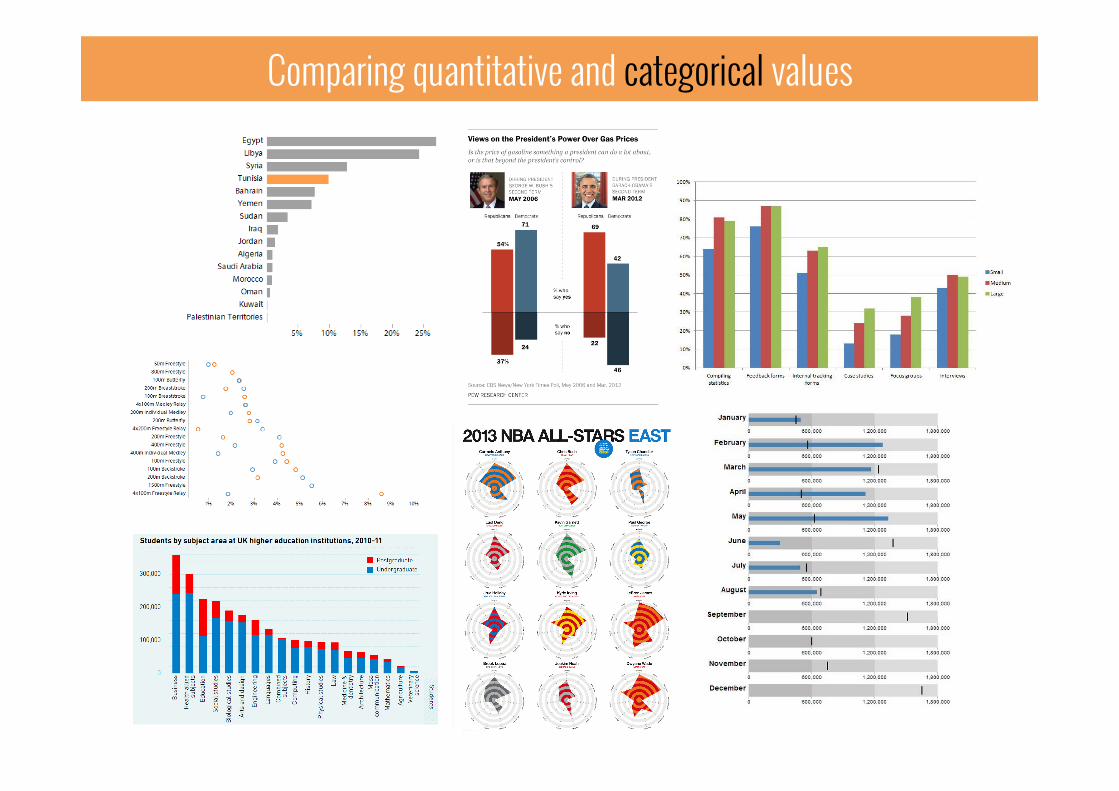
Comparing quantitative and categorical values
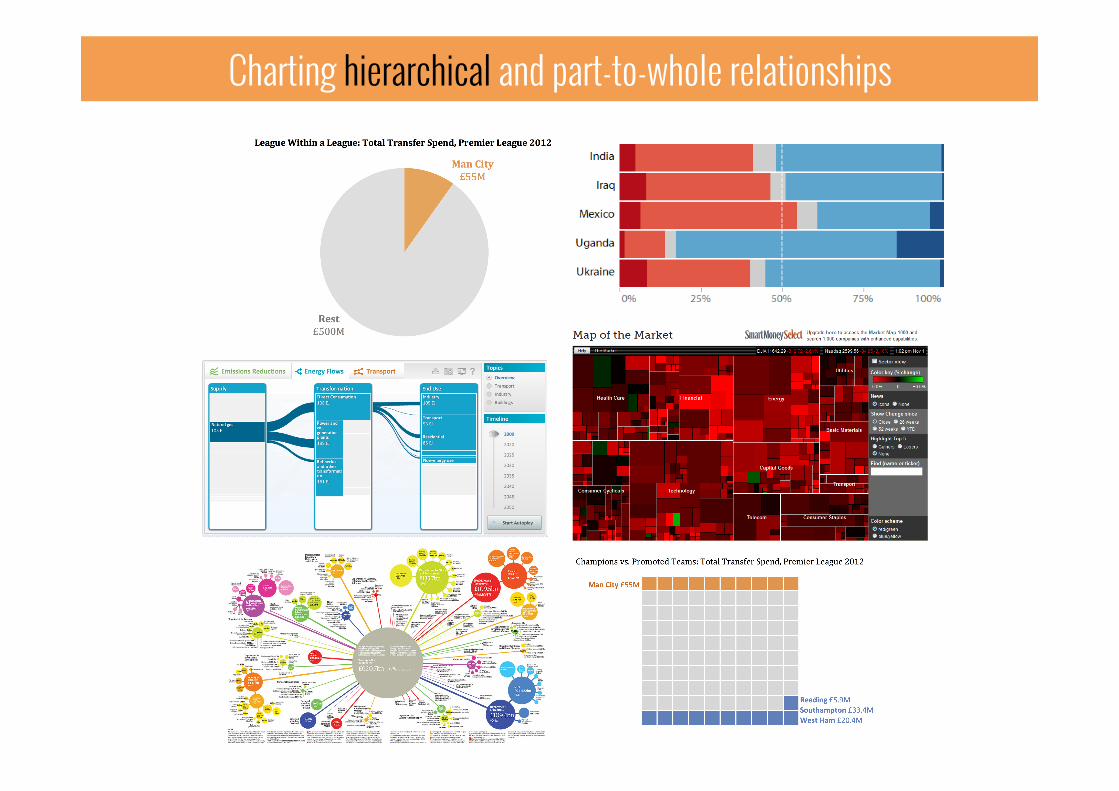
Charting hierarchical and part-to-whole relationships

Graphing connections and multivariate relationships

Plotting trends and changes over time

Mapping spatial data

http://bryanchristieblog.blogspot.co.uk/2012/03/my-visual-definition-of-information.html http://www.w3schools.com/tags/ref_colorpicker.asp?colorhex=F0F8FF
COLOUR Theory

http://projects.nytimes.com/census/2010/explorer
COLOUR: Categorical data = Show difference

COLOUR: Quantitative data = Show magnitude
http://www.nzz.ch/aktuell/inland-sommerserie-schweizer-karten-interaktiv/vergleich-strom-versorger-1.18120907

INTERACTIVITY: Multiple points of entry
http://www.nytimes.com/interactive/2011/05/31/business/economy/case-shiller-index.html?smid=tw-share&_r=3&

http://hint.fm/wind/
INTERACTIVITY/ANIMATION: Explorable dynamic data

http://www.visualisingdata.com/index.php/2011/07/new-visualisation-design-project-un-global-pulse-challenge/
ANNOTATION: Judging the right level of help

http://www.nytimes.com/interactive/2009/03/01/business/20090301_WageGap.html
ANNOTATION: User insights

https://www.flickr.com/photos/accurat/14577900823/in/set-72157632185046466?utm_content=buffer050e5&utm_medium=social&utm_source=twitter.com&utm_campaign=buffer
ARRANGEMENT: Size, shape, position, order

“#8 Good design is thorough down to the last detail... Nothing must be arbitrary or left to chance.”
Dieter Rams’ ‘10 principles of good design’
“Good design is thorough down to the last detail... Nothing must be arbitrary or left to chance.”
Dieter Rams’ ‘10 principles of good design’
https://www.vitsoe.com/gb/about/good-design

Be able to justify every design decision
http://www.oecd.org/dac/peerreviewsofdacmembers/PRFINLAND2012.pdf

Be able to justify every design decision
The real craft behind data visualisation design is how we rationalise choices.
To make astute choices, you need to be aware of all the options.
Takeaway #4: Critical thinking
#5 ORGANISED
Sequenced thinking

Visualisation is a process, not a procedure
“There's a strand of the data viz world that argues that everything could be a bar chart. That's possibly true but
also possibly a world without joy”
Amanda Cox, New York Times
“There's a strand of the data viz world that argues that everything could be a bar chart. That's possibly true but
also possibly a world without joy”
Amanda Cox, New York Times
http://blogs.hbr.org/hbr/hbreditors/2013/03/power_of_visualizations_aha_moment.html

Framework for thinking rather than rules for obeying

Framework for thinking rather than rules for obeying

Where to begin? What pathway to take?
http://www.mattneuman.com/maze.gif

Cohesion and flow of thinking

1. Establish the visualisation’s purpose
2. Acquire, familiarise with and prepare your data
3. Determine the editorial focus of your subject matter
4. Conceive your design: data representation and presentation
5. Construct and complete your design solution PR
ACTIC
AL
CREA
TIVE

Pursue an effective and efficient workflow to sequence and optimise your thinking.
Takeaway #5: Organised thinking

CONTEXTUAL JOURNALISTIC IMAGINATIVE
CRITICAL ORGANISED
Embrace fresh thinking!

Getting this little guy working will make a huge difference!

COMMUNICATING THROUGH DATA: VISUALISING YOUR STORY
Andy Kirk
@visualisingdata www.visualisingdata.com