androscoggin river modeling report and alternative
TRANSCRIPT
Androscoggin River Modeling ReportAnd Alternative Analysis
June 2002
Paul Mitnik, P.E.Bureau of Land and Water Quality
Division of Environmental AssessmentDEPLW2001-11

Androscoggin River Modeling Report - May 2002Executive Summary
DEPLW2001-11 Page 1
Executive Summary
This study focuses on Gulf Island Pond, which is a large impoundment that extends for14 miles from Lewiston to Turner. A four-mile segment upstream of Gulf Island dam ison Maine’s 303d non-attainment list. The Clean Water Act requires that a TMDL (TotalMaximum Daily Load) be completed for this water segment. A water quality model wasdeveloped by DEP using data collected both historically and in the summer of 2000. Thefollowing findings were made:
1. Water Quality Conditions• The Androscoggin River has historically had poor water quality. A low point was
reached in the 1960’s when it was ranked as one of the ten most polluted rivers in thenation.
• The Androscoggin River’s water quality has improved dramatically since the 1960’sdue to many actions including the mandatory requirement of secondary treatment;voluntary pollution prevent efforts and additional regulatory requirements at threepaper mills; and the installation of an instream oxygen diffuser (GIPOP) at GulfIsland Pond in 1992.
• Data taken from 1993 to 2000 indicate little improvement has occurred in Gulf IslandPond’s dissolved oxygen levels since the initial improvements from GIPOP in 1992.
• The data indicate that class C daily minimum and monthly average dissolved oxygencriteria are not met in 10% and 23%, respectively, of the total pond volume. Most ofthe non-attainment is restricted to a 4-mile stretch above the dam in the deeperportions of the pond.
• Algae blooms occur in Gulf Island Pond every summer. The algae blooms contributeto the dissolved oxygen depletion and violate the water classification narrative criteriafor meeting designated uses of water contact recreation.
2. Model Predictions in Gulf Island Pond with GIPOP at 92000 PPD
• Point sources at licensed limits:- Daily minimum DO criteria (5 ppm) not met for a length of 13 river miles and
55% of pond volume- Monthly average DO criteria (6.5 ppm) not met for a length of 38 river- miles and 72% of pond volume- Maximum chlorophyll a of 19 ppb and length of 7 miles exceeds the algae
bloom threshold of 8 ppb.• Point sources at actual discharge levels:
- Daily minimum DO criteria (5 ppm) not met for a length of 4 river miles and11% of pond volume
- Monthly average DO criteria (6.5 ppm) not met for a length of 4 river- miles and 20% of pond volume- Maximum chlorophyll a of 17 ppb and length of 7 miles exceeds the algae
bloom threshold of 8 ppb.
Androscoggin River Modeling Report - May 2002Executive Summary
DEPLW2001-11 Page 2
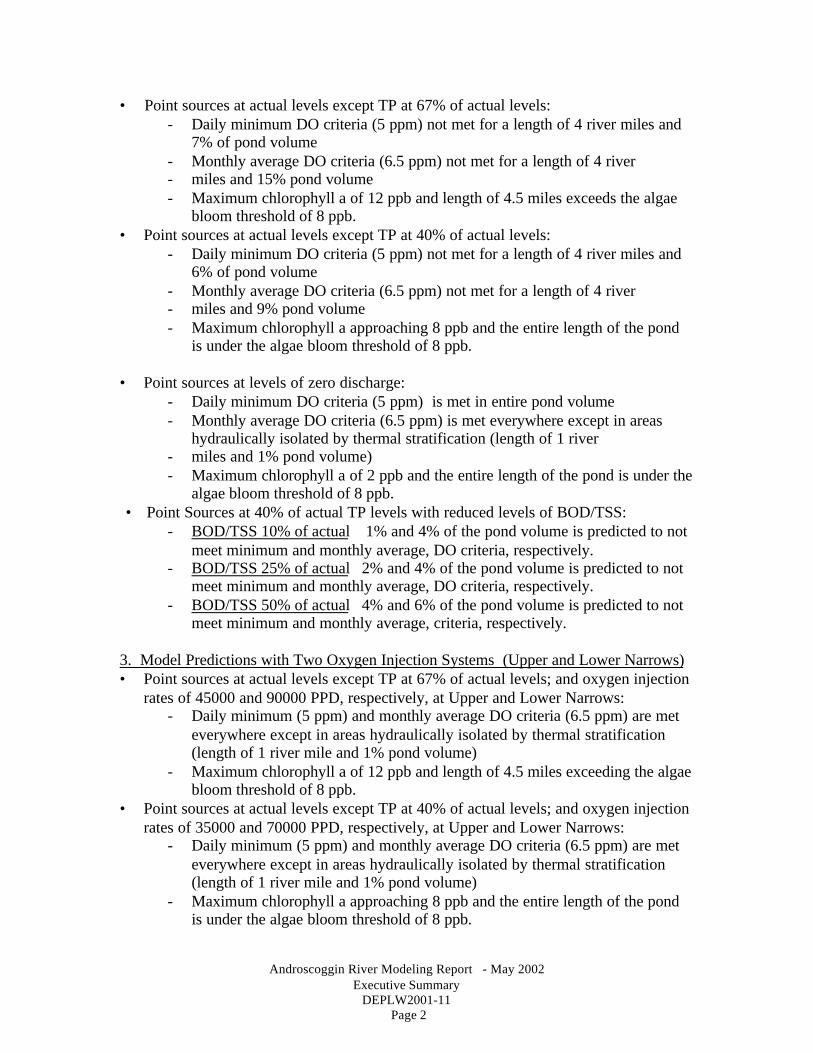
• Point sources at actual levels except TP at 67% of actual levels:- Daily minimum DO criteria (5 ppm) not met for a length of 4 river miles and
7% of pond volume- Monthly average DO criteria (6.5 ppm) not met for a length of 4 river- miles and 15% pond volume- Maximum chlorophyll a of 12 ppb and length of 4.5 miles exceeds the algae
bloom threshold of 8 ppb.• Point sources at actual levels except TP at 40% of actual levels:
- Daily minimum DO criteria (5 ppm) not met for a length of 4 river miles and6% of pond volume
- Monthly average DO criteria (6.5 ppm) not met for a length of 4 river- miles and 9% pond volume- Maximum chlorophyll a approaching 8 ppb and the entire length of the pond
is under the algae bloom threshold of 8 ppb.
• Point sources at levels of zero discharge:- Daily minimum DO criteria (5 ppm) is met in entire pond volume- Monthly average DO criteria (6.5 ppm) is met everywhere except in areas
hydraulically isolated by thermal stratification (length of 1 river- miles and 1% pond volume)- Maximum chlorophyll a of 2 ppb and the entire length of the pond is under the
algae bloom threshold of 8 ppb.• Point Sources at 40% of actual TP levels with reduced levels of BOD/TSS:
- BOD/TSS 10% of actual 1% and 4% of the pond volume is predicted to notmeet minimum and monthly average, DO criteria, respectively.
- BOD/TSS 25% of actual 2% and 4% of the pond volume is predicted to notmeet minimum and monthly average, DO criteria, respectively.
- BOD/TSS 50% of actual 4% and 6% of the pond volume is predicted to notmeet minimum and monthly average, criteria, respectively.
3. Model Predictions with Two Oxygen Injection Systems (Upper and Lower Narrows)• Point sources at actual levels except TP at 67% of actual levels; and oxygen injection
rates of 45000 and 90000 PPD, respectively, at Upper and Lower Narrows:- Daily minimum (5 ppm) and monthly average DO criteria (6.5 ppm) are met
everywhere except in areas hydraulically isolated by thermal stratification(length of 1 river mile and 1% pond volume)
- Maximum chlorophyll a of 12 ppb and length of 4.5 miles exceeding the algaebloom threshold of 8 ppb.
• Point sources at actual levels except TP at 40% of actual levels; and oxygen injectionrates of 35000 and 70000 PPD, respectively, at Upper and Lower Narrows:
- Daily minimum (5 ppm) and monthly average DO criteria (6.5 ppm) are meteverywhere except in areas hydraulically isolated by thermal stratification(length of 1 river mile and 1% pond volume)
- Maximum chlorophyll a approaching 8 ppb and the entire length of the pondis under the algae bloom threshold of 8 ppb.
Androscoggin River Modeling Report - May 2002Executive Summary
DEPLW2001-11 Page 3
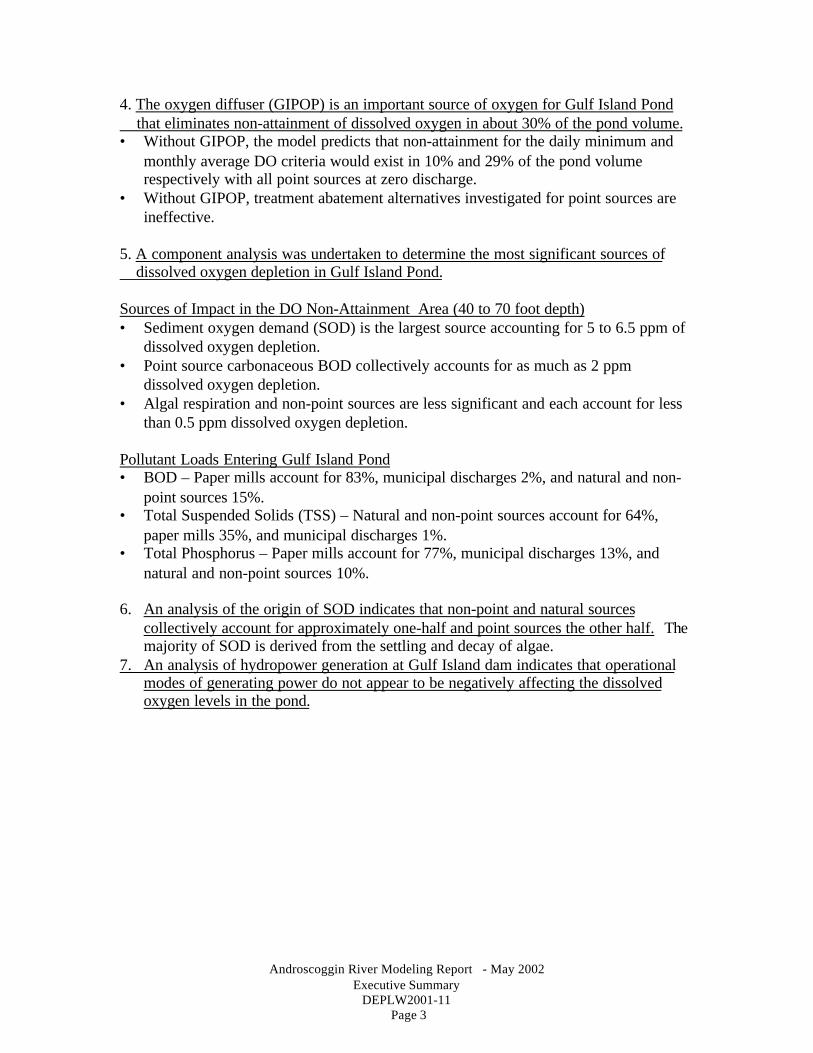
4. The oxygen diffuser (GIPOP) is an important source of oxygen for Gulf Island Pond that eliminates non-attainment of dissolved oxygen in about 30% of the pond volume.• Without GIPOP, the model predicts that non-attainment for the daily minimum and
monthly average DO criteria would exist in 10% and 29% of the pond volumerespectively with all point sources at zero discharge.
• Without GIPOP, treatment abatement alternatives investigated for point sources areineffective.
5. A component analysis was undertaken to determine the most significant sources of dissolved oxygen depletion in Gulf Island Pond.
Sources of Impact in the DO Non-Attainment Area (40 to 70 foot depth)• Sediment oxygen demand (SOD) is the largest source accounting for 5 to 6.5 ppm of
dissolved oxygen depletion.• Point source carbonaceous BOD collectively accounts for as much as 2 ppm
dissolved oxygen depletion.• Algal respiration and non-point sources are less significant and each account for less
than 0.5 ppm dissolved oxygen depletion.
Pollutant Loads Entering Gulf Island Pond• BOD – Paper mills account for 83%, municipal discharges 2%, and natural and non-
point sources 15%.• Total Suspended Solids (TSS) – Natural and non-point sources account for 64%,
paper mills 35%, and municipal discharges 1%.• Total Phosphorus – Paper mills account for 77%, municipal discharges 13%, and
natural and non-point sources 10%.
6. An analysis of the origin of SOD indicates that non-point and natural sourcescollectively account for approximately one-half and point sources the other half. Themajority of SOD is derived from the settling and decay of algae.
7. An analysis of hydropower generation at Gulf Island dam indicates that operationalmodes of generating power do not appear to be negatively affecting the dissolvedoxygen levels in the pond.
Table Of Contents
PageIntroduction 1Summary of Gulf Island Pond Data 2Summary of Summer 1999 Data 8Water Quality Model 14Calibration of Gulf Island Pond Chemical Data 20Orthophosphorus Uptake Rate 39Analysis of Origin Of Sediment Oxygen Demand 42Water Quality Model Prediction Runs 52Model Component Analysis of Impacts to Gulf Island Pond 79Model Sensitivity Analysis 84Analysis of Hydropower Operation at Gulf Island Dam 88Analysis of GIPOP Operation 89
Figures1. Percentage of Gulf Island Pond Not Meeting Minimum Class C DO Criteria 52. Summary of Gulf Island Pond Chlorophyll a Data 1998 – 2000 63.Time of Travel Androscoggin River 74. Gulf Island Pond Summer 1999 % Volume of DO Non-Attainment Vs Chl a 105. Gulf Island Pond Summer 1999 % Volume of DO Non-Attainment Vs Temp 116. Gulf Island Pond Summer 1999 % Vol. of DO Non-Attain. Vs Temp. Vs Flow 127. Gulf Island Pond Summer 1999 % Vol. of DO Non-Attain. Vs Temp Vs Chl a 137a. WASP Model Schematic 168. Qual2EU Model Setup for Upper Androscoggin 179. WASP Model Setup for Gulf Island Pond 1810. Androscoggin River Flow August 2000 2511. Model Calibration of Ultimate BOD – Aug 2000 Data 2612. Model Solar Radiation 2713. Model Calibration of Chl a – Aug 2000 Data 2814. Model Calibration of Total Nitrogen– Aug 2000 Data 2915. Model Calibration of Total Phosphorus – Aug 2000 Data 2616. Model Vertical Dispersion Rate 3117.Continuous Model Calibration of DO Turner Bridge Monitor – Aug 2000 3218.Continuous Model Calibration of DO Gulf Island DamMonitor – Aug 2000 3319a. Model Calibration of DO by River Mile – Aug. 9, 2000 3419b. Model Calibration of DO by River Mile – Aug. 15, 2000 3519c. Model Calibration of DO by River Mile – Aug. 31, 2000 3620. Model Verification of the Aug. 1984 PO4-P, CBOD, Chl a in Gulf Island Pond 3720a. Model Verification of the Aug. 1984 Dissolved Oxygen 3821. Calibration of Upper Androscoggin River PO4-P Uptake Rate 4122. TSS Calibration Summer 1989 4823. Origin of SOD in Gulf Island Pond by Source 4924. Origin of SOD in Gulf Island Pond by Pollution Parameters 50
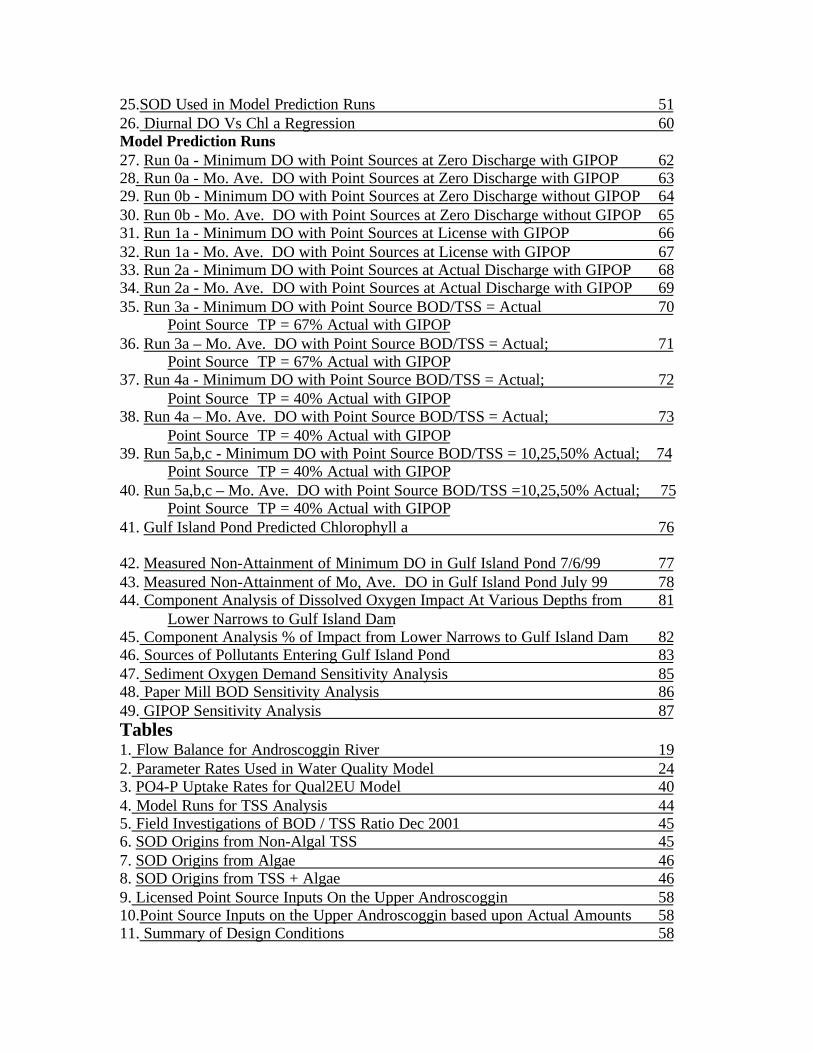
25.SOD Used in Model Prediction Runs 5126. Diurnal DO Vs Chl a Regression 60Model Prediction Runs27. Run 0a - Minimum DO with Point Sources at Zero Discharge with GIPOP 6228. Run 0a - Mo. Ave. DO with Point Sources at Zero Discharge with GIPOP 6329. Run 0b - Minimum DO with Point Sources at Zero Discharge without GIPOP 6430. Run 0b - Mo. Ave. DO with Point Sources at Zero Discharge without GIPOP 6531. Run 1a - Minimum DO with Point Sources at License with GIPOP 6632. Run 1a - Mo. Ave. DO with Point Sources at License with GIPOP 6733. Run 2a - Minimum DO with Point Sources at Actual Discharge with GIPOP 6834. Run 2a - Mo. Ave. DO with Point Sources at Actual Discharge with GIPOP 6935. Run 3a - Minimum DO with Point Source BOD/TSS = Actual 70
Point Source TP = 67% Actual with GIPOP36. Run 3a – Mo. Ave. DO with Point Source BOD/TSS = Actual; 71
Point Source TP = 67% Actual with GIPOP37. Run 4a - Minimum DO with Point Source BOD/TSS = Actual; 72
Point Source TP = 40% Actual with GIPOP38. Run 4a – Mo. Ave. DO with Point Source BOD/TSS = Actual; 73
Point Source TP = 40% Actual with GIPOP39. Run 5a,b,c - Minimum DO with Point Source BOD/TSS = 10,25,50% Actual; 74
Point Source TP = 40% Actual with GIPOP40. Run 5a,b,c – Mo. Ave. DO with Point Source BOD/TSS =10,25,50% Actual; 75
Point Source TP = 40% Actual with GIPOP41. Gulf Island Pond Predicted Chlorophyll a 76
42. Measured Non-Attainment of Minimum DO in Gulf Island Pond 7/6/99 7743. Measured Non-Attainment of Mo, Ave. DO in Gulf Island Pond July 99 7844. Component Analysis of Dissolved Oxygen Impact At Various Depths from 81
Lower Narrows to Gulf Island Dam45. Component Analysis % of Impact from Lower Narrows to Gulf Island Dam 8246. Sources of Pollutants Entering Gulf Island Pond 8347. Sediment Oxygen Demand Sensitivity Analysis 8548. Paper Mill BOD Sensitivity Analysis 8649. GIPOP Sensitivity Analysis 87Tables1. Flow Balance for Androscoggin River 192. Parameter Rates Used in Water Quality Model 243. PO4-P Uptake Rates for Qual2EU Model 404. Model Runs for TSS Analysis 445. Field Investigations of BOD / TSS Ratio Dec 2001 456. SOD Origins from Non-Algal TSS 457. SOD Origins from Algae 468. SOD Origins from TSS + Algae 469. Licensed Point Source Inputs On the Upper Androscoggin 5810.Point Source Inputs on the Upper Androscoggin based upon Actual Amounts 5811. Summary of Design Conditions 58

12. Summary of Paper Mill Discharges to Androscoggin River 5913. Summary of Model Prediction Runs in Gulf Island Pond 6114. Revised GIPOP Operational Plan – Effective June 1999 89

Androscoggin River Modeling Report - May 2002DEPLW2001-11
Page 1
Introduction
The Androscoggin River originates at the outlet of Umbagog Lake in Errol, NewHampshire, and empties into Merrymeeting Bay at Brunswick, Maine. The river flow isregulated from a series of lakes in the upper watershed that store a significant amount ofwater. As a result, a minimum flow of 1550 cfs can usually be maintained at Errol. NewHampshire. The entire river in Maine is classified C, which is Maine’s lowest legalclassification. Class C water quality still supports the fishable and swimmable goals ofthe Clean Water Act (CWA).
The Androscoggin River has had a long history of very poor water quality. A low pointwas reached in the 1960’s when it was recognized as one of the ten most polluted riversnationally. Considerable cleanup progress has been accomplished over the years up to apoint where dissolved oxygen criteria are met everywhere except in the deeper portionsof Gulf Island Pond.
The area of interest in this study is Gulf Island Pond, a large impoundment with a totalvolume of 2.5 billion cubic feet. Gulf Island dam is located in Lewiston-Auburn andimpounds the Androscoggin River for a distance of 14.5 miles up to the towns of Greeneand Leeds on its east bank and Turner on its west bank. Gulf Island Pond has a meandepth of 21 feet and maximum depth of 80 feet at its deep hole located approximately1500 feet upstream from the dam.
Gulf Island Pond is on Maine’s 303d list of non-attainment segments. Dissolved oxygenis listed as the parameter of non-attainment and point and both non-point sources arecited as the reasons for the non-attainment. Class C minimum dissolved oxygen criteriacurrently require that ambient levels exceed a minimum of 5 ppm and 60% of saturationand exceed a monthly average of 6.5 ppm. As a result of being on the 303d list, theCWA requires that a Total Maximum Daily Load (TMDL) be developed to bring thiswater body into compliance with class C dissolved oxygen criteria. This TMDL has ahigh level of priority on the 303d list with a projected completion date before 2003.
Numerous point sources discharge to the Androscoggin River above Gulf Island Pondand can potentially influence its water quality. Paper mills discharge to the river inBerlin, NH (Pulp and Paper of America), Rumford, ME (Mead Westvaco Corp), and Jay,ME (International Paper Co). Municipal point sources are located in New Hampshire(Berlin and Gorham); and in Maine (Bethel, Rumford-Mexico, and Livermore Falls).The collective dilution of the river 7-day 10-year low flow (7Q10 flow) to all pointsource discharges above Gulf Island Pond is only 8.6:1. The low dilution that is availablefor point source discharges and the poor capacity provided by the pond to assimilatewastes both result in a difficult situation for maintaining adequate water quality. Sourcesof non-point source pollution include land use activities related primarily to residentialdevelopment, silviculture, and agriculture.

Androscoggin River Modeling Report - May 2002DEPLW2001-11
Page 2
A modeling study was undertaken by the DEP and consultants to the three paper millsfrom 1980 to 1985. A result of that study was that no level of point source control couldresult in attainment of dissolved oxygen criteria everywhere in Gulf Island Pond. Amajor cause of the non-attainment in the pond was determined to be from the sedimentoxygen demand that was believed to be derived from the historical accumulation ofwastes in the pond. To mitigate this impact, an in-stream oxygenation diffuser was put inGulf Island Pond approximately five miles upstream of Gulf Island dam. A cooperativeagreement was reached between the three paper mills and a public utility company (nowFlorida Power and Light) that owns the dam and its hydropower generating facility. Theaeration system became known as Gulf Island Pond Oxygenation Project (GIPOP). Theaeration system was installed in the summer of 1992 and immediate improvements ofdissolved oxygen in the pond became evident.
A number of waste treatment improvements have been realized at the paper mills as aresult of voluntary pollution prevention efforts and regulatory requirements. Gulf IslandPond has been monitored closely since 1985 to document the improvements in waterquality. As expected, the data have shown significant improvements of dissolved oxygenlevels in Gulf Island Pond, but some non-attainment of class C dissolved oxygen criteriapersists every summer in the deeper portions of the pond.
This modeling analysis updates the prior effort with newer data. Four major issues arealso explored that weren’t considered in the original modeling analysis.1. What is the origin of the sediment oxygen demand (SOD) that continues to be a major
cause of oxygen depletion in Gulf Island Pond? Can anything be done to reduceSOD?
2. Algae blooms are now experienced on the pond every summer. To what extent doesalgae affect dissolved oxygen levels on the pond? How much will nutrient inputreductions improve water quality?
3. Can the monthly average dissolved oxygen criteria of 6.5 ppm be maintained in theAndroscoggin River and Gulf Island Pond?
4. What other actions are necessary to improve water quality in Gulf Island Pond?
Summary of Gulf Island Pond Data
The quantity and scope of water quality data taken on the Androscoggin River by DEPand the GIPOP cooperative in the last two decades is extensive. The data taken over sixyears (1992-1995, and 1998, 1999) illustrated the following (figure 1):
1. Initially after the installation of GIPOP in 1992, significant improvements in GulfIsland Pond’s dissolved oxygen levels resulted immediately.2. There appears to be minimal additional incremental improvement in dissolved oxygentrends since 1993.3. About 10% of the pond volume does not meet class C minimum dissolved oxygencriteria in the more critical summers (93, 95, 99) of low flow and high water temperature.About 23% of the pond volume does not meet monthly average DO criteria of 6.5 ppm incritical summers.

Androscoggin River Modeling Report - May 2002DEPLW2001-11
Page 3
4. The Class C DO non-attainment is typically limited to that portion of the pond fourmiles upriver from the dam at depths of 35 to 70 feet.
5. Algae blooms occur every summer.
Gulf Island Pond is monitored continuously in the summer for dissolved oxygen andtemperature at Turner Bridge, 1.5 feet from the river bottom and above the dam off afloating module at depths of five, twenty, thirty-five, fifty, and sixty-three feet.Monitoring was formerly done off the face of the dam, but it was determined that thiswas not a good monitoring location. As a result the floating module system was installedin 1999. Some of the daily minimum dissolved oxygen data collected by the monitorprior to 1999 may not be representative of the actual water quality in most of the areasnear the dam. The dissolved oxygen readings just above the dam are of primary interestdue to the fact that this is where the D.O. sag point (location in the river of the lowestdissolved oxygen readings) usually occurs.
In addition to the continuous monitor data, DEP sampled the pond at seven to ninelocations from Turner Bridge to Gulf Island dam in the summers of 1992-95, 1998, 1999and 2000. The 1992 to 1995, 1998 and 1999 data were taken as a continuing effort toobserve water quality trends in the pond. Sampling was usually undertaken weekly fordissolved oxygen and temperature (taken as depth profiles), and some nutrient andchlorophyll a data was taken in 1998. The effort in 1999 involved twice weeklydissolved oxygen and temperature sampling and typically weekly chlorophyll a sampling.These data were taken in a summer when a 7-day 10-year low flow (7Q10) was nearlyreached. In addition, the GIPOP cooperative agreed to start GIPOP up earlier and inject25% more oxygen during the times of higher river temperature (>24 oC). The 1999 dataprovide valuable information regarding the factors that influence dissolved oxygen levelsin the Gulf Island Pond. It is discussed separately in the next section of this report.
In the summer of 2000, during the month of August, weekly sampling of the pond wasdone. Chlorophyll a, nutrients, ultimate BOD, and secchi depth data were collected atfive locations; four locations on the pond and one location at the inlet to the pond (TwinBridges at Rte 219), in addition to the dissolved oxygen and temperature profiles. The2000 data were collected primarily to calibrate a water quality model for algae andnutrient interactions on the pond and to determine their effect on dissolved oxygen.
The chlorophyll a data taken in the summers from 1998 to 2000 (Figure 2) oftenexceeded 8 ppb, indicating that algae blooms occurred each summer. The 1999 data bestillustrate dry weather conditions; in contrast, relatively wet summers were experienced in1998 and 2000. In the summer of 1999, the chlorophyll a levels were typically around 10to 30 ppb and peaked at 45 to 50 ppb. Total phosphorus and orthophosphorus weretypically in the range of 40 to 60 ppb and 20 to 30 ppb, respectively, in 1998 and 2000,easily supporting bloom conditions in a large impoundment. In the summer of 1999 nophosphorus data were taken, except on August 31, when a TP range of 58 to 82 ppb wasobserved in the pond.
Androscoggin River Modeling Report - May 2002DEPLW2001-11
Page 4
A number of studies involving the tracking of dye tracers were undertaken in the 1980’sby DEP and USGS to more fully understand the travel time of pollutants entering theAndroscoggin River. The results of these studies indicate that the cumulative river traveltime from Berlin, within a range of river flow of 5000 to 2000 cfs at Rumford are asfollows: two to three days to Rumford; three to five days to the Twin Bridges on route219 (the inlet to Gulf Island Pond); and seven to sixteen days to Gulf Island dam (Figure3). Hence under most summertime flow conditions the travel time within Gulf IslandPond ranges from four to eleven days over a distance of 14 miles. The river travel timefrom Berlin to pond inlet at Turner is only three to five days over a distance of 93 rivermiles.
Androscoggin River Modeling Report - May 2002DEPLW2001-11
Page 8
Summary of Summer 1999 Data
The 1999 data illustrate that during critical summers (high temperature and flowapproaching 7Q10), the deeper portions of Gulf Island Pond could remain chemicallystratified (poorly mixed vertically but without temperature gradient) for extended periodsof time. The stratification results in a partial mixing of bottom waters. The pond is mostsensitive to pollutant loadings during this stratified state. This limits the assimilativecapacity of the pond; accordingly, the low vertical transfer of dissolved oxygen to bottomwaters must be accounted for when representing the design “worse case” conditions forthe model prediction runs.
A stronger density gradient occurs at a depth of 58 to 66 feet near the dam, where athermal stratification occurs. Thermal stratification is defined as a change of at least 1oCper meter of vertical depth. The location where this occurs in the water column isreferred to as the thermocline. The waters above and below the thermocline are theepilimnion and hypolimnion, respectively. The hypolimnetic volume of Gulf Island Pondis usually less than 1% of the total pond volume. The difference between a chemicallystratified and thermally stratified water body can be explained as follows. In the former,there is some low level of vertical mixing, but in the latter, vertical mixing of chemicalconstituents (notably dissolved oxygen) for all practical purposes can be zero forextended time periods. The chemical stratification is a weak gradient that is more easilybroken up by minor meteorological or runoff events than a thermal stratification thatcould remained fixed for several weeks.
The percentage of the pond that does not meet DO criteria has historically been used as acomparative planning tool. The 1999 data were analyzed to determine the percentage ofpond volume that does not attain DO criteria. This process begins by first plotting thedissolved oxygen data taken biweekly from June 7 to September 14 on graphicalrepresentations of Gulf Island Pond for each sampling day (see appendix). Thepercentage of the total volume of the pond that did not attain minimum class C DOcriteria is calculated, and the non-attainment area on the graphical representations isrepresented by light gray shading. The thermocline is represented by a boldface heavyline. The volume of the pond that did not meet minimum class C DO criteria varied fromless than 1% to 10% of the total pond volume. The hypolimnetic volume is alsocalculated and was found to be usually < 1% of the total pond volume. The thermoclinetypically occurs at a depth of 58 to 66 feet. When the July data are averaged for theentire month, it can be deduced that 23% of the pond volume did not meet monthlyaverage DO criteria of 6.5 ppm.
The percentage of the pond that did not meet class C DO criteria (NA Volume) iscompared to the measured chlorophyll a levels taken over the entire summer (Figure 4).There appears to be a good correlation of NA Volume to chlorophyll a. The higherchlorophyll a levels usually occurred during time periods when there was larger volumeDO non-attainment. This could imply that the high levels of algae measured are acontributing factor to the DO non-attainment.

Androscoggin River Modeling Report - May 2002DEPLW2001-11
Page 9
The temperature of river water entering the pond as compared to the existing pondtemperature is an important factor describing pollutant transport mechanisms. When theincoming river water is warmer than the pond temperature, flow of the warmer less densewater is across the surface of the pond. There is minimal mixing of the deeper pondwaters under this condition, which typically results in a stratification and lower DO indeeper areas of the pond. In contrast, when the water temperature of incoming water iscooler than the pond temperature, the denser cooler water sinks closer to the pondbottom. Mixing of the deeper pond waters is promoted under this condition that typicallyresults in higher DO in the deeper areas of the pond.
The 1999 data can be used to illustrate this. The temperature of the river water that entersGulf Island Pond at Turner Bridge is compared to the water temperature at a depth of 50feet near Gulf Island dam and both are compared to the NA Volume (Figure 5). A depthof 50 feet is chosen, since that is the depth at the continuous DO / temperature monitor atthe dam where DO non-attainment first occurs.
In figure 5, the thicker boldface line represents the incoming water temperature at theTurner Bridge continuous monitor and the thinner line represents the temperature at adepth of 50 feet near the dam. When the thicker line is higher than the thinner one, riverflow of the warmer river water is sliding across the pond surface promoting both athermal and chemical stratification. It can be observed that the largest NA Volumetypically occurs during stratification periods. Conversely, when the thick line is belowthe thinner one, the incoming water is cooler and flow sinks to deeper parts of the pond.This promotes vertical mixing of the pond and a lower NA Volume is observed.
River flow can also be added as another comparison variable (Figure 6). The river flowwas relatively stable throughout the summer with limited runoff events. Flow dropped toa minimum level of 1730 cfs at the end of August, slightly higher than 7Q10 (1600 cfs).There appears to be little correlation of river flow to NA Volume. However, it can beobserved that runoff events probably played major roles in promoting the pond mixing.Large runoff events occurred in mid July and mid September, and a smaller runoff eventwas experienced in mid August just prior to the pond’s mixing. The cooler watertemperature that typically results following precipitation events together with theincreased river flow probably resulted in a mixing of the pond.
Finally the chlorophyll a data are compared to chemical stratification patterns (Figure 7).It can be observed that maximum chlorophyll a occurs during a state of pondstratification. During pond mixing the chlorophyll a levels typically decreased. This isdue to the added dilution obtained from mixing of the pond’s surface and bottom waters,increased river flow and the possibility that algae blooms are flushed out by the surge ofrunoff.
Androscoggin River Modeling Report - May 2002DEPLW2001-11
Page 14
Water Quality Model
A water quality modeling analysis of the Androscoggin River from Berlin, NH, toLewiston, ME, was undertaken by DEP. This involves two separate modeling efforts; theuse of a steady state, one-dimensional model (Qual2EU) for the upper Androscoggin; andthe use of a multi-dimensional, time variable model (WASP) for Gulf Island Pond. Mostof this effort in this report focuses on the modeling of Gulf Island Pond with WASP(Water Quality Analysis Simulation Program).
The application of mathematical modeling techniques to water quality problems hasproven to be a powerful tool in water resource management. As a diagnostic tool itpermits the abstraction of a highly complex real world. Realizing that no one can everdetail all the physical phenomena that comprise our natural world, the modeler attemptsto identify and include only the phenomena, be they natural or man-made, that arerelevant to the water quality problems under consideration. As a predictive tool,mathematical modeling permits the forecasting and evaluation of the effects of changes inthe surrounding environment on water quality. Some water quality problems are of sucha complex nature that mathematical models provides the only real means for predictingthe source of impacts and possible management alternatives to correct problems withinthe limits of the model’s assumptions and precision.
The modeling analysis for the Androscoggin River involves two separate efforts. Sincethe data have always shown that water quality chemistry in the upper Androscoggin(Berlin to Turner) is uniform both vertically and laterally, the model simulation here is asteady state, one-dimensional analysis. The model Qual2EU was used for this effort.
Conversely Gulf Island Pond’s water quality varies vertically. For example, thedissolved oxygen levels are typically lower as measurements get deeper along a verticalprofile. The differences, vertically, are important, but they cannot be accounted for usinga one-dimensional analysis such as QuaL2EU. For this reason, the model, WASP, wasused to simulate water quality conditions in Gulf Island Pond. Both Qual2EU and WASPare EPA supported models. The models are linked by using the water quality at the endof the Qual2EU simulation for the initial boundary conditions of the WASP simulation ofGulf Island Pond.
The kinetic representation of the WASP model is quite complex and mathematicallyrelates the relevant factors to dissolved oxygen production and depletion. A flow chartrepresentation of the model (Figure 7a) details the many processes involved. The“sources and sinks” of dissolved oxygen include algae growth and respiration, which inturn are driven by light and nutrient interactions, carbonaceous BOD decay, nitrification,atmospheric reaeration, sediment oxygen demand, sediment nutrient sources (fluxes), andthe settling of particulate portions of pollutants. The model includes input sections forpoint and non-point sources of pollution, and upstream and downstream boundaries.
The modeling analysis undertaken by DEP and the GIPOP cooperative from 1980 to1985 was used as a basis for setting up the model structure. The upper Androscoggin
Androscoggin River Modeling Report - May 2002DEPLW2001-11
Page 15
was segmented into 16 reaches (Figure 8). Gulf Island Pond was segmented into 60reaches (Figure 9). In the former effort by consultants to the GIPOP cooperative, GulfIsland Pond was segmented into 123 reaches. DEP does not feel that this level of detail isnecessary and hence the reduction of segmentation, which also results a less burdensomemanagement of the model output.
A flow balance is typically calculated for a modeling analysis whenever there is asignificant change of drainage area over the modeled stretch, and the river flow is likelyto change from the initial upstream boundary conditions. The portion of theAndroscoggin considered for the modeling effort is 107 miles long and the drainage areaincreases from 1200 square miles in Berlin to 2863 square miles at Gulf Island dam.Historic gaging information from USGS was used whenever possible. Gaginginformation is available on the Androscoggin River at Gorham, Rumford, and Auburnand on the following tributaries; the Wild River, Ellis River, Swift River, NezinscotRiver, and Little Androscoggin River. The larger tributaries were generally inputted intothe model as point sources and the smaller tributaries inputted as distributed incrementalflow. A drainage area adjustment at 7Q10 of 0.086 cfs /mi2 was calculated fromavailable gaging data for tributaries without gaging information (Table 1).
Androscoggin River Modeling Report - May 2002DEPLW2001-11
Page 20
Calibration of Gulf Island Pond Chemical Data
The data collected in the summer of 2000 were used as a basis for re-calibrating a waterquality model of Gulf Island Pond. Older data (1984) were used for model verification.Satisfactory results were obtained when comparing a match of modeled Vs observed forvarious chemical parameters. The calibration / verification process is typicallyundertaken to give the model greater reliability when predicting “worse case” waterquality conditions.
Since the non-attainment of dissolved oxygen in the Androscoggin is limited to GulfIsland Pond, the modeling discussed in this report is an effort focused primarily on thepond. For the most part, parameter rate inputs to the model of the Upper Androscogginwas not changed, except for the addition of nutrient and algae interactions. The inputs tothe Qual2EU model were thoroughly checked to assure that they are now consistent withpresent day conditions. In some cases point source inputs were changed to reflect currentlicensed values.
Algae as phytoplankton, is generally not a significant contributor to the dissolved oxygendepletion in the upper Androscoggin. As a result, most of the changes to the Qual2EUmodel are not deemed to be significant and are not discussed in this report. (The oneexception to this statement is the dissolved phosphorus uptake rate, which is discussedlater in the report.) For a description of the Qual2EU parameter rate inputs used in themodel, one should consult Table 2.
The data collected in August of 2000 are used for model re-calibration of Gulf IslandPond. Whenever possible, the parameter rates used in the former effort were used. Insome cases, the older rates were not well documented. Some minor changes from the1980’s effort are noted. First is the 2000 data set re-calibrated BOD decay rate of 0.03per day (1984 rate 0.05 per day). The algae settling rate of 0.5 meter/day is higher thanthe older rate of 0.5 ft/day. A summary of all the model parameter rates together with therationale used to assign the rates is explained in Table 2.
When simulating algae and nutrients with a model, a continuous effort over a long timeperiod is often needed to successfully account for the variability that typically occurs inthis environment. River flow (Figure 10), chlorophyll a, nutrients, and dissolved oxygenlevels were all highly variable in the month of August 2000. To account for thisvariability, WASP was run in a time variable mode over the entire month of August. Themodel re-calibration of the August 2000 data is plotted for carbonaceous BOD (CBOD),total nitrogen (TN), total phosphorus (TP), chlorophyll a (CHLA), and dissolved oxygen(DO). The calibration is usually a time series plot of individual sampling locations.
The CBOD calibration was initially problematic due to the fact that the laboratory BODtest measures algal respiration that is not included in the model output for CBOD. (Thedissolved oxygen depletion for respiration is accounted for in the model in another way.)An adjustment was made to the data and hence the term “corrected” in the calibrationplots. The following equation was used to correct the measured CBOD:
Androscoggin River Modeling Report - May 2002DEPLW2001-11
Page 21
CBODc = CBODL - PHYT X 2.67where 2.67 = oxygen / carbon ratio
PHYT = Phytoplankton as carbon (ppm)CBODL = Laboratory uncorrected CBOD in ppm (CBOD + respiration)CBODc = Corrected CBOD in ppm
The CBOD data are plotted as both corrected and uncorrected. A fair calibration occurs,considering the variability in river flow during the first two weeks of August. A decayrate of 0.03 per day gave the best results (figure 11). The laboratory bottle decay rate forthe August-00 BOD samples was also 0.03 per day. In quiescent velocity situations suchas those experienced in Gulf Island Pond, the laboratory decay rates and actual decayrates are often the same. Hence the bottle decay rate, in itself, can be used as justificationfor the assignment of the BOD decay rate. The difference between the 2000 BOD decayrate (.03 per day) and the 1984 BOD decay rate (.05 per day) can best be explained by themuch lower level of BOD experienced in 2000. The BOD decay rate generally becomeslower as pollution levels are reduced.
The calibration of algae was complicated due to the high variability in light conditionsand river flow, which resulted in a high variability of CHLA and nutrients. In the middleof August, there was a large runoff event and low light conditions from an extendedperiod of cloud cover. This resulted in lower than normal chlorophyll a levels in GulfIsland Pond on the 8/15 and 8/21 sampling days, during a pond mixing event. Timefunctions were derived for the model input for both river flow and light as solar radiation.River flow at the Rumford gage was provided by USGS and estimates of the inflow toGulf Island Pond by Western Hydro. For light conditions, Mead Westvaco PaperCompany provided solar radiation data that could directly be inputted into the model as atime function (Figure 12). This resulted in a satisfactory model calibration of CHLA(Figure 13).
The model calibration for nutrients is displayed as TN and TP (Figures 14,15). There is agood fit of modeled to measured values. Phosphorus values initially outputted by themodel were consistently high in comparison to measured values. An additional uptakecomponent of orthophosphorus (PO4-P) had to be added. (The organic–P from the modelwas within measured values but it was the PO4-P that was consistently high.) This wasaccomplished by adding a settling component for PO4-P. Although dissolved solids donot ordinarily settle, other studies have shown that PO4-P can attach onto solids throughadsorption. A settling rate of 0.5 m/day, the same rate used for all other parameters, wasinput to the model which subsequently resulted in a satisfactory fit of modeled tomeasured TP values
The BOD decay rate, reaeration rate, and the vertical dispersion rate were the mainparameters adjusted to achieve a calibration of dissolved oxygen. The vertical dispersionwas adjusted to achieve the proper distribution of dissolved oxygen vertically. A timefunction was needed to simulate the very variable conditions of vertical mixing thatoccurred in Gulf Island Pond in August of 2000 (Figure 9a). At the beginning of August,

Androscoggin River Modeling Report - May 2002DEPLW2001-11
Page 22
the pond was chemically stratified resulting in the assignment of low rates of verticaltransfer. In the middle of August, a large runoff event occurred which resulted in anearly complete mixing of the pond. A high rate of vertical transfer was needed tosimulate the mixing caused by the increased river flow (Figure 16). At the end ofAugust, Gulf Island Pond entered into a less stratified condition than was experiencedearlier that month.
Different rates of vertical transfer had to be assigned to some of the model reaches (18,19, 23, 24, 41, 42, 43) near the bottom of the pond. Model reaches (41,42,43) at thebottom of the deep hole near the dam typically needed very low rates of vertical transfer.This area of the pond is in or near the hypolimnion below the thermocline that is formednear the dam. The density gradient formed by the thermal stratification experienced hereis very resistant to mixing and hence the low rate of vertical transfer. During thebeginning of August, the dissolved oxygen readings in the hypolimnion of Gulf IslandPond were anaerobic. The hypolimnion often remains this way for a majority of thesummer. (The hypolimnion typically is only 1% of the total volume of the pond.) A rateof zero vertical transfer was used to simulate these conditions. In contrast, during therunoff event experienced in the middle of August, it appears that a large slug of coolerwater sank to the pond bottom right up to the dam resulting in a vertical mixing of thepond. A very high rate of vertical tranfer (20 cm2/sec) was needed to simulate thisphenomena.
Another portion of Gulf Island Pond that appears to be very resistant to mixing is an areanear the pond bottom in the vicinity of Lower Narrows and stretching down toward thedam. This area is represented by model reaches 19, 23, and 24. The depth of Gulf IslandPond changes abruptly here and this physical characteristic appears to affect mixing nearthe pond bottom. This often results in very low dissolved oxygen in the bottom 5 to 10feet from Lower Narrows to the dam. To simulate this lower dissolved oxygen, it wasnecessary to assign lower rates of vertical transfer here than most of the other modeledreaches. The rates assigned here were typically higher than those assigned for thesimulation of thermal stratification, except during the runoff event.
The model calibration of dissolved oxygen is undertaken as a continuous model run overthe entire month of August at the two monitor locations (Turner Bridge and Gulf Islanddam) and also on individual sampling days (8/9, 8/15, 8/31). The calibration plot atTurner Bridge (Figure 17) results in a good match of modeled to measured values andindicates that the assumed boundary inputs of dissolved oxygen at Twin Bridges arereasonable. Calibration plots at the dam are displayed at 5, 35, and 63-foot depths(Figure 18) and indicate a good match of modeled to measured dissolved oxygen. Thedata taken on the individual sampling days along the entire pond longitudinally at eightlocations are also checked for model calibration and again good match results (Figures19a,b,c). These data are early morning readings representing the daily minimum DO, andto be consistent with the model output, must be adjusted to the daily average DO. Adiurnal adjustment was derived from the continuous monitor data at Turner Bridge andGulf Island dam that was specific to those sampling days. The diurnal adjustment of 0.3

Androscoggin River Modeling Report - May 2002DEPLW2001-11
Page 23
ppm was added to the early morning data, which was identical for those three samplingdays.
Although the 1984 data were calibrated in the previous modeling effort, the recentstructure changes and additions of algae and nutrient interaction made verification of themodel with this data necessary. The 1985 modeling effort was a steady state analysisover a two-week period. Light was directly measured in the field and could be input as atime function (Figure 6a). For the phosphorus calibration (displayed as PO4-P), a ratherhigh settling rate (2.0 m/sec) had to be assigned to receive a calibration of PO4-P (figure20). The CBOD decay rate of 0.05 per day used in the 1984 analysis gave the best resultsfor the CBOD (figure 20) and dissolved oxygen calibration. The previously calibratedvertical dispersion rate of 7.5 cm2/sec could be used in all reaches except thoserepresenting the thermal stratification near the dam (model reaches 41,42,43). Here avertical dispersion rate of 1 cm2/sec was necessary. A good fit of dissolved oxygen wasobtained (figure 20a).
Androscoggin River Modeling Report - May 2002DEPLW2001-11
Page 39
Orthophosphorus Uptake Rate
In impoundments or quiescent velocity situations, phytoplankton, or floating algae are theprimary algae experienced. In shallower river systems, algae that attach to the riverbottom are the primary algae experienced. Phosphorus is utilized in the growth ofphytoplankton and bottom attached algae. Riverine systems may also experience theuptake of dissolved phosphorus, which is primarily orthophosphorus (PO4-P), in excessof that quantity needed for growth. Hence PO4-P uptake could be very rapid andsignificant in situations where bottom attached algae are abundant. As previouslyexplained, some PO4-P uptake could also occur by settling, which involves dissolvedphosphorus attaching to particulate matter through adsorption
It is necessary to account for PO4-P uptake in the Upper Androscoggin. The uptakewould represent phosphorus that is assimilated in the river before reaching Gulf IslandPond. This phenomenon was not accounted for in the earlier modeling effort of theAndroscoggin River. The uptake rate is usually quite variable according to a number offactors. For example, if a number of consecutive cloudy days were experienced, theuptake would be less than that experienced under maximum sunlight. Although theassignment of this rate is difficult, it was determined the error introduced in the modelingby the assignment of this rate in the upper Androscoggin model should be less thanassuming no PO4-P uptake occurs. For example, with no PO4-P uptake, for given pointsource inputs of phosphorus, the modeling would be predicting much more phosphorusentering Gulf Island Pond, than what actually occurs. This would also result in aprediction of higher phytoplankton in the pond than what actually occurs.
The older data taken in 1982 and 1984 are used to estimate phosphorus uptake in theAndroscoggin River from Berlin to the entrance of Gulf Island Pond. It can be seen thatwith no uptake, the model output for PO4-P is consistently higher than measured PO4-P(dashed lines, Figure 21). Although Qual2EU currently does not have the capability tomodel bottom attached algae directly, orthophosphorus uptake can still be accounted forin the river bottom as a negative PO4-P flux. (MDEP is currently having the programstructure to Qual2EU adapted through EPA support so that attached algae can bemodeled in the future.) PO4-P uptake rates of 0.25 and 0.50 mg/ft2-day resulted in agood match of measured PO4-P to modeled values, respectively for the August 1982 and1984 data sets (figure 21).
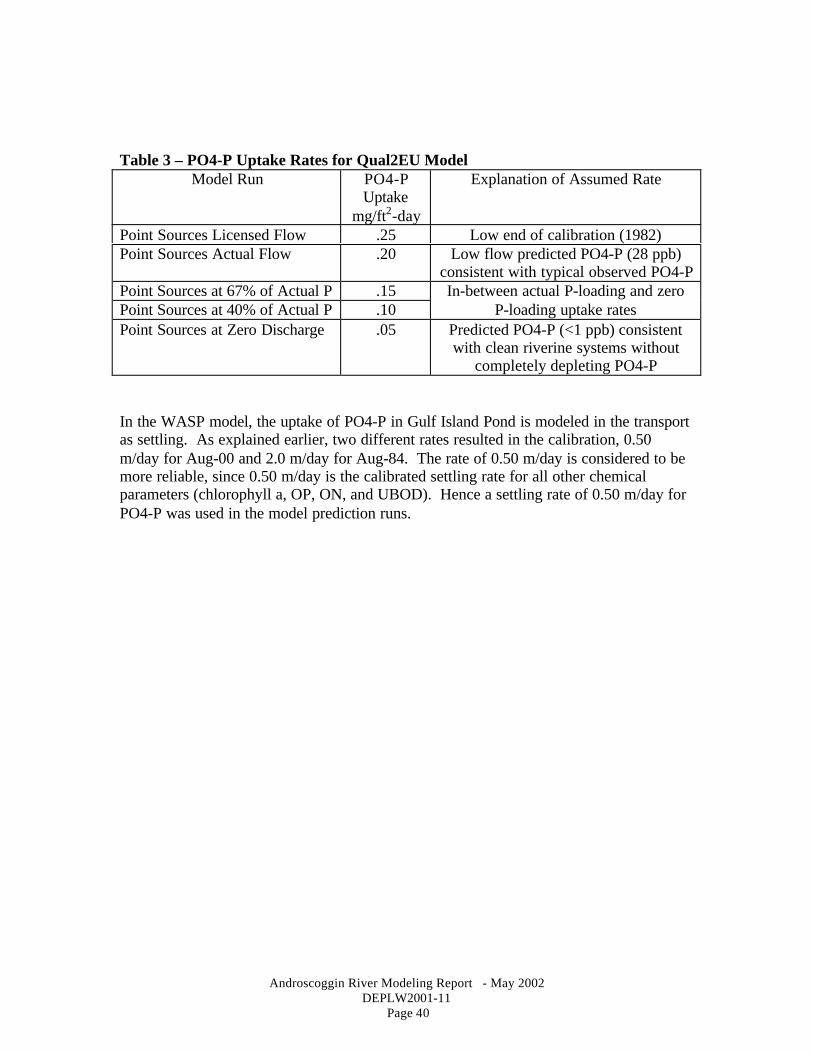
Since the uptake of PO4-P is quite variable, some conservatism must be used whenassigning this rate in the model prediction runs. If phosphorus is reduced through pointsource controls, the population of bottom attached plants will be reduced and P-uptakewill subsequently also be reduced. Hence the rates assigned in the model prediction runsare as follows:
Androscoggin River Modeling Report - May 2002DEPLW2001-11
Page 40
Table 3 – PO4-P Uptake Rates for Qual2EU ModelModel Run PO4-P
Uptakemg/ft2-day
Explanation of Assumed Rate
Point Sources Licensed Flow .25 Low end of calibration (1982)Point Sources Actual Flow .20 Low flow predicted PO4-P (28 ppb)
consistent with typical observed PO4-PPoint Sources at 67% of Actual P .15Point Sources at 40% of Actual P .10
In-between actual P-loading and zeroP-loading uptake rates
Point Sources at Zero Discharge .05 Predicted PO4-P (<1 ppb) consistentwith clean riverine systems without
completely depleting PO4-P
In the WASP model, the uptake of PO4-P in Gulf Island Pond is modeled in the transportas settling. As explained earlier, two different rates resulted in the calibration, 0.50m/day for Aug-00 and 2.0 m/day for Aug-84. The rate of 0.50 m/day is considered to bemore reliable, since 0.50 m/day is the calibrated settling rate for all other chemicalparameters (chlorophyll a, OP, ON, and UBOD). Hence a settling rate of 0.50 m/day forPO4-P was used in the model prediction runs.
Androscoggin River Modeling Report - May 2002DEPLW2001-11
Page 42
Analysis of Origin of Sediment Oxygen Demand
Another important consideration in the model prediction runs is the assignment of thesediment oxygen demand (SOD) rate. The input of more or less pollutant loads into GulfIsland Pond should also proportionally affect the SOD rate. As discussed later in thereport, the SOD is the most significant cause to dissolved oxygen depletion in the deeperportion of the pond. How the SOD rate changes with different pollutant load inputs wasnot addressed in the initial modeling effort of the 1980’s. Although the calculation of theexpected changes of the SOD rate is inexact, it was determined that not addressing thisfactor results in introducing more error into the modeling analysis.
An analysis was undertaken to determine the sources of SOD and best actions to reduceSOD. This analysis shows that a majority of the SOD (85%) can be accounted for bycurrent inputs. Current point source inputs are estimated to be responsible for about 46%of the measured SOD. About 65% of the SOD can be accounted for by the settling anddecay of algae. Reduction of algae through point source phosphorus controls appears tobe the most promising action to reduce SOD. Point sources are responsible for about90% of the phosphorus entering the pond.
The SOD rate is typically assigned using two considerations; measurement and the modelcalibration of dissolved oxygen. Direct measurement is difficult. The SOD test involvescollecting sediment cores in a number of locations. Oxygen depletion over time isobserved at the laboratory in a water column over the sediment. There are many issuesthat make direct measurement an unprecise process. Some of these include: obtaining asundisturbed a sample as possible, the highly variable conditions of the sediment substrate,and the relatively small sample size of the pond bottom that the sediment cores represent.
The SOD measurement is regarded as a rough estimate of the actual SOD rate. It is astarting point in the calibration / verification process. The model rate of SOD that isneeded to obtain a match of modeled to observed DO should not be largely different thanthe measured rate, but some variation is considered acceptable.
In the past, it has always been assumed that given the prior severe polluted state of theAndroscoggin River, the sediment oxygen demand was largely related to historicaccumulations of sediment. However, more than two decades have passed since theinitiation of secondary treatment at all point source discharges on the AndroscogginRiver. In this time period, if all SOD was of historic origin, there should have been asignificant reduction over time. Both the trend of the DO data taken in the pond over the1990’s together with limited SOD data taken in 1998 indicate that SOD has probablyreached an equilibrium with current pollution sources. As discussed earlier, the DO datataken after the installation of GIPOP (1992), and the initial immediate improvementsobserved, indicate a trend of no significant subsequent improvement. The SOD ratemeasured in 1998 was actually 50% higher than an average of data taken in the early1980’s.

Androscoggin River Modeling Report - May 2002DEPLW2001-11
Page 43
The apparent higher present day SOD could possibly be explained by data scatter that isexpected in the SOD measurements.
Historic accumulations may not be the most important source of SOD anymore, and ananalysis of how current pollution source may influence SOD is necessary. An analysisconsidered the settling of pollutants in Gulf Island Pond as both total suspended solids(TSS) annually, and phytoplanktonic algae seasonally. It is well documented that lakeswith algae blooms typically have low DO in their deeper areas due to SOD andrespiration and die-off of settling algae. The seasonality of the exertion of the SOD ratemust also be considered.
This analysis must be done both within and outside the WASP modeling framework.Model runs are made to determine the portions of algae and TSS that settle to the pondbottom. Then a spreadsheet is set up that calculates the SOD that should result from thesettled pollutants.
SOD from TSS
The modeling of TSS requires accounting for several seasonal considerations. A higherremoval rate in Gulf Island Pond would be expected during the summer. A portion ofTSS is particulate BOD and similarly has a BOD decay rate (Kd) associated with itsbiodegradation. Hence in the summer, a greater loss of TSS occurs in the upperAndroscogggin above Gulf Island Pond than in non-summer. In the non-summer, loss ofTSS in the upper Androscoggin is minimal, resulting in higher TSS concentrationsentering at the pond inlet. Paper mill discharges, a large source of TSS (35% of total),typically discharge more solids in the non-summer than summer. There is also the issueof how river flow and water temperature vary seasonally.
It was decided that an annual analysis accounting for the mentioned seasonal variationsmust be undertaken to properly account for the TSS contribution to the pond’s SOD rate.TSS that settles to the pond bottom in the winter, although it would not exert a significantsediment oxygen demand immediately, would remain intact to contribute to the SOD thefollowing summer. The similarity of monthly average historic temperature (Gulf Islanddam monitor) and flow (USGS Gage Rumford) data resulted in the following groupingsby months: Dec-March; June; July-Sept, Oct-Nov. (Table 7). For the months of Apriland May, the average flow at Rumford is 7700 cfs, more than double that of the other tenmonths. It was decided that settling would be minimal under spring high flow conditionsand could be neglected.
A critical step in this process is determining an appropriate settling rate to assign to TSS.Historic data taken in 1989 as part of a study on color, odor, and foam (COF) were usedto calibrate a settling rate. In the COF study, the Androscoggin River was typicallysampled once a week for TSS at many locations. Point source TSS inputs and non-pointsource TSS inputs as tributaries were also measured. The sampling began in early Juneand continued into mid-September, so both low flow and runoff periods were included.A TSS removal rate (Kr) of 0.10 per day was calibrated from a summer average of all this

Androscoggin River Modeling Report - May 2002DEPLW2001-11
Page 44
data (Figure 22). (Kr = Kd + Ks, where Kd is the rate of decay and Ks is the rate ofsettling.) The removal rate is used to determine the amount of TSS lost from the point ofinput to the inlet of Gulf Island Pond. A run with QUAL2eu is done to determine TSSremoval above Gulf Island Pond. Point sources were input at the average amountdischarged from 1998 to 2000 and specific to the four time periods.
Once pollutants enter Gulf Island Pond, the difference between the decay and settling ofTSS must be determined. Temperature correction factors need to be applied to the ratesof removal, decay, and settling. Default temperature corrections (θ) were applied to thecalibrated rates of Kr = .10 and Kd = .03, which resulted in θ”s of 1.047 and 1.024 fordecay and settling, respectively, as summarized in the following equation.
Xt = X20 * θ (t-20) where Xt is the corrected rate at the local temperature, tX20 is the calibrated rate at 20oC
The settling rate is determined by the difference of the temperature-corrected removaland decay rates. This resulted in settling rates from about 0.05 and 0.07 per day in thesummer and non-summer, respectively (Table 7).
Table 4 Model Runs For TSS AnalysisAve Flow (cfs) Temp Corrected Rates
Gorham RumfordAve Temp
Qual Kr WASP Kd Wasp KsDec-Mar 2201 3057 0.6 0.063 0.012 0.051
April-May 4100 7710 9.5 No Settling Assumed
June 2816 3947 19.1 0.098 0.029 0.069
July- Sept 1984 2420 22 0.104 0.032 0.072
Oct-Nov 2050 3049 8.5 0.076 0.018 0.058
A series of model runs were made to determine the amount of setting that occurs in thepond in each time period. The portion of TSS that settles can be determined by acomparison of the pond inlet and outlet TSS in the model run (the decay is set at zero).The amount of SOD that occurs can than be calculated by the following equation:
SOD (gm/m2-day) = (Tc) x (TSSs) x (BOD/TSS) x (Unit) / (BA)WhereTc =Temperature Correction Factor = 1.77 = Normalized annual average
water temperature (10.2 oC to 20 oC). using θ = 1.06.TSSs =TSS that has settled in ppd.BOD/TSS = 0.4 Determined by field data Dec 2001 (Table 5).Unit = Unit Conversion (lb to gm) = 454
= 0.4 Determined by field data Dec 2001 (Table 5).BA = Bottom area in m2
Androscoggin River Modeling Report - May 2002DEPLW2001-11
Page 45
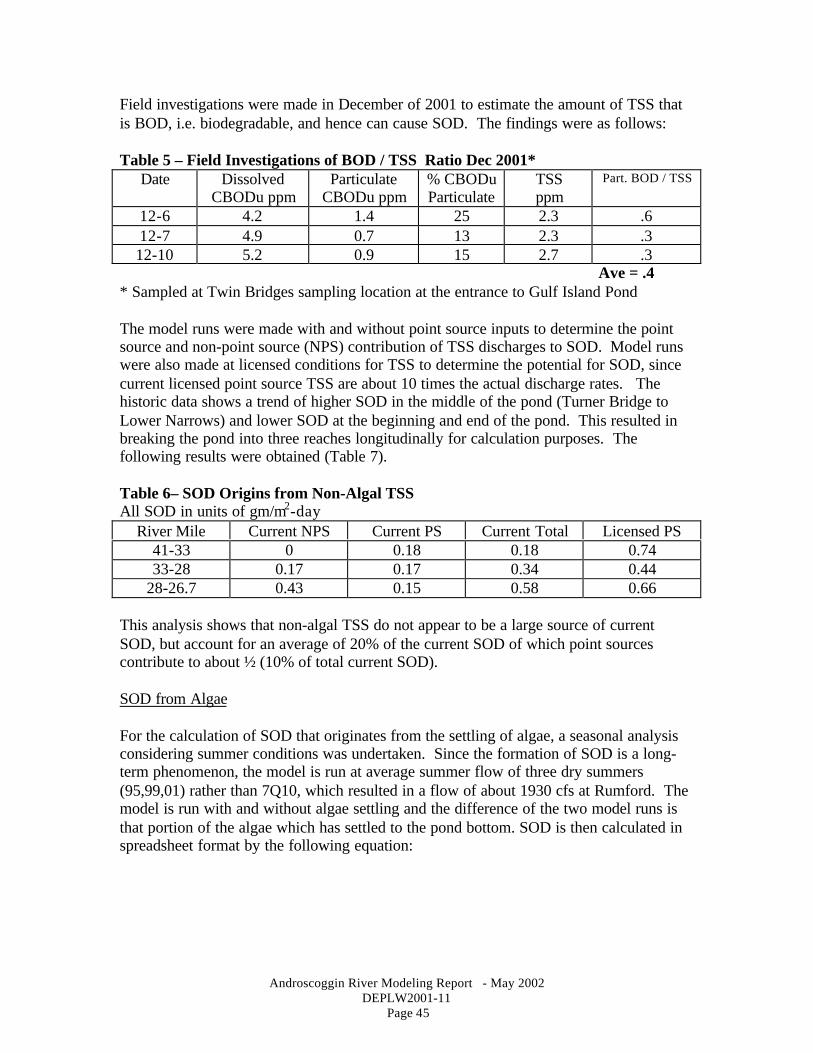
Field investigations were made in December of 2001 to estimate the amount of TSS thatis BOD, i.e. biodegradable, and hence can cause SOD. The findings were as follows:
Table 5 – Field Investigations of BOD / TSS Ratio Dec 2001*Date Dissolved
CBODu ppmParticulate
CBODu ppm% CBODuParticulate
TSSppm
Part. BOD / TSS
12-6 4.2 1.4 25 2.3 .612-7 4.9 0.7 13 2.3 .312-10 5.2 0.9 15 2.7 .3
Ave = .4* Sampled at Twin Bridges sampling location at the entrance to Gulf Island Pond
The model runs were made with and without point source inputs to determine the pointsource and non-point source (NPS) contribution of TSS discharges to SOD. Model runswere also made at licensed conditions for TSS to determine the potential for SOD, sincecurrent licensed point source TSS are about 10 times the actual discharge rates. Thehistoric data shows a trend of higher SOD in the middle of the pond (Turner Bridge toLower Narrows) and lower SOD at the beginning and end of the pond. This resulted inbreaking the pond into three reaches longitudinally for calculation purposes. Thefollowing results were obtained (Table 7).
Table 6– SOD Origins from Non-Algal TSSAll SOD in units of gm/m2-day
River Mile Current NPS Current PS Current Total Licensed PS41-33 0 0.18 0.18 0.7433-28 0.17 0.17 0.34 0.44
28-26.7 0.43 0.15 0.58 0.66
This analysis shows that non-algal TSS do not appear to be a large source of currentSOD, but account for an average of 20% of the current SOD of which point sourcescontribute to about ½ (10% of total current SOD).
SOD from Algae
For the calculation of SOD that originates from the settling of algae, a seasonal analysisconsidering summer conditions was undertaken. Since the formation of SOD is a long-term phenomenon, the model is run at average summer flow of three dry summers(95,99,01) rather than 7Q10, which resulted in a flow of about 1930 cfs at Rumford. Themodel is run with and without algae settling and the difference of the two model runs isthat portion of the algae which has settled to the pond bottom. SOD is then calculated inspreadsheet format by the following equation:
Androscoggin River Modeling Report - May 2002DEPLW2001-11
Page 46
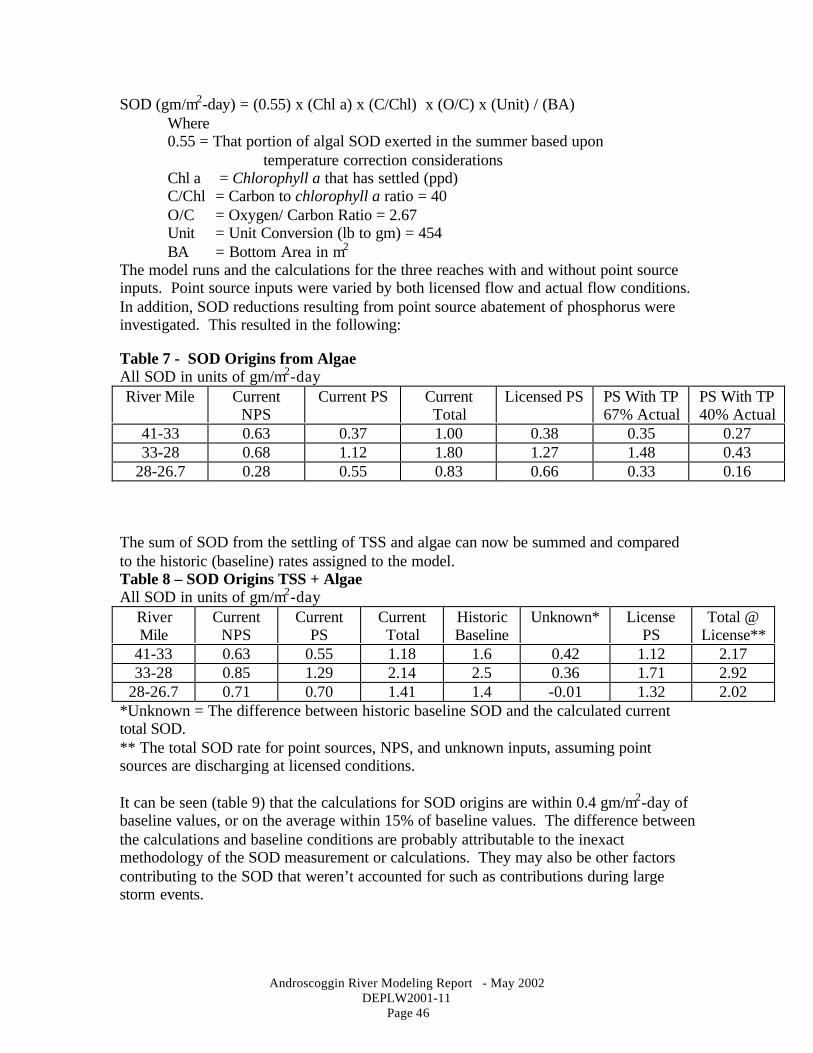
SOD (gm/m2-day) = (0.55) x (Chl a) x (C/Chl) x (O/C) x (Unit) / (BA)Where0.55 = That portion of algal SOD exerted in the summer based upon temperature correction considerationsChl a = Chlorophyll a that has settled (ppd)C/Chl = Carbon to chlorophyll a ratio = 40O/C = Oxygen/ Carbon Ratio = 2.67Unit = Unit Conversion (lb to gm) = 454BA = Bottom Area in m2
The model runs and the calculations for the three reaches with and without point sourceinputs. Point source inputs were varied by both licensed flow and actual flow conditions.In addition, SOD reductions resulting from point source abatement of phosphorus wereinvestigated. This resulted in the following:
Table 7 - SOD Origins from AlgaeAll SOD in units of gm/m2-dayRiver Mile Current
NPSCurrent PS Current
TotalLicensed PS PS With TP
67% ActualPS With TP40% Actual
41-33 0.63 0.37 1.00 0.38 0.35 0.2733-28 0.68 1.12 1.80 1.27 1.48 0.43
28-26.7 0.28 0.55 0.83 0.66 0.33 0.16
The sum of SOD from the settling of TSS and algae can now be summed and comparedto the historic (baseline) rates assigned to the model.Table 8 – SOD Origins TSS + AlgaeAll SOD in units of gm/m2-day
RiverMile
CurrentNPS
CurrentPS
CurrentTotal
HistoricBaseline
Unknown* LicensePS
Total @License**
41-33 0.63 0.55 1.18 1.6 0.42 1.12 2.1733-28 0.85 1.29 2.14 2.5 0.36 1.71 2.92
28-26.7 0.71 0.70 1.41 1.4 -0.01 1.32 2.02*Unknown = The difference between historic baseline SOD and the calculated currenttotal SOD.** The total SOD rate for point sources, NPS, and unknown inputs, assuming pointsources are discharging at licensed conditions.
It can be seen (table 9) that the calculations for SOD origins are within 0.4 gm/m2-day ofbaseline values, or on the average within 15% of baseline values. The difference betweenthe calculations and baseline conditions are probably attributable to the inexactmethodology of the SOD measurement or calculations. They may also be other factorscontributing to the SOD that weren’t accounted for such as contributions during largestorm events.

Androscoggin River Modeling Report - May 2002DEPLW2001-11
Page 47
In summary, when the origins of SOD are considered by source type, about 46% of theSOD can be accounted for by point sources; 39% by non-point and/or natural sources,and 15% by unknown sources (Figure 23). If point sources were continuouslydischarging at maximum licensed conditions, the current SOD could potentially increaseby 27% (Figure 23). When the origins of SOD are considered by pollutant parameters,about 65% can be accounted for by the settling of algae, 20% by non-algal TSS, and 15%by unknown sources (figure 24).
When assigning the SOD rate for the model prediction runs (figure 25), unknown sourceswere grouped with NPS/ natural sources to derive a zero discharge condition of pointsources. The SOD rate assigned at these conditions averaged about 54% of baselineconditions. With point sources at licensed conditions, the SOD rate averaged about 27%higher than baseline conditions. Finally for the phosphorus abatement conditionsinvestigated, the SOD rate averaged about 79% and 90% of baseline conditions for 40%and 67% of actual point TP, respectively.
Androscoggin River Modeling Report - May 2002DEPLW2001-11
Page 52
Water Quality Model Prediction Runs
The summary of the model predictions indicate that if point sources were to discharge atcurrent licensed limits and with GIPOP at full capacity, DO non-attainment of themonthly average criteria (6.5 ppm) would occur throughout the Androscoggin River fromJay to Gulf Island Dam, a distance of 28 miles. Monthly average DO criteria would notbe met in 72% of the volume of Gulf Island Pond and daily minimum DO criteria in 55%of the pond volume. Model predictions with BOD and TSS of point source discharges atactual levels indicate that DO non-attainment of the monthly average criteria and dailyminimum criteria would occur in about 20% and 11% of the pond volume, respectively,and could be limited to a distance of 4 miles. If all point sources were at zero discharge,the DO non-attainment of both the monthly average criteria (6.5 ppm) and dailyminimum criteria (5 ppm) would be limited to 1% of the total pond volume. Finally itcan also be concluded that GIPOP makes a large difference in improving the pond’s DOlevels.
After the water quality model is calibrated to observed data, worst case conditions aresimulated to assure dissolved oxygen criteria will be achieved at all locations. Worsecase conditions are defined by:1. low river flows, when dilution of wastewater inputs is at a minimum;2. high water temperatures, when the saturation of dissolved oxygen is lower and BOD
decay and oxygen demand from the sediment are higher; and3. maximum inputs (point sources discharging at licensed limits).
Two tests are run with the water quality model to check dissolved oxygen compliancewith statutory criteria; one to test compliance of class C minimum dissolved oxygencriteria (5 ppm and 60% of saturation) and a second to test compliance with the monthlyaverage criteria of 6.5 ppm.
When considering the daily minimum DO criteria, the water quality model’s predictionof dissolved oxygen is a daily average and must be adjusted outside the model frameworkto obtain a daily minimum DO. A regression equation was derived from the chlorophylla data and the continuous monitor data (figure 21). There are two considerations for adiurnal fluctuation of DO; one related to algae photosynthesis and respiration and anotherdue to variability not related to algae. The algal component of daily DO variation shouldresult in the daily minimum DO occurring in the early AM (after an evening of limitedlight results in respiration and net oxygen depletion), and maximum DO occurring in theafternoon (after extended daylight results in photosynthesis and net oxygen production).
The continuous monitor diurnal fluctuation of the minimum and maximum DO did notalways occur in the early AM and mid-afternoon, respectively, indicating other non-algalfactors are effecting the diurnal variation in addition to the algae. The monitor readingsin the early AM and mid afternoon were considered as the algal component of daily DOvariation. The difference between the actual monitor daily minimum and maximum DOand the algal component of daily DO variation is the component of non-algal daily DOvariation. This can be summarized as follows:

Androscoggin River Modeling Report - May 2002DEPLW2001-11
Page 53
DO (Total) = DO (algae) + DO (Non-algae)whereDO (Total) = The difference between the daily maximum and minimum monitor DODO (Algae) = The difference between the early morning and mid afternoon daily monitor DO
The regression equation calculates the algal component of daily DO variation as afunction of chlorophyll a. The regression is as follows:
DO (Algae) = .03 x (chl a) + 0.22 where chl a is in ppb and DO in ppm.
In addition, a non-algal diurnal component was calculated from the median difference ofDO (Total) and DO (Algae). This diurnal variation due to causes other than algae isestimated to be 0.8 ppm.
DO (Non-Algae) = 0.8 ppm
The diurnal adjustment applied to the model output of daily average DO is one-half thediurnal range and the following equation is applied to the model prediction of chl a :
Diurnal DO Adjustment = ½ x DO (Total) = 0.015 x (chl a) + 0.51
This equation is applied to the surface model segments (top 10 feet of depth) only, wherealgal photosynthesis is significant. Since the model predictions and available data alwaysshow adequate DO occurs in surface segments, the diurnal adjustment applied here isgenerally not a factor in making regulatory decisions.
In the subsurface segments the median monitor diurnal range at 20, 35, and 50 footdepths was consistently around 0.8 ppm in the summers from 1998 to 2000. Hence adiurnal adjustment of 0.4 ppm (DO Non-Algae) was applied to subsurface segments.
Point source inputs used in the model prediction runs are summarized as licensed (Table10) and actual discharge conditions (Table 11). The actual discharge conditions werecalculated for paper mills as a 95% confidence interval of a log-normal distribution fromthree years (98-00) of discharge monitoring reports (DMR’s). This is a representation ofthe upper limit of what the treatment plants are actually discharging and is usually quite abit less than license values (what the plants are currently allowed to discharge). ). Formunicipal discharges, which represent a very small portion of the TSS and BOD, actualdischarge conditions were calculated as an average discharge over 98-00. The designconditions used for the model prediction runs and numeric class C DO criteria, whichmust be met are summarized in Table 12. A representation of licensed, actual, andaverage values of BOD and TSS for the three paper mill discharges for the summer andnon-summer is summarized in Table 13.
The model prediction runs are first made at three different assumed conditions. The first(Run 1) examines the predicted dissolved oxygen in Gulf Island Pond with all pointsources at licensed flow and BOD. This run is used to check compliance with the class C

Androscoggin River Modeling Report - May 2002DEPLW2001-11
Page 54
statutory requirements and gives potential worse case DO levels. The second (Run 2)examines point sources at actual discharge levels. This predicts what the actual dissolvedoxygen levels in the pond currently are and how much of the pond is achieving class Ccriteria. The third (Run 0) examines a model prediction of dissolved oxygen levels in thepond assuming no point sources are discharging to the Androscoggin River above GulfIsland Pond. Finally, the model runs are made without the oxygenation diffuser, GIPOP(suffix a is with GIPOP; suffix b is without GIPOP).
Model prediction runs are also made for four major alternatives explored to improve thepond’s DO levels. Run 3 examines the predicted DO with point source TP reduced to67% of actual levels and with point source BOD and TSS at actual levels. Run 4examines the predicted DO with point source total phosphorus (TP) reduced to 40% ofactual levels and with point source BOD and TSS at actual levels. Runs 5a, b, and cinvestigates additional point source BOD and TSS discharges levels of 10%, 25%, and50% of actual discharge in addition to reducing point source TP to 40% of actual. Run 6investigates adding an additional oxygen diffuser at Lower Narrows (see schematics) atthe two point source TP discharge levels investigated (40% and 67% of actual).
The runs are summarized in tabular form (Table 14) and as plotted in schematicrepresentations of Gulf Island Pond. The areas of non-attainment are shaded in light grayand the corresponding model predicted dissolved oxygen (ppm) is displayed in allportions of the pond. The total volume of the pond not meeting dissolved oxygen criteriais calculated.
In order to simplify the modeling process and the interpretation of the model results, thesimulation was done as steady state. In all model runs the thermocline was assumed tooccur at 60 feet of depth. Hence a moderately low level of vertical mixing was used thatcould potentially occur over a longer period of time (several days). This resulted inmodel vertical dispersion inputs of 0.35 cm2 /sec for most reaches and .10 cm2/sec for thepoorer mixed reaches. As mention previously, the SOD rates and PO4-P uptake rateswere assigned as suggested earlier in this report. For the BOD decay rate, a rate of 0.05was assigned for licensed point source conditions and a rate of 0.03 per day forconditions of actual point source BOD or less. The BOD decay rate generally decreaseswith decreasing discharge and these two assigned rates are consistent with the 1984 and2000 calibrations. Assigning rates lower than 0.03 was not considered appropriate, sincea rate lower than 0.03 per day has never been experienced in any of Maine’s waters. Theresults obtained with the model are as follows.
Run 0a - Point sources at levels of zero discharge with GIPOP at full capacity• Daily minimum DO criteria (5 ppm) are met in entire pond volume (Figure 27).• Monthly average DO criteria (6.5 ppm) is met everywhere except in areas
hydraulically isolated by thermal stratification (length of 1 rivermiles and 1% pond volume) (Figure 28).
• Maximum chlorophyll a of 2 ppb and the entire length of the pond is under the algaebloom threshold of 8 ppb (Figure 41).

Androscoggin River Modeling Report - May 2002DEPLW2001-11
Page 55
Run 0b - Point sources at levels of zero discharge without GIPOP• Daily minimum DO criteria (5 ppm) not met for a length of 3 river miles and 10% of
pond volume (Figure 29).• Monthly average DO criteria (6.5 ppm) not met for a length of 4 river miles and 29%
of pond volume (Figure 30).• Maximum chlorophyll a of 2 ppb and the entire length of the pond is under the algae
bloom threshold of 8 ppb (Figure 41).
Run 0d – Paper Mills at levels of zero discharge, municipal WWTP at actual levels withGIPOP at full capacity• Daily minimum DO criteria (5 ppm) not met for a length of 1 river mile and 1% of
pond volume. This result is similar to Run 0a (zero discharge all point sources).• Maximum chlorophyll a of 7 ppb and the entire length of the pond is under the algae
bloom threshold of 8 ppb (Figure 41). However no phosphorus allocation is availablefor paper mill discharges.
Run 1a - Point sources at licensed limits with GIPOP at full capacity• Daily minimum DO criteria (5 ppm) not met for a length of 13 river miles and 55% of
pond volume (Figure 31).• Monthly average DO criteria (6.5 ppm) not met for a length of 38 river
miles and 72% of pond volume (Figure 32).• Maximum chlorophyll a of 19 ppb and length of 8 miles exceeds the algae bloom
threshold of 8 ppb (Figure 41).
Run 1b - Point sources at licensed limits without GIPOP• Daily minimum DO criteria (5 ppm) not met for a length of 14 river miles and 64 %
of pond volume.• Monthly average DO criteria (6.5 ppm) not met for a length of 38 river
miles and 86% of pond volume.• Maximum chlorophyll a of 19 ppb and length of 8 miles exceeds the algae bloom
threshold of 8 ppb (Figure 41).
Run 2a - Point sources at actual discharge levels with GIPOP at full capacity• Daily minimum DO criteria (5 ppm) not met for a length of 4 river miles and 11% of
pond volume (Figure 33).• Monthly average DO criteria (6.5 ppm) not met for a length of 4 river
miles and 20% of pond volume (Figure 34).• Maximum chlorophyll a of 17 ppb and length of 7 miles exceeds the algae bloom
threshold of 8 ppb (Figure 41).
Run 2b - Point sources at actual discharge levels without GIPOP• Daily minimum DO criteria (5 ppm) not met for a length of 6 river miles and 20% of
pond volume (Figure 33).• Monthly average DO criteria (6.5 ppm) not met for a length of 6 river
miles and 54% of pond volume (Figure 34).
Androscoggin River Modeling Report - May 2002DEPLW2001-11
Page 56
• Maximum chlorophyll a of 17 ppb and length of 7 miles exceeds the algae bloomthreshold of 8 ppb (Figure 41).
Run 3a - Point sources at actual levels except TP at 67% of actual levels with GIPOP atfull capacity• Daily minimum DO criteria (5 ppm) not met for a length of 4 river miles and 7% of
pond volume (Figure 35).• Monthly average DO criteria (6.5 ppm) not met for a length of 5 river
miles and 15% pond volume (figure 36).• Maximum chlorophyll a of 12 ppb and length of 4.5 miles exceeds the algae bloom
threshold of 8 ppb (Figure 41).
Run 3b - Point sources at actual levels except TP at 67% of actual levels without GIPOP• Daily minimum DO criteria (5 ppm) not met for a length of 6 river miles and 40% of
pond volume.• Monthly average DO criteria (6.5 ppm) not met for a length of 6 river
miles and 54% pond volume.• Maximum chlorophyll a of 12 ppb and length of 4.5 miles exceeds the algae bloom
threshold of 8 ppb (Figure 41).
Run 4a - Point sources at actual levels except TP at 40% of actual levels with GIPOP atfull capacity• Daily minimum DO criteria (5 ppm) not met for a length of 4 river miles and 6% of
pond volume (Figure 37).• Monthly average DO criteria (6.5 ppm) not met for a length of 4 river
miles and 9% pond volume (Figure 38).• Maximum chlorophyll a approaching 8 ppb and the entire length of the pond is under
the algae bloom threshold of 8 ppb (Figure 41).
Run 4b - Point sources at actual levels except TP at 40% of actual levels without GIPOP• Daily minimum DO criteria (5 ppm) not met for a length of 6 river miles and 37% of
pond volume.• Monthly average DO criteria (6.5 ppm) not met for a length of 6 river
miles and 54% pond volume.• Maximum chlorophyll a approaching 8 ppb and the entire length of the pond is under
the algae bloom threshold of 8 ppb (Figure 41).
Run 5a - Point Sources at 40% of actual TP and 10% of actual BOD/TSS with GIPOP atfull capacity• Daily minimum DO criteria (5 ppm) not met for a length of 1 river mile and 1% of
pond volume (Figure 39).• Monthly average DO criteria (6.5 ppm) not met for a length of 4 river
miles and 4% pond volume (Figure 40).• Maximum chlorophyll a approaching 8 ppb and the entire length of the pond is under
the algae bloom threshold of 8 ppb (Figure 41).

Androscoggin River Modeling Report - May 2002DEPLW2001-11
Page 57
Run 5b - Point Sources at 40% of actual TP and 25% of actual BOD/TSS with GIPOP atfull capacity• Daily minimum DO criteria (5 ppm) not met for a length of 2 river mile and 2% of
pond volume (Figure 39).• Monthly average DO criteria (6.5 ppm) not met for a length of 4 river
miles and 4% pond volume (Figure 40).• Maximum chlorophyll a approaching 8 ppb and the entire length of the pond is under
the algae bloom threshold of 8 ppb (Figure 41).
Run 5c - Point Sources at 40% of actual TP and 50% of actual BOD/TSS with GIPOP atfull capacity• Daily minimum DO criteria (5 ppm) not met for a length of 3 river miles and 4% of
pond volume (Figure 39).• Monthly average DO criteria (6.5 ppm) not met for a length of 3 river
miles and 6% pond volume (Figure 40).• Maximum chlorophyll a approaching 8 ppb and the entire length of the pond is under
the algae bloom threshold of 8 ppb (Figure 41).
Run 6a - Point sources at actual levels except TP at 67% of actual levels. Oxygeninjection rates of 45000 and 90000 PPD, respectively, at Upper and Lower Narrows.• Daily minimum DO criteria (5 ppm) not met for a length of 1 river mile and 1% of
pond volume.• Monthly average DO criteria (6.5 ppm) not met for a length of 1 river
mile and 1% pond volume.• Maximum chlorophyll a of 12 ppb and length of 4.5 miles exceeding the algae bloom
threshold of 8 ppb (Figure 41).
Run 6b - Point sources at actual levels except TP at 40% of actual levels. Oxygeninjection rates of 35000 and 70000 PPD, respectively, at Upper and Lower Narrows.• Daily minimum DO criteria (5 ppm) not met for a length of 1 river mile and 1% of
pond volume.• Monthly average DO criteria (6.5 ppm) not met for a length of 1 river
mile and 1% pond volume.• Maximum chlorophyll a approaching 8 ppb and the entire length of the pond is under
the algae bloom threshold of 8 ppb (Figure 41).
Data taken in the summer of 1999 can be compared to the model predictions of pointsources at actual discharge levels (Run 2a). This can be regarded as another calibrationcheck of the water quality model. The model’s prediction of DO non-attainment ofminimum criteria (11% of the volume of the pond) compares well to the measured DOnon-attainment of the 1999 data (10% of pond volume, figure 42). The model’sprediction of DO non-attainment of monthly average criteria (20% of the volume of thepond) also compares well to the measured DO non-attainment of the 1999 data (23% ofpond volume, figure 43).
Androscoggin River Modeling Report - May 2002DEPLW2001-11
Page 79
Model Component Analysis of Impacts to Gulf Island Pond
In a modeling component analysis, different potential factors are tested to determine themost significant pollutants that contribute to dissolved oxygen depletion. The componentanalysis reveals that sediment oxygen demand and point source discharges continue to bethe most significant factors affecting dissolved oxygen levels on Gulf Island Pond. Sincecurrent point source discharges are also contributing to sediment oxygen demand, pointsource controls should be an effective strategy for improving the water quality of GulfIsland Pond. GIPOP is an effective mechanism for obtaining compliance with dissolvedoxygen criteria in the upper half of the water column near the dam. In the deeper half ofthe water column, the effectiveness of GIPOP becomes diminished due to the difficultyof transferring the benefits of GIPOP to deeper waters.
This analysis is accomplished by individually subtracting each component of impact, andobserving the difference from a base case in the model’s prediction of higher dissolvedoxygen. Point sources were inputted at actual discharge levels for the base case at 7Q10river flow. The components of impact that were tested for the modeling of dissolvedoxygen on Gulf Island Pond are as follows: sediment oxygen demand, algalphotosynthesis and respiration, point source carbonaceous biochemical oxygen demand(CBOD), and non-point and natural CBOD. Although not an impact, the addition ofoxygen with GIPOP is also tested by observing the difference in the model’s predictionof lower dissolved oxygen without its input. Components of impact are computed atdifferent depths in 10-foot increments and averaged over the river from Lower Narrowsto Gulf Island Dam, a distance of about 3 river miles. This length is significant in thatmost of the DO non-attainment occurs here.
The results of the component analysis are plotted for each individual component both asdissolved oxygen impacts in ppm (Figure 44) and percentage comparisons (Figure 45).The two most significant contributors to dissolved oxygen depletion in Gulf Island Pondare sediment oxygen demand and point source inputs. SOD and point source inputs areresponsible for about 60% to 70% and 20% to 40%, respectively, of the DO depletion.
As would be expected, the impact from SOD results in an increasing DO depletion aswater depth increases. The DO depletion due to SOD ranges from 1 ppm five feet fromthe water surface to 6.8 ppm five feet from the bottom (65-foot depth). The DO depletiondue to point source CBOD inputs ranges from 0.7 ppm five feet from the water surface to1.9 ppm five feet from the bottom (65-foot depth).
The contribution of DO due to GIPOP is most efficient at depths of 25 to 45 feet rangingfrom 2.6 to 3.2 ppm. At a depth of 5 feet the contribution of DO from GIPOP is reducedto 1.1 ppm, probably due to atmospheric losses. At a depth of 65 feet, there is negligiblecontribution from GIPOP, due to thermal stratification. It is interesting to note that whereGIPOP can offset the impact due to SOD, DO criteria are usually met (surface to 35 footdepth), and where it cannot (45 foot depth to bottom), DO criteria are not met.

Androscoggin River Modeling Report - May 2002DEPLW2001-11
Page 80
The relative contribution of pollutant loads entering Gulf Island Pond are compared in piechart diagrams (Figure 46). In this analysis, point sources were inputted at actualdischarge levels. It can be observed that the majority of total suspended solids (TSS)originate from non-point and natural sources (64%), followed by paper mill point sources(35%), and municipal point sources (1%). When considering CBOD loads entering GulfIsland Pond, paper mill point source discharges account for about 83%; non-point andnatural inputs account for about 15%, and municipal point source discharges account forabout 2%. When considering total phosphorus loads entering the pond, the paper millpoint source discharges account for about 77%; municipal point source dischargesaccount for about 13%, and non-point and natural sources account for about 10%.

Androscoggin River Modeling Report - May 2002DEPLW2001-11
Page 84
Model Sensitivity Analysis
In a model sensitivity analysis, different parameter rates are tested to determine whichones are the most important. A model sensitivity analysis was undertaken on the SODrate, mill BOD inputs, and GIPOP oxygen injection rates. The results indicate that theSOD rate is the most important parameter, and oxygen injection is second. Mill BODinputs are less important, but still significant when assessing the impact of oxygendepletion in Gulf Island Pond.
The results of the sensitivity analysis are plotted on graphical representations of GulfIsland Pond (Figures 47 to 49). The change that results in the predicted model DO byreducing the calibrated rate in 50% increments can be observed. The magnitude of thechange determines the parameter’s sensitivity or importance when making regulatorydecisions.
The results indicate that sediment oxygen demand is the most sensitive parameter tested,especially in the deeper reaches where the non-attainment of DO criteria most frequentlyoccurs. At the bottom reach of Lower Narrows (RM 29.5), for example, the modelresponse of predicted DO is as much as 4 ppm for each 50% incremental reduction inSOD.
The model response in predicted DO is less sensitive to mill BOD inputs. The predictedDO change for each 50% reduction of mill BOD was slightly over 1 ppm in the moresensitive model reaches where the DO non-attainment occurs.
Finally, the sensitivity of the model to varying inputs of oxygen injection at GIPOP wastested. The model response to reductions of oxygen injection was in-between that ofSOD and mill BOD reductions. (Lower response than SOD but higher response than millBOD). In the deeper reaches immediately below GIPOP where the DO non-attainmentoccurs, the model response of predicted DO typically ranged from 1 to 2 ppm for each50% reduction of oxygen injection.
Androscoggin River Modeling Report - May 2002DEPLW2001-11
Page 88
Analysis of Hydropower Operation at Gulf Island Dam
An analysis was undertaken to determine whether or not the mode of operation of thehydropower facility at Gulf Island dam is contributing to the low dissolved oxygen ofbottom waters in the pond. Through both modeling and an examination of data, it wasdetermined that the hydropower operation is not having a significant impact.
River flow from the hydropower facility at Gulf Island dam is currently controlled in astore and release mode. This means that during the release mode, generation flows oroutflow from Gulf Island Pond often exceeds inflow resulting in a lowering of the waterlevel. The storing mode is needed to re-fill the pond while still maintaining an adequateminimum flow to support water quality standards in the Androscoggin River below GulfIsland Pond. In the storing mode, no power generation typically occurs.
A non-generating minimum flow of 1450 cfs (to be exceeded in the storing mode) isproposed for the FERC re-licensing. This minimum flow has recently been maintainedfrom Gulf Island dam, even though it is not yet required. Another issue that is examinedis whether or not operating the hydropower project in a store and release mode ratherthan run of river mode is negatively impacting the pond’s dissolved oxygen levels duringthe storing period. There are two possibilities that should be examined.
1. Does the cycling of river flow result in a hydraulic isolation of bottom waters of thepond?
2. Is the dissolved oxygen impacted due to factors such as increased river time of travelthrough the pond?
To answer the first question, plots of inflow, outflow, and the monitored dissolvedoxygen at the dam were compared at the deeper pond areas (35 and 50 foot depth). Theredid not appear to be any consistent pattern of lower DO during extended periods ofminimum flow. At times, the DO decreased, but at other times it increased. Since theexpected response would be a consistent decrease of DO during extended minimum flowperiods, the conclusion reached was that minimum flow releases of 1450 cfs did notappear to affect dissolved oxygen of bottom waters.
A model run was made to help answer the second question. A run was made assuming5.5 hours of generation outflow of 3300 cfs and a minimum flow release of 1450 cfs forup to three days. This operation appears to be consistent with how the hydropower plantis operated during low flow periods. A difference in DO of only 0.1 ppm lower waspredicted by the model as compared to a base case in which a steady state flow of 1700cfs is maintained. It is concluded that since the minimum flow is already similar to 7Q10flow (1700 cfs), the impact from dissolved oxygen due to the cycling of flow isnegligible.
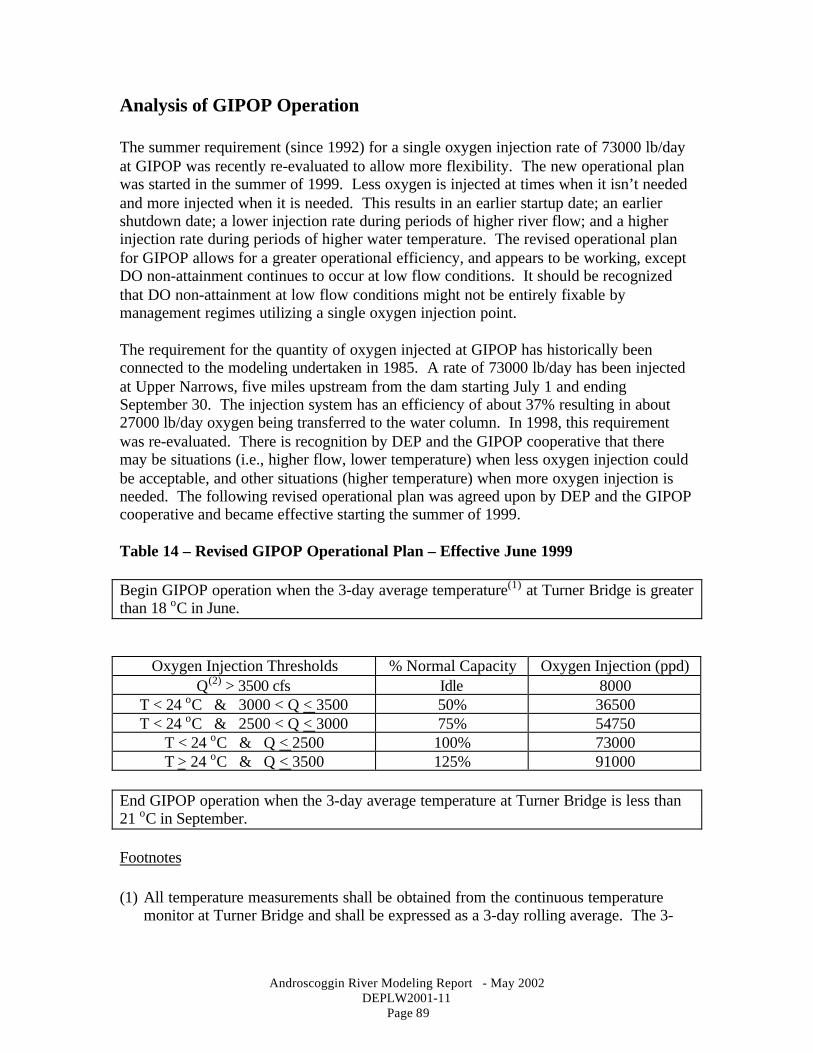
Androscoggin River Modeling Report - May 2002DEPLW2001-11
Page 89
Analysis of GIPOP Operation
The summer requirement (since 1992) for a single oxygen injection rate of 73000 lb/dayat GIPOP was recently re-evaluated to allow more flexibility. The new operational planwas started in the summer of 1999. Less oxygen is injected at times when it isn’t neededand more injected when it is needed. This results in an earlier startup date; an earliershutdown date; a lower injection rate during periods of higher river flow; and a higherinjection rate during periods of higher water temperature. The revised operational planfor GIPOP allows for a greater operational efficiency, and appears to be working, exceptDO non-attainment continues to occur at low flow conditions. It should be recognizedthat DO non-attainment at low flow conditions might not be entirely fixable bymanagement regimes utilizing a single oxygen injection point.
The requirement for the quantity of oxygen injected at GIPOP has historically beenconnected to the modeling undertaken in 1985. A rate of 73000 lb/day has been injectedat Upper Narrows, five miles upstream from the dam starting July 1 and endingSeptember 30. The injection system has an efficiency of about 37% resulting in about27000 lb/day oxygen being transferred to the water column. In 1998, this requirementwas re-evaluated. There is recognition by DEP and the GIPOP cooperative that theremay be situations (i.e., higher flow, lower temperature) when less oxygen injection couldbe acceptable, and other situations (higher temperature) when more oxygen injection isneeded. The following revised operational plan was agreed upon by DEP and the GIPOPcooperative and became effective starting the summer of 1999.
Table 14 – Revised GIPOP Operational Plan – Effective June 1999
Begin GIPOP operation when the 3-day average temperature(1) at Turner Bridge is greaterthan 18 oC in June.
Oxygen Injection Thresholds % Normal Capacity Oxygen Injection (ppd)Q(2) > 3500 cfs Idle 8000
T < 24 oC & 3000 < Q < 3500 50% 36500T < 24 oC & 2500 < Q < 3000 75% 54750
T < 24 oC & Q < 2500 100% 73000T > 24 oC & Q < 3500 125% 91000
End GIPOP operation when the 3-day average temperature at Turner Bridge is less than21 oC in September.
Footnotes
(1) All temperature measurements shall be obtained from the continuous temperaturemonitor at Turner Bridge and shall be expressed as a 3-day rolling average. The 3-
Androscoggin River Modeling Report - May 2002DEPLW2001-11
Page 90
day rolling average is defined as the arithmetic mean of the daily maximum andminimum temperatures over any given consecutive three-day period.
(2) All flow measurements shall be obtained from the USGS gage at Rumford and shallbe expressed as a consecutive 3-day rolling average of daily average flow values.
The revised operational plan results in both an earlier startup and also an earlier shutdownof GIPOP by two to three weeks. The earlier startup is needed to improve late June andearly July DO. After the first to second week in September, the pond is typically mixedand water temperature is cooler, so that the oxygen from GIPOP is not needed. The datataken at the dam continuous monitor has shown that the most severe DO non-attainmenttypically occurs when water temperature exceeds 24 oC. Periods of higher watertemperature are also more likely to result in pond chemical stratification, which results inlow DO in the deeper waters.
The relaxation of injection requirements at higher river flows is being tried on anexperimental basis. The data at the dam monitor is being used to determine whether ornot the lower injection rates are adequate. DO readings at the monitor indicate that classC criteria can be met down to a depth of 35 feet but at a depth of 50 feet some non-attainment is still experienced. The modeling indicates that the effectiveness of thecurrent oxygen injection system becomes greatly diminished at depths of greater than 45feet. Hence the relaxation of injection requirements at higher flows does not appear to bethe cause of this non-attainment. The non-attainment of DO in the deeper areas of thepond will be addressed in the TMDL.

Appendix Graphical Representations of 1999 DO Non-Attainment
Hydropower Inflow / Outflow Plots Compared to DissolvedOxygen