anderson stockley · 1 anderson stockley accredited training ltd maths workbook - questions this is...
TRANSCRIPT

1
Anderson Stockley Accredited Training Ltd
MATHS WORKBOOK - Questions
This is NOT a TEST ... it is just you learning.
You may use a calculator for any questions
NAME……………………………………………………………………………………………………

2
CONTENTS
Numbers Page 3
1 Dealing with numbers tasks Page 6
Mean, Mode, Median and Range Page 9
2 Mean, Mode, Median and Range tasks Page 11
Perimeter, Area and Volume Page 12
3 Perimeter, Area and Volume tasks Page 16
Fractions Page 18
Percentages Page 22
Decimals, Fractions and Percentages (Conversions) Page 25
4 Decimals, Fractions and Percentages tasks Page 29
Charts and Graphs Page 32
5 Charts and Graphs tasks Page 37
Frequency Distribution Page 40
Probability Page 42
6 Probability tasks Page 45
7 Maths crossword Page 46
Acknowledgements:
www.mathsisfun.com
www.bbc.co.uk/bitesize
www.primaryresources.co.uk
www.pearsonschoolsandfecolleges.co.uk
www.ncfe.org.uk/functional-skills

3
Numbers
Place Value We write numbers using only ten symbols (called Digits).
The Ten Digits The Digits we use today are called "Hindu-Arabic Numerals" and look like these:
0 1 2 3 4 5 6 7 8 9 The value of each digit in a number depends on its position in the number, its place value. So, where we PLACE a digit is important!
Names for Each Column These are the names of each column:
Millions Hundred-Thousands
Ten-Thousands
Thousands Hundreds Tens Ones
Example: The number eleven thousand, three hundred and twenty seven in a place value table:
Ten-Thousands
Thousands Hundreds Tens Ones
1 1 3 2 7
The Number 11,327
You write this number as 11 327 or 11,327.

4
Large numbers are often rounded. To round a number: Count along to the last digit that is needed. If the next digit is 5, 6, 7, 8 or 9, round the last digit up. If the next digit is 0, 1, 2, 3 or 4, leave the last digit. Example 1: 27 687 people watch a rugby match. Round this number to the nearest thousand.
28000
A newspaper reported that approximately 150 000 people attended the Glastonbury festival in 2005. What are the possible values of the attendance?
Assume the number is rounded to the nearest ten thousand. You can show the rounded number on a number line:
145000 155000
140000 150000 160000
Answer: Between 145,000 and 155,000
Remember
A billion is one thousand million.
1 billion = 1 000 000
000 or 109
Remember A loss or overdraft is a negative amount of
money.
Remember A profit or credit is a
positive amount of
money.

5
Negative numbers are used for:
■ temperatures below zero
■ heights below sea level
■ company losses
■ overdrawn bank accounts.
To find the difference between two numbers:
If the signs are the same, subtract the numbers. If the signs are different, add the numbers. Example 1: A minimum temperature of –88°C was recorded in Antarctica. Moscow recorded one of their lowest overnight temperatures of –31°C. What is the difference between the two temperatures? The lower of the two temperatures is –88°C. Sketch a number line. -31
88 – 31 31
-88 88 0
The signs are the same. You find the difference by subtracting: 88 – 31 = 57.
Answer: 57 degrees Example 2: A girl has an overdraft of £20 on her bank account. How much must she pay in, so that the balance is £75?
The overdrawn balance is – £20. You find the difference by adding: 20 + 75 = 95.
Answer: £95

6
1 Dealing with Numbers Task
For the number 2768, what does the 2 mean?
A B C D
2 Units 2 Tens 2 Hundreds 2 Thousands
A large company announces annual profits of £23 billion. Write the number 23 billion in figures.
Our galaxy contains roughly 250 000 000 000 stars. How many billion is this?
One of the largest lotto wins was £22 590 829. Round this amount to the nearest £100 000
A population of 3.5 million bacteria increases by 488 000. How many bacteria are there now?
On one night in London the temperature fell to 12°C. On the same night in Moscow the temperature fell to –5°C. What was the difference in temperature?
A boy started the month with a balance of –£25 in his bank account. He paid £120 out of his account during the month but did not put any money into his account. What was his balance at the end of the month?

7
How much is someone worth?
Plan A) What is the problem I am trying to solve? B) What information do I need to find? C) What is the maths I need to do? D) What form will my answer be? E) What assumptions have I made? F) Could I have solved the problem in another way?
Would you rather have a column of £1 coins as
tall as you, or a collection of 5p pieces
as heavy as you?
It may be helpful to know that the thickness of a £1 coin is 3.15mm, and a 5p coin weighs 3.25g
1 foot = 12 inches
1 stone = 14lbs
Use a person who is 5' 5" tall, who weighs 9st 7lbs.
1inch = 3.39cm
1lb = 453.59grms

8
Your answers
A)
B)
C)
D)
E)
F)
What is the result? (Rounded to the nearest £)

9
Mean, Median, Mode and Range The mean, median and mode are types of average. The range gives a measure of the spread of a set of data.
This section revises how to calculate these measures for a simple set of data. It then goes on to look at how the measures can be calculated for a table of data.
Calculating the Mean, Median, Mode and Range for simple data The table below shows how to calculate the mean, median, mode and range for two sets of data. Set A contains the numbers 2, 2, 3, 5, 5, 7, 8 and Set B contains the numbers 2, 3, 3, 4, 6, 7.
Measure
Set A 2, 2, 3, 5, 5, 7, 8
Set B 2, 3, 3, 4, 6, 7
The Mean
To find the mean, you need to add up all the data, and then divide
this total by the number
of values in the data.
Adding the numbers up gives: 2 + 2 + 3 + 5 + 5 + 7 + 8 = 32
There are 7 values, so you divide the total by 7: 32 ÷ 7 = 4.57...
So the mean is 4.57
(2 d.p.)
Adding the numbers up gives: 2 + 3 + 3 + 4 + 6 + 7 = 25
There are 6 values, so you divide the total by 6: 25 ÷ 6 = 4.166...
So the mean is 4.17
(2 d.p.)
The Median
To find the median, you
need to put the values in order, then find the middle value. If there
are two values in the
middle then you find the mean
of these two values.
The numbers in order: 2 , 2 , 3 , (5) , 5 , 7 , 8
The middle value is marked in brackets, and it is 5.
So the median is 5
The numbers in order: 2 , 3 , (3 , 4) , 6 , 7
This time there are two values in the middle. They have been put in brackets. The median is found by calculating the mean of these two values: (3 + 4) ÷ 2 = 3.5
So the median is 3.5
The Mode The data values: The data values:

10
The mode is the value
which appears the most
often in the data. It is possible to have more than one mode if there is more than one value
which appears the most.
2 , 2 , 3 , 5 , 5 , 7 , 8
The values which appear most often are 2 and 5. They both appear more time than any of the other data values.
So the modes are 2 and 5
2 , 3 , 3 , 4 , 6 , 7
This time there is only one value which appears most often - the number 3. It appears more times than any of the other data values.
So the mode is 3
The Range
To find the range, you first need to find the lowest and highest
values in the data. The range
is found by subtracting
the lowest value from the
highest value.
The data values: 2 , 2 , 3 , 5 , 5 , 7 , 8
The lowest value is 2 and the highest value is 8. Subtracting the lowest from the highest gives: 8 - 2 = 6
So the range is 6
The data values: 2 , 3 , 3 , 4 , 6 , 7
The lowest value is 2 and the highest value is 7. Subtracting the lowest from the highest gives: 7 - 2 = 5
So the range is 5
Remember
A tip to remember Mean It is the ‘mean, nasty’ maths question
because it makes you do 2 calculations –
Addition and Division.
Remember
A tip to remember Mode Remember to use the first to letters to
remind you that you are looking for
the most often occurring number.
Remember
A tip to remember Median It sounds like ‘medium’, so is not small
or large but in the middle once the numbers are in order.
Remember
A tip to remember Range It is the difference between the smallest and biggest amount or number. Think of a range of
mountains and how far you would need to climb from the smallest to the
biggest mountain.

11
2 Mean, Mode, Median and Range Tasks
Which measure of average requires you to put the data in numerical order?
Mean Mode Median
Which measure of average can have more than one value?
Mean Mode Median
Take a look at this series of numbers: 25, 21, 12, 14, 8, 19, 17, 12
What's the mean?
What is the median?
What is the mode?
What is the range?
A booklet has 12 pages with the following numbers of words:
271, 354, 296, 301, 333, 326, 285, 298, 327, 316, 287 and 314
What is the mean number of words per page?
A) 307 B) 311 C) 309 D) 313

12
Perimeter, Area and Volume
The perimeter of a shape is the distance around its boundary. This is a length, and is said to have dimension (1D).
Example
An ant walks all the way around the edge of a rectangle, measuring by .
What distance will it have travelled?
Perimeter
Rectangles and Squares (Area)
A way to find the area of a rectangle is to multiply its length by its width.
The formula is:
Remember
When calculating the perimeter,
remember to include the length of
every side.

13
Compound shapes (Perimeter)
Sometimes shapes can be more complicated. Be particularly careful to add up the lengths of every side when you work out the total perimeter.
Perimeter
In some cases you’ll need to calculate the 'missing' lengths, e.g. and in the question below.
A plan of a play area is shown below:
a) Calculate the length of and .
b) Calculate the perimeter of the play area.
a) The length of the play area is , so .
The width of the play area is , so .
b)Perimeter
.

14
Compound Shapes (Area)
There are two different methods for finding the area of a compound shape:
Method 1 Divide the shape into squares and rectangles, find their individual areas and then add them together.
The length of the larger rectangle is
Method 2 Imagine the shape as a large rectangle with a section cut out. The length of the outer rectangle is
Find the area of the large rectangle ( ) and then subtract the part that has been cut out ( )

15
Volume of a cuboid
To find the volume of a cuboid, multiply its length by its width by its height. This can be written as:
Example
The volume of this cereal packet is:

16
3 Perimeter, Area and Volume Tasks
What is the perimeter of a rectangle whose sides are and ?
What is the perimeter of the following shape?
What is the length of ?
What is the area of this rectangle?
What is the area of the following compound shape?

17
What is the volume of this tin?
Circle the correct answer:
What is the volume of a cube that has sides long? A) 18cm3 B) 27cm3 c) 30cm3
What is the volume of a cuboid that has the following dimensions?
length width height ?
A) 120cm3 B) 162cm3 C) 182cm3
What is the volume of a cuboid if its length is , its width is and its height is ?
A) 560cm3 B) 660cm3 C) 702cm3
What is the length of a cuboid if its volume is , its width is and its height is ? A) 3cm B) 3.5cm C) 4cm
What is the height of a cuboid if its volume is , its length is and its width is
A) 7cm B) 8cm C) 9cm

18
Fractions A fraction is a part of a whole
Slice a pizza, and we get fractions:
1/2
1/4 3/8
(One-Half) (One-Quarter) (Three-Eighths)
The top number says how many slices we have. The bottom number says how many slices the pizza is cut into.
Equivalent Fractions Some fractions may look different, but are really the same, for example:
4/8 = 2/4 = 1/2
(Four-Eighths) Two-Quarters) (One-Half)
=
=
It is usually best to show an answer using the simplest fraction (1/2 in this case). That is called Sim-plifying, or Reducing the Fraction
Numerator / Denominator We call the top number the Numerator, it is the number of parts we have. We call the bottom number the Denominator; it is the number of parts the whole is divided into.
Numerator
Denominator
Adding Fractions It is easy to add fractions with the same denominator (same bottom number):
1/4 + 1/4 = 2/4 = 1/2
(One-Quarter) (One-Quarter) (Two-Quarters) (One-Half)

19
+
=
=
Another example:
5/8 + 1/8 = 6/8 = 3/4
+
=
=
Adding Fractions with Different Denominators But what about when the denominators (the bottom numbers) are not the same?
3/8 + 1/4 = ?
+
=
We must somehow make the denominators the same. In this case it is easy, because we know that 1/4 is the same as 2/8:
3/8 + 2/8 = 5/8
What is a Common Denominator? When the denominators of two or more fractions are the same, they have Common Denomina-tors.
What is the Least Common Denominator? The "Least Common Denominator" is the smallest of all the possible common denominators. We will see how to find it soon, but first let's investigate why common denominators are needed.
Different Denominators We can't add fractions with different denominators:

20
1/3 + 1/6 = ?
So what do we do? How can they be added? Answer: We need to make the denominators the same.
Finding a Common Denominator But what should the new denominator be? One simple answer is to multiply the current denominators together: 3 × 6 = 18
So instead of having 3 or 6 slices, we will make both of them have 18 slices. The pizzas now look like this:
6 /18 + 3 /18 = 9 /18
Least Common Denominator That is all fine, but 18 is a lot of slices ... can we do it with fewer slices?
Here is how to find out:
1/ 3
List the multiples of 3:
3, 6, 9, 12, 15, 18, 21, ...
1/ 6 List the multiples of 6: 6, 12, 18, 24, ...
Then find the smallest number that is the same
multiples of 3: 3, 6, 9, 12, 15, 18, 21, ...
multiples of 6: 6, 12, 18, 24, ...
The answer is 6, and that is the Least Common Denominator. So let us try using it! We want both fractions to have 6 slices.
When we multiply top and bottom of 1 /3 by 2 we get 2 /6 1 /6 already has a denominator of 6
And our question now looks like:

21
2/ 6 + 1/ 6 = 3/ 6
One last step is to simplify the fraction (if possible). In this case 3/6 is simpler as 1/2:
2 /6 + 1/ 6 = 3 /6 = 1 /2
And that is what the Least Common Denominator is all about. It lets us add (or subtract) fractions using the least number of slices.

22
Percentages (%) When we say "Percent" we are really saying "per 100" One percent (1%) means 1 per 100.
1% of this line is shaded green: it is very small isn't it?
50% means 50 per 100 (50% of this box is green)
25% means 25 per 100 (25% of this box is green)
Examples:
100% means all.
Example:
100% of 80 is 100
× 80 = 80 100
50% means half.
Example:
50% of 80 is 50
× 80 = 40 100

23
5% means 5/100ths.
Example:
5% of 80 is 5
× 80 = 4 100
Because "Percent" means "per 100" think: "This should be divided by 100" So 75% really means 75/100
And 100% is 100/100, or exactly 1 (100% of any number is just the number, unchanged)
And 200% is 200/100, or exactly 2 (200% of any number is twice the number)
A Percent can also be expressed as a Decimal or a Fraction
A Half can be written...
As a percentage: 50%
As a decimal: 0.5
As a fraction: 1/2
Some Worked Examples: Example: Calculate 25% of 80
25% = 25
100
And 25
× 80 = 20 100
So 25% of 80 is 20
Example: 15% of 200 apples are bad. How many apples are bad?
15% = 15
100
And 15
× 200 = 15 × 200
= 15 × 2 = 30 apples 100 100
30 apples are bad

24
Example: if only 10 of the 200 apples are bad, what percent is that?
As a fraction, 10/200 = 0.05 As a percentage it is: (10/200) x 100 = 5% 5% of those apples are bad
Example: A Skateboard is reduced 25% in price in a sale. The old price was £120. Find the new price.
First, find 25% of £120:
25% = 25
100
And 25
× £120 = £30 100
25% of £120 is £30 So the reduction is £30
Take the reduction from the original price £120 - £30 = £90 The Price of the Skateboard in the sale is £90

25
Decimals, Fractions and Percentages (Conversions)
Decimals, Fractions and Percentages are just different ways of showing the same value:
A Half can be written...
As a fraction: 1/2
As a decimal: 0.5
As a percentage: 50%
A Quarter can be written...
As a fraction: 1/4
As a decimal: 0.25
As a percentage: 25%
Example Values Here is a table of commonly used values shown in Percent, Decimal and Fraction form:
Percent Decimal Fraction
1% 0.01 1/100
5% 0.05 1/20
10% 0.1 1/10
12½% 0.125 1/8
20% 0.2 1/5
25% 0.25 1/4
331/3% 0.333... 1/3
50% 0.5 1/2
75% 0.75 3/4
80% 0.8 4/5
90% 0.9 9/10
99% 0.99 99/100
100% 1
125% 1.25 5/4
150% 1.5 3/2
200% 2

26
Conversions
From Percent to Decimal To convert from percent to decimal: divide by 100, and remove the "%" sign. The easiest way to divide by 100 is to move the decimal point 2 places to the left:
From Percent
To Decimal
Move the decimal point 2 places to the left, and remove the "%" sign.
From Decimal to Percent To convert from decimal to percent: multiply by 100, and add a "%" sign. The easiest way to multiply by 100 is to move the decimal point 2 places to the right:
From Decimal
To Percent
Move the decimal point 2 places to the right, and add the "%" sign.
From Fraction to Decimal The easiest way to convert a fraction to a decimal is to divide the top number by the bottom number (divide the numerator by the denominator in mathematical language).
Example: Convert 2/5 to a decimal Divide 2 by 5: 2 ÷ 5 = 0.4 Answer: 2/5 = 0.4

27
From Decimal to Fraction
To convert a decimal to a fraction needs a little more work.
Example: To convert 0.75 to a fraction
Steps Example
First, write down the decimal "over" the number 1 0.75
1
Multiply top and bottom by 10 for every number after the decimal point (10 for 1 number, 100 for 2 numbers, etc.)
0.75 × 100
1 × 100
(This makes a correctly formed fraction) 75
100
Then Simplify the fraction 3
4
From Fraction to Percentage The easiest way to convert a fraction to a percentage is to divide the top number by the bottom number. Then multiply the result by 100, and add the "%" sign.
Example: Convert 3/8 to a percentage
First divide 3 by 8: 3 ÷ 8 = 0.375, Then multiply by 100: 0.375 x 100 = 37.5 Add the "%" sign: 37.5% Answer: 3/8 = 37.5%

28
From Percentage to Fraction To convert a percentage to a fraction, first convert to a decimal (divide by 100), then use the steps for converting decimal to fractions (like above).
Example: To convert 80% to a fraction
Steps Example
Convert 80% to a decimal (=80/100):
0.8
Write down the decimal "over" the number 1 0.8
1
Multiply top and bottom by 10 for every number after the decimal point (10 for 1 number, 100 for 2 numbers, etc.)
0.8 × 10
1 × 10
(This makes a correctly formed fraction) 8
10
Then Simplify the fraction 4
5

29
4 Decimals, Fractions and Percentages Tasks
Circle the correct answer:
What percent of the above box is green?
A) 24% B) 26% C) 74% D) 76%
The population of a city in the year 2000 was 500,000. Over the following decade the popula-tion grew by 8%. What was the population of the city in 2010?
A) 540,000 B) 550,000 C) 575,000 D) 580,000
Peter scored 27 out of 50 in a test. What percent was that?
A) 13.5% B) 27% C) 50% D) 54%
Calculate 75% of 60
A) 40 B) 45 C) 50 D) 55
A TV originally cost £400. If the price of the TV increases by 15%, what is the new price?
A) £340 B) £415 C) £430 D) £460
Convert the decimal 0.875 to a percent A) 0.875% B) 8.75% C) 87.5% D) 875%
Convert 3.5% to a decimal A) 0.0035 B) 0.035 C) 0.35 D) 3.5
Convert 3/5 to a decimal
A) 0.3 B) 0.4 C) 0.5 D) 0.6
Convert 11/20 to a decimal
A) 0.45 B) 0.55 C) 0.65 D) 0.75

30
Shade one half of these shapes:
Shade one quarter of these shapes:
What fraction of the sweets are in the box? What fraction are outside the box?
a) b)
in out in out

31
½ of 12 = _____
½ of 20 = _____
½ of 24 = _____
¼ of 12 = _____
¼ of 4 = _____
¼ of 40 = _____
1/3 of 9 = _____
1/3 of 12 = _____
1/3 of 30 = _____
1/10 of 10 = _____
1/10 of 20 = _____
1/10 of 50 =_____
Draw a circle around the following fractions of these amounts:
a) ½ b) ¼
c) 1/3

32
Charts and Graphs Bar Graphs A Bar Graph (also called Bar Chart) is a graphical display of data using bars of different heights. Imagine you just did a survey of your friends to find which kind of movie they liked best:
Table: Favourite Type of Movie
Comedy
Action
Romance
Drama
Sci-Fi
4 5 6 1 4
We can show that on a bar graph like this:
It is a really good way to show relative sizes: we can see which types of movie are most liked, and which are least liked, at a glance. We can use bar graphs to show the relative sizes of many things, such as what type of car people have, how many customers a shop has on different days and so on.
Example: Nicest Fruit
A survey of 145 people asked them "Which is the nicest fruit?”
Fruit: Apple Orange Banana Kiwifruit Blueberry Grapes
People: 35 30 10 25 40 5

33
And here is the bar graph:
This group of people think Blueberries are the nicest.
Bar Graphs can also be Horizontal, like this:
Example: Student Grades
In a recent test, this many students got these grades:
Grade: A B C D
Students: 4 12 10 2
And here is the bar graph:

34
Histograms vs Bar Graphs
Bar Graphs are good when your data is in categories (such as "Comedy", "Drama", etc.)
When you have continuous data (such as a person's height) then use a Histogram. It is best to leave gaps between the bars of a Bar Graph, so it doesn't look like a Histogram.
Line Graphs Line Graph: a graph that shows information that is connected in some way (such as change over time) You are learning facts about dogs, and each day you do a short test to see how good you are. These are the results:
Table: Facts I got Correct
Day 1 Day 2 Day 3 Day 4
3 4 12 15
And here is the same data as a Line Graph:
Make sure to have:
Vertical scale with tick marks and labels
Horizontal scale with tick marks and labels
Data points connected by lines
A Title

35
Pie Chart
Pie Chart: a special chart that uses "pie slices" to show relative sizes of data.
Imagine you survey your friends to find the kind of movie they like best:
Table: Favourite Type of Movie
Comedy
Action
Romance
Drama
Sci-Fi
4 5 6 1 4
You can show the data by this Pie Chart:
It is a really good way to show relative sizes: it is easy to see which movie types are most liked, and which are least liked, at a glance.
First, put your data into a table (like above), then add up all the values to get a total:
Table: Favourite Type of Movie
Comedy Action Romance Drama Sci-Fi TOTAL
4 5 6 1 4 20
Next, divide each value by the total and multiply by 100 to get a percent:
Comedy Action Romance Drama Sci-Fi TOTAL
4 5 6 1 4 20
4/20
= 20%
5/20
= 25%
6/20
= 30%
1/20
= 5%
4/20
= 20% 100%

36
Now to figure out how many degrees for each "pie slice" (correctly called a sector). A Full Circle has 360 degrees, so we do this calculation:
Comedy Action Romance Drama Sci-Fi TOTAL
4 5 6 1 4 20
20% 25% 30% 5% 20% 100%
4/20 × 360°
= 72°
5/20 × 360°
= 90°
6/20 × 360°
= 108°
1/20 × 360°
= 18°
4/20 × 360°
= 72° 360°
Now you are ready to start drawing! Draw a circle. Then use your protractor to measure the degrees of each sector. Here I show the first sector... Finish up by colouring each sector and giving it a label like "Comedy: 4 (20%)", etc. (And don’t forget a title!)
37
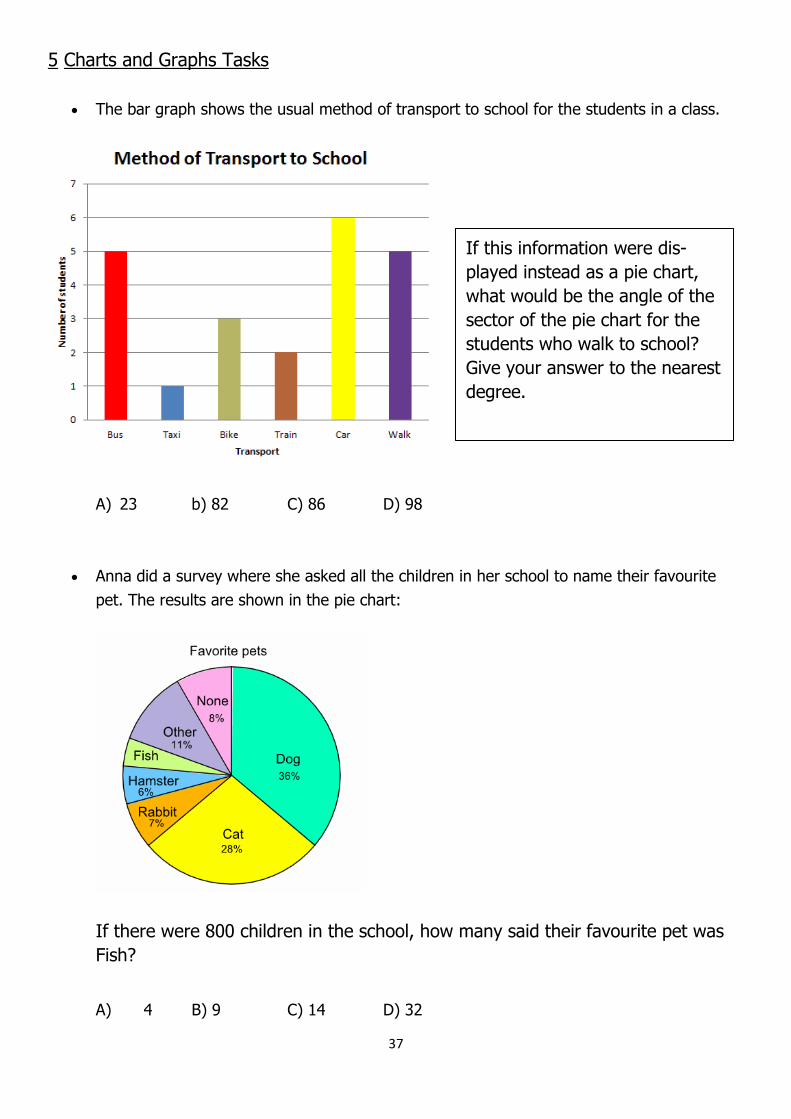
5 Charts and Graphs Tasks
The bar graph shows the usual method of transport to school for the students in a class.
A) 23 b) 82 C) 86 D) 98
Anna did a survey where she asked all the children in her school to name their favourite
pet. The results are shown in the pie chart:
If there were 800 children in the school, how many said their favourite pet was
Fish?
A) 4 B) 9 C) 14 D) 32
If this information were dis-
played instead as a pie chart,
what would be the angle of the
sector of the pie chart for the
students who walk to school?
Give your answer to the nearest
degree.

38
This pie chart shows the McCreedy's household expenditure, broken down into categories:
What percentage of the family's income is spent on Power?
A) 10% B) 11.1% C) 13.9% D) 40%
The bar graph shows the scores obtained when a die was rolled a number of times.
If this information were displayed instead as a pie chart, what would be the angle of the
sector of the pie chart representing the score of 2?
A) 18 B) 54 C) 90 D) 108

39
Spot the Mistakes
The office manager has drawn a chart showing the sales figures in the table
Jack £500
Jane £350
Joan £225
John £175
James £300
Janet £125
June £45
£600
Jack
Jane
£550 Joan
John
James
Janet
£400 June
£300
£200
£100
£50
List the mistakes with this bar chart.

40
Frequency Distribution Frequency Frequency is how often something occurs.
Example: Sam played football on:
Saturday Morning, Saturday Afternoon Thursday Afternoon
The frequency was 2 on Saturday, 1 on Thursday and 3 for the whole week.
Frequency Distribution By counting frequencies we can make a Frequency Distribution table
Example: Goals
S Sam's team has scored the following numbers of goals in recent games:
2, 3, 1, 2, 1, 3, 2, 3, 4, 5, 4, 2, 2, 3
Sam put the numbers in order, then added up:
how often 1 occurs (2 times),
how often 2 occurs (5 times),
etc.
And he wrote them down as a Frequency Distribution table.
From the table we can see interesting things such as
getting 2 goals happens most often only once did they get 5 goals
This is the definition: Frequency Distribution: values and their frequency (how often each value occurs).

41
Here is another example:
Example: Newspapers These are the numbers of newspapers sold at a local shop over the last 10 days:
22, 20, 18, 23, 20, 25, 22, 20, 18, 20
Let us count how many of each number there is:
Papers Sold Frequency
18 2
19 0
20 4
21 0
22 2
23 1
24 0
25 1
It is also possible to group the values. Here they are grouped in 5’s:
Papers Sold Frequency
15-19 2
20-24 7
25-29 1

42
Probability
How likely something is to happen.
Many events can't be predicted with total certainty. The best we can say is how likely they are to happen, using the idea of probability.
Tossing a Coin
When a coin is tossed, there are two possible outcomes:
heads (H) or
tails (T)
We say that the probability of the coin landing H is ½.
And the probability of the coin landing T is ½.
Throwing Dice
When a single die is thrown, there are six possible outcomes:
1, 2, 3, 4, 5, 6.
The probability of any one of them is 1/6.
Probability
In general:
Probability of an event happening = Number of ways it can happen Total number of outcomes
Example: the chances of rolling a "4" with a die
Number of ways it can happen: 1 (there is only 1 face with a "4" on it)
Total number of outcomes: 6 (there are 6 faces altogether)
So the probability = 1 /6
Example: there are 5 marbles in a bag: 4 are blue, and 1 is red. What is the probability that a blue marble gets picked?
Number of ways it can happen: 4 (there are 4 blues)
Total number of outcomes: 5 (there are 5 marbles in total)
So the probability = 4 5 = 0.8

43
Probability Line We can show probability on a Probability Line:
Probability is always between 0 and 1
Probability is Just a Guide Probability does not tell us exactly what will happen, it is just a guide.
Example: toss a coin 100 times, how many Heads will come up? Probability says that heads have a ½ chance, so we can expect 50 Heads. But when we actually try it we might get 48 heads, or 55 heads ... or anything really, but in most cases it will be a number near 50. The probability of an event occurring is somewhere between impossible and certain.
As well as words we can use numbers (such as fractions or decimals) to show the probability of something happening:
Impossible is zero
Certain is one. Here are some fractions on the probability line:
This can also be shown using decimals, 0, 0.25, 0.50 and 0.75

44
We can also show the chance that something will happen:
a) The sun will rise tomorrow. b) I will not have to learn mathematics at school. c) If I flip a coin it will land heads up. d) Choosing a red ball from a sack with 1 red ball and 3 green balls
Between 0 and 1 The probability of an event will not be less than 0.
This is because 0 is impossible (sure that something will not happen).
The probability of an event will not be more than 1. This is because 1 is certain that something will happen.

45
6 Probability Tasks
Which of the arrows A, B, C or D shows the best position on the probability line for the
event 'Tomorrow it will snow in Hawaii'?
Which of the following events is NOT represented by the arrow on the probability line?
A Getting a tail with a single toss of a coin.
B Getting one tail and one head when tossing two coins.
C Getting two heads when tossing two coins.
D Throwing an even number with a single roll of a die.
A bag contains 1 red ball and 9 blue balls. A ball is chosen at random from the
bag. Which of the arrows A, B, C or D shows the best position on the probability
line for the event 'The ball is red'?

46
7 Maths Crossword
1 2
3
4 5 6
7
.
8 9 10
11
12
13 14
15
. 16 17
.
18 19
20 . 21
22
Across Down
1 Square of 8 2 Nearest whole number to 437.126
3 200 divided by 10 3 The biggest one 25% of 360 or 30% of 900
4 The mean average of 27, 18, 19, 21, 16, and 25 4 Half of 4.09
7 2400g expressed as Kg 5 Area of size 4m x 350cm in m2
8 3/4 of 1000 6 3916.09 to the nearest tenth
10 Convert 200mm to cm 7 1/3 of 666
11 Square of 9 9 53.2553 rounded to 2 decimal places
13 Take 20% off 156195 11 Minutes in 1 hour 25 minutes
15 10 1/4 as a decimal 12 Rounded to the nearest ten 71218.35 17 As a percentage, the chance of throwing an
even number with one die 13 1.5 multiplied by 100
18 2179 rounded to the nearest thousand 14 Degrees in a right angle
19 99 divided by 9 16 What is 1/5 as a percentage
20 2 3/5 as a decimal 19 Number of centimetres in a metre
21 Number of grams in a kilogram 21 90 divided by 9
22 Degrees in a triangle