anderson materials evaluation, inc
TRANSCRIPT

Anderson Materials Evaluation, Inc.
Materials Characterization & Failure Analysis Laboratory
9051 Red Branch Road, Suite CColumbia, MD 21045-2103
Phone: (410) 740-8562Fax: (410) 740-8201
www.andersonmaterials.com
XPS Surface Analysis, WD-XRF, SEM/EDX, FTIR, Thermal Analysis (TGA, DSC, TMA),GC-MS, Optical Microscopy, Cross Section Analysis, Electrochemistry, Corrosion Analysis,Adhesive Bonding Failure Analysis, Mechanical Testing, Metallography, Fractography, RGA MSContact Angle Measurement, UV-Vis, Reflectivity, Color Measurement, Density/Porosity
Email [email protected]
DATE 20 February 2021
TO Redacted
FROM Charles R. Anderson, Ph.D.
SUBJ XPS and XRF Analyses and Optical Microscopy Examination of Tiles Said to Emit OdorWhen Wet
Summary
The principal results of the XPS and XRF analyses and the optical microscopyexamination are:
• There is a surface glaze coating applied over a hard white layer about 0.5 mmthick on the baked clay substrate material of the tile.
• The surface was examined in many more areas than those whose images areshown in this report with similar results. All areas had numerous round holes inthe glaze coating on the hard white layer.
• It is believed that the round holes are the result of the release of a gas with gasbubble formation as the coating material was cured or otherwise heated.
• The tile glaze is primarily an alumino-soda-calcia silicate.
• The hard, white layer material is primarily composed of SiO2, Al2O3, ZrO2, CaO,Na2O, K2O, and ZnO listed from most concentrated to least concentrated.
• Distilled water on the clean glazed surface beads up. When allowed to dry inlaboratory air, water spots are formed, with heavy deposits at the perimeter ofthe water spot and thinner deposits in the interior of the water spots.
• The heavy perimeter deposit and the interior of the water spot have large
Solutions to applied materials problems by innovative analysis DmeG/ 21Feb21 / Page 1

increases in carbon and sodium concentrations, with decreases of the surfacesilicon and aluminum concentrations relative to the outside of the water spotarea analyzed.
• The 2.6 times increase in carbon in the heavy perimeter deposit compared to theoutside the water spot clean glaze area is due to an increase in both the C – Cbonds of organic material and of carbonates.
• The increase in the sodium in the perimeter deposit compared to the clean glazearea is due to some combination of hydrated sodium carbonate and sodiumbicarbonate.
• The cause of the water spot deposits has to be that the glaze is not preventing thedistilled water on the surface from dissolving organic materials and sodiumcarbonates from the underlying hard white layer material. This is because of themany round defects observed in the surface glaze. This formation of deposits onthe glaze surface upon water exposure is certainly a serious fault with this floortile. It is reasonable to believe that when a substantial surface area of the floor iswet, the dissolved materials from the underlying clay cause the wet clay smellthat has been reported. The fact that water applied to the surface causes waterspots as happens here is certainly a defect in appearance.
Solutions to applied materials problems by innovative analysis DmeG/ 21Feb21 / Page 2

Samples and Background
A tile was received for examination and analysis to determine why the tile emitted areported clay odor when wet. The floor tile is shown below.
Figure 1. The tile received at AME for examination is shown above. The tile was white with gray streaksthrough it as seen by the naked eye.
Figure 2. The edge of the tile is shown in the upper image and the back of the tile is shown in the lowerimage.
Solutions to applied materials problems by innovative analysis DmeG/ 21Feb21 / Page 3

Tile Preparation
The tile was examined in a clean condition after wiping it with 91% isopropyl alcoholsoaked towels and then again after allowing distilled water on its surface to dry inplace. Distilled water on the surface of the tile beaded up and when these puddles ofwater dried, they left solid deposits on the surface of the tiles with the most densedeposits at the outer perimeter of the beaded water puddles.
Figure 3. Some of the deposits on the surface of the tile after distilled water has dried on the tile surfaceare shown above. The water spots show up best in the reflected light from overhead lights, which limits
the uniformity of the brightness in these images.
There is a white layer on top of the baked clay, which was polished to remove asubstantial fraction of its total thickness. That fraction was close to one-half. Thepolished fragment of tile is shown below:
Solutions to applied materials problems by innovative analysis DmeG/ 21Feb21 / Page 4

Figure 4. The tile fragment after polishing about half the hard, white surface overlayer away is shownabove. The larger piece in the right image was not polished for comparison of the white layer before andafter polish. It appears that at least half of the white layer was polished away. The surface becamedecidedly more dull after the thinner surface glaze was removed.
There are at least three layers of materials making up the floor tile. There is the bakedclay base which makes up most of the tile thickness. On top of that, there is a thinwhite, very hard layer which is about 0.5 mm thick. Finally, there is a glossy glazesurface coating.
Solutions to applied materials problems by innovative analysis DmeG/ 21Feb21 / Page 5

Optical Microscopy Examination
The tile surface was examined using an Olympus PMG-3 metallographic microscopeequipped with an AmScope digital camera with a 5.1 MP Aptina Color CMOS detector(Figures 5-9, 12-15) or an AmScope inspection microscope using a 3.1 MP Aptina ColorCMOS detector (Figures 10, 11). The images were acquired using the AmScope imageacquisition program Version 3.7. The Olympus PMG-3 microscope has a polarized lightcapability and the Nomarski differential phase contrast capability.
Examination of the Clean Dry Tile
The tile surface was initially examined as-received. Then it was re-examined afterwiping the surface with 3 towels soaked in 91% isopropyl alcohol (IPA). There were nosubstantial changes in the nature of the images acquired. The images shown here arethose made after cleaning the surface with the IPA wiping.
Figure 5. These images were made using reflected white light at an as-printed magnification of 35.82times.
Solutions to applied materials problems by innovative analysis DmeG/ 21Feb21 / Page 6
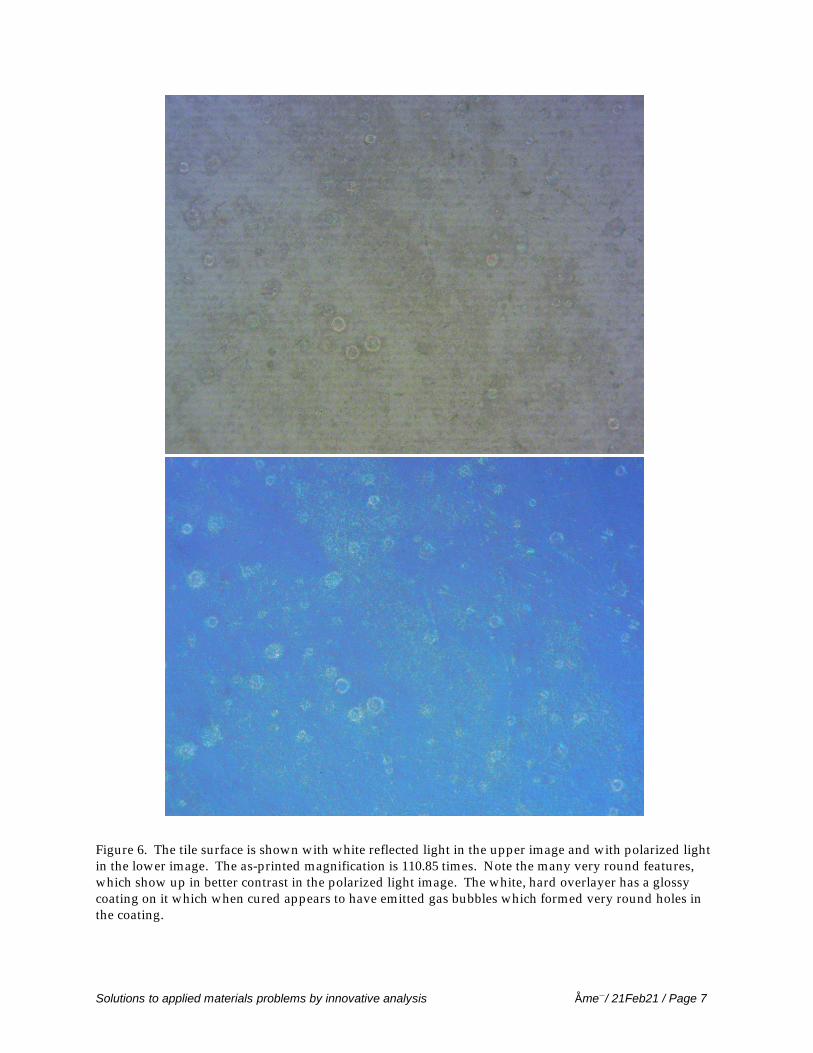
Figure 6. The tile surface is shown with white reflected light in the upper image and with polarized lightin the lower image. The as-printed magnification is 110.85 times. Note the many very round features,which show up in better contrast in the polarized light image. The white, hard overlayer has a glossycoating on it which when cured appears to have emitted gas bubbles which formed very round holes inthe coating.
Solutions to applied materials problems by innovative analysis DmeG/ 21Feb21 / Page 7

Figure 7. Another example of the round features in the glossy surface coating on the tile is shown herewith the white light image above and a polarized light image below. There is also a blue polarized lightimage of this area that makes the holes in the coating look like those in Figure 6. The as-printedmagnification is again 110.85 times.
Solutions to applied materials problems by innovative analysis DmeG/ 21Feb21 / Page 8
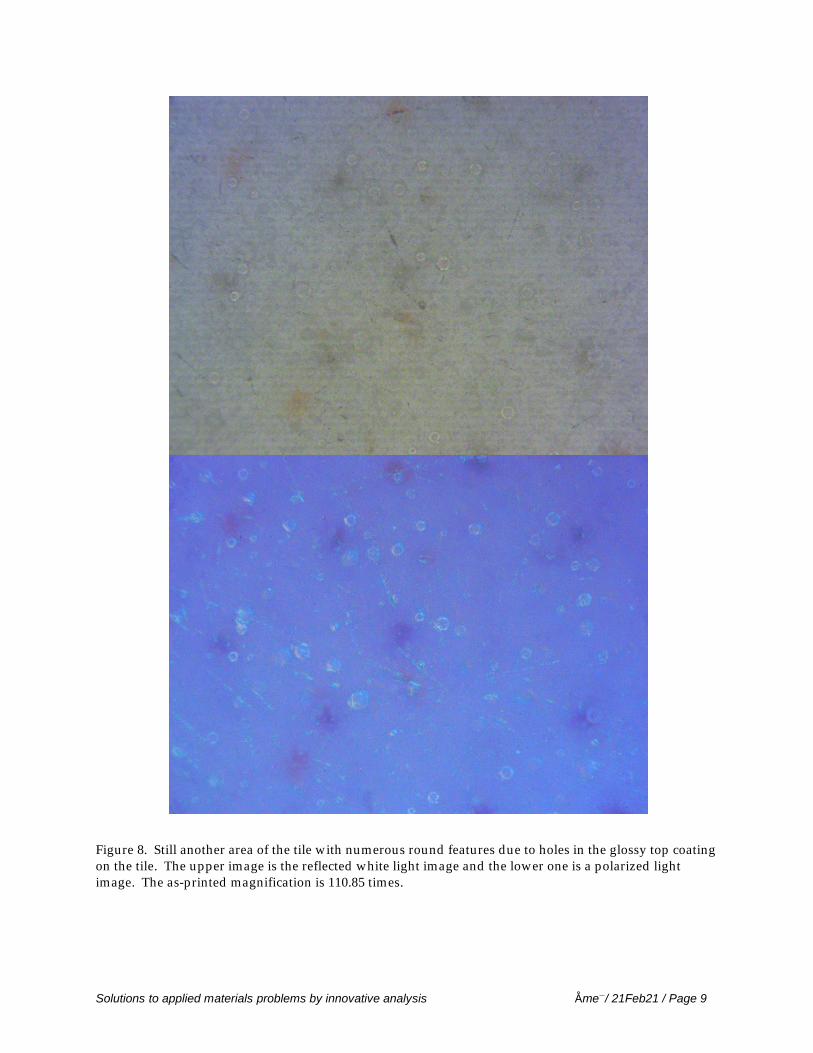
Figure 8. Still another area of the tile with numerous round features due to holes in the glossy top coatingon the tile. The upper image is the reflected white light image and the lower one is a polarized lightimage. The as-printed magnification is 110.85 times.
Solutions to applied materials problems by innovative analysis DmeG/ 21Feb21 / Page 9

Figure 9. Another area of the tile surface with many round holes through the glossy top surface coatingon the thin white layer. The hole on the left was anomalously large in this area, but all of the areasexamined had numerous round holes in the coating such as those shown in the images above. The topimage is again reflected white light and the bottom image is a polarized light image. The as-printedmagnification is again 110.85 times.
Solutions to applied materials problems by innovative analysis DmeG/ 21Feb21 / Page 10

Examination of the Wet Tile After Drying
Figure 10. A water spot left after the distilled water dried is shown above. Only the outer perimeter ofprecipitated materials can be seen as a thin line here. Blue tick marks were made just outside theperimeter to make it easier to find under the microscope, especially once the sample was inside the XPSchamber. The as-printed magnification is 2.67 times.
Figure 11. This is the water spot on which XPS analysis of the materials deposited on the surface upondrying the water was performed. The analysis areas were inside the deposit above the lower perimeterheavy deposit where there was less deposited material, in the lower perimeter heavy deposit area, andoutside the perimeter where no water bead had sat. The as-printed magnification is 12.71 times.
Solutions to applied materials problems by innovative analysis DmeG/ 21Feb21 / Page 11
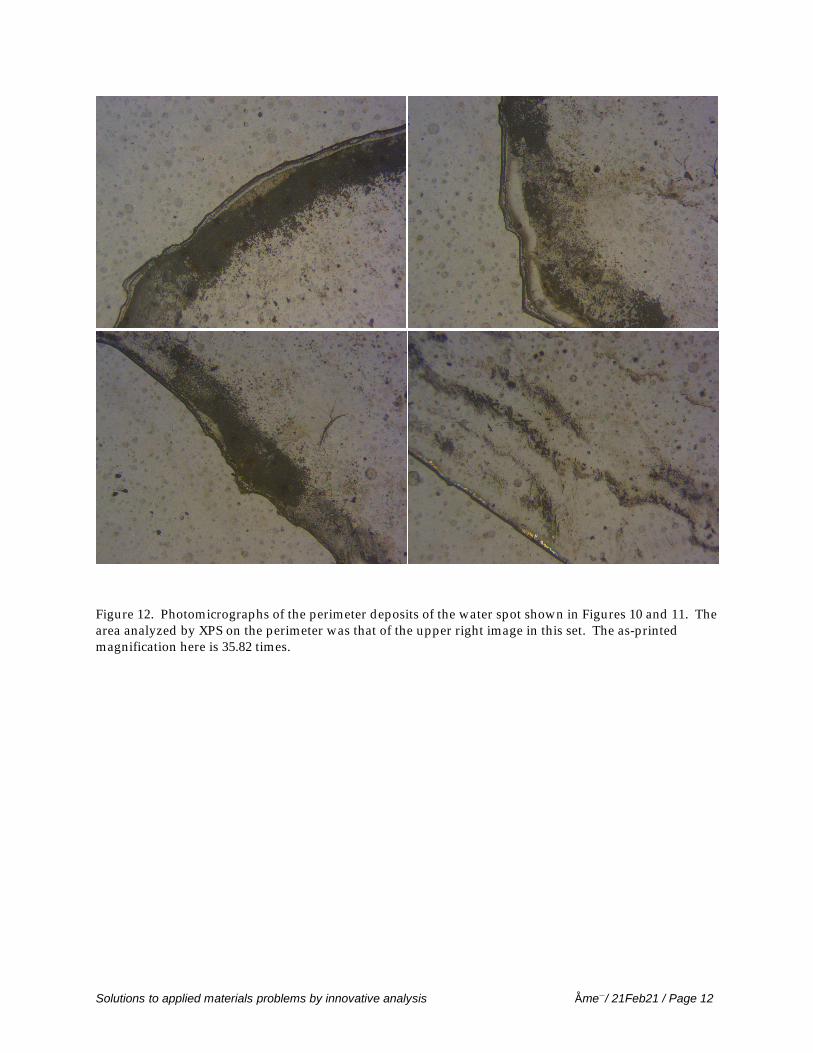
Figure 12. Photomicrographs of the perimeter deposits of the water spot shown in Figures 10 and 11. Thearea analyzed by XPS on the perimeter was that of the upper right image in this set. The as-printedmagnification here is 35.82 times.
Solutions to applied materials problems by innovative analysis DmeG/ 21Feb21 / Page 12
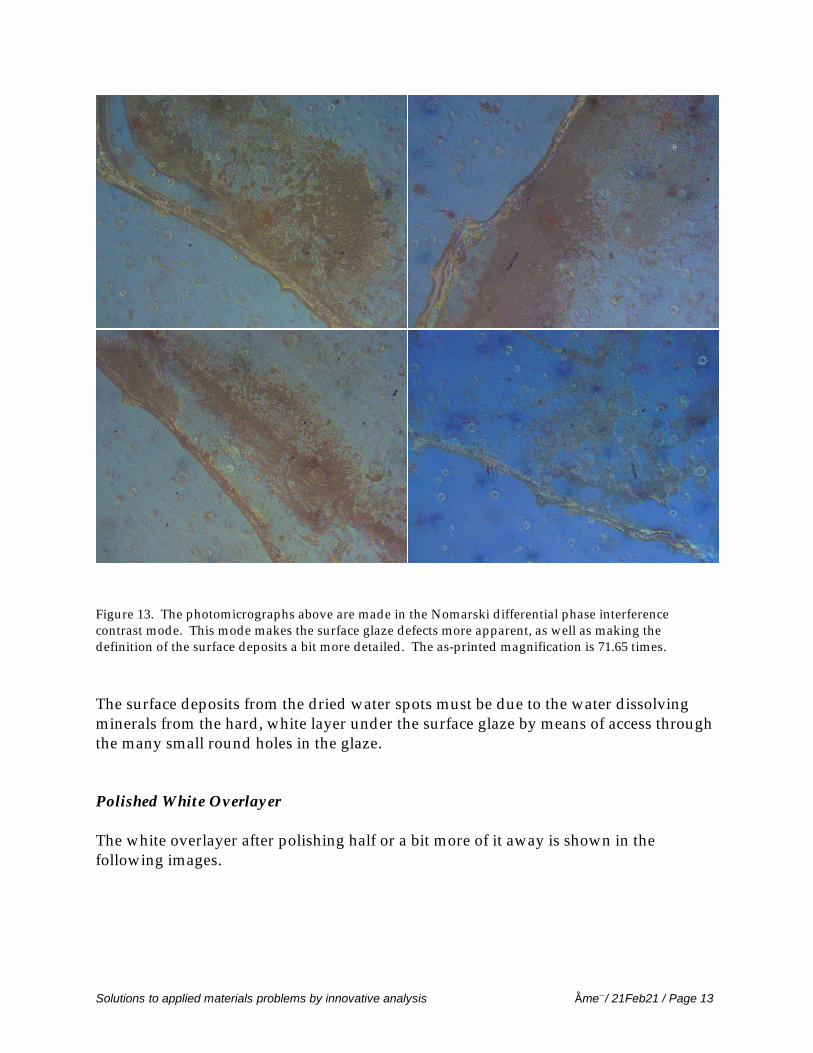
Figure 13. The photomicrographs above are made in the Nomarski differential phase interferencecontrast mode. This mode makes the surface glaze defects more apparent, as well as making thedefinition of the surface deposits a bit more detailed. The as-printed magnification is 71.65 times.
The surface deposits from the dried water spots must be due to the water dissolvingminerals from the hard, white layer under the surface glaze by means of access throughthe many small round holes in the glaze.
Polished White Overlayer
The white overlayer after polishing half or a bit more of it away is shown in thefollowing images.
Solutions to applied materials problems by innovative analysis DmeG/ 21Feb21 / Page 13
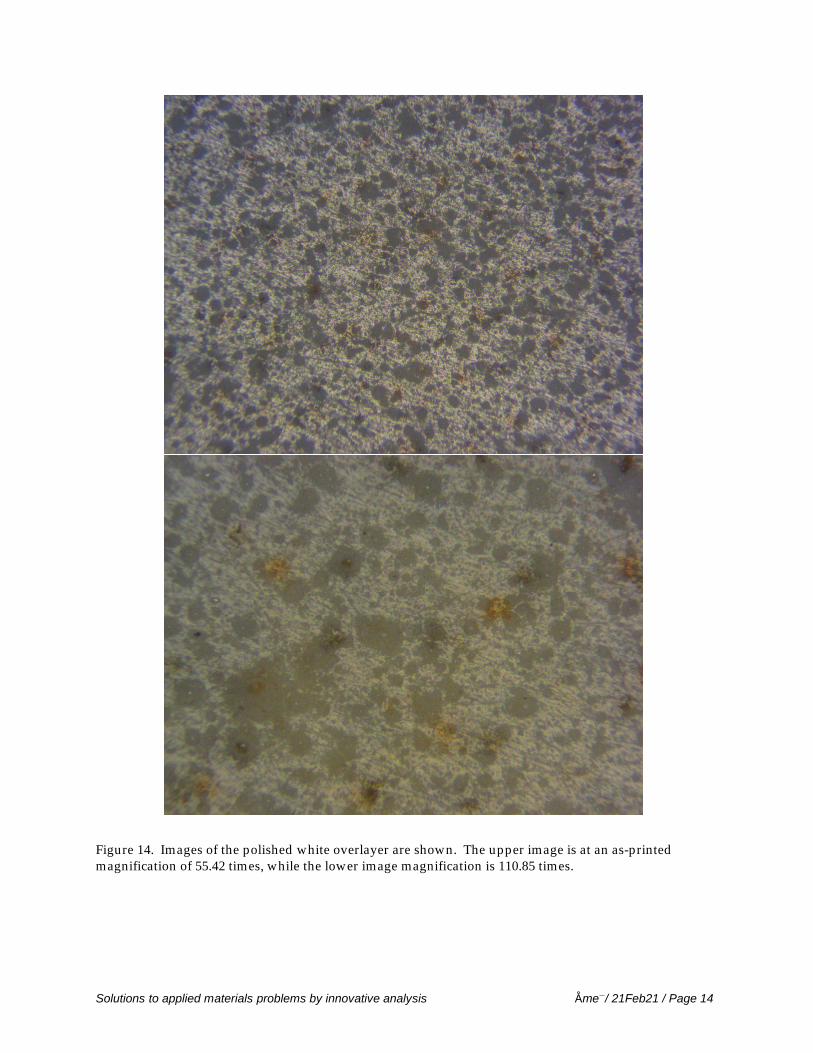
Figure 14. Images of the polished white overlayer are shown. The upper image is at an as-printedmagnification of 55.42 times, while the lower image magnification is 110.85 times.
Solutions to applied materials problems by innovative analysis DmeG/ 21Feb21 / Page 14
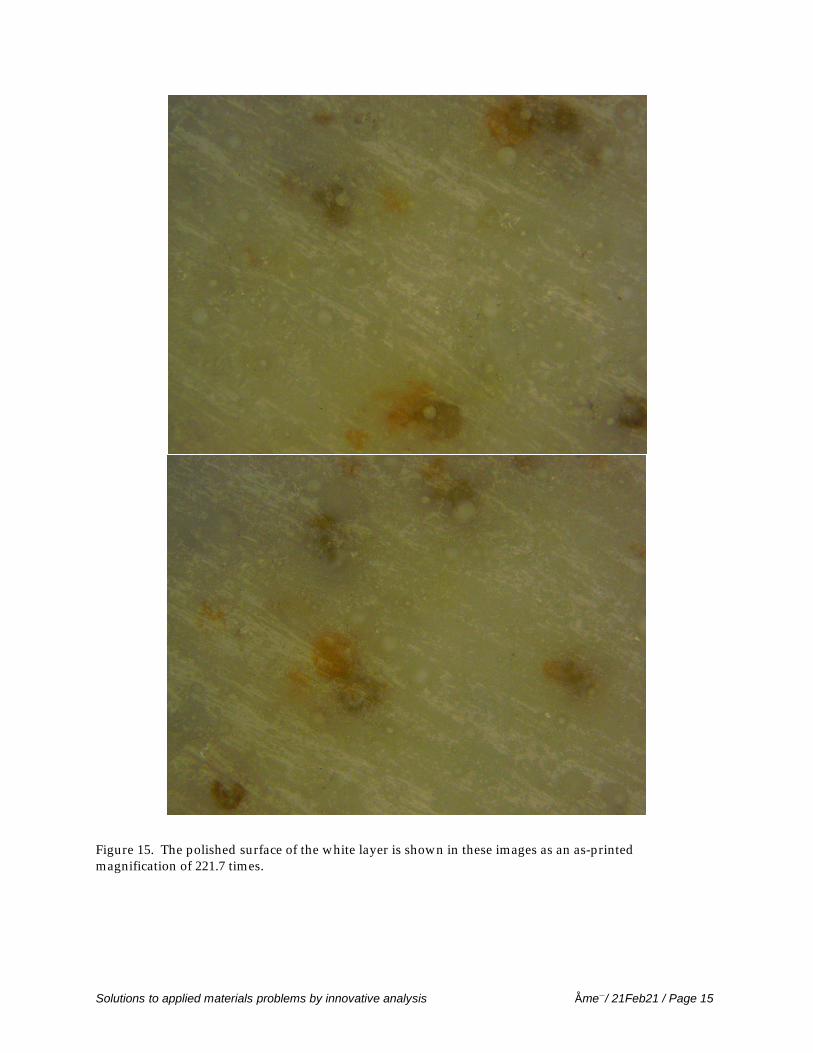
Figure 15. The polished surface of the white layer is shown in these images as an as-printedmagnification of 221.7 times.
Solutions to applied materials problems by innovative analysis DmeG/ 21Feb21 / Page 15
XRF Analysis
The XRF analysis was performed using a Thermo Scientific ARL PERFORM’X 1500wavelength-dispersive spectrometer with quantitative elemental concentration analysisfor all elements from carbon to uranium using sequential analysis with three detectioncrystals. It has the capability to analyze areas of 0.5 mm, 1.5 mm, 10 mm, or 29 mm indiameter. It can analyze samples either under vacuum or under helium. The depth ofanalysis is a couple of micrometers.
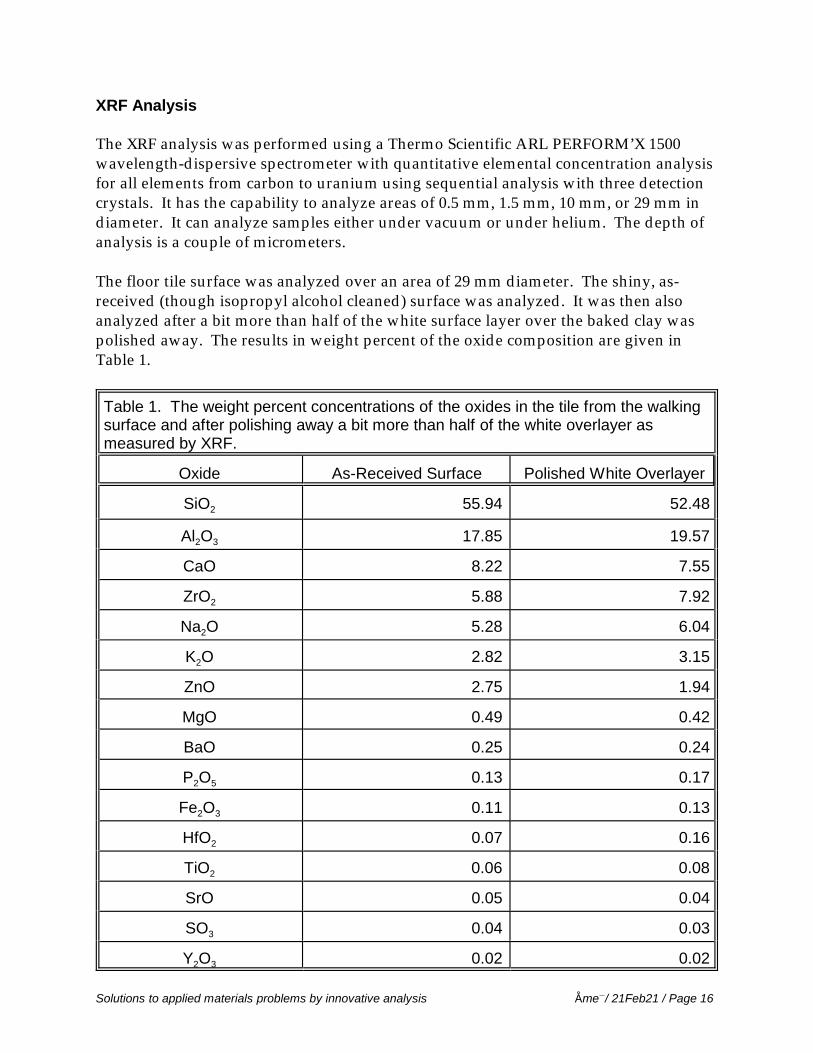
The floor tile surface was analyzed over an area of 29 mm diameter. The shiny, as-received (though isopropyl alcohol cleaned) surface was analyzed. It was then alsoanalyzed after a bit more than half of the white surface layer over the baked clay waspolished away. The results in weight percent of the oxide composition are given inTable 1.
Table 1. The weight percent concentrations of the oxides in the tile from the walkingsurface and after polishing away a bit more than half of the white overlayer asmeasured by XRF.
Oxide As-Received Surface Polished White Overlayer
SiO2 55.94 52.48
Al2O3 17.85 19.57
CaO 8.22 7.55
ZrO2 5.88 7.92
Na2O 5.28 6.04
K2O 2.82 3.15
ZnO 2.75 1.94
MgO 0.49 0.42
BaO 0.25 0.24
P2O5 0.13 0.17
Fe2O3 0.11 0.13
HfO2 0.07 0.16
TiO2 0.06 0.08
SrO 0.05 0.04
SO3 0.04 0.03
Y2O3 0.02 0.02
Solutions to applied materials problems by innovative analysis DmeG/ 21Feb21 / Page 16

The immediate surface glaze with the round holes in it observed by the opticalmicroscopy examination, has a composition similar to that of the underlying thick whitelayer. However, it has more silica, CaO, and ZnO in it. The subsurface white overlayerhas more alumina, zirconia, Na2O , and K2O in it. It is the Na2O that is primarilyleached from the white layer when the tile is wet.
XPS Analysis
The XPS analysis was performed over an elliptical area irradiated by the low-energy(1487 eV) monochromatic aluminum Kα x-ray with a major axis of 1.28 mm and a minoraxis of 0.64 mm. This is an area of approximately 0.64 mm2. The x-ray angle ofincidence and the take-off angle relative to the horizontal plane is 35E. A wide-angle(±13E solid angle) input lens, hemispherical analyzer, and a multi-channel detectormake the spectrometer very efficient with respect to the input x-ray flux. The depth ofthe analyzed volume is determined by the small mean-free path of the emittedphotoelectrons, such that about half the signal comes from the outer 6 nm of the surface,about 70% from the outer 10.5 nm, and about 90% from the outer 20 nm of the surface. The elemental survey spectra cover the binding energy range from 0 to 1100 eV, with astep size of 0.5 eV. This step size, with the monochromator, the moderate analyzed areasize, and a high signal-to-noise ratio, provides high quantitative accuracy andsensitivity.
The XPS system consists of a turbomolecular pumped introduction chamber, an ionpumped sample preparation chamber, and an analysis chamber which is also ionpumped. When samples are inserted into the Analysis Chamber, they pass through thePreparation Chamber, which decreases the exposure of the Analysis Chamber to watervapor and hydrocarbons from the Introduction Chamber. Briefly on introduction intothe Analysis Chamber, the pressure is typically in the low 10-8 Torr range, but within aminute of closing the gate valve to the Introduction Chamber, it is in the 10-9 Torr rangeand usually in the low 10-9 Torr range long before data acquisition has been completed.We also make a practice of segregating the samples of different customers to minimizecross contamination.
The quantitative elemental concentration results of the XPS analysis for the water spotand its environs are given in Table 2. Outside the water spot, the carbon concentrationis very low at 19.94 atomic percent (at.%), compared to the much higher concentrationin the interior of the water spot of 45.50 at.%, and the even higher perimeter ringconcentration of 52.63 at.%. This makes it clear that the distilled water sitting on theglaze surface is dissolving organic material out of the underlying clay through thecircular defects in the glaze. The other remarkable increase in concentration is that ofsodium, which outside the water spot is 2.29 at.%, inside in the interior of the waterspot is higher at 3.80 at.%, and at the perimeter deposits is a very high 10.62 at.%.
Solutions to applied materials problems by innovative analysis DmeG/ 21Feb21 / Page 17

Outside of the water spot, the silicon and aluminum concentrations are much higherthan in the interior of the water spot and still higher than in the heavy deposits at theperimeter of the water spot.
The high energy resolution results for the purpose of identifying the chemical speciesfor the surface of the glaze outside the water spot are given in Table 3. The glazesurface is that of a silicate of silicon, aluminum, sodium, and calcium. The nitrogenbinding energy matches with that of urethane. There is very little to no carbonate onthe surface.
The chemical species from the high energy resolution results for the heavy deposit atthe perimeter of the water spot are given in Table 4. The big increase in carbon on thesurface was shown to be due to a near tripling of the C – C bond concentration and abig increase in carbonates. The C – O bonds clearly seen in the outside the water spotarea analyzed were reduced by a factor of 10. The huge increase in sodium in thedeposit compared to the outside the water spot area is due to some combination ofNa2CO3 and NaHCO3. The Ca 2p3 binding energy also decreased, indicating it may behydrated calcium carbonate or it may be a calcium silicate. The reduced concentrationsof silicon and aluminum are in the form of silicates, though the ratio of aluminum tosilicon has increased.
Solutions to applied materials problems by innovative analysis DmeG/ 21Feb21 / Page 18
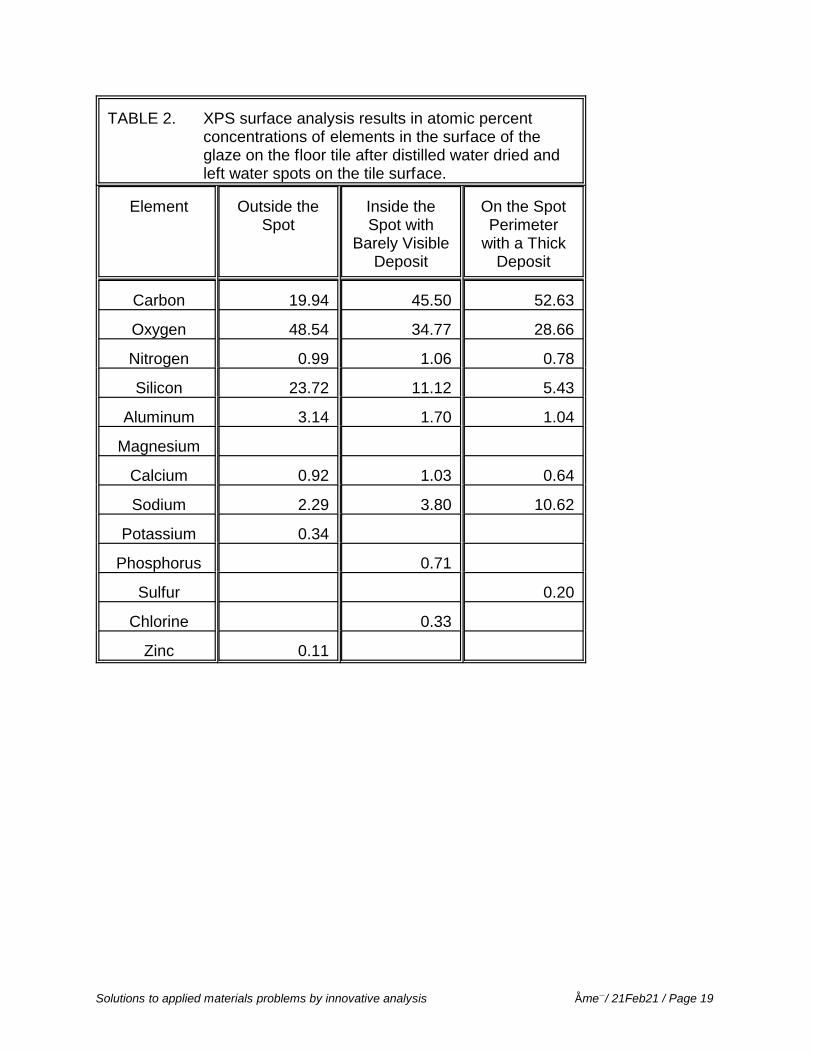
TABLE 2. XPS surface analysis results in atomic percentconcentrations of elements in the surface of theglaze on the floor tile after distilled water dried andleft water spots on the tile surface.
Element Outside theSpot
Inside theSpot with
Barely VisibleDeposit
On the SpotPerimeter
with a ThickDeposit
Carbon 19.94 45.50 52.63
Oxygen 48.54 34.77 28.66
Nitrogen 0.99 1.06 0.78
Silicon 23.72 11.12 5.43
Aluminum 3.14 1.70 1.04
Magnesium
Calcium 0.92 1.03 0.64
Sodium 2.29 3.80 10.62
Potassium 0.34
Phosphorus 0.71
Sulfur 0.20
Chlorine 0.33
Zinc 0.11
Solutions to applied materials problems by innovative analysis DmeG/ 21Feb21 / Page 19

Table 3. High energy resolution XPS results for the surface of the glaze outside the water spot.
Element Elementat.%
ComponentBinding
Energy (eV)Measured
ComponentBinding
Energy (eV)Corrected
Component%
Componentat.%
Component Identity
C 1s 19.94 283.86 285.00 76.06 15.17 C – C
285.36 286.50 12.48 2.49 C – O, C – C(=O) – O – C Ester
287.70 288.84 11.46 2.28 C – C(=O) – O – C Ester,C – O – C(=O) – NH – C Urethane
O 1s 48.54 531.05 532.19 61.03 29.62
531.93 533.07 38.97 18.92
N 1s 0.99 399.27 400.41 100.00 0.99 C – O – C(=O) – NH – C Urethane
Si 2p 23.72 101.94 103.07 100.00 23.72 23.72 Si Al0.132 Na0.097 Ca0.039 O2.285
Al 2p 3.14 73.71 74.85 100.00 3.14 Si Al0.132 Na0.097 Ca0.039 O2.285
Na 1s 2.29 1071.67 1072.81 100.00 2.29 Si Al0.132 Na0.097 Ca0.039 O2.285
Ca 2p3 0.92 347.03 348.17 100.00 0.92 Si Al0.132 Na0.097 Ca0.039 O2.285
Solutions to applied materials problems by innovative analysis DmeG/ 21Feb21 / Page 20
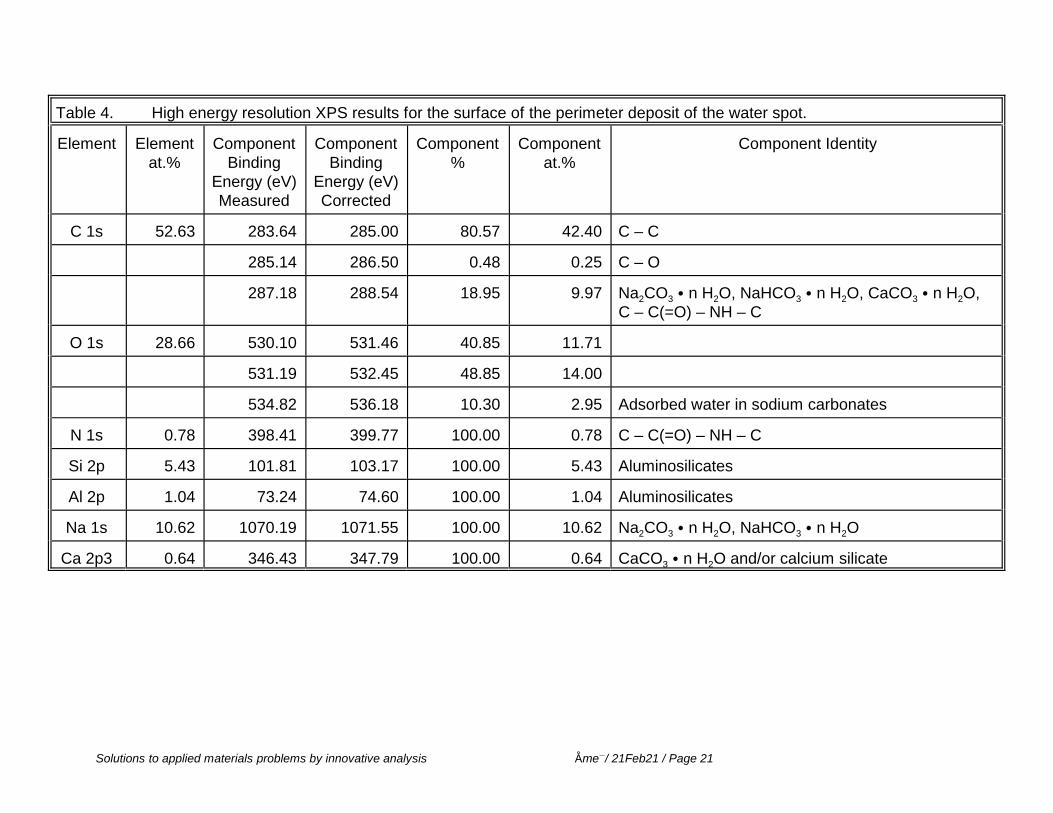
Table 4. High energy resolution XPS results for the surface of the perimeter deposit of the water spot.
Element Elementat.%
ComponentBinding
Energy (eV)Measured
ComponentBinding
Energy (eV)Corrected
Component%
Componentat.%
Component Identity
C 1s 52.63 283.64 285.00 80.57 42.40 C – C
285.14 286.50 0.48 0.25 C – O
287.18 288.54 18.95 9.97 Na2CO3 C n H2O, NaHCO3 C n H2O, CaCO3 C n H2O,C – C(=O) – NH – C
O 1s 28.66 530.10 531.46 40.85 11.71
531.19 532.45 48.85 14.00
534.82 536.18 10.30 2.95 Adsorbed water in sodium carbonates
N 1s 0.78 398.41 399.77 100.00 0.78 C – C(=O) – NH – C
Si 2p 5.43 101.81 103.17 100.00 5.43 Aluminosilicates
Al 2p 1.04 73.24 74.60 100.00 1.04 Aluminosilicates
Na 1s 10.62 1070.19 1071.55 100.00 10.62 Na2CO3 C n H2O, NaHCO3 C n H2O
Ca 2p3 0.64 346.43 347.79 100.00 0.64 CaCO3 C n H2O and/or calcium silicate
Solutions to applied materials problems by innovative analysis DmeG/ 21Feb21 / Page 21