anderson c. , conde m. , mcharg m. , holmes,...
TRANSCRIPT

Anderson C.1, Conde M.1, McHarg M.2, Holmes, J.3
1 Geophysical Institute, University of Alaska Fairbanks, 2 Department of Physics, U.S. Air Force Academy CO, 3 Space Vehicles Directorate, Air Force Research Laboratory, Kirtland AFB, NM,USA
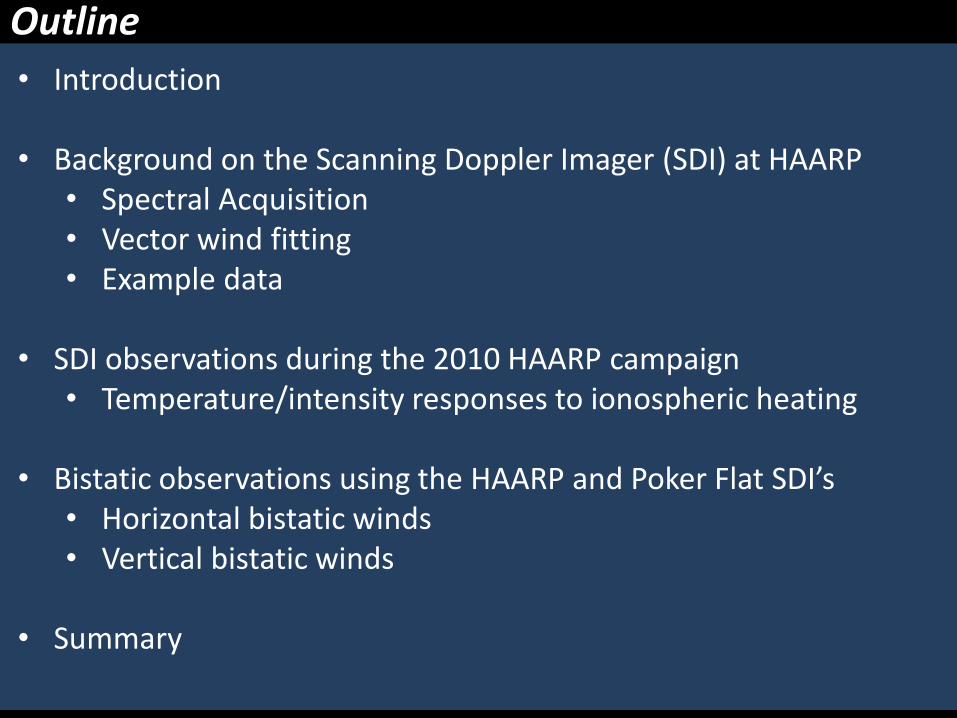
Outline
• Introduction
• Background on the Scanning Doppler Imager (SDI) at HAARP • Spectral Acquisition • Vector wind fitting • Example data
• SDI observations during the 2010 HAARP campaign
• Temperature/intensity responses to ionospheric heating
• Bistatic observations using the HAARP and Poker Flat SDI’s • Horizontal bistatic winds • Vertical bistatic winds
• Summary

• The US Air Force Academy and Geophysical Institute operate an all-sky Scanning Doppler Imager (SDI) at the HAARP facility in Gakona, Alaska. This instrument is a type of Fabry-Perot spectrometer, which can record airglow spectra from many (> 100) locations across a 160° full-angle field-of-view.
Introduction
• Recorded airglow spectra provide estimates of neutral gas temperature, bulk line-of-sight velocity, and airglow emission intensity. With further processing, two-dimensional horizontal vector wind fields can be derived.
• In its current configuration, the instrument provides a spatial resolution of 100 km at F-region altitudes (240 km), and 50 km at E-region altitudes (120 km). Temporal resolution depends upon emission brightness, and varies between 3-15 minutes.

Background
HAARP, Gakona
Airglow spectra are acquired in ‘zones’. From these, line-of-sight wind, temperature, and intensity estimates are derived in each zone.

Background
Spectrometer
• Line-of-sight winds are measured in each zone, from the Doppler shifts of the observed airglow spectra.
• Horizontal, 2-D vector wind fields can be fitted to the spatial variation of the line-of-sight winds.
• Importantly, all of the variability present in the line-of-sight winds is still present in the fitted wind field.
Doppler shifts (line-of-sight winds) Fitted vector wind field
Background
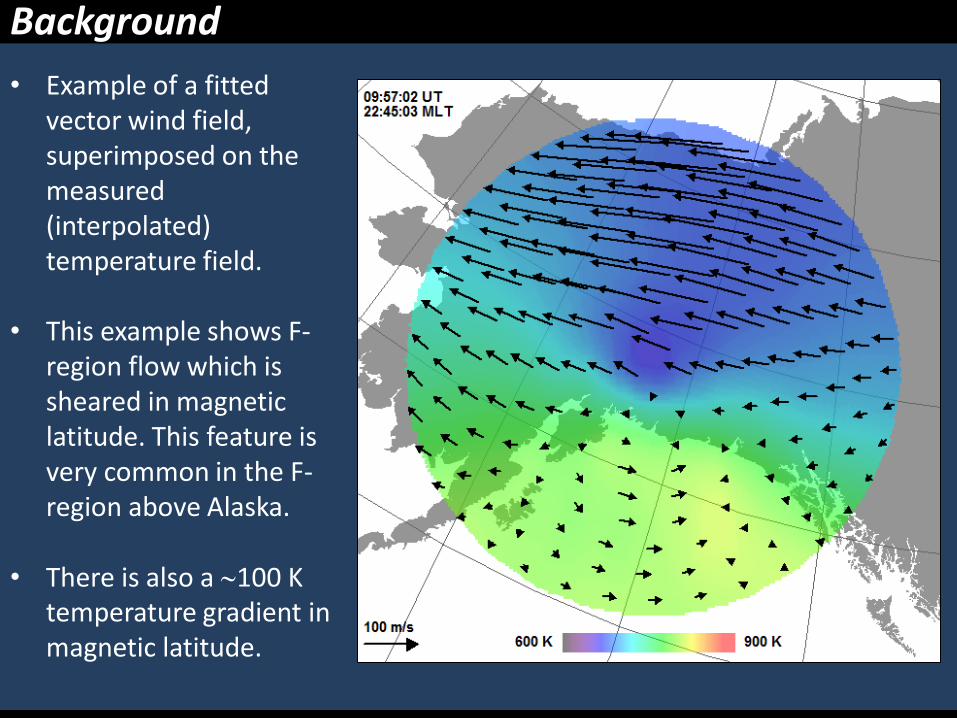
• Example of a fitted vector wind field, superimposed on the measured (interpolated) temperature field.
• This example shows F-region flow which is sheared in magnetic latitude. This feature is very common in the F-region above Alaska.
• There is also a 100 K temperature gradient in magnetic latitude.
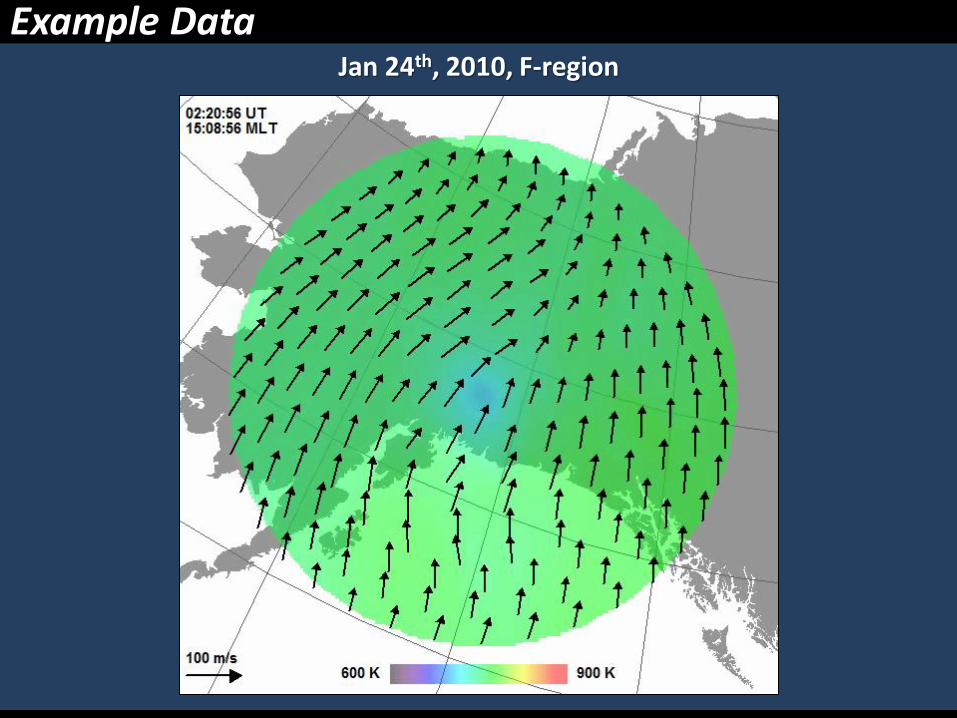
Example Data Jan 24th, 2010, F-region

Example Data Feb 3rd, 2010, F-region
Ion-convection from PFISR
SDI Neutral Winds

Observations during the HAARP Campaign March 22nd – April 5th, 2011

HAARP Campaign, Mar-Apr 2011
March 26th, 2011, E-region
Intensity Temperature

March 29th, 2011, E-region
Intensity Temperature
HAARP Campaign, Mar-Apr 2011

March 29th, 2011, F-region
Intensity Temperature
HAARP Campaign, Mar-Apr 2011

March 30th, 2011, F-region
Intensity Temperature
HAARP Campaign, Mar-Apr 2011

Summary of HAARP Observations
• Observed temperature response is clearly correlated with spot brightness.
• Temperature variations are very likely driven by changes in HAARP-stimulated airglow emission altitude, rather than in-situ processes.
• Wind response is at best very weak, and difficult to separate form natural variability – work in progress!
Dashed line is outside of the heated region

Bistatic Observations
A second SDI instrument operates at Poker Flat. The fields-of-view of the HAARP and Poker Flat instruments overlap. This allows for bistatic measurements. For example, the red line shows locations at which bistatic vertical winds can be derived.
Poker Flat
HAARP
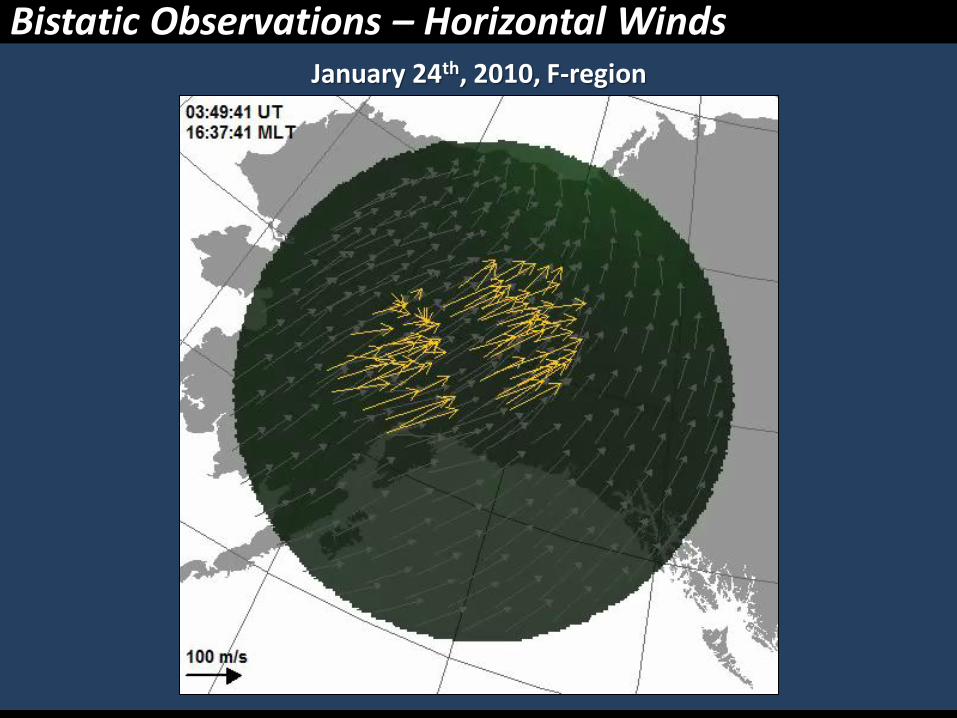
Bistatic Observations – Horizontal Winds January 24th, 2010, F-region

Bistatic Observations
PROS:
• Bistatic horizontal winds can be derived with far fewer assumptions than are required for the single instrument (monostatic) fit technique.
• This allows us to resolve smaller-scale features in the wind field.
• The ability to resolve the spatial variation of vertical winds (next slide). This is not possible with a single ground-based instrument.
CONS:
• Greater sensitivity to observing conditions (especially cloud).
• Difficult to do in the E-region where airglow emission heights are so variable.
• Require both instruments to be running (usually not a problem).
• However, if bistatic winds are
unreliable, we always have single-station winds, so these are not really ‘cons’!

Bistatic Observations – Vertical Winds January 24th, 2010, F-region

Bistatic Observations – Vertical Winds April 5th, 2010, F-region

Summary
• The SDI measures neutral wind, temperature and intensity across a large field-of-view with excellent spatial resolution.
• Significant wind structure is observed over a range of scales (both spatial and temporal).
• Bistatic observations provide even higher spatial resolution, with far fewer assumptions in the derived winds, plus the ability to resolve the spatial variation of the vertical wind field.
• The HAARP SDI clearly observes temperature/intensity variations in response to ionospheric heating.
• These instruments are well suited to providing information on neutral winds and temperatures, important quantities for studying ionosphere/thermosphere coupling (i.e. Joule heating, ion-neutral collision frequency, …)

Thank you!