and society for the study of social problems are ... fileariela schachter, stanford university ......
TRANSCRIPT
Acculturation and Self-Rated Health among Latino and Asian Immigrants to the United StatesAuthor(s): Rachel Tolbert Kimbro, Bridget K. Gorman and Ariela SchachterSource: Social Problems, Vol. 59, No. 3 (August 2012), pp. 341-363Published by: University of California Press on behalf of the Society for the Study of Social ProblemsStable URL: http://www.jstor.org/stable/10.1525/sp.2012.59.3.341 .
Accessed: 03/07/2013 16:52
Your use of the JSTOR archive indicates your acceptance of the Terms & Conditions of Use, available at .http://www.jstor.org/page/info/about/policies/terms.jsp
.JSTOR is a not-for-profit service that helps scholars, researchers, and students discover, use, and build upon a wide range ofcontent in a trusted digital archive. We use information technology and tools to increase productivity and facilitate new formsof scholarship. For more information about JSTOR, please contact [email protected].
.
University of California Press and Society for the Study of Social Problems are collaborating with JSTOR todigitize, preserve and extend access to Social Problems.
http://www.jstor.org
This content downloaded from 128.42.163.38 on Wed, 3 Jul 2013 16:52:26 PMAll use subject to JSTOR Terms and Conditions

Acculturation and Self-Rated Healthamong Latino and Asian Immigrantsto the United States
Rachel Tolbert Kimbro, Rice University
Bridget K. Gorman, Rice University
Ariela Schachter, Stanford University
The ways in which immigrant health profiles change with shifts in acculturation is of increasing interest toscholars and policy makers in the United States, but little is known about the mechanisms that may link acculturationand self-rated health, particularly for Asians. Utilizing the National Latino and Asian American Study (NLAAS)and its data on foreign-born Latinos (N = 1,199) and Asians (N = 1,323) (Pennell et al. 2004), we investigate andcompare the associations between acculturation and self-rated health for immigrants to the United States fromsix major ethnic subgroups (Chinese, Filipino, Vietnamese, Mexican, Cuban, and Puerto Rican). Using comprehensivemeasures of acculturation, we demonstrate that across ethnic groups, and despite the widely varying contexts of thesending countries and receiving communities, native-language dominance is associated with worse self-rated healthrelative to bilingualism, and measures of lower acculturation—coethnic ties and remittances—are associated withbetter self-rated health; and moreover, these associations are only partially mediated by socioeconomic status, and notmediated by acculturative stress, discrimination, social support, or health behaviors. We speculate that immigrantswho maintain a native language while also acquiring English, as has been shown for other immigrant outcomes,attain a bicultural fluency, which also enables good health. Surprisingly, we do not find strong associations betweenduration of time in the United States or age at migration—measures frequently used to proxy acculturation—withself-rated health. Our findings illustrate the complexity of measuring acculturation and its influence on health forimmigrants. Keywords: acculturation; migration; health; language; ethnicity.
In the United States today, approximately one in five persons resides in an immigrant family—being either foreign born or the child of immigrants (Hirschman and Massey 2008). A large pro-portion of population growth over the past 20 years in urban and nonurban areas of the UnitedStates is attributable to births in these immigrant families (Johnson and Lichter 2008), althoughimmigrants, while still concentrated in several states and large urban areas, are residing moreoften in new destinations (Singer 2004). At the same time, a rise in American antipathytowards immigrants, coupled with spiraling health care costs and a new attempt at health carereform, have created a great need for reliable data on the health and well-being of immigrantgroups, and how their incorporation into the United States may influence that health andwell-being. Moreover, to date, research on immigrant incorporation has tended to utilizeunidimensional measures of acculturation (such as the number of years lived in the UnitedStates), despite there being strong theoretical and empirical arguments for complexity under-lying the acculturation process, highlighting the need for multidimensional and ecodevelop-mental frameworks relating acculturation to health (Lopez-Class, Castro, and Ramirez 2011).
Direct correspondence to: Rachel Tolbert Kimbro, Department of Sociology, MS-28, Rice University, 6100 MainSt. Houston, TX 77005; E-mail: [email protected].
Social Problems, Vol. 59, Issue 3, pp. 341–363, ISSN 0037-7791, electronic ISSN 1533-8533. © 2012 by Society for the Study ofSocial Problems, Inc. All rights reserved. Please direct all requests for permission to photocopy or reproduce article contentthrough the University of California Press’s Rights and Permissions website at www.ucpressjournals.com/reprintinfo/asp.DOI: 10.1525/sp.2012.59.3.341.
This content downloaded from 128.42.163.38 on Wed, 3 Jul 2013 16:52:26 PMAll use subject to JSTOR Terms and Conditions

Focusing on the health status of immigrants, which tends to erode over time spent in the UnitedStates—and with acculturation—provides a good case study for the acculturation process, andhighlights the extent to which continuing migration into the United States may shape not onlythe overall health profile of the U.S. population, but the level of need for health-related resour-ces and expenditures in the years to come.
Approximately 80 percent of the foreign born in the United States are from Asian or Hispanicsubgroups (Grieco 2010; Larsen 2004). Overall, studies have shown that immigrants come to theUnited States in better health than their native-born counterparts, but that this benefit erodeswith time (Antecol and Bedard 2006; Cho and Hummer 2001; Singh and Siahpush 2002). This“healthy immigrant effect” is all the more surprising given that the socioeconomic profile of manyimmigrant groups is quite low, and research has repeatedly linked poorer health outcomes tolower socioeconomic status (SES) (House and Williams 2000). Research on self-rated health hasfurther complicated our understanding of immigrant health status, as some studies find better self-rated health among recent immigrants, while others find the reverse (Zsembik and Fennell 2005),a pattern surely complicated by research indicating that the understanding of the actual self-ratedhealth question by immigrant groups may differ from the native born, due to language and inter-pretation issues (Angel and Guarnaccia 1989; Bzostek, Goldman, and Pebley 2007). Therefore, aneed exists for research that both compares self-rated health across immigrant groups, and at-tempts to disentangle relationships among acculturation, language, and self-rated health(Lopez-Class et al. 2011).
In this article, we utilize a nationally representative U.S. data set that includes large samplesof Latino and Asian foreign-born adults to test how acculturation is related to self-rated healthacross six major subgroups (Chinese, Filipino, and Vietnamese ethnic groups among the AsianAmerican sample, and Mexican, Cuban, and Puerto Rican ethnic groups among the Latino sam-ple). We measure acculturation in comprehensive and unique ways, focusing on language abilityin both the respondent’s language of origin and English, the frequency of remittances and returnvisits, age at migration, the closeness of coethnic ties, and whether he/she migrated to find a job.We also explore socioeconomic status, stress and discrimination, social support, and health behav-iors as explanatory mechanisms for the relationships between acculturation and self-rated health.Finally, we test the correlations between self-rated health and several objective health measuresfor each ethnic group to assess whether the meaning of the self-rated health question is likely tovary across groups.
Background
Acculturation and Self-Rated Physical Health
Self-rated health is increasingly acknowledged to be an important indicator of health status. Itis a valid predictor of mortality, even after controlling for a variety of objective health measures(Idler and Benyamini 1997), and studies have repeatedly shown that differences in self-ratedhealth across population subgroups mimic differences seen in more objective measures of healthstatus (Idler, Rusell, and Davis 2000;Månsson and Råstam 2001) andmortality (Franks, Gold, andFiscella 2003; Idler and Angel 1990). Therefore, it is an expedient measure of the general healthstatus of individuals that maps well onto differences in more objective health measures. In addi-tion, we argue that if broad health differences across groups are of interest, a subjective, holisticmeasure like self-rated health captures the totality of an individual’s health status in a way thata single objective measure (or a scale of multiple objective measures) could not. In terms ofracial/ethnic health disparities in themeasure, studies have found that black adults are most likelyto report fair or poor self-rated health, followed by Hispanics, then non-Hispanic whites, and finallyAsians (McGee et al. 1999; Meredith and Siu 1995), although more recently Namratha Kandula,Diane Lauderdale, and David Baker (2007) found Asians to have worse self-rated health compared
342 KIMBRO/GORMAN/SCHACHTER
This content downloaded from 128.42.163.38 on Wed, 3 Jul 2013 16:52:26 PMAll use subject to JSTOR Terms and Conditions

to whites. To date, most health disparities research has focused on the black-white divide inself-rated health, while less is known about Latinos and particularly Asians.
Researchers often focus on acculturation as a possible explanation for self-rated health pat-terns among Latino and Asian adults. While exact definitions vary, acculturation is generally un-derstood to be the process by which immigrants are exposed to the receiving country’s cultureand, over time, adapt characteristics of this culture while simultaneously rejecting characteristicsof the culture of their country of origin (Alba and Nee 1997). Of course, the large social and polit-ical differences in both countries of origin as well as in the contexts of receiving communities(Menjívar 2000; Portes and Rumbaut 2001; Portes and Zhou 1993) imply that the relationshipsbetween acculturation and health most likely will vary for each immigrant subgroup. In health-related research, most studies test the general hypothesis that increasing acculturation decreasesdifferences between whites and Latinos or Asians on rates of fair/poor self-rated health (Abraído-Lanza, Chao, and Florez 2005). For example, Susan Shetterly and colleagues (1996) found thateven controlling for SES, acculturation was a significant predictor of low self-rated health amongLatinos, and that the most acculturated Latinos had the most similar self-rated health when com-pared to whites. Other studies have found similar results for Asian immigrants (e.g., Frisbie, Choand Hummer 2001).
With regard to Latinos, some studies have shown that the less acculturated report worse self-rated health (Franzini and Fernandez-Esquer 2004), findings that seem counterintuitive given thewidely documented healthy immigrant effect found using more objective health status measures.However, Brian Finch and William Vega (2003) found that, controlling for acculturation status,Mexican immigrants reporting higher levels of acculturative stress report poorer self-rated health,suggesting that it is not necessarily those who are most or least acculturated who report the poor-est self-rated health, but rather those most affected by the stress associated with the acculturationprocess. Sharon Bzostek, Noreen Goldman, and Anne Pebley (2007) offer an alternative explana-tion, suggesting that there may be two distinct processes occurring simultaneously: (1) increasingacculturation leads Latinos to rate their health more positively, and (2) the adoption of negativehealth behaviors more prevalent in U.S. society results in Latinos rating their health worse, andthese two processes counteract and effectively cancel out one another. With regard to Asians,much less attention has been paid to the relationship between self-rated health and acculturation,and a need exists for documenting potential differences across Asian ethnic groups. While ElenaErosheva, Emily Walton, and David Takeuchi (2007) found no difference in self-rated healthwhen comparing foreign and U.S.-born Asians, Parker Frisbie, Youngtae Cho, and Robert Hummer(2001) found that Asian immigrants reported better self-rated health compared to U.S.-bornAsians, but that their health advantage decreased over time. Most recently, Zhang and Ta (2009)also found that compared to U.S.-born Asians, recent immigrants were less likely to report lowself-rated health.
Measuring Acculturation
Most research concerning linkages between acculturation and self-rated health focuses onhow time in the United States shifts the cultural and social orientation of immigrants from theirhome country to the United States, and is thought to encompass a variety of aspects of life (e.g.,language, food, social integration, access to and utilization of health care). Many health disparitiesstudies define and test acculturation as a unidimensional transition from sender-country cultureto receiver-country culture (e.g., Palinkas and Pickwell 1995; Salant and Lauderdale 2003), mostcommonly measured using nativity (U.S. or foreign born) and length-of-stay in the United States(e.g., Erosheva et al. 2007). More sophisticated analyses also examine language proficiency andusage, including measures of how much respondents think, write, and use media in Englishand Spanish for Latinos (Finch and Vega 2003; Franzini and Fernandez-Esquer 2004; Schachter,Kimbro, and Gorman 2012). We found similar acculturation measures for nativity and length-of-stay for Asians, but fewer studies were able to use English proficiency because few U.S.-born
Acculturation and Self-Rated Health among Latino and Asian Immigrants 343
This content downloaded from 128.42.163.38 on Wed, 3 Jul 2013 16:52:26 PMAll use subject to JSTOR Terms and Conditions

respondents did not speak English (Erosheva et al. 2007). However, according to a recent reviewby Maria Lopez-Class, Felipe González, and Amelie Ramirez (2011), this common reliance onindicators of language usage and generation status does not capture the nuances involved in theacculturation-health relationship.
In contrast to this unidimensional focus, others have argued for a bidimensional model of ac-culturation (An, Cochran, and Mays 2008; Rogler, Cortes and Malgady 1991; Ryder, Alden, andPaulhus 2000), wherein adaptation to the host country and maintenance of country-of-originpractices are considered independently (Berry 1997). Each of these categories of acculturationmay have different effects on health (Bethel and Schenker 2005), but we expect that in general,evidence ofmaintaining ties to the sending country, in conjunction with evidence of acculturatingto the United States, is likely to be beneficial for the health of immigrants. In linewith this perspec-tive, scholars examining language usage have argued that it, too, should not be seen as a linear,unidimensional transition from Spanish to English (for Latinos), as some Latinos with highEnglish-proficiency may maintain their Spanish language skills (Hunt, Schneider, and Comer2004). However, studies focused on Asians have noted that for some subethnic Asian groups(e.g., Filipinos and selected South Asians), English is the native language, limiting its usage as ameasure in analyses among Asian subethnic groups (Salant and Lauderdale 2003). Nonetheless,we expect language proficiency to be a key predictor of self-rated health for immigrants, sinceimmigrants who are bilingual—highly proficient in both English and their native language—alsocan be expected to have a high degree of “cultural flexibility” that expands their social networksand increases their knowledge of and access to healthy behaviors and health care (Chen, Benet-Martínez, and Bond 2008). In prior work testing the associations between language proficiencyand physical and mental health for panethnic Asian and Latino groups, we found that being bilin-gual was associated with better health compared to being native-language or English dominant(Schachter et al. 2012). Thus, we also hypothesize that simply being English proficient—whilehaving reduced proficiency in a native language—is unlikely to confer the same benefits to health,because it indicates a loss of familiarity with one’s sending country and a lower likelihood of beingconnected to two cultures.
Scholarship examining the health effects of acculturation tends to rely on measures of adap-tation to U.S. society (e.g., (Finch and Vega 2003; Franzini and Fernandez-Esquer 2004), butrarely do these studies also examine the extent to which immigrants maintain country-of-originties and healthy behaviors. Yet, it seems likely that immigrants would benefit from close connec-tions to country-of-origin family and social networks, as these connections are thought to encour-age healthy behaviors and social supports that promote physical and mental well-being (Kimbro2009). For example, previous research, mostly focused on Latino immigrants, has found thatforeign-born residents of the United States who remit money to relatives in their respectivecountries-of-origin tend to be more recent migrants with the strongest personal links back home(DeSipio 2002; Lozano-Ascencio 2005; Sana and Massey 2005). Given this evidence, we wouldexpect that remitting would be a sign of links to the sending country, and, following previousfindings of the healthy immigrant effect, we hypothesize that remitting individuals would belikely to have higher levels of self-rated health compared to individuals who do not remit.
In addition to considering social ties to the country of origin, we also examine immigrants’self-reported levels of ethnic identity and closeness to others of the same race/ethnicity as an ad-ditional aspect of bidimensional acculturation. Here we are informed by Jean Phinney’s (1990)definition of ethnic identity as a measure of respondents’ own sense of belonging to a culture orgroup. Previous scholarship has found that a strong ethnic identity can protect health status byshielding immigrants from negative health behaviors and by increasing the monitoring of healthstatus and health behaviors by coethnic group members (Phinney 1990; Phinney et al. 2001;Frisbie et al. 2001). Additionally, Krysia Mossakowski (2003) argued that ethnic identity can bean important source of social support and that it is protective for immigrant mental health status.We correspondingly hypothesize that immigrants with a stronger sense of closeness to coethnicswill report better self-rated health relative to those who feel less close.
344 KIMBRO/GORMAN/SCHACHTER
This content downloaded from 128.42.163.38 on Wed, 3 Jul 2013 16:52:26 PMAll use subject to JSTOR Terms and Conditions

Following a similar line of reasoning, JohnBerry (1997) and Talya Salant andDiane Lauderdale(2003) have argued that additional contextual factors such as reason for migrating (e.g., economicopportunities) can frame how acculturation occurs for individuals. This context for migration maybe particularly important in health research given the selection argument—the healthy immigranteffectmay be explained by thenecessity of goodhealth in order tomake the often arduous andphys-ically demanding trip to the United States, as well as the high prevalence of young, employment-seekingmales (who tend to have few health problems) amongmigrators (Jasso et al. 2004; Landale,Oropesa, and Gorman 2000). In particular, economic migrants—those whose primary motive formigration is to find a job—may experience more selection effects relative to other immigrants (in-cluding those whose migration is primarily motivated by family reunification or political asylum)based not just on health but also other indicators of labormarket success (Chiswick 1999), Together,this scholarship suggests that economically motivated migrants will report better health statusescompared to other immigrants. Another way tomeasure immigrant country-of-origin ties is the fre-quency of return trips they make. Douglas Massey and Ilana Akresh (2006) have emphasized thatnot all immigrants come to the United States with the intention to remain permanently and becomenaturalized citizens. The permanence ofmigration depends onmany factors, including the economicand social conditions in sending nations, and how satisfiedmigrants arewith their lives in theUnitedStates. Frequency of return trips may tap an individual’s intended degree of permanence in theUnited States, and thus acculturation level.
Explanatory Mechanisms
The relationship between acculturation and self-rated health is almost certainly related tosocioeconomic status, and this relationship likely differs across immigrant subgroups due to thevaried contexts of sending countries and receiving communities, as well as different modes ofemigration (Lara et al. 2005). For example, some Asian immigrants to the United States are highlyeducated, enjoy good access to health care, and have high levels of English ability (Brown et al.2000). In contrast, many immigrants fromMexico have low levels of education and economic sta-tus in the United States (Markides and Eschbach 2005), although this is not necessarily the caseacross all Latino ethnic groups. For example, Cuban immigrants are likely to be highly educated,enjoy relatively high socioeconomic status, and have better health outcomes compared to otherLatinos (Vega and Amaro 1994). We expect that the relationship between acculturation andhealth will be partially explained by SES; that is, that education and income-related measures areresponsible for some of the relationship between acculturation and health. For example, bilingualimmigrants might report better health partially because they are also more likely to be better ed-ucated. Or, immigrants who make more frequent return trips to their countries of origin mightreport better health because they are also likely to have higher incomes. Research also demon-strates, however, that the relationship between SES and health and health behaviors is unusualfor U.S. immigrant groups (Goldman et al. 2006; Kimbro et al. 2008), and that these “healthgradients” are typically flatter for immigrants than for the U.S. born, indicating a reduced salienceof SES factors for predicting immigrant health. If this is the case, we may not see much mediationof acculturation measures by SES measures. Measures of acculturation are also likely boundtogether with SES in ways that might shape physical health outcomes. For example, research onremittances has shown a positive relationship between SES and remitting (Lozano-Ascencio2005). However, Massey and Akresh (2006) have argued that attachment to the United States—and thus one’s likelihood of remitting—is not inherently determined by SES, emphasizing thathighly educated immigrants who earn high incomes are positioned to be very desirable workerswithin the global labor market, and therefore may face little pressure to assimilate. It is unclearhow remittancesmay be tied to self-rated health, but we suspect that more remitting behaviorwillbe linked to better health, and that this may be partially explained by the higher SES necessary forremitting. Alternatively, more remitting might be an indicator of needy family members whohave been left behind in the country of origin, and therefore a source of stress that is linked to
Acculturation and Self-Rated Health among Latino and Asian Immigrants 345
This content downloaded from 128.42.163.38 on Wed, 3 Jul 2013 16:52:26 PMAll use subject to JSTOR Terms and Conditions

poorer health, particularly for immigrants with lower SES (Ward 2010).We thus hypothesize thatSES will be a key mediator of the relationships among our acculturation measures and self-ratedhealth.
We hypothesize further that stress, discrimination, social support, and health behaviors areadditional, but likely less consequential, mediators of the relationship between acculturation andself-rated health. As much as the migration-health scholarship emphasizes the healthy selectionof migrants (e.g., Jasso et al. 2004), this does not overshadow the difficulties associated withmoving from one country to another, particularly the upheaval of relationships with friends andfamily, as migrants break ties with those left behind and seek out new relationships and sources ofsupport in the United States (Rogler 1994). Previous scholarship has demonstrated that both re-cent migrators and more acculturated immigrants can experience high levels of stress relating toresettlement (Kritz and Gurak 2004; Krueger and Chang 2008) and perceived discrimination(Williams, Neighbors, and Jackson 2008), which may impact their physical health status (Finchand Vega 2003). However, scholars note that the migration process also relies on, and reinforces,strong social network support, as migrants often settle in areas where they know people and findother coethnic residents (Arnold 1989; Martin and Midgeley 2006; Sanders, Nee, and Sernan2002; Vega et al. 1991). As such, strong social and family support may counteract the effects ofstress, discourage unhealthy behaviors, and provide positive role models (Finch and Vega 2003;Kawachi and Berkman 2000; Thomson and Hoffman-Goetz 2009). The strength of family andsocial ties may depend on individuals’ levels of acculturation into larger communities (Alba andNee 2003); however, Bridget Gorman, Elaine Ecklund, and Holly Heard (2010) find that meas-ures of integration and social support mediate little of the relationship between immigrant statusand physical health. In the analysis that follows, we test associations between acculturation andself-rated health for six major U.S. immigrant groups, and assess whether the relationshipbetween acculturation and self-rated health are driven by SES or other explanatory factors.
Data, Measures, and Method
Data
Weexamine data on foreign-born adults from theNational Latino andAsian American Study(NLAAS). Collected in 2002–2003, the NLAAS is a nationally representative community house-hold survey designed to examine mental health and health care among U.S. Latinos and AsiansAmericans aged 18 and older. A multistage, stratified national area probability sample was drawnfrom the noninstitutionalized U.S. population, with oversampling of areas with a moderate-to-high density of Latinos and Asian Americans. All interviewers were bilingual, and interviews wereconducted in person and in English, Spanish, Vietnamese, Chinese (eitherMandarin or Cantonese),or Tagalog. The overall response rate was 65.6 percent for Asian Americans and 75.5 percent forLatinos (see Heeringa et al. 2004 and Pennell et al. 2004 for detailed sampling descriptions).Whenweighted, the NLAAS includes a nationally representative sample of 4,649 adults, including 2,554Latinos (including Mexican, Puerto Rican, Cuban, and other Latino groups) and 2,095 AsianAmericans (including Chinese, Vietnamese, Filipino, and other Asian groups). We limit this sam-ple based on three criteria. First, because of our focus on acculturation, we limit the sample toforeign-born respondents, or immigrants (n = 3,266). Next, given our interest in ethnic group dif-ferences, we exclude respondents who do not identify with a specific ethnic group (i.e., “other”Latino and Asian Americans; n = 738). Last, we remove one case with missing information onself-rated health, resulting in a final sample size of 2,522 respondents. Rates of item nonresponseare nonexistent or small (under 2 to 3 percent for most measures), with the exception of onemea-sure, index of neighborhood trust (see measures sections), where 15 percent of cases are missing.All missing data on predictor measures were imputed using the multiple imputation ICEcommand in Stata.
346 KIMBRO/GORMAN/SCHACHTER
This content downloaded from 128.42.163.38 on Wed, 3 Jul 2013 16:52:26 PMAll use subject to JSTOR Terms and Conditions

Measures
Our dependent measure is self-rated health, where respondents are asked to rate their overallphysical health status on a five-point scale (1 = poor and 5 = excellent). Our key predictors are sev-eral measures of acculturation that tap different but interrelated aspects of the acculturative pro-cess for U.S. migrants. This includes indicators of age at migration to the United States (1 = beforeage 18, 0 = age 18+); whether they currently remit money to relatives in their country of origin(1 = yes, 0 = no); how frequently they make return visits to their country of origin (1 = never, 2 = rarely,3 = sometimes, and 4 = often); and the importance of finding a job as their reason for migrating to theUnited States (1 = not at all important, 2 = somewhat, and 3 = very important).We also examine ameasure of coethnic ties, based on the average response to four questions that ask respondents torank how close they feel to others of the same racial/ethnic descent (e.g., “How closely do youidentify with other people who are of the same racial and ethnic descent as yourself?”; α = .66).Finally, we include a measure of whether the respondent is a U.S. citizen (1 = citizen). Given themultidimensional qualities of the acculturation process, compared to creating an acculturationscale, including each of these measures allows for maximum flexibility in measurement—respondents can be high on one measure and low on another. None of the measures werecorrelated more than r = .23.
The NLAAS also includes measures of language use and ability, andwemeasure both Englishand native language proficiency, where respondents are asked to rate their ability to read,write, and speak English and Asian/Spanish on four-point scales (1 = poor and 4 = excellent).Respondents are also asked how much they use each language on a five-point Likert scale(1 = only Asian/Spanish and 5 = only English) in a variety of contexts, including with family, withfriends, and when thinking. Additionally, the NLAAS includes interviewer-rated scores of Englishproficiency for respondents who took the survey in English. John Ayers (2010) has argued thatinterviewer-assessed measures of language ability may be more accurate than self-assessed rat-ings, and using NLAAS data found significant differences in self- and interviewer-assessed ratingsfor individual respondents. However, the NLAAS does not include interviewer-assessed measuresof fluency in native languages. This means that the interviewer-assessed English fluency ratingspromoted by Ayers (2010) are not appropriate for our analysis given our specific interest in bilin-gualism. Also, bilingual English-Spanish speakers were randomly assigned to either the English orSpanish version of the survey, while all other bilingual respondents were allowed to choose whichlanguage they preferred for the interview, meaning that interviewer-assessments of English flu-ency for some bilingual speakers are not included. As such, we cannot consider language of inter-view alone to be an accuratemeasure of English fluency, as some bilingual Latinos were randomlyassigned to the Spanish survey instrument. Nevertheless, we recognize Ayers’ (2010) and Akreshand Reanne Frank’s (2011) caution of using self-reported language proficiency, and note the po-tential for bias in these measures.
We calculated Pearson correlation coefficients for all combinations of the self-rated Englishand native-language variables for reading, writing, and speaking, along with all of the context ofuse languagemeasures, and based on the highmulticollinearity present among these variables wedecided to create scaled measures that would allow us to include multiple indicators of languageuse and context without introducing instability into our models. First, English proficiency is calcu-lated by summing the three measures of respondents’ abilities to read, write, and speak English(α = .97). Higher values on the scale indicate greater proficiency in English. Second, Asian/Spanish(native language) proficiency is based on threemeasures and is the sum of respondents’ values forhow well they read, write, and speak their native language (α = .94). Next, we used cluster anal-ysis (k-means) to discern a sensible grouping of respondents into categories so we could modelproficiency in both languages simultaneously, which resulted in: bilingual (high proficiency onboth scales), native-language dominant (high on native language proficiency but not English), andEnglish dominant (high on English proficiency but not on native language). Next, the three meas-ures for the frequency of English use among friends, family, and while thinking were summed
Acculturation and Self-Rated Health among Latino and Asian Immigrants 347
This content downloaded from 128.42.163.38 on Wed, 3 Jul 2013 16:52:26 PMAll use subject to JSTOR Terms and Conditions
into a scale (α = .86) and divided by three for an average score. Thus, this measure gives the aver-age propensity to use English in several different contexts, and allows us to test whether languageproficiency still matters even in the context of accounting for the frequency of use of English.
We also examine several categories of covariates. Demographic characteristics include gender(1 = female) and age at interview (range: 18 to 97). We include seven key measures of socioeco-nomic status, including dummy variables for completed schooling, which contrasts adults who(1) did not complete high school against (2) those who graduated from high school, and (3) adultswith at least some college experience. We also include dichotomous measures of employment(1 = currently working, 0 = otherwise) and poverty status (1 = income below the 2001 federal pov-erty line, 0 = higher), while for relative income respondents rank from 0 to 10 howwell off they arerelative to all other people in the United States (where higher values = more well off). We alsoinclude measures of the extent to which respondents report that they don’t have enough money tomeet their needs (where 1 = more than enough, 2 = just enough, and 3 = not enough), and whetheradults lack any type of medical insurance coverage.
Several measures of stress and discrimination are also available in NLAAS, including accultur-ative stress, which is a summed index (α = .71) based on responses to nine yes-no questions aboutstress experienced since migrating to the United States (e.g., “Have you felt guilty about leavingfamily or friends in your country of origin?”). We also include the frequency of day-to-day discrimi-natory treatment on the basis of national origin/ancestry, race, or skin color (where 1 = never and6 = almost everyday), constructed from the average of nine questions about routine experienceswith racial discrimination (e.g., being treated with less respect than other people, being callednames or insulted; α = .91). We also construct two measures that tap negative aspects of relation-ships with friends and family. First, our measure of negative social exchanges is an averaged indexbased on four questions that ask how frequently friends and family argue with and make toomany demands on the respondent (where 1 = less than once a month and 5 = almost every day;α = .69). Second, family cultural conflict is an averaged index (α = .76) based on five questions ad-dressing issues of cultural and intergenerational conflict between respondents and their families(e.g., arguments over different customs, personal goals in conflict with family), (1 = hardly everor never, 2 = sometimes, and 3 = often) (see Alegria et al. 2004).
We also control for multiple measures of social networks and support, includingmarital status(1 = married or cohabiting, 0 = otherwise) and the number of adults and children living in the house-hold. Additionally, we construct an index of neighborhood trust, which is the average of seven ques-tions (α = .81) about perceptions of neighborhood safety and social cohesion (e.g., how safe therespondent feels being out alone in his or her neighborhood at night, whether people in theneighborhood can be trusted), where 1 = not at all true and 4 = very true. Positive social support isconstructed from six questions (α = .73) that gauge the availability of support from friends andfamily (e.g., howmuch they can rely on relatives they don’t live with if they have a serious prob-lem), where 1 = less than once a month and 5 = almost every day. Family cohesion is constructedfrom 10 questions (α = .93) that gauge family closeness and communication (e.g., familymemberslike to spend free time with each other, family members feel very close to each other) (1 = hardlyever or never, 2 = sometimes, and 3 = often).
Finally, we control for three health behaviors, including three dummy variables for smokingstatus (current smoker, former smoker, and never smoked), while heavy drinking is defined as twoor more drinks per day for women, and three or more drinks per day for men (USDHHS 2005).Last, wemeasure whether respondents are classified as obese (1 = yes, 0 = no), based on their bodymass index (WHO 1995).
Method of Analysis
All analyses were run using the Stata 12.0 software package. We utilized Taylor-series-approximate methods with SVY commands to adjust for the complex sample design of theNLAAS. All analyses in this article are also weighted with the final sampling weight. We begin by
348 KIMBRO/GORMAN/SCHACHTER
This content downloaded from 128.42.163.38 on Wed, 3 Jul 2013 16:52:26 PMAll use subject to JSTOR Terms and Conditions

presenting sample characteristics for foreign-born NLAAS adults, followed by OLS regressionmodels predicting self-rated physical health for both Latino and Asian American adults, focusingon the role of acculturation in predicting self-rated health, and how this differs across Latino andAsian ethnic groups. We ran our modeling sequence for self-rated health using both ordered logitand OLS regression models, as well as logistic models predicting both good/excellent self-ratedhealth and fair/poor self-rated health; findings were very similar, so we only present results fromOLS models.
Results
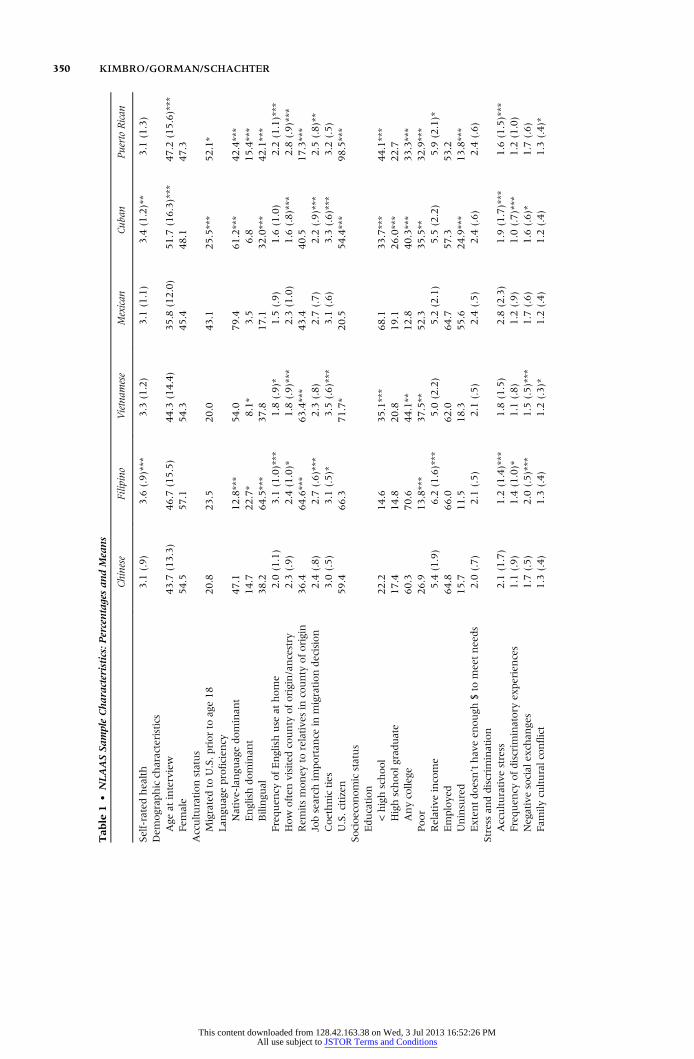
Sample Characteristics
Weighted NLAAS sample characteristics and bivariate tests for difference, by ethnic sub-group, are displayed in Table 1. First, note that Filipinos and Cubans have the highest mean scoreon self-rated health for Asians and Latinos, respectively. In terms of the acculturation measures,while the vast majority (over three-quarters) of Asian subgroupsmigrated after age 18, we see dif-ferences for the Latino subgroups—more Cubans came to the mainland United States at olderages compared to Mexicans and Puerto Ricans. We also see important differences across groupsin our language measures. For Asians, compared to the Chinese subgroup (38.2 percent), moreFilipinos are bilingual (64.5 percent), likely due to the widespread use of English in the Philip-pines. In addition, also compared to those of Chinese origin (14.7 percent), significantly fewerVietnamese immigrants in the United States report high English ability (8.1 percent). For theLatino subgroups, fewer Cubans and Puerto Ricans are Spanish-dominant (61.2 percent and42.4 percent, respectively) compared to Mexicans (79.4 percent).
Compared to immigrants of Chinese origin, those from Vietnam return less often. Com-pared to those of Mexican origin, those from Cuba return less often, and those from PuertoRico return more often, likely due to the legal barriers preventing travel between Cuba andthe United States and the ease of traveling between the United States and Puerto Rico.Remittances also show different patterns across the subgroups. Filipinos and Vietnameseremit at nearly twice the rate of Chinese, while Puerto Ricans are much less likely to do so thaneither Mexicans or Cubans. Filipinos are more likely than Chinese immigrants to cite the impor-tance of finding work for their migration decision, while compared toMexican immigrants, Cubansand Puerto Ricans are less likely to cite a job search as a reason formigrating. Filipinos and Vietnam-ese immigrants report stronger coethnic ties compared to Chinese immigrants, and Cubans reportstronger coethnic ties compared to Mexicans. Finally, Vietnamese immigrants are more likely thanare Chinese immigrants to report being a citizen, while Cubans are significantly more likely thanMexicans to report being a citizen.
The groups also differ widely, as expected, by socioeconomic status. More than half of theChinese and Filipino immigrants in our sample have at least some college education, comparedto percent for the Vietnamese immigrants and just 12.8 percent for Mexican immigrants,40.3 percent for Cubans, and 33.3 percent for Puerto Ricans. Vietnamese, Cuban, and PuertoRican immigrants also demonstrate a bimodal educational distribution—with large proportionsat the low end (less than high school) and high end (some college or more). This illustrates the het-erogeneitywithin immigrant subgroups, andnot just between them.With the exceptionof Filipinos,all immigrant groups have close to or more than one-third of respondents living in poverty.
Additive Regression Models
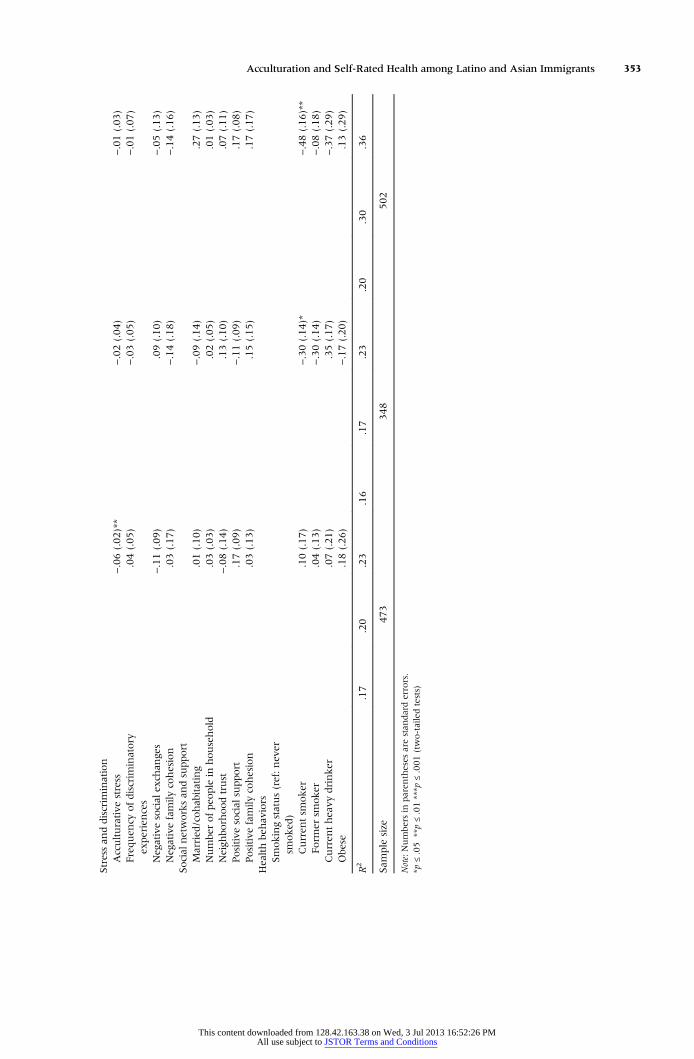
Tables 2 and 3 present results of our first series of OLS regression models predicting self-ratedhealth for all six of our immigrant subgroups. Table 2 presents results for Chinese, Filipino, andVietnamese immigrants, while Table 3 presents results for Mexicans, Cubans, and Puerto Ricans.We show a series of three stepwise models for each group, starting with our baseline models that
Acculturation and Self-Rated Health among Latino and Asian Immigrants 349
This content downloaded from 128.42.163.38 on Wed, 3 Jul 2013 16:52:26 PMAll use subject to JSTOR Terms and Conditions
Tab
le1
•NLAASSampleCharacteristics:P
ercentagesan
dMeans
Chinese
Filipino
Vietnam
ese
Mexican
Cuban
PuertoRican
Self-ratedhealth
3.1
(.9)
3.6
(.9)***
3.3
(1.2)
3.1
(1.1)
3.4
(1.2)**
3.1
(1.3)
Dem
ograp
hicch
aracteristics
Age
atinterview
43.7
(13.3)
46.7
(15.5)
44.3
(14.4)
35.8
(12.0)
51.7
(16.3)***
47.2
(15.6)***
Fem
ale
54.5
57.1
54.3
45.4
48.1
47.3
Acculturationstatus
Migratedto
U.S.priorto
age18
20.8
23.5
20.0
43.1
25.5***
52.1*
Lan
guageproficien
cyNative-langu
agedominan
t47.1
12.8***
54.0
79.4
61.2***
42.4***
Englishdominan
t14.7
22.7*
8.1*
3.5
6.8
15.4***
Bilingu
al38.2
64.5***
37.8
17.1
32.0***
42.1***
Frequen
cyofEnglishuse
athome
2.0
(1.1)
3.1
(1.0)***
1.8
(.9)*
1.5
(.9)
1.6
(1.0)
2.2
(1.1)***
How
often
visitedcounty
oforigin/ancestry
2.3
(.9)
2.4
(1.0)*
1.8
(.9)***
2.3
(1.0)
1.6
(.8)***
2.8
(.9)***
Rem
itsmoney
torelative
sin
county
oforigin
36.4
64.6***
63.4***
43.4
40.5
17.3***
Jobsearch
importan
cein
migrationdecision
2.4
(.8)
2.7
(.6)***
2.3
(.8)
2.7
(.7)
2.2
(.9)***
2.5
(.8)**
Coethnicties
3.0
(.5)
3.1
(.5)*
3.5
(.6)***
3.1
(.6)
3.3
(.6)***
3.2
(.5)
U.S.citizen
59.4
66.3
71.7*
20.5
54.4***
98.5***
Socioeconomicstatus
Education
<highschool
22.2
14.6
35.1***
68.1
33.7***
44.1***
Highschoolgrad
uate
17.4
14.8
20.8
19.1
26.0***
22.7
Anycolle
ge60.3
70.6
44.1**
12.8
40.3***
33.3***
Poor
26.9
13.8***
37.5**
52.3
35.5**
32.9***
Relativeincome
5.4
(1.9)
6.2
(1.6)***
5.0
(2.2)
5.2
(2.1)
5.5
(2.2)
5.9
(2.1)*
Employe
d64.8
66.0
62.0
64.7
57.3
53.2
Uninsured
15.7
11.5
18.3
55.6
24.9***
13.8***
Extentdoesn’thaveen
ough
$to
meetneeds
2.0
(.7)
2.1
(.5)
2.1
(.5)
2.4
(.5)
2.4
(.6)
2.4
(.6)
Stressan
ddiscrim
ination
Acculturative
stress
2.1
(1.7)
1.2
(1.4)***
1.8
(1.5)
2.8
(2.3)
1.9
(1.7)***
1.6
(1.5)***
Frequen
cyofdiscrim
inatory
experiences
1.1
(.9)
1.4
(1.0)*
1.1
(.8)
1.2
(.9)
1.0
(.7)***
1.2
(1.0)
Negativesocial
exch
anges
1.7
(.5)
2.0
(.5)***
1.5
(.5)***
1.7
(.6)
1.6
(.6)*
1.7
(.6)
Fam
ilycu
lturalconflict
1.3
(.4)
1.3
(.4)
1.2
(.3)*
1.2
(.4)
1.2
(.4)
1.3
(.4)*
350 KIMBRO/GORMAN/SCHACHTER
This content downloaded from 128.42.163.38 on Wed, 3 Jul 2013 16:52:26 PMAll use subject to JSTOR Terms and Conditions

Social
networksan
dsupport
Married
/cohab
itating
74.0
77.4
75.8
75.6
65.1**
58.9***
Numbe
rofpeo
ple
inhousehold
2.7
(1.4)
3.2
(1.7)***
3.5
(1.6)***
3.5
(1.8)
2.5
(1.3)***
2.4
(1.4)***
Neigh
borhoodtrust
3.2
(.5)
3.3
(.5)
3.4
(.5)**
3.0
(.6)
3.3
(.6)***
3.0
(.7)
Positive
social
supp
ort
2.4
(.6)
2.7
(.7)***
2.0
(.7)***
2.5
(.7)
2.9
(.7)***
2.7
(.7)**
Fam
ilycohesion
3.6
(.5)
3.8
(.4)***
3.8
(.4)***
3.6
(.5)
3.8
(.4)***
3.6
(.6)
Healthbe
hav
iors
Smokingstatus
Curren
tsm
oker
9.6
13.3
15.3*
14.6
18.9
19.4
Form
ersm
oker
10.8
21.8***
13.5
17.6
23.0
30.0***
Nev
ersm
oked
79.6
64.9***
71.2*
67.8
58.1*
50.6***
Curren
theavy
drinke
r3.4
12.1***
3.5
20.6
17.9
21.9
Obe
se2.6
13.5***
2.5
28.9
22.0
34.8
Sam
ple
size
473
348
502
483
500
216
Note:Numbe
rsin
paren
theses
arestan
darddev
iations.
*p≤.05**p≤.01***p
≤.001(two-tailedtests,relative
toChineseforAsian
responden
tsan
drelative
toMex
ican
sforLatinoresponden
ts)
Acculturation and Self-Rated Health among Latino and Asian Immigrants 351
This content downloaded from 128.42.163.38 on Wed, 3 Jul 2013 16:52:26 PMAll use subject to JSTOR Terms and Conditions

Tab
le2
•Unstan
dardized
Coefficientsfrom
OLSRegressionMod
elsamon
gForeign
-BornAsianAdults,PredictingSelf-RatedHealth
Chinese
Filipino
Vietnam
ese
Model1a
Model2a
Model3a
Model1b
Model2b
Model3b
Model1c
Model2c
Model3c
Dem
ograp
hicch
aracteristics
Age
atinterview
−.01(.00)
−.01(.00)
−.00(.00)
−.02(.00)***
−.02(.00)***
−.02(.00)**
−.02(.00)***
−.02(.00)***
−.02(.00)***
Fem
ale
−.21(.10)
−.20(.12)
−.22(.12)
.09(.10)
.09(.10)
.07(.10)
−.14(.09)
−.16(.08)
−.36(.11)**
Acculturationstatus
Migratedto
U.S.p
riorto
age18
−.06(.12)
−.04(.12)
−.05(.11)
−.22(.20)
−.20(.21)
−.25(.21)
.13(.16)
.20(.16)
.24(.16)
Lan
guageproficien
cy(ref:bilin
gual)
Asian
-lan
guagedominan
t−.40(.14)**
−.35(.15)*
−.34(.15)*
−.67(.15)***
−.65(.16)***
−.66(.17)**
−.29(.13)*
−.33(.12)*
−.26(.13)*
Englishdominan
t−.27(.14)
−.25(.16)
−.29(.15)
−.05(.12)
−.06(.13)
−.01(.15)
−.15(.21)
−.26(.22)
−.37(.19)
Frequen
cyofEnglishuse
athome
.20(.08)*
.16(.07)*
.14(.07)
−.01(.06)
−.01(.06)
.01(.07)
−.01(.11)
−.04(.08)
.01(.08)
How
often
visitedcounty
oforigin
.02(.06)
.00(.05)
.01(.05)
.07(.07)
.07(.07)
.06(.06)
−.14(.08)
−.14(.06)
−.15(.06)*
Rem
itsmoney
torelative
s−.01(.10)
−.03(.09)
−.03(.09)
.00(.17)
.00(.17)
.04(.14)
.59(.15)***
.33(.10)**
.31(.11)**
Jobsearch
importan
cein
migrationdecision
.02(.05)
.03(.05)
.07(.05)
.02(.07)
.03(.06)
.00(.06)
.01(.07)
−.02(.06)
.00(.06)
Coethnicties
−.00(.09)
−.01(.09)
−.02(.08)
.05(.11)
.02(.10)
.01(.12)
.20(.10)
.15(.09)
.10(.09)
U.S.Citizen
.04(.08)
.02(.09)
−.02(.08)
.12(.12)
.08(.12)
.03(.12)
.42(.09)***
.34(.10)**
.35(.11)**
Socioeconomicstatus
Education(ref:<
highschoo
l)Highschoolgrad
uate
−.19(.18)
−.17(.17)
.02(.19)
.12(.20)
−.09(.18)
−.12(.17)
Anycolle
ge−.10(.14)
−.09(.14)
−.06(.16)
.06(.20)
−.40(.13)**
−.46(.13)**
Poor
−.02(.14)
−.07(.13)
−.03(.12)
−.11(.12)
−.29(.11)*
−.25(.13)
Relativeincome
.07(.03)*
.06(.02)*
.04(.04)
.03(.04)
.05(.02)*
.04(.02)
Employe
d.01(.13)
.02(.13)
−.05(.11)
−.11(.12)
.19(.14)
.17(.11)
Uninsured
−.10(.11)
−.10(.13)
−.01(.16)
−.08(.19)
−.10(.14)
−.02(.14)
Extentdoesn’thav
een
ough
$to
meetneeds
−.05(.06)
−.05(.05)
−.16(.11)
−.17(.12)
−.41(.11)***
−.37(.11)**
352 KIMBRO/GORMAN/SCHACHTER
This content downloaded from 128.42.163.38 on Wed, 3 Jul 2013 16:52:26 PMAll use subject to JSTOR Terms and Conditions
Stressan
ddiscrim
ination
Acculturative
stress
−.06(.02)**
−.02(.04)
−.01(.03)
Frequen
cyofdiscrim
inatory
experiences
.04(.05)
−.03(.05)
−.01(.07)
Negativesocial
exch
anges
−.11(.09)
.09(.10)
−.05(.13)
Negativefamily
cohesion
.03(.17)
−.14(.18)
−.14(.16)
Social
networksan
dsupport
Married
/cohab
itating
.01(.10)
−.09(.14)
.27(.13)
Numbe
rofpeo
ple
inhousehold
.03(.03)
.02(.05)
.01(.03)
Neigh
borhoo
dtrust
−.08(.14)
.13(.10)
.07(.11)
Positive
social
supp
ort
.17(.09)
−.11(.09)
.17(.08)
Positive
family
cohesion
.03(.13)
.15(.15)
.17(.17)
Healthbe
hav
iors
Smokingstatus(ref:never
smoked
)Curren
tsm
oker
.10(.17)
−.30(.14)*
−.48(.16)**
Form
ersm
oker
.04(.13)
−.30(.14)
−.08(.18)
Curren
theavy
drinke
r.07(.21)
.35(.17)
−.37(.29)
Obe
se.18(.26)
−.17(.20)
.13(.29)
R2
.17
.20
.23
.16
.17
.23
.20
.30
.36
Sam
ple
size
473
348
502
Note:Numbe
rsin
paren
theses
arestan
darderrors.
*p≤.05
**p≤.01***p
≤.001(two-tailedtests)
Acculturation and Self-Rated Health among Latino and Asian Immigrants 353
This content downloaded from 128.42.163.38 on Wed, 3 Jul 2013 16:52:26 PMAll use subject to JSTOR Terms and Conditions

Tab
le3
•Unstandardized
Coefficientsfrom
OLSRegressionMod
elsamon
gForeign
-BornLatinoAdu
lts,PredictingSelf-R
atedHealth
Mexican
Cuban
PuertoRican
Model1a
Model2a
Model3a
Model1b
Model2b
Model3b
Model1c
Model2c
Model3c
Dem
ograp
hicch
aracteristics
Age
atinterview
−.02(.00)***
−.01(.00)***
−.01(.00)**
−.02(.00)***
−.02(.00)***
−.02(.01)**
−.02(.00)***
−.02(.00)***
−.02(.01)**
Fem
ale
−.15(.10)
−.10(.10)
−.02(.09)
−.39(.10)**
−.30(.08)**
−.38(.10)**
−.19(.19)
−.15(.22)
−.12(.21)
Acculturationstatus
Migratedto
U.S.priorto
age18
.04(.11)
.04(.11)
.06(.10)
−.10(.20)
−.26(.19)
−.32(.18)*
−.27(.13)*
−.21(.14)
−.03(.11)
Lan
guageproficien
cy(ref:b
ilingu
al)
Span
ish-lan
guagedominan
t.07(.15)
.13(.16)
.05(.14)
−.39(.11)**
−.34(.08)***
−.32(.14)**
−.99(.23)***
−.62(.27)*
−.48(.20)*
Englishdominan
t−.27(.41)
−.22(.42)
−.16(.33)
.04(.23)
.03(.23)
−.01(.20)
−.51(.31)
−.34(.27)
−.42(.31)
Frequen
cyofEnglishuse
athome
.29(.11)*
.24(.11)**
.24(.11)*
.06(.10)
.04(.10)
.07(.09)
.19(.12)
.19(.12)
.23(.12)
How
often
visitedcounty
of
origin
.03(.05)
.02(.05)
.03(.05)
−.06(.06)
−.09(.06)
−.06(.05)
−.10(.08)
−.12(.10)
−.05(.08)
Rem
itsmoney
torelative
s−.16(.15)
−.16(.13)
−.11(.12)
.39(.10)**
.31(.11)**
.33(.11)**
.24(.18)
.06(.17)
.09(.24)
Jobsearch
importan
cein
migrationdecision
.05(.10)
.06(.11)
.08(.10)
−.08(.04)
−.08(.04)
−.07(.05)
.03(.13)
.05(.13)
.03(.10)
Coethnicties
.24(.10)*
.22(.10)*
.19(.11)
.16(.09)
.13(.08)
.07(.09)
.12(.09)
.16(.09)
.02(.11)
U.S.citizen
−.03(.14)
−.09(.14)
−.11(.13)
.22(.15)
.18(.15)
.18(.16)
––
–
Socioeconomicstatus
Education
(ref:<highschool)
Highschoolgrad
uate
.20(.12)
.16(.11)
.02(.13)
.09(.14)
−.05(.26)
−.10(.29)
Anycolle
ge.05(.18)
−.04(.16)
−.19(.12)
−.12(.11)
.47(.20)*
.41(.24)
Poor
.03(.09)
.07(.11)
.01(.12)
.04(.12)
−.08(.20)
−.08(.18)
Relativeincome
.05(.02)*
.03(.02)
.13(.02)***
.11(.02)***
.08(.03)*
.07(.03)
Employe
d.14(.15)
.15(.14)
.40(.11)**
.39(.13)**
.11(.26)
.09(.26)
Uninsured
−.08(.13)
−.13(.12)
.06(.10)
.06(.10)
−.14(.18)
−.17(.26)
Extentdoesn’thav
een
ough
$to
meetneeds
−.09(.10)
−.12(.09)
−.07(.11)
−.01(.11)
−.03(.12)
.04(.12)
354 KIMBRO/GORMAN/SCHACHTER
This content downloaded from 128.42.163.38 on Wed, 3 Jul 2013 16:52:26 PMAll use subject to JSTOR Terms and Conditions
Stressan
ddiscrim
ination
Acculturative
stress
−.01(.03)
−.03(.03)
−.02(.04)
Frequen
cyofdiscrim
inatory
experiences
.19(.05)**
.02(.07)
.02(.09)
Negativesocial
exch
anges
−.26(.08)**
−.13(.05)*
−.14(.13)
Fam
ilycu
lturalconflict
.08(.21)
.15(.20)
.12(.26)
Social
networksan
dsupport
Married
/cohab
itating
.00(.09)
−.02(.12)
−.03(.14)
Numbe
rofpeo
ple
inhousehold
.04(.03)
.10(.03)**
.13(.05)*
Neigh
borhoodtrust
−.08(.09)
.14(.11)
.19(.12)
Positive
social
support
.11(.07)
.23(.06)**
.14(.13)
Fam
ilycohesion
.18(.10)
−.03(.17)
−.07(.11)
Healthbe
haviors
Smokingstatus(ref:nev
ersm
oked
)Curren
tsm
oker
.16(.12)
−.15(.12)
−.33(.21)
Form
ersm
oker
.12(.13)
−.22(.09)*
−.27(.15)
Curren
theavy
drinker
.01(.13)
−.07(.13)
.08(.19)
Obe
se−.35(.15)*
−.19(.12)
−.39(.13)**
R2
.09
.11
.18
.21
.30
.34
.32
.38
.44
Sam
ple
size
483
500
216
Note:Numbe
rsin
paren
theses
arestan
dard
errors.
*p≤.05**p≤.01***p
≤.001
(two-tailedtests)
Acculturation and Self-Rated Health among Latino and Asian Immigrants 355
This content downloaded from 128.42.163.38 on Wed, 3 Jul 2013 16:52:26 PMAll use subject to JSTOR Terms and Conditions

include age, gender, and our acculturation measures, then adding our SES measures, and finallyadding our additional mediating measures, including stress and discrimination, social networksand support, and health behaviors. Starting first with the Asian immigrant models, note that oneof the most common measures of acculturation—lifecourse timing of migration—is not a signifi-cant predictor of self-rated health across any of the Asian immigrant groups. Additional bivariatemodels (not shown) demonstrate that migrating as a child is positively associated with higher self-rated health for Chinese and Vietnamese, but not Filipino immigrants. However, this significantassociation is mediated by the other acculturation measures that we utilize in our full models.
Next, we see a broadly similar pattern across groups for the language measures, where com-pared to bilingual immigrants, those who are Asian-language dominant—typically a marker oflower acculturation—report lower self-rated health. With the exception of Vietnamese immi-grants, there are very few additional associations between the acculturation measures andself-rated health. Chinese immigrants who use English at home more frequently report slightlybetter self-rated health. For Vietnamese immigrants, remitting money to relatives and being aU.S. citizen are associatedwith significantly better self-rated health, although both associations arepartially mediated by the inclusion of the SESmeasures, specifically relative income for citizenship(using a Sobel test for mediation, Z = 3.51, p < .001) and not having enoughmoney tomeet needs(Z = 2.21, p > .05), and for remitting, not having enough money to meet needs (Z = 2.75, p < .01),indicating that part of the beneficial influence of remitting is due to higher SES.
Finally, in Model 3 for each group we add our remaining mediator variables. Across all threeethnic groups, with the exception of the remitting and citizenship associations for Vietnameseimmigrants, we see very little evidence that any of our proposed mediators influence the associa-tion between acculturation and self-rated health, which is unsurprising given that only a few ofthe acculturationmeasures are meaningful predictors of self-rated health. This is particularly clearfor the language coefficients, which remain very similar across all three models for all threegroups, despite controlling for a wide variety of proposedmechanisms that may link acculturationand health status. Clearly, language proficiency is a key predictor of self-rated health, with bilin-gual immigrants reporting the best self-rated health across all ethnic groups, although the distinc-tion between bilingual and English-dominant speakers is suggestive, it is not significant.
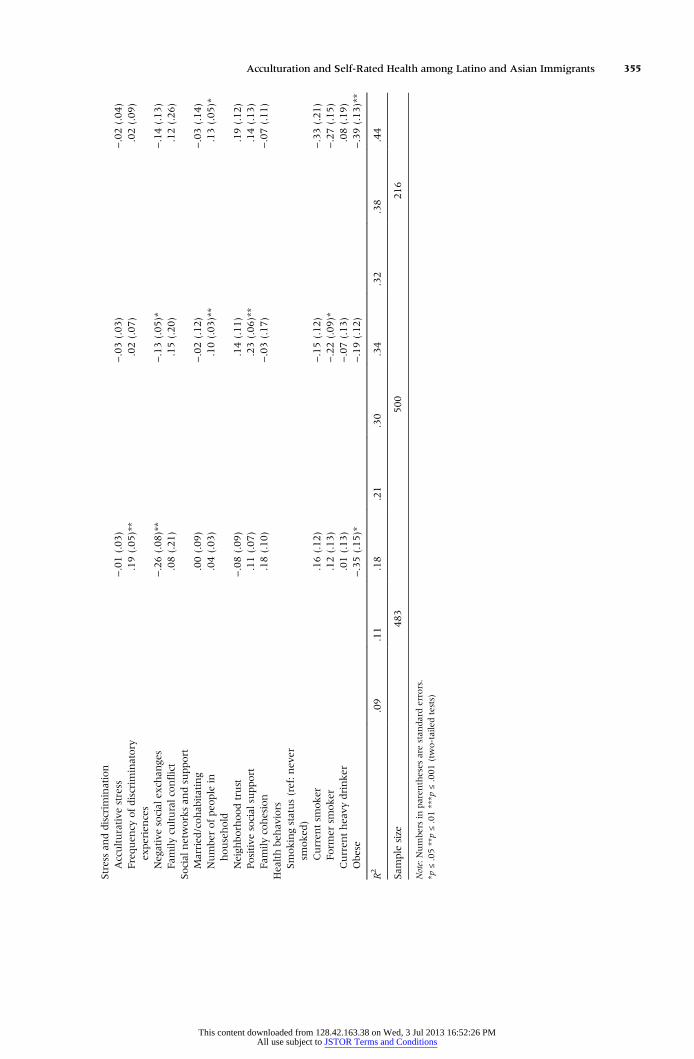
Table 3 reports the same series of regression results for Latino immigrants, and, unlike for Asianimmigrants, we see a significant number of associations between acculturation and self-ratedhealth, with divergent results for the acculturation measures across the three ethnic groups. ForMexicans in Model 1a, the frequency of English use at home is positively associated with self-ratedhealth, as is the degree of coethnic ties, indicating some potentially contradictory associationsbetween acculturation and self-rated health. For Cubans, relative to being bilingual, those who areSpanish-dominant report lower self-rated health. In addition, remitting money to relatives ispositively associated with self-rated health. Puerto Ricans who are Spanish-dominant reportmuch lower levels of self-rated health compared to those who are bilingual. Other than the lan-guagemeasures, acculturation does not seem to play much of a role in predicting self-rated healthfor Puerto Ricans (except for a significant, negative effect of migrating as a child in Model 1, butthis is reduced to nonsignificance once we adjust for SES in Model 2). For all three Latino groups,bivariate models (not shown) indicate significant, positive relationships between migrating as achild and self-rated health, but this relationship is attenuated (or reversed, in the case of PuertoRicans) with the inclusion of our additional acculturation measures as shown.
AcrossModels 2a and 3a forMexican immigrants, there is no significant mediation of the fre-quency of English use effect with the addition of SES and other mediators. Interestingly, the fre-quency of discriminatory experiences is positively associated with self-rated health while negativesocial exchanges are negatively associatedwith self-rated health. For Cubans we see a slight atten-uation of the Spanish-dominant association with self-rated health once we control for SES, attrib-utable in part to remittances (Z = −2.16, p < .05); we also see an attenuation of the associationbetween remitting and self-rated health, but this attenuation did not achieve significance with aSobel test for mediation. Also of note for Cubans is that negative social exchanges are negatively
356 KIMBRO/GORMAN/SCHACHTER
This content downloaded from 128.42.163.38 on Wed, 3 Jul 2013 16:52:26 PMAll use subject to JSTOR Terms and Conditions
related to self-rated health while number of residents in the household, as well as positive socialsupport, are positively related to self-rated health. The inclusion of these potential mediators,however, does not substantively influence the relationships between acculturation and self-ratedhealth. In addition, after controlling for SES and the rest of the covariates, age at migrationemerges as a significant, negative predictor of self-rated health for Cubans such that migrating asa child is negative for health status. Finally, in Model 2c, for Puerto Ricans, we see an attenuationof the influence of Spanish-dominance on self-rated health with the inclusion of the SES meas-ures. The primary mediator of this relationship is having attended any college (Z = −3.33,p < .001). Similar to the results for Cubans, the number of people in the household is positivelyrelated to health status for Puerto Ricans. After the inclusion of all of our potential mediatingvariables, Spanish-dominance remains a strong, negative influence on self-rated health for PuertoRicans.
In order to check the robustness of our results, and because of concerns that the concept ofself-rated health could have different meanings to different ethnic groups (or that the questionmay be interpreted differently by different groups), we tested correlations between self-ratedhealth and objective health measures (i.e., ever had arthritis/rheumatism, chronic back/neckproblems, severe headaches, other chronic pain, seasonal allergies, stroke, heart disease, heartattack, high blood pressure, asthma, chronic lung disease, diabetes, ulcer, epilepsy, cancer, and thetotal number of chronic conditions) in our data for each group (not shown). Correlations betweenself-rated health and objective health measures were in the same direction across ethnic groups,without exception, although the magnitude of the correlation varied. No group, however, stoodout as having particularly high or low correlations between health conditions and self-ratedhealth. We also tested three objective, diagnosed health measures as outcomes—hypertension,diabetes, and heart disease—to see whether the relationship between our acculturation measuresand these outcomes differed from those for self-rated health (not shown). In general, observedacculturation relationships for self-rated health were repeated in models for the objective condi-tions, although it varied by outcome. In addition, we tested whether self-rated health responsesvaried systematically by language of interview for our bilingual respondents (who might havechosen to take the survey in either English or their native language). Although our sample sizesin each group were small, we did not find evidence that mean scores on the self-rated healthmeasure varied by language of interview. Thus, we feel confident that there are not major prob-lems with translation issues for the self-rated health question.
Discussion
Our results highlight the importance of more nuanced analysis of the acculturation-healthrelationship. We find mixed support for our hypothesis that bilingual immigrants report betterself-rated health relative to both native- and English-language dominant immigrants. Whilenative-language dominance consistently has a significant, negative effect on self-rated health(except for Mexicans) even after accounting for measures of SES, stress and discrimination, socialnetworks and social support, and health behaviors, we do not find similar results for English-language dominance. However, beyond language we find limited evidence of systematic patternsin our acculturation measures that cut across individual ethnic groups. We do find that remittingmoney home is positive for the health of Vietnamese and Cuban immigrants, which suggests thatremittances may mean something different for refugee/asylee groups. Also, strong coethnic tiesappear to be beneficial for Mexican immigrants, although the significance of this factor is reducedin the full models. Citizenship emerges as an important predictor of self-rated health only forVietnamese immigrants. Additionally, we are struck by the lack of significant effects for age atmigration (except for Cuban immigrants and for Puerto Ricans), a commonly employed proxy foracculturation status, which has been used in many of the studies demonstrating a negative rela-tionship between acculturation and self-rated health (Lopez-Class et al. 2011). Taken all together,
Acculturation and Self-Rated Health among Latino and Asian Immigrants 357
This content downloaded from 128.42.163.38 on Wed, 3 Jul 2013 16:52:26 PMAll use subject to JSTOR Terms and Conditions

our findings suggest that how scholars measure acculturation may strongly influence theirfindings, and caution against simplistic conclusions that acculturation is good or bad for the healthstatus of immigrants.
First, for all country-of-origin groups but Mexicans, results demonstrate that being bilingual—in English and one’s native language—is associated with higher self-rated health compared to na-tive-language dominance. This trend holds both for immigrants coming from countries where littleEnglish is spoken—such as Cuba and Vietnam—as well as those frommore bilingual contexts, likePuerto Rico and the Philippines, where English is an official language. While controlling for SES,along with stress and discrimination and social supportmeasures, does slightly attenuate the differ-ences among the language proficiency groups, bilingualism remains a significant contrast, particu-larly from those who are native-language dominant. Following the bidimensional model ofacculturation articulated earlier, we do not consider bilingualism to be a classification of high or lowacculturation. Rather, we are informed by Alejandro Portes and Ruben Rumbault (2001) whohave advanced a theory of selective acculturation where immigrants use strong social supportnetworks as protection against discrimination and for assistance with navigating the U.S. educa-tional system and labor market to achieve upward assimilation through bilingualism andbiculturalism. This contention is supported by scholarship in psychology finding that strong profi-ciency in both languages reflects a “cultural flexibility,” which is beneficial for psycho-social well-being by allowing bilingual immigrants tomore easily navigate the culture of sending and receivingcountries (Chen, Benet-Martínez, and Bond 2008; Lang et al. 1982; Ying 1995). Altogether, thisscholarship suggests that bilingual immigrants may be able to retain social support from coethnicswhile also having the language skills necessary to advance economically and form ties with native-born Americans, and our findings show that these advantages should extend to better self-ratedhealth.
However, our conclusions on the benefits of bilingualism are tempered when we considerthat there is no evidence that bilingualism is significantly better than English-language dominancein terms of health status, despite previous research showing a positive relationship between bilin-gualism and self-rated physical health (Mulvaney-Day, Alegría, and Sribney 2007; Schachter et al.2012). It is possible that given the importance of English for accessing health care in the UnitedStates, English fluency, regardless of native-language maintenance, plays an important role indetermining immigrant health status. Nevertheless, we argue that the negative (although notsignificant) effects of English dominance relative to bilingualism found for all groups but Cubans,are suggestive that bilingualism may be advantageous for immigrant health status across at leastsome ethnic groups.
To the best of our knowledge, little other scholarship has studied the effects of bilingualism—
as opposed to just English proficiency—on health, perhaps due to the starkly different resultsobtained forMexicans compared to other groups. Interestingly, we do find that higher frequenciesof English use at home is positive for the health status of Mexicans, which we interpret as evi-dence that language is related to the self-rated health of Mexicans, but that the relationship oper-ates somewhat differently compared to other immigrant groups. Indeed, in their analysis of therole of language proficiency in health status, Anthony Jerant, Rose Arellanes, and Peter Franks(2008) found different moderating effects of language for Mexicans compared to other ethnicgroups and called for further research that disaggregates Hispanics into country-of-origin groups.Our results support this finding, and highlight a potential trap for scholarship that assumes popu-lation samples with high ratios of Mexicans are representative of all Latinos. While this strategy isoften employed due to the difficulty of obtaining large enough sample sizes of non-MexicanLatino subgroups, doing so may hide important findings, such as the role of bilingualism in theself-rated health of Cubans and Puerto Ricans. Nevertheless, we recognize that scholars are oftenconfrontedwithmore ethnically limited samples, and in these cases we suggest limiting analysis tothe largest single subethnic group. Alternatively, when this strategy is not possiblewe recommendscholars include indicators of the context of reception, such as legal status and the percent ofcoethnics in the neighborhood, as rough proxies for the important differences associated with
358 KIMBRO/GORMAN/SCHACHTER
This content downloaded from 128.42.163.38 on Wed, 3 Jul 2013 16:52:26 PMAll use subject to JSTOR Terms and Conditions

country of origin groups, although we caution that this is far from ideal. Similarly, scholarship onAsian immigrant health has also focused on English acquisition (Salant and Lauderdale 2003),perhaps because English proficiency rates are high for many Asian subethnic groups. However,our results indicate that even for immigrants from the Philippines—where English is the domi-nant language used by the government and in schools—fluency in a traditional, non-Englishlanguage is positively related to health, and we urge scholars to consider bilingualism in futurestudies of Asian immigrant outcomes.
Our results also demonstrate that other measures of acculturation have inconsistent effectson self-rated health. First, we find that remitting is positive for the health statuses of Vietnameseand Cuban immigrants, but that it has no significant effect for other immigrant groups. In addi-tional models (not shown), we tested whether there might be nonlinear effects of remittances onself-rated health, and we find that remittances are more strongly associated with self-rated healthat the bottom of the scale—fair or poor health—than at the top of the scale—good or excellenthealth. In other words, remittances are protective of poor health for Vietnamese and Cubanimmigrants but do not provide additional benefits at the upper end of the distribution. We specu-late that we may find this pattern for Vietnamese and Cuban immigrants but not for other groupsbecause of the unique incorporation experiences of both groups as political asylees/refugees in theUnited States, as well as conditions in their countries of origin (Portes and Rumbaut 2001; Portesand Zhou 1993). Alternatively, Mariano Sana and Massey (2005) have suggested that measuresof remittances may be inaccurate for Mexican immigrants, who are often able to takemoneywiththem on trips to Mexico given its proximity to the United States, so it is possible that our measureof remittances does not truly capture the remitting behavior of Mexican (and other) immigrants.All together, more research on the relationships among country of origin, remittance practices,and health status are needed to clarify this finding.
Second, as hypothesized, we find evidence that having a strong ethnic identity as measuredby the strength of respondents’ ties to coethnics is associated with better self-rated health forMexican immigrants, but this association is attenuated by the collective effects of our proposedmediators. The ability to account for citizenship among our sample is an important strength of thisanalysis. Interestingly, however, only for Vietnamese immigrants does U.S. citizenship emerge asa significant predictor of self-rated health. Finally, there are two additional findings worthhighlighting. First, despite its near-universal usage in immigrant health disparities research as aprimary measure of acculturation, we find no relationship between the duration of time spent inthe United States and self-rated health, andwe also find that age at migration is only significant forPuerto Ricans and for Cuban immigrants. These findings should further convince scholars of thebenefits of including multiple measures of acculturation in their models, which speak to immi-grants’ social and cultural ties to their countries-of-origin and to the United States. Second, wenote that compared to our other, objective measures of SES, relative income is significant in thefull additive models much more often. Our finding that traditional SES measures are not impor-tant predictors of self-rated health supports other studies finding suppressed effects of SES onhealth for immigrants (Goldman et al. 2006; Kimbro et al. 2008). Moreover, the fact that relativeincome—a subjective measure of one’s income relative to others—is significant suggests thatimmigrants view their health status more positively when they believe that they fall more favor-ably along the socioeconomic spectrum compared to other persons living in the United States(Schnittker and McLeod 2005).
There are some limitations to our study. First, our analysis employs cross-sectional data andwe cannot employ longitudinal measures of health status or acculturation. Additionally, althoughwe include multiple measures of acculturation to develop a more nuanced view of immigrants’cultural fluency in their countries-of-origin and the United States, it remains possible that addi-tional, unobserved factors such as media consumption and the adoption of other “Americanized”norms and values may more accurately capture immigrants’ levels of acculturation. In particular,while we believe that our measures accurately represent immigrants’ ties to their countries-of-origin, our study lacks similar measures focusing on immigrants’ ties to the United States, such as
Acculturation and Self-Rated Health among Latino and Asian Immigrants 359
This content downloaded from 128.42.163.38 on Wed, 3 Jul 2013 16:52:26 PMAll use subject to JSTOR Terms and Conditions

having a bank account or homeownership. However, we remain confident that our analysis, withits focus on six major U.S. immigrant ethnic groups, significantly expands upon the current normof relying on only a few measures of acculturation—namely age at migration, duration in theUnited States, and English proficiency—and represents a significant step forward in the literatureexamining immigrant health disparities. Furthermore, our results demonstrate that it is inaccurateto conclude that acculturation is necessarily bad for immigrant health outcomes; rather, learningEnglish while maintaining strong fluency in a native language, along with remitting money homeand developing a strong ethnic identity, are all associated with better self-rated health, providingfurther support for bidimensional acculturation models. The process of immigrant adaptation asrelated to health status, and the fate of the second generation, will have significant impacts on theoverall health of the United States in the decades to come, further stressing the importance ofmore theoretically and empirically nuanced analyses of the relationships among acculturationand health status for immigrant groups.
References
Abraído-Lanza, Ana,Maria Chao, andKaren Flórez. 2005. “DoHealthy Behaviors Decline with Greater Accul-turation?: Implications for the Latino Mortality Paradox.” Social Science & Medicine 61(6):1243–55.
Akresh, Ilana Redstone and Reanne Frank. 2011. “At the Intersection of Self and Other: English LanguageAbility and Immigration Labor Market Outcomes.” Social Science Research 40(5):1362–70.
Alba, Richard and Victor Nee. 1997. “Rethinking Assimilation Theory for a New Era of Immigration.” Interna-tional Migration Review 31(4):826–74.
———. 2003. Remaking the American Mainstream. Cambridge, MA: Harvard University Press.Alegria, Margarita, Doryliz Vila, Meghan Woo, Glorisa Canino, David Takeuchi, Mildred Vera, Vivian Febo,
Peter Guarnaccia, Sergio Aguilar-Gaxiola, and Patrick Shrout. 2004. “Cultural Relevance and Equiva-lence in the NLAAS Instrument: Integrating Etic and Emic in the Development of Cross-Cultural Meas-ures for a Psychiatric Epidemiology and Services Study of Latinos.” International Journal of Methods inPsychiatric Research 13(4):270–88.
An, Ning, Susan D. Cochran, and Vickie M. Mays. 2008. “Influence of American Acculturation on CigaretteSmoking Behaviors among Asian American Aubpopulations in California.” Nicotine & Tobacco Research10(4):579–87.
Angel, Ronald and Peter J. Guarnaccia. 1989. “Mind, Body, and Culture: Somatization among Hispanics.”Social Science & Medicine 28(12):1229–38.
Antecol, Heather and Kelly Bedard. 2006. “Unhealthy Assimilation: Why do Immigrants Converge to Ameri-can Health Status Levels?” Demography 43(2):337–60.
Arnold, Fred. 1989. “Unanswered Questions About the ImmigrationMultiplier.” International Migration Review23(4):889–92.
Ayers, JohnW. 2010. “Measuring English Proficiency and Language Preferece: Are Self-Reports Valid?” Amer-ican Journal of Public Health 100(8):1364–66.
Berry, John. 1997. “Lead Article: Immigration, Acculturation, and Adaptation.” Applied Psychology: An Interna-tional Review 46(1):5–68.
Bethel, Jeffrey W. and Marc B. Schenker. 2005. “Acculturation and Smoking Patterns among HispanicsA Review.” American Journal of Preventive Medicine 29(2):143–48.
Brown, E. Richard, Victoria D. Ojeda, Roberta Wyn, and Rebecca Levan. 2000. “Racial and Ethnic Disparities inAccess to Health Insurance and Health Care.” Los Angeles, CA: UCLA Center for Health Policy Research.
Bzostek, Sharon, Noreen Goldman, and Anne R. Pebley. 2007. “Why do Hispanics in the USA Report PoorHealth?” Social Science & Medicine 65(5):990–1003.
Chen, Svlvia X., Verónica Benet-Martínez, andMichael H. Bond. 2008. “Bicultural Identity, Bilingualism, andPsychological Adjustment in Multicultural Societies: Immigration-Based and Globalization-Based Accul-turation.” Journal of Personality 76(4):803–38.
Chiswick, Barry R. 1999. “Are Immigrants Favorably Self-Selected?” American Economic Review 89(2):181–85.Cho, Yongtae and Robert Hummer. 2001. “Disability Status Differentials across Fifteen Asian and Pacific
Islander Groups and the Effect of Nativity and Duration of Residence in the U.S.” Social Biology48(3–4):171–95.
360 KIMBRO/GORMAN/SCHACHTER
This content downloaded from 128.42.163.38 on Wed, 3 Jul 2013 16:52:26 PMAll use subject to JSTOR Terms and Conditions
DeSipio, Louis. 2002. “Sending Money Home . . . For Now: Remittances and Immigrant Adaptation in theUnited States.” Pp. 157–87 in Sending Money Home: Hispanic Remittances and Community Development, editedby Rodolfo de la Garza and Briant Lindsay Lowell. Lanham, MD: Rowman & Littlefield.
Erosheva, Elena, Emily C. Walton, and David T. Takeuchi. 2007. “Self-Rated Health among Foreign- andU.S.-Born Asian Americans: A Test of Comparability.” Medical Care 45(1):80–87.
Finch, Brian. K. and William A. Vega. 2003. “Acculturation Stress, Social Support, and Self-Rated Healthamong Latinos in California.” Journal of Immigrant Health 5(3):109–17.
Franks, Peter, Marthe R. Gold, and Kevin Fiscella. 2003. “Sociodemographics, Self-Rated Health, and Mortalityin the U.S.” Social Science & Medicine 56(12):2505–14.
Franzini, Louisa and Maria E. Fernandez-Esquer. 2004. “Socioeconomic, Cultural, and Personal Influences onHealth Outcomes in Low Income Mexican-Origin Individuals in Texas.” Social Science & Medicine59(8):1629–46.
Frisbie, W. Parker, Youngtae Cho, and Robert A. Hummer. 2001. “Immigration and the Health of Asian andPacific Islander Adults in the United States.” American Journal of Epidemiology 153(4):372–80.
Goldman, Noreen, Rachel T. Kimbro, Cassio M. Turra, and Anne R. Pebley. 2006. “Socioeconomic Gradientsin Health for White and Mexican-Origin Populations.” American Journal of Public Health 96(12):2186–93.
Gorman, Bridget K., Elaine H. Ecklund, and Holly E. Heard. 2010. “Nativity Differences in Physical Health: TheRoles of Emotional Support, Family, and Social Integration. Sociological Spectrum 30(6):671–94.
Grieco, Elizabeth M. 2010. “Race and Hispanic Origin of the Foreign-Born Population in the United States:2007.” American Community Survey Reports. Washington, DC: U.S. Census Bureau.
Heeringa, StevenG., JamesWagner, Myriam Torres, Naihua Duan, Terry Adams, and Patricia Berglund. 2004.“Sample Designs and SamplingMethods for the Collaborative Psychiatric Epidemiology Studies (CPES).”International Journal of Methods in Psychiatric Research 13(4):221–40.
Hirschman, Charles and Douglas S. Massey. 2008. “Places and Peoples: The New American Mosaic.” Pp. 1–22in New Faces in New Places: The Changing Geography of American Immigration, edited by Douglas S. Massey.New York: Russell Sage Foundation.
House, James and David R. Williams. 2000. “Understanding and Reducing Socioeconomic and Racial/EthnicDisparities in Health.” Pp. 81–124 in Promoting Health: Intervention Strategies from Social and BehavioralResearch, edited by Brian D. Smedley and S. Leonard Syme. Washington, DC: National Academy Press.
Hunt, Linda M., Suzanne Schneider, and Brendon Comer. 2004. “Should ‘Acculturation’ be a Variable inHealth Research? A Critical Review of Research onU.S. Hispanics.” Social Science &Medicine 59(5):973–86.
Idler, Ellen L., Louise B. Russell, and Diane Davis. 2000. “Survival, Functional Limitations, and Self-RatedHealth in the NHANES I Epidemiologic Follow-Up Study, 1992.” American Journal of Epidemiology152(9):874–83.
Idler, Ellen L. and Ronald J. Angel. 1990. “Self-Rated Health and Mortality in the NHANES-I EpidemiologicFollow-Up Study.” American Journal of Public Health 80(4):446–52.
Idler, Ellen L. and Yael Benyamini. 1997. “Self-Rated Health andMortality: A Review of Twenty-Seven Com-munity Studies.” Journal of Health and Social Behavior 38(1):21–37.
Jasso, Guillermina, Douglas S. Massey, Mark R. Rosenzweig, and James P. Smith. 2004. “Immigrant Health—Selectivity and Acculturation.” Pp. 227–66 in Critical Perspectives on Racial and Ethnic Differences in Health inLate Life, edited by Norman B. Anderson, Rodolfo A. Bulatao, and Barney Cohen. Washington, DC: TheNational Academies Press:
Jerant, Anthony, Rose Arellanes, and Peter Franks. 2008. “Health Status among US Hispanics: Ethnic Varia-tion, Nativity, and Language Moderation.” Medical Care 46(7):709–17.
Johnson, Kenneth M. and Daniel T. Lichter. 2008. “Natural Increase: A New Source of Population Growth inEmerging Hispanic Destinations in the United States.” Population and Development Review 34(2):327–46.
Kandula, Namratha R., Diane S. Lauderdale, and David W. Baker. 2007. “Differences in Self-Reported Healthamong Asians, Latinos, and Non-HispanicWhites: The Role of Language and Nativity.” Annals of Epidemi-ology 17(3):191–98.
Kawachi, Ichiro and Lisa F. Berkman. 2000. “Social Ties and Mental Health.” Journal of Urban Health78(3):458–67.
Kimbro, Rachel T. 2009. “Acculturation in Context: Gender, Age at Migration, Neighborhood Ethnicity, andHealth Behaviors.” Social Science Quarterly 90(5):1145–66.
Kimbro, Rachel T., Sharon Bzostek, Noreen Goldman, andGermán Rodriguez. 2008. “Race, Ethnicity, and theEducation Gradient in Health.” Health Affairs 27(2):361–72.
Kritz, MaryM. andDouglas T. Gurak. 2004. “Immigration and a Changing America.” Pp. 259–301 in The Amer-ican People: Census 2000, edited by Reynolds Farley and John Haaga. New York, Russell Sage Foundation.
Acculturation and Self-Rated Health among Latino and Asian Immigrants 361
This content downloaded from 128.42.163.38 on Wed, 3 Jul 2013 16:52:26 PMAll use subject to JSTOR Terms and Conditions

Krueger, Patrick andVirginia Chang. 2008. “Being Poor and Copingwith Stress: Health Behaviors and the Riskof Death.” American Journal of Public Health 98(5):889–96.
Landale, Nancy S., R. S. Oropesa, and Bridget K. Gorman. 2000. “Migration and Infant Death: Assimilation orSelective Migration among Puerto Ricans?” American Sociological Review 65(6):888–909.
Lang, John G., Ricardo F. Munoz, Guillermo Bernal, and James L. Sorensen. 1982. “Quality of Life andPsychological Well-Being in a Bicultural Latino Community.” Hispanic Journal of Behavioral Sciences4(4):433–50.
Lara, Marielena, Cristina Gamboa, Iya Kahramanian, Leo Morales, and David Hayes Bautista. 2005. “Accul-turation and Latino Health in the United States: A Review of the Literature and its Sociopolitical Con-text.” Annual Review of Public Health 26(1):367–97.
Larsen, Luke. J. 2004. “The Foreign-Born Population in the United States: 2003.” Current Population Reports.Washington, DC: U.S. Census Bureau.
Lopez-Class, Maria, Felipe González Castro, and Amelie G. Ramirez. 2011. “Conceptions of Acculturation:A Review and Statement of Critical Issues.” Social Science & Medicine 72(9):1555–62.
Lozano-Ascencio, Fernando. 2005. Remittance Behaviour among Latin American Immigrants in the United States.Presented at the XXV International Union for the Scientific Study of Population International PopulationConference, July 21, Tours, France.
Månsson, Nils-Ove and Lennart Råstam. 2001. “Self-Rated Health as a Predictor of Disability Pension andDeath—A Prospective Study of Middle-Aged Men.” Scandinavian Journal of Public Health 29(2):151–58.
Markides, Kyriakos and Karl Eschbach. 2005. “Aging, Migration, andMortality: Current Status of Research onthe Hispanic Paradox.” Journals of Gerontology Series B: Psychological Sciences and Social Sciences 60(SpecialIssue 2):S68–S75.
Martin, Philip and Elizabeth Midgeley. 2006. “Immigration: Shaping and Reshaping America. Revised andUpdated 2nd Edition.” Population Bulletin 61(4). Washington, DC: Population Reference Bureau.
Massey, Douglas S. and Ilana R. Akresh. 2006. “Immigrant Intentions and Mobility in a Global Economy: TheAttitudes and Behavior of Recently Arrived U.S. Immigrants.” Social Science Quarterly 87(5):954–71.
McGee, Daniel L., Youlian Liao, Guichan Cao, and Richard S. Cooper. 1999. “Self-Reported Health Status andMortality in a Multiethnic U.S. Cohort.” American Journal of Epidemiology 149(1):41–46.
Menjívar, Cecilia. 2000. Fragmented Ties: Salvadoran Immigrant Networks in America. Berkeley: University ofCalifornia Press.
Meredith, Lisa S. and Albert L. Siu. 1995. “Variation and Quality of Self-Report Health Data: Asians and PacificIslanders Compared with Other Ethnic Groups.” Medical Care 33(11):1120–31.
Mossakowski, Krysia N. 2003. “Coping with Percieved Discrimination: Does Ethnic Identity Protect MentalHealth?” Journal of Health and Social Behavior 44(3):318–31.
Mulvaney-Day, Norah, Margarita Alegría, and William Sribney. 2007. “Social Cohesion, Social Support, andHealth among Latinos in the United States.” Social Science & Medicine 64(2):477–95.
Palinkas, Lawrence A. and Sheila M. Pickwell. 1995. “Acculturation as a Risk Factor for Chronic Diseaseamong Cambodian Refugees in the United States.” Social Science & Medicine 40(12):1643–53.
Pennell, Beth-Ellen, AshleyBowers, DeborahCarr, Stephanie Chardoul, Gina-QianCheung, Karl Dinkelmann,Nancy Gebler, Sue Ellen Hansen, Steve Pennell, andMyriam Torres. 2004. “The Development and Imple-mentation of theNational Comorbidity Survey Replication, theNational Survey of American Life, and theNational Latino and Asian American Survey.” International Journal of Methods in Psychiatric Research13(4):241–69.
Phinney, Jean S. 1990. “Ethnic Identity in Adolescents and Adults: Review of Research.” Psychological Bulletin108(3):499–514.
Phinney, Jean S., Gabriel Horenczyk, Karmela Liebkind, and Paul Vedder. 2001. “Ethnic Identity, Immigra-tion, and Well-Being: An Interactional Perspective.” Journal of Social Issues 57(3):493–510.
Portes, Alejandro and Min Zhou. 1993. “The New Second Generation: Segmented Assimilation and its Var-iants.” Annals of the American Academy of Political and Social Science 530:74–96.
Portes, Alejandro and Ruben Rumbaut. 2001. Legacies: The Story of the Immigrant Second Generation. Berkeley:University of California Press; and New York: Russell Sage Foundation.
Rogler, Lloyd H. 1994. “International Migrations: A Framework for Directing Research.” American Psychologist49(8):701–08.
Rogler, Lloyd H., Drama E. Cortes, and Robert G. Malgady. 1991. “Acculturation and Mental Health Statusamong Hispanics: Convergence and New Directions for Research.” American Psychologist 46(6):585–97.
362 KIMBRO/GORMAN/SCHACHTER
This content downloaded from 128.42.163.38 on Wed, 3 Jul 2013 16:52:26 PMAll use subject to JSTOR Terms and Conditions
Ryder, AndrewG., Lynn E. Alden, andDelroy L. Paulhus. 2000. “Is AcculturationUnidimensional or Bidimen-sional? A Head-to-Head Comparison in the Prediction of Personality, Self-Identity, and Adjustment.”Journal of Personality and Social Psychology 79(1):49–65.
Salant, Talya and Diane S. Lauderdale. 2003. “Measuring Culture: A Critical Review of Acculturation andHealth in Asian Immigrant Populations.” Social Science & Medicine 57(1):71–90.
Sana, Mariano and Douglas S. Massey. 2005. “Household Composition, Family Migration, and CommunityContext: Migrant Remittances in Four Countries.” Social Science Quarterly 86(2):509–28.
Sanders, Jimy, Victor Nee, and Scott Sernau. 2002. “Asian Immigrants’Reliance on Social Ties in aMultiethnicLabor Market.” Social Forces 81(1):281–314.
Schachter, Ariela, Rachel T. Kimbro, and Bridget K. Gorman. 2012. “Language Proficiency and Health Status:Are Bilingual Immigrants Healthier?” Journal of Health and Social Behavior 53(1):124–45.
Schnittker, Jason and Jane McLeod. 2005. “The Social Psychology of Health Disparities.” Annual Review ofSociology 31:75–103.
Shetterly, SusanM., Judith Baxter, LynnD.Mason, and Richard F. Hamman. 1996. “Self-Rated Health amongHispanic versus non-HispanicWhite Adults: The San Luis Valley Health and Aging Study.” American Jour-nal of Public Health 86(12):1798–1801.
Singer, Audrey. 2004. “The Rise of New Immigrant Gateways.” The Living Cities Census Series. Washington, DC:The Brookings Institution.
Singh, Gopal K. and Mohammad Siahpush. 2002. “Ethnic-Immigrant Differentials in Health Behaviors, Mor-bidity, and Cause-Specific Mortality in the United States: An Analysis of Two National Data Bases.”Human Biology 74(1):83–110.
Thomson, Maria D. and Laurie Hoffman-Goetz. 2009. “Defining and Measuring Acculturation: A SystematicReview of Public Health Studies with Hispanic Populations in the United States.” Social Science and Medi-cine 69(7):983–91.
U.S. Department of Health and Human Services (USDHHS) and the U.S. Department of Agriculture. 2005.Dietary Guidelines for Americans, 2005. 6th ed. Washington, DC: U.S. Government Printing Office.
Vega, William W., Bohdan Kolody, Ramon Valle, and Jude Weir. 1991. “Social Networks, Social Support, andtheir Relationship to Depression among ImmigrantMexicanWomen.”Human Organization 50(2):154–162.
Vega, William and Hortensia Amaro. 1994. “Latino Outlook: Good Health, Uncertain Prognosis.” AnnualReview of Public Health 15(1):39–67.
Ward, Louise S. 2010. “Farmworkers at Risk: The Costs of Family Separation.” Journal of Immigrant and Minor-ity Health 12:672–77.
Williams, David, Harold W. Neighbors and James S. Jackson. 2008. “Racial/Ethnic Discrimination and Health:Findings from Community Studies.” American Journal of Public Health 98(Supplement 1):200–08.
World Health Organization (WHO). 1995. Physical Status: The Use and Interpretation of Anthropometry. WHOTechnical Report Series 854. Geneva, Switzerland: World Health Organization.
Ying, Yu-Wen. 1995. “Cultural Orientation and Psychological Well-Being in Chinese Americans.” AmericanJournal of Community Psychology 23(6):893–911.
Zhang, Wei and Van M. Ta. 2009. “Social Connections, Immigration-Related Factors, and Self-Rated Physicaland Mental Health among Asian Americans.” Social Science & Medicine 68(12):2104–12.
Zsembik, Barbara A. and Dana Fennell. 2005. “Ethnic Variation in Health and the Determinants of Healthamong Latinos.” Social Science & Medicine 61(1):53–63.
Acculturation and Self-Rated Health among Latino and Asian Immigrants 363
This content downloaded from 128.42.163.38 on Wed, 3 Jul 2013 16:52:26 PMAll use subject to JSTOR Terms and Conditions