and rxte qbservations of 4u 2206+54 disappearance 9.6 day
TRANSCRIPT

Source of Acquisition NASA Goddard Space Flight Center
Swift/BAT and RXTE Qbservations of the Peculiar X-ray Binary 4U 2206+54 - Disappearance of the 9.6 Day Modulation
R.H.D. Corbet', C.B. Markwardt2l3, and J. Tueller3
ABSTRACT
Observations of the high-mass X-ray binary 4U 2206+54 with the Swift Burst Alert Telescope (BAT) do not show modulation at the previously reported period of 9.6 days found from observations made with the Rossi X-ray Timing Explorer (RXTE) All-Sky Monitor (ASM). Instead, the strongest peak in the power spec- trum of the BAT light curve occurs at a period of 19.25 f 0.08 days, twice the period found with the RXTE ASM. The maximum of the folded BAT light curve is also delayed compared to the maximum of the folded ASM light curve. The most recent ASM data folded on twice the 9.6 day period show 'similar mor- phology to the folded BAT light curve. This suggests that the apparent period doubling is a recent secular change rather than an energy-dependent effect. The 9.6 day period is thus not a permanent strong feature of the light curve. We sug- gest that the orbital period of 4U 2206+54 may be twice the previously proposed value.
Subject headings: stars: individual '(4U 2206+542 - stars: neutron - X-rays: stars
1. Introduction
The Uhuru X-ray source 4U2206+54 (Giacconi et al. 1972) was identified with the optical counterpart BD +53"2790 by Steiner et al. (1984). Optical photometry and the presence of a double peaked H a line in the spectrum led Steiner et al. (1984) to conclude that BD +53"2790 is a Be star. However, it has been argued that the optical properties,
'Universities Space Research Association; X-ray Astrophysics Laboratory, Mail Code 662, NASA Goddard Space Flight Center, Greenbelt, MD 20771; [email protected].
2Department of Astronomy, University of Maryland, College Park, MD 20742.
3Astroparticle Physics Laboratory, Mail Code 661, NASA/Goddard Space Flight Center, Greenbelt, MD 20771.

n
1
- 3 - I
d
might be a white dwarf, black hole, or the magnetosphere of a neutron star rather than the surface of a neutron star.
In this paper we present an analysis of observations of 4U 2206+54 made with the Burst Alert Telescope (B-4T) on board the Swift satellite. These data do not show modulation on the 9.6 day period but, unexpectedly, show a maximum in the power spectrum at twice this period. We update the ASM results ind compare the folded BAT and ASM light curves and show that recent ASM data show similar behavior to that found with the BAT. We find that the phase of the BAT maxima in the light curve does not exactly coincide with either the “odd” or “even” outbursts on the 9.6 day period. We also present light curves of 4U2206+54 obtained with the RXTE Proportional Counter Array (PCA) and High Energy Timing Experiment (HEXTE) in 2001 which cover orbital phases around the maximum in the folded B-4T light curve. We make a comparison of 4U 2206+54 with other systems with somewhat similar properties. While there is some similarity with GRO J2058f42, the overall properties of 4U2206+54 so far appear to be unique.
2. Observations
2.1. Swift BAT
The BAT is described in detail by Barthelmy et al. (2005) and data reduction is de- scribed by Markwardt et al. (2005). In brief, the BAT is a very wide field of view (1.4 sr half-coded) hard X-ray telescope that utilizes a 2.7 m2 coded-aperture mask and a 0.52 m2 CdZnTe detector array divided into 32,768 detectors each with an area of 0.16 cm2. The pointing direction of the BAT is controlled by observations using the narrow-field XRT and UVOT instruments also onboard Swift which are primarily used to study gamma-ray bursts and their afterglows. BAT observations of X-ray sources are thus generally obtained in a serendipitous and unpredictable fashion. The BAT sky survey is therefore non-uniform and the signal to. noise level of each observation of a source depends on the location of the source within the BAT field of view. Typically the BAT observes 50% to 80% of the sky each day. The data considered here consists of individual ‘(snapshots” which have exposure times ranging between 150 to 2660 s with a mean of 1000 s. From these snapshots light curves are constructed in 4 energy bands: 14 to 24 (“A”), 24 to 50 (“B”), 50 to 100 (‘(C’’), and LOO to 195 (“D”) keV. For the entire energy range the Crab produces approximately 0.045 counts s-l per fully illuminated detector for an equivalent on-axis source (hereafter abbrevi- ated to counts s-l). In each energy band the Crab produces 0.019, 0.018, 0.0077, and 0.0012 counts s-’ respectively, equivalent to approximately 311, 295, 126, and 19.7 counts s-’ for the entire array after accounting for the 50% obscuration by the mask. The light curve used

- 5 -
each gain epoch and have a time resolution of 16s. In this paper we employ the 2 - 9 keV light curve. Background subtracted HEXTE light curves have a time resolution of 16s and are available for the energy ranges 15 - 30 keV, 30 - 60 keV, and 60 - 250 keV.
3. Analysis and Results
3.1. Weighting Data Points in Power Spectra
Due to various factors such as source location in the detector field of view, exposure duration, and non-uniform sky coverage, the light curves from both the BAT and ASM show considerable variability in the statistical quality of individual data points. When searching for periodic modulation it is common to calculate power spectra. Two common ways to calculate the power spectrum of a data set with non-uniform error bars are to either weight the contribution of a data point to the power spectrum (e.g. Scargle 1989) or to use uniform weighting. The use of weighting is briefly discussed for RXTE ASM data in Corbet (2003) where a weighting factor of yi/a: (“simple weighting”) was used where yi is the value of a data point and ai is its associated error. Whether weighted or unweighted power spectra was preferred was argued by Corbet (2003) to depend on the relative size of the error bars compared to overall variability. If the scatter in data values is large compared to ekor bar’size then weighting by error bars can be inappropriate. In addition, it was noted by Corbet (2003) that periodic or quasi-periodic changes in data quality, such as caused by the precession period of RXTE’s orbit, may introduce spurious signals in the power spectrum if weighting is used. The effects of periodicities in data quality in ASM light curves are also noted by Wen et al. (2006). .
* L
For the Swift BAT we investigated the difference between “weighted” and “unweighted” power spectra for a number of high-mass X-ray binaries with already well determined orbital and superorbital periods that covered a range of count rates. As a ity parameter we used the ratio of the height of the peak in the power spectrum compared to the mean noise level. We then calculated the relative peak heights measured in this way for weighted and unweighted power spectra and this ratio is plotted against count rate in Fig. 1. We find that, as predicted, the benefits of weighting are strongly dependent on source brightness, with weighting very beneficial for faint sources, but detrimental for bright sources. The count rate of 4U 2206+54 lies in,the transition region between weighting being detrimental to beneficial. We next investigated an alternative weighting scheme (“modified weighting”) which incorporates the variance due to source variability. The contribution of each data

1
-7- 3
The weighted mean ASM count rate from 4U2206+54 is 0.365 f 0.004 (statistical) counts s-l, equivalent to 4.9 mCrab. In each ASM energy band the weighted mean count rates and statistical errors are 0.050 rrt 0.002 (A), 0.079 rrt 0.002 (B) and 0.178 k 0.003 (C) counts s-l, corresponding to 1.9, 3.4, and 7.0 mCrab respectively.
In a light curve averaged over intervals of one day the mean significance with which 4U2206+54 was detected in the B-4T is 2.50. For the ASM the mean significance with which 4U2206+54 was detected is 1.40 for the total light curve, and 1.140 for just the interval coinciding with the B-4T observations. The BAT thus detects 4U2206+54 at a higher average significance than does the ASM. However, due to the differences in the way ASM and BAT observations are obtained the ASM provides more uniform coverage than does the BAT.
We searched for periodic modulation from 4U2206+54 by first calculating the power spectrum of the BAT light curve for the entire 14 - 195 keV energy range and this is shown in the lower panel of Fig. 4. No signal is present at the previously reported 9.6 day period, instead the strongest peak is at a period of 19.28 days at a level of 19 times the mean value of the power spectrum and -6 times the local power level. This period coincides to better than 1% with twice the 9.6 day period. We will use the term “2P” hereafter to refer to the period of twice the originally proposed orbital period near 9.6 days, i.e. 19.118 days.
We next calculated the power spectrum of each BAT energy band separately and the results for bands A and B are also shown in Fig. 4. Band A shows multiple peaks in the power spectrum including one near 19.28 days. and the power spectrum of Band B has its strongest peak at 19.28 days at a level of 19 times the mean power, and -7 times the local power. Apart from the peak at 19.28 days, there are less strong peaks in the B band power spectrum than in the lower energy A band power spectrum. For neither spectrum do any‘ of the peaks appear to be related to each other as harmonics or aliases. The BAT power spectra thus demonstrate the considerable variability on a variety of timescales commented on in previous work (Section 1). However, the clear discrepancy from previous work is the lack of significant modulation at- 9.6 days.
We divided the B band light curve into two halves and examined the power spectra of these separately. In both cases we see peaks near 19 days and no significant peak near 9.6 days. Results are not shown in Figure 4 for bands C and D due to the low count rates in these bands.
We next calculated the power spectrum of the RXTE ASM to search for modulation at a period of twice the previously reported value. Although the modified weighting described in Section 1 was employed with an error bar modification factor, f, of 1.27 this procedure

- g -
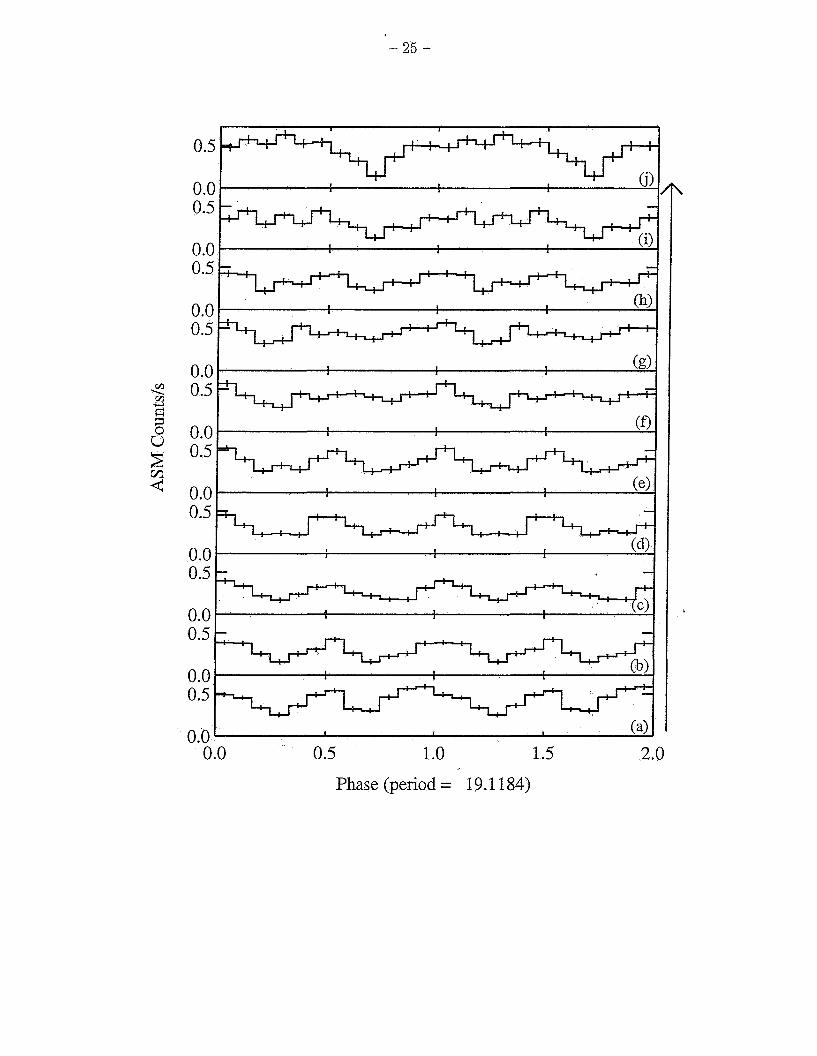
In the power spectra from the most recent subset the strongest power in this frequency range is found at 2P, consistent with the BAT results. We also folded the data in the same subsets on a period of 2P and these are shown in Fig. 8. We note that the earlier subsets show the expected two peaks while the last subset shows a profile comparable to that seen with the BAT with a single maximum at similar phase.
3.3. PCA and HEXTE
The light curves obtained with the PCA and HEXTE are shown in Fig. 9. The modu- lation of the PCA light curve is consistent with the folded ASM light curve. However, the HEXTE light curves, which cover similar energy ranges to the BAT, do not show similar be- havior to the folded BAT light curve and appear to follow the PC-4 light curve. In particular the HEXTE light curves do not show a minimum near phase 0.5 which would be expected if they followed the behavior seen with the BAT. However, some caution should be taken in interpreting these observations as 4U 2206+54 shows sig-nificant apparently non-periodic behavior which can affect a short data set such as this.
4. Discussion
4.1. Periodic Modulation and the Orbital Period
The BAT light curve of 4U 2206+54 shows modulation at a period twice that previously derived from RXTE ASM data. If this modulation is orbital in origin then it suggests that the underlying orbital ’period may actually be double the previously propbsed value. The BAT light curve covers 282 days, equivalent to more than 14 “2P” cycles and thus the apparent period doubling is unlikely to be a purely stochastic effect caused by a small number of unusually bright maxima. 4U2206+54 thus shows either an energy dependent number of X-ray maxima per orbit, or else it underwent a transition between exhibiting two maxima per orbit to a state of a single maximum per orbit. The energy-dependent modulation hypothesis may be supported by the shape of the folded BAT “A” band light curve which has an appearance suggestive of a mix of the two types of modulation. Thus a change in the nature of the periodic modulation may occur in the range of 14 - 24 keV. However, evidence that argues against this hypothesis is: (i) The shape of the HEXTE light curve (Fig. 7) does not follow the folded BAT light curve (although non-periodic modulation presumably also contributes to the observed light curve). (ii) The most recent ASM data folded on 2P show the same morphology as the BAT light curve (Fig. 6).

‘ - 11 -
find that there is a clear energy difference in the size of the outbursts detected and these authors proposed that the orbital period of the system is 110 days with outbursts occurring at both periastron and apastron passage. The energy dependence of the underlying period in GRO J2058342 has some apparent similarities to what is seen in 4U 2206+54. However, for GRO J2058f42 no phase shift is observed. Wilson et al. (2005) also report that pulse frequency changes seen dhring the outbursts are consistent with a 55 day period.
The supergiant system 4U 1907+09 was found by Marshall & Ricketts (1980) to exhibit two outbursts per orbital cycle, separated by approximately 0.45 in phase. Marshall & Rick- etts noted that: (‘the amplitudes of the secondary maxima are more variable than those of the primary maxima ranging from being approximately equal in flux down to insignificance.” in ’t Zand, Baykal, & Strohmayer (1998) speculated that speculated that the two flares per orbital cycle might indicate that the wind from the supergiant primary is not isotropic and the flares may occur when the neutron star crosses the equatorial plane of the primary where there is an enhanced wind. In the supergiant high-mass X-ray binary 4U 1223-62 (GX 301- 2) evidence has also sometimes been reported for the presence of flares at apastron in its eccentric 41.5 day orbit in addition to the large flares that occur shortly before periastron (Pravdo et al. 1995, Pravdo & Ghosh 2001). For 4U 1223-62 the size of the apastron flare has always been observed to be much smaller than the periastron flare.
The phase difference between the ASM and BAT light curves could also potentially be a secular or an energy dependent effect. For the Be/neutron star binary EX0 2030f375, which has an orbital period of 46 days, a temporary change in the phase of maximum flux was seen to occur in both RXTE ASM and BATSE data (Wilson et al. 2002) with a difference of about 10 days. No period change accompanied this temporary phase shift. Corbet (2003) reported evidencg: for a 24 day period in the low-mass X-ray binary (2X 13+1 from RXTE ASM observations and that the higher energy (5 - 12 keV) emission trailed the lower energy (1.5 - 5 keV) by a phase difference of 0.2 f 0.03.
Of the sources considered above, while none exhibits exactly the same behavior shown by 4U 2206+54, a possible similarity with GRO J2058f42 may exist in the apparent factor of two difference in orbital periods found by two different instruments at different times. However 4U 2206+54 has several differences including the presence of pulsations in GRO J2058+52 and the possible difference in the nature of the mass donor. The variable secondary maxima exhibited by 4U 1907+09 may ‘also be similar to the behavior shown by 4U 2206+54 although there is again a difference in thenature of the mass donor.
While khe systems discussed here provide hints of how an underlying orbital period at 2P might show itself as modulation at half that period, it appeirs even more difficult to understand how a -9.6 day long orbital period could produce modulation at twice that

- 13 -
source. The exceptional properties of 4U2206+54 may be related to the unusual nature of the mass donor in the system. 4U 2206+54 may thus provide a new parameter regime where models of wind accretion may be tested.
. RHDC thanks Pere Blay for providing information on his optical observations and Alan M. Levine for useful discussions on the weighting of data points in power spectra and sug- gesting the modified weighting technique.
REFERENCES
Barthelmy, S.D., Barbier, L.M., Cummings, J.R., Fenimore, E.E., Gehrels, N., Hullinger, D., Krimm, HA., Markwardt, C.B., Palmer, D.M., Parsons, A., Sato, G., Suzuki, M., Takahashi, T., Tashiro, M., & Tueller, J. 2005, Space Science Reviews, 120, 143
Blay, P., Rib6, M., Negueruela, I., Torrejh, J. M., Reig, P., Camero, A., Mirabel, I. F., & Reglero, V. 2005, A&_4, 438, 963
Blay, P. 2006, PhD thesis, University of Valencia
Blay, P., Negueruela, I., Reig, P., Coe, M. J., Corbet, R. H. D., Fabregat, J., & Tarasov, A. E. 2006, A&A, 446, 1095
Boyd, P. T., Tripicco, M. J., Smale, A. P., Kiddy, A. C., Rohrbach, G. L., & RXTE Guest Observer Facility (GOF) Team 2001, 199th AAS Meeting, #10.12; Bulletin of the American Astronomical Society, 33, 1322
Charles, P.A., & Coe, M.J. 2003, in ”Compact Stellar X-ray Sources”, eds. W.H.G. Lewin and M. van der Klis (astro-ph/0308020).
Corbet, R.H.D. 2003, ApJ, 595, 1086
Corbet, R., Peele; A., & Remillard, R. 1997, L4UC 6556
Corbet, R.H.D., & Peele, A.G. 2001, ApJ, 562, 936
Farrell, S.A., Sood, R.K., & O’Neill, P.M. 2006, MNRAS, 367, 1457
Giacconi, R., Murray, S., Gursky, H., Kellogg, E., Schreier, E., & Tananbaum, H. 1972, ApJ,
in ’t Zand, J.J.M., Baykal, A., & Strohmayer, T.E. 1998, ApJ, 496, 386
Jahoda, K., Swank, J.H., Stark, M.J., Strohmayer, T., Zhang, W., & Morgan, E.H., 1996, “EUV, X-ray and Gamma-ray Instrumentation for Space Astronomy VII, O.H. W. Siegmund & MA. Gummin, eds., SPIE 2808, 59, 1996
178, 281

- 15 -
Wilson, C.A., Weisskopf, M.C., Finger, M.H., Coe, M.J., Greiner, J., Reig, P., & Papamas- torakis, G. 2005, -4pJ, 622, 1024
This preprint was prepared with the AAS I.4TE;y macros v5.0.

for analysis in each section were: (a) MJD 50087 - 50817; (b) 50452 - 51182; (c) 50817 - 51547; (d) 51182 - 51912; (e) 51547 - 52277; (f) 51912 - 52642; (9) 52277 - 53007; (h) 52642 - 53372; (i) 53007 - 53737; (j) 53372 54102.
Fig. 8.- RXTE/ASM light curves of 4U2206+54 folded on a period of 2P. The ASM light curve was divided into the same sections as used in Fig. 7.
Fig. 9.- RXTE PCA, ASM, and HEXTE light curves of 4U2206+54 obtained in 2001. The 15 - 30 and 30 - 250 keV HEXTE light curves were rebinned by factors of 2 and 4 respectively compared to the original standard products. The boxes indicate the mean count rate, plus and minus the standard error on this value during each of the four PCA and HEXTE observations.

- 19 -
o o \ o 0 0 0 0 0 0 0 0
d- 0 0 0 0
rn 0 0 0 0
I I I I
d - r n 0 0
0 0
(Ray ZT - S’T)
0 0 0 d- m
0 0 0 m m
0 0 0 c\l m
0 0 0
In d
0 0 0 0 m

- - 2 1 -
I I
m 1 I \ m I I BAT: 24 - 50 keV
m BAT: 14 - 24 keV \
m
Frequency (day-')

- 23 -
0.0 0.5 1 .o 1.5 2.0
Phase (period = 19.11 84)
i
0.5
0.0 0.5
u.u 0.5
0.0 0.5
0.0 0.0 0.5 1 .o 1.5
Phase (period = 19.1 184) 2.0
\