and requirements for improved aircraft … design and operating techniques and requirements for...
TRANSCRIPT

AND
NASA TECHNICAL NASA TM X-72006MEMORANDUM ~ COPY NO.
CDCD
r\-NEW DESIGN AND OPERATING TECHNIQUES
AND REQUIREMENTS FOR IMPROVED AIRCRAFT
TERMINAL AREA OPERATIONS(NASA-TM-X-72006) NEW DESIGN AND N75-12911OPERATING TECHNIQUES AND REQUIREMENTS FORIMPROVED AIRCRAFT TERMINAL AREA OPERATIONS(NASA) 71 p HC $4.25 CSCL 01C Unclas
.G3/03 04919
John P. Reeder, Robert T. Taylor, and Thomas M. WalshNASA Langley Research Center
Hampton, Virginia
c-J
This informal documentation medium is used to provide accelerated orspecial release of technical information to selected users. The contentsmay not meet NASA formal editing and publication standards, may be re-vised, or may be incorporated in another publication. os- o.a
NATIONAL AERONAUTICS AND SPACE ADMINISTRATION
LANGLEY RESEARCH CENTER, HAMPTON, VIRGINIA 23665
https://ntrs.nasa.gov/search.jsp?R=19750004839 2018-06-18T06:50:17+00:00Z

1. Report No. 2. Government Accession No. 3. Recipient's Catalog No.TM X-720064. Title and Subtitle 5. Report Date
NEW DESIGN AND OPERATING TECHNIQUES AND REQUIREMENTS DECEMBER 1974FOR IMPROVED AIRCRAFT TERMINAL AREA OPERATIONS 6. Performing OrganizatiooCode
7. Author(s) 8. Performing Organization Report No.
John P. Reeder, Robert T. Taylor, and Thomas M. Walsh
10. Work Unit No.
9. Performing Organization Name and Address
NASA Langley Research Center 11. Contract or Grant No.
Hampton, VA 2366513. Type of Report and Period Covered
12. Sponsoring Agency Name and Address
National Aeronautics and Space Administration 14. Sponsoring Agency Code
Washington, DC 2054615. Supplementary Notes
Presented at the Society of Automotive Engineers Air Transportation Meeting,Dallas, Texas, April 30 - May 2, 1974
16. Abstract
Current aircraft operating problems that must be alleviated for future high-
density terminal areas are safety, dependence on weather, congestion, energy
conservation, noise, and atmospheric pollution. The MLS under development by
FAA provides increased capabilities over the current ILS. It is, however,
necessary and urgent to develop the airborne system's capability to take
maximum advantage of the MLS capabilities in order to solve the terminal area
problems previously mentioned. A major limiting factor in longitudinal spacing
for capacity increase is the trailing vortex hazard. Promising methods for
causing early dissipation of the vortices are being explored. Also, flight
procedures for avoiding the hazard will be explored.
These problems are being addressed in a cooperative NASA/FAA program on
terminal configured vehicles, which includes flight test development and
demonstration of the most promising solutions.
17. Key Words (Suggested by Author(s)) (STAR category underlined) 18. Distribution Statement
AircraftDigital control Flight proceduresAvionics Air traffic control UNCLASSIFIED - UNLIMITEDAeronauticsDisplays19. Security Classif. (of this report) 20. Security Classif. (of this page) 21. No. of Pages 22. Price'
UNCLASSIFIED UNCLASSIFIED 69 $4.25
The National Technical Information Service, Springfield, Virginia 22151*Available fromScientific and Technical Information Facility, P.O. Box 33
(STIF/NASA Scientific and Technical Information Facility, P.O. Box 33, College Park, MD 20740

TABLE OF CONTENTS
Section Page
ABSTRACT . ............... . . . ................... ii
A. INTRODUCTION ........ ..... . . . . . . . . . . . . . . . . . 1
B. PROBLEMS IN THE TERMINAL AREA . ........ . . . .. ...... 1
C. CAPABILITIES NEEDED FOR SOLVING PROBLEMS ......... . . . . . . 2
D. TECHNOLOGY DEVELOPMENTS AND REQUIREMENTS . ........ . . . . .
D.1 LANDING GUIDANCE SYSTEMS ........ . . . . . ... ........ 4
D.2 AVIONICS SYSTEMS . . . . . . . . .. . . . . . . . . . . . . . 5D.3 ENGINE QUIETING AND ENERGY IMPLICATIONS . ......... . 7
E. TERMINAL CONFIGURED VEHICLE (TCV) PROGRAM . ........... . 8
E. 1 TERMINAL CONFIGURED VEHICLE (TCV) PROGRAM . . . . . . . . . . 8
E.1.1 Overview . . . . . . . . . . . . . . . . . . . . . . . 8E.1.2 Research Support Flight System . ........... 9E.1.3 Avionics Equipment . .......... . .. . .... . 12
E. 1.4 Piloted Simulator . .............. . . . . 15
E.1.5 Terminal-Area Environment Simulation . ........ 16
E.1.6 Wallops Research Facility . . . . . . . . . . . . . . . 18
E.1.7 Flight Procedures . . . . . . . . . . . . . . . . . . . 19E.1.8 Displays and Human Factors . . . . . . . . . . . . . . 24
E.1.9 Flight Results to Date . ............... 30
E. 2 KEY AIRCRAFT DESIGN AND OPERATIONAL REQUIREMENTS . . ... . . 30
E. 3 TERMINALLY COMPATIBLE LONG-HAUL AIRCRAFT . ......... . 32
E.3.1 Technical Design Aspects . ............. . 32
E.3.2 Cost and Benefit Analyses . .............. 35
E.4 VORTEX-WAKE REDUCTION . ............. . . . . . . 37
F. CONCLUDING REMARKS ............ . . . . . . . . . .... 38
G. REFERENCES . . . . . . . .. .. . . . . . . . . . . . . . . . . . . . 39
FIGURE CAPTIONS ......... ... . . . . . . . . . . . . . . . . . 40
i

NEW DESIGN AND OPERATING TECHNIQUES AND REQUIREMENTS
FOR IMPROVED AIRCRAFT TERMINAL AREA OPERATIONS
John P. Reeder, Robert T. Taylor, and Thomas M. Walsh
NASA Langley Research CenterHampton, Virginia
ABSTRACT
Current aircraft operating problems that must be alleviated for future
high-density terminal areas are safety, dependence on weather, congestion,
energy conservation, noise, and atmospheric pollution. The MLS under devel-
opment by FAA provides increased capabilities over the current ILS. -It is,
however, necessary and urgent to develop the airborne system's capability to
take maximum advantage of the MLS capabilities in order to solve the terminal
area problems previously mentioned. A major limiting factor in longitudinal
spacing for capacity increase is the trailing vortex hazard. Promising
methods for causing early dissipation of the vortices are being explored.
Also, flight procedures for avoiding the hazard will be explored.
These problems are being addressed in a cooperative NASA/FAA program on
terminal configured vehicles, which includes flight test development and
demonstration of the most promising solutions.
ii

NEW DESIGN AND OPERATING TECHNIQUES AND REQUIREMENTS
FOR IMPROVED AIRCRAFT TERMINAL AREA OPERATIONS
John P. Reeder, Robert T. Taylor, and Thomas M. Walsh
NASA Langley Research Center
Hampton, Virginia
A. INTRODUCTION
The purpose of this paper is to discuss some new design and operating
techniques to improve terminal area compatibility with particular emphasis
on the airborne part of the required systems. The subjects to be reviewed
are: Terminal area problems, capabilities needed for their solution,
advanced technology status and requirements, and some specific information
on a cooperative NASA/FAA program dedicated to providing some solutions and
demonstrations for conventional take-off and landing aircraft (CTOL) in
reduced weather minima and future high-density terminal areas equipped with
new landing systems, navigational aids, and increased surveillance and
automation under development by DOT/FAA.
B. PROBLEMS IN THE TERMINAL AREA
Problems in the terminal area are: Safety; weather effects; congestion;
and resulting loss in productivity caused by delays, diversions, and schedule
stretchouts; energy conservation; noise; and atmospheric pollution. The
exposure of inhabited areas near airports to high noise levels was one of
the first problems to cause an impact on aircraft operations. Operations
in a number of terminal areas are now restricted by procedures designed to
reduce noise exposure. More recently, fuel conservation has rapidly climbed
to a place of high national priority in all aircraft operations and this must be a
dominant concern in evaluating methods for solving the other terminal area problems.
1

The deleterious effects of air traffic congestion on operations during
peak traffic hours at some terminals, and the near-paralysis of the system
that can be caused by weather-induced delays, diversions, or closure of only
a few terminals are well-known to air travelers. The effects of reduced
visibility on safety occur predominantly in the terminal area, and reliable
and safe all-weather operation is a major goal. Atmospheric pollution is
also an item of continuing concern to the general public and must be con-
sidered in future system developments.
It should be recognized that some of the methods available for solving
the various problems listed above lead to conflicting results. For example,
engine acoustic treatment to reduce source noise will cause increased fuel
consumption, as will be indicated later. Thus, some hard choices must be
made,. and for maximum effectiveness the solutions for terminal area problems
must ultimately be considered and evaluated in an integrated manner.
C. CAPABILITIES NEEDED FOR SOLVING PROBLEMS
To assist in solving terminal area problems, the following new or
improved capabilities are required in the airborne systems:
Increased Productivity - Reduced Weather Effects
Example Required Capabilities Potential Improvement
Zero-visibility operation Precision automatic control
Advanced displays (monitoring or manualintercedance for landing)
Independent monitor of guidanceintegrity
Increased acceptance rates Improved tracking for lateral spacing
Reduced longitudinal separation throughvortex reduction/avoidance
2

Example Required Capabilities (con.) Potential Improvement
Increased acceptance rates Improved threshold arrival accuracy(continued)
Reduced runway occupancy time
Reduced workload Flight deck design and automation
Conservation of Energy - Reduced Atmospheric Pollution
Example Required Capabilities Potential .Improvement
Reduced air delays Increased airport acceptance rates
RTOL (reduced take-off and landing) aircraft
capability for use of secondary airports
Reduced route time Direct routing, deceleration from cruisethrough landing
Minimum-fuel flight profile Precise airspeed and altitude schedulingand prediction
Reduced engine use on ground Powered wheels or aircraft towing
Lowered combustion pollution Improved combustor design and enginecycles, anid new fuels (e. g.,, hydrogen,methane, etc.)
Reduced Noise
Example Required Capabilities Potential Improvement
Avoidance of sensitive areas Curved paths
Reduced source intensity Quiet engines
Steep, decelerating approach paths
High rate of climb
Continuing study and testing will be required to determine the practicality
and assess the value of the potential improvement, the penalties and prob-
lems involved in their application, and the costs involved. Although listed
under specific categories, there is obvious interaction between the various
items. For example,- .the :RTOL-aircraft._capability needed to .assist in
reducing air delays will most likely also provide increased rates of climb
3

to reduce noise exposure during take-off. The increased airport acceptance
rates required to reduce air delays will in turn require the capability to
reduce, avoid, or counteract the vortex wake problem.
D. TECHNOLOGY DEVELOPMENTS AND REQUIREMENTS
Recognition of the growing congestion associated with the rapid expan-
sion of air travel and the noise impact of the jet fleet on the airport
neighbors has, fortunately, already led to technology development in ground
and airborne electronic equipment and in noise suppression, and additional
development and evaluation activities should recognize and make maximum use
of these early developments.
D.1 LANDING GUIDANCE SYSTEMS - The improved airborne systems will be
required to operate in conjunction with upgraded navigation and guidance
systems shown in Figure 1. These systems are currently under development by
the Federal Aviation Administration (1)*. Terminal area operations will
include transition from enroute navigation by means of an area system (RNAV),
into the Microwave Landing System (MLS) with much of the operation probably
being automated. The MLS (Fig. 2) will provide coded signals over an azimuth
range of +600 and an elevation range of +10 to +200 plus distance information.
These signals will be received and processed onboard the aircraft to provide
position and velocity data. Thus, the guidance system will provide the
flexibility for flying the curved and variable angle approach paths required
for noise abatement, and will permit multiple aircraft arriving from many
directions to be guided into a time sequenced approach pattern with maximum
efficiency.
Numbers in parentheses designate References at end of paper.
4

D.2 AVIONICS SYSTEMS - In order to implement the needed capabilities
and improvements, new avionics developments must anticipate the operating
conditions of tomorrow's terminal area environment and must also be compat-
ible with the evolution of advanced ATC concepts. Many constraints will
affect the future systems, including location of airports and sitings of
runways, noise, pilot workload, aircraft handling qualities, passenger com-
fort, ride qualities, aircraft dynamics and flight paths, airline operational
considerations, and weather conditions. Recent advances in technologies such
as automatic controls, computers, navigation and guidance, and communication
systems provide the necessary tools for the development of an integrated
system for effective operations within an advanced terminal area Air Traffic
Control (ATC) system. There are gaps, however, in the application of tech-
nology. These gaps include the integration of the avionics with the aircraft
systems and the crew, and the operating procedures required for the Advanced
Air Traffic Control System environment. For example, displays, which must
be suitable for monitoring automatic operation or for manual control, must
be integrated into the aircraft, considering the pilot, flight control sys-
tems, guidance systems, traffic flow instructions, and collision avoidance
or station-keeping systems. The airborne digital computer having appropriate
ground/air data link inputs and outputs; data storage capacity; aircraft
control, sensor, and actuator inputs and outputs; and pilot/display and
instrumentation interfaces, offers the most promise as an integrating element
for the onboard system.
Advanced aircraft operating in the future civil air traffic management
system will require guidance and control techniques and enroute and terminal
area operating procedures which are significantly different from those

currently in use. Advanced flight-path control and landing systems will be
required to maintain rigorous schedules during noise abatement flight proce-
dures, and to interface with ground equipment transmitting guidance informa-
tion. Unique requirements arise from precision horizontal, vertical and
time-controlled (4D) navigation and close-in curved and decelerating preci-
sion flight-path control throughout landing in Category III visibilities.
At the present time, advanced guidance and control systems making full use
of digital technology offer the most promising approach.
Although automatic landing systems have been developed and automatic
landings made routinely during good weather conditions, they are being used
only by two operators in the world in commercial airline operations during
actual low-visibility conditions (Category III(a) Interim). This is due, in
part, to the lack of suitably equipped runways, but also due to a lack of
operationally suitable autoland performance and to the inability of the pilot
to adequately assess this performance as defined by the aircraft's situation
relative to the touchdown zone as it is approached. The most effective role
of the pilot in Category III landing operations has not been defined and his
role in automatic systems operation requires study and evaluation.
NASA's on-going research work in digital flight-control techniques
involves the application of an onboard system to perform the command and
control function, motion suppression (ride control), modal alleviation and
flutter suppression, maneuver load alleviation, stability augmentation,
guidance and navigation, and performance and failure monitoring. Specific
digital computer work includes investigations of logic theory, efficiency
of computations, and self-monitoring functions.
6

The application to aeronautical guidance and control systems of advanced
electronic circuitry and systems developed in support of the space program
may offer significant advantages. Acceptance of these advanced systems
(pure fly-by-wire) is not anticipated until sufficient flight investigation
and evaluation is undertaken.
D.3 ENGINE QUIETING AND ENERGY IMPLICATIONS - Conceptual designs of
advanced fanjet engines with a primary goal of reduced noise have been
studied (2,3). The use of high bypass ratios and extensive acoustic treat-
ment of the engines were both found to be effective, with a combination of
the two being required to achieve the magnitudes of noise reduction desired.
An example of the noise benefits obtained and economic costs of. quiet engines
is illustrated in Figure 3, (2). The top half of the sketch represents a
high bypass-ratio .engine designed to achieve FAR 36 noise levels with no
acoustic treatment. The lower half of the sketch shows the acoustic treat-
ment and increased length necessary to obtain a noise reduction of perhaps
12-18 EPNdB. The heavy lines illustrate the acoustic treatment.. The
increased length and the added acoustic treatment would, of course, add to
the weight and cost of the engine and increase the fuel consumption. Vari-
able fan and nozzle geometry can also be used to achieve the lowest noise
levels but the weight and cost would most likely be prohibitive.
The curves show that increasing amounts of acoustic treatment can
achieve noise reductions as great as 12-18 EPNdB below FAR 36 levels but that
the cost in reduced return on investment (ROI) is large. .A reduction of 1%
in ROI is a significant economic loss to an airline. It appears, at least
from this example, that achievement of noise reductions above about 10 EPNdB
7

by engine design and treatment may be economically impractical and noise
abatement flight procedures may be a practical necessity.
An example of a typical conflict between energy usage and environmental
quality (in this case, aircraft noise) is shown in Figure 4 (for the termi-
nally compatible study airplanes of Ref. 4). For advanced CTOL aircraft
designs, the 90 EPNdB footprint areas in square miles are plotted as a
function of percent block fuel increase at design range.
Several important observations are suggested by the design estimates of
Figure 4:
(a) The take-off (middle set of curves) produced about 80% of the noise
footprint for the study airplanes, and this is essentially unaffected by
extensive acoustic treatment.
(b) Increased engine acoustic treatment will reduce the approach noise
footprint area, but at the cost of increased block fuel usage (about 3%).
(c) Steep approach angles will lower the approach noise footprint to
a level comparable to that obtained with extensive acoustic treatment.
(d) The airplane designed for steep approaches will be heavier than
one without this requirement, which will result in a block fuel increase
of about 1%.
(e) Steep descent procedures will thus lead to a net fuel saving of
about 2% compared to an acoustically treated nacelle at low approach angles.
E. TERMINAL COMPATIBILITY
E. 1 TERMINAL CONFIGURED VEHICLE (TCV) PROGRAM -
E.1.1 Overview - It has been recognized that new navigation, landing
guidance, and ATC equipment and procedures cannot solve the problems that
they are intended to solve unless the airborne systems and procedures are
8

developed to take full advantage of the capabilities of the ground-based
facilities. The airborne system is considered to be the basic airframe and
equipment, the flight-control systems (automatic and piloted modes), the
displays for monitoring or pilot control, and the crew as manager and opera-
tor of the system. Because of the urgent need.to develop the required air-
borne system capability, the NASA Langley Research Center (LRC) has
implemented a long-term research effort known as the Terminal Configured
Vehicle Program. The program will conduct analytical, simulation, and
flight-test work to:
Develop advanced flight-control capability for -
4D RNAV and transition to MLS
Precision curved, steep, decelerating final approach, timesequenced, utilizing MLS
Zero-visibility landings through turnoff
By means of -
Advanced automatic controls
Advanced pilot displays for monitoring/control
Reduced crew workload
Improved interfaces of avionics, aircraft, crew
Advanced airframe configurations to be determined
E.. 2 Research Support Flight System - The primary facility to be used
in the flight research program is the Research Support Flight System (RSFS).
The system consists of a Boeing 737 aircraft shown in Figure 5 taking off for
its first flight with NASA markings. An FAA insignia has been added to the aircraft
since this is a cooperative program with FAA. The equipment aboard the air-
craft includes all-digital integrated navigation, guidance, control, and

display systems, the latter developed for the now defunct U.S. Supersonic
Transport (SST). These developments were initiated to provide a state-of-
the-art digital system technology base for future transport airplanes. The
baseline operational requirement for these systems considered low approach
operations in future air terminals of high density using noise abatement
procedures with consideration for the economics of their operation and
purchase; however, Category III landings or close-in curved approaches were
not a requirement. Utilization of the technology spinoff from the SST is
considered to be a very important element of the TCV program in that the
display hardware and computer developments had already taken place under a
DOT contract, and it appeared to be a cost-effective means of initiating the
operational aspects of the research program. It is to be stressed that these
systems are considered a starting point rather than the end points of the
equipment to be developed in the program.
A cutaway view of the airplane is shown in Figure 6 illustrating the
palletized installation of these equipments and depicting a second cockpit
for research (aft flight deck, AFD) installation. The value of the RSFS for
research purposes is enhanced by several notable design features:
(a) The system functions are controllable and variable through software.
(b) The hardware is easily removed, modified, repaired, and reinstalled.
(c) Flight station changes are readily accomplished in the research
cockpit which has a fly-by-wire implementation for control of the airplane.
The Advanced Electronic Display System (ADEDS) pilot displays illustrated in
Figure 7 consist of an Electronic Attitude Director Indicator (EADI) at the
top, the Electronic Horizontal Situation Indicator (EHSI) in the middle, and
the Navigation Control/Display Unit (NCDU) at the bottom. The display system
10

is all-digital and can be readily re-programed with regard to formats and
symbology for research purposes. The NCDU is used to call up pre-planned
routes and flight profile information or for entering new or revised infor-
mation to be displayed. Inserted information and flight progress information
can be called up on the NCDU for review. This display system will be retained
by NASA on a long-term loan from DOT-FAA.
The EADI instrument provides basic attitude information to control the
aircraft. Also, error or command symbology can be added to fly predefined
horizontal, vertical and speed controlled (4D) profiles and transitions from
one profile to another. The EHSI shows the horizontal plan of the flight,
either heading-up or with north-up mode, and the flight progress. On it can
be displayed moving time slots in which the pilot can maintain position,
manually or automatically, for sequencing. Also, the dashed leader line
projected from the nose of the aircraft in the figure shown presents pre-
dictive information to the pilot as to where the airplane will be (at its
present turn rate) in 30, 60, or 90 seconds from the present. Although the
entire flight plan could be flown from the EADI alone, the EHSI-adds greatly
to the clarity of the situation and provides long-term anticipation for the
pilot. It is a great confidence builder and a planning aid to changes to
the flight plan.
A block diagram of the integrated navigation, guidance, and control
system in the aircraft is shown in Figure 8. An implementation of redundant
computers and sensors is the heart of the automatic control system in the
airplane. It is configured to allow an evaluation of sensor voting tech-
niques. Inasmuch as the basic 737 controls have not been disturbed, the
servos remain the simplex system of the basic airplane with a monitor added.
11

In this diagram, the research cockpit controls appear as another sensor
input to the flight-control computers. Other elements of the system make
up the navigation, guidance, and display subsystem. The concept would
require these systems to be duplex but their implementation for TCV research
on the 737 is single thread.
A photograph of the partially completed aft flight deck is shown in
Figure 9. Spaces provided for the ADEDS unit are visible as well as the
Brolly Handle controls used to permit unobstructed views of the ADEDS.
E.1.3 Avionics Equipment - A major part of the effort in the first
part of the TCV program will be to investigate and evaluate the advanced
avionic equipment that will be on the airplane initially to determine its
suitability for use during the complex approach paths made possible by the
MLS guidance. Following these phases, new or different avionic systems will
also be considered and evaluated as deemed appropriate.
E.1.3.1 Guidance and Controls - It is necessary to determine the most
effective aircraft operating system from the standpoint of cost, safety,
pilot proficiency (through use in day-to-day operations), and pilot accept-
ance during crucial Category III operating conditions. The objective will
be to define a system employing a digital computer for aiding the crew in
its monitoring, checkout, and flight planning functions. A time line analy-
sis of crew functions to define workload, and the design of software to aid
at peak workload times will be undertaken and demonstrated on a flight simu-
lator. The reduction in distraction and workload and its effect on increas-
ing safety during critical flight periods will be determined. The man/
machine system, with the added capabilities -inherent in the digital computer,
will be investigated to further define satisfactory handling qualities of
12

aircraft operating in an advanced ATC system particularly during maneuvers
required in heavy traffic situations. The flight-control work will develop
an advanced system and evaluate the potential of digital sensors and actua-
tors as well as digital computers. This work will provide technology to
allow better command-following for the aircraft in executing ATC flight paths.
E.1.3.2 Digital Flight-Control System Computers - Future transport
aircraft are expected to utilize digital computer systems to perform such
critical tasks as stability augmentation, flight-path control, and automatic
approach and landing. Concepts and techniques required to maintain a high
level of aircraft safety and system reliability with the high degree of auto-
mation required for future operations are being examined.
During the initial phases of the TCV program, the flight critical func-
tions of the automatic guidance and control system will be mechanized using
triply redundant digital techniques. The primary element of this system is
the General Electric ICP-723, a triply redundant variable-increment digital
computer (Fig. 10) available from a DOT program. All three computers inter-
face with a System Status and Control Unit (SSCU) which serves as a junction
box for a Sensor Failure Decoder Unit, a Computer Monitor Unit, and a Memory
Program Loader Unit. The SSCU also serves as a monitor for internal equip-
ment failures while sensor failures are monitored by the Sensor Failure
Decoder Unit.
The triply redundant computation of this system provides the capability
for studies involving a fail-operational control system even though the sys-
tem actuators are single thread. The digital mechanization is identical in
all three channels including the input and output monitors as well as the
basic computers. This configuration permits a relatively straightforward
13

implementation of failure monitoring and redundancy management. The system
generally reduces to a less redundant operation when subjected to either a
system failure or a transient anomaly. Since this is an undesirable feature,
alternate schemes for mechanizing a fault tolerant system are being examined
for application to the RSFS in the near future. An attractive alternate
scheme appears to be the use of a whole word general-purpose digital computer.
This computer has the potential to re-order the system organization through
software control to (1) recover from a transient abnormality, (2) provide
priority processing of critical functions, and (3) modify control algorithms
so as to utilize alternate data sources with perhaps some task performance
degradation. For longer-term applications during the TCV program advanced
computer architectures (i.e., multicomputer, multiprocessor, distributed
computer) will be investigated and an architecture selected from several
candidates for detailed design. Emphasis will be placed on achieving an
ultra-reliable design with modularity and flexibility for differing applica-
tions. This design is expected to provide the high level of test and diag-
nostic capability needed to eliminate the effects of failures during opera-
tional use.
The development and application of concepts and techniques for reliable
airborne computers is currently being examined. Initial emphasis is being
placed on advanced computer processors, systems software. and error
detection/correction methods which would take advantage of space system
advances. For immediate applications, examinations are being made of "off-
the-shelf" computers with redundant organizations (i.e., triple-modular
redundant, hybrid, majority voting, spare switching).
14

E.1.3.3 Aircraft-Ground Data Transfer - Current aircraft-ground infor-
mation exchange needs are satisfied by voice-radio communications which
suffer from limitations in response time, information carrying capacity,
reliability of information transfer and the workload, and distractions for
both the pilot and controller during communications and frequency changes.
The increasing demands on the present ATC system, brought on by increasing
air traffic density and the changing performance of new aircraft designs,
require a more effective means of managing air traffic. In addition, aircraft
will be participating in a changing ATC environment in which at least some of
the present functions will be automated. These demands lead to a requirement
for a reliable, high-speed communication system for data transfer between
airborne systems and ground systems. The design of such a system is dependent
upon the division of responsibilities for ground and airborne data processing.
Initial studies will be aimed toward the definition of requirements and
implementation techniques for the data transfer system. Some of the technical
problems which will be attacked during the initial study are multiplexing,
digital data transmission techniques, modulation and coding, and data format.
A critical interface problem to be investigated is that of interfacing the
data'transfer system with the displays. The requirement for precision low-
altitude navigation information and flow management information in high
traffic density terminal areas introduces a question of severity of multipath
effects on the data transfer system. This question will be examined and
resolved in the preliminary study phase of the program.
E.1.4 Piloted Simulator - The current simulation facility at the
Langley Research Center incorporating the characteristics of the RSFS is
being utilized in the study of display format and symbology. In order to
15

accommodate the heavy program load of the future and to provide the maximum
amount of realism, a dedicated simulator cab is being purchased which dupli-
cates the aft cockpit of the RSFS airplane. This cabin allows for a maximum
of center panel visibility utilizing the Brolly Handle controllers shown in
Figure 9. This approach is a fallout of the SST display and control develop-
ments and will serve as a "jumping off" point for the TCV program. Plans for
the study and evaluation of other pilot control concepts include sidearm and
pencil-type controllers. The mechanization of these new concepts in the
simulator for development and study and in the aft cockpit of the airplane
for flight evaluation is seen as a relatively simple operation, since the
same hardware can flow from simulator to airplane. In addition to serving
the research needs of the program, it is anticipated that the simulator will
serve as a '"mission trainer" as outside pilots are invited to participate in
program evaluations.
E.1.5 Terminal-Area Environment Simulation - Systems development under
the TCV program will be directed toward the improvement of aircraft systems
performance. However, it is essential to study the vehicle in the traffic
environment in which it must operate. A number of vehicle-dependent aspects
which impose constraints on the flight paths and on rates of changes of flight
speed and direction which are practically achievable must be given proper
consideration. For example, aircraft performance and aircraft system charac-
teristics must be compatible with advanced air traffic management concepts.
These considerations lead naturally to trade-off studies between future air
traffic management system characteristics. For this purpose, a detailed
airport terminal-area simulation has been developed for use in these studies.
The terminal-area simulation can be used for analysis and synthesis of both
16

current and future air traffic situations and has the capability for repre-
senting advanced airborne and ground instrumentation as illustrated in Fig-
ure 11. The simulation currently being utilized models a typical terminal
area and contains elements to realistically represent: (1) airborne naviga-
tion equipment, communication systems, and the primary aircraft sensors;
(2) the ground navigation aids, data links, radars, airport configurations,
traffic situation displays, ATC procedures, enroute flow control information,
runway and airspace constraints; (3) models of traffic samples; and (4) air-
craft performance characteristics with constraints on maximum descent, turn,
and climb rates.
Fast-time simulations will be used to determine candidate concepts for
flight-path control. Analytical models of the RSFS, MLS characteristics, and
wind effects are currently being developed. These simulations will assess
the performance required of the aircraft and selected airborne systems oper-
ating in a simulated air traffic environment of a typical terminal area.
A sample of the type of preliminary results that are being obtained with this
simulation is shown in Figure 12. A typical traffic situation at the Atlanta
terminal with the aircraft mix indicated in Figure 12 was simulated, based on
data for a single runway in 1967. -With a 3-mile separation between aircraft,
the acceptance rate from the simulation levels off at a number in agreement
with the known normal IFR rate at Atlanta at that time, which provides valida-
tion of the simulation. If a 2-mile separation could be achieved, an increase
in acceptance rates could be realized as shown.
Piloted simulation experiments will be conducted in conjunction with the
terminal environment simulation to verify candidate system concepts which
take maximum advantage of the pilot and aircraft performance. characteristics.
17

These studies will identify technology deficiencies which are most critical.
Studies which include air-to-ground and ground-to-air links will place
emphasis on determining the effects of time delays, information update rates,
human-detected and undetected data loss, or incorrect transmission of data
and failure modes. In the evaluation of total system performance, current
and projected concepts for surveillance, navigation, communication, airborne
computer/display systems, and ground computer equipments and instrumentation
levels will be considered.
Subsequently, the RSFS aircraft, flying at the Wallops Station, will be
included in the terminal area situation studies via the LRC-Wallops data tie-
line. A data link between the terminal area simulation and the aircraft will
permit the aircraft to participate in a realistic air traffic control system
and environment. The concepts selected for flight investigations will be
based on results from the analytical studies and simulations. Flight experi-
ments will provide realistic bounds for, and verification of, simulation
studies and results.
The flight experiments will also identify operating constraints imposed
by use of the actual aircraft and avionics systems, and will result in pre-
liminary hardware specifications for critical airborne avionics systems.
E.1.6 Wallops Research Facility - The Wallops Station airfield will be
utilized for much of the flight activity in this program. It permits a high
volume of research on approach and landing problems since the contiguous air-
space is controlled by the NASA. A modern control tower, as well as fire,
crash, and rescue services, are available on a full-time basis. The station
has all the required research support facilities such as meteorology, photog-
raphy, and computer systems, in addition to hangars and housing, if required.
18

The MLS capabilities and signal characteristics will be simulated by an
FPS-16 radar and laser tracker for precision guidance throughout landing,
rollout, and turnoff, as well as take-off until an actual MLS system is
available. A display generation facility,.a research tool, will also be
available to generate, through data downlink and television uplink, display
formats and symbologies on the pilot's display to augment the information
that can be generated onboard the RSFS. Figure 13 is a photo of the Wallops
airfield. Note the unobstructed approaches and the low population density.
No civil or military. aircraft operate out of Wallops so little interference
with the flight research will be encountered.
Facilities at Langley and Wallops will be integrated through a ground
data link as shown schematically in Figure 14. This system will permit the
terminal area simulations at LRC and at the FAA's National Aviation Facili-
ties Experimental Center (NAFEC) to display and control the RSFS while in
flight. The LRC display illustrated in Figures 11 and 14 is only for obser-
vation and is not a control display. The system will be used for a realistic
study of overall performance and system interactions.
Two of the national standard developmental MLS systems have been
installed at the Wallops Station airfield for FAA proof-of-concept evalua-
tions. It is hoped that a winning system prototype can be utilized in early
phases of the program to evaluate performance capabilities on an actual MLS
system.
E.1.7 Flight Procedures - Figure 15 illustrates the utilization of
advanced paths and serves to show how some of these capabilities might be
used. Operations in the MLS environment can, with proper-controls and dis-
plays, allow operators to take advantage of curved approaches with close-in
19

capture, steep approaches and decelerating approaches. Onboard precision
navigation and guidance systems are required for 3D/4D navigation for sequenc-
ing and closer lateral runway spacing, and displays are under development with
the intent of achieving zero visibility operations with sufficient confidence
that they become routine. Finally, programed turnoffs at relatively high
speed should clear the runway to allow operations to proceed with perhaps 35
to 45 seconds between aircraft, should the vortex wake problems be solved. New
take-off noise abatement procedures may require additional thrust and higher take-
off climb gradients in order to satisfy some of the noise abatement procedures.
E.1.7.1 Curved Approaches - The utilization of the curved path is pro-
posed as a method of noise control at many locations; however, the impact on
capacity of curved approaches with short final legs has yet to be established.
Nevertheless, this capability can be used to shorten trip time and conserve
fuel. Figure 16 is a chart of the New York terminal area with its included
control zones and instrument weather final approach paths for a given landing
direction. Note that the final approach paths are 8 to 10 miles in length
and that approach paths into JFK, for example, pass through the LaGuardia
control zone, Newark's through Teterboro control zone, and so forth. (A STOL
aircraft landing opposite Manhattan would be constrained to fly around and
underneath the CTOL patterns.) The approach control of these aircraft is,
thus, a very involved operation indeed. The airspace required is excessive.
Development of close-in curved approach capability would permit containment
of instrument traffic within each airport's control zone, would reduce the
traffic coordination problem, thus increasing capacity, and would permit more
direct routing of STOL aircraft, as an example, between airport control zones.
The TCV program plans heavy emphasis on the development of curved approach
20

techniques for both manual and automatic flight. Control law development is
underway on some aspects of these advanced all-weather paths.
E.1.7.2 Steep Approaches - Figure 17 shows the effect of increased
approach glide-path angle on the airport community noise for two values of
landing flap deflection, 5f = 400 and 300, for the Boeing 737 with acousti-
cally untreated nacelles. At the top of the figure, 90 EPNdB contours shrink
as the glide-slope angle is increased. With 300 landing flap, less power is
required and the 90 EPNdB contour is smaller in area. Contour or footprint
area is plotted in the lower left as a function of glide-slope angle, but
normalized to the standard 30 glide slope for each flap deflection. This
relative footprint area shows that even at a glide-slope angle of 40 a 50%
reduction in area affected by the 90 EPNdB noise is possible. The lower
right section of the figure shows the reduction in the FAR-36 approach noise
as a function of glide-slope angle. The slope of the curve taken at the 30
glide slope is approximately 3 EPNdB reduction per degree of glide-slope
angle increase with 400 of landing flap. The dominant source of noise in
these calculations is. the propulsion system. An estimate of the airframe
noise at a flap setting of 5 = 400 is included to indicate the lower limit
of possible noise reduction based on a current understanding of aerodynamic
noise. The propulsive noise changes are more favorably affected by glide
slope than is the-aerodynamic noise due to the dual effect of increased dis-
tance and the reduced thrust required (the aerodynamic noise varies only as
the distance from the ground for a given speed).
Presently, it has been shown to be feasible to reduce landing noise
through use of the two-segment approach. Both NASA and FAA data indicate
substantial reductions in the resulting community noise levels. Further,
21

there appears to be no difficulty in flying these approaches down to non-
precision approach minima, or in passenger acceptance. In addition, many
aircraft have more than one certificated landing flap setting and as a result
some airlines are using a landing flap setting which is less than the maximum
flap when the landing field and other conditions allow. These procedures
require no further development, but they form a standard for the comparison
of the techniques proposed for operation within the MLS environment.
E.1.7.3 Decelerating Approaches - Much effort has been devoted to
assessment, from the noise viewpoint, of the decelerating approach. This
technique requires a precise knowledge of the distance from the runway and a
continuous closed loop on speed and progress (computer and INS sensors), as
well as IAS and flap configuration, to be consistently effective and safe.
The technique will be explored in the TCV program to assess not only noise
but to explore reductions in flight time and savings in fuel for possible
improvement in terminal operations.
E.1.7.4 Terminal Capacity - Many authors and airline passengers have
noted the yearly increases in the number of airports which saturate in instru-
ment weather due to the increased number of operations. Even with the present
schedule reductions due to limited fossil fuel reserves the number of airports
which operate at saturation rates is high since the airlines have reduced
the number of flights mainly to nonmajor terminals. The constraints of
single runway landing capacity are shown in Figure 18. Here, landing opera-
tions per hour are given as a function of the aircraft separation in seconds.
The curve represents the maximum number of landing operations per hour on a
single independent runway.
22

Typical known constraints are shown on the curve and illustrate the
effect on operations rate (capacity). The first constraint deals with vortex
decay (area 1). As will be shown later, some evidence exists that vortex
attenuation devices have the potential of alleviating this constraint.
Application of these devices to large airplanes will reduce the separa-
tion interval to about that indicated by area (2) or even lower. The area
labeled (3) on the curve represents the time required to decelerate to a
5-knot turnoff airspeed and clear the runway. Quicker runway clearance can
be achieved by providing (a) higher decelerations, (b) higher turnoff speeds,
or (c) a combination of the two. The latter appears to provide the possibil-
ity of meeting the TCV goal of an arrival-time interval of 40 seconds ±5, as
indicated by area (4) on the figure, and can be achieved by braking at 0.2g
and turning off at 60 knots or by a modest increase in braking force and
using a 40-knot turnoff. Increased accuracy in time of arrival over the
threshold (+± seconds compared to today's +15 to 20 seconds) will be required
to maintain safety with the reduced spacing. It should be. pointed out that
current rules and traffic flow rates do not require that a pilot exit the
runway quickly even at airfields where congestion is a problem, and at some
airfields where high-speed exits do exist, the exiting aircraft are often
forced to stop for other taxiing aircraft. To make maximum use of busy run-
ways, the constraints must be recognized and moves made to improve the total
picture such as proper use, location, and designation of turnoffs by traffic
control. Operations in very low visibility will require automatic guidance
from touchdown through braking, turnoff, and taxi. In addition, airport
surveillanpe systems, an FAA responsibility, will need more attention to
protect against collisions on the ground.
23

A conceptual sketch of a high-capacity runway making use of some of the
techniques discussed for noise abatement is shown in Figure 19. By using
different final approach paths and touchdown points, the trailing vortex wake
can be avoided to permit less spacing between aircraft. Raising the lower
glide slope to 40 from 30 would reduce the 90 EPNdB footprint by almost 50%
and the FAR-36 approach noise by 3 dB. However, if such techniques are to be
brought into being, the whole air terminal as well as the airplane must be
upgraded. The Microwave Landing System flare guidance antenna must be located
so that more of the runway is available for touchdown under instrument condi-
tions. The lower path of 40 shown in the figure could be used by all of the
"heavy" aircraft and possibly some of the lighter aircraft as well, and if
combined with reduced flap or decelerating approach techniques noise foot-
prints and fuel consumption could be considerably reduced.
The high glide slope could accommodate no "heavies" but could accommo-
date all other types and maintain noise and fuel improvements even greater
than the lower path. The pilot needs better displays of his situation rela-
tive to other aircraft and to the runway if he is to gain enough confidence
in such a system to allow it to become a reality.
E.1.8 Displays and Human Factors -
E.1.8.1 Primary Displays - New cockpit displays must consider the
changing role of the crew from sensor/controllers to monitor/managers. Infor-
mation presented to the crew should be processed and displayed in an inte-
grated, analog form where possible to convey a naturally assimilated mental
picture for assessment of a complex situation. Predictive display informa-
tion will be needed to provide the required level of anticipation for the
pilot whether monitoring or controlling.
24

The research system will incorporate electronic displays which offer an
element of capability not currently found in electromechanical display sys-
tems. The cathode ray tube (CRT) system photograph taken in the Langley
simulator is shown beside current airline attitude director indicator (ADI)
and horizontal situation indicator (HSI) in Figure 20. Note the ADI/HSI
instrumentation requires scanning, interpretation, and integration of the
information presented on two separate instruments to enable the pilot to
assess his aircraft's situation.
The instrument pilot must have and maintain a continually updated mental
picture of his aircraft's orientation and flight-path trend with respect to
the runway to satisfactorily complete an instrument low approach. This
requirement becomes all important if an instrument landing is to be made or
if monitoring an automatic landing in Category III visibility. Without a
current mental picture of his aircraft's situation, the pilot's workload
during the interpretation of his instruments, control of the aircraft while
following specific procedures, and the performance of other necessary com-
munication, check and decision making tasks during the instrument approach
may easily become excessive, resulting in disorientation and missed approaches.
Capability for operating in Category IIIc conditions (zero visibility) is
seen as a strong requirement for the future air transportation system. The
TCV program will place a heavy emphasis on the primary displays for pilot
confidence in operations independent of weather.
A CRT display concept with a computer-generated perspective runway super-
imposed on a typical ADI instrument format has often been proposed and tried
to improve the pilot's "natural" real-world cues for determining aircraft
situation with respect to the runway during an instrument approach. However,
25
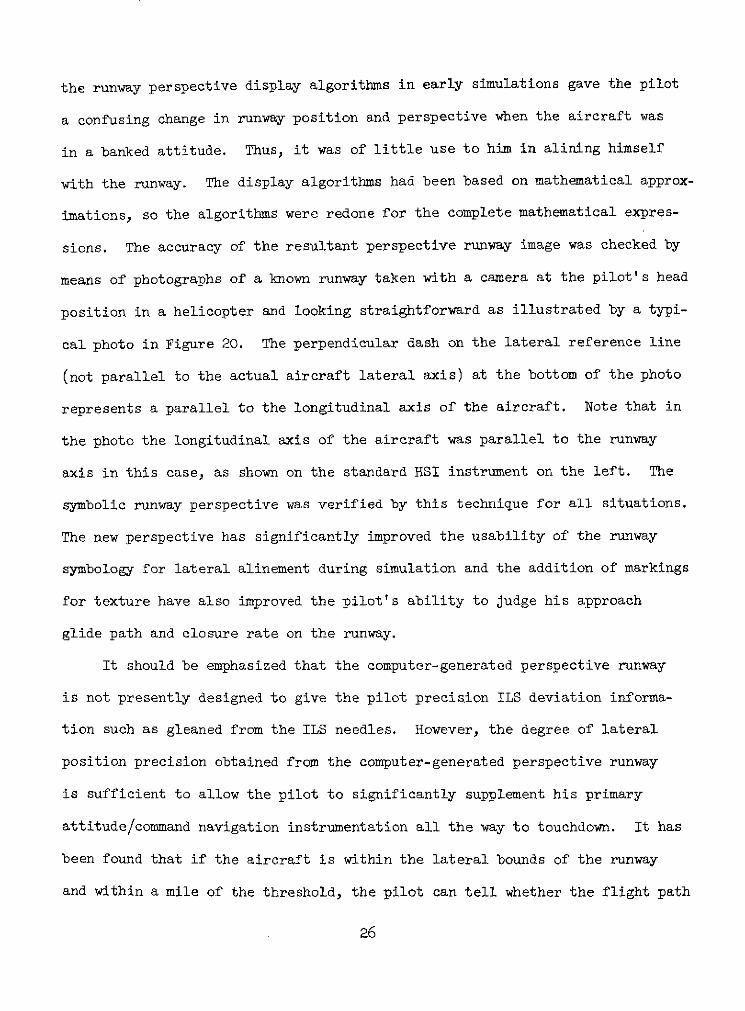
the runway perspective display algorithms in early simulations gave the pilot
a confusing change in runway position and perspective when the aircraft was
in a banked attitude. Thus, it was of little use to him in alining himself
with the runway. The display algorithms had been based on mathematical approx-
imations, so the algorithms were redone for the complete mathematical expres-
sions. The accuracy of the resultant perspective runway image was checked by
means of photographs of a known runway taken with a camera at the pilot's head
position in a helicopter and looking straightforward as illustrated by a typi-
cal photo in Figure 20. The perpendicular dash on the lateral reference line
(not parallel to the actual aircraft lateral axis) at the bottom of the photo
represents a parallel to the longitudinal axis of the aircraft. Note that in
the photo the longitudinal axis of the aircraft was parallel to the runway
axis in this case, as shown on the standard HSI instrument on the left. The
symbolic runway perspective was verified by this technique for all situations.
The new perspective has significantly improved the usability of the runway
symbology for lateral alinement during simulation and the addition of markings
for texture have also improved the pilot's ability to judge his approach
glide path and closure rate on the runway.
It should be emphasized that the computer-generated perspective runway
is not presently designed to give the pilot precision ILS deviation informa-
tion such as gleaned from the ILS needles. However, the degree of lateral
position precision obtained from the computer-generated perspective runway
is sufficient to allow the pilot to significantly supplement his primary
attitude/command navigation instrumentation all the way to touchdown. It has
been found that if the aircraft is within the lateral bounds of the runway
and within a mile of the threshold, the pilot can tell whether the flight path
26

is taking him to the first quarter of the runway. This development represents
progress but is not to be construed as final in the search for better displays.
E.1.8.2 Independent Landing Monitor - Available technology needs to be
be applied to the development of an independent landing monitor (ILM) for the
pilot with which he can continually determine the integrity of the basic
guidance system (MLS or ILS) and judge the overall performance of the approach
to landing, be it automatic or manual. The sensor system and the- utilization
and integration of the sensor information have not yet been determined for
commercial application. Concepts which may be applicable in the development.
of an ILM include autonomous or active ground-assisted sensors, radar-
radiometer imaging and radar triangulation for position determination, and
computer-generated predictive displays. It would be desirable for ILM infor-
mation to be integrated with and usefully augment the basic flight displays.
Studies will identify and analyze problem areas relative to propagation
effects that are deemed to be critical to the successful achievement of an
ILM.capable of.meeting user needs., Near-field effects, multipath, shadowing,
and -weather penetration are distinct areas of concern. Concurrently, studies
will be conducted to define display criterion; that is, how best to display
what information. Simulations will also aid in the determination of the
adequacy-.of ,existing techniques to meet the program objective. Computer
formating and system interfacing will also be investigated.via simulation.
This phase of the program will provide the information required to procure
a flight model. -The prototype will have built-inflexibility to permit
essentially breadboardlike parameter manipulation of such items, as display
and computer formating-and system-interfacing.
27

E.1.8.3 Traffic Situation Displays - Research will also be conducted
to evaluate candidate display techniques for providing the pilot with infor-
mation concerning other traffic in his proximity for the purposes of increased
terminal-area efficiency and safety enhancement particularly during low-
visibility conditions. For example, airborne traffic situation displays have
been considered as a means of enhancing safety and performing the collision
avoidance function in congested areas. However, controversy exists as to the
desirability of such displays for the pilot. Hence, further evaluation of
this type of display in an operational environment is required. In the TCV
program, the terminal-area simulation model will be used to provide high-
density traffic situation data for transmission to airborne traffic situation
displays. Both cockpit simulation and RSFS flight experiments will be con-
ducted under simulated instrument conditions. During this simulation, con-
flict conditions will also be generated.
Flight experiments will also be conducted under VFR conditions and, if
feasible, one additional aircraft will be used to determine the effectiveness
of the traffic situation display in enhancing visual acquisition of poten-
tially hazardous targets.
Types of data, data rates, and data link characteristics necessary to
provide pilot-acceptable traffic situation displays for enhancement of
terminal-area safety will be explored.
E.1.8.4 Manual Control Modes - The research support flight system is
currently equipped with control laws which allow the selection of either of
two manual control options: (1) rate command, attitude hold control wheel
steering, and (2) velocity vector control wheel steering which combines flight-
path angle control wheel steering in the longitudinal axis and track angle
28

control wheel steering in the lateral axis. Figure 21 is an illustration of
the performance of the two systems in the lateral axis. On the left of the
figure, the aircraft with rate command attitude hold is stabilized on a course
until it encounters a shear V which blows it off course at a constantc
attitude. When track angle is used (right sketch), there may be a slight
deviation between course and track as a cross shear is encountered but track
angle is sensed and the airplane quickly recovers on a parallel track in a
new heading attitude. Reduced pilot workload in tracking is expected to ensue.
E.1.8.5 Oculometer - An important research tool for the development of
advanced displays is the Langley-developed oculometer. This device tracks
the pilot's eye movement without interceding in his scan pattern and auto-
matically records the movement of his eye for later analysis. The device is
very accurate and shows within about 1/2 inch where the eye's gaze resides.
The device is, at this point, new and all the uses to which it may be'put
eventually are not known; however, it will be used to track the pilot's eye
to see if he scans various new pieces of displayed information. While it is
true that if a pilot does not look at his information he cannot use it, if
he does regard it with his eye he may not use it. Furthermore, he may stare
at information inefficiently and not look at information he should use for
the task. Figure 22 shows the superposition of a pilot's scan pattern as
measured by the oculometer during a recent night approach at the Wallops air-
port. While he has no recollection of the fact, the data show his scan
rested on the clock during this particular approach. It is anticipated that
as experience is gained with the device its utility will grow and its uses
will expand in the development of new display formats and systems.
29

E.1.9 Flight Results to Date - A flight-test demonstration program of
40 flights comprising 78 flight hours (Fig. 23) has been completed by Boeing
under FAA and NASA sponsorship. These flights were to shakedown, checkout,
and validate the advanced display and automatic guidance and control system.
The aft flight deck was not in place and the display and control systems were
operated from the forward flight deck. As noted in Figure 23, a variety of
weather conditions was encountered during the tests.
Some operational problems not unexpected with complex, digital avionic
equipment were encountered but most of these have been resolved and the equip-
ment design is considered validated and acceptable for initiation of the
research program. A number of automatically controlled flights were made
including 30 which were 4-D controlled through a complete 125-mile flight
profile from climbout through touchdown. The touchdown time accuracies
obtained (Fig. 23) give encouragement to the belief that further development
and experience will result in attaining the goal of <5 seconds in routine
operations.
Following installation and checkout of the aft flight deck, an extensive
research program will begin with initial emphasis on advanced flight proce-
dures and avionics to contribute to solution of terminal-area problems.
E.2 KEY AIRCRAFT DESIGN AND OPERATIONAL REQUIREMENTS - Previous dis-
cussions have dealt with alleviation of terminal-area problems by means of
advanced electronic systems and advanced flight procedures made possible by
them. To -implement some of these procedures and to gain additional benefits,
a number of key requirements for aircraft performance will be necessary to
achieve terminal-area compatibility. In order to determine quantitative
measures of what the requirements should be and the associated cost and
30

benefits, the NASA has underway activities in consultation and cooperation
with the FAA; airframe, engine, and avionics manufacturers; airlines; and
airport operators.
An example of these activities is a recently completed contractual effort
with the Boeing Company, conducted under the management of the Langley
Research Center Aeronautical Systems Office, entitled "Advanced Subsonic
Long-Haul Transport Terminal Area Compatibility Study" (4). The long-haul
class of aircraft was chosen for these initial studies since considerable
information existed from the extensive Advanced.Transport Technology Studies
(5-7) conducted in 1972. It is apparent that short-to-medium range aircraft
will spend a considerably higher percentage of their trip time in the'termi-
nal area and additional studies on these classes of aircraft are now getting
underway.
Some of the key design and operational requirements that have been
identified as being technically feasible for the approach and landing phase
are summarized numerically in the following table. For comparison, current
long-haul aircraft characteristics are also presented.
Key Design Requirements
Characteristic Current Objective
Approach and landing:
Path Straight, constant Curved,velocity decelerating
Angle, degrees 3" 6 to 9Velocity, final, knots 135 120Aircraft long. spacing, miles 3 and 5 1 to 2
Runway lateral spacing,. feet 5000 2500Arrival accuracy, seconds 18 5Touchdown dispersion, feet ±320 +100
Aircraft deceleration, ft/sec2 6 9 to 12Turnoff velocity, knots <5 40 to 60Occupancy time, seconds 55 25
31

Key Design Requirements - Concluded
Characteristic Current Objective
Noise: EPNdBSource FAR-36 FAR-36-10 to -12
Airframe FAR-36-8 to -12 FAR-36 > -12
Take-off and climb:
Emissions, CO-HC, lb/cycle 60 25
Noise: EPNdB FAR-36 FAR-36-3 to -5Climb angle, degrees 7 to 8 8 to 10
Altitude at FAR-36 point, ft 1300 2000 to 2500
E.3 TERMINALLY COMPATIBLE LONG-HAUL AIRCRAFT - With the key design and
operational requirements identified, preliminary design studies were made to
determine the technical feasibility and the costs and benefits associated
with subsonic long-haul Terminal-Area Compatible (TAC) Aircraft. Two designs
were considered: (1) a conventional take-off and landing (CTOL) configuration
sized to operate from 10,000-foot runways, and (2) a reduced take-off and
landing (RTOL) configuration sized to operate from 5000-foot runways. The
latter design utilized essentially the same technology features as the former
to achieve terminal compatibility and differed mainly by increased wing area
and engine thrust to attain the reduced runway performance.
E.3.1 Technical Design Aspects - To provide a comparative baseline from
which to judge the terminally compatible features, an M = 0.90, 200-passenger
cruise configured three-engine Advanced Technology Transport (ATT) was uti-
lized (4,5). A drawing of this configuration along with some pertinent char-
acteristics is presented in Figure 24 . It should be noted that this configu-
ration employed supercritical aerodynamics, advanced engines and acoustic
treatment, composite materials, active controls, and advanced subsystems.
32

An example concept of the four-engine TAC-CTOL aircraft configuration is
shown in Figure 25. In addition to the advanced technologies notes for the
baseline ATT airplane and the advanced avionics systems discussed previously,
the noteworthy features are:
E.3.1.1 Basic Wing Geometry Changes to Provide Aerodynamic Improvements-
To provide a landing approach speed of 120 knots, which allows higher runway
acceptance rates than those associated with the 1355-knot speed generally
associated with cruise configured aircraft and to improve take-off and climb-
out flight-path angles in order to reduce noise, an.aspect-ratio-9.0 wing
(compared to 7.6 for baseline ATT) with somewhat greater wing area (12%) than
the baseline ATT airplane (Fig. 24) was employed. Although not a prime design
consideration, the increased aspect ratio also increased the cruise L/D by
9%. This increased efficiency essentially paid for the increase in structural
weight of the wing resulting from the increased aspect ratio and wing area.
E.3.1.2 Tip Vortex Control - To provide potential solutions for both
take-off and landing, two vortex control methods were adopted. It should be
noted that vortex control methodology is in its infancy and that extensive
data as to the validity of these approaches is lacking.
For take-off, where low drag is desired, the outboard engines were
located as close to the wing tip as possible without incurring excessive
weight penalties dictated by flutter considerations. In the present instance,
the engines are located just outboard of the trailing-edge flap tip where the
highest vorticity discharge takes place. This is also the approximate span-
wise location of the rolled-up vortex core which forms downstream of the wing
trailing edge. The discharge of the engine mass flow provides two favorable
functions in that it pressurizes the vortex core and thereby diminishes the
33

troublesome tangential velocities (8) and provides a turbulent mechanism to
effect early vortex dissipation.
For landing, where low thrust and high drag levels are required for
steep decelerating descents to reduce noise, a retractable trailing-edge
device is employed to provide a turbulence mechanism for early vortex dissi-
pation. Some preliminary flight-test information on such a device will be
presented subsequently.
E.5.1.3 Drag Brakes - To provide steep descent capability to reduce
noise, additional drag, approximately equal to the low-speed drag level of
the. basic airplane in level flight, must be added to implement a 90 glide
slope with the engines at flight-idle. This drag is provided by several
sets of large drag brakes mounted on the rear of the fuselage. Careful
design of these devices will be required to insure that there are no adverse
buffet characteristics incurred from their use.
E.3.1 .4 Engines - Four advanced high bypass ratio engines (4.0) are
utilized which employ advanced combustor technology to minimize pollutants
and acoustic treatment (two rings and one splitter) to minimize noise while
maintaining acceptable levels of fuel consumption. As previously, the use of
steep descent operational procedures might eliminate the need for the more
complex acoustic treatment. An increase in vertical tail size was required
to maintain directional stability and control in the event of an outboard
engine failure.
E. 3.1.5 Powered Wheels and High-Speed Turnoff Gear - To provide a
means of ground locomotion without the main engines running, powered wheels
are utilized to effect pollutant reductions and reduce fuel consumption. This
hydraulically powered system is dependent on self-driven taxi/inflight
34

auxiliary power units. No special additions were required for high-speed
turnoff capability since the design studies indicated that the baseline gear
was sufficient to withstand the loads.
E.3.1.6 High-Capacity Brakes - The brake system was designed integrally
with the powered wheels and incorporates sufficient additional brake material
to achieve no degradation in life relative to the baseline ATT airplane. It
also incorporates an automatic system in order to achieve the desired decel-
erations without exceeding jerk levels in excess of passenger tolerance.
E.3.1.7 Self-Driven Taxi/Inflight Auxiliary Power Unit (APU) - Redun-
dant power requirements were met by using two auxiliary power units to supply
all anti-icing power, all on-the-ground power including powered wheels, and
the bulk of the inflight power. Electrical generators and hydraulic.pumps
on the two inboard engines supply additional channels of safety-of-flight
essential loads. The APU's have sea-level ratings of 1800 hp each determined
primarily by the anti-icing requirement. It should be noted that the APU's
were identified as relatively high-cost items because of maintenance
complexity.
E.3.1.8 RTOL Capability - To provide reduced take-off and landing
(RTOL) capability, a TAC-RTOL configuration was sized with wing area and
thrust-to-weight ratio increased by 6 and 15%, respectively, relative to the
TAC-CTOL airplane.
E.3.2 Cost and Benefit Analyses - Cost and benefit analyses considered
each of the terminal-area compatibility features separately and in combina-
tion. In the interest of brevity, only the combined effects are summarized
in this paper. Quantitative measurement indicators employed were Take-Off
Gross Weight (TOGW), Aircraft Acquisition Cost (AAC), Direct Operating Costs
35

(DOC), and Net Present Value (NPV). The TOGW's were determined from pre-
liminary design studies; the DOC's were calculated by use of the 1967 ATA
method adjusted to 1972 dollars; and the NPV's of each aircraft, over a
14-year period, were calculated assuming a constant 10% discount rate, depre-
ciation over an 8-year period, and a 7% investment tax credit allowance.
A summary of the cost benefits associated with attaining the desirable
terminal-area objectives listed previously are presented in Figure 26 rela-
tive to the ATT baseline (no advanced terminal-area features). For each of
the benefit indicators (DOC's and NPV's), two comparisons are presented. In
the Standard Delay Case (1967 ATA allowance), all aircraft were unrealisti-
cally assumed to be capable of accomplishing a 14-minute taxi cycle and a
6-minute airborne delay. In the Expected Delay Case, the TAC aircraft were
credited with being able to maintain these minimum delays whereas the ATT
baseline was expected to require a 36-minute airborne allowance since it did
not incorporate the required terminal-area features.
The TAC-CTOL and RTOL aircraft are shown to be 3% and 9% heavier and
their acquisition prices to be 10% and 15% higher, respectively, than the
ATT baseline. These characteristics are unaffected by the assumed delays.
For the standard delay, the TAC-CTOL and RTOL aircraft are shown to have 9%
and 13% higher DOC's and 21% and 30% lower NPV's than the ATT baseline. For
the Expected Delay Case, the TAC-CTOL and RTOL aircraft provide 6% and 3%
reductions in DOC's and 63% and 47% increases in NPV's, respectively. These
large variations in DOC and NPV values show the extreme sensitivity of Cost
Benefit to airborne delay time and indicate that profit or loss, or success
or failure, of the business venture will require that these delays be
minimized.
36

E.4 VORTEX-WAKE REDUCTION.- As noted previously, means for alleviating
or avoiding the vortex wake of aircraft will be necessary to permit closer
longitudinal spacing and thus increased runway acceptance rate. Past studies
have shown that the vortex persistence is of the order of 1-1/2 to 2 minutes
but that time can be quite dependent upon atmospheric conditions. Recent work
at Langley aimed at reducing the vortex hazard has shown some promise. Water
tunnel and other small-scale studies have shown the effectiveness of several
methods for attenuating the effects of the vortex. One such method involves
the attachment of a retractable spline to the wing tip (9). Flight data have
recently become available for this concept whereby flights were made with a
PA-28 trailing aircraft penetrating the wing-tip vortices of a C-54 generating
aircraft with (Fig. 27) and without tip splines attached to the C-54. Plotted
in Figure 28 as a function of distance is the rolling acceleration of the
trailingaircraft.
Flying in the wake of the clean C-54, the PA-28 is able to maintain con-
trol only to a point about 4 miles behind the C-54. At closer range, the
light aircraft is overturned by the tip vortices as the induced rolling moment
exceeds its control power and it is ultimately thrown from the vortex in an
unfamiliar and dangerous attitude. Such a maneuver could be catastropic if
it were close to the ground.
With the splines extended from the C-54 aircraft, however, the rolling
moments produced by the vortex are much reduced and the lighter PA-28 can
penetrate the larger airplane wake to as close as 1/4 mile. Although both
aircraft were flown at 100 kn in this case, analysis indicates that the PA-28
could fly with a margin of control at any distance even at 70 kn. The results
37

shown are preliminary and are intended to demonstrate the applicability of
the model scale experimental techniques.
Research investigations underway in small-scale facilities have shown
that with modifications to flap systems (to alter spanwise distribution of
airload on the wing) along with the addition of splines, greater reductions
in vortex strength than for splines alone can be achieved with little increase
in drag. Application of these techniques would indicate safe air separations
of 1 to 2 miles or less for an aircraft like a DC-9 following a 747. Research
is continuing on this problem at Langley and elsewhere and as new techniques
become practical the effect on capacity will be assessed.
F. CONCLUDING REMARKS
Problems currently existing in terminal-area operations of the civil air
transportation system can be expected to intensify in the future. New flight
procedures and advancements in avionics, airframe, and engine design to take
maximum advantage of MLS, RNAV, and advanced ATC equipment offer potential
solutions to these problems as well as economic advantages. To develop and
demonstrate these advantages is an urgent requirement for flight testing.
The NASA Terminal Configured Vehicle Program will contribute significantly
to this effort. The Boeing 737 Research Support Flight System provides a
unique research facility for flight research. Flight demonstration testing
to date indicates that the aircraft and its advanced avionic equipment are
validated in concept and suitable for initiation of the research effort. In
related programs, flight and ground testing has indicated that potential
solutions exist to the wake vortex hazard - a major restraining factor in
terminal-area operations. Studies indicate high payoff for specific airframe
38

configuration features for terminal-area effectiveness and experimental eval-
uation of some of these features appears to be desirable.
G. REFERENCES
G.1 "An Overview of the FAA Engineering.and Development Programs."Rept. No. FAA-EM-73-2, Department of Transportation, Federal AviationAdministration, Washington, D.C., March 1973.
G.2 G. A. Champagne, "Study of Unconventional Propulsion System Conceptsfor Use in a Long Range Transport." NASA CR-121242, August 1973.
G.3 M. A. Compagnon, "A Study of Engine Variable Geometry Systems foran Advanced High Subsonic Long Range Commercial Aircraft." NASACR-134495, October 1973.
G.4 "Advanced Subsonic Long-Haul Transport Terminal Area CompatibilityStudy." NASA CR-132367, February 1974.
G. 5 "Final Report - Study of the Application of Advanced Technologiesto Long-Range Transport Aircraft. Vol. I - Advanced Transport TechnologyFinal Results." NASA CR-112092, May 1972.
G.6 "Study of the Application of Advanced Technologies to Long-RangeTransport Aircraft. Vol. I - Analysis and Design." NASA CR-112088,1972.
G.7 "Study of the Application of Advanced Technologies to Long-RangeTransport Aircraft. Vol. I - Technology Applications." NASA CR-112090,May 1972.
G.8 W. H. Mason and J. R. Marchman III, "Farfield Structure of anAircraft Trailing Vortex, Including Effects of Mass Injection." NASACR-62078, April 1972.
G.9 J. C. Patterson, Jr., "Lift-Induced Wing-Tip Vortex Attenuation."AIAA Paper No. 73-38, Proceedings of the 12th Aerospace Sciences Meeting,Washington, D.C., January 30-February 1, 1972.
39
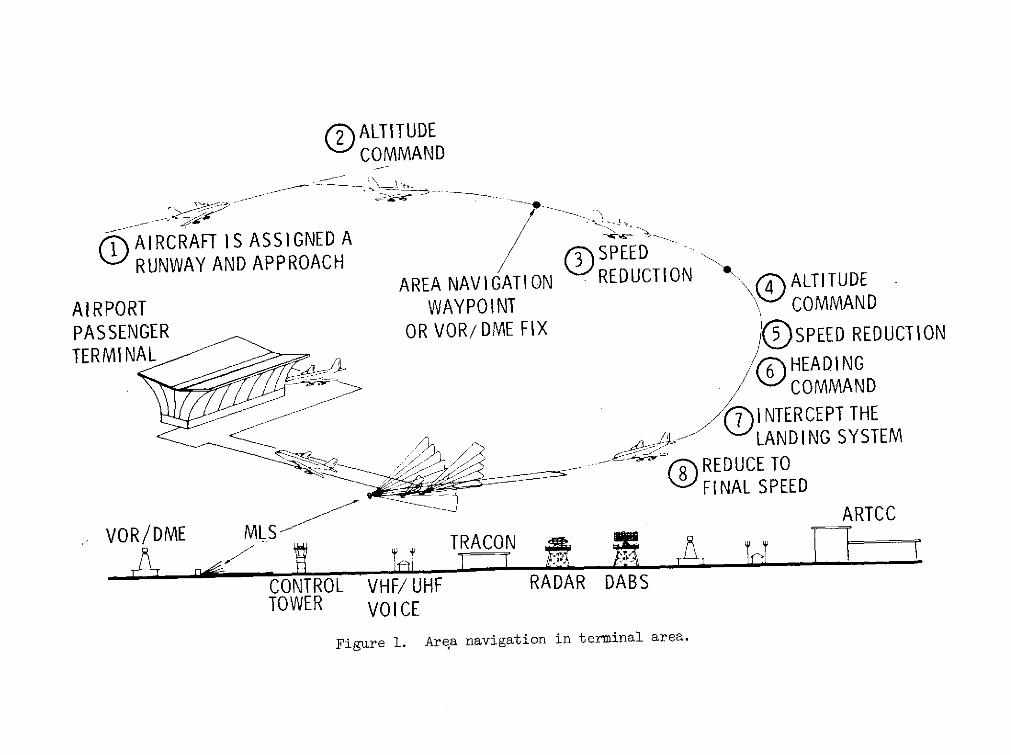
O ALTITUDECOMMAND
(1 AIRCRAFT IS ASSIGNED A
1 RUNWAY AND APPROACH SPEEDO
AREA NAVIGATION REDUCTION 4. ALTITUDE
AIRPORT WAYPOINT 0 COMMAND
PASSENGER OR VOR//DME FIX Q)SPEED REDUCTION
TERMINAL HEADINGCOMMAND
O INTERCEPT THELANDING SYSTEM
-28 REDUCE TOFINAL SPEED
VOR/DME MLS TRACON ARTCC
CONTROL VHF/UHF RADAR DABSTOWER VOICE
Figure 1. Area navigation in terminal area.

ELEVATION BEAM1o ABOVE THE HORIZONTO 200 (MAX.)
...... ..,._AZIM UTH":'ELEVATION +600 (MAX.
FLARE
AZIMUTH/DME
NOTE: SCANNING BEAMS IN AZIMUTH AND ELEVATION PERMIT THE DEFINITION OFPILOT-SELECTABLE 3-DIMENSIONAL APPROACH PATHS TO THE RUNWAY.
Figure 2. Microwave landing system.

FAR 36 NOISE LEVEL
FAR 36 -12 TO -18EPNdB NOISE LEVEL
100 - -6
NOISEFOOTPRINT
/ -4NOISE FOOTPRINT R
AREA RATIO, % 50 - / ROAROI,%AROI
-- 2
0 -5 -10 -15 -20NOISE LEVEL BELOW FAR 36; EPNdB
Figure 3. Engine noise reduction by acoustic treatment - high bypass-ratio engines.

TAC-A IRPLANEPERI PHERAL
6 TREATMENT
2 RINGS AND1 SPLITTER
5 TOTAL
. . --c. TAKE-OFF4- WITH CUT-BACK
90 EPNdBCONTOUR 3 1% - BLOCK FUEL = 45 GAL.AREA, 69000 GALIYR./AI RPLANEsq mi. @ 1000 n. mi. RANGE
2-
_ 301A
9030 --- APPROACH, I I I I
0 1 2 3 4BLOCK FUEL INCREASE, PERCENT
Figure 4. Energy implications of acoustic treatment and operational procedures.

Figure 5. RSFS first flight.

ELECTRON I CDISPLAYS INRESEARCHCONVERTERCOCKP IT CONTROL
ELECTRONIC INTERFACE NASA
DISPLAYS IN GUI DANCEAND RECORDERS 515COPILOT NAVIGATIO
LOW LIGHTLEVEL TV RSDATA ACQUI SITION
SYSTEMRESEARCH VIDEOCOCKPIT RECORDERSINTE R FACE_
FLI GHTSCONTROL
INERT I AL FLIGHTTEST COMPUTERSNAVIGATION ENGINEERSPALLET STATION
Figure 6. RSFS internal arrangements.

c
IF
ii
Fiue7 iwo AESeupet

DOTTED BLOCKS IDENTIFY SOLID BLOCKS IDENTIFYFULL AGCS IMPLEMENTATION TEST AGCS CONFIGURATION
-FLIGHT CRITICALCOMMAND AUGMENTATION
NAV GUIDANCE AGCS MODE AUTOLANDVOR CONTROL AND ' AND PARAMETER SYSTEM INTEGRITYDME DISPLAY UNIT SELECT PANEL ASSURANCEAIR DATA - ,
I SERVOSNON-FLIGHT NAVIGATION- FLIGHT CONTROL SERVOS --
CRITICAL GUIDANCE COMPUTERSOAR COMPUTER
NON-FLIGHT W FLIGHTCRITICAL -- LITTON C-4000 - GE ICP 723 CRITICAL
NAVI GATION ISENSORS,GUIDANCE RATE GYROS -
DISPLAY GENERATION -- - INSAUTO CRUISE AND IPRRIMARY DISPLAYSI i ILSAUTO THRUST AUTO AND ] AIR DATA
TI-;HRUST ANNUNC I.ATORS - RADIO ALTIMETER
SERVO CONTROL WHEEL FORCECOLUMN FORCE
Figure 8. Advanced guidance and control system configuration.

Figure 9. View of partially completed aft flight deck.

SENSOR SYSTEM STATUSFAILURE -AND CONTROLDECODER UNIT
COMPUTERJ PROGRAMMONITOR LOADER
CROSS CHANNELA CHANNEL INFORMATIONSENSOR INPUTS
COMPUTER ICP-723 PROGRAMA CHANNEL SERVO INTERFACE COMPUTER MEMORYCOMMAND OUTPUTS UNIT "A" UNIT "A" UNIT "A"
B CHANNELSENSOR INPUTS COMPUTER ICP-723 PROGRAM
B CHANNEL SERVO INTERFACE COMPUTER MEMORYCOMMAND OUTPUTS UNIT "B" / f UNIT "B" '- - UNIT "B"
C CHANNELSENSOR INPUTS - COMPUTER ICP-723 PROGRAM
C CHANNEL SERVO INTERFACE COMPUTER MEMORYCOMMAND OUTPUTS UNIT "C" INPUT/OUTPUT UNIT "C" UNIT "C"
DATA, FRAME SYNCH, TIMING ANDAND LOCK PROGRAM INFORMATION
Figure 10. Flight control computer organization.

REQUIREMENTSDEFINITION
CONCEPT EVALUATION
AIRBORNE NAVIGATION FLIGHT TESTSAND COMMUNICATIONS
S TAATM REAL-TIME SIMULATION DISPLAY
:111 1,
GROUND BASED NAVIGATION AIRCRAFT/AVIONICS/ENVIRONMENTAND GUIDANCE SIMULATION
Figure 11. Terminal area environment simulation.

80
SCHEDULEDARRIVAL RATE
60ACCEPTANCE
RATE, ATLANTA NORMAL 2 MILE SEPARATIONPER HOUR IFR RATE -
40
3 MILE SEPARATION
20
2 HOUR DATA, 70/30 ARRIVAL TO DEPARTURE MIX,20 AIRCRAFT TYPES
0 20 40 60 80 100 120SCHEDULED OPERATIONS, PER HOUR
Figure 12. Example of simulated runway acceptance rate data as affected by final approachseparation - Atlanta terminal, 1967 data.

Figure 13. Wallops Station airfield.

TERMINAL AREASIMULATION
F YWALLO P S-LANG LEY ~i TWO WAY DATA LIK
LANGLEY COMPUTATIONCENTER
DISPLAY GENERATION ..... TO NAFEC
FACILITY ATC INTERFACE
DATA LINK
GUIDANCE SIMULATION'-FACILITY (FPS-16 AND 'LASER TRACKERS) RESEARCH SUPPORT
FLIGHT SYSTEM
Figure 14. Wallops/Langley aircraft flight research facility.

3D/4D PRECISION,
MINIMUM SEQUENCED
DELAY OR HOLD COCKPIT DISPLAYS,: INTERFACES FOR ALL .
OPERATIONS IN WEATHEROPERATIONS INOPERATIONSMLS ENVIRONMENT
AUTOMATIC CONTROLSCLOSE IN CAPTURE
HIGHER ALTITUDE 40 ses --- STEEP, DECELERATINGAT FAR 36 2500 ft + 5 APPROACHES
... ti 1.5 mile
a 100 ft
/PROGRAMMED TURNOFF
Figure 15. Use of advanced systems and procedures to improve terminal area operation,
independent of weather.

S\ CURRENT CTOL7MJ --- / ,TEBdI-
/ //
I / LGA'i4;I EWR/ 1CURRENT ILS
/ / ' JFK
CRI7AY POTENTIAL MLS
Figure 16. New York terminal area flight .paths for one landing direction.

DISTANCE FROM B-737, Va = 125 knotsCENTERLINE, ft0 6 0 0
2000 = -3 Va = =-9
0 P 90 EPN dB
-2000- 90 EPN dB 90 EPN dBI I I I0 20 40 0 20 40 0 20 40
DISTANCE FROM RUNWAY THRESHOLD, 1000 ft
6 = 4006 = 300f 30 110-
1.2- FOOTPRINT FAR-36 NOISEREDUCTION
100 \.8
RELATIVE EPNdBFOOTPRINT
AREA, .490 EPN dB AIRF
AIRFRAME AIRFRAMEA IS ME NOISENOISE 80 NI80-
0 3 6 9 0 3 6 9Fiure 17. The effect of -lide-slo le on landinaroach noise.
Figure 17. The effect of glide-slope angle on landing approach noise.
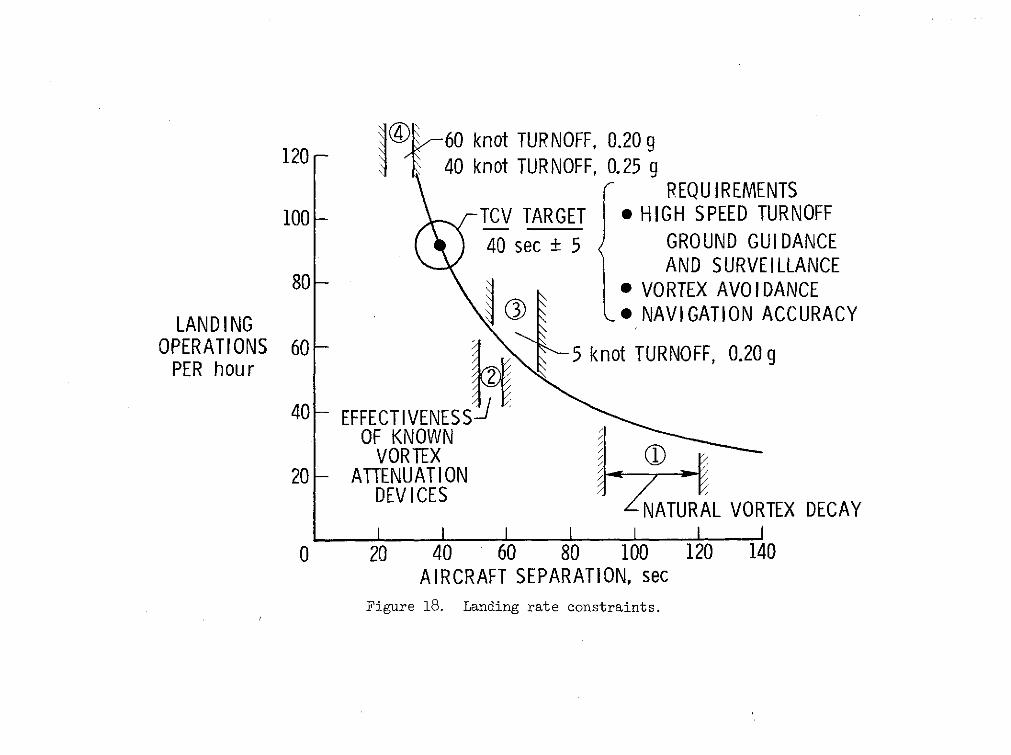
60 knot TURNOFF, 0.20 g120 40 knot TURNOFF, 0.25 g
REQUIREMENTS
100- TCV TARGET * HIGH SPEED TURNOFF
40 sec + 5 GROUND GUIDANCEAND SURVEILLANCE
80 0 VORTEX AVOIDANCE
LANDING * NAVIGATION ACCURACY
OPERATIONS 60 5 knot TURNOFF, 0.20 gPER hour
40- EFFECTIVENESS-OF KNOWN
VORTEX20 - ATTENUATION
DEVICES ATURAL VORTEX DECAY
0 20 40 60 80 100 120 140AIRCRAFT SEPARATION, sec
Figure 18. Landing rate constraints.

60 APPROACH, LONG TOUCHDOWN TO
2 m2 mi AVOID VORTICES, REDUCE NOISE ANDREDUCE FUEL CONSUMPTION
FLARE GUIDANCE
40 APPROACH
REDUCED FLAP FOR LOWER NOISE, HIGH SPEEDDECELERATING REDUCED FUEL CONSUMPTION DR I FTOFFITURNOFF
GUIDANCE
Figure 19. Conceptual high capacity runway procedures for noise abatement and vortex avoidance.

Figure 20. Comparison of electronic displays and visual approach information.

RATE COMMAND/ATITUDE HOLD TRACK ANGLE
COURSE , TRACK COURSE
Vc - TRACK
/ II
I
Figure 21. Control wheel steering modes.

Figure 22. Oculometer data showing pilot eye track on instrument panel.

FLI GHTS
* 40 FLIGHTS FOR 78 HOURS
* 30 AUTOMATIC 4D FLIGHTS OF 125 MILES, 35 MINS.;76 AUTOMATIC LANDINGS
* ENCOUNTERED 800 ft CEILINGS; 60 KN HEADWIND VARIATIONS:30 KN CROSSWINDS; ICING; TURBULENCE; WIND SHEARS
RESULTS
* DESIGNS SATISFACTORY FOR CONTINUING TEST PROGRAM; SOMEDEVELOPMENT PROBLEMS REMAIN
* FLIGHT RESULTS CONSISTENT WITH GROUND-BASED SIMULATIONS
* AUTOMATIC 4D TIME ERRORS AT TOUCHDOWN 5 TO 8 SECONDSFOR 125 NMI FLIGHTS
* LITTLE PERFORMANCE VARIATIONS BETWEEN 4 PROGRAM PILOTS
Figure 23. Summary of ADEDS/AGCS flight demonstration tests.

R = 3000 n. mi., 200 PASSENGER
MCR -------- 0.90CR
TOGW, Ib ------ 302 200OWE, Ib-- - - - - -159 200
WIS, Ib/ft 2 - - - - - - - 131T/W.- ------ - -0. 308T/Eng., Ib------31 100
S, ft2 --- 2300R - - - ------ -7. 6
APP, KTS
176' -5"-
Figure 24. Baseline advanced technology transport airplane.

HIGH SPEED TURNOFF GEARMCR --- 0.90TOGW, Ib ---- 311 100 ADVANCED COMBUSTORSOWE, lb------172 630W/S lb/ft2 -----121W/S b/ 2121 ENGINE POSITIONED FOR TIP VORTEX CONTROT/W -------- 0.299 TIP VORTEX CONTROLT/ENG, Ib-----23 200S, ft2 -------- 2 570 INCREASED WING AREAAR----------- 9.0 AND ASPECT RATIVAPP, KTS---- -- 120App ' ADVANCED DISPLAYS
S, "DRAG BRAKESINCREASED HIGH CAPACITY SELF-DRIVEN TAXI-ACCURACY BRAKES IN-FLIGHT APUAVIONICS
186ft-4in.
Figure 25. Terminal compatible airplane concept.

RTOL1.10- 1.09 DELAY, MIN.
ATA TAX I AIR 1.2STANDARD: ATT 14 6 AIC 1.15
TOGW TAC 14 6 PRICERATIO 1.05 CTOL EXPECTED: ATT 14 36 RATIO 1.1
1.03 1.11.03 TAC 14 6 1.1
1.0 I1.0 IATT-BASELINE = 302,200 # $15.48 M
DELAY DELAYSTANDARD EXPECTED STANDARD EXPECTED1.21.21.13 2 1.631.09 1.47
DOC j NPVRATIO 1.0 RATIO 1
.94 .97 .79 70i
1.20/ASM 1.4¢/ASM 0
ATT-BASELINE (AT 1000 n. mi.) $11.2 M $5.4 M
Figure 26. Summary of cost-benefit analysis of terminal compatible airplane.

Figure 27. C-54 with wing-tip spline for rortex dispersion.

4 A NO SPLINESO 72" SPLINESOE 90" SPLINES IN UNDISTURBED AIR WITH
MAX. AILERON DEFLECTION
3C-54
rad. /sec(PA-28) 2
1-
I I I I I I0 1 2 3 4 5 6
SEPARATION DISTANCE, n. mi.
Figure 28. Measured roll acceleration for PA-28 airplane in vortex wake of C-54with and without splines.