and in the matter statement of evidence of...
TRANSCRIPT

Dr John (Jack) McConchie 1
IN THE MATTER of the Resource Management Act
1991
AND
IN THE MATTER of Greater Wellington Regional
Council’s proposed Natural Resources Plan
STATEMENT OF EVIDENCE OF
JOHN (JACK) ALLEN McCONCHIE
ON BEHALF OF THE
NEW ZEALAND TRANSPORT AGENCY
1. EXECUTIVE SUMMARY
1.1 There is considerable emphasis within the Greater Wellington Regional Council’s
(Council’s) Proposed Natural Resources Plan (pNRP) on improving water quality. I
understand that this is supported by the New Zealand Transport Agency (Transport
Agency), and aligns with its own integrated catchment management approach of
improving stormwater quality over time.
1.2 To achieve the overall improvement objective, the pNRP proposes a quantum shift
towards regulating stormwater discharges based on the origin of the discharge, rather
than on an individual ‘effects based’ approach. In particular, the pNRP imposes stricter
controls on discharges from ‘large sites’; which include the State highway network.
1.3 The grouping of three very different land uses as ‘large sites’ ignores the actual
hydrological and other environmental processes operating. The State highway network
is distinctly different to the other two land uses within the ‘large site’ classification.
1.4 The change in focus represents a paradigm shift from the Regional Freshwater Plan for
the Wellington Region 1999 (Operative Plan), which focused on maintaining water
quality, and regulated stormwater discharges on a case by case basis, based on
compliance with specific measureable standards. The implication of this paradigm shift
is that water quality in the Wellington region has been compromised by past processes
and controls, and particularly, practices related to ‘large sites’.
1.5 An understanding of hydrological processes, and the issues and problems inherent in
water quality monitoring and measurement (discussed in greater detail in my evidence
to follow), highlight a number of potential issues with the pNRP, and its approach to the
management and regulation of stormwater discharges.
1.6 In particular, in my view, the shift towards regulation based on the origin of a discharge

Dr John (Jack) McConchie 2
(i.e. from a ‘large site’ as opposed to an ‘individual site’), is not appropriate from the
perspective of managing effects on water quality, because:
a) Rivers and streams have the ability to moderate and attenuate potential
contaminants, and their effect on the environment. This ability is, however, both
catchment and site specific.
b) There is no simple or unique causal relationship between an activity and its
effect. This is because the effect of an activity at a particular location is very site
specific, and reflects the interaction of the activity with both the environment and
any management practices which have been adopted.
c) The grouping of three, very different ‘large sites’ (airports, the State highway
network and Centreport) together ignores the actual hydrological and other
environmental processes operating, and the distinct differences between the
activities (in terms of spatial area and possible effects on individual catchments).
The State highway network is distinctly different to the other two land uses within
the ‘large site’ classification.
d) ‘Individual sites’ in my opinion actually have the potential to have greater effect
of specific catchments, as any development is likely to be focused and localized,
and actually represent a greater proportion of the actual catchment. Any
development is also unlikely to be guided by any ‘management plan’ or ‘industry
best practice’ guidelines.
e) The effects of any discharge on water quality, should be considered on a case-
by-case basis, and regulated according to the actual effects of the discharge, or
the ability of the activity or discharge to comply with specific measurable
standards.
1.7 The particular focus in the pNRP on improving the water quality of stormwater from the
State highway network by stricter regulation through the pNRP provisions, is also not
appropriate for the following reasons:
a) There is a common misconception that roads are a primary source of
contaminants and that targeting roads along with other high contaminate
generating activities, will address water quality issues. The reality is that roads
are only a minor to moderate contributor of contaminants.
b) There is no evidence for the contention that stormwater discharges from the
State highway network have compromised water quality in the Wellington
Region.
c) There is no evidence that large projects (including the State highway network)
have a disproportionate effect on water quality, or that the management of the
Dr John (Jack) McConchie 3
effects of these projects could be improved. There is also no evidence that the
water quality of stormwater discharges from these sources is at a level that
requires the number of new specific Objectives and Policies which have been
proposed in the pNRP.
d) The concentration of potential contaminants from the State highway network is
not simple, and the potential effect of any contaminant on the environment will
differ both spatially and temporally. Therefore, in my opinion, any effects are
best addressed through, and managed in accordance with, industry derived Best
Management Practices and/or site specific Stormwater Management Plans.
e) Any adverse effects arising from stormwater discharges from the State
highway network can be managed adequately through permitted activity
conditions in the pNRP (as proposed by Mr Hywel Edwards), and through
the Transport Agency’s existing approach to stormwater management,
which focuses on improving water quality over time through ‘best practice’
and ‘optimising’ the design of stormwater devices to meet specific
environmental outcomes.1
1.8 For reasons which will be expanded upon in my evidence to follow, in my view, the
pNRP should:
a) Provide a clear cascading policy framework which conforms to the Resource
Management Act 1991 (RMA) hierarchy in respect of avoiding, remedying and
mitigating effects; while also recognizing that ‘off-setting’ can be appropriate in
some circumstances. Requiring no net loss, and improved water quality are not
required by the RMA. In the context of linear infrastructure, such a ‘zero bottom
line’ could unduly constrain investment;
b) Provide policy direction on the use of the ‘Best Practicable Option’. For large
infrastructure projects such an approach is critical in considering the benefits,
adverse effects, and financial costs of regionally significant infrastructure;
c) Regulate all stormwater discharges to water, or to land in circumstances where it
may enter water, as a permitted activity, subject to controls in the form of
permitted activity standards. Where the permitted activity standards cannot be
met, then a restricted discretionary activity status should apply. In my opinion, this
should apply in relation to all discharges, including discharges from the State
highway network (including existing, redevelopment of or completely new State
highways); and
1 Through its commitment to managing the environmental effects of its activities under its
Environmental Plan and Stormwater Management Strategy, as mandated under the Land Transport Management Act.
Dr John (Jack) McConchie 4
d) Provide clear, specific and measurable water quality standards for stormwater
discharges, and regulate discharges based on compliance with those standards.
1.9 Consequently, I support the evidence provided by Mr Hywel Edwards, on behalf of the
Transport Agency, with regard to the wording of the policies, objectives and rules in the
pNRP relating to the management of the water quality of stormwater from the State
highway network.
2. INTRODUCTION
Qualifications
2.1 My full name is John (Jack) Allen McConchie. I hold a Bachelor of Science degree with
First Class Honours, and a PhD. I am a member of a number of professional and
relevant associations including the:
a) New Zealand Hydrological Society;
b) American Geophysical Union;
c) New Zealand Geographical Society;
d) Australia-New Zealand Geomorphology Group; and
e) Environment Institute of Australia and New Zealand.
I am a certified Commissioner (2011-present) and an Independent Professional Adviser
to the New Zealand Transport Agency (2011-2018).
Experience
2.2 I am employed by Opus International Consultants Ltd as the Technical Principal
(Hydrology & Geomorphology).
2.3 Prior to the start of 2008, I was an Associate Professor with the School of Earth
Sciences at Victoria University of Wellington. I taught undergraduate courses in
hydrology and geomorphology, and postgraduate courses in hydrology and water
resources.
2.4 For more than 40 years my research and professional experience has focused on
various aspects of hydrology and geomorphology, including; slope and surface water
hydrology (including water quality), groundwater dynamics, landscape evolution, and
natural hazards. Within these fields I have edited one book. I have written, or co-
authored, 10 book chapters and over 40 internationally-refereed scientific publications
including a number of papers focused specifically on water quality, sources of
contaminants, and the natural attenuation of hydrocarbons.
2.5 I have been involved in numerous research projects focusing on erosion and sediment
transport, water quality monitoring, and surface water-groundwater interactions since

Dr John (Jack) McConchie 5
completing my PhD on mass movement erosion in the Wairarapa (1986).
2.6 Specific to this evidence, I have investigated leachate quantity and quality (particularly
heavy metals) from the Silverstream and Happy Valley landfills, various sources of
contaminants resulting from land use and other activities in the Kaiwharawhara
catchment, and the natural variability of suspended sediment concentration in the four
major rivers intersected by the Peka Peka to Otaki Expressway. I have also
investigated the use of natural attenuation to remediate BTEX contamination in
unconfined aquifers.
2.7 I have considerable experience working throughout Wairarapa, the Hutt basin,
Wellington City, and on the Kapiti Coast. I worked on the Climate Change Impacts for
Flood Hazard in the Wellington region, the Hutt and Waikanae Rivers Sediment
Transport Studies, the Western Link Road, the Waikanae River Crossing, Transmission
Gully, the Peka Peka to Otaki Expressway, and the Basin Bridge project. As a result of
this experience, I have an in-depth understanding of climate, hydrology, flooding,
sediment transport processes, and water quality issues across the Wellington Region.
3. CODE OF CONDUCT
3.1 Although not necessary in respect of council hearings, I can confirm I have read the
Expert Witness Code of Conduct set out in the Environment Court's Practice Note
2014. I have complied with the Code of Conduct in preparing this evidence, and I
agree to comply with it while giving oral evidence before the hearing committee.
Except where I state that I am relying on the evidence of another person, this written
evidence is within my area of expertise. I have not omitted to consider material facts
known to me that might alter or detract from the opinions expressed in this evidence.
4. SCOPE AND STRUCTURE OF EVIDENCE
4.1 Within the brief of evidence, I have attempted to:
a) Review the documented effects of the State highway network on stormwater
quality;
b) Provide a discussion of the natural variability of one potential contaminant,
suspended sediment, to illustrate the difficulty of measuring and monitoring water
quality;
c) Place the proposed Objectives, Policies and Rules relating to erosion and
sediment control, and stormwater management, in the context of natural
environmental processes, including the inherent spatial and temporal variability;
and
d) Suggest changes to the proposed Rules which will, in my view, improve their
Dr John (Jack) McConchie 6
appropriateness, and the guidance they provide to potential land users.
5. CONTAMINANTS IN ROAD RUNOFF
5.1 Studies in New Zealand and overseas have identified urban runoff as a major
contributor to the declining quality of aquatic environments. It is estimated that upwards
of 40% of the contaminant content of this runoff can be attributed to runoff from roads.
Since the 1980's, numerous studies conducted overseas, and in New Zealand, have
tried to characterise the pollutants contained in roadway runoff. The roadways
considered in these studies include rural and urban highways as well as city/town
streets and thoroughfares. The variety of contaminants found in road runoff is
dependent on the type, condition and the purpose of vehicles using the roads, the
roadway materials and condition of the roadway, and the surrounding land use
(Annexure 1).
5.2 The sources of contaminants from roads fall into six main groups: vehicle exhaust
emissions; tyre wear; brake lining wear; transport fuels; lubricant losses; and road
surface wear.
Vehicle exhaust emissions contain a wide range of metals and organic
compounds. It is generally the particulate component of the emissions that is
most important. The particulates from diesel-fueled vehicles are important
contributors of PAHs;
Tyres are an important source of zinc, they also contain a range of organic
compounds;
Brake pads are an important source of copper, lead, and antimony. They also
contain a number of organic compounds;
Vehicle fuels contain a wide range of volatile organic compounds (VOCs), semi-
VOCs and metals. However, fuel losses are probably not a significant contributor
to contamination;
Vehicle lubricants, greases and coolants contain a range of metals, in particular
zinc, and a range of organic compounds. Again, these sources are not likely to be
a significant contributor to contamination; and
Road surface wear is a source of particulate matter and some organic
compounds. Bitumen surfaces contain PAHs in low concentrations.
5.3 In addition to the routine contaminants found in road runoff, there is potential for the
stormwater quality to be impacted by accidental spills or discharges of contaminants.
For example, the accidental release of fuel to the road from a ruptured fuel tank after a
vehicle collision.

Dr John (Jack) McConchie 7
5.4 It is primarily the suspended solids that absorb and transport many of the contaminants
present in stormwater. Consequently, removing the suspended solids achieves a
significant reduction in the potential contaminant load of road runoff. Stormwater
treatment methods generally remove more than 75% of the suspended solids from new
impervious areas. Since the metal ions are bound to the suspended sediment,
treatment also removes that major component of these from affecting the environment
and downstream receiving waters.
5.5 The concentrations of contaminants contained in the road runoff can be affected by
variables of the storm, such as duration, volume and intensity of the storm; as well as
the antecedent dry periods. In addition, the volume of traffic during the antecedent dry
period as well as traffic during the storm can also affect the contaminant loading in the
stormwater generated from the roadways. The concentration of potential contaminants
in stormwater runoff from the State highway network are therefore spatially and
temporally variable.
5.6 Despite the above, there is to the best of my knowledge, no evidence for the contention
that stormwater discharges from the State highway network have compromised water
quality in the Wellington Region, or that water quality from stormwater discharged from
these sources is at a level that requires the number of new specific Objectives and
Policies which have been proposed through the pNRP provisions.
5.7 It is a common misconception that roads are a primary source of contaminants, and that
targeting roads (along with other high contaminate generating activities), will address
water quality issues. The reality is that roads are only a minor to moderate contributor of
contaminants. I discuss the reasons for this in greater detail below.
6. CONCEPTUAL FRAMEWORK
6.1 Any discussion of the status and management of water quality is problematic because of
the high level of inherent natural variability (caused by changes in the source, transport
and deposition of contaminants), which is compounded by issues relating to sampling,
measurement and monitoring.
6.2 The popular perception of water in its natural state in rivers, lakes and groundwater is
that it is ‘pure’. However, in the scientific sense this is not the case. One of the reasons
water is so important to the environment, and to living things, is that it is an excellent
solvent. As such water almost always contains dissolved impurities. These impurities
i.e. potential ‘contaminants’, provide nutrients to plants, and supply some vital trace
elements to animals and people.
6.3 Quality is a very difficult concept to define, even though most people have some idea of
what it means. Water quality usually comes to our attention when the level of impurities
becomes too high to use the water for a particular purpose i.e. a restriction on

Dr John (Jack) McConchie 8
recreational contact or prohibition on water use for potable purposes.
6.4 The ionic concentrations of stream water under baseflow conditions have a wide range;
with high values at least 10 times, and sometimes 50 times, greater than low values.
The upper and lower quartiles usually differ by a factor of about three. The
concentrations are approximately log-normally distributed i.e. there are a number of
extremely high or low values which lie well outside of the ‘average’. This needs to be
recognised and taken into account when sampling, and using statistical tests to
compare the concentrations of samples at different sites. This is particularly problematic
when setting ‘background levels’ as required under the pNRP.
6.5 The above relate to baseflow samples i.e. those not affected by direct rainfall runoff.
The total variability of ‘contaminants’ within any river is actually several orders of
magnitude greater than indicated above when the effects of flood events are
considered.
6.6 There are a wide range of potential contaminants which can affect water quality. This
evidence, however, will focus on suspended solids, and their effect on turbidity, which is
generally considered one of the easier parameters to measure. Other water quality
determinants are even more problematic with respect to sampling, measurement and
monitoring.
HYDROLOGICAL PROCESSES
6.7 Many of the potential environmental effects of any State highway network project on
water quality relate to its interaction with the rainfall-runoff relationships which exist
within the project area. It is the hydrological processes which occur between
precipitation within the catchment, and runoff into the respective harbours, which affect
the water quality of any stormwater.
6.8 The paths taken by water as it moves through a catchment are important because they
determine many of the characteristics of a landscape, the nature and generation of
storm runoff, the magnitude of any erosion and sediment transport processes, the
potential to mobilise or trap any contaminants, and the strategies required to mitigate
any potential adverse environmental effects (Figure 1).
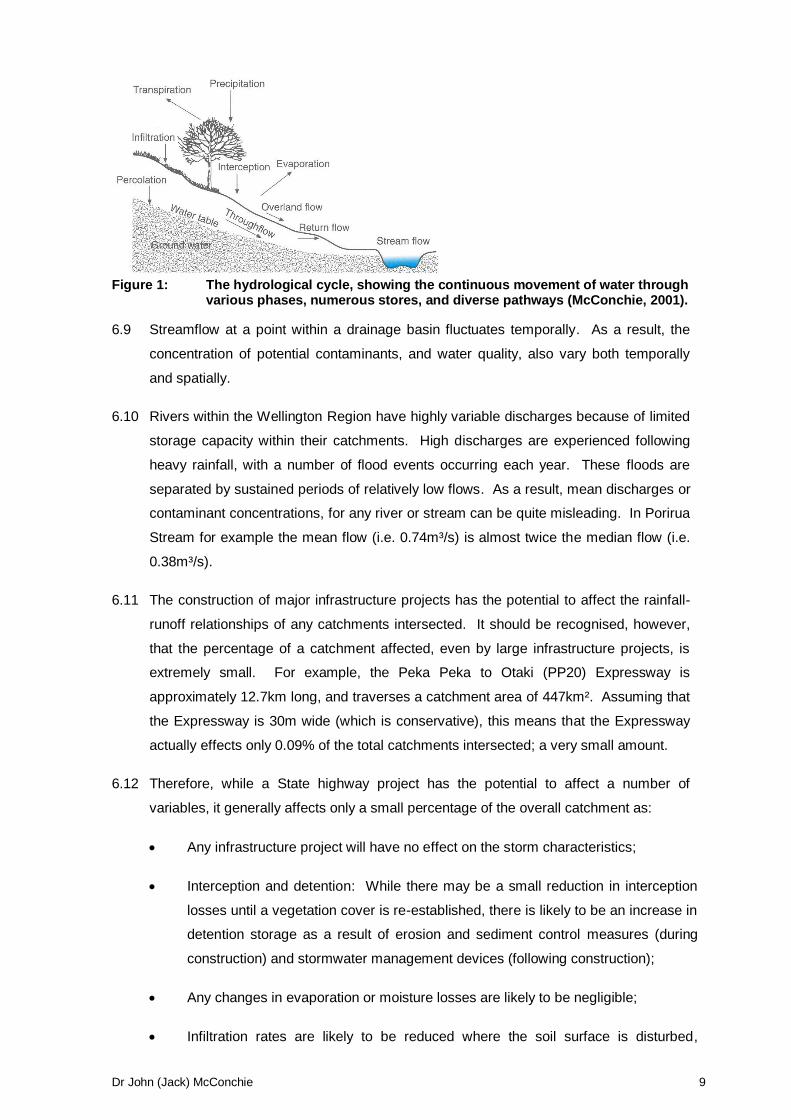
Dr John (Jack) McConchie 9
Figure 1: The hydrological cycle, showing the continuous movement of water through
various phases, numerous stores, and diverse pathways (McConchie, 2001).
6.9 Streamflow at a point within a drainage basin fluctuates temporally. As a result, the
concentration of potential contaminants, and water quality, also vary both temporally
and spatially.
6.10 Rivers within the Wellington Region have highly variable discharges because of limited
storage capacity within their catchments. High discharges are experienced following
heavy rainfall, with a number of flood events occurring each year. These floods are
separated by sustained periods of relatively low flows. As a result, mean discharges or
contaminant concentrations, for any river or stream can be quite misleading. In Porirua
Stream for example the mean flow (i.e. 0.74m³/s) is almost twice the median flow (i.e.
0.38m³/s).
6.11 The construction of major infrastructure projects has the potential to affect the rainfall-
runoff relationships of any catchments intersected. It should be recognised, however,
that the percentage of a catchment affected, even by large infrastructure projects, is
extremely small. For example, the Peka Peka to Otaki (PP20) Expressway is
approximately 12.7km long, and traverses a catchment area of 447km². Assuming that
the Expressway is 30m wide (which is conservative), this means that the Expressway
actually effects only 0.09% of the total catchments intersected; a very small amount.
6.12 Therefore, while a State highway project has the potential to affect a number of
variables, it generally affects only a small percentage of the overall catchment as:
Any infrastructure project will have no effect on the storm characteristics;
Interception and detention: While there may be a small reduction in interception
losses until a vegetation cover is re-established, there is likely to be an increase in
detention storage as a result of erosion and sediment control measures (during
construction) and stormwater management devices (following construction);
Any changes in evaporation or moisture losses are likely to be negligible;
Infiltration rates are likely to be reduced where the soil surface is disturbed,
Dr John (Jack) McConchie 10
compacted, and sealed. Again, while the area affected in this manner may be
greater during construction, it will still affect only a small percentage of any
catchment;
Any effects on the subsurface moisture storage capacity are likely to be small
because of the generally thin (i.e. <1m) soils and regolith and steep slopes; and
While there may be a significant change in land use on the road alignment, the
land use is likely to have already undergone significant changes in the past. For
example, the removal of a forest cover, and its replacement with pasture, would
have generally resulted in a significantly greater degree of change than the
formation of any subsequent infrastructure project.
6.13 Overall therefore, any changes to the catchment runoff parameters are likely to be small,
and their effects extremely localised. Any effects will be moderated and attenuated
rapidly either downslope or downstream as the upstream catchment becomes larger.
The inclusion of appropriate erosion and sediment control (during construction) and
stormwater management devices (following construction) mitigates any effects even
further.
6.14 Larger rivers and streams, those most likely to be impacted by the State highway
network, because of their larger catchment areas and greater flows, have a greater
capacity to attenuate and moderate the discharge of any potential contaminants. This
can be illustrated with respect to both the Ruamahanga and Hutt Rivers were flow is
monitored at various locations down the catchment (Table 1).
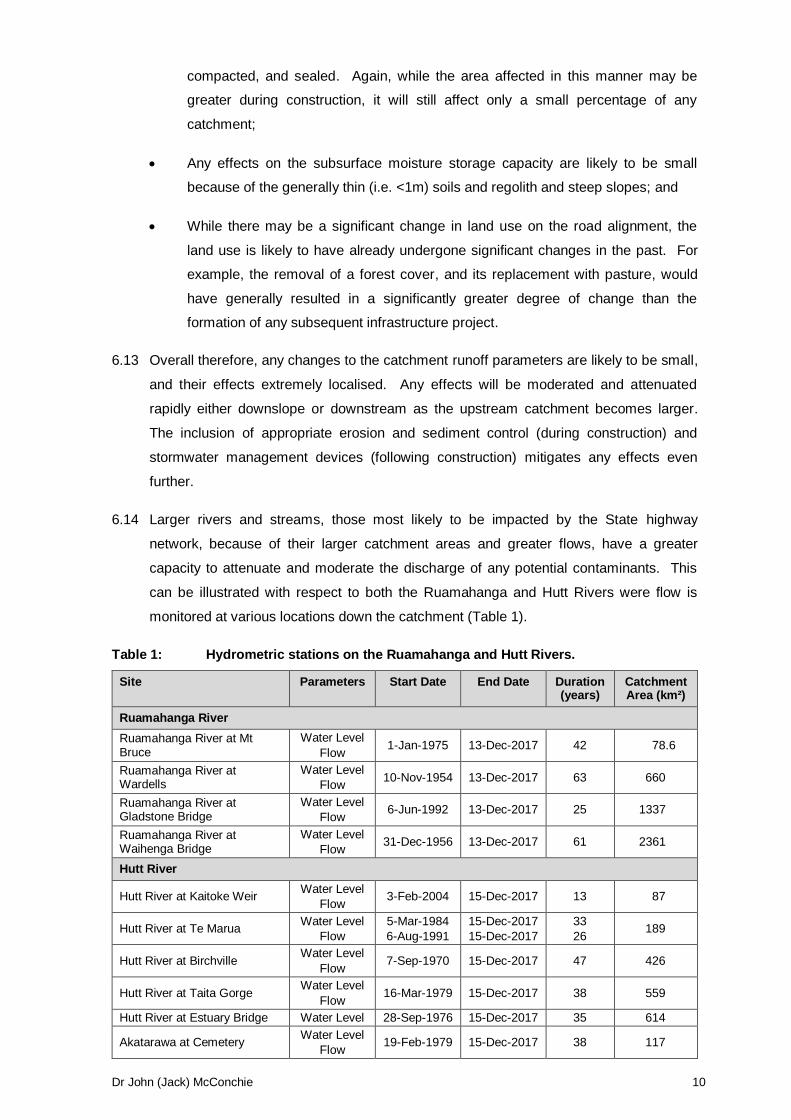
Table 1: Hydrometric stations on the Ruamahanga and Hutt Rivers.
Site Parameters Start Date End Date Duration (years)
Catchment Area (km²)
Ruamahanga River
Ruamahanga River at Mt Bruce
Water Level
Flow 1-Jan-1975 13-Dec-2017 42 78.6
Ruamahanga River at Wardells
Water Level
Flow 10-Nov-1954 13-Dec-2017 63 660
Ruamahanga River at Gladstone Bridge
Water Level
Flow 6-Jun-1992 13-Dec-2017 25 1337
Ruamahanga River at Waihenga Bridge
Water Level
Flow 31-Dec-1956 13-Dec-2017 61 2361
Hutt River
Hutt River at Kaitoke Weir Water Level
Flow 3-Feb-2004 15-Dec-2017 13 87
Hutt River at Te Marua Water Level
Flow
5-Mar-1984
6-Aug-1991
15-Dec-2017
15-Dec-2017
33
26 189
Hutt River at Birchville Water Level
Flow 7-Sep-1970 15-Dec-2017 47 426
Hutt River at Taita Gorge Water Level
Flow 16-Mar-1979 15-Dec-2017 38 559
Hutt River at Estuary Bridge Water Level 28-Sep-1976 15-Dec-2017 35 614
Akatarawa at Cemetery Water Level
Flow 19-Feb-1979 15-Dec-2017 38 117

Dr John (Jack) McConchie 11
Mangaroa at Te Marua Water Level
Flow 20-May-1977 15-Dec-2017 34 103
6.15 For the period of concurrent record, it is apparent that while the discharge increases,
largely as a function of the increasing catchment area, the coefficient of variation actually
decreases (Table 2). The coefficient of variation is a measure of the relative flow
variability and is the ratio of the standard deviation to the mean. The higher the
coefficient of variation, the higher the variability, or ‘volatility’, of river.
Table 2: Summary statistics for flows recorded at various locations along the Ruamahanga River.
Site Max Mean Median U.Q. L.Q. Quartile Range
Std. dev.
C.O.V
Ruamahanga River at Mt Bruce 446 9.9 4.5 9.04 2.6 6.44 18.5 1.874
Ruamahanga River at Wardells 844 23.9 12.5 25.5 6.6 18.9 37.6 1.571
Ruamahanga River at Gladstone Bridge
1255 40.0 19.1 41.1 9.3 31.8 69.9 1.747
Ruamahanga River at Waihenga Bridge
1165 80.9 47.9 91.9 25.2 66.7 107.2 1.325
6.16 The effect of increasing catchment size on flow attenuation and moderation is illustrated
with respect to a major flood event passing down the Ruamahanga catchment (Figure
2).
Figure 2: Flood hydrographs at various locations in the Ruamahanga catchment as a
large event passes downstream.
6.17 The same patterns of response as catchment size increases are also apparent within the
Hutt River. As the flood passes down a catchment, the peak discharge is prolonged,
attenuated, and moderated.
6.18 Consequently, it is not appropriate to treat all rivers and streams in the same
manner. While the pNRP proposes to classify ‘Surface water bodies’ into two
classes, these classes appear to take no account of the hydrology and hydrological
dynamics of the actual water bodies. The water bodies are classified largely in
terms of what the water is used for, rather than the physical processes and
dynamics of the hydrological system. It is these physical processes which are
Dr John (Jack) McConchie 12
critical when assessing the potential for changes to the contaminant concentrations
and their effect on the environment.
6.19 The management of rivers and streams would be better served by also recognising
the scale of the river, the potential for it to be affected by anthropogenic activities,
and its ability to assimilate, moderate and attenuate any effects of changes to the
hydrological processes operating within the catchment. In the Wellington Region, it
might be appropriate to classify stream, and part of streams, in terms of their ‘stream
order’. For example, ‘zero order catchments’, and then orders 1-2, 3-4, 5-7.
VARIABILITY OF ‘CONTAMINANTS’
6.20 Issues associated with the monitoring and measurement of potential ‘contaminants’ in a
river can be illustrated with reference to a detailed study of turbidity undertaken as part
of the ‘pre-conditions’ for the Peka Peka to Otaki Expressway (PP2O) i.e. conditions in
an effectively ‘natural’ catchment, and not one in which construction activities are being
undertaken.
6.21 One of the outcomes of the Board of Inquiry decision on the PP2O Expressway was a
requirement to conduct environmental baseline monitoring of turbidity in four rivers and
streams which may be affected by construction activities.
6.22 Despite being ‘industry standard’ turbidity sensors, the resulting data are still prone to
interference from debris, biofouling, and drift over time.
6.23 As expected, data collected in each of the four rivers demonstrate a general relationship
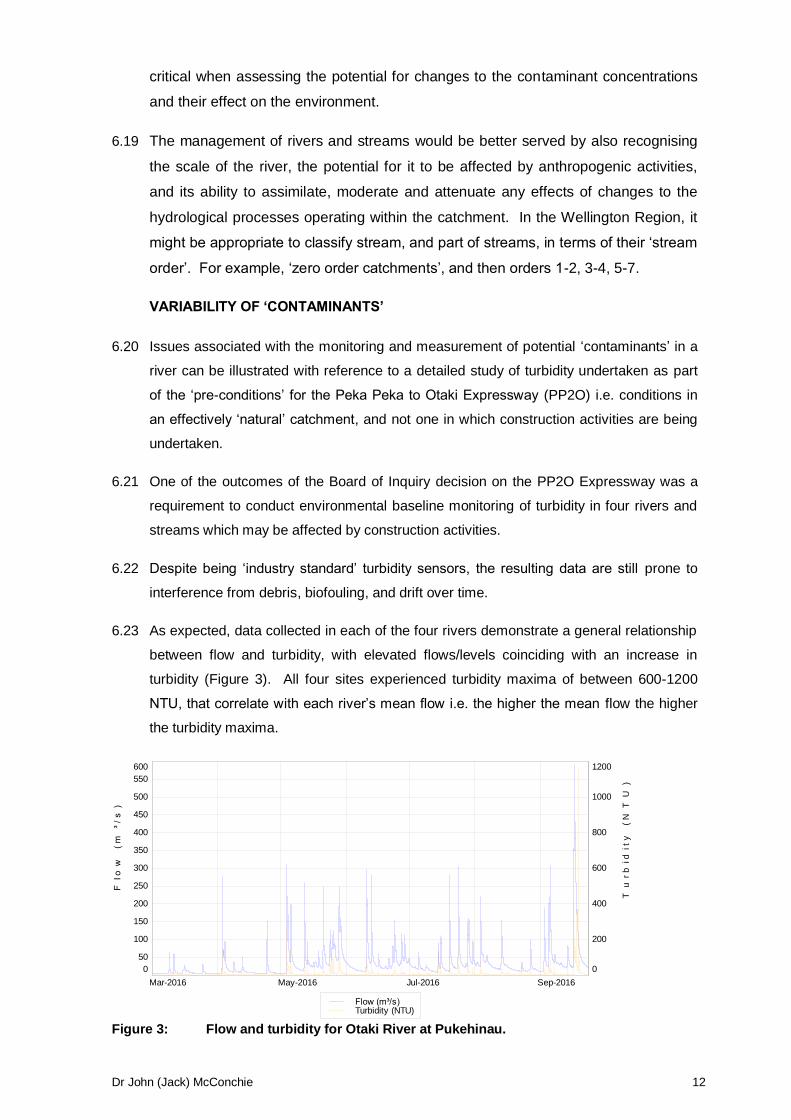
between flow and turbidity, with elevated flows/levels coinciding with an increase in
turbidity (Figure 3). All four sites experienced turbidity maxima of between 600-1200
NTU, that correlate with each river’s mean flow i.e. the higher the mean flow the higher
the turbidity maxima.
Figure 3: Flow and turbidity for Otaki River at Pukehinau.
Mar-2016 May-2016 Jul-2016 Sep-2016
0
50
100
150
200
250
300
350
400
450
500
550
600
0
200
400
600
800
1000
1200
Flo
w
(m
³/
s)
Tu
rb
idit
y
(N
TU
)
Flow (m³/s)Turbidity (NTU)
Dr John (Jack) McConchie 13
6.24 The turbidity and flow data presented in Figure 3 reflect the actual variability of flow and
turbidity measured in the Otaki River over only an 8-month period. It should therefore be
recognised that the sensors were in a major ‘natural’ water course, and installed
immediately downstream of the Tararua Forest Park. The data therefore reflect natural
variability only, and variability over a relatively short time period.
6.25 While any obviously anomalous data were removed, the remaining data are those
actually measured using ‘best practice’ and ‘industry standard’ sensors. Consequently,
these data are likely to reflect ‘natural’ conditions upstream of the construction of the
PP2O Expressway.
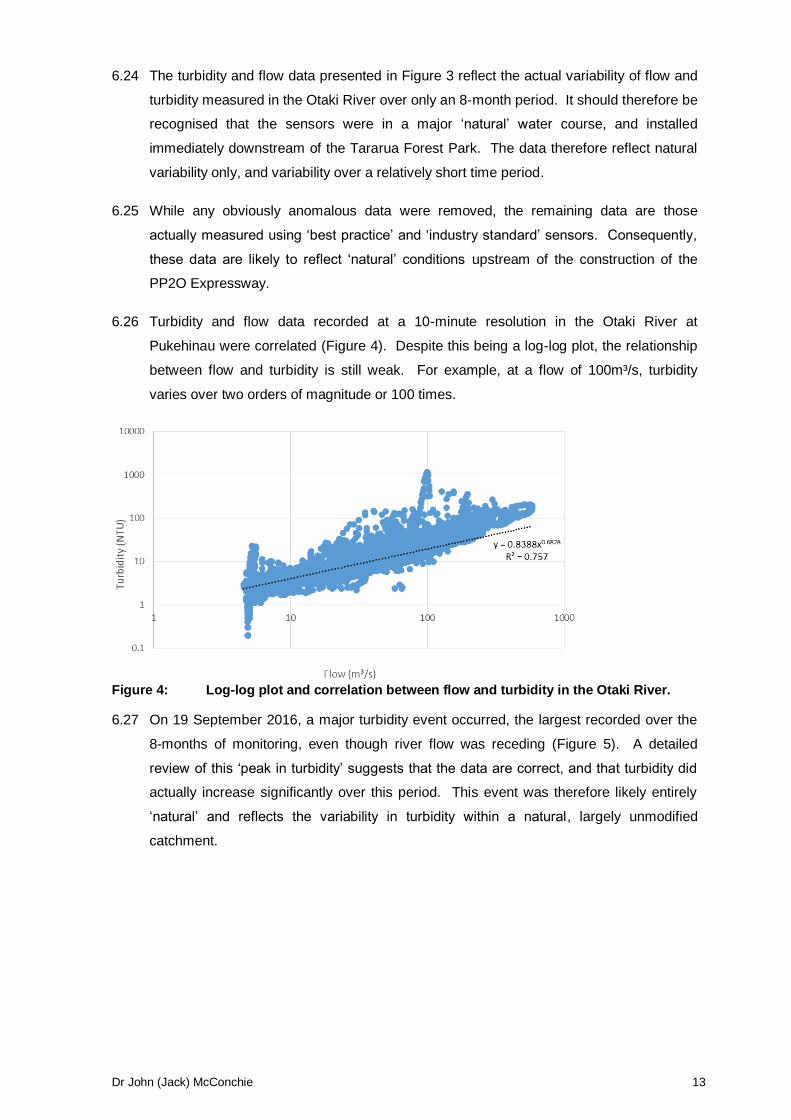
6.26 Turbidity and flow data recorded at a 10-minute resolution in the Otaki River at
Pukehinau were correlated (Figure 4). Despite this being a log-log plot, the relationship
between flow and turbidity is still weak. For example, at a flow of 100m³/s, turbidity
varies over two orders of magnitude or 100 times.
Figure 4: Log-log plot and correlation between flow and turbidity in the Otaki River.
6.27 On 19 September 2016, a major turbidity event occurred, the largest recorded over the
8-months of monitoring, even though river flow was receding (Figure 5). A detailed
review of this ‘peak in turbidity’ suggests that the data are correct, and that turbidity did
actually increase significantly over this period. This event was therefore likely entirely
‘natural’ and reflects the variability in turbidity within a natural, largely unmodified
catchment.
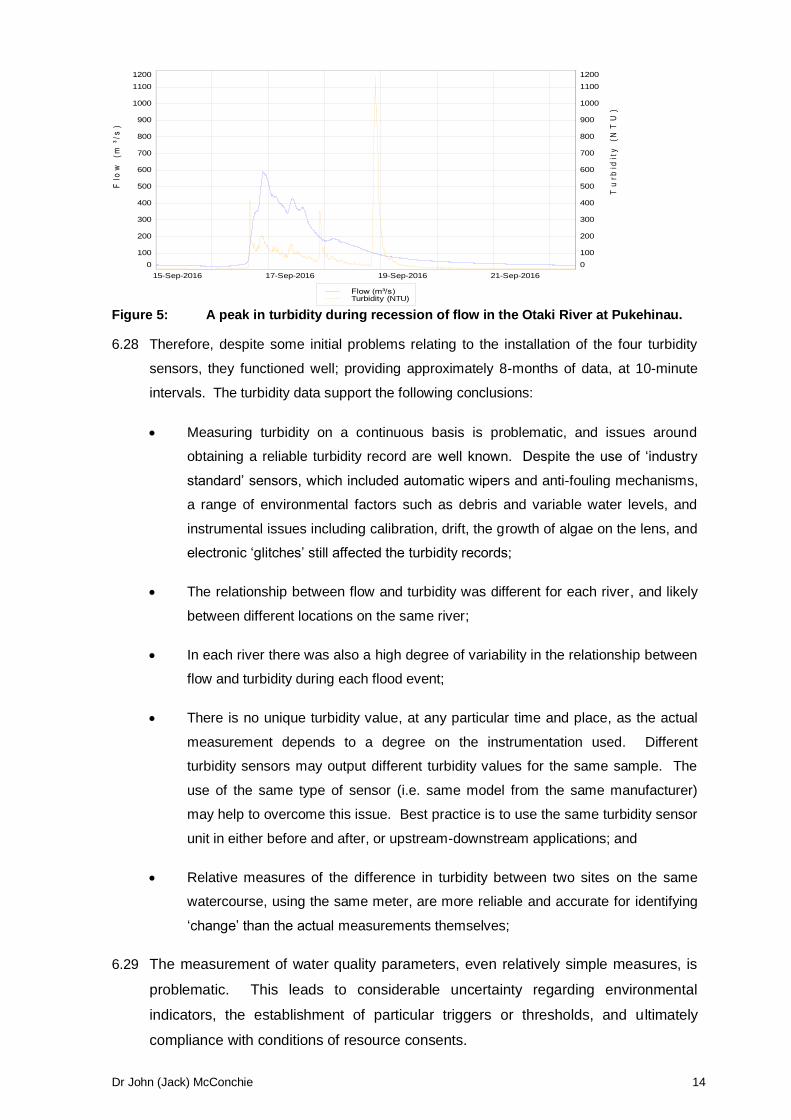
Dr John (Jack) McConchie 14
Figure 5: A peak in turbidity during recession of flow in the Otaki River at Pukehinau.
6.28 Therefore, despite some initial problems relating to the installation of the four turbidity
sensors, they functioned well; providing approximately 8-months of data, at 10-minute
intervals. The turbidity data support the following conclusions:
Measuring turbidity on a continuous basis is problematic, and issues around
obtaining a reliable turbidity record are well known. Despite the use of ‘industry
standard’ sensors, which included automatic wipers and anti-fouling mechanisms,
a range of environmental factors such as debris and variable water levels, and
instrumental issues including calibration, drift, the growth of algae on the lens, and
electronic ‘glitches’ still affected the turbidity records;
The relationship between flow and turbidity was different for each river, and likely
between different locations on the same river;
In each river there was also a high degree of variability in the relationship between
flow and turbidity during each flood event;
There is no unique turbidity value, at any particular time and place, as the actual
measurement depends to a degree on the instrumentation used. Different
turbidity sensors may output different turbidity values for the same sample. The
use of the same type of sensor (i.e. same model from the same manufacturer)
may help to overcome this issue. Best practice is to use the same turbidity sensor
unit in either before and after, or upstream-downstream applications; and
Relative measures of the difference in turbidity between two sites on the same
watercourse, using the same meter, are more reliable and accurate for identifying
‘change’ than the actual measurements themselves;
6.29 The measurement of water quality parameters, even relatively simple measures, is
problematic. This leads to considerable uncertainty regarding environmental
indicators, the establishment of particular triggers or thresholds, and ultimately
compliance with conditions of resource consents.
15-Sep-2016 17-Sep-2016 19-Sep-2016 21-Sep-2016
0
100
200
300
400
500
600
700
800
900
1000
1100
1200
0
100
200
300
400
500
600
700
800
900
1000
1100
1200
Flo
w (
m³/
s)
Tu
rbid
ity
(N
TU
)
Flow (m³/s)Turbidity (NTU)
Dr John (Jack) McConchie 15
7. BASIS FOR CHANGES TO THE WATER QUALITY MANAGEMENT APPROACH
7.1 The focus of the pNRP has shifted from ‘maintaining water quality’ to ‘improving water
quality’, and regulating discharges on the basis of their origin, rather than compliance
with specific water quality standards. The implication of this paradigm shift, is that water
quality has been compromised by past processes and practices and, because of the
proposed shift in ‘activity status’, that these adverse effects are related specifically to
‘large sites’; namely airports, the State highway network and Centreport.
7.2 The presumption of the pNRP rules in relation to the State highway network specifically,
appears to be that the State highway network is currently having an adverse effect on
water quality.
7.3 To the best of my knowledge, there is no evidence to support the contention that water
quality as a result of stormwater discharges, particularly from the State highway
network, has been, and is being, compromised in the Wellington Region. Further, there
is no evidence that large projects (including the State highway network) have a
disproportionate effect on water quality, or that the management of the effects of these
projects could be improved. Finally, there is no evidence that the water quality from
these sources is at a level that requires the number of new specific Objectives and
Policies which have been proposed through the pNRP.
7.4 The Council’s “River and stream water quality and ecology in the Wellington Region –
state and trends”2 report makes no mention of the State highway network as being a
critical, or even major, control on degrading water quality within the Wellington Region.
In fact, there are no references to the State highway network at all in the report.
7.5 The report states that “The majority of SoE (State of the Environment) sites exhibited
stable water quality and ecological health over the time periods examined (2006 to 2011
and 2004 to 2011 respectively). Generally speaking, the majority of statistically
significant trends tended to be indicative of improving water quality (predominantly
declining nutrient concentrations) but deteriorating ecological condition (increasing
periphyton cover/biomass and declining macroinvertebrate community health). In most
cases the reasons for the observed trends were unclear.”
7.6 Further “The RSoE (Regional State of the Environment) sites in poorest condition – in
particular those with small catchments dominated by urban or intensive agricultural land
uses – share in common one or more of the following ‘stressors’: nutrient enrichment,
poor water clarity, nitrate or heavy metal toxicity, microbiological contamination, and
instream habitat degradation. Management of these stressors requires a whole of
catchment approach that addresses municipal wastewater discharges to water (in the
2 River and stream water quality and ecology in the Wellington region. State and trends. Report
prepared by A. Perrie, S. Morar, J.R. Milne & S.Greenfield. ISBN: 978-1-927217-13-9 June 2012.
Dr John (Jack) McConchie 16
Wairarapa Valley in particular), nutrient loss (from both overland runoff and leaching via
shallow groundwater) in intensively farmed rural catchments, sediment runoff associated
with erosion-prone farmland, exotic forestry and urban development, sewer
infrastructure leaks/faults, urban stormwater discharges, water abstraction, and direct
stock access to streams and riparian margins.”
7.7 Consequently, Council’s Environmental Monitoring and Investigations Department do
not appear to have any data to support the contention that the State highway network is
a major contributor of either contaminants or to declining water quality.
7.8 In recommending the pNRP’s proposed provisions for managing stormwater discharges
be adopted in the s42A Reports, the Council Officers appear to have relied on the
primary evidence of Ms Claire Conwell3 for guidance regarding the distinction between
the water quality emanating from ‘large sites’ and ‘individual sites’. Consequently, it is
critical that Ms Conwell’s evidence is placed in context, and areas of uncertainty
clarified.
7.9 Ms Conwell’s principal argument in support of maintaining the distinction appears to be
that proposed Rule 52 is necessary since ‘large sites’ “may contain both a wide range of
contaminants and relatively high concentrations and/or loads of contaminants compared
to individual sites, it should be managed differently to stormwater discharges from
individual sites.”
7.10 Furthermore, Ms Conwell appears to suggest that because the types of activities and
the scale of activities are different, ‘large sites’ should be managed in a different manner
to ‘individual sites’.
7.11 With respect, I disagree with Ms Conwell’s conclusions. In my view, it is not the
activities which should be regulated but their effects on the environment. There is no
simple or unique causal relationship between an activity and its effect. This is because
the effect of an activity at a particular location is very site specific, and reflects the
interaction of the activity with both the environment and any management practices
which have been adopted. There are a wide range of controls on the activities for all
three ‘large sites’ identified in the pNRP, and these have a significant effect on any
potential risk from contaminants in stormwater to the environment.
7.12 While recognising that ‘large sites’ are different, and “As such, it is expected and
common for contaminant discharges from large sites to be managed in accordance with
industry derived Best Management Practices and/or site specific Stormwater
Management Plans” Ms Conwell’s opinion is that Rule 52 is still necessary.
3 Statement of primary evidence of Claire Conwell on behalf of Wellington Regional Council.
Technical – Large site stormwater quality in regards to Rule 52 Stormwater from large sites 12 January 2017.
Dr John (Jack) McConchie 17
7.13 Airports, the State highway network, and Centreport are all classified as ‘large sites’.
The State highway network, however, is distinctly different to the other two land uses in
that it is linear infrastructure as opposed to a concentrated focus of activity.
7.14 For example, the estimated surface area of the State highway network is 44ha;
however, this is spread as linear infrastructure across the entire region. Consequently,
the 44ha is actually spread over a large number, and wide range, of catchments. The
effect of the State highway network in any particular catchment is actually very small.
7.15 This can be illustrated with reference to three elements of the State highway network
(Figure 6).
Figure 6: Three components of the State highway network.
7.16 As already discussed, the PP2O Expressway directly affects stormwater from less than
0.09% of the catchments which it intersects. On the same assumption as used for the
PP2O Expressway for the other elements of the State highway network (which would be
extremely conservative since these are generally two lane highways as opposed to four)
then SH2, with a length of 67.2km, interacts with 0.06% of the Ruamahanga catchment
(i.e. 3188km²). SH2 through the Hutt catchment has a length of 40.52km and has the
potential to affect 0.19% of the runoff throughout the catchment.
7.17 The airports on the other hand affect a total area of ~280ha, of which about 82ha is
impervious. Any environmental effect is concentrated within only a very few, and
generally small, catchments. The effect within these catchments is potentially

Dr John (Jack) McConchie 18
significantly greater than that of the more dispersed State highway network.
7.18 Likewise, CentrePort covers approximately 28.3ha and essentially drains a single
catchment; draining directly into Wellington Harbour. This situation is also very different
to the State highway network, and would potentially have different catchment-scale
effects.
7.19 The grouping of these three very different land uses as ‘large sites’ therefore ignores the
actual hydrological and other environmental processes operating. The State highway
network is distinctly different to the other two land uses within the ‘large site’
classification.
7.20 It should also be noted that ‘individual sites’ actually have the potential to have a greater
effect on the specific catchments, as any development is likely to affect a greater
proportion of the actual catchment. Any development is also unlikely to be guided by
any ‘management plan’ or potentially even ‘industry best practice’. The pNRP would
result in the management of such areas being less restrictive than the State highway
network.
7.21 I would agree with Ms Conwell that “the stormwater from the State Highway Network is
well defined, described in detail, and is supported by a track record of pro-active and
targeted investigations.”
7.22 The effect of the State highway network can also be positive as shown with the Mackays
to Peka Peka Expressway. Comparing the modified/constructed wetlands and other
stormwater management and control structures with the pre-existing condition highlights
the positive outcomes for the environment from the Expressway.
7.23 I would also agree with Ms Conwell that “copper and zinc represent contaminants in
stormwater that are ubiquitous in road runoff, present in concentrations that are of
potential environmental concern, are reliably measured in the laboratory, and are
routinely measured in targeted investigations.”
7.24 With respect, the data presented in Table 3 of Ms Conwell’s evidence, while reflecting
information held in the URQIS database, need to be interpreted with caution. For
example, with respect to any potential environmental effect it is the bioavailability which
is critical, and not the total concentration. The difference between the ‘Dissolved’ and
‘Total’ concentrations is likely to reflect the concentration of metals bound to sediment.
This material is not generally bioavailable.
7.25 Considering the ‘Dissolved’ concentrations of both Cu and Zn, even for roads with a vpd
>20,000, these are less than those from Low-density residential; dramatically so for Zn.
Yet it is proposed, through the pNRP provisions, to control activities relating to the State
highway network to a greater degree than Low-density residential development.
Dr John (Jack) McConchie 19
7.26 To understand the actual potential effects of these discharges, it is also important that
these ‘point measurements’ of concentration are placed within a wider environmental
context. For example, if these contaminated discharges represent a large proportion of
the flow within a catchment, they have the potential to have a greater adverse effect on
the environment than if the discharge is to a larger water body. The potential for dilution
is therefore a critical control on the ‘effective concentration’ and the potential effects on
the receiving environment. It should be noted that the State highway network generally
passes through larger catchments, with larger discharges and therefore with a greater
dilution potential, than other components of the roading network.
7.27 Even considering the total concentrations, which I would argue is not appropriate for the
reasons given above, the differences between Low-density residential and Roads
>20,000vpd are small, and the potential effect of dilution and any management
interventions still need to be considered.
7.28 In addition to the above considerations, the limits and assumptions provided by Ms
Conwell must also be considered when placing these data in the context of the State
highway network.
7.29 The concentration of potential contaminants from the State highway network is therefore
not simple, and the potential effect of any contaminant on the environment is even less
certain. Any effect will differ both spatially and temporally, and in my opinion are best
addressed through, and managed in accordance with, industry derived Best
Management Practices and/or site specific Stormwater Management Plans.
7.30 As mentioned previously, it is my understanding that the Transport Agency supports,
and actively promotes, efforts to improve water quality. For example, it has developed,
produced and regularly updates a range of guidance and ‘best practice’ documents and
manuals. These include:
NZTA Environmental and Social Responsibility Policy
https://www.nzta.govt.nz/assets/resources/environmental-and-social-responsibility-
manual/docs/environmental-and-social-responsibility-policy.pdf
NZTA Environment Plan
https://nzta.govt.nz/assets/resources/environmental-plan/docs/environmental-plan.pdf
NZTA Stormwater and Treatment Standard for State Highway Infrastructure
https://www.nzta.govt.nz/assets/resources/stormwater-management/docs/201005-nzta-
stormwater-standard.pdf
NZTA Project Management Manual - Part 4 Guidelines
Project Management Manual guidelines outlines minimum standards for social and
environmental management

Dr John (Jack) McConchie 20
- includes MS Z/4 - Contractor's social and environmental management plan; and
SM032 (State Highway maintenance contract pro forma manual) - Contractor's quality
plan - environmental management.
7.31 These documents illustrate an ongoing and pro-active commitment by the Transport
Agency to the continual improvement of the water quality of stormwater emanating from
the State highway network. I also understand that the Transport Agency uses best
practice environmental management strategies to mitigate the effects of discharges
when undertaking new roading projects. On the existing network, the Transport Agency
is progressively improving effects by identifying sensitive receiving environments that
are being adversely affected by State highway runoff, and treating the identified sites as
appropriate, based on a pragmatic, prioritisation approach.
8. DISCUSSION OF THE PROPOSED PLANNING FRAMEWORK
8.1 Based on Mr Hywel Edwards’ evidence, I understand that under the pNRP all existing
and new stormwater discharges from the State highway network:
a) Onto land are permitted;
b) Into or onto water or onto land in circumstances where they may enter water
require consent as a Restricted Discretionary activity;
c) Into or onto water or onto land in circumstances where they may enter water in
sites of significance require consent or as a Non-Complying activity.
8.2 However, the matters over which the Council has retained its discretion are ambiguous,
and would require a high degree of background research to be able to demonstrate
compliance. The matters over which they have retained their discretion are also not
necessarily well understood (for example, mahinga kai), and no clear guidelines or
standards are provided. Without clear standards it is not possible to assess the level of
effect which is permitted before ‘adverse effects’ result.
8.3 Consequently, the proposed ‘process’ will be ambiguous, potentially time consuming
and costly. This will, in my opinion, lead to inefficiencies and uncertainty, with no
guarantee of a better outcome than achieved at present.
8.4 The pNRP fails to recognize the inherently high degree of variability in water quality, in
both natural and modified watercourses. It also fails to recognise the difficulty in
quantifying various water quality parameters in absolute terms.
8.5 There also appears to be the perception that activities can be undertaken in such a way
that there will be no effects. Large infrastructure projects will invariably have an effect
on water quality and hydrological processes. Whether these effects are measurable
and quantifiable is less well defined. These effects, however, can be reduced and

Dr John (Jack) McConchie 21
mitigated by applying best practicable options.
8.6 For the various reasons outlined in my evidence, it is inappropriate and in my opinion,
not effective or efficient from a water quality perspective, to regulate activities based on
the size or type of the activity rather than the effect.
8.7 To the best of my knowledge, there is no evidential basis, or effects based reason for
imposing a stricter activity status on discharges from the State highway network.
Comments on Specific pNRP Provisions
8.8 I support the intent of Objective 48, which encourages any adverse effects on the quality
and quantity of water in stormwater networks be reduced over time. This objective
aligns with the concept of integrated catchment management to improve stormwater
quality over time. However, as noted by Mr Edwards, the RMA is not a ‘zero effects’
piece of legislation. It is therefore anticipated that effects may be ‘remedied’ or
‘mitigated’, and this assumes that any effects are of sufficient impact that they need to
be addressed. Furthermore, water quality is spatially and temporally variable and it is
difficult to envisage a situation where the adverse effects of stormwater no longer
require improvement i.e. that stormwater is ‘pure’. I therefore agree with the proposed
changes to Objective 48 made by Mr Edwards, to refocus the objective on improving
water quality where the existing quality is degraded, and maintaining water quality where
the existing quality is acceptable.
8.9 The intent of Policy 62 is supported as it promotes the discharge of contaminants to land
rather than directly to water. This allows for moderation, attenuation and ‘treatment’ of
many potential contaminants by various processes within the soil before they enter a
waterbody.
8.10 Policy 67 sets a very high standard which ignores the natural variability which exists
within the environment, and the moderating and attenuating effects of rivers and
streams. While the concept is fully endorsed, the goal should be to ‘minimise’ rather
than the higher standard of ‘avoiding’. Many activities would have great difficulty in
‘avoiding’ the production of contaminants. Whether a potential contaminant actually has
an adverse effect is often both site and catchment specific.
8.11 Policy 71 is endorsed as it takes a pragmatic approach to the variability of water quality
and potential discharges. It also recognises that the quality of any discharge should be
directly related to the quality of the receiving water. The upstream/downstream
comparison allows for natural variability, while at the same time quantifying the nature of
the potential impact of any discharge.
8.12 As shown above, there would appear to be no reason, given the underlying aim of Rule
48, to exclude Local Authority stormwater networks, ports, airports or State highway
Dr John (Jack) McConchie 22
network from this rule. Since the rule is to allow discharges as a Permitted activity,
assuming that it meets certain standards, it should apply equally to all parties. The rule
applies to the quality of the discharge, as it should, and therefore it should not be
applied differently to different land uses or the size of the property parcel.
8.13 There appears to be little justification, and no quantitative data, to support Rule 52. In
addition, Rule 52 appears to focus on activities rather than on effects. Finally, the
inclusion of the State highway network with ports and airports ignores the distinct
differences between these three activities, particularly with respect to the potential of
runoff from these land use to have adverse effects on the environment.
8.14 Rule 52 is problematic in that makes the discharge of stormwater from the State
highway network (including the existing State highway network) a Restricted
Discretionary activity, and requires consent to be applied for in relation to the entirety of
the existing State highway network within the Wellington region.
8.15 Consequently, I support the evidence provided by Mr Hywel Edwards, on behalf of the
Transport Agency, with regard to the wording of the policies, objectives and rules
relating to the management of the water quality of stormwater from the State highway
network.
9. SUMMARY AND CONCLUSIONS
9.1 There is considerable emphasis within the pNRP on improving water quality. I
understand that this is supported by the Transport Agency, and aligns with its own
integrated catchment management approach of improving stormwater quality over time.
It therefore appears to me that the Transport Agency and the Council have the same
goals about what should be achieved, albeit a difference of opinion on how to achieve
this in terms of managing discharges from the State highway network.
9.2 I support the overall direction towards improving water quality in the Wellington region.
However, for the reasons outlined in this evidence, I do not consider that the provisions
currently proposed in the pNRP are the most effective way to achieve this. In my view:
a) The shift towards regulation based on the origin of a discharge (i.e. from a ‘large
site’ as opposed to an ‘individual site’), rather than either the effect of the
discharge or the ability of the activity or discharge to comply with specific
measureable standards, is not appropriate. Rivers and streams have the ability to
moderate and attenuate potential contaminants, and their effect on the
environment. This ability is, however, both catchment and site specific.
Therefore, effects of stormwater discharges on water quality need to be assessed
on a case-by-case basis.
b) There is a common misconception that roads are a primary source of
Dr John (Jack) McConchie 23
contaminants and that targeting roads along with other high contaminate
generating activities, will address water quality issues. The reality is that roads
are only a minor to moderate contributor of contaminants. There is no evidence
for the contention that stormwater discharges from the State highway network
have compromised water quality in the Wellington Region.
c) The focus in the pNRP on improving the water quality of stormwater from the
State highway network by stricter regulation is, in my view, not appropriate given
the nature of the stormwater, the level of any measured effects, and the existing
focus of the Transport Agency on ‘best practice’ and ‘optimising’ the design of
stormwater devices to meet specific environmental outcomes.
d) Any adverse effects arising from discharges from the State highway network are
managed adequately through the permitted activity conditions as proposed by Mr
Hywel Edwards, and through the Transport Agency’s approach to stormwater
management (through its commitment to managing the environmental effects of
its activities under its Environmental Plan and Stormwater Management Strategy,
as mandated under the Land Transport Management Act). In addition,
improvements to existing stormwater systems are most efficiently undertaken in
conjunction with road upgrades. I would also argue that the environmental
outcomes from such an approach are greater than having to retrospectively apply
for consent for all existing State highways.
e) In my opinion, stormwater discharges from the State highway network to water, or
to land in circumstances where it may enter water, should be regulated as a
permitted activity, subject to controls in the form of permitted activity standards.
This is the situation under the Operative Plan. Where the permitted activity
standards cannot be met, then a restricted discretionary activity status should
apply. This applies in relation to all discharges, whether from existing,
redevelopment of, or completely new State highways.
9.3 Consequently, I would support the evidence provided by Mr Hywel Edwards, on behalf
of the Transport Agency, with regard to the wording of the policies, objectives and rules
relating to the management of the water quality of stormwater from the State highway
network.
John (Jack) Allen McConchie
30 January 2018

Dr John (Jack) McConchie 24
Annexure 1 Brown, J.N. and Peake, B.M. 2006: Sources of heavy metals and polycyclic aromatic
hydrocarbons in urban stormwater runoff. Science of the total environment 359: 145-
155.
Depree, C. and Ahrens, M. 2007: Polycyclic aromatic hydrocarbons in Auckland’s aquatic
environment: sources, concentrations and potential environmental risks. NIWA Client
Report: HAM2006-088, prepared for Auckland Regional Council. Auckland Regional
Council Technical Publication No. 378.
Environment Southland, 2003: Topoclimate Southland Soil Information Sheet No. 1. Last
updated 4/02/03.
Gardiner, L.R. and Armstrong, W. 2007: Identifying sensitive receiving environments at risk
from road runoff. Land Transport NZ Research Report No. 315.
Gadd, J. 2007: Draft assessment of environmental effects for swales at SH1 and Halswell
Junction Road. Prepared for Transit New Zealand.
Kennedy, P and Gadd, J. 2000: Preliminary examination of trace elements in tyres, brake pad
and road bitumen. Prepared for Ministry of Transport. (Updated 2003)
Kennedy, P. 1999: The effects of road transport on freshwater and marine ecosystems.
Prepared for Ministry of Transport. (Updated 2003)
Kennedy, P. 2003: Metals in particulate material on road surfaces. Prepared for Ministry of
Transport.
Kouvelis, B. and Armstrong, W. 2004: Integrated stormwater management guidelines for the
New Zealand Roading Network. Transfund New Zealand Research Report No. 260.
Ministry of Health (MoH) 2005: Drinking-water Standards for New Zealand 2005. Wellington:
Ministry of Health.
Moncrief, I. and Kennedy, P. 2002: Road transport impacts on aquatic ecosystems - Issues
and context for policy development. Prepared for Ministry of Transport. (Updated
2004)
Moores, J.; Pattinson, P. and Hyde, C. 2010: Enhancing the control of contaminants from New
Zealand’s roads: results of a road runoff sampling programme, March 2010. Land
Transport NZ Research Report No. 315.
New Zealand Transport Agency, 2010: Stormwater treatment for road infrastructure.
O’Riley, A.; Pandey, S.; Langdon, A. and Wilkins, A. 2002: Characterisation of runoff
contaminants from New Zealand roads, & effect of rainfall events. Transfund New
Zealand Research Report No. 228.
Pandy, S.; Taylor, M. and Lee, R. 2005: Reduction of road runoff contaminants: laboratory
experiments and monitoring of treatment walls. Land Transport NZ Research Report No.
282.
Pitt, R. 2001: Stormwater management for Highway Projects. Presented at the Symposium on
the Pollution of Water Sources from Road Runoff at Tel Aviv University in March 2001.
Sansom, J. 1984: The climate and weather of Southland. New Zealand Meteorological
Service Miscellaneous Publication 115(15).
Torgerson, L. 2011: Statement of evidence on behalf of Transit New Zealand in respect of
Variation 1 Proposed Natural Resources Regional Plan: Chapter 4 – Water.
Williamson, R.B. 1993: Urban runoff data book. Water Quality Centre Publication No. 20,
National Institute of Water and Atmospheric Research, Hamilton.