redalyc.hydrogeology and hydrodynamics of tremembé aquifer ... · descrição detalhada do perfil...
TRANSCRIPT

Ambiente & Água - An Interdisciplinary Journal
of Applied Science
ISSN: 1980-993X
Universidade de Taubaté
Brasil
Nóbile Diniz, Helio; Santoro, Jair; Teixeira Batista, Getulio; Wellausen Dias, Nelson; dos Santos Targa,
Marcelo
Hydrogeology and hydrodynamics of Tremembé aquifer, São Paulo, Brazil
Ambiente & Água - An Interdisciplinary Journal of Applied Science, vol. 3, núm. 1, abril, 2008, pp. 108-
137
Universidade de Taubaté
Taubaté, Brasil
Available in: http://www.redalyc.org/articulo.oa?id=92830112
How to cite
Complete issue
More information about this article
Journal's homepage in redalyc.org
Scientific Information System
Network of Scientific Journals from Latin America, the Caribbean, Spain and Portugal
Non-profit academic project, developed under the open access initiative

ISSN = 1980-993X – www.agro.unitau.br/ambi-agua E-mail: [email protected]; Tel.: (12) 3625-4116
Revista Ambiente e Água – An Interdisciplinary Journal of Applied Science: v. 3, n. 1, 2008.
Hydrogeology and hydrodynamics of Tremembé aquifer, São Paulo, Brazil
Helio Nóbile Diniz1; Jair Santoro1; Getulio Teixeira Batista2; Nelson Wellausen
Dias2; Marcelo dos Santos Targa2
1São Paulo State Geological Institute, Environmental Secretariat, Av.Miguel Stéfano, 3900, Água Funda,
04301-903 - São Paulo, SP, Brazil e-mail: {heliodiniz1; jairsantor}@yahoo.com.br
2Environmental Sciences Post-Graduate Program, University of Taubaté, Estrada Mun. Dr.José Luiz Cembranelli, 5000, Bairro Itaim, 12081-010 – Taubaté, SP, Brazil
e-mail: {getulio; mtarga; nelson}@agro.unitau.br
ABSTRACT This paper shows the results obtained from several pump tests of two wells drilled 13.2
meters apart, in the Agrarian Sciences Department of the University of Taubaté farm, located in the Una river hydrographic basin, Taubaté municipality, State of São Paulo, Brazil. During well drilling some difficulties were encountered due to the presence of sandy grains without inter-granular cementation of the Tremembé Formation sandstones, Taubaté Group. The detailed description of the geologic profile obtained by sampling the perforated sedimentary layers shows the presence of persistent sandstone and conglomerate sequences, intercalated by layers of shale and claystone with limestone nodules. In order to determine the hydrodynamic parameters of the Tremembé aquifer, several pump tests were conducted during well perforation and the unconfined, leaky, water-table, and confined aquifer layers were sampled. Once the boreholes were completed, tests were conducted to determine maximum discharge rate, interference between wells and artificial recharge potential. In addition to establishing appropriated methodologies for the determination of aquifer hydrodynamics, this paper describes techniques for interpreting the effects of artificial recharge and interference between wells, and demonstrated the application of image well theory complemented with a new theory, the image well water-mirror.
Keywords: hydrogeology; well hydraulics; theory of the image well water-mirror.
Hidrogeologia e hidrodinâmica do Aqüífero Tremembé, São Paulo, Brasil
RESUMO Este trabalho mostra os resultados obtidos com a perfuração e ensaios de bombeamento
realizados em dois poços tubulares profundos, distanciados de 13,2 m, na área do Departamento de Ciências Agrárias da Universidade de Taubaté, no Município de Taubaté. Os dados construtivos descritos demonstram as dificuldades encontradas com a perfuração dos poços, devido aos tipos litológicos da Formação Tremembé, do Grupo Taubaté, no local, onde os grãos arenosos das camadas terciárias não possuem cimentação intergranular. A descrição detalhada do perfil geológico, caracterizado por meio de testemunhos das sondagens, mostra a presença de seqüências arenosas e conglomeráticas persistentes, intercaladas por camadas de folhelhos, argilitos maciços e nódulos calcáreos. Durante a construção dos poços foram realizados testes de vazão em diferentes profundidades que mostraram a evolução hidrodinâmica dos aqüíferos atravessados pela perfuração, de livres,

DINIZ, H. N.; SANTORO, J.; BATISTA, G. T.; DIAS, N. W.; TARGA, M. dos S. Hydrogeology and hydrodynamics of Tremembé aquifer, São Paulo, Brazil. Revista Ambi-Água, Taubaté, v. 3, n. 1, p. 108-137, 2008.
109
semi-livres, semi-confinados a confinados. Com os poços completados foram realizados testes de vazão máxima, de interferência entre poços e de recarga artificial. Adicionalmente às metodologias consagradas, são empregadas e demonstradas novas técnicas para interpretação hidrodinâmica da recarga artificial dos aqüíferos e da interferência entre os poços. São demonstrados os ensaios metodológicos da aplicação da teoria do poço imagem, complementados com um nova teoria, a do poço imagem espelho d´água.
Palavras-chave: hidrogeologia; hidráulica de poços; teoria do poço imagem espelho d´água.
1. INTRODUCTION The aquifer cone of depression of a pumping well can be determined with reasonable
accuracy if hydrodynamic parameters are known for a confined aquifer (transmissivity and coefficient of storage) as well as the pumping rate (Driscoll, 1989). The depression (or drawdown) cone shape is a function of s x r, where s is the depression observed at an r distance from the well due to a Q pumping rate maintained during a t period measured from the beginning of well pumping. Usually the depression cone has transitory characteristics since several factors associated with groundwater flow and pumping activities change with time. The influence radius (or the interference area of the depression cone) is related to the distance that the depression cone could reach away from the well. This influence can be determined when some hydrodynamic parameters of the aquifer are known (Minnesota, 1991).
A method for calculating the percentage of the total pumping rate of two wells (built within the influence radius of each other) comes from groundwater flow distributed within the intersection of the influence circumference of both wells or from areas located outside of the region of intersection but within each well’s influence area.
The confined aquifer transmissivity and coefficient of storage hydraulic parameters are aquifer characteristics that do not change during either extracting groundwater through pumping or recharging an aquifer through deep well injection. Based on this premise and applying the image well theory (on a horizontal mirror plane) a method for estimating the recharge cone associated with an injection well is proposed and demonstrated in this research. The study proposes methods considered more appropriate than the traditional methods used for solving this type of problem, such as the one proposed by Bouwer (1978).
The research focuses on analyzing the hydrogeological properties of the Tertiary sedimentary aquifers located in the Tremembé Formation (part of the Taubaté Group) within the Una River hydrographic basin, São Paulo State, Brazil.
The research was conducted based on the construction of two deep wells, one for the production of groundwater to supply the water demand for irrigation in the Department of Agrarian Sciences of the University of Taubaté. The other well was built to support the hydrogeologic research to allow measures of the interference between wells as well as other important observations. The main objective of this research is to develop a hydrogeologic model that explains the hydraulic properties of wells in the study area.
1.1. Study area
The study area is located in the Taubaté Municipal District (southeastern region of the State of São Paulo) and within Paraíba do Sul River Valley. The study area is distant approximately 160 km east of the city of São Paulo (Figure 1). Road access to Taubaté from São Paulo is provided by two highways, President Dutra and Carvalho Pinto.

DINIZ, H. N.; SANTORO, J.; BATISTA, G. T.; DIAS, N. W.; TARGA, M. dos S. Hydrogeology and hydrodynamics of Tremembé aquifer, São Paulo, Brazil. Revista Ambi-Água, Taubaté, v. 3, n. 1, p. 108-137, 2008.
110
2000 100
-53 -52 -51 -50 -49 -48 -47 -46 -45
-25
-24
-23
-22
-21
-20La
titud
e
Longitude
SÃO PAULO STATE, BRAZIL
São Paulo CityTaubaté Municipal District
Scalekm
MINAS GERAIS STATE, BRAZIL
ATLANTIC OCEAN
PARANÁ STATE, BRAZIL
MATO GROSSODO SUL STATE, BRAZIL
Figure 1. Taubaté Municipal District location in relationship to the state of São Paulo boundaries in Brazil.
Taubaté municipality is located within the Paraíba do Sul river valley and bordered by two mountain chains, Serra da Mantiqueira and Serra do Mar. The district’s terrain in the urban and surrounding rural areas is characterized mostly by flattened hills sustained by Tertiary sediments of the Taubaté Group. In the rural areas, away from the urban center, the terrain is predominantly rugged due to the higher hills of Serra do Mar in the southwestern portion of the territory, while in the northwestern portion the hills belong to Serra da Mantiqueira. Both areas are sustained by the Complex Embu crystalline rock formation. In the central portion of the district there is the occurrence of extensive floodplains associated with Paraíba do Sul River. The extent of the district’s territory is 655 km2. The climate is tropical with dry winter, 21°C average annual temperature, and 1,400 mm average annual precipitation.
1.2. Regional geology
Taubaté sedimentary basin is formed by layers of Cenozoic and Tertiary sediments deposited within the Paraíba do Sul tectonic block, which is characterized by Embu and Apiaí Lands of the Precambrian crystalline complex. Those crystalline basement rocks are constituted by gneiss, granites, and migmatites with bands and different migmatization grades, intercalated with schist and granites of the Brasiliano cycle (Santoro et al., 1991). The Buquira Fault, at the north, and Alto da Fartura Fault, at the south, are the lateral boundaries of both sedimentary and crystalline rocks (Hasui and Ponçano, 1978).
The origin of Taubaté sedimentary basin is associated with the reactivation of major E-NE faults that comprise the São Paulo strike-slip fault zone (Hasui et al., 1978) represented by Monteiro Lobato Fault (Sadowski and Carneiro, 1974), Jaguari River Fault (Cavalcante and Kaefer, 1974), and Buquira and Bom Retiro Faults (Carneiro et al., 1976). Palmital, Parateí, São José, and Rio Comprido are normal faults described by Carneiro et al. (1976). Those are dip-slip faults associated with gravitational mudslides (Coltrinari, 1992) that characterize recent reactivations of old strike-slip faults.

DINIZ, H. N.; SANTORO, J.; BATISTA, G. T.; DIAS, N. W.; TARGA, M. dos S. Hydrogeology and hydrodynamics of Tremembé aquifer, São Paulo, Brazil. Revista Ambi-Água, Taubaté, v. 3, n. 1, p. 108-137, 2008.
111
Taubaté sedimentary basin is part of a taphrogenic basin group, the so-called “system of Serra do Mar rifts” described by Almeida (1976) and, more recently, the “Southest Brazilian continental rift” described by Riccomini (1989). These tectonic processes occurred during the opening of the South Atlantic Plate that formed asymmetrical grabens with dumper to SE or NW filled with Tertiary sediments. It has an elongated format approximately 170 km long and 10 km to 20 km wide.
The thickness of the sediments varies reaching a maximum of 850 m in the Roseira sub-basin, near Serra da Mantiqueira mountains (Hasui et al., 1978; Melo et al., 1986). Sedimentation occurred simultaneously with tectonics (Souza, 2004) producing typical gravel deposits originated from debris-flow processes in active folded edges of the basin. Sandstone and conglomerate deposits located in the central part of the basin are connected to alluvial and lacustrine systems.
For this research Hasui and Ponçano’s (1978) stratigraphic column is the basis for describing both Tremembé and Caçapava Formations of the Taubaté Group. The names were initially proposed because of existing river channels and alluvial Tertiary plain deposits located in São José dos Campos and Caçapava municipality areas.
1.3. Hydrogeology of the Paraíba do Sul river basin in the State of São Paulo
In the Paraíba do Sul River Water Resource Management Unit, or “Unidade 2 de Gerenciamento de Recursos Hídricos” (UGRHI-2), there are two main aquifer systems: sedimentary (Cenozoic) and crystalline (Precambrian). The sedimentary terrains are responsible for the formation of the best aquifers of the region. The terrains are anysotropic and the aquifer characteristics vary according to the sedimentary formation lithology.
Franco Filho and Souza (1994) differentiated two units in the Taubaté sedimentary basin: 1) the Tremembé Formation at the base and 2) the Caçapava Formation at the top. Tremembé Formation consists of shale with lens of gray greenish pyrobetuminous argillites formed in a lacustrine environment and centimeter to decimeter sandstones, siltstones, and breccia inserts. Caçapava Formation consists of sandstones and siltstones originated in a fluvial environment with gray, yellow, and red pelite inserts.
Paraíba do Sul is an effluent river since groundwater flow discharges are responsible for supplying much of its water. Due to the increasing water demand for domestic and industrial uses, mainly in Jacareí, São José dos Campos, and Lorena municipalities, there are several pump wells with strong groundwater withdrawal that may be causing changes in groundwater flow patterns, such as induced aquifer recharge by wells drawdown, as observed by the Department of Water and Electric Energy studies (São Paulo, 1977a; São Paulo, 1977b). In several locations Paraíba do Sul river has become an influential river due to its recharging effect over the exploited aquifers.
According to São Paulo (1977a), most of the region is characterized by phreatic aquifers that show leaky conditions. Just in restricted areas there are confined aquifers that characterize artesian conditions.
1.3.1. Paraíba do Sul Taubaté sedimentary aquifer system
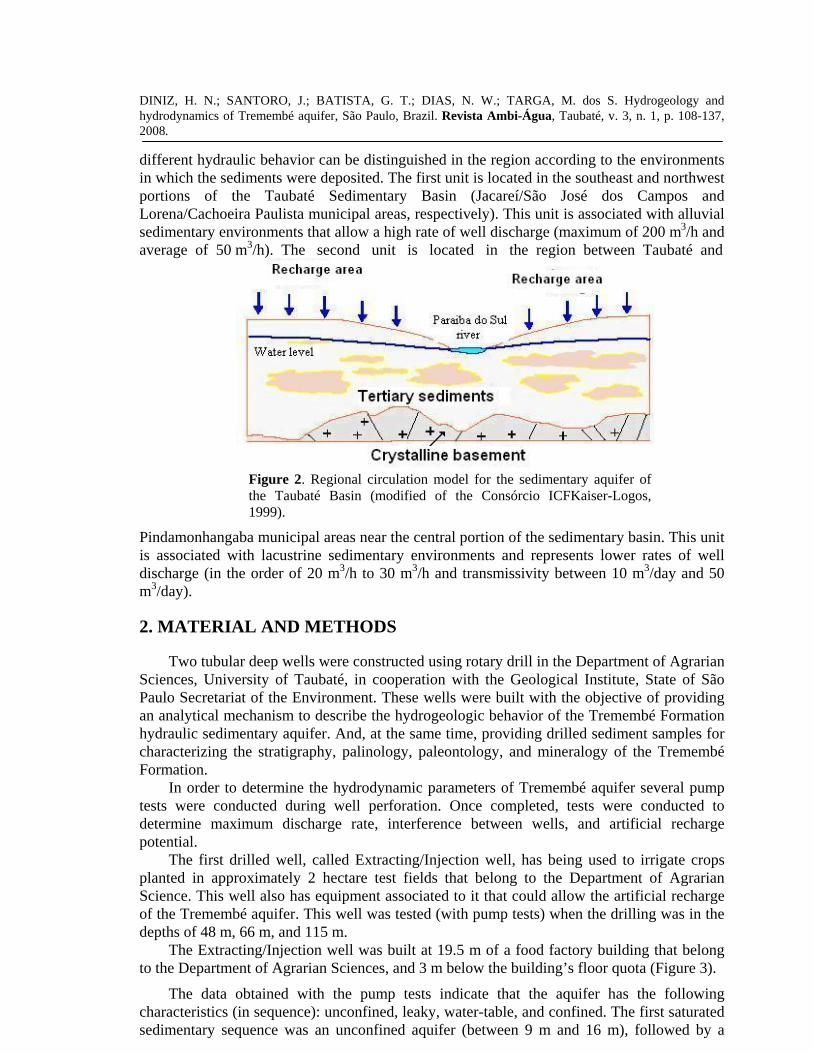
The groundwater flow model currently accepted for the Paraíba do Sul sedimentary aquifer system (Consórcio ICFKaiser-Logos, 1999) shows that the recharge associated with natural precipitation occurs throughout the basin area due to its permeable characteristics (Figure 2). These recharge areas are drained by the groundwater flow after the infiltrating rainwater reaches the phreatic aquifer. Hydrogeologic characteristics of the aquifers are closely related to the depositional environments. Based on this knowledge, two units with
DINIZ, H. N.; SANTORO, J.; BATISTA, G. T.; DIAS, N. W.; TARGA, M. dos S. Hydrogeology and hydrodynamics of Tremembé aquifer, São Paulo, Brazil. Revista Ambi-Água, Taubaté, v. 3, n. 1, p. 108-137, 2008.
112
different hydraulic behavior can be distinguished in the region according to the environments in which the sediments were deposited. The first unit is located in the southeast and northwest portions of the Taubaté Sedimentary Basin (Jacareí/São José dos Campos and Lorena/Cachoeira Paulista municipal areas, respectively). This unit is associated with alluvial sedimentary environments that allow a high rate of well discharge (maximum of 200 m3/h and average of 50 m3/h). The second unit is located in the region between Taubaté and
Figure 2. Regional circulation model for the sedimentary aquifer of the Taubaté Basin (modified of the Consórcio ICFKaiser-Logos, 1999).
Pindamonhangaba municipal areas near the central portion of the sedimentary basin. This unit is associated with lacustrine sedimentary environments and represents lower rates of well discharge (in the order of 20 m3/h to 30 m3/h and transmissivity between 10 m3/day and 50 m3/day).
2. MATERIAL AND METHODS
Two tubular deep wells were constructed using rotary drill in the Department of Agrarian Sciences, University of Taubaté, in cooperation with the Geological Institute, State of São Paulo Secretariat of the Environment. These wells were built with the objective of providing an analytical mechanism to describe the hydrogeologic behavior of the Tremembé Formation hydraulic sedimentary aquifer. And, at the same time, providing drilled sediment samples for characterizing the stratigraphy, palinology, paleontology, and mineralogy of the Tremembé Formation.
In order to determine the hydrodynamic parameters of Tremembé aquifer several pump tests were conducted during well perforation. Once completed, tests were conducted to determine maximum discharge rate, interference between wells, and artificial recharge potential.
The first drilled well, called Extracting/Injection well, has being used to irrigate crops planted in approximately 2 hectare test fields that belong to the Department of Agrarian Science. This well also has equipment associated to it that could allow the artificial recharge of the Tremembé aquifer. This well was tested (with pump tests) when the drilling was in the depths of 48 m, 66 m, and 115 m.
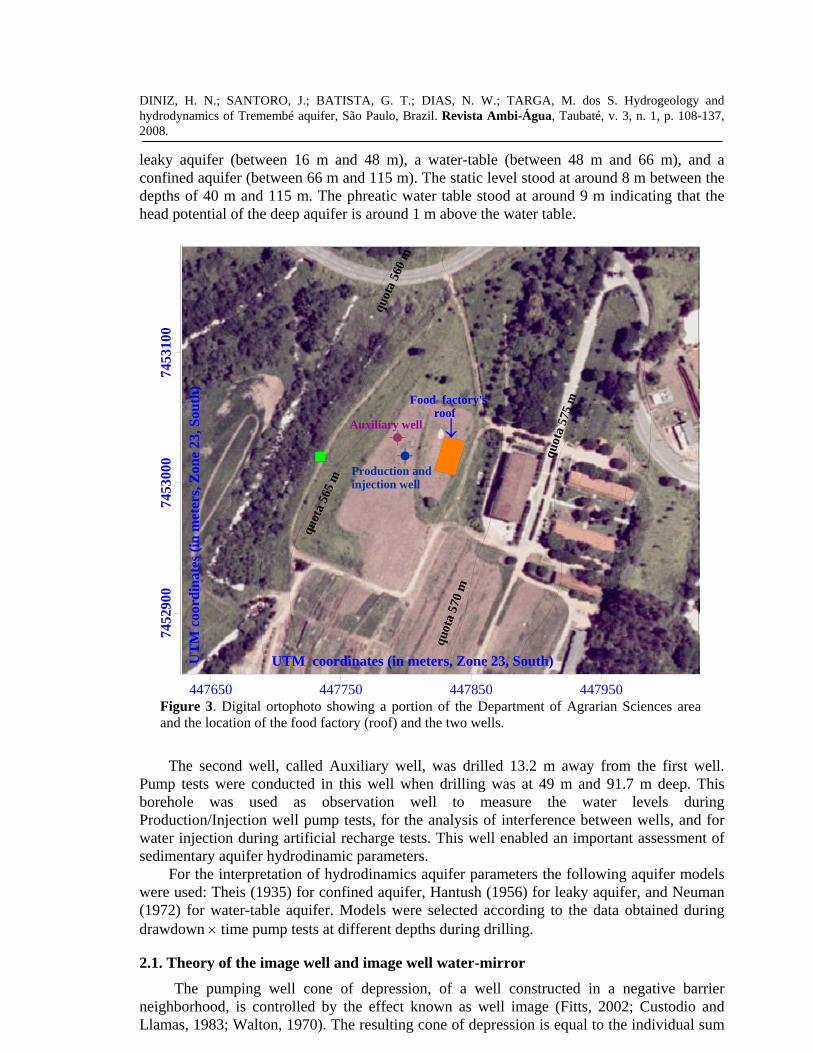
The Extracting/Injection well was built at 19.5 m of a food factory building that belong to the Department of Agrarian Sciences, and 3 m below the building’s floor quota (Figure 3).
The data obtained with the pump tests indicate that the aquifer has the following characteristics (in sequence): unconfined, leaky, water-table, and confined. The first saturated sedimentary sequence was an unconfined aquifer (between 9 m and 16 m), followed by a
DINIZ, H. N.; SANTORO, J.; BATISTA, G. T.; DIAS, N. W.; TARGA, M. dos S. Hydrogeology and hydrodynamics of Tremembé aquifer, São Paulo, Brazil. Revista Ambi-Água, Taubaté, v. 3, n. 1, p. 108-137, 2008.
113
leaky aquifer (between 16 m and 48 m), a water-table (between 48 m and 66 m), and a confined aquifer (between 66 m and 115 m). The static level stood at around 8 m between the depths of 40 m and 115 m. The phreatic water table stood at around 9 m indicating that the head potential of the deep aquifer is around 1 m above the water table.
447650 447750 447850 447950
UTM coordinates (in meters, Zone 23, South)
7452
900
7453
000
7453
100
UT
M c
oord
inat
es (i
n m
eter
s, Z
one
23, S
outh
)
Auxiliary well
Production and injection well
Food factory's roof
quot
a 56
0 m
quot
a 56
5 m
quot
a 57
0 m
quot
a 57
5 m
Figure 3. Digital ortophoto showing a portion of the Department of Agrarian Sciences area and the location of the food factory (roof) and the two wells.
The second well, called Auxiliary well, was drilled 13.2 m away from the first well.
Pump tests were conducted in this well when drilling was at 49 m and 91.7 m deep. This borehole was used as observation well to measure the water levels during Production/Injection well pump tests, for the analysis of interference between wells, and for water injection during artificial recharge tests. This well enabled an important assessment of sedimentary aquifer hydrodinamic parameters.
For the interpretation of hydrodinamics aquifer parameters the following aquifer models were used: Theis (1935) for confined aquifer, Hantush (1956) for leaky aquifer, and Neuman (1972) for water-table aquifer. Models were selected according to the data obtained during drawdown × time pump tests at different depths during drilling.
2.1. Theory of the image well and image well water-mirror
The pumping well cone of depression, of a well constructed in a negative barrier neighborhood, is controlled by the effect known as well image (Fitts, 2002; Custodio and Llamas, 1983; Walton, 1970). The resulting cone of depression is equal to the individual sum
DINIZ, H. N.; SANTORO, J.; BATISTA, G. T.; DIAS, N. W.; TARGA, M. dos S. Hydrogeology and hydrodynamics of Tremembé aquifer, São Paulo, Brazil. Revista Ambi-Água, Taubaté, v. 3, n. 1, p. 108-137, 2008.
114
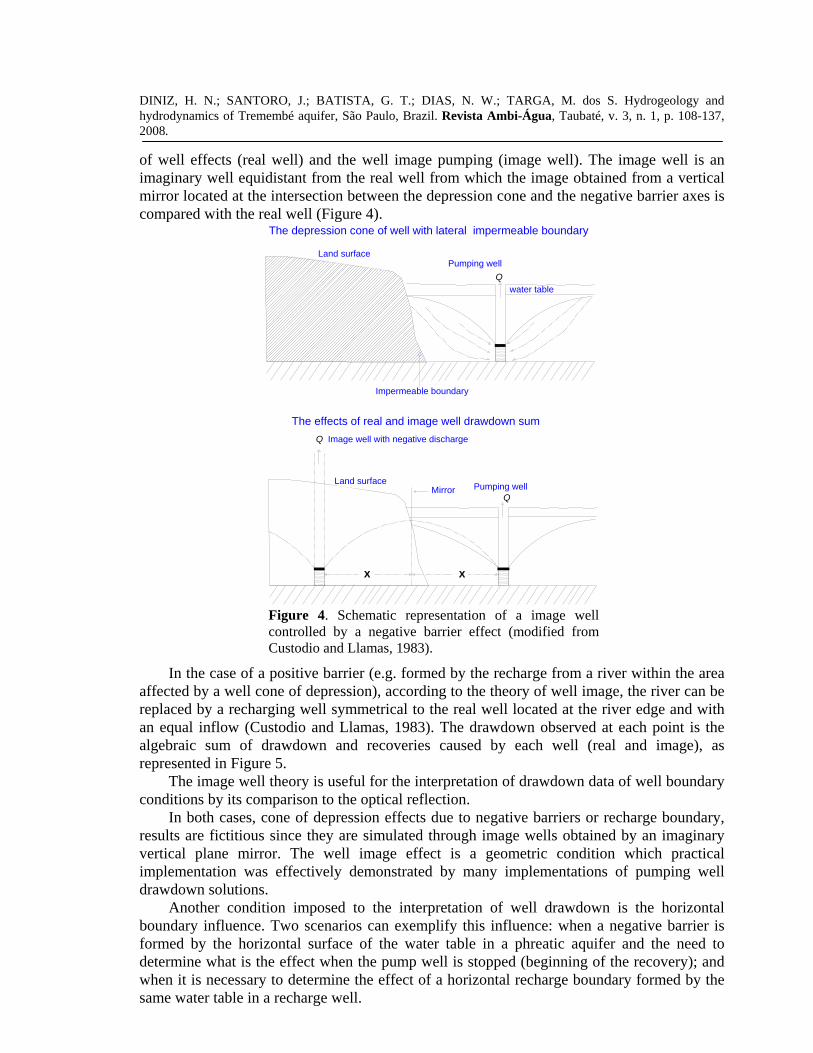
of well effects (real well) and the well image pumping (image well). The image well is an imaginary well equidistant from the real well from which the image obtained from a vertical mirror located at the intersection between the depression cone and the negative barrier axes is compared with the real well (Figure 4).
Impermeable boundary
Land surface
Q
Q
XX
Q
Pumping well
The depression cone of well with lateral impermeable boundary
The effects of real and image well drawdown sum
Pumping wellLand surface
water table
Image well with negative discharge
Mirror
Figure 4. Schematic representation of a image well controlled by a negative barrier effect (modified from Custodio and Llamas, 1983).
In the case of a positive barrier (e.g. formed by the recharge from a river within the area affected by a well cone of depression), according to the theory of well image, the river can be replaced by a recharging well symmetrical to the real well located at the river edge and with an equal inflow (Custodio and Llamas, 1983). The drawdown observed at each point is the algebraic sum of drawdown and recoveries caused by each well (real and image), as represented in Figure 5.
The image well theory is useful for the interpretation of drawdown data of well boundary conditions by its comparison to the optical reflection.
In both cases, cone of depression effects due to negative barriers or recharge boundary, results are fictitious since they are simulated through image wells obtained by an imaginary vertical plane mirror. The well image effect is a geometric condition which practical implementation was effectively demonstrated by many implementations of pumping well drawdown solutions.
Another condition imposed to the interpretation of well drawdown is the horizontal boundary influence. Two scenarios can exemplify this influence: when a negative barrier is formed by the horizontal surface of the water table in a phreatic aquifer and the need to determine what is the effect when the pump well is stopped (beginning of the recovery); and when it is necessary to determine the effect of a horizontal recharge boundary formed by the same water table in a recharge well.

DINIZ, H. N.; SANTORO, J.; BATISTA, G. T.; DIAS, N. W.; TARGA, M. dos S. Hydrogeology and hydrodynamics of Tremembé aquifer, São Paulo, Brazil. Revista Ambi-Água, Taubaté, v. 3, n. 1, p. 108-137, 2008.
115
In the first scenario, the effect of a negative barrier formed by the horizontal water table of a phreatic aquifer and the effect when the pump well stops can be determined by the resulting effect (cone of ascension) similar to the well cone of depression but inverted by a horizontal mirror. In the second scenario, when the boundaries are in the touchline and when the boundary is horizontal (top of aquifer) the image well theory is also valid.
A
Zero drawdown boundary
Resultant depressed cone
Perennial stream
Aquifer
Aquiclude
Aquiclude
Aquifer
X
Imaginary wellQA
Real profile( resultant )
Q
Idealized groundwater profile
Real groundwater profile
X X
Influence of imaginary well
Combined influence
Imaginary recovery
Effective drawdown
s'
s
The depression cone of well with recharge boundary
Q
Pumping well
cone of depression
Pumping well
Water table
Zero drawdown boundary
Figure 5. Schematic representation of the well image effect when the cone of depression finds a recharge boundary (modified from U.S. Geological Survey, 1977).
Therefore, when the pumping stops the cone of ascension will be symmetrical to the cone of depression but with an inverted image (negative barrier) produced by a well water-mirror. It is symmetrical to the cone of depression but inverted. Thus, the recharge rate is equal to the discharge rate with changed signal (Figure 6).

DINIZ, H. N.; SANTORO, J.; BATISTA, G. T.; DIAS, N. W.; TARGA, M. dos S. Hydrogeology and hydrodynamics of Tremembé aquifer, São Paulo, Brazil. Revista Ambi-Água, Taubaté, v. 3, n. 1, p. 108-137, 2008.
116
Land surface
Aquitarde
Water level (barrier - mineral and air)
Virtual depressed cone
Q
Land surface
Aquitarde
Water level (recharge boundary)
Real recovery cone
Q
Natural water table
Profile during pumping (image well)
Profile during recovery (real well)
Natural water table
mineral and air
mineral and water
mineral and water
Figure 6. The well cone of ascension after well pumping stopped and the effect of an image well water-mirror.
When water injection occurs in a recharge well (phreatic aquifer) the water table effect is a positive barrier to the cone of ascension. The resulting effect is a cone symmetrical to the cone of depression for an equal discharge rate, but with opposite sign, reflected in a water-mirror (horizontal plane mirror), as represented in Figure 7.
The image well water-mirror (horizontal mirror) theory has two important applications: 1) In the analysis of pump tests results – recovery × time data (real cone of ascension) will be similar to the drawdown × time data (virtual well – image well water-mirror), thus all methods used in the analysis of well hydraulics are applicable, such as Theis (1935) for confined aquifers, Hantush (1956) for leaky aquifers, and Neuman (1972) for water table aquifers with delayed drainage. In this scenario the situation is analogous to the descriptive geometry theory of projection planes for a line-of-sight. 2) In the analysis of well hydraulics – usually this analysis when applied to pump tests uses models that consider the discharge rate constant. In reality this rarely happens because during well pumping water level lowering occurs and, consequently, the hydraulic potential varies affecting the efficiency of the extraction equipment so that the discharge rate decreases over time. This effect,

DINIZ, H. N.; SANTORO, J.; BATISTA, G. T.; DIAS, N. W.; TARGA, M. dos S. Hydrogeology and hydrodynamics of Tremembé aquifer, São Paulo, Brazil. Revista Ambi-Água, Taubaté, v. 3, n. 1, p. 108-137, 2008.
117
however, doesn’t occur during recovery because well flow rate restoration is equivalent to the average pump test discharge rates. Therefore, the use of pump test recovery data rather than pump test drawdown data is more accurate for the interpretation of aquifer hydraulic parameters.
Image well
Recharge well
Land surface
Aquitarde
Q
Recharge cone
Water level
Virtual depressed cone
QEffective rechargeboundary
Natural water table
mineral and air
mineral and water
mineral andwater
Figure 7. Well image recharge effect representation with positive barrier boundary.
The average discharge rate (equal to the injection rate with an opposite signal) is given by Equation [1]:
total
11)(
t
ttQQ
ni
iiii
m
∑=
=−−⋅
= Eq. [1]
where Qi is the discharge rate obtained for a period equal to ti - ti-1 and ttotal is the total pump test time.
2.2. Well interference For an aquifer considered infinite the well pumping discharge rate comes from a circular
area whose radius (r) is known as the well radius of influence. The well radius of influence is controlled by the aquifer hydrodynamic parameters
transmissivity (T) and coefficient of storage (S), as shown in Figure 8 (Freeze and Cherry, 1979). Another important variable is the discharge rate.
At any point within the radius of influence the drawdown is given by the following equations:
)(4
uWT
Qsπ
= for confined aquifers (Theis, 1935), Eq. [2]
)B
,(4
ruWT
Qsπ
= for leaky aquifers (Hantush, 1956), Eq. [3]
),,(4
Γ= BA uuWT
Qsπ
for water table aquifers (Neuman, 1972), Eq. [4]

DINIZ, H. N.; SANTORO, J.; BATISTA, G. T.; DIAS, N. W.; TARGA, M. dos S. Hydrogeology and hydrodynamics of Tremembé aquifer, São Paulo, Brazil. Revista Ambi-Água, Taubaté, v. 3, n. 1, p. 108-137, 2008.
118
Radius of influence
High Transmissivity
Radius of influence
Low Storativity
Radius of influence
Radius ofinfluence
Low Transmissivity
High Storativity
t0
t1
Q
t0
t1
t0
t1
t0
t1
Q
Q
Q
Figure 8. Extension and depth of the well radius of influence depending on the aquifer transmissivity and coefficient of storage values.
In the above equations there is a consistent relationship, that is, the direct proportionality
between discharge rate (Q) and transmissivity (T) for any observed drawdown.
When another well is constructed within a well’s radius of influence and pumped, interference occurs between them. In this case each well’s radius of influence (r1 and r2) becomes an intervenient, as represented in Figure 9. Therefore, the effect of one well drawdown (s1), produced by the discharge rate Q1, is added to the radius of influence of the other pumping well’s drawdown (s2) produced by a discharge rate Q2. This results in a total drawdown (s’) that is equal to the sum of s1 and s2.
In pumping tests performed in one well and measurements of dynamic water level made in another well, the application of Equations [2], [3] or [4] is appropriate. Especially for calculating transmissivity (T) since this is an aquifer parameter and not a well specific parameter.
When there is interference between wells, because both are pumping and they are within the radius of influence of each other, in one well there will be a drawdown (s1) due to this well’s pumping and the influence of the other well’s drawdown (s2), caused by the interference. The total well drawdown (s’) is the sum of both, more than only s1.
An interference pump test is done by pumping two wells simultaneously from time t0 and a discharge rate dependent on the equipment power and the dynamic head. In one of the

DINIZ, H. N.; SANTORO, J.; BATISTA, G. T.; DIAS, N. W.; TARGA, M. dos S. Hydrogeology and hydrodynamics of Tremembé aquifer, São Paulo, Brazil. Revista Ambi-Água, Taubaté, v. 3, n. 1, p. 108-137, 2008.
119
pumping wells it could be determined the relationship s’ × t for a constant discharge rate Q’. This discharge rate will be lower than the discharge rate Q obtained without the interference between wells.
Well 2
Well 1
r1
r2
Q'1
Q'2
Well1 radius of influence
Well2 radius of influence
Figure 9. Well interference representation when two wells are constructed within each other’s radius of influence.
This is because, for the same equipment, the dynamic head would be higher due to the lowering water level caused by the influence of the other pumping well and, consequently, by the decreasing efficiency of the pumping equipment.
Values of the relationship s’ × t for the discharge constant rate Q´ when plotted in a logarithmic graphic using methods proposed by Theis given by Equation [2], Hantush given by Equation [3], or Neuman given by Equation [4], considering the characteristic of a given aquifer, the apparent transmissivity (T’) value is obtained. The value of transmissivity is apparent because the drawdown is measured under the influence of the other well interference.
As already mentioned, one relationship is consistent, that is, the direct proportionality between discharge rate and transmissivity value. From this the following can be said:
''
TQ
TQ
= Eq. [5]
where Q and T are obtained for one well during pumping test without interference, while Q’ and T’ are obtained during an interference pumping test.
Thus, Q’ × T = Q × T’. Where Q, T and T´ can be obtained from pump test results interpretation with or without interference, from which Q’ can be determined. The discharge rate Q comes from the aquifer area located within the well radius of influence (r1 for Well 1 in Figure 9). The discharge rate Qi (interference discharge rate) is equal to Q - Q', since this discharge comes from the water contained within the aquifer circular area located between one well and its interfering well. The discharge rate Qi is related to the aquifer area whose radius is equal to the distance between the wells (see Figure 9).

DINIZ, H. N.; SANTORO, J.; BATISTA, G. T.; DIAS, N. W.; TARGA, M. dos S. Hydrogeology and hydrodynamics of Tremembé aquifer, São Paulo, Brazil. Revista Ambi-Água, Taubaté, v. 3, n. 1, p. 108-137, 2008.
120
3. RESULTS AND DISCUSSION 3.1. Wells drilling
The Production/Injection well was built at the site of UTM coordinates E 447798 m and N 7453025 m, Zone 23, South. The well design and geological log are shown in Figure 10.
The construction of this well had several problems, especially related to the geological characteristics of the drilled terrain. As the soil is composed predominantly by sandy material with little cohesion and high porosity it absorbed large amount of perforation fluid (water and bentonite) causing collapses as drilling progressed.
To prevent loss from borehole collapses, the drilling started with large-diameter (φ = 24”) down to 5.60 m depth, then, φ = 17” down to 16 m depth. Additionally, a steel pipe with φ = 15” and thickness of 1/8” was introduced to prevent collapses. The space between the 17” diameter borehole and the external pipe surface of φ = 15” was filled with cement grout. Thus, the entire geological section where the phreatic aquifer occurs, from 7.8 m (depth of the water table) to 16 m (maximum depth of the soil) was completely isolated, preventing the mixing of phreatic and confined aquifer waters. From 16 m down to 48 m the well was drilled with 14” steel drill bit. Between 48 m and 52.5 m, the well was drilled with a 10” drill bit. After this depth down to 115 m, an 8” drill bit was used. Borehole collapse and fragments fall occurred between 87 m and 115 m. Thus, the well was protected with 8” and 6” PVC pipes and mechanic filtering tubes down to 87.1 m depth. Between 87.1 m and 115 m depth, fragment falls filled the borehole.
An Auxiliary well was built 13.2 m away from the Extracting/Injection well. The Auxiliary well design and the geological log are shown in Figure 11. For the Auxiliary well construction the same method employed in the drilling of the Production/Injection well was used. Thus, to avoid loss of drilling fluid and borehole fragment falls, a large diameter (φ = 24”) drill bit was used down to 5 m and the extent of the borehole was secured by iron rings welded one after the other. After completing this path, the drilling progressed with a bit of 17” in diameter down to the depth of 13.66 m, and a steel pipe of φ = 15” and thickness of 1/8" was inserted into the borehole. The empty space was filled with cement grout. Thus, the entire geological section, where the phreatic aquifer occurs (beginning at 7.8 m depth of the water table down to 13.66 m that was the maximum depth of the soil at this site, has been completely isolated, preventing the mixing of phreatic and confined aquifer waters.
The drilling continued down to 64.26 m depth, in the Tertiary sediments of Tremembé formation, using a bit of φ = 10”. After a trial to perform the hydraulic characteristics of the sedimentary aquifer, a collapse of this sedimentary layer occurred. Thus, a reopening of the borehole with φ = 14” rotating drill bit was performed down to 18.1 m depth.
From 0.67 m above the ground surface down to 19.1 m depth, a steel pipe with φ = 10" and 1/4" thickness was introduced. At 18.1 m deep, a holding tab (φ = 14”) was welded to hold the 10” internal pipes.
The drilling continued to 91.3 m depth and the extent between 47.7 m to 64.63 m was protected with PVC pipes (φ = 8”), and the interval between 51.03 m to 91.03 m with pipes and screens (PVC, φ = 6”). The opening of screen slots was 0.75 mm and filter pack of 1 to 5 mm.

DINIZ, H. N.; SANTORO, J.; BATISTA, G. T.; DIAS, N. W.; TARGA, M. dos S. Hydrogeology and hydrodynamics of Tremembé aquifer, São Paulo, Brazil. Revista Ambi-Água, Taubaté, v. 3, n. 1, p. 108-137, 2008.
121
Production and injection well log
0
16
Soil
Depth (meters)
22
Sandstone
24.2
3435.5
57
95.497.5
100.1
104.1
107.2
111
115
Clayey shale
Sandstone
Sandstone
Layers sequence:shale, sandstoneand clayey shale
Sandstone
Shale
Clayey shale
Sandstone
Shale
Clayey shale
Clayey shale
Lithologic simbology
Tertiary TremembéFormation sediments
Figure 10. Agrarian Sciences Department of Taubaté University Production/Injection well design and geologic log.

DINIZ, H. N.; SANTORO, J.; BATISTA, G. T.; DIAS, N. W.; TARGA, M. dos S. Hydrogeology and hydrodynamics of Tremembé aquifer, São Paulo, Brazil. Revista Ambi-Água, Taubaté, v. 3, n. 1, p. 108-137, 2008.
122
0 m
5 m
13.66m
18.1 m19.1 m
64.26 m64.63 m
+0.67 m Land surface
Inner casing, cementgrout (4 bags)
1m
Inner casing thickness 6 mm, Ø = 10"
Cement grout (4 bags)
47.07 m
Geomechanic PVC standardcasing, Ø = 8"
Cement grout(11 bags)
Inner casing thickness6 mm, Ø = 8"
Soil
TertiaryTremembéFormationsediments
24"
17"
15"
14"
10"
8"
Inner
PVC
Cement grout (15 bags)
51.03 m
91,03m
Geomechanic PVC standardcasing, Ø = 6"
67.03 m
Geomechanic PVC well screen ,Ø = 6"
87.03 m
PVC
PVC
PVC
6"
Gravel pack
Inner casingthickness 3 mm, Ø = 15"
Horizontal scale = 30 x vertical scale
Geomechanic PVC casing,Ø = 6"
Lithologic simbology0
18.1
22.4
34.235.2
Depth (meters)
Soil
SandstoneClayey shale
Sandstone
Sandstone
Layers sequence:shale,
sandstone and clayey shale
24.926.227.6
45.5
48
51.251.6
57
59
63
67.368.8
71.3
75.9
80.9
84.9
91.7
Clayey shale
Sandstone
Clayey shale
shale and clayey shale
Sandy limestone
Sandstone
Clayey shale and sandstone
Sandy conglomerate
Sandstone and shale
Argillaceous shale
Sandstone
Argillaceous limestone
Conglomerate
Sandstone and clayey shale
Argillaceous limestone,sandstoneand argillaceoussiltstone
Auxiliary well log
Figure 11. Agrarian Sciences Department of Taubaté University Auxiliary well design and geologic log.
3.2. Geological characteristics The dominant soil type in the Una river hydrographic basin is the red yellow latosol
(argisol) with thickness varying from 10 m in the floodplains up to 20 m in the hill tops. The soil profile is composed of fine to coarse sand from the surface down to 1 m; by sandy clay loam from 1 to 2 m; and by fine to coarse sand from 2 m to the maximum soil depth. In the Production/Injection well the latosol extended down to 16 m depth.

DINIZ, H. N.; SANTORO, J.; BATISTA, G. T.; DIAS, N. W.; TARGA, M. dos S. Hydrogeology and hydrodynamics of Tremembé aquifer, São Paulo, Brazil. Revista Ambi-Água, Taubaté, v. 3, n. 1, p. 108-137, 2008.
123
Underneath the soil, the Taubaté basin Tertiary sediments occur until, at least, the depth of Production/Injection well (115 m). It is characterized by a succession of Tertiary layers formed by river and lake depositions during a semi-arid climate. The layers are comprised of shale, argillaceous limestone, calcareous and quartzitic sandstone, and conglomerate (Figures 10 and 11).
In the Production/Injection well, from 16 to 57 m depth, horizontal layers of Tremembé Formation Tertiary sandstones (Taubaté Group) predominantly occurs, formed during a fluvial depositional environment. Between 57 m to 115 m, deposits of clayey shale dominate. However, they are intercalated with quartzitic micaceous sandstone and argillaceous shale formed in depositional environment originated from lakes with a lot of submerged animal and plant life. This explains the black organic matter found in the argillaceous shale layers.
3.3. Hydrogeologic characterization During the Production/Injection well construction, an initial pump test was conducted at
the depth of 48 m (Figure 12). The pump test data showed that the aquifer was leaky according to Hantush (1956) and was supplied from the aquitarde storage, an argillaceous sandstone layer located at a high aquifer level, and there was dynamic water level stabilization with 1.028 m3/h pumping rate. Measured transmissivity was 0.58 m2/h.
1 10 100 1000 10000 1000000,1
1
10r/B = 0
r/B = 0.1r/B = 0.15
r/B = 0.4r/B = 0.2
Hantush Type Curves
W(u
,r/B)
1/u
1 10 100 1000 100000,01
0,1
1
Calculating the leaky confined well functions = Q K0(r/B)/2π Ts = Q 1.7527/2 π 0.58s = 0.48 Q
Calculating the transmissivitys = Q W(u,r/B)/4 π T0.14 = 1.028/4π.T
T = 0.58 m2/h
r/B = 0.6
Match pointW(u,r/B) = 11/u = 1000s = 0.14 meterst = 33 minutesr/B = 0.2
Extraction and injection well pump test on April 3, 2006, with 48 meters depth
Dra
wdo
wn
(m)
Time in minutes since the pumping started
Figure 12. Interpretation of pump test data conducted during the perforation of the Production/Injection well at 48 m depth.
A second pump test was conducted when the borehole was at 66 m (Figure 13). This pump test had the purpose of checking possible hydrogeological variations given that the water level rose while the perforation went from 48 m to 66 m, what indicates a clear change in aquifer behavior. The field drawdown data indicated that the aquifer changed its behavior, from leaky to delayed gravity response (Neuman, 1972), but the value of transmissivity did not change (0.58 m2/h).
From the depth of this pump test (66 m) down to the final depth of the borehole (115 m) sandstones with intercalations of argillaceous shale occur and form aquicludes that confine the aquifer layers. The well was completed with 87.1 m and the interpretation of the final

DINIZ, H. N.; SANTORO, J.; BATISTA, G. T.; DIAS, N. W.; TARGA, M. dos S. Hydrogeology and hydrodynamics of Tremembé aquifer, São Paulo, Brazil. Revista Ambi-Água, Taubaté, v. 3, n. 1, p. 108-137, 2008.
124
pump test (Figure 14) shows that the aquifer type changed to confined with 8 m2/h of transmissivity and 0.002 of coefficient of storage.
1E-3
0,01
0,1
1
10
10010-1 100 101 102 103 104 105
1/uA
Γ = 0,001 Γ = 0,01 Γ = 0,06 Γ = 0,2 Γ = 0,6 Γ = 1 Γ = 2 Γ = 4 Γ = 6
W(u
A,uB,Γ
)
10-5 10-4 10-3 10-2 10-1 100 101 102 103 104
Production and injection well drawdown pump test on April 28, 2006, with 66meters depth and 6.83 meters of the static water level
Neuman method, delayed drainage type B curves
Match point Bs = 2.5 meterst = 7.7 minutesW(uA, uB, Γ) = 11/uB = 0.1
s = 2.5 mW(uA, uB, Γ) = 1
Q = 18 m3/hs = Q W(uA, uB, Γ) / 4π T
T = 0.58 m2/h
1/ub
1 10 100 1000 100000,1
1
10
Dra
wdo
wn
(m)
Time in minutes
Figure 13. Matching late drawdown data to a type B curve (water-table aquifer).
The Production/Injection well, with the hydraulics characteristics, shown in Figure 14,
can provide a very good discharge rate. For example, if the well is continuously pumped at 120 m3/h rate, after 2 years the dynamic level will be 35 m, or equal to the static level (8.33 m) plus the drawdown (26.59 m, Eq. 5) obtained from the Cooper and Jacob (1946) equation, therefore 8.33 + 26.59 = 34.92 ≅ 35 m.
The drawdown above was calculated as described: r = 14”/2 = 7” = 0.18 m; and t = 2 years = 2 × 365 days × 24 hours/day = 17520 hours.
( )mss
SrtT
TQ
s 59.26002.018.0
17520825.2log84
1203.225.2log
43.2
22 =⇒⎟⎟⎠
⎞⎜⎜⎝
⎛
⋅⋅⋅
⋅⋅
=⇒⎟⎟⎠
⎞⎜⎜⎝
⎛=
ππ Eq. [6]

DINIZ, H. N.; SANTORO, J.; BATISTA, G. T.; DIAS, N. W.; TARGA, M. dos S. Hydrogeology and hydrodynamics of Tremembé aquifer, São Paulo, Brazil. Revista Ambi-Água, Taubaté, v. 3, n. 1, p. 108-137, 2008.
125
1 10 100 1000 10000 100000 1000000 1E70,1
1
10
100
Theis Type Curve Confined Aquifer
W(u
)
1/u
1 10 100 1000 100001
10
100
Production and injection well drawdown data point on October 17, 2006
1/u = 4 T t /r2 S
S = 4 T t /r2 1/u
S = 2 x 10⁻³
Q = 44.47 m3/hT = Q W(u)/4π sT = 44.47 x 10/4π x 4.43
T = 8 m2/h
r = 0.18 m
r2 = 0.032 m2
Q = 44.47 m3/h
T = 8 m2/hS = 0.002
Match pointt = 120 minutest = 2 hourss = 4.43 meters1/u = 1000000W(u) = 10
Dra
wdo
wn
(m)
Time in minutes after the pumping started
Figure 14. Interpretation of the final pump test data of Production /Injection well.
3.4. Advanced hydrogeological characterization After completion of the Production/Injection and Auxiliary wells, several pump tests
were conducted in July and August, 2007. Interpretation of a pump test in the Production/Injection well with constant discharge rate of 36 m3/h and measurement of dynamic water level in the Production/Injection well is shown in Figure 15. Figure 16 shows the drawdown at the Auxiliary well.
1 10 100 1000 10000 100000 1000000 1E70,1
1
10
100
Theis Type Curve Confined Aquifer
W(u
)
1/u
1 10 100 1000 100001
10
100
Production and injection well (pumping well) drawdown data point on July 25, 2007,in Taubate University Departament of Agronomy pump test
1/u = 4 T t /r2 S
S = 4 T t /r2 x 1/uS = 0.00052
Q = 36 m3/hT = Q W(u)/4π sT = 36 x 10/4π 5.4
T = 5.3 m2/h
r = 1 m
r2 = 1 m2
Q = 36 m3/h
T = 5.3 m2/hS = 0.00052
Match pointt = 14.8 minutest = 0.247 hourss = 5.4 meters1/u = 10000W(u) = 10
Dra
wdo
wn
(m)
Time in minutes after the pumping started
Figure 15. Interpretation of pump test conducted in the Production/ Injection well with drawdown data measured at the same pumped well.

DINIZ, H. N.; SANTORO, J.; BATISTA, G. T.; DIAS, N. W.; TARGA, M. dos S. Hydrogeology and hydrodynamics of Tremembé aquifer, São Paulo, Brazil. Revista Ambi-Água, Taubaté, v. 3, n. 1, p. 108-137, 2008.
126
1 10 100 1000 10000 100000 1000000 1E70,1
1
10
100
Theis Type Curve Confined AquiferW
(u)
1/u
1 10 100 1000 100001
10
100
Auxiliary well (observation well) drawdown data point on July 18, 2007,of the Production and injection well pump test
1/u = 4 T t /r2 S
S = 4 T t /r2 x 1/u
S = 3.6 x 10⁻⁴
Q = 36 m3/hT = Q W(u)/4π sT = 36 x 10/4π 3.63
T = 7.89 m2/h
r = 13,2 m
r2 = 174.24 m2
Q = 36 m3/h
T = 7.89 m2/hS = 0.00036
Match pointt = 776 minutest = 19.93 hourss = 3.63 meters1/u = 10000W(u) = 10
Dra
wdo
wn
(m)
Time in minutes after the pumping started
Figure 16. Interpretation of pump test conducted in the Production/Injection well with drawdown data measured at the auxiliary well (observation well) 13.2 m away.
1 10 100 1000 10000 100000 1000000 1E70,1
1
10
100Theis Type Curve Confined Aquifer
W(u
)
1/u
1 10 100 1000 100001
10
100
Production and injection well (pumping well) recovery data point on July 25, 2007
1/u = 4 T t /r2 S
S = 4 T t /r2 x 1/uS = 0.000027
Q = 36 m3/hT = Q W(u)/4π sT = 36 x 10/4π4.2
T = 6.8 m2/h
r = 1 m
r2 = 1 m2
Q = 36 m3/h
T = 6.8 m2/hS = 0.000027
Match pointt = 6.3 minutest = 0.105 hourss = 4.2 meters1/u = 100000W(u) = 10
Reco
very
(m)
Time in minutes after the pumping stopped
Figure 17. Interpretation of recovery test conducted in the Production/Injection well with recovery data measured at the same well pumped.
DINIZ, H. N.; SANTORO, J.; BATISTA, G. T.; DIAS, N. W.; TARGA, M. dos S. Hydrogeology and hydrodynamics of Tremembé aquifer, São Paulo, Brazil. Revista Ambi-Água, Taubaté, v. 3, n. 1, p. 108-137, 2008.
127
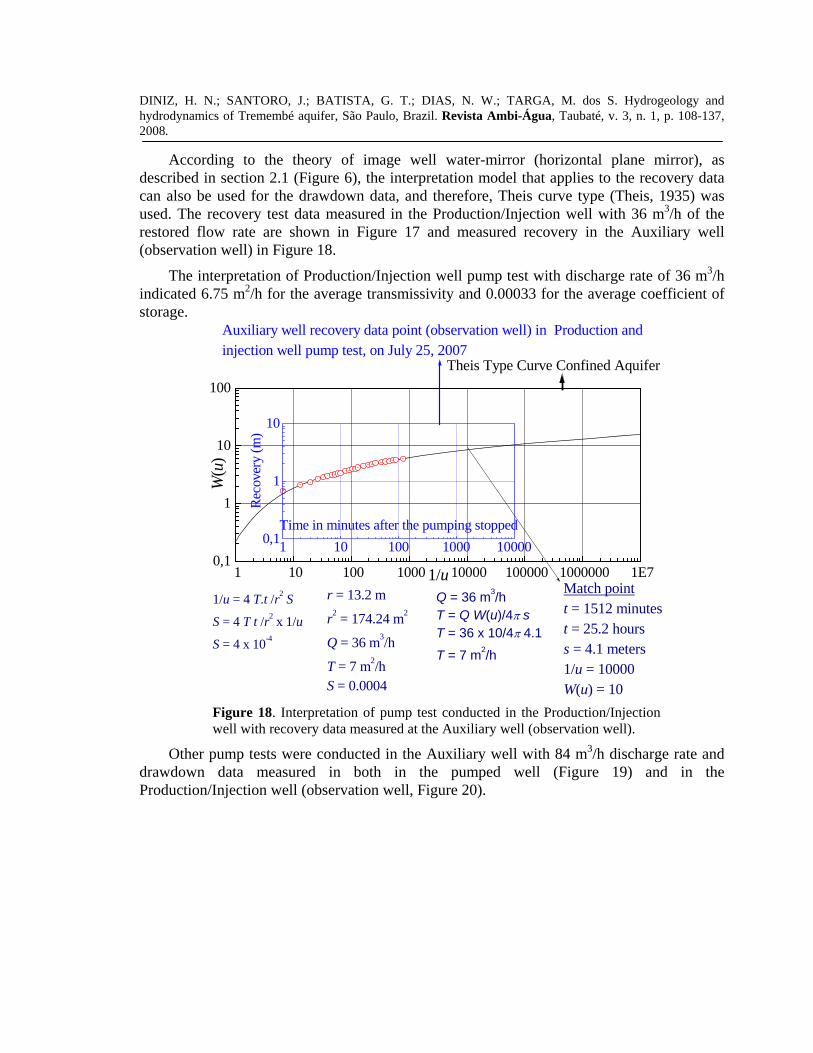
According to the theory of image well water-mirror (horizontal plane mirror), as described in section 2.1 (Figure 6), the interpretation model that applies to the recovery data can also be used for the drawdown data, and therefore, Theis curve type (Theis, 1935) was used. The recovery test data measured in the Production/Injection well with 36 m3/h of the restored flow rate are shown in Figure 17 and measured recovery in the Auxiliary well (observation well) in Figure 18.
The interpretation of Production/Injection well pump test with discharge rate of 36 m3/h indicated 6.75 m2/h for the average transmissivity and 0.00033 for the average coefficient of storage.
1 10 100 1000 10000 100000 1000000 1E70,1
1
10
100
W(u
)
1/u
1 10 100 1000 100000,1
1
10
Theis Type Curve Confined Aquifer
Auxiliary well recovery data point (observation well) in Production andinjection well pump test, on July 25, 2007
1/u = 4 T.t /r2 S
S = 4 T t /r2 x 1/u
S = 4 x 10⁻⁴
Q = 36 m3/hT = Q W(u)/4π sT = 36 x 10/4π 4.1
T = 7 m2/h
r = 13.2 m
r2 = 174.24 m2
Q = 36 m3/h
T = 7 m2/hS = 0.0004
Match pointt = 1512 minutest = 25.2 hourss = 4.1 meters1/u = 10000W(u) = 10
Reco
very
(m)
Time in minutes after the pumping stopped
Figure 18. Interpretation of pump test conducted in the Production/Injection well with recovery data measured at the Auxiliary well (observation well).
Other pump tests were conducted in the Auxiliary well with 84 m3/h discharge rate and drawdown data measured in both in the pumped well (Figure 19) and in the Production/Injection well (observation well, Figure 20).

DINIZ, H. N.; SANTORO, J.; BATISTA, G. T.; DIAS, N. W.; TARGA, M. dos S. Hydrogeology and hydrodynamics of Tremembé aquifer, São Paulo, Brazil. Revista Ambi-Água, Taubaté, v. 3, n. 1, p. 108-137, 2008.
128
1 10 100 1000 10000 100000 1000000 1E70,1
1
10
100
Theis Type Curve Confined Aquifer
W(u
)
1/u
1 10 100 1000 100001
10
100
Auxiliary well drawdown (pumping well) on July 18, 2007
1/u = 4 T t /r2 S
S = 4 T t /r2 x 1/uS = 0.0004
Q = 84 m3/hT = Q W(u)/4π sT = 84 x 10/4π 5.71
T = 11.7 m2/h
r = 1 m
r2 = 1 m2
Q = 84 m3/h
T = 11.7 m2/hS = 0.0004
Match pointt = 5.05 minutest = 0.084 hourss = 5.71 meters1/u = 10000W(u) = 10
Dra
wdo
wn
(m)
Time in minutes after the pumping started
Figure 19. Interpretation of pump test conducted in the Auxiliary well with 84 m3/h discharge rate and drawdown measured in the same pumped well.
1 10 100 1000 10000 100000 1000000 1E70,1
1
10
100Theis Type Curve Confined Aquifer
W(u
)
1/u
1 10 100 1000 100001
10
100
Production and injection well drawdown data point (observation well)of the Auxiliary well pump test, on July 18, 2007
1/u = 4T t /r2 S
S = 4 T t /r2 x 1/u
S = 1,5 x 10⁻³
Q = 84 m3/hT = Q W(u)/4π sT = 84 x 10/4π 7.58
T = 8.81 m2/h
r = 13.2 m
r2 = 174,24 m2
Q = 84 m3/h
T = 8.81 m2/hS = 0.0015
Match pointt = 4713 minutest = 78.55 hourss = 7.58 meters1/u = 10000W(u) = 10
Dra
wdo
wn
(m)
Time in minutes after the pumping started
Figure 20. Interpretation of pump test conducted in the Auxiliary well with 84 m3/h discharge rate and drawdown measured in the Production/Injection well (observation well).

DINIZ, H. N.; SANTORO, J.; BATISTA, G. T.; DIAS, N. W.; TARGA, M. dos S. Hydrogeology and hydrodynamics of Tremembé aquifer, São Paulo, Brazil. Revista Ambi-Água, Taubaté, v. 3, n. 1, p. 108-137, 2008.
129
The recovery data in the Auxiliary well (pumped well) test are shown in Figure 21 and in the Production/Injection well (observation well) are shown in Figure 22.
1 10 100 1000 10000 100000 1000000 1E70,1
1
10
100
Theis Type Curve Confined AquiferW
(u)
1/u
1 10 100 1000 100001
10
100
Auxiliary well (pumped well) recovery data point on July 18, 2007
1/u = 4 T t /r2 S
S = 4 T t /r2 x 1/uS = 0.0028
Q = 84 m3/hT = Q W(u)/4π sT = 84 x 10/4π 6.86
T = 9.74 m2/h
r = 1 m
r2 = 1 m2
Q = 84 m3/h
T = 9.74 m2/hS = 0.0028
Match pointt = 43.98 minutest = 0.733 hourss = 6.86 m1/u = 10000W(u) = 10
Reco
very
(m)
Time in minutes after the pumping stopped
Figure 21. Interpretation of pump test conducted in the auxiliary well with 84 m3/h ground water inflow rates and recovery data measured in the same well (extraction well).
1 10 100 1000 10000 100000 1000000 1E70,1
1
10
100
Theis Type Curve Confined Aquifer
W(u
)
1/u
1 10 100 1000 100001
10
100
Time in minutes after the pumping stopped
Production and injection well recovery data point (observation well) inAuxiliary well pump test, on July 18, 2007
1/u = 4 T t /r2 S
S = 4 T t /r2 x 1/u
S = 5.3 x 10⁻³
Q = 84 m3/hT = Q W(u)/4π sT = 84 x 10/4π 7.52
T = 8.9 m2/h
r = 13,2 m
r2 = 174,24 m2
Q = 84 m3/h
T = 8.9 m2/hS = 0.0053
Match pointt = 1751 minutest = 23.53 hourss = 7.52 meters1/u = 10000W(u) = 10
Rec
over
y (m
)
Figure 22. Interpretation of pump test conducted in the auxiliary well with 84 m3/h ground water inflow rates and recovery data measured in the Production/Injection well (observation well).

DINIZ, H. N.; SANTORO, J.; BATISTA, G. T.; DIAS, N. W.; TARGA, M. dos S. Hydrogeology and hydrodynamics of Tremembé aquifer, São Paulo, Brazil. Revista Ambi-Água, Taubaté, v. 3, n. 1, p. 108-137, 2008.
130
The interpretation of pump tests data with discharge rate of 84 m3/h in the Auxiliary well, indicated 9.8 m2/h for the average transmissivity and 0.0025 for the average coefficient of storage.
The higher values found for both transmissivity and coefficient of storage for a higher discharge rate demonstrate that when groundwater extraction increases other aquifer layers contribute to discharge rate, because the Tremembé Aquifer is confined with multi-layers (sandstone layers intercalated with argillaceous shale).
3.5. Artificial recharge tests After the pump tests in the Production/Injection well and Auxiliary well were conducted
on July 26, 2007, a recharge test in the Auxiliary well, with ascent water level (water injection) and drawdown (water injection stopped) was performed in both recharge wells, Auxiliary well and Production/Injection well.
The recharge test was conducted by pumping water from a container of 15.4 m3 that was filled with water previously extracted from the well at 27 m3/h recharge rate for 30 minutes (Figure 23).
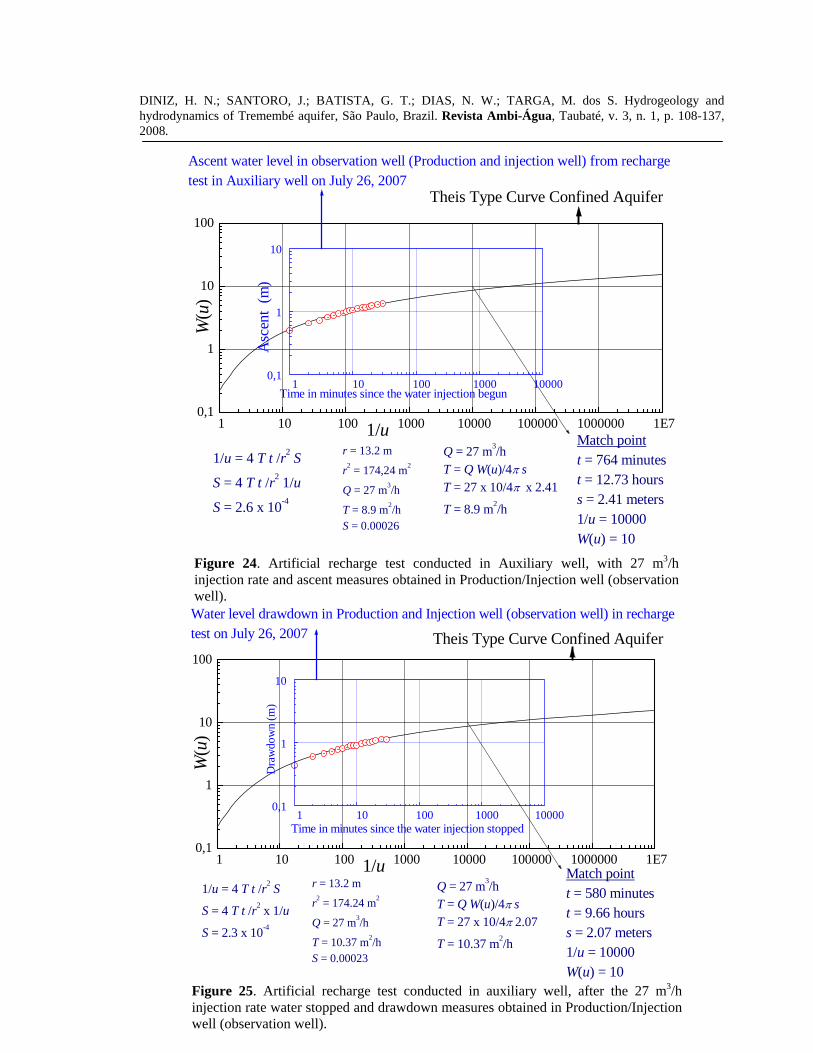
According to the theory of image well shown in Figure 7 (section 2.1), during water injection (recharge rate = - Q) in a tubular deep well, the water level acts as a positive barrier and the increasing cone of the recharge water is equal to the cone of depression (discharge rate = Q) as an image reflected in a water-table mirror (horizontal mirror plane). Thus, for rise level data or drawdown after the water recharge stopped, the Theis model can be used for hydrodynamics’ parameter determination when the aquifer is confined.
Data from rising water level observed in the Production/Injection well, with water injection in the Auxiliary well, are shown in Figure 24. And the drawdown data in the Production/Injection well, after the water injection stopped, are shown in Figure 25. Hydrodynamic parameters obtained during artificial recharge tests in the Tremembé Aquifer in the Department of Agrarian Sciences, University of Taubaté, are quite consistent with those obtained by pump tests.
1 10 100 1000 10000 100000 1000000 1E70,1
1
10
100
W(u
)
1/u1 10 100 1000 10000
0,1
1
10
Theis Type Curve Confined AquiferAscent water-level in recharge well (Auxiliary well), artificial recharge test on July 26, 2007
1/u = 4.T t /r2 S
S = 4 T t /r2 x 1/u
S = 3.4 x 10⁻⁴
Q = 27 m3/hT = Q W(u)/4π sT = 27 x 10/4π x 4
T = 5.37 m2/h
r = 0.1 m
r2 = 0.01 m2
Q = 27 m3/h
T = 5.37 m2/hS = 0.00034
Match pointt = 10 minutest = 0.16 hourss = 4 meters1/u = 1000000W(u) = 10
Asc
ent (
m)
Time in minutes since the water injection begun
Figure 23. Artificial recharge test conducted in Auxiliary well, with 27 m3/h injection rate and ascent measures obtained in the same well (auxiliary well).
DINIZ, H. N.; SANTORO, J.; BATISTA, G. T.; DIAS, N. W.; TARGA, M. dos S. Hydrogeology and hydrodynamics of Tremembé aquifer, São Paulo, Brazil. Revista Ambi-Água, Taubaté, v. 3, n. 1, p. 108-137, 2008.
131
1 10 100 1000 10000 100000 1000000 1E70,1
1
10
100W
(u)
1/u
1 10 100 1000 100000,1
1
10
Theis Type Curve Confined Aquifer
Ascent water level in observation well (Production and injection well) from rechargetest in Auxiliary well on July 26, 2007
1/u = 4 T t /r2 S
S = 4 T t /r2 1/u
S = 2.6 x 10⁻⁴
Q = 27 m3/hT = Q W(u)/4π sT = 27 x 10/4π x 2.41
T = 8.9 m2/h
r = 13.2 m
r2 = 174,24 m2
Q = 27 m3/h
T = 8.9 m2/hS = 0.00026
Match pointt = 764 minutest = 12.73 hourss = 2.41 meters1/u = 10000W(u) = 10
Asc
ent
(m)
Time in minutes since the water injection begun
Figure 24. Artificial recharge test conducted in Auxiliary well, with 27 m3/h injection rate and ascent measures obtained in Production/Injection well (observation well).
1 10 100 1000 10000 100000 1000000 1E70,1
1
10
100
W(u
)
1/u
1 10 100 1000 100000,1
1
10
Theis Type Curve Confined AquiferWater level drawdown in Production and Injection well (observation well) in rechargetest on July 26, 2007
1/u = 4 T t /r2 S
S = 4 T t /r2 x 1/u
S = 2.3 x 10⁻⁴
Q = 27 m3/hT = Q W(u)/4π sT = 27 x 10/4π 2.07
T = 10.37 m2/h
r = 13.2 m
r2 = 174.24 m2
Q = 27 m3/h
T = 10.37 m2/hS = 0.00023
Match pointt = 580 minutest = 9.66 hourss = 2.07 meters1/u = 10000W(u) = 10
Dra
wdo
wn
(m)
Time in minutes since the water injection stopped
Figure 25. Artificial recharge test conducted in auxiliary well, after the 27 m3/h injection rate water stopped and drawdown measures obtained in Production/Injection well (observation well).

DINIZ, H. N.; SANTORO, J.; BATISTA, G. T.; DIAS, N. W.; TARGA, M. dos S. Hydrogeology and hydrodynamics of Tremembé aquifer, São Paulo, Brazil. Revista Ambi-Água, Taubaté, v. 3, n. 1, p. 108-137, 2008.
132
The potentiometric water level of Tremembé Aquifer is approximately 8 m depth in the wells sites. Applying this value for drawdown in the Cooper and Jacob (1946) equation, a radius of 7” (half-diameter of borehole ⇒ r = 14”/2 = 7” = 0,18 m), and a time of water injection of 24 hours (rainfall of 24 hours), to Equation [7], considering T = 8 m2/h and S = 0,002, shows that the maximum recharge rate by gravity, without extravasation of the injected water, is equal to 60 m3/h.
( )h/m60
002,018,024825,2log
843,28
25,2log
43,2 3
22 =⇒⎟⎟⎠
⎞⎜⎜⎝
⎛
⋅⋅⋅
⋅⋅
=⇒⎟⎟⎠
⎞⎜⎜⎝
SrtT
TQ
sππ
Eq. [7]
In the Taubaté region rarely occurs 24 hour rains with intensities greater than 60 mm. Therefore, with 60 m3/h flow rate, all water can be infiltrated by gravity in a single well, this corresponds to the water collected in a roof area of 24,000 m2 (60 m3/h × 24 h/0,006 m = 24,000 m2). Thus, a well drilled in the region is quite effective for the injection of water captured in 24,000 m2 roofs for artificial recharge of aquifers.
3.5. Wells interference After pump and recharge tests in the Production/Injection and Auxiliary wells, various
tests for measuring interference between the wells were performed on August 8, 2007 (Figures 26, 27, 28 and 29).
The procedure for the interference tests was: pumping begun simultaneously in both wells (Production/Injection and Auxiliary) with maximum flow rate lower than the maximum discharge rate of individual well pump tests and limited by equipment power loss due to interference; and pumping stopped in both wells at the same time to begin the recovery tests in both wells.
100 101 102 103 104 105 106 10710-1
100
101
102
Theis Type Curve Confined Aquifer
W(u
)
1/u
1 10 100 1000 100001
10
100
Production and injection well drawdown data point in the interference pump testwith Auxiliary well, on August 08, 2007
Interference data: Q x T ' = Q' x T or, 36 x 2.88 = Q' x 7.89, thus Q' = 13.14 m3/h
1/u = 4.T.t /r2.S
S = 4.T.t /r2.1/uS = 0.00064
Q = 29 m3/hT = Q.W(u)/4π.sT ' = 29.10/4π.8
T ' = 2,88 m2/h
r = 1 m
r2 = 1 m2
Q = 29 m3/h
T ' = 2.88 m2/hS = 0.00064
Match pointt = 333 minutest = 5.55 hourss = 8 meters1/u = 100000W(u) = 10
Dra
wdo
wn
(m)
Time in minutes after the pumping wells begun
Figure 26. Interference test (Production/Injection well drawdown) during the Production/Injection and Auxiliary wells pumping.

DINIZ, H. N.; SANTORO, J.; BATISTA, G. T.; DIAS, N. W.; TARGA, M. dos S. Hydrogeology and hydrodynamics of Tremembé aquifer, São Paulo, Brazil. Revista Ambi-Água, Taubaté, v. 3, n. 1, p. 108-137, 2008.
133
The radius of influence found for the Production/Injection well pump test (Figure 16) with the obtained hydrodynamic parameters (7.89 m2/h for transmissivity and 0.00036 for coefficient of storage) without interference between wells, and for the time duration of the pumping (13 hours) with 36 m3/h constant discharge rate, is approximately 800 m.
The interference test results of the Production/Injection well drawdown (Figure 26) show that 13.14 m3/h of the total discharge rate of the Production/Injection well pump test, without interference between the wells (36 m3/h), comes from a radial area equal to the distance between the Production/Injection and Auxiliary wells (13.2 m). The withdraw flow rate in that area corresponded to 36.5% of the discharge rate of the Production/Injection well pump test without interference (36 m3/h).
Considering the recovery data obtained in the Production/Injection well during the interference test (Figure 27), the ground water inflow rates in the area of 13.17 m3/h represents 37.8% of the Production/Injection well ground water inflow rates without interference (36 m3/h) as shown in Figure 18.
100 101 102 103 104 105 106 10710-1
100
101
102
W(u
)
1/u
1 10 100 1000 100001
10
100
Time in minutes after the pumping wells stopped
Theis Type Curve Confined Aquifer
Production and injection well recovery data point in the interference recovery testwith Auxiliary well, on August 08, 2007
Interference data: Q x T ' = Q ' x T, thus 36 x 2.56 = Q ' x 7 , or Q ' = 13.17 m3/h
1/u = 4.T.t /r2.S
S = 4.T.t /r2.1/uS = 0,0011
Q = 29 m3/hT = Q.W(u)/4π.sT ' = 29.10/4π.9
T ' = 2.56 m2/h
r = 1 m
r2 = 1 m2
Q = 29 m3/h
T ' = 2,56 m2/hS = 0,0011
Match pointt = 636 minutest = 10.6 hourss = 9 m1/u = 100000W(u) = 10
Reco
very
(m)
Figure 27. Interference test (Production/Injection well recovery test) during the Production/Injection and Auxiliary wells ground water inflow rates.
The radius of influence found for the Auxiliary well pump test (Figure 20) with the obtained hydrodynamic parameters (8.81 m2/h for transmissivity and 0.0015 for coefficient of storage) without interference between wells, and for the pumping time duration (13 hours) with 84 m3/h constant discharge rate, is approximately 415 m.
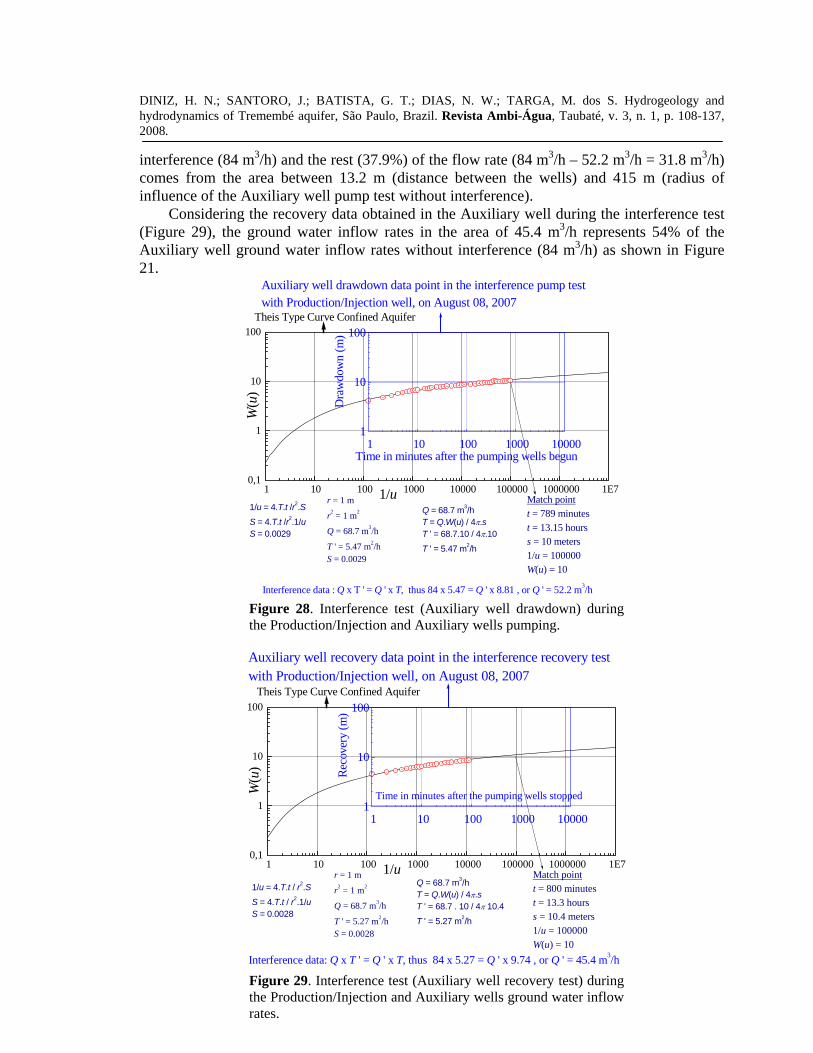
The interference test results of the Auxiliary well drawdown (Figure 28) show that 52.2 m3/h of the total discharge rate of the Auxiliary well pump test, without interference between the wells (84 m3/h), comes from the area whose radius is equal to the distance between the Production/Injection and Auxiliary wells (13.2 m). The flow rate withdraw in the considered area corresponds to 62.1% of the discharge rate of the Auxiliary well pump test without
DINIZ, H. N.; SANTORO, J.; BATISTA, G. T.; DIAS, N. W.; TARGA, M. dos S. Hydrogeology and hydrodynamics of Tremembé aquifer, São Paulo, Brazil. Revista Ambi-Água, Taubaté, v. 3, n. 1, p. 108-137, 2008.
134
interference (84 m3/h) and the rest (37.9%) of the flow rate (84 m3/h – 52.2 m3/h = 31.8 m3/h) comes from the area between 13.2 m (distance between the wells) and 415 m (radius of influence of the Auxiliary well pump test without interference).
Considering the recovery data obtained in the Auxiliary well during the interference test (Figure 29), the ground water inflow rates in the area of 45.4 m3/h represents 54% of the Auxiliary well ground water inflow rates without interference (84 m3/h) as shown in Figure 21.
1 10 100 1000 10000 100000 1000000 1E70,1
1
10
100Theis Type Curve Confined Aquifer
W(u
)
1/u
1 10 100 1000 100001
10
100
Auxiliary well drawdown data point in the interference pump testwith Production/Injection well, on August 08, 2007
Interference data : Q x T ' = Q ' x T, thus 84 x 5.47 = Q ' x 8.81 , or Q ' = 52.2 m3/h
1/u = 4.T.t /r2.S
S = 4.T.t /r2.1/uS = 0.0029
Q = 68.7 m3/hT = Q.W(u) / 4π.sT ' = 68.7.10 / 4π.10
T ' = 5.47 m2/h
r = 1 m
r2 = 1 m2
Q = 68.7 m3/h
T ' = 5.47 m2/hS = 0.0029
Match pointt = 789 minutest = 13.15 hourss = 10 meters1/u = 100000W(u) = 10
Dra
wdo
wn
(m)
Time in minutes after the pumping wells begun
Figure 28. Interference test (Auxiliary well drawdown) during the Production/Injection and Auxiliary wells pumping.
1 10 100 1000 10000 100000 1000000 1E70,1
1
10
100
Time in minutes after the pumping wells stopped
Theis Type Curve Confined Aquifer
W(u
)
1/u
1 10 100 1000 100001
10
100
Auxiliary well recovery data point in the interference recovery testwith Production/Injection well, on August 08, 2007
Interference data: Q x T ' = Q ' x T, thus 84 x 5.27 = Q ' x 9.74 , or Q ' = 45.4 m3/h
1/u = 4.T.t / r2.S
S = 4.T.t / r2.1/uS = 0.0028
Q = 68.7 m3/hT = Q.W(u) / 4π.sT ' = 68.7 . 10 / 4π 10.4
T ' = 5.27 m2/h
r = 1 m
r2 = 1 m2
Q = 68.7 m3/h
T ' = 5.27 m2/hS = 0.0028
Match pointt = 800 minutest = 13.3 hourss = 10.4 meters1/u = 100000W(u) = 10
Reco
very
(m)
Figure 29. Interference test (Auxiliary well recovery test) during the Production/Injection and Auxiliary wells ground water inflow rates.

DINIZ, H. N.; SANTORO, J.; BATISTA, G. T.; DIAS, N. W.; TARGA, M. dos S. Hydrogeology and hydrodynamics of Tremembé aquifer, São Paulo, Brazil. Revista Ambi-Água, Taubaté, v. 3, n. 1, p. 108-137, 2008.
135
4. CONCLUSIONS The two wells drilled within the property of the Department of Agrarian Sciences,
University of Taubaté, allowed improving the current geological and hydrogeological knowledge about Tremembé Formation (Taubaté Group).
Analysis of sedimentary layer samples collected during well drilling allowed characterizing Tremembé Formation lithology, stratigraphy, and paleontology. Several pump tests were conducted to verify the hydrogeological evolution in different depths of the sedimentary layers.
Tremembé Formation samples obtained at the depth between 16 m and 18 m showed the presence of red-yellow latosol soils that contained the phreatic aquifer and around 9 m the water table was observed. It was found between 18 m and 48 m a succession of sandstone and conglomerate layers formed by Tremembé Formation Tertiary sediments. These layers constitute a leaky aquifer due to the intercalation of shale argillaceous layers and associated slow vertical leakage. Predominantly sandstone and conglomerate layers were observed between 48 m and 66 m that, associated with upper layers water contribution, form an unconfined aquifer with delayed response with transmissivity around 0.6 m2/h and water level located 8 m deep.
From 66 m depth towards the end of the Production/Injection well drilling (at 115 m) a succession of sandstone, conglomerate, shale, argillaceous shale, mudstone, and dolomite layers occurs. These layers constitute a confined aquifer with an 8 m water level depth, and around 8 m2/h transmissivity, and 1 x 10⁻⁴ coefficient of storage. With these hydrodynamic characteristics this well can provide discharge rates up to 150 m3/h.
The construction of an Auxiliary well located at 13.2 m from the Production/Injection well enabled several pumping tests with drawdown and recovery measurements in both, the pumping and observation wells.
The interpretation of pump tests (drawdown and recovery), as well as recharge tests, were developed by applying the theory of image well water-mirror (horizontal mirror) that can be applied in two situations:
a) In the analysis of pumping test results, where the recovery × time data (real well) are considered similar to the drawdown × time (virtual well – image well water-mirror), due to the similarity between the cones of depression and ascension. When the tested aquifer is classified as confined, the Theis method could be applied to obtain the hydrodynamic parameters associated with drawdown and recovery behavior. b) During pumping tests, the theory of image well water-mirror enabled to determine that well recovery is associated with the average (weighted by the time factor) of the pumping flow rates, so that recovery × time is more accurate for determining the aquifer hydrodynamic parameters than the drawdown × time because the recovery flow rate is always constant.
The application of image well water-mirror theory showed that the water injected by artificial recharge also have a similar cone of depression behavior. A flow rate Q (for a drawdown h) can be extracted and the same flow rate Q (for a rise h) injected in a well if water extravasation does not occur, which is limited by the recharge dynamic level when it reaches the well head.
The contribution of the aquifer circular area, between interfering wells, in the discharge rate of a well was determined by multiplying the aquifer transmissivity and the interference

DINIZ, H. N.; SANTORO, J.; BATISTA, G. T.; DIAS, N. W.; TARGA, M. dos S. Hydrogeology and hydrodynamics of Tremembé aquifer, São Paulo, Brazil. Revista Ambi-Água, Taubaté, v. 3, n. 1, p. 108-137, 2008.
136
flow rate. The discharge rate of a well without interference was determined by multiplying the apparent transmissivity and the discharge rate without interference. 5. ACKNOWLEDGEMENTS
The authors wish to express their gratitude to the Geological Institute of the State of São Paulo Secretariat of Environmental and to the Graduate Program in Environmental Sciences of the University of Taubaté for their support to this research. They also wish to thank the State of São Paulo Research Support Foundation – FAPESP for funding this research.
6. REFERENCES ALMEIDA, F. F. M. The system of continental rifts bordering the Santos Basin, Brazil.
Anais Academia Brasileira de Ciências, Rio de Janeiro, n. 48 (supl.), p.15-26, 1976.
BOUWER, H. Groundwater hydrology. New York: McGraw-Hill, 1978. 480 p.
CARNEIRO, C. D. R.; HASUI, Y.; GIANCURSI, F. D. Estrutura da bacia de Taubaté na região de São José dos Campos. In: CONGRESSO BRASILEIRO DE GEOLOGIA, 29., 1976, Ouro Preto. Anais... Ouro Preto: SBG, 1976. v. 4, p. 247-256.
CAVALCANTE, J. C.; KAEFER, L. Q. Geologia da folha de Santos (parcial). In: CONGRESSO BRASILEIRO DE GEOLOGIA, 28., 1974, Porto Alegre. Anais... Porto Alegre: SBG, 1974. v. 4, p. 227-245.
COLTRINARI, L. Geomorfologia e dinâmica quaternária no sudeste do Brasil. Revista do Departamento de Geografia da FFLCH/USP, São Paulo, v. 6, p. 7-16, 1992.
CONSÓRCIO ICFKAISER-LOGOS. Projeto qualidade das águas e controle da poluição hídrica na bacia do Rio Paraíba do Sul: meta I. São Paulo: SRHSO-SEPURB/MPO-BIRD-PNUD, may/1999. Stencilled.
COOPER JR., H. H.; JACOB, C. E. A generalized graphical method for evaluating formation constants and summarizing well-field history. American Geophysics Union Transaction, Washington, n. 27, p. 526-534, 1946.
CUSTODIO, E.; LLAMAS, M. R. Hidrologia subterrânea. Barcelona: Omega, 1983. Tomo I, 1157 p.
DRISCOLL, F. G. Groundwater and wells. 2.ed. St. Paul: Johnson Filtration Systems, 1989. 1089 p.
FITTS C. R. Groundwater science. London: Academic Press, 2002. 450 p.
FRANCO FILHO, F. W. B.; SOUZA, J. C. S. Explotação de água subterrânea em São José dos Campos: efeitos observados ao longo do tempo. In: CONGRESSO BRASILEIRO DE ÁGUAS SUBTERRÂNEAS, 8., dez.1994, Recife. Anais... Recife: ABAS, 1994. v. 1, p.113-123.
FREEZE, R. A.; CHERRY, J. A. Groundwater. Englewood Cliffs: Prentice-Hall, 1979. 604 p.
HANTUSH, M. S. Analysis of data from pumping tests in leaky aquifers. American Geophysical Union Transaction, Washington, v. 37, n. 6, p. 702-714, 1956.

DINIZ, H. N.; SANTORO, J.; BATISTA, G. T.; DIAS, N. W.; TARGA, M. dos S. Hydrogeology and hydrodynamics of Tremembé aquifer, São Paulo, Brazil. Revista Ambi-Água, Taubaté, v. 3, n. 1, p. 108-137, 2008.
137
HASUI, Y.; GIMENEZ, A. F.; MELO, M. S. Sobre as bacias tafrogênicas do sudeste brasileiro. In: CONGRESSO BRASILEIRO GEOLOGIA, 30., 1978, Recife. Anais... Recife: SBG, 1978. v. 1, p. 382-392.
HASUI, Y.; PONÇANO, W. Organização estrutural e evolução da bacia de Taubaté. In: CONGRESSO BRASILEIRO GEOLOGIA, 30., 1978, Recife. Anais... Recife: SBG, 1978. v. 1, p.368-381.
MELO, M. S.; CAETANO, S. L .V.; COIMBRA, A. M. Tectônica e sedimentação nas áreas das bacias de São Paulo e Taubaté. In: CONGRESSO BRASILEIRO DE GEOLOGIA, 34., 1986, Goiânia. Anais... Goiânia: SBG, 1986. v. 1, p. 321-336.
MINNESOTA. Departament of Natural Resources. Division of Waters. Criteria and guidelines for assessing geologic sensitivity of ground water resources in Minnesota. St. Paul: DNR, Division of Waters, 1991.
NEUMAN, S. P. Theory of flow in unconfined aquifers considering delayed response of the water table. Water Resources Research, n. 8, p. 1031-1045, 1972.
RICCOMINI, C. O rift continental do sudeste do Brasil. 1989, 256f. Tese (Doutorado em Geociências) - Instituto de Geociências, Universidade de São Paulo, São Paulo, 1989.
SADOWSKI, G. R.; CARNEIRO, C. D. R. O charnoquito de São Francisco Xavier, São Paulo. In: CONGRESSO BRASILEIRO DE GEOLOGIA, 28., Porto Alegre, 1974. Anais... Porto Alegre: SBG, 1974. v. 4, p. 207-211.
SANTORO, E.; ENS H. H.; NAGATA, N. Geologia das folhas Jacareí, Tremembé, Taubaté e Pindamonhangaba. São Paulo, Parte 1: embasamento setentrional da bacia de Taubaté. In: SIMPÓSIO GEOLOGIA DO SUDESTE, 2., 1991, Rio de Janeiro. Atas... São Paulo: SBG, p. 481-489.
SÃO PAULO. Secretaria do Meio Ambiente. Departamento de Águas e Energia Elétrica - DAEE. Estudo de águas subterrâneas: região administrativa 3 – S.J. dos Campos e faixa litorânea. São Paulo: Enco/DAEE, 1977a. v. 1, 112 p. (text).
SÃO PAULO. Secretaria do Meio Ambiente. Departamento de Águas e Energia Elétrica -DAEE. Estudo de águas subterrâneas: região administrativa 3 – S.J. dos Campos e faixa litorânea. São Paulo: Enco/DAEE, 1977b. v. 5, 160 p. (maps and tables).
SOUZA, J. C. S. Estudo hidrogeológico da região de Lorena. 2004, 174f. Tese (Doutorado em Geociências) - Instituto de Geociências, Universidade de São Paulo, São Paulo, 2004.
THEIS, C. V. The relation between the lowering of piezometric surface and the rate and duration of discharge of a well using ground-water storage. American Geophysical Union Transaction, Washigton, Part II p. 519-524. 1935.
U. S. GEOLOGICAL SURVEY. Ground water manual. Washington: Government Printing Office, 1977. 480 p.
WALTON, W. C. Groundwater resource evaluation. New York: Ed.McGraw-Hill, 1970. 664 p.