uwaterloo.ca and agriculture 34 . target price - 20% weighted of 5 methodologies . company...
TRANSCRIPT

Advisory Board Meeting – Fall 2012 December 4th, 2012

Agenda
December 4, 2012 - Advisory Board Meeting 2
SAF Investment Fund Overview
Stock selection: Process & methodology
Portfolio Performance
Investment Action
Stock Pitches
Next Steps
Global Macro Outlook

Click to edit Master title style
FUND OVERVIEW SAF Investment Fund
http://www.saf.uwaterloo.ca/SAF/SAFInvestmentFund.html

The Team – Introductions
December 4, 2012 - Advisory Board Meeting 4
Student Investment Team L to R: Front Row: Sammy Shen, Jing Xu, Catherine Zheng, Alex Wang, Linda Teng, Talha Omer, William Li, Leon Wu L to R: Back Row: Judith Ma, Mo Du, Anqi Wang, Michael Wang, Prasanth Pahirathan, Dustin Fader
Faculty L to R: Alan Douglas, Craig Geoffrey, Ranjini Jha, Andrew Ecclestone

Organization Structure
5
Analyst Leon Wu Fertilizer and Agriculture
Analyst Linda Teng Gold Mining
Analyst Michael Wang Diversified Mining
Analyst Talha Omer Oil & Gas
Analyst Sammy Shen Financials
Analyst Catherine Zheng TMT
Analyst Alex Wang Consumer
Analyst Judith Ma Utilities
Analyst Jing Xu Industrials
Analyst Dustin Fader REITs
Mo Du Chief Investment Officer
Anqi Wang Portfolio Manager
Prasanth Pahirathan Portfolio Manager
William Li Portfolio Manager
Fund Overview

Advisory Board
Aazar Zafar CA, CFA
Principal
Anish Chopra CA, CFA, CBV
Managing Director and Portfolio Manager
John Gort CA, CFA
Vice-President and CFO
Dr. Thomas Scott Director
Dennis Huber Vice President, Finance
Jeffrey D. Stacey Founding Partner

Industry Mentors
Derek Chu CA Associate IB
Aly Hadibhai CA, CFA Director
Kevin Huynh CA, CFA IB Analyst
Simon Kwan CA Analyst
Dan Lavric CFA Portfolio Manager
David Middleton CA, CFA Principal
Saran Ananth Senior Risk Analyst
Ohad Lederer CA, CPA, CFA Investment Analyst
ONCAP
Middleton Family Office

Industry Mentors
Phillip Huang CFA, CA Director
Niall Glynn CFA Associate
Milenko Sikljovan CA Associate

Investor Policy Statement
9
Category Restriction
Asset Class Canadian Equities
Market Capitalization
$300 Million +
Debt Rating S&P greater than B (or equivalent)
Individual Holdings
< 10% of Fund assets
Industry Sectors
< 25% of Fund assets
Trading Volume
< 5% of 10-day daily average
Exemption during one-year
“phase-in period”
Fund Overview

Click to edit Master title style
STOCK SELECTION: PROCESS & METHODOLOGY
SAF Investment Fund
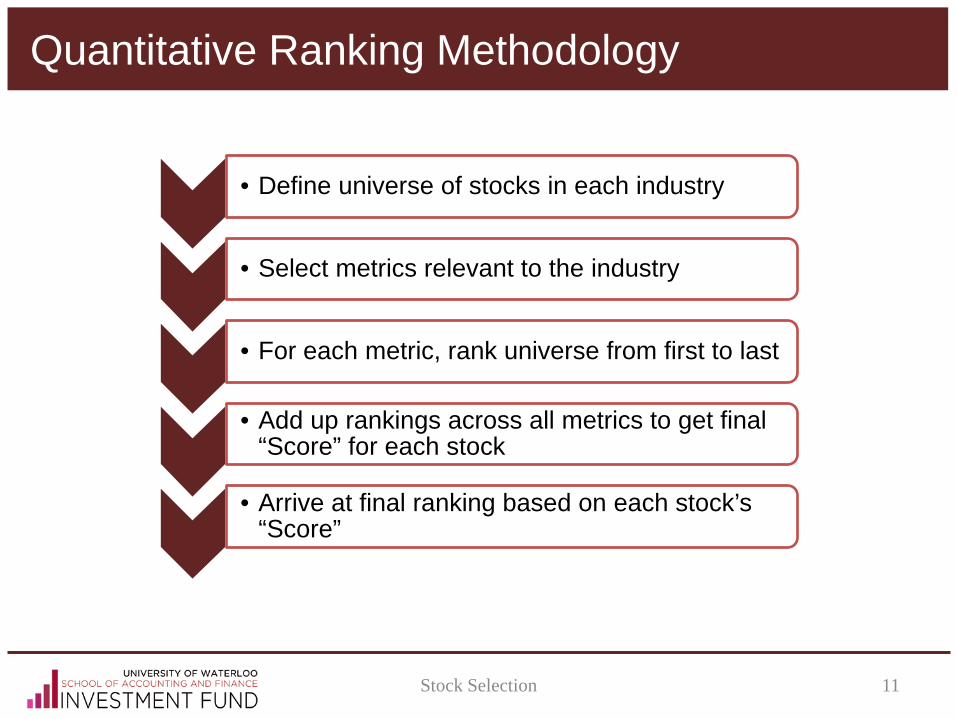
Quantitative Ranking Methodology
Stock Selection 11
• Define universe of stocks in each industry
• Select metrics relevant to the industry
• For each metric, rank universe from first to last
• Add up rankings across all metrics to get final “Score” for each stock
• Arrive at final ranking based on each stock’s
“Score”

Click to edit Master title style
PORTFOLIO PERFORMANCE SAF Investment Fund
JULY 31ST 2012 – NOVEMBER 30TH 2012

Updates to Previous Holdings - November 30, 2012
Portfolio Performance 13
Sells Holds

Performance Update: July 31, 2012 - November 30, 2012
14
Stock Shares (#) Last Close ($) SAF
Analyst Target ($)
% Variance
Canadian Natural Resources (SOLD) 175 28.35 34.09 20% National Bank 65 77.58 79.65 3% Fortis 150 33.38 35.71 7% Metro (SOLD) 90 61.16 63.00 3% Northern Properties (SOLD) 150 30.67 35.90 17%
Stock Cost Basis ($) MV ($) Dividends P&L ($) P&L (%) % of
Portfolio
Canadian Natural Resources (SOLD) 4,953.45 4,961.75 18.38 8.30 0.5% 19.76% National Bank 4,888.35 5,042.70 51.35 154.35 4.2% 20.08% Fortis 5,036.45 5,007.00 45 15.55 0.3% 19.94% Metro (SOLD) 5,023.95 5,504.40 38.23 518.68 10.3% 21.92% Northern Properties (SOLD) 5,041.95 4,600.00 57.39 (384.56) -7.6% 18.32% Total 24,944.15 25,115.85 210.35 312.32 1.5% 100.0%
TSX Holding Period Return 4.93%
Portfolio Performance
Portfolio Performance
15
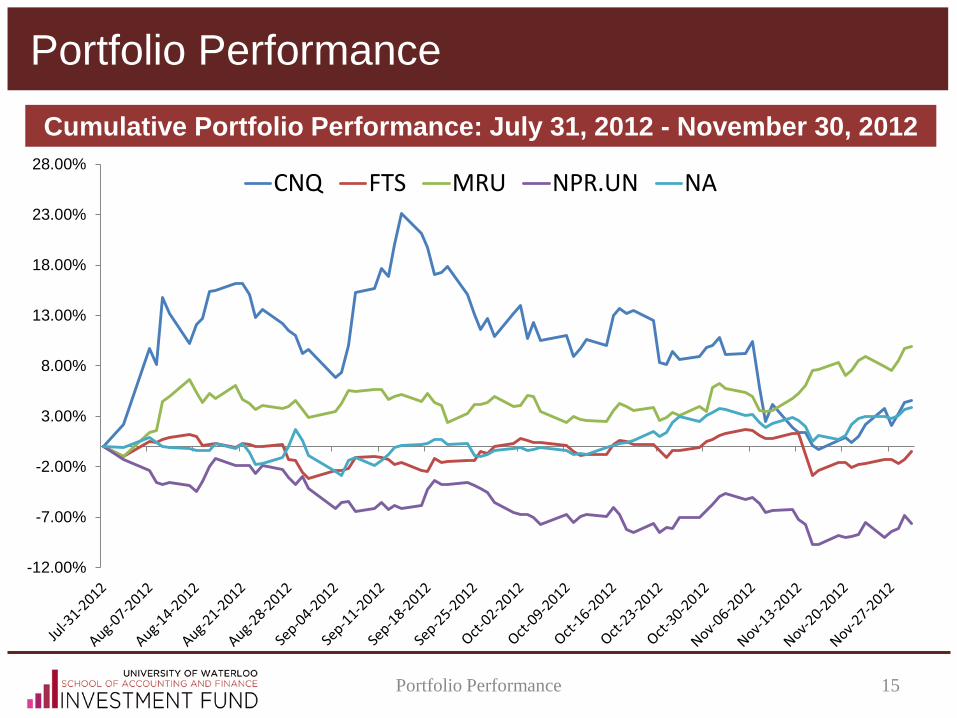
-12.00%
-7.00%
-2.00%
3.00%
8.00%
13.00%
18.00%
23.00%
28.00%CNQ FTS MRU NPR.UN NA
Cumulative Portfolio Performance: July 31, 2012 - November 30, 2012
Portfolio Performance

Strategy Performance: July 31, 2012 - November 30, 2012
16
-2.00%
-1.00%
0.00%
1.00%
2.00%
3.00%
4.00%
5.00%
6.00%
7.00%
8.00%Portfolio - Cumulative Returns TSX - Cumulative Returns Passive Portfolio - Cumulative Returns
Benchmark Against Passive Portfolio of iShares ETFs
TSX Return 4.93%
Passive Portfolio Return 1.02%
Portfolio Return 1.46%
Passive Portfolio : Equally Weighted Portfolio of iShares: XRE for NPR.UN, TSX:CLO for CNQ, XUT for FTS, XFN for NA,XST for MRU

Sector Performance July 31, 2012 - November 30, 2012
17
-10.00%
-5.00%
0.00%
5.00%
10.00%
15.00%
20.00%
25.00%Energy Index Financials IndexREIT Index Information Technology IndexMaterials Index Composite IndexConsumer Discretionary Index Diversified Metals & Manufacturing IndexHealth Care Index Utilities Index
Portfolio Performance

Key Metrics
18
NPR-U NA MRU CNQ FTS
NPR-U 1 0.26 0.076 0.111 0.155
NA 0.26 1 0.118 0.325 0.315
MRU 0.076 0.118 1 0.295 0.118
CNQ 0.111 0.325 0.295 1 0.308
FTS 0.155 0.315 0.118 0.308 1 Source: Bloomberg - 5 years weekly data
Source: CapIQ
Beta 0.77 Average Daily Returns 0.02% Annualized Returns 5.20% Annualized Standard Deviation 0.100
VAR - 5% ($25,000 invested) $2,802.12 Sharpe Ratio 0.29 Number of Days underperformed Index 45 Number of Days outperformed Index 39
Portfolio Performance
Click to edit Master title style
GLOBAL MACRO OUTLOOK SAF Investment Fund
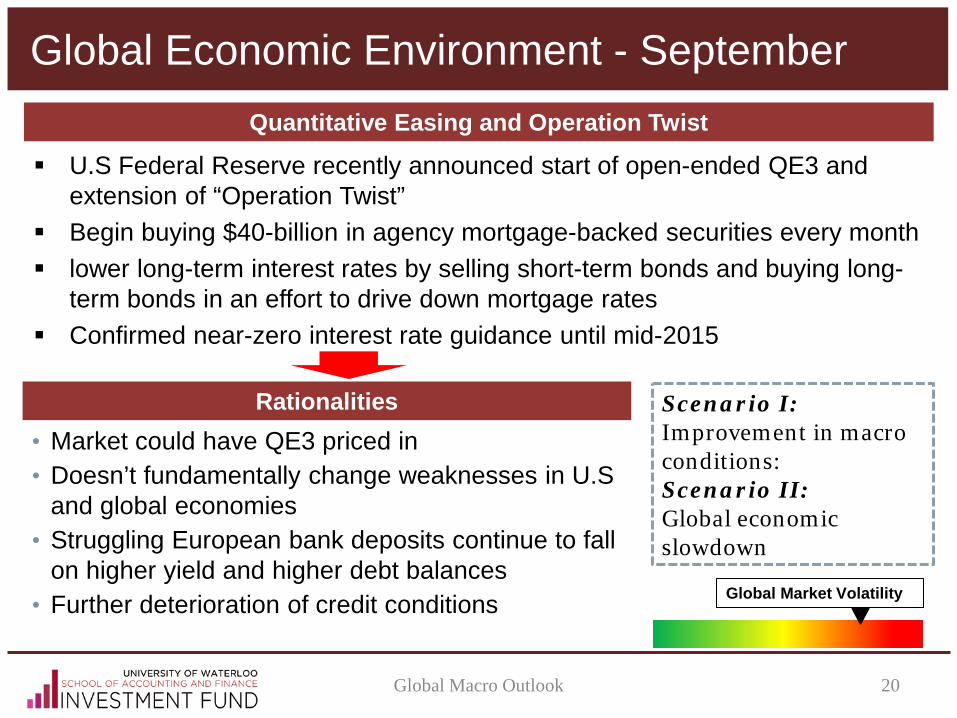
Global Economic Environment - September
20
U.S Federal Reserve recently announced start of open-ended QE3 and extension of “Operation Twist”
Begin buying $40-billion in agency mortgage-backed securities every month lower long-term interest rates by selling short-term bonds and buying long-
term bonds in an effort to drive down mortgage rates Confirmed near-zero interest rate guidance until mid-2015
Rationalities
Global Market Volatility
• Market could have QE3 priced in • Doesn’t fundamentally change weaknesses in U.S
and global economies • Struggling European bank deposits continue to fall
on higher yield and higher debt balances • Further deterioration of credit conditions
Scenario I: Improvement in macro conditions: Scenario II: Global economic slowdown
Quantitative Easing and Operation Twist
Global Macro Outlook

Overseas Markets – Euro-zone and China
21
Record household debt and large government deficit had led to financial restraint
A weak global environment and an elevated exchange rate are weighing on exports
Export and investment outlook could improve against strong macro conditions
Analyst pegging real GDP growth at ~ 2.0% in 2012 and improving in 2013 and 2014 with less than stellar job growth
Cautious Optimism
A Growing Debt Problem Risks and Opportunities
• Growing consumer debt and a resource focused economy could derail recovery efforts
• Weak demand for oil and bulk commodities likely to continue in the near future
Source: TD Economics
Global Macro Outlook

Overseas Markets – Euro-zone and China
22
• QE3 stimulates capital spending and higher consumer confidence spurs brighter global economic outlook
• Investment Bias: High beta, cyclicality, and large international exposure
• Probability: Low
Scenario I
Scenario II • QE3 ineffective as macro outlook
continues to deteriorate while EU and emerging economies fail to deliver
• Investment Bias: Low correlation and volatility defensive, and large domestic focus
• Probability: High Source: RBC Research
Global Macro Outlook
Investment Thesis
23
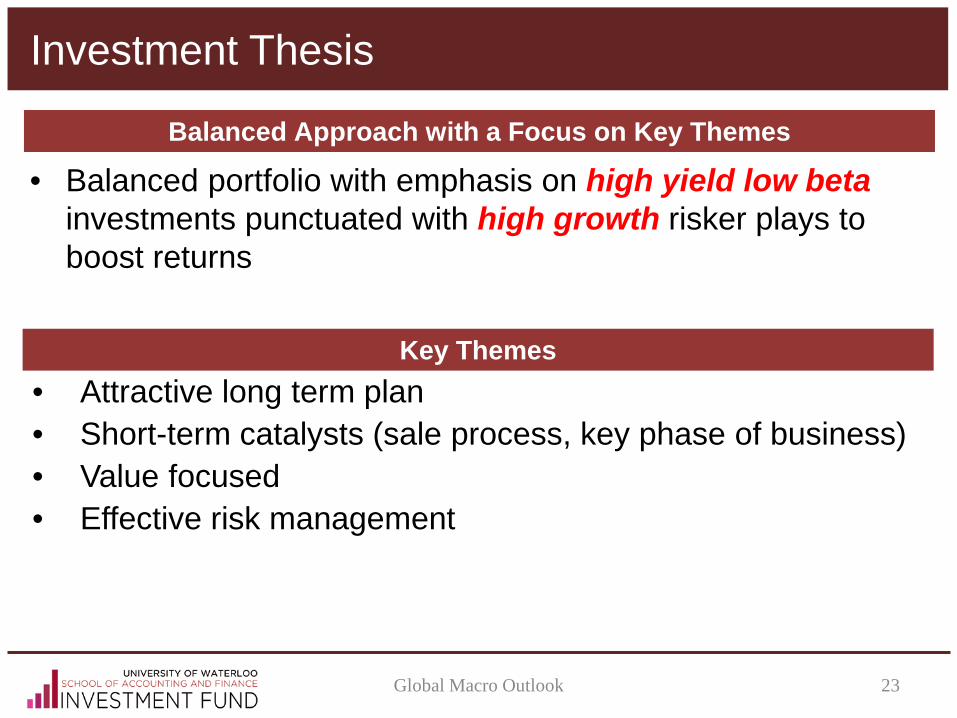
• Balanced portfolio with emphasis on high yield low beta investments punctuated with high growth risker plays to boost returns
Balanced Approach with a Focus on Key Themes
Key Themes • Attractive long term plan • Short-term catalysts (sale process, key phase of business) • Value focused • Effective risk management
Global Macro Outlook

Looking Beyond the Cliff
24
Source: TD Economics
Source: CBO
5% GDP in proposed spending cuts Dampen consumer confidence in the
short-term Improving but fragile U.S housing market
Dividend and capital gains tax hike could lead to shift in asset preferences
Global Macro Outlook

Cautious Optimism
25
Strategy – U.S. Focus
• Bullish: ▫ Gold and precious metals ▫ Healthcare and domestic industries
• Bearish: ▫ Consumer discretionary ▫ Infrastructure and real estate
• China’s monetary easing to create tailwinds for recovery
• Greater clarity surrounding high risk Euro countries could lead to less volatility
Global Macro Outlook
Click to edit Master title style
INVESTMENT ACTION SAF Investment Fund

Analyst Recommended Stocks
Investment Action 27

Other Proposed Stocks
28
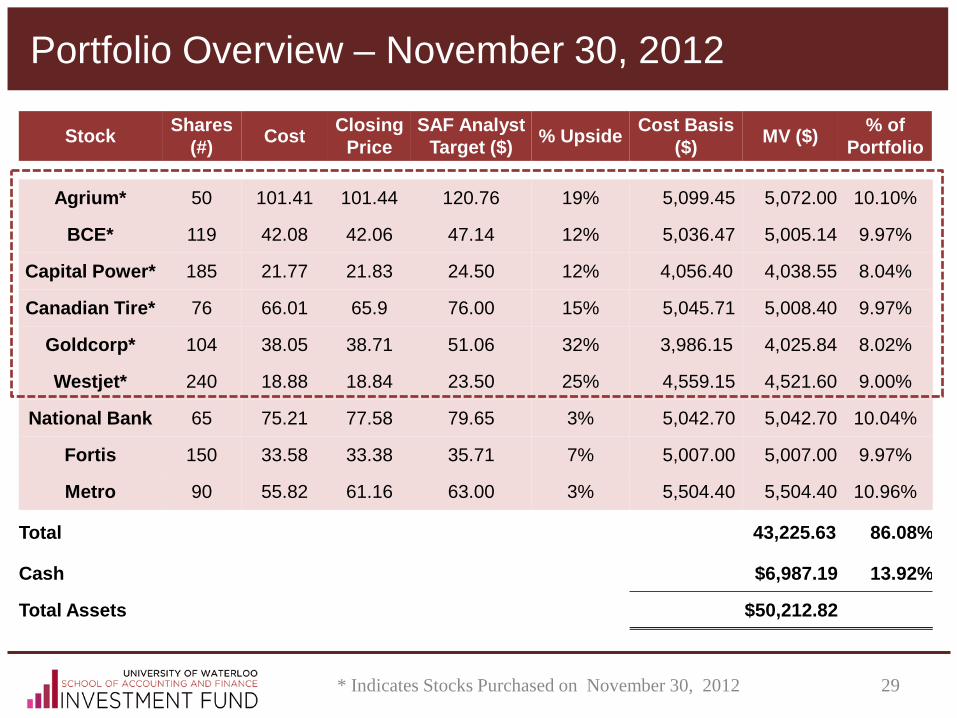
Portfolio Overview – November 30, 2012
29
Stock Shares (#) Cost Closing
Price SAF Analyst
Target ($) % Upside Cost Basis ($) MV ($) % of
Portfolio
Agrium* 50 101.41 101.44 120.76 19% 5,099.45 5,072.00 10.10%
BCE* 119 42.08 42.06 47.14 12% 5,036.47 5,005.14 9.97%
Capital Power* 185 21.77 21.83 24.50 12% 4,056.40 4,038.55 8.04%
Canadian Tire* 76 66.01 65.9 76.00 15% 5,045.71 5,008.40 9.97%
Goldcorp* 104 38.05 38.71 51.06 32% 3,986.15 4,025.84 8.02%
Westjet* 240 18.88 18.84 23.50 25% 4,559.15 4,521.60 9.00%
National Bank 65 75.21 77.58 79.65 3% 5,042.70 5,042.70 10.04%
Fortis 150 33.58 33.38 35.71 7% 5,007.00 5,007.00 9.97%
Metro 90 55.82 61.16 63.00 3% 5,504.40 5,504.40 10.96%
Total 43,225.63 86.08%
Cash $6,987.19 13.92%
Total Assets $50,212.82
* Indicates Stocks Purchased on November 30, 2012
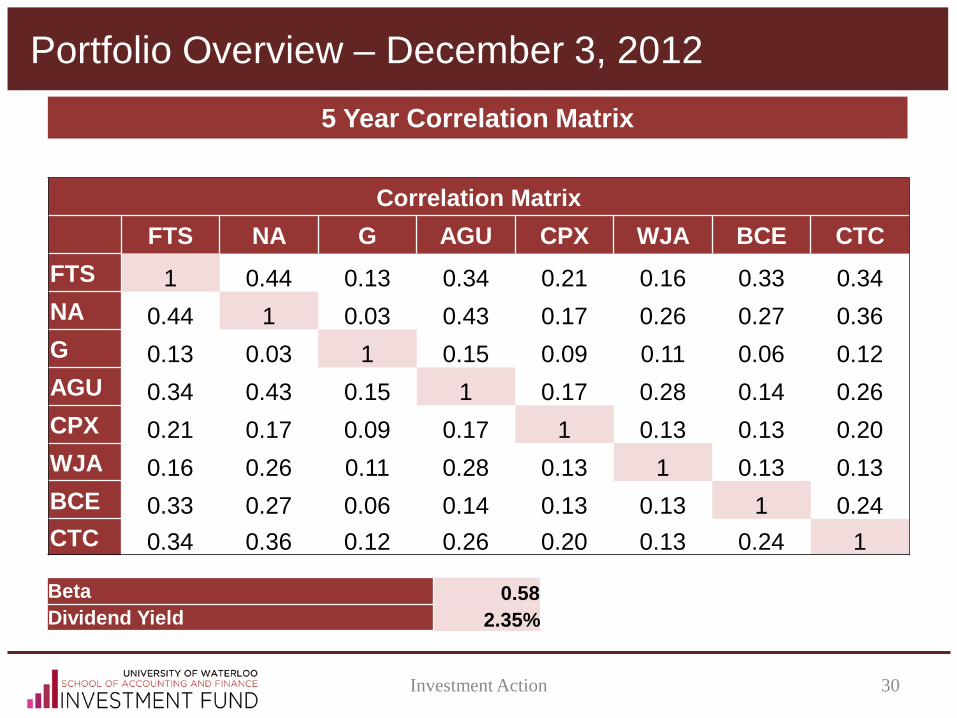
Portfolio Overview – December 3, 2012
30 Investment Action
Correlation Matrix FTS NA G AGU CPX WJA BCE CTC FTS 1 0.44 0.13 0.34 0.21 0.16 0.33 0.34 NA 0.44 1 0.03 0.43 0.17 0.26 0.27 0.36 G 0.13 0.03 1 0.15 0.09 0.11 0.06 0.12 AGU 0.34 0.43 0.15 1 0.17 0.28 0.14 0.26 CPX 0.21 0.17 0.09 0.17 1 0.13 0.13 0.20 WJA 0.16 0.26 0.11 0.28 0.13 1 0.13 0.13 BCE 0.33 0.27 0.06 0.14 0.13 0.13 1 0.24 CTC 0.34 0.36 0.12 0.26 0.20 0.13 0.24 1
5 Year Correlation Matrix
Beta 0.58 Dividend Yield 2.35%

Click to edit Master title style
QUESTION PERIOD SAF Investment Fund

Click to edit Master title style
STOCK PITCHES SAF Investment Fund

Agrium Inc.
December 4, 2012
Mo Du, Chief Investment Officer Leon Wu, Analyst

Recommendation - Buy
Fertilizer and Agriculture 34
Target Price - 20% Weighted of 5 methodologies Company Highlights
Risk Exposure
• Strong fundamentals: industry leader, diversified business lines and markets, defensive
• Growth potential through business acquisition and production expansion
• Attractive EV/EBITDA multiples
• Low operating risk: small use of leverage, strong cash flow
• Commodity prices • Foreign exchange • Operational factors
Low / Medium Risk
$66.00
$87.00
$111.00
$75.09
$114.48
$107.95
$107.50
$166.00
$191.00
$140.87
$135.39
$131.13
$50.00 $90.00 $130.00 $170.00 $210.00
52 WeekTrading Range
AnalystConsensus
Sum of PartsEV/EBITDA
P/CF
DCF -EBITDA Exit Multiple
DCF -Perpetuity Growth
Target Price $120.76
Target price represents a 19% premium on closing price of $101.44 (Nov. 30th)

Company Profile
35 Fertilizer and Agriculture
Market Cap $14.34B
Beta 1.234
Current Price $97.81
52 Weeks High/Low 107.5/66
1 Year Return 21.72%
Current Dividend Yield 1.07%
LTM EPS 9.86
-20
-10
0
10
20
30
40
Perc
enta
ge A
ppre
caiti
on (%
)
AGU CN Equity SPTSX Index STFERTR Index
TSX: AGU Generally Outperformed S&P/TSX Index
Gross Profit Contribution by Business Unit as of 2011
45% - $1,982 million Retail
52% - $2,286 million Wholesale
3% - $115 million
Advanced Tech.

Industry Overview
36
• China is the global leader in crop production. However, low production efficiency results in high production cost
-20.0%
-10.0%
0.0%
10.0%
20.0%
30.0%
40.0%
2003 2004 2005 2006 2007 2008 2009 2010
Nitrogen Fertilizers Phosphate Fertilizers Potash Fertilizers
$0
$50
$100
$150
$200
$250
$300
1992
1993
1994
1995
1996
1997
1998
1999
2000
2001
2002
2003
2004
2005
2006
2007
2008
2009
Brazil Canada China
• AGU’s high exposure to stable nitrogen production leads to earnings stability
Growth in Global Nutrient Consumption
Cost of Wheat Production ($/ Tonne)
Fertilizer and Agriculture
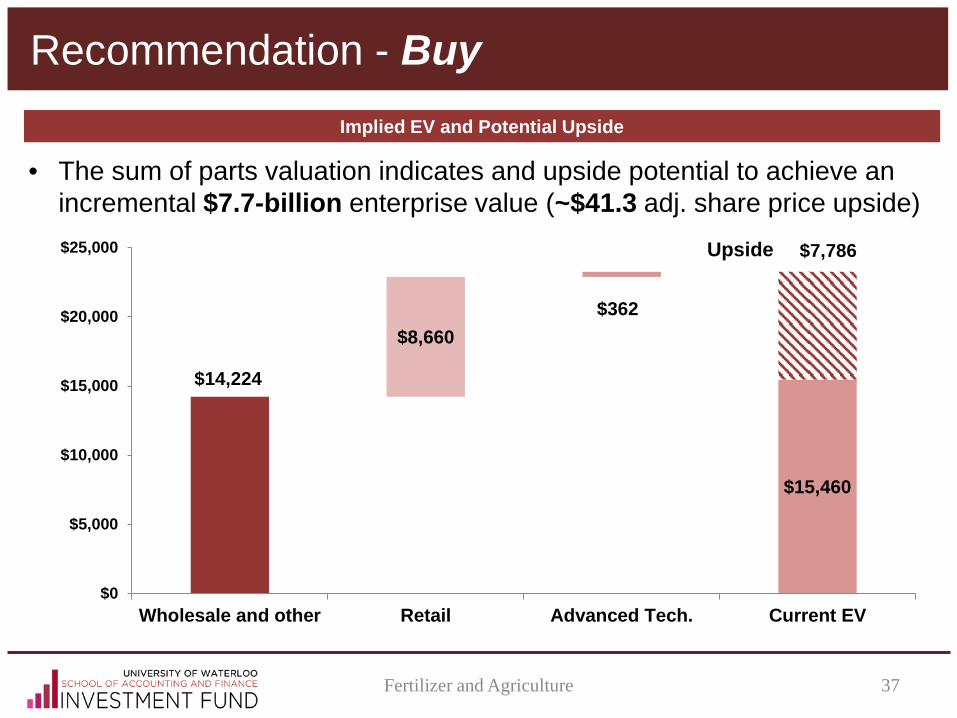
Recommendation - Buy
37
• The sum of parts valuation indicates and upside potential to achieve an incremental $7.7-billion enterprise value (~$41.3 adj. share price upside)
Implied EV and Potential Upside
$14,224
$15,460
$8,660
$7,786
$362
$0
$5,000
$10,000
$15,000
$20,000
$25,000
Wholesale and other Retail Advanced Tech. Current EV
Upside
Fertilizer and Agriculture

Click to edit Master title style
QUESTION PERIOD SAF Investment Fund

CNQ Update Anqi Wang, Portfolio Manager
Talha Omer, Analyst

CNQ Update
Oil & Gas 40
CNQ Announces Q3 Earnings (dividend)
Downward guidance on production

Downward Guidance
on production
Profits fell by 57%
Cash Flow decreased by 19%
Q3 Earnings
Oil & Gas 41

Investment Risks
Oil and Gas 42
Industry level asset
sell-off
CNQ lowering guidance
Production mix limits
upside
High correlation with Capital
Power

Goldcorp Initiating Coverage
December 4, 2012
Anqi Wang, Portfolio Manager Linda Teng, Analyst

Investment Highlights
Metals & Mining - Gold 44
Goldcorp (TSE:G)
Source: Bloomberg on 2012/11/25
• Stock Rating: BUY • Current Price: $40.78 (2012/11/23) • Implied Share Price: $51.06 (23.3% upside)
Focus on Low Risk & Low Cost
Growth Profile
Valuation & Opportunity
0
2000000
4000000
6000000
8000000
10000000
12000000
14000000
0
10
20
30
40
50
60
Volu
me
Shar
e Pr
ice
G CN Equity - Volume G CN Equity - Last Price

Goldcorp Inc. – Overview
Metals & Mining - Gold 45
Description • Second largest gold miner by
market cap • Engages in gold, silver, copper,
lead and zinc • 100% sales unhedged
Recent Earnings – Q3/12
Metrics (LTM) Large Cap Average Goldcorp Inc.
Market Cap 6.1B 36.4B
1 Yr Return -5.5% -18.0%
Beta (1 Yr) 1.7 0.81
Basic EPS 0.7 2.0
P/E 38.7 23.8
Dividend Yield % 1.5 1.3
EBITDA Margin % 40.0 54.1
• EPS Actual: $0.54, Estimate: $0.45 Share Price: +8.2% d/d
• EBIT +9% from Q3/11 • First gold pour at mine in
Dominican Republic Source: BMO Research report, CapitalIQ, Bloomberg on 2012/11/10
71%
16%
6% 5% 2% 0%
Revenue Breakdown YTD Q3/12 Gold
Silver
Copper
Zinc
Lead
Other

Goldcorp Inc. – Advantages
Metals & Mining - Gold 46
Growth Leader • Robust project development pipeline with 6 new mines • Expect ↑ 90% in CFPS to $5.46 in 3 years
Source: Goldcorp Inc. company website on 2012/11/10

Goldcorp Inc. – Advantages
Metals & Mining - Gold 47
• Focused on low risk jurisdictions
Competent Management Low Political Risk • Consistently met street
expectations • Outstanding execution in
operations
Environment protection • Dedicated to increase energy
efficiency and renewable energy use
• Focus on water conservation – recycle 74% used water
Source: Goldcorp Inc. company website on 2012/11/10

Goldcorp Inc. – Advantages
Metals & Mining - Gold 48
• Reduce exposure to capital inflation • By-product cost of $220/oz in Q3/12 vs. $258/oz in Q3/11
Low Cost Producer
Source: Goldcorp Inc. company website on 2012/11/10, BMO Research Report
$300
$400
$500
$600
$700
$800
2010A 2011A 2012E 2013E 2014E 2015E
Expected Co-product Cash Costs per Ounce
Sr. Producer Avg. Barrick Gold Corp. Goldcorp Inc.

NAV
Metals & Mining - Gold 49
Net Asset Value
Source: Goldcorp Inc. company website, Capital IQ on 2012/11/25
• NAV = PV(mines) + fully diluted in the money working capital – long term debt – minority interests + other items
Producing Assets (Figures in USD)
Name Value Per Share
Red Lake $5.62 Porcupine $2.61 Penasquito $10.46 Marlin $1.75 Los Filos $4.13 Musselwhite $2.57 Alumbrera $0.83 Marigold $0.81 El Sauzal $0.33 Wharf $0.36 Pueblo Viejo $3.64 Total $33.1
Developing Assets (Figures in USD)
Name Value
Per Share
Eleonore $2.69 Cerro Blanco $0.83 Cerro Negro $3.70 Cochenour $2.09 Camino Rojo $1.82 Noche Buena $0.63 El Morro $4.76 Total $16.52
Valuation Per Share (Figures in USD) Cash & Equivalents $1.10 Equity Investments $1.70
Liabilities
Minority Interest
$0.26
Reclamation $0.49 Long Term
Debt $0.95
Net Asset Value $50.73
P/NAV 0.811x
Upside 23.38%
Assumptions Gold Price $1,800 3-Year Annual Depreciation 25.24% Discount Rate (Producing) 5.0%

• Diversification & hedge • Low correlation with current holdings Portfolio Fit
• Mainly focused in low risk jurisdictions • Low cost senior producer
Low Risk & Costs
• Undervalued at 0.81x P/NAV Valuation
• Unmatched growth profile • +70% in production by 2016 Growth
Recommendation – BUY
Metals & Mining - Gold 50
Click to edit Master title style
QUESTION PERIOD SAF Investment Fund
Bell Corporation Inc. Initiating Coverage
December 4, 2012 Prasanth Pahirathan, Portfolio Manager
Catherine Zheng, Analyst

Recommendation - BUY
TMT
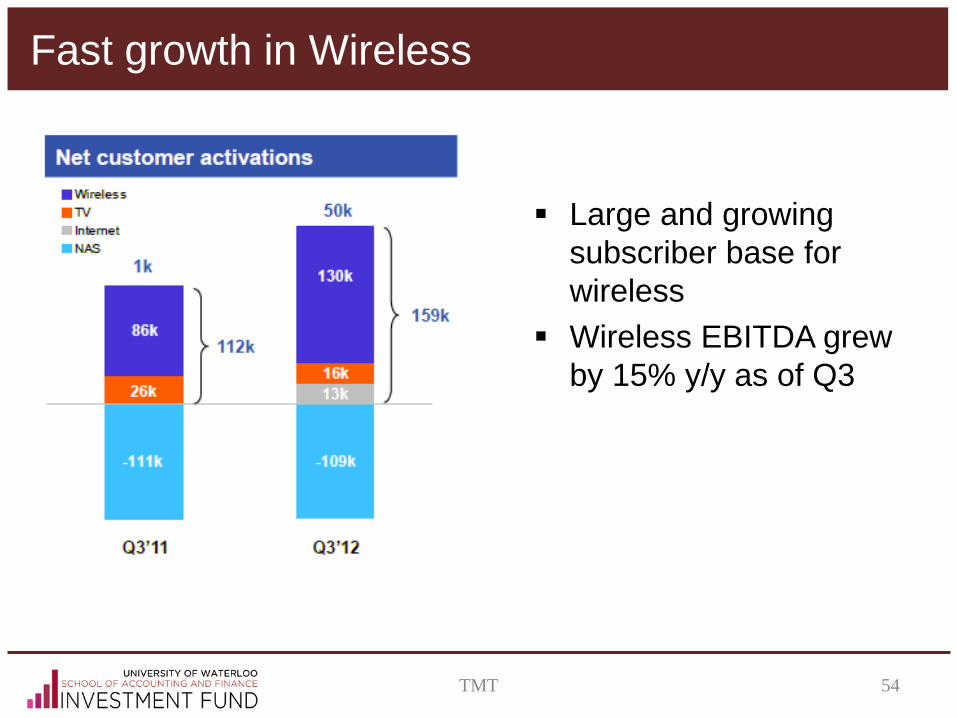
Large and growing subscriber base for wireless
Wireless EBITDA grew by 15% y/y as of Q3
Fast growth in Wireless
54 TMT

Bell Media maintains the industry’s strongest ratings at CTV channels
Media EBITDA growth at 93% y/y
Commitment to Media
TMT 55

Solid Management Execution
56
Investment in customer service has brought down churn rates to 1.6%
Accretive M&A activity regardless of Astral fallout
TMT

Football Field Valuation Map
57 TMT

Canadian Tire Corp. Initiating Coverage
December 4, 2012
Prasanth Pahirathan, Portfolio Manager Alex Wang, Analyst
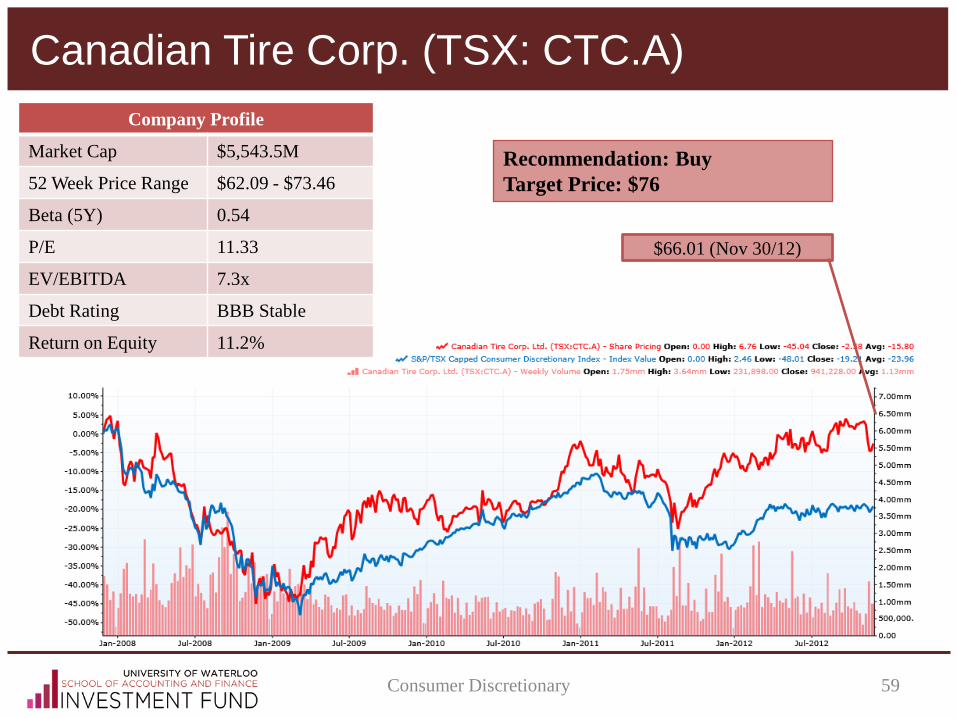
Canadian Tire Corp. (TSX: CTC.A)
59
Company Profile
Market Cap $5,543.5M
52 Week Price Range $62.09 - $73.46
Beta (5Y) 0.54
P/E 11.33
EV/EBITDA 7.3x
Debt Rating BBB Stable
Return on Equity 11.2%
Recommendation: Buy Target Price: $76
$66.01 (Nov 30/12)
Consumer Discretionary
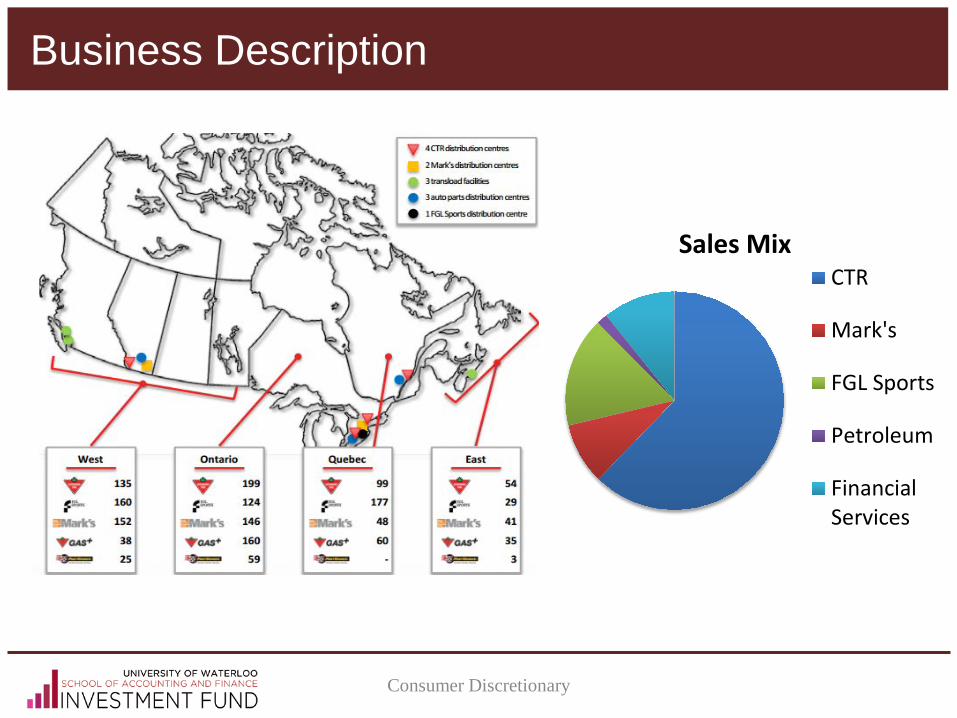
Business Description
Sales Mix CTR
Mark's
FGL Sports
Petroleum
FinancialServices
Consumer Discretionary

Strong cash flow from operations and ample cash balance 2011 acquisition of FGL Sports for $765 million mostly funded by
cash Cash balance of $262 million at end of Q3/12
Consistent dividend payout Dividend hike of 17% in Q3/12 to $0.35/share
Strong Financial Performance
0
5
10
15
20
25
2007 2008 2009 2010 2011 2012 YTD
Dividend Payout
0
500
1000
1500
2000
2007 2008 2009 2010 2011
Cash Flow from Operations
Consumer Discretionary

Positive sales and same-store sales growth Mark’s and FGL Sports experience higher growth
Improving EBITDA margin Efforts to upgrade merchandising and IT processes have paid off Expected to recognize cost synergies with acquisition of FGL
Sports
Strong Financial Performance
7.47.67.888.28.48.68.899.29.4
0
5
10
15
20
25
30
35
2007 2008 2009 2010 2011 2012E
EBITDA Margin
Credit EBITDA Retail EBITDA
-3
-2.5
-2
-1.5
-1
-0.5
0
0.5
1
1.5
2
2.5
0
2000
4000
6000
8000
10000
12000
14000
2007 2008 2009 2010 2011 2012
Sales and Same Store Sales Growth
Sales SSS Growth
Consumer Discretionary

Strengths: brand, difficult to replicate retail network, diversified product offering
Benefits from acquisition of FGL Sports Mark’s has doubled sales since acquisition in 2002
Smart store formats and pro shops In place of traditional CTR stores
New loyalty program in pilot stage 1% return versus 0.4% of existing loyalty program
Timing Q3 Revenues miss because of mild winter weather Negative reaction in stock price
Ability to Grow and Timing
Consumer Discretionary
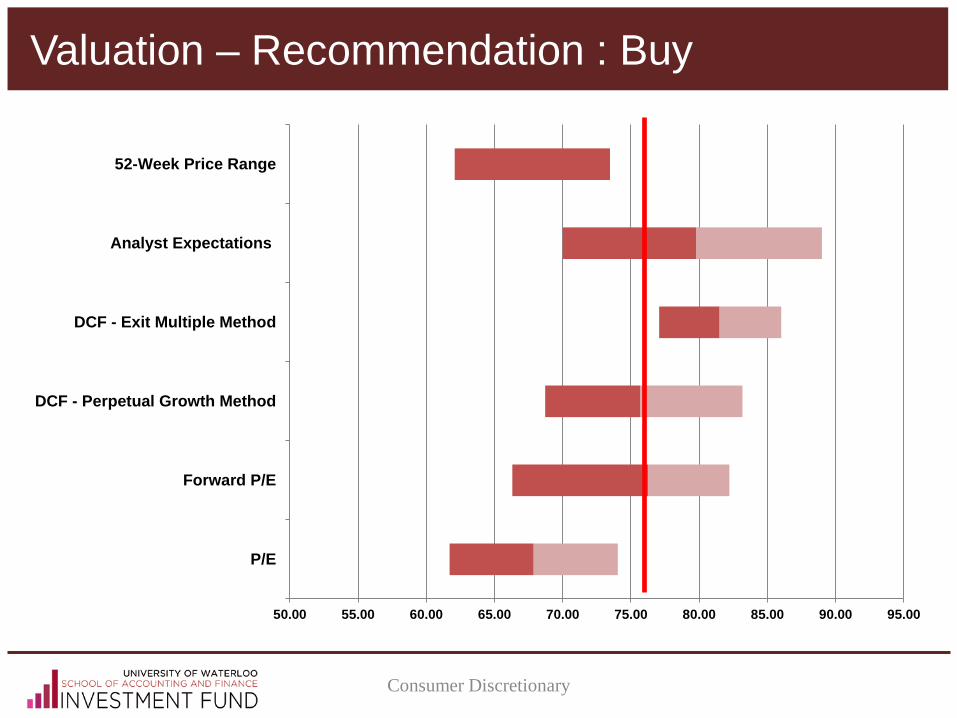
50.00 55.00 60.00 65.00 70.00 75.00 80.00 85.00 90.00 95.00
P/E
Forward P/E
DCF - Perpetual Growth Method
DCF - Exit Multiple Method
Analyst Expectations
52-Week Price Range
Valuation – Recommendation : Buy
Consumer Discretionary

Metro Inc. Update Prasanth Pahirathan, Portfolio Manager
Alex Wang, Analyst

Metro Inc. (TSX:MRU) Update
66
Purchase Price: $55.50 (Aug 3/12) Current Price: $61.09(Nov 30/12) Return: 10.02% Target Price: $63 (limit order)
Consumer Staples

National Bank Update Prasanth Pahirathan, Portfolio Manager
Sammy Shen, Analyst

0.00
1.00mm
2.00mm
3.00mm
4.00mm
5.00mm
6.00mm
50.00
55.00
60.00
65.00
70.00
75.00
80.00
85.00
National Bank of Canada (TSX:NA) - Volume
Recommendation Company Profile
Market Cap $12390.9M
52 Week Price Range
$64.25- $81.27
Beta (5Y) 0.68
Dividend 4.1%
P/E 8.8
P/B 1.89
Return on Equity 18.6%
Recommendation: Hold Target Price: $79 (limit order)
$76.89 (Nov 27/12)
Financials

Click to edit Master title style
QUESTION PERIOD SAF Investment Fund

Capital Power Initiating Coverage
December 4, 2012
William Li, Portfolio Manager Judith Ma, Analyst
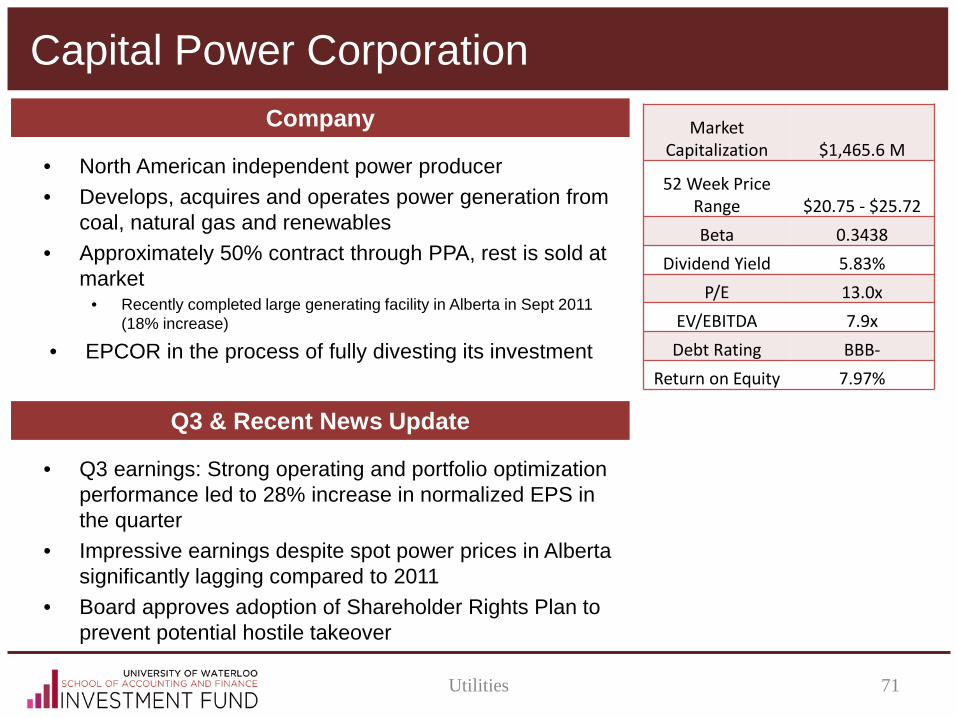
Capital Power Corporation
Utilities 71
• North American independent power producer • Develops, acquires and operates power generation from
coal, natural gas and renewables • Approximately 50% contract through PPA, rest is sold at
market • Recently completed large generating facility in Alberta in Sept 2011
(18% increase)
• EPCOR in the process of fully divesting its investment
Company
• Q3 earnings: Strong operating and portfolio optimization performance led to 28% increase in normalized EPS in the quarter
• Impressive earnings despite spot power prices in Alberta significantly lagging compared to 2011
• Board approves adoption of Shareholder Rights Plan to prevent potential hostile takeover
Q3 & Recent News Update
Market Capitalization $1,465.6 M
52 Week Price Range $20.75 - $25.72 Beta 0.3438
Dividend Yield 5.83% P/E 13.0x
EV/EBITDA 7.9x Debt Rating BBB-
Return on Equity 7.97%

Capital Power Corporation
72
• Looking to develop power generation projects in BC, Alberta and Ontario. • Committed $1.4B to 4 wind projects
• Quality Wind project set to commence operations in Nov 2012 in BC • Three in progress:
• Halkirk Wind Project: deregulated wholesale market, Alberta • Port Dover & Nanticoke Wind Project: PPA in Ontario, target completion at
end of 2013 • JV in the K2 Wind Power Project: PPA in Ontario, for 2014
• By completion, approximately 13% of energy production from wind • New initiatives should support further EBITDA growth
Major Projects & News
Utilities

Capital Power Corporation
73
• Fast growing independent power producer • Current dividend yield of 5.8%, above industry average
Capital Power
• Operationally excellent fleet of power generators • Pipeline of wind developments: provide steady stream of income
through PPAs • Strong management team with relevant experience • Alberta power prices are volatile: commercial activities have been
hedged; long-term outlook positive
Summary of Drivers
Utilities

Capital Power Corp Valuation Chart
Utilities 74
Football Field
$- $10.00 $20.00 $30.00 $40.00 $50.00 $60.00 $70.00 $80.00 $90.00
52 - Week Range
2.4-3.4% Growth Rate, 6.3-7.1% Discount Rate
7.9-9.1x Multiple, 6.3-7.1% Discount Rate
2012 P / E:
2012 EV / EBITDA:
Comps Analysis: Regulated Utilities & IPPs
DCF Analysis
Trading Range

Recommendation – Buy
0
5
10
15
20
25
30
35
26/0
6/20
09
26/1
2/20
09
26/0
6/20
10
26/1
2/20
10
26/0
6/20
11
26/1
2/20
11
26/0
6/20
12
26/1
2/20
12
26/0
6/20
13
26/1
2/20
13
TSX:CPX - Share Pricing
$21.10 (November 16, 2012)
$24.50 (December 31, 2013)
Utilities

Westjet Initiating Coverage
December 4, 2012
William Li, Portfolio Manager Jing Xu, Analyst

Growing industry Highly cyclical Intense competition Thin profit margins Mature North America
market Fuel price biggest cost
WestJet - Airline Industry
Industrials 77
Airline Industry Drivers & Risks
Fuel Price Economy
Weather ?
Labour ↓

WestJet - Company Overview
78
Canadian low-cost carrier Based in Calgary Operates 99 Boeing Next-Gen 737 aircrafts Serves 81 destinations in Canada, the United States, Mexico, Central
America, and the Caribbean
WestJet Profile
Strategy
People and culture Guest experience and
performance Revenue and growth Cost and margin
Market Profile Market Capitalization $2,567.6 M 52 Week Price Range $10.30 - $19.31 Beta 0.64 Dividend Yield 1.7% P/E 12.1x EV/EBITDA 3.6x Debt Rating NA Return on Equity 15.5%
Industrials

WestJet Valuation Chart – Recommendation: Buy
Industrials 79
$- $5.00 $10.00 $15.00 $20.00 $25.00 $30.00 $35.00 $40.00 $45.00 $50.00
52 - Week Range
0.5-3.0% Growth Rate, 5.25-6.75% Discount Rate
2.0-4.5x Multiple, 5.25-6.75% Discount Rate
2012 EV / Revenue:
2013E EV / Revenue:
2012 EV / EBITDA:
2013E EV / EBITDA:
2012 EV / EBITDAR:
2012 P / E:
2013E P / E:
Public Company Comparable:
Discounted Cash Flow Analysis:

WestJet - Summary of Investment Drivers
80
• 30% gain in market share in 10 years • Expansion into profitable destinations • Potential to attractive high yield customers
Growth
• Non-unionized but motivated employees • Committed to low cost edge over competitors • Top two airlines for customer service
Strategy
• One of North America’s most profitable airlines • 30 consecutive quarters of profitability • Able to maintain profitable when competitors suffer
Profitability
• Buy • Target: $23.50 Current: $18.93 • Potential return: 24%
Recommendation
Industrials

Northern Property Update William Li, Portfolio Manager
Dustin Fader, Analyst

Northern Property REIT – Sell Recommendation
82
FFO/unit decreased to $0.55 from $0.63 Decrease mainly due to sale of senior residences (approx. 15% of
property portfolio) Low utility costs with the summer months temporarily helped to boost
FFO Share price is down 8.9% since purchase (REIT index down 5.8%) Vacancy is up to 4.7% from 3.6% Q2
Q3 Results and Updates
REITs

Northern Property REIT
83
Peer Multiple Comparison
$- $20.00 $40.00 $60.00 $80.00 $100.00 $120.00 $140.00 $160.00 $180.00 $200.00
2012 P/NAV
Implied Cap Rate:
2012 P / AFFO
2012 P / FFO
2012 P/NAV
Implied Cap Rate:
2012 P / AFFO
2012 P / FFO
US REITs
Canadian REITs
REITs
Fortis Update William Li, Portfolio Manager
Judith Ma, Analyst
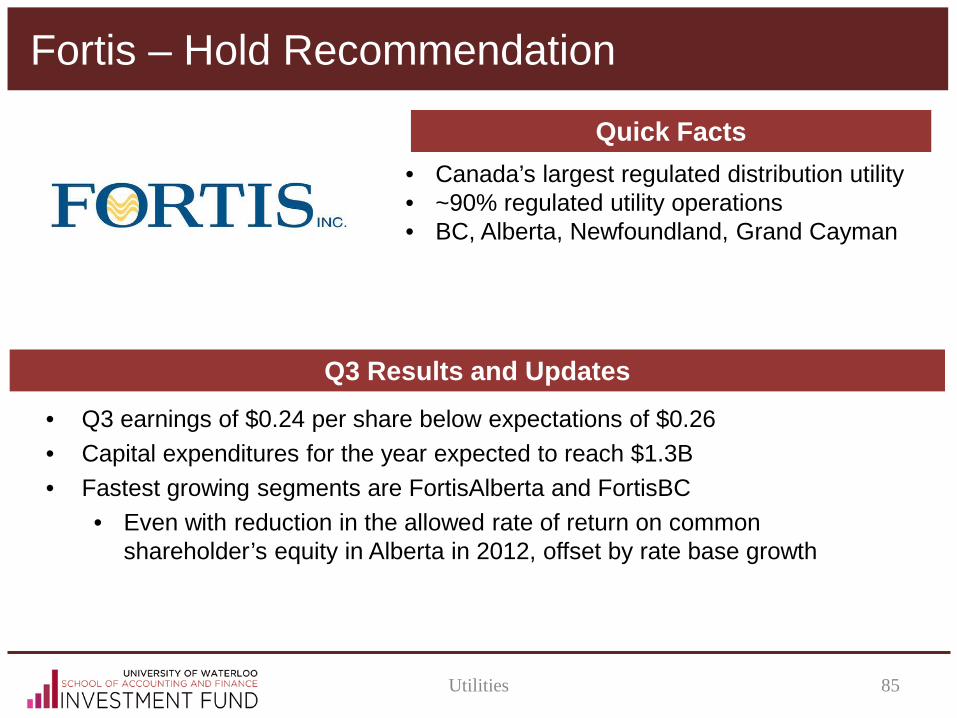
Fortis – Hold Recommendation
85
• Q3 earnings of $0.24 per share below expectations of $0.26 • Capital expenditures for the year expected to reach $1.3B • Fastest growing segments are FortisAlberta and FortisBC
• Even with reduction in the allowed rate of return on common shareholder’s equity in Alberta in 2012, offset by rate base growth
Q3 Results and Updates
• Canada’s largest regulated distribution utility • ~90% regulated utility operations • BC, Alberta, Newfoundland, Grand Cayman
Utilities
Quick Facts

Click to edit Master title style
QUESTION PERIOD SAF Investment Fund
Click to edit Master title style
NEXT STEPS SAF Investment Fund

Capturing Opportunities in the U.S
88
Update current back-testing procedure (Bloomberg EQS)
Create uniform quant screen
Complete detailed macro-scan for U.S market
Determine industries with high investment potential
Assign coverage analysts
Action Steps
December 4, 2012 - Advisory Board Meeting

Analyst Responsibilities – Continuation
89
• Quarterly Earnings Releases
• Significant Events
Continuing Coverage
• Results of Quant. Screening
• Change of Global Macro Outlook
Initiating Coverage
vs
December 4, 2012 - Advisory Board Meeting

Reporting Role
90
Weekly Monthly Quarterly
• Macro-economic analysis
• Detailed portfolio update
• Significant news releases
• Potential next actions to sell or add to existing positions
• List of transactions completed in month
• Copies of analysis reports
• Copies of trade approvals
• Summary of portfolio assets & market valuations
• Compliance report (SIPP)
• Macro-economic analysis
• Summary of portfolio assets & turnover
• Portfolio rate of return
• Performance relative to benchmark
• Summary of investment decisions made
• Proxy voting info
December 4, 2012 - Advisory Board Meeting
Click to edit Master title style
FINAL QUESTION PERIOD SAF Investment Fund

Click to edit Master title style
THANK YOU FOR LISTENING

Click to edit Master title style
APPENDICES
Click to edit Master title style
PORTFOLIO PERFORMANCE
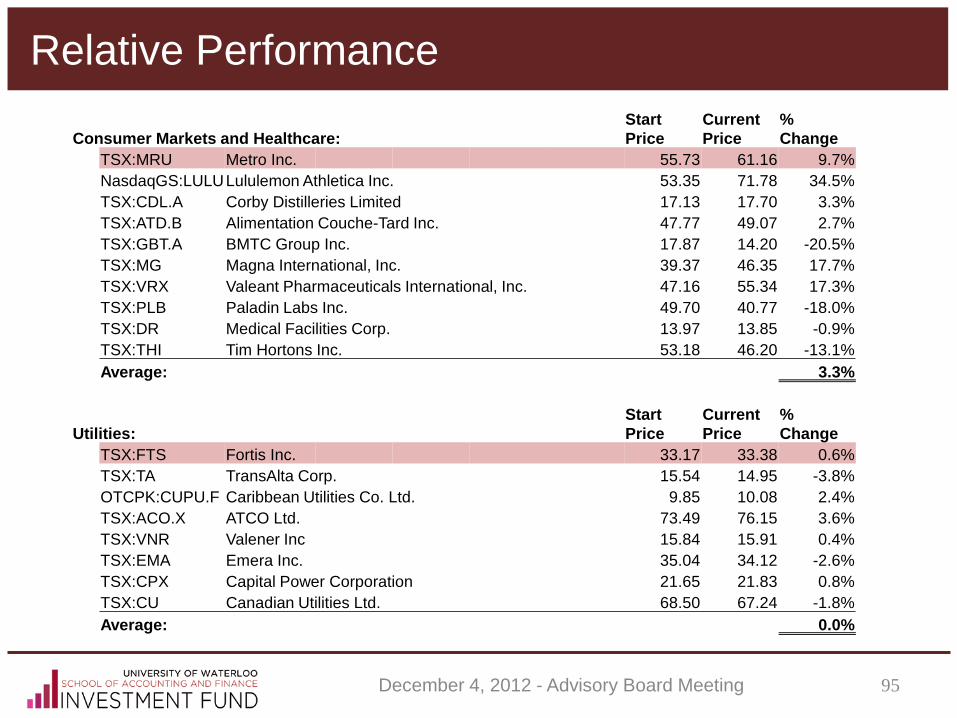
Relative Performance
95
Consumer Markets and Healthcare: Start Price
Current Price
% Change
TSX:MRU Metro Inc. 55.73 61.16 9.7% NasdaqGS:LULU Lululemon Athletica Inc. 53.35 71.78 34.5% TSX:CDL.A Corby Distilleries Limited 17.13 17.70 3.3% TSX:ATD.B Alimentation Couche-Tard Inc. 47.77 49.07 2.7% TSX:GBT.A BMTC Group Inc. 17.87 14.20 -20.5% TSX:MG Magna International, Inc. 39.37 46.35 17.7% TSX:VRX Valeant Pharmaceuticals International, Inc. 47.16 55.34 17.3% TSX:PLB Paladin Labs Inc. 49.70 40.77 -18.0% TSX:DR Medical Facilities Corp. 13.97 13.85 -0.9% TSX:THI Tim Hortons Inc. 53.18 46.20 -13.1% Average: 3.3%
Utilities: Start Price
Current Price
% Change
TSX:FTS Fortis Inc. 33.17 33.38 0.6% TSX:TA TransAlta Corp. 15.54 14.95 -3.8% OTCPK:CUPU.F Caribbean Utilities Co. Ltd. 9.85 10.08 2.4% TSX:ACO.X ATCO Ltd. 73.49 76.15 3.6% TSX:VNR Valener Inc 15.84 15.91 0.4% TSX:EMA Emera Inc. 35.04 34.12 -2.6% TSX:CPX Capital Power Corporation 21.65 21.83 0.8% TSX:CU Canadian Utilities Ltd. 68.50 67.24 -1.8% Average: 0.0%
December 4, 2012 - Advisory Board Meeting

Relative Performance
96
Banks: Start Price
Current Price
% Change
TSX:NA National Bank of Canada 74.56 77.58 4.1% TSX:BMO Bank of Montreal 57.43 59.67 3.9% TSX:LB Laurentian Bank of Canada 47.77 45.01 -5.8% TSX:CM Canadian Imperial Bank of Commerce 73.55 80.20 9.0% TSX:CWB Canadian Western Bank 26.30 29.10 10.6% Average: 4.4%
Insurance: Start Price
Current Price
% Change
TSX:IFC Intact Financial Corporation 62.46 64.10 2.6% TSX:GWO Great-West Lifeco Inc. 21.26 23.52 10.6% TSX:PWF Power Financial Corporation 24.31 26.51 9.0% TSX:POW Power Corporation of Canada 22.73 25.00 10.0%
TSX:IAG Industrial Alliance Insurance and Financial Services, Inc. 20.75 28.99 39.7%
Average: 14.4%
December 4, 2012 - Advisory Board Meeting
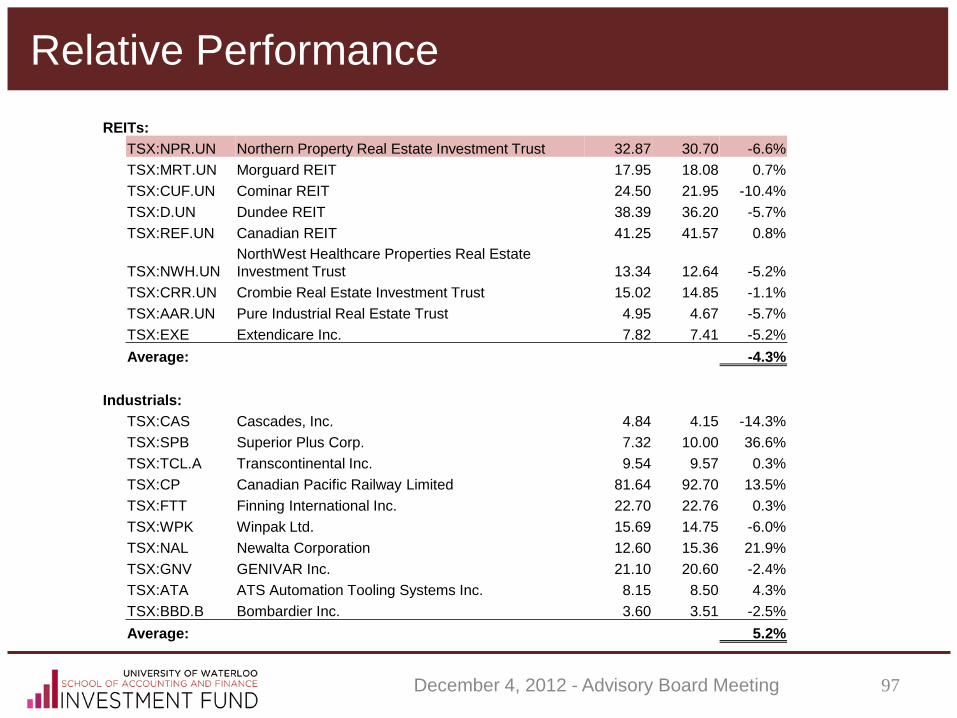
Relative Performance
97
REITs: TSX:NPR.UN Northern Property Real Estate Investment Trust 32.87 30.70 -6.6% TSX:MRT.UN Morguard REIT 17.95 18.08 0.7% TSX:CUF.UN Cominar REIT 24.50 21.95 -10.4% TSX:D.UN Dundee REIT 38.39 36.20 -5.7% TSX:REF.UN Canadian REIT 41.25 41.57 0.8%
TSX:NWH.UN NorthWest Healthcare Properties Real Estate Investment Trust 13.34 12.64 -5.2%
TSX:CRR.UN Crombie Real Estate Investment Trust 15.02 14.85 -1.1% TSX:AAR.UN Pure Industrial Real Estate Trust 4.95 4.67 -5.7% TSX:EXE Extendicare Inc. 7.82 7.41 -5.2% Average: -4.3%
Industrials: TSX:CAS Cascades, Inc. 4.84 4.15 -14.3% TSX:SPB Superior Plus Corp. 7.32 10.00 36.6% TSX:TCL.A Transcontinental Inc. 9.54 9.57 0.3% TSX:CP Canadian Pacific Railway Limited 81.64 92.70 13.5% TSX:FTT Finning International Inc. 22.70 22.76 0.3% TSX:WPK Winpak Ltd. 15.69 14.75 -6.0% TSX:NAL Newalta Corporation 12.60 15.36 21.9% TSX:GNV GENIVAR Inc. 21.10 20.60 -2.4% TSX:ATA ATS Automation Tooling Systems Inc. 8.15 8.50 4.3% TSX:BBD.B Bombardier Inc. 3.60 3.51 -2.5% Average: 5.2%
December 4, 2012 - Advisory Board Meeting

Relative Performance
98
Tech, Telecom, and Media: TSX:BCE BCE, Inc. 42.58 42.06 -1.2% TSX:T TELUS Corporation 62.71 64.84 3.4% TSX:RCI.B Rogers Communications Inc. 39.54 43.87 11.0% TSX:SJR.B Shaw Communications, Inc. 19.64 21.90 11.5% TSX:CJR.B Corus Entertainment Inc. 22.30 22.86 2.5% TSX:MDZ.A MDC Partners Inc. 9.45 10.61 12.3% TSX:CMG Computer Modelling Group Ltd. 18.07 19.74 9.2% TSX:CSU Constellation Software Inc. 91.00 119.86 31.7% TSX:BA Bell Aliant Regional Communications Inc. 25.09 27.19 8.4%
TSX:MBT Manitoba Telecom Services, Inc. 34.02 33.54 -1.4%
TSX:EXF EXFO Inc 4.75 4.48 -5.7% Average: 7.4%
Mining and Materials: TSX:CNQ Canadian Natural Resources Limited 27.60 28.59 3.6% TSX:LIM Labrador Iron Mines Holdings Limited. 2.04 0.69 -66.2% TSX:FM First Quantum Minerals Ltd. 17.93 20.40 13.8% TSX:PAA Pan American Silver Corp. 14.84 19.24 29.6% TSX:FR First Majestic Silver Corp. 16.07 22.89 42.4% TSX:RIO Rio Alto Mining Limited 4.37 5.06 15.8% TSX:MDI Major Drilling Group International Inc. 10.10 9.20 -8.9% TSX:FVI Fortuna Silver Mines Inc. 3.67 4.59 25.1% TSX:AGU Agrium Inc. 94.70 101.44 7.1% TSX:WEF Western Forest Products Inc. 0.96 1.15 19.8% Average: 8.2%
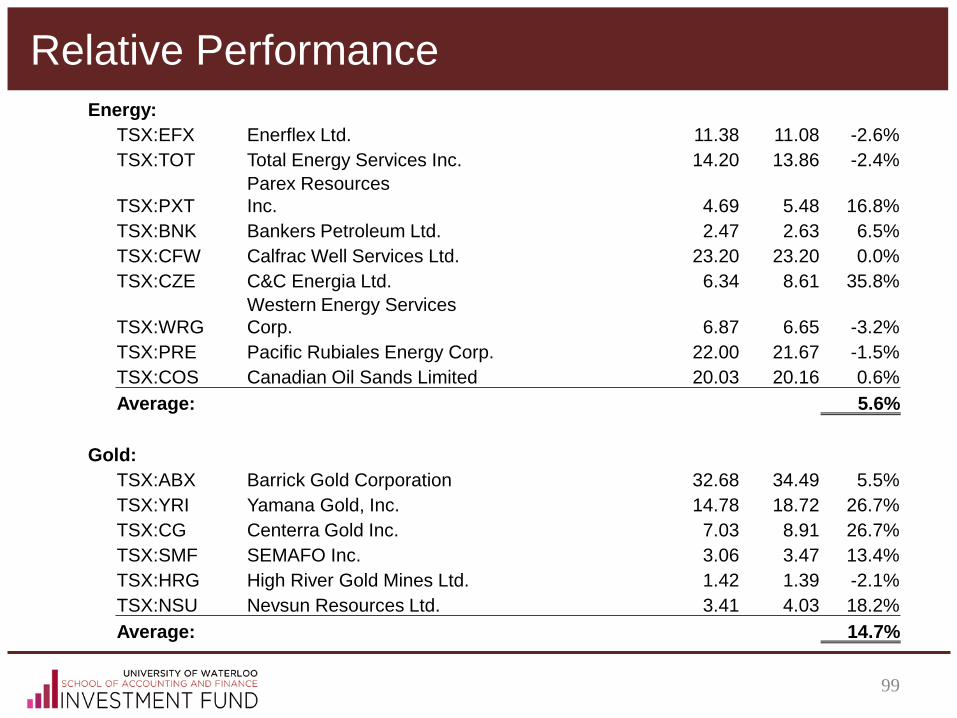
Relative Performance
99
Energy: TSX:EFX Enerflex Ltd. 11.38 11.08 -2.6% TSX:TOT Total Energy Services Inc. 14.20 13.86 -2.4%
TSX:PXT Parex Resources Inc. 4.69 5.48 16.8%
TSX:BNK Bankers Petroleum Ltd. 2.47 2.63 6.5% TSX:CFW Calfrac Well Services Ltd. 23.20 23.20 0.0% TSX:CZE C&C Energia Ltd. 6.34 8.61 35.8%
TSX:WRG Western Energy Services Corp. 6.87 6.65 -3.2%
TSX:PRE Pacific Rubiales Energy Corp. 22.00 21.67 -1.5% TSX:COS Canadian Oil Sands Limited 20.03 20.16 0.6% Average: 5.6%
Gold: TSX:ABX Barrick Gold Corporation 32.68 34.49 5.5% TSX:YRI Yamana Gold, Inc. 14.78 18.72 26.7% TSX:CG Centerra Gold Inc. 7.03 8.91 26.7% TSX:SMF SEMAFO Inc. 3.06 3.47 13.4% TSX:HRG High River Gold Mines Ltd. 1.42 1.39 -2.1% TSX:NSU Nevsun Resources Ltd. 3.41 4.03 18.2% Average: 14.7%