anc model comparison - nrc.gov · watts bar cycle 2 anc model comparison cycle i short window...
TRANSCRIPT

WATTS BAR Cycle 2 ANC Model ComparisonWith and Without TPBAR Assemblies
A. J. HartshornCore Analysip CDate: 3/.11fl
"1 have verified the attached and agree with its content."
Verified: . 9R. D. AnkneyCore Analysis ADate: &/i/e5 7
Approved: 13g.B. J. agerCore Analysis CDate: 3I 'l
© Westinghouse Electric Corporation 1997All Rights Reserved
9707280252 970721PDR ADOCK 05000390P PDR
I of 19MATERAIS TRANSMI"ElP HEREWITH
CONTAINS 2W90 INFORMATION

Watts Bar Cycle 2 ANC Model Summary
Two models were created for Watts Bar Cycle 2. These two models are identical with theexception of four assemblies. in the model without any TPBAR rods, these four assemblies eachcontain 104 IFBA rods and 4 WABA rods. In the model with the TPBAR rods, the fourassemblies each contain 104 IFBA rods and 8 TPBAR rods. The assemblies are located in H-7, J-8, G-8, and H-9 (i.e. quarter-core location (2,2)).
Table I contains the Cycle 1 burnup window, as well as mini-RSAC results. From Table 1, theuse of TPBAR rods result in a loss of 90-95 MWD/MTU lifetime. Also, the maximum bumupunder an RCCA increases by about 110 MWD/MTU with the TPBARs, but is still comfortablyunder the 35000 MWD/MTU limit. As expected with the additional burnable absorber strengthassociated with the 8 TBARs, the HZP MTC becomes more negative with the TPBARs.
The maximum FdH occurs between 8000-9000 MWD/MTtJ for both models. When the TPBARrods are used in the model, the peak is found in quarter-core location (4,6). The peak moves toquarter-core location (3,1) in the model without TPBARs. Again, this is due to the greaterburnable absorber strength of 8 TPBAR rods compared to 4 WABA rods. From Table 1, themaximum FdH on a core-wide basis does not differ greatly between the TPBAR and non-TPBARmodels. Table 2 shows the FdH and power for each assembly at BOL, MOL and EOL times inlife. The assembly FdH without the TPBARs is approximately 4-5% higher than the FdH withthe TPBARs. Table 2 also shows approximately a 4-8% greater power suppression with theTPBARs.
Finally, the depletion summaries for each model are documented in Table 3.
MATElIALS TRANSMITr0 HEREWIfTHCONTUMB 2280INFWOBATION
2 of 19
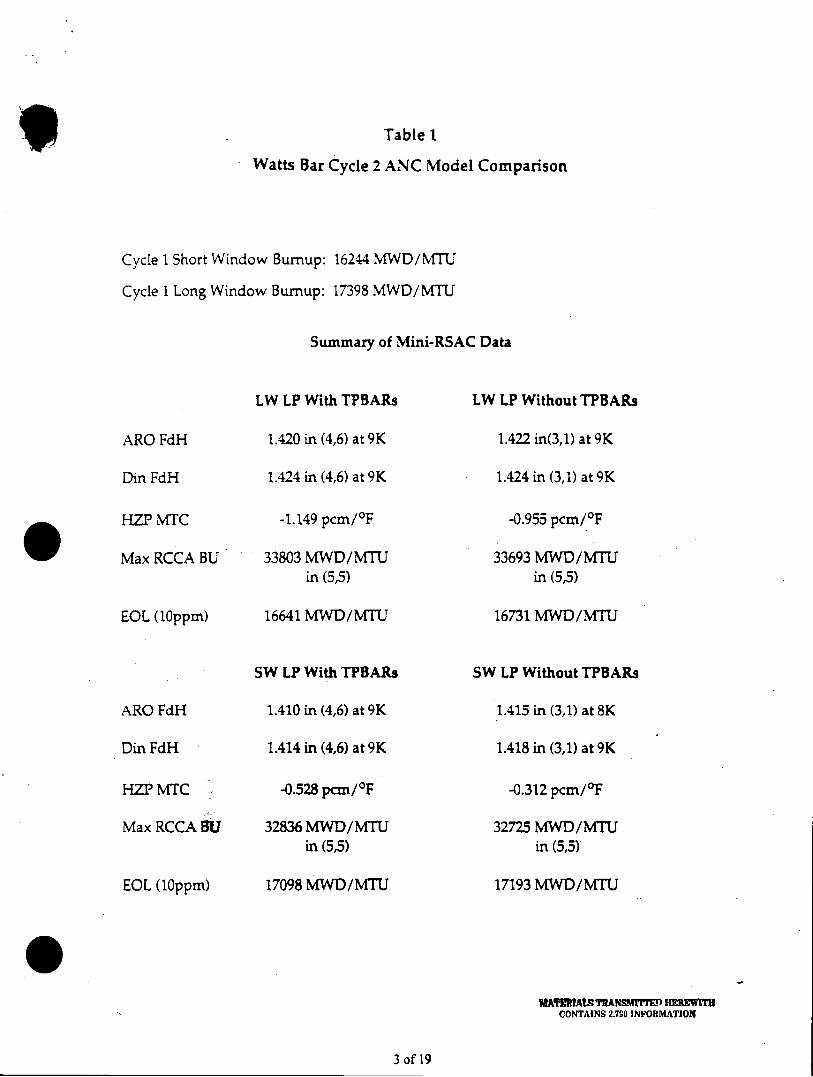
Table 1
Watts Bar Cycle 2 ANC Model Comparison
Cycle I Short Window Bumup: 16244 MWD/MTU
Cycle I Long Window Bumnup: 17398 MWD/MTU
Summary of Mini-RSAC Data
ARO FdH
Din FdH
HZP1' MTC
Max RCCA BU
EOL (l0ppm)
ARO FdH
Din FdH
HZP MTC -C
Max RCCA BU
EOL (l0ppm)
LW LP With TPBARs
1.420 in (4,6) at 9K
1.424 in (4,6) at 9K
-1.149 pcm/°F
33803 MWD/MTUin (5,5)
16641 MWD/MTU
SW LP With TPBARs
1.410 in (4,6) at 9K
1.414 in (4,6) at 9K
-0.528 pcm/°F
32836 MWD/MTUin (5,5)
17098 MWD/MTU
LW LP Without TPBARs
1.422 in(3,1) at 9K
1.424 in (3,1) at 9K
-0.955 pcm/°F
33693 MWD/MTUin (5,5)
16731 MWD/MTU
SW LP Without TPBARs
1.415 in (3,1) at 8K
1.418 in (3,1) at 9K
-0.312 pcm/°F
32725 MWD/MTUin (5,5)
17193 MWD/MTU
MA¶!A!tSTRANSBrwrM HEnRITCONTAINS 2.790 INFORMATION
3 of 19

Table 2
150 MWDfMTU Short Window with TPBARs
rH i;2':fAl;-?AGE -OWER .t'D F :.H
:.330
.367
2 ;. :;4
II.235
3 1.270
1.326
4 1.134
1.302
5 I.1 35
1.252
6 1.3000
1.066
7 L .355
'I. i 3
9 .632
.927
2
I. :, 4
1.235
!.:33
:.330
L .236
1.326
1.1.32
1.332
1.1335
1.245
I.1 29
L .258
:. :32
1.340
.539
.789
2 .270
i326
1.233
1.322
1.268
1.. 348
1..052
1.1 34
1.1 71
;.314
1.1.42
1.236
1.1 67
1.341.
.475
.737
4
:.:94
1.302
:.167
1.327
!.350
1.1.29
L .241
1.320
1.242
1.362
1.:55
' .266
1.000
1.231
.343
.634
1. 135
1.252
1.1L34
1.245
1. 1.73
1. 31.8
1 . 249
1 .366
1. .63
1. 2S52
1 .347
1 .222
.904
I . 000
1.'66
;.:31.
1 .261
1. :46
1.240
1.163
1 .275
I .054
1 .237
1.308
1.280
.366
.676
7
1. 355I . ;331.1 38
I 19 7
. 345
... :72
1. 346
1 .00 5
I .237
.657
.31.0
.366
. 673
.532
.327
.5 46
.796
.476
.740
.345
.637
NOTE - WDH VALUES REPRZSDNT HETEROGENEOUS PIN POWERS
PflMLRRA TRANSMrMTTD HEREMiTHCONTAINS 2.790 INFORMATION
4 of 19

Table 2 (continued)
150 MWD/MTU Short Window without TPBARs
: FSH k5S-SOBLY ;V^RAGZ PCWER A4ND F SH
: 2 3 4 5 6 7 a
.373 L.221 1.336 1.206 1.183 .392 1.343
.13 :.294 :.363 !.321 :.256 1.359 1.:25
2 1.221 :.292 :.Z56 1.;98 !.132 :.:31 :.:84
:.294 :.3a9 1.349 : .347 1. 239 1. 248 1.330
3 1.306 :.369 1.287 ;.354 1.167 1.135 !.158
.363 1.353 1.362 1.;33 1.303 !.228 1.331
4 :.236 1.233 1.356 1.237 :.239 1.150 . .393
1.32! 1.353 1.143 !.312 1.357 1.263 1.222
5 !.183 1.132 1.166 1.232 1.151 1.342 .649
1.256 1.238 1.305 1.353 1.239 1.223 .898
6 .392 1.179 1.131 1.142 !.034 .995
1.359 1.245 1.224 1.254 1.208 1.264
.5 25
.316
.539
.787
.472
.731
.341
.629
.36 1
.569
7 1.343 1.1!78 1.153 .988 .645 .361
;.125 1.326 1.327 1.216 .893 .667
a .625 .533 .469 .339
.916 .780 .727 .626
NOTE - 'DR VALUES RZPRZSENT HETEROGENEOUS P IN POWERS
MATERIALS TRANSMITE HEREWITHCONTAINS 2.9N INFORMATION
S of 19

Table 2 (continued)
9000 MWD/MTU Short Window with TPBARs
: -,H :S;N31t AVE-RAGE :CWEaR AND F OH
2 3 4 5 5 7 3
: .301 :..33 1.324 1.136 1.345 .371 .324 .548
.329 1.384 1.400 1.215 1.407 1. .54 1.012 .312
2 1.3C8 I .177 1.081 1.301 1.114 1.316 1.141 .490
1.a4 :.255 1.185 1.357 1.208 1.391 1.321 .708
3 1.324 1.^82 1.074 .978 1.326 1.099 1.145 .453
l.*00 1. a8 1.138 1.055 1.379 1.167 1.311 .676
4 1.136 1.305 .979 1.327 1.172 1.324 1.049 .349
1.215 1.362 1.055 1.397 1.269 1.410 1.283 .614
5 1.345 1.115 1.325 1.169 1.094 1.203 .672
1.407 1.208 1.378 1.268 1.168 1.329 .931
6 .971 1.316 1.098 1.320 1.198 .980 .370
1.354 1.391 1.165 1.407 1.320 1.230 .670
7 .924 1.:39 1.143 1.047 .670 .370
1.312 1.320 1.309 1.281 .929 .669
a .548 .486 .452 .348
.812 .705 .674 .614
NOTE - FOH VALUES RZPRESEN HETEROGZENOUS ?IN POWERS
MATERIALS TRANSMI.VJ) HERMCONTAINS 2.790 INFORMATION
6 of 19

Table 2 (continued)
8000 MWD/MTTU Short Window without TPBARs
9-FDH ASS-XBLY AVi-!AXZ PCWER AND F OH
: 2 3 4 5 6 7 a
.332 1-50 1.348 1.140 1.338 .967 .922
.361 :.:24 1.415 1.225 1.399 1.350 1.011
. 543
. 309
2 1.350 1.271 1.103 1.294 :.111 1.310 1.140 .485
I.124 1.322 1.202 1.353 1.206 1.382 1.319 .704
3 1.34a 1. :05 I . 8 5 . 976 1.311 1.097 1.143 .44a
11.415 .205 1.143 1.051 1.364 1.165 1.309 .672
4 1.140 1.298 .977 1.321 1.171 1.315 1.043 .343
1.225 1.358 1.351 1.391 1.269 1.401 1.278 .610
S 1.338 1.111 1.310 1.168 1.091 1.189 .664
1.399 1.206 1.363 1.267 1.167 1.310 .925
6 .967 1.309 1.096 1.311 1.183 .974 .364
1.050 1.381 1.163 1.396 1.301 1.226 .664
7 .922 1.138 1.142 1.041 .663 .364
1.011 1.318 1.307 1.276 .923 .662
8 .543 .482 .447 .343
.809 .701 .671 .609
NOTSE-- vTH VALUES aRPRZSENT HETEROGENEOUS P IN PCWERS
MAT1RAI TRANSMnM I*REWITII~NTAuIS 2.790 INFORMATION
7 of 19

Table 2 (continued)
17470 MWD/MTU Short Window with TPBARs
2 -. :; 3N3: 4 A;T C FE AND 5 -7H
i 2 1 4 5 5 7 a
I .366 1.323 1.291 1.098 1.297 .971 .952
.395 1.0a3 1.347 1.167 1.345 1.040 1.021
.613
.864
2 1.023 1.196 1.066 1.288 1.082 1.276 1.138 .549
1.33 1.258 1.152 1.352 1.160 1.335 1.279 .760
3 1.291 1.067 1.070 .378 1.299 1.067 1.134 .507
1.347 1.153 1.126 1.043 1.359 1.123 1.269 .726
4 1.298 1.290 .379 1.283 1.128 1.281 1.059 .396
12.67 1.354 1.043 1.333 1.208 1.349 1.251 .658
5 1.297 1.Q83 1.299 1.127 1.069 1.209 .713
1.345 1.160 1.360 1.207 1.132 1.336 .948
6 .971 1.276 1.067 1.280 1.207 1.002 .417
1.040 1.335 1.123 1.346 1.332 1.206 .706
7 .952 1-.37 1.134 1.059 .713 .417
-321 1.279 1.270 1.252 .948 .706
9 .613 .545 .507 .396
.364 .757 .726 .658
NOTE- FP8 VALUES R1PRBSDIT HETEROGENEOUS PIN POWERS
MATSIMALS TRANSMICmE HEnvITUCONTAICS 2.760 INFoRmATION
8 of 19

Table 2 (continued)
17470 MWD/MTU Short Window without TPBARs
O F: AS3EM:Y A;-RAGE .=CwEt AND F 0H
1 2 3 4 , 6 7 a
; .372 1.330 1.288 1.092 1.293 .970 .951 .612
.901 1.3-7 1.340 1.161 1.340 1.038 1.020 .363
2 1.030 1.246 1.066 1.282 1.079 1.275 1.138 .548
1.387 :.310 1.147 1'.45 1.157 1.333 1.279 .759
3 1.238
!.340
:.367 1. '67 .374 1.297 1.066 1.134 .507
:. :a 1.121 :.039 1.358 1.122 1.270 .726
1.392 1.294 .375 1.280 1.127 1.282 1.059
1.161 1.348 1.039 1.331 1.206 1.350 1.252
5 1.293 1.079 1.297 1.125 1.069 1.210
1.340 1.158 1.358 1.206 1.132 1.337
6 .370 1.275 1.066 1.281 1.208 1.003
1.038 1.334 1.122 1.347 1.333 1.207
. 395
. 65a
.7.13
.949
.417
.706
7 .951 1.137 1.134 1.360 .713 .416
1.020 1.279 1.270 1.253 .949 .705
8 .612 .545 .507 .395
.a63 .756 .725 .658
NOTS -FDR VALUES REMSENT HETZROGEMEOUS PIN POWERS
MATERIALS TRANSMIr1 HEREWITHCONiTAMS 2JS0 UFOBMATION
9 of 19

Table 2 (continued)
150 MWD/MTU Long Window with TPBARs
-3X A;'3SILY NV;-RAG?' ?CWER ;.,I F 'H
; 2 3 4 5 6 7
I .304 1. :34 1.256 1.177 1.182 .992 1.053 .631
.939 1.203 1.312 1.283 1.246 1.055 1.133 .933
2 1.134 1.175 1.209 1.179 1.122 1.198 1.210 .544
1.203 1.311 1.298 1.314 1.233 1.275 1.360 .795
3 1.256 1.212 1.247 1.034 1.176 1.143 1.190 .479
1.312 1.303 1.329 1.107 1.323 1.238 1.363 .744
4 1.177 1.184 1.037 1.242 1.249 1.180 1.025 .347
1.283 1.319 1.112 1.324 1.366 1.287 1.260 .643
5 1.182 1.123 1.174 1.242 1.165 1.375 .666
1.246 1.232 1.318 1.362 1.254 1.253 .920
6 .992 1.195 1.139 1.171 1.067 1.031 .370
1.055 1.271 1.234 1.278 1.239 1.308 .687
7 1.053 1.204 1.185 1.020 .663 .369
1.133 1.355 1.358 1.253 .915 .685
8 .631 .537 .476 .345
.933 .788 .740 .640
DO FDOE VALie AftUSK RWTEOGMMRUS PIN PIAMS
MATERIALS TRANSMITrT) HEREWITHCOTAANS 2.790 INFORMATION
10 of 19

Table 2 (continued)
150 MWDJMTU Long Window without TPBARs
C FOH A3SLMBLY AVIRAGE PCWER AND F OH
1 2 3 4 5 6 7 3
i .952 1..30 1.293 1.9a9 £.181 .985 1.341 .623
.389 1.262 1.346 1.301 1.250 1.048 1.121 .922
2 1.190 1.274 1.242 1.190 1.119 1. La 1.197 .537
1.262 1.369 1.325 1.334 1.227 1.262 1.346 .786.
3 !.293 1.245 1.265 1.037 1.170 1.133 1.176 .472
1.346 1.329 1.340 1.115 L.314 1.226 1.348 .735
4 1. 89 L.:95 1.040 1.238 1.240 1.167 1.013
1.301 1.340 1.121 1.316 1.358 1.275 1.245
.342
. 635
5 1.181 1.120 1.168 1.232 1.154 1.062 .657
1.250 1.226 1.310 1.354 1.241 1.239 .909
6 .985 1.186 1.129 1.159 1.054 1.018 .365
1.348 1.259 1.221 1.266 1.225 1.292 .678
7 1.041 1.191 1.171 1.007 .654 .364
1.121 1.341 1.343 1.239 .903 .676
a .623 .530 .469 .340
.922 .779 .731 .631
NOTE - ragj VALUZS RBPRBS3Nr HZTZROGENOUS PIN POWERS
MATERIALS TRANSMfrTED HEDUWITCONTAINS 2.790 INFORMATION
11 of 19

Table 2 (continued)
9000 MWD/MTU Long Window with TPBARs
9 ?0SS A;MELY AVER.AGF ?CWER ANDF ~ H
: 2 3 4 5 6 7 a
1 .793 .399 1.329 1.130 1.350 .963 .919 .543
.320 1.074 1.406 1.212 1.412 1.045 1.004 .812
2 .999 1. :79 1.075 1.305 1.107 1.323 1.147 .484
1.074 1.256 1.181 1.362 1.200 1.397 1.330 .701
3 1.329 :.376 1.368 .969 1.331 1.093 1.153 .447
1.406 1.184 1.134 1.045 1.386 1.158 1.320 .670
4 1.130 1.309 .371 1.331 1.171 1.335 1.058 .345
1.212 1.367 1.046 1.403 1.270 1.420 1.295 .611
5 1.350 1. 107 1.331 1.168 1.090 1.214 .671
L.412 1.201 1.385 1.26a 1.167 1.341 .931
6 .963 1.322 1.092 1.330 1.208 .988 .366
1.045 1.397 1.157 1.416 1.332 1.241 .667
7 .919 1.145 1.151 1.056 .669 .366
1.004 1.329 1.319 1.293 .928 .666
a .543 .480 .446 .344
.312 .698 .66a .610
NOTC- FOD VALUES REPRESZENT HETEROGENEOUS PI N POWERS
MATERIALS 7RANSMTm) mmEmPCONTAjNS 2.790 INFOHMATION
12 of 19

Table 2 (continued)
9000 MWD/MTU Long Window without TPBARs
; -OH ASSEMBLY AVERAGE ?CWER A.D F OH
1 2 3 4 5 6 7 3
.927 1.038 1.353 1.133 1.344 .957
.ass 1.110 1.422 1.217 1.408 1.039
.313 .539
.998 a.06
2 1.03a 1.275 1.093 1.307 1.102 1.314 1.139
1.1-10 1.327 1.194 1.366 1.194 1.389 1.322
3 1.353 1.395 1.076 .968 1.324 1.086 1.145
1.422 1.136 1.136 1.041 1.378 1.151 1.311
.480
.696
.444
. 665
4 1.133 1.311 .369 1.327 1.165 1.326 1.050 .342
1.217 1.371 1.C42 1.397 1.264 1.411 1.287 .606
5 1.344 1.103 1.324 1.162 1.084 1.206 .666
1.408 1.194 1.377 1.263 1.160 1.332 .925
6 .357 1.314 1.085 1.322 1.201 .982 .364
1.039 1.389 1.150 1.407 1.323 1.234 .663
7 .313 1.137 1.144 1.049 .664 .363
.398 1.320 1.310 1.285 .922 .662
a .539 .476 .443 .341
.406 .692 .663 .605
NOTE FD* VALUNS RRPRZSIWT HETEROGENROUS PIN POWZRS
MATERIALS TRANSMn-.4 ERMTEWCOMANS 2.71s NFRAT(
13 of 19

Table 2 (continued)
17470 MWD/MTU Long Window with TPBARs
- :; -- :AGCER k N0 3H
2 3 4 5 6 7 3
I .363 !.,19 *.301 1.396 1.304 .365 .347 .608
.391 1.379 1.357 1.169 1.352 1.033 1.015 .864
2 :.019 1.234 1.065 1.296 1.077 !.282 1.142 .542
1.079 1.267 1.153 1.361 1.;54 1.340 1.285 .752
3 1.301 1.066 1.069 .972 1.305 1.360 1.138 .501
1.357 1.155 1.130 1.036 1.365 1.115 1.275 .719
4 1.396 1.298 .973 1.289 1.127 1.287 1.363 .390
1.169 1.364 1.037 1.339 1.209 1.355 1.257 .653
5 1.304 1.078 1.306 1.125 1.065 1.214 .709
1.352 1.155 1.366 1.208 1.129 1.341 .943
6 .365 1.282 1.060 1.286 1.212 1.006 .411
1.033 1.341 1.115 1.352 1.337 1.211 .700
7 .347 1.:41 1.139 1.063 .709 .411
1.015 1.285 1.275 1.257 .944 .700
8 .60a .539 .500 .390
.d64 .749 .718 .653
S0TE, - FDH VALUES REPRESENT HETEROGENEOUS PIN POWERS
MAYT9UAL9 TRANSMITTE HEREWITHCONTAINS 2.790 INFORMATION
14 of 19

Table 2 (continued)
17470 MWD/MTU Long Window without TPBARs
E FCH ASSEMBLY AVERAGE ?OWER VAND F OH
1 2 3 4 5 6 7 3
1 .869 !.026 1.03a 1.091 1.300 .363 .946 .607
.897 1.084 1.350 1.163 1.347 1.031 1.014 .362
2 1.326 S.255 1.366 1.290 1.074 1.281 1.142 .541
1.084 1.319 1.'48 1.355 1.152 1.339 1.285 .752
3 1.298 1.367 1.066 .369 1.303 1.059 1.138 .500
1.350 1.150 1.125 1.033 1.364 1.114 1.275 .719
4 1.091 1.292 .970 1.287 1.126 1.287 1.063 .390
1.:63 :.357 1.334 1.337 1.207 1.355 1.257 .652
5 1.300 1.075 1.303 1.124 1.064 1.215 .709
1.347 1.153 1.364 1.207 1.129 1.342 .944
6 .963 1.281 1.060 1.286 1.213 1.006 .410
1.331 1.339 1.115 1.352 1.337 1.212 .699
7 .946 1.141 1.139 1.063 .709 .410
1.014 1.285 1.276 1.258 .944 .699
a .607 .s38 .500 .390
.862 .748 .717 .652
NOTETS FD VALUES RaPR2S323 HETERCGENECUS PtN POWERS
-M2ATERIALS TRANSMrfrP ummma.CONTAINS .790 INFORMATION
1S of 19

Table 3
Short Window Depletion Summary with TPBARs
No au POWER EIGEN BORON CON TIN XE SM FQ FOH FZ A/O
HD HD 2.066
DP DP 2.147
DP DP 1.847
DP DP 1.628
DP DP 1.613
DP DP 1.605
DP DP 1.621
DP DP 1.643
OP DP 1.644
OP DP 1.648
OP DP 1.634
OP DP 1.613
OP DP 1.603
DP DP 1.582
DP DP 1.560
DP DP 1.558
DP DP 1.550
DP DP 1.543
DP DP 1.531
DP DP 1.536
1.376
1.3 661 . 3 51.355
1.364
1.365
1.365
1.384
1.399
1.406
1.4 10
1.4 10
1.407
1.403
1.397
1.392
1.387
1.38a
1.373
1.364
1.360
1.344
1.402
1.235
1 . 159
1.139
1.136
1. 142
I . 148
1.144
1.142
1.133
1. 121
1.114
1 .105
1.095
1.100
1.101
1.104
1.104
1.113
1.62
-4. 71
4.76
*5.02
5.29
4.82
*3.68
*2.98
2.34
2.92
2.50
*2.49
*2.21
*1.66
-1.85
-2.06
-2.31
*2 .58
MATMMLSLS TRANSM7rrETT iPrwr'p00AffWFS 1790 INFYORMATION
16 of 19
1.
2
3
4
5
6
7
8
9
10
11
12
13
14
15
16
17
18
19
20
a150
1000
2000
3000
4000
5000
6000
7000
a000
9 000
10000
110 0
12000
13000
14000
15000
16000
17000
17470
1.00 0
1.00 0
1. CO 0
1.000
1.000
1.000
1.000
1.00 0
1.000
1.000
1.000
1.000
1.000
1.000
1. 000
1.000
1.000
1.00 0
1.000
1.000
1.000000
.999999
.999999
1.0000001
.999999
.999999
.999999
.999998
.999998
.999999
.999997
.999999
1.00 00 01
1.000005
1.0000001
.999999
1.000000
1.000000
1.000000
1.000000
PPM
1347
994
99a
1024
1034
1025
996
949
887
a16
741
660
575
486
395
301
207
112
19
-24
G/KG DEC-
7.704 560.6
5.687 560.6
5.705 560.6
5.856 560.6
5.912 560.6
5.863 560.6
5.699 560.6
5.429 560.6
5. 0 7 5 s 60.6
4.667 560.6
4.239 560.6
3.777 560.6
3.287 560.6
2.778 560.6
2.257 560.6
1.722 560.6
1.182 560.6
.643. 560.6
.111 560.6
- .136 560.6
DEG C
293.7
293.7
293.7
293.7
293.7
293.7
293.7
293.7
293.7
293.7
293.7
29 3.7
293.7
293.7
293.7
293.7
293.7
293.7
293.7
293.7

Table 3 (continued)
Short Window Depletion Summary without TPBARs
NO SU POWER EI1EN 9ORON CON
2
13
4
S
6
7
8
9
10
12
1 3
1 4
1 5
1 6
1 7
198
1 9
20a
2 1
0 1.000
150 1.000
1000 1.000
2000 1.000
3000 1.300
4000 1.000
5000 1.000
6000 1.000
7000 1.000
0000 1.000
9000 1.000
10000 1.000
11000 1.000
12000 1.000
13000 1.000
14000 1.000
15000 1.000
16000 1.000
17000 1.000
17450 1.000
17470 1.000
1.000000
1.000002
.399997
.999999
.999999
.999999
1.000005
1.000002
.999996
.999999
1.000000
1.000000
1.000000
I .000001
1.000002
.999998
.999997
1.000004
.999998
1.000001
.999999
PPM
1354
1001
1004
1031
1040
1032
1004
957
895
825
750
669
585
495
403
310
216
12 1
2 8
-14
-15
TIN XE SM FQ FOH FZ
G/KG DEG-P DEG-C
7.746 560.6 293.7
5.726 560.6 293.7
5.742 560.6 293.7
5.894 560.6 293.7
5.951 560.6 293.7
5.905 560.6 293.7
5.743 560.6 293.7
5.476 560.6 293.7
5.120 560.6 293.7
4.720 560.6 293.7
4.291 560.6 293.7
1.828 560.6 293.7
3.343 560.6 293.7
2.832 560.6 293.7
2.307 560.6 293.7
1.774 560.6 293.7
1.234 560.6 293.7
.691 560.6 293.7
.159 560.6 293.7
-. 079 560.6 293.7
-.08o 560.6 293.7
HD HD 2.175 1.402 1.35S
DP DP 2.251 1.389 1.416
DP DP 1.922 1.370 1.240
DP DP 1.665 1.361 1.159
DP DP 1.592 1.373 1.137
DP DP 1.587 1.384 1.134
DP DP 1.602 1.400 1.141
DP DP 1.629 1.405 1.150
DP DP 1.634 1.410 1.146
DP DP 1.639 1.415 1.144
DP DP 1.629 1.414 1.134
DP DP 1.620 1.411 1.128
DP DP 1.589 1.404 1.110
DP DP 1.584 1.393 1.108
DP DP 1.565 1.387 1.101
DP DP 1.551 1.383 1.097
DP DP 1.546 1.378 1.099
DP DP 1.541 1.370 1.103
DP DP 1.535 1.362 1.108
DP DP 1.530 1.358 1.109
DP DP 1.528 1.35S 1.107
MAML4 O N TRANSMITrEr) HER"WJTCONTAiNS 2
790 INFP~fMATION
17 of 19
A/0
1.96
-4.56
4.62
-4.8I
- 5. 12
4.70
- 3.63
3 .02
2 .54
2. 80
-2.47
-2.75
-1.93
-2.38
-2.07
-1.77
- 1. 79
2 .11
-2.36
-2.47
-2.47

Table 3 (continued)
Long Window Depletion Summary with TPBARs
Bo au POWER EIGEN BORON CON
PPM G/KG
1 0 1.000 1.000000 1298 7.425
2 150 1.000 1.000000 942 5.389
3 1000 1.000 .999998 943 5.392
4 2000 1.000 1.000002 971 5.555
5 3000 1.000 1.000001 982 5.619
6 4000 1.000 .999999 975 5.579
7 5000 1.000 .999999 947 5.419
8 6000 1.000 1.000004 900 5.150
9 7000 1.000 .999985 840 4.802
10 8000 1.000 1.000001 770 4.401
11 9000 1.000 1.000000 695 3.974
12 10000 1.000 .399996 615 3.520
13 11000 1.000 .999998 530 3.034
14 12000 1.000 .999999 441 2.525
15 13000 1.300 1.000001 350 2.000
16 14000 1.000 1.000000 257 1.470
17 15000 1.000 1.000002 163 .932
is 16000 1.000 1.000000 69 .397
19 17000 1.090 .999999 *23 *.131
20 17470 1.000 .999998 -66 *.375
TIN XE
DEG-F DEG-C
560.6 293.7 HD
560.6 293.7 DP
560.6 293.7 DP
560.6 293.7 OP
560.6 293.7 DP
560.6 293.7 DP
560.6 293.7 DP
560.6 293.7 DP
560.6 293.7 DP
560.6 293.7 DP
560.6 293.7 DP
560.6 293.7 OP
560.6 293.7 DP
560.6 293.7 DP
560.6 293.7 DP
560.6 293.7 DP
560.6 293.7 DP
560.6 293.7 DP
560.6 293.7 DP
560.6 293.7 DP
SM FQ FDO FZ A/O
2.260
2.246
1.931
1.719
1.680
1 .646
1.659
1 .663
1.655
1.657
1.638
1.610
1.584
1.569
1.560
1.548
1.543
1.540
1.541
1.532
1.377
1.366
1.373
1.380
1.379
1.375
1.398
1.410
1.417
1.420
1.420
1.416
1.410
1.404
1.398
1.394
1.387
1.379
1.370
1.366
1. 481
1.476
1.299
1.209
1. 175
1.155
1.155
1.153
1.146
1.142
1.131
1.118
1.104
1. 0 9 2
1.09 1
1.089
1.092
1.096
1.105
1.102
*5.49
* 9.78
- 8 65
a 8.45
7.794
* 6 .16
-4.49
*3.22
- 1.76
*2.39
*2.05
-1.01
.98
*1.20
1 .44
-1.14
*1.37
* 1.75
*2.19
*2.18
MATERIALS TRANSMrlr&Tn HlEnwITCONTAINS 2.790 INFORMATION
18 of 19

Table 3 (continued)
Long Window Depletion Summary without TPBARs
.0 SU ?OWER ElGEN BORON CON TIN XE SH FQ FD# FZ A/O
0 1.000 .999998
;50 1.000 1.000001
1000 1.000 .999997
2000 1.000 .999997
3000 1.000 1.000003
4000 1.000 1.000001
5000 1.300 1.000000
6000 1.000 .999996
7000 1.000 .999994
8000 1.000 .999996
9000 1.000 .999999
10000 1.000 .999997
11000 1.000 1.000001
12000 1.000 1.000001
13000 1.000 .999998
14000 1.000 1.000001
15000 1.o00 .999998
16000 1.000 1.000000
17000 1.000 1.000000
17450 1.000 .999999
17470 1.000 .999999
PPM
1305
949
949
978
989
982
955
909
848
779
704
624
540
451
359
266
172
7a
15
-56
*57
G/KG OEG-F DEG-C
7.465 560.6 293.7 HD HD 2.374
5.428 560.6 293.7 DP DP 2.357
5.429 560.6 293.7 DP DP 2.000
5.592 560.6 293.7 DP DP 1.728
5.658 560.6 293.7 DP DP 1.654
5.619 560.6 293.7 OP DP 1.625
5.463 560.6 293.7 DP DP 1.642
5.201 560.6 293.7 DP DP 1.646
4.851 560.6 293.7 DP DP 1.643
4.455 560.6 293.7 DP DP 1.641
4.029 560.6 293.7 DP DP 1.633
3.571 560.6 293.7 DP DP 1.612
3.086 560.6 293.7 DP DP 1.592
2.579 560.6 293.7 DP DP 1.565
2.0s5 560.6 293.7 DP DP 1.555
1.520 560.6 293.7 DP DP 1.549
.983 560.6 293.7 DP OP 1.543
.446 560.6 293.7 DP DP 1.539
-. 084 s60.6 293.7 DP DP 1.537
-. 318 560.6 293.7 DP DP 1.527
*.329 560.C 293.7 DP DP 1.520
1.380 1.490 s5.21
1.369 1.494 a.71
1.360 1.301 -8.58
1.366 1.214 8.39
1.366 1.169 -7.63
1.379 1.152 -6.0o
1.395 1.155 *4.53
1.40S 1.152^ -. 70
1.414 1.147 -1.79
1.420 1.142 -1.90
1.422 1.133 -1.84
1.419 1.119 -1.56
1.412 1.109 -1.39
1.405 1.092 -1.17
1.396 1.089 -1.22
1.390 1.092 -1.59
1.384 1.093 -1.42
1.376 1.097 -1.79
1.368 1.105 -2.22
1.364 1.103 -2.22
1.364.1.103 -2.24
MATERIALS TRANSMITr' FHERMWITHCONTAINS 2.790 INFORMATION
19 of 19
2
3
4
10
1 1
12
13
1 4
I5
16
1 7
18a
19
20
21

ENCLOSURE 3
PHOENIX-P/ANCCOMPUTER CODE CHANGES
NON-PROPRIETARY VERSION
NAwzyw ASnrrmWsyCONTAINS 2.790 INFORMATION
E3-1

aWestinghouse Non-Proprietary Class 3
Final Modifications to the PHOENIX-P/ANC Code SystemFor Explicit Modeling of TPBARs
Introduction
Reference 1 described the modifications and testing of the PHOENIX-P2 ,3 code version, calledPHOENIX-L, which was developed for the modeling of Tritium Producing Burnable Absorber Rods(TPBARs). As discussed in that letter, [
]a,c
PHOENIX-L Code Logic Additions and Testing
The code logic additions necessary to implement the full TPBAR depletion chain in PHOENIX-L weresmall. The equations which describe the tritium/helium-3 chain were implemented into the TPBARdepletion logic within PHOENIX-L. Also, logic was added to the code to permit it to write necessaryinformation to databanks. No changes to the fundamental solution algorithm were necessary. Also, nonew cross section library updates were needed since the cross sections for tritium and helium-3 werepreviously added to the library1 .
Reference 1 described the code testing that was performed for the original PHOENIX-L version. Thistesting was repeated for this new version. As before, the test matrix consisted of a set of generic testmatrix problems, which are routinely used to test the production PHOENIX-P version, plus a set ofversion-specific test cases. The generic test matrix confirmed that the new PHOENIX-L version willproduce results identical to the production version of PHOENIX-P for fuel depletion problems notinvolving TPBARs. Overall, the results of the generic test cases were consistent with expectations. Theresults of the version-specific test cases were also consistent with expectations; the new PHOENIX-Lversion properly depleted the TPBARs and properly tracked the production and decay of tritium as wellas the production of helium-3 and neutron absorption in helium-3.
Since no changes were made to the fundamental solution algorithm or cross section library, References 2and 3 remain appropriate references for the PHOENIX-L version of PHOENIX-P.
ANC-L Code Logic Additions and Testing
ANC2 ,4 is an advanced nodal code capable of two-dimensional and three-dimensional reactor corecalculations. PHOENIX-P is used to calculate the necessary fuel and burnable absorber cross sectiondata for ANC. ANC uses this data to predict core power distributions, reactivity coefficients, etc.
]ac CONTAINSM2?719 HI EWRIO'W]acCONTAINS 2.79 INFCBMATID.

Westinghouse Non-Proprietary Class 3
The ANC code modifications described above have been incorporated into a version of ANC calledANC-L to distinguish it from the standard production version of ANC. No changes to the basic ANCneutronic solution algorithm were made in this code version. The changes to the code were limited tothose required for explicit modeling of the TPBARs, as described above, and editing routines that provideconvenient TPBAR modeling and performance information for the code user. Since no changes weremade to the ANC fundamental solution algorithm, References 2 and 4 remain appropriate references forthis code version.
The testing of ANC-L included the execution of a generic test matrix and the execution of a version-specific test matrix. The generic test matrix consisted of a set of standard ANC problems which aredesigned to test a wide range of code features and capabilities. These generic cases did not includeTPBARs. In all instances, ANC-L produced identical results to the production version of ANC for thisgeneric test matrix. The version-specific test matrix consisted of a set of additional test cases designed toensure that the TPBARs were being modeled and depleted correctly and that standard code featuresaffected by burnable absorbers function normally in the presence of TPBARs. Detailed review of thesetest cases demonstrated that the ANC-L version of ANC is, indeed, modeling the TPBARs as intendedand performing as expected.
Summary
Explicit TPBAR modeling capability has been added to PHOENIX-P and ANC. The code versionswhich incorporate these capabilities are called PHOENIX-L and ANC-L, respectively. These new codes
1versions permit explicit modeling and tracking of the three principal TPBAR isotopes, lithium-6, tritium,and helium-3. Testing of these code versions has been completed with the result that the codes areperforming as expected.
MATERIALS TRANSMITTEM aREWrTCONTAINS 2.790 INFORMATION

a
MATEMIXLS TRANSM1TIEP HEMEWITHCONTAINS 2.90 INFORMATION
Westinghouse Non-Proprietary Class 3
References
1. Letter from S. M. Sohinki, DOE, to Document Control Desk, transmitting requested informationon failure modes and effects analysis and modifications made to the PHOENIX-P computersoftware, March 12, 1997.
2. Nguyen, T. Q. et al., Qualification of the PHOENIX-P/ANC Nuclear Design System forPressurized Water Reactor Cores, WCAP- 11596-P-A, June 1988 (Westinghouse Proprietary).
3. Harris, A. J., Mayhue, L. T., and Mildrum, C. M., A Description of the Nuclear Design AnalysisPrograms for Boiling Water Reactors, WCAP- 10I06-P-A, June 1982 (WestinghouseProprietary).
4. Liu, Y. S., et al., ANC-A Westinghouse Advanced Nodal Computer Code, WCAP- 10965-P-A(Proprietary) and WCAP-1 0966-P-A (Nonproprietary), December 1985.

4

E
DRP-013
m hi
PROPRIETARY INFORMATION
NOTICE
THE ATTACHED DOCUMENT CONTAINS OR ISCLAIMED TO CONTAIN PROPRIETARY INFORMATIONAND SHOULD BE HANDLED AS NRC SENSITIVEUNCLASSIFIED INFORMATION. IT SHOULD NOT BEDISCUSSED OR MADE AVAILABLE TO ANY PERSONNOT REQUIRING SUCH INFORMATION IN THECONDUCT OF OFFICIAL BUSINESS AND SHOULD BESTORED, TRANSFERRED, AND DISPOSED OF BY EACHRECIPIENT IN A MANNER WHICH WILL ASSURE THATITS CONTENTS ARE NOT MADE AVAILABLE TOUNAUTHORIZED PERSONS.
COPY NO.I I -,
DOCKET NO.
CONTROL NO.
REPORT NO.
REC'D W/LTR DTD.
NRC FORM 190(1-94)NRCMD 3.12 PROPRIETARY INFORMATION U. S. NUCLEAR
REGULATORY COMMISSION
-