anatomy of toner adhesion with spm measurement … · 2014/12/20 static-tribo-electricity of powder...
TRANSCRIPT

2014/12/20
Static-Tribo-Electricity of Powder
Technical Committee on Simulation Technology Technical Committee on Toner Technology
Masami KADONAGA(Ricoh co.)
Anatomy of Toner Adhesion with
SPM Measurement and
Electrostatic Simulation
Imaging Society of Japan
Jun HIRABAYASHI(Canon Inc.)

-Colaborators-
ISJ:Technical Committee on Toner Technology
T. TADA ( Canon )、 T. UEHARA ( TREK )、 H. OHTA ( KYOCERA )、
M. KIMURA ( Fuji Xerox )、 T. KUBO ( Kao )、 H. KOBAYASHI ( Powdertech )、 N. SAWAYAMA ( RICOH )、 C. SUZUKI( Fuji Xerox )、 D. HARADA ( CLARIANT )、 K. HOSHINO ( CHIBA Univ. )、 Y. HOSHINO (TOKYO DENKI Univ. )
ISJ:Technical Committee on Simulation Technology
J. HIRABAYASHI( Canon ) 、H. KAWAMOTO( Waseda Univ. )、 N. NAKAYAMA ( Fuji Xerox ) 、 M. NAKANO ( Canon ) 、 T. KAGAWA ( KONICA MINOLTA )、 T. ITOH ( Fuji Xerox ) 、 M. MAEDA (((( brother)、 S. HASEBE ( Fuji Xerox ) 、 J. MURAKOSO ( FUJITSU )
Experiment and DiscussionT.Tanaka( Canon )
SPM Measurement and Discussion
Estimation of Charge, Simulation and Discussion
2

Agenda
2. Objective
1. Introduction
3. Estimation of Charge Distribution with SPM Measurement
4. Estimation of Adhesion with Charge Distribution obtained from SPM Measurement
5. Analysis of Toner Adhesion with Simulation
1
6. Conclusion

Electrostatic AdhesionMeasurement 1 nN ~ 50nN50nN50nN50nN ~100nN
Theory(Mirror Force) ~ 2nN2nN2nN2nN ~
20
2
4 D
qFe πε
=
Theory(Mirror Force)
-q
+q
Metal(Grounded)
D
(ex) Q=2.51fC D=6μm⇒1.55nN-10 -9 -8 -7 -6
Log10F
Fre
q.
Measurement
Average:30nN
10nN1nN 100nN0.1nN
2
Measurements indicate forces on the order of Measurements indicate forces on the order of Measurements indicate forces on the order of Measurements indicate forces on the order of 10x10x10x10x larger than larger than larger than larger than
what would be predicted from the mirror force theory.what would be predicted from the mirror force theory.what would be predicted from the mirror force theory.what would be predicted from the mirror force theory.

SPM
Potential
Measurement
Charge
Distribution
on a Toner
Estimation
of
Charge
Estimation of Adhesion
(Simulation)
Adhesion
Measurement
Adhesion f orce of par t ly charged toners
T. Tanaka (2013)
>
SPM potential
T. Tada (2013) Our Study
3
M. Kadonaga(2014)
J. Hirabayashi (2014)
Big Picture of Adhesion Analysis

Step2: Estimation of adhesion with
the charge distribution
To investigate adhesion mechanism
with SPM and simulation
Step1 :Estimation of charge distribution
with SPM measurement
4Objective
Step 3: Analysis of adhesion with simulation

5
Step1:Estimation of charge distribution
with SPM measurement
Jun HIRABAYASHI(Canon Inc.)

CarrierToner
+ +
SampleToner Charging 6
polystyrene particle
Fumed Silica
(Negative)
ISJ standard carrier Model Toner
Mixing and Charging
Carrier
Toner
� � � � � � � � � � � � � � � � � � � � � � � � � � � � � � � �
Additive
5µm

5µm
+ +
Sample
Carrier
Toner
Toner Charging 6
Soken chemical & Engineering SX500H( polystyrene particle)
AEROSIL
Fumed Silica (Nega)RY 200 (0.5部)
ISJ standard carrier N-02 (T/D:5%)

Toner Q=2~3 fC D=6μm
SampleMeasurement with SPM 6
Surface form and Potential
2.5 μm
2.5 μm
Polystyrene + Additive(Silica)
ISJ Standard Carrier
Mixed and toner is charged.
40 nmToner
SPM(2013:Canon Tada)
Grounded Metal
�
We should estimate a charge distribution from We should estimate a charge distribution from We should estimate a charge distribution from We should estimate a charge distribution from
the potential distribution.the potential distribution.the potential distribution.the potential distribution.

Charge Estimation using de-Convolution with System Response
× =
Point ChargePotential
System
Response
=
Estimated
ChargeMeasured Potential -1
×
Inverse ofSystem
Response
Theoretically speaking, we can estimate charge Theoretically speaking, we can estimate charge Theoretically speaking, we can estimate charge Theoretically speaking, we can estimate charge
distribution with a system response.distribution with a system response.distribution with a system response.distribution with a system response.
7
System response: Relation between charge and potential

Estimation of System Response
Electrostatic simulation of SPM is carried out.
System response is estimated from a 3DSystem response is estimated from a 3DSystem response is estimated from a 3DSystem response is estimated from a 3D----electrostatic electrostatic electrostatic electrostatic
simulation of SPM.simulation of SPM.simulation of SPM.simulation of SPM.
8
System Response
Toner: Flat plane with 6µm thick(ε=3)80 µm
SPM model SPM system response
Relation between the position of a charge and induced potential of the probe is obtained.
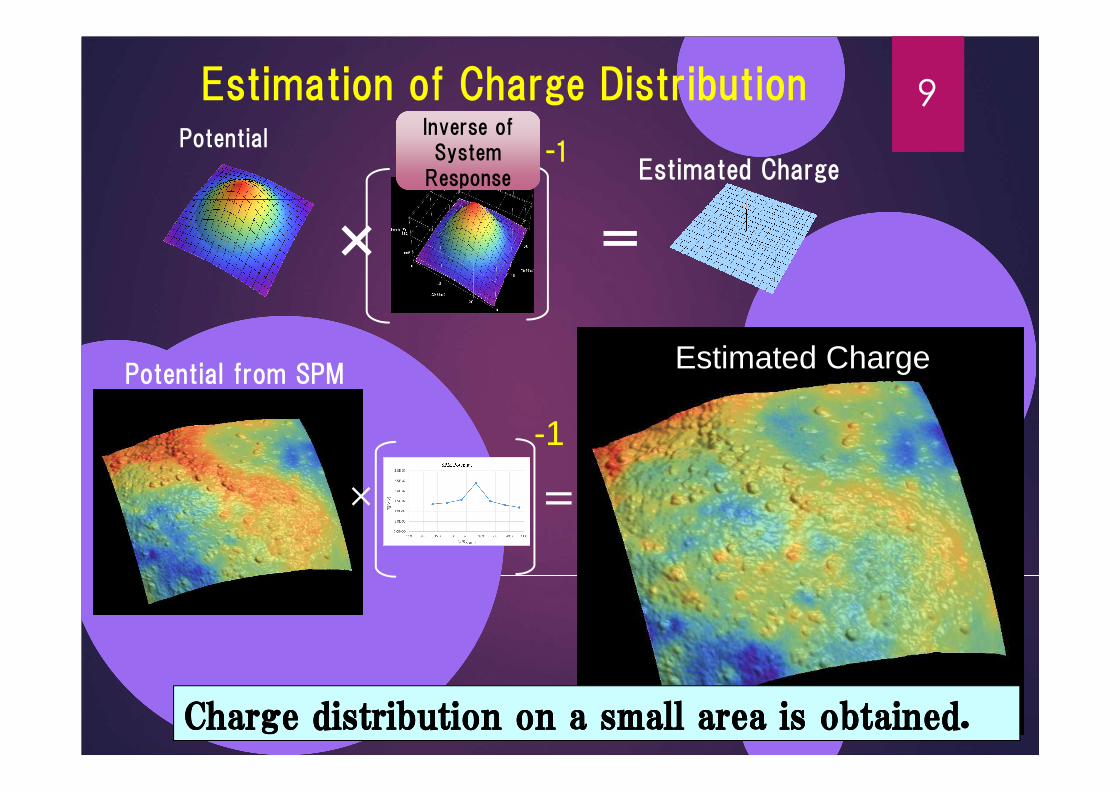
9Estimation of Charge Distribution
=
Estimated Charge
-1
× =
Potential Inverse of System
Response Estimated Charge
Charge distribution on a small area is obtained.Charge distribution on a small area is obtained.Charge distribution on a small area is obtained.Charge distribution on a small area is obtained.
Potential from SPM
-1
×

Estimation of Charge on the Whole Surface of a Toner
Copy
Sphere Mapping
Expand to Cube
Projection to Sphere
Charge on
a small area
10
Charge distribution on the whole surface Charge distribution on the whole surface Charge distribution on the whole surface Charge distribution on the whole surface
of a toner is obtained.of a toner is obtained.of a toner is obtained.of a toner is obtained.

Step1:Estimation of charge distribution
with SPM measurement
11Estimation of Charge on the whole surface of a Toner
Q=2.5fC
shows non-uniform charging!

Masami KADONAGA(Ricoh)
12
Step2: Estimation of adhesion with
the charge distribution

①Mesh Making/Setting Toner ②Setting Charge
③Electrostatic Calculation ④Estimation of Adhesion to a Grounded Plane with Maxwell Stress Tensor
Simulation Model (FDM)13

Adhesion with Charge Distribution Estimated from SPM Measurement 14
Appropriate adhesion is obtained with the charge Appropriate adhesion is obtained with the charge Appropriate adhesion is obtained with the charge Appropriate adhesion is obtained with the charge
distribution obtained from distribution obtained from distribution obtained from distribution obtained from Step1Step1Step1Step1....
Electrostatic Simulation Q=2.5fC
Adhesion:135nN
Result
(Mirror Force:1.6nN)
Estimation of Adhesion
Charge Distribution Estimated from Step1 Deposit on the
grounded plane

Rotated Toner(N=100)
Appropriate distribution of adhesion is obtained.Appropriate distribution of adhesion is obtained.Appropriate distribution of adhesion is obtained.Appropriate distribution of adhesion is obtained.
15
Adhesion with Rotated Charge Distribution
Average:68nN(N=100)

16
offers an appropriate
adhesion value!
Step2: Estimation of adhesion with
charge distribution

Masami KADONAGA(Ricoh)
17
Step 3: Analysis of adhesion with simulation

Anatomy of Adhesion
Calculate adhesion
18
Artificial charge-distributions are made by random number.
SPM measurements and estimations of charge are laborious work・・・・

23
N=1000 q=3.4fC With Charge Patch on the South Pole
Average Adhesion27nN(N=1000)
Estimated Adhesion of Artificial Toner
Appropriate adhesion is obtained with artificial toners.Appropriate adhesion is obtained with artificial toners.Appropriate adhesion is obtained with artificial toners.Appropriate adhesion is obtained with artificial toners.
19

FE(Whole Toner)
FEN(Northern Hemisphere) << FES(Southern Hemisphere)
1.7fC F= 22nN1.7fC F= 0.89nN
3.4fC F= 27nN
Effect of Location of Charge Patch21
FEN(Northern Hemisphere) FES(Southern Hemisphere)
Charge of Southern Hemisphere is dominant.Charge of Southern Hemisphere is dominant.Charge of Southern Hemisphere is dominant.Charge of Southern Hemisphere is dominant.

Num.of Charge Patch/Size v.s. Adhesion 22
Q=3.4fC, N=100
Patch Radius:0.4μm Q=3.4fC Patch Radius:0.5μm Q=3.4fC
Patch Radius:1μm Q=3.4fC Patch Radius:1.5μm Q=3.4fC
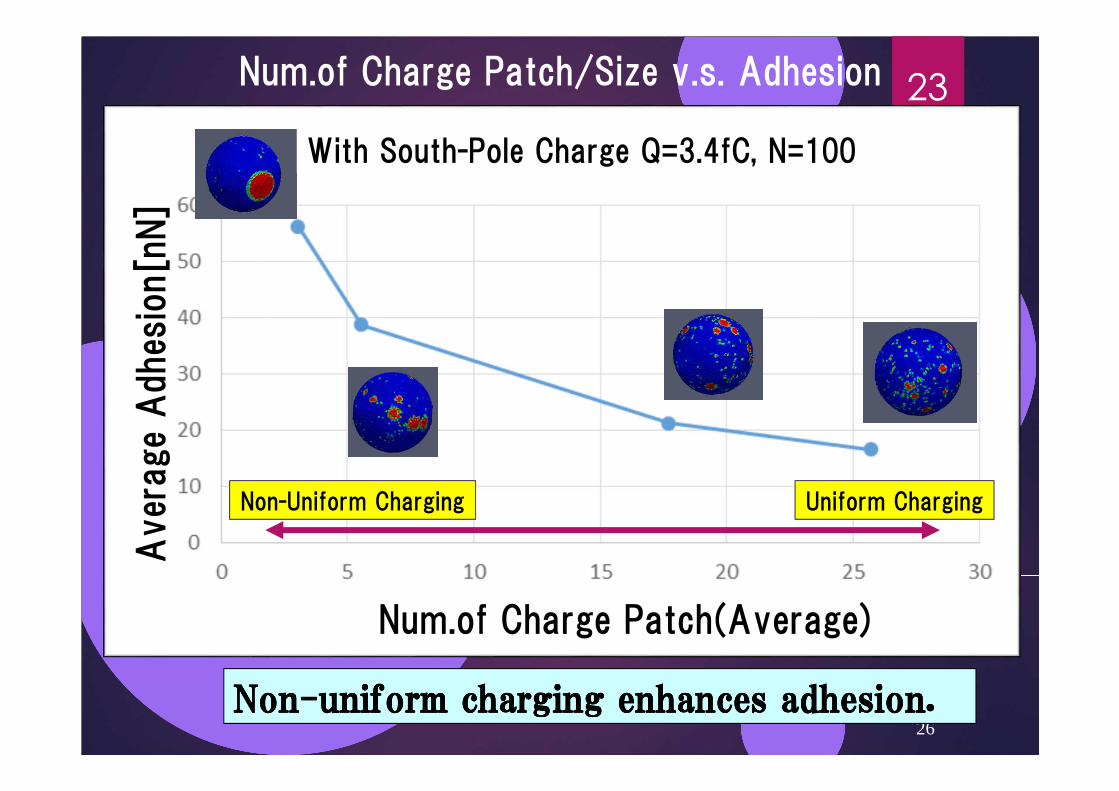
26NonNonNonNon----uniform charging enhances adhesion.uniform charging enhances adhesion.uniform charging enhances adhesion.uniform charging enhances adhesion.
23Num.of Charge Patch/Size v.s. Adhesion
Num.of Charge Patch(Average)
Aver
age
Adhes
ion[n
N]
With South-Pole Charge Q=3.4fC, N=100
Uniform ChargingNon-Uniform Charging

Conclusion24
Step2: Estimation of adhesion with
the charge distribution
Step1:Estimation of charge distribution
with SPM measurement
Step 3: Anatomy of adhesion with simulation
offers an appropriate adhesion
value!
shows non-uniform charging!
Charge of Southern Hemisphere
is dominant.

SPM
Potential
Measurement
Charge
Distribution
on a Toner
Estimation
of
Charge
Estimation of Adhesion
(Simulation)
Adhesion
Measurement
Adhesion f orce of par t ly charged toners
T. Tanaka (2013)
>
SPM potential
T. Tada (2013) Our Study
3
M. Kadonaga(2014)
J. Hirabayashi (2014)
Big Picture of Adhesion Analysis