anatek labs, inc. quality assurance plan tables, figures ... · anatek labs, inc. quality assurance...
TRANSCRIPT

Anatek Labs, Inc.
Quality Assurance Plan Tables, Figures & Appendices
Items below are linked – click on a heading to proceed to that section
Tables ................................................................................................................ 1a Analytical Equipment Utilized at Anatek Labs, Moscow ............................. 1b Analytical Equipment Utilized at Anatek, Labs, Spokane ............................
2 Summary of Analytical Parameters, Method, Sample Containers, Preservation Methods, Holding Times and Estimated Working time ...........
3 Matrix of Accredited Parameters – Anatek Labs, Moscow........................... 4 Matrix of Accredited Parameters – Anatek Labs, Spokane...........................
Figures...............................................................................................................
1 Anatek Labs, Moscow Organizational Chart................................................. 2 Anatek Labs, Moscow Personnel................................................................... 3 Anatek Labs, Moscow Floor Plan.................................................................. 4 Anatek Labs, Spokane Organizational Chart................................................. 5 Anatek Labs, Spokane Personnel................................................................... 6 Anatek Labs, Spokane Floor Plan..................................................................
Appendices ....................................................................................................... A Index of Standard Operating Procedures ....................................................... B Examples of Sample Submission Form ......................................................... C Quick Reference for Chemical Safety ........................................................... D Laboratory Staff Resumes / Qualifications.................................................... E Current State Certifications............................................................................
F Backup, Fault Tolerance, Disaster Recovery and Data Archive of Mission- Critical Information Storage and Services.....................................................
G Control Chart Information ............................................................................. H Method Detection Limit................................................................................. I Calibration Methods and Equations...............................................................
J Authorized Signatures....................................................................................
Page 1 of 81
Tables
Tables 1a & 1b
Instrument Inventory
Page 2 of 81

Table 1a
Anatek Moscow Equipment List
Type Manufacturer Model DescriptionAPI 4000 APPLIED BIOSYSTEMS API 4000 HPLC/MS/MSAPI 4000 SHIMADZU LC-20AD LCAPI 4000 SHIMADZU LC-20AD LCAPI-3000 PE SCIEX API-3000 TRIPLE QUAD MS/MSECD1 HP HP6890 GC SYSTEMECD2 HP HP6890 GC SYSTEMFIA OI ANALYTICAL FS 3000 ANALYZERFID1 HP 6890 GC SYSTEMFID2 AGILENT 6890N GC SYSTEMGCMSMS AGILENT 7890B GC SYSTEMGFPC PROTEAN MPC 9604 GAS FLOW PROPORTIONAL COUNTERHPLC #2 SHIMADZU RF20A FLUORESCENCE DETECTORICP VARIAN 720-ES ICP-OESICP-MS AGILENT G3281A ICP-MS 7700XIONS METROHM 761 COMPACT ICIONS METROOHM 882 COMPACT IC PLUSMercury Analyzer CETAC M8000 Hg AnalyzerMSD2 AGILENT 6890N GC SYSTEMMSD3 AGILENT 7890B GC SYSTEMOIL & GREASE HORIZON 3000XL EXTRACTORRAD MONITOR PYLON ELECTRONICS AB6A PORTABLE RAD MONITORSATURN 2100 Varian 2100T GC/MSTOC ANALYZER SHIMADZU TOC-Vcsh TOC ANALYZERVARIAN 1200 VARIAN 1200 QUADRUPOLE MS/MSVARIAN 4000 VARIAN 4000 GC SYSTEMVOC1 Agilent 6890N GC
Page 3 of 81

Type Manufacturer Model DescriptionAutoclave Market Forge Sterilmatic STM-ELBOD Hach HQ40d LBOD 101 ProbeBTU Parr 1341EB Oxygen Bomb CalorimeterChlorine Hach 58700-00 ColorimeterCOD HACH DigestorColiform IDEXX Quanti-tray 2X 89-10894-00Conductivity Hach HQ40d MeterFIA Lachet QUIKCHEM 8500 Analyzer
Lachet BD-46 TKN Digestor BlockLachet 65454 Cyanide Distillation System
FOG CPI Instruments
GC/ECD Hewlett Packard 5890 SERIES II GC
GC/FID Hewlett Packard 5890 SERIES II GCGC/FID Hewlett Packard 6890 SERIES II GCGC/MS Encon ENCON EV Purge and Trap
Centurion CENT272011509 AutosamplerHewlett Packard 5890 SERIES II PLUS GC
MSGC/MS TEKMAR 3000 Purge and Trap
Varian Archon AutosamplerHewlett Packard 5890 SERIES II PLUS GC
MSGC/PID/FID Hewlett Packard 4430 Concentrator Purge and Trap
Gross a and ß counter Protean Instrument IPC650 Gas Flow Proportional Counter
HPLC Agilent Technology G1329B AutosamplerAgilent Technology G1314B UV
IC Thermo Fisher 2100 ICS-2100ICPMS Agilent 7500cx ICPMSMercury Analyzer Cetac M-7600 AnalyzerpH meter Denver Instruments 225pH Hach HQ40dSalmonella SEWARD STOMACHER 400Spectrophotometer HACH DR/3000 AnalyzerTOC DOHRMANN PHOENIX 8000TOX MICROCOULOMETER AnalyzerTurbidimeter HACH 2100AN
WTW TURB355IR
Anatek Spokane Equipment List
Table 1b
Page 4 of 81

Anatek Labs, Inc.
Table 2
Summary of Analytical Parameters, Method, Sample Containers,
Preservation Methods, and Holding Times
Page 5 of 81

Test Type Parameter Method Container PreservativeHolding
TimeOrganics - Drinking WaterCOMPOST Herbicide/ Pesticide Residue in Soil/Compost 4 oz glass n/a 14 daysDBP Haloacetic Acids SM 6251B 2 x 40 mL amber vial no headspace 4 mg Ammonium Chloride 28 daysDBP Total Trihalomethane Potentials (THMP) EPA 524.3 3 x 40 mL amber vial no headspace Ambient Temperature ASAPDBP Total Trihalomethanes (TTHM) EPA 524.3 2 x 40 mL amber vial no headspace 25 mg ascorbic acid, 200 mg maleic acid 14 daysDIOXIN DioxinDIQUAT Diquat EPA 549 500 mL HDPE 10 mg Sodium Thiosulfate 7 daysEDB EDB/DBCP EPA 504.1 2 x 40 mL amber vial 3 mg Sodium Thiosulfate 14 daysENDOTHALL Endothall EPA 548.1 250 mL amber glass 20 mg Sodium Thiosulfate 14 daysGAS Petroleum in Soil-HCID WA TPH-HCID NWTPH-Gx/EPA 8015 4 oz glass n/a 14 daysGLYPHOSATE Glyphosate EPA 547 40 mL amber vial 3 mg Sodium Thiosulfate 14 daysHERB1 Herbicides Regulated & Unregulated EPA 515.4 250 mL amber glass 20 mg Sodium Thiosulfate 14 daysHERB2 Private Herbicide EPA 515.4 250 mL amber glass Sodium Thiosulfate 14 daysHERB2 Private Herbicide EPA 515.4 1 L amber glass Sodium Thiosulfate 14 daysCARB Carbamates Regulated & Unregulated EPA 531.2 40 mL amber vial 6mg Sodium Thiosulfate / 560mg Potassium Dihydrate Citrate 28 daysNWTPH-HCID Petroleum NWTPH-HCID 1L amber bottle HCl pH<2, Cool to <4°C 7 daysPERCHLORATE Perchlorate EPA 331.0/6850 125 mL HDPE Cool to <4°C 14 daysPEST1 Chlorinated Pesticides/PCBs EPA 505 2 x 40 mL amber vial 3 mg Sodium Thiosulfate 14 daysSOC (SOC) Haloacetic Acids SM 6251B 2 x 40 mL amber vial 4 mg NH4CL 14 daysSOC Full SOC Multiple methods 14 daysSOC Synthetic Organic (SOC) Screen - Washington Multiple methods 1 L amber glass and 1 x 40 mL amber vial 50 mg Sodium Sulfite 4 mg Sodium Thiosulfate 14 daysSOC Synthetic Organic (SOC) Screen Multiple methods 1 L amber glass 50 mg Sodium Sulfite 14 daysSOC WA Short SOCs Multiple methods 14 daysSOC Phase II (Phase II SOC) Carbanates Regulated & Unregulated EPA 531.2 40 mL amber vial 6mg Sodium Thiosulfate / 560mg Potassium Dihydrate Citrate 28 daysSOC Phase II (Phase II SOC) Chlorinated Pesticides/PCBs EPA 505 2 x 40mL amber vial 50 mg Sodium Thiosulfate 14 daysSOC Phase II (Phase II SOC) EDB/DBCP EPA 504.1 2 x 40 mL amber vial 3 mg Sodium Thiosulfate 14 daysSOC Phase II (Phase II SOC) Herbicides Regulated & Unregulated EPA 515.4 250 mL amber glass 20 mg Sodium Thiosulfate 14 daysSOC Phase II (Phase II SOC) Semivolatiles EPA 525.2 1 L amber glass 50 mg Sodium Sulfite 14 daysSOC Phase V (Phase V SOC) Diquat EPA 549.2 500mL HDPE Sodium Thiosulfate 21 daysSOC Phase V (Phase V SOC) Endothall EPA 548.1 250 mL amber glass Sodium Thiosulfate 14 daysSOC Phase V (Phase V SOC) Glyphosate EPA 547 2 x 40 mL amber vial Sodium Thiosulfate 14 daysTOC Total Organic Carbon (TOC) SM 5310B 2 x 40 mL amber vial H2SO4 or HCl pH<2 14 daysVOC (VOC) Regulated & Unregulated Full List EPA 524.3 3 x 40 mL amber vial 25 mg ascorbic acid, 200 mg maleic acid 14 daysVOC (VOC) Single Volatile Compound (e.g. TCE or MTBE) EPA 524.3 3 x 40 mL amber vial 25 mg ascorbic acid, 200 mg maleic acid 14 daysVOC (VOC) Total Trihalomethanes (Total THM) EPA 524.3 3 x 40 mL amber vial 25 mg ascorbic acid, 200 mg maleic acid 14 daysVOC (VOC) Trihalomethanes (THMP) EPA 524.3 3 x 40 mL amber vial n/a 14 daysVOC1 Chlorinated Regulated & Unregulated Full List EPA 524.3 3 x 40 mL amber vial no headspace 25 mg ascorbic acid, 200 mg maleic acid 14 daysVOC1 Not chlorinated Regulated & Unregulated Full List EPA 524.3 3 x 40 mL amber vial no headspace 25 mg ascorbic acid, 200 mg maleic acid 14 daysVOC2 Private Volatiles (VOC) EPA 524.3 3 x 40 mL amber vial no headspace 25 mg ascorbic acid, 200 mg maleic acid 14 daysVOC2 Single Volatile Compound (i.e. TCE or MtBE) EPA 524.3/624/8270 3 x 40 mL amber vial no headspace 25 mg ascorbic acid, 200 mg maleic acid 14 days
Page 6 of 81

Test Type Parameter Method Container PreservativeHolding
TimeInorganics - Drinking WaterASBESTOS Asbestos in Insulation or Tile 100 grams, Ziploc bag (no vermiculite) Cool to <4°C 6 monthsASBESTOS Asbestos in Insulation or Tile 100 grams, Ziploc bag (no vermiculite) n/a 6 monthsFLUORIDE Fluoride EPA 300.0 125 mL HDPE n/a 7 daysID IOC Package Arsenic & Sodium EPA 200.8 / 200.7 125 mL HDPE n/a 6 monthsID IOC Package Fluoride EPA 300.0 125 mL HDPE n/a 28 daysID IOC Package Idaho Primary IOC package with cyanide waiver Multiple methods 1 L HDPE n/a 28 daysID IOC Package Idaho Secondary/Optional IOC package Multiple methods 1 L HDPE n/a ASAPID IOC Package Nitrate EPA 300.0 125 mL HDPE n/a 48 hoursID IOC Package Nitrate/Nitrite EPA 300.0 125 mL HDPE n/a 48 hoursID IOC Package Phase II IOC metals EPA 200.7/200.8 500 mL HDPE n/a 28 daysID IOC Package Phase V IOC Multiple methods 500 mL HDPE n/a 6 monthsIOC Alkalinity SM 2320B 125 mL HDPE n/a 14 daysIOC Ammonia SM 4500 NH3-G 125 mL HDPE H2SO4 pH<2 28 daysIOC Anionic Surfactants SM 5540C 250 mL HDPE n/a 48 hoursIOC Anions: (Cl, F or SO4) EPA 300.0 125 mL HDPE n/a 28 daysIOC Anions: (NO2, NO3 or PO4) EPA 300.0 125 mL HDPE n/a 48 hoursIOC Chlorine - Total Residual SM 4500 Cl-G 2 x 40mL clear vial no headspace n/a 15 minutesIOC Color SM 2120B 125 mL HDPE n/a 48 hoursIOC Conductivity SM 2510B 125 mL HDPE n/a 28 daysIOC Corrosivity - Langlier 1 L HDPE n/a ASAPIOC Cyanide EPA 335.4/SM 4500-CNE 250mL HDPE NaOH pH > 12 14 daysIOC Hardness EPA 200.7 / SM 2340B 125 mL HDPE HNO# pH <2 6 monthsIOC Hydrogen Sulfide 1 L HDPE 1 Tablet NaOH/L + Zn Acetate, pH>9 7 daysIOC Iron EPA 200.7 125 mL HDPE HNO3 pH < 2 6 monthsIOC Lead & Copper (Pb/Cu) Rule EPA 200.8 1 L HDPE HNO3 Lab Preserves 6 monthsIOC Mercury by CVAFS EPA 245.7/EPA 1631E I L glass or 250 mL fluorinated plastic HCl pH < 2 6 monthsIOC Metals (single metals) EPA 200.7/200.8/6010/6020 125 mL HDPE HNO3 pH < 2 6 monthsIOC Odor 1 L HDPE n/a ASAPIOC pH SM 4500 H+B 125 mL HDPE n/a 15 minutesIOC Phenolics EPA 420.1 1L amber bottle H2SO4 pH<2 28 daysIOC Silica/Silicon - Dissolved Only EPA 200.7 125 mL HDPE n/a 6 monthsIOC Surfactants SM 5540C 1 L amber glass n/a 48 hoursIOC TDS SM 2540C 1 L HDPE n/a 7 daysIOC TSS SM 2540D 1 L HDPE n/a 7 daysIOC Turbidity EPA 180.1 125 mL HDPE n/a 48 hoursIOC Washington Complete IOC Multiple methods 2 x 1 L HDPE NaOH for CN in 1L 48 hoursIOC Idaho Complete IOC Multiple methods 1 L HDPE n/a 48 hoursLEAD Lead in Paint EPA 6020 10 grams, Ziploc bag Cool to <4°C 6 monthsNITRATE Nitrate EPA 300.0 125 mL HDPE n/a 48 hoursSpokane Co. Test Package Coliform Bacteria, Nitrate EPA 9223B/EPA 300.0 125 mL HDPE and Sterile 125 mL bottle Sodium Thiosulfate (in Sterile bottle only) 30 hoursTri-County Area Test Package Coliform Bacteria, Nitrate, Lead, Arsenic Multiple methods 1 Sterile 125 mL HDPE and 1 125 mL HDPE Sodium Thiosulfate (in Sterile 125 mL HDPE only) 30 hours
Page 7 of 81

Test Type Parameter Method Container PreservativeHolding
TimePrivate Well - Drinking WaterPRIVATE WELL Private Well List (with bacteria) Multiple methods 125 mL HDPE and Sterile 125 mL bottle Cool to <4°C 30 hoursPRIVATE WELL Private Well List (without bacteria) Multiple methods 125 mL HDPE Cool to <4°C 48 hours
Microbiology - Drinking WaterBacteriological Coliform P/A as Count SM 9223B Sterile 125 mL bottle Sodium Thiosulfate 30 hoursBacteriological Heterotrophic Plate Counts (HPC) SM 9215B Sterile 125 mL bottle Sodium Thiosulfate 30 hoursBacteriological Iron Bacteria 125 mL HDPE n/a 30 hoursBacteriological Coliform Presence/Absence SM 9223B Sterile 125 mL bottle Sodium Thiosulfate 30 hoursBacteriological Coliform Bacteria SM 9223B Sterile 125 mL HDPE Sodium Thiosulfate 30 hoursBacteriological Coliform Bacteria - Waste Water SM 9223B Sterile 125 mL HDPE Sodium Thiosulfate 6 hoursBOD BOD SM 5210B 1 L plastic n/a 2 days
Page 8 of 81

Waste Water Page 1 of 2
Microbiology - Waste WaterTest Method Container Preservative Holding Time
COLIFORM MPN SM9223B Plastic Na2S2O3 6 HoursE COLI SM9221F Plastic Na2S2O3 8 HoursE COLI MPN SM9223B Plastic Na2S2O3 6 HoursFECAL COLIFORMS SM9221E Plastic Na2S2O3 8 HoursHETEROTROPIC PLATE COUNT SM9215B Plastic Na2S2O3 8 HoursTOTAL COLIFORMS SM9221B Plastic Na2S2O3 6 HoursTOTAL/ECOLI COLILERT SM9223B Plastic Na2S2O3 24 Hours
Organics - Waste WaterTest Method Container Preservative Holding Time
624 VOLATILES IN WW EPA 624 40mL Amber Vial HCl 14 DaysAMINOPYRALID HPLC/MS/MS n/a 10 DaysBTEX EPA 624/8260 40mL Amber Vial HCL 14 DaysCLOPYRALID GC/MS/MS Plastic or glass n/a 14 DaysDIESEL NWTPHD/EPA 8015D 1L Amber Glass HCl 14 DaysEPA 8141A EPA 8141A 1L Amber Glass n/a 7 DaysEPH - WA DOE WTPHEPH G n/a 7 DaysEXPLOSIVES GC EPA 8095 1L Amber Glass n/a 7 DaysEXPLOSIVES HPLC EPA 8330 1L Amber Glass n/a 7 DaysGASOLINE NWTPH-G/EPA 8015D 40mL Amber Vial HCl 14 DaysGlyphosate-LC/MS EPA 8321A 250mL Amber Glass n/a 14 DaysHERBICIDES EPA 8151A 1L Amber Glass n/a 14 DaysKEROSENE MOSC EPA 8015D 1L Amber Glass HCl 14 DaysMETHAMPHETAMINE HPLC/MS/MS 28 DaysOC PEST 8081A EPA 8081A G n/a 7 DaysOP PESTS EPA 8270Dm 1L Amber Glass n/a 7 DaysPAH 8270D MOSC EPA 8270D 1L Amber Glass n/a 7 DaysPCB 8082 EPA 8082 G n/a 7 DaysPERCHLORATE 331.0 EPA 331.0 125mL HDPE n/a 28 DaysPEST SCREEN 8270D EPA 8270D 1L Amber Glass n/a 7 DaysSEMIVOLATILES 625 EPA 625 1L Amber Glass n/a 7 DaysSVOC 8270D EPA 8270D 1L Amber Glass n/a 7 DaysTCLP HERBICIDES EPA 8151A 1L Amber Glass n/a 7 DaysTCLP PESTICIDES EPA 8081A n/a 14 DaysTCLP SVOC EPA 8270D 1L Amber Glass n/a 14 DaysTCLP VOLATILES EPA 8260B 40mL Amber Vial HCl 14 DaysTOC/DOC SM 5310B 40mL Clear Vial HCl 28 DaysVOLATILE ACIDS GC EPA 8015D 40mL HCL Vial HCl 14 DaysVOLATILES 8260 EPA 8260B 40mL HCL Vial HCl 14 DaysVOLATILES MISC GC/MS EPA 8260B 40mL HCL Vial HCl 14 DaysVolatiles Priority Pollutant EPA 624 40mL HCL Vial HCl 14 DaysWA Fertilizer Metals N/A 14 Days
Radiochemistry - Waste WaterTest Method Container Preservative Holding Time
GROSS ALPHA EPA 900.0 1L HDPE HNO3 180 DaysGROSS BETA EPA 900.0 1L HDPE HNO3 180 DaysRADIUM-226 EPA 903.0 1L HDPE HNO3 180 DaysRADIUM-228 EPA 904.0 1L HDPE HNO3 180 Days
Page 9 of 81

Waste Water Page 2 of 2
Inorganics - Waste WaterTest Method Container Preservative Holding Time
ALKALINITY SM2320B 125mL HDPE n/a 48 HoursAMMONIA-NITROGEN SM4500NH3G 125mL HDPE H2SO4 28 DaysCARBONATE SM2320B 125mL HDPE n/a 48 HoursCHLORIDE EPA 300.0 125mL HDPE n/a 28 DaysCHROMIUM VI (HEXAVALENT) SM3500CR 1 L Plastic n/a 28 DaysCN AMENABLE TO CHLORINATION SM4500CNG Plastic or glass NaOH 14 DaysCOLOR SM 2120B 125mL HDPE n/a 7 DaysCONDUCTIVITY SM2510B Plastic or glass n/a 7 DaysCYANIDE FREE SM 4500 CN-E SM4500CNE 250mL HDPE NaOH 14 DaysCYANIDE REACTIVE SW846 CH7 250mL HDPE NaOH 14 DaysCYANIDE TOTAL EPA EPA 335.4 250mL HDPE NaOH 14 DaysCYANIDE WAD SM4500CNI 250mL HDPE NaOH 14 DaysDISSOLVED MERCURY-CVAFS EPA 245.7 HNO3 28 DaysDISSOLVED MERCURY-TRACE EPA 1631e PTFE/Glass HCl / BrCl 180 DaysDISSOLVED METALS - ICP EPA 200.7/6010B Plastic or glass HNO3 28 DaysDISSOLVED METALS ICP-MS EPA 200.8/6020a Plastic or glass HNO3 28 DaysDISSOLVED NITRATE EPA 300.0 n/a 48 HoursDISSOLVED NITRATE + NITRITE AS N EPA 300.0 n/a 48 HoursDISSOLVED NITRITE EPA 300.0 n/a 48 HoursDISSOLVED PHOSPHATE/P FIA SM4500PF Plastic or glass H2SO4 28 DaysDISSOLVED SULFATE EPA 300.0 n/a 28 DaysDISSOLVED TOTAL P FIA SM4500PF Plastic or glass H2SO4 28 DaysDOC - MOSC SM 5310B 40mL Clear Vial HCl 28 DaysFLUORIDE EPA 300.0 125mL HDPE n/a 28 DaysFOG - HEM EPA 1664A 1L Amber Glass H2SO4 or HCl 28 DaysFOG - NON POLAR EPA 1664 1L Amber Glass H2SO4 or HCl 28 DaysGLYCOLS - EG & PG EPA 8015 G n/a 14 DaysHARDNESS EPA 200.7 125mL HDPE HNO3 180 DaysMERCURY-CV-7471A EPA 7471A 28 DaysMERCURY-CVAFS EPA 245.7 40mL Amber Vial HCl 28 DaysMERCURY-ICPMS EPA 200.8 125mL HDPE HNO3 180 DaysMERCURY-TRACE EPA 1631e PTFE/Glass HCl / BrCl 180 DaysMETALS ICP EPA 200.7/6010B Plastic or glass HNO3 180 DaysMETALS ICP-MS EPA 200.8 Plastic or glass HNO3 180 DaysNITRATE/NITRITE FIA SM 4500 NO3F/EPA 353.2 125mL HDPE H2SO4 48 HoursNITRATE/NITRITE EPA 300.0 125mL HDPE n/a 48 HoursNITRITE - TOTAL N+N FIA SM 4500 NO3F 125mL HDPE H2SO4 28 DayspH SM 4500pH-B Plastic or glass n/a 15 MinutesPHENOLICS TOTAL EPA 420.1 1L Amber Glass H2SO4 28 DaysPHOSPHATE - SRP SM4500PF Plastic or glass 28 DaysPHOSPHATE/P EPA 300.0 Plastic or glass n/a 48 HoursPHOSPHATE/P FIA SM4500PF Plastic or glass H2SO4 28 DaysSOLIDS - TDS/TSS/TS/TVS/VSS SM 2540C Plastic or glass n/a 7 DaysSOLIDS - FDS EPA 160.4 1L HDPE n/a 7 DaysSULFATE EPA 300.0 Plastic or glass n/a 28 DaysSULFIDE REACTIVE SW846 CH7 250ml HDPE NaOH / ZnAc 7 DaysSURFACTANTS SM5540C Plastic or glass H2SO4 48 HoursTANNIN & LIGNIN SM5550B Plastic or glass n/a 28 DaysTCLP MERCURY BY 245.7 EPA 245.7 28 DaysTCLP Metals EPA 6020A Plastic or glass 14 DaysTCLP METALS EPA 6020A n/a 14 DaysTCLP Metals ICP EPA 6020A Plastic or glass 14 DaysTKN SM4500NORGC 125mL HDPE H2SO4 28 DaysTOTAL 4 N/A Plastic or glass HNO3 14 DaysTOTAL P FIA SM4500PF 125mL HDPE H2SO4 28 DaysTOTAL VOLATILE ACIDS SM5560C Plastic or glass n/a 14 DaysTURBIDITY EPA 180.1 Plastic or glass n/a 48 Hours
Page 10 of 81

Microbiology - Soils/SolidsTest Method Container Preservative Holding Time
E COLI SM9221F Plastic n/a 24 HoursFECAL COLIFORMS SM9221E Plastic n/a 24 HoursHETEROTROPIC PLATE COUNT SM9215B Plastic n/a 24 HoursTOTAL COLIFORMS SM9221B Plastic n/a 24 Hours
Organics - Soil/SolidsTest Method Container Preservative Holding Time
ACROLEIN EPA 8260B Glass Cool to 4°C 14 DaysAMINOPYRALID HPLC/MS/MS Plastic or glass Cool to 4°C 10 DaysBTEX 8260 EPA 8260B Glass Cool to 4°C 14 DaysCARBAMATE PESTICIDES EPA 8318 Glass Cool to 4°C 28 DaysCLOPYRALID GC/MS/MS Plastic or glass Cool to 4°C 28 DaysDIESEL NWTPH-DX/EPA 8015D Glass Cool to 4°C 14 DaysEPA 6850 perchlorate EPA 331.0 4oz glass jar Cool to 4°C 14 DaysEPA 8141A EPA 8141A Cool to 4°C 7 DaysEPH - WA DOE WTPHEPH Glass Cool to 4°C 14 DaysEXPLOSIVES GC EPA 8096 Glass Cool to 4°C 14 DaysEXPLOSIVES HPLC EPA 8330 Glass Cool to 4°C 14 DaysGASOLINE NWTPH-GX/EPA 8015D Glass Cool to 4°C 14 DaysGLYPHOSATE IN SOIL HPLC/MS/MS Glass Cool to 4°C 28 DaysHERBICIDES EPA 8151A Glass Cool to 4°C 14 DaysKEROSENE EPA 8015D Cool to 4°C 14 DaysMETHAMPHETAMINE HPLC/MS/MS Cool to 4°C 28 DaysOC PEST 8081A EPA 8081A Glass Cool to 4°C 14 DaysOP PESTS EPA 8270Dm/EPA 8141 Glass Cool to 4°C 14 DaysPAH 8270D MOSC EPA 8270D 1L Amber Glass Cool to 4°C 7 DaysPCB 8082 EPA 8082 Glass Cool to 4°C 14 DaysPERCHLORATE 6850 EPA 6850 8 OZ JAR Cool to 4°C 14 DaysSEMIVOLATILES 625 EPA 625 Glass Cool to 4°C 7 DaysSEMIVOLATILES MISC GC/FID GC/FID Cool to 4°C 7 DaysSEMIVOLATILES MISC GC/MS EPA 8270CMOD Cool to 4°C 14 DaysSEMIVOLATILES MISC GC/MS/MS EPA 8270CMOD Cool to 4°C 7 DaysSEMIVOLATILES MISC HPLC HPLC Cool to 4°C 14 DaysSEMIVOLATILES MISC LC/MS/MS EPA 8321A Cool to 4°C 14 DaysSPLP TPHDx EPA 8015D Cool to 4°C 14 DaysSVOC 8270D MOSC EPA 8270D 1L Amber Glass Cool to 4°C 7 DaysTCLP HERBICIDES EPA 8151A Cool to 4°C 14 DaysTCLP PCB EPA 8082 Cool to 4°C 14 DaysTCLP PESTICIDES EPA 8081A Cool to 4°C 14 DaysTCLP SVOC EPA 8270D Cool to 4°C 14 DaysTCLP VOLATILES EPA 8260B Cool to 4°C 14 DaysVOLATILES 8260 EPA 8260B Glass Cool to 4°C 14 Days
Page 11 of 81
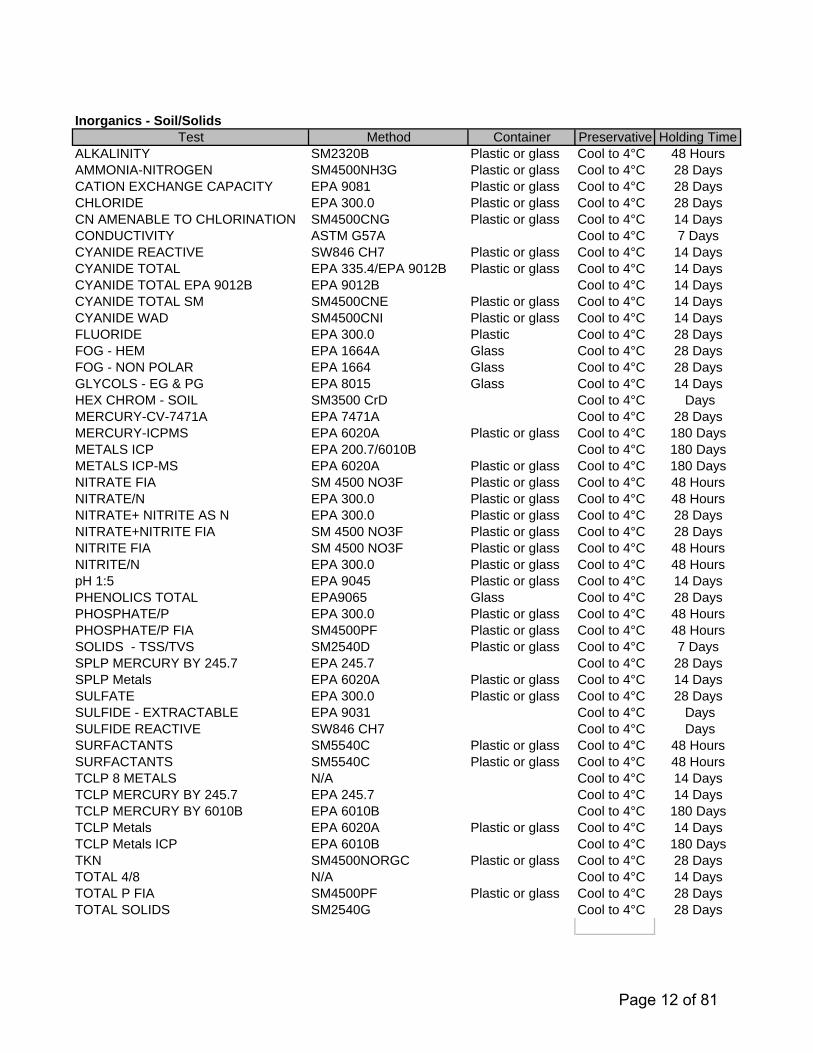
Inorganics - Soil/SolidsTest Method Container Preservative Holding Time
ALKALINITY SM2320B Plastic or glass Cool to 4°C 48 HoursAMMONIA-NITROGEN SM4500NH3G Plastic or glass Cool to 4°C 28 DaysCATION EXCHANGE CAPACITY EPA 9081 Plastic or glass Cool to 4°C 28 DaysCHLORIDE EPA 300.0 Plastic or glass Cool to 4°C 28 DaysCN AMENABLE TO CHLORINATION SM4500CNG Plastic or glass Cool to 4°C 14 DaysCONDUCTIVITY ASTM G57A Cool to 4°C 7 DaysCYANIDE REACTIVE SW846 CH7 Plastic or glass Cool to 4°C 14 DaysCYANIDE TOTAL EPA 335.4/EPA 9012B Plastic or glass Cool to 4°C 14 DaysCYANIDE TOTAL EPA 9012B EPA 9012B Cool to 4°C 14 DaysCYANIDE TOTAL SM SM4500CNE Plastic or glass Cool to 4°C 14 DaysCYANIDE WAD SM4500CNI Plastic or glass Cool to 4°C 14 DaysFLUORIDE EPA 300.0 Plastic Cool to 4°C 28 DaysFOG - HEM EPA 1664A Glass Cool to 4°C 28 DaysFOG - NON POLAR EPA 1664 Glass Cool to 4°C 28 DaysGLYCOLS - EG & PG EPA 8015 Glass Cool to 4°C 14 DaysHEX CHROM - SOIL SM3500 CrD Cool to 4°C DaysMERCURY-CV-7471A EPA 7471A Cool to 4°C 28 DaysMERCURY-ICPMS EPA 6020A Plastic or glass Cool to 4°C 180 DaysMETALS ICP EPA 200.7/6010B Cool to 4°C 180 DaysMETALS ICP-MS EPA 6020A Plastic or glass Cool to 4°C 180 DaysNITRATE FIA SM 4500 NO3F Plastic or glass Cool to 4°C 48 HoursNITRATE/N EPA 300.0 Plastic or glass Cool to 4°C 48 HoursNITRATE+ NITRITE AS N EPA 300.0 Plastic or glass Cool to 4°C 28 DaysNITRATE+NITRITE FIA SM 4500 NO3F Plastic or glass Cool to 4°C 28 DaysNITRITE FIA SM 4500 NO3F Plastic or glass Cool to 4°C 48 HoursNITRITE/N EPA 300.0 Plastic or glass Cool to 4°C 48 HourspH 1:5 EPA 9045 Plastic or glass Cool to 4°C 14 DaysPHENOLICS TOTAL EPA9065 Glass Cool to 4°C 28 DaysPHOSPHATE/P EPA 300.0 Plastic or glass Cool to 4°C 48 HoursPHOSPHATE/P FIA SM4500PF Plastic or glass Cool to 4°C 48 HoursSOLIDS - TSS/TVS SM2540D Plastic or glass Cool to 4°C 7 DaysSPLP MERCURY BY 245.7 EPA 245.7 Cool to 4°C 28 DaysSPLP Metals EPA 6020A Plastic or glass Cool to 4°C 14 DaysSULFATE EPA 300.0 Plastic or glass Cool to 4°C 28 DaysSULFIDE - EXTRACTABLE EPA 9031 Cool to 4°C DaysSULFIDE REACTIVE SW846 CH7 Cool to 4°C DaysSURFACTANTS SM5540C Plastic or glass Cool to 4°C 48 HoursSURFACTANTS SM5540C Plastic or glass Cool to 4°C 48 HoursTCLP 8 METALS N/A Cool to 4°C 14 DaysTCLP MERCURY BY 245.7 EPA 245.7 Cool to 4°C 14 DaysTCLP MERCURY BY 6010B EPA 6010B Cool to 4°C 180 DaysTCLP Metals EPA 6020A Plastic or glass Cool to 4°C 14 DaysTCLP Metals ICP EPA 6010B Cool to 4°C 180 DaysTKN SM4500NORGC Plastic or glass Cool to 4°C 28 DaysTOTAL 4/8 N/A Cool to 4°C 14 DaysTOTAL P FIA SM4500PF Plastic or glass Cool to 4°C 28 DaysTOTAL SOLIDS SM2540G Cool to 4°C 28 Days
Page 12 of 81

Anatek Labs - Moscow IDMatrix of Accredited Methods - by State
Method Description WS WS WS WS WS WS WS WS WS WP WP WP WP WP RCRA RCRA RCRAEPA 1311-TCLP TCLP NVEPA 1312-SPLP SPLP NVEPA 160.4 TVS WAEPA 180.1 Turbidity FL WA ID NM OR NV MT FL WA OR NVEPA 200.7 ICP FL WA ID NM OR NV MT WY FL WA OR NVEPA 200.8 ICP-MS FL WA ID NM OR NV MT WY FL WA OR NVEPA 245.7 Hg WA OR MT FL WA OR NV AZEPA 300 Ions FL WA ID NM OR NV MT WY FL WA OR NV WAEPA 331 Perchlorate FL WA OR NV WA NVEPA 335.4 Cyanide FL WA ID NM OR NV WY FL WA OR NV WAEPA 420.1 Phenolics FL WA OR NV WAEPA 504.1 EDB/DBCP FL WA ID NM OR NV MT WYEPA 505 Pesticides FL WA ID NM OR NV MT WYEPA 515.4 Herbicides FL WA ID NM OR NV MT WYEPA 524.3 SOCs FL WA ID NM OR NV MT WY AZEPA 525.2 VOCs FL WA ID NM OR NV MT WYEPA 531.2 Carbamates FL WA ID NM OR NV MT WYEPA 547 Glyphosate FL WA ID NM OR NV MT WYEPA 548.1 Endothall FL WA ID NM OR NV MT WYEPA 549.2 Diquat FL WA ID NM OR NV MT WYEPA 608 Herbicides FL WA OR NVEPA 608.2 Herbicides FL WA OR NVEPA 624 VOCs FL WA OR NV AZEPA 625 SVOCs FL WA OR NV AZEPA 900 Gross A/B FL WA ID NM OR NV MT WY FL WA OREPA 903 Ra226 FL WA ID NM OR NV MT WY FL WA OR NVEPA 903.1 Ra226 FL FL (OR)EPA 904 Ra228 FL WA ID NM OR NV MT WY FL WA OR NVEPA 1631E Hg Trace FL WA OR NV AZEPA 1664B FOG OR FL WA OR NVEPA 6010B/C ICP FL OR NV WA NVEPA 6020A/B ICP-MS FL OR NV WA NVEPA 6850 Perchlorate FL WA OREPA 8015B Diesel - Gas NV NV AZEPA 8081 Pesticides FL OR NV WA NVEPA 8082 PCBs FL OR NV WA NV AZEPA 8141 OCPests NV WA NVEPA 8151 Herbicides FL OR NV WA NVEPA 8260c VOCs FL OR NV WA NV AZ
Page 13 of 81

Anatek Labs - Moscow IDMatrix of Accredited Methods - by State
Method Description WS WS WS WS WS WS WS WS WS WP WP WP WP WP RCRA RCRA RCRAEPA 8270d SVOCs FL OR NV WA NV AZEPA 8330b Explosives NV WAEPA 9012B pHNWTPH-DX Diesel WANWTPH-GX Gas WASM 2120B Color FL WA NM OR NV MTSM 2320B Alkalinity FL WA NM OR NV FL WA OR NVSM 2340B Hardness FL WA NM OR NV FL WA OR NVSM 2510B Conductivity FL WA NM OR NV FL WA OR NVSM 2540C TDS FL WA NM OR NV MT FL WA OR NVSM 2540D TSS FL WA OR NVSM 4500CLG Chlorine NVSM 4500CNE Cyanide ID NV NV WASM 4500CNG Cyanide Amenable NV WA NV WASM 4500CNI Cyanide WAD NVSM 4500H+B pH FL WA NM OR NV FL WA OR NVSM 4500NH3-G Ammonia FL WA OR NV WASM 4500NO3F NO2/NO3 FL WA ID NM OR NV WY FL WA OR NVSM 4500NORGC TKN FL WA OR NV WASM 4500P-F Ortho/Total P FL WA OR NV WASM 5210B BOD WASM 5310B TOC FL WA NM OR NV MT FL OR NVSM 5530D Phenolics WA NVSM 5540C MBAS FL WA NM OR NV MTSM 6251B HAA FL WA ID NM OR NV MT WYSM 9221B+E1+C Total/Fecal-count WASM 9221B+F+C Total Coli/Ecoli-count WASM 9223B-MPN Coli - count WA IDSM 9223B-PA Coli - detect WA ID
Page 14 of 81

Anatek Labs - Spokane WAMatrix of Accredited Methods - by State
Method Description WS WS WS WP RCRAEPA 180.1 Turbidity WA MT ID WAEPA 200.8 ICP-MS WA MT ID WA - FLEPA 300 Ions WA MT ID WA WAEPA 335.4 Cyanide WA ID WA WAEPA 410.4 COD WAEPA 415.3 TOC WA MT WAEPA 504.1 EDB/DBCP MTEPA 524.2 SOCs WA MT IDEPA 624 VOCs WAEPA 900 Gross A/B WA FL ID FLEPA 1680 Fecal-count WAEPA 1682 Salmonella WAEPA 6020A ICP-MS FL WAEPA 8021B BTEX WAEPA 8082 PCBs WAEPA 8260c VOCs WAEPA 9020B TOX WA WAEPA 9023 EOX WAEPA 9045D pH WAEPA 9076 Chloride WANWTPH-DX Diesel WANWTPH-GX Gas WASM 2120B Color WA MTSM 2320B Alkalinity WA MT WASM 2340B/C Hardness WA MT WASM 2510B Conductivity WA MT WASM 2540C TDS WA MT WASM 2540D TSS WASM 2540G TVS WASM 4500CNE Cyanide WA MT ID WA WASM 4500H+B pH WA MT WASM 4500NH3-H Ammonia WA WASM 4500NO3F NO2/NO3 WA WASM 4500NORGC TKN WA WASM 4500P-F Ortho/Total P WA MT WASM 4500P-G Orthophosphate WASM 4500P-H Total Phosphate WASM 5210B BOD WASM 5310C TOC/DOC WA MT WASM 9215B Heterotrophic Plate Count WA MT WASimplate Heterotrophic Plate Count WA MT WASM 9221B+E1 Total/Fecal-detect WA MTSM 9221B+E1 + C Total/Fecal-count WA MT WASM 9221B+F Total Coli/Ecoli-detect WA MTSM 9221B+F+C Total Coli/Ecoli-count WA MT WASM 9221E2+C Fecal-count WASM 9222D Fecal-count MTSM 9223B-MPN Coli - count WA MT WASM 9223B-PA Coli - detect WA MTSM 9260D Salmonella WA
Page 15 of 81

Figures
Page 16 of 81

Anatek Labs, Inc. Organizational Chart
Mike PearsonLab Director
Todd TaruscioLab Manager
Gene SolomonQA Officer
Rad Safety Officer Organic Chemists/Techs
Erin LinskeyInorganic
Technical Director
Bookkeeping / HR Staff
Justin DotyClient Services
Manager
Sample Custodian
Shipping / Receiving Staff
Inorganic Chemists/Techs
IT Staff
Rad ChemChemists/Techs
Feb 2017 Page 17 of 81
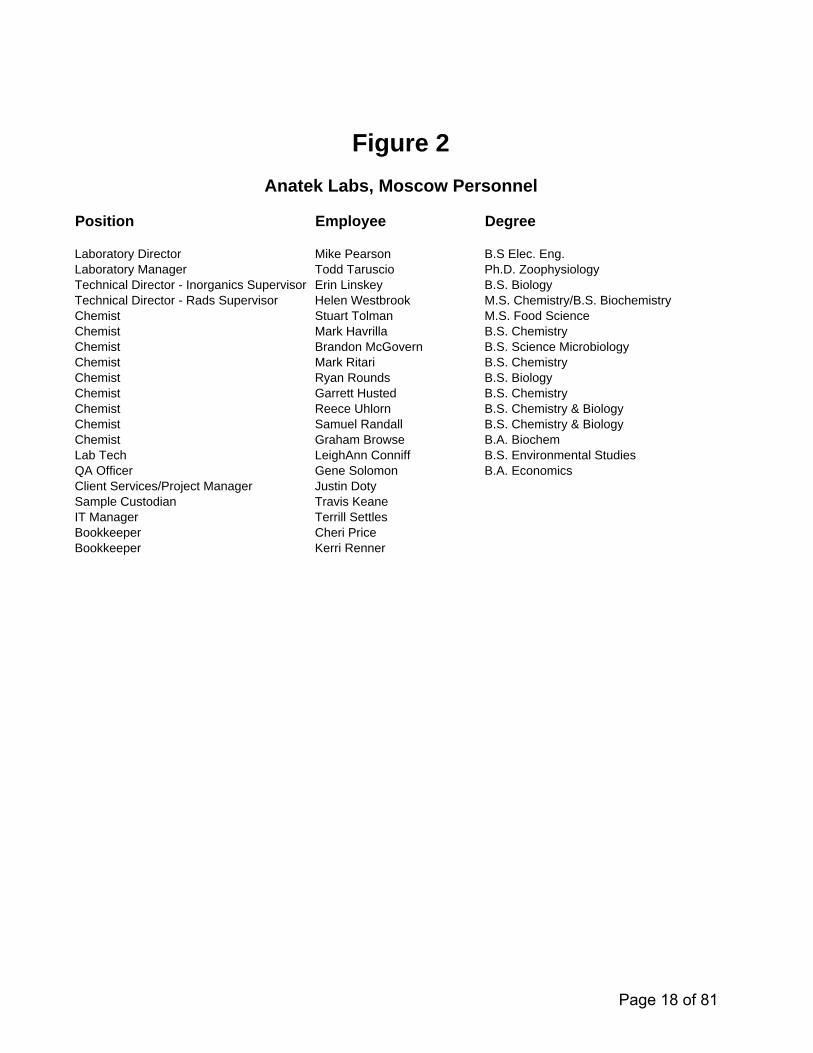
Position Employee Degree
Laboratory Director Mike Pearson B.S Elec. Eng.Laboratory Manager Todd Taruscio Ph.D. ZoophysiologyTechnical Director - Inorganics Supervisor Erin Linskey B.S. Biology Technical Director - Rads Supervisor Helen Westbrook M.S. Chemistry/B.S. BiochemistryChemist Stuart Tolman M.S. Food ScienceChemist Mark Havrilla B.S. Chemistry Chemist Brandon McGovern B.S. Science MicrobiologyChemist Mark Ritari B.S. ChemistryChemist Ryan Rounds B.S. Biology Chemist Garrett Husted B.S. ChemistryChemist Reece Uhlorn B.S. Chemistry & BiologyChemist Samuel Randall B.S. Chemistry & BiologyChemist Graham Browse B.A. BiochemLab Tech LeighAnn Conniff B.S. Environmental StudiesQA Officer Gene Solomon B.A. Economics Client Services/Project Manager Justin DotySample Custodian Travis KeaneIT Manager Terrill SettlesBookkeeper Cheri PriceBookkeeper Kerri Renner
Anatek Labs, Moscow Personnel
Figure 2
Page 18 of 81

EXIT
FX
FX
Women's Room
Chemical Storage
Rads Lab
Counting Room
Men's Room
Lease Space
DI
EX
IT
Office Space
Office Space
EXIT
DI
Hood
Hood
Hood
Hood
Hood
SS EWFX
DI
Gas StorageMilli-Q/ Storage
Shipping/ Receiving
Micro/IC Lab
Reception Area
Conference Room/Break
Room
Main Lab
FXFX
Walk-In Sample Archive
FX
IT Room Servers
Electrical/ Storage/
Crawl Space Access
FX
VOC/Metals Lab
GC/ECD/ HPLC Lab
Anatek Labs Floor Plan September 2014 Page 19 of 81

February 2017
Mike PearsonLab Director
QA Officer
Kathleen SattlerLab Manager
Technical Director
Radiation Safety OfficerOffice Staff Sample Custodian Chemist ChemistChemist
Chemist
Chemist
Anatek Labs Organizational Chart - Spokane, Inc.
Page 20 of 81

Anatek Labs, Inc.
Eff 2 Jun 2016
Figure 5
Anatek Labs, Spokane
Personnel
Position Employee Degree Laboratory Director Mike Pearson B.S. Electrical Engineering Laboratory Manager Kathy Sattler B.S. Microbiology QA Officer Gene Solomon B.A. Economics Chemist Wendy Ozminkowski B.S. Chemistry Chemist/RSO Andrew Mendez B.A. Chemistry Chemist Hannah DePaolo B.S. Biology Chemist Leah Dittberner B.S. Biology Chemist Brock Gerger B.S. Chemistry Chemist Tracy Martinez B.S. Chemistry Chemist Koryne Plaskett B.S. Biochem/Chem Chemist Aunna Younger B.S. Bioengineering Customer Service Manager Karice Scott Lab Technician Kyle Ehlert QA/QC Assistant David Fisher
Page 21 of 81

Anatek Labs, Spokane Floor Plan and Safety Plan
Figure 6
EXIT EXIT EXITDesk
HWD- Hazardous Waste DisposalDesk VOC Prep Room
Office Reception Area EW- Eye Wash
Supplies
DI- Deionized Water
Desk Data Storage FX- Fire Extinguisher
FX Desk FX SS- Safety ShowerWalk-inRefridgerator FS - Flammable Solvents
DeskS - Safety Equipment
Sample HOOD Archives
H2 FX FS Desk
HOOD Desk NFSGlassware KitchenStorage Lunchroom
Wet ChemMain Lab
EWLAB
S Bathroom
EW H2 EWFX
O2Bathroom
S FX Electrical HWDDI HOOD
Metals H2 DI First Aid
Storage
Room
Metals LabBathroom
SS FXFS FS Tanks
FX HOOD DI HOOD HOOD Flammables
EXIT EXIT EXIT
File Storage
+
Desk
Page 22 of 81
Appendices
Anatek Labs, Inc.
Page 23 of 81

Anatek Labs, Inc.
Appendix A
Index of Standard Operating Procedures
Moscow Index is followed by Spokane Index
Page 24 of 81
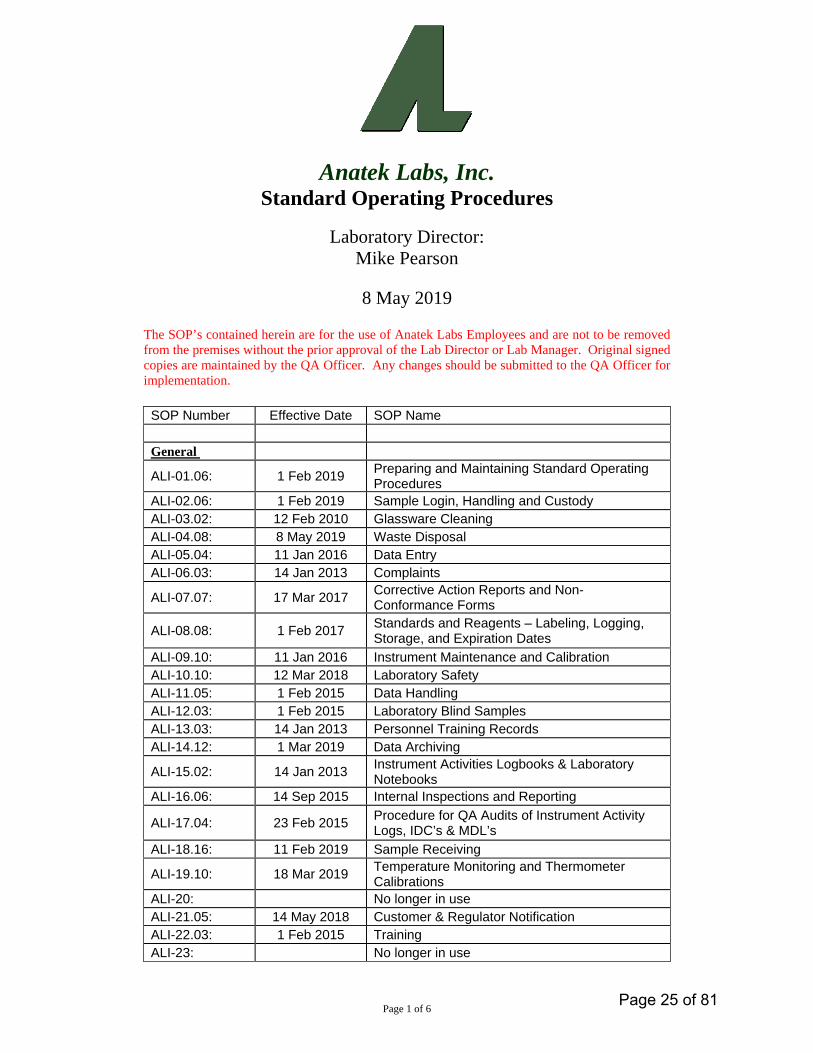
Anatek Labs, Inc. Standard Operating Procedures
Laboratory Director: Mike Pearson
8 May 2019
The SOP’s contained herein are for the use of Anatek Labs Employees and are not to be removed from the premises without the prior approval of the Lab Director or Lab Manager. Original signed copies are maintained by the QA Officer. Any changes should be submitted to the QA Officer for implementation.
SOP Number Effective Date SOP Name General
ALI-01.06: 1 Feb 2019 Preparing and Maintaining Standard Operating Procedures
ALI-02.06: 1 Feb 2019 Sample Login, Handling and CustodyALI-03.02: 12 Feb 2010 Glassware Cleaning ALI-04.08: 8 May 2019 Waste DisposalALI-05.04: 11 Jan 2016 Data EntryALI-06.03: 14 Jan 2013 Complaints
ALI-07.07: 17 Mar 2017 Corrective Action Reports and Non-Conformance Forms
ALI-08.08: 1 Feb 2017 Standards and Reagents – Labeling, Logging, Storage, and Expiration Dates
ALI-09.10: 11 Jan 2016 Instrument Maintenance and Calibration ALI-10.10: 12 Mar 2018 Laboratory SafetyALI-11.05: 1 Feb 2015 Data HandlingALI-12.03: 1 Feb 2015 Laboratory Blind SamplesALI-13.03: 14 Jan 2013 Personnel Training RecordsALI-14.12: 1 Mar 2019 Data Archiving
ALI-15.02: 14 Jan 2013 Instrument Activities Logbooks & Laboratory Notebooks
ALI-16.06: 14 Sep 2015 Internal Inspections and Reporting
ALI-17.04: 23 Feb 2015 Procedure for QA Audits of Instrument Activity Logs, IDC’s & MDL’s
ALI-18.16: 11 Feb 2019 Sample Receiving
ALI-19.10: 18 Mar 2019 Temperature Monitoring and Thermometer Calibrations
ALI-20: No longer in use ALI-21.05: 14 May 2018 Customer & Regulator NotificationALI-22.03: 1 Feb 2015 TrainingALI-23: No longer in use
Page 1 of 6 Page 25 of 81

Standard Operating Procedures Anatek Labs, Inc. ALI-24.03: 23 Feb 2015 Performing Records InspectionsALI-25.06: 5 Jan 2018 Performance of IDCs, MDLs, and PQLsALI-26.05: 21 Jun 2018 Data ReportingALI-27.04: 18 Mar 2019 IT Systems DocumentationALI-28.00: 1 Sep 2012 QC Acceptance RangesALI-29.05: 18 Feb 2019 PT ReportingALI-30.03: 4 Aug 2017 Authorized Signatures ALI-31.00: 1 Aug 2015 Master List of Quality Systems DocumentsALI-32.00: 13 Mar 2017 Preventive Action Reports Office Manual ALI-OM-01.02: 13 Jan 2010 Customer ServiceALI-OM-02.02: 13 Jan 2010 Custodial ServicesALI-OM-03: No longer in use ALI-OM-04.02: 13 Jan 2010 Telephone Systems ProceduresALI-OM-05.03: 5 Jan 2018 Mail HandlingALI-OM-06.04: 17 Feb 2017 PurchasingALI-OM-07.07: 9 Jan 2015 ShippingALI-OM-08.03: 14 Jan 2013 Office EquipmentALI-OM-09.07: 11 Feb 2019 Accounting ALI-OM-10.03: 28 Jan 2013 Credit AccountsALI-OM-11.04: 19 Jan 2015 EmployeesALI-OM-12.00: 1 Jun 2014 Website Maintenance Radiochemistry – General (00) ALI-R-01.08: 1 Feb 2019 Radiation Safety PlanALI-R-02.02: 1 Feb 2019 Radioactive Waste Disposal ALI-R-03.01: 16 Mar 2018 Radiochemical Method ValidationALI-R-04.01: 1 Feb 2019 Detection Limits for Radionuclides Analytical Drinking Water (100)
ALI-A-101.15: 18 Mar 2019 EDB/DBCP/1,2,3-TCP Analysis by EPA Method 504.1
ALI-A-102.22: 15 Apr 2019 Haloacetic Acids Analysis by SM 6251B
ALI-A-103.15: 16 Oct 2017 Organochlorine Pesticides and PCB’s by EPA Method 505
ALI-A-104.17: 17 Dec 2018 Herbicides Analysis by EPA Method 515.4ALI-A-105.08: Not in use Volatile Organic Analysis by EPA Method 524.2ALI-A-106.17: 13 Feb 2017 Semi-volatiles Analysis by EPA Method 525.2ALI-A-107.14: 23 Feb 2018 Carbamates Analysis by EPA Method 531.2ALI-A-108.12: 28 Jan 2019 Glyphosate Analysis by EPA Method 547ALI-A-109.13: 18 Mar 2019 Endothall Analysis by EPA Method 548.1ALI-A-110.11: 23 Feb 2018 Diquat/Paraquat Analysis by EPA Method 549.2ALI-A-111: Not in use Explosives by GC/MS – EPA Method 529
Page 2 of 6 Page 26 of 81

Standard Operating Procedures Anatek Labs, Inc.
ALI-A-112: Not in use Pesticides and Flame Retardants by GC/MS – EPA Method 527
ALI-A-113: Not in use Acetanilide Degradates by LC/MS/MS – EPA Method 535
ALI-A-114: Not in use Nitrosamines by GC/MS/MS - EPA Method 521
ALI-A-115: Not in use Semi-volatiles Analysis by EPA Method 525.2 – UCMR2 List
ALI-A-116.05: 25 Feb 2019 Volatile Organic Analysis by EPA Method 524.3ALI-A-117.01: 21 Mar 2019 1,4-Dioxane by EPA Method 522ALI-A-118.02: 1 Feb 2018 Perfluorinated Alkyl Acids by EPA Method 537ALI-A-119.00: Not in use Hormones Analysis by EPA Method 539
ALI-A-120.00 Semi-volatiles Analysis by EPA Method 525.3 – UCMR4 List
ALI-A-121.01 1 Mar 2018 Alcohols by EPA Method 541 – UCMR4ALI-A-122.01 1 Mar 2018 Semivolatiles by EPA Method 530 – UCMR4
ALI-A-123.00 16 Oct 2017 Haloacetic Acids by EPA Method 552.3 – UCMR4
Non Drinking Water Organic (200)
ALI-A-201.07: 15 Mar 2019 Pressurized Fluid Extraction By EPA Method 3545
ALI-A-202: No longer used ALI-A-203.12: 16 Mar 2018 Pesticides/PCB’s by EPA Method 608.3
ALI-A-204.03: 17 Mar 2017 Carbamates/Urea Pesticide Analysis by HPLC-UV by EPA Method 8321B & EPA Method 632
ALI-A-205.14: 17 Dec 2018 Herbicides by EPA Method 8151A/615
ALI-A-206.15: 13 Feb 2017 Semivolatile Organic Compounds Analysis by GC/MS by EPA Method 625/8270D
ALI-A-207.09: 15 Jun 2018 Volatile Organic Analysis by EPA Method 8260CALI-A-208.10: 15 Jun 2018 Volatile Organic Analysis by EPA Method 624.1
ALI-A-209.04: 23 Feb 2018 Explosives and Explosive By-products by EPA Method 8330B
ALI-A-210: No longer used
ALI-A-211.11: 7 May 2018 Organophosphorus Pesticide Analysis by GC/MS by EPA Method 8141B Modified/614/614.1
ALI-A-212.12: 18 Feb 2019 Pesticides/PCB’s by EPA Method 8081B/8082AALI-A-213.07: 26 Feb 2018 Soil Herbicides by EPA Method 8151A ModifiedALI-A-214: No longer used ALI-A-215: See SOP ALI-A-340ALI-A-216.02: Not in Use Volatile Organic Analysis by EPA Method 8260B
ALI-A-217.03: 13 Feb 2017 Semivolatile Organic Compounds Analysis by EPA Method 8270C
ALI-A-218.02: 05 Oct 2015 Triclopyr and 2,4-D by HPLC/MS/MS by EPA Method 8321A
ALI-A-219.00: 18 Nov 2013 Closed Purge-and-Trap Extraction for VOCs by EPA Method 5035A
ALI-A-220.02: 5 Feb 2017 Continuous Liquid-Liquid Extraction by EPA Method 3520C
ALI-A-221.00: 16 Feb 2016 PCBs in Oil and Soil by EPA Method 8082A
Page 3 of 6 Page 27 of 81

Standard Operating Procedures Anatek Labs, Inc. ALI-A-222.01: 14 Jun 2018 Salicylic Acid by EPA Method 8321ALI-A-223.01: 14 Jun 2018 IBA by EPA Method 8321Inorganic and Wet Chemistry (300)
ALI-A-301.08: 19 Mar 2018 Orthophosphate/Total Phosphorus (SM4500P-F/EPA 365.4) Flow Injection Analysis
ALI-A-302: No longer in use
ALI-A-303.10: 20 Dec 2018 Phenolics by Manual Colorimetry by EPA Method 420.1/SM5530C/EPA 9065
ALI-A-304.09: 1 Feb 2019 Ammonia Nitrogen (SM4500NH3-G/EPA 350.1) and TKN (SM4500NorgC) by Flow Injection Analysis
ALI-A-305.02: 6 Apr 2012 Cation Exchange Capacity of Soils by EPA Method 9081
ALI-A-306.02: 1 Sep 2014 Residual Chlorine by SM 4500Cl-GALI-A-307: No longer in use
ALI-A-308.06: 14 Sept 2017 Cyanide (Total, Amenable, and Weak Acid Dissociable) by Semi-Automated Colorimetry SM 4500-CN-E-G-I
ALI-A-309.10: 20 Apr 2015 Total Cyanide by Semi-Automated Colorimetry by EPA Method 335.4/9012B
ALI-A-310.07: 5 Dec 2011 pH by EPA Method 150.1 & EPA Method 9045C & SM4500 H+B
ALI-A-311.08: 18 Feb 2019 Alkalinity by EPA Method 310.1/SM 2320B
ALI-A-312.10: 23 Jan 2019 Conductivity by EPA Method SM 2510B (and Resistivity by ASTM G57a)
ALI-A-313.03: 24 Jan 2014 Hardness by SM 2340BALI-A-314.12: 17 Jul 2017 Trace Metal Analysis by EPA Method 200.8ALI-A-315.13: 1 Apr 2019 Trace Metal Analysis by EPA Method 6020BALI-A-316.02: Not in use Ultra Trace Metal Analysis by EPA Method 1638ALI-A-317: No longer in use
ALI-A-318.13: 16 Mar 2018 Trace Mercury Analysis by EPA Method 1631/245.7/7471A
ALI-A-319.07: 22 May 2017 Nitrate/N and Nitrite/N (SM4500NO3-F & EPA 353.2) Flow Injection Analysis
ALI-A-320.14: 15 Feb 2019 Ions (Nitrate, Nitrite, Chloride, Sulfate, Fluoride, Phosphate, Bromide) By EPA Method 300.0
ALI-A-321.04: 22 Jan 2018 Chlorate Analysis by EPA Method 300.1ALI-A-322.08: 8 Mar 2019 Turbidity by EPA Method 180.1ALI-A-323.11: 18 Jun 2018 TSS by SM 2540-D and TDS by SM 2540-CALI-A-324.02: 18 Feb 2013 Color (Platinum-Cobalt Method) by SM 2120B
ALI-A-325.04: 2 Nov 2015 Total Volatile Solids by EPA Method 160.4/SM 2540E & Total Fixed Solids (%Ash) by EPA Method 1684 and Total Solids
ALI-A-326.02: 1 Mar 2012 Total Volatile Acids by SM 5560 CALI-A-327.03: 11 Apr 2016 Anionic Surfactants by Method 5540 CALI-A-328.05: 1 Mar 2017 Tannin and Lignin by SM 5550 BALI-A-329: No longer in use
ALI-A-330.07: 22 Jan 2018 Toxicity Characteristic Leaching Procedure by SW 846 Method 1311
ALI-A-331: No longer in use
Page 4 of 6 Page 28 of 81

Standard Operating Procedures Anatek Labs, Inc. ALI-A-332.06: 2 Oct 2017 Sulfide (SM4500-S2 F) Iodometric Titration
ALI-A-333: Not in use Ammonia Nitrogen by SM4500 NH3-G (Discrete Analyzer)
ALI-A-334: Not in use Low Level Orthophosphate/Total P by SM4500P-F (Discrete Analyzer)
ALI-A-335: Not in use Mid Range Orthophosphate/Total P by SM4500P-F (Discrete Analyzer)
ALI-A-336: Not in use TKN by SM4500NorgC (Discrete Analyzer)
ALI-A-337.04: 24 Feb 2014 Synthetic Precipitation Leaching Procedure by SW-846 Method 1312
ALI-A-338.11: 15 Apr 2019 Trace Metals Analysis by EPA Method 200.7ALI-A-339.05: 1 Dec 2016 Trace Metals Analysis by EPA Method 6010D
ALI-A-340.05: 26 Jan 2018 Perchlorate by EPA Method 331.0 (HPLC/ESI/MS)
ALI-A-341.04: 11 Feb 2019 Perchlorate by EPA Method 6850ALI-A-342.02: 18 Aug 2014 TOC/DOC by SM5310B
ALI-A-343.06: Not in use Trace Metals Analysis by EPA Method 200.8 – UCMR3 Analysis
ALI-A-344.02: 11 Jan 2016 Acid Digestion of Sediments, Sludges, and Soils by EPA Method 3050B
ALI-A-345.00: 26 Jun 2013 Odor by SM 2150B
ALI-A-346.01: 14 Jan 2019 Trace Metals Analysis by EPA Method 200.8 – UCMR4 Analysis
UST Petroleum Methods (400) ALI-A-401: No longer used ALI-A-402: No longer usedALI-A-403: No longer used
ALI-A-404.10: 1 Mar 2019 Gasoline Analysis by NWTPHG(x)/EPA Method 8260C/EPA Method 8015 (Modified)/NW TPHG(X)
ALI-A-405.14: 1 Mar 2018 TPH-D & HCID-NW TPH-D & NW TPH-HCID – EPA 8015D
ALI-A-406: No longer used
ALI-A-407.08: 1 Dec 2018 Hexane Extractable Material (FOG) by EPA Method 1664B
ALI-A-408.05: No longer used ALI-A-409: No longer used ALI-A-410: No longer used ALI-A-411.03: 9 Mar 2018 Flashpoint by EPA Method 1010ALI-A-412: Not in use C10-C32 Hydrocarbons in Soil by 8015AZALI-A-413.03: 26 Jan 2015 Glycols by EPA 8015DALI-A-414.00 9 Mar 2019 Ignitability by EPA 1030Coliform and Bacteria (500) ALI-A-501.08: 1 Dec 2017 SM 9223B-MPN (Quanti-tray) ProcedureALI-A-502.12: 1 Feb 2019 SM 9223B-PA ProcedureALI-A-503.04: 1 Mar 2017 Heterotrophic Plate Count by Method 9215 BALI-A-504: No longer used
ALI-A-505.04: 19 Apr 2016 SM 9221E-MPN Fecal Coliform and E. coli Count by Multiple Tube Fermentation
Page 5 of 6 Page 29 of 81

Standard Operating Procedures Anatek Labs, Inc.
ALI-A-506.05: 19 Apr 2016 SM9221B-E-F-MPN Total Coliform, Fecal Coliform, and E. coli Count by Multiple Tube Fermentation
ALI-A-507.00 1 Jan 2017 BOD, CBOD, and Dissolved Oxygen by SM 5210B
Special (600) ALI-A-601.07: 4 Jun 2018 Quantitation of Clopyralid in Finished Compost
ALI-A-602.05: 25 Mar 2016 Determination of Methamphetamine from Wipe Samples and Other Matrices
ALI-A-603.00: 26 Nov 2012 Glyphosate and AMPA in Soil & Solids
ALI-A-604.00: 25 Mar 2019 Acesulfame K and Sucralose in Water – LC/MS/MS
Radiochemistry - Analytical (700)
ALI-A-701.08: 20 Apr 2018 Gross Alpha-Beta Radioactivity by EPA Method 900.0
ALI-A-702.06: 20 Apr 2018 Radium-226 by EPA Method 903.1ALI-A-703.09: 1 Apr 2019 Radium-228 by EPA Method 904.0ALI-A-704.02: 1 Apr 2019 Wipe Testing for Gross Alpha-Beta RadioactivityALI-A-705.05: 26 Jan 2018 ICP Barium RecoveryALI-A-706.08: 1 Apr 2019 Radium 226 by EPA Method 903.0
Page 6 of 6 Page 30 of 81

Anatek Labs, Inc. Spokane Laboratory
Standard Operating Procedures
Laboratory Director: Mike Pearson
1 Apr 2019
The SOP’s contained herein are for the use of Anatek Labs Employees and are not to be removed from the premises without the prior approval of the Lab Director or Lab Manager. Original signed copies are maintained by the QA Officer. Any changes should be submitted to the QA Officer for implementation.
SOP Number Effective Date SOP Name
General (00) ALI-01.02 3 Apr 2015 Preparing and Maintaining Standard Operating
Procedures ALI-02.04 1 Oct 2017 Sample Login, Handling, and Custody ALI-03.02 24 Jan 2019 Glassware Cleaning ALI-04.00 24 Jan 2019 Waste Disposal ALI-05.00 1 Feb 2019 Data Entry ALI-06.01 15 Mar 2019 Complaints ALI-07.04 20 Mar 2017 Corrective Action Reports
ALI-08.00 1 Feb 2019 Standards and Reagents - Labeling, Logging, Storage, and Expiration Dates
ALI-09.03 11 Mar 2019 Instrument Maintenance and Calibrations ALI-10.01 14 Dec 2014 Chemical Hygiene Plan ALI-11.02 1 Feb 2019 Data Handling ALI-12.00 20 Apr 2018 Laboratory Blind Sample ALI-13.02 1 Apr 2019 Personnel Training Records ALI-14.00 20 Apr 2018 Data Archiving ALI-15.02 24 Jan 2019 Instrument Activities Logbooks ALI-16.03 13 Mar 2019 Internal Inspections and Reporting
ALI-17.02 5 Sept 2018 Procedure for QA Audits of Instrument Activity Logs, IDC’s and MDL’s
ALI-18.02 15 Jun 2016 Sample Receiving ALI-19.02 4 Jul 2018 Calibration and Monitoring of Thermometers ALI-20.02 4 Jul 2018 IDEXX Bottle Volume and Sterility Test ALI-21.03 1 Feb 2019 Customer Notification ALI-22.02 4 Jul 2018 Training ALI-23.02 19 Mar 2018 Shipping and Receiving
Page 1 of 5 Page 31 of 81

Standard Operating Procedures Anatek Labs, Inc.
ALI-24.01 25 Jan 2016 Performing Records Inspections ALI-25.02 26 Feb 2018 Performance of IDOCs, MDLs, and PQLs ALI-26.03 21 Jun 2018 Data Reporting ALI-27.01 1 Jun 2016 IT Systems Documentation ALI-28.02 30 Aug 2018 QC Acceptance Ranges and Control Charting ALI-29.02 4 Jul 2016 PT Reporting ALI-30.02 21 Nov 2017 Authorized Signatures ALI-31.02 3 May 2017 Fume Hood Performance Testing ALI-32.02 4 Jul 2018 Vendor Qualifications and Purchasing ALI-33.02 2 Feb 2019 Regulatory Inspections ALI-34.02 6 Feb 2019 Law Enforcement, Cannabis and Anatek Labs ALI-35.02 10 Feb 2019 Security System ALI-36.00 20 Mar 2017 Preventive Action Reports
Office Manual (00)
ALI-OM-1.03 21 Nov 2017 Customer Service ALI-OM-2.03 1 Mar 2018 Custodial Services ALI-OM-3.02 18 Apr 2016 Sample Handling Procedures ALI-OM-4.03 10 Nov 2017 Telephone Systems Procedures ALI-OM-5.02 28 Apr 2016 Mail Handling ALI-OM-6.03 21 Nov 2017 Purchasing ALI-OM-7.03 1 Mar 2018 Shipping ALI-OM-8.02 16 May 2016 Office Equipment ALI-OM-9.02 16 May 2016 Accounting
ALI-OM-10.02 20 May 2016 Credit Accounts ALI-OM-11.02 20 May 2016 Employees
Analytical
Organics (100)
ALI-S-101.04 1 Mar 2019 Volatile Organic Analysis by EPA Method 524.2 ALI-S-102.03 1 Mar 2019 Volatile Organic Analysis by EPA Method 624 ALI-S-103.05 1 Mar 2019 Volatile Organic Analysis by EPA Method 8260C ALI-S-104.03 6 Dec 2016 Total Organic Carbon by SM 5310C ALI-S-105.05 17 Dec 2016 Total Organic Halides by EPA Method 9020B ALI-S-106.05 17 Dec 2016 Extractable Organic Halides by EPA Method 9023 ALI-S-107.01 Inactive Haloacetic Acids by SM 6251B
Inorganic and Wet Chemistry (200)
ALI-S-201.02 1 Jan 2016 Total Phosphorus by SM4500-PF
- 2 - Page 32 of 81

Standard Operating Procedures Anatek Labs, Inc.
ALI-S-202.01 1 Jan 2016 Total Residual Chloride by SM4500Cl-G ALI-S-203 Total Cyanide by SM 4500CN-F
ALI-S-204.06 1 Feb 2019 pH by EPA Method 150.1
ALI-S-205.08 1 Feb 2019 Alkalinity (Carbonate & Bicarbonate) by SM 2320 B/EPA 310.1
ALI-S-206.06 15 Aug 2017 Conductivity by SM 2510 B ALI-S-207.08 13 Nov 2018 Hardness by SM 2340 C – EPA 130.2 (CaCO3)
ALI-S-208.05 25 Feb 2019 Anions (NO3, NO2, SO4, Cl, F, PO4, Br) by EPA Method 300.0
ALI-S-209.01 Inactive Ions (Bromate, Chlorate, Chlorite) by EPA Method 300.1 Part B
ALI-S-210.04 10 Jul 2017 Turbidity by EPA Method 180.1
ALI-S-211.05 6 Mar 2017 TSS (Total Suspended Solids) by EPA Method 160.2/SM 2540 D
ALI-S-212.05 6 Mar 2017 TDS (Total Dissolved Solids) by EPA Method 160.1/SM 2540 C
ALI-S-213.00 6 Mar 2017 TS (Total Solids) by EPA Method 160.3 ALI-S-214.04 6 Mar 2017 BOD/DO/CBOD by SM 5210 B ALI-S-215.03 2 Feb 2010 COD by EPA Method 410.4 ALI-S-216.00 6 Mar 2017 Percent Solids ALI-S-217.06 1 Feb 2019 pH (non-aqueous) by EPA Method 9045D ALI-S-218.03 1 Feb 2019 Color by SM 2120 B ALI-S-219.01 11 Apr 2016 Ammonia Nitrogen by SM 4500 NH3-G ALI-S-220.02 15 Mar 2019 Ortho-phosphate by SM 4500-PF
ALI-S-221 3 Dec 2009 Sulfide by SM4500-S2-F ALI-S-222.02 28 Jan 2010 Acidity by EPA 310.1 / SM2310-B
ALI-S-223 22 Jul 2010 Sulfite by SM4500-SO32-B ALI-S-224 Inactive No Longer In Use
ALI-S-225.01 1 Feb 2018 Resistivity by ASTMG57A ALI-S-226.08 1 Feb 2019 Metals by EPA 200.8 ALI-S-227.07 1 Mar 2019 Metals by EPA 6020A-B ALI-S-228.01 15 Dec 2016 TKN by SM 4500NORG C
ALI-S-229 29 Apr 2011 Specific Gravity/Density by ALI-S-230 30 Sep 2016 Chlorine Demand by SM
ALI-S-231.01 Inactive MBAS by SM 5540C ALI-S-232.02 29 Apr 2016 Carbon Dioxide ALI-S-233.02 14 Jan 2019 Sulfide by SM4500-S2-D ALI-S-234.02 11 Feb 2019 CN in DW by SM 4500 CN E / EPA 335.4 ALI-S-235.03 16 Dec 2016 Total CN by SM 4500 CN N / EPA 335.4 ALI-S-236.03 25 Feb 2019 Nitrate + Nitrite by SM 4500 ALI-S-237.02 1 Feb 2018 Hexane Extractable Material by EPA 1664A/B
ALI-S-238 1 Jun 2014 Sharps, Inerts and Foreign Matter by TMECC 03.06 ALI-S-239.00 10 Mar 2015 Mercury Analysis by EPA 245.1 ALI-S-240.02 1 Mar 2018 Trace Mercury Analysis by EPA 245.7/7471B/245.2
ALI-S-241.00 15 Mar 2019 Toxicity Characteristic Leaching Procedure by SW 846 Method 1311
ALI-S-242.00 1 Mar 2017 Cation Exchange Capacity of Soils by EPA Method 9081
- 3 - Page 33 of 81
Standard Operating Procedures Anatek Labs, Inc.
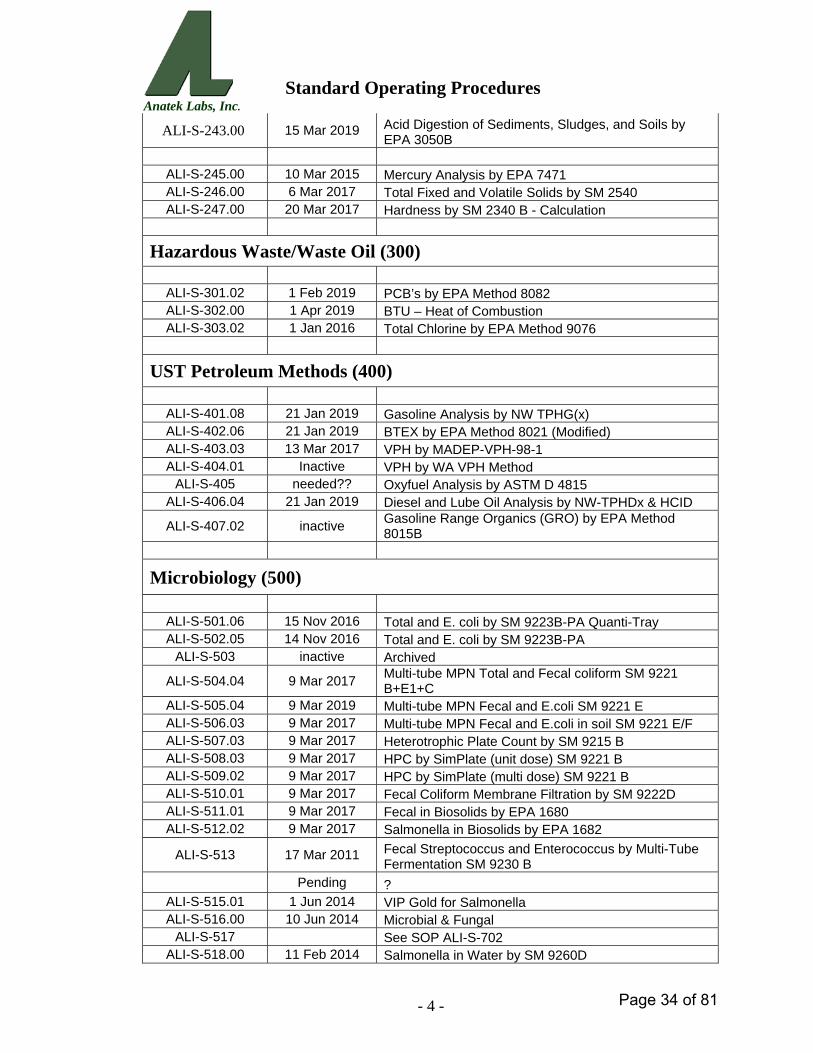
ALI-S-243.00 15 Mar 2019 Acid Digestion of Sediments, Sludges, and Soils by EPA 3050B
ALI-S-245.00 10 Mar 2015 Mercury Analysis by EPA 7471 ALI-S-246.00 6 Mar 2017 Total Fixed and Volatile Solids by SM 2540 ALI-S-247.00 20 Mar 2017 Hardness by SM 2340 B - Calculation
Hazardous Waste/Waste Oil (300)
ALI-S-301.02 1 Feb 2019 PCB’s by EPA Method 8082 ALI-S-302.00 1 Apr 2019 BTU – Heat of Combustion ALI-S-303.02 1 Jan 2016 Total Chlorine by EPA Method 9076
UST Petroleum Methods (400)
ALI-S-401.08 21 Jan 2019 Gasoline Analysis by NW TPHG(x) ALI-S-402.06 21 Jan 2019 BTEX by EPA Method 8021 (Modified) ALI-S-403.03 13 Mar 2017 VPH by MADEP-VPH-98-1 ALI-S-404.01 Inactive VPH by WA VPH Method
ALI-S-405 needed?? Oxyfuel Analysis by ASTM D 4815 ALI-S-406.04 21 Jan 2019 Diesel and Lube Oil Analysis by NW-TPHDx & HCID
ALI-S-407.02 inactive Gasoline Range Organics (GRO) by EPA Method 8015B
Microbiology (500)
ALI-S-501.06 15 Nov 2016 Total and E. coli by SM 9223B-PA Quanti-Tray ALI-S-502.05 14 Nov 2016 Total and E. coli by SM 9223B-PA
ALI-S-503 inactive Archived
ALI-S-504.04 9 Mar 2017 Multi-tube MPN Total and Fecal coliform SM 9221 B+E1+C
ALI-S-505.04 9 Mar 2019 Multi-tube MPN Fecal and E.coli SM 9221 E ALI-S-506.03 9 Mar 2017 Multi-tube MPN Fecal and E.coli in soil SM 9221 E/F ALI-S-507.03 9 Mar 2017 Heterotrophic Plate Count by SM 9215 B ALI-S-508.03 9 Mar 2017 HPC by SimPlate (unit dose) SM 9221 B ALI-S-509.02 9 Mar 2017 HPC by SimPlate (multi dose) SM 9221 B ALI-S-510.01 9 Mar 2017 Fecal Coliform Membrane Filtration by SM 9222D ALI-S-511.01 9 Mar 2017 Fecal in Biosolids by EPA 1680 ALI-S-512.02 9 Mar 2017 Salmonella in Biosolids by EPA 1682
ALI-S-513 17 Mar 2011 Fecal Streptococcus and Enterococcus by Multi-Tube Fermentation SM 9230 B
Pending ? ALI-S-515.01 1 Jun 2014 VIP Gold for Salmonella ALI-S-516.00 10 Jun 2014 Microbial & Fungal
ALI-S-517 See SOP ALI-S-702 ALI-S-518.00 11 Feb 2014 Salmonella in Water by SM 9260D
- 4 - Page 34 of 81

Standard Operating Procedures Anatek Labs, Inc.
Radionuclides (600)
ALI-S-601.05 4 May 2018 Gross Alpha and Gross Beta by EPA 900.0 ALI-S-602 Pending Radium 228 by EPA 904.0
ALI-S-603.01 2 Feb 2017 Radium 226 by EPA 903.0
Cannabis (700)
ALI-S-701.05 1 Apr 2019 THC Analysis by HPLC with UV/VIS Detector ALI-S-702.04 1 Apr 2019 Cannabis Microbiology Testing (Petrifilm Methods) ALI-S-703.02 29 Aug 2018 Residual Solvent by GC/MS ALI-S-704.01 26 Jun 2017 Foreign Matter in Cannabis ALI-S-705.00 1 Sept 2017 Water Activity in Cannabis ALI-S-706.03 1 Apr 2019 Mycotoxins in Cannabis ALI-S-707.02 30 Aug 2018 Terpenes in Cannabis
- 5 - Page 35 of 81

Appendix B
Example of Sample Submission Form
Page 36 of 81

Company Name: Project Manager:
Address: Project Name & # :
City: State: Zip: Email Address :
Phone: Purchase Order #:
Fax: Sampler Name & phone:
Provide Sample Description List Analyses Requested Note Special Instructions/Comments
Lab ID Sample Identification Sampling Date/Time Matrix
Received Intact? Y NLabels & Chain Agree? Y NContainers Sealed? Y NVOC Head Space? Y N
Printed Name Signature Company Date Time
Relinquished by Temperature (C):Received by
Relinquished by Preservative:Received by
Relinquished by Inspected By:Received by Date & Time:
Inspection Checklist
# of
Con
tain
ers
Sam
ple
Vol
ume
Turn Around Time & Reporting
*All rush order requests must be prior approved.
Anatek Log-In #
Chain of Custody Record1282 Alturas Drive, Moscow ID 83843 (208) 883-2839 FAX 882-9246
504 E Sprague Ste D, Spokane WA 99202 (509) 838-3999 FAX 838-4433
Preservative:
Inc. Labs,
Anatek
Please refer to our normal turn around times at:http://www.anateklabs.com/services/guidelines/reporting.asp
__Normal__Next Day*__2nd Day*__Other*______
__Phone__Mail__Fax__Email
Page 37 of 81

Appendix C
Quick Reference for Chemical Safety
ACIDS Hazards First Aid (Skin)
Fire-Fighting Spillage
Acetic Acid (CH3COOH)
Flammable, corrosive
Water spray CO2, Powder Neutralize with weak base
Hydrochloric acid (HCl) (concentrated)
Not combustible, corrosive
Rinse with plenty of water
Any extinguishing agent
Report to supervisor
Hydrochloric acid (HCl) (diluted, 50%<)
Corrosive, not combustible
Rinse with plenty of water
Any extinguishing agent
Neutralize with weak base
Hydrofluoric Acid (HF) (concentrated)
Corrosive, not combustible
Rinse with plenty of water
NO hydrous agent
Report to supervisor
Hydrofluoric Acid (HF) (diluted 30%<)
Corrosive, not combustible
Rinse with plenty of water
NO hydrous agent
Neutralize with weak base
Nitric Acid (HNO3) (concentrated)
Corrosive, not combustible
Rinse with plenty of water
NO FOAM Report to supervisor
Nitric Acid (HNO3) (diluted, 50%<)
Corrosive, not combustible
Rinse with plenty of water
NO FOAM Neutralize with weak base
Phosphoric Acid (H3PO4) (diluted or concentrated)
Corrosive, not combustible
Rinse with plenty of water
Any extinguishing agent
Neutralize with weak base
Sulfuric Acid (H2SO4) (diluted or concentrated)
Corrosive, not combustible
Rinse with plenty of water
Powder, CO2, NO WATER
Neutralize with weak base
BASES
Ammonium Hydroxide (NH4OH)
Corrosive, not combustible
Rinse with plenty of water
Any extinguishing agent
Neutralize with weak acid
Page 38 of 81
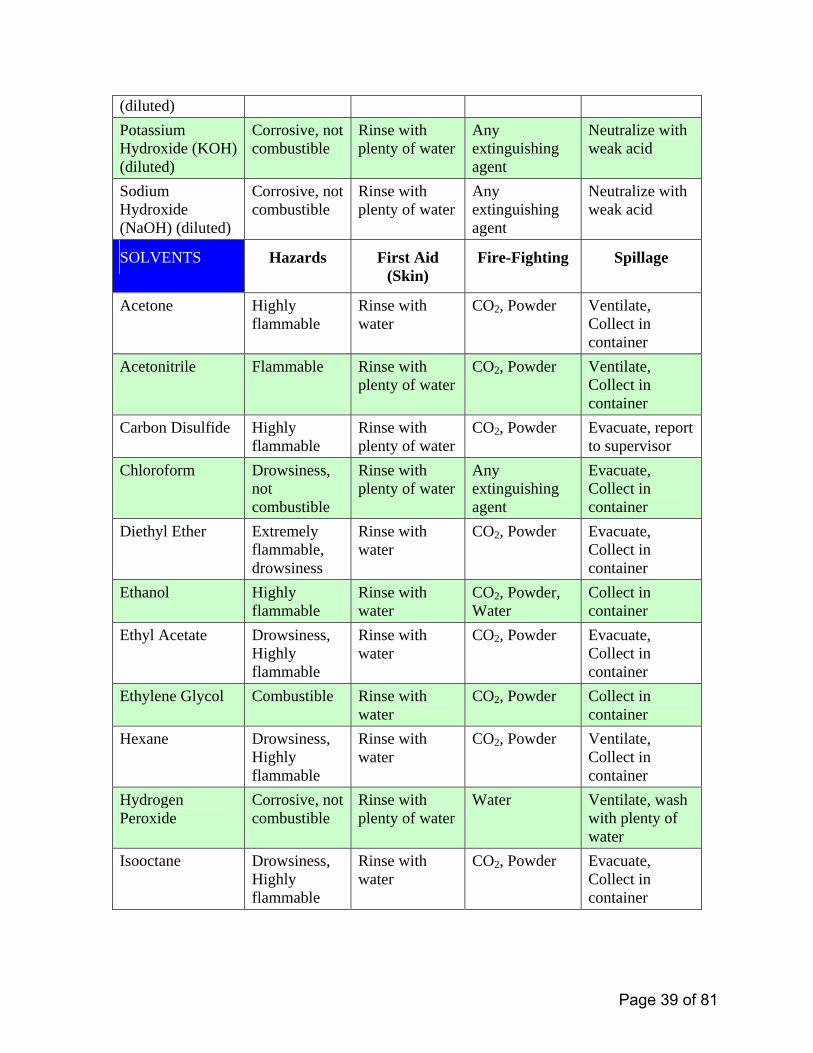
(diluted) Potassium Hydroxide (KOH) (diluted)
Corrosive, not combustible
Rinse with plenty of water
Any extinguishing agent
Neutralize with weak acid
Sodium Hydroxide (NaOH) (diluted)
Corrosive, not combustible
Rinse with plenty of water
Any extinguishing agent
Neutralize with weak acid
SOLVENTS Hazards First Aid (Skin)
Fire-Fighting Spillage
Acetone Highly flammable
Rinse with water
CO2, Powder Ventilate, Collect in container
Acetonitrile Flammable Rinse with plenty of water
CO2, Powder Ventilate, Collect in container
Carbon Disulfide Highly flammable
Rinse with plenty of water
CO2, Powder Evacuate, report to supervisor
Chloroform Drowsiness, not combustible
Rinse with plenty of water
Any extinguishing agent
Evacuate, Collect in container
Diethyl Ether Extremely flammable, drowsiness
Rinse with water
CO2, Powder Evacuate, Collect in container
Ethanol Highly flammable
Rinse with water
CO2, Powder, Water
Collect in container
Ethyl Acetate Drowsiness, Highly flammable
Rinse with water
CO2, Powder Evacuate, Collect in container
Ethylene Glycol Combustible Rinse with water
CO2, Powder Collect in container
Hexane Drowsiness, Highly flammable
Rinse with water
CO2, Powder Ventilate, Collect in container
Hydrogen Peroxide
Corrosive, not combustible
Rinse with plenty of water
Water Ventilate, wash with plenty of water
Isooctane Drowsiness, Highly flammable
Rinse with water
CO2, Powder Evacuate, Collect in container
Page 39 of 81

Methanol Highly flammable
Rinse with water
CO2, Powder, Water
Evacuate, Collect in container
Methylene Chloride
Drowsiness, combustible
Rinse with water
Any extinguishing agent
Ventilate, Collect in container
MTBE Highly flammable
Rinse with water
CO2, Powder Ventilate, Collect in container
THF Highly flammable
Rinse with water
CO2, Powder, Water
Ventilate, Collect in container
Toluene Highly flammable
Rinse with water
CO2, Powder Collect in container
Page 40 of 81

Appendix D
Laboratory Management and Staff CVs/Qualifications
Page 41 of 81

ANATEK LABS, INC. MIKE PEARSON [email protected]
EXPERIENCE 08/00– Present Laboratory Manager, Alturas Analytics, Inc, Moscow, ID
Manages and initiates experiments in the laboratory including: Develops and directs employees in the development of HPLC/MS/MS methods, Maintains analytical equipment, supervise scientific employees, perform HPLC/MS/MS quantitation of drugs and other compounds from various matrices, develops HPLC/MS/MS methods
03/92- Present Laboratory Director, Anatek Labs, Inc., Moscow, ID Directs all aspects of the laboratory including:
Supervise scientific and administrative personnel, develop business plan and marketing strategy, prepare and analyze budgets, bid contracts
09/87-03/92 Instrumentation Specialist, Precision Analytics, Pullman, WA SKILLS AND TECHNIQUES
• Gas Chromatography (GC) with ECD, FID, NPD detection • Gas Chromatography/Mass spectrometry (GC/MS), and tandem mass spectrometry
(GC/MS/MS) • HPLC with UV and Fluorescence detection and post column reaction techniques • Liquid Chromatography with tandem mass spectrometry (LC/MS/MS) • Ion Chromatography and Flow Injection Analysis • ICP-MS, Atomic Absorption/Atomic Emission spectroscopy AA and AE • CVAFS – Cold vapor atomic fluorescence spectroscopy • Method development and analysis of small molecule organic and inorganic compounds
using the above techniques • Extractions and wet chemistry including solid and liquid phase extraction techniques
EDUCATION BS in Electrical Engineering, University of Idaho, Moscow, ID, 1987
Page 42 of 81

ANATEK LABS, INC. TODD TARUSCIO [email protected]
EXPERIENCE 2016 – Present Laboratory Manager, Anatek Labs, Inc, Moscow, ID Responsible for all aspects of day-to-day operation of a full service analytical
laboratory, including customer relations, preparation of bids and reports, troubleshooting methods and analytical instruments, and developing new methods per customer guidelines.
2006– 2016 Technical Director, Anatek Labs, Inc, Moscow, ID Manage and coordinate activities of laboratory departments, assuring objectives of the QA Plan are met. Provide technical support to laboratory staff, and investigate new methods and technologies. Responsible for non-routine instrument maintenance. Write reports and work with customers as necessary.
1999 – 2006 Organic Group Leader/Manager, Analytical Sciences Laboratory, Dept. of Food Science and Toxicology, University of Idaho, Moscow, ID General & direct supervision of scientists & technicians performing organic analysis, including pesticides, herbicides, and other compounds in biological and environmental samples. Also responsible for QA/QC oversight and Good Laboratory Practice compliance.
1994-1999 Laboratory Manager, Anatek Labs, Inc., Moscow, ID Managed full service environmental laboratory, including inorganic and organic analyses of water and soil samples.
1989-1994 Teaching Assistant, Dept. of Zoology, Washington State University, Pullman Organized, supervised, and lectured in physiology courses, including human, mammalian, and cell physiology.
SKILLS AND TECHNIQUES
• Gas Chromatography (GC) with ECD, FID, NPD detection • Gas Chromatography/Mass spectrometry (GC/MS), and tandem mass spectrometry (GC/MS/MS) • HPLC with UV and Fluorescence detection and post column reaction techniques • Liquid Chromatography with tandem mass spectrometry (LC/MS/MS) • Ion Chromatography • Residue analysis, method development and validation, technical report writing, personnel
management • Extractions and wet chemistry including solid and liquid phase extraction techniques
EDUCATION Ph.D in Zoophysiology, Washington State University, Pullman, 1994 B.S. in Biochemistry, Washington State University, Pullman, 1989
Page 43 of 81

ANATEK LABS, INC. ERIN LINSKEY [email protected]
EXPERIENCE 7/02 – Present Inorganic Supervisor, Chemist III, Anatek Labs, Inc, Moscow, ID
Typical duties include training junior level staff, editing and improving analytical procedures and coordinating Inorganic department, troubleshooting methods and analytical instruments. Responsible for performing preparation and analysis of trace and ultra trace metal levels in samples.
9/98 – 7/02 Analyst/Lab Technician, Anatek Labs, Inc, Moscow, ID 9/97 – 5/98 Lab Technician, Stukenholtz Laboratory, Twin Falls, ID SKILLS AND TECHNIQUES
• ICP-MS, Atomic Absorption/Atomic Emission spectroscopy AA and AE • CVAFS – Cold vapor atomic fluorescence spectroscopy • Ion Chromatography IC • Flow Injection Analysis FIA • Wet Chemistry and Microbiology
EDUCATION BS in Biology, Minor History, University of Idaho, Moscow, ID, 2000 AWARDS AND PROFESSIONAL AFFILIATIONS National Dean’s List, member, 2000 - present American Red Cross, Certified First Responder, 1999 – present Presidential Award for Academic Achievement, 1993
Page 44 of 81
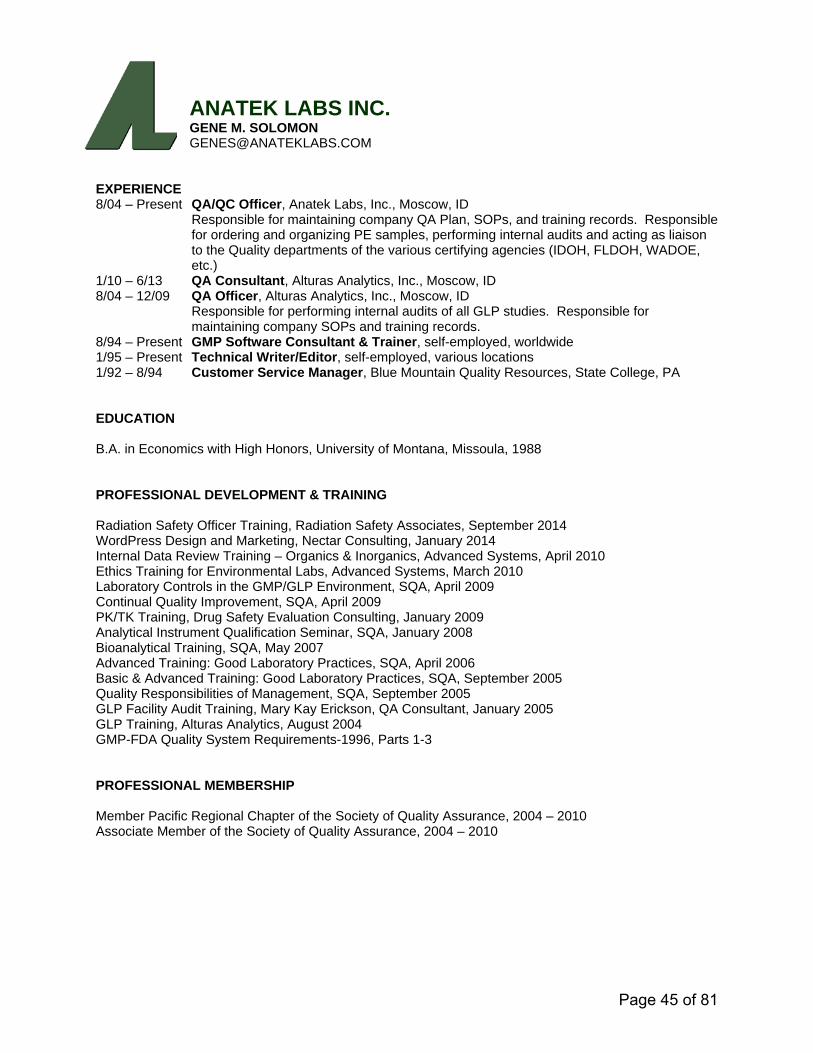
ANATEK LABS INC. GENE M. SOLOMON [email protected]
EXPERIENCE 8/04 – Present QA/QC Officer, Anatek Labs, Inc., Moscow, ID
Responsible for maintaining company QA Plan, SOPs, and training records. Responsible for ordering and organizing PE samples, performing internal audits and acting as liaison to the Quality departments of the various certifying agencies (IDOH, FLDOH, WADOE, etc.)
1/10 – 6/13 QA Consultant, Alturas Analytics, Inc., Moscow, ID 8/04 – 12/09 QA Officer, Alturas Analytics, Inc., Moscow, ID
Responsible for performing internal audits of all GLP studies. Responsible for maintaining company SOPs and training records.
8/94 – Present GMP Software Consultant & Trainer, self-employed, worldwide 1/95 – Present Technical Writer/Editor, self-employed, various locations 1/92 – 8/94 Customer Service Manager, Blue Mountain Quality Resources, State College, PA EDUCATION B.A. in Economics with High Honors, University of Montana, Missoula, 1988 PROFESSIONAL DEVELOPMENT & TRAINING Radiation Safety Officer Training, Radiation Safety Associates, September 2014 WordPress Design and Marketing, Nectar Consulting, January 2014 Internal Data Review Training – Organics & Inorganics, Advanced Systems, April 2010 Ethics Training for Environmental Labs, Advanced Systems, March 2010 Laboratory Controls in the GMP/GLP Environment, SQA, April 2009 Continual Quality Improvement, SQA, April 2009 PK/TK Training, Drug Safety Evaluation Consulting, January 2009 Analytical Instrument Qualification Seminar, SQA, January 2008 Bioanalytical Training, SQA, May 2007 Advanced Training: Good Laboratory Practices, SQA, April 2006 Basic & Advanced Training: Good Laboratory Practices, SQA, September 2005 Quality Responsibilities of Management, SQA, September 2005 GLP Facility Audit Training, Mary Kay Erickson, QA Consultant, January 2005 GLP Training, Alturas Analytics, August 2004 GMP-FDA Quality System Requirements-1996, Parts 1-3 PROFESSIONAL MEMBERSHIP Member Pacific Regional Chapter of the Society of Quality Assurance, 2004 – 2010 Associate Member of the Society of Quality Assurance, 2004 – 2010
Page 45 of 81

ANATEK LABS INC. KATHLEEN A. SATTLER [email protected]
EXPERIENCE
10/01 – Present Laboratory Manager, Anatek Labs, Inc., Spokane, WA
Responsible for all aspects of day-to-day operation of a full service analytical laboratory. Typical duties include training junior level staff, preparing bids and reports, troubleshooting methods and analytical instruments, and developing new methods per customer guidelines, and customer relations. 07/96 – 10/01 Microbiology Supervisor, Anatek Labs, Inc., Spokane, WA 10/96 – 02/97 Laboratory Assistant, Sacred Heart Medical Center, Spokane, WA 07/95 – 07/96 Microbiologist I, Bremerton-Kitsap County Health District, Bremerton, WA
SKILLS AND TECHNIQUES
• Bacteria cultures, isolation, identification • Membrane filtration • Multiple tube fermentation • Heterotrophic plate count • Bacteriological examination of water • Proficient with aseptic technique • Nutrient agar preparation • Centrifugation and separation of blood for testing • Spectrophotometry • Dilutions, titrations • Urine analysis • Quality control and Quality analysis
EDUCATION B.S. in Microbiology, Minor in Chemistry, University of Idaho, 1994 Professional Affiliations American Water Works Association Member AWWA Inland Empire Subsection Member
Page 46 of 81
ANATEK LABS INC. WENDY OZMINKOWSKI [email protected]
EXPERIENCE
2004 – Present Chemist III, Anatek Labs, Inc., Spokane, WA Responsible for TOX’s, G/BTEX, VOC’s, VPH’s, OxyFuels, Ion analysis and BTU’s. Responsible for troubleshooting and repair of instruments and methods. 2002 – 2004 Organic Chemistry Supervisor, SVL Analytical, Inc., Kellogg, ID 1998 – 2002 Organic Chemist I, SVL Analytical, Inc., Kellogg, ID 1998 Laboratory Technician, Quality Coatings, Post Falls, ID 1993 – 1995 Laboratory Technician, North Idaho College, Coeur d’Alene, ID
SKILLS AND TECHNIQUES
• Gas Chromatography (GC) with ECD, ELCD, FID, PID detection • Gas Chromatography/Mass spectrometry (GC/MS) • Ion Chromatography (IC) • Extractions and wet chemistry including solid and liquid phase extraction techniques • Dohrmann Phoenix 8000 NDIR • TOX 10
EDUCATION B.S. in Chemistry, University of Idaho, 1996 AWARDS AND PROFESSIONAL AFFILIATIONS American Chemical Society, 2000-2004
Page 47 of 81
ANATEK LABS INC. KARICE T. SCOTT [email protected]
EXPERIENCE
10/03 – Present Sample Custodian, Anatek Labs, Inc., Spokane, WA Responsibilities include sample receipt/processing, customer service and general office. 09/95-05/03 Social Activities Director, The Spokane Club, Spokane, WA
SKILLS AND TECHNIQUES
• Microsoft Office applications • Sample handling • Database maintenance • Customer relations • Shipping and receiving
EDUCATION Business Skills Certificate, Spokane Falls Community College, 1992
Page 48 of 81

ANATEK LABS INC. ANDREW P. MENDEZ [email protected]
EXPERIENCE
2/11 – Present Radiation Safety Officer, Anatek Labs, Inc., Spokane, WA Responsibilities: Preparation/implementation of radiochemistry division Overseeing safe use/transport of radioactive material Radionuclide analysis of drinking water
10/09 - Present Chemist I, Anatek Labs, Inc., Spokane, WA Responsibilities: Analysis of PCB’s in all matrices on the GC/ECD. Variety of Wet Chem. analyses Troubleshooting and maintenance of instruments. General lab maintenance 8/08-5/09 Lab Assistant, Carroll College, Helena, MT Responsibilities: Setup, monitoring, and cleanup of routine experiments
Reagent preparation SKILLS AND TECHNIQUES
• ICP-MS, GC-ECD, IPC • Spectrophotometry • Preparation/implementation of wide range of SOPs • Dilutions, titrations • Liquid phase extractions and solid phase extractions • Wet chemistry: pH (in soil, drinking and wastewater and other matrices), Alkalinity, TDS,
Hardness, Conductivity, Turbidity, Color • Quality control and Quality analysis • Instrument Maintenance • Gas Proportional Counter
EDUCATION B.A. in Chemistry and Spanish, Carroll College, 2009
Page 49 of 81

Appendix E
Current State Certifications Anatek - Moscow
Florida Department of Health (NELAP # E87893)
(Primary Accrediting Authority for NELAP) Idaho Department of Health (EPA ID00013) Washington Department of Ecology (C595)
Oregon Department of Environmental Quality (ORELAP # ID200001) Nevada Department of Conservation and Natural Resources (ID00013)
Montana Department of Public Health and Human Services (CERT0028) New Mexico Environment Department, Drinking Water Bureau (ID00013)
Arizona Department of Health Services (AZ0701) EPA Region 8/Wyoming (EPA ID00013)
Current State Certifications Anatek - Spokane
Florida Department of Health (NELAP # E871099)
(Primary Accrediting Authority for NELAP) Idaho Department of Health (EPA WA00169) Washington Department of Ecology (C585)
Montana Department of Public Health and Human Services (CERT0095) Washington State Liquor Control Board (Cert# 0010)
Current scopes of accreditation are available at www.anateklabs.com/certifications
Page 50 of 81

Anatek Labs, Inc.
Appendix F
Backup, Fault Tolerance, Disaster Recovery and Data Archive of Mission-critical Information Storage and
Services
Terrill Settles
Information Systems Manager
Updated 8/12/2015
Page 51 of 81

Introduction Mission-critical information storage and services are those that a business cannot afford to lose. Loss of such data or interruption of such services will seriously impact the daily operations of the business and incur monetary loss. Fault Tolerance Fault tolerance in data storage involves redundant storage disks to tolerate certain faults in the hardware. For example, in RAID 5 implementation, in case of failure of one disk, the remaining disks in the array still maintain the data. But with the loss of a disk the array is in a critical state and its performance is greatly reduced until the failed disk is replaced and the array is rebuilt. Fault tolerance only tolerates hardware faults. It does not cover human or application software faults. For example, accidental or intentional deletion by operators or file damage caused by misbehaving applications is not covered by fault tolerance. So fault tolerance does not replace backups and the archiving of the data. Backup Backup is the process of copying data to other media creating an extra copy. The media can be copied to hard disk drives, tape drives, USB drives, CD and DVD disks, and even to the internet “cloud.” In case of loss of or damage to current files, if they were backed up, and the media is available, the data can be restored. Backup usually occurs during off-peak hours, normally nights and weekends. Backups generally cannot copy certain open system files and database files such as SQL databases and Exchange Information Store. However, by using the built-in backup tools within these programs a backup can be created to a file or folder. After these backups have occurred this data can now be backed up to another media. System Disaster Backup and Recovery A system disaster is an incident that causes the loss of the server operating system and other data due to hardware or software failure. If set up correctly the downtime due to system disaster can be minimized due to a well-planned, and rehearsed, recovery model. Normal data backup works well for regular data files but does not back up the system files. The system files are used by the server’s operating system. In case of loss of the server system such as an operating system crash, the server cannot be restored the same as restoring normal data files. In a disaster recovery scenario the operating system will need to be installed, then any additional programs will need to be installed. Finally, any configurations and data files will need to be restored as well.
Page 52 of 81

A disaster recovery plan involves recognizing and documenting what programs are installed on the system, backing up of the system files and other programs configuration files, and having available a recovery plan and the backups of the files. A backup of the system has to be made during a downtime made available for system maintenance. There are different possibilities backing up of the system files. One could be an image of the server created while off-line. Backups can also be accomplished by backing up the system files using other manufacturers’ offline backup programs. Data Archiving Infrequently used older data should be archived onto other media. Data archiving serves dual purposes. It frees online disk storage, and, if it is still necessary to put a copy online, the archive provides a backup.
Identification of mission-critical information storage and services
Analytical data and results acquired by the instruments: The analytical data resides on a server with RAID 5 fault tolerance. Current and recent data files are in a share folder called “AnatekData.” Archived data is copied to CD/DVD ROMs and is available in IT and in off-site storage. These files are backed up nightly Monday through Friday, and again on Sunday night. SQL Server running on Windows server: SQL server databases for LIMS and other miscellaneous databases: LIMS databases provide data entry, storage and reporting. Databases and their logs reside on RAID drives. Further, database files and log files reside on separate disk spindles for maximum recoverability in case of disk failure. SQL provides its own backup nightly -- the files are also backed up nightly Monday through Friday, and again on Sunday night. Exchange Server running on Windows server: Microsoft Exchange Provides e-mail, tasking, scheduling and other collaborating functions to the company. The Exchange data is located on a RAID drive. Exchange provides its own backup nightly – the files are also backed up nightly Monday through Friday, and again on Sunday night. Windows Domain Controller Servers: These servers provide Active Directory services which includes user authentication, security, and sharing functions for the domain. Active Directory services provide the platform on which SQL, Exchange, FTP, IIS, and other services reside. Standard Windows File Server:
Page 53 of 81

Provide general file service for user shares. IIS on Windows Server: Provides a web service for Internet, Intranet and Extranet. QuickBooks files on Windows File Server: Stores all accounting information of the company, including banking, purchasing, receivable, payable and payroll. These files are stored on the RAID disk of Windows file server.
Data security/integrity implementations
Fault Tolerance Each Windows Server has been configured with RAID 5 or RAID 10 for storage of critical data files. All disks are hot swappable. The domain controllers have redundant power supplies. Backup The backup software currently in use is Macrium Reflect and the Windows NTbackup utility. Backup hardware is a removable hard disk drive for disk-to-disk backup. Macrium Reflect runs on server Treasure copying the following files: Analysis Data from server Treasure and other Instrument PCs; SQL and FTP backups from server Bobwhite; department and user personal files from Grouse; Quickbook and Payclock backup files from PC Moonstone; and Quickbook files from Magpie. Data backups on Friday run a full backup. Data backups Sunday through Thursday run incremental backups. Exchange runs its own backup and places the backup files on server Bobwhite in folder “ExchangeBackup.” Quickbooks backups are copied from server Magpie in the folder “Quickbooks.” PC Moonstone also runs a windows backup to copy the files every Sunday through Friday at 9AM. SQL runs its own backups and they occur Sunday through Thursday at 1AM and are placed on server Bobwhite in folder “SQL2K8\Backup”. Disaster recovery We have Symantec Ghost 7.5 as an imaging tool. The entire hard disks of the Windows servers and majority of workstations have been taken as a snapshot. The images of those disks were either burned onto DVD disks or storage on removable drives.
Page 54 of 81

As imaging the servers requires taking them off-line, the imaging is not a regularly scheduled task. However, when major changes are made to servers, re-imaging should be done once the servers have been tested to be running satisfactorily. Workstation imaging is updated when there is major configuration change in hardware or software. Data archiving The older data files on the analytical data storage server (older than 6 or 12 months, as dictated by data volume) are archived to CD/DVD at intervals of 6 or 12 months, or when deemed necessary, for permanent archival. The permanent archive has two copies, one kept on-site and another off-site. The DVD/CD disks, if properly stored, should have a lifetime of at least 50 years. A few randomly selected DVD/CD disks are checked for readability annually to ensure the availability of older data files. A copy of the archived data files is kept available for read-only, as long as the storage server has enough space for them. When the space approaches depletion, the oldest files will be purged. The shared location for the older data is secured so only system administrators can change them. All regular users have read-only permission.
Summary
We have hardware redundancy to protect against disk failure for the most important data. Our backup scheme is disk-to-disk technology and CD/DVD archival. The disk backups are on a four week off-site rotation. The servers and majority of workstations are imaged for quick disaster recovery. Data archiving is done on a regular basis and two permanent copies of archived data are kept.
Page 55 of 81

Appendix G
Control Chart Information
Page 56 of 81

Control Charting Control charting is a useful way to determine accuracy and precision data for specific repeated recovery calculations (surrogates, LFBs, CCVs, etc.). It is most useful to calculate acceptance criteria from the most recent data, and allows comparison to written method requirements if they exist.
At minimum, control charts must be made for control standards. For methods that require the addition of surrogate compounds, control charts are also required for the surrogate recoveries.
Definitions: Let X1, X2, X3, X4,..............Xn (n ≥ 20) represent the first n time ordered determinations for an analyte, and then define the following:
X = average = n1 (X1 + X2 + X3 + .............. + Xn)
S = Standard Deviation of the Group = 21
2
1)(⎥⎦
⎤⎢⎣
⎡−−Σ
nXX n
Based on the average and standard deviation information of this n number of trials a control chart can be plotted using the formulas outlined in Table 1. An example of a control chart is shown in Figure 1 with X = 99 % and S = 4 %. Such plot can then be used to determine if one or a set of trial is out of control.
Table 1: Control Chart Formula.
Parameter Symbol Formula
Centerline CL X
Upper Control Limit UCL X + 3S
Lower Control Limit LCL X – 3S
Upper Warning Limit UWL X + 2S
Lower Warning Limit LWL X – 2S
Criteria for an Out-of-Control Situation A process is considered out of statistical control whenever one of the following conditions is demonstrated from control charting.
a. Any one point is outside of the control limits.
b. Any three consecutive points are outside the warning limits.
c. Any ten consecutive points are on the same side of the centerline.
d. Any six consecutive points are such that each deviation is greater than its predecessor.
e. Any obvious cyclic pattern is seen in the points.
Page 57 of 81

Figure 1: A sample control chart.
80
85
90
95
100
105
110
115
120
0 5 10 15 20 25 30 35
Number of Samples
% R
ecov
ery
Centerline
UWL
LWL
UCL
LCL
Corrective Action
When a process is out of control as determined by control chart monitoring, an immediate solution must be found before processing more samples. An example might be the slow deterioration of the PID lamp, which might cause recoveries to slowly decrease. This problem may easily be remedied by more frequent cleaning or perhaps more frequent calibration.
Page 58 of 81

Appendix H
Method Detection Limit
Page 59 of 81

Office of Water EPA 821-R-16-006
www.epa.gov December 2016
Definition and Procedure for the Determination of the Method Detection Limit, Revision 2
Page 60 of 81
This document contains the text of Revision 2 of the method detection limit procedure from 40 CFR 136 Appendix B; but formatted as a more user friendly stand-alone document.
Please address questions or comments to:
CWA Methods Team Engineering and Analytical Support Branch/EAD (4303T) Office of Science and Technology U.S. Environmental Protection Agency 1200 Pennsylvania Avenue Washington, DC 20460
https://www.epa.gov/cwa-methods
Page 61 of 81
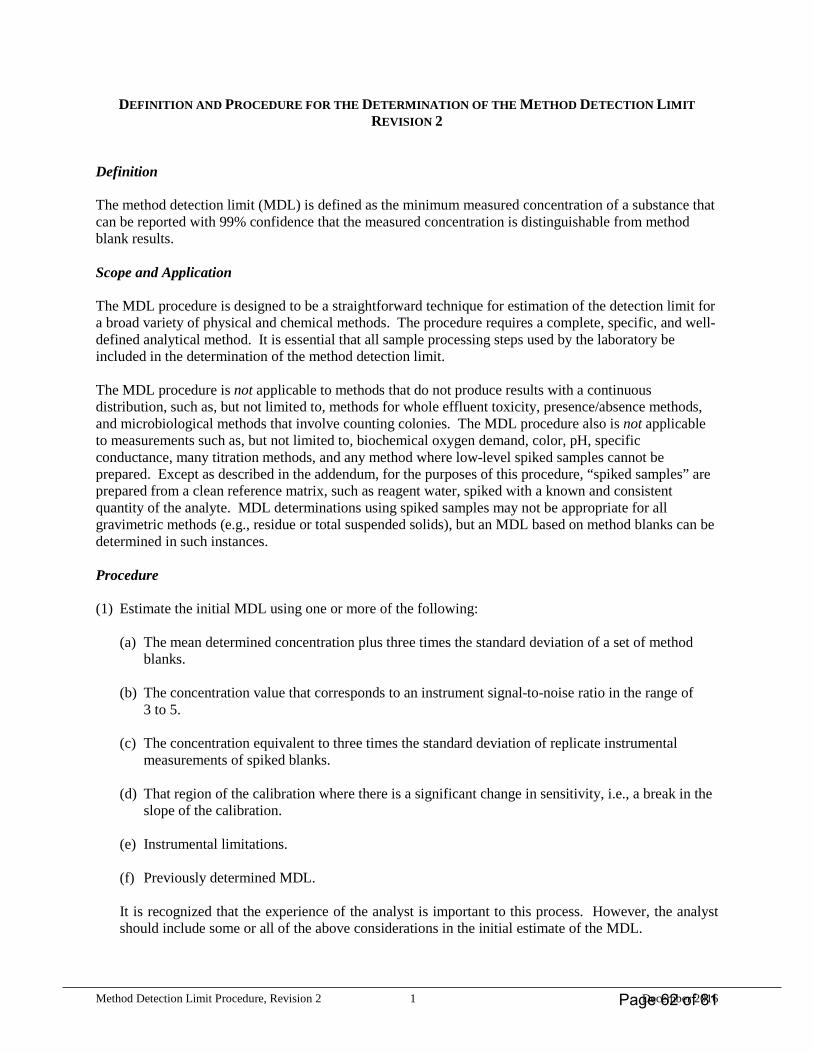
Method Detection Limit Procedure, Revision 2 1 December 2016
DEFINITION AND PROCEDURE FOR THE DETERMINATION OF THE METHOD DETECTION LIMIT REVISION 2
Definition The method detection limit (MDL) is defined as the minimum measured concentration of a substance that can be reported with 99% confidence that the measured concentration is distinguishable from method blank results. Scope and Application The MDL procedure is designed to be a straightforward technique for estimation of the detection limit for a broad variety of physical and chemical methods. The procedure requires a complete, specific, and well-defined analytical method. It is essential that all sample processing steps used by the laboratory be included in the determination of the method detection limit. The MDL procedure is not applicable to methods that do not produce results with a continuous distribution, such as, but not limited to, methods for whole effluent toxicity, presence/absence methods, and microbiological methods that involve counting colonies. The MDL procedure also is not applicable to measurements such as, but not limited to, biochemical oxygen demand, color, pH, specific conductance, many titration methods, and any method where low-level spiked samples cannot be prepared. Except as described in the addendum, for the purposes of this procedure, “spiked samples” are prepared from a clean reference matrix, such as reagent water, spiked with a known and consistent quantity of the analyte. MDL determinations using spiked samples may not be appropriate for all gravimetric methods (e.g., residue or total suspended solids), but an MDL based on method blanks can be determined in such instances. Procedure (1) Estimate the initial MDL using one or more of the following:
(a) The mean determined concentration plus three times the standard deviation of a set of method blanks.
(b) The concentration value that corresponds to an instrument signal-to-noise ratio in the range of
3 to 5. (c) The concentration equivalent to three times the standard deviation of replicate instrumental
measurements of spiked blanks. (d) That region of the calibration where there is a significant change in sensitivity, i.e., a break in the
slope of the calibration. (e) Instrumental limitations. (f) Previously determined MDL.
It is recognized that the experience of the analyst is important to this process. However, the analyst should include some or all of the above considerations in the initial estimate of the MDL.
Page 62 of 81
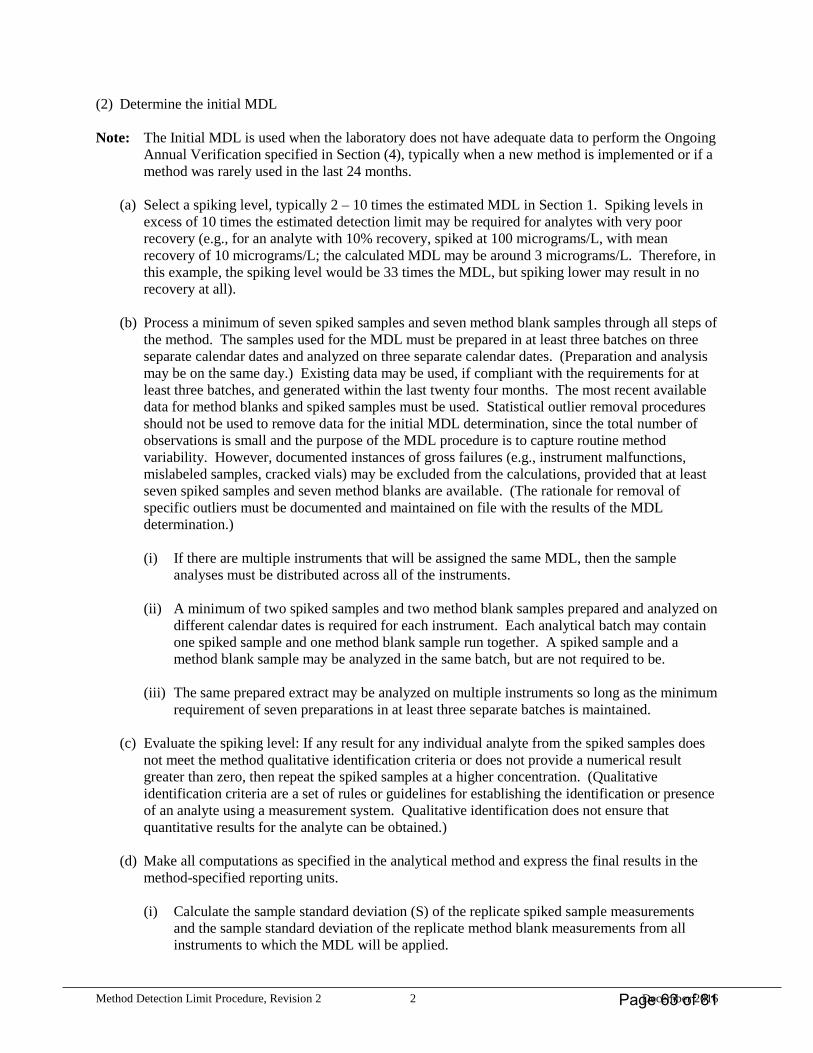
Method Detection Limit Procedure, Revision 2 2 December 2016
(2) Determine the initial MDL Note: The Initial MDL is used when the laboratory does not have adequate data to perform the Ongoing
Annual Verification specified in Section (4), typically when a new method is implemented or if a method was rarely used in the last 24 months.
(a) Select a spiking level, typically 2 – 10 times the estimated MDL in Section 1. Spiking levels in excess of 10 times the estimated detection limit may be required for analytes with very poor recovery (e.g., for an analyte with 10% recovery, spiked at 100 micrograms/L, with mean recovery of 10 micrograms/L; the calculated MDL may be around 3 micrograms/L. Therefore, in this example, the spiking level would be 33 times the MDL, but spiking lower may result in no recovery at all).
(b) Process a minimum of seven spiked samples and seven method blank samples through all steps of
the method. The samples used for the MDL must be prepared in at least three batches on three separate calendar dates and analyzed on three separate calendar dates. (Preparation and analysis may be on the same day.) Existing data may be used, if compliant with the requirements for at least three batches, and generated within the last twenty four months. The most recent available data for method blanks and spiked samples must be used. Statistical outlier removal procedures should not be used to remove data for the initial MDL determination, since the total number of observations is small and the purpose of the MDL procedure is to capture routine method variability. However, documented instances of gross failures (e.g., instrument malfunctions, mislabeled samples, cracked vials) may be excluded from the calculations, provided that at least seven spiked samples and seven method blanks are available. (The rationale for removal of specific outliers must be documented and maintained on file with the results of the MDL determination.) (i) If there are multiple instruments that will be assigned the same MDL, then the sample
analyses must be distributed across all of the instruments. (ii) A minimum of two spiked samples and two method blank samples prepared and analyzed on
different calendar dates is required for each instrument. Each analytical batch may contain one spiked sample and one method blank sample run together. A spiked sample and a method blank sample may be analyzed in the same batch, but are not required to be.
(iii) The same prepared extract may be analyzed on multiple instruments so long as the minimum
requirement of seven preparations in at least three separate batches is maintained.
(c) Evaluate the spiking level: If any result for any individual analyte from the spiked samples does not meet the method qualitative identification criteria or does not provide a numerical result greater than zero, then repeat the spiked samples at a higher concentration. (Qualitative identification criteria are a set of rules or guidelines for establishing the identification or presence of an analyte using a measurement system. Qualitative identification does not ensure that quantitative results for the analyte can be obtained.)
(d) Make all computations as specified in the analytical method and express the final results in the
method-specified reporting units.
(i) Calculate the sample standard deviation (S) of the replicate spiked sample measurements and the sample standard deviation of the replicate method blank measurements from all instruments to which the MDL will be applied.
Page 63 of 81
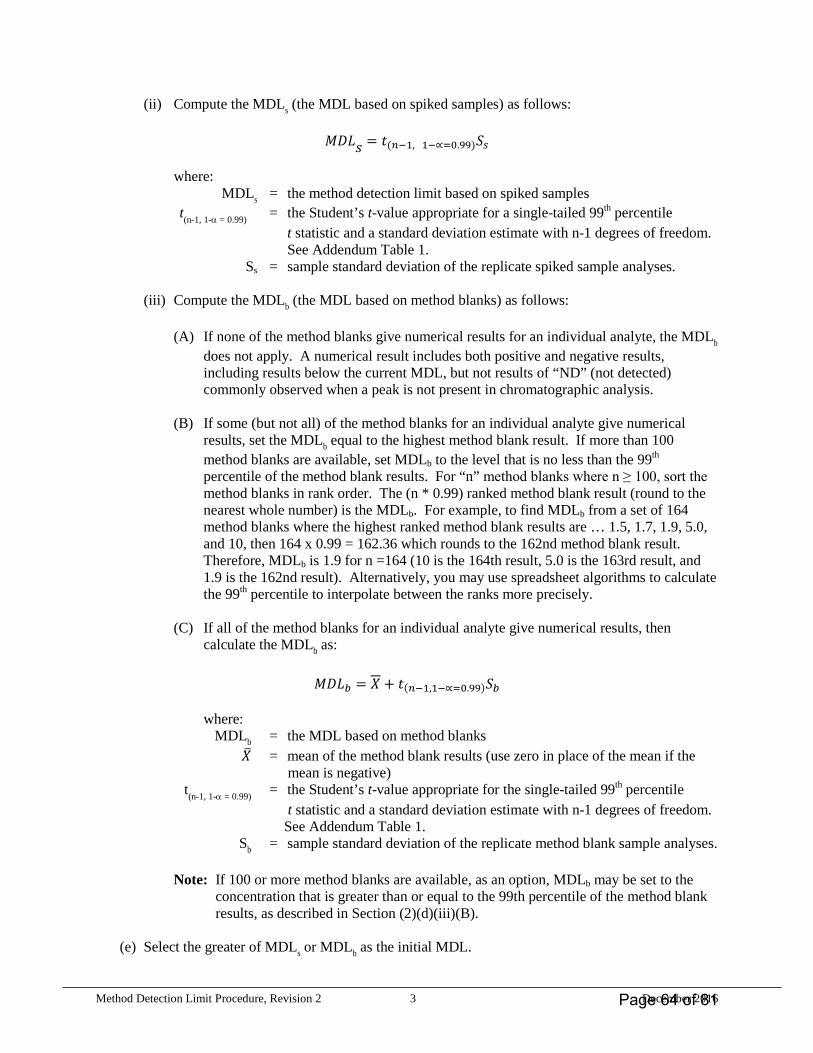
Method Detection Limit Procedure, Revision 2 3 December 2016
(ii) Compute the MDLs (the MDL based on spiked samples) as follows:
𝑀𝑀𝑀𝑀𝑀𝑀𝑠𝑠 = 𝑡𝑡(𝑛𝑛−1, 1−∝=0.99)𝑆𝑆𝑠𝑠
where: MDLs = the method detection limit based on spiked samples t(n-1, 1-α = 0.99) = the Student’s t-value appropriate for a single-tailed 99th percentile
t statistic and a standard deviation estimate with n-1 degrees of freedom. See Addendum Table 1.
Ss = sample standard deviation of the replicate spiked sample analyses.
(iii) Compute the MDLb (the MDL based on method blanks) as follows:
(A) If none of the method blanks give numerical results for an individual analyte, the MDLb does not apply. A numerical result includes both positive and negative results, including results below the current MDL, but not results of “ND” (not detected) commonly observed when a peak is not present in chromatographic analysis.
(B) If some (but not all) of the method blanks for an individual analyte give numerical
results, set the MDLb equal to the highest method blank result. If more than 100 method blanks are available, set MDLb to the level that is no less than the 99th percentile of the method blank results. For “n” method blanks where n ≥ 100, sort the method blanks in rank order. The (n * 0.99) ranked method blank result (round to the nearest whole number) is the MDLb. For example, to find MDLb from a set of 164 method blanks where the highest ranked method blank results are … 1.5, 1.7, 1.9, 5.0, and 10, then 164 x 0.99 = 162.36 which rounds to the 162nd method blank result. Therefore, MDLb is 1.9 for n =164 (10 is the 164th result, 5.0 is the 163rd result, and 1.9 is the 162nd result). Alternatively, you may use spreadsheet algorithms to calculate the 99th percentile to interpolate between the ranks more precisely.
(C) If all of the method blanks for an individual analyte give numerical results, then
calculate the MDLb as:
𝑀𝑀𝑀𝑀𝑀𝑀𝑏𝑏 = 𝑋𝑋 + 𝑡𝑡(𝑛𝑛−1,1−∝=0.99)𝑆𝑆𝑏𝑏
where: MDLb = the MDL based on method blanks 𝑋𝑋� = mean of the method blank results (use zero in place of the mean if the
mean is negative) t(n-1, 1-α = 0.99) = the Student’s t-value appropriate for the single-tailed 99th percentile
t statistic and a standard deviation estimate with n-1 degrees of freedom. See Addendum Table 1.
Sb = sample standard deviation of the replicate method blank sample analyses.
Note: If 100 or more method blanks are available, as an option, MDLb may be set to the concentration that is greater than or equal to the 99th percentile of the method blank results, as described in Section (2)(d)(iii)(B).
(e) Select the greater of MDLs or MDLb as the initial MDL.
Page 64 of 81

Method Detection Limit Procedure, Revision 2 4 December 2016
(3) Ongoing Data Collection
(a) During any quarter in which samples are being analyzed, prepare and analyze a minimum of two spiked samples on each instrument, in separate batches, using the same spiking concentration used in Section 2. If any analytes are repeatedly not detected in the quarterly spiked sample analyses, or do not meet the qualitative identification criteria of the method (see Section 2(c) of this procedure), then this is an indication that the spiking level is not high enough and should be adjusted upward. Note that it is not necessary to analyze additional method blanks together with the spiked samples, the method blank population should include all of the routine method blanks analyzed with each batch during the course of sample analysis.
(b) Ensure that at least seven spiked samples and seven method blanks are completed for the annual verification. If only one instrument is in use, a minimum of seven spikes are still required, but they may be drawn from the last two years of data collection.
(c) At least once per year, re-evaluate the spiking level. (i) If more than 5% of the spiked samples do not return positive numerical results that meet all
method qualitative identification criteria, then the spiking level must be increased and the initial MDL re-determined following the procedure in Section 2.
(d) If the method is altered in a way that can be reasonably expected to change its sensitivity, then re-
determine the initial MDL according to Section 2, and the restart the ongoing data collection.
(e) If a new instrument is added to a group of instruments whose data are being pooled to create a single MDL, analyze a minimum of two spiked replicates and two method blank replicates on the new instrument. If both method blank results are below the existing MDL, then the existing MDLb is validated. Combine the new spiked sample results to the existing spiked sample results and recalculate the MDLs as in Section 4. If the recalculated MDLs does not vary by more than the factor specified in Section 4(f) of this procedure, then the existing MDLs is validated. If either of these two conditions is not met, then calculate a new MDL following the instructions in Section 2.
(4) Ongoing Annual Verification
(a) At least once every thirteen months, re-calculate MDLs and MDLb from the collected spiked samples and method blank results using the equations in Section 2.
(b) Include data generated within the last twenty four months, but only data with the same spiking level. Only documented instances of gross failures (e.g., instrument malfunctions, mislabeled samples, cracked vials) may be excluded from the calculations. (The rationale for removal of specific outliers must be documented and maintained on file with the results of the MDL determination.) If the laboratory believes the sensitivity of the method has changed significantly, then the most recent data available may be used, maintaining compliance with the requirement for at least seven replicates in three separate batches on three separate days (see Section 2b).
(c) Include the initial MDL spiked samples, if the data were generated within twenty four months.
(d) Only use data associated with acceptable calibrations and batch QC. Include all routine data, with the exception of batches that are rejected and the associated samples reanalyzed. If the method has been altered in a way that can be reasonably expected to change its sensitivity, then use only data collected after the change.
Page 65 of 81

Method Detection Limit Procedure, Revision 2 5 December 2016
(e) Ideally, use all method blank results from the last 24 months for the MDLb calculation. The laboratory has the option to use only the last six months of method blank data or the fifty most recent method blanks, whichever criteria yields the greater number of method blanks.
(f) The verified MDL is the greater of the MDLs or MDLb. If the verified MDL is within 0.5 to 2.0 times the existing MDL, and fewer than 3% of the method blank results (for the individual analyte) have numerical results above the existing MDL, then the existing MDL may optionally be left unchanged. Otherwise, adjust the MDL to the new verification MDL. (The range of 0.5 to 2.0 approximates the 95th percentile confidence interval for the initial MDL determination with six degrees of freedom.)
ADDENDUM: DETERMINATION OF THE MDL FOR A SPECIFIC MATRIX The MDL may be determined in a specific sample matrix as well as in reagent water.
(1) Analyze the sample matrix to determine the native (background) concentration of the analyte(s) of
interest.
(2) If the response for the native concentration is at a signal-to-noise ratio of approximately 5-20, determine the matrix-specific MDL according to Section 2 but without spiking additional analyte.
(3) Calculate MDLb using the method blanks, not the sample matrix.
(4) If the signal-to-noise ratio is less than 5, then the analyte(s) should be spiked into the sample matrix to
obtain a concentration that will give results with a signal-to-noise ratio of approximately 10-20.
(5) If the analytes(s) of interest have signal-to-noise ratio(s) greater than approximately 20, then the resulting MDL is likely to be biased high.
Table 1: Single-Tailed 99th Percentile t Statistic
Number of replicates Degrees of freedom (n-1) t (n-1, 0.99) 7 6 3.143 8 7 2.998 9 8 2.896 10 9 2.821 11 10 2.764 16 15 2.602 21 20 2.528 26 25 2.485 31 30 2.457 32 31 2.453 48 47 2.408 50 49 2.405 61 60 2.390 64 63 2.387 80 79 2.374 96 95 2.366
100 99 2.365
Page 66 of 81

Method Detection Limit Procedure, Revision 2 6 December 2016
Documentation The analytical method used must be specifically identified by number or title and the MDL for each analyte expressed in the appropriate method reporting units. Data and calculations used to establish the MDL must be able to be reconstructed upon request. The sample matrix used to determine the MDL must also be identified with MDL value. Document the mean spiked and recovered analyte levels with the MDL. The rationale for removal of outlier results, if any, must be documented and maintained on file with the results of the MDL determination.
Page 67 of 81

Appendix I
CALIBRATION METHODS AND EQUATIONS This chapter provides an overview of calibration models and equations commonly used by methods performed at Anatek Labs, Inc. Calibration information is provided here as a reference, so that definitions and equations do not have to be provided in each individual analytical SOP. Review of this information shall be considered adequate on-going training in calibration models and equations.
This chapter consists of the following sections:
• Definitions • General Criteria for All Calibration Models • External Standard Calibration • Internal Standard Calibration • Response/Calibration Factor Model • Linear Calibration Using A Least Square Regression • Weighted Least Squares Regression
Page 68 of 81
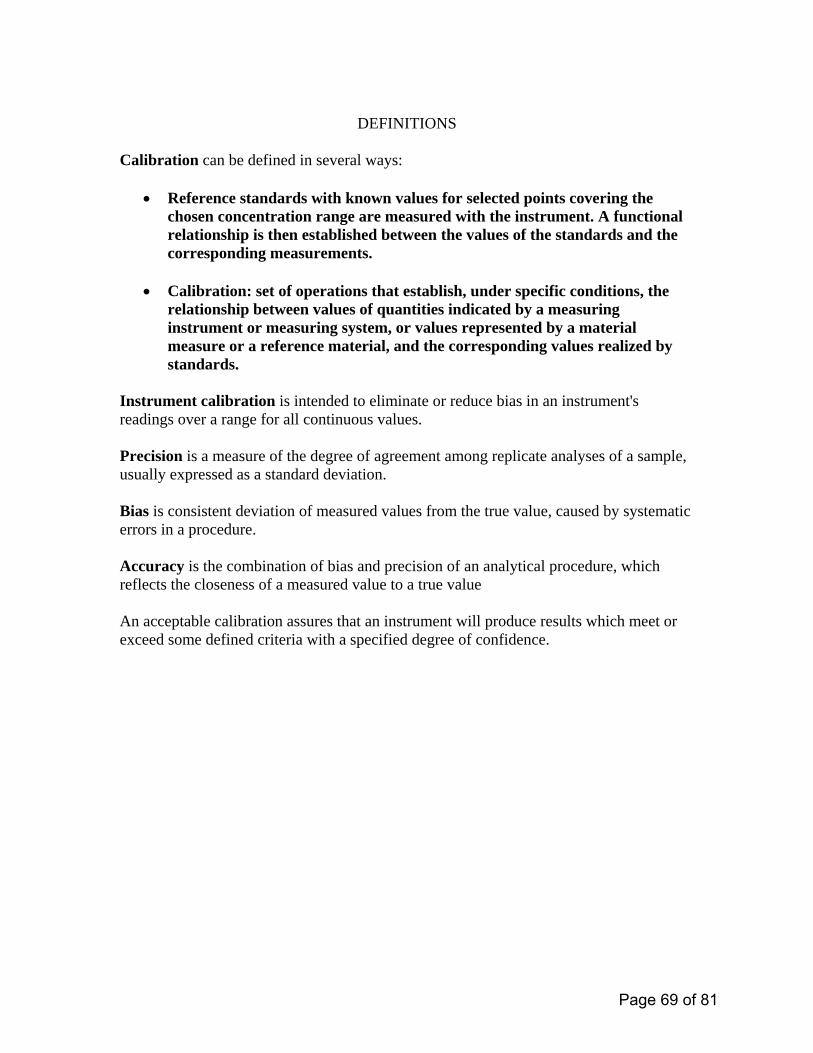
DEFINITIONS
Calibration can be defined in several ways:
• Reference standards with known values for selected points covering the chosen concentration range are measured with the instrument. A functional relationship is then established between the values of the standards and the corresponding measurements.
• Calibration: set of operations that establish, under specific conditions, the
relationship between values of quantities indicated by a measuring instrument or measuring system, or values represented by a material measure or a reference material, and the corresponding values realized by standards.
Instrument calibration is intended to eliminate or reduce bias in an instrument's readings over a range for all continuous values. Precision is a measure of the degree of agreement among replicate analyses of a sample, usually expressed as a standard deviation. Bias is consistent deviation of measured values from the true value, caused by systematic errors in a procedure. Accuracy is the combination of bias and precision of an analytical procedure, which reflects the closeness of a measured value to a true value An acceptable calibration assures that an instrument will produce results which meet or exceed some defined criteria with a specified degree of confidence.
Page 69 of 81

GENERAL CRITERIA FOR ALL CALIBRATION MODELS
• Mid-points cannot be dropped to meet criteria • Points can be reanalyzed, original run must be discarded • Analyzing additional standards and discarding some to achieve a better
correlation coefficient value is prohibited • Narrowing of curve on either end is allowed
Initial Calibration Perform initial calibration with a minimum of three concentrations of standards for linear curve, a minimum of five concentrations for nonlinear curves, or as specified by the method of choice.
At the beginning of each day that samples are to be analyzed, a calibration curve covering the sample concentration range and all target analytes should be generated according to the approved SOP. Depending on concentration ranges, the curve should be composed of three or more points. The reporting limit should be included in the calibration range.
Daily Verification Standard
Where the determinative time is extensive and the instrument is very stable, the calibration curve should be initially developed. Thereafter, each day analyses are performed, this curve should be verified by analysis of at least one standard for each of the target analytes at the expected concentration range. This verification should be done at both the beginning and end of the analyses.
Calibration Plot
A working curve is a plot of the instrument response as a function of analyte concentration. The concentration of an unknown sample is determined by correlating its response to the mathematical relationship of concentration to the instrument response established by the curve.
Response Factor/Calibration Factor
Both calibration factors and response factors are measures of the slope of the calibration relationship. Each calibration or response factor represents the slope of the line between the response for a given standard and the origin. Under ideal conditions, the factors will not vary with the concentration of the standard. In practice, some variation is to be expected. If response factors or calibration factors are used, the calculated % RSD for each analyte of interest must be less than or equal the method-specified value. Refer to the applicable method for the calibration procedure and acceptance criteria on the response factors or calibration factors for each analyte.
Page 70 of 81

Correlation Coefficient
The correlation coefficient is a measure of the degree with which the independent variable and its partner move either together or in opposition. A positive result indicates direct correlation and a negative result indicates an inverse correlation. If linear regression is used, use the minimum correlation coefficient specified in the method. If the minimum correlation coefficient is not specified then a minimum value of 0.995 is recommended. The appropriate linear or nonlinear correlation coefficient for standard concentration to instrument response should be > 0.995. It is not necessarily true that a relationship measured by r is meaningful. There must be a rational relationship of the two variables under investigation. The sample on which the data is based must be large enough to ensure that the influence of chance causes of variation is minimized.
Coefficient of Determination
In a correlation analysis, r2 (occasionally called the “correlation index”) may be calculated most simply by squaring the correlation coefficient, r. It may be described as the amount of variability in one of the variables accounted for by correlating that variable with the second variable. As in regression analysis, r2 may be considered to be a measure of the strength of the straight-line relationship. In order for the linear regression model to be used for quantitative purposes, r, COD, or r2 must be greater than or equal to 0.99
Page 71 of 81

EXTERNAL STANDARD CALIBRATION
For an external standard quantitation, known data from a calibration standard and unknown data from the sample are combined to generate a quantitative report.
It is called external standard because the standard or known material is separate or external to the unknown material. External standard calibration is one of the most common approaches to calibrations. It involves a simple comparison of instrument responses from the sample to the responses from the target compounds in the calibration standards.
Sample peak areas (or peak heights) are compared to peak areas (or heights) of the standards. The ratio of the detector response to the amount (mass) of analyte in the calibration standard is defined as the calibration factor (CF).
CF = (Ax)/(Cx)
Where: Ax = Area of the compound
Cx = Concentration of the compound
Advantages:
• The advantages of external standard calibration are that it is simple to perform this type of calibration and it can be applied to a wide variety of methods.
Disadvantages: • The primary disadvantage is that it is greatly affected by the stability of the
chromatographic detector system and the presence of chromatographic interferences in a sample or sample extract.
Page 72 of 81
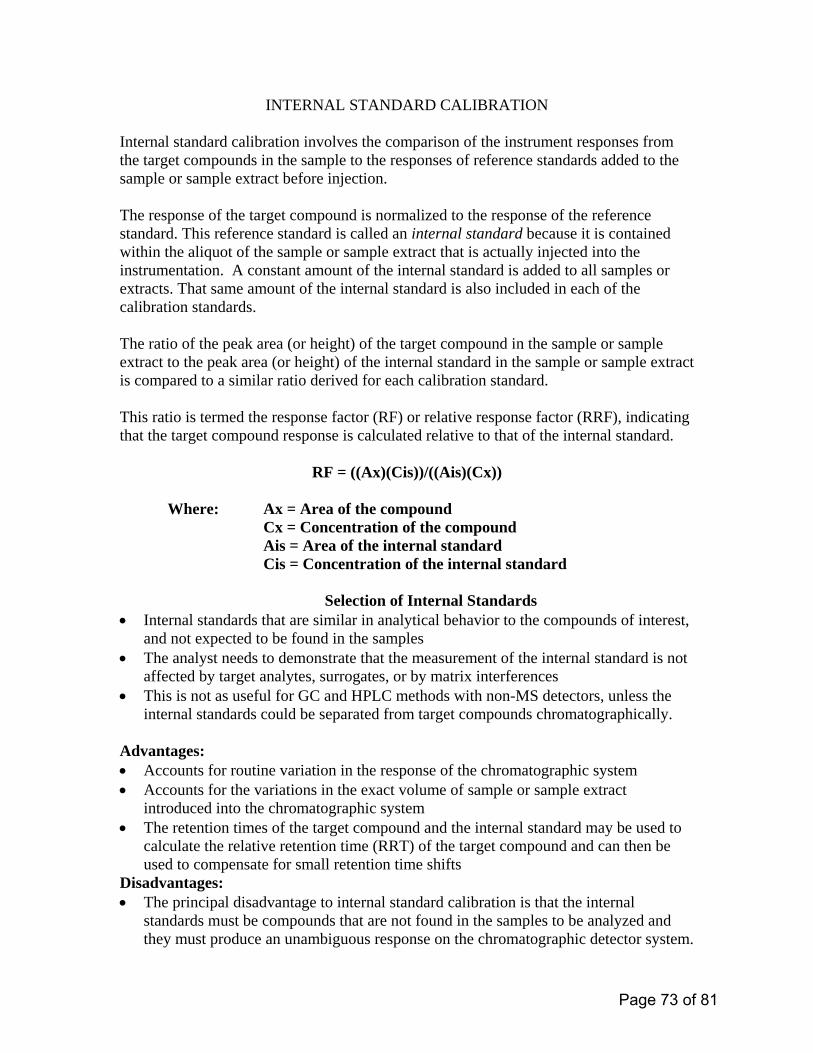
INTERNAL STANDARD CALIBRATION
Internal standard calibration involves the comparison of the instrument responses from the target compounds in the sample to the responses of reference standards added to the sample or sample extract before injection. The response of the target compound is normalized to the response of the reference standard. This reference standard is called an internal standard because it is contained within the aliquot of the sample or sample extract that is actually injected into the instrumentation. A constant amount of the internal standard is added to all samples or extracts. That same amount of the internal standard is also included in each of the calibration standards. The ratio of the peak area (or height) of the target compound in the sample or sample extract to the peak area (or height) of the internal standard in the sample or sample extract is compared to a similar ratio derived for each calibration standard. This ratio is termed the response factor (RF) or relative response factor (RRF), indicating that the target compound response is calculated relative to that of the internal standard.
RF = ((Ax)(Cis))/((Ais)(Cx)) Where: Ax = Area of the compound Cx = Concentration of the compound Ais = Area of the internal standard Cis = Concentration of the internal standard
Selection of Internal Standards • Internal standards that are similar in analytical behavior to the compounds of interest,
and not expected to be found in the samples • The analyst needs to demonstrate that the measurement of the internal standard is not
affected by target analytes, surrogates, or by matrix interferences • This is not as useful for GC and HPLC methods with non-MS detectors, unless the
internal standards could be separated from target compounds chromatographically. Advantages: • Accounts for routine variation in the response of the chromatographic system • Accounts for the variations in the exact volume of sample or sample extract
introduced into the chromatographic system • The retention times of the target compound and the internal standard may be used to
calculate the relative retention time (RRT) of the target compound and can then be used to compensate for small retention time shifts
Disadvantages: • The principal disadvantage to internal standard calibration is that the internal
standards must be compounds that are not found in the samples to be analyzed and they must produce an unambiguous response on the chromatographic detector system.
Page 73 of 81
RESPONSE/CALIBRATION FACTOR MODEL
Calibration Factor: A measure of the chromatographic response of a target analyte relative to the mass injected. Response Factor: A measure of the relative mass spectral response of an analyte compared to its internal standard. Each calibration or response factor represents the slope of the line between the response for a given standard and the origin. The average calibration factor or response factor of the standards for each analyte is then used to calculate the concentration of the sample. When the variation, measured as the relative standard deviation (RSD) of the factors, is less than or equal to 20%, then the slopes of the lines for each standard are sufficiently close to one another that the use of the linear model is generally appropriate over the range of standards that are analyzed. A relative standard deviation (RSD) of 25% or less is considered linear.
Response/Calibration Factor Equations
External Standard Equation CF = (Ax)/(Cx)
or
Internal Standard Equation RF = ((Ax)(Cis))/((Ais)(Cx))
Where: Ax = Area of the compound Cx = Concentration of the compound Ais = Area of the internal standard Cis = Concentration of the internal standard
Response/Calibration Factor Statistical Equations Average RF or CF: RFAVE = (S RFi / n ) Standard Deviation (s): s = √ { [ S (RFi - RFAVE )2 ] / (n-1) } Relative Standard Deviation (RSD): RSD = s / RFAVE *100 Where: n = number of pairs of data RFi = Response Factor for each level RFAVE = Average of all the response factors S = the sum of all the individual values In the equations above RF can be replaced with CF
Page 74 of 81
Response/Calibration Factor Equations for Concentration
External Standard Equation
Cx = Ax/CFAVE
or
Internal Standard Equation Cx = ((Ax)*(Cis)) / ((Ais)*(RFAVE))
Advantages
• Assumes linearity through the origin, no negative calculated concentrations. • Simple calculation
Disadvantages
• Linearity of the curve is required. • May not reflect actual detector response curve.
Page 75 of 81

LINEAR CALIBRATION USING A LEAST SQUARE REGRESSION
According to NIST Linear least squares regression is by far the most widely used modeling method. It is what most people mean when they say they have used "regression", "linear regression" or "least squares" to fit a model to their data. Least square regression is a method of determining the curve that best describes the relationship between expected and observed sets of data by minimizing the sums of the squares of deviation between observed and expected values. The regression calculations attempt to minimize this sum of the squares, hence the name “least squares regression.”
A linear calibration model based on a least squares regression may be employed based on past experience or a prior knowledge of the instrument response and at the discretion of the analyst. This approach may be used for analytes that do meet the RSD Limits. The linear calibration model is most easily achieved by performing a linear least squares regression of the instrument response versus the mass of the analyte. Correlation Coefficient Definition: A measure of the interdependence of two random variables that ranges in value from −1 to +1, indicating perfect negative correlation at −1, absence of correlation at zero, and perfect positive correlation at +1. Also called coefficient of correlation.
Linear Equation
y = mx + b
Where: y = Response Ax for External Standard Or Ax/Ais for Internal Standard
x = Concentration Cx for External Standard
or Cx/Cis for Internal Standard m = Slope b = Intercept
Page 76 of 81

Linear Regression Statistical Equations
Slope (m)
m = [(Swxiyi * Sw) - (Swxi * Swyi)] [(Sw * Swxi2) - (Swxi * Swxi)]
Intercept (b)
b = yAVE – (m * (xAVE))
Correlation Coefficient (r)
r = _______[(Sw * Swxiyi) - (Swxi * Swyi)]_______
√{[(Sw * Swxi2) - (Swx * Swxi)] * [(Sw * Swyi2) – (Swyi * Swyi)]}
Coefficient of Determination (r2) r2 = r * r
Where: n = number of x, y pairs xi = individual values for the independent variable yi = individual values for the dependent variable w = weighting factor, for equal or no weighting w = 1 xAVE = average of the x values yAVE = average of the y values S = the sum of all the individual values
Equations for Concentration
External Standard Equation Cx = {Ax-b} /m
or
Internal Standard Equation Cx = [{(Ax)/(Ais)}-b] /m *Cis
Advantages • This technique is the simplest and most commonly applied form of Linear Curve • Computation of coefficients and standard deviations is easy
Disadvantages • If least squares regression (linear and non-linear) is used for curve construction it is
usually noticed that the lower levels of the calibration may fail the re-fit criteria (<20% D) even when the r/COD/r2 criteria have been met.
Page 77 of 81

• Analysts that use least squares regression and rely only on the r/COD/r2 criteria for curve acceptance may not be aware of this potential problem at the lower calibration levels.
Page 78 of 81

WEIGHTED LEAST SQUARE REGRESSION
Each term in the weighted least squares criterion includes an additional weight that determines how much each observation in the data set influences the final parameter estimates and it can be used with functions that are either linear or nonlinear in the parameters. One of the common assumptions underlying most process modeling methods, including linear and nonlinear least squares regression, is that each data point provides equally precise information about the deterministic part of the total process variation. In other words, it is assumed that the standard deviation of the error term is constant over all values of the predictor or explanatory variables. This assumption clearly does not hold, even approximately, in every modeling application. In a weighted fit, less weight is given to the less precise measurements and more weight to more precise measurements when estimating the unknown parameters in the model. Using weights that are inversely proportional to the variance at each level of the explanatory variables yields the most precise parameter estimates possible. Method 8000C describes variance as the difference between the observed instrument response for the ith calibration standard and the predicted or calculated response for the ith calibration standard. Weighting the sum of the squares of the differences may significantly improve the ability of the least square regression to fit the linear model to the data.
∑ wi (yi-y’i)2
where: wi = Weighting factor for the ith calibration standard (w=1 for unweighted
least square regression) yi = Observed instrument response for the ith calibration standard y’I = Predicted (or calculated) response for the ith standard ∑ = The sum of all individual values
The mathematics used in unweighted least squares regression has a tendency to favor numbers of larger value over numbers of smaller value. Thus the regression curves that are generated will tend to fit points that are at the upper calibration levels better than those points at the lower calibration levels. Examples of weighting factors which can place more emphasis on numbers of smaller value are:
wi = 1/yi or wi = 1/yi
2
where, wi = weighting factor for the ith calibration standard (wi=1 for unweighted least
squares regression).
Page 79 of 81

yi = observed instrument response (area or height) for the ith calibration standard.
Different Types Of Weights
No Weights: Default higher weighting of higher amounts or signal values 1/Amount: Nearly cancels out the weighting of higher amounts 1/Amount^2 : Causes over-proportional weighting of smaller amounts 1/Response: Nearly cancels out the weighting of higher signal values 1/Response^2: Causes over-proportional weighting of smaller signal values 1/RSD: Weights signal values with small relative standard deviations more
than those with large relative standard deviations 1/RSD ² : Weights signal values with small relative standard deviations
clearly more than those with large relative standard deviation. Advantages
• Weighted least squares is an efficient method that makes good use of small data sets. It also shares the ability to provide different types of easily interpretable statistical intervals for estimation, prediction, calibration and optimization.
• The main advantage that weighted least squares enjoys over other methods is the
ability to handle regression situations in which the data points are of varying quality.
Disadvantages
• The biggest disadvantage of weighted least squares is probably the fact that the theory behind this method is based on the assumption that the weights are known exactly. The exact weights are almost never known in real applications, so estimated weights must be used instead. The effect of using estimated weights is difficult to assess, but experience indicates that small variations in the weights due to estimation do not often affect a regression analysis or its interpretation.
• When the weights are estimated from small numbers of replicated observations,
the results of an analysis can be very badly and unpredictably affected. This is especially likely to be the case when the weights for extreme values of the predictor or explanatory variables are estimated using only a few observations. It is important to remain aware of this potential problem, and to only use weighted least squares when the weights can be estimated precisely relative to one another.
• Weighted least squares regression is also sensitive to the effects of outliers. If
potential outliers are not investigated and dealt with appropriately, they will likely have a negative impact on the parameter estimation and other aspects of a weighted least squares analysis.
• If a weighted least squares regression actually increases the influence of an
outlier, the results of the analysis may be far inferior to an unweighted least squares analysis.
Page 80 of 81

Anatek Labs, Inc.
Authorized Signatures
The individuals listed below are authorized to sign/approve documents in the classes listed. See also SOP ALI-30.
Approval Signatures - Moscow
Quotes/Contracts/RFP Submissions
• Todd Taruscio, Lab Manager • Erin Linskey, Technical Director • Mike Pearson, Lab Director • Gene Solomon, QA Officer
Analytical Reports
• Todd Taruscio, Lab Manager • Erin Linskey, Technical Director • Mike Pearson, Lab Director
SOPs
• Todd Taruscio, Lab Manager • Gene Solomon, QA Officer • Justin Doty, Customer Service Manager (for
office procedures) • Erin Linskey/Todd Taruscio, Technical Director
(in Lab Manager’s absence) • Mike Pearson, Lab Director (in Lab Manager’s
absence)
Corrective Action Reports
• Todd Taruscio, Lab Manager • Erin Linskey, Technical Director • Mike Pearson, Lab Director • Gene Solomon, QA Officer
Demonstrations of Capability (IDC/DOC)
• Todd Taruscio, Lab Manager • Gene Solomon, QA Officer • Erin Linskey, Technical Director (in Lab
Manager’s absence) • Mike Pearson, Lab Director (in Lab Manager’s
absence)
Approval Signatures - Spokane
Quotes/Contracts/RFP Submissions
• Kathy Sattler, Lab Manager • Gene Solomon, QA Officer • Mike Pearson, Lab Director
Analytical Reports
• Kathy Sattler, Lab Manager • Gene Solomon, QA Officer • Mike Pearson, Lab Director
SOPs
• Kathy Sattler, Lab Manager • Gene Solomon, QA Officer • Mike Pearson, Lab Director • Karice Scott, Office Manager (for office
procedures) • Mike Pearson, Lab Director (in Lab Manager’s
absence)
Corrective Action Reports
• Kathy Sattler, Lab Manager • Gene Solomon, QA Officer • Mike Pearson, Lab Director
Demonstrations of Capability (IDC/DOC)
• Kathy Sattler, Lab Manager • Gene Solomon, QA Officer • Mike Pearson, Lab Director
Page 81 of 81