ananthropometricstudyofmanualandpowered wheelchairusersidea.ap.buffalo.edu/publications/articles and...
TRANSCRIPT

ARTICLE IN PRESS
International Journal of Industrial Ergonomics 33 (2004) 191–204
*Correspondi
716-645-3302.
E-mail addre
0169-8141/$ - see
doi:10.1016/j.erg
An anthropometric study of manual and poweredwheelchair users
Victor Paquet*, David Feathers
Department of Industrial Engineering, University at Buffalo, State University of New York, 342 Bell Hall, P.O. Box 602050,
Buffalo, NY 14260-2050, USA
Received 15 August 2003; accepted 5 October 2003
Abstract
The purpose of this study was to evaluate the structural anthropometric dimensions of adult wheelchair users as part
of a larger project that involved developing a database of the structural characteristics and functional abilities of
wheelchair users. Measurements were made on 121 adult manual and powered wheelchair users with an
electromechanical probe that registered the three-dimensional locations of 36 body and wheelchair landmarks.
Thirty-one body and wheelchair dimensions (e.g., heights, breadths, depths) were calculated from the three-dimensional
coordinate data. Tests of distributional normality showed that less than 1/3 of the dimensions were not normally
distributed. ANOVA showed significant differences between powered and manual chair users, and women and men for
only some of the anthropometric dimensions. The results of this study provide anthropometric information for a small
and diverse group of wheelchair users using new measurement methods that may have value for three-dimensional
human modeling and CAD applications.
Relevance to industry
Anthropometric data of wheelchair users can be applied toward the universal design of occupational environments
and products that afford greater usability for wheelchair mobile user populations that are usually not considered in the
design process.
r 2003 Elsevier B.V. All rights reserved.
Keywords: Anthropometry; Wheelchair users; Three-dimensional human modeling
1. Introduction
Anthropometry, the measurement of physicalcharacteristics and abilities of people, providesinformation that is essential for the appropriatedesign of occupational and non-occupational
ng author. Tel.: +1-716-645-2357; fax: +1-
ss: [email protected] (V. Paquet).
front matter r 2003 Elsevier B.V. All rights reserve
on.2003.10.003
environments, as well as for the design ofconsumer products, clothing, tools and equipment.The most comprehensive anthropometric studiesto date have focused on non-disabled adults, withmuch of the data based on military personnel (e.g.,Anthropology Research Staff, 1978a, b; Gordonet al., 1989; Kennedy, 1986).Anthropometric studies of the elderly or
individuals with disabilities generally have in-volved much smaller sample sizes and fewer
d.

ARTICLE IN PRESS
V. Paquet, D. Feathers / International Journal of Industrial Ergonomics 33 (2004) 191–204192
measurements than military studies (e.g., Das andKozey, 1999; Goswami et al., 1987; Hobson andMolenbroek, 1990; Jarosz, 1996; Laubach et al.,1981; Molenbroek, 1987; Stoudt, 1981; Ward andKirk, 1967). Studies involving disabled subjectshave tended to focus on specific disability groups,and this, coupled with the lack of standardizeddimensional definitions and measurement meth-ods, has made combining information fromprevious studies very difficult (Bradtmiller andAnnis, 1997). The physical characteristics ofindividuals have also been shown to be quitedifferent across disability populations (e.g., Annis,1996; Goswami et al., 1987; Jarosz, 1996). Thegeneral lack of anthropometric information aboutindividuals who are wheelchair mobile limits theability of designers to create environments andproducts that can be used effectively and safely bythis diverse set of users.Many of the previous anthropometric studies of
wheelchair users have employed conventionalmethods of data collection, which include the useof anthropometers, spreading and sliding calipers,cylinders, and cones to measure body segmentlengths, and grip circumferences. These measuresallow percentile estimates for individual bodydimensions that can be used in the design of livingand workspaces. Newer approaches to engineeringanthropometry stress the simultaneous considera-tion of multiple dimensions through various typesof multivariate analyses that include humanmodeling (Reed et al., 1999). However, conven-tional anthropometric measurement approachesdo not provide three-dimensional information thatmay facilitate the development of more realistichuman models (Steinfeld et al., 2002).Anthropometric data collection methods that
allow an individual’s body position to be recordedin three-dimensional space have been describedpreviously (Annis, 1989; Brooke-Wavell et al.,1994; Hoekstra, 1997), and may overcome some ofthe limitations of conventional anthropometricmeasurement methods. Three-dimensional surfaceanthropometry already appears to have practicalvalue in medical applications, the development ofclothing and personal protective equipment, andthe design of constructed environments (Jones andRioux, 1997).
The objective of this paper was to evaluate somekey structural anthropometric dimensions of adultwheelchair users, as part of a larger project thatinvolved developing a database of the three-dimensional structural characteristics and func-tional abilities of wheelchair users. Of particularinterest in this study was how anthropometrydiffered by gender and wheelchair type.
2. Methods
2.1. Participants
Manual and powered wheelchair users withdisabilities that included arthritic disorders, CNSdisorders, spinal cord injuries, amputations, pa-ralysis, cardio-pulmonary conditions and strokewere recruited through a local Independent LivingCenter, a VA Medical Center, a United CerebralPalsy Association location, and local hospitals. Inaddition, advertisements were posted in localnewspapers and flyers placed in retail stores. Onlythose who relied on a wheelchair for their primarymeans of mobility were allowed to participate. Adeliberate attempt was made to select a diversegroup of wheelchair users, rather than justindividuals who possessed a specific set of physicalcapabilities, so that the results obtained could beextended more generally to wheelchair user popu-lations.
2.2. Measurement protocols
The measurement protocol required the collec-tion of wheelchair specifications, demographicinformation, structural anthropometric informa-tion and functional anthropometric informationfor each participant. The make, model, types ofaccessories and other wheelchair specificationswere obtained by inspecting each wheelchair.Demographic information about the participantsuch as age, disability type, and years of experiencewith a wheelchair was obtained through a struc-tured interview. Three-dimensional locations ofbody and wheelchair landmarks were collected.Additionally, photographic records of each parti-cipant in a variety of positions were recorded.

ARTICLE IN PRESS
Fig. 1. Data collection with an electromechanical probe allows
quick and accurate measurement of key mobility device and
body dimensions.
V. Paquet, D. Feathers / International Journal of Industrial Ergonomics 33 (2004) 191–204 193
Other data that were collected but not described inthis paper included quantitative information aboutobjective moving capabilities, wheelchair maneu-vering abilities and grip strength.The measurement protocol used for this study
differed from conventional anthropometric datacollection protocols. Some have noted the impor-tance of using alternative measurement methodsfor wheelchair users (Hobson and Molenbroek,1990). Physically disabled individuals may not beable to maintain standard anthropometric refer-ence positions during data collection. Addition-ally, unclothed conditions may not be practicaldue to thermoregulatory issues, and assistancerequired to change out of and into clothes. Thephysical characteristics of the wheelchair caninfluence the maneuverability and reaching abil-ities of an individual. Therefore, individuals in thisstudy wore light clothing and were measured whileseated in a comfortable position while remainingin their own wheelchair.
2.3. Variables
2.3.1. Wheelchair characteristics
The following information about each chair wasrecorded: device type (e.g., manual or powerchair), make, model, age, and presence/absenceof armrests and footrests, drive wheels, controller,and seat support surfaces.
2.3.2. Landmarks, reference planes and dimensions
Body landmarks, wheelchair landmarks andreference planes were recorded with an electro-mechanical probe (Fig. 1). The probe was anarticulating arm with six degrees of freedom andthe location of the tip of the device had a precisionof 0.3mm. The three-dimensional coordinates ofeach landmark point were recorded by pressing theprobe’s activation button three times in rapidsequence. For the reference planes, a minimum offive points on different locations of the physicalplane such as on the floor or on the top of afootrest were recorded to define the plane. Bodyand mobility device dimensions were obtained bycalculating the distances between points or refer-ence planes and used to derive estimated widths,heights, and depths of key chair and body
dimensions. This method of obtaining anthropo-metric dimensions is reliable but measurementsmay differ from those obtained with conventionalanthropometric measuring devices (Feathers et al.,2004). For this study, 36 body and wheelchairlandmarks and seven reference planes were used inthe calculation of 31 structural anthropometricdimensions (Tables 1 and 2).
2.4. Data analysis
Descriptive analyses were performed to evaluatethe distributional characteristics of the dimen-sions, as well as the correlation of selecteddimensions by gender and chair type. The mean,standard deviation, and 5th, 50th and 95thpercentile values of the distribution for eachdimension stratified by gender and wheelchairtype were calculated. Kolmogorov–Smirnov good-ness of fit tests were conducted to identifydimensional distributions that were non-normal.Analysis of variance (ANOVA) was used to testthe effects of gender, chair type (manual vs.

ARTICLE IN PRESS
Table 1
Body and wheelchair landmarks and reference planes used in this study
Description
Landmarks
Acromion� Most lateral palpable point on the acromial process of the scapula on the outer aspect of the
upper shoulder.
Abdominal point, anterior Most protruding point of the abdominal region.
Anterior-most point Forward-most portion of the individual’s body or wheelchair. This includes the footrest
edge, toe tip, etc.
Deltoid point, lateral� Most lateral point on the surface of the shoulder covering the bulge of the deltoid muscles.
Ectocanthus� Point at which both eyelids converge on the lateral edge of the eye.
Forearm point, lateral� Most lateral point on the forearm.
Hip point, lateral� Most lateral surface point in the hip region, different than ASIS left and right landmarks
which are osteologically defined.
Knee point, distal� Most distal portion of the knee when the knee is in or close to 90� flexion. The palpable
osteological reference is the tibial tuberosity.
Lateral-most point� Lateral most point of the individual and individual’s wheelchair, including parts of the
wheelchair and gear, including such as wheels (bottom—if with camber), elbow rests,
communication hardware, trays, controls, pads, bags, etc.
Malleolus, lateral� Lateral-most point on bony prominence at the distal end of the fibula. This landmark is
lateral and superior to the talocrural joint.
Malleolus, medial� Medial-most point on bony prominence at the distal end of the tibia. In relation to the
malleoli, lateral this point is medial, slightly superior and anterior.
MCPII point, lateral� Lateral-most point of the metacarpophalangeal joint II, which is located at the base of the
index finger.
MCPV point, lateral� Lateral-most point of the metacarpophalangeal joint V, which is near the hypothenar
skinfold of the palm of the hand.
Popliteal point� Center point of the fold resulting from knee flexion located on the dorsum of the knee area.
Posterior-most point Backward-most portion of the individual’s wheelchair. This may include wheelchair handles,
wheelchair backpacks, wheel edges, etc.
Radial styloid� Distal end of a bony prominence of the radius bone, located at the base of the thumb slightly
inferior to the thenar eminence. In most cases, it is lateral to the ‘anatomical snuff box’ (a
series of tendons that cross laterally from the forearm to the thumb).
Suprapatella� Superior portion of the distal femur and patellar region on the knee when it is at or close to
90� flexion.
Thigh point, lateral� Lateral-most point of the thigh between the knees and hips.
Waist point, lateral� Lateral-most portion of the waist on the left and right side of the trunk between ASIS and
ribs.
Vertex Highest point of the head, regardless of head posture.
Planes
Elbow rest plane� Upper surfaces of the wheelchair elbow rests. Left and right are often at the same height
above the floor, but in some cases, elbow rests may be at different heights.
Floor plane The floor surface beneath the wheelchair.
Footrest plane� Upper surfaces of the wheelchair footrests.
Seat back plane Inner surface of the seatback the back, which supports the wheelchair user’s back.
Seat pan plane Horizontal plane passing through the lowest point of the compressed cushion surface of the
seat of an individual’s wheelchair.
�Measurements made on left and right side of body.
V. Paquet, D. Feathers / International Journal of Industrial Ergonomics 33 (2004) 191–204194
powered), and gender� chair type on the anthro-pometric dimensions. ANOVA was conducted onall dimensions since the test is robust even when
the distribution of the measured variable does notexactly follow a normal distribution for samplesizes such as the ones used in this study

ARTICLE IN PRESS
Table 2
Calculated anthropometric dimensions derived from the landmarks in Table 1
Dimension Description
Abdominal extension depth Shortest perpendicular distance from seat back plane to abdominal point, anterior.
Acromion height� Vertical distance from floor plane to acromion landmark.
Biacromial breadth Point to point distance between right and left acromion landmarks.
Bideltoid breadth Point to point distance between right and left deltoid point, lateral landmarks.
Bimalleolar breadth� Point to point distance between malleolus, lateral and malleolus, medial landmarks of the ankle.
Buttock–knee length� Shortest perpendicular distance from seat back plane to knee point, distal.
Buttock–popliteal length� Shortest perpendicular distance from seat back plane to popliteal point.
Elbow rest height� Vertical distance from floor plane to elbow rest plane.
Eye height� Vertical distance from floor plane to ectocanthus.
Forearm to forearm breadth Point-to-point distance between right and left forearm point, lateral landmarks.
Hand breadth� Point-to-point distance between the MCPII point, medial landmark and MCPV point, lateral
landmark.
Hip breadth Point-to-point distance between the right and left hip point, lateral landmarks.
Knee height� Vertical distance from floor plane to suprapatella landmark.
Knee to footrest height� Shortest perpendicular distance from footrest plane to suprapatella landmark.
Overall depth Distance between parallel vertical planes that cross the anterior-most point and posterior-most point
of wheelchair or occupant.
Overall height Vertical distance from the floor plane to the vertex.
Overall breadth Distance between parallel vertical planes that cross the left and right lateral-most point landmarks.
Sitting height Vertical distance from the seat pan plane to vertex.
Thigh breadth Point-to-point distance between the left and right thigh point, lateral landmarks.
Waist breadth Point-to-point distance between the left and right waist point, lateral landmarks.
Wrist height� Vertical distance from the floor plane to the radial styloid.
�Measurements made on left and right side of body.
V. Paquet, D. Feathers / International Journal of Industrial Ergonomics 33 (2004) 191–204 195
(Kleinbaum et al., 1988). Since the correlation ofdimensions is useful in the application of anthro-pometric data in design, Pearson’s correlationcoefficients (r), stratified by gender and chair type,were calculated for height dimensions. Analyseswere completed using the statistical analysissystem (SAS) statistical software program for thepersonal computer (SAS Institute, 2002).
3. Results
3.1. Study sample
The study sample consisted of 75 males and 46females who used wheelchairs as their primarymeans of mobility on a regular basis. The averageage (standard deviation) for participants was 51(16) years, with a range of 22–94 years. Theaverage years (standard deviation) with disabilitywas 25.2 (17.2) years with a range of one half year
to 69 years. The number of male and femalemanual and powered wheelchair users for differentcategories of disability is shown in Table 3. Almosthalf of the sample (46%) used poweredwheelchairs. Of those that used powered wheel-chairs, more than half reported their primarydisability to be a disorder of the central nervoussystem such as cerebral palsy. The sample overallhad a larger proportion of powered wheelchairusers with more severe physical limitations thanwhat might be expected in the United Statespopulation of wheelchair users (Jones and San-ford, 1996).
3.2. Wheelchair characteristics
One-third of all wheelchairs sampled had aheadrest, trunk lateral support, thigh lateralsupport or other positioning support. A majorityof the postural supports (81%) were found onpowered wheelchairs, with the trunk lateral

ARTICLE IN PRESS
Table 3
Number of study participants by disability category, chair type and gender
Disability Males Females Total
Manual chair Powered chair Manual chair Powered chair
Spinal cord injury 9 11 1 0 21
CNS disorder 8 18 15 13 54
Orthopedic injury or deformity 10 3 7 1 21
Cerebral vascular disease 2 3 4 0 9
Respiratory or cardiovascular disorder 4 1 0 0 5
Other 4 2 1 4 11
Total 37 38 28 18 121
V. Paquet, D. Feathers / International Journal of Industrial Ergonomics 33 (2004) 191–204196
supports being the most common postural supportfor all powered wheelchair types. Trunk lateralsupport accounted for almost half of all posturalsupports (47%). One half of the armrests onmanual chairs were height adjustable. The swing-away footrest was the most common type offootrest on the manual chair. For powered chairs,rear wheel drives accounted for 66% of the drivewheels, and middle wheel drives accounted for28% of the drive wheels. A hand controlleraccounted for almost 97% of all controllers. Overhalf of the participants in this study carried at leastone piece of luggage such as a backpack or satchelon their wheelchair. Luggage was most oftencarried on the back of the chair (69%). Thewheelchair type most likely to have luggage wasthe power wheelchair (67%). Only 6% of allparticipants carried more than one piece ofluggage. Of those who did, the side and backcombination accounted for 75% of the luggagecombinations.
3.3. Structural dimensions
The structural dimensions of the manual andpowered wheelchair users by gender are summar-ized in Tables 4 and 5. Goodness of fit tests on theoverall sample and samples of women and menindicated that less than 1/3 of the dimensions werenot normally distributed (po0:05). Often distribu-tions found to be non-normal had median (50thpercentile) values that were close to the meanvalues. In some cases, the median approximated
the middle of the 5th and 95th percentile values ofthe dimensions, suggesting fairly symmetricaldistributions for these dimensions. Standard de-viations of non-normally distributed dimensionshave been left in the tables to allow directcomparisons of the variability in dimensions fordifferent groups, but should not be used toestimate dimensional values of specific percentilesin the distribution.ANOVA revealed significant differences
(po0:05) between men and women, and manualand powered wheelchair for some, but not alldimensions (Table 6). Significant differences be-tween men and women were found for many of theheight dimensions, as well as for biacromialbreadth and hand breadth (po0:05; d.o.f=1,117). As expected in these cases, the heights andbreadths were larger for men than for women.Differences between powered and manual wheel-chair users were found for elbow rest and wristheights as well as several of the breadth and depthdimensions. The correlations of the height dimen-sions also varied, to a certain extent, by gender andwheelchair type (Appendix A).
4. Discussion
4.1. Measurement considerations
In this study, three-dimensional surface anthro-pometric measurement methods were used tocapture body and wheelchair landmarks that were

ARTICLE IN PRESS
Table 4
Body and wheelchair dimensions (cm) of female wheelchair usersa
Dimension Overall sample (n ¼ 46) Manual chair users (n ¼ 28) Power chair users (n ¼ 18)
Mean SD 5th 50th 95th Mean SD 5th 50th 95th Mean SD 5th 50th 95th
Age (years) 49.5 15.0 28 48.5 74 53.1 15.2 33 51 82 44.0 15.0 22 41 72
Heights
Overall height 125.1 6.3 113.9 125.8 134.3 125.4 5.8 113.9 125.5 134.3 124.6 7.0 113.2 126.1 135.5
Eye height, left 113.9 6.3 104.3 114.7 123.7 113.6 5.4 104.8 114.7 123.7 114.3 7.6 99.6 115.4 124.1
Eye height, right 114.2 6.5 103.0 115.0 125.5 114.0 5.6 104.6 114.9 125.5 114.7 7.9 102.0 116.1 125.7
Acromion height, left 99.7 5.2 91.3 100.5 106.9 99.3 4.9 91.8 99.4 106.9 100.3 5.7 88.6 100.7 109.9
Acromion height, right 99.8 5.4 92.0 99.6 109.7 99.5 5.1 92.3 98.9 109.9 100.3 5.9 90.3 100.9 109.7
Elbow rest height, left 73.4 4.9 65.8 73.4 80.5 71.9 3.9 65.8 73.0 77.6 75.6 5.5 64.3 76.6 86.2
Elbow rest height, right 72.9 4.1 66.4 73.7 80.1 71.8 4.0 65.8 72.4 76.0 74.6 3.8 68.7 74.2 81.3
Wrist height, left 77.1 6.6 64.9 77.0 88.2 75.7 6.5 62.6 76.8 87.2 79.4 6.3 70.2 79.7 90.6
Wrist height, right 78.2 9.5 63.3 77.4 93.1 75.1 8.1 62.2 75.4 90.1 83 9.6 66.6 84.9 101.6
Sitting height 73.6 6.3 62.1 74.1 83.3 75.3 4.9 66.3 74.9 83.3 71 7.3 58.9 73.0 86.8
Knee to footrest height, Leftm 45.3 7.5 30.8 45.8 55.8 47.8 6.4 32.8 48.4 56.2 41.3 7.6 23.0 42.0 55.5
Knee to footrest height, righto,m 44.8 7.8 30.0 45.0 55.5 46.8 7.5 30.0 47.4 55.5 41.7 7.4 25.4 42.4 56.6
Knee height, leftp 62.1 5.4 53.9 61.4 70.8 60.4 5.2 53.8 59.4 70.4 64.6 4.6 58.3 63.9 74.1
Knee height, right 62.8 5.8 54.6 62.3 71.5 61.2 5.3 53.2 60.9 71.0 65.2 5.7 55.5 64.3 81.0
Breadths
Overall breadtho,m 70.8 7.9 61.3 68.9 85.2 69.6 7.6 60.8 67.5 84.4 72.8 8.2 61.6 72.1 90.6
Bideltoid breadth 50.6 6.8 39.2 49.9 63.2 51.2 6.5 39.1 50.6 62.0 49.6 7.4 39.2 48.4 63.9
Biacromial breadth 33.5 4.1 26.9 33.7 40.5 33.6 4.3 26.9 33.8 40.6 33.4 4.0 25.5 33.3 40.5
Forearm to forearm breadth 59.9 8.1 44.8 59.7 72.6 58.5 7.8 44.9 59.2 72.6 61.0 8.5 42.4 61.2 76.5
Hand breadth, left 8.0 0.8 6.6 8.1 9.4 8.1 0.8 7.1 8.1 9.5 7.9 0.7 6.2 7.9 9.3
Hand breadth, right 8.1 0.6 7.0. 8.1 8.8 8.1 0.6 7.0 8.1 8.8 8.1 0.6 6.9 8.2 9.1
Hip breadtho,p 27.7 5.2 21.6 26.1 38.3 27.9 5.2 21.6 26.8 38.3 27.4 5.4 21.2 25.3 41.8
Waist breadth 43.1 5.1 36.6 43.0 51.9 43.1 4.6 36.6 42.7 50.8 43.2 6.0 32.4 43.7 53.8
Thigh breadth 44.4 8.2 33.8 43.2 60.3 43.6 7.6 33.8 42.8 59.6 45.5 9.1 31.7 43.6 65.5
Bimalleolar breadth, left 8.1 1.4 6.3 7.9 10.5 7.9 1.4 6.2 7.7 10.5 8.4 1.4 6.5 8.2 11.5
Bimalleolar breadth, right 8.4 1.4 6.7 8.1 10.6 8.2 1.4 6.4 7.9 10.6 8.6 1.3 6.7 8.4 10.7
Depths and lengths
Overall depth 119.0 10.0 104.8 118.9 134.0 116.8 9.3 102.5 116.1 132.9 122.4 10.4 106.8 122.2 152.9
Abdominal extension depth 36.5 5.6 28.4 35.8 45.7 36.1 5.8 26.4 34.9 45.7 37.2 5.5 27.3 36.5 46.3
Buttock–knee length, leftp 62.5 6.8 55.2 62.9 76.0 63.5 4.9 55.2 63.7 69.2 60.9 9.1 34.7 61.0 76.1
Buttock–knee length, righto 62.4 6.2 54.8 62.5 74.4 62.8 4.0 56.5 62.8 67.4 61.9 8.7 38.7 61.3 77.9
Buttock–popliteal length, left 52.1 5.2 45.1 51.9 58.9 52.7 4.1 46.9 51.8 58.9 51.2 6.7 35.1 51.8 65.4
Buttock–popliteal length, righto,m 52.8 7.2 41.5 52.6 46.4 53.6 6.7 43.4 52.9 64.6 51.5 8.0 31.7 52.6 67.2
aNon-normal distribution (po0.05) indicated by o for overall sample, m for manual wheel chair users, p for power wheelchair users.
V. Paquet, D. Feathers / International Journal of Industrial Ergonomics 33 (2004) 191–204 197
then used in the calculation of standard anthro-pometric dimensional values. Descriptions of theanatomical landmarks used therefore had to bemodified from those often used in conventionalanthropometric studies. Each participant enrolledin this study was allowed to assume a comfortableseated posture while wearing light clothing, which
may have added to the variability of dimensionalvalues within categories of gender and chair type(Feathers et al., 2004). While our measurementmethods deviated from others, the value ofmeasuring the user and wheelchair together insuch a way has been described by others (e.g.,Jarosz, 1996).

ARTICLE IN PRESS
Table 5
Body and wheelchair dimensions (cm) of male wheelchair usersa
Dimension Overall sample (n ¼ 75) Manual chair users (n ¼ 37) Power chair users (n ¼ 38)
Mean SD 5th 50th 95th Mean SD 5th 50th 95th Mean SD 5th 50th 95th
Age 52.0 15.6 23 52 80 57.3 15.6 33 57 81 46.5 13.8 22 46 70
Heights
Overall height 130.9 6.0 121.6 131.2 139.4 130.6 4.7 123.6 131.0 137.9 131.2 7.1 121.4 131.2 149.4
Eye height, left 119.6 5.7 111.0 119.5 127.2 119.2 4.4 111.8 119.5 126.0 120.0 6.7 110.9 119.9 137.8
Eye height, right 119.4 5.8 110.5 119.3 127.0 118.8 4.7 112.5 119.0 126.6 120.0 6.6 109.8 120.0 136.7
Acromion height, Lefto 104.2 5.4 94.1 104.6 114.0 103.8 3.8 94.1 104.6 109.6 104.6 6.6 93.6 104.4 120.3
Acromion height, righto,p 104.3 5.0 94.6 104.6 113.4 103.8 4.2 93.0 104.3 109.9 104.8 5.6 94.6 104.7 119.1
Elbow rest height, left 74.1 5.8 63.9 73.5 84.0. 73.1 5.1 63.9 73.3 80.4 75.1 6.2 62.3 75.8 84.8
Elbow rest height, right 74.1 4.9 64.7 73.7 83.7 72.8 4.1 64.2 72.8 79.3 75.2 5.3 65.7 73.9 85.1
Wrist height, left 77.7 7.2 66.7 77.7 91.5 76.5 6.6 66.4 76.2 94.3 78.9 7.7 67.9 78.3 91.5
Wrist height, right 77.5 7.7 64.8 77.0 89.2 75.4 6.3 63.5 74.9 87.3 79.5 8.5 64.8 79.3 90.2
Sitting heighto 77.3 6.0 67.8 78.6 85.0 79.6 4.7 69.4 80.3 86.7 75.0 6.3 60.1 75.6 84.5
Knee to footrest height, lefto,m 50.5 7.1 37.8 52.5 59.0 51.9 7.4 37.8 53.2 59.4 49.1 6.6 37.8 50.3 57.8
Knee to footrest height, righto,m 49.6 8.1 35.9 51.6 57.3 49.7 9.8 22.5 52.7 58.9 49.6 6.2 38.2 50.8 56.8
Knee height, left 62.8 6.0 53.7 63.5 73.5 61.4 6.2 51.5 61.0 72.4 64.2 5.5 56.3 63.6 75.2
Knee height, righto,m 64.5 6.7 55.0 64.2 74.8 63.9 7.8 52.1 63.9 85.7 65.0 5.4 55.0 64.9 74.8
Breadths
Overall breadtho,m 71.3 8.2 60.4 70.9 83.9 69.8 6.8 58.9 69.0 83.9 72.8 9.2 60.8 72.6 88.5
Bideltoid breadth 52.2 6.0 41.5 52.1 61.1 53.4 5.2 46.7 52.5 63.3 51.0 6.5 39.7 51.9 60.4
Biacromial breadth 37.1 3.6 30.6 37.5 42.3 38.6 2.8 33.8 39.0 42.4 35.75 3.8 27.7 36.6 42.2
Forearm to forearm breadth 60.1 8.2 47.5 59.3 73.7 59.0 6.5 49.2 57.9 70.1 61.2 9.5 39.1 60.7 74.7
Hand breadth, left 8.9 1.0 7.0 8.9 10.6 9.0 0.9 7.2 9.0 10.4 8.8 1.1 6.8 8.7 10.9
Hand breadth, rightm 9.0 0.9 7.2 9.1 10.5 9.2 0.8 7.2 9.3 10.4 8.8 0.9 7.1 8.8 10.5
Hip breadth 27.0 4.1 20.7 26.7 33.9 26.3 3.9 22.4 28.0 38.7 25.8 4.0 18.4 25.5 32.8
Waist breadth 42.9 6.1 30.4 43.5 53.0 44.3 5.4 30.8 44.7 53.6 41.7 6.6 29.2 42.0 53.0
Thigh breadth 44.1 9.1 27.0 44.0 62.5 45.1 6.7 30.8 46.1 52.9 43.2 11.0 25.2 42.5 69.6
Bimalleolar breadth, lefto,m 8.5 1.3 6.6 8.4 11.0 8.6 1.3 7.1 8.4 11.0 8.5 1.4 6.4 8.4 11.2
Bimalleolar breadth, righto,m 8.8 1.5 6.9 8.5 11.2 9.0 1.4 7.2 8.6 12.3 8.7 1.5 5.7 8.5 11.1
Depths and Lengths
Overall depthp 122.5 10.1 109.2 123.0 141.9 123.5 10.9 107.1 124.0 146.5 121.6 9.4 109.6 118.9 138.1
Abdominal extension depth 37.1 5.5 28.2 36.1 47.4 35.6 5.0 27.0 35.5 43.7 38.5 5.7 30.6 37.6 48.8
Buttock–knee length, lefto,m 62.3 7.4 48.9 63.8 73.2 62.4 6.1 51.1 63.8 71.2 62.2 8.5 44.9 63.8 73.6
Buttock–knee length, right 62.5 7.0 51.4 62.8 73.6 63.2 5.0 54.7 63.2 70.5 61.8 8.5 47.0 62.1 74.3
Buttock–popliteal length, left 51.8 7.1 39.4 52.4 62.6 51.7 5.8 40.5 52.7 59.8 51.8 8.2 34.6 52.0 63.9
Buttock–popliteal length, righto 52.0 7.4 37.0 53.0 62.9 52.2 6.8 39.2 53.1 60.9 51.8 7.9 35.1 53.1 63.1
aNon-normal distribution (po0:05) indicated by o for overall sample, m for manual wheel chair users, p for power wheelchair users.
V. Paquet, D. Feathers / International Journal of Industrial Ergonomics 33 (2004) 191–204198
4.2. Sampling considerations
Significant differences in dimensional valuesbetween men and women, and powered andmanual wheelchair users were found for only someof the dimensions. This is most likely the result ofthe small sample sizes, diversity of the participants
and diversity of chair models within chair types, aswell as factors related to the measurement proto-col. The sample sizes for categories of gender andchair type were relatively small, and a widerange of disabilities was represented in eachcategory. Additionally, there are different typesof manual and powered wheelchairs, along

ARTICLE IN PRESS
Table 6
Summary of significant effects for the ANOVA on gender and chair type for the anthropometric dimensions (po0:05; d.o.f=1, 117)a
Dimensions Differences between
women and men
Differences between manual and
powered chair users
Overall height OEye height, left and right OAcromion height, left and right OElbow rest height, left and right OWrist height, left and right OSitting height OKnee to footrest height, left O OKnee to footrest height, right OKnee height, left and right OOverall breadth OBiacromial breadth O OHand breadth, left and right OHip breadth OAbdominal extension depth O
aO indicates statistical significance (po0:05; d.o.f=1, 117).
V. Paquet, D. Feathers / International Journal of Industrial Ergonomics 33 (2004) 191–204 199
with different types of accessories that would addto the variability of dimensional values withinchair type.While significant differences between men and
women, and manual and powered wheelchair userswere found for some dimensions, the 5th, 50th and95th values of dimensions between user groups inthese cases still often remained within 5 cm of eachother. While the differences are meaningful from atheoretical perspective, and may be important inbiomechanical or kinematic modeling, differencesof this magnitude may have limited practicalsignificance to designers.The sample described in this study was not
representative of the US wheelchair user popula-tion in terms of gender, wheelchair type anddisability status. For example, there is a greaterproportion of powered wheelchair users includedin this sample than the 7% of powered chair usersestimated in US population of wheelchair users(Jones and Sanford, 1996). However, a wide rangeof disabilities was sampled within wheelchair type,and the results summarized in Tables 4 and 5, ifused cautiously, may be useful in the design ofenvironments that accommodate power and man-ual wheelchair users. Data collection efforts arecontinuing to increase the size and diversity of the
sample to improve the quality and utility of thedata set.
4.3. Comparisons with previous studies
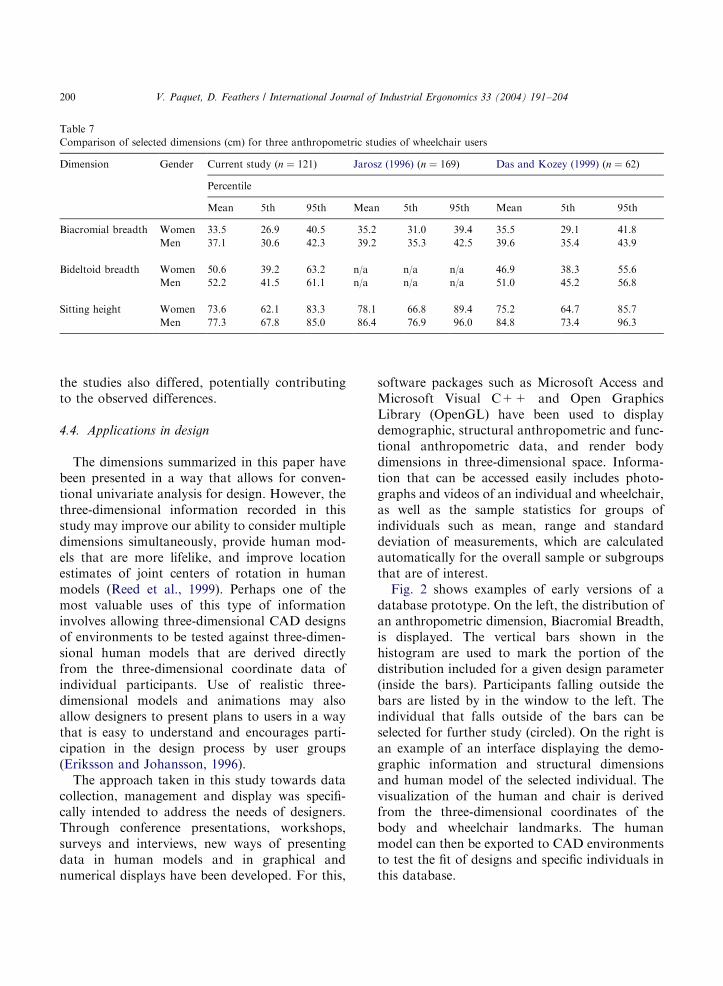
When selected dimensions of body size arecompared with other recent studies of wheelchairusers, there are differences in the dimensionalvalues. For example, in this study sitting heightand biacromial breadth appear to be smaller, whilebideltoid breadth appears to be larger (Table 7).Differences in the measurement methods andcharacteristics of the study population mayexplain these differences. Individuals in the currentstudy were allowed to maintain a relaxed sittingposture during the measurement sessions andoften abducted their shoulders to rest their armson the wheelchair’s arm support. Such postureswould likely result in a reduction of sitting heightand biacromial breadth, and an increase inbideltoid breadth when compared to those mea-surements recorded during erect seated postures.Additionally, the definitions of the landmarks anddimensions used in this study were slightlydifferent than those used in previous studies.Finally, the types of disabilities represented in
ARTICLE IN PRESS
Table 7
Comparison of selected dimensions (cm) for three anthropometric studies of wheelchair users
Dimension Gender Current study (n ¼ 121Þ Jarosz (1996) (n ¼ 169Þ Das and Kozey (1999) (n ¼ 62Þ
Percentile
Mean 5th 95th Mean 5th 95th Mean 5th 95th
Biacromial breadth Women 33.5 26.9 40.5 35.2 31.0 39.4 35.5 29.1 41.8
Men 37.1 30.6 42.3 39.2 35.3 42.5 39.6 35.4 43.9
Bideltoid breadth Women 50.6 39.2 63.2 n/a n/a n/a 46.9 38.3 55.6
Men 52.2 41.5 61.1 n/a n/a n/a 51.0 45.2 56.8
Sitting height Women 73.6 62.1 83.3 78.1 66.8 89.4 75.2 64.7 85.7
Men 77.3 67.8 85.0 86.4 76.9 96.0 84.8 73.4 96.3
V. Paquet, D. Feathers / International Journal of Industrial Ergonomics 33 (2004) 191–204200
the studies also differed, potentially contributingto the observed differences.
4.4. Applications in design
The dimensions summarized in this paper havebeen presented in a way that allows for conven-tional univariate analysis for design. However, thethree-dimensional information recorded in thisstudy may improve our ability to consider multipledimensions simultaneously, provide human mod-els that are more lifelike, and improve locationestimates of joint centers of rotation in humanmodels (Reed et al., 1999). Perhaps one of themost valuable uses of this type of informationinvolves allowing three-dimensional CAD designsof environments to be tested against three-dimen-sional human models that are derived directlyfrom the three-dimensional coordinate data ofindividual participants. Use of realistic three-dimensional models and animations may alsoallow designers to present plans to users in a waythat is easy to understand and encourages parti-cipation in the design process by user groups(Eriksson and Johansson, 1996).The approach taken in this study towards data
collection, management and display was specifi-cally intended to address the needs of designers.Through conference presentations, workshops,surveys and interviews, new ways of presentingdata in human models and in graphical andnumerical displays have been developed. For this,
software packages such as Microsoft Access andMicrosoft Visual C++ and Open GraphicsLibrary (OpenGL) have been used to displaydemographic, structural anthropometric and func-tional anthropometric data, and render bodydimensions in three-dimensional space. Informa-tion that can be accessed easily includes photo-graphs and videos of an individual and wheelchair,as well as the sample statistics for groups ofindividuals such as mean, range and standarddeviation of measurements, which are calculatedautomatically for the overall sample or subgroupsthat are of interest.Fig. 2 shows examples of early versions of a
database prototype. On the left, the distribution ofan anthropometric dimension, Biacromial Breadth,is displayed. The vertical bars shown in thehistogram are used to mark the portion of thedistribution included for a given design parameter(inside the bars). Participants falling outside thebars are listed by in the window to the left. Theindividual that falls outside of the bars can beselected for further study (circled). On the right isan example of an interface displaying the demo-graphic information and structural dimensionsand human model of the selected individual. Thevisualization of the human and chair is derivedfrom the three-dimensional coordinates of thebody and wheelchair landmarks. The humanmodel can then be exported to CAD environmentsto test the fit of designs and specific individuals inthis database.

ARTICLE IN PRESS
Fig. 2. Left: display showing the distribution of an anthropometric dimension. Right: display showing the demographic information,
structural dimensions, sample photographs and human model of a selected individual derived from the three-dimensional coordinates
of the individual’s body and wheelchair landmarks.
V. Paquet, D. Feathers / International Journal of Industrial Ergonomics 33 (2004) 191–204 201
Steinfeld et al. (2002) in summarizing keyfindings of a workshop held to discuss the currentstate of the knowledge about research and designpractices related to anthropometry and disability,found that the available databases were notproviding the information that designers need ina form that is easy to use. Furthermore, theyconcluded that using conventional anthropometricmeasurement techniques would adequately im-prove our knowledge of the anthropometry ofdisabled populations. While the study describedhere is ongoing, it attempts to address theselimitations by providing data that can be usednot only with conventional anthropometric meth-ods, but introduces a prototype interface that mayallow designers to use information more readilyand effectively in simple ways that involve usingthree-dimensional human models in design.
5. Conclusion
This paper summarized the structural anthro-pometric dimensions of 121 male and femalewheelchair users. There is a need for continuedefforts that will improve our understanding of theanthropometry of wheelchair users. It appears thatnew measurement and data presentation methodswill soon offer promising new ways to apply
anthropometry in design for this importantsegment of the population.
Acknowledgements
This research was supported with a grantprovided by the Department of Education, Na-tional Institute on Disability and RehabilitationResearch through the Rehabilitation EngineeringResearch Center on Universal Design at Buffalo(Grant # H133E990005). The opinions expressedin this paper are those of the authors and do notrepresent those of the Department of Education orthose of the National Institute on Disability andRehabilitation Research.The authors wish to acknowledge the assistance to
Edward Steinfeld, John Roebuck, and James Lenkerfor their valuable advice about methodologicalconsiderations related to this study. AishwaryaBhave, Valerie Beecher, Kenfield Griffith, AdwaitJoshi, Heather Lindsay, Mieko Naito, and JanaPolzin assisted with data collection and/or developedcode used for the prototype interface and database.
Appendix A
Correlation matrices of height dimensions bygender and chair type (see Tables 8–11).

ARTICLE IN PRESS
Table 9
Female powered chair users (n ¼ 18)
1 2 3 4 5 6 7 8 9 10 11 12 13 14
1 Overall height 1 0.93 0.91 0.95 0.94 0.78 0.64 0.37 0.45 0.92 0.42 0.40 0.40 0.412 Eye height, left 1 0.93 0.92 0.88 0.83 0.73 0.40 0.68 0.83 0.42 0.38 0.56 0.533 Eye height, right 1 0.86 0.88 0.85 0.78 0.39 0.51 0.80 0.42 0.35 0.54 0.504 Acromion height, left 1 0.95 0.86 0.62 0.40 0.55 0.86 0.50 0.48 0.49 0.475 Acromion height, right 1 0.85 0.56 0.54 0.54 0.85 0.53 0.51 0.46 0.486 Elbow rest height, left 1 0.72 0.45 0.61 0.64 0.33 0.31 0.62 0.527 Elbow rest height, right 1 0.20 0.54 0.55 0.18 0.07 0.38 0.218 Wrist height, left 1 0.51 0.25 0.24 0.34 0.32 0.429 Wrist height, right 1 0.33 0.26 0.22 0.53 0.4710 Sitting height 1 0.57 0.58 0.27 0.3511 Knee to footrest height, left 1 0.96 0.33 0.4312 Knee to footrest height, right 1 0.31 0.4813 Knee height, left 1 0.9214 Knee Height, Right 1
Values exceeding 0.58 are statistically significant (po0:01).
Table 10
Male manual chair users (n ¼ 37)
1 2 3 4 5 6 7 8 9 10 11 12 13 14
1 Overall height 1 0.93 0.94 0.78 0.76 0.31 0.20 0.02 0.12 0.65 0.35 0.00 0.41 0.382 Eye height, left 1 0.98 0.72 0.73 0.33 0.19 0.10 0.11 0.59 0.30 0.00 0.34 0.333 Eye height, right 1 0.74 0.73 0.33 0.20 0.09 0.15 0.62 0.33 0.01 0.34 0.324 Acromion height, left 1 0.76 0.44 0.52 0.20 0.30 0.63 0.43 0.04 0.26 0.245 Acromion height, right 1 0.61 0.20 0.07 0.34 0.39 0.37 �0.16 0.33 0.446 Elbow rest height, Left 1 0.51 0.40 0.50 0.14 0.04 �0.46 �0.06 0.377 Elbow rest height, right 1 0.48 0.52 0.34 �0.04 �0.09 �0.13 0.168 Wrist height, left 1 0.73 0.01 �0.09 �0.21 �0.01 0.139 Wrist height, right 1 0.16 �0.05 �0.37 �0.12 0.3310 Sitting height 1 0.29 0.14 0.01 0.0711 Knee to footrest height, left 1 0.54 0.33 0.2712 Knee to footrest height, Right 1 0.26 �0.2313 Knee height, left 1 0.3814 Knee height, right 1
Values exceeding 0.42 are statistically significant (po0:01).
Table 8
Female manual chair users (n ¼ 28)
1 2 3 4 5 6 7 8 9 10 11 12 13 14
1 Overall height 1 0.87 0.95 0.88 0.81 0.37 0.44 0.11 0.16 0.70 0.42 0.34 0.28 0.392 Eye height, left 1 0.94 0.83 0.65 0.35 0.43 0.04 0.16 0.61 0.31 0.34 0.28 0.373 Eye height, right 1 0.85 0.71 0.35 0.43 0.05 0.18 0.63 0.31 0.31 0.30 0.384 Acromion height, left 1 0.88 0.49 0.59 0.19 0.30 0.60 0.28 0.21 0.38 0.515 Acromion height, right 1 0.43 0.46 0.13 0.20 0.59 0.33 0.08 0.26 0.386 Elbow rest height, left 1 0.93 0.53 0.68 0.10 0.10 0.01 0.55 0.567 Elbow rest height, right 1 0.50 0.68 0.13 0.09 0.10 0.57 0.588 Wrist height, left 1 0.79 �0.08 �0.02 �0.03 0.36 0.459 Wrist height, right 1 �0.08 �0.12 �0.12 0.53 0.5710 Sitting height 1 0.51 0.47 �0.03 0.1111 Knee to footrest height, left 1 0.84 0.09 0.1512 Knee to footrest height, right 1 0.11 0.2013 Knee height, left 1 0.9014 Knee height, right 1
Values exceeding 0.46 are statistically significant (po0:01).
V. Paquet, D. Feathers / International Journal of Industrial Ergonomics 33 (2004) 191–204202

ARTICLE IN PRESS
Table 11
Male manual powered chair users (n ¼ 38)
1 2 3 4 5 6 7 8 9 10 11 12 13 14
1 Overall height 1 0.97 0.95 0.85 0.90 0.65 0.66 0.55 0.40 0.74 0.31 0.27 0.36 0.26
2 Eye height, left 1 0.98 0.87 0.91 0.67 0.70 0.53 0.39 0.68 0.35 0.31 0.36 0.28
3 Eye height, right 1 0.84 0.89 0.66 0.67 0.52 0.40 0.65 0.35 0.33 0.31 0.24
4 Acromion height, left 1 0.92 0.74 0.72 0.46 0.45 0.55 0.42 0.34 0.44 0.33
5 Acromion height, right 1 0.75 0.63 0.46 0.42 0.56 0.34 0.32 0.45 0.35
6 Elbow rest height, left 1 0.73 0.36 0.45 0.19 0.18 0.14 0.56 0.40
7 Elbow rest height, right 1 0.53 0.44 0.28 0.24 0.09 0.47 0.34
8 Wrist height, left 1 0.71 0.30 0.24 0.15 0.50 0.45
9 Wrist height, right 1 0.08 0.27 0.15 0.54 0.47
10 Sitting height 1 0.18 0.11 �0.12 �0.2211 Knee to footrest height, left 1 0.78 0.41 0.41
12 Knee to footrest height, right 1 0.35 0.48
13 Knee height, left 1 0.92
14 Knee height, right 1
Values exceeding 0.42 are statistically significant (po0:01).
V. Paquet, D. Feathers / International Journal of Industrial Ergonomics 33 (2004) 191–204 203
References
Annis, J., 1989. An automated device used to develop a new 3-
D database for head and face anthropometry. In: Mital, A.
(Ed.), Advances in Industrial Ergonomics and Safety I.
Taylor & Francis, London, pp. 181–188.
Annis, J., 1996. Aging effects on anthropometric dimensions
important to workplace design. International Journal of
Industrial Ergonomics 18, 381–388.
Anthropology Research Staff (Eds.), 1978a. Anthropometric
Source Book, Vol. I: Anthropometry for Designers (NASA
Reference Publication 1024). NASA Scientific and Techni-
cal Information Office, Houston.
Anthropology Research Staff (Eds.), 1978b. Anthropometric
Source Book, Vol. II: A Handbook of Anthropometric
Data (NASA Reference Publication 1024). NASA Scientific
and Technical Information Office, Houston.
Bradtmiller, B., Annis, J., 1997. Anthropometry for persons
with disabilities: needs for the 21st century. Report for the
US Architectural and Transportation Barriers Compliance
Board.
Brooke-Wavell, K., Jones, P., West, G., 1994. Reliability and
repeatability of 3-D body scanner (LASS) measurements
compared to anthropometry. Annals of Human Biology 21
(6), 571–577.
Das, B., Kozey, J., 1999. Structural anthropometric measure-
ments for wheelchair mobile adults. Applied Ergonomics 30
(5), 385–390.
Eriksson, J., Johansson, G., 1996. Adaptation of workplaces
and homes for disabled people using computer-aided design.
International Journal of Industrial Ergonomics 17, 153–162.
Feathers, D., Paquet, V., Drury, C., 2004. Measurement
consistency and three-dimensional electromechanical
anthropometry. International Journal of Industrial Ergo-
nomics, this issue.
Gordon, C., Bradtmiller, B., Clauser, C., Churchill, T.,
McConville, J., Tebbetts, I., Walker, R., 1989. 1987–1988
Anthropometric survey of US army personnel: methods and
summary statistics. Technical Report (TR-89/027) (AD
A209600). US Army Natick Research, Development and
Engineering Center, Natick, MA.
Goswami, A., Ganguli, S., Chatterjee, B., 1987. Anthropo-
metric characteristics of disabled and normal Indian men.
Ergonomics 30 (5), 817–823.
Hobson, D., Molenbroek, J., 1990. Anthropometry and design
for the disabled: experiences with seating design for the
cerebral palsy population. Applied Ergonomics 21 (1), 43–54.
Hoekstra, P., 1997. On postures, percentiles and 3D surface
anthropometry. In: Robertson, S.A. (Ed.), Contemporary
Ergonomics. Taylor & Francis, London, pp. 130–135.
Jarosz, E., 1996. Determination of workspace of wheelchair
users. International Journal of Industrial Ergonomics 17,
123–133.
Jones, P., Rioux, M., 1997. Three-dimensional surface anthro-
pometry: applications to the human body. Optics and
Lasers in Engineering 28, 89–117.
Jones, M., Sanford, J., 1996. People with mobility impairments
in the United States today and in 2010. Assistive Technol-
ogy 8 (1), 43–53.
Kennedy, K., 1986. A collation of United States air force
antrhopometry (U) (AAMRL-TR-85-062). Wright–Patter-
son Air Force Base, Aerospace Medical Research Labora-
tory, Aiero Medical Division, and Air Force Systems
Command, OH.
Kleinbaum, D., Kupper, L., Muller, K., 1988. Applied
Regression Analysis and Other Multivariable Methods.
Duxbury Press, Belmont, CA.
Laubach, L., Glaser, R., Suryaprasad, A., 1981. Anthropome-
try of aged male wheelchair-dependent patients. Annals of
Human Biology 8 (1), 25–29.

ARTICLE IN PRESS
V. Paquet, D. Feathers / International Journal of Industrial Ergonomics 33 (2004) 191–204204
Molenbroek, J., 1987. Anthropometry of elderly people in the
Netherlands: research and applications. Applied Ergo-
nomics 18 (3), 187–194.
Reed, M., Manary, M., Schneider, L. (1999). Methods for
measuring and representing automobile occupant posture
(SAE Technical Paper 990959). Society of Automotive
Engineers, Warrendale, PA.
SAS Institute, Inc., 2002. Statistical Analysis System (SAS),
version 8. SAS Institute, Inc., Cary, NC.
Steinfeld, E., Lenker, J., Paquet, V., 2002. The Anthropo-
metrics of Disability: An International Workshop. Report
for the US Architectural and Transportation Barriers
Compliance Board. Available at http://design6.ap.buffalo.
edu/Brercud.Stoudt, H., 1981. The anthropometry of the elderly. Human
Factors 23 (1), 29–37.
Ward, J., Kirk, N., 1967. Anthropometry of elderly women.
Ergonomics 10 (1), 17–24.