analyzing the pit count - wordpress.com€¦ · success stories. pre-pit promotion ... 2017...
TRANSCRIPT
Analyzing the PIT Countfor the State of Mississippi

What Is The Point-In-Count?➤The Point-in-Time (PIT) count is a
count of sheltered and unsheltered homeless persons on a single night in January.
➤These counts reveal the number of homeless persons in our shelters and on our streets at a single point-in-time. Each count is planned, coordinated, and carried out locally.
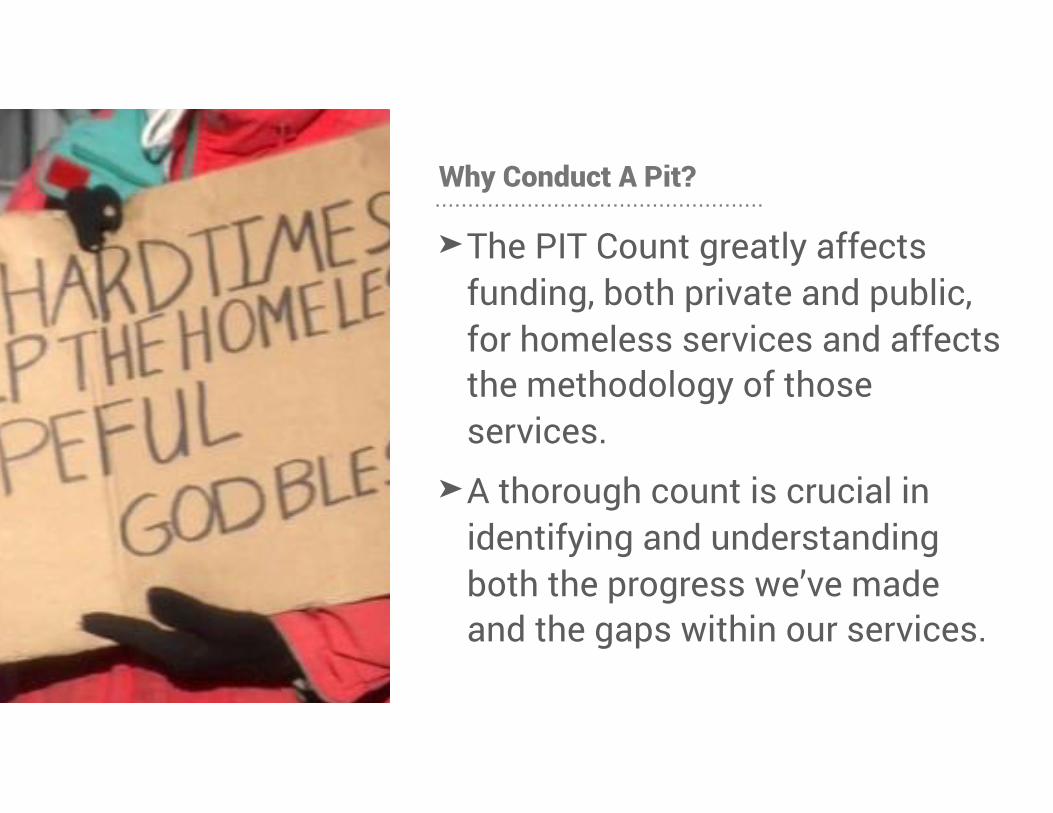
Why Conduct A Pit?
➤The PIT Count greatly affects funding, both private and public, for homeless services and affects the methodology of those services.
➤A thorough count is crucial in identifying and understanding both the progress we’ve made and the gaps within our services.

Our Strategy➤Pre-Pit
➤Meeting Of The Pit Count Committee ➤Awareness & Buy-In ➤Training Preparation
➤Count Day ➤Regional Coalitions ➤Counting Strategies
➤Post-Pit ➤Reporting & Analysis ➤Adapting Homeless Systems/Processes
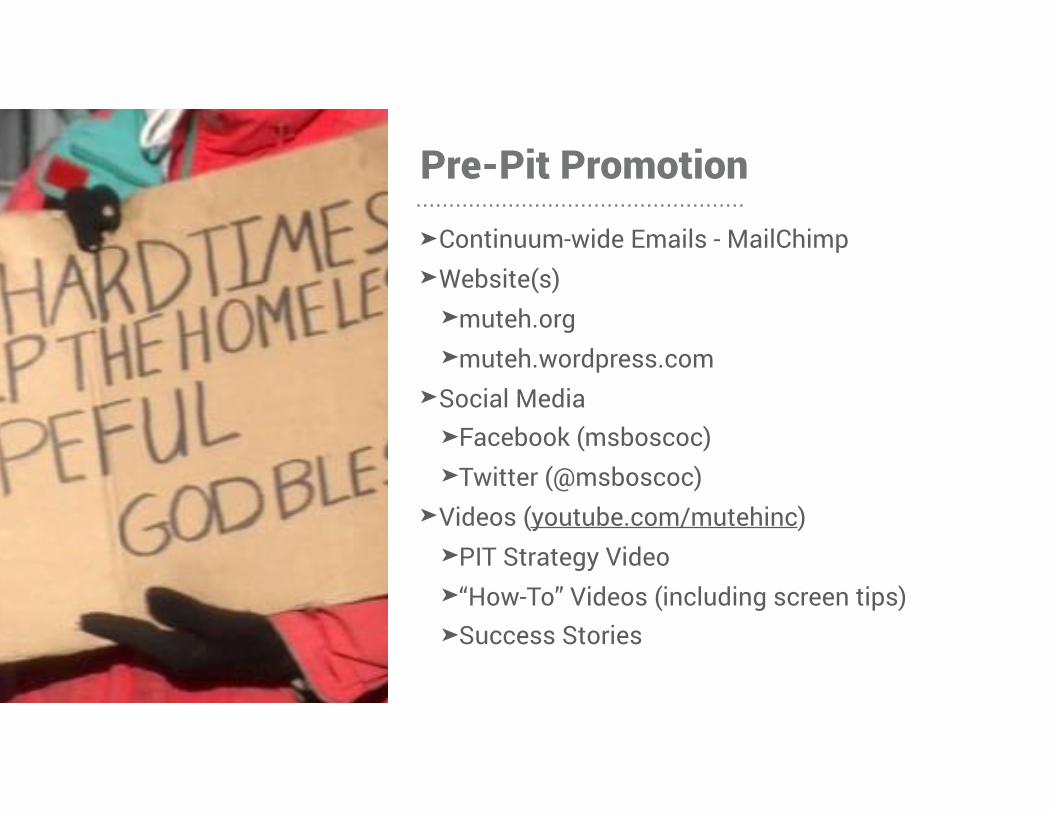
Pre-Pit Promotion
➤Continuum-wide Emails - MailChimp ➤Website(s)
➤muteh.org ➤muteh.wordpress.com
➤Social Media ➤Facebook (msboscoc) ➤Twitter (@msboscoc)
➤Videos (youtube.com/mutehinc) ➤PIT Strategy Video ➤“How-To” Videos (including screen tips) ➤Success Stories

Pre-Pit Promotion
➤Schools of Social Work ➤Snail Mail Campaigns ➤DVD of PIT Videos ➤Point-In-Time Cheat
Sheets
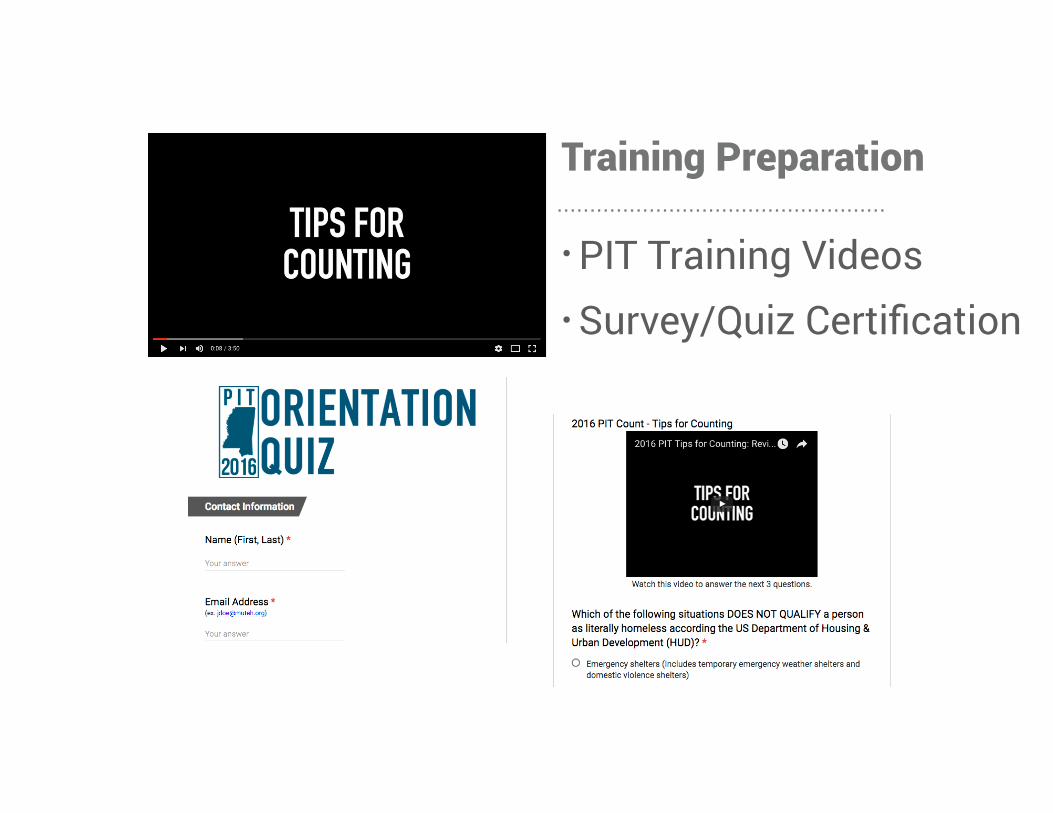
Training Preparation
• PIT Training Videos • Survey/Quiz Certification
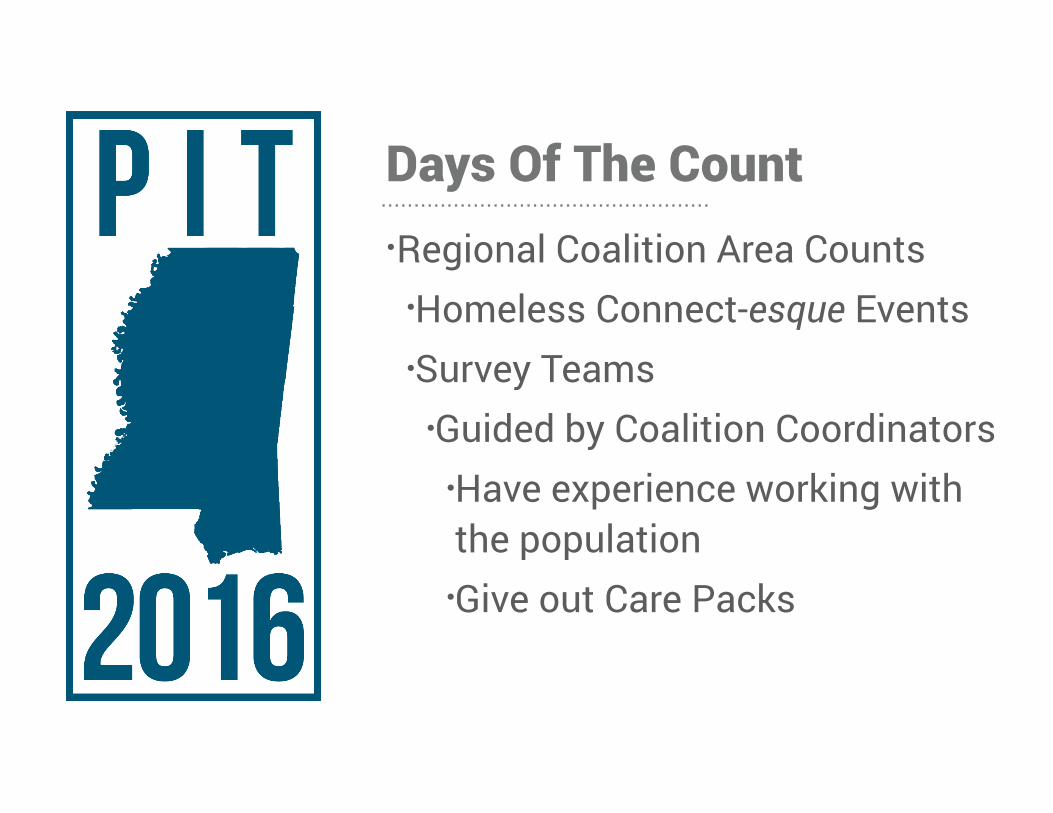
Days Of The Count•Regional Coalition Area Counts •Homeless Connect-esque Events •Survey Teams •Guided by Coalition Coordinators •Have experience working with the population •Give out Care Packs

Methodology➤Sheltered Count ➤HMIS ➤Interviews w/ sheltered
homeless people during the PIT Count
➤Distribution/collection of PIT forms to provider staff
Unsheltered Count • HMIS • Interviews w/ unsheltered homeless people during the PIT Count
• Interviews with service provider staff
• Distribution/collection of PIT forms to provider staff

Regional StrategiesDelta •Focus volunteers on major municipalities
•Send local case managers to smaller townships to survey homeless
Southwest •WINGS coverage of Southwest MS •Post volunteers at local concentration points in the city. •Part with local law enforcement to canvass homeless-concentrated areas

Regional StrategiesCentral •Count all local shelters •Connect with local homeless ministries, soup kitchens •Conduct Central Homeless Connect •Survey intakes at local supportive service agencies
Pine Belt •Collaboration with local advocates •Enlisted help of USM School of Social Work Dept. •Count shelters, Outreach, and Conduct surveys
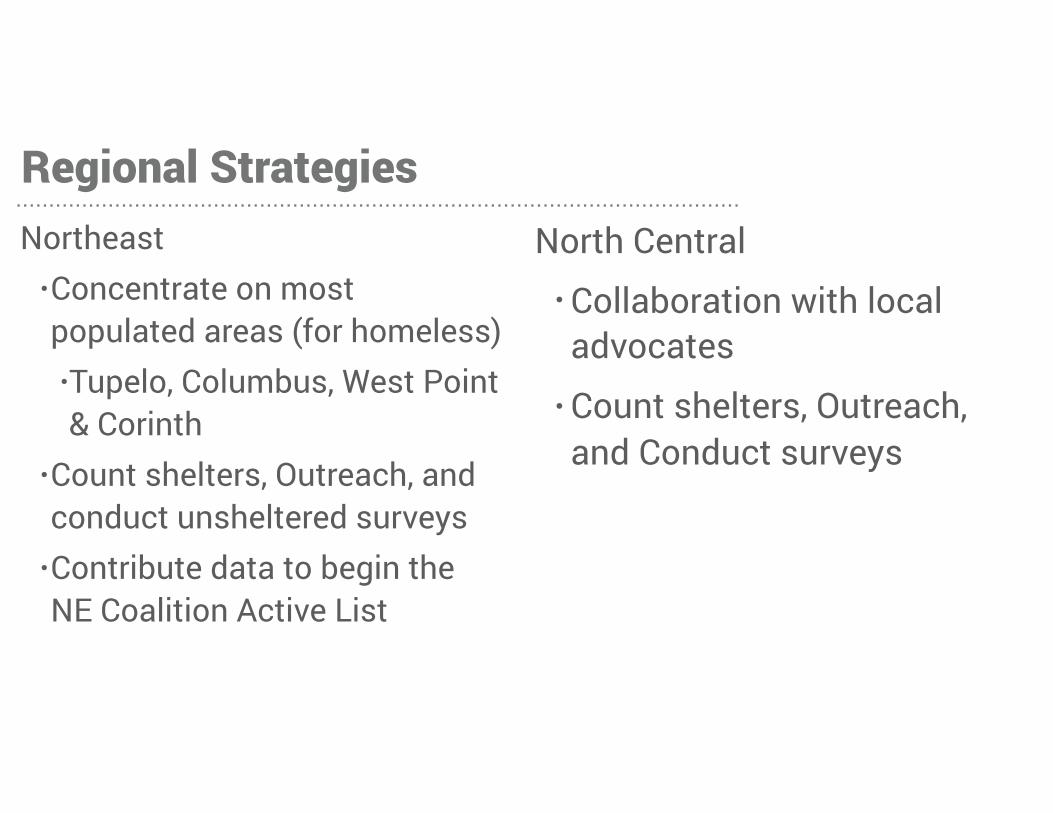
Regional StrategiesNortheast •Concentrate on most populated areas (for homeless) •Tupelo, Columbus, West Point & Corinth
•Count shelters, Outreach, and conduct unsheltered surveys •Contribute data to begin the NE Coalition Active List
North Central • Collaboration with local advocates
• Count shelters, Outreach, and Conduct surveys
Results & Datafor the 2017 Point-In-Time Count

81
785JANUARY
2016
697JANUARY
2017
DECREASE BY 88 = 11%
CES Highlights

82
697PERSONS COUNTED
=451
SHELTERED
UNSHELTERED
246
2017 PIT Count
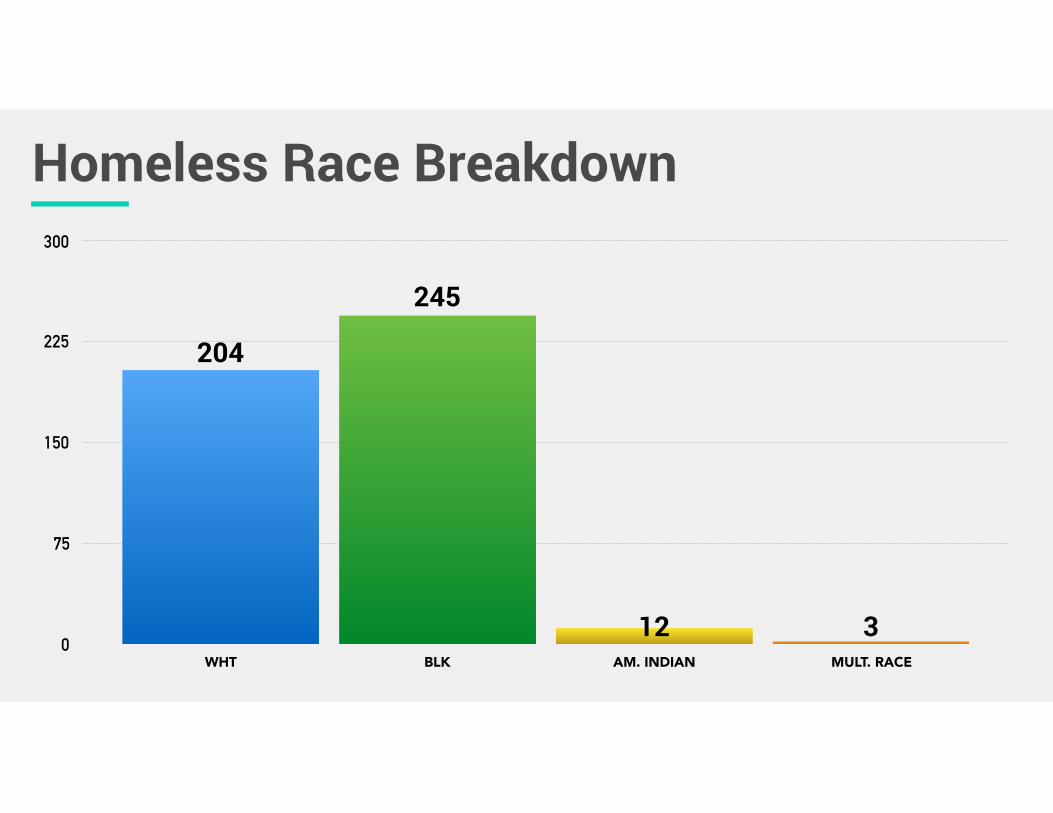
Homeless Race Breakdown
0
75
150
225
300
WHT BLK AM. INDIAN MULT. RACE
312
245
204

Living Situations
35%
22%
43%Emergency ShelterTransitional HousingUnsheltered
246 299
152
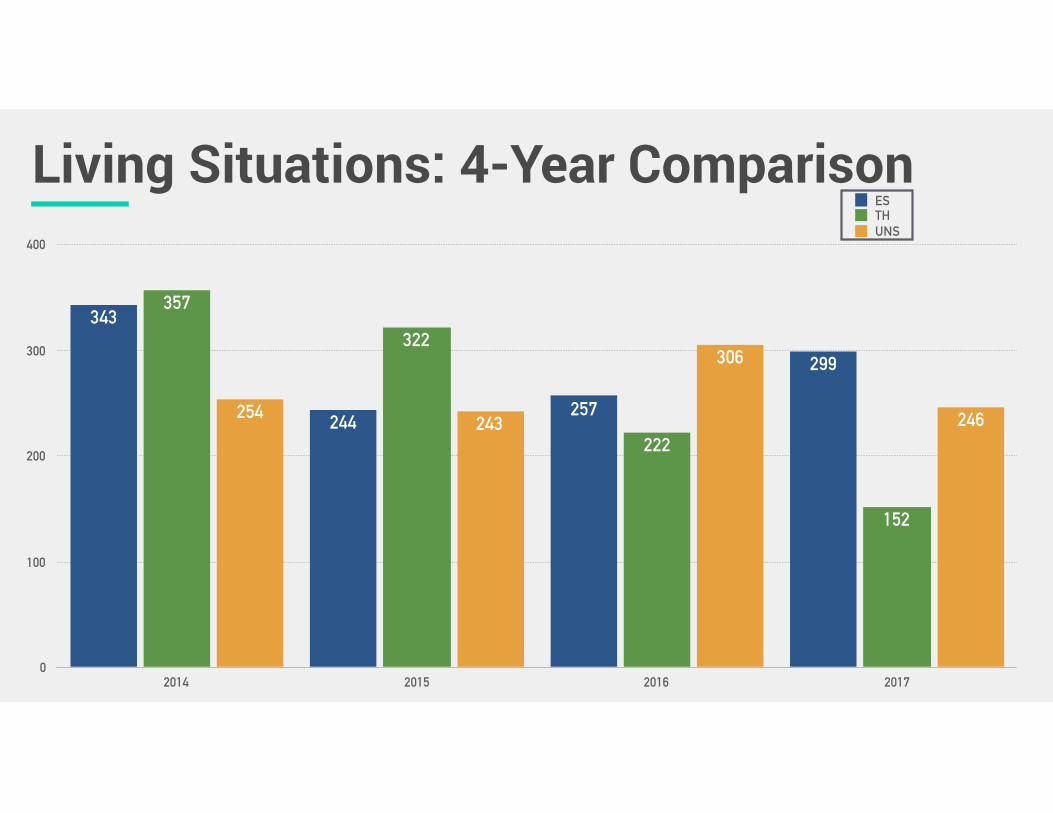
Living Situations: 4-Year Comparison
0
100
200
300
400
2014 2015 2016 2017
246
306
243254
152
222
322
357
299
257244
343
ESTHUNS
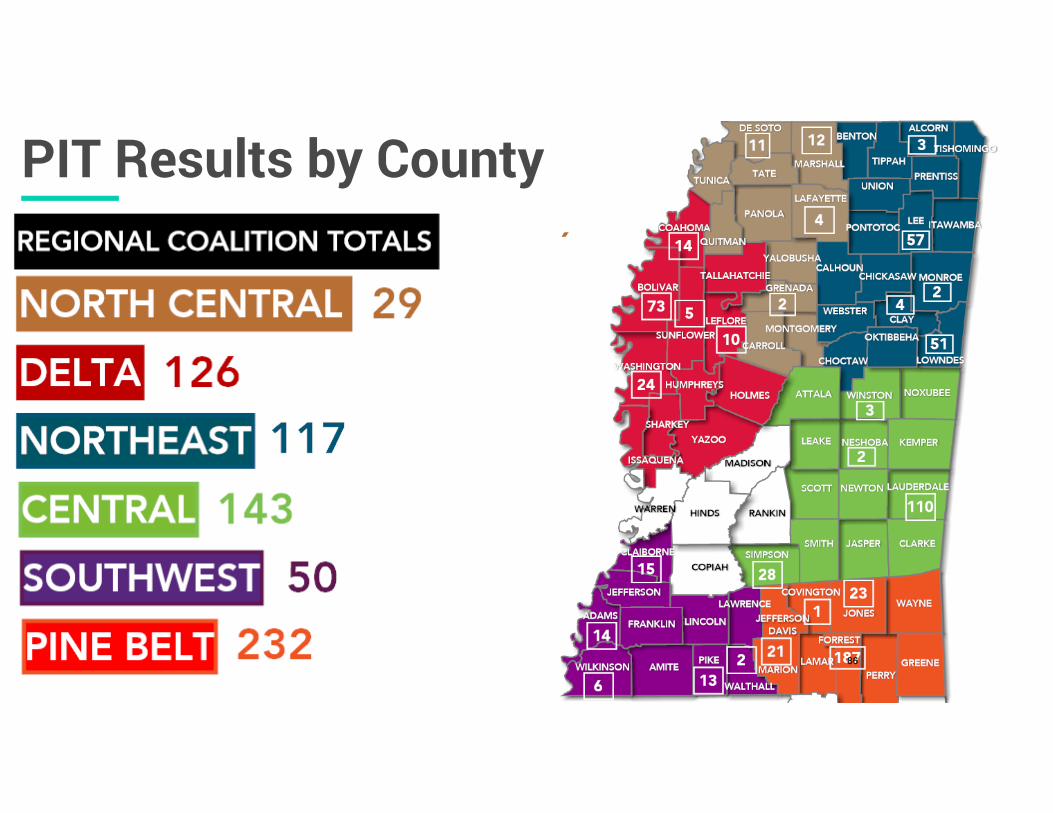
86
PIT Results by County

Top 5 Homeless-Populated Cities (BoS)
5
4
3
2
1 Hattiesburg - 187
Meridian - 110
Cleveland - 73
Tupelo - 57
Columbus - 51

Gender Breakdown
279FEMALE
417MALE

Households & PersonsSHELTERED
TOTALES TH UNS
TOTAL NO. OF HOUSEHOLDS 192 114 202 508
TOTAL NO. OF PERSONS 299 152 246 697
NO. OF CHILDREN (AGE < 18) 92 37 25 154
NO. OF PERSONS (AGES 18 TO 24) 23 7 21 51
NO. OF PERSONS (AGE > 24) 184 108 200 492

Households w/ at Least 1 Adult & 1 ChildSHELTERED
TOTALES TH UNS
TOTAL NO. OF HOUSEHOLDS 36 17 13 66
TOTAL NO. OF PERSONS 136 55 41 232
NO. OF CHILDREN (AGE < 18) 92 36 25 153
NO. OF PERSONS (AGES 18 TO 24) 6 3 8 17
NO. OF PERSONS (AGE > 24) 38 16 8 62

Households w/ Only ChildrenSHELTERED
TOTALES TH UNS
TOTAL NO. OF HOUSEHOLDS 0 1 0 1
TOTAL NO. OF CHILDREN (AGE < 18) 0 1 0 1

Households without ChildrenSHELTERED
TOTALES TH UNS
TOTAL NO. OF HOUSEHOLDS 156 96 189 441
TOTAL NO. OF PERSONS (ADULTS) 163 96 205 464
NO. OF PERSONS (AGES 18-24) 17 4 13 34
NO. OF PERSONS (AGE > 24) 146 92 192 430

Age Breakdown
AGE < 18 AGES 18-24 AGES > 24 TOTAL
SHELTERED 129 30 292 451
UNSHELTERED 25 21 200 246
TOTAL 154 51 492 697

Homeless Subpopulationsfor the 2017 Point-In-Time Count

Adults with Serious Mental Illness
SHELTERED 20UNSHELTERED 23
43TOTAL
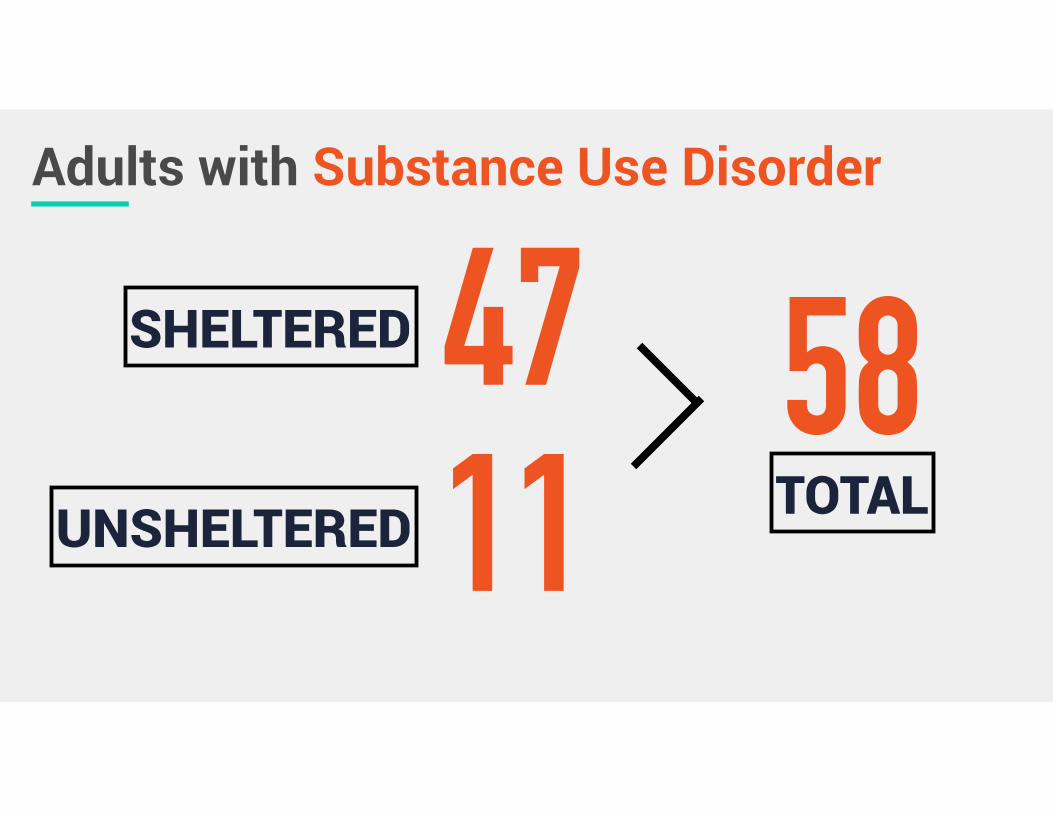
Adults with Substance Use Disorder
SHELTERED 47UNSHELTERED 11
58TOTAL
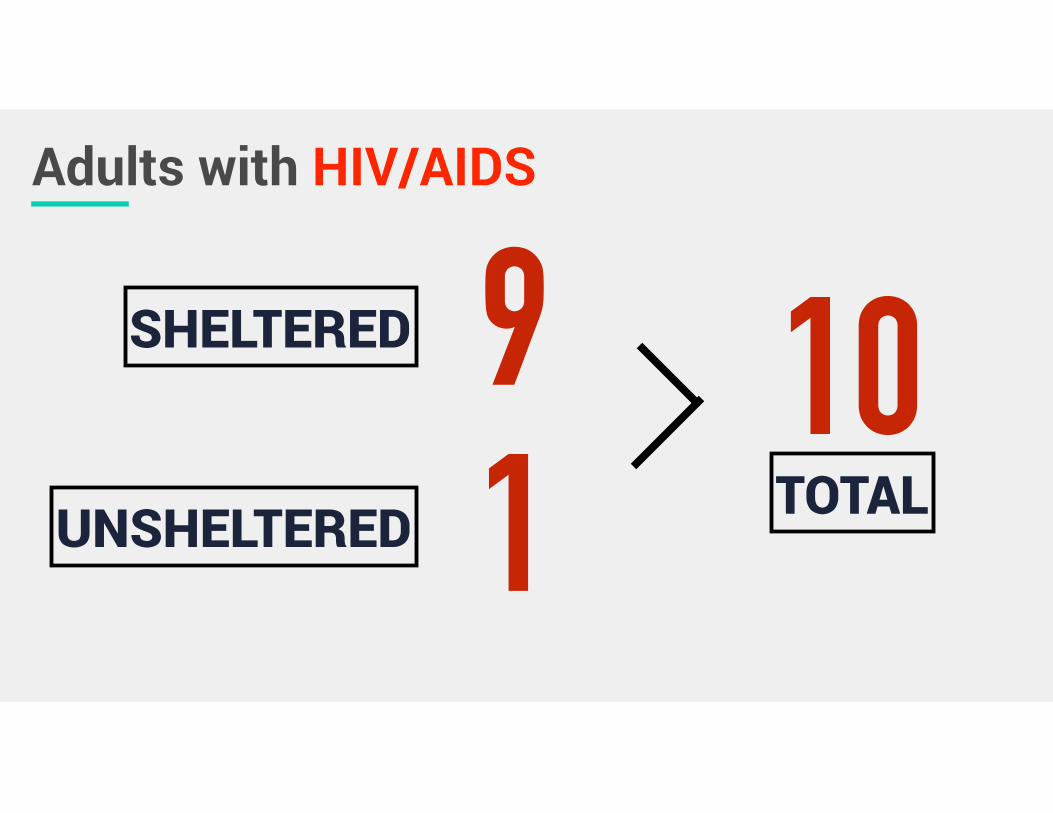
Adults with HIV/AIDS
SHELTERED 9UNSHELTERED 1
10TOTAL
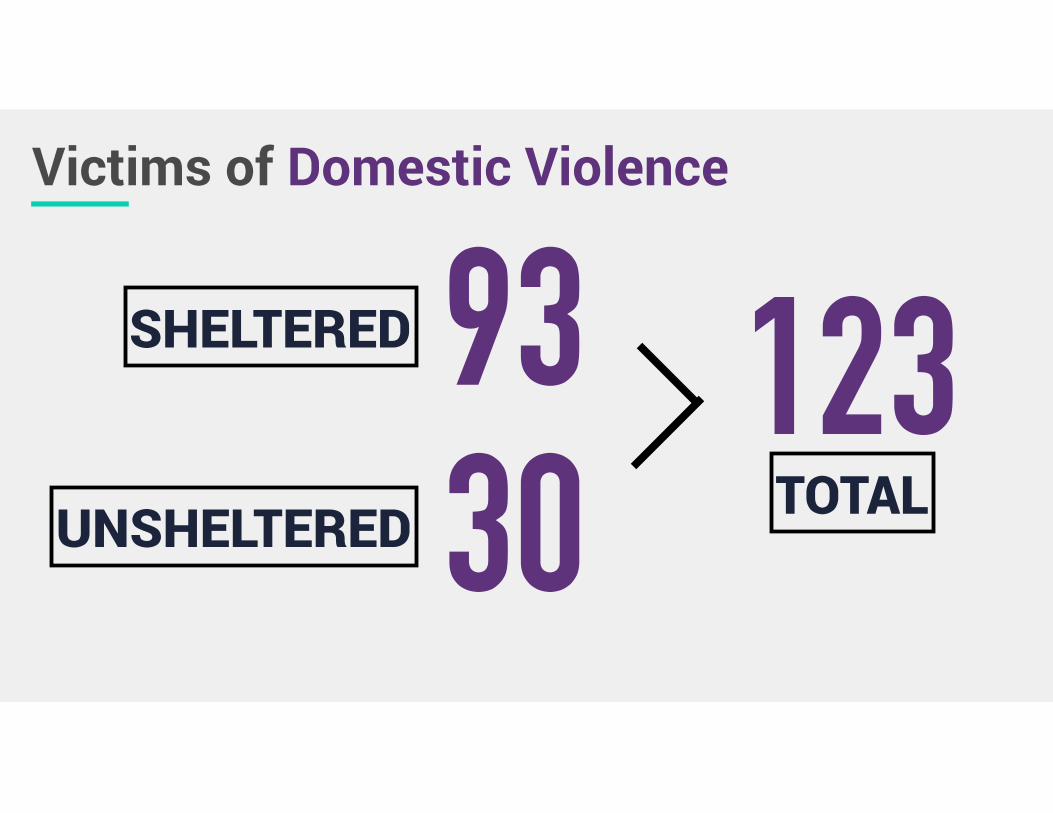
Victims of Domestic Violence
SHELTERED 93UNSHELTERED 30
123TOTAL
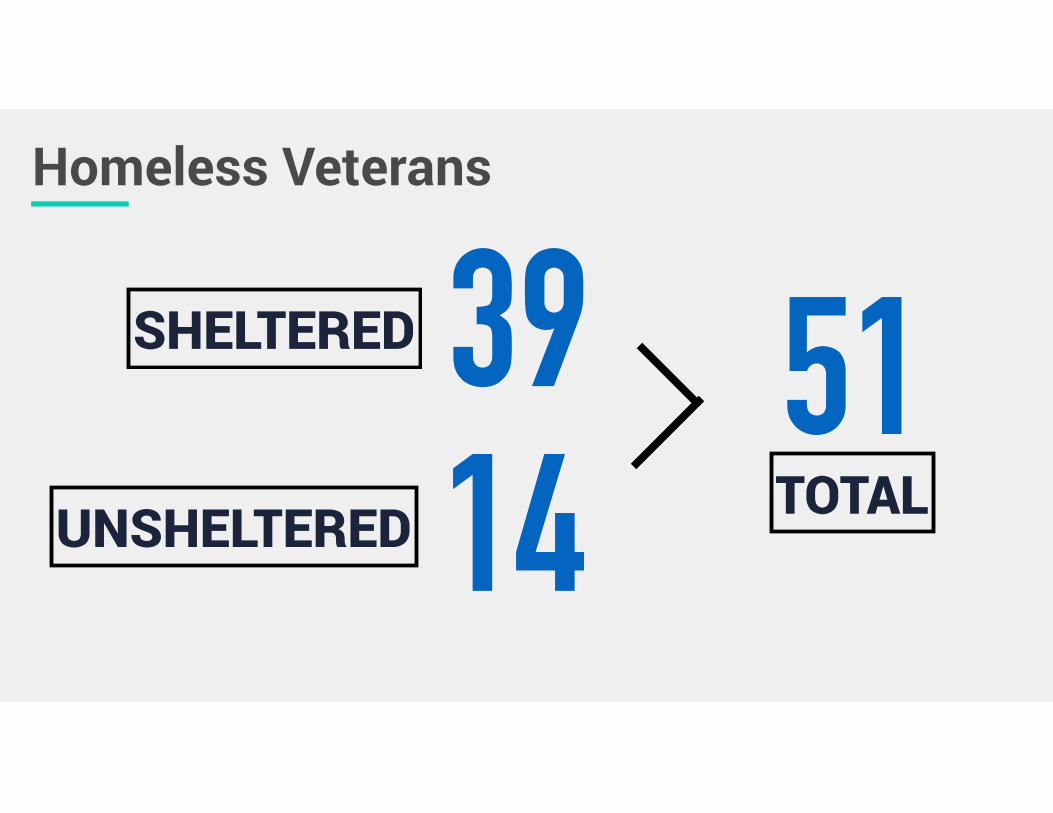
Homeless Veterans
SHELTERED 39UNSHELTERED 14
51TOTAL

Homeless Veterans
MALES 45FEMALES14
51TOTAL
CHRONIC HOMELESS = 3
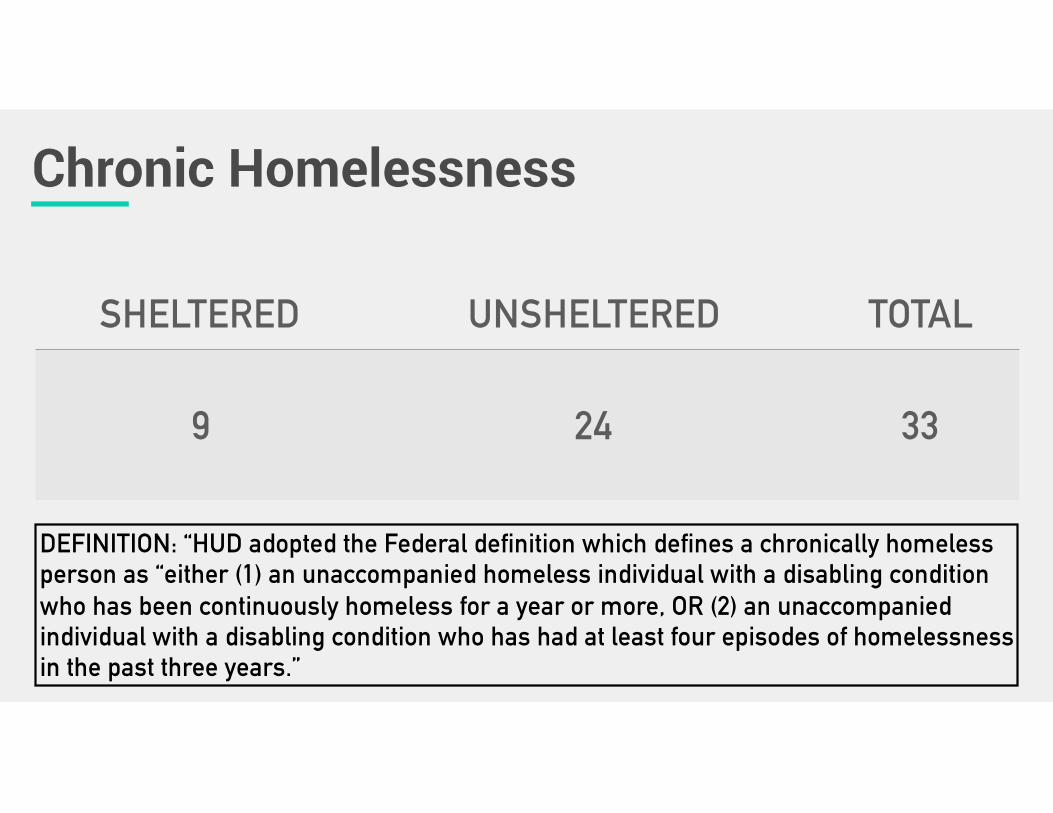
Chronic Homelessness
SHELTERED UNSHELTERED TOTAL
9 24 33
DEFINITION: “HUD adopted the Federal definition which defines a chronically homeless person as “either (1) an unaccompanied homeless individual with a disabling condition who has been continuously homeless for a year or more, OR (2) an unaccompanied individual with a disabling condition who has had at least four episodes of homelessness in the past three years.”

VI-SPDATsThe VI-SPDAT is a "super-tool" that combines the strengths of two widely used existing assessments (developed by OrgCode Consulting’s Ian DeJong):
• The Vulnerability Index (VI) is a street outreach tool currently in use in more than 100 communities. Rooted in leading medical research, the VI helps determine the chronicity and medical vulnerability of homeless individuals.
• The Service Prioritization Decision Assistance Tool (SPDAT) is an evidence-informed approach to assessing an individual's or family's acuity. The tool, across multiple components, prioritizes who to serve next and why, while concurrently identifying the areas in the person/family's life where support is most likely necessary in order to avoid housing instability.
NOTES: •AVERAGE VI-SPDAT SCORE: 5 (QUALIFIES FOR RAPID REHOUSING (RRH)

VI-SPDAT Statistics
•# x’s visiting the emergency room = 2-visit average
•# x’s interacting w/ the police = 2 interactions on average
Risks•…Do Risky Things…? 17% answered ‘YES’
•35% of participants have some form of income
Socialization & Daily Functions
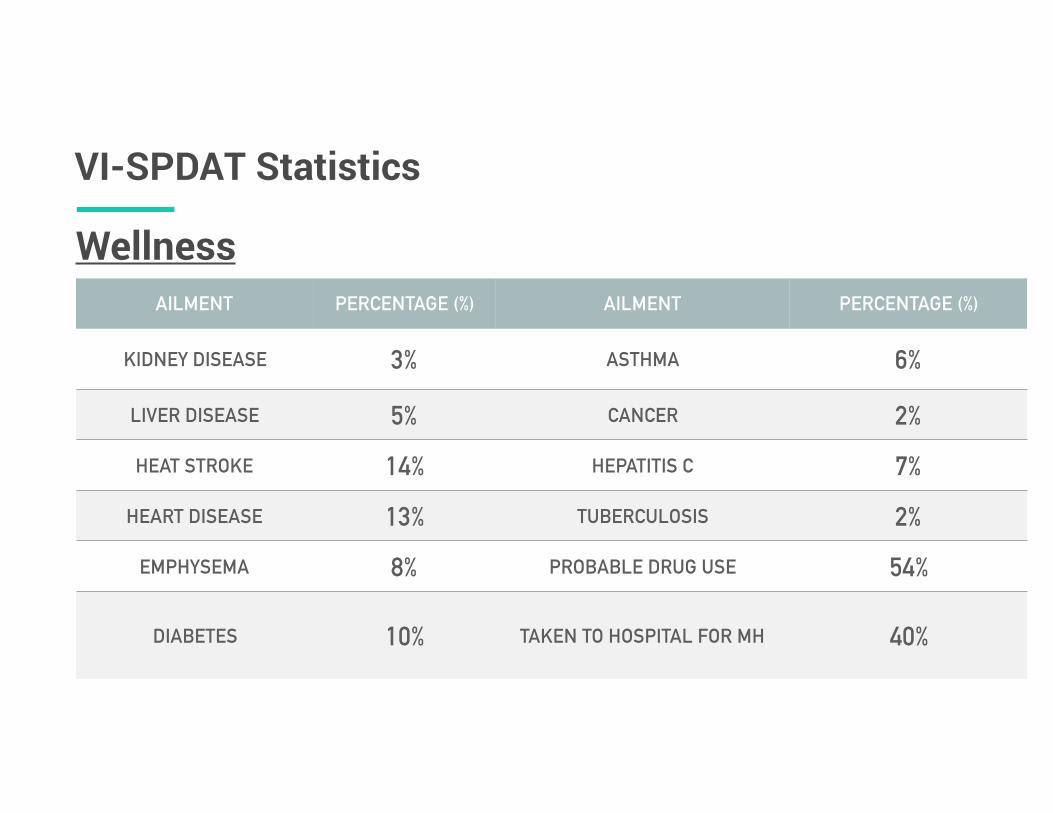
VI-SPDAT Statistics
WellnessAILMENT PERCENTAGE (%) AILMENT PERCENTAGE (%)
KIDNEY DISEASE 3% ASTHMA 6%
LIVER DISEASE 5% CANCER 2%
HEAT STROKE 14% HEPATITIS C 7%
HEART DISEASE 13% TUBERCULOSIS 2%
EMPHYSEMA 8% PROBABLE DRUG USE 54%
DIABETES 10% TAKEN TO HOSPITAL FOR MH 40%

Central Mississippi Data for the 2017 Point-In-Time Count

106
511PERSONS COUNTED
=231
SHELTERED
UNSHELTERED
280
2017 PIT Count: Central MS CoC

Homeless Race Breakdown: Central MS
0
100
200
300
400
WHT BLK MULT. RACE
3
330
178
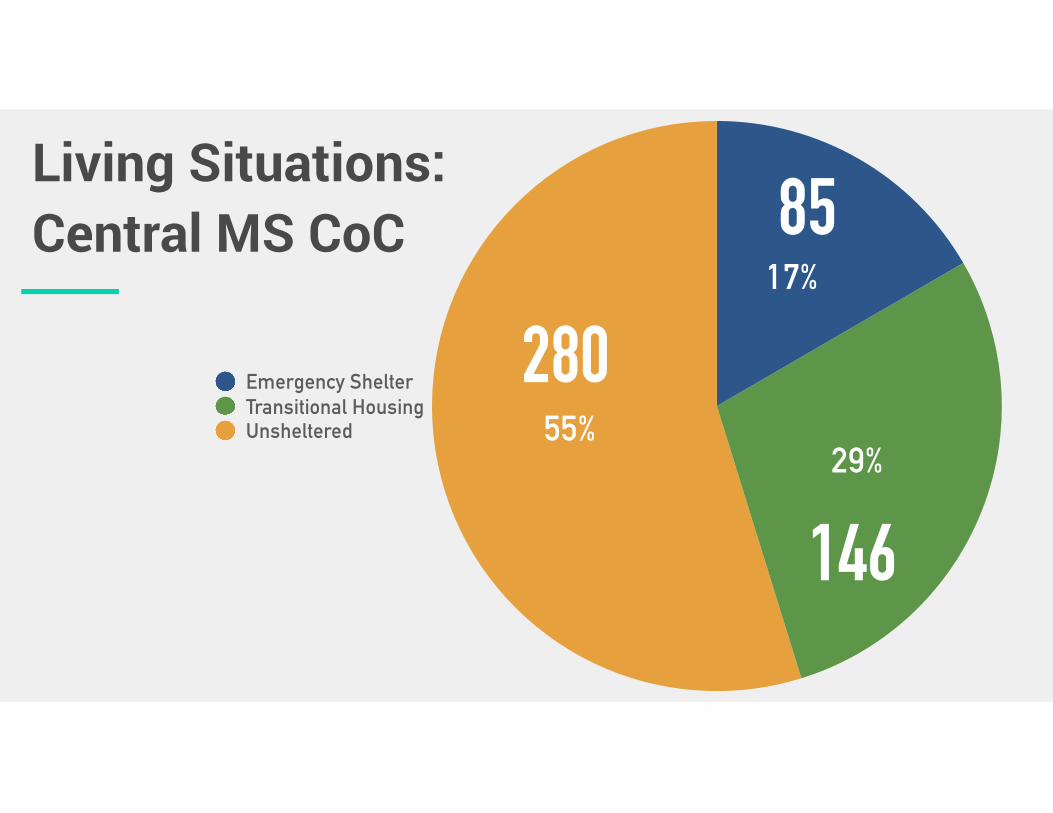
Living Situations: Central MS CoC
55%29%
17%
Emergency ShelterTransitional HousingUnsheltered
280
85
146
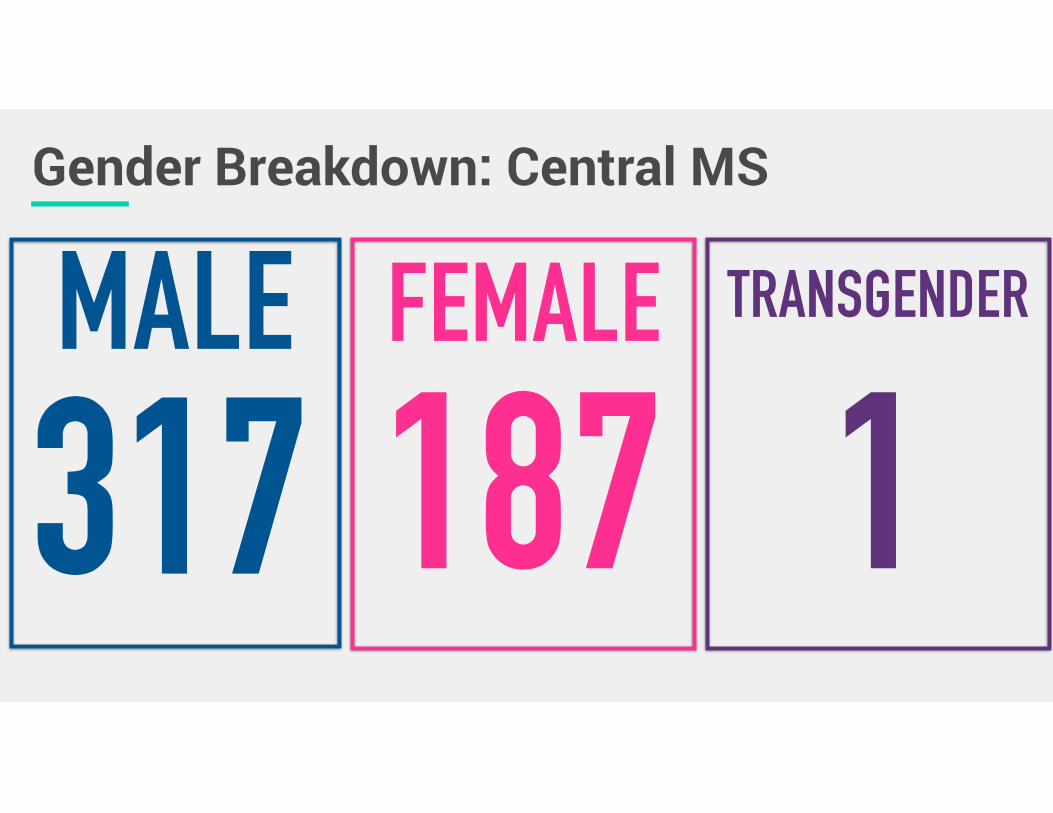
Gender Breakdown: Central MS
187FEMALE
317MALE
1TRANSGENDER
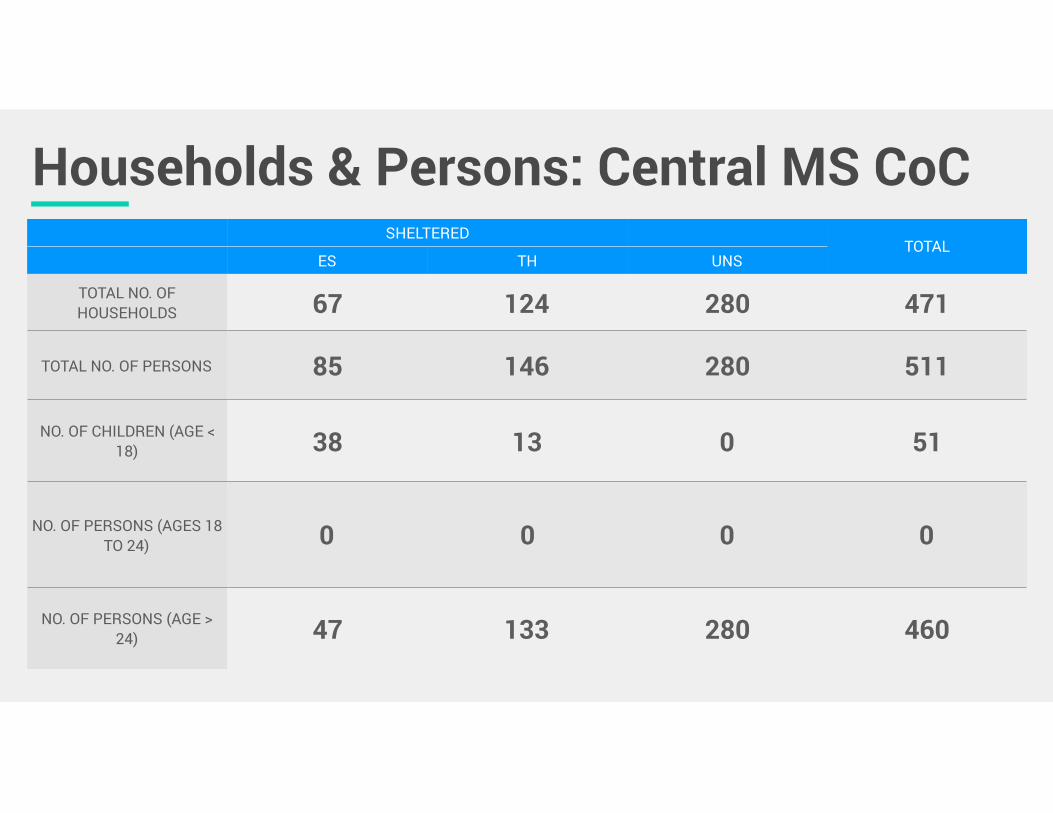
Households & Persons: Central MS CoCSHELTERED
TOTALES TH UNS
TOTAL NO. OF HOUSEHOLDS 67 124 280 471
TOTAL NO. OF PERSONS 85 146 280 511
NO. OF CHILDREN (AGE < 18) 38 13 0 51
NO. OF PERSONS (AGES 18 TO 24) 0 0 0 0
NO. OF PERSONS (AGE > 24) 47 133 280 460
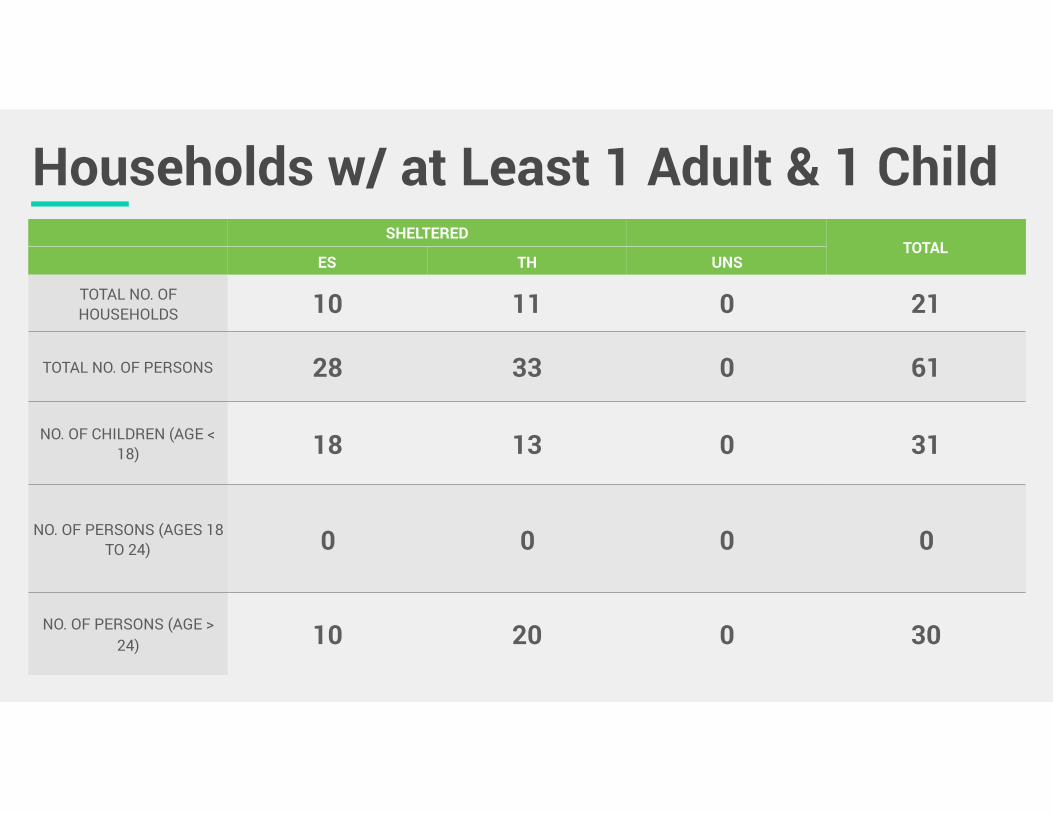
Households w/ at Least 1 Adult & 1 ChildSHELTERED
TOTALES TH UNS
TOTAL NO. OF HOUSEHOLDS 10 11 0 21
TOTAL NO. OF PERSONS 28 33 0 61
NO. OF CHILDREN (AGE < 18) 18 13 0 31
NO. OF PERSONS (AGES 18 TO 24) 0 0 0 0
NO. OF PERSONS (AGE > 24) 10 20 0 30

Households w/ Only ChildrenSHELTERED
TOTALES TH UNS
TOTAL NO. OF HOUSEHOLDS 20 0 0 20
TOTAL NO. OF CHILDREN (AGE < 18) 20 0 0 20
Households without ChildrenSHELTERED
TOTALES TH UNS
TOTAL NO. OF HOUSEHOLDS 37 113 280 430
TOTAL NO. OF PERSONS (ADULTS) 37 113 280 430
NO. OF PERSONS (AGES 18-24) 0 0 0 0
NO. OF PERSONS (AGE > 24) 37 113 280 430

Age Breakdown: Central MS CoC
AGE < 18 AGES 18-24 AGES > 24 TOTAL
SHELTERED 51 0 180 231
UNSHELTERED 0 0 280 280
TOTAL 51 0 460 511
MS Gulf Coast Data for the 2017 Point-In-Time Count

116
264PERSONS COUNTED
=71
SHELTERED
UNSHELTERED
193
2017 PIT Count: MS Gulf Coast

Homeless Race Breakdown: MS Gulf Coast
0
45
90
135
180
WHT BLK ASIAN AMER. IND. MULT. RACE
11134
62
174
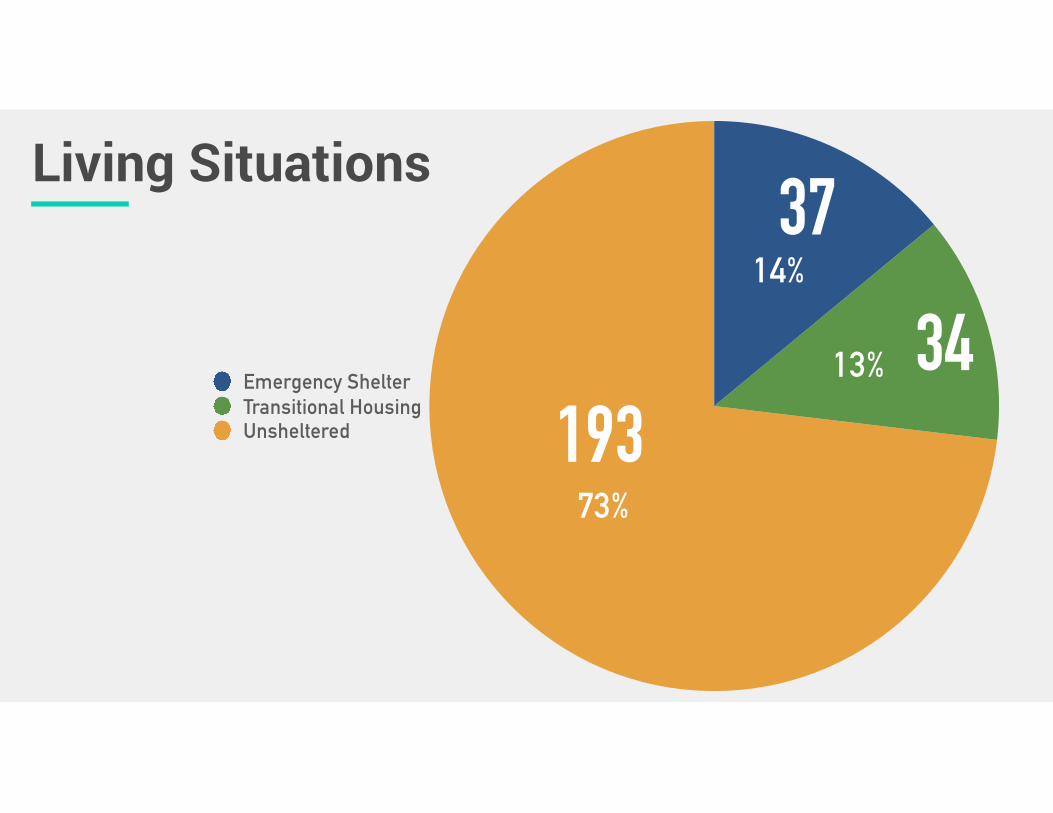
Living Situations
73%
13%
14%
Emergency ShelterTransitional HousingUnsheltered 193
37
34

Gender Breakdown: MS Gulf Coast
107FEMALE
157MALE

Households & Persons: MS Gulf CoastSHELTERED
TOTALES TH UNS
TOTAL NO. OF HOUSEHOLDS 28 10 171 209
TOTAL NO. OF PERSONS 37 34 193 264
NO. OF CHILDREN (AGE < 18) 9 19 19 47
NO. OF PERSONS (AGES 18 TO 24) 0 0 9 9
NO. OF PERSONS (AGE > 24) 28 15 165 208
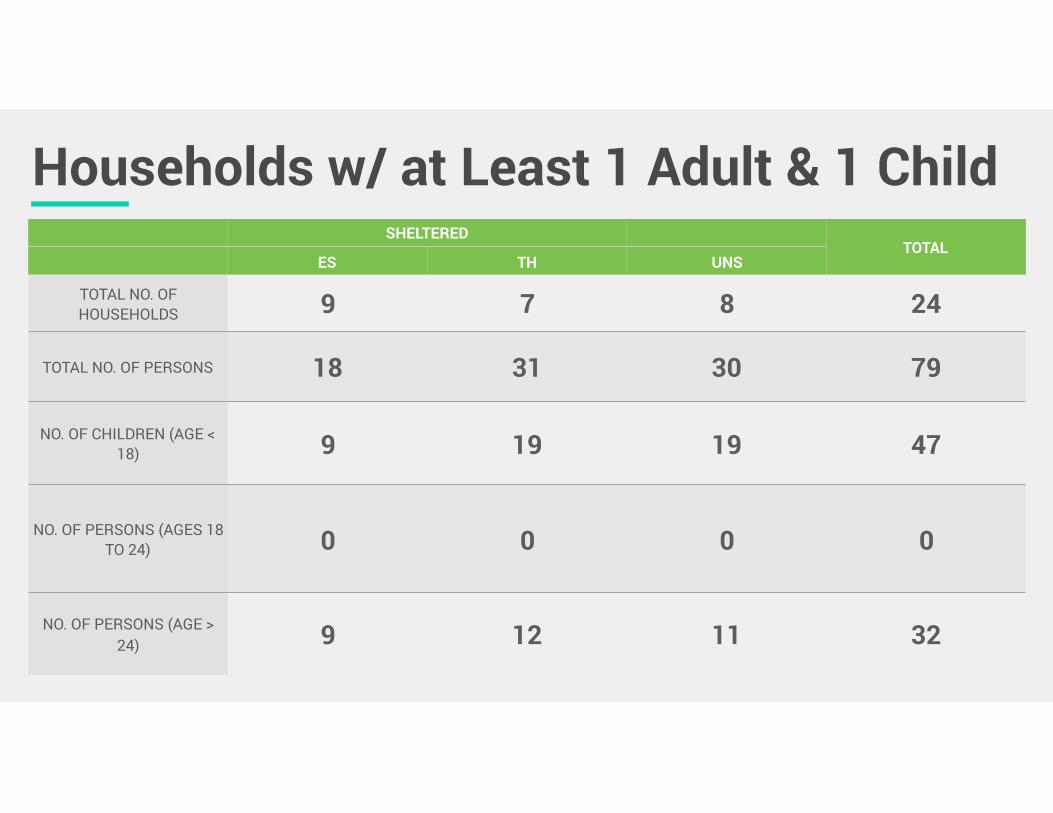
Households w/ at Least 1 Adult & 1 ChildSHELTERED
TOTALES TH UNS
TOTAL NO. OF HOUSEHOLDS 9 7 8 24
TOTAL NO. OF PERSONS 18 31 30 79
NO. OF CHILDREN (AGE < 18) 9 19 19 47
NO. OF PERSONS (AGES 18 TO 24) 0 0 0 0
NO. OF PERSONS (AGE > 24) 9 12 11 32

Households w/ Only ChildrenSHELTERED
TOTALES TH UNS
TOTAL NO. OF HOUSEHOLDS 0 0 0 0
TOTAL NO. OF CHILDREN (AGE < 18) 0 0 0 0

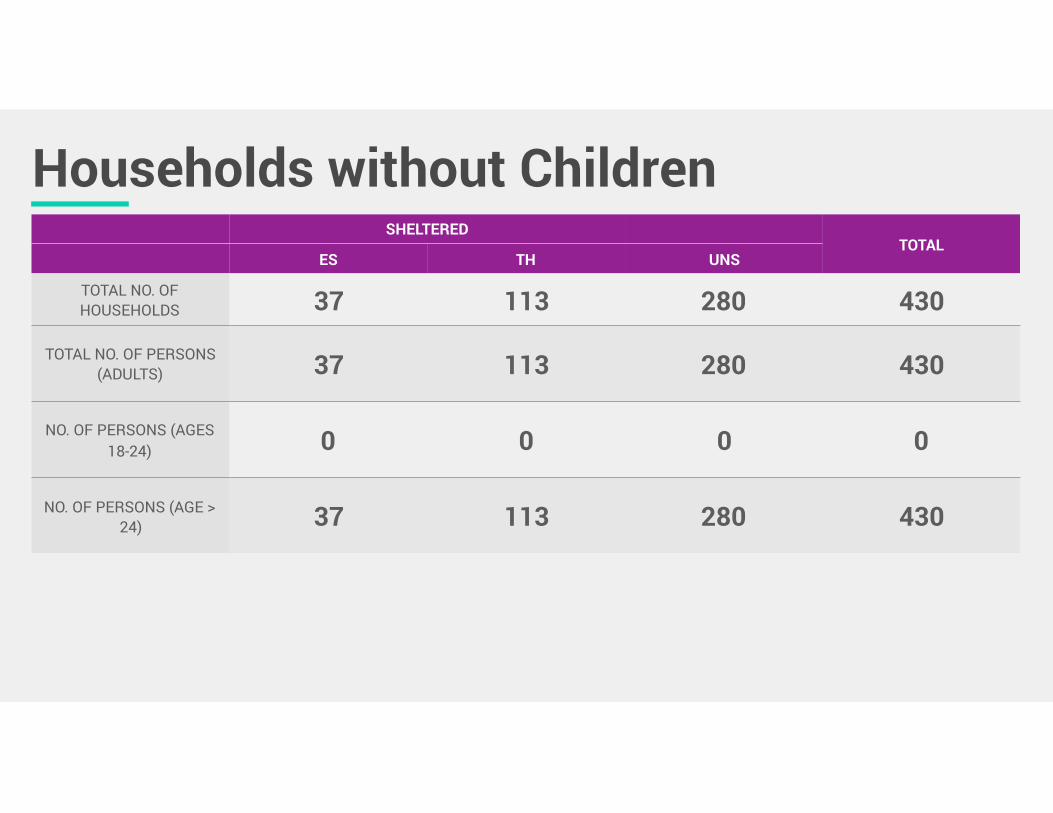
Households without ChildrenSHELTERED
TOTALES TH UNS
TOTAL NO. OF HOUSEHOLDS 19 3 163 185
TOTAL NO. OF PERSONS (ADULTS) 19 3 163 185
NO. OF PERSONS (AGES 18-24) 0 0 9 9
NO. OF PERSONS (AGE > 24) 19 3 154 176
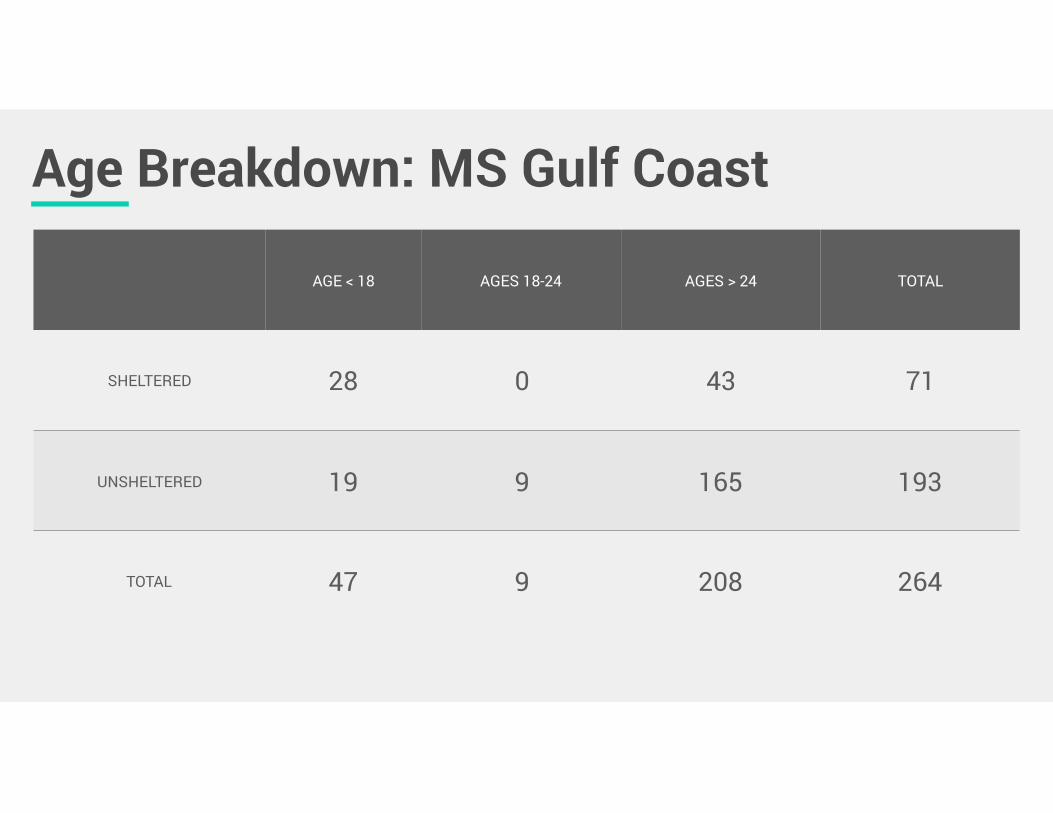
Age Breakdown: MS Gulf Coast
AGE < 18 AGES 18-24 AGES > 24 TOTAL
SHELTERED 28 0 43 71
UNSHELTERED 19 9 165 193
TOTAL 47 9 208 264
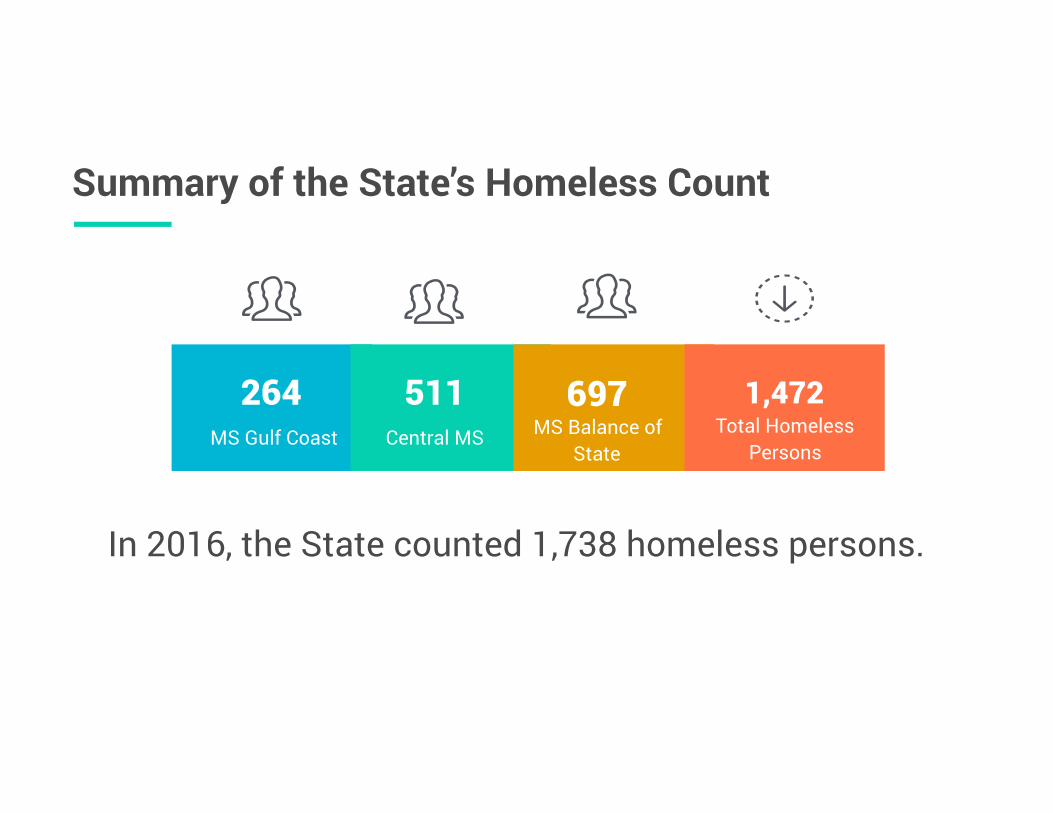
264Central MSMS Gulf Coast
511MS Balance of
State
697 1,472 Total Homeless
Persons
Summary of the State’s Homeless Count
In 2016, the State counted 1,738 homeless persons.

Do You Have Any Questions?