analyzing the impact of structure in handwriting ... · funded ink-12 project, ... tested a...
TRANSCRIPT
Analyzing the Impact of Structure in
Handwriting Recognition Software MASSAHUSETTS INTITUTE
by JUN 2 1 2011
Neil E. Chao LIBRARIESB.S., Massachusetts Institute of Technology (2010)
ARCHNVES
Submitted to the Department of Electrical Engineering and Computer Science
in Partial Fulfillment of the Requirements for the Degree of Master of Engineering in
Electrical Engineering and Computer Science at the Massachusetts Institute of
Technology
May 2011
Copyright 2011 Massachusetts Institute of Technology All rights reserved.
The author hereby grants to M.I.T. permission to reproduce and
to distribute publicly paper and electronic copies of this thesis document in whole and in
part in any medium now known or hereafter created.
Author .
Department of Electrical Engineering and Computer Science
Certified by
Kimberle Koile, Ph.D.
Research Scientist, MIT CECI
Thesis Supervisor
May 20, 2011
Accepted by
Dr. Christopher J. Terman
Chairman, Masters of Engineering Thesis Committee
Analyzing the Impact of Structure in
Handwriting Recognition Software
by
Neil E. Chao
Submitted to the Department of Electrical Engineering and Computer Science
May 20, 2011
in Partial Fulfillment of the Requirements for the Degree of
Master of Engineering in Electrical Engineering and Computer Science
ABSTRACT
Handwriting recognition for text and numbers has existed for Tablet PCs andspecialty devices for almost a decade. The use of such software in a classroom canshorten the latency between answers to exercises and teacher feedback. While text andnumber inputs have already been well explored, graphical examples and math problemsare a relatively new territory for recognition software. Under the guidance of the NSF-funded INK-12 Project, I explored the impact of structure on the ability of Ink-AnalysisHandwriting Recognition to understand students' solutions math and science exercises,hoping to find the ideal balance between accurate grading and minimal human effort. Itested a prototype system aimed at supporinting "virtual-teacher-guided" learning inelementary school classrooms in the Greater Boston area.
Thesis Supervisor: Kimberle Koile, Ph. D.
Title: Research Scientist, MIT CECI
Contents
1 Introduction 17
2 Previous Work 20
2.1 INK12 20
2.2 Existing Technology 21
2.3 Related Research 22
3 Research of Existing Handwriting Recognition Technology 25
3.1 Microsoft Tablet SDK 25
3.2 Ink Stroke Representation and Saving Ink 26
4. The Recognition Grid 27
5. Handwriting Diagnostic and Curriculum Analysis 28
5.1 Math and Science Curriculum in the CLP Notebooks 28
5.2 The Handwriting Diagnostic Program and Exercises 30
6. Results of the Handwriting Diagnostic 53
6.1 Structure in Fraction Coloring Problems 54
6.2 Results of Detecting Table Entries 65
6.3 Detecting the Number Grid Solutions 72
6.4 The Effects of Structure in Graph Recognition 78
7. Conclusion and Future Works 89
7.1 The Impact of Structure 89
7.2 Algorithm Changes to Improve Detection 90
7.3 Quantifying Structure's Impact on Student Accuracy 92

7.4 Future Work 93
7.5 Contribution 94
Bibliography 95
Appendix A. Test Applications to Explore the Technology 97
Appendix B. Design Choices in the Recognition Grid 104
Appendix C. The Authoring Tool 125
List of Figures
Figure 1-1: An example of a student solution that is difficult to interpret. A teacher can
easily understand that the lines from the x and y-axis are a student's way of measuring
from the tick marks so that his or her points are accurate. A computer may not expect this
behavior and thus might misinterpret the lines as foreign artifacts.
Figure 5-1: A fraction coloring problem with a faded grid on the interior. The interior
grid helps students measure out 1/3 of the shape and is expected to increase student
accuracy in solving the problem.
Figure 5-2: A fraction coloring problem without the interior grid but with the outer
boundary. Students will have to measure out of this shape on their own, either by
drawing their own interior grid or by eyeballing the outer shape.
Figure 5-3: A fraction coloring problem without the interior grid or the outer boundary.
Students must provide the shape and then color in /4 of it. This difficult for the
Recognition Grid to do because it must distinguish between Ink Strokes that are meant to
represent the edges of the shape and Ink Strokes that are meant to color in the shape.
Figure 5-4: A fraction coloring problem with a non-traditional shape. This problem tests
the Authoring Tool's ability create unique shapes for students to work on, proving that
we are not limited to basic squares and rectangles for our problems. To create this, we
used the Snapping Strokes method in the Authoring Tool.
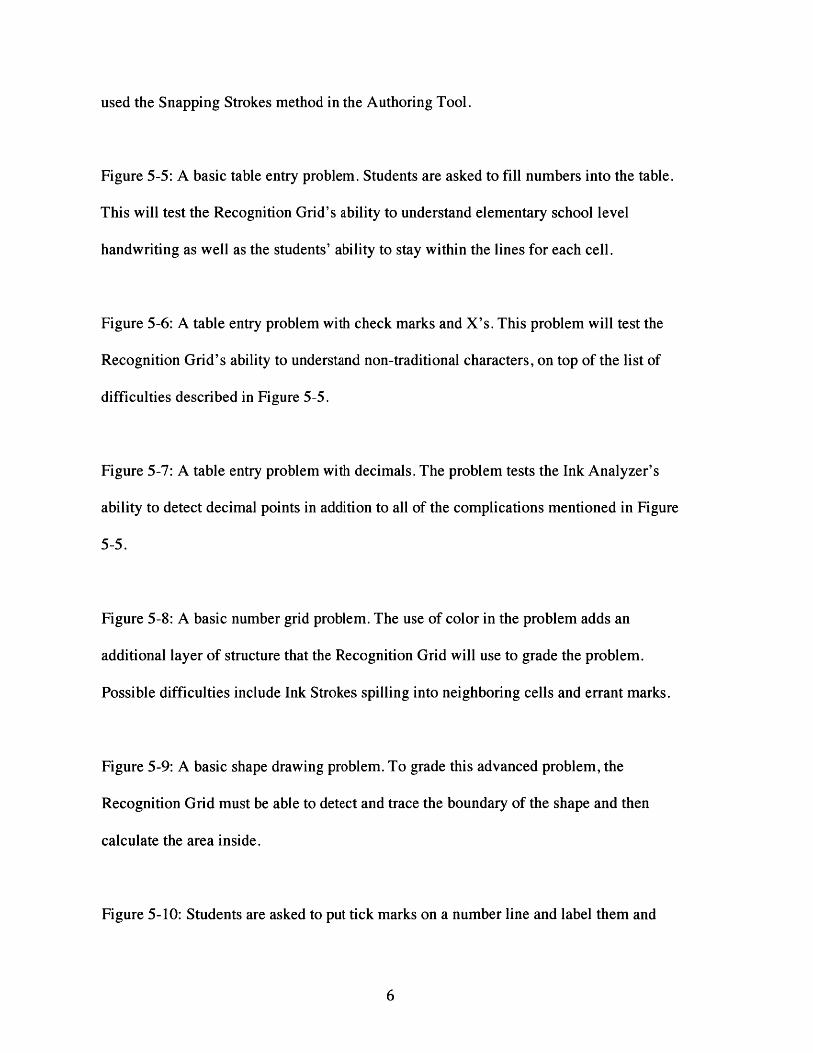
Figure 5-5: A basic table entry problem. Students are asked to fill numbers into the table.
This will test the Recognition Grid's ability to understand elementary school level
handwriting as well as the students' ability to stay within the lines for each cell.
Figure 5-6: A table entry problem with check marks and X's. This problem will test the
Recognition Grid's ability to understand non-traditional characters, on top of the list of
difficulties described in Figure 5-5.
Figure 5-7: A table entry problem with decimals. The problem tests the Ink Analyzer's
ability to detect decimal points in addition to all of the complications mentioned in Figure
5-5.
Figure 5-8: A basic number
additional layer of structure
Possible difficulties include
grid problem. The use of color in the problem adds an
that the Recognition Grid will use to grade the problem.
Ink Strokes spilling into neighboring cells and errant marks.
Figure 5-9: A basic shape drawing problem. To grade this advanced problem, the
Recognition Grid must be able to detect and trace the boundary of the shape and then
calculate the area inside.
Figure 5-10: Students are asked to put tick marks on a number line and label them and
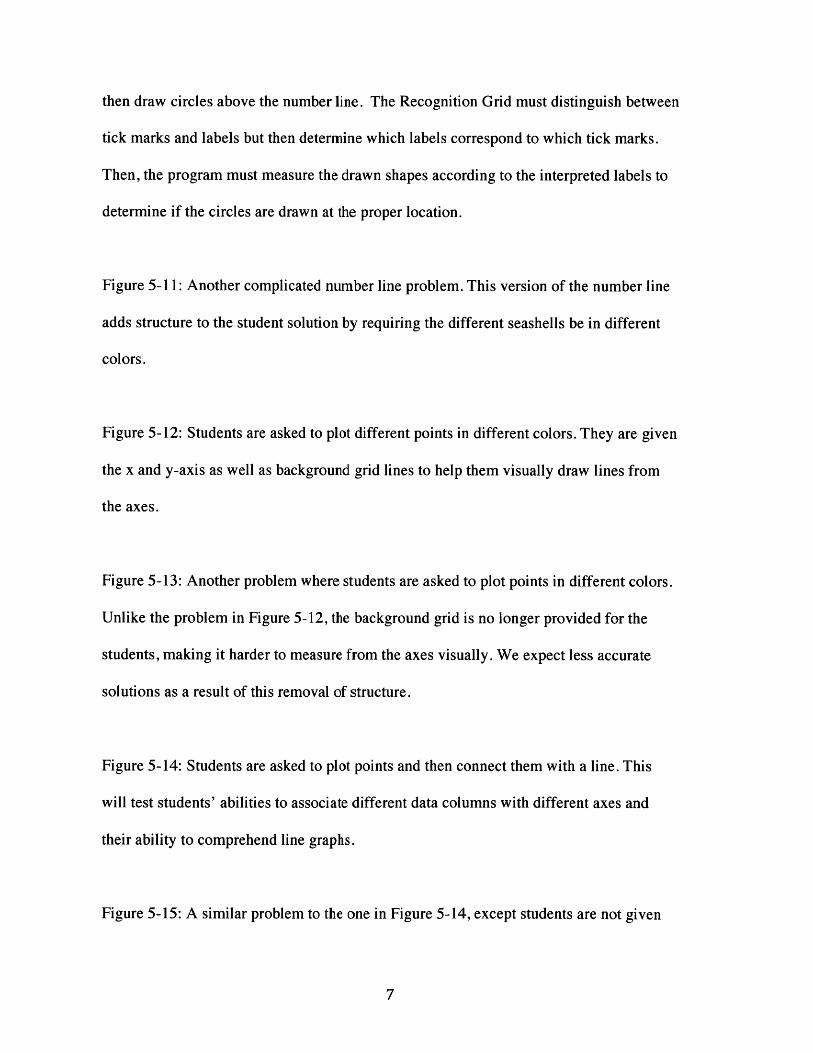
then draw circles above the number line. The Recognition Grid must distinguish between
tick marks and labels but then determine which labels correspond to which tick marks.
Then, the program must measure the drawn shapes according to the interpreted labels to
determine if the circles are drawn at the proper location.
Figure 5-11: Another complicated number line problem. This version of the number line
adds structure to the student solution by requiring the different seashells be in different
colors.
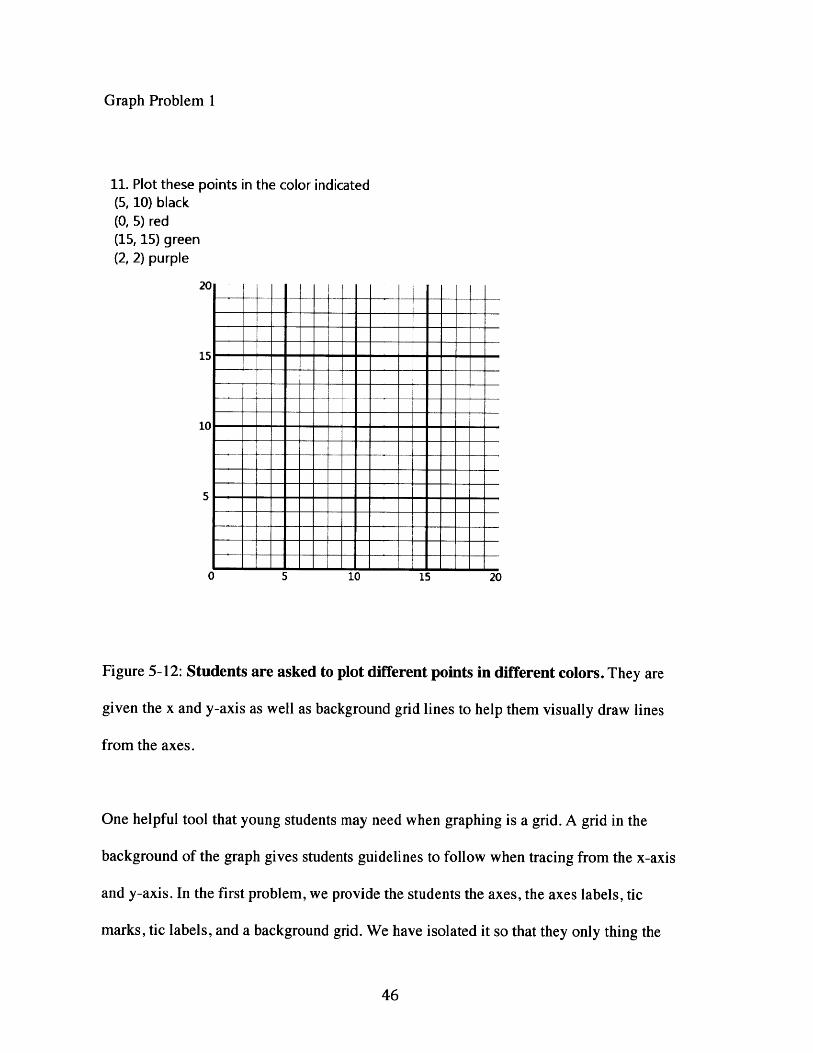
Figure 5-12: Students are asked to plot different points in different colors. They are given
the x and y-axis as well as background grid lines to help them visually draw lines from
the axes.
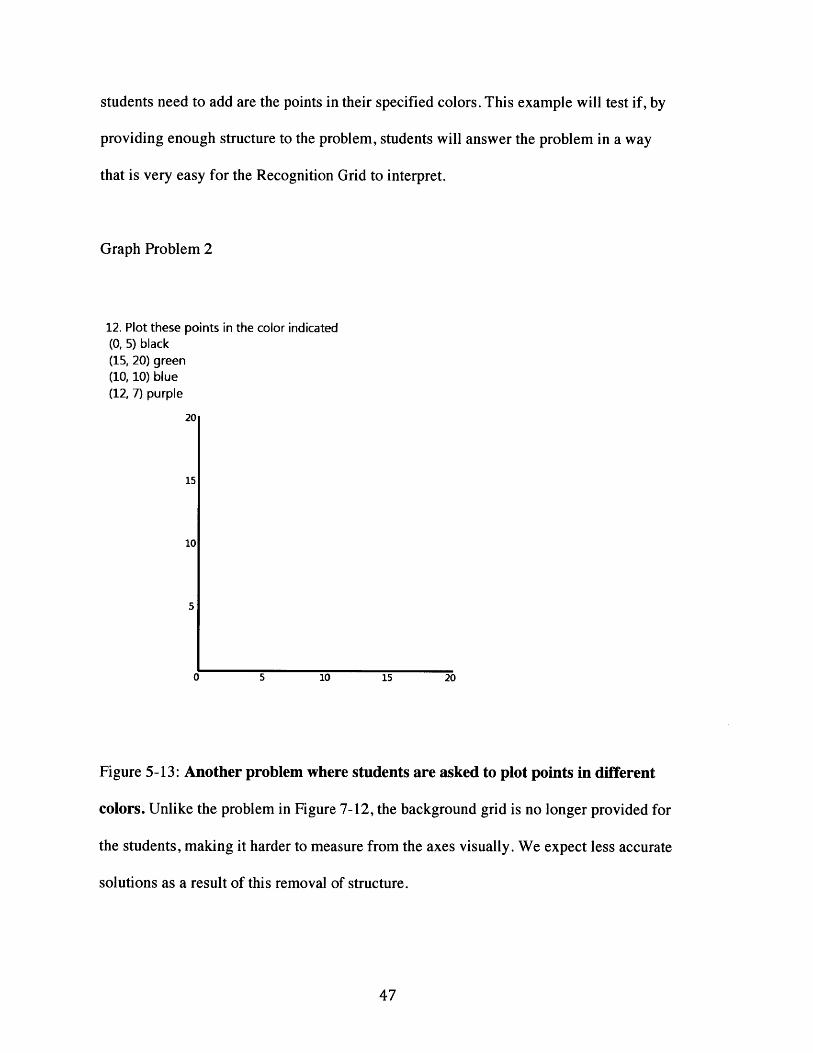
Figure 5-13: Another problem where students are asked to plot points in different colors.
Unlike the problem in Figure 5-12, the background grid is no longer provided for the
students, making it harder to measure from the axes visually. We expect less accurate
solutions as a result of this removal of structure.
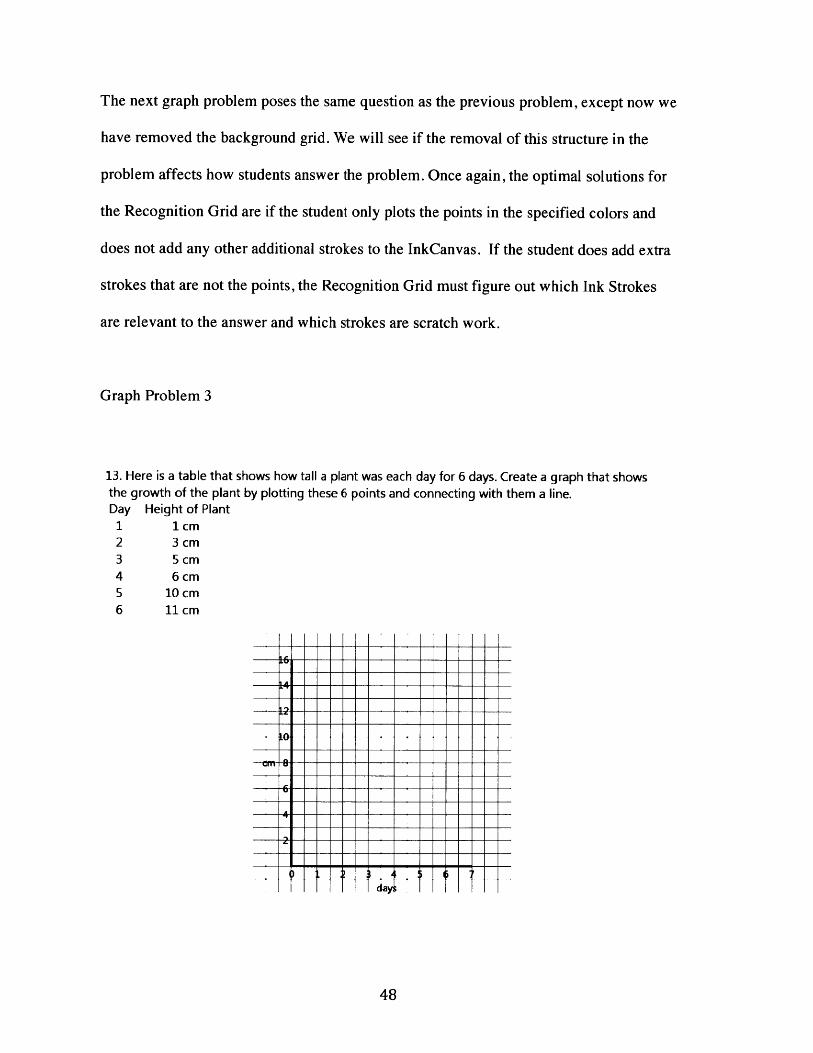
Figure 5-14: Students are asked to plot points and then connect them with a line. This
will test students' abilities to associate different data columns with different axes and
their ability to comprehend line graphs.
Figure 5-15: A similar problem to the one in Figure 5-14, except students are not given
the x or y-axis. This will test the Recognition Grid's ability to recognize the axes and
their labels and then determine the correctness of the line graph with respect to these
axes. This is extremely complicated and we will collect data so that a future version of
the Recognition Grid can eventually test its grading mechanism for this problem.
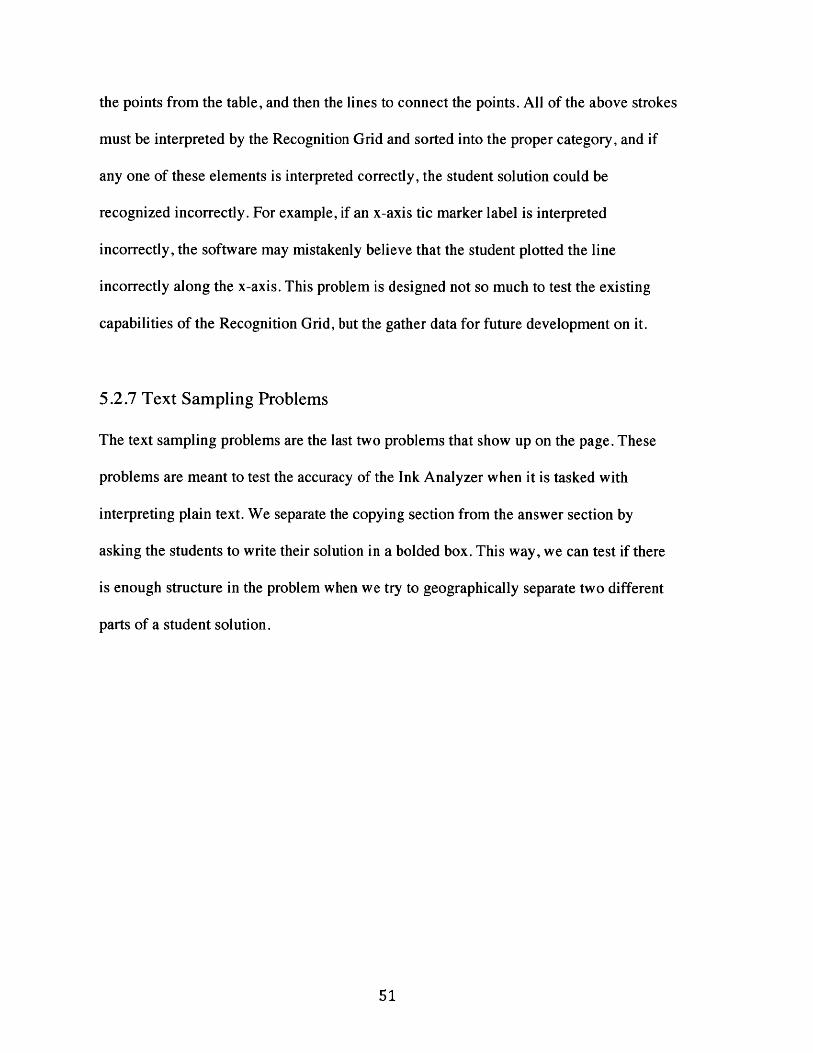
Figure 5-16: Students are asked to copy a piece of text and then give a one-word answer
in the box. Hopefully the students will keep their answers contained in the box.
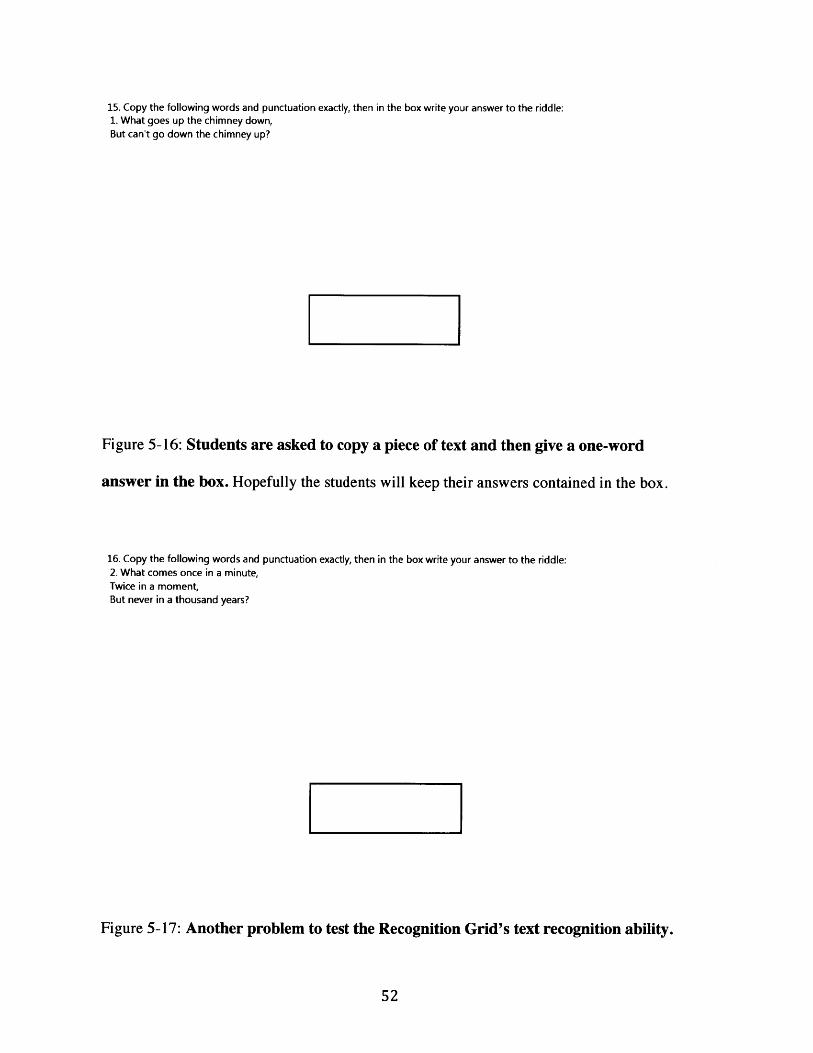
Figure 5-17: Another problem to test the Recognition Grid's text recognition ability.
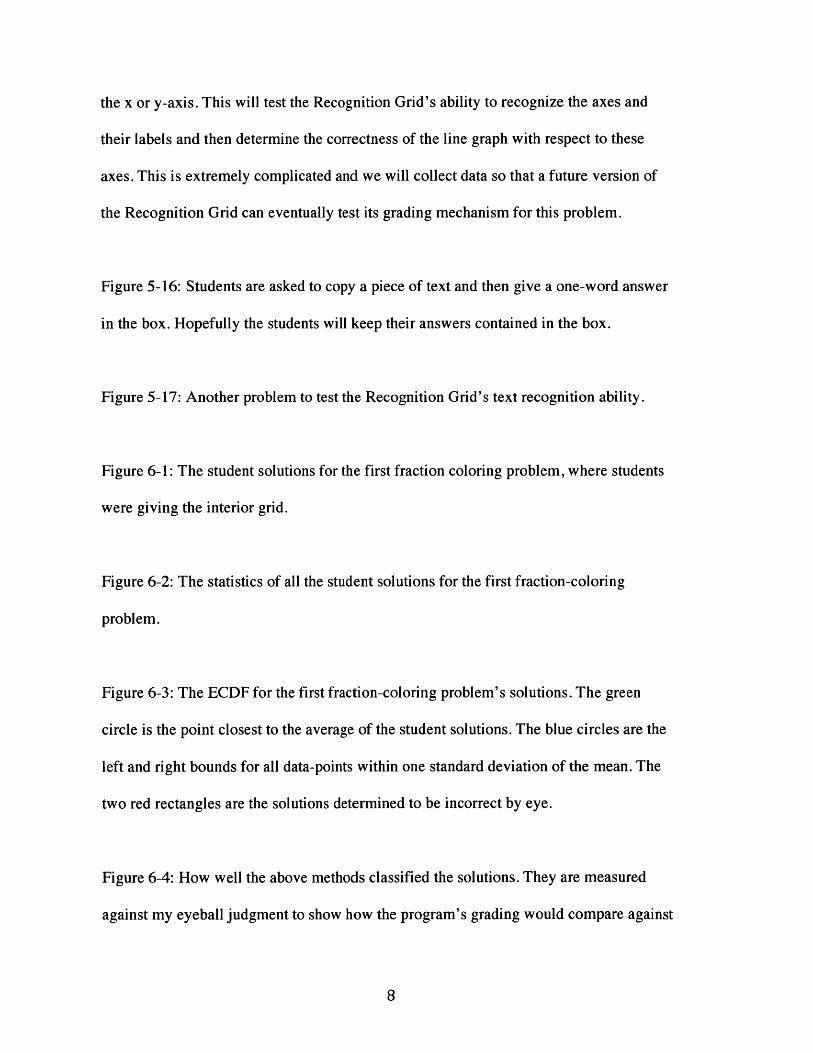
Figure 6-1: The student solutions for the first fraction coloring problem, where students
were giving the interior grid.
Figure 6-2: The statistics of all the student solutions for the first fraction-coloring
problem.
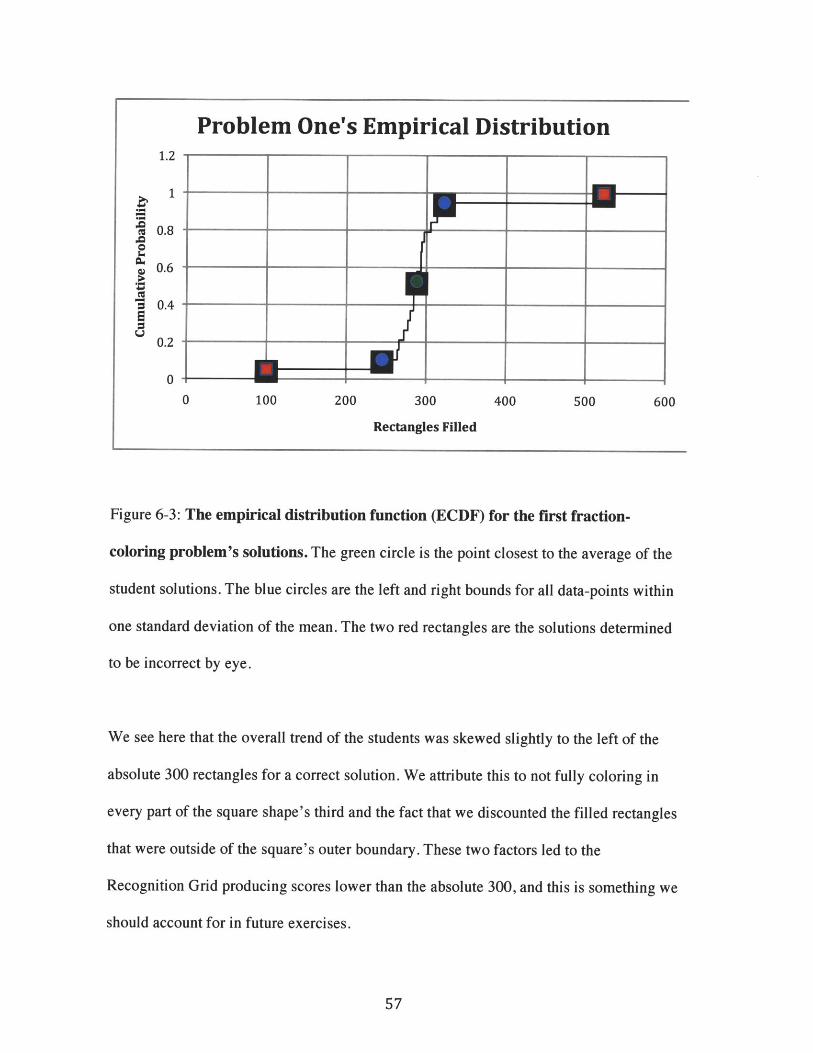
Figure 6-3: The ECDF for the first fraction-coloring problem's solutions. The green
circle is the point closest to the average of the student solutions. The blue circles are the
left and right bounds for all data-points within one standard deviation of the mean. The
two red rectangles are the solutions determined to be incorrect by eye.
Figure 6-4: How well the above methods classified the solutions. They are measured
against my eyeball judgment to show how the program's grading would compare against
human grading.
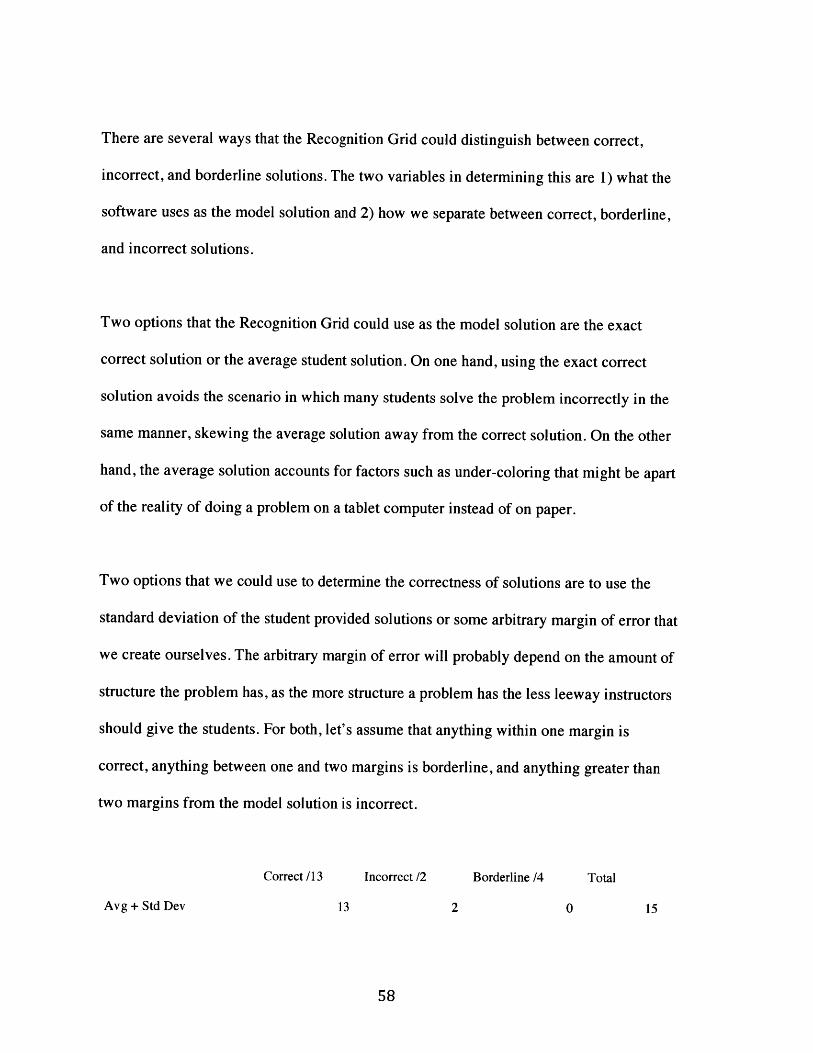
Figure 6-5: A visual representation of the method's effectiveness in grading the first
fraction-coloring problem. We see that for this problem, using the exact solution as the
model solution and a 10% margin yields the most correctly classified student solutions.
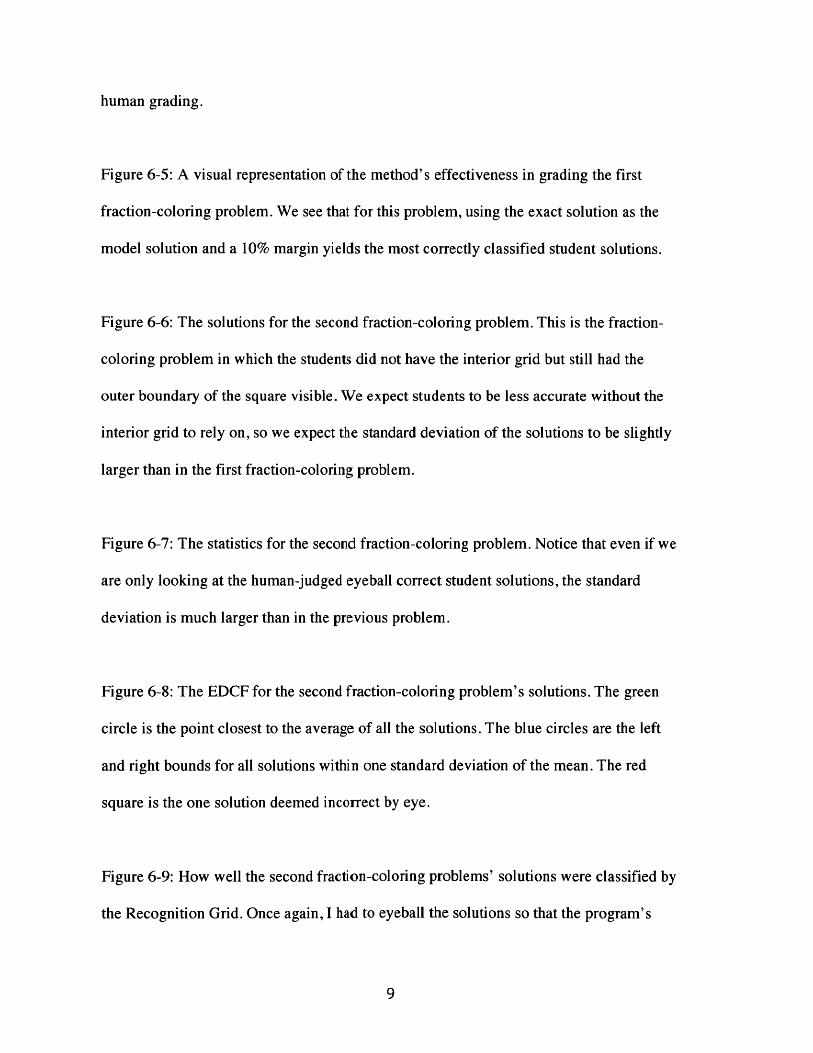
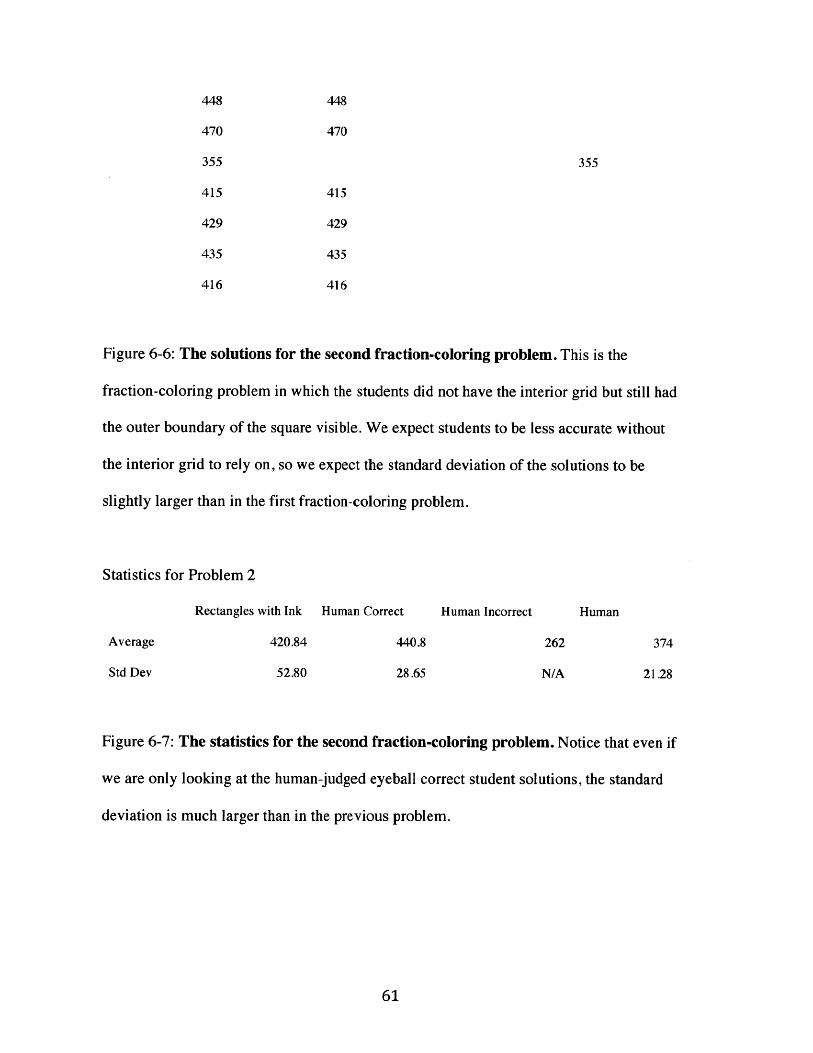
Figure 6-6: The solutions for the second fraction-coloring problem. This is the fraction-
coloring problem in which the students did not have the interior grid but still had the
outer boundary of the square visible. We expect students to be less accurate without the
interior grid to rely on, so we expect the standard deviation of the solutions to be slightly
larger than in the first fraction-coloring problem.
Figure 6-7: The statistics for the second fraction-coloring problem. Notice that even if we
are only looking at the human-judged eyeball correct student solutions, the standard
deviation is much larger than in the previous problem.
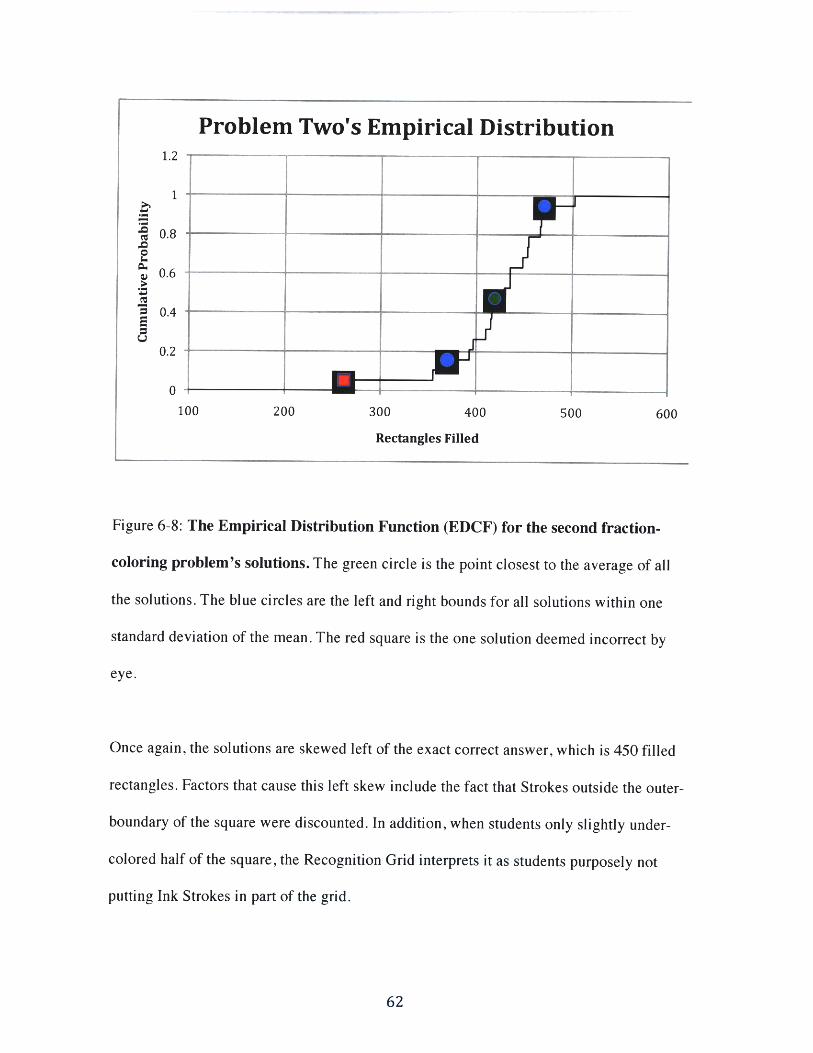
Figure 6-8: The EDCF for the second fraction-coloring problem's solutions. The green
circle is the point closest to the average of all the solutions. The blue circles are the left
and right bounds for all solutions within one standard deviation of the mean. The red
square is the one solution deemed incorrect by eye.
Figure 6-9: How well the second fraction-coloring problems' solutions were classified by
the Recognition Grid. Once again, I had to eyeball the solutions so that the program's
classifications could be matched against a human's.
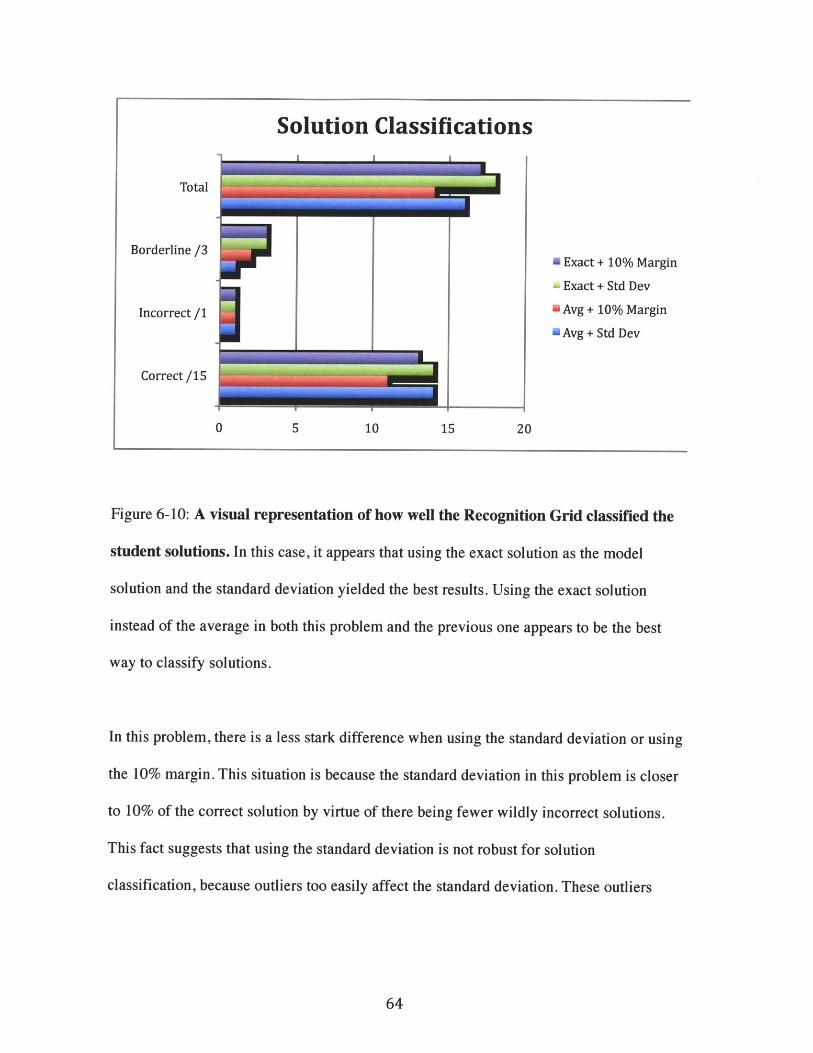
Figure 6-10: A visual representation of how well the Recognition Grid classified the
student solutions. In this case, it appears that using the exact solution as the model
solution and the standard deviation yielded the best results. Using the exact solution
instead of the average in both this problem and the previous one appears to be the best
way to classify solutions.
Figure 6-11: The results when we interpreted all the table entry problems using the first
option - interpreting the answers cell by cell using the clipped results of the grid in each
cell as the Ink Strokes of that data entry.
Figure 6-12: The results when we interpreted the table entry problems using option the
second option - interpreting all of the Ink Strokes in the table at once and looking for
consistency in the consecutive numbers.
Figure 6-13: Statistics for the correctly interpreted exercises when the Ink Analyzer
interprets cell by cell.
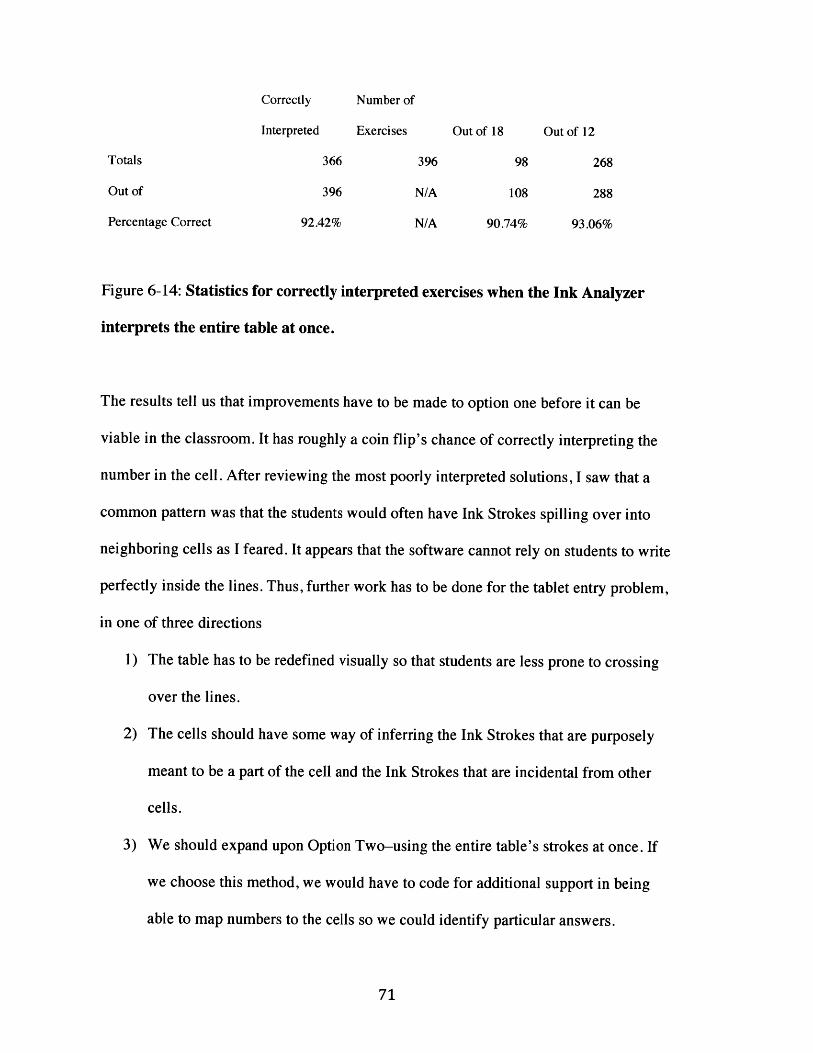
Figure 6-14: Statistics for correctly interpreted exercises when the Ink Analyzer interprets
the entire table at once.
Figure 6-15: The number of cells with spilled-over strokes from other cells in the number
grid exercise. Out of the 24 student solutions that we collected, 8 were obviously
incorrect - the students circled the wrong numbers as multiples.
Figure 6-16: The statistics for how much the spilled-over strokes affected the Recognition
Grid's ability to determine correctness. These statistics were calculated on the 16 correct
solutions.
Figure 6-17: The amount of strokes spilling into other cells when we used thresholding.
Notice that this substantially reduced the amount of spillvoer, but caused two cases where
Strokes were undercounted. This is because several students didn't circle the numbers in
the cells but instead put dots in them. These dots ended up being smaller than the cut off
threshold, and the Recognition Grid did not count them.
Figure 6-18: The statistics of how many cells had spillover Strokes when the Recognition
Grid used a threshold.
Figure 6-19: The Recognition Grid's ability to classify student solutions in the graphing
problem with a background grid. I accepted solutions up to 100 squared pixels away
from the model solutions. Notice that this margin was small enough such that no false
positives were allowed.
Figure 6-20: Statistics for the Recognition Grid's ability to classify solutions. All
incorrect solutions were correctly classified as incorrect while almost three quarters of
correct solutions were classified as correct. The correct solutions that were mistakenly
classified as incorrect were done so because of errant strokes and students drawing
guidelines to accurately plot the points, as these factors would impede the detection
process.
Figure 6-21: An example of a student drawing guidelines from the axes to help plot the
point. Because of the nature of the detection algorithm, the guidelines were counted into
the Strokes for each color and impacted the bounding box's center. The cyan squares
show where the Recognition Grid thinks the students' solutions are.
Figure 6-22: An example of the Recognition Grid's accuracy in detection incorrect
solutions. The red point should be plotted at (0,5) but is actually plotted at (1,5). The 100
squared pixels threshold is so small that the Recognition Grid rejects the red point and
determines that the red point is plotted in the wrong place.
Figure 6-23: An example in which errant purple strokes skewed the purple points'
location detection.
Figure 6-24: Student solutions on the graphing problem without the background grid. The
Recognition Grid still uses the 100 squared pixels as the cutoff for correct solutions so
there are a lot more solutions counted as incorrect than in Figure 6-19. Notice that there
are still no false positives.
Figure 6-25: Statistics for classification of student graphing problems when they were not
given a background grid.
Figure 6-26: Classification of student solutions after I raised the cutoff threshold from
100 pixels squared to 800 pixels squared.
Figure 6-27: Statistics for solution classification with a threshold of 800 pixels squared.
One surprising result is that even with the relaxed threshold (800 pixels squared up from
100), we still don't have any false positives.
Figure A-1: The Real-Time Interpreter. Ink Strokes are inputted in the top, white area and
the translated results are displayed in the bottom, blue area.
Figure A-2: The Real-Time Interpreter in action. I drew the Ink Strokes that made up the
word "he" and then the word "hello", while the Microsoft Ink Analyzer outputted the
translated results in the blue TextBox below.
Figure A-3: Color strokes drawn into the Color Entry Recognizer. The Ink Strokes were
drawn into the Ink Canvas on the left.
Figure A-4: The Color Entry Recognizer's Get Colors button reads the Ink Strokes and
then outputs their locations and hex color codes. Notice that the relative left to right
ordering of the color strokes is preserved, and the x-coordinates of the Strokes' horizontal
bounds are shown to pixel level precision.
Figure A-6: The previous functions are collapsed into a table. I also experimented with
alternative forms of inputting answers, such as the calculator like number grid on the
bottom left.
Figure B-1: An example of a group of dense Ink Strokes making up a bounding box.
Figure B-2: A single Ink Stroke that has the same bounding box as the dense group from
Figure B-1. This example shows a flaw in just using bounding boxes in determining
between similar groups of Strokes.
Figure B-3: A basic L shaped stroke and the bounding box it produces.
Figure B-4: Three rectangles and the boundaries that they create on the Ink Canvas. The
three rectangles will be used to clip the Ink Strokes from Figure B-3 so that different
portions of the resulting child Strokes fall separately into the final rectangles.
Figure B-5: After clipping the L shaped stroke using the three rectangles. Now instead of
seeing a single bounding box, we see that two out of the three rectangles have a resulting
child Stroke in them while one of the three rectangles did not clip with any part of the L-
shaped Stroke.
Figure B-6: The grid structure of the Recognition Grid. The grey colors of the individual
rectangles denote that no Ink Strokes have been clipped into them yet.
Figure B-7: The Recognition Grid after Ink Strokes are drawn on it. After clipping the
input Ink Strokes, the rectangles that have resulting child Strokes are colored light green,
while the rest remain grey.
Figure B-8: The Recognition Grid with threshold mode turned on. The threshold values
are displayed in the top left corner of each rectangle. The closer the value of the bounding
box in the rectangle is to 1, the greener that rectangle is.
Figure B-9: A Recognition Grid with very low precision. Although the Ink Stroke has
been captured, we learn very little information about the Ink Stroke and what the user
intended it to represent.
Figure B-10: A Recognition Grid with higher precision. By using more columns and rows
in the Recognition Grid, we can obtain more information about the Ink Stroke.
Figure B-11: A Recognition Grid with a drawing of an x and y axis and a circle.
Figure B-12: A plain Ink Stroke.
Figure B-13: The Ink Stroke separate in two using an erase-by-point eraser down the
middle of the Stroke.
Figure B-14: The Ink Stroke further divided into fourths using more erase-by-point
mouse actions.
Figure C-1: The options prompt window in Authoring Mode. This controls all of the
settings that a teacher currently needs to create the basic math and science problems that
we used in the Handwriting Diagnostic.
Figure C-2: An example of snapped student strokes. Students' Ink Strokes are snapped to
the background grid to create rigid strokes. This helps make problems and solutions
neater and can even aid in detection.
Figure C-3: An Ink Stroke, with snapping turned on, before it is erased in half. I curved
the Ink Stroke to highlight what happens when it gets cut in half.
Figure C-4: The resulting snapped lines when the original Ink Stroke is cut in half. Both
remaining halves are valid Ink Strokes, so the consistent behavior here is to snap both of
these halves to the grid.
Chapter 1
Introduction
What is so difficult about student free-hand solution interpretation?
There are many factors involved in answering that question. While text and
number inputs can be relatively accurately translated using modern day Ink tools, the lack
of structure when it comes to open-ended problems makes it difficult to determine
correctness. When a fourth-grade teacher reads a student's graph, the teacher can take
into account bad handwriting and errant scribbles while understanding that not all fourth-
grade students will draw perfectly straight lines or adhere strictly to tic marks. Teachers
can also quickly distinguish between scratch work and the final answer. In addition,
teachers can more easily figure out why students made a mistake than a computer can.
Current interpretation software may tell you that a plotted line is not done correctly,
while the teacher can reason from the drawing that the student mixed up the x and y-axes.
One example of the difficulties of Ink interpretation is shown in Figure 1 below.
The problem asks students to plot points on a graph. To make interpretation even easier,
the problem specifies that the different points be drawn in different colors.
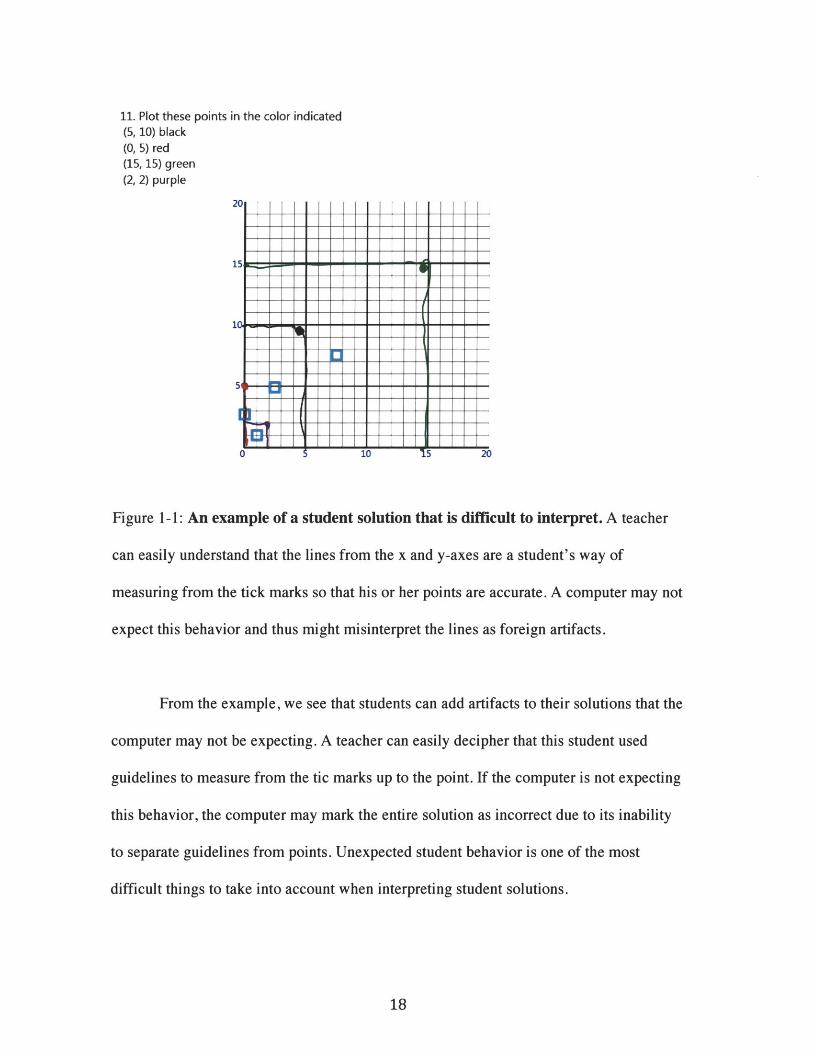
11. Plot these points in the color indicated(5, 10) black(0, 5) red(15, 15) green(2, 2) purple
20
is
--
S10 15 20
Figure 1- 1: An example of a student solution that is difficult to interpret. A teacher
can easily understand that the lines from the x and y-axes are a student's way of
measuring from the tick marks so that his or her points are accurate. A computer may not
expect this behavior and thus might misinterpret the lines as foreign artifacts.
From the example, we see that students can add artifacts to their solutions that the
computer may not be expecting. A teacher can easily decipher that this student used
guidelines to measure from the tic marks up to the point. If the computer is not expecting
this behavior, the computer may mark the entire solution as incorrect due to its inability
to separate guidelines from points. Unexpected student behavior is one of the most
difficult things to take into account when interpreting student solutions.
My thesis explores the tradeoff between exercise structure and the ability for a
software system to accurately grade student answers. I aim to use structure as a way to
organize student answers, allowing artifacts such as the guidelines above while
minimizing their ability to impede interpretation and recognition. I do not want to
completely structure problems in a way to remove all the fun and exploration: I only wish
to provide enough structure to keep problems entertaining and novel while giving the
computer enough context to act as a virtual teacher. With new Ink technology and
classroom-tested structure, I hope to bring Ink Interpretation to the level of reading,
processing, and understanding student work.
Chapter 2
Previous Work
2.1 INK12
The goal of the NSF-Funded INK-12 project is to study virtual-teacher-guided
learning and its impact in the classroom.
For a previous project, we experimented with immediate communication between
students in the forms of handwritten notes, submissions, and grading comments passed
through a classroom's wireless network, reducing the amount of time required for
traditional flow in between the student's desk and the teacher's. In addition, teachers
could explore peer learning. With a click of a button, a teacher could display a student's
solution on a projector for the entire class to see without revealing that student's identity.
Another feature allowed the teacher to virtually swap student work with other students.
Using this function, students were able to benefit from peer learning by grading each
other's work. Finally, a database was designed such that student work could always be
saved, and any child's submissions relating to a certain lesson could be quickly queried
and examined.
The software developed, called Classroom Learning Partner, or CLP, provided a
tablet PC-based platform for students and teachers to engage in classroom discussion and
formative assessment. CLP integrated existing tools with math and science curriculum to
allow teachers to be more involved with student work as it took place during lessons and
not after them. Our research explored these passive teacher aids in a series of classroom
visits in the 2008-2010 school years.
The most recent grant is aimed at developing a new version of CLP, one that will
give active support to teachers by automatically interpreting student submissions. We
wish to create software that interprets, aggregates, and analyzes student submissions. For
example, imagine a graphing problem that involves a student plotting some points on a
graph. In a traditional classroom, the teacher would have to collect assignments and grade
the plots overnight. With active virtual-teacher-guided learning, the students would
immediately receive feedback on their plots. The software would automatically interpret
student graphs by converting them into a computer intelligible representation and
grouping them into correct solutions and incorrect solutions. The software would then
take the incorrect solutions and sort them into buckets of common mistakes, allowing the
teacher to instruct according to the most frequent errors. With the help of active
interpretation, INK-12 aims to greatly improve student-teacher feedback by allocating
much of the grading process to the computers.
2.2 Existing Technology
Existing classroom tools such as SMART® Boards and Mimio Virtual Ink
provide a glimpse into the capabilities and limitations of modern day classroom feedback
technology. SMART Boards allow the sharing of written ink faster than transparencies
or slides can be created. Student answers can be chosen from the classroom and displayed
on the board so that the children can review a peer's thought process. <Citation needed>
Mimio "vote pads" allow teachers to instantly survey the level of understanding
of a given lesson. The vote pads are basically mobile "multiple choice" boxes. Teachers
can ask a question and then take a poll of the number of A's, B's, C's, and D's that
students respond with. This process shortens the amount of time it takes for a teacher to
understand the general level of comprehension. In the past, educators would either have
to grade assignments or take verbal hands-up polls of the classroom. Neither of these
methods are ideal, as grading assignments take time and verbal / hands-up polls could
easily be influenced by peer pressure and lack of privacy. In addition, multiple-choice
questions often limit teaching and learning to the regurgitation of facts.
The INK-12 project aims to expand upon these technologies by creating an ink-
based notebook and virtual-teacher that can provide feedback on wider variety of
problems. The long-term goal is to move well beyond multiple choice and basic word
problems into modern context-based math problems including graphs, number lines,
drawings, and diagrams. We aim to support all aspects of classroom curriculum without
restricting student submissions to easily interpretable solutions. Throughout this process,
we will continue to provide the same passive teacher-support using our tablet computers,
databases, and projectors.
2.3 Related Research
In the paper "The Usability of Handwriting Recognition for Writing in the
Primary Classroom", Read, MacFarlane et al. set about studying the usability of
computer tools in the classroom. The researchers went into school classrooms, primarily
working with children ages 7 to 10, to test student likes and dislikes of three mediums of
communication: pen and paper, tablet PC and stylus, and laptops with keyboards.
The stimulus for this writing was a parable about an ant and a grasshopper in
which the ant stored food for the winter, while the grasshopper played his cello all
summer and subsequently went hungry in the winter. The children were asked to write a
story about what happened the next year.
Children were asked to rate their predicted enjoyment of the activity as well as the
actual enjoyment afterwards using a scale called the Smileyometer; students were asked
to choose from varying smiley faces to describe how much they enjoyed each activity.
Their stories were graded on quality and quantity, or the word count. Finally, the students
were asked to assess the experience using each of the three mediums.
The researchers found the following results, all ranked from greatest to least:
Quality of writing: 1) Pen, 2) Tablet, slightly ahead of 3) Keyboard
Quantity of writing: 1) Pen, 2) Tablet, 3) Keyboard
Preferences Expected: 1) Keyboard, 2) Tablet, slightly ahead of 3) Paper
Preferences Actual: 1) Keyboard, 2) tie between tablet and paper
The researchers noted that when using a keyboard, students spent time looking for
what key to press and were more aware of spelling mistakes when using the keyboard.
The age of the students may have played a role in their reaction to the keyboard.

This experiment shows that the tablet and stylus are usable mediums for
classroom exercises. While students appear to work faster using pen and paper, we
believe that the benefits of being able to send work through a wireless network,
automatically grading student answers, supporting real-time classroom discussions of
student work, will outweigh the disadvantages.
24
Chapter 3
Research of Existing Handwriting Recognition
Technology
3.1 Microsoft Tablet SDK
My thesis's focus is not to reinvent the wheel. There are plenty of well-researched
and developed handwriting recognition technologies out there, created by teams of
researchers or entire corporate divisions. My first task was to examine the most popular
technologies and to choose something suitable for use in the classroom. Through this
process, I had to keep in mind the adaptability of the SDK to account for my own
additions, most importantly graph recognition.
I found the Microsoft Tablet SDK to contain the most suitable handwriting
recognition software. Not only was the text input success rate very high, but the Tablet
SDK was also very robust in support of Ink Strokes, enabling me to easily save and load
student Ink examples, slice up individual strokes, and manipulate the ink in a way to
understand individual lines and curves.
Starting from the Microsoft Tablet Ink Resources, I began my thesis project of
creating structured math problems for students that went beyond simple text and number
answers. Using these libraries, I created tools that could be shaped into a virtual-teacher
that could provide instant feedback for students in the classroom.

3.2 Ink Stroke Representation and Saving Ink
In the Microsoft Tablet SDK, strokes are represented as a series of points, much
like Bdzier Curves are defined by a series of "control points". Rather than saving every
pixel location of a single Ink Stroke, I could simply save an Ink Stroke's less numerous
Stroke Points to a file. To load data stored in saved files, I could reconstruct ink using
these points. This would create an identical replica of the Ink saved earlier. These basic
tools would allow me to go into elementary school classrooms, have students test out the
software by doing basic exercises, and then go back to the computer lab to analyze the
results before having to wait for the new CLP software to be completely functional.
Chapter 4
The Recognition Grid
I created a modular class that contained all of the functions necessary to interpret
ink. I call this class the "Recognition Grid" and it integrates several key concepts that
allow it to interpret text, numbers, and free-hand other strokes (e.g. graph axes and lines)
all at the same time.
Recognition Grids use certain techniques in order to be able to specifically detect
when student solutions are incorrect while providing enough leeway that the differences
in how two students go about solving a problem will not be enough to deem one version
correct and another incorrect. To see the discoveries and prototypes leading up to the
creation of the Recognition Grid, please see Appendix A. To see the design choices
behind the Recognition Grid, please see Appendix B. To see how a teacher creates a
Recognition Grid in a CLP Notebook and all of the options it can take, please see
Appendix C.
Chapter 5
Handwriting Diagnostics and Curriculum Analysis
The CLP Team decided that a large sample of student's handwriting should be
collected in order to determine the feasibility of automatic interpretation of different
exercises. While we continued to develop the Recognition Grid, the CLP Notebook,
networking features, and all other components of the CLP Software, we wanted proceed
with testing how students performed traditional paper-based math problems on a tablet
computer. We especially wanted to take note of any interesting patterns or outlying
solutions that would be difficult to interpret with the current Handwriting Recognition
system. Since we were at the beginning of the INK-12 grant, we understood that we
would limit ourselves to only a subset of all possible handwriting recognition problems
and later would add to the Handwriting Recognition software new functionality, e.g. the
ability to distinguish being correct and incorrect handwritten solutions.
5.1. Math and Science Curriculum in the CLP Notebooks
The current INK-12 curriculum, developed by the Principle Investigators Andee
Rubin of TERC and Dr. Kimberle Koile of MIT CECI were chosen for several similar
qualities:
1. The exercises required critical thinking while staying relevant to the existing
elementary school curriculum.
2. The exercises asked for solutions and explanations that, if shared with the entire
classroom, could benefit other students through peer learning.
3. The exercises asked for solutions that are not limited to text and numbers, thus
requiring new methods of handwriting recognition.
4. The exercises utilized the expanded capabilities of tablet PCs. For example, they
asked students to quickly switch between colors, to highlight certain parts of the
exercise, and to use various other new tools, like CLP Stamps, that would be more
difficult and tedious to do on traditional pen and paper.
As we both observed students in the classroom and analyzed their exercise
solutions afterwards, we kept the following questions in mind:
Are some exercises too difficult to interpret in their current state?
Is this difficulty because the student solutions are too varied for a single pattern
detection to recognize? Could this difficulty be solved by adding additional structure to
the exercise, perhaps by requiring certain parts of the solution to be supplied in different
colors?
Is there too much information cluttered on a single page that would make
interpretation very difficult? If so, can we add a table that will structure where students
have to put certain answers?
Is there more than one correct answer? Exercises that have a wide range of
answers will be difficult to categorize as correct or incorrect. For some of these exercises,
it may be possible to separate the answer into a computer-graded component and then a
teacher-graded component.
5.2 The Handwriting Diagnostic Program and Exercises
The Handwriting Diagnostic tests took place over the course of four days in April
2011. Two different elementary schools were visited: Northeast Elementary School in
Waltham, Massachusetts, and Baldwin Elementary in Cambridge, Massachusetts. We
worked with three teachers and roughly 70 students.
The problems that PIs Andee Rubin and Dr. Kimberle Koile developed for this
experiment fell into <insert number> categories.
1. Fraction Coloring Problems
2. Table Entry Problems
3. Number Grid Problems
4. Shape drawing Problems
5. Number Line problems
6. Graphing Problems
7. Text Sampling

Each of the following problems was created using a Canvas and an InkCanvas. The
Canvas element is a Microsoft User Interface element that allows us to draw primitive
shapes. The InkCanvas, as discussed before, accepts the Ink Strokes when the user writes
in the specified area. The problem that the student sees is created on the Canvas layer,
while the capturing of the strokes and processing through the Recognition Grid is done on
the InkCanvas layer.
5.2.1 Fraction Coloring Problems
The fraction coloring problems were very straightforward: students were asked to
color in a certain fraction of a shape in whatever color they chose. We created four
different fraction coloring problems, but we varied the amount of structure provided to
the students in each exercise. For some problems, the shape would be provided as well as
guidelines within the shape that students could use to help figure out the fractions. In
other problems, students were asked to draw shapes of their own and then color in a
specified fraction of it. We wanted to compare these answers to each other to see if the
added structure significantly impacted some student's ability to correctly do the
exercises. In addition, we wanted to understand the impact of structure on the
Recognition Grid's ability to interpret the solution correctly. Does providing the shape
and guidelines remove some artifacts that would be difficult to interpret? Or can it even
introduce artifacts?
Fraction Coloring Problem 1
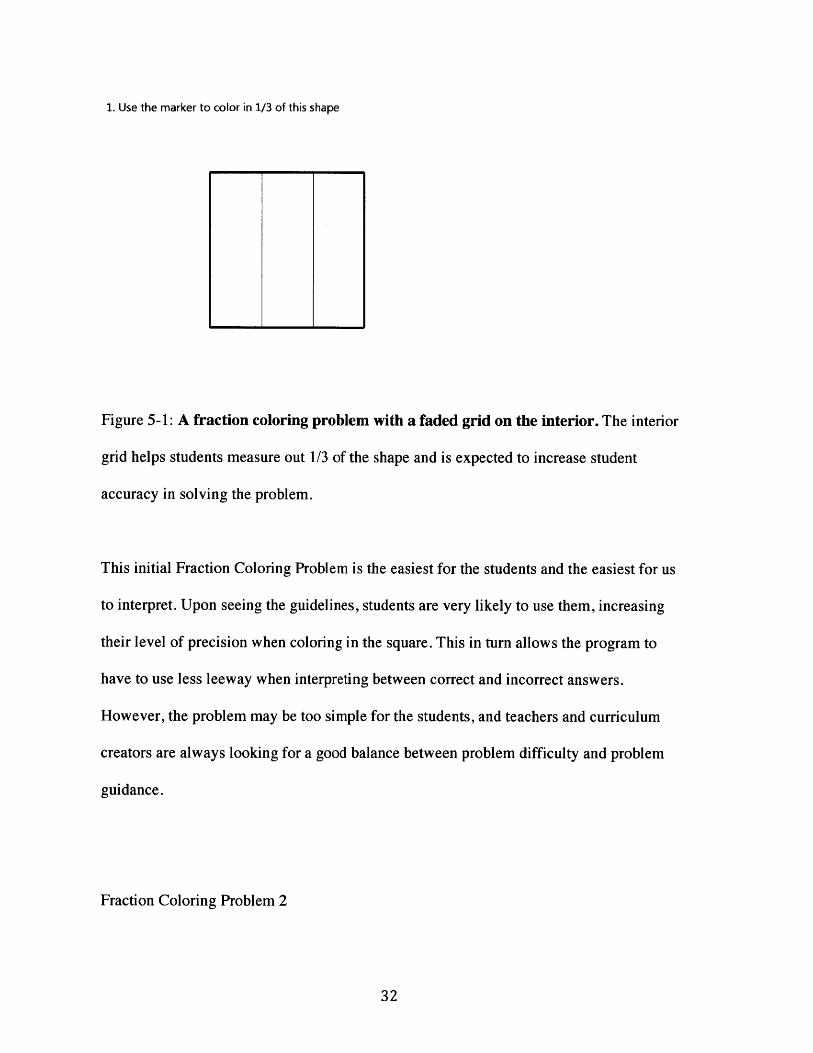
1. Use the marker to color in 1/3 of this shape
Figure 5-1: A fraction coloring problem with a faded grid on the interior. The interior
grid helps students measure out 1/3 of the shape and is expected to increase student
accuracy in solving the problem.
This initial Fraction Coloring Problem is the easiest for the students and the easiest for us
to interpret. Upon seeing the guidelines, students are very likely to use them, increasing
their level of precision when coloring in the square. This in turn allows the program to
have to use less leeway when interpreting between correct and incorrect answers.
However, the problem may be too simple for the students, and teachers and curriculum
creators are always looking for a good balance between problem difficulty and problem
guidance.
Fraction Coloring Problem 2
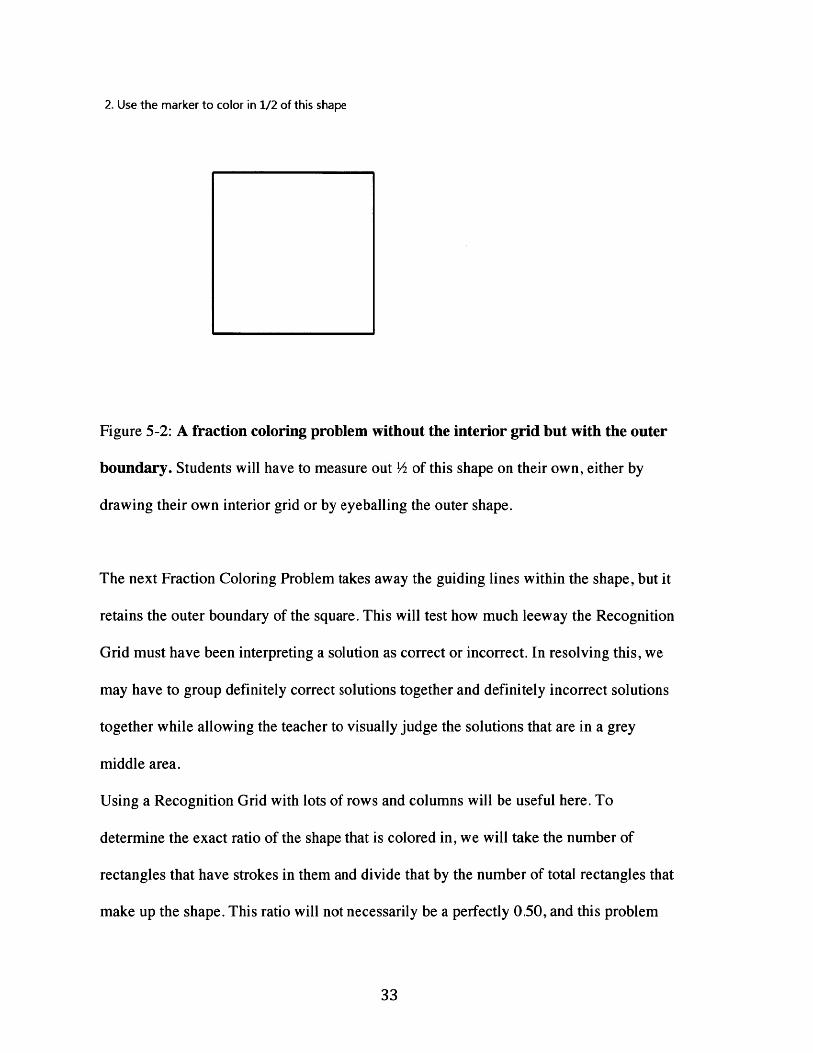
2. Use the marker to color in 1/2 of this shape
Figure 5-2: A fraction coloring problem without the interior grid but with the outer
boundary. Students will have to measure out of this shape on their own, either by
drawing their own interior grid or by eyeballing the outer shape.
The next Fraction Coloring Problem takes away the guiding lines within the shape, but it
retains the outer boundary of the square. This will test how much leeway the Recognition
Grid must have been interpreting a solution as correct or incorrect. In resolving this, we
may have to group definitely correct solutions together and definitely incorrect solutions
together while allowing the teacher to visually judge the solutions that are in a grey
middle area.
Using a Recognition Grid with lots of rows and columns will be useful here. To
determine the exact ratio of the shape that is colored in, we will take the number of
rectangles that have strokes in them and divide that by the number of total rectangles that
make up the shape. This ratio will not necessarily be a perfectly 0.50, and this problem
will help us determine how much error we should allow in the Recognition Grid's
detected ratio.
Fraction Coloring Problem 3
3. Draw a square and color in 1/4 of it.
Figure 5-3: A fraction coloring problem without the interior grid or the outer
boundary. Students must provide the shape and then color in of it. This difficult for
the Recognition Grid to do because it must distinguish between Ink Strokes that are
meant to represent the edges of the shape and Ink Strokes that are meant to color in the
shape.
This Fraction Coloring Problem further removes structure from the student solution.
Students are asked to draw for themselves a square and then color in a fourth of it. To
accomplish this task, the Recognition Grid will have to distinguish between which
strokes are part of the outline of the shape and which strokes are part of the colored-in
region. To do this, the Recognition Grid could look for thin, consecutive lines of
34
rectangles that have strokes in them while they are surrounded by rectangles without
strokes. These rectangles would be categorized as boundary-containing rectangles.
Meanwhile, stroke-containing rectangle clusters that are more than some threshold thick
will be categorized as filler-containing rectangles.
Different students may choose different sized rectangles to draw, and rectangles that are
too small may inhibit our ability to perform the above technique. We will try to gather
enough data to determine if this type of problem can be accurately interpreted on a
consistent basis.
Fraction Coloring Problem 4
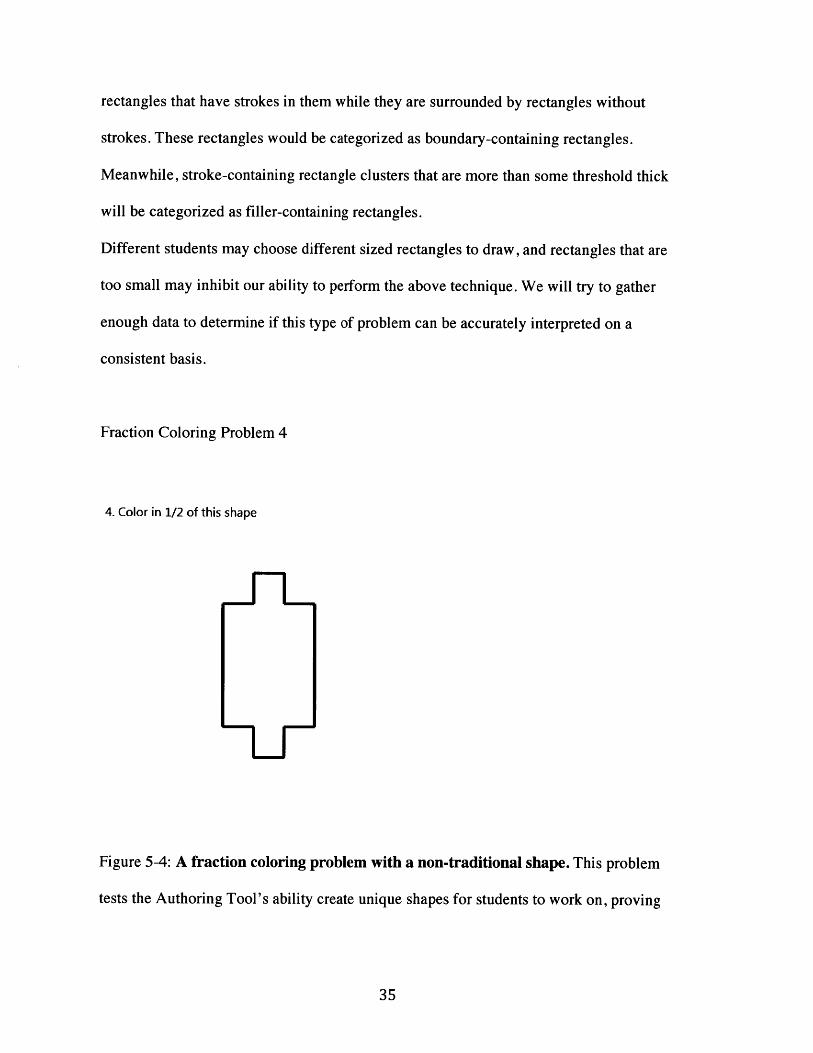
4. Color in 1/2 of this shape
Figure 5-4: A fraction coloring problem with a non-traditional shape. This problem
tests the Authoring Tool's ability create unique shapes for students to work on, proving
that we are not limited to basic squares and rectangles for our problems. To create this,
we used the Snapping Strokes method in the Authoring Tool.
The final Fraction Coloring Problem provides an outer-boundary but not inner guidelines
for an odd, non-orthodox shape. This exercise is designed to show that the Recognition
Grid is not limited to basic shapes such as squares. Instead, the Recognition Grid will be
able to trace the boundary of the provided by the problem creator and determine the total
area of the shape. Then when students color in the shape, the Recognition Grid will
determine which rectangles that contain strokes are within the boundary of the outer
shape and use these rectangles to contribute to the final ratio of rectangles colored. That
ratio will be used to determine if the student colored in the correct fraction of the shape or
not.
5.2.2 Table Entry Problems
The next class of problems is table entry problems. Tables are great for handwriting
recognition because they specify to the program where it should expect certain solutions.
In this group of problems, the Diagnostic attempts to find what tables can and cannot
convey to the Recognition Grid tool.
Table Entry Problem 1
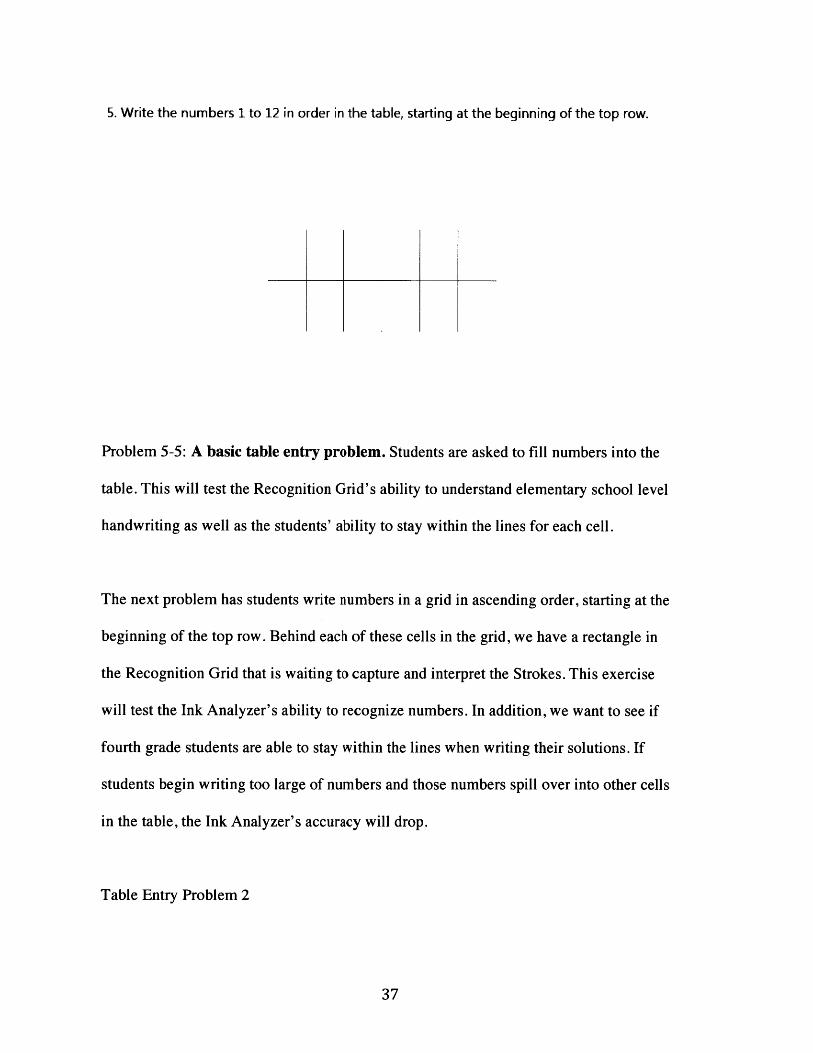
5. Write the numbers 1 to 12 in order in the table, starting at the beginning of the top row.
Problem 5-5: A basic table entry problem. Students are asked to fill numbers into the
table. This will test the Recognition Grid's ability to understand elementary school level
handwriting as well as the students' ability to stay within the lines for each cell.
The next problem has students write numbers in a grid in ascending order, starting at the
beginning of the top row. Behind each of these cells in the grid, we have a rectangle in
the Recognition Grid that is waiting to capture and interpret the Strokes. This exercise
will test the Ink Analyzer's ability to recognize numbers. In addition, we want to see if
fourth grade students are able to stay within the lines when writing their solutions. If
students begin writing too large of numbers and those numbers spill over into other cells
in the table, the Ink Analyzer's accuracy will drop.
Table Entry Problem 2
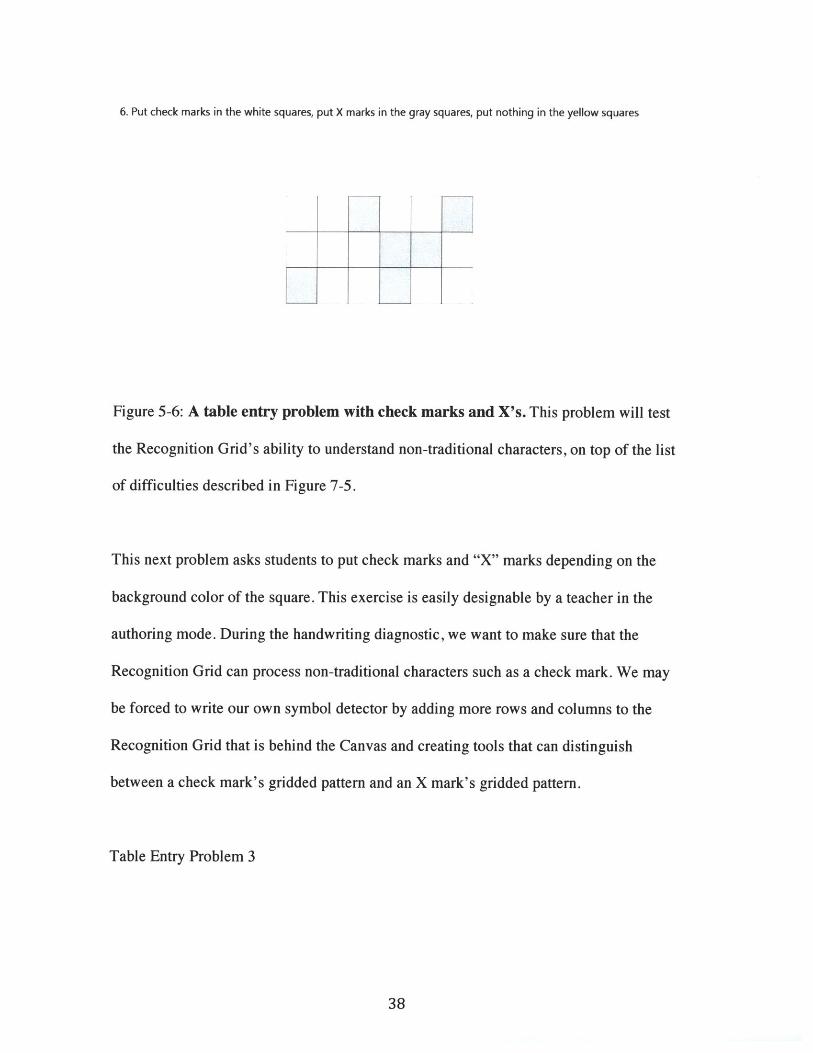
6. Put check marks in the white squares, put X marks in the gray squares, put nothing in the yellow squares
Figure 5-6: A table entry problem with check marks and X's. This problem will test
the Recognition Grid's ability to understand non-traditional characters, on top of the list
of difficulties described in Figure 7-5.
This next problem asks students to put check marks and "X" marks depending on the
background color of the square. This exercise is easily designable by a teacher in the
authoring mode. During the handwriting diagnostic, we want to make sure that the
Recognition Grid can process non-traditional characters such as a check mark. We may
be forced to write our own symbol detector by adding more rows and columns to the
Recognition Grid that is behind the Canvas and creating tools that can distinguish
between a check mark's gridded pattern and an X mark's gridded pattern.
Table Entry Problem 3
......... ............. ------ ----- - __ -------- __ . ..... ...... .............. ...............
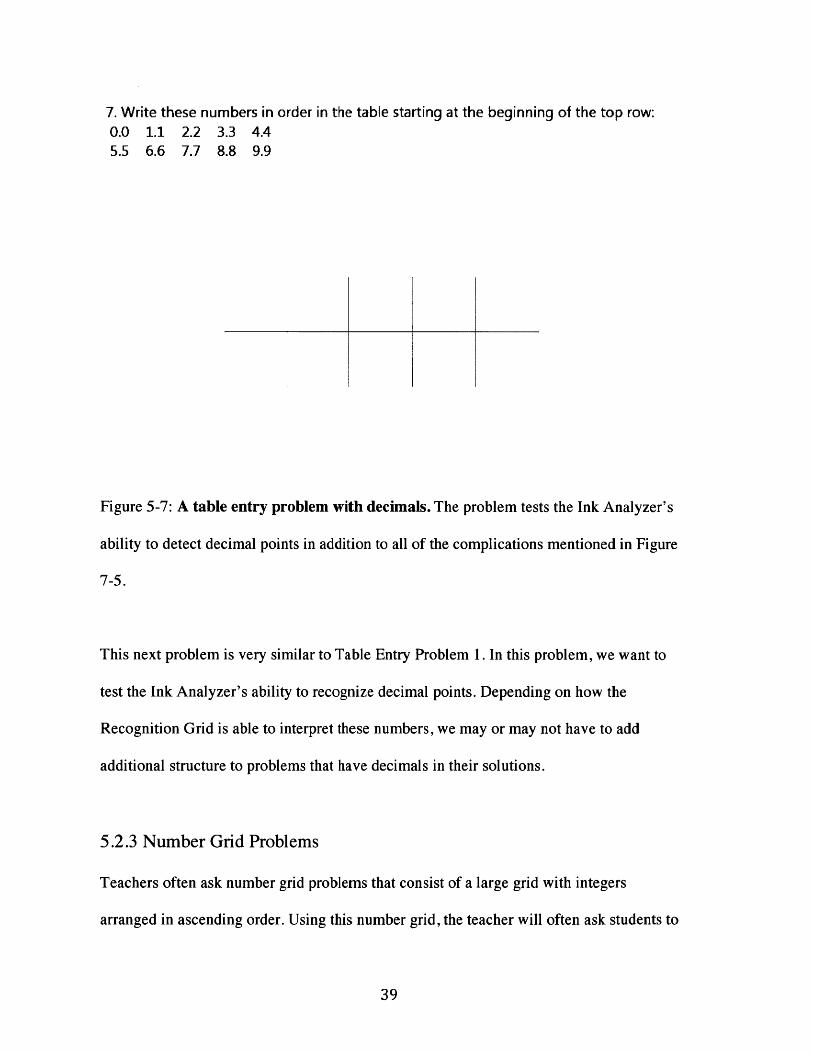
7. Write these numbers in order in the table starting at the beginning of the top row:0.0 1.1 2.2 3.3 4.45.5 6.6 7.7 8.8 9.9
Figure 5-7: A table entry problem with decimals. The problem tests the Ink Analyzer's
ability to detect decimal points in addition to all of the complications mentioned in Figure
7-5.
This next problem is very similar to Table Entry Problem 1. In this problem, we want to
test the Ink Analyzer's ability to recognize decimal points. Depending on how the
Recognition Grid is able to interpret these numbers, we may or may not have to add
additional structure to problems that have decimals in their solutions.
5.2.3 Number Grid Problems
Teachers often ask number grid problems that consist of a large grid with integers
arranged in ascending order. Using this number grid, the teacher will often ask students to
identify multiples of certain numbers, because the number grid can help reveal the pattern
behind certain multiples. This is a good class of problems to include in our handwriting
diagnostic because they inherently have a lot of structure in them. Student Ink Strokes
will naturally be concentrated inside of the grid cells, and any handwriting recognition
being performed can specifically look for Ink there.
Number Grid Problem 1
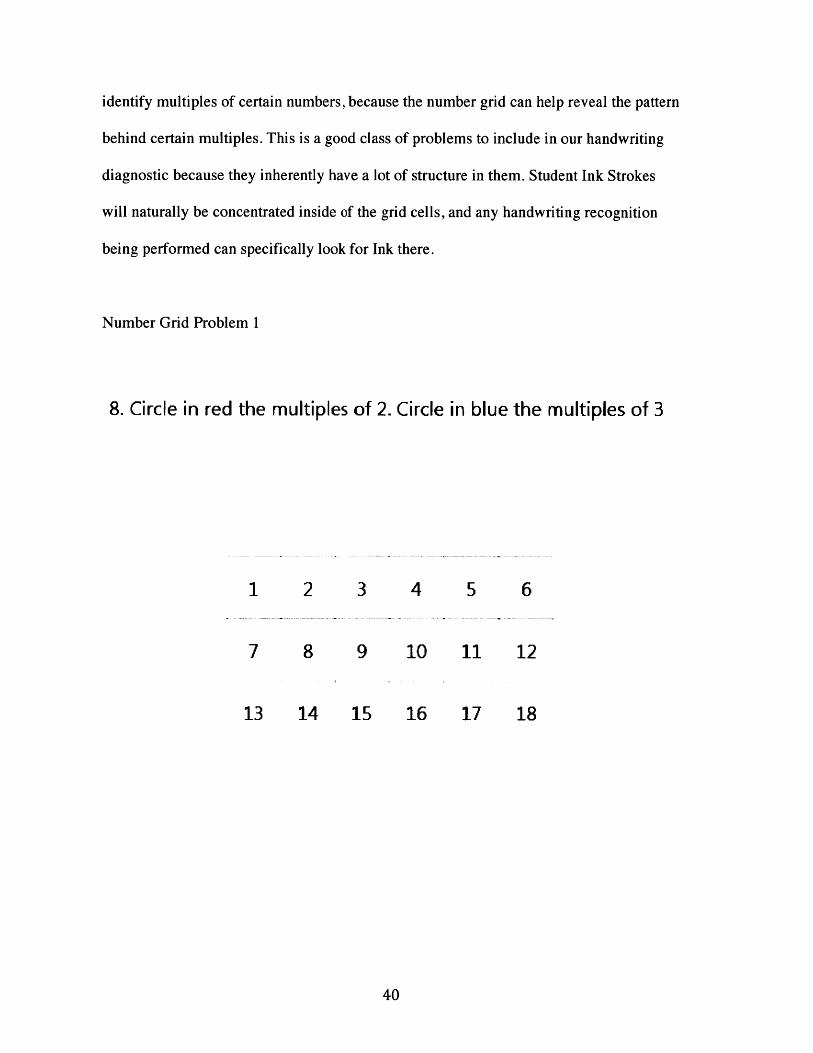
8. Circle in red the multiples of 2. Circle in blue the multiples of 3
1 2 3 4 5 6
7 8 9 10 11 12
13 14 15 16 17 18
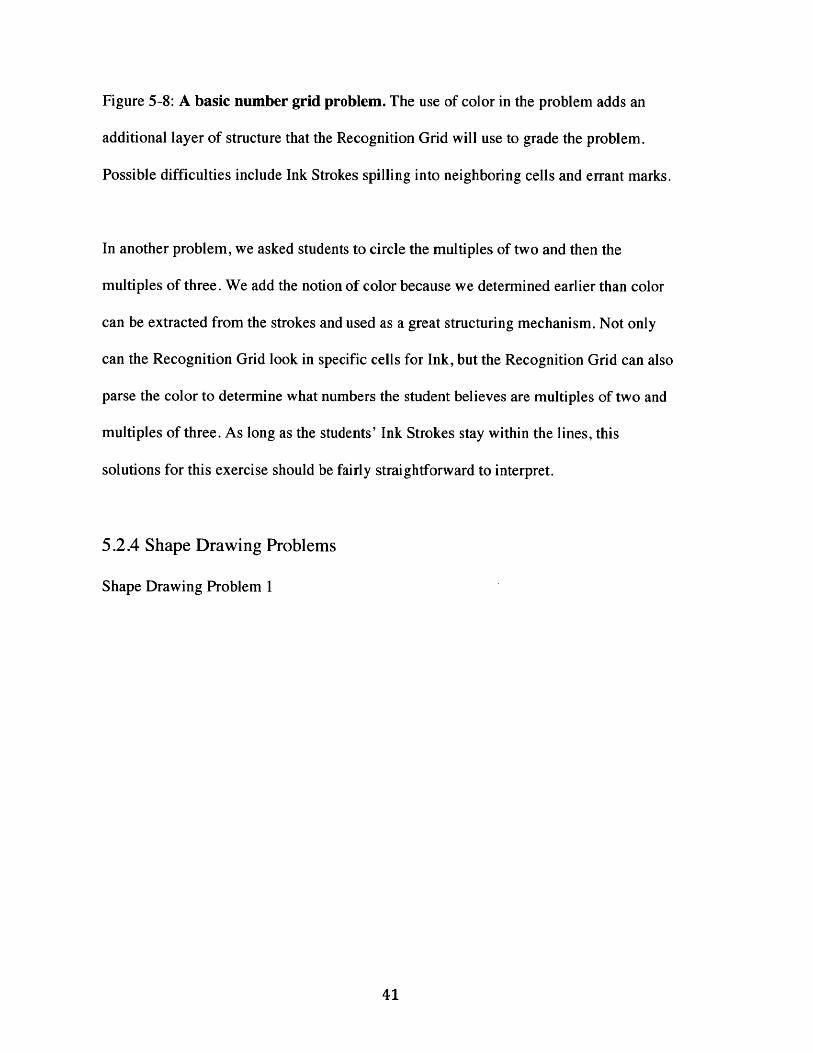
Figure 5-8: A basic number grid problem. The use of color in the problem adds an
additional layer of structure that the Recognition Grid will use to grade the problem.
Possible difficulties include Ink Strokes spilling into neighboring cells and errant marks.
In another problem, we asked students to circle the multiples of two and then the
multiples of three. We add the notion of color because we determined earlier than color
can be extracted from the strokes and used as a great structuring mechanism. Not only
can the Recognition Grid look in specific cells for Ink, but the Recognition Grid can also
parse the color to determine what numbers the student believes are multiples of two and
multiples of three. As long as the students' Ink Strokes stay within the lines, this
solutions for this exercise should be fairly straightforward to interpret.
5.2.4 Shape Drawing Problems
Shape Drawing Problem 1
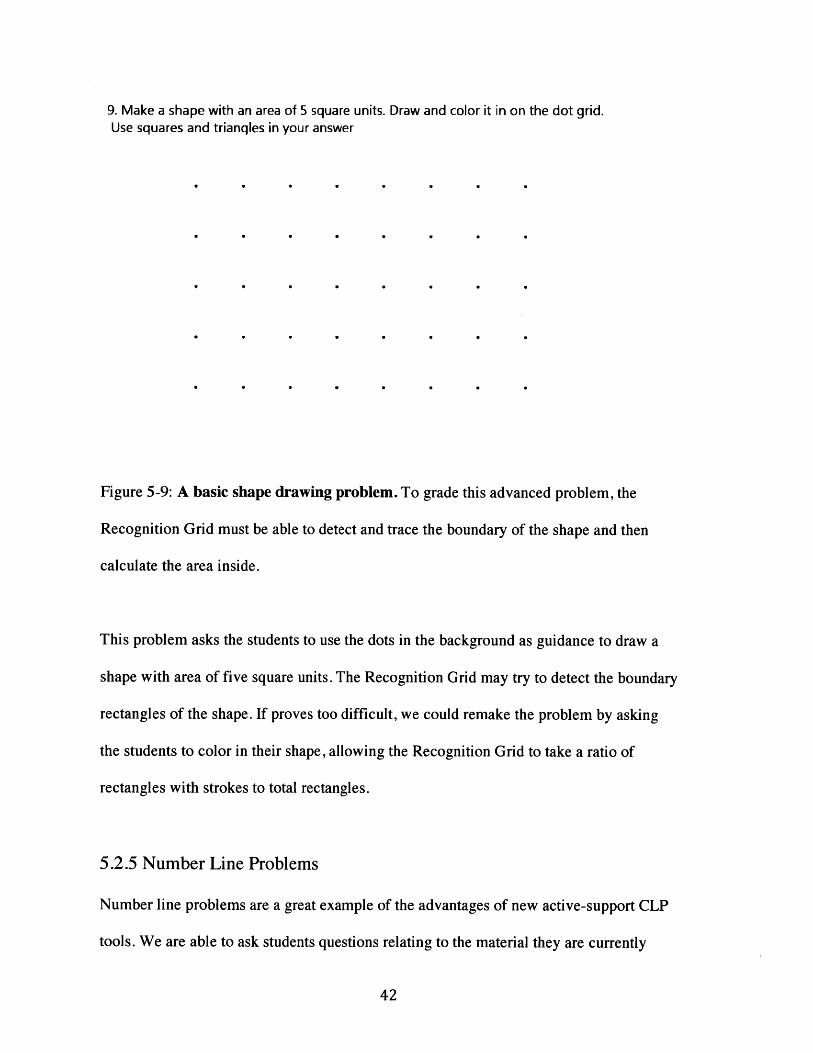
9. Make a shape with an area of 5 square units. Draw and color it in on the dot grid.Use squares and trianqles in your answer
Figure 5-9: A basic shape drawing problem. To grade this advanced problem, the
Recognition Grid must be able to detect and trace the boundary of the shape and then
calculate the area inside.
This problem asks the students to use the dots in the background as guidance to draw a
shape with area of five square units. The Recognition Grid may try to detect the boundary
rectangles of the shape. If proves too difficult, we could remake the problem by asking
the students to color in their shape, allowing the Recognition Grid to take a ratio of
rectangles with strokes to total rectangles.
5.2.5 Number Line Problems
Number line problems are a great example of the advantages of new active-support CLP
tools. We are able to ask students questions relating to the material they are currently
learning without having to simplify the questions into multiple-choice problems. In
number lines and graphs, students interact with the problem environment in interesting
ways. If the Recognition Grid was able to interpret the students' solutions, INK-12 can
begin introducing a new class of interesting problems that can be auto-graded by the
software itself.
Number Line Problem 1
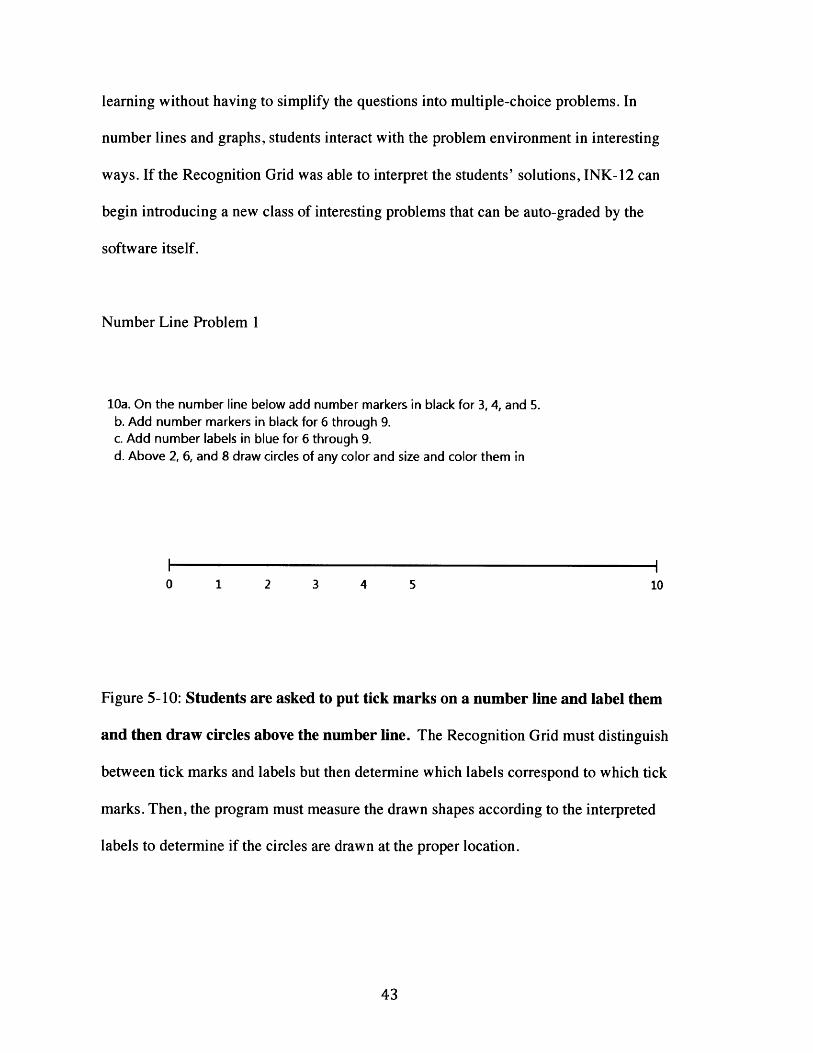
10a. On the number line below add number markers in black for 3, 4, and 5.b. Add number markers in black for 6 through 9.c. Add number labels in blue for 6 through 9.d. Above 2, 6, and 8 draw circles of any color and size and color them in
0 1 2 3 4 5 10
Figure 5-10: Students are asked to put tick marks on a number line and label them
and then draw circles above the number line. The Recognition Grid must distinguish
between tick marks and labels but then determine which labels correspond to which tick
marks. Then, the program must measure the drawn shapes according to the interpreted
labels to determine if the circles are drawn at the proper location.
This number line problem takes advantage of color structure by asking the students to add
number markers in black and number labels in blue. This makes life easier on the
Recognition Grid by allowing the Recognition Grid to limit its search to only Strokes
with a specific color. Then, the problem asks students to draw circles above the number
line. This stipulation allows the Recognition Grid to try to interpret the circles only in a
particular location on the problem. We will see if these conditions are enough for the
Recognition Grid to be able to distinguish between correct and incorrect solutions, and if
there are incorrect solutions, we will see if the Recognition Grid can single out which part
of the problem was done incorrectly.
Number Line Problem 2
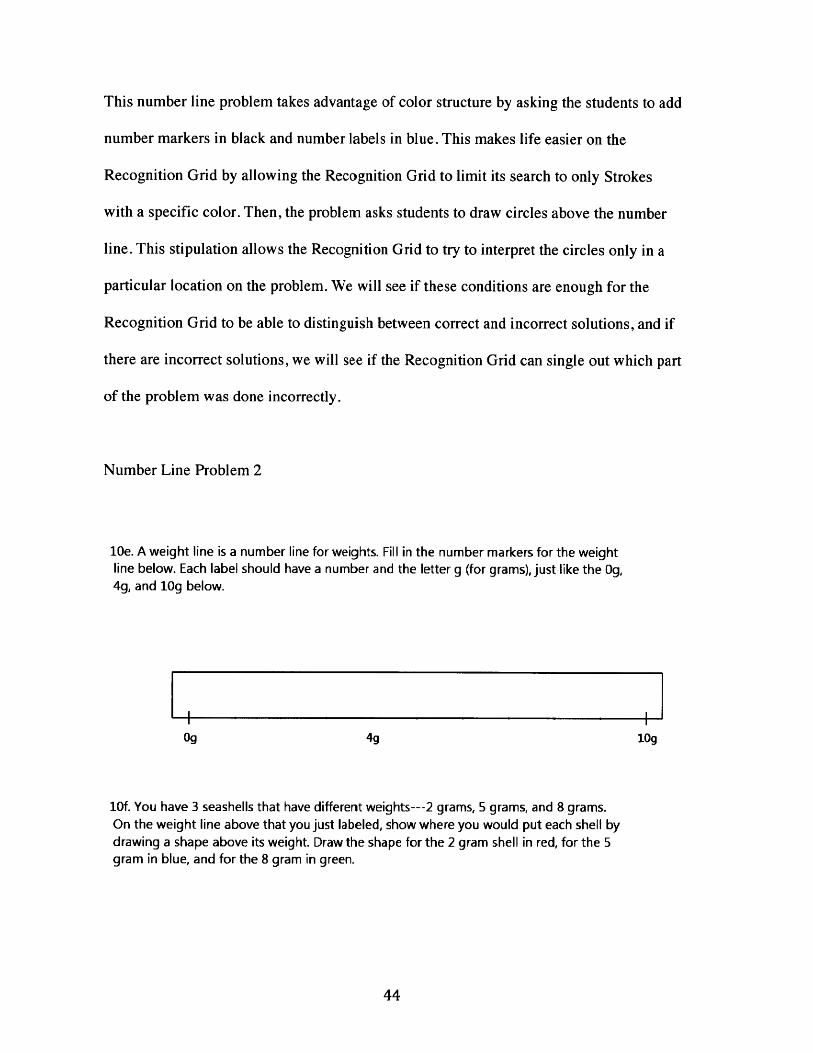
10e. A weight line is a number line for weights. Fill in the number markers for the weightline below. Each label should have a number and the letter g (for grams), just like the Og,4g, and 10g below.
Og 4g log
10f. You have 3 seashells that have different weights---2 grams, 5 grams, and 8 grams.On the weight line above that you just labeled, show where you would put each shell bydrawing a shape above its weight. Draw the shape for the 2 gram shell in red, for the 5gram in blue, and for the 8 gram in green.
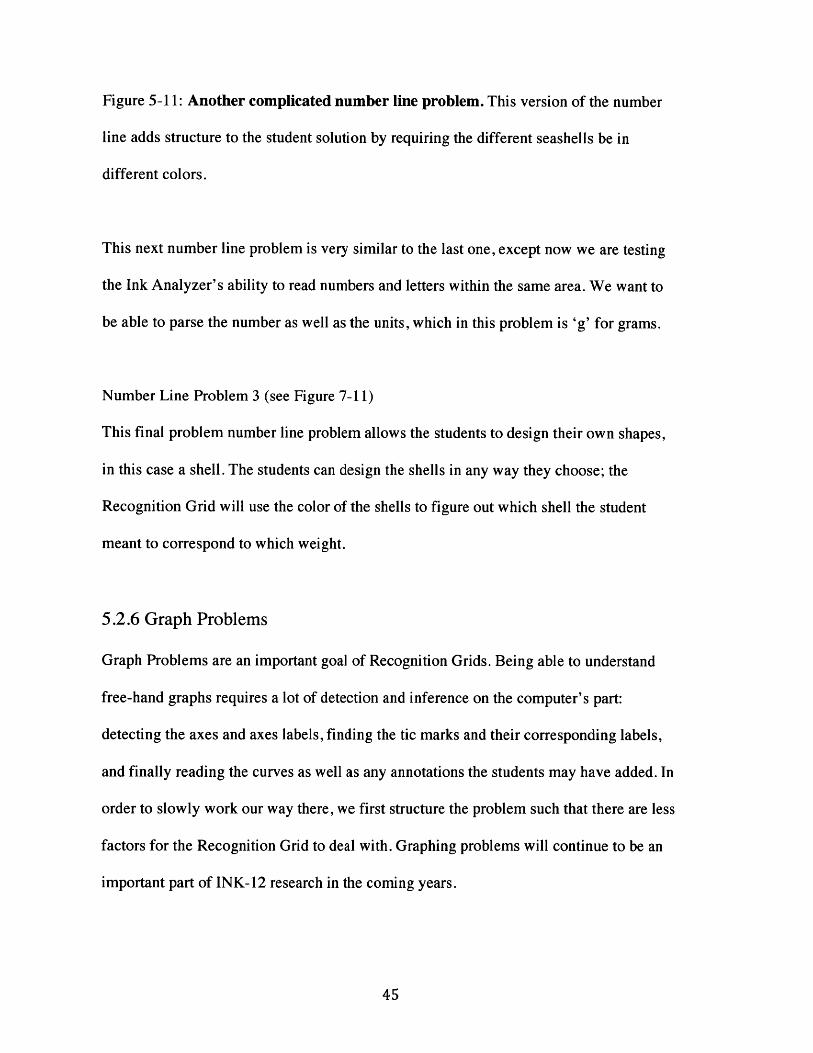
Figure 5-11: Another complicated number line problem. This version of the number
line adds structure to the student solution by requiring the different seashells be in
different colors.
This next number line problem is very similar to the last one, except now we are testing
the Ink Analyzer's ability to read numbers and letters within the same area. We want to
be able to parse the number as well as the units, which in this problem is 'g' for grams.
Number Line Problem 3 (see Figure 7-11)
This final problem number line problem allows the students to design their own shapes,
in this case a shell. The students can design the shells in any way they choose; the
Recognition Grid will use the color of the shells to figure out which shell the student
meant to correspond to which weight.
5.2.6 Graph Problems
Graph Problems are an important goal of Recognition Grids. Being able to understand
free-hand graphs requires a lot of detection and inference on the computer's part:
detecting the axes and axes labels, finding the tic marks and their corresponding labels,
and finally reading the curves as well as any annotations the students may have added. In
order to slowly work our way there, we first structure the problem such that there are less
factors for the Recognition Grid to deal with. Graphing problems will continue to be an
important part of INK-12 research in the coming years.
Graph Problem 1
11. Plot these points in the color indicated(5, 10) black(0, 5) red(15, 15) green(2, 2) purple
Figure 5-12: Students are asked to plot different points in different colors. They are
given the x and y-axis as well as background grid lines to help them visually draw lines
from the axes.
One helpful tool that young students may need when graphing is a grid. A grid in the
background of the graph gives students guidelines to follow when tracing from the x-axis
and y-axis. In the first problem, we provide the students the axes, the axes labels, tic
marks, tic labels, and a background grid. We have isolated it so that they only thing the
students need to add are the points in their specified colors. This example will test if, by
providing enough structure to the problem, students will answer the problem in a way
that is very easy for the Recognition Grid to interpret.
Graph Problem 2
12. Plot these points in the color indicated(0, 5) black(15, 20) green(10, 10) blue(12, 7) purple
201
Figure 5-13: Another problem where students are asked to plot points in different
colors. Unlike the problem in Figure 7-12, the background grid is no longer provided for
the students, making it harder to measure from the axes visually. We expect less accurate
solutions as a result of this removal of structure.
The next graph problem poses the same question as the previous problem, except now we
have removed the background grid. We will see if the removal of this structure in the
problem affects how students answer the problem. Once again, the optimal solutions for
the Recognition Grid are if the student only plots the points in the specified colors and
does not add any other additional strokes to the InkCanvas. If the student does add extra
strokes that are not the points, the Recognition Grid must figure out which Ink Strokes
are relevant to the answer and which strokes are scratch work.
Graph Problem 3
13. Here is a table that shows how tall a plant was each day for 6 days. Create a graph that showsthe growth of the plant by plotting these 6 points and connecting with them a line.Day Height of Plant1 1 cm2 3 cm3 5 cm4 6 cm5 10 cm6 11 cm
-4-
* V Kay
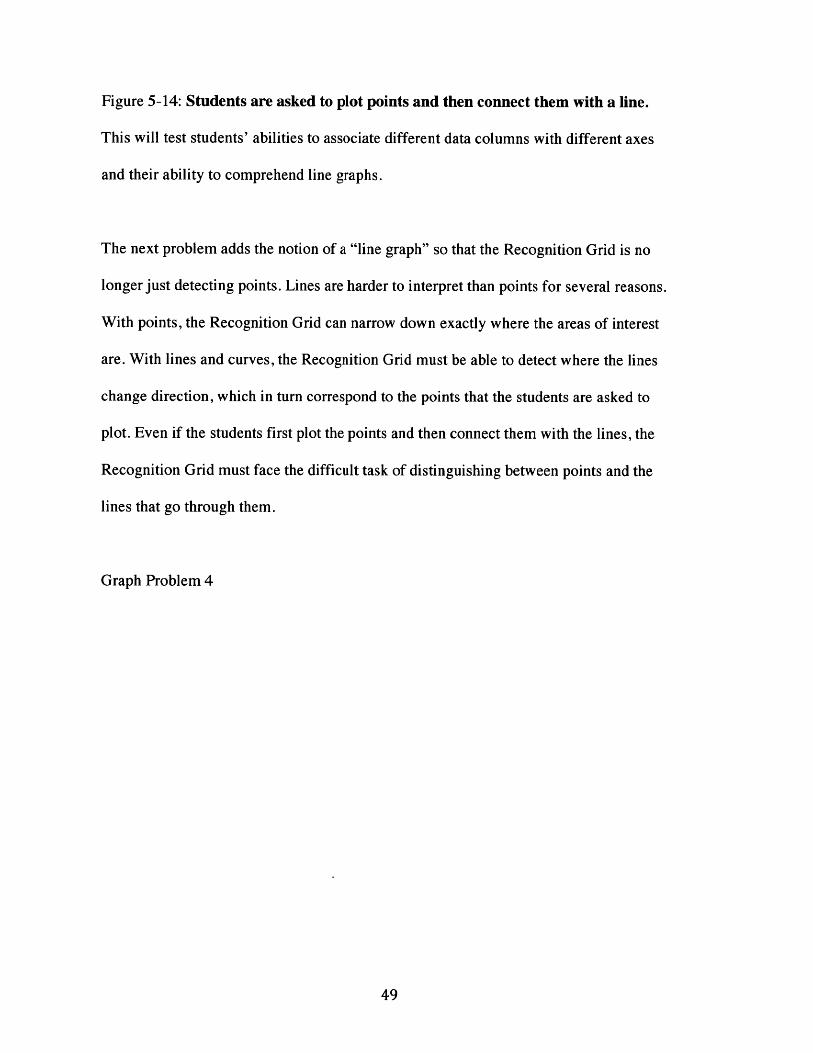
Figure 5-14: Students are asked to plot points and then connect them with a line.
This will test students' abilities to associate different data columns with different axes
and their ability to comprehend line graphs.
The next problem adds the notion of a "line graph" so that the Recognition Grid is no
longer just detecting points. Lines are harder to interpret than points for several reasons.
With points, the Recognition Grid can narrow down exactly where the areas of interest
are. With lines and curves, the Recognition Grid must be able to detect where the lines
change direction, which in turn correspond to the points that the students are asked to
plot. Even if the students first plot the points and then connect them with the lines, the
Recognition Grid must face the difficult task of distinguishing between points and the
lines that go through them.
Graph Problem 4
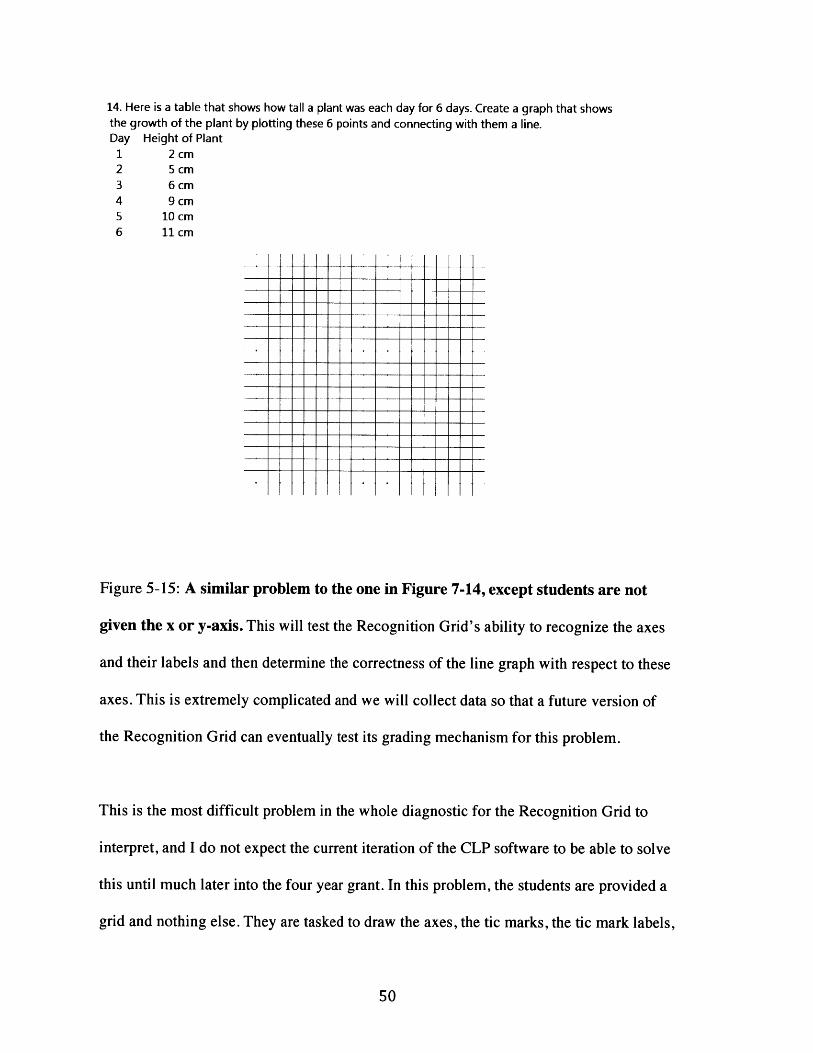
14. Here is a table that shows how tall a plant was each day for 6 days. Create a graph that showsthe growth of the plant by plotting these 6 points and connecting with them a line.Day Height of Plant1 2 cm2 5 cm3 6 cm4 9 cm5 10 cm6 11 cm
it ~
Figure 5-15: A similar problem to the one in Figure 7-14, except students are not
given the x or y-axis. This will test the Recognition Grid's ability to recognize the axes
and their labels and then determine the correctness of the line graph with respect to these
axes. This is extremely complicated and we will collect data so that a future version of
the Recognition Grid can eventually test its grading mechanism for this problem.
This is the most difficult problem in the whole diagnostic for the Recognition Grid to
interpret, and I do not expect the current iteration of the CLP software to be able to solve
this until much later into the four year grant. In this problem, the students are provided a
grid and nothing else. They are tasked to draw the axes, the tic marks, the tic mark labels,
the points from the table, and then the lines to connect the points. All of the above strokes
must be interpreted by the Recognition Grid and sorted into the proper category, and if
any one of these elements is interpreted correctly, the student solution could be
recognized incorrectly. For example, if an x-axis tic marker label is interpreted
incorrectly, the software may mistakenly believe that the student plotted the line
incorrectly along the x-axis. This problem is designed not so much to test the existing
capabilities of the Recognition Grid, but the gather data for future development on it.
5.2.7 Text Sampling Problems
The text sampling problems are the last two problems that show up on the page. These
problems are meant to test the accuracy of the Ink Analyzer when it is tasked with
interpreting plain text. We separate the copying section from the answer section by
asking the students to write their solution in a bolded box. This way, we can test if there
is enough structure in the problem when we try to geographically separate two different
parts of a student solution.
15. Copy the following words and punctuation exactly, then in the box write your answer to the riddle:1. What goes up the chimney down,But can't go down the chimney up?
zmJFigure 5-16: Students are asked to copy a piece of text and then give a one-word
answer in the box. Hopefully the students will keep their answers contained in the box.
16. Copy the following words and2. What comes once in a minute,Twice in a moment,But never in a thousand years?
punctuation exactly, then in the box write your answer to the riddle:
ElilillFigure 5-17: Another problem to test the Recognition Grid's text recognition ability.
Chapter 6
Results of the Handwriting Diagnostic
This thesis focuses on testing the effects of structure on handwriting recognition
in the classroom. The groups of handwriting diagnostic exercises were chosen
specifically so that students would answer similar questions consecutively with the same
general knowledge on the topic. Each of the questions in a group varied not in its
difficulty but in the amount of structure provided to the student. We wanted to quantify
the impact that this structure would provide the student.
Initially, I hypothesized that as a student is provided more structure for an
exercise, the more accurate the results would be when interpreted by the Recognition
Grid. We will test this hypothesis by comparing within the groups of diagnostic exercises
and quantifying the differences in the student results. This task will require some
subjective decision making on my part, because I have to visually check if certain student
solutions are obviously correct or obviously incorrect. To produce more accurate
representations of the Recognition Grid results, I added a third category called
"borderline" answers that will encompass results that are not entirely correct or incorrect.
The ultimate goal of the Handwriting Diagnostic, beyond proving or disproving
the hypothesis, is seeing whether or not a statistical method can be created to aggregate
and sort the different student solutions. For example, is it possible to use the standard
deviation of students' results as a way to sort the correct and incorrect solutions? Would
all correct solutions fall within X standard deviations, and all incorrect solutions fall
outside Y standard deviations? As we examine the results of the diagnostic problems, we
will keep this goal in mind. Due to time constraint, not all students worked all problems.
The following sets of problems had sufficient numbers of student answers for our
analysis.
6.1 Structure in the Fraction Coloring Problems
For our first comparison, we took exercises 1 and 2, which are the problems in
which the students are asked to color in 1/3 of a square and then 1/2 of a square,
respectively. Students worked with an internal grid in problem 1, whereas the students
did not have that internal grid in problem 2. In both problems, the students were given the
outer boundary of the square that they are asked to color.
We collected 19 student solutions of the first problem, of which two were obviously
incorrect. The two students who answered the problem incorrectly colored in 1/9 of the
square or 5/9 of the square. Of the remaining 17 solutions, 13 had the correct solution,
while four were mostly correct but were either slightly under-colored or oddly colored in
a way, and I subjectively classified these 4 solutions as "borderline" prior to seeing the
results of the Recognition Grid. It is important that the "borderline" tag was applied
before seeing what the Recognition Grid returned, as this will give me a fair assessment
of how well the Recognition Grid classifies the student solutions compared to human
classification.
54
For the second problem, we also collected 19 student solutions from the same students, of
which one was obviously incorrect. Of the remaining 18 solutions, 15 were obviously
correct, while three were subjectively tagged as borderline. Once again, the borderline
description was applied before the results of the Recognition Grid were calculated.
In both problems, the dimensions of the Recognition Grid were 50 x 50, or 2500
rectangles in total. The number of rectangles enclosed by the square is only 900, because
the Recognition Grid provided some padding between the edge of the outer bounds of the
square and the edge of the Recognition Grid. This is done so that for some exercises, the
computer can record the ink strokes outside of the exercise, either for scratch work
analysis or other purposes.
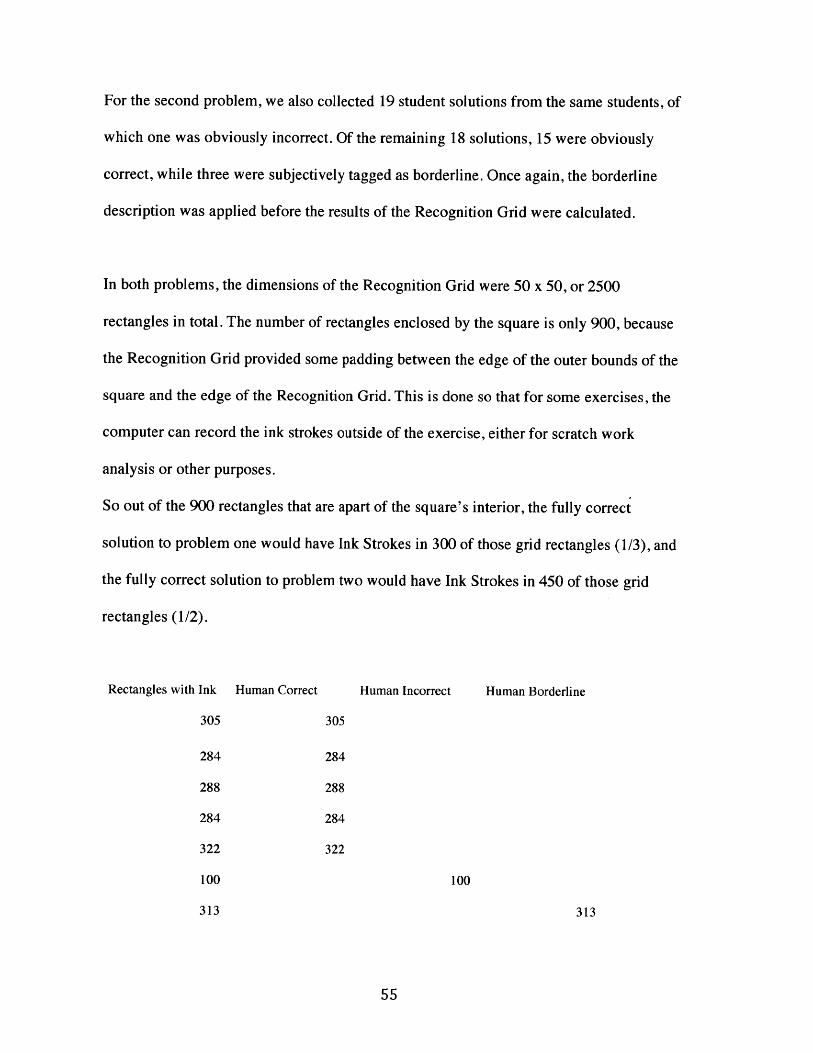
So out of the 900 rectangles that are apart of the square's interior, the fully correct
solution to problem one would have Ink Strokes in 300 of those grid rectangles (1/3), and
the fully correct solution to problem two would have Ink Strokes in 450 of those grid
rectangles (1/2).
Rectangles with Ink Human Correct Human Incorrect Human Borderline
305 305
284 284
288 288
284 284
322 322
100 100
313 313
272
522
264
280
293
297
287
277
294
266
245
293
272
522
264
280
293
297
287
277
294
266
245
293
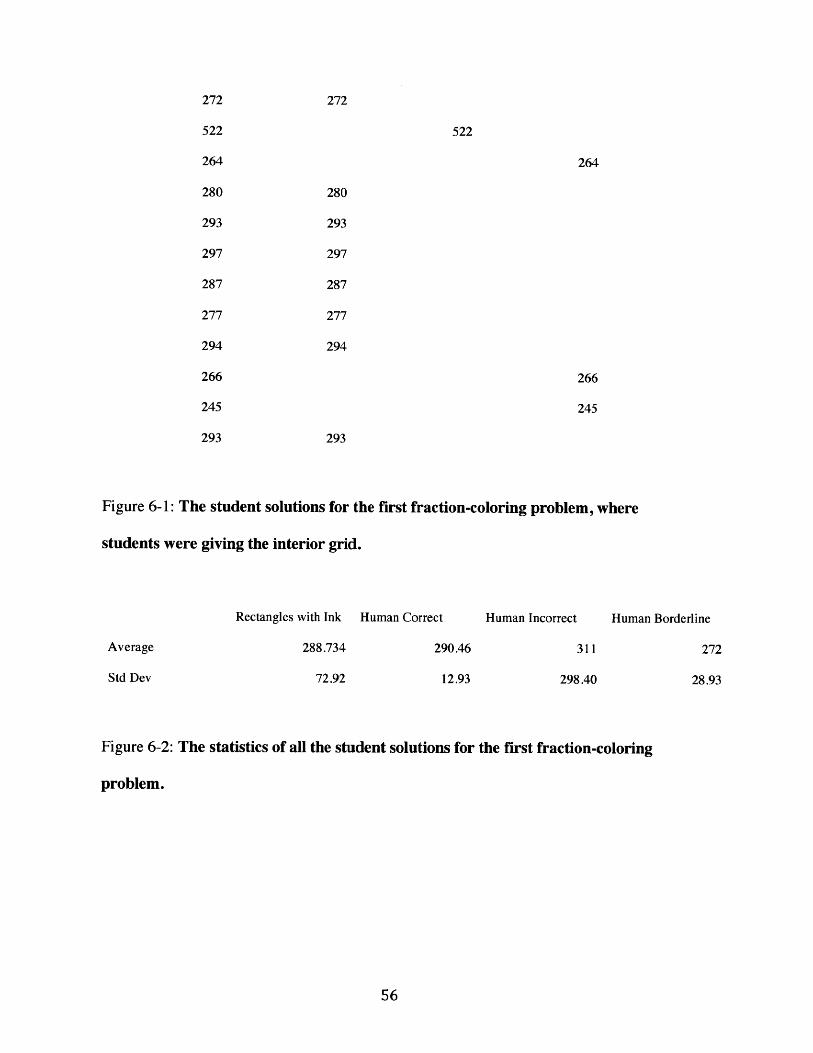
Figure 6-1: The student solutions for the first fraction-coloring problem, where
students were giving the interior grid.
Rectangles with Ink Human Correct
288.734 290.46
72.92 12.93
Human Incorrect
311
298.40
Human Borderline
272
28.93
Figure 6-2: The statistics of all the student solutions for the first fraction-coloring
problem.
Average
Std Dev
Problem One's Empirical Distribution1.2
1
0.8
0.6
0.4
0.2
0
- . I I
. -- - . .I0 100 200 300 400 500 600
Rectangles Filled
Figure 6-3: The empirical distribution function (ECDF) for the first fraction-
coloring problem's solutions. The green circle is the point closest to the average of the
student solutions. The blue circles are the left and right bounds for all data-points within
one standard deviation of the mean. The two red rectangles are the solutions determined
to be incorrect by eye.
We see here that the overall trend of the students was skewed slightly to the left of the
absolute 300 rectangles for a correct solution. We attribute this to not fully coloring in
every part of the square shape's third and the fact that we discounted the filled rectangles
that were outside of the square's outer boundary. These two factors led to the
Recognition Grid producing scores lower than the absolute 300, and this is something we
should account for in future exercises.
................ .. . ...... ...... . ......................
There are several ways that the Recognition Grid could distinguish between correct,
incorrect, and borderline solutions. The two variables in determining this are 1) what the
software uses as the model solution and 2) how we separate between correct, borderline,
and incorrect solutions.
Two options that the Recognition Grid could use as the model solution are the exact
correct solution or the average student solution. On one hand, using the exact correct
solution avoids the scenario in which many students solve the problem incorrectly in the
same manner, skewing the average solution away from the correct solution. On the other
hand, the average solution accounts for factors such as under-coloring that might be apart
of the reality of doing a problem on a tablet computer instead of on paper.
Two options that we could use to determine the correctness of solutions are to use the
standard deviation of the student provided solutions or some arbitrary margin of error that
we create ourselves. The arbitrary margin of error will probably depend on the amount of
structure the problem has, as the more structure a problem has the less leeway instructors
should give the students. For both, let's assume that anything within one margin is
correct, anything between one and two margins is borderline, and anything greater than
two margins from the model solution is incorrect.
Correct /13 Incorrect /2 Borderline /4 Total
Avg + Std Dev 13 2 0 15
Avg + 10% Margin
Exact + Std Dev
Exact + 10% Margin
Figure 6-4: How well the above methods classified the solutions. They are measured
against my eyeballed judgment to show how the program's grading would compare
against human grading.
Solution Classifications
Total
Borderline /4
Incorrect /2
Correct /13
U Exact + 10% Margin
Exact + Std Dev
Avg + 10% Margin
mAvg + Std Dev
0 5 10 15
Figure 6-5: A visual representation of the method's effectiveness in grading the first
fraction-coloring problem. We see that for this problem, using the exact solution as the
model solution and a 10% margin yields the most correctly classified student solutions.
......... ...................
We can see that the only significant difference between the methods of distinguishing
correctness comes when we attempt to determine the borderline solutions. In this
particular problem, the two incorrect student solutions cause the dataset's standard
deviation to be very large, so both the "Avg + Std Dev" and "Exact + Std Dev" method
end up grouping the borderline solutions as correct. Depending on the teacher and the
classroom, this may or may not be the desired result. For the INK-12 grant however, the
active-teacher support is supposed to deliver on-the-fence solutions to the teacher for
human grading. Therefore, an arbitrary 10% margin makes more sense for solution
classification.
Rectangles with Ink
466
370
262
393
453
435
419
410
467
502
454
397
Human Correct Human Incorrect Human Borderline
466
370
262
393
453
435
419
410
467
502
454
397
448 448
470 470
355 355
415 415
429 429
435 435
416 416
Figure 6-6: The solutions for the second fraction-coloring problem. This is the
fraction-coloring problem in which the students did not have the interior grid but still had
the outer boundary of the square visible. We expect students to be less accurate without
the interior grid to rely on, so we expect the standard deviation of the solutions to be
slightly larger than in the first fraction-coloring problem.
Statistics for Problem 2
Rectangles with Ink Human Correct Human Incorrect Human
Average 420.84 440.8 262 374
Std Dev 52.80 28.65 N/A 21.28
Figure 6-7: The statistics for the second fraction-coloring problem. Notice that even if
we are only looking at the human-judged eyeball correct student solutions, the standard
deviation is much larger than in the previous problem.
Problem Two's Empirical Distribution1.2 -
1-
0.8 -
0.6 -
0.4 -
0.2 -
0
100 200 300 400 500
Rectangles Filled
600
Figure 6-8: The Empirical Distribution Function (EDCF) for the second fraction-
coloring problem's solutions. The green circle is the point closest to the average of all
the solutions. The blue circles are the left and right bounds for all solutions within one
standard deviation of the mean. The red square is the one solution deemed incorrect by
eye.
Once again, the solutions are skewed left of the exact correct answer, which is 450 filled
rectangles. Factors that cause this left skew include the fact that Strokes outside the outer-
boundary of the square were discounted. In addition, when students only slightly under-
colored half of the square, the Recognition Grid interprets it as students purposely not
putting Ink Strokes in part of the grid.
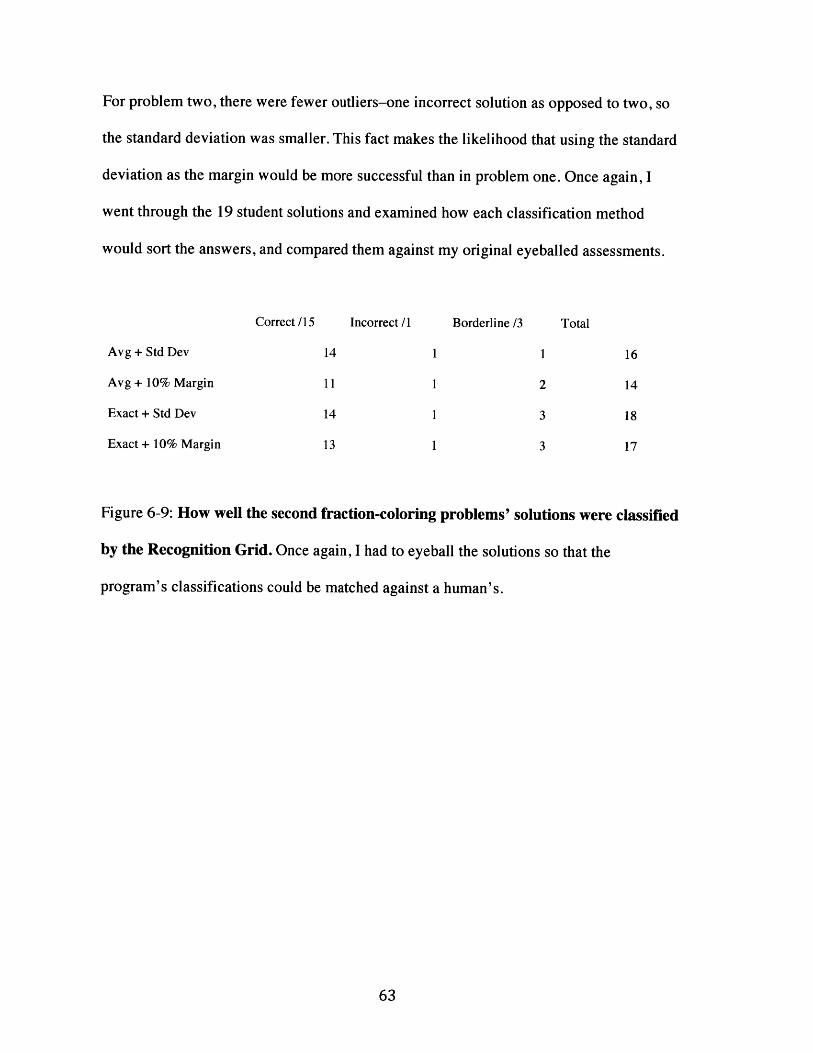
For problem two, there were fewer outliers-one incorrect solution as opposed to two, so
the standard deviation was smaller. This fact makes the likelihood that using the standard
deviation as the margin would be more successful than in problem one. Once again, I
went through the 19 student solutions and examined how each classification method
would sort the answers, and compared them against my original eyeballed assessments.
Correct /15 Incorrect /1 Borderline /3 Total
Avg + Std Dev 14 1 1 16
Avg + 10% Margin 11 1 2 14
Exact + Std Dev 14 1 3 18
Exact + 10% Margin 13 1 3 17
Figure 6-9: How well the second fraction-coloring problems' solutions were classified
by the Recognition Grid. Once again, I had to eyeball the solutions so that the
program's classifications could be matched against a human's.
Solution Classifications
Total
Borderline /3
Incorrect /1
Correct /15
I- - i
xact + 10% Margin
Exact + Std Dev
*Avg + 10% Margin
* Avg + Std Dev
15 20
Figure 6-10: A visual representation of how well the Recognition Grid classified the
student solutions. In this case, it appears that using the exact solution as the model
solution and the standard deviation yielded the best results. Using the exact solution
instead of the average in both this problem and the previous one appears to be the best
way to classify solutions.
In this problem, there is a less stark difference when using the standard deviation or using
the 10% margin. This situation is because the standard deviation in this problem is closer
to 10% of the correct solution by virtue of there being fewer wildly incorrect solutions.
This fact suggests that using the standard deviation is not robust for solution
classification, because outliers too easily affect the standard deviation. These outliers
have no correlation with the problem itself, and could be impacted by how well the
instructor reviews the material before the students answer the problems.
We also notice that using the exact solution as the model solution once again classifies
the borderline solutions more reliably than the average solutions. If we want the CLP
software to consistently pass along borderline solutions to the teacher to be graded in
person, we should use the exact solution instead of the average. It appears that by using
the average solution in the model, the natural skew of student solutions is in the direction
of many of these borderline solutions.
6.2 Results of Detecting Table Entries
Table Entry Problems are an excellent use for handwriting recognition tools.
Imagine a group of students gathered around a science experiment, recording their results
in a table in their digital notebooks. These notebooks are wirelessly sent to the teacher,
and handwriting technology software on the teacher's notebook automatically parses and
translates the Ink Strokes on each notebook, converting them to the proper numbers and
units. These numbers and units are then measured against the teacher's solution, and any
outliers are presented to the teacher. The teacher then heads the outlier's group's
experiment and works with the students to overcome any improper setups or methods that
are leading to incorrect results.
Without the handwriting recognition software, teachers would have to wait and go
over all of the data themselves before being able to pick out the groups that might need
help. By then, the experiment would have been finished and any advice the teacher gives
would be retroactive and reliant on the fact that the students remembered exactly what
they had done. By adding real-time table entry detection, errors can be caught as they
occur, and students can get the feedback as they are performing the experiments.
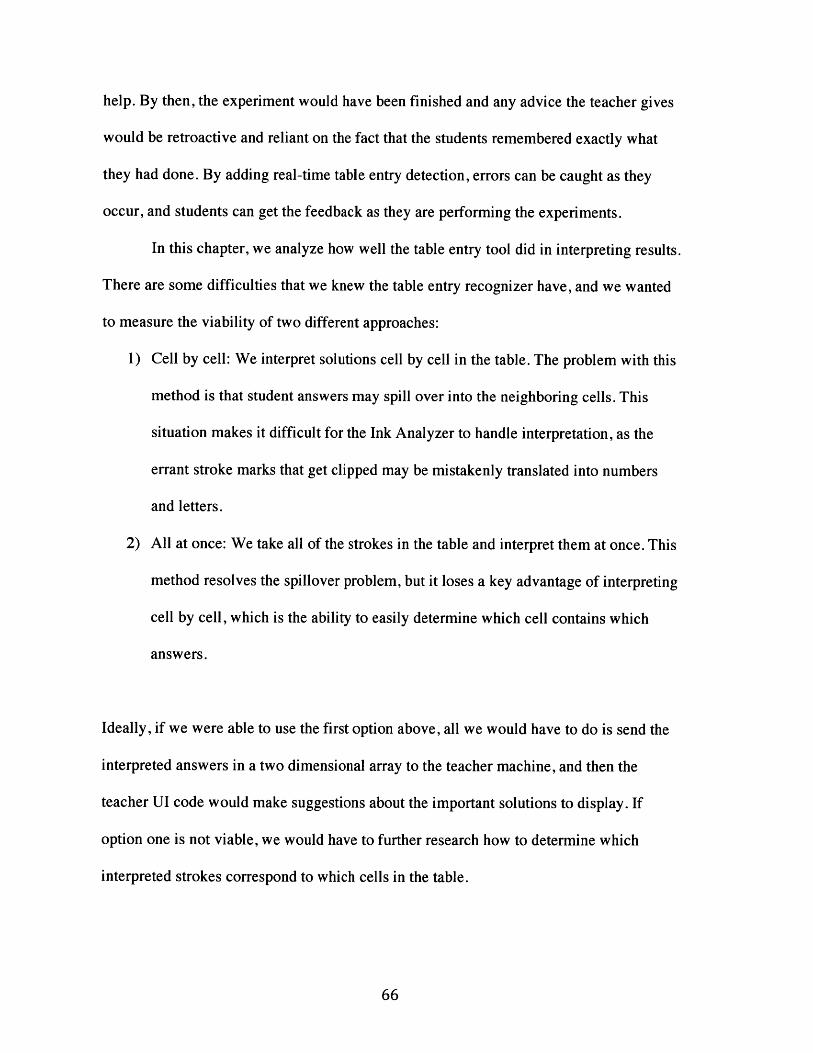
In this chapter, we analyze how well the table entry tool did in interpreting results.
There are some difficulties that we knew the table entry recognizer have, and we wanted
to measure the viability of two different approaches:
1) Cell by cell: We interpret solutions cell by cell in the table. The problem with this
method is that student answers may spill over into the neighboring cells. This
situation makes it difficult for the Ink Analyzer to handle interpretation, as the
errant stroke marks that get clipped may be mistakenly translated into numbers
and letters.
2) All at once: We take all of the strokes in the table and interpret them at once. This
method resolves the spillover problem, but it loses a key advantage of interpreting
cell by cell, which is the ability to easily determine which cell contains which
answers.
Ideally, if we were able to use the first option above, all we would have to do is send the
interpreted answers in a two dimensional array to the teacher machine, and then the
teacher UI code would make suggestions about the important solutions to display. If
option one is not viable, we would have to further research how to determine which
interpreted strokes correspond to which cells in the table.
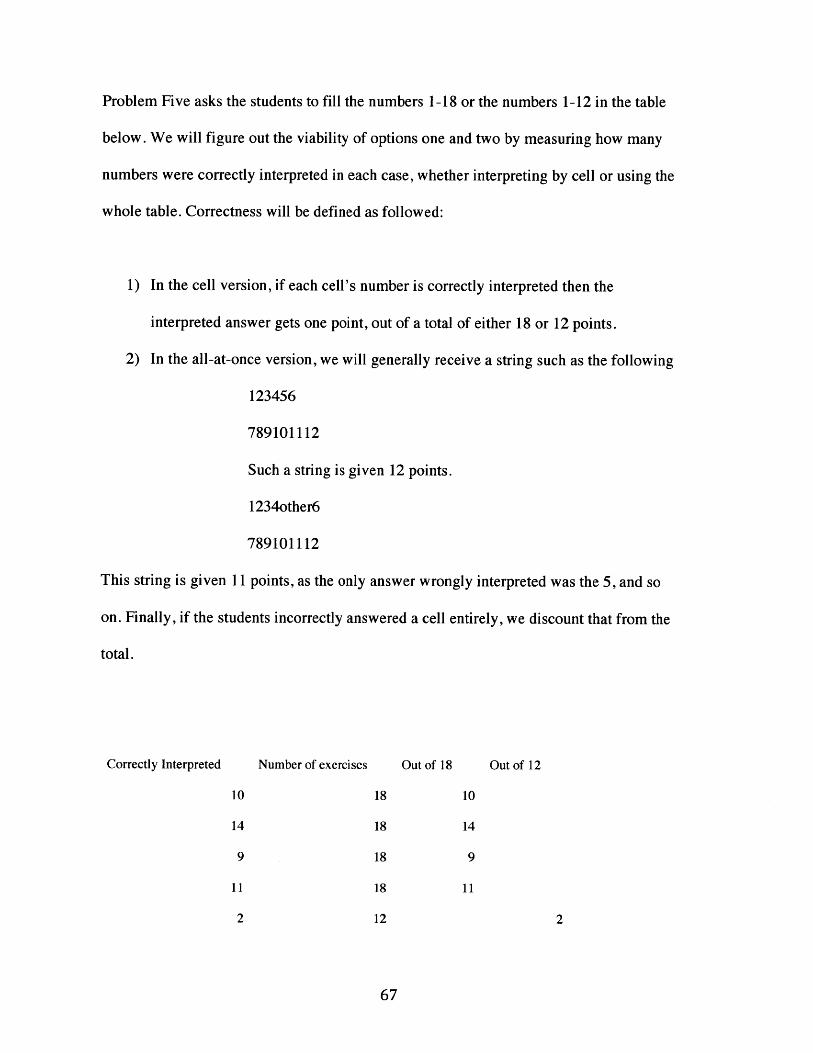
Problem Five asks the students to fill the numbers 1-18 or the numbers 1-12 in the table
below. We will figure out the viability of options one and two by measuring how many
numbers were correctly interpreted in each case, whether interpreting by cell or using the
whole table. Correctness will be defined as followed:
1) In the cell version, if each cell's number is correctly interpreted then the
interpreted answer gets one point, out of a total of either 18 or 12 points.
2) In the all-at-once version, we will generally receive a string such as the following
123456
789101112
Such a string is given 12 points.
1234other6
789101112
This string is given 11 points, as the only answer wrongly interpreted was the 5, and so
on. Finally, if the students incorrectly answered a cell entirely, we discount that from the
total.
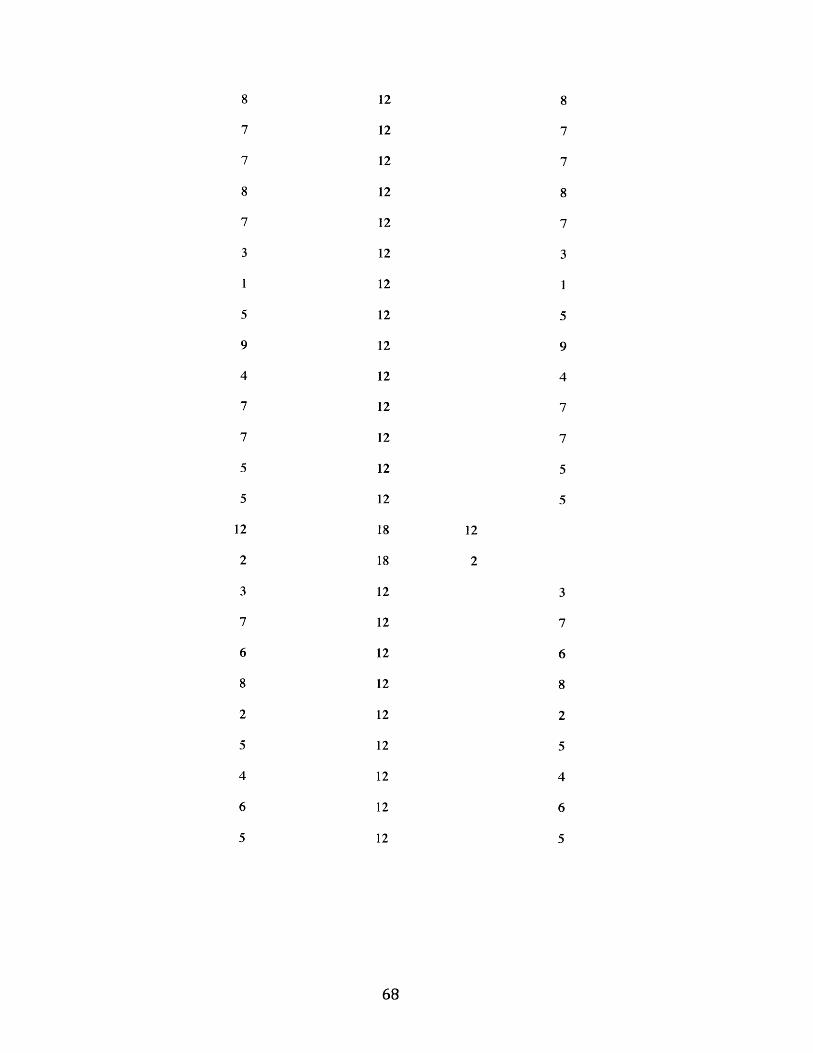
Correctly Interpreted Number of exercises Out of 18 Out of 12
10 18 10
14 18 14
9 18 9
11 18 11
2 12 2
8 12 8
7 12 7
7 12 7
8 12 8
7 12 7
3 12 3
1 12 1
5 12 5
9 12 9
4 12 4
7 12 7
7 12 7
5 12 5
5 12 5
12 18 12
2 18 2
3 12 3
7 12 7
6 12 6
8 12 8
2 12 2
5 12 5
4 12 4
6 12 6
5 12 5
68
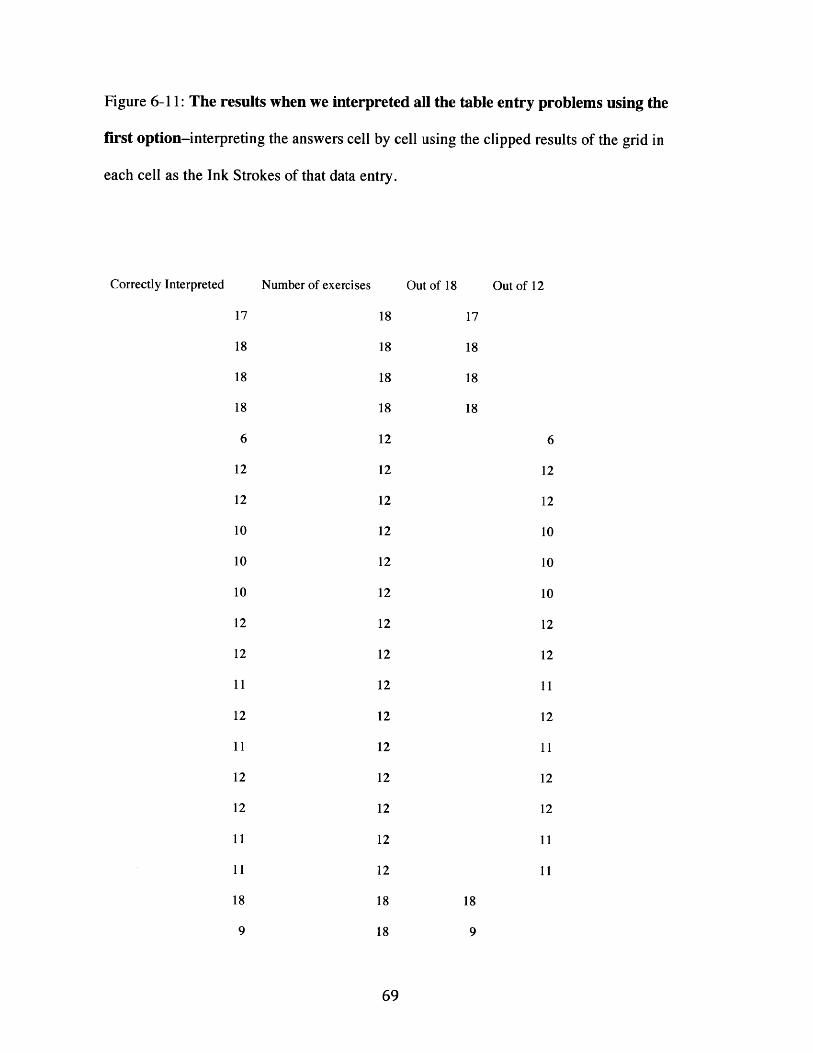
Figure 6-11: The results when we interpreted all the table entry problems using the
first option-interpreting the answers cell by cell using the clipped results of the grid in
each cell as the Ink Strokes of that data entry.
Correctly Interpreted Number of exercises Out of 18 Out of 12
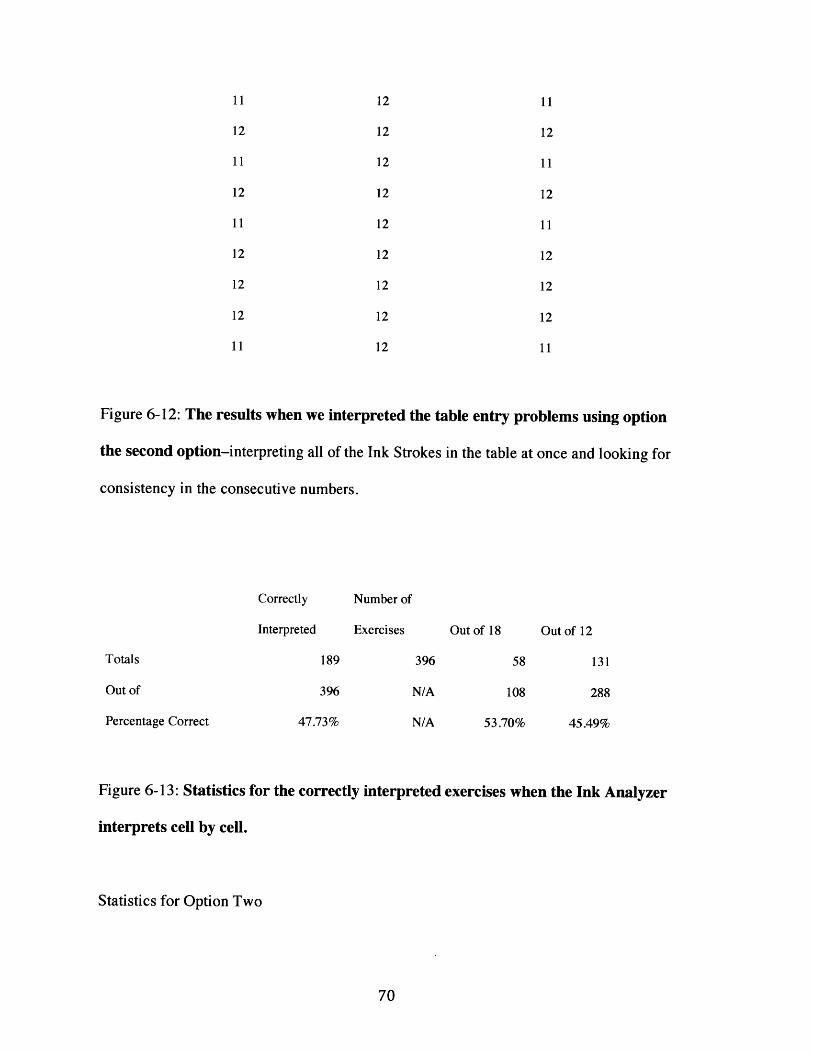
Figure 6-12: The results when we interpreted the table entry problems using option
the second option-interpreting all of the Ink Strokes in the table at once and looking for
consistency in the consecutive numbers.
Correctly
Interpreted
Totals
Out of
Percentage Correct
Number of
Exercises
189
396
47.73%
396
N/A
N/A
Out of 18
58
108
53.70%
Figure 6-13: Statistics for the correctly interpreted exercises when the Ink Analyzer
interprets cell by cell.
Statistics for Option Two
Out of 12
131
288
45.49%
Correctly Number of
Interpreted Exercises Out of 18 Out of 12
Totals 366 396 98 268
Out of 396 N/A 108 288
Percentage Correct 92.42% N/A 90.74% 93.06%
Figure 6-14: Statistics for correctly interpreted exercises when the Ink Analyzer
interprets the entire table at once.
The results tell us that improvements have to be made to option one before it can be
viable in the classroom. It has roughly a coin flip's chance of correctly interpreting the
number in the cell. After reviewing the most poorly interpreted solutions, I saw that a
common pattern was that the students would often have Ink Strokes spilling over into
neighboring cells as I feared. It appears that the software cannot rely on students to write
perfectly inside the lines. Thus, further work has to be done for the tablet entry problem,
in one of three directions
1) The table has to be redefined visually so that students are less prone to crossing
over the lines.
2) The cells should have some way of inferring the Ink Strokes that are purposely
meant to be a part of the cell and the Ink Strokes that are incidental from other
cells.
3) We should expand upon Option Two-using the entire table's strokes at once. If
we choose this method, we would have to code for additional support in being
able to map numbers to the cells so we could identify particular answers.

While adding this capability would greatly help instructors in the classroom, the
Recognition Grid support for table entry is not reliable enough to actively support the
teacher yet. There is still work to be done to improve this particular piece of the
Recognition Grid.
6.3 Detecting the Number Grid Color Solutions
The next problem I will analyze is the number grid problem, which will test our ability to
use color interpretation in the context of math exercises.
8. Circle in red the multiples of 2. Circle in blue the multiples of 3
Students are shown a number grid and then asked to make notations on that number grid.
In this example, students are asked to circle multiples of two in one color and multiples
of three in another color. The Recognition Grid's job is to interpret which cells in the
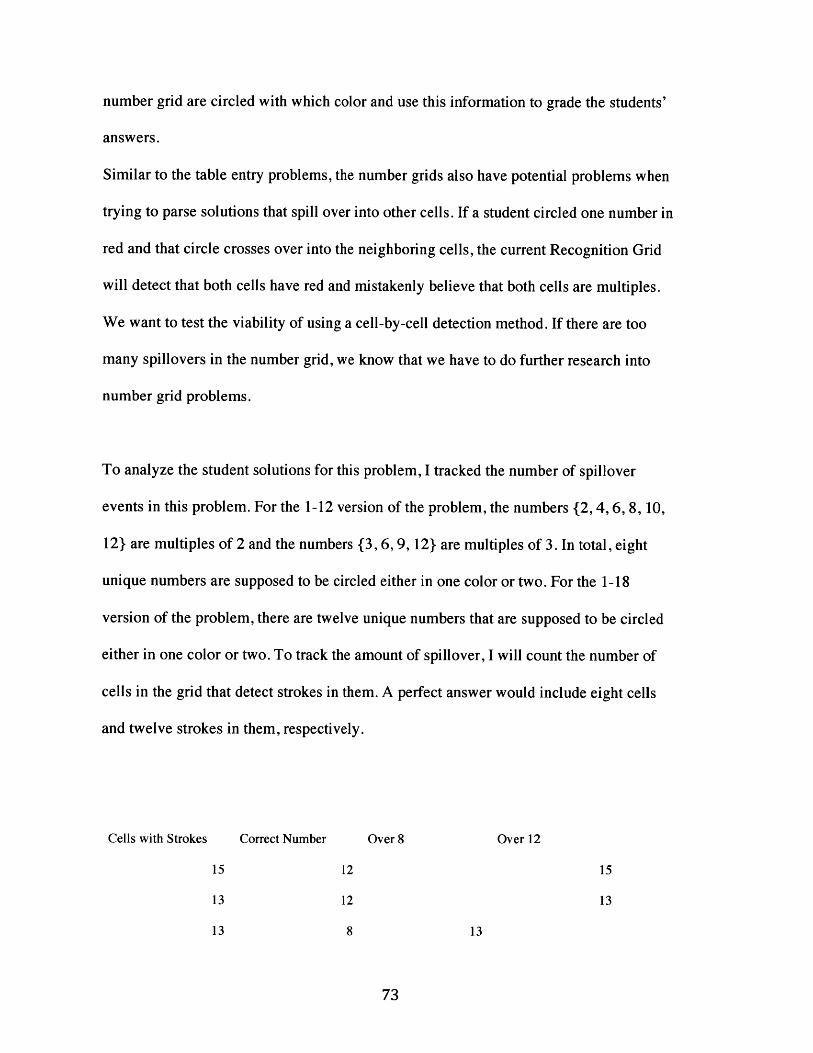
number grid are circled with which color and use this information to grade the students'
answers.
Similar to the table entry problems, the number grids also have potential problems when
trying to parse solutions that spill over into other cells. If a student circled one number in
red and that circle crosses over into the neighboring cells, the current Recognition Grid
will detect that both cells have red and mistakenly believe that both cells are multiples.
We want to test the viability of using a cell-by-cell detection method. If there are too
many spillovers in the number grid, we know that we have to do further research into
number grid problems.
To analyze the student solutions for this problem, I tracked the number of spillover
events in this problem. For the 1-12 version of the problem, the numbers {2, 4, 6, 8, 10,
12} are multiples of 2 and the numbers {3, 6, 9, 12} are multiples of 3. In total, eight
unique numbers are supposed to be circled either in one color or two. For the 1-18
version of the problem, there are twelve unique numbers that are supposed to be circled
either in one color or two. To track the amount of spillover, I will count the number of
cells in the grid that detect strokes in them. A perfect answer would include eight cells
and twelve strokes in them, respectively.
Cells with Strokes Correct Number Over 8 Over 12
15 12 15
13 12 13
13 8 13
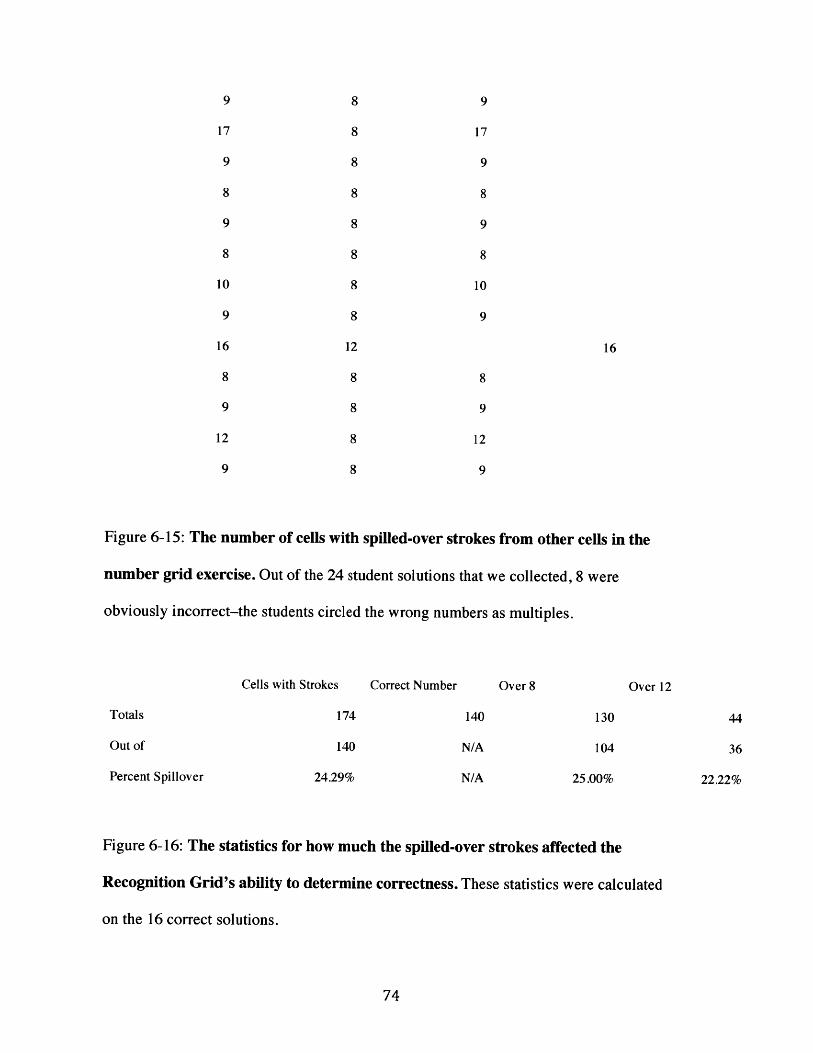
9 8 9
17 8 17
9 8 9
8 8 8
9 8 9
8 8 8
10 8 10
9 8 9
16 12 16
8 8 8
9 8 9
12 8 12
9 8 9
Figure 6-15: The number of cells with spilled-over strokes from other cells in the
number grid exercise. Out of the 24 student solutions that we collected, 8 were
obviously incorrect-the students circled the wrong numbers as multiples.
Cells with Strokes Correct Number Over 8 Over 12
Totals 174 140 130 44
Out of 140 N/A 104 36
Percent Spillover 24.29% N/A 25.00% 22.22%
Figure 6-16: The statistics for how much the spilled-over strokes affected the
Recognition Grid's ability to determine correctness. These statistics were calculated
on the 16 correct solutions.
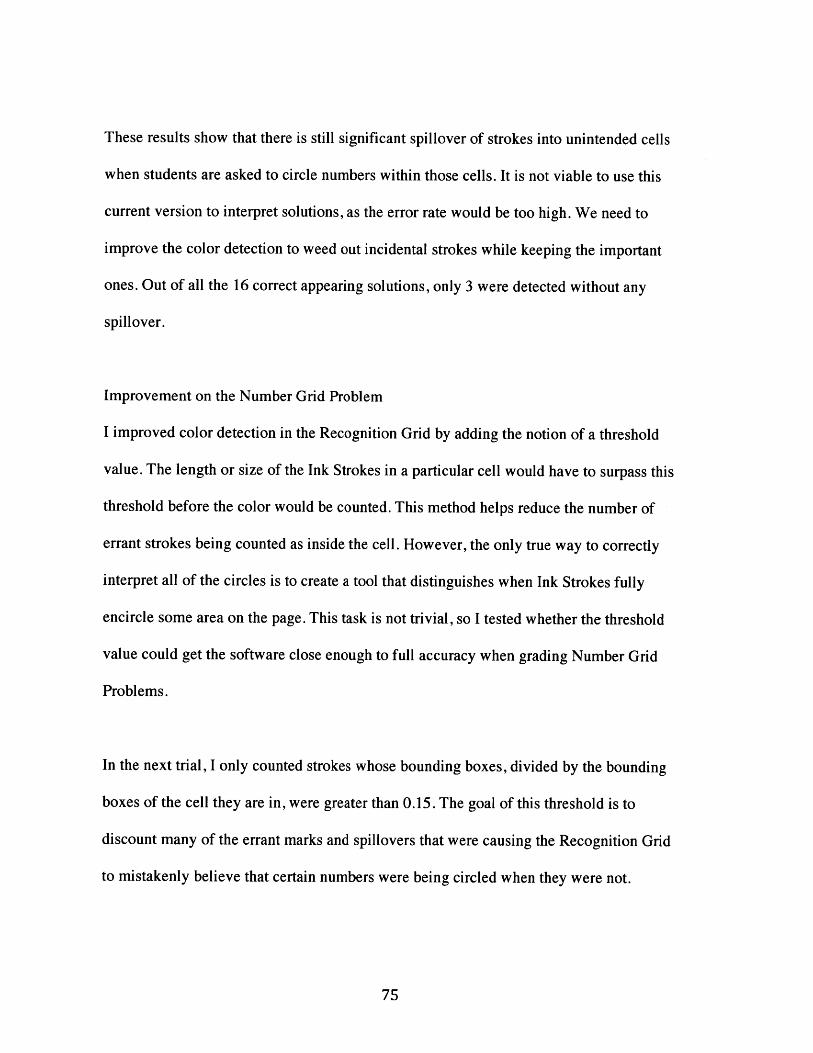
These results show that there is still significant spillover of strokes into unintended cells
when students are asked to circle numbers within those cells. It is not viable to use this
current version to interpret solutions, as the error rate would be too high. We need to
improve the color detection to weed out incidental strokes while keeping the important
ones. Out of all the 16 correct appearing solutions, only 3 were detected without any
spillover.
Improvement on the Number Grid Problem
I improved color detection in the Recognition Grid by adding the notion of a threshold
value. The length or size of the Ink Strokes in a particular cell would have to surpass this
threshold before the color would be counted. This method helps reduce the number of
errant strokes being counted as inside the cell. However, the only true way to correctly
interpret all of the circles is to create a tool that distinguishes when Ink Strokes fully
encircle some area on the page. This task is not trivial, so I tested whether the threshold
value could get the software close enough to full accuracy when grading Number Grid
Problems.
In the next trial, I only counted strokes whose bounding boxes, divided by the bounding
boxes of the cell they are in, were greater than 0.15. The goal of this threshold is to
discount many of the errant marks and spillovers that were causing the Recognition Grid
to mistakenly believe that certain numbers were being circled when they were not.
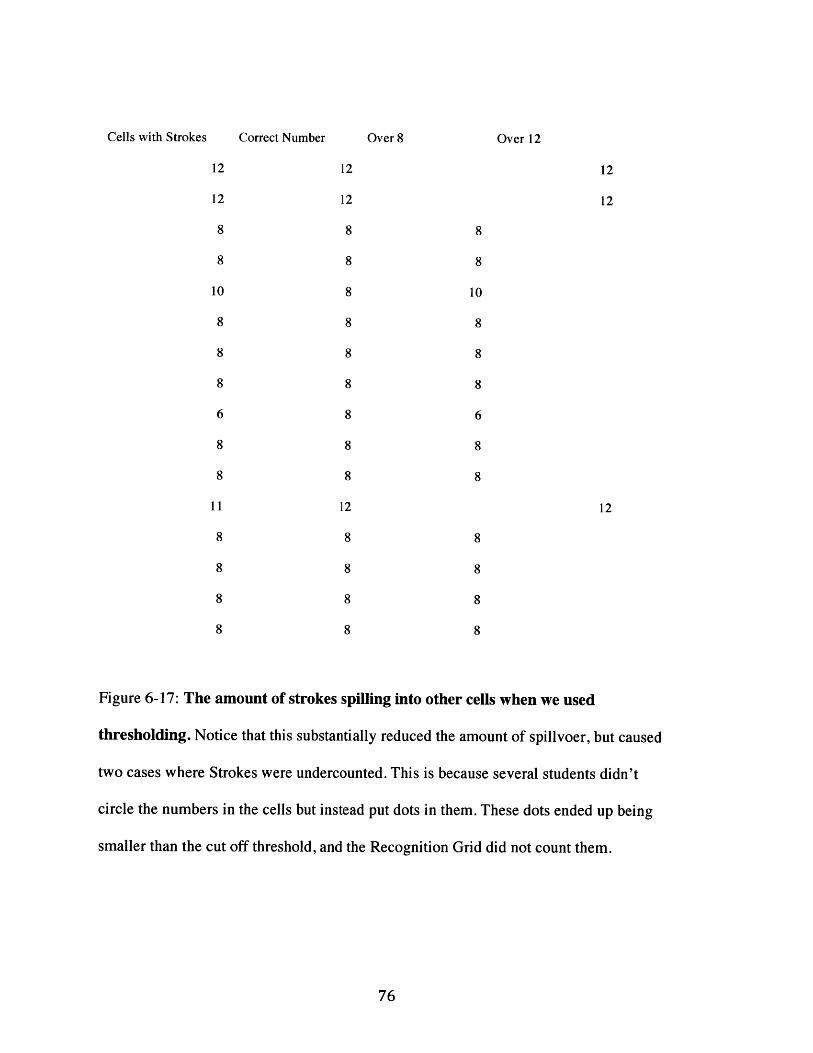
Correct Number Over 8
12 12 12
12 12 12
8 8 8
8 8 8
10 8 10
8 8 8
8 8 8
8 8 8
6 8 6
8 8 8
8 8 8
11 12 12
8 8 8
8 8 8
8 8 8
8 8 8
Figure 6-17: The amount of strokes spilling into other cells when we used
thresholding. Notice that this substantially reduced the amount of spillvoer, but caused
two cases where Strokes were undercounted. This is because several students didn't
circle the numbers in the cells but instead put dots in them. These dots ended up being
smaller than the cut off threshold, and the Recognition Grid did not count them.
Cells with Strokes Over 12
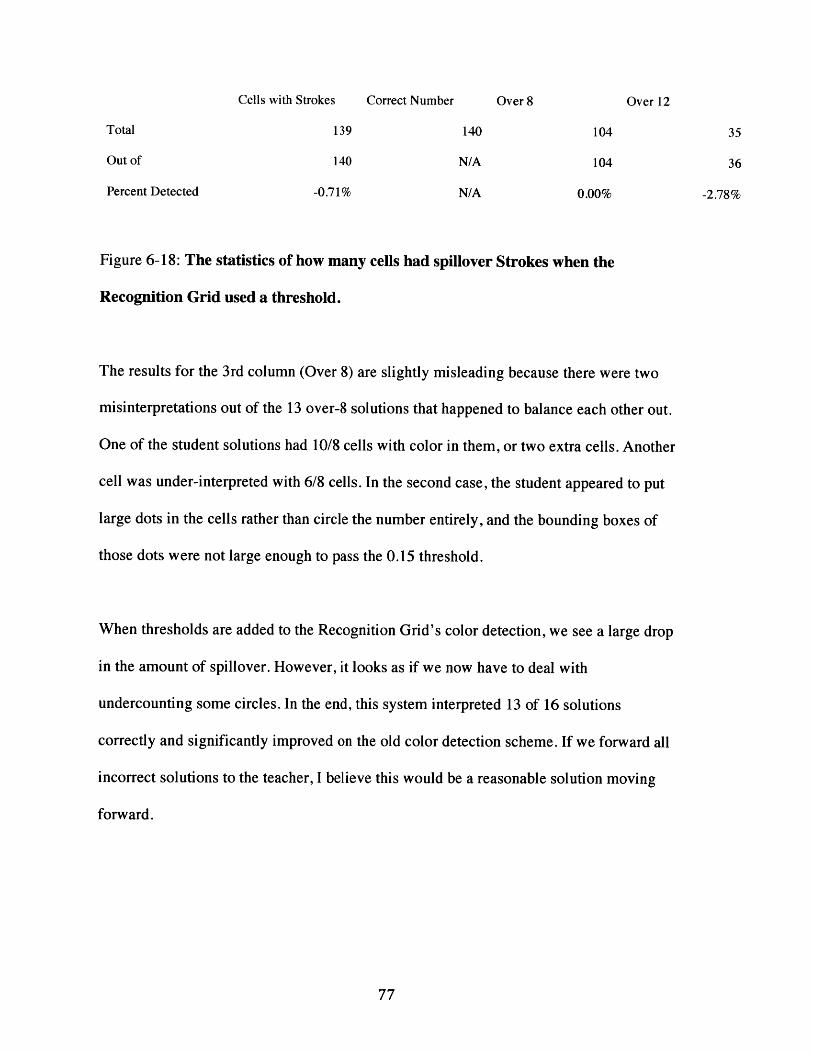
Correct Number Over 8
Total
Out of
Percent Detected
139
140
-0.71%
140
N/A
N/A
104
104
0.00%
Figure 6-18: The statistics of how many cells had spillover Strokes when the
Recognition Grid used a threshold.
The results for the 3rd column (Over 8) are slightly misleading because there were two
misinterpretations out of the 13 over-8 solutions that happened to balance each other out.
One of the student solutions had 10/8 cells with color in them, or two extra cells. Another
cell was under-interpreted with 6/8 cells. In the second case, the student appeared to put
large dots in the cells rather than circle the number entirely, and the bounding boxes of
those dots were not large enough to pass the 0.15 threshold.
When thresholds are added to the Recognition Grid's color detection, we see a large drop
in the amount of spillover. However, it looks as if we now have to deal with
undercounting some circles. In the end, this system interpreted 13 of 16 solutions
correctly and significantly improved on the old color detection scheme. If we forward all
incorrect solutions to the teacher, I believe this would be a reasonable solution moving
forward.
35
36
-2.78%
Cells with Strokes Over 12
6.4 The Effects of Structure in Graph Recognition
One of the more advanced problems that the Recognition Grid is built to handle is
detecting points plotted on a graph. In the Graph Problem of the Handwriting Diagnostic,
students were tasked, in two separate problems, with plotting various points in different
colors on a graph. In the first problem, the students were provided the set of axes and a
grid and in the second problem, the students still had the x axis and y axis but no longer
had the grid. I want to measure the effect of the grid on the student's ability to accurately
plot points, and I want to determine if any drop in accuracy could negatively impact the
Recognition Grid's ability to determine solution correctness.
I measured correctness in the solution using the following method:
I grouped all strokes of the same color together, so that all blue Ink Strokes on the
Recognition Grid were in one Stroke Collection, all red Ink Strokes were in another
Stroke Collection, and so on. I then took the bounding boxes of each of the separate
Stroke Collections so that afterwards, I would have a Rectangle object for every unique
color that was in used in the student's solution. Finally, I would take the center-point of
each of these Rectangles (by taking the Top Left point of the Rectangle and adding half
the width and half the height to the X and Y values, respectively). This center-point for
each color estimates the exact coordinates of the student-plotted point. These center
points are compared to the teacher solutions, and if the distance squared between is less
than 100 pixels squared, the Recognition Grid will count it as a correct solution. If the
distance squared is greater than 100 pixels squared, the Recognition Grid will count it as
a correct solution.
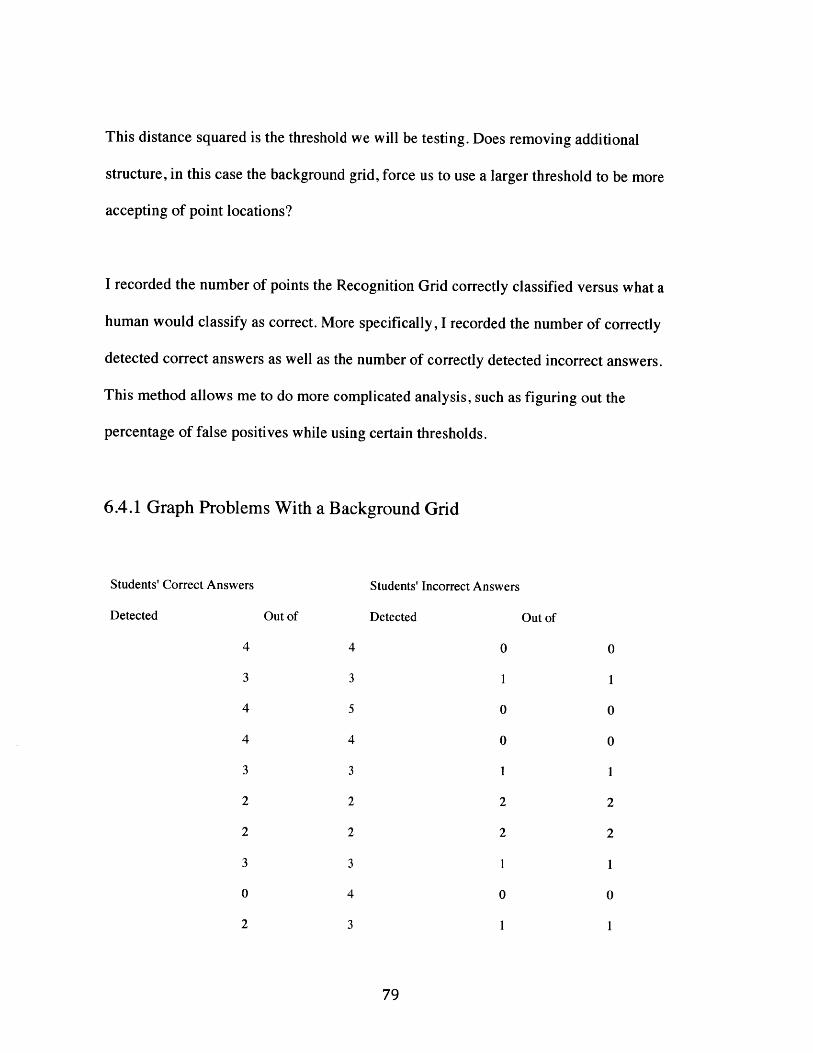
This distance squared is the threshold we will be testing. Does removing additional
structure, in this case the background grid, force us to use a larger threshold to be more
accepting of point locations?
I recorded the number of points the Recognition Grid correctly classified versus what a
human would classify as correct. More specifically, I recorded the number of correctly
detected correct answers as well as the number of correctly detected incorrect answers.
This method allows me to do more complicated analysis, such as figuring out the
percentage of false positives while using certain thresholds.
6.4.1 Graph Problems With a Background Grid
Students' Correct Answers Students' Incorrect Answers
Detected Out of Detected Out of
4 4 0 0
3 3 1 1
4 5 0 0
4 4 0 0
3 3 1 1
2 2 2 2
2 2 2 2
3 3 1 1
0 4 0 0
2 3 1 1
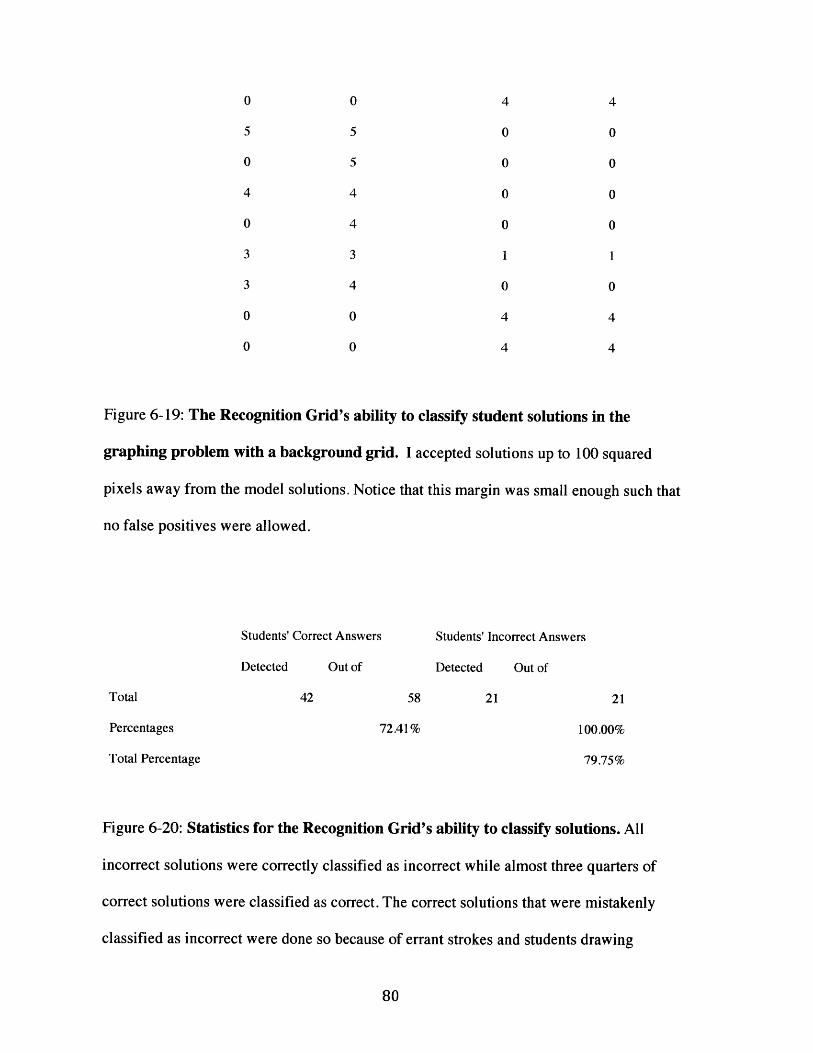
0 0 4 4
5 5 0 0
0 5 0 0
4 4 0 0
0 4 0 0
3 3 1 1
3 4 0 0
0 0 4 4
0 0 4 4
Figure 6-19: The Recognition Grid's ability to classify student solutions in the
graphing problem with a background grid. I accepted solutions up to 100 squared
pixels away from the model solutions. Notice that this margin was small enough such that
no false positives were allowed.
Students' Correct Answers Students' Incorrect Answers
Detected Out of Detected Out of
Total 42 58 21 21
Percentages 72.41% 100.00%
Total Percentage 79.75%
Figure 6-20: Statistics for the Recognition Grid's ability to classify solutions. All
incorrect solutions were correctly classified as incorrect while almost three quarters of
correct solutions were classified as correct. The correct solutions that were mistakenly
classified as incorrect were done so because of errant strokes and students drawing
guidelines to accurately plot the points, as these factors would impede the detection
process.
For one of the 0/4 correctly detected problems, the student's solutions were mostly
correct. Upon further inspection, the points were all about (1,1) to the southwest of the
correct point. It appears the student didn't understand that when plotting, the point had to
be exactly on the coordinates and not just underneath and to the left of it. Depending on
the teacher, this may or may not have been accepted as correct. We decided to mark it
incorrect and to let the teacher make that decision. If we removed this one problem from
consideration, the correctly interpreted correct answers rises from 72% to over 77%.
Two problems account for the 0/4 and 0/5 correctly detected problems. In these
problems, students draw guidelines from the x and y-axes up to the point. This ruined the
bounding box detection that the Recognition Grid used and caused the interpreter to
mistake the solutions as incorrect when they were actually correct. If we discount the two
solutions where students drew in guidelines, the percentage of correctly detected correct
answers rises from 72% to almost 86%.
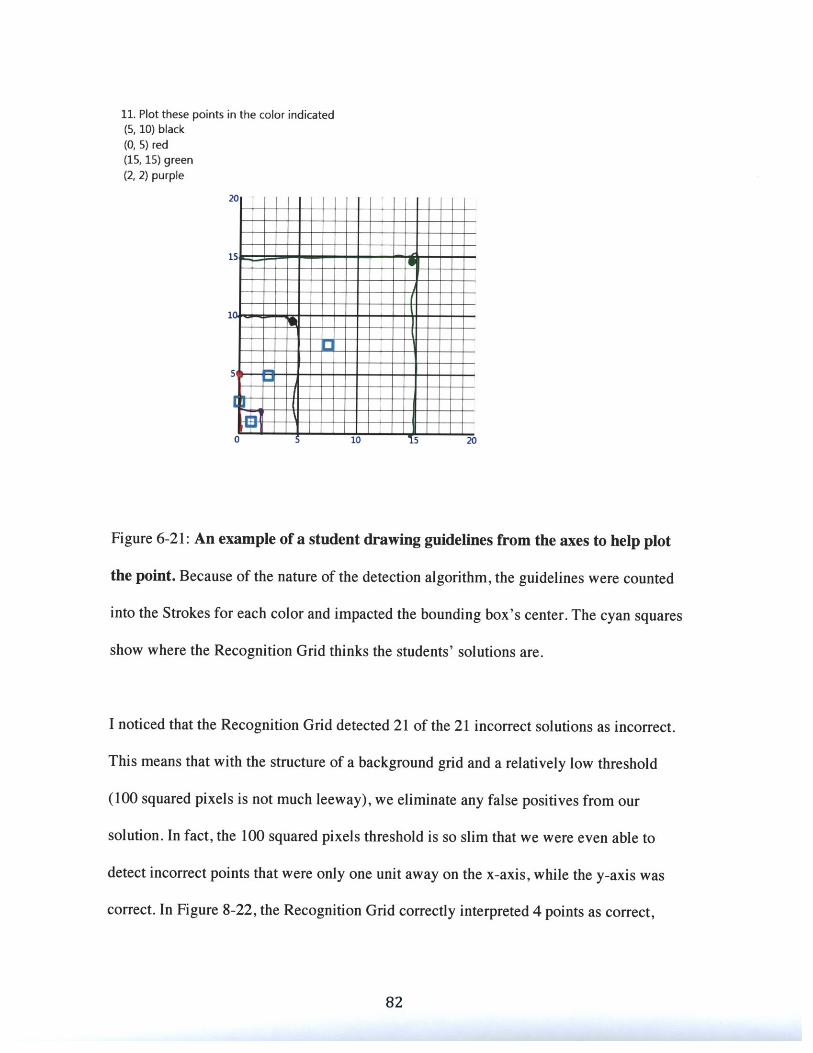
11. Plot these points in the color indicated(5, 10) black(0, 5) red(15, 15) green(2, 2) purple
20
15
10
5
J~I i i
0 10 15 20
Figure 6-21: An example of a student drawing guidelines from the axes to help plot
the point. Because of the nature of the detection algorithm, the guidelines were counted
into the Strokes for each color and impacted the bounding box's center. The cyan squares
show where the Recognition Grid thinks the students' solutions are.
I noticed that the Recognition Grid detected 21 of the 21 incorrect solutions as incorrect.
This means that with the structure of a background grid and a relatively low threshold
(100 squared pixels is not much leeway), we eliminate any false positives from our
solution. In fact, the 100 squared pixels threshold is so slim that we were even able to
detect incorrect points that were only one unit away on the x-axis, while the y-axis was
correct. In Figure 8-22, the Recognition Grid correctly interpreted 4 points as correct,
- - ---------- -- .. ..............
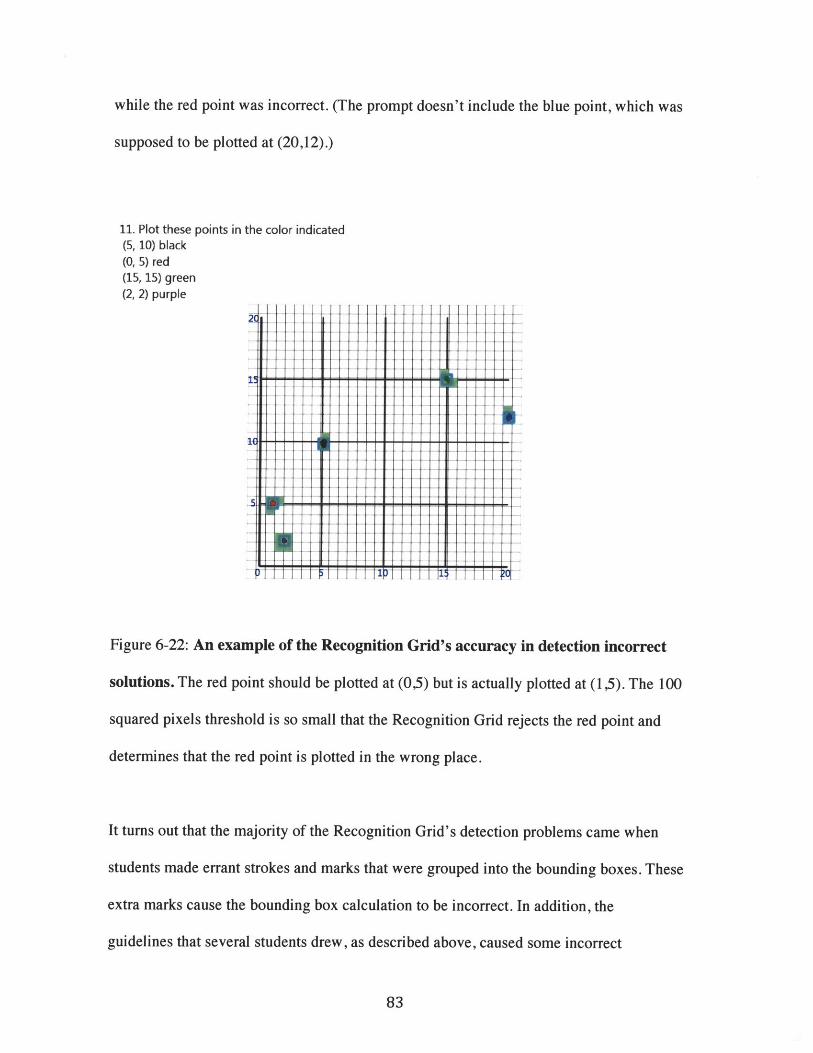
while the red point was incorrect. (The prompt doesn't include the blue point, which was
supposed to be plotted at (20,12).)
11. Plot these points in the color indicated(5, 10) black(0, 5) red(15, 15) green(2, 2) purple
Figure 6-22: An example of the Recognition Grid's accuracy in detection incorrect
solutions. The red point should be plotted at (0,5) but is actually plotted at (1,5). The 100
squared pixels threshold is so small that the Recognition Grid rejects the red point and
determines that the red point is plotted in the wrong place.
It turns out that the majority of the Recognition Grid's detection problems came when
students made errant strokes and marks that were grouped into the bounding boxes. These
extra marks cause the bounding box calculation to be incorrect. In addition, the
guidelines that several students drew, as described above, caused some incorrect
........... ............
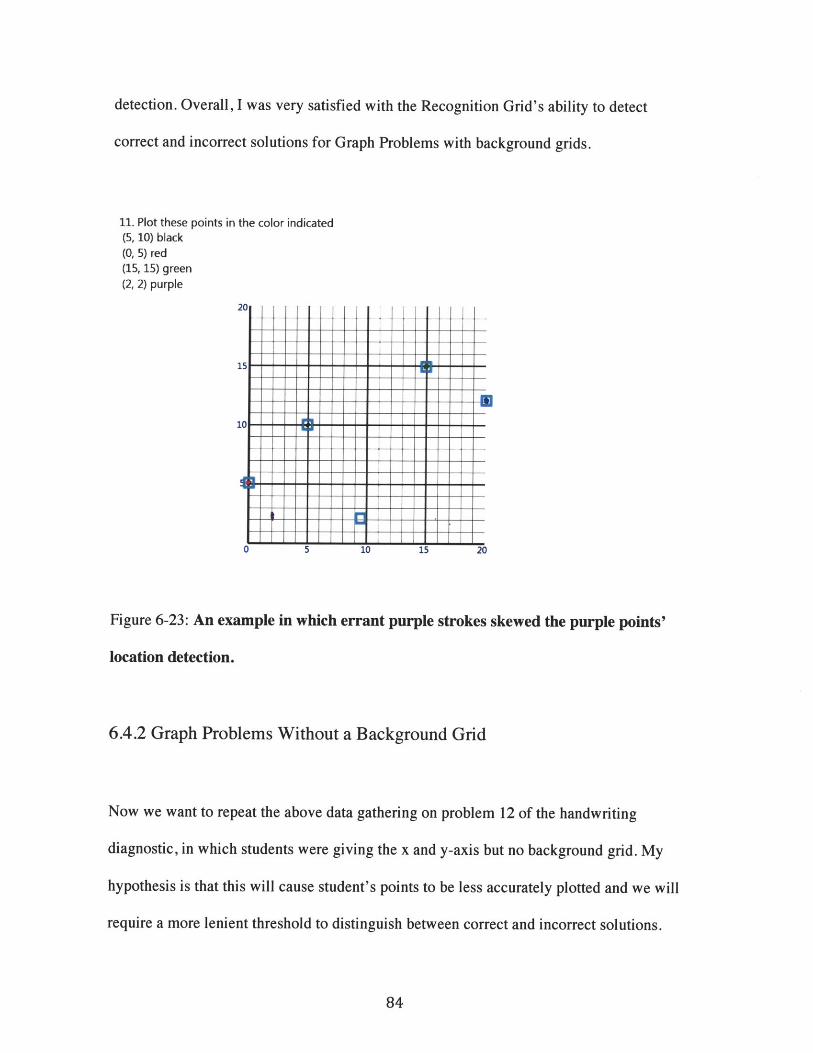
detection. Overall, I was very satisfied with the Recognition Grid's ability to detect
correct and incorrect solutions for Graph Problems with background grids.
11. Plot these points in the color indicated(5, 10) black(0, 5) red(15, 15) green(2, 2) purple
1.I
1-
10--
Figure 6-23: An example
location detection.
in which errant purple strokes skewed the purple points'
6.4.2 Graph Problems Without a Background Grid
Now we want to repeat the above data gathering on problem 12 of the handwriting
diagnostic, in which students were giving the x and y-axis but no background grid. My
hypothesis is that this will cause student's points to be less accurately plotted and we will
require a more lenient threshold to distinguish between correct and incorrect solutions.
.... .......... - -- - -- -- ------ - --- --------------------
. I
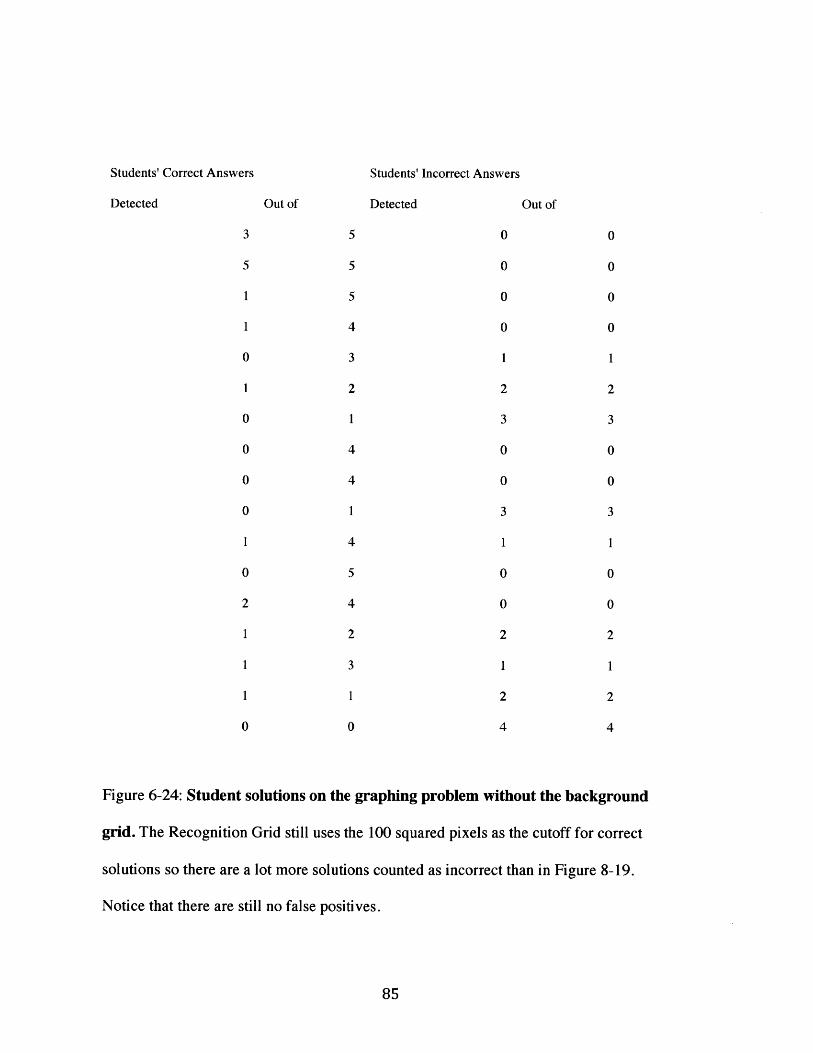
Students' Correct Answers
Detected
Students' Incorrect Answers
Detected Out ofOut of
Figure 6-24: Student solutions on the graphing problem without the background
grid. The Recognition Grid still uses the 100 squared pixels as the cutoff for correct
solutions so there are a lot more solutions counted as incorrect than in Figure 8-19.
Notice that there are still no false positives.
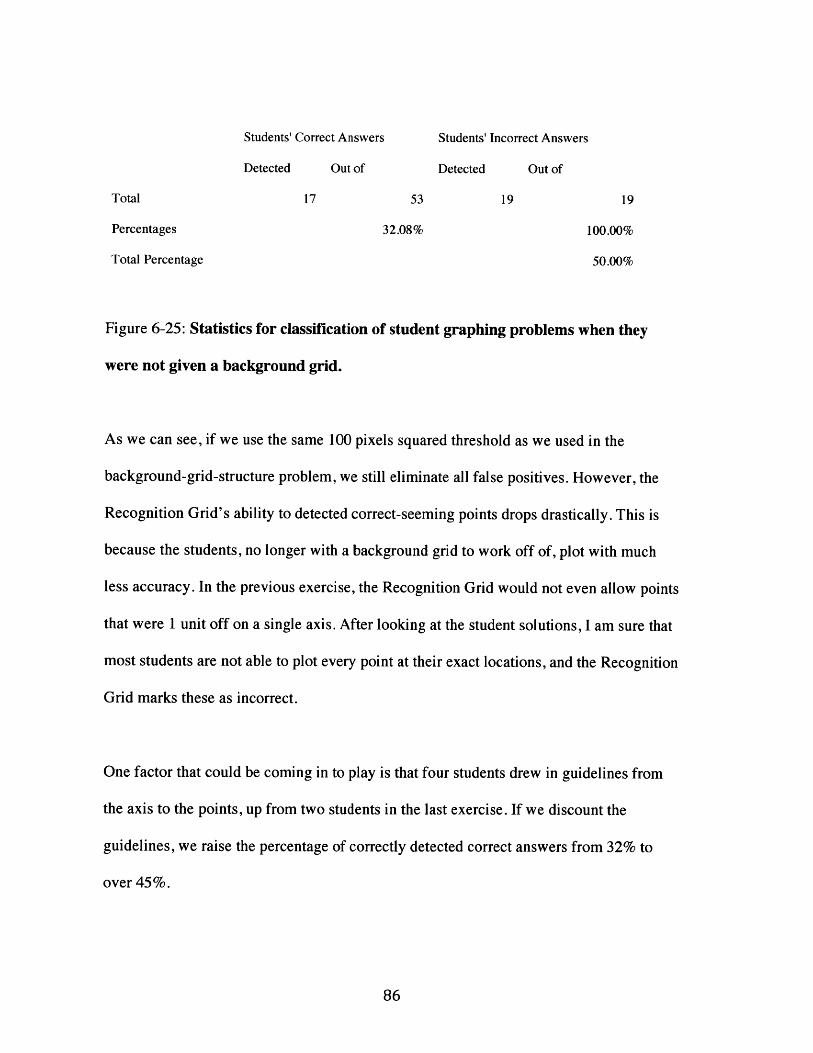
Students' Correct Answers Students' Incorrect Answers
Detected Out of Detected Out of
Total 17 53 19 19
Percentages 32.08% 100.00%
Total Percentage 50.00%
Figure 6-25: Statistics for classification of student graphing problems when they
were not given a background grid.
As we can see, if we use the same 100 pixels squared threshold as we used in the
background-grid-structure problem, we still eliminate all false positives. However, the
Recognition Grid's ability to detected correct-seeming points drops drastically. This is
because the students, no longer with a background grid to work off of, plot with much
less accuracy. In the previous exercise, the Recognition Grid would not even allow points
that were 1 unit off on a single axis. After looking at the student solutions, I am sure that
most students are not able to plot every point at their exact locations, and the Recognition
Grid marks these as incorrect.
One factor that could be coming in to play is that four students drew in guidelines from
the axis to the points, up from two students in the last exercise. If we discount the
guidelines, we raise the percentage of correctly detected correct answers from 32% to
over 45%.
86
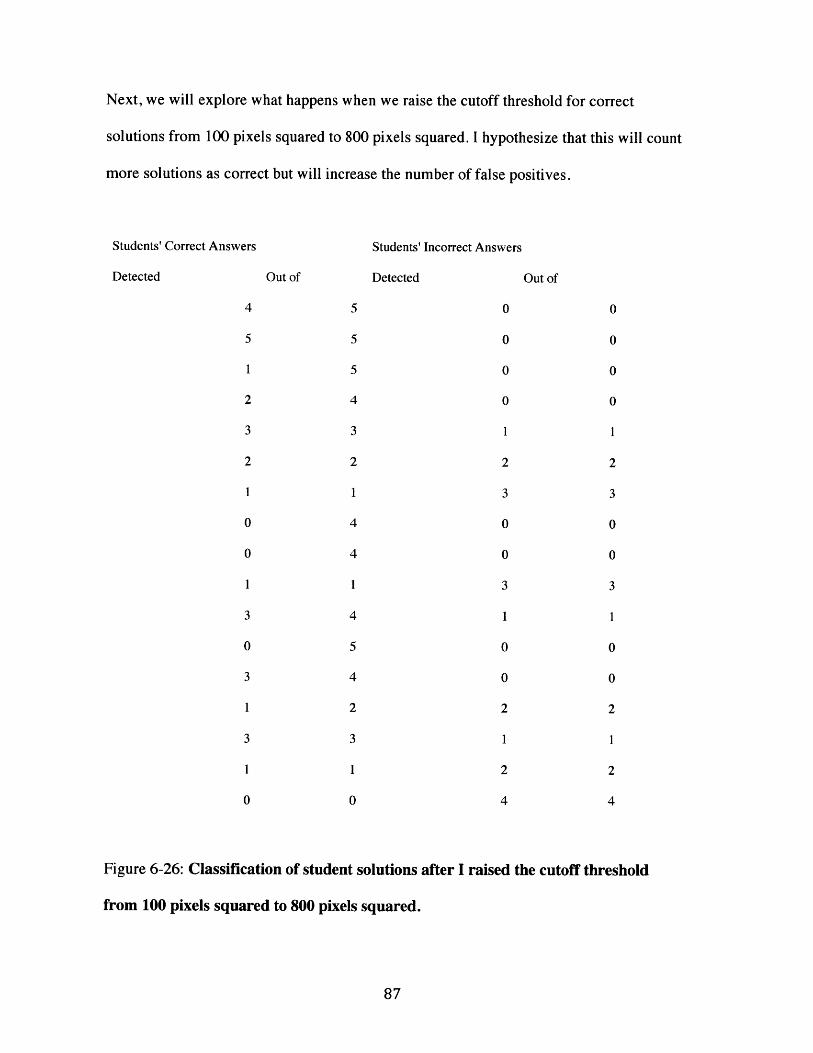
Next, we will explore what happens when we raise the cutoff threshold for correct
solutions from 100 pixels squared to 800 pixels squared. I hypothesize that this will count
more solutions as correct but will increase the number of false positives.
Students' Correct Answers
Detected
Students' Incorrect Answers
Detected Out ofOut of
Figure 6-26: Classification of student solutions after I raised
from 100 pixels squared to 800 pixels squared.
the cutoff threshold
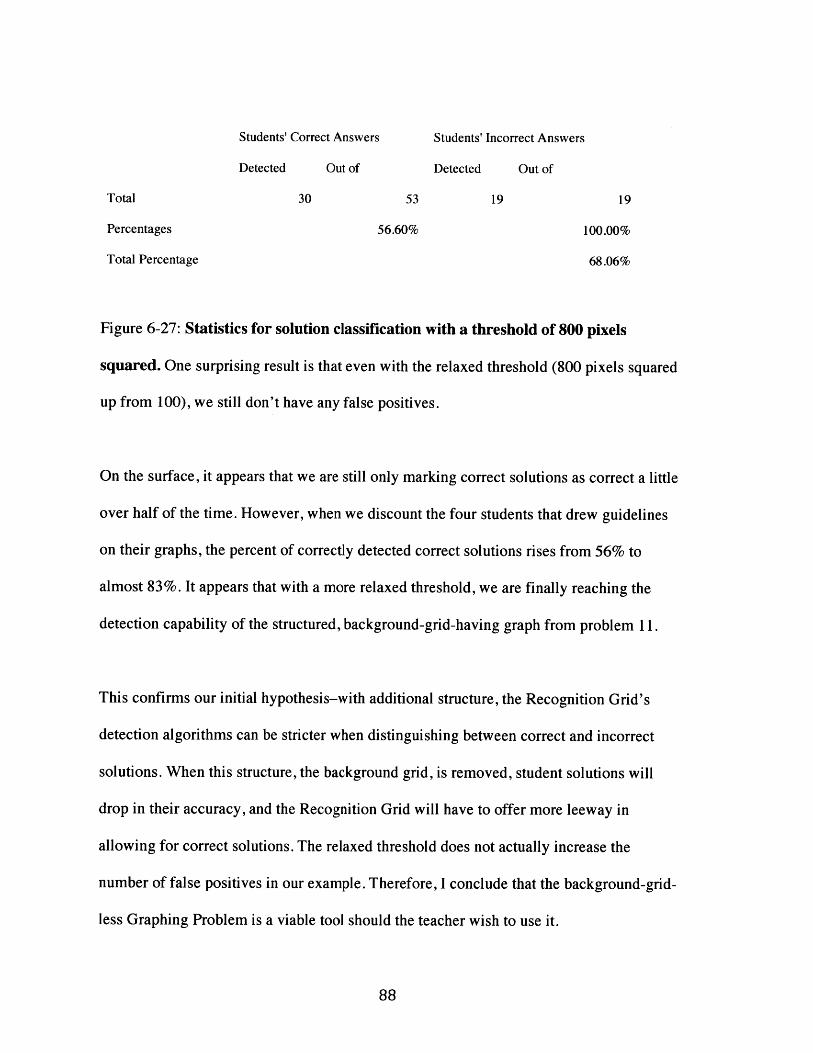
Students' Correct Answers Students' Incorrect Answers
Detected Out of Detected Out of
Total 30 53 19 19
Percentages 56.60% 100.00%
Total Percentage 68.06%
Figure 6-27: Statistics for solution classification with a threshold of 800 pixels
squared. One surprising result is that even with the relaxed threshold (800 pixels squared
up from 100), we still don't have any false positives.
On the surface, it appears that we are still only marking correct solutions as correct a little
over half of the time. However, when we discount the four students that drew guidelines
on their graphs, the percent of correctly detected correct solutions rises from 56% to
almost 83%. It appears that with a more relaxed threshold, we are finally reaching the
detection capability of the structured, background-grid-having graph from problem 11.
This confirms our initial hypothesis-with additional structure, the Recognition Grid's
detection algorithms can be stricter when distinguishing between correct and incorrect
solutions. When this structure, the background grid, is removed, student solutions will
drop in their accuracy, and the Recognition Grid will have to offer more leeway in
allowing for correct solutions. The relaxed threshold does not actually increase the
number of false positives in our example. Therefore, I conclude that the background-grid-
less Graphing Problem is a viable tool should the teacher wish to use it.
Chapter 7
Conclusion and Future Works
The Handwriting Diagnostic showed adding structure to student exercises
improves ink interpretation and automatic grading of math and science exercises. The
Recognition Grid was able to actively grade fraction coloring problems, number grid
problems, and basic graphing problems. The nature of these three types of problems is
that the teachers can provide structure to aid in the computer recognition process.
7.1. The Impact of Structure
In the first two fraction coloring problems, the outer boundaries of the shapes that
students are asked to color are clearly defined. Using these outer boundaries, the
Recognition Grid can calculate the percentage of grid cells that get colored and return an
estimate of the students' intended fraction answers. As we showed above, when further
structure is added, in this case inner boundaries, student solutions become even more
accurate. This allows the Recognition Grid to count a more narrow range of solutions as
correct, and it cuts down on false positives. However, when this outer boundary is
removed as in Problem three of the Handwriting Diagnostic, the Recognition Grid must
distinguish between what the boundary Ink Strokes are and what the interior Ink Strokes
are. The boundary Ink Strokes are especially important, because unlike the more
structured version of the problem, the Recognition Grid does not know beforehand what
the correct number of filled in grid cells is. If the student draws a very large shape, the
Recognition Grid must scale up the correct answer accordingly and vice versa. One
possible way to distinguish between the boundary and the interior Ink Strokes is to detect
single Strokes that have no Strokes in neighboring cells. The students most likely drew
these isolated Strokes as the boundary of the shape. Another solution to this freehand
version of the fraction coloring problem is to ask the student to draw the boundary in one
color and the interior in another. However, some students draw interior guidelines to help
them divide the whole shape into fractions. The Recognition Grid would have to take into
account these interior Strokes. I have shown that Fraction Coloring Problems can be
interpreted up to a certain extent, as long as they have the structure necessary to make
detection fairly predictable and straightforward.
7.2 Algorithm Changes to Improve Detection
Next, we have seen that the table detection capabilities of the Recognition Grid
are still somewhat lacking. Fourth grade students do not consistently keep their answers
contained in the different cells of a table. When their strokes spill over from one cell to
the next, it ruins the Ink Analyzer's ability to accurately translate the Strokes into text.
The current Recognition Grid solves this problem by interpreting all the Ink Strokes in
the table at once. This is not the ideal solution, because it limits the Recognition Grid's
ability to detect which numbers and letters correspond to which cells in the table. One
possible future work to solve this is to create an algorithm that isolates different groups of
strokes at a single time. The algorithm starts off by choosing all the strokes that are at
least partially in a cell but instead of clipping those strokes, the algorithm takes the entire
strokes. The algorithm then tries the different combinations of these strokes until it finds
a set that the Ink Analyzer can successfully translate into an answer that makes some
sense. Unfortunately, there does not appear to be a simple solution of adding structure to
the problem to make it more easily interpretable, like there was for the fraction-coloring
problem.
After that, I looked into number grid problems. In these problems, students circle
multiples of two in one color and multiples of three in another color to test their
knowledge of multiplication. Similar to the previous problem, the diagnostic revealed
that many student's circles would spill over into neighboring cells of the number grid.
When the Recognition Grid attempted to simply detect the colors of the strokes in each
cell, I discovered that almost one in four circles would cross the boundaries of other cells
and ruin the grading algorithm. However, the strokes in this problem do not have to be
passed to an Ink Analyzer; instead, the algorithm only needs to detect the color attribute
of these strokes. Thus, I used a threshold fix in order to minimize the amount of spillover
strokes I was taking account of. The results showed that filtering these strokes by their
bonding box's size significantly raised the accuracy of the Recognition Grid grading
algorithm. In this problem, we showed that we did not need to add any additional
structure to improve the Recognition Grid's interpretation ability. Instead, I used a trick
to help separate the intentional strokes from the errant marks. This trick helped increase
the accuracy of the Recognition Grid's grading algorithm to a respectable and serviceable
level.
7.3 Quantifying Structure's Impact on Student Accuracy
Finally, the last problem the current Recognition Grid was able to grade were the
first two graphing problems. The two graphing problems differed from each other in
structure: the first graph had axes and a background grid, while the second graph only
had axes. My hypothesis for this problem was that students would plot much more
accurately on the graph with the background grid, resulting in the Recognition Grid
needing a smaller margin of error when distinguishing between correct and incorrect
solutions. Indeed, this was the result after analyzing the student solutions for both
problems. In the graphing problem with the background grid, the Recognition Grid used a
very small margin of error but was still able to distinguish correct solutions from
incorrect solutions fairly accurately. In fact, the Recognition Grid was so accurate that it
even discounted a point that was only 1 unit away from where it should be. Through all
of these problems, the Recognition Grid did not allow a single false positive. In the
graphing problem without the background grid, the Recognition Grid had to accept a
much larger margin of error from the students in order to keep up with the accuracy.
Depending on how strict the teacher in the classroom is, the Recognition Grid may or
may not be accepting incorrect solutions as correct ones for this problem. The set of
graphing problems demonstrated that even when a problem's structure is not crucial to
the Recognition Grid's ability to grade that problem, the structure can play a key role in
student accuracy, and in turn the amount of leeway the Recognition Grid must accept for
correct solutions.
7.4 Future Work
Over the last year, I have created an extensive set of tools that led up to the
creation of the Recognition Grid. The Recognition Grid's ultimate goal is to active
support teachers in the classroom by automatically grading, sorting, and returning student
work. This real time feedback loop will help teachers manage larger classrooms and aid
instructors in catching student misunderstandings while they are doing the exercises and
not afterwards. However, a year's work is not enough for the Recognition Grid to be able
to cover the entire set of math and science problems that the INK- 12 grant wants to
eventually be able to handle. For example, the number line problems and the more
advanced graphing problems require more difficult algorithms. To grade number line
problems, the Recognition Grid must combine the ability to detect the tick marks,
associate them with the proper number labels after converting those numbers from
Strokes into text, and then measuring the relative location of the seashells with respect to
those tick marks. This is extremely complicated, and depending on the accuracy of each
of the three components, it is possible that the Recognition Grid could turn out to grade
these problems very poorly. The advanced graphing problems are very similar: the
Recognition Grid just be able to differentiate the x-axis and y-axis from the labels and the
curve itself. A failure at any of these three points could result in a correct answer being
marked as incorrect or a false positive.
Future work will focus on handling these more complicated problems, by adding
the ability to use regression tests and other useful statistical analysis tools to the existing

platform. These tools will enable the Recognition Grid to move beyond matters of
structure and begin learning patterns and tendencies from student solutions. Eventually,
the Recognition Grid will be able to comprehend free-hand drawings and other very
complicated exercises.
7.5 Contribution
We created a standalone class called the Recognition Grid that modularizes the
process of clipping Strokes and analyzing the resulting thresholds. With this Recognition
Grid, we went into the classroom to take dozens of samples of student work. We drew
conclusions about the impact of a problem's structure both on the Recognition Grid's
ability to determine correctness as well as its effect on student accuracy. We collected
data so that future students can integrate statistical analysis into the Recognition Grid.
Our goal is eventually integrate into CLP a fully functioning, highly accurate automatic
grader that will reduce the latency between when students answer a question and when
they receive comprehensive feedback for their solutions. This year's work took a
significant step towards reaching that goal.
Bibliography
Read, J., MacFarlane, S., Horton, M. (2007) The Usability of Handwriting Recognition
for Writing in the Primary Classroom. In Interacting with Computers Volume 19 Issue 1,
January, 2007.
Black, P, and Wiliam, D. (1998) Inside the Black Box: Raising Standards Through
Classroom Assessment. King's College, London.
Bransford, J.D., Brown, A.L., and Cocking, R.R., Eds. (1999) How People Learn: Brain,
Mind, Experience, and School. National Academy Press, Washington, D.C.
Koile, K., Chevalier, K., Rbeiz., M., Rogal, A., Singer, D., Sorensen, J., Smith, A., Tay,
K.S., and Wu, K. Supporting Feedback and Assessment of Digital Ink Answers to In-
Class Exercises. (2007a) In Proceedings of IAAI 2007, July, 2007.
Koile, K., Chevalier, K., Low, C., Pal, S., Rogal, A., Singer, D., Sorensen, J., Tay. K.S.,
and Wu. K. (2007b) Supporting Pen-Based Classroom Interaction: New Findings and
Functionality for Classroom Learning Partner. In Proceedings of First International
Workshop on Pen-Based Learning Technologies, May 24-26, 2007.
Mazur, E. (1997) Peer Instruction: A User's Manual. Series in Educational Innovation,
Prentice Hall, Upper Saddle River, NJ.

Topping, Keith (1998) Peer Assessment Between Students in Colleges and Universities.
Review of Educational Research, 68 (3), 249-276.
Appendix A
Test Applications to Explore the Technology
To explore the Microsoft Ink SDKs and their functions, I wrote a series of
prototype applications that performed various tasks. Because INK-12 is a four-year
project, future students will eventually take over my work and build upon it. These
applications will be good references for them to understand the basic building blocks of
my handwriting recognition piece.
A.1 Real-Time Interpreter
The first Windows Presentation Foundation application I wrote was built with the
purpose of testing the viability of existing handwriting recognition software. This is the
first test of handwriting recognition accuracy. If the interpretation accuracy of my own
ink was too low, I could abandon the Microsoft platform and search for another existing
SDK to use.
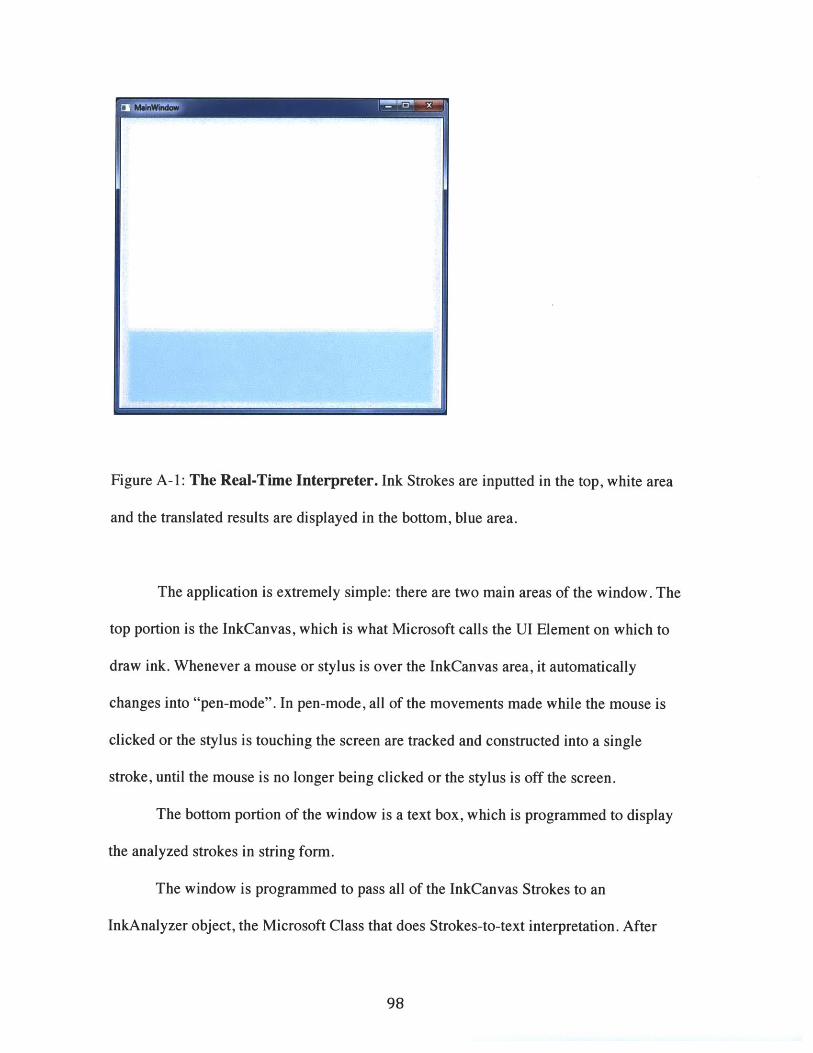
Figure A-1: The Real-Time Interpreter. Ink Strokes are inputted in the top, white area
and the translated results are displayed in the bottom, blue area.
The application is extremely simple: there are two main areas of the window. The
top portion is the InkCanvas, which is what Microsoft calls the UI Element on which to
draw ink. Whenever a mouse or stylus is over the InkCanvas area, it automatically
changes into "pen-mode". In pen-mode, all of the movements made while the mouse is
clicked or the stylus is touching the screen are tracked and constructed into a single
stroke, until the mouse is no longer being clicked or the stylus is off the screen.
The bottom portion of the window is a text box, which is programmed to display
the analyzed strokes in string form.
The window is programmed to pass all of the InkCanvas Strokes to an
InkAnalyzer object, the Microsoft Class that does Strokes-to-text interpretation. After
98
. ...........
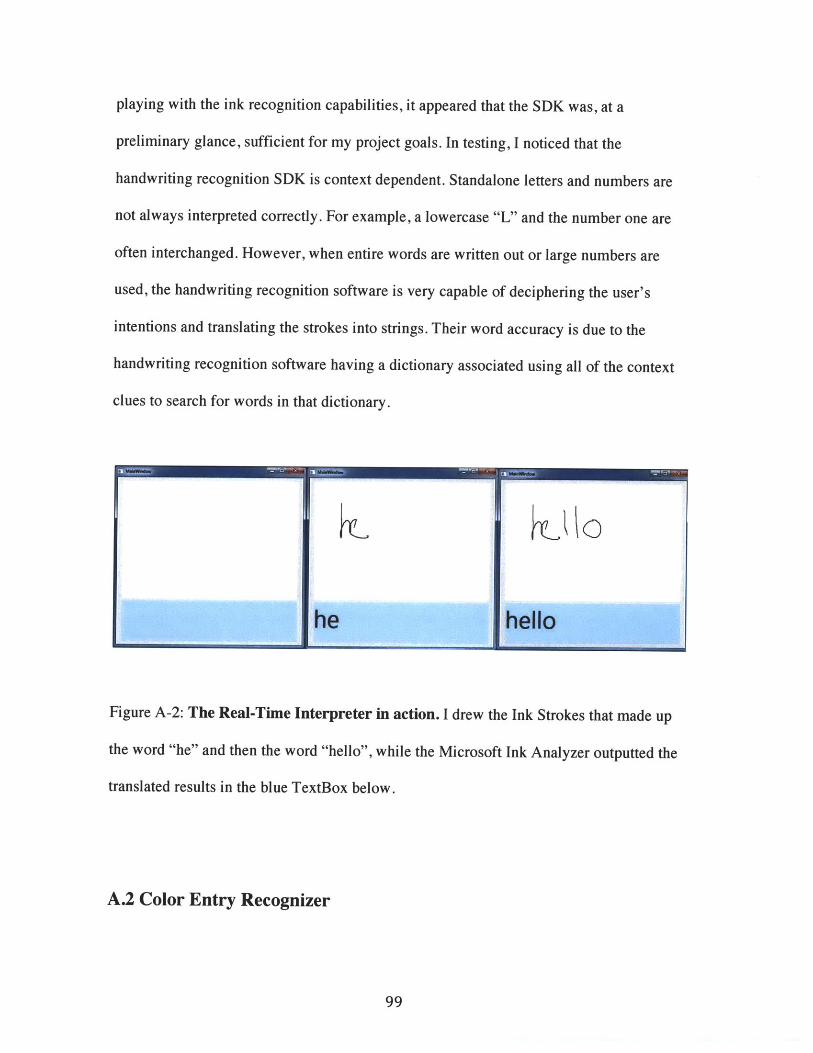
playing with the ink recognition capabilities, it appeared that the SDK was, at a
preliminary glance, sufficient for my project goals. In testing, I noticed that the
handwriting recognition SDK is context dependent. Standalone letters and numbers are
not always interpreted correctly. For example, a lowercase "L" and the number one are
often interchanged. However, when entire words are written out or large numbers are
used, the handwriting recognition software is very capable of deciphering the user's
intentions and translating the strokes into strings. Their word accuracy is due to the
handwriting recognition software having a dictionary associated using all of the context
clues to search for words in that dictionary.
he hello
Figure A-2: The Real-Time Interpreter in action. I drew the Ink Strokes that made up
the word "he" and then the word "hello", while the Microsoft Ink Analyzer outputted the
translated results in the blue TextBox below.
A.2 Color Entry Recognizer
99
............. .
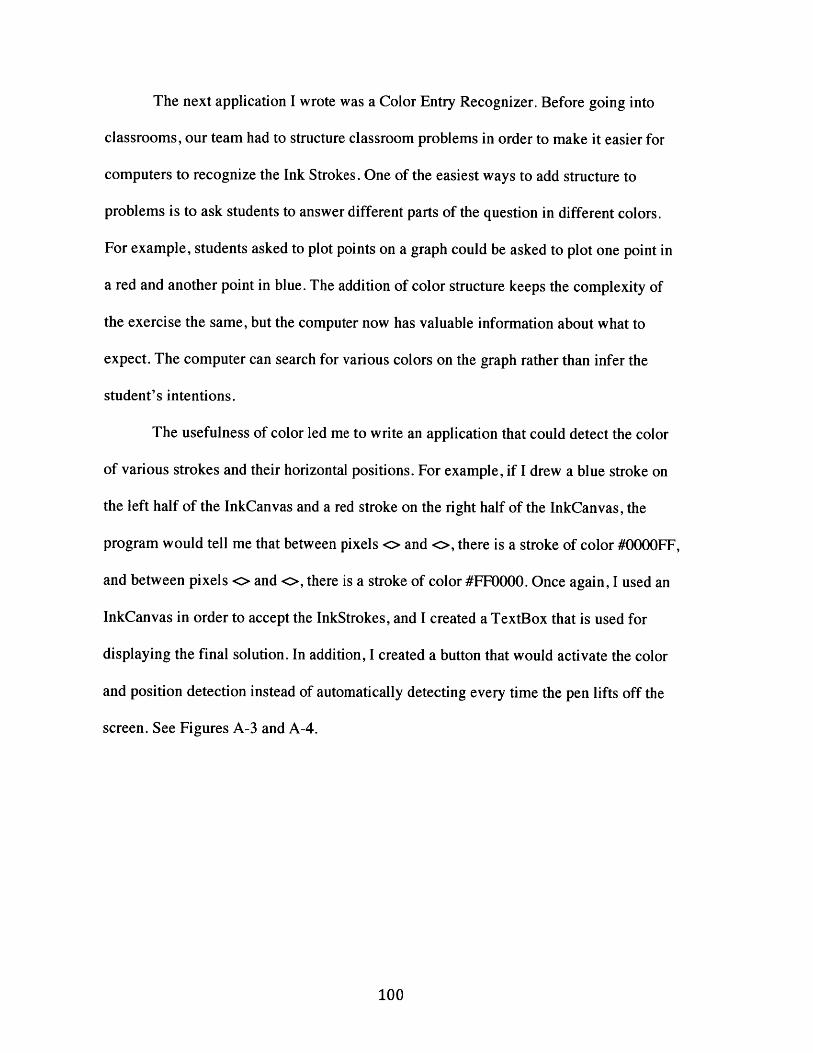
The next application I wrote was a Color Entry Recognizer. Before going into
classrooms, our team had to structure classroom problems in order to make it easier for
computers to recognize the Ink Strokes. One of the easiest ways to add structure to
problems is to ask students to answer different parts of the question in different colors.
For example, students asked to plot points on a graph could be asked to plot one point in
a red and another point in blue. The addition of color structure keeps the complexity of
the exercise the same, but the computer now has valuable information about what to
expect. The computer can search for various colors on the graph rather than infer the
student's intentions.
The usefulness of color led me to write an application that could detect the color
of various strokes and their horizontal positions. For example, if I drew a blue stroke on
the left half of the InkCanvas and a red stroke on the right half of the InkCanvas, the
program would tell me that between pixels o and o, there is a stroke of color #0000FF,
and between pixels o and o, there is a stroke of color #FF0000. Once again, I used an
InkCanvas in order to accept the InkStrokes, and I created a TextBox that is used for
displaying the final solution. In addition, I created a button that would activate the color
and position detection instead of automatically detecting every time the pen lifts off the
screen. See Figures A-3 and A-4.
100
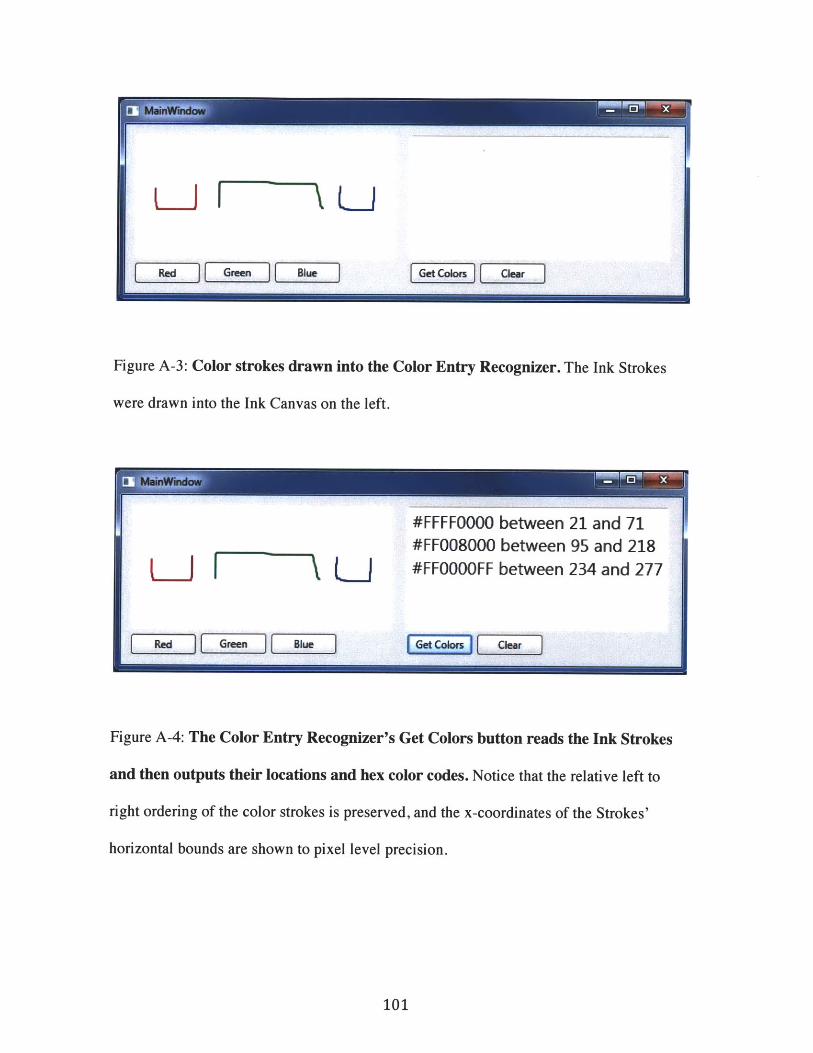
Figure A-3: Color strokes drawn into the Color Entry Recognizer. The Ink Strokes
were drawn into the Ink Canvas on the left.
Figure A-4: The Color Entry Recognizer's Get Colors button reads the Ink Strokes
and then outputs their locations and hex color codes. Notice that the relative left to
right ordering of the color strokes is preserved, and the x-coordinates of the Strokes'
horizontal bounds are shown to pixel level precision.
101
#FFFFOOOO between 21 and 71#FF008000 between 95 and 218
7L #FFOOOOFF between 234 and 277
Get Colors L e&rIRed ] Green Bue I
......... . ...... . ... .......... .. . ... .......
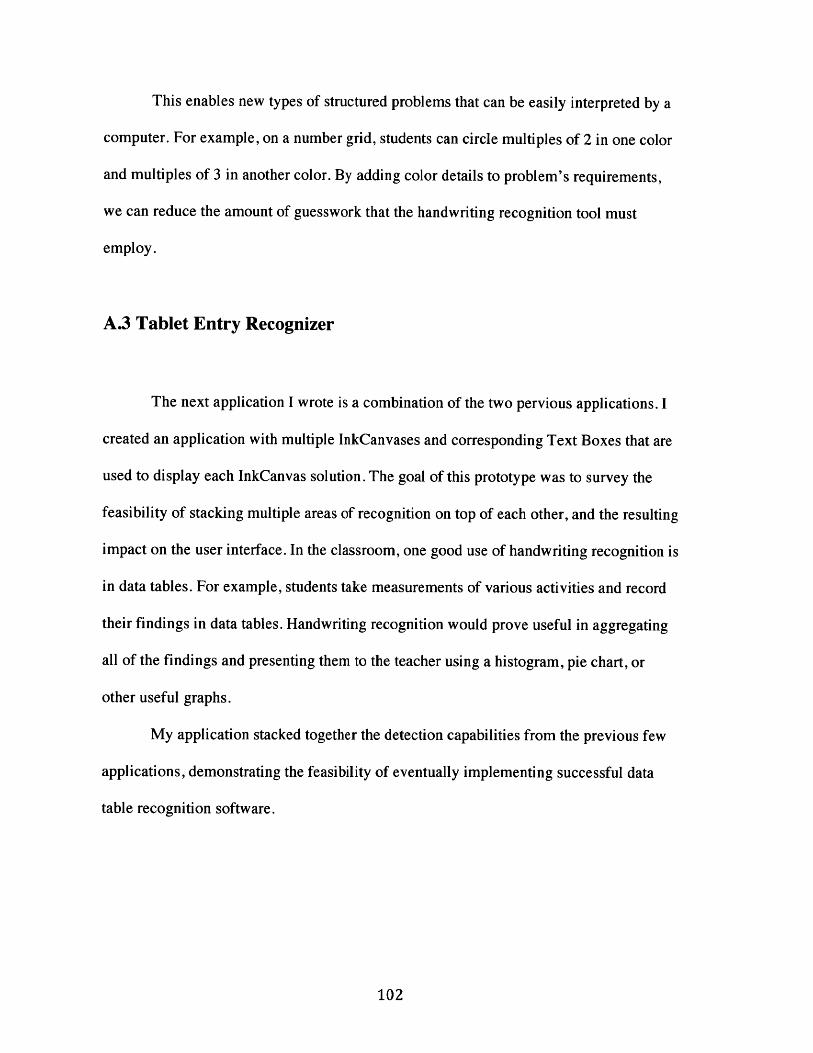
This enables new types of structured problems that can be easily interpreted by a
computer. For example, on a number grid, students can circle multiples of 2 in one color
and multiples of 3 in another color. By adding color details to problem's requirements,
we can reduce the amount of guesswork that the handwriting recognition tool must
employ.
A.3 Tablet Entry Recognizer
The next application I wrote is a combination of the two pervious applications. I
created an application with multiple InkCanvases and corresponding Text Boxes that are
used to display each InkCanvas solution. The goal of this prototype was to survey the
feasibility of stacking multiple areas of recognition on top of each other, and the resulting
impact on the user interface. In the classroom, one good use of handwriting recognition is
in data tables. For example, students take measurements of various activities and record
their findings in data tables. Handwriting recognition would prove useful in aggregating
all of the findings and presenting them to the teacher using a histogram, pie chart, or
other useful graphs.
My application stacked together the detection capabilities from the previous few
applications, demonstrating the feasibility of eventually implementing successful data
table recognition software.
102
Figure A-6: The previous functions are collapsed into a table. I also experimented
with alternative forms of inputting answers, such as the calculator like number grid on the
bottom left.
103
Ly my
P,1 name
#FFFFOOOO
1764
1 2 3
4 5 6
7 8 9
0 Enter
s l. a c tdOa,.
. ...............
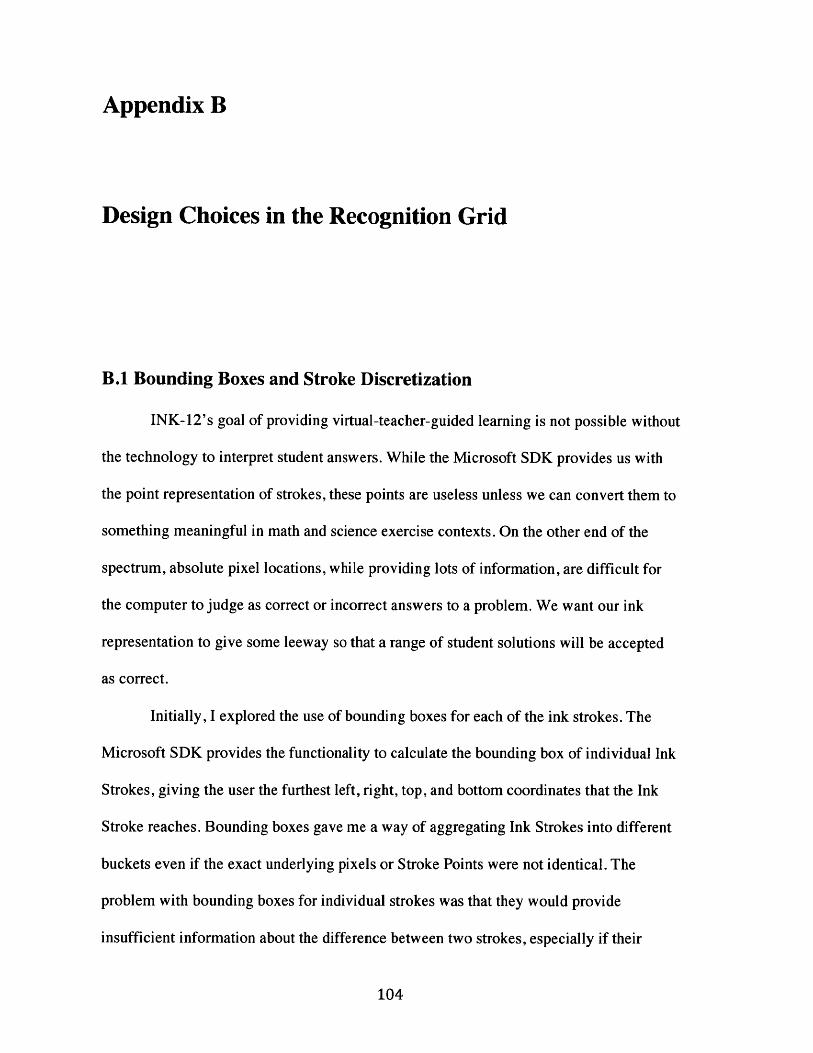
Appendix B
Design Choices in the Recognition Grid
B.1 Bounding Boxes and Stroke Discretization
INK-12's goal of providing virtual-teacher-guided learning is not possible without
the technology to interpret student answers. While the Microsoft SDK provides us with
the point representation of strokes, these points are useless unless we can convert them to
something meaningful in math and science exercise contexts. On the other end of the
spectrum, absolute pixel locations, while providing lots of information, are difficult for
the computer to judge as correct or incorrect answers to a problem. We want our ink
representation to give some leeway so that a range of student solutions will be accepted
as correct.
Initially, I explored the use of bounding boxes for each of the ink strokes. The
Microsoft SDK provides the functionality to calculate the bounding box of individual Ink
Strokes, giving the user the furthest left, right, top, and bottom coordinates that the Ink
Stroke reaches. Bounding boxes gave me a way of aggregating Ink Strokes into different
buckets even if the exact underlying pixels or Stroke Points were not identical. The
problem with bounding boxes for individual strokes was that they would provide
insufficient information about the difference between two strokes, especially if their
104
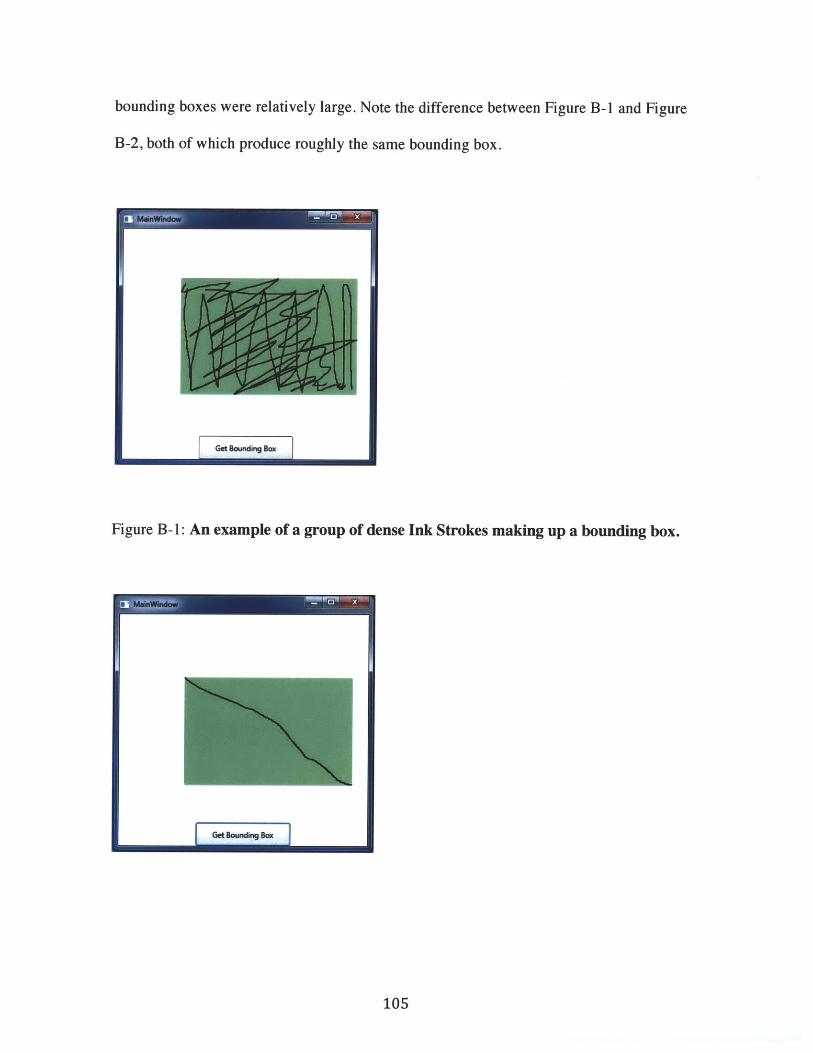
bounding boxes were relatively large. Note the difference between Figure B-1 and Figure
B-2, both of which produce roughly the same bounding box.
Figure B-1: An example of a group of dense Ink Strokes making up a bounding box.
105
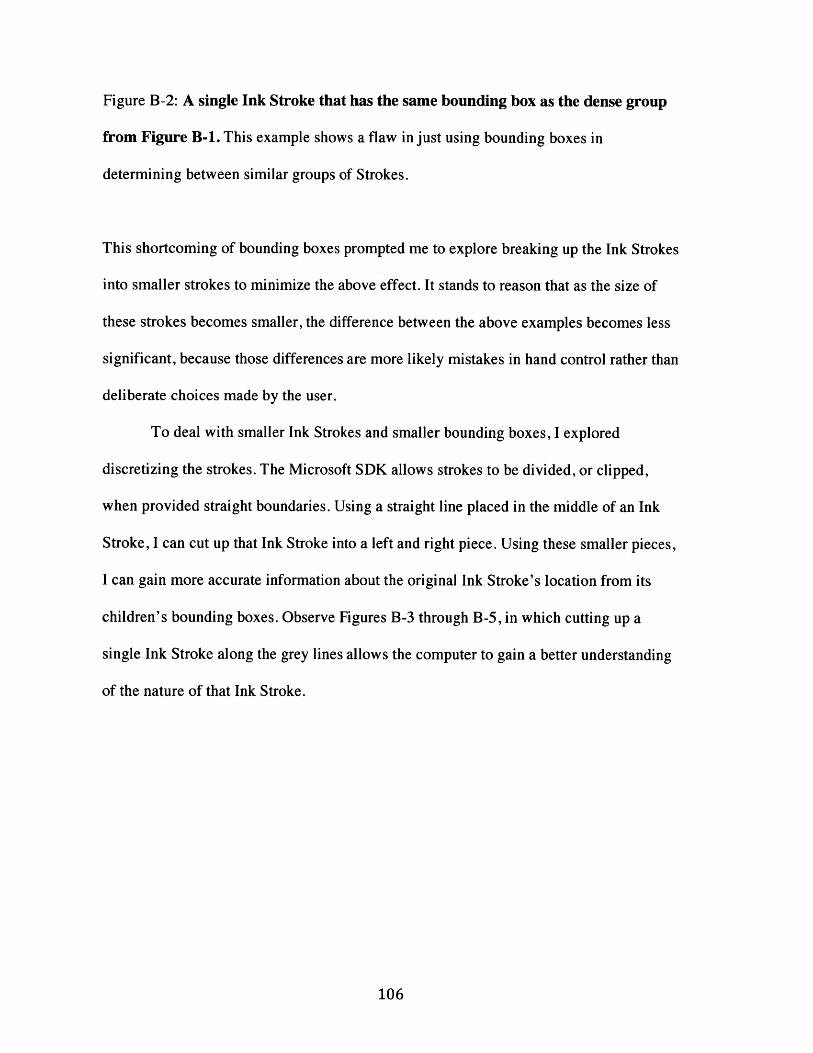
Figure B-2: A single Ink Stroke that has the same bounding box as the dense group
from Figure B-1. This example shows a flaw in just using bounding boxes in
determining between similar groups of Strokes.
This shortcoming of bounding boxes prompted me to explore breaking up the Ink Strokes
into smaller strokes to minimize the above effect. It stands to reason that as the size of
these strokes becomes smaller, the difference between the above examples becomes less
significant, because those differences are more likely mistakes in hand control rather than
deliberate choices made by the user.
To deal with smaller Ink Strokes and smaller bounding boxes, I explored
discretizing the strokes. The Microsoft SDK allows strokes to be divided, or clipped,
when provided straight boundaries. Using a straight line placed in the middle of an Ink
Stroke, I can cut up that Ink Stroke into a left and right piece. Using these smaller pieces,
I can gain more accurate information about the original Ink Stroke's location from its
children's bounding boxes. Observe Figures B-3 through B-5, in which cutting up a
single Ink Stroke along the grey lines allows the computer to gain a better understanding
of the nature of that Ink Stroke.
106
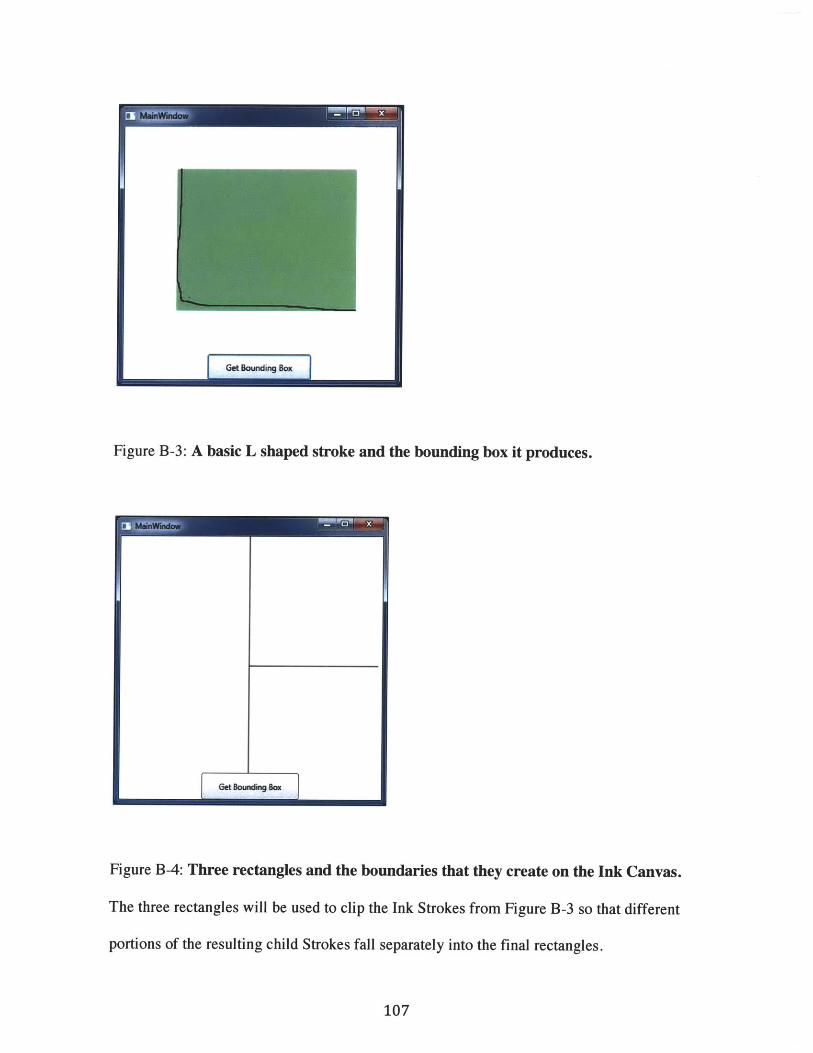
Figure B-3: A basic L shaped stroke and the bounding box it produces.
I-I-
Figure B-4: Three rectangles and the boundaries that they create on the Ink Canvas.
The three rectangles will be used to clip the Ink Strokes from Figure B-3 so that different
portions of the resulting child Strokes fall separately into the final rectangles.
107
Get Bom~ing Bo
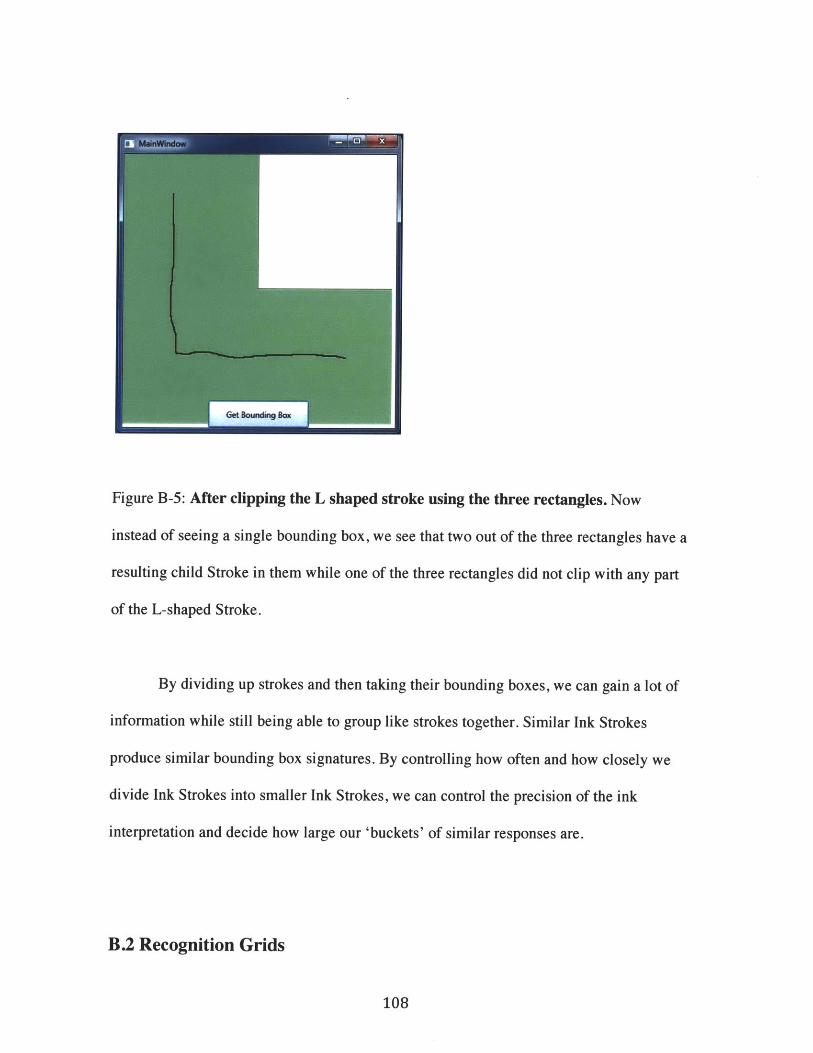
Figure B-5: After clipping the L shaped stroke using the three rectangles. Now
instead of seeing a single bounding box, we see that two out of the three rectangles have a
resulting child Stroke in them while one of the three rectangles did not clip with any part
of the L-shaped Stroke.
By dividing up strokes and then taking their bounding boxes, we can gain a lot of
information while still being able to group like strokes together. Similar Ink Strokes
produce similar bounding box signatures. By controlling how often and how closely we
divide Ink Strokes into smaller Ink Strokes, we can control the precision of the ink
interpretation and decide how large our 'buckets' of similar responses are.
B.2 Recognition Grids
108
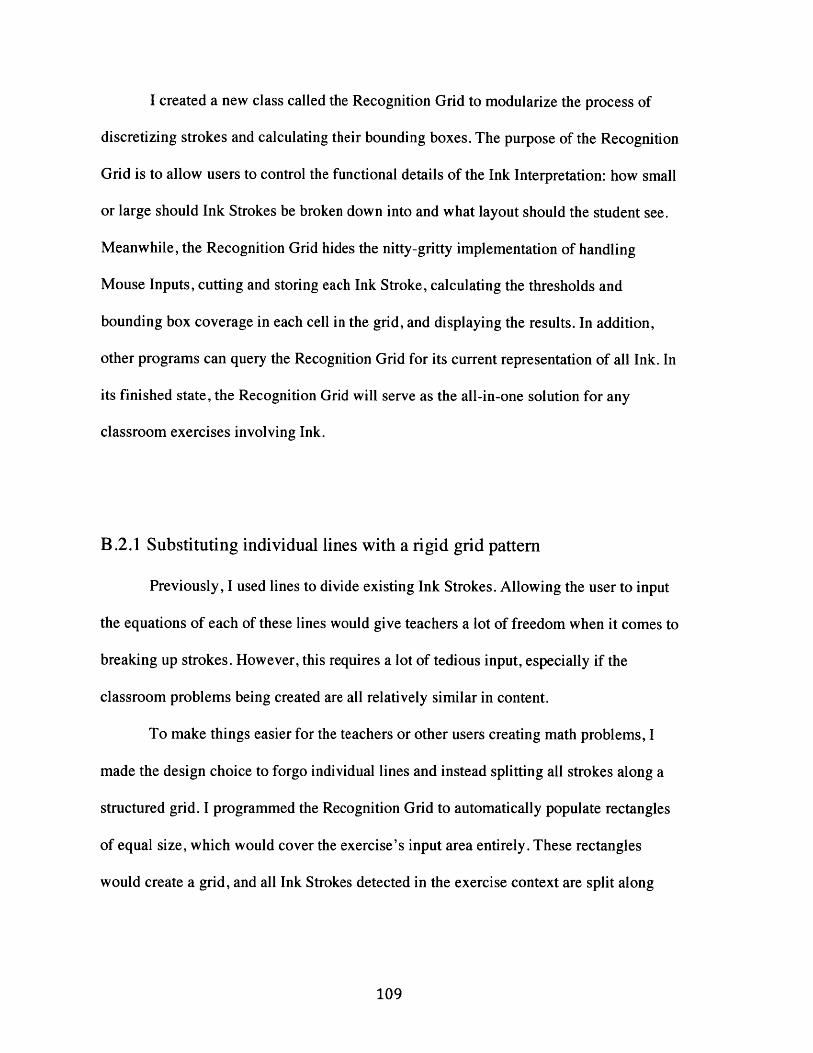
I created a new class called the Recognition Grid to modularize the process of
discretizing strokes and calculating their bounding boxes. The purpose of the Recognition
Grid is to allow users to control the functional details of the Ink Interpretation: how small
or large should Ink Strokes be broken down into and what layout should the student see.
Meanwhile, the Recognition Grid hides the nitty-gritty implementation of handling
Mouse Inputs, cutting and storing each Ink Stroke, calculating the thresholds and
bounding box coverage in each cell in the grid, and displaying the results. In addition,
other programs can query the Recognition Grid for its current representation of all Ink. In
its finished state, the Recognition Grid will serve as the all-in-one solution for any
classroom exercises involving Ink.
B.2.1 Substituting individual lines with a rigid grid pattern
Previously, I used lines to divide existing Ink Strokes. Allowing the user to input
the equations of each of these lines would give teachers a lot of freedom when it comes to
breaking up strokes. However, this requires a lot of tedious input, especially if the
classroom problems being created are all relatively similar in content.
To make things easier for the teachers or other users creating math problems, I
made the design choice to forgo individual lines and instead splitting all strokes along a
structured grid. I programmed the Recognition Grid to automatically populate rectangles
of equal size, which would cover the exercise's input area entirely. These rectangles
would create a grid, and all Ink Strokes detected in the exercise context are split along
109
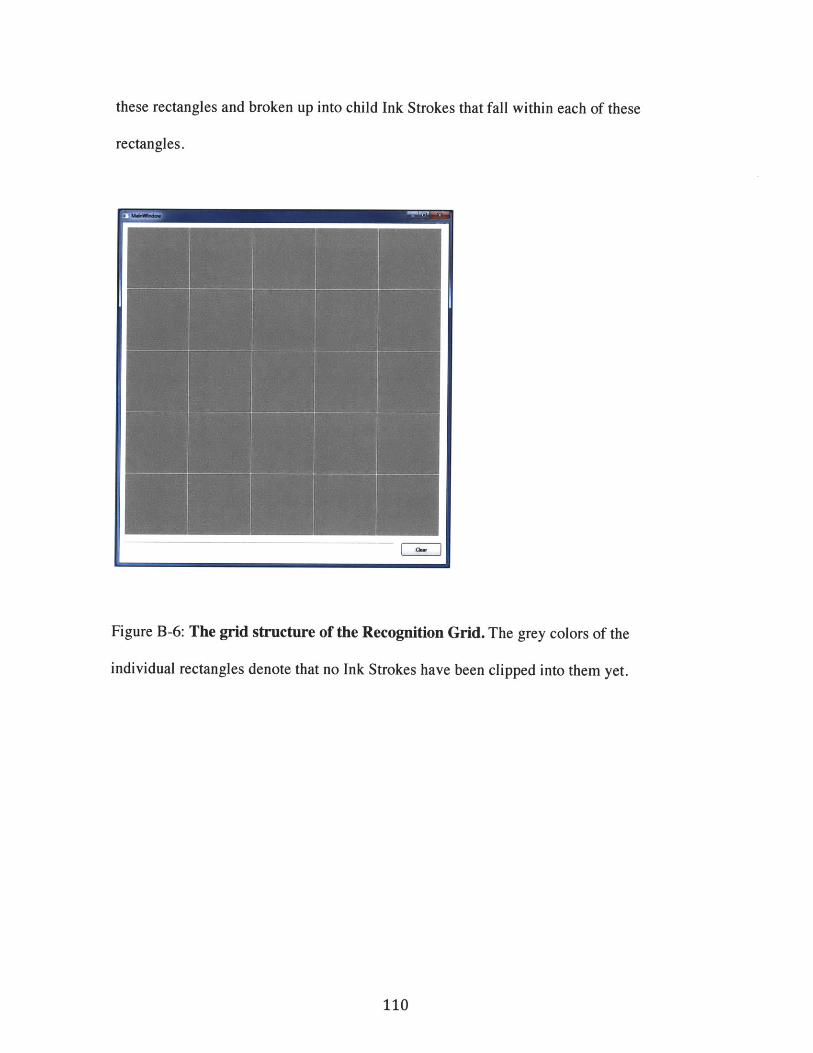
these rectangles and broken up into child Ink Strokes that fall within each of these
rectangles.
Figure B-6: The grid structure of the Recognition Grid. The grey colors of the
individual rectangles denote that no Ink Strokes have been clipped into them yet.
110
.. ........ . ......
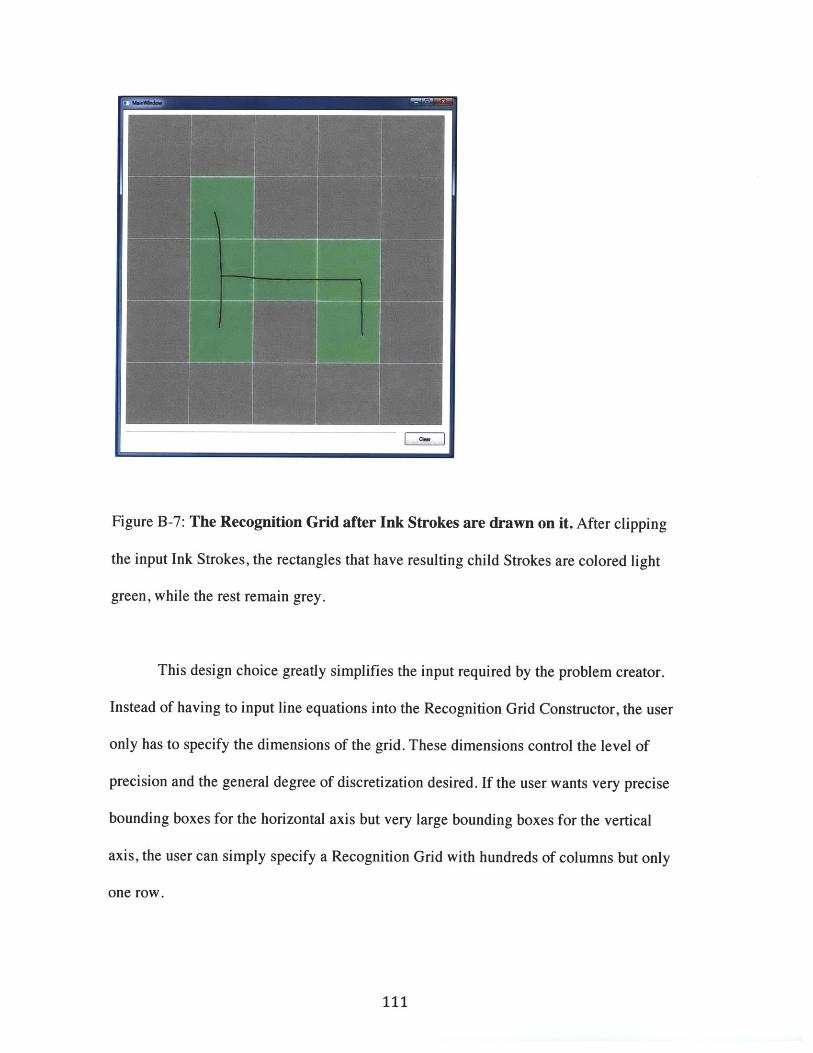
Figure B-7: The Recognition Grid after Ink Strokes are drawn on it. After clipping
the input Ink Strokes, the rectangles that have resulting child Strokes are colored light
green, while the rest remain grey.
This design choice greatly simplifies the input required by the problem creator.
Instead of having to input line equations into the Recognition Grid Constructor, the user
only has to specify the dimensions of the grid. These dimensions control the level of
precision and the general degree of discretization desired. If the user wants very precise
bounding boxes for the horizontal axis but very large bounding boxes for the vertical
axis, the user can simply specify a Recognition Grid with hundreds of columns but only
one row.
111
...........
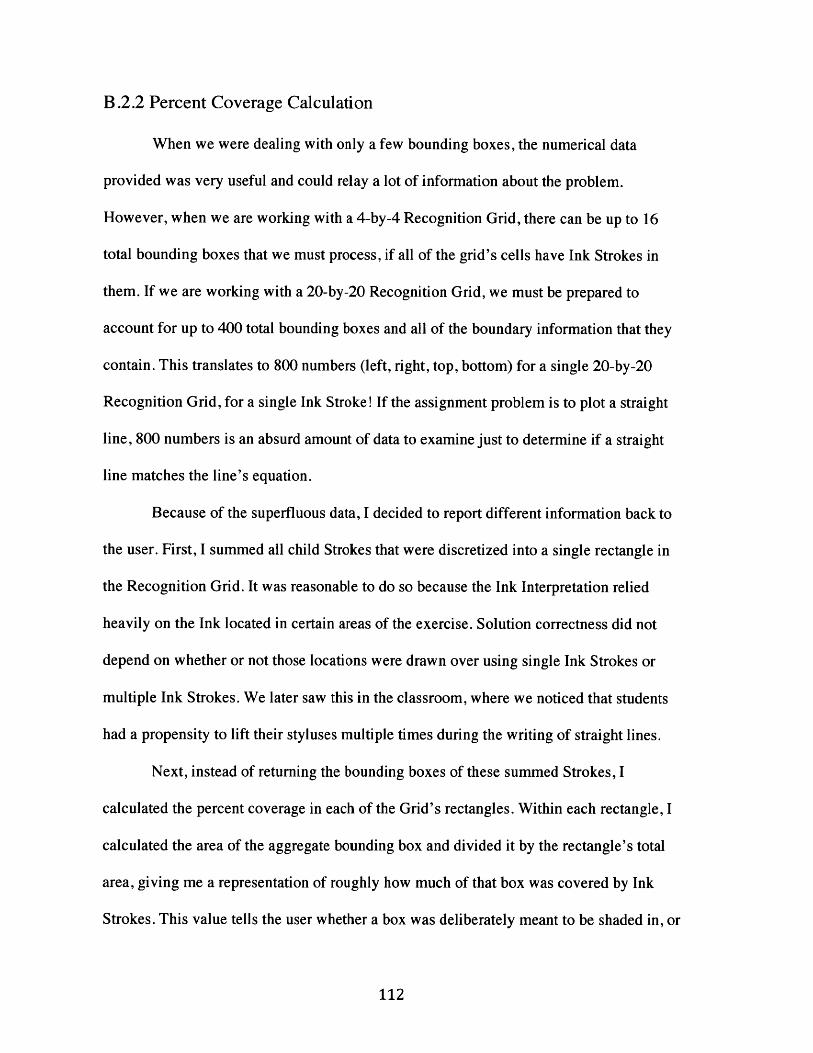
B.2.2 Percent Coverage Calculation
When we were dealing with only a few bounding boxes, the numerical data
provided was very useful and could relay a lot of information about the problem.
However, when we are working with a 4-by-4 Recognition Grid, there can be up to 16
total bounding boxes that we must process, if all of the grid's cells have Ink Strokes in
them. If we are working with a 20-by-20 Recognition Grid, we must be prepared to
account for up to 400 total bounding boxes and all of the boundary information that they
contain. This translates to 800 numbers (left, right, top, bottom) for a single 20-by-20
Recognition Grid, for a single Ink Stroke! If the assignment problem is to plot a straight
line, 800 numbers is an absurd amount of data to examine just to determine if a straight
line matches the line's equation.
Because of the superfluous data, I decided to report different information back to
the user. First, I summed all child Strokes that were discretized into a single rectangle in
the Recognition Grid. It was reasonable to do so because the Ink Interpretation relied
heavily on the Ink located in certain areas of the exercise. Solution correctness did not
depend on whether or not those locations were drawn over using single Ink Strokes or
multiple Ink Strokes. We later saw this in the classroom, where we noticed that students
had a propensity to lift their styluses multiple times during the writing of straight lines.
Next, instead of returning the bounding boxes of these summed Strokes, I
calculated the percent coverage in each of the Grid's rectangles. Within each rectangle, I
calculated the area of the aggregate bounding box and divided it by the rectangle's total
area, giving me a representation of roughly how much of that box was covered by Ink
Strokes. This value tells the user whether a box was deliberately meant to be shaded in, or
112

if the students likely made a mistake when their Ink Strokes strayed into that particular
rectangle.
In Figure B-8, the darkness of the color in each of the rectangles corresponds to
the percent coverage within that rectangle. A fully covered rectangle (percentage = 1.0)
corresponds to light green and a non-covered rectangle (percentage = 0.0) corresponds to
dark grey.
113
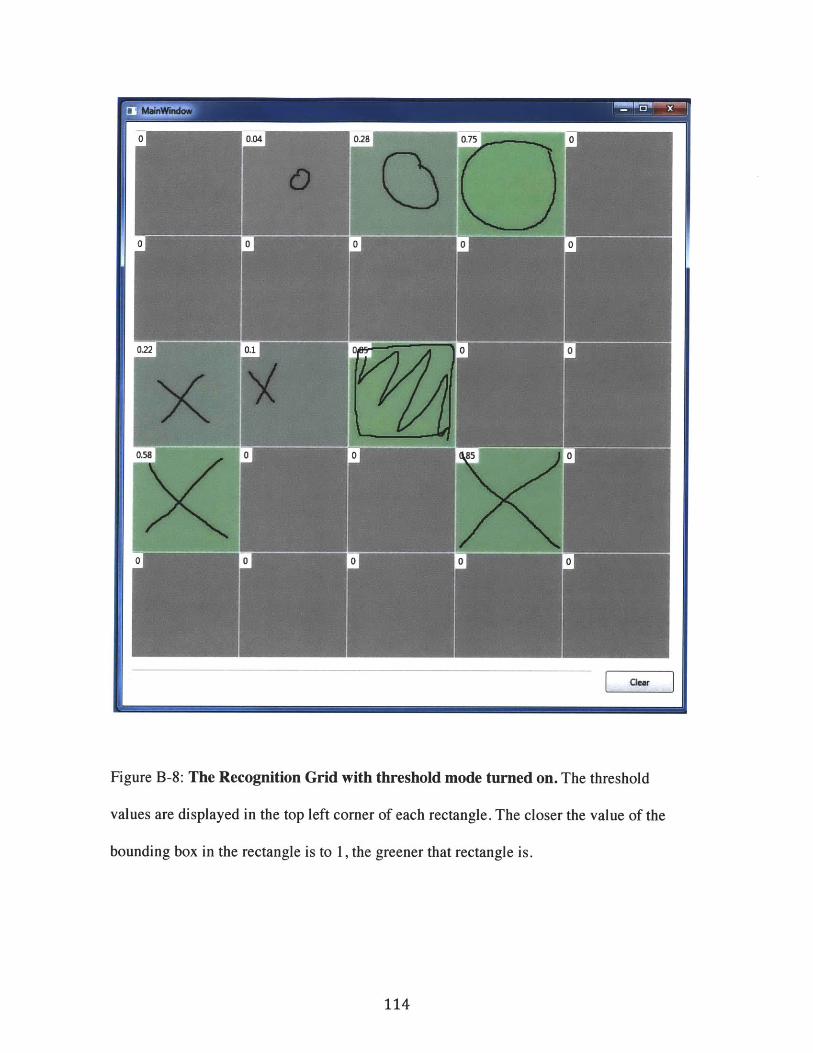
Figure B-8: The Recognition Grid with threshold mode turned on. The threshold
values are displayed in the top left corner of each rectangle. The closer the value of the
bounding box in the rectangle is to 1, the greener that rectangle is.
114
.. . ........... ................ - - -- --
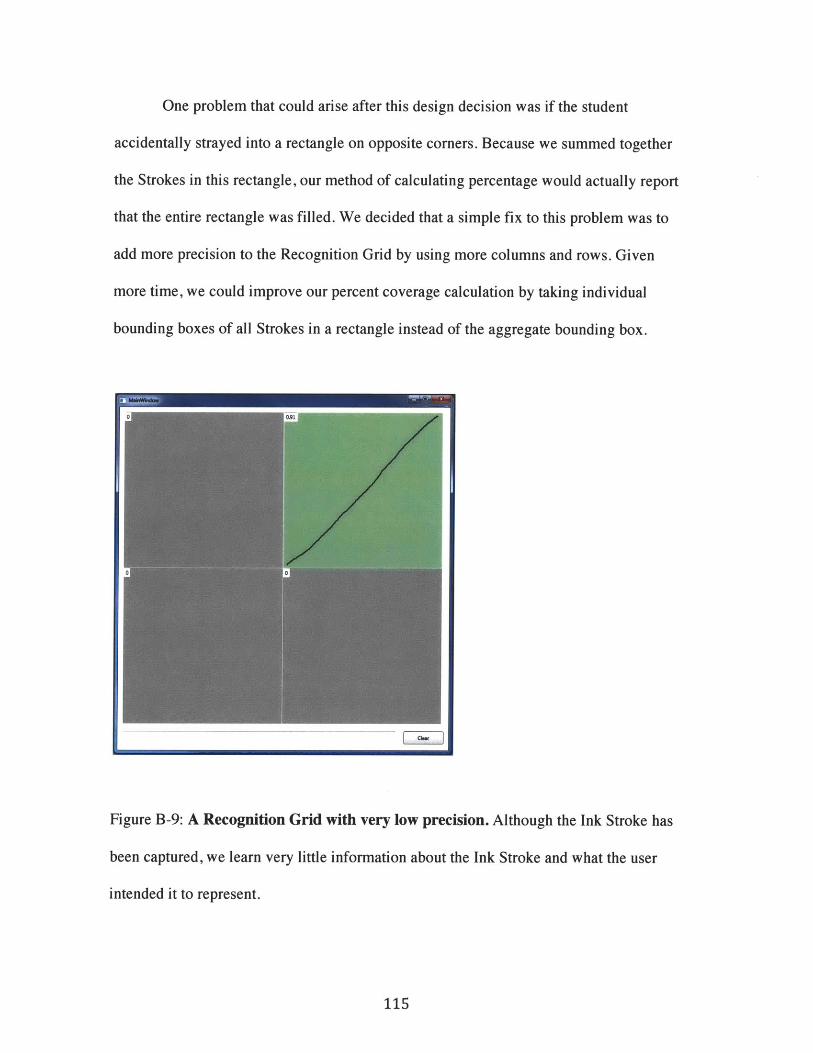
One problem that could arise after this design decision was if the student
accidentally strayed into a rectangle on opposite corners. Because we summed together
the Strokes in this rectangle, our method of calculating percentage would actually report
that the entire rectangle was filled. We decided that a simple fix to this problem was to
add more precision to the Recognition Grid by using more columns and rows. Given
more time, we could improve our percent coverage calculation by taking individual
bounding boxes of all Strokes in a rectangle instead of the aggregate bounding box.
Figure B-9: A Recognition Grid with very low precision. Although the Ink Stroke has
been captured, we learn very little information about the Ink Stroke and what the user
intended it to represent.
115
.. .................... .............. .... . ..... .........
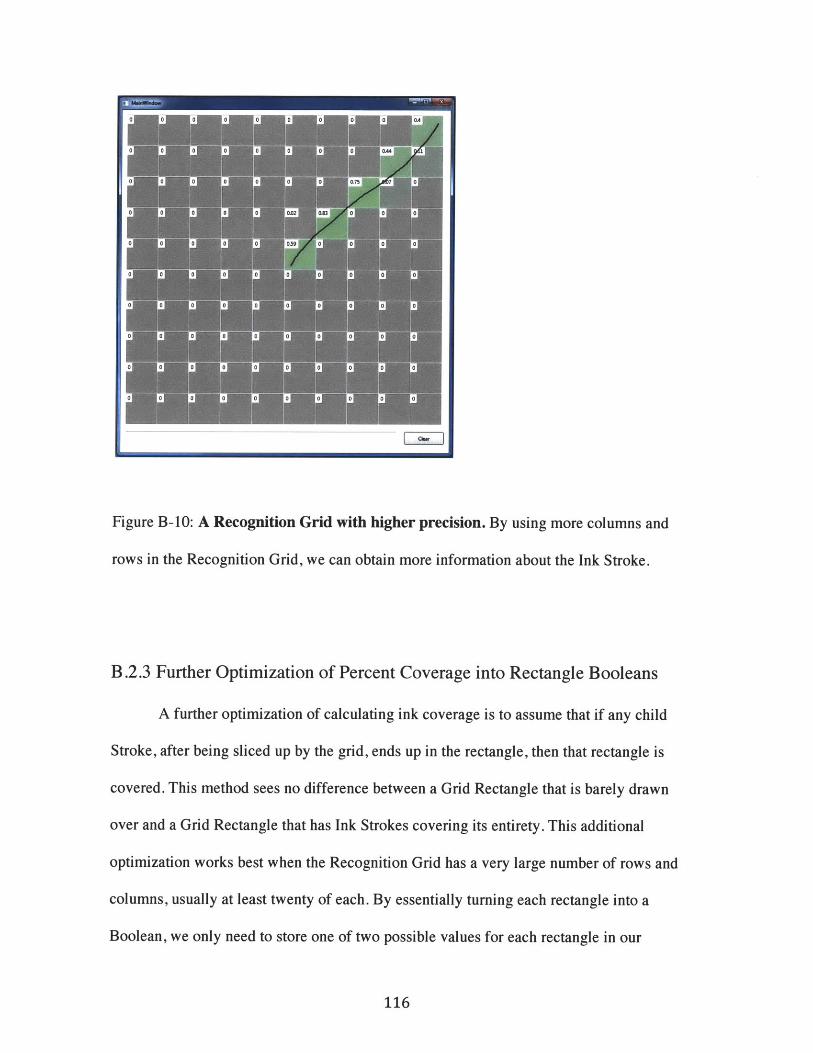
Figure B-10: A Recognition Grid with higher precision. By using more columns and
rows in the Recognition Grid, we can obtain more information about the Ink Stroke.
B.2.3 Further Optimization of Percent Coverage into Rectangle Booleans
A further optimization of calculating ink coverage is to assume that if any child
Stroke, after being sliced up by the grid, ends up in the rectangle, then that rectangle is
covered. This method sees no difference between a Grid Rectangle that is barely drawn
over and a Grid Rectangle that has Ink Strokes covering its entirety. This additional
optimization works best when the Recognition Grid has a very large number of rows and
columns, usually at least twenty of each. By essentially turning each rectangle into a
Boolean, we only need to store one of two possible values for each rectangle in our
116
-- - -- - ----------- --. . .. . ..... . ........................
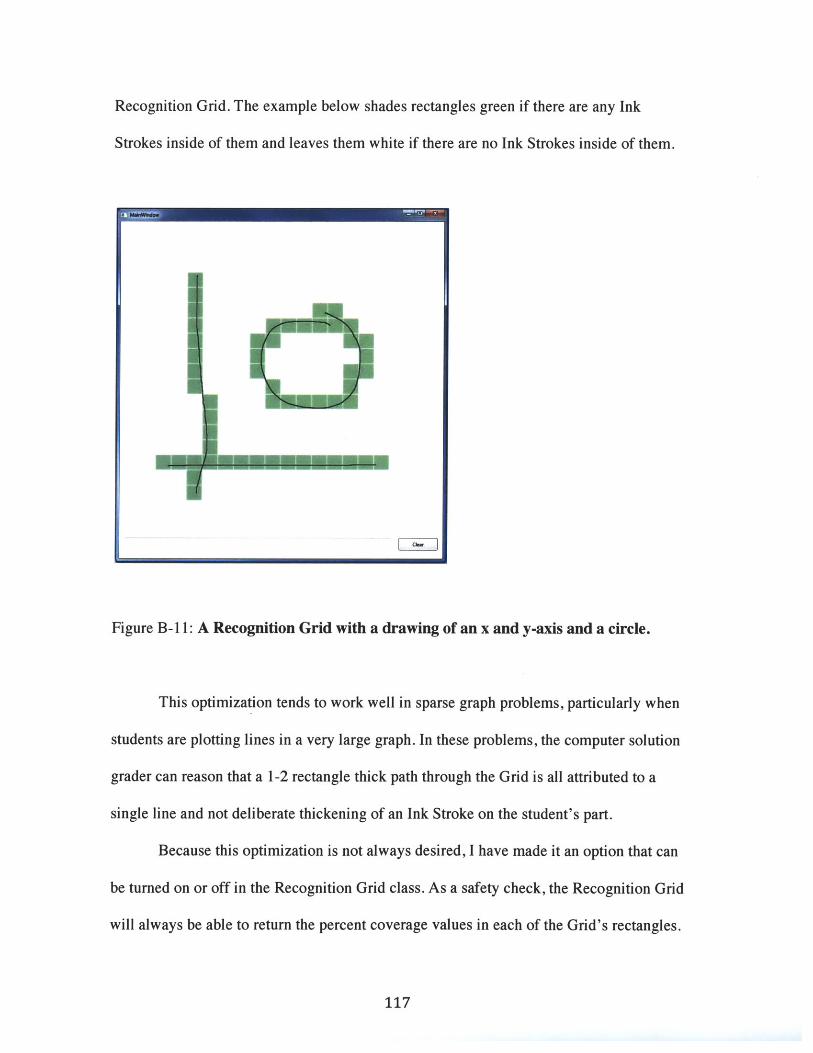
Recognition Grid. The example below shades rectangles green if there are any Ink
Strokes inside of them and leaves them white if there are no Ink Strokes inside of them.
Figure B-11: A Recognition Grid with a drawing of an x and y-axis and a circle.
This optimization tends to work well in sparse graph problems, particularly when
students are plotting lines in a very large graph. In these problems, the computer solution
grader can reason that a 1-2 rectangle thick path through the Grid is all attributed to a
single line and not deliberate thickening of an Ink Stroke on the student's part.
Because this optimization is not always desired, I have made it an option that can
be turned on or off in the Recognition Grid class. As a safety check, the Recognition Grid
will always be able to return the percent coverage values in each of the Grid's rectangles.
117
z~z
........... W- - - - --- - --- -- - - - - - -- -- - I - I - - --- -- - !!! - - - - - -- -- - .....................
For many of our classroom examples, I simply use the Rectangle Boolean mode when
visualizing the Recognition Grid, while I continue to use coverage values when actually
numerically evaluating the solutions.
B.2.4 Performance Optimizations
B.2.4.1 Speeding up erasing
Erasing strokes is a very computationally intense process. When a user adds
strokes to the Recognition Grid, the methods process that stroke and find out the
rectangles to which the child strokes were clipped, and only the Stroke Collections in
those rectangles get modified. However, when a stroke is removed, we need a fast way to
find the child strokes that were clipped as a result of adding that stroke. To optimize this,
I created a dictionary that mapped a stroke to an arraylist of all the child strokes that were
a result of clipping that stroke against the grid. Whenever a stroke gets added, this
dictionary gets populated. When the stroke is then removed, we look in the dictionary for
all of the child strokes. This saves us from having to recalculate and re-clip all of the
strokes currently on the Recognition Grid, and this optimization significantly speeds up
the performance of handling StrokesChanged events such as erasing.
B.2.4.2 Real Time and Delayed Features
The ultimate goal of the recognition is to understand the student answers and
report an aggregate of these results to the instructor. Teachers can always circulate among
students, examining individual student work and providing one-on-one feedback. The
118
Recognition Grid will drastically reduce the time it takes for the teacher to pinpoint
students with particular needs as well as provide feedback on the class's overall progress.
However, the discretizing, calculating of the bounding box, and character
interpretation can be computationally expensive. As the Recognition Grid gets larger,
these processes can begin to negatively affect the user experience noticeably. In order to
ensure a smooth user experience, I made the decision to move certain features from real
time.
The first feature was the text recognition. Because in the current version of the
software students never see the text translation of their writing, text does not need to be
recognized in real time. In fact, the recognizer often requires the context clues from
sentences to understand what is being written. This fact makes it logical to trigger text
recognition only when students save or submit their answers to the teacher.
Calculating the bounding box is also something that can be delayed until save or
submit actions. The threshold calculations that we get only need to be run through
regression tests after the students have completed the exercise. We can save valuable
resources by not having to do this in real time.
B.2.4.3 Erase By Point Batching
Erasing done by the students can be a computational nightmare. Microsoft allows
erasing using two methods with their Tablet software: by point and by strokes. Erasing by
point is the more computational intensive of the two because for every motion of the
eraser, dozens of erase-events are sent to the program to be processed. In turn, each of
these erase-events requires lookups into dictionaries to find the child strokes of the stroke
119
that was produced by clipping with the grid. These child strokes must be removed from
the Recognition Grid's storage of all of the child strokes in each of the grid's rectangles,
so that future threshold calculations can accurately reflect only the remaining strokes, and
not strokes that were once there but since removed.
Erasing by point is a popular feature because students like being able to control
the precision of their erasing. In order to keep the feature but speed up the computations
performed when it occurs, I decided to batch together many erase events into a few
"supersized" erase events. The Recognition Grid still processes each of the erase events,
which send a collection of "added-strokes" and a collection of "removed-strokes", and
adds all of the added strokes to an ongoing queue and all of the removed strokes to an
ongoing queue. The Recognition Grid waits until the eraser mode has been switched off,
such as when the student switches back to using a pen. Upon seeing the student using
pen-mode again, the Recognition Grid knows that there will most likely not be any
additional erasing events for a short while, and goes ahead and processes all of the
queued up added-strokes and removed-strokes.
One benefit of batching together erase events is that it takes advantages of the
redundancies in Microsoft's StrokeCollectionChanged events. For example, let's say we
have a single Ink Stroke ranging from the left side of the screen to the right side. If I
select the "EraseByPoint" eraser and erase down the middle of the stroke, we have cut the
original stroke in half. The Microsoft SDK conveys this erasing by removing the original
stroke and adding two new strokes that are the remaining left half and the right half
strokes, as seen in Figures B-12 and B-13.
120
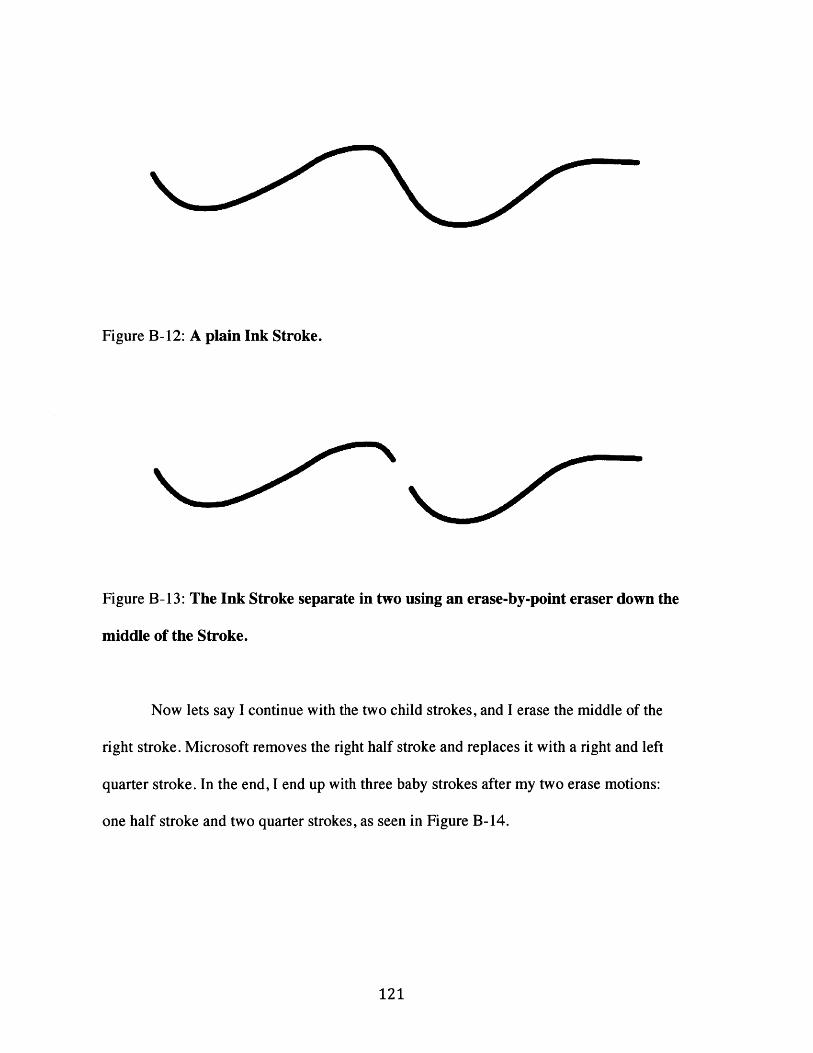
Figure B-12: A plain Ink Stroke.
Figure B-13: The Ink Stroke separate in two using an erase-by-point eraser down the
middle of the Stroke.
Now lets say I continue with the two child strokes, and I erase the middle of the
right stroke. Microsoft removes the right half stroke and replaces it with a right and left
quarter stroke. In the end, I end up with three baby strokes after my two erase motions:
one half stroke and two quarter strokes, as seen in Figure B-14.
121
\Omm
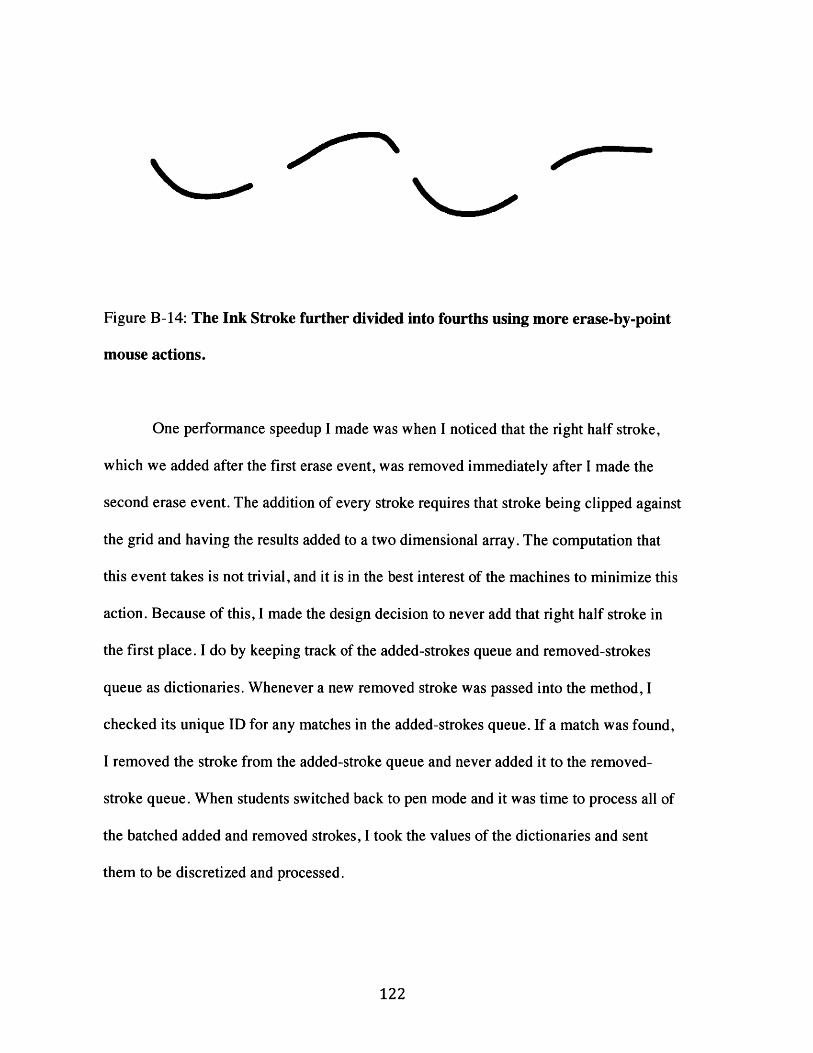
Figure B-14: The Ink Stroke further divided into fourths using more erase-by-point
mouse actions.
One performance speedup I made was when I noticed that the right half stroke,
which we added after the first erase event, was removed immediately after I made the
second erase event. The addition of every stroke requires that stroke being clipped against
the grid and having the results added to a two dimensional array. The computation that
this event takes is not trivial, and it is in the best interest of the machines to minimize this
action. Because of this, I made the design decision to never add that right half stroke in
the first place. I do by keeping track of the added-strokes queue and removed-strokes
queue as dictionaries. Whenever a new removed stroke was passed into the method, I
checked its unique ID for any matches in the added-strokes queue. If a match was found,
I removed the stroke from the added-stroke queue and never added it to the removed-
stroke queue. When students switched back to pen mode and it was time to process all of
the batched added and removed strokes, I took the values of the dictionaries and sent
them to be discretized and processed.
122
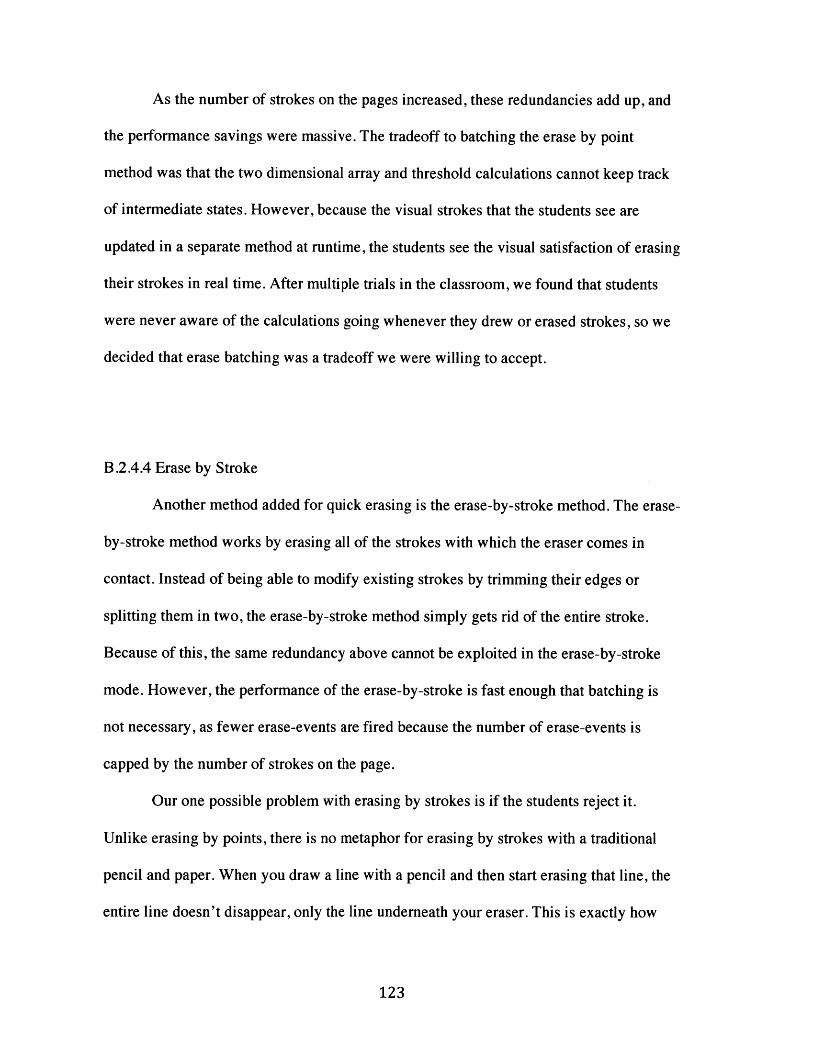
As the number of strokes on the pages increased, these redundancies add up, and
the performance savings were massive. The tradeoff to batching the erase by point
method was that the two dimensional array and threshold calculations cannot keep track
of intermediate states. However, because the visual strokes that the students see are
updated in a separate method at runtime, the students see the visual satisfaction of erasing
their strokes in real time. After multiple trials in the classroom, we found that students
were never aware of the calculations going whenever they drew or erased strokes, so we
decided that erase batching was a tradeoff we were willing to accept.
B.2.4.4 Erase by Stroke
Another method added for quick erasing is the erase-by-stroke method. The erase-
by-stroke method works by erasing all of the strokes with which the eraser comes in
contact. Instead of being able to modify existing strokes by trimming their edges or
splitting them in two, the erase-by-stroke method simply gets rid of the entire stroke.
Because of this, the same redundancy above cannot be exploited in the erase-by-stroke
mode. However, the performance of the erase-by-stroke is fast enough that batching is
not necessary, as fewer erase-events are fired because the number of erase-events is
capped by the number of strokes on the page.
Our one possible problem with erasing by strokes is if the students reject it.
Unlike erasing by points, there is no metaphor for erasing by strokes with a traditional
pencil and paper. When you draw a line with a pencil and then start erasing that line, the
entire line doesn't disappear, only the line underneath your eraser. This is exactly how
123

erasing by points works. Erasing by strokes feels less natural because most users have
never seen it in action before. However, the fourth grade students quickly adapted to the
erasing by strokes. In fact, we saw many of them playing with the functionality on their
scratch pages and later erasing by strokes on their exercise problems.
124
Appendix C
The Authoring Tool
I had to create tools for the teachers to design and create Recognition Grids. This
capability fell in line with the CLP Notebook's Authoring Tools being developed. In the
Notebook Editing Mode, I created a button on the Authoring Toolbar, named "Insert
Recognition Grid", that would start the process of creating a Recognition Grid on the
notebook page.
When the teacher clicked the "Insert Recognition Grid" button, I created a Modal
Window that would appear and prompted the teacher for the settings of the Grid. The
teacher was responsible for the following information relating to the grid:
125
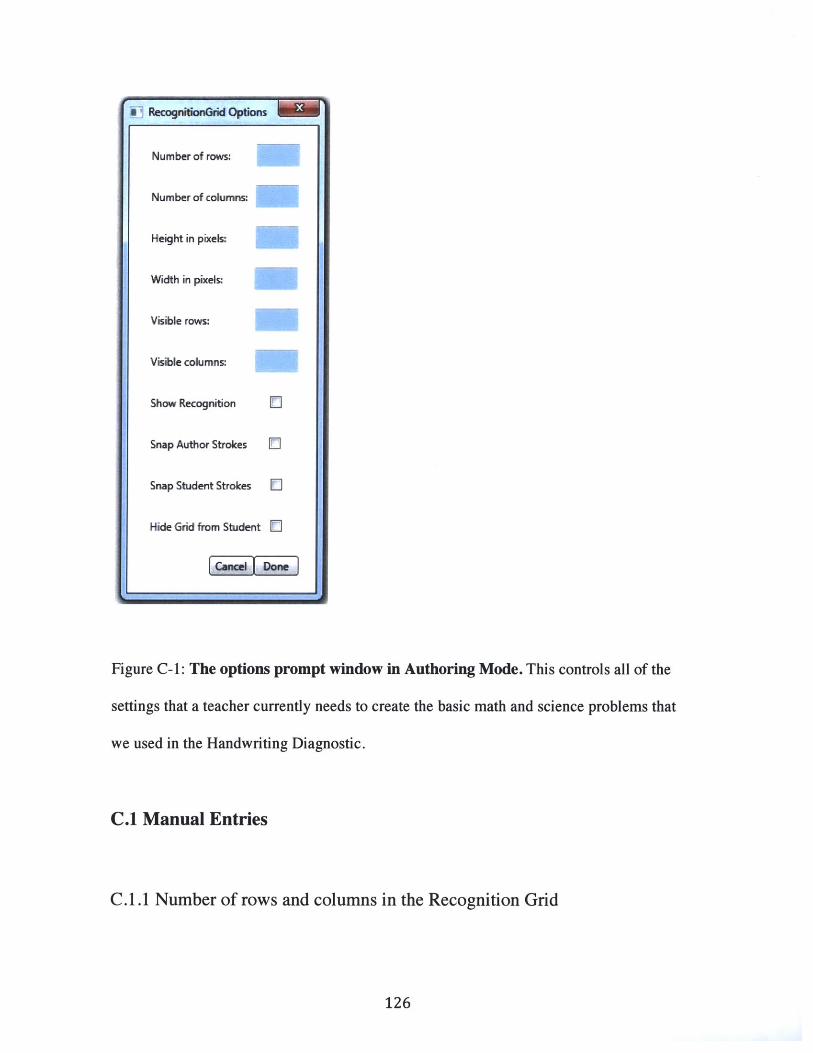
Figure C-1: The options prompt window in Authoring Mode. This controls all of the
settings that a teacher currently needs to create the basic math and science problems that
we used in the Handwriting Diagnostic.
C.1 Manual Entries
C.1.1 Number of rows and columns in the Recognition Grid
126
#3RecognitionGrid Options
N um ber of rows:
Number of columns:
Height in pixels:
Width in pixels:
Visible rows:
Visible columns:
Show Recognition
Snap Author Strokes
Snap Student Strokes El
Hide Grid from Student
CaneIEDonL4
..... ...... ..... ........ woo

The rows and columns are the dimensions of the grid doing the stroke clipping
and threshold calculating. Teachers should use lots of rows and columns for problems
such as graphing when precision is needed, and few rows and columns if the task at hand
is simply using the Ink Analyzer to interpret Ink Strokes into text and numbers.
Generally, the rule of thumb is that for drawings, diagrams, and graphs, teachers want a
lot of rows and columns because it makes ratio calculation, line detection, and other
features more accurate. For text and number recognition, the Ink Analyzer always
processes the unclipped strokes all at once, so the number of rows and columns is
irrelevant.
C.1.2 Height and Width of the Recognition Grid in pixels
The teacher is able to control the size of the Recognition Grid. This is important
when teachers want to guide student answers to different parts of the page.
C.1.3 Number of rows and columns that the student sees
Because tables and grids are a recurring theme in many of the math problems we
dealt with, we made the authoring tool such that teachers wouldn't have to manually
draw the lines in tables and grids themselves. These dimensions are not the same as the
ones used for clipping strokes (these not the same dimensions used in the underlying
Recognition Grid).
127
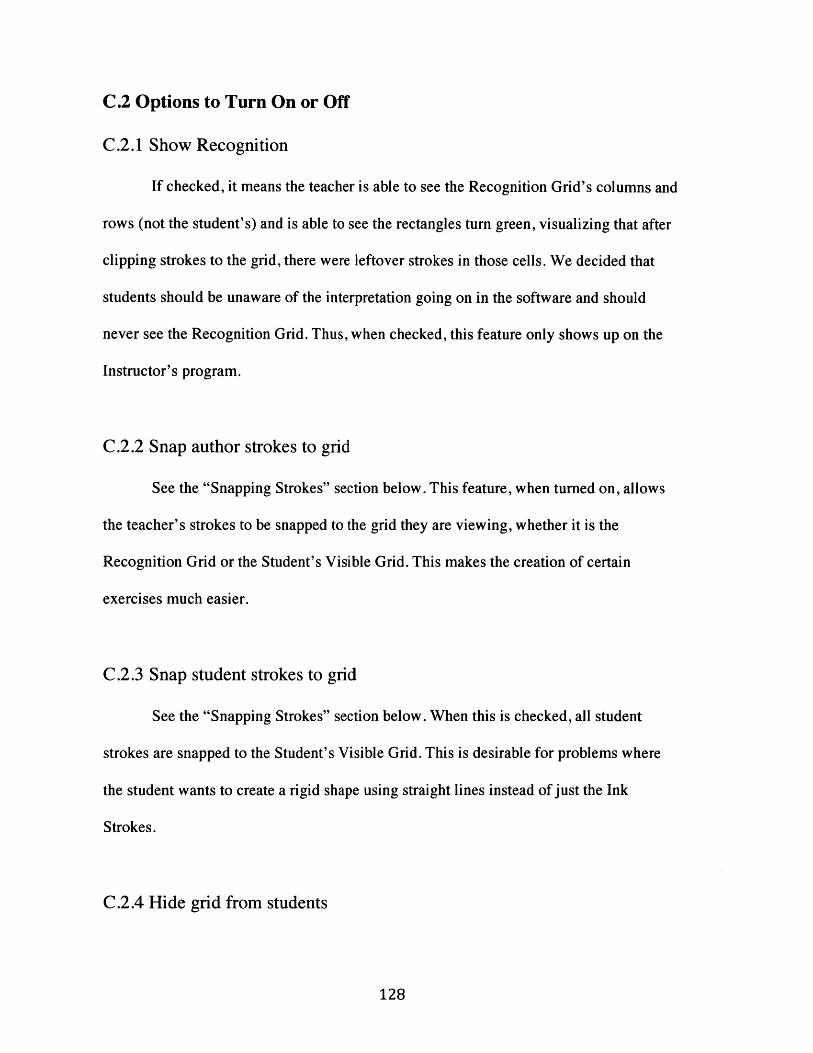
C.2 Options to Turn On or Off
C.2.1 Show Recognition
If checked, it means the teacher is able to see the Recognition Grid's columns and
rows (not the student's) and is able to see the rectangles turn green, visualizing that after
clipping strokes to the grid, there were leftover strokes in those cells. We decided that
students should be unaware of the interpretation going on in the software and should
never see the Recognition Grid. Thus, when checked, this feature only shows up on the
Instructor's program.
C.2.2 Snap author strokes to grid
See the "Snapping Strokes" section below. This feature, when turned on, allows
the teacher's strokes to be snapped to the grid they are viewing, whether it is the
Recognition Grid or the Student's Visible Grid. This makes the creation of certain
exercises much easier.
C.2.3 Snap student strokes to grid
See the "Snapping Strokes" section below. When this is checked, all student
strokes are snapped to the Student's Visible Grid. This is desirable for problems where
the student wants to create a rigid shape using straight lines instead of just the Ink
Strokes.
C.2.4 Hide grid from students
128
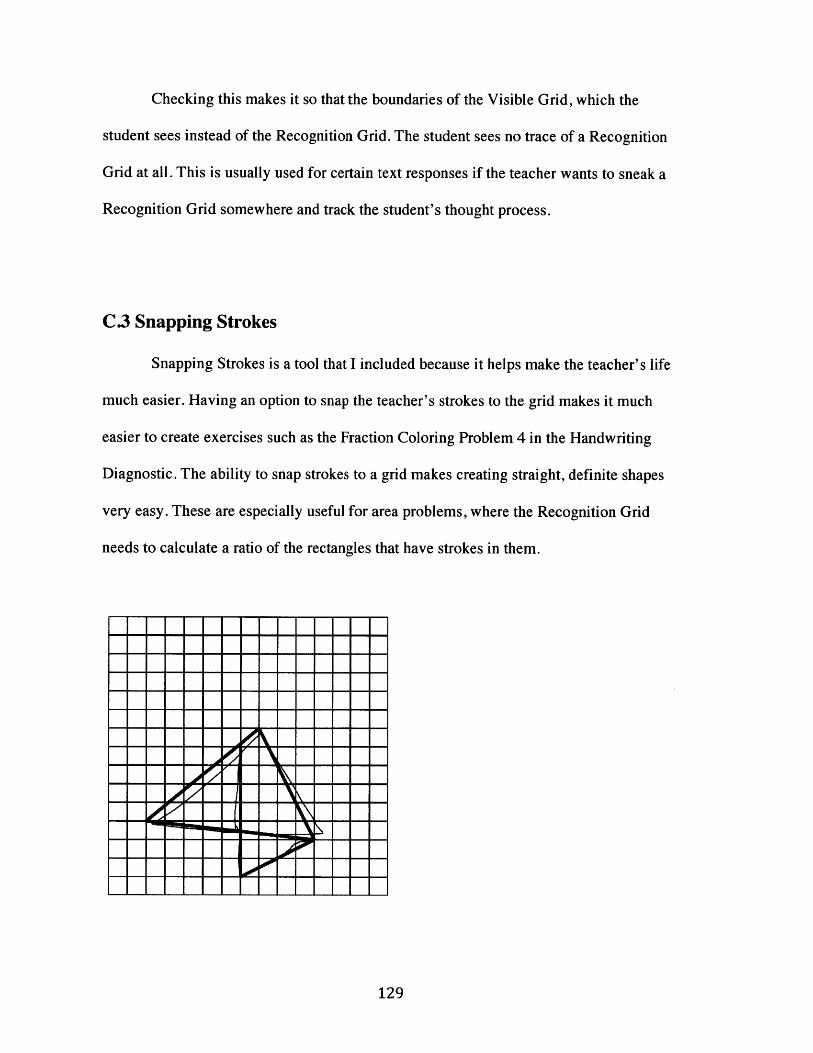
Checking this makes it so that the boundaries of the Visible Grid, which the
student sees instead of the Recognition Grid. The student sees no trace of a Recognition
Grid at all. This is usually used for certain text responses if the teacher wants to sneak a
Recognition Grid somewhere and track the student's thought process.
C.3 Snapping Strokes
Snapping Strokes is a tool that I included because it helps make the teacher's life
much easier. Having an option to snap the teacher's strokes to the grid makes it much
easier to create exercises such as the Fraction Coloring Problem 4 in the Handwriting
Diagnostic. The ability to snap strokes to a grid makes creating straight, definite shapes
very easy. These are especially useful for area problems, where the Recognition Grid
needs to calculate a ratio of the rectangles that have strokes in them.
129
OOAr X I"00
am IV
0001"
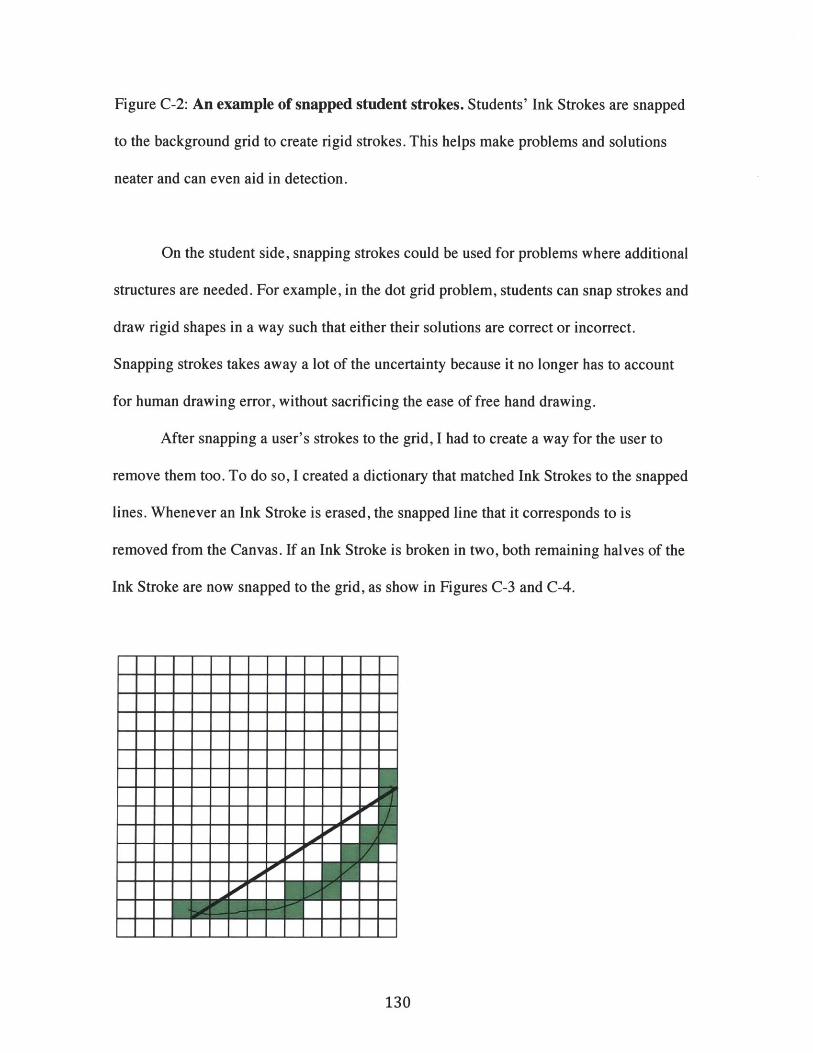
Figure C-2: An example of snapped student strokes. Students' Ink Strokes are snapped
to the background grid to create rigid strokes. This helps make problems and solutions
neater and can even aid in detection.
On the student side, snapping strokes could be used for problems where additional
structures are needed. For example, in the dot grid problem, students can snap strokes and
draw rigid shapes in a way such that either their solutions are correct or incorrect.
Snapping strokes takes away a lot of the uncertainty because it no longer has to account
for human drawing error, without sacrificing the ease of free hand drawing.
After snapping a user's strokes to the grid, I had to create a way for the user to
remove them too. To do so, I created a dictionary that matched Ink Strokes to the snapped
lines. Whenever an Ink Stroke is erased, the snapped line that it corresponds to is
removed from the Canvas. If an Ink Stroke is broken in two, both remaining halves of the
Ink Stroke are now snapped to the grid, as show in Figures C-3 and C-4.
130
===rnrn==0jehE
..... ........... ..........
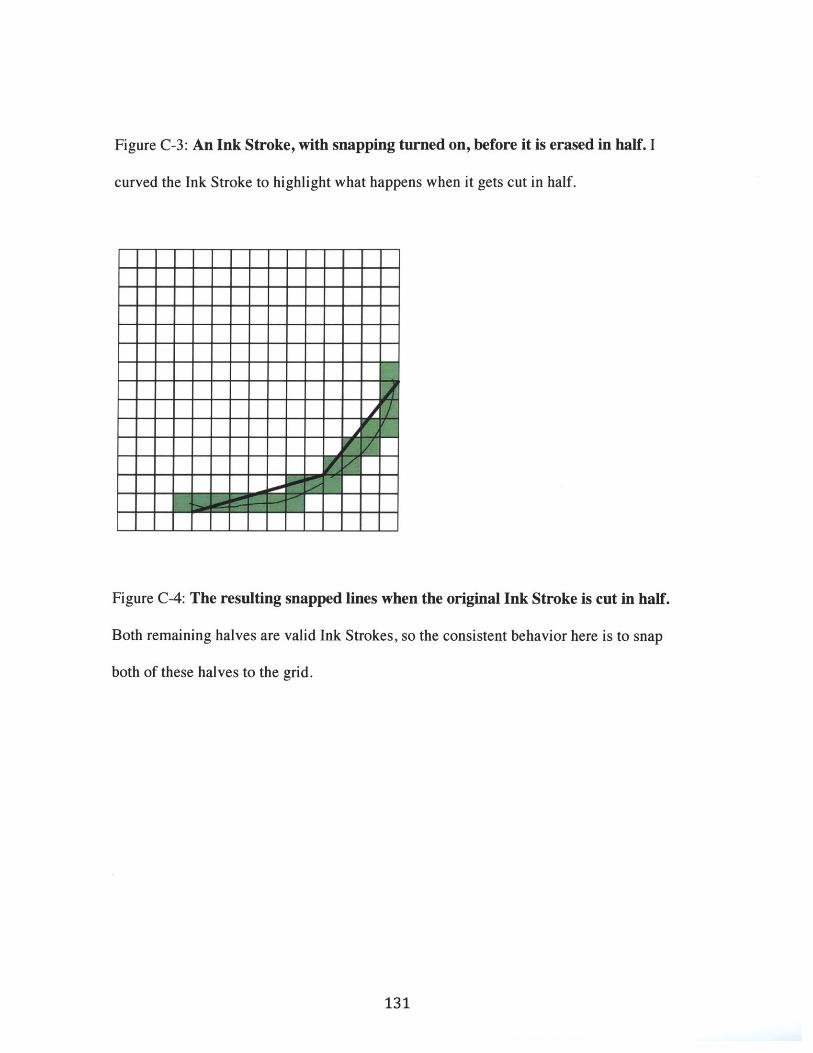
Figure C-3: An Ink Stroke, with snapping turned on, before it is erased in half. I
curved the Ink Stroke to highlight what happens when it gets cut in half.
Figure C-4: The resulting snapped lines when the original Ink Stroke is cut in half.
Both remaining halves are valid Ink Strokes, so the consistent behavior here is to snap
both of these halves to the grid.
131
.......... .