analyzing stock quotes using data mining...
TRANSCRIPT

Department of Computer Science, the University of Hong Kong
Analyzing Stock Quotes using Data Mining Techniques
Final Year Project
2012-2013
Final Report
Supervisor: Dr. W.S. Ho Student: To Yi Fun, Cyrus(2010149103)
Table of Content
1. Introduction ......................................... P.1
2. Flow of Report ......................................... P.2-3
3. Approaches ......................................... P.3-6
4. Implementation ......................................... P.7-13
5. Result Presentation ......................................... P.13-14
6. Assessment ......................................... P.15
7. Data Analysis ......................................... P.16-17
8. Modification ......................................... P.18-19
9. Result Presentation ......................................... P.19-21
10. Assessment ......................................... P.22-24
11. Result Presentation ......................................... P.25-26
12. Modification ......................................... P.27-28
13. Result Presentation ......................................... P.29
14. Assessment ......................................... P.30-31
15. Data Deployed,
Technology Deployed,
Core Code, Material
Reference
......................................... Reference

1. Introduction This report aims at implementing the plans from the previous state. It will discuss the implementation, modification of algorithm of the modules Classification, on the induction of decision tree. It will reveal the details of the construction, verification and modification of the application.
1.1 Planning Classification, as one of the major data mining techniques, can be applied in different fields to help the user building up descriptive model to classify instances into different class or predictive model to reveal the behavior of testing set by using classifier. Decision Tree is an example of classifiers. It is structured as a tree with attributes as nodes and conditional statements as braches. Its leaves represent the class labels.
The goal of this project is to build a decision tree that can help the user to predict the trend of the testing set stock in the stock trading market.
1.2 Feasibility Test The Decision Tree will be implemented using a 3-Tier Structure, which consists of a back-end database, a server-side (localhost) engine, a client-side console application. Components like connectors, converters for data structure conversion and application connection will also be used in this project. In the previous state, we expect the application can represent the induced decision tree by visualization. Due to lack of resource, we temporary use console to represent the tree in this report. We will expect the first induced decision tree not accurate enough to help making decision in stock trading. The tree will be modified using methods like post-pruning to enhance the accuracy and we hope that this can improve the predicative power of the decision tree
Introduction—Analyzing Stock Quotes Using Data Mining Techniques P.1
2. Flow of Report We will introduce each part of the project here for a clear understanding for readers.
2.1 Approach We will discuss the strategies, restrictions, criteria for each process of the
project.
2.2 Implementation Technologies: We will discuss the technologies that have been deployed in the application. Structure: We will discuss how the application is being constructed here. It mainly contains three components. They are Source, Preprocessing and Engine. We will discuss what data from the U.S. stock market is being
deployed in the application. For preprocessing, we mainly talk about how the attributes are being set from the source data. They will be used in the induction of the decision tree. For engine, we will talk about how the algorithms of decision tree induction is implemented in source code.
2.3 Result Presentation The outcomes of the applications run on the processed data will be present here. It will be a decision tree induced on the source data from the U.S.
stock market (training set). It will present the tree as detail as possible including the instances passing each node.
2.4 Assessment (Testing) We will test the induced decision tree from the previous part to see its performance. The testing scheme will include both the source data used in the induction process (training set) and source data not used in the induction process (testing set). It will also include statistical measures to assess the performance of the decision tree.
Flow of Report—Analyzing Stock Quotes Using Data Mining Techniques P.2
2.5 Modification We will expect the first induced decision tree to have limited predicative power. We will make modification to address the issue. The modification contains three components. They are data analysis, algorithm modification and assessment on the modified decision tree. In data analysis, we will explain the failure or limitation of the current decision tree. In algorithm modification, we will try to address the issue based on the previous analysis part. Finally, we will assess the modified decision tree again to see
if there is any improvement after the modification. We hope that the performance of the tree will be better by adopting this flow. The modification will be carried out several times for improvement.
Flow of Report—Analyzing Stock Quotes Using Data Mining Techniques P.3
3. Approach This report aims at implementing the plans from the previous state. It will discuss the implementation, modification of algorithm of the modules Classification, by the induction of decision tree. It will reveal the details of the construction, verification and modification of the application.
3.1 Source
To induce the decision tree, we have to collect raw data of training set and testing set from the stock market. The criteria for selecting training set is that they are indicators of the market, i.e. we choose to use the DOW index constituent 30 shares as the training set as they occupy the stock market by a weighting large enough to reflect the trend of the stock market. We considered them as good example of training set in this project For testing set, we consider using the medium-sized (judge by volume)
stock as small size stock may fluctuate intensively. Besides, we will use the training set which stay the same industry as the testing set.
3.2 Preprocessing After temporary storage of source data, we will generate the attributes for each instance. Instances will be chopped to ensure consistency. We will use trading signals like morning star (a signal for buy), three black solider (a signal for sell) as attributes. We hope that the attributes can classify the instances using its market meaning. It is also expected that the number of instances having those attributes (signals) would be small.
Approach—Analyzing Stock Quotes Using Data Mining Techniques P.4

3.3 Decision Tree Induction After the data has been preprocessed, we will construct the decision tree using the training set data. At this point, we will adopt the most common strategy for inducing the tree and try to modify it later. The induction algorithm will have the following characteristics: 1. Greedy: locally optimal decision (best-attribute currently) will be made.
2. Follow Occam’s Razor principle1 (under the same predicative power, a simpler decision tree is a better one): tends to produce a simpler and shorter tree. This principle is applied by using pruning to produce a simpler decision tree. However, pruning is not applied for the first induced decision tree.
3. Information Gain as Best Attribute: Choose the attribute that has the
highest information gain as the best attribute. The meaning of information gain is the change in information entropy from the prior state (before taking it as node) to current state (taken it as a node).
Information entropy is the expected value of information contained in a message.
4. Top-Down: The decision tree is constructed from root to leaves.
5. Natural Termination: The algorithm does not terminate the induction tree when the number of the node exceed a certain threshold nor terminate the induction when the height exceed certain level. It terminates when the all the attributes have been used.
Basically, the decision tree is induced from top to bottom, choosing the best attribute remaining on the set of attributes for each level of height recursively. After choosing the best attribute, branches indicating the values of that attribute are unfold from the node and then start all over again. This process continues until there is no more attributes from the set of remaining attributes. The instances are split using these attributes.
1. Sentences of Peter Lombard, 1495, William of Ockham
Approach—Analyzing Stock Quotes Using Data Mining Techniques P.5
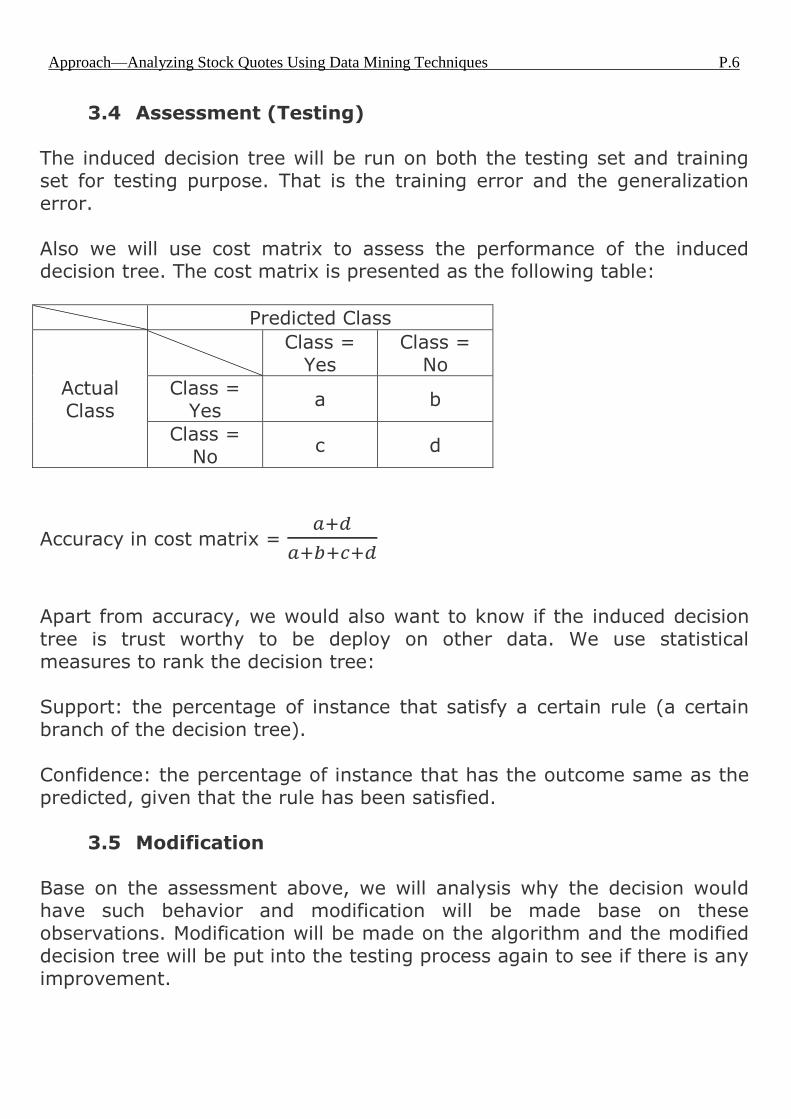
3.4 Assessment (Testing) The induced decision tree will be run on both the testing set and training set for testing purpose. That is the training error and the generalization error. Also we will use cost matrix to assess the performance of the induced decision tree. The cost matrix is presented as the following table:
Predicted Class
Actual Class
Class =
Yes Class =
No
Class = Yes
a b
Class = No
c d
Accuracy in cost matrix =
Apart from accuracy, we would also want to know if the induced decision tree is trust worthy to be deploy on other data. We use statistical measures to rank the decision tree: Support: the percentage of instance that satisfy a certain rule (a certain branch of the decision tree).
Confidence: the percentage of instance that has the outcome same as the predicted, given that the rule has been satisfied.
3.5 Modification Base on the assessment above, we will analysis why the decision would have such behavior and modification will be made base on these observations. Modification will be made on the algorithm and the modified
decision tree will be put into the testing process again to see if there is any improvement.
Approach—Analyzing Stock Quotes Using Data Mining Techniques P.6

4. Implementation This report aims at implementing the plans from the previous state. It will discuss the implementation, modification of algorithm of the modules Classification, on the induction of decision tree. It will reveal the details of the construction, verification and modification of the application.
4.1 Technology
To implement the application, we make use of technologies available on the web and PC lab. To collect the DOW index constituent 30 shares and the testing set, we use Yahoo! Finance2 to import the historic stock prices of these stocks. The details of the DOW index constituent 30 shares and the testing set can be viewed at reference3. After importing the training set and testing test data, we need an application for storage and preprocessing to generate the attributes. We use mySQL4 this time as it is relative easy to use and contain mySQL
command to manipulate the raw data. For convenience, we installed XAMPP5 package for running the mySQL database. We also used a command line generator6 for converting spreadsheet records to SQL insertion statement. The versions of mySQL database and XAMPP are 5.5 and 1.8.1respectively. After passing the raw data into the database application, we have to retrieve data, implement algorithms and present the result. We use Microsoft Visual Studio 2010 professional7 for implementation and
presenting the result. For convenience, we use Visual C# Console Application to write the algorithms since the developing environment is mature. To retrieve data from mySQL database, we have to use the mySQL connector8 to connect the Console Application with the database. Other software have been used for inspection, modification and testing. For example, Microsoft Office 2007 has been used for generating graphs for data analysis.
Implementation—Analyzing Stock Quotes Using Data Mining Techniques P.7
2. http://finance.yahoo.com/
3. At Reference 7.1.1
4. http://www.mysql.com/
5. http://www.apachefriends.org/zh_tw/xampp.html
6. http://dev.mysql.com/downloads/connector/net/6.1.html
7. http://www.microsoft.com/visualstudio/eng/team-foundation-service
8. http://www.codeproject.com/Articles/83673/Importing-Data-from-Spreadsheet-XLS-to-SQL-Databas [by
caiubyfreitas]

Learn
Raw Data
Storage and Preprocessing
Algorithms Implementation and Presentation
Apply Classifier (Model)
Our focus will be on the classifier (induction of decision tree).
4.3 Source For the following implementation, we will use 5 out of the DOW index constituent 30 shares. They are all in the IT industry:
Company Date of stock price used Total records
cisco 1990/4/20-31/12/2012 5721
hp 1962/1/9-31/12/2012 12833
ibm 1962/1/12-31/12/2012 12830
intel 1986/7/31-31/12/2012 6662
microsoft 1986/3/25-31/12/2012 6751
They merged into one single table and stored into the database. The total
number of records is 44797.
4.2 Structure
The Structure of the application will consist of three components: Raw Data, Storage and Preprocessing and Algorithms Implementation and Presentation. The following graph will illustrate the structure:
Implementation—Analyzing Stock Quotes Using Data Mining Techniques P.8
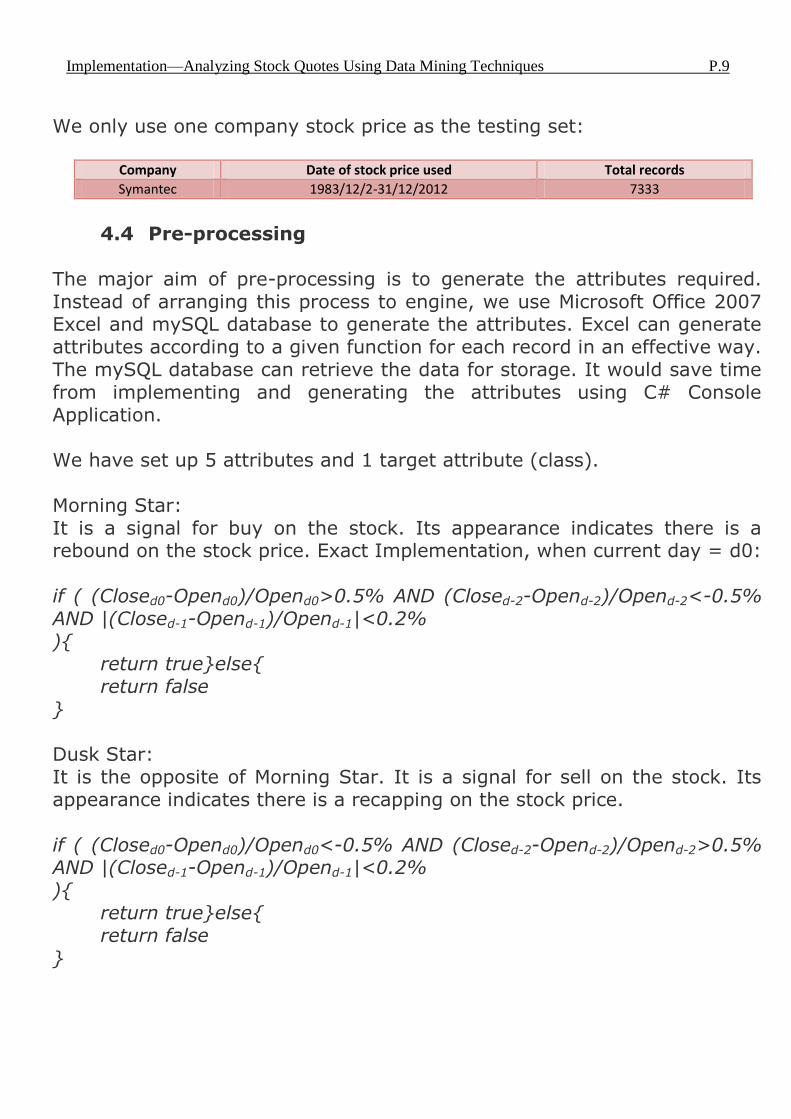
We only use one company stock price as the testing set:
Company Date of stock price used Total records
Symantec 1983/12/2-31/12/2012 7333
4.4 Pre-processing
The major aim of pre-processing is to generate the attributes required. Instead of arranging this process to engine, we use Microsoft Office 2007 Excel and mySQL database to generate the attributes. Excel can generate attributes according to a given function for each record in an effective way. The mySQL database can retrieve the data for storage. It would save time from implementing and generating the attributes using C# Console Application. We have set up 5 attributes and 1 target attribute (class). Morning Star:
It is a signal for buy on the stock. Its appearance indicates there is a rebound on the stock price. Exact Implementation, when current day = d0: if ( (Closed0-Opend0)/Opend0>0.5% AND (Closed-2-Opend-2)/Opend-2<-0.5% AND |(Closed-1-Opend-1)/Opend-1|<0.2% ){
return true}else{ return false
} Dusk Star: It is the opposite of Morning Star. It is a signal for sell on the stock. Its appearance indicates there is a recapping on the stock price. if ( (Closed0-Opend0)/Opend0<-0.5% AND (Closed-2-Opend-2)/Opend-2>0.5% AND |(Closed-1-Opend-1)/Opend-1|<0.2% ){
return true}else{ return false
}
Implementation—Analyzing Stock Quotes Using Data Mining Techniques P.9

Three White Soldiers: It is a signal for buy on the stock. Its appearance indicates there will be a continuous rising trend of the stock price. Exact Implementation, when current day = d0: if ( (Closed-2-Opend-2)>0 AND (Closed-1-Opend-1)>0 AND (Closed0-Opend0)>0 AND Closed-2 < Closed-1 AND Closed-1 < Closed0 ){
return true}else{
return false } Three Black Soldiers: It is the opposite of Three White Soldiers. It is a signal for sell on the stock. Its appearance indicates there will be a continuous falling trend of the stock price. Exact Implementation, when current day = d0: if ( (Closed-2-Opend-2)<0 AND (Closed-1-Opend-1)<0 AND (Closed0-Opend0)<0
AND Closed-2 > Closed-1 AND Closed-1 > Closed0 ){
return true}else{ return false
} Hammer: It is a signal for buy on the stock. Its appearance indicates there is support for the stock price.
if ( (Close-Open)>0 AND (Open-Min)>(3)(Close-Open) AND ((Close-Open)>(Max-Close) ){
return true}else{ return false
}
Implementation—Analyzing Stock Quotes Using Data Mining Techniques P.10
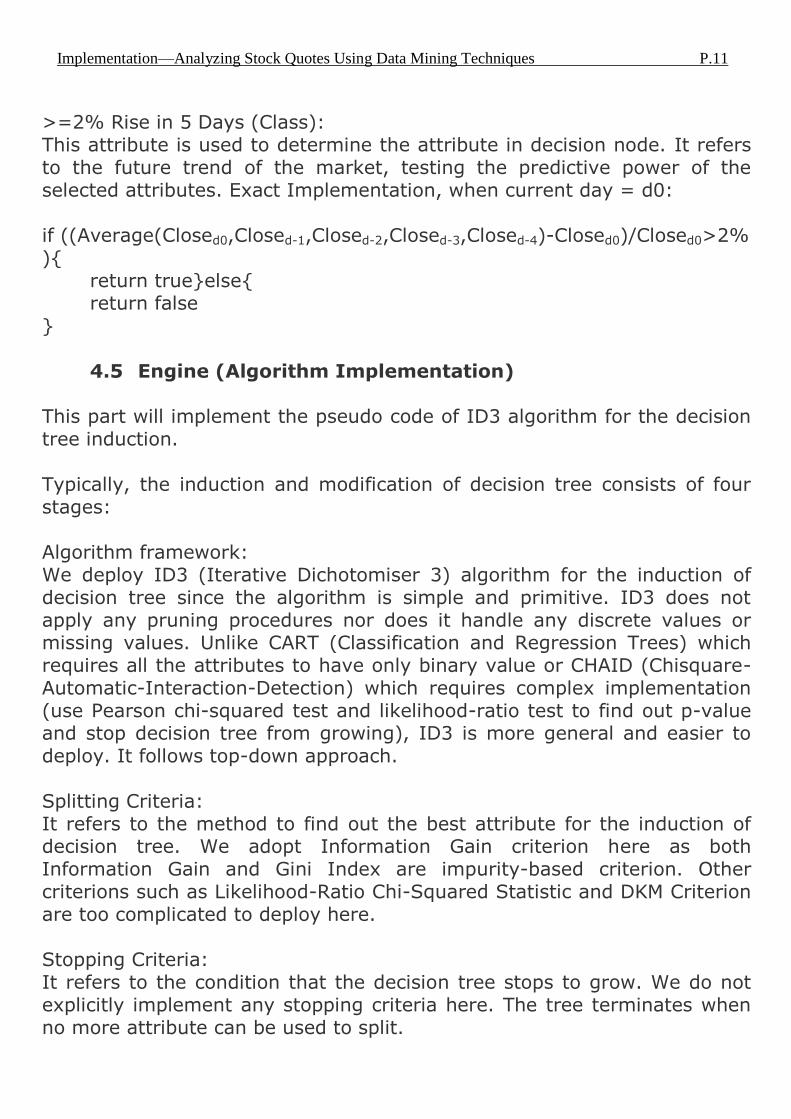
>=2% Rise in 5 Days (Class): This attribute is used to determine the attribute in decision node. It refers to the future trend of the market, testing the predictive power of the selected attributes. Exact Implementation, when current day = d0: if ((Average(Closed0,Closed-1,Closed-2,Closed-3,Closed-4)-Closed0)/Closed0>2% ){
return true}else{ return false
}
4.5 Engine (Algorithm Implementation) This part will implement the pseudo code of ID3 algorithm for the decision tree induction. Typically, the induction and modification of decision tree consists of four stages: Algorithm framework: We deploy ID3 (Iterative Dichotomiser 3) algorithm for the induction of decision tree since the algorithm is simple and primitive. ID3 does not apply any pruning procedures nor does it handle any discrete values or missing values. Unlike CART (Classification and Regression Trees) which requires all the attributes to have only binary value or CHAID (Chisquare-Automatic-Interaction-Detection) which requires complex implementation (use Pearson chi-squared test and likelihood-ratio test to find out p-value and stop decision tree from growing), ID3 is more general and easier to
deploy. It follows top-down approach. Splitting Criteria: It refers to the method to find out the best attribute for the induction of decision tree. We adopt Information Gain criterion here as both Information Gain and Gini Index are impurity-based criterion. Other criterions such as Likelihood-Ratio Chi-Squared Statistic and DKM Criterion are too complicated to deploy here. Stopping Criteria: It refers to the condition that the decision tree stops to grow. We do not explicitly implement any stopping criteria here. The tree terminates when no more attribute can be used to split.
Implementation—Analyzing Stock Quotes Using Data Mining Techniques P.11

Pruning Method: It refers to the method to prune the induced tree. No pruning has been implemented in here. Pseudo Code: We imitate ID3 algorithm9 in this implementation.
ID3 (Examples, Target_Attribute, Attributes) 10
Create a root node for the tree
If all examples are positive, Return the single-node tree Root, with label = +.
If all examples are negative, Return the single-node tree Root, with label = -.
If number of predicting attributes is empty, then Return the single node tree Root,
with label = most common value of the target attribute in the examples.
Otherwise Begin
A ← The Attribute that best classifies examples.
Decision Tree attribute for Root = A.
For each possible value, , of A,
Add a new tree branch below Root, corresponding to the test A = .
Let Examples( ) be the subset of examples that have the value for A
If Examples( ) is empty
Then below this new branch add a leaf node with label = most common target value in the examples
Else below this new branch add the subtree ID3 (Examples( ),
Target_Attribute, Attributes – {A})
End
Return Root
9. The ID3 algorithm is reference from Wikipedia, http://en.wikipedia.org/wiki/ID3_alogrithm and the inventor of this
algorithm is John Ross Quinlan
10. The core part of the source of this implementation can be found at reference 15.3
Implementation—Analyzing Stock Quotes Using Data Mining Techniques P.12
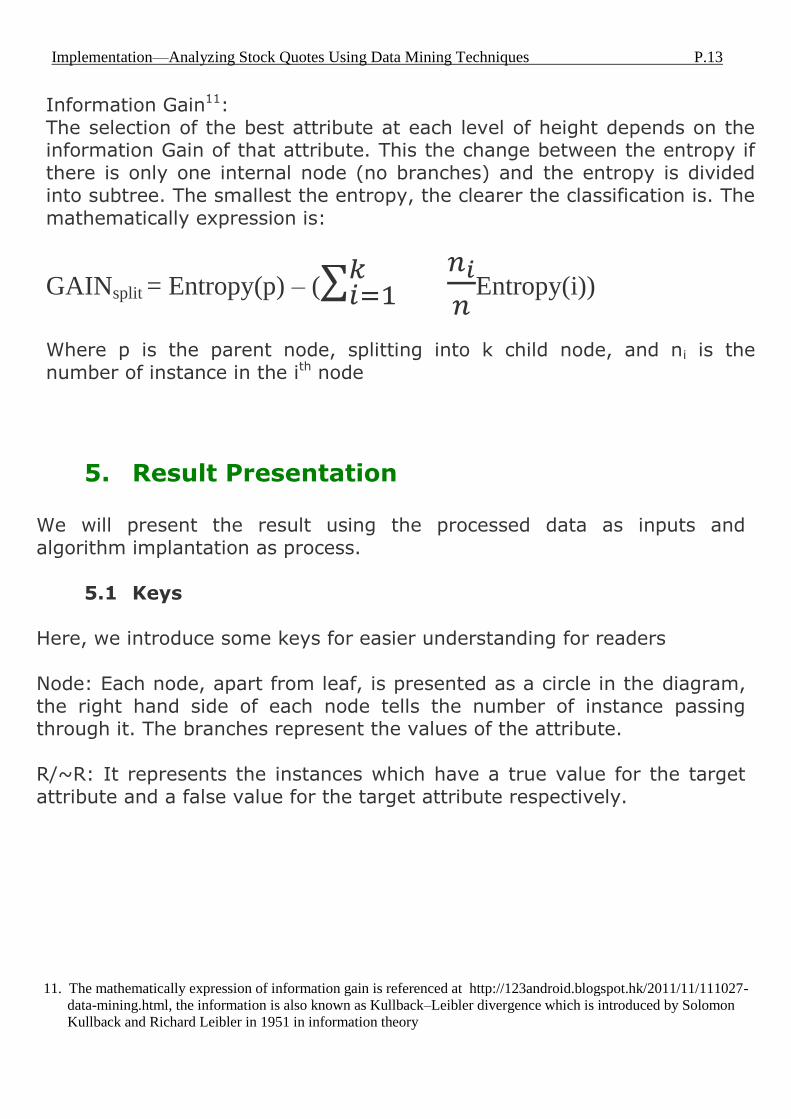
Information Gain11: The selection of the best attribute at each level of height depends on the information Gain of that attribute. This the change between the entropy if there is only one internal node (no branches) and the entropy is divided into subtree. The smallest the entropy, the clearer the classification is. The mathematically expression is:
GAINsplit = Entropy(p) – (
Entropy(i))
Where p is the parent node, splitting into k child node, and ni is the number of instance in the ith node
Implementation—Analyzing Stock Quotes Using Data Mining Techniques P.13
11. The mathematically expression of information gain is referenced at http://123android.blogspot.hk/2011/11/111027-
data-mining.html, the information is also known as Kullback–Leibler divergence which is introduced by Solomon
Kullback and Richard Leibler in 1951 in information theory
5. Result Presentation
We will present the result using the processed data as inputs and algorithm implantation as process.
5.1 Keys Here, we introduce some keys for easier understanding for readers Node: Each node, apart from leaf, is presented as a circle in the diagram, the right hand side of each node tells the number of instance passing through it. The branches represent the values of the attribute.
R/~R: It represents the instances which have a true value for the target attribute and a false value for the target attribute respectively.
5.2
D
iag
ram
P
resentatio
n—
Analy
zing
Sto
ck Q
uotes U
sing D
ata Min
ing T
echniq
ues
P
.14

6. Assessment (skip) As the result of this experiment generates a null tree (all the leaves favor ~R class), assessment on the accuracy of the decision tree is not performed and we will not run the testing set on this null tree. Instead, we will discuss why the induction algorithms produce such null tree:
Support: Most of the instances (76.8%) go through the rightmost branch in the decision tree. We take one branch from the decision tree as example, the 8th (from left to right) branch has 304 instances pass through it. The support of this branch is (304/44797) 0.68% which is very low. It indicates this rule does not trained from a large amount of instances. The predicative power is not trustworthy. Confidence: The Confidence of this branch is (233/304) 76.6% which is quite accurate. However, since Support of this branch is too low, the
Confidence may suffer problems like overfitting, which means the decision tree reflects only the partial behavior of training set but not the overall behavior of other data.
Implementation—Analyzing Stock Quotes Using Data Mining Techniques P.15

7. Data Analysis We will analysis the result of the induced decision tree here from the above assessment.
7.1 Observations
1) According to the ID3 algorithm, if there does not have any instance
passing through a particular node, that node will be labeled as the most common target value. Out of total 19 leaves, 11 leaves do not have any instance passing through it. Those leaves do not classify instance according to the attribute values and hence do not have any predicative power. Its label is just the most common value of the target attribute instead of the
2) The support of is very low in particular rules (branches). Most of the rules has achieved support < 1%. It indicates the rules are not
trustworthy due to the lack of instances.
3) Most of the instances pass through one particular branch. It occupies more than half of the total instances.
We can conclude that the number of instances pass through particular nodes is not adequate enough to induce a trustworthy decision tree. Most of the instances pass through one branch. The support of the remaining branches is very low. 7.2 Possible Modifications
1) We can include more data in the training set. i.e. input more data from the stock market to produce a larger training set. It will induce a decision tree with more instances on each rule. It can address the leaves that do not have any instance passing through it. However, since the formulation of the attributes remain unchanged; the percentage of the instances going through most of the branches will remain low. The support of most of the branches will remain low.
Data Analysis—Analyzing Stock Quotes Using Data Mining Techniques P.16
2) We can reset the attributes and target attribute to raise a greater support. One of the reasons that most of the instances go through one particular branch is that the attribute (i.e. the signal) happens rarely. Most of the instances do not have such true value of the attribute. If we can reset the attributes in a way that more instances carry the true value (appear) of the attribute, the issue of leaves that do not have any instances passing through it will be addressed.
More, since more instances carry a true value of attributes, other
branches will have a higher support. The instances will not only go through one particular branch but all. Also, resetting the target attribute can avoid the induction of a null tree. From the above experiment, we can see all of the instances have been classified as ~R. One of the reasons is that the target attribute is hard to satisfy (same as splitting attributes). The instances that have a true value for target attribute to the instances that have a false value for target attribute is 1:3. If we can loosen the
formulation of target attribute, the leaves will favor both of the classes instead of only one. We can achieve a higher support by resetting the attribute formulation to a loosened manner such that the attribute happens more frequently (more instance will carry the true value of the attributes).
Data Analysis—Analyzing Stock Quotes Using Data Mining Techniques P.17

8. Modification
We will modify the decision tree in the above example to produce a decision tree which will predict in a better way. We deploy the second method by resetting the sets of splitting attributes and target attribute to a loosened manner such that they happen more frequently.
8.1 Modification
30 Days Average: It is the average close price of the stock in the past 30 days. It means the average price of stock in a short period. A true value means the current price achieve a breakthrough among current period. Exact Implementation, when current day = d0: if (Close d0 >= Average(Close d-1 to Closed-30)){
return true}else{ return false
} Daily Change: It refers to the change of the close price of the stock on the current day. if ( Close-Open >= 0){
return true}else{ return false
}
Change Percentage: It refers to the fluctuation of the price of the stock on the current day. if ( (|Close-Open|)/Open>= 0.5%){
return true}else{ return false
} Volume Change:
It refers to the popularity of the price of the stock in a week. A true value means the volume of the stock on the current day is higher or equal to the average volume of the stock in the past 10 Days. (Average is used for comparison since the fluctuation of the volume is high.)
Modification—Analyzing Stock Quotes Using Data Mining Techniques P.18
Exact Implementation, when current day = d0: if (Volume d0 >= Average(Volume d-1 to Volumed-10)){
return true}else{ return false
} RiseOrFall: (Class) It refers to the change in the close price of the stock in the next 3 days. A
true value means the close price of the stock on the current day is larger than or equal to the average of the close price of the stock in the next 3 days. Exact Implementation, when current day = d0: if (Close d0 >= Average(Close d1 to Closed3)){
return true}else{ return false
}
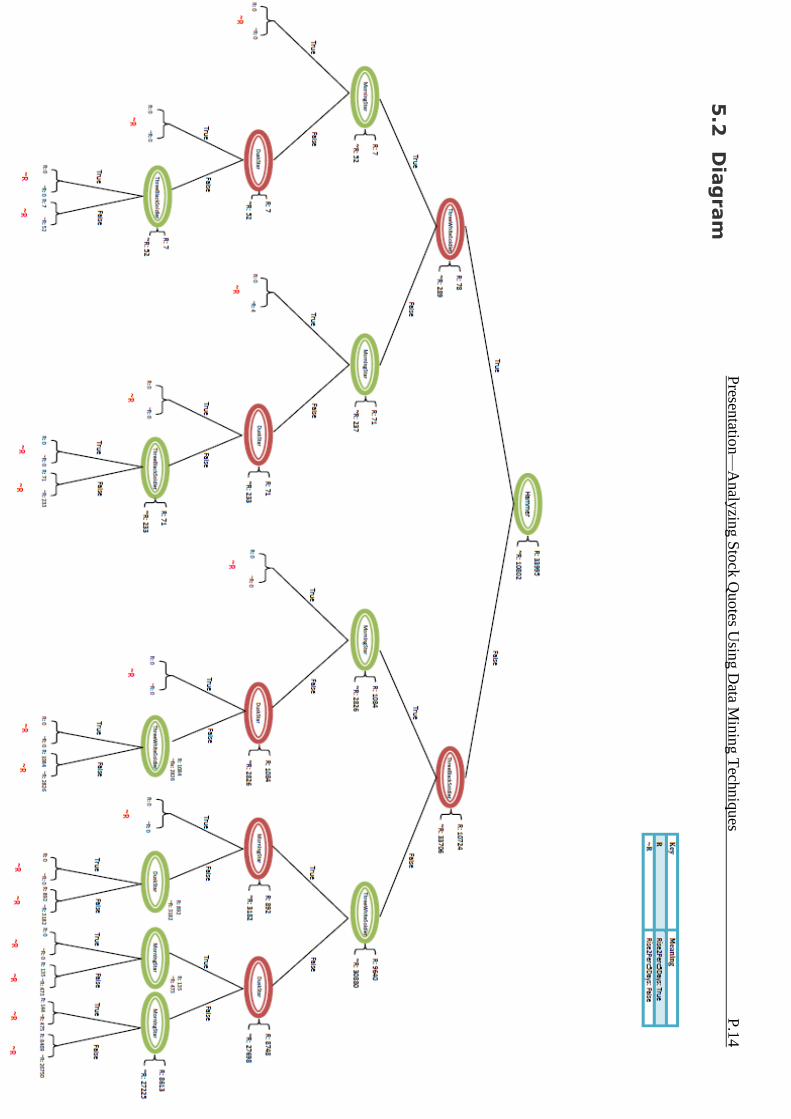
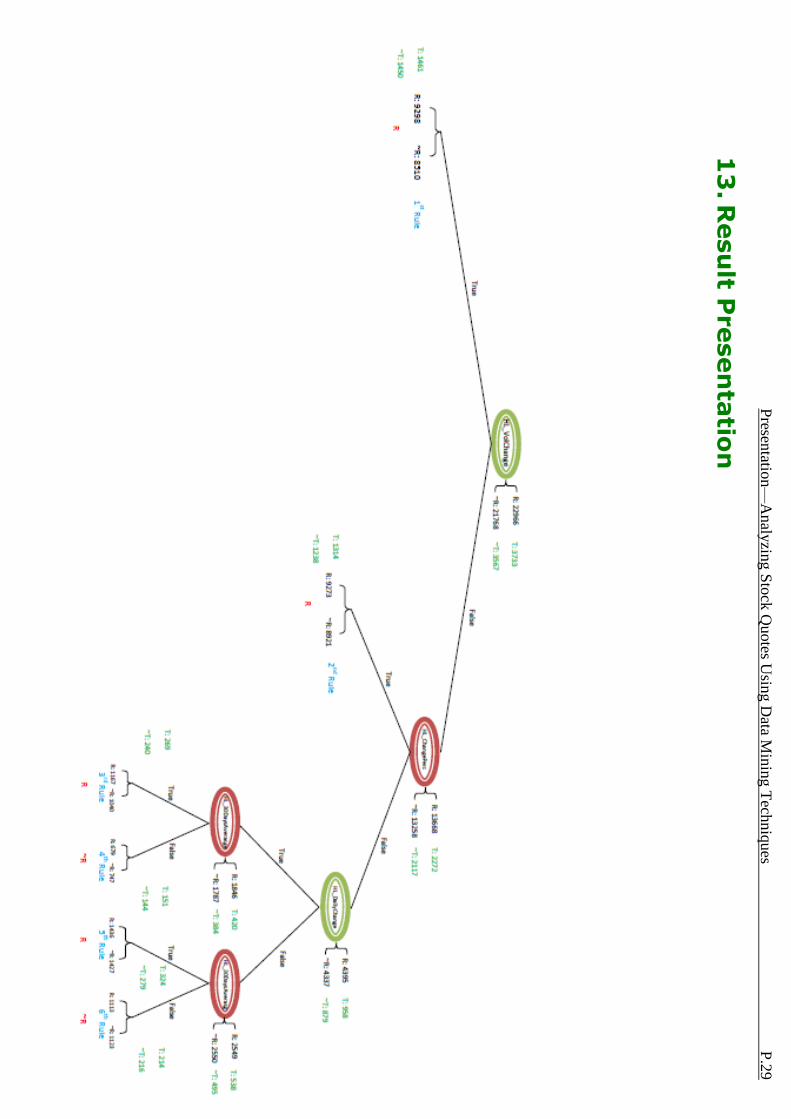
9. Result Presentation A modified decision tree has been induced using the above modification of the formulation of sets of splitting attributes and target attribute. Other factors like induction algorithm and source data remains the same. The below diagram shows the result decision tree
9.1 Keys
Black figures indicate the number of instances of training set running on the induced decision tree. R and ~R represent the number of instance that satisfy the value of the corresponding splitting attribute and the true/false value of the target attribute respectively. Green figures indicate the number of instances of testing set running on
the induced decision tree. T and ~T represent the number of instance that satisfy splitting attribute and true/false value of target attribute. Blue figures are the index of the rules (branches of the decision tree)
Modification—Analyzing Stock Quotes Using Data Mining Techniques P.19

9.2
Dia
gram
P
resentatio
n—
Analy
zing
Sto
ck Q
uotes U
sing D
ata Min
ing T
echniq
ues
P
.20

3.
Resu
lt Presen
tatio
n
10
.3 D
iag
ram
(S
imp
lified
)
Presen
tation—
Analy
zing
Sto
ck Q
uotes U
sing D
ata Min
ing T
echniq
ues
P
.21

10. Assessment We will test the modified decision tree to see the performance on its predicative power.
10.1 Training Set
We will perform the test on training set to see whether the rules are trustworthy or not. The total number of instances of training set running
on this experiment is 44734.
1) Support and Confidence
Total
Instance Misclassified
Instance Support Confidence
1st Rule 17808 8510 39.81% 52.21%
2nd Rule 5763 2808 12.88% 51.28%
3rd Rule 3211 1574 7.18% 50.98%
4th Rule 9220 4476 20.61% 51.45%
5th Rule 2207 1040 4.93% 52.88%
6th Rule 1426 679 3.19% 52.38%
7th Rule 2863 1427 6.4% 50.16%
8th Rule 2236 1113 4.5% 50.22%
2) Re-Substitution Error: 21627 (48.35%)
3) Accuracy:
Predicted Class
Actual Class
Class =
Yes Class =
No
Class = Yes
19600 3366
Class = No
18261 3507
Accuracy in cost matrix =
=51.65%
Assessment—Analyzing Stock Quotes Using Data Mining Techniques P.22
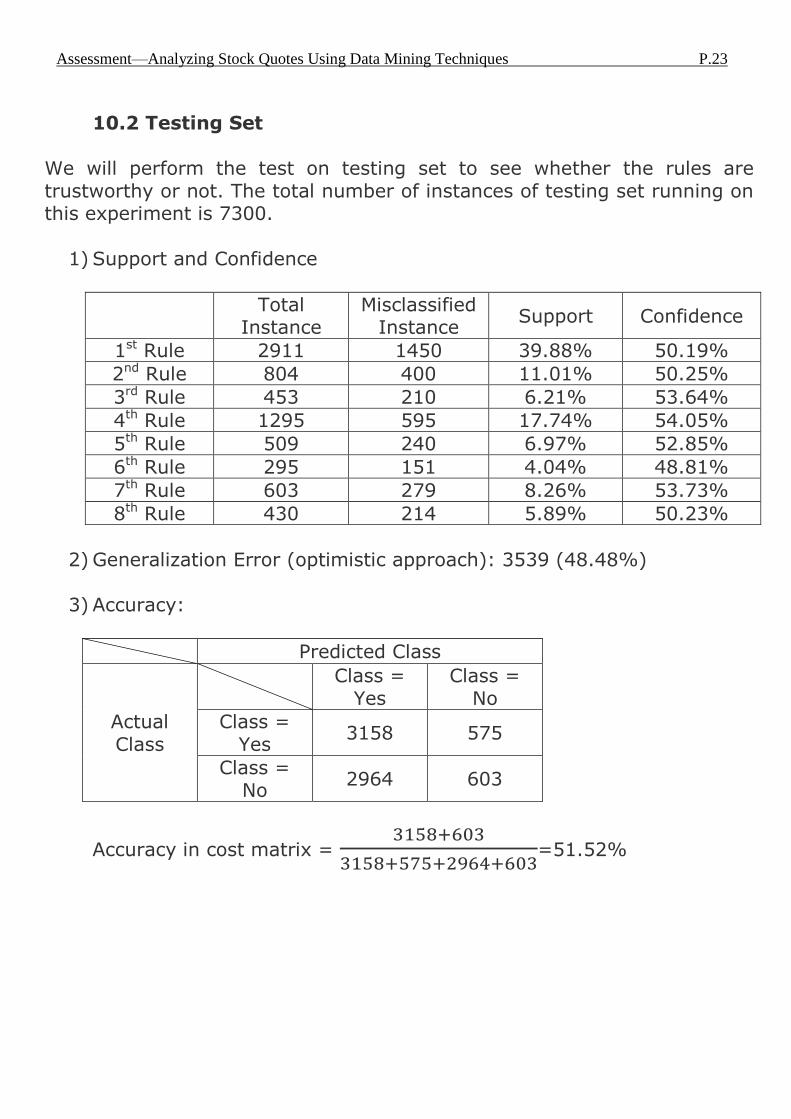
10.2 Testing Set
We will perform the test on testing set to see whether the rules are trustworthy or not. The total number of instances of testing set running on this experiment is 7300.
1) Support and Confidence
Total
Instance Misclassified
Instance Support Confidence
1st Rule 2911 1450 39.88% 50.19%
2nd Rule 804 400 11.01% 50.25%
3rd Rule 453 210 6.21% 53.64%
4th Rule 1295 595 17.74% 54.05%
5th Rule 509 240 6.97% 52.85%
6th Rule 295 151 4.04% 48.81%
7th Rule 603 279 8.26% 53.73%
8th Rule 430 214 5.89% 50.23%
2) Generalization Error (optimistic approach): 3539 (48.48%)
3) Accuracy:
Predicted Class
Actual
Class
Class =
Yes Class =
No
Class =
Yes 3158 575
Class = No
2964 603
Accuracy in cost matrix =
=51.52%
Assessment—Analyzing Stock Quotes Using Data Mining Techniques P.23
10.3 Analysis on Improvement:
First, as more instances run through other branches, the issue of having most of the branches with 0 instance running through them is addressed. Classification depends on the number of instance running through the branches instead of using the most common value of the target attribute. Second, the support on most of the branches increased. Since more instance run through other branches instead of one, most of the branches
have more than 5% of support in the training set and testing set. The rules induced by the decision tree have more instances to support the prediction. Third, after changing the formulation of the target attribute, more instances has been classified as the true label of the target attribute. Before the modification, the induction returns a null tree since all the instances has been classified as the false label of the target attribute. After loosening the formulation of the target attribute, instances have a higher
frequency of carrying the true value of the target attribute. As a result, the decision tree induction will not produce a null tree.
However, the confidence of the rules in the modified decision tree is not high. The overall confidence is 51.65% in the training set. It indicates the rules induced may not be reliable. Many of the instances do not follow the predicted outcome given that it satisfies the rule. More, the overall accuracy of the decision tree in the testing set is not high. It is 51.52% in the cost matrix, which is just higher than a random
guess. It indicates the instances on the testing set do not have a high likelihood of following the prediction of the induced the rule. The predicative power of the modified decision tree is limited on the prediction of other stock data.
Assessment—Analyzing Stock Quotes Using Data Mining Techniques P.24

11. Result Analysis
11.1 Induction Algorithms
We have performed a decision tree induction in the previous implementation. The induction algorithm imitated ID3 algorithm. Theoretically, a classifier (decision tree) can complete fit (no re-substitution error) the training set if we allow the tree to grow infinitely (no terminal condition until all instances are classified).
However, the predicative power of the classifier may be lower due to this issue. The classifier learns all the instances, including noise, from the training set and reflected on the testing set. Those instances may induce a decision tree that reflects the partial characteristic of the training set (over-fitting) instead of the generalized characteristic of the data (unseen data) we want to predict. The consequence of decision tree induction without appropriate pruning method can cause the accuracy to be low when it prediction on testing set. We have to set up explicit pruning mechanism to reduce the number of nodes in the decision tree to address the issue.
0
0.5
1
1.5
2
2.5
3
3.5
4
4.5
0 1 2 3 4 5
R
-R
Noise of 5 instances from R class exists in 14 instances of ~R
class, taken from the training set of the previous experiment.
Result Analysis—Analyzing Stock Quotes Using Data Mining Techniques P.25
11.1 Possible Modifications
1) Over-fitting is the result of induction algorithms being too heavily relied on the data in the training set. To address the problem of over-fitting, we can deploy pruning to restrict instances that do not have a large support in the training set. This can be done by pre-pruning. We can setup the stopping criteria in the induction of decision tree (for example the height of the decision tree cannot exceed a certain threshold, or the number of nodes is restricted). However, the pre-pruning methods execute without taking into account the accuracy of the decision before and after pruning. It may happen that the pruned tree is under-fitting to the training set (the decision tree can not reflect the overall characteristic of unseen data in the domain since it cannot learn enough from the training set).
2) Another method to address the over-fitting problem is by post-
pruning. The induced decision tree will be put into an examination condition that reflects the change in accuracy before and after the pruning process. If it satisfies a particular condition in the
examination, it will be allowed to prune. An example of pruning algorithm is pessimistic pruning. It prunes the decision tree when the estimated error in original subtree is not more than that in replacing node by a certain statistical threshold. The pruned decision tree will usually have a lower accuracy in re-substitution but simpler. The post-pruning method can follow Occam’s Razor principle by inducing a simpler tree to suit unseen data.
Result Analysis—Analyzing Stock Quotes Using Data Mining Techniques P.26

12. Modification
12.1 Pruning
We will deploy pessimistic pruning as the post-pruning method after the induction of the decision tree. This is a top-down approach searching each internal node of the induced
decision tree. It tries to replace the internal node t (subtree) with an appropriate leaf. It will replace the internal node when the following condition is satisfied12:
The term refers to the error rate if the internal node
is replace with a appropriate leaf on pessimistic approach, where T refers
to the induced decision and S refers to the sample set. The ’ error rate on
pessimistic approach different from the error rate on optimistic approach
by a constant of ½ for each leaf in the subtree. This is known as the the continuity correction for binomial distribution to provide a more realistic measure on the estimation of error on the training set.
The term refers to the error of the original internal node
(subtree). The algorithm performs the comparison before and after the pruning process on the term with an additional penalty with the previous term.
The term
refers to the statistical confidence interval for
proportions. It favors pruning for subtrees which have lesser instances passing through it and a medium estimated error rate.
Modification—Analyzing Stock Quotes Using Data Mining Techniques P.27
12. The mathematically expression of pessimistic pruning is referenced at Data Mining with Decision Trees: Theory
and Applications p.65-66, by Lior Rokach. The algorithm is invented by Quinlan in C4.5, 1994, the core source
code can be referenced at Reference 15.3

12.2 Other modifications
We have also used gain ratio instead of information gain. It normalizes the information gain by giving a term intrinsic information to penalize high-branch attributes (attribute with significant large set of values). It returns a small value when all instances belong to one branch. The mathematically expression of gain ratio13 is:
, where
And Si is the number of instances which have the value i in that attribute
and S is the total number of instances for that attribute. The attribute which has the highest information gain ratio among the set of splitting attributes will be selected as the best attribute for splitting.
Modification—Analyzing Stock Quotes Using Data Mining Techniques P.28
13. The mathematically expression of information gain is referenced at http://ocw.univalle.edu.co/ocw/ingenieria-de-
sistemas-telematica-y-afines/descubrimiento-de-conocimiento-en-bases-de-datos/material-1/Clasificacion-PS2.pdf,
this measure is originated from information theory, the core source code can be referenced at Reference 15.3
13
. Resu
lt Presen
tatio
n
Presen
tation—
Analy
zing
Sto
ck Q
uotes U
sing D
ata Min
ing T
echniq
ues
P
.29

14. Assessment We will test the modified decision tree to see the performance on its predicative power.
14.1 Testing Set
We will perform the test on testing set to see whether the rules are trustworthy or not. The total number of instances of testing set running on
this experiment is 7300.
1) Support and Confidence
Total
Instance Misclassified
Instance Support Confidence
1st Rule 2911 1450 39.88% 50.19%
2nd Rule 2552 1238 34.96% 51.49%
3rd Rule 509 240 6.97% 52.85%
4th Rule 295 151 4.04% 48.81%
5th Rule 603 279 8.26% 53.73%
6th Rule 430 214 5.89% 50.23%
2) Generalization Error (optimistic approach): 3572 (48.93%)
3) Accuracy:
Predicted Class
Actual Class
Class =
Yes Class =
No
Class = Yes
3368 365
Class = No
3207 360
Accuracy in cost matrix =
=51.07%
Assessment—Analyzing Stock Quotes Using Data Mining Techniques P.30

14.2 Analysis on Improvement
The replacement of information gain by gain ratio induced the same decision tree. The normalization on multi-branched attributes does not restructure the decision tree as only binary branched attributes are deployed in the induction process. For the pruning process, two internal nodes and three leaves have been pruned. The subtree under the HL_DailyChange attribute at depth of 2 has been replaced by a leaf after the pessimistic pruning process. The overall accuracy is lowered by 0.45% and the confidence of the 2nd Rule is lower compare with that of the original 2nd, 3rd and 4th Rules. The decrease in accuracy for the pruning process is expected as pessimistic pruning tends to prune the subtrees by leaves, unless the estimated error of pruned leaf is still larger than that of the original subtree by a penalty factor. The pruned leaf has larger estimated error compared with that of the original subtree. But the difference is not large enough to skip the pruning process. The subtree under HL_DailyChange attribute has too few instances passing through it and the accuracy is too low. Thus it is pruned to give a simpler decision tree to obey the Occam’s Razor principle in order to suit for unseen data.
Assessment—Analyzing Stock Quotes Using Data Mining Techniques P.31
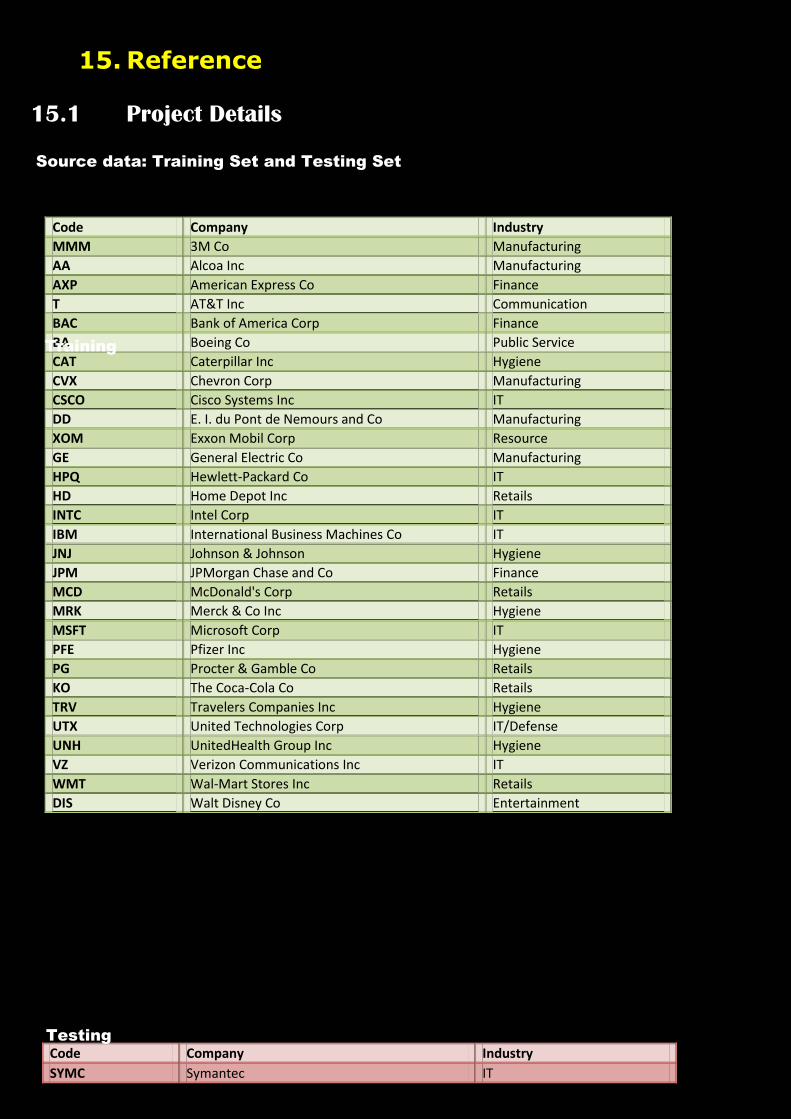
15. Reference
15.1 Project Details
Source data: Training Set and Testing Set
Code Company Industry
MMM 3M Co Manufacturing
AA Alcoa Inc Manufacturing
AXP American Express Co Finance
T AT&T Inc Communication
BAC Bank of America Corp Finance
BA Boeing Co Public Service
CAT Caterpillar Inc Hygiene
CVX Chevron Corp Manufacturing
CSCO Cisco Systems Inc IT
DD E. I. du Pont de Nemours and Co Manufacturing
XOM Exxon Mobil Corp Resource
GE General Electric Co Manufacturing
HPQ Hewlett-Packard Co IT
HD Home Depot Inc Retails
INTC Intel Corp IT
IBM International Business Machines Co IT
JNJ Johnson & Johnson Hygiene
JPM JPMorgan Chase and Co Finance
MCD McDonald's Corp Retails
MRK Merck & Co Inc Hygiene
MSFT Microsoft Corp IT
PFE Pfizer Inc Hygiene
PG Procter & Gamble Co Retails
KO The Coca-Cola Co Retails
TRV Travelers Companies Inc Hygiene
UTX United Technologies Corp IT/Defense
UNH UnitedHealth Group Inc Hygiene
VZ Verizon Communications Inc IT
WMT Wal-Mart Stores Inc Retails
DIS Walt Disney Co Entertainment
Code Company Industry
SYMC Symantec IT
Training
Testing

14.2 Technology deployed
Index Agent From
1 Yahoo! Finance http://finance.yahoo.com/
2 mySQL http://www.mysql.com/
3 XAMPP http://www.apachefriends.org/zh_tw/xampp.html
4 CSV 2 SQLScript Generator http://www.codeproject.com/Articles/83673/Importing-Data-from-Spreadsheet-XLS-to-SQL-Databas [by caiubyfreitas]
5 Microsoft Visual Studio 2010 Professional
http://www.microsoft.com/visualstudio/eng/team-foundation-service
6 Connector/Net 6.1.6 http://dev.mysql.com/downloads/connector/net/6.1.html

14.3 Core Code (Induction) public void TreeInduction(string divideQuery, string targetAttribute, string[] attributes, int level) { //stopping criteria
if (attributes.Length == 0) { return; } //terminate statements if (terminateState(divideQuery, targetAttribute) == "EmptySet") { nodes[nodeindex].truevalue = (int)Count("1", divideQuery, "0", "0", "0", "0") - (int)Count("2", divideQuery, targetAttribute, "2", "0", "0"); nodes[nodeindex].falsevalue = (int)Count("1", divideQuery, "0", "0", "0", "0") - (int)Count("2", divideQuery, targetAttribute, "1", "0", "0"); } else if (terminateState(divideQuery, targetAttribute) == "AllPositive") { nodes[nodeindex].truevalue = (int)Count("2", divideQuery, targetAttribute, "1", "0", "0"); } else if (terminateState(divideQuery, targetAttribute) == "AllNegative") { nodes[nodeindex].falsevalue = (int)Count("2", divideQuery, targetAttribute, "2", "0", "0"); nodes[nodeindex].truevalue = 0; } //else begin recursion else { //find the best attribute nodes[nodeindex].attribute = BestAttriCalc(divideQuery, targetAttribute, attributes); string previousAttribute = nodes[nodeindex].attribute; //for first iteration need to log the level out if (level == 1) { nodes[nodeindex].level = level; nodes[nodeindex].truevalue = (int)Count("1", divideQuery, "0", "0", "0", "0") - (int)Count("2", divideQuery, targetAttribute, "2", "0", "0"); nodes[nodeindex].falsevalue = (int)Count("1", divideQuery, "0", "0", "0", "0") - (int)Count("2", divideQuery, targetAttribute, "1", "0", "0"); } //branch for attribute with {value}, i.e. true or false TrueValue(divideQuery, targetAttribute, attributes, level, previousAttribute); FalseValue(divideQuery, targetAttribute, attributes, level, previousAttribute); } } static void Main(string[] args) { DBConnect db = new DBConnect(); string divideQuery = "SELECT Count(*) FROM trainingset where 1"; string targetAttribute = "Rise2Perc5Days"; string[] attributes = { "MorningStar", "DuskStar", "ThreeWhiteSoldier", "ThreeBlackSoldier", "Hammer" }; db.TreeInduction(divideQuery, targetAttribute, attributes, 1); } }

14.3 Core Code (Pessimistic Pruning) public void pessimisticPrunning(prunNode pNode, prunNode[] pNodes) { if (prunDetermine(pNode, pNodes)==true) { Console.WriteLine("prum the node " + pNode.attribute); return; } //is a leaf else if (pNode.child[0] == "LEAF") { return; } else if (prunDetermine(pNode, pNodes) == false) { //childnode1 for (int k = 0; k < pNodes.Length; k++) { if (pNodes[k].attribute == pNode.child[0]) { pessimisticPrunning(pNodes[k], pNodes); } } //childnode2 for (int l = 0; l < pNodes.Length; l++) { if (pNodes[l].attribute == pNode.child[(pNode.child.Length / 2) + 1]) { pessimisticPrunning(pNodes[l], pNodes); } } } }
Core Code (Gain Ratio) public double InfoGainRatioCalc(string Partquery, string targetAttribute, string attribute) { double returnInfoGain = 0; double attriTotal = EntropyCalc(Count("2", Partquery, targetAttribute, "1", "0", "0"), Count("2", Partquery, targetAttribute, "2", "0", "0")); Console.WriteLine("the total entropy of attribute " + attribute + " is " + attriTotal); double TrueValueWeight = (Count("4", Partquery, targetAttribute, "1", attribute, "1") + Count("4", Partquery, targetAttribute, "2", attribute, "1")) / ((Count("2", Partquery, targetAttribute, "1", "0", "0") + Count("2", Partquery, targetAttribute, "2", "0", "0"))); Console.WriteLine("the weighting of the positive is " + TrueValueWeight); double TrueValueEntr = TrueValueWeight * EntropyCalc(Count("4", Partquery, targetAttribute, "1", attribute, "1"), Count("4", Partquery, targetAttribute, "2", attribute, "1")); Console.WriteLine("the positive entropy of attribute " + attribute + " is " + TrueValueEntr); double FalseValueWeight = (Count("4", Partquery, targetAttribute, "1", attribute, "2") + Count("4", Partquery, targetAttribute, "2", attribute, "2")) / (Count("2", Partquery, targetAttribute, "1", "0", "0") + Count("2", Partquery, targetAttribute, "2", "0", "0")); Console.WriteLine("the weighting of the negative is " + FalseValueWeight); double FalseValueEntr = FalseValueWeight * EntropyCalc(Count("4", Partquery, targetAttribute, "1", attribute, "2"), Count("4", Partquery, targetAttribute, "2", attribute, "2")); Console.WriteLine("the negative entropy of attribute " + attribute + " is " + FalseValueEntr); returnInfoGain = attriTotal - TrueValueEntr - FalseValueEntr; Console.WriteLine("informatioin Gain is " + TrueValueEntr); //introduce the intrisic information here returnInfoGain = returnInfoGain / InstrInfo(Partquery, targetAttribute, attribute); return returnInfoGain; }

7.3 Materials Reference Index Agent From
1 Yahoo! Finance http://finance.yahoo.com/
2 mySQL http://www.mysql.com/
3 XAMPP http://www.apachefriends.org/zh_tw/xampp.html
4 CSV 2 SQLScript Generator http://www.codeproject.com/Articles/83673/Importing-Data-from-Spreadsheet-XLS-to-SQL-Databas [by caiubyfreitas]
5 Microsoft Visual Studio 2010 Professional
http://www.microsoft.com/visualstudio/eng/team-foundation-service
6 Connector/Net 6.1.6 http://dev.mysql.com/downloads/connector/net/6.1.html
7 ID3 induction algorithm http://en.wikipedia.org/wiki/ID3_alogrithm
8 Information Gain Calculation http://ocw.univalle.edu.co/ocw/ingenieria-de-sistemas-
telematica-y-afines/descubrimiento-de-conocimiento-en-bases-
de-datos/material-1/Clasificacion-PS2.pdf
9 General decision tree theories and pessimistic pruning
at Data Mining with Decision Trees: Theory and Applications,
by Lior Rokach
10 General decision tree theories http://www.ise.bgu.ac.il/faculty/liorr/hbchap9.pdf
11 Pruning methods http://www.ismll.uni-hildesheim.de/lehre/ml-08w/skript/decision_trees2.pdf
12 Pessimistic pruning http://rritw.com/a/bianchengyuyan/C__/20121210/269217.html
13 Pessimistic pruning http://books.google.com.hk/books?id=GlKIIR78OxkC&pg=PA65&lpg=PA65&dq=pessimistic+pruning&source=bl&ots=0_2CgPXfTW&sig=3INbNLUKSqcIAEKsCg3f7FW6rTg&hl=zh-TW&sa=X&ei=3tcjUf7GJoukiAfRoIHgAw&ved=0CDMQ6AEwAA#v=onepage&q=pessimistic%20pruning&f=false