analyzing metagenomic data inferring … · · 2010-11-02studying microorganisms recalcitrant to...
TRANSCRIPT
In: Metagenomics and its Applications in Agriculture, … ISBN 978-1-61668-682-6 Editor: Robert W. Li, pp. © 2010 Nova Science Publishers, Inc.
Chapter 3
ANALYZING METAGENOMIC DATA: INFERRING MICROBIAL COMMUNITY FUNCTION
WITH MG-RAST
Dionysios A. Antonopoulos, Elizabeth M. Glass, and Folker Meyer
ABSTRACT
Application of massively parallel throughput DNA sequencing technologies to the generation of metagenomic datasets from environmental samples is presently transforming the field of microbiology. Whereas traditional (Sanger-based) DNA sequencing technology imparted a high economic cost on data generation, the development of “next-generation” technologies now make the large-scale generation of sequence data required for studying complex microbial communities feasible. Therefore, molecular-based approaches to inferring the structure of microbial communities based on the cataloging of PCR amplified small subunit ribosomal RNA (SSU rRNA) encoding genes can now be complemented with the inference of the function of these communities via shotgun sequencing strategies. However, significant hurdles in analyzing sequence data at this scale include: (1) efficient strategies for identifying the gene content (annotation), (2) providing web-based interfaces for comparing datasets from different samples, and (3) applying statistical methods to guide identification of relevant gene sets for further study. The MG-RAST (MetaGenome Rapid Annotation using Subsystems Technology) system is one solution that has found widespread use in the analysis of metagenome-derived datasets. In this chapter, the underlying structure of the publically accessible MG-RAST resource and how it addresses the aforementioned hurdles will be discussed. Additionally, future challenges will be identified in relation to the expected increase of data output from DNA sequencing platforms.

Dionysios A. Antonopoulos, Elizabeth M. Glass and Folker Meyer 2
INTRODUCTION Studying microorganisms recalcitrant to cultivation in the laboratory has been a major
impediment to understanding natural microbial populations within the context of their environment. As a result, little is known about many of their physiologies and their functional contribution to the system at large. Cataloging the different types of microorganisms within any environment requires alternate approaches to those used with larger, macroscopic life forms. Classical taxonomy of plants and animals focuses on the comparison of a compilation of morphological and behavioral characteristics that are simply unavailable for the systematic classification of microbes. Comparison of a common molecular molecule found in all forms of life, namely the sequence of RNA comprising the small subunit of the ribosome (SSU rRNA), provides an informative phylogenetically based context in which to quantify such diversity. Molecular-based approaches have revealed an enormous phylogenetic diversity of microbial species found in natural environments that have not been cultured (Pace, 1997). The number of major taxonomic divisions (phyla) within the bacterial domain of life alone has grown from 12 in the mid-1980s (Fox et al., 1980) to greater than 80 today, of which less than 30 have cultured representatives (Hugenholtz et al., 1998; Fox, 2005). Moreover, with the application of massively parallel sequencing technology to rRNA-based inventories, previous estimates of species diversity richness, for example in the marine environment, may be under-represented by 10- to 100-fold (Sogin et al., 2006; Huber et al., 2007). With currently available molecular-based microbial ecology tools focused on the use of a single gene (usually rRNA encoding genes) as a proxy for the organisms present we can describe the community structure of the microbial community present, but in comparison there has been little available in terms of systems-based approaches to describing their function. This is presently changing as analyses geared towards studying the collection of genomes representing these species – the metagenome – have also recently incorporated second-generation sequencing platforms (primarily 454-based pyrosequencing).
Milestones in metagenomic-based research have been achieved primarily in marine and soil environments, complex samples in their own right (Handelsman, 2004). The first metagenomic library was constructed from marine picoplankton populations using fosmids for the purpose of testing the bias in PCR amplification of 16S rRNA genes from environmental sequences (Schmidt et al., 1991). Accessing the “metabolic potential” of a microbial community would not effectively occur until high-throughput Sanger-based DNA sequencing became more routine following the microbial genome sequencing revolution of the late 1990s. For low complexity environmental samples, this could drive the assembly of complete genomes from target-organism-specific sequences. In the case of an extremely low diversity environmental sample, as in the case of run-off from acid mine drainage, the reconstruction of several near-whole genomes was possible (Tyson et al., 2004). The alternative view for looking at more complex systems was to use the metagenome as a resource for data mining (Venter et al., 2004) – large insert libraries could be screened for functions of interest from soils (Rondon et al., 2000) or discovery as in the case of finding a previously unknown form of bacterial phototrophy in marine systems (Beja et al., 2000). However, the impediment of both library construction, predicated on the successful isolation of fairly large fragments of DNA, as well as the necessary sequencing depth, using Sanger-
Analyzing Metagenomic Data 3
based sequencing, sorely under-represents the DNA sequence space present in most natural environments.
Metagenomics is presently entering a new phase of development as the implementation of the massively parallel throughput afforded by second-generation sequencing approaches becomes more widespread and applied to an increasing number of environments. Traditional dideoxy termination (Sanger) based DNA sequencing in metagenomics historically relied on large insert libraries propogated in an Escherichia coli host. Genes that may have been otherwise unstable or toxic in the cloning vector host cell can be accessed without cloning bias in the sequencing profile. In addition to circumventing the need for cloning, the throughput afforded by second-generation sequencing technology enables a new approach to comparative metagenomics (Ronaghi et al., 1996; Ronaghi et al., 1998; Margulies et al., 2005). Now sequence representation (abundance) can be used to contextualize datasets for driving pattern recognition and uncovering unique properties within natural microbial communities.
The MG-RAST (MetaGenome Rapid Annotation using Subsystems Technology) suite of tools has incorporated a variety of visualizations to help users explore datasets via an intuitive web-based platform (Meyer et al., 2008). The system has found widespread use in the analysis of metagenome-derived datasets as the data exploration can be performed in “real-time” by any user with an Internet connection and web browser. However, significant hurdles in analyzing sequence data at this scale include: (1) efficient strategies for identifying the gene content (annotation), (2) providing web-based interfaces for comparing datasets from different samples, and (3) applying statistical methods to guide identification of relevant gene sets for further study. This chapter describes how MG-RAST addresses these issues by utilizing BLAST to screen for potentially protein encoding genes (PEGs) from metagenomes and then projecting them onto subsystems to efficiently organize and display the output in a user-friendly web-browser format.
SUBSYSTEMS APPROACH TO GENE ANNOTATION AND COMPARATIVE GENOMICS
The combination of high-throughput, automated, Sanger-based DNA sequencing
technologies and improvements in computation allowed for the sequencing of microbial genomes beginning in 1995 (Fleischmann et al., 1995). Alongside improvements in sequence accuracy and assembly, accurate gene annotation remained a challenge. This was complicated by the fragmentary nature of biological inquiry, and compounded by the diversity of the natural microbial world. Although gene annotation can be obviously limited by the extent of the knowledge-base of previously sequenced and characterized genes, there is also the problem of ontology – inconsistencies in the names of homologs would impede the high-throughput annotation of genomes. In the context of “The Project to Annotate 1000 Genomes”, an international collaboration led by the Fellowship for the Interpretation of Genomes (FIG) and Argonne National Laboratory created a structured system for gene annotation that would lend itself to automation. The tenets of their approach were to: (1) annotate a set of related genes (subsystem) across genomes by a single expert user rather than genes across a single genome; (2) analyze related protein families instead of a single protein

Dionysios A. Antonopoulos, Elizabeth M. Glass and Folker Meyer 4
family; (3) project annotations from a populated subsystem instead of individual annotations; and (4) provide a central resource for other bioinformatic analyses. The core concept for this was the organization of genes into “subsystems”.
A “subsystem” is defined as a set of abstract “functional roles” that together implement a specific biological process or structural complex (Overbeek et al., 2005). In this manner, the term “subsystem” has the flexibility of representing, for example, either a metabolic pathway (e.g. glycolysis) or a physical structure (e.g. ribosome). When these functional roles are linked to specific genes across genomes and organized in a “subsystem spreadsheet”, a “populated subsystem” emerges. The utility of this organization is extended by “subsystem connections” that allows linkage of genes between subsystems; in other words, a single gene may play a functional role in multiple subsystems simultaneously.
By having “subsystem experts” perform the curation, consistency is encouraged to control the vocabularies and this is propagated across additional genomes as they become annotated. Overlap in functional roles between subsystems will lead to conflicts, but a “clearinghouse” has been established for expert curators to resolve differences and produce solutions.
FIGFAMS AND THE RAST SERVER The National Microbial Pathogen Data Resource (NMPDR) is a Bioinformatics Resource
Center that was funded by the National Institute of Allergy and Infectious Diseases (NIAID) to compile all known genetic information related to Category B priority pathogens (McNeil et al., 2007). Initially, the complete genomes of 50 pathogenic bacteria were the focus for subsystems curation but additional genomes were incorporated to provide a phylogenetic context for data analysis (in the form of “supporting genomes”). As genome sequencing of new strains and serovars and newly discovered pathogens would become routine, a system for quickly and accurately annotating genome sequences became a priority. This in itself was recognized as a global utility of the NMPDR that could be extended beyond pathogens, and the Rapid Annotation using Subsystems Technology (RAST) server was developed as a general comparative genomics analysis platform (Aziz et al., 2008).
RAST is based on the manually curated subsystems described earlier and on the protein families that are derived from them called “FIGfams” (Meyer et al., 2009). FIGfams are sets of isofunctional homologues that are defined as a four-tuple: (1) a stable, unique identifier [ID], (2) a set of protein sequences that are globally similar and provide a common function [protein-set], (3) a procedure for deciding whether a new protein sequence should be included in the set [decision-procedure], and (4) a function implemented by all protein-set members [family-function]. FIGfams are analogous to TIGRFAMs (Haft et al., 2003) and PIRSFs (Wu et al., 2004) in that all three approaches curate protein families based on global similarity and common domain structure. However, the method of curation and decision-procedure set FIGfams apart from the other two. This impacts not only the throughput of curation but also the number of families identified. The creation of an individual FIGfam is based on the avoidance of placing two proteins with different functions in the same set; this conservative perspective leads to a high number of small protein families.

Analyzing Metagenomic Data 5
The RAST server provides a comparative genomics environment by the fully automated annotation of two general classes of gene functions – those that are subsystems-based and those that are nonsubsystems-based. This is reflected in the way FIGfams are created initially. They are either subsystems-driven or delineated from the comparison of closely related strains. For subsystems-generated FIGfams, proteins would be considered part of the same FIGfam if they implement the same functional role (inferred from the previously described subsystem spreadsheet), and the region of similarity shared by them covers at least 70% of each sequence. For non-subsystems generated FIGfams that are inferred from strain-to-strain comparison, sequence similarity (greater than 90% identity) and context within the chromosome (i.e. synteny) are the major determinants. Although non-subsystems based gene functions may be unknown, they serve a useful purpose in that they can act as the starting material for novel subsystems.
Furthermore, the tight coupling of FIGfams with subsystems allows continual updates to reflect changes to the subsystems. The current release (10.0) contains roughly 107,000 families that are built up from both manual curation using the subsystems approach and automated annotation of closely related strains.
MG-RAST OVERVIEW The quantum leap in metagenomics is presently occurring with the implementation of
second-generation DNA sequencing technologies. The challenges associated with second-generation DNA sequencing relative to didexoy chain termination (“Sanger”) sequencing are shorter reads and an increased scale of data output. The aforementioned RAST server was designed for analyzing complete, or near-complete, archaeal and bacterial genomes and is therefore predicated upon large stretches of assembled contiguous sequences (“contigs”). The output for most metagenomic datasets is far from an assembled state and therefore the strategy for data handling and display is distinct. Whereas the focus of RAST with an individual genome is an exhaustive inventory of the types of genes present, for MG-RAST the abundance of the types of genes is equally important for the purposes of comparative metagenomics.
Regardless of the DNA sequencing technology implemented, the first step in analysis of any metagenome-derived dataset involves the comparison of them to known sequences. This is a computationally intensive task, but provides the data types required for many subsequent analyses. These analyses can include phylogenetic comparisons, functional annotations, binning of sequences, phylogenomic profiling, and metabolic reconstructions.
The pipeline accepts data in a number of formats: 454 reads may be uploaded directly in the format delivered by 454, and fasta files typical of Sanger-sequences and used by other platforms may also be uploaded. The pipeline will also accept assembled sequences in fasta format. Users may choose to upload raw unassembled reads or assembled contigs.
It is increasingly apparent that the full potential of comparative metagenome analysis can be achieved only in the context of the metadata (information describing the sample). The Genomics Standards Consortium has proposed a minimal set of data, called the Minimum Information about a (Meta)Genome Sequence (MIGS/MIMS), that should be collected with every metagenome sequence. Although this is an evolving standard, the metagenomics-RAST Dionysios Antonopou…, 10/23/10 1:24 PM
Deleted: []

Dionysios A. Antonopoulos, Elizabeth M. Glass and Folker Meyer 6
server is MIGS/MIMS-compliant (Kottmann et al., 2008). Metadata is requested from the user at the time of sequence submission to MG-RAST. This data is stored with the user's data and is made available to them. If the user chooses to publicly release the sequence data, the metadata is also included.
After data upload files are checked for formatting errors and sequences are dereplicated. Next, fragments are mapped against a comprehensive nonredundant database (NR). A phylogenetic reconstruction and a metabolic reconstruction are computed from the set of hits against the NR. The resulting data is made available for browsing, download, and most important, comparison against a comprehensive collection of public metagenomes. A submitted metagenome is visible only to the user, unless the user makes it public or shares with other registered users. Public metagenomes are available to all.
Descriptions of Major Steps in Data Processing Step 1. Normalization step – generating unique internal IDs and removal of exactly
duplicated sequences from 454 data sets. After uploading the data, unique internal IDs are generated and duplicate
sequences from 454 data sets are removed. These sequences can arise as artifacts of the sequencing technique (Gomez-Alvarez et al., 2009).
Step 2. Sequences screened for potential protein encoding genes via BLASTX against variety of databases. (E-value of cutoff of 0.01). Other sequence matches also made to specialized database (e.g. rRNA).
In parallel with BLASTX searches against the NR, the sequence data is compared to accessory databases by using the appropriate algorithms. These include several rRNA-derived ones, including GREENGENES (DeSantis et al., 2006), RDP-II (Cole et al., 2005), and the Silva database (Pruesse et al., 2007). Other accessory databases include the chloroplast database, mitochondrial database, and ACLAME database of mobile elements (Leplae et al., 2010). The search criteria are specific for each database that the sequence data is compared against. For example, screens for ribosomal RNA genes in the sequence data are performed by using BLASTN against the rRNA databases. However more stringent selection criteria are used to identify candidate rRNA genes than those used for identifying protein-encoding genes (by default, the similarity must exceed 50 bp in length and have an expect value less than e-05).
Step 3. Matches used to compute derived data. A “phylogenomic” reconstruction of the sample is computed by using both the
phylogenetic information contained in the NR database and the similarities to the ribosomal RNA database. Functional annotations of the PEGs are computed by projecting against SEED FIGfams and subsystems based on the similarity searches. Functional assignments become the input to an automatically generated metabolic reconstruction and model of the sample, providing suggestions for metabolic fluxes and flows, reactions, and enzymes.
Dionysios Antonopou…, 10/23/10 1:19 PM
Dionysios Antonopou…, 10/23/10 1:19 PMFormatted: Highlight
Deleted: D

Analyzing Metagenomic Data 7
INDIVIDUAL METAGENOME DATA MINING The data from a single metagenome is displayed in four major ways: (1) an overview of
the basic statistics related to the DNA sequences themselves, (2) a metabolic reconstruction (“Metabolic Profile”) displaying the categorization of the annotated genes within the metagenome, (3) a phylogenetic reconstruction (“Phylogenetic Profile”) displaying the composition of the metagenome based on taxonomic inference, and (4) metabolic models and maps in the Biochemistry and Model database of the MGRAST framework for genome annotation. Compounds and reactions can be viewed for each specific model.
Overview. The basic statistics of the uploaded sequence are outlined according to the distribution of sequences and their GC content. A “preview” of the data is also generated based on both the protein-encoding gene content as well as any detected 16S rRNA encoding genes (using e-05 as a maximal expectation value and a minimal alignment length of 50 bases).
Sequence profile. Once sequence data has been uploaded to MG-RAST and computed, the genes detected via BLAST are displayed according to the subsystems approach. Two distinct interfaces allow the user to mine the sequence data; one interface is driven by the functional genes detected (“Metabolic Profile”) and the other is by the 16S rRNA encoding genes detected (“Phylogenetic Profile”).
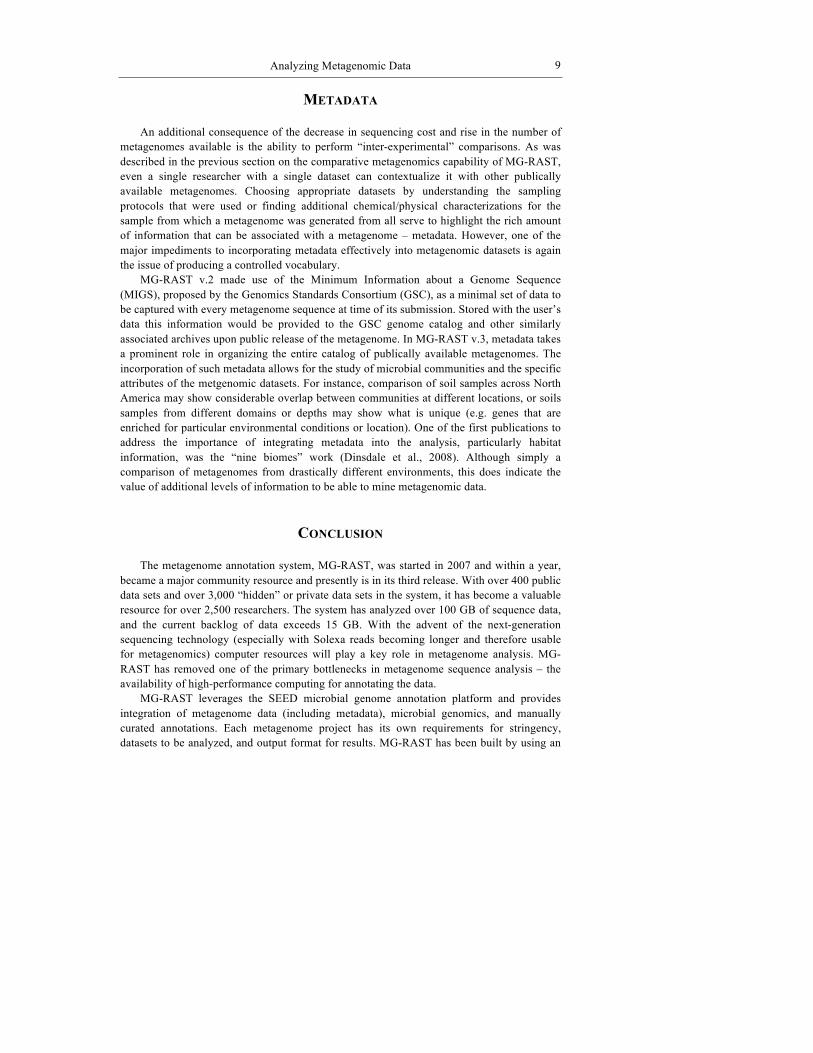
For the “Metabolic Profile” only a subsystems-based hierarchy is used to display the data in a hierarchical fashion. Data can be viewed and searched via pie charts or interactive tables. Profiles of a sample can also be compared with others via a visualization tool that places the information in a circular tree with the interior nodes to the leaves representing the various levels of the subsystems hierarchy. The color and hue shown for a branch reflects the commonality between the samples.
The “Phylogenetic Profile” is also displayed in a nested hierarchy. However, the user is able to display different taxonomic frameworks based on the database searched. Presently, only Greengenes, NCBI, RDP, and SILVA are the databases available. Depending on when user data was uploaded (pre-2008), the European RNA database may be available to drive the display.
Another feature of the “Phylogenetic Profile” interface is the option to use the SEED as a way of interpreting the composition of the microbial community represented in a dataset. This feature uses the annotated functional genes in a dataset to extract the taxonomic string associated with their nearest match. Although functional genes may be more prone to horizontal gene transfer and therefore lose their phylogenetic resolution to infer the identity of an organism, the approach does serve to query a significantly greater number of genes (since for shotgun metagenomic datasets, the number of 16S rRNA encoding genes sampled randomly will be low; usually less than <1%).
BLAST. A direct sequence driven query interface is provided, where the user can mine the sequence data directly via BLAST.
Download. A full sequence dataset or subset can be downloaded via the MG-RAST analysis platform. Additionally all of the “Profile” interfaces allow the user to download the displayed tables.
Dionysios Antonopou…, 10/23/10 1:20 PMDeleted:

Dionysios A. Antonopoulos, Elizabeth M. Glass and Folker Meyer 8
COMPARATIVE METAGENOMICS Comparative analyses are what drive discovery-based biology. Even a single
metagenome dataset generated by an individual researcher can be mined in a comparative fashion via the MG-RAST platform. Three interfaces are provided that compare a metagenome to either (1) other metagenomes (via a heat map), (2) individual genomes (via a “recruitment plot”), or (3) both metagenomes and genomes (via metabolic maps).
The subsystem comparison tools identify the number of PEGs in each metagenome connected to a subsystem based on protein level similarity. With these connections, subsystems present in a sample are scored by counting the number of sequences similar to a protein in each subsystem. Dividing the score by the total number of sequences similar to any protein in a subsystem, yields the fraction of sequences in subsystems that are in a given subsystem. In this manner, samples can be compared irrespective of the number of sequences from a particular sample. Since only a few sequences may hit each subsystem, the fractions tend to be small (especially considering there are now over 600 subsystems in the SEED). To emphasize those subsystem that differ between samples, the scores can be factored for display purposes. Furthermore, the display can focus on specific areas of metabolism, or other subsystem groups, as desired by the user.
Heat map. The heat map function in MG-RAST allows the user to choose publically available metagenome datasets, in addition to privately held ones owned by the user, and then compare them. The main interface is driven by a color scheme that represents either the relative abundance or absolute number of sequences classified to a specific subsystem. When the upper-level subsystem hierarchy is chosen, the number of rows is minimized. This “low resolution” heat map serves to at least display where the majority of annotated sequences are binned. Choosing the succeeding levels in the subsystem hierarchy serves to expand the number of rows. However, for the color scheme to retain its effectiveness, the color scale needs to be adjusted accordingly. Additionally, depending on the complexity of the sample from which the metagenome was generated, fine level susbsystems dissection can dilute the effectiveness of the heat map. All of the numerical data displayed in the heat maps are downloadable as tab-delimited files that can be imported into any off-line tool for downstream analysis.
Recruitment plot. The recruitment plot function is set up to provide a selected sequenced microbial genome as a scaffold to map metagenome-derived sequences to. As in the heat map, sequences that have been annotated from a metagenome are used as the queries. The initial view provides a ranked list of microbial genomes that “contain” the most number of matched sequences from the metagenome. This gives an indication of the relative representations in terms of genomic content found within the metagenome.
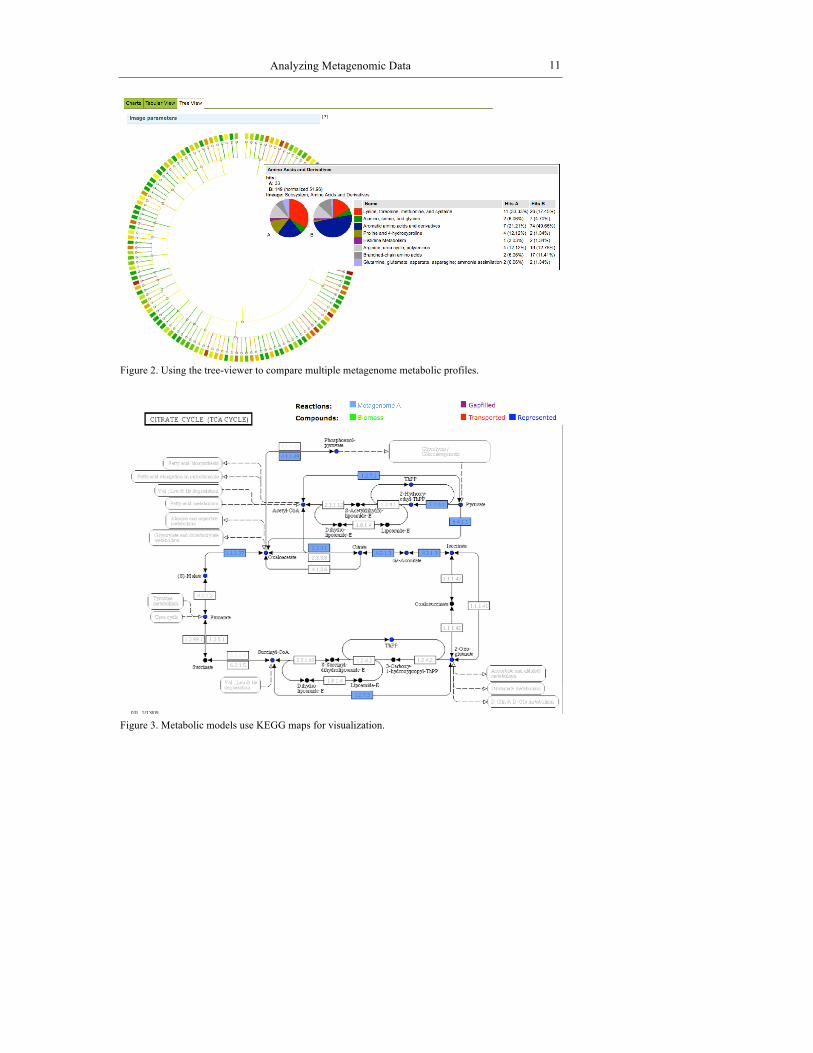
Metabolic maps and models. Metagenomics also has the potential provide insights into the critical biochemical mechanisms in each environment. Models in the MG-RAST are based on the initial metabolic reconstructions constructed. The functional roles from the reconstruction are then mapped to reactions in the SEED biochemistry database, and this mapping is used then used to assemble a reaction list for the model. Models are based on a steady state and undergo flux balance analysis.
Analyzing Metagenomic Data 9
METADATA An additional consequence of the decrease in sequencing cost and rise in the number of
metagenomes available is the ability to perform “inter-experimental” comparisons. As was described in the previous section on the comparative metagenomics capability of MG-RAST, even a single researcher with a single dataset can contextualize it with other publically available metagenomes. Choosing appropriate datasets by understanding the sampling protocols that were used or finding additional chemical/physical characterizations for the sample from which a metagenome was generated from all serve to highlight the rich amount of information that can be associated with a metagenome – metadata. However, one of the major impediments to incorporating metadata effectively into metagenomic datasets is again the issue of producing a controlled vocabulary.
MG-RAST v.2 made use of the Minimum Information about a Genome Sequence (MIGS), proposed by the Genomics Standards Consortium (GSC), as a minimal set of data to be captured with every metagenome sequence at time of its submission. Stored with the user’s data this information would be provided to the GSC genome catalog and other similarly associated archives upon public release of the metagenome. In MG-RAST v.3, metadata takes a prominent role in organizing the entire catalog of publically available metagenomes. The incorporation of such metadata allows for the study of microbial communities and the specific attributes of the metgenomic datasets. For instance, comparison of soil samples across North America may show considerable overlap between communities at different locations, or soils samples from different domains or depths may show what is unique (e.g. genes that are enriched for particular environmental conditions or location). One of the first publications to address the importance of integrating metadata into the analysis, particularly habitat information, was the “nine biomes” work (Dinsdale et al., 2008). Although simply a comparison of metagenomes from drastically different environments, this does indicate the value of additional levels of information to be able to mine metagenomic data.
CONCLUSION The metagenome annotation system, MG-RAST, was started in 2007 and within a year,
became a major community resource and presently is in its third release. With over 400 public data sets and over 3,000 “hidden” or private data sets in the system, it has become a valuable resource for over 2,500 researchers. The system has analyzed over 100 GB of sequence data, and the current backlog of data exceeds 15 GB. With the advent of the next-generation sequencing technology (especially with Solexa reads becoming longer and therefore usable for metagenomics) computer resources will play a key role in metagenome analysis. MG-RAST has removed one of the primary bottlenecks in metagenome sequence analysis – the availability of high-performance computing for annotating the data.
MG-RAST leverages the SEED microbial genome annotation platform and provides integration of metagenome data (including metadata), microbial genomics, and manually curated annotations. Each metagenome project has its own requirements for stringency, datasets to be analyzed, and output format for results. MG-RAST has been built by using an

Dionysios A. Antonopoulos, Elizabeth M. Glass and Folker Meyer 10
extensible format allowing the integration of new datasets and algorithms without a need for recomputation of existing results.
Although the service contains core functionality for the annotation and analysis of metagenomes, many of the techniques traditionally used for genome analysis (e.g., approaches for the prediction of coding sequences) either do not work with metagenomes or have poor performance (Krause et al., 2006). Many of the differences between complete genome annotation and metagenome annotation are reminiscent of those encountered previously with the analysis of expressed sequenced tags (Liang et al., 2000). Therefore, new analytical methods are needed to fully understand metagenomics data. The most obvious problem is with the large number of unknown sequences in any sample. Depending on the specific sample processed, as few as 10% of the sequences or as many as 98% of the sequences may have no known similarity to anything in the database. Beside ourselves, others in this field are developing new binning, clustering, and gene prediction tools to handle these unknown sequences, and effective tools will be incorporated into the pipeline when available. Another problem is that the rapid pace with which sequence data is being generated outpaces increases in computational speed, and therefore improvements in common search algorithms are required to ensure that sequence space can be accurately and efficiently searched.
Figure 1. The metadata editor in MG-RAST.
Analyzing Metagenomic Data 11
Figure 2. Using the tree-viewer to compare multiple metagenome metabolic profiles.
Figure 3. Metabolic models use KEGG maps for visualization.

Dionysios A. Antonopoulos, Elizabeth M. Glass and Folker Meyer 12
ACKNOWLEDGEMENTS This work was supported in part by the Office of Advanced Scientific Computing
Research, Office of Science, U.S. Department of Energy, under Contract DE-AC02-06CH11357. Special thanks to the MG-RAST team, Andreas Wilke, Jared WIlkening, Mark D’Souza, Tobias Paczian and Daniela Bartels, Chris Henry and Rick Stevens.
REFERENCES
Aziz, R.K., Bartels, D., Best, A.A., DeJongh, M., Disz, T., Edwards, R.A. et al. (2008) The
RAST Server: rapid annotations using subsystems technology. BMC Genomics 9: 75. Beja, O., Aravind, L., Koonin, E.V., Suzuki, M.T., Hadd, A., Nguyen, L.P. et al. (2000)
Bacterial rhodopsin: evidence for a new type of phototrophy in the sea. Science 289: 1902-1906.
Cole, J.R., Chai, B., Farris, R.J., Wang, Q., Kulam, S.A., McGarrell, D.M. et al. (2005) The Ribosomal Database Project (RDP-II): sequences and tools for high-throughput rRNA analysis. Nucleic Acids Res 33: D294-296.
DeSantis, T.Z., Hugenholtz, P., Larsen, N., Rojas, M., Brodie, E.L., Keller, K. et al. (2006) Greengenes, a chimera-checked 16S rRNA gene database and workbench compatible with ARB. Appl Environ Microbiol 72: 5069-5072.
Dinsdale, E.A., Edwards, R.A., Hall, D., Angly, F., Breitbart, M., Brulc, J.M. et al. (2008) Functional metagenomic profiling of nine biomes. Nature 452: 629-632.
Fleischmann, R.D., Adams, M.D., White, O., Clayton, R.A., Kirkness, E.F., Kerlavage, A.R. et al. (1995) Whole-genome random sequencing and assembly of Haemophilus influenzae Rd. Science 269: 496-512.
Fox, G.E., Stackebrandt, E., Hespell, R.B., Gibson, J., Maniloff, J., Dyer, T.A. et al. (1980) The phylogeny of prokaryotes. Science 209: 457-463.
Fox, J.L. (2005) Ribosomal gene milestone met, already left in dust. In ASM News, pp. 6-7. Gomez-Alvarez, V., Teal, T.K., and Schmidt, T.M. (2009) Systematic artifacts in
metagenomes from complex microbial communities. ISME J 3: 1314-1317. Haft, D.H., Selengut, J.D., and White, O. (2003) The TIGRFAMs database of protein
families. Nucleic Acids Res 31: 371-373. Handelsman, J. (2004) Metagenomics: application of genomics to uncultured
microorganisms. Microbiol Mol Biol Rev 68: 669-685. Huber, J.A., Mark Welch, D.B., Morrison, H.G., Huse, S.M., Neal, P.R., Butterfield, D.A.,
and Sogin, M.L. (2007) Microbial population structures in the deep marine biosphere. Science 318: 97-100.
Hugenholtz, P., Goebel, B.M., and Pace, N.R. (1998) Impact of culture-independent studies on the emerging phylogenetic view of bacterial diversity. J Bacteriol 180: 4765-4774.
Kottmann, R., Gray, T., Murphy, S., Kagan, L., Kravitz, S., Lombardot, T. et al. (2008) A standard MIGS/MIMS compliant XML Schema: toward the development of the Genomic Contextual Data Markup Language (GCDML). OMICS 12: 115-121.

Analyzing Metagenomic Data 13
Krause, L., Diaz, N.N., Bartels, D., Edwards, R.A., Puhler, A., Rohwer, F. et al. (2006) Finding novel genes in bacterial communities isolated from the environment. Bioinformatics 22: e281-289.
Leplae, R., Lima-Mendez, G., and Toussaint, A. (2010) ACLAME: a CLAssification of Mobile genetic Elements, update 2010. Nucleic Acids Res 38: D57-61.
Liang, F., Holt, I., Pertea, G., Karamycheva, S., Salzberg, S.L., and Quackenbush, J. (2000) An optimized protocol for analysis of EST sequences. Nucleic Acids Res 28: 3657-3665.
Margulies, M., Egholm, M., Altman, W.E., Attiya, S., Bader, J.S., Bemben, L.A. et al. (2005) Genome sequencing in microfabricated high-density picolitre reactors. Nature 437: 376-380.
McNeil, L.K., Reich, C., Aziz, R.K., Bartels, D., Cohoon, M., Disz, T. et al. (2007) The National Microbial Pathogen Database Resource (NMPDR): a genomics platform based on subsystem annotation. Nucleic Acids Res 35: D347-353.
Meyer, F., Overbeek, R., and Rodriguez, A. (2009) FIGfams: yet another set of protein families. Nucleic Acids Res 37: 6643-6654.
Meyer, F., Paarmann, D., D'Souza, M., Olson, R., Glass, E.M., Kubal, M. et al. (2008) The metagenomics RAST server - a public resource for the automatic phylogenetic and functional analysis of metagenomes. BMC Bioinformatics 9: 386.
Overbeek, R., Begley, T., Butler, R.M., Choudhuri, J.V., Chuang, H.Y., Cohoon, M. et al. (2005) The subsystems approach to genome annotation and its use in the project to annotate 1000 genomes. Nucleic Acids Res 33: 5691-5702.
Pace, N.R. (1997) A molecular view of microbial diversity and the biosphere. Science 276: 734-740.
Pruesse, E., Quast, C., Knittel, K., Fuchs, B.M., Ludwig, W., Peplies, J., and Glockner, F.O. (2007) SILVA: a comprehensive online resource for quality checked and aligned ribosomal RNA sequence data compatible with ARB. Nucleic Acids Res 35: 7188-7196.
Ronaghi, M., Uhlen, M., and Nyren, P. (1998) A sequencing method based on real-time pyrophosphate. Science 281: 363, 365.
Ronaghi, M., Karamohamed, S., Pettersson, B., Uhlen, M., and Nyren, P. (1996) Real-time DNA sequencing using detection of pyrophosphate release. Anal Biochem 242: 84-89.
Rondon, M.R., August, P.R., Bettermann, A.D., Brady, S.F., Grossman, T.H., Liles, M.R. et al. (2000) Cloning the soil metagenome: a strategy for accessing the genetic and functional diversity of uncultured microorganisms. Appl Environ Microbiol 66: 2541-2547.
Schmidt, T.M., DeLong, E.F., and Pace, N.R. (1991) Analysis of a marine picoplankton community by 16S rRNA gene cloning and sequencing. J Bacteriol 173: 4371-4378.
Sogin, M.L., Morrison, H.G., Huber, J.A., Mark Welch, D., Huse, S.M., Neal, P.R. et al. (2006) Microbial diversity in the deep sea and the underexplored "rare biosphere". Proc Natl Acad Sci U S A 103: 12115-12120.
Tyson, G.W., Chapman, J., Hugenholtz, P., Allen, E.E., Ram, R.J., Richardson, P.M. et al. (2004) Community structure and metabolism through reconstruction of microbial genomes from the environment. Nature 428: 37-43.
Venter, J.C., Remington, K., Heidelberg, J.F., Halpern, A.L., Rusch, D., Eisen, J.A. et al. (2004) Environmental genome shotgun sequencing of the Sargasso Sea. Science 304: 66-74.

Dionysios A. Antonopoulos, Elizabeth M. Glass and Folker Meyer 14
Wu, C.H., Nikolskaya, A., Huang, H., Yeh, L.S., Natale, D.A., Vinayaka, C.R. et al. (2004) PIRSF: family classification system at the Protein Information Resource. Nucleic Acids Res 32: D112-114.
CONTRIBUTORS
Dionysios A. Antonopoulos, Ph.D., Assistant Biologist, Institute for Genomics and Systems Biology and Biosciences Division, Argonne National Laboratory, USA. Email: [email protected]
Ransom L. Baldwin, VI, Ph.D., Research Animal Scientist, Bovine Functional Genomics Laboratory, United State Department of Agriculture, Agricultural Research Service, USA. Email: [email protected]
Rolene Bauer, Ph.D., Post Doctoral Researcher, Institute for Microbial Biotechnology and Metagenomics, University of the Western Cape, South Africa. Email: [email protected]
Brian J. Bequette, Ph.D., Associate Professor, Department of Animal and Avian Sciences, University of Maryland, USA. Email: [email protected]
Renaud Berlemont, Ph.D., Research Assistant of Biochemistry, University of Liege, Belgium. Email: [email protected]
Rodrigo Bibiloni, Ph.D., Research Scientist, Nestlé Research Centre. Email: [email protected]
Yi Vee Chew, Ph.D. Candidate, School of Molecular and Microbial Biosciences, University of Sydney, Australia. Email: [email protected]
Chieh J. Chou, Ph.D., Research Scientist, Nestlé Research Center, Switzerland. Email: [email protected].
Erin E. Connor, Ph.D., Research Molecular Biologist, Bovine Functional Genomics Laboratory, United State Department of Agriculture, Agricultural Research Service, USA. Email: [email protected].
Don A. Cowan, Ph.D., Professor of Microbiology, Institute for Microbial Biotechnology and Metagenomics, University of the Western Cape, South Africa. Email: [email protected]
Christelle Desnues, Ph.D., Chargée de Recherche Unité de Recherche sur les Maladies Infectieuses et Tropicales Emergente, France. Email: [email protected]
Dieter Ebert, Ph.D., Full Professor, Fribourg University, Switzerland; Full Professor and head of institute, Basel University, Switzerland. E-mail: [email protected]
Martina M. Ederer, Ph.D., Team Leader, Environmental Biotechnology Institute, University of Idaho, USA. Email: [email protected]
Patricia Finn, M.D., Professor of Medicine, Pulmonary Critical Care Division, University of California San Diego, USA. Email: [email protected]
Moreno Galleni, Ph.D., Professor of Biological Macromolecules, University of Liège Laboratoire de Macromolécules Biologiques, Belgium. Email: [email protected]
Weimin Gao, Ph.D., Assistant Research Scientist, Center for Ecogenomics, Biodesign Institute, Arizona State University, USA. Email: [email protected]
Richard Giannone, Ph.D., Post-doctoral associate, Biosciences Division, Oak Ridge National Laboratory, USA. Email: [email protected]

Robert W. Li 2
Elizabeth M. Glass, Ph.D., Assistant Computational Biologist, Mathematics and Computer Science Division, Argonne National Laboratory, USA. Email: [email protected]
Jian Gu, Ph.D., Research Scientist, Center for Applied Nanobioscience, the Biodesign Institute, Arizona State University, USA. Email: [email protected]
Jin He, Ph.D., Assistant Research Professor Center for Single Molecule Biophysics, the Biodesign Institute, Arizona State University, USA. Email: [email protected]
Robert Hettich, Ph.D., Senior research staff member, Oak Ridge National Laboratory, USA; adjunct faculty member in the Genome Science and Technology, University of Tennessee, USA. Email: [email protected]
Andrew J. Holmes, Ph.D., Professor of Biochemistry, School of Molecular and Microbial Biosciences, University of Sydney, Australia. Email: [email protected]
Ying Huang, Ph.D., Staff Scientist in bioinformatics and computational biology, Department of Medicine, University of California San Diego, USA. Email: [email protected]
Robert J. Huddy, PhD, Post Doctoral Researcher, Institute for Microbial Biotechnology and Metagenomics, University of the Western Cape, South Africa. Email: [email protected]
Martin Keller, Ph.D., Associate laboratory director and director of the Bioenergy Science Center, Biosciences Directorate, Oak Ridge National Laboratory, USA. Email: [email protected]
Lutz Krause, Ph.D., Research Scientist, Nestlé Research Center, Switzerland. Email: [email protected]
Congjun Li, Ph.D., Research Molecular Biologist, Bovine Functional Genomics Laboratory, United State Department of Agriculture, Agricultural Research Service, USA. Email: [email protected]
Robert W. Li, Ph.D., Research Molecular Biologist, Bovine Functional Genomics Laboratory, United State Department of Agriculture, Agricultural Research Service, USA. Email: [email protected]
Weizhong Li, Ph.D., Staff Scientist in bioinformatics, California Institute for Telecommunication and Information Technology, University of California San Diego, USA. Email: [email protected]
Stuard Lindsay, Ph.D., Regents’ Professor, Center for Single Molecule Biophysics, Biodesign Institute, Arizona State University, U.S.A. Email: [email protected]
Volker Mai, Ph.D., Assistant Professor, Department of Microbiology and Cell Science, University of Florida, USA. Email: [email protected]
Hideaki Maki, Ph.D., Environmental Chemist, Marine Environment Section, National Institute for Environmental Studies, Japan. Email: [email protected]
Shigeru Matsuyama, Ph.D., Chemical Ecologist, Graduate School of Life and Environmental Sciences, University of Tsukuba, Japan. Email: [email protected]
Deirdre R. Meldrum, Ph.D., Dean of the Ira A. Fulton Schools of Engineering; Professor of Electrical Engineering; Director of the Center for Ecogenomics at the Biodesign Institute, Director National Institutes of Health Center of Excellence in Genomic Science, the Microscale Life Sciences Center, Ira A. Fulton Schools of Engineering, Arizona State University, USA. Email: [email protected]
Folker Meyer, Ph.D., Scientist, Mathematics and Computer Science Division; Associate Director, Institute for Genomics and Systems Biology, Argonne National Laboratory, USA. Email: [email protected]

Contributors 3
Kentaro Miyazaki, Ph.D., Group leader, National Institute of Advanced Industrial Science and Technology (AIST); Department of Medical Genome Sciences, Graduate School of Frontier Sciences, University of Tokyo, Japan. Email: [email protected]
Moola S. Mutondo, Ph.D., Post Doctoral Researcher, Institute for Microbial Biotechnology and Metagenomics, University of the Western Cape, South Africa. Email: [email protected]
David Perkins, M.D., Ph.D., Professor of Medicine & Surgery, University of California San Diego, USA. Email: [email protected]
Mihai Pop, Ph.D., Assistant Professor, University of Maryland, USA. Email: [email protected]
Weihong Qi, Ph.D., Group leader, Swiss Tropical Institute, Switzerland; Senior Bioinformatician, Functional Genomics Center, Switzerland. E-mail: [email protected]
Forest Rohwer, Ph.D., Professor, San Diego State University, USA. Email: [email protected]
Asaf Salamov, Ph.D., Softberry Inc., USA. Mark Schell, Ph.D., Professor, Department of Microbiology, University of Georgia, USA.
Email: [email protected] Steven G. Schroeder, Ph.D., Research Computational Biologist, Bovine Functional Genomics
Laboratory, United State Department of Agriculture, Agricultural Research Service, USA. Email: [email protected]
Takefumi Shimoyama, Ph.D., Researcher, Research Center for Advanced Science and Technology, University of Tokyo, Japan. Email: [email protected]
Victor Solovyev, Ph.D., Professor, Department of Computer Science, Royal Holloway, University of London, United Kingdom. Email: [email protected]
Tad S. Sonstegard, Ph.D., Research Geneticist, Bovine Functional Genomics Laboratory, United State Department of Agriculture, Agricultural Research Service, USA.
Email: [email protected] Michael E. Sparks, Ph.D., Research Computational Biologist, Bovine Functional Genomics
Laboratory, United State Department of Agriculture, Agricultural Research Service, USA. Email: [email protected]
Hikaru Suenaga, Ph.D., Research Scientist, National Institute of Advanced Industrial Science and Technology, Japan. Emal: [email protected]
I Marla Tuffin, Ph.D., Deputy Director, Institute for Microbial Biotechnology and Metagenomics, University of the Western Cape, South Africa. Email: [email protected]
Hiroo Uchiyama, Ph.D., Environmental Microbiologist, Graduate School of Life and Environmental Sciences, University of Tsukuba, Japan. E-mail: uchiyama@ sakura.cc.tsukuba.ac.jp
Vasuki Venkat, M.D., Nephrologist, University of California San Diego, USA. Email: [email protected]
Kazuya Watanabe, Ph.D., Associate Professor, Research Center for Advanced Science and Technology, University of Tokyo, Japan. Email: [email protected]
Dana Willner, Ph.D. candidate, San Diego State University, USA. Email: [email protected] John C. Wooley, Ph.D., Associate Vice Chancellor for Research, University of California San
Diego; Adjunct Professor in Pharmacology, and in Chemistry and Biochemistry, and
Robert W. Li 4
Strategic Advisor and Senior Fellow of the San Diego Supercomputer Center. University of California San Diego, USA. Email: [email protected]
Kunio Yamane, Ph.D., Molecular Biologist, National Food Research Institute, Japan. E-mail: [email protected]
Peiming Zhang, Ph.D., Associate Professor of Research, Center for Single Molecule Biophysics, the Biodesign Institute, Arizona State University, USA.‘ Email: [email protected]
Weiwen Zhang, Ph.D., Associate Research Professor, Center for Ecogenomics; Affiliate Professor of Microbiology, School of Life Science, Biodesign Institute, Arizona State University, USA. Email: [email protected]