analyzing major league baseball using xmt architecture april 22, 2014 vince gennaro society for...
TRANSCRIPT

Analyzing Major League Baseball Using XMT
Architecture
April 22, 2014Vince Gennaro
Society for American Baseball Research
2
Agenda
• The Changing World of Baseball Information and Data
• Big Data Application– Using XMT architecture to predict the outcome of
the batter-pitcher matchup

3
A New Era of Baseball Analytics
• Proliferation of baseball data
• Revolutionary processing technology
• Massive, inexpensive storage capability

4
Our World Has Changed
Box Score
Play-by-Play
Pitchf/x
Source: MLB.com and Baseball-Reference

5
Our World Has Changed
6
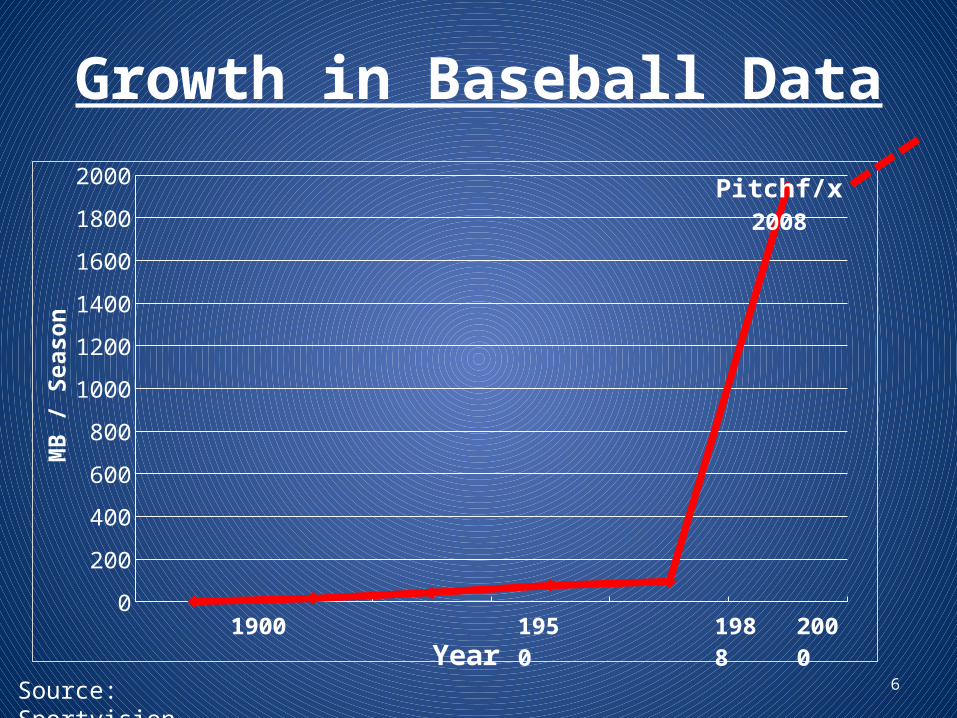
Growth in Baseball Data
0
200
400
600
800
1000
1200
1400
1600
1800
2000
Year
MB
/ Se
ason
Pitchf/x2008
1900 1950 20001988
Source: Sportvision

7
Moneyball—a Breakthrough in 2003

8
The Demand Side
• The stakes have grown dramatically
• $50—$100 million decisions are commonplace
• Winning (Efficiently) Drives Profitability
• Better player personnel decisions promote winning

9
Big Data Era of Baseball Analytics

How Should a Batter-Pitcher Perform?
10

How Should a Batter-Pitcher Perform?
Starting Lineups Batting Order Pinch Hitters Relief Pitchers11

12
The Problem We’re Solving
• The Prevailing Approach—One-Pitcher vs. One-Batter Career Data
– Small sample sizes
– Timeframe is too long (full career)
– No Experience = No Help
– Data includes only outcomes

13
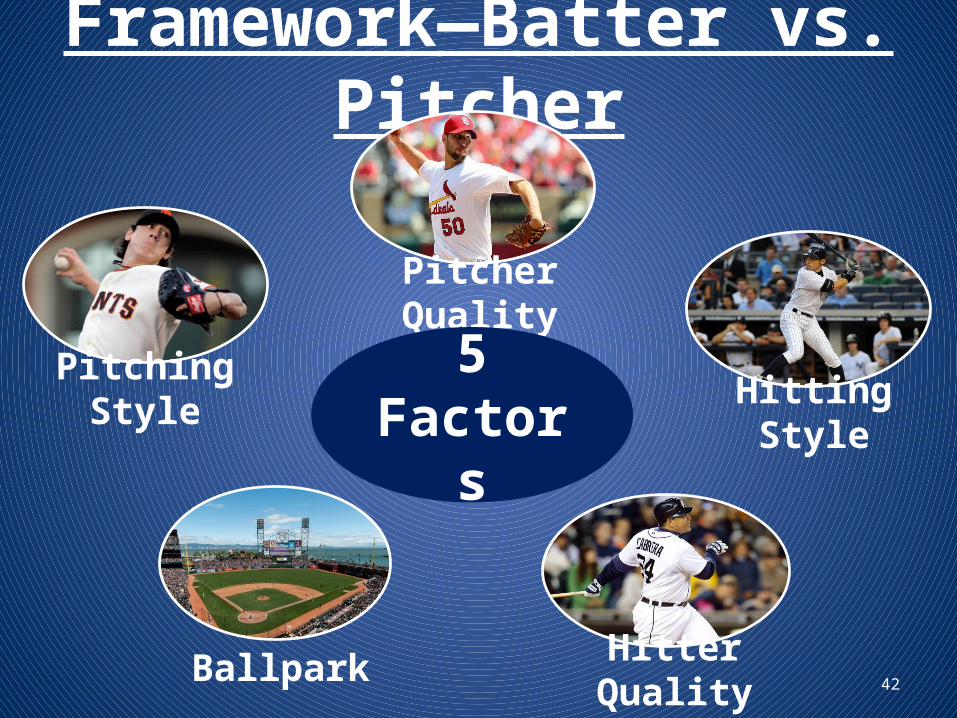
Framework—Batter vs. Pitcher
Pitching Style
Pitcher Quality
Hitting Style
Hitter QualityBallpark
5 Factors

14
New Data + New Technology
• New Data– Pitch f/x– Hit f/x
+• New Technology– Graph Analytics– .
EvaluatingBatter/Pitcher
Match Ups

15
Framework—Batter vs. Pitcher
Pitching Style
Pitcher Quality
Hitting Style
Hitter QualityBallpark
5 Factors

16
Ballpark© Greg Rybarczyk

17
Ballpark© Greg Rybarczyk

18
Ballpark© Greg Rybarczyk

19
Ballpark61% = Single25% = Double14% = Out

20
Ballpark61% = Single25% = Double14% = Out
1.11 Total Bases

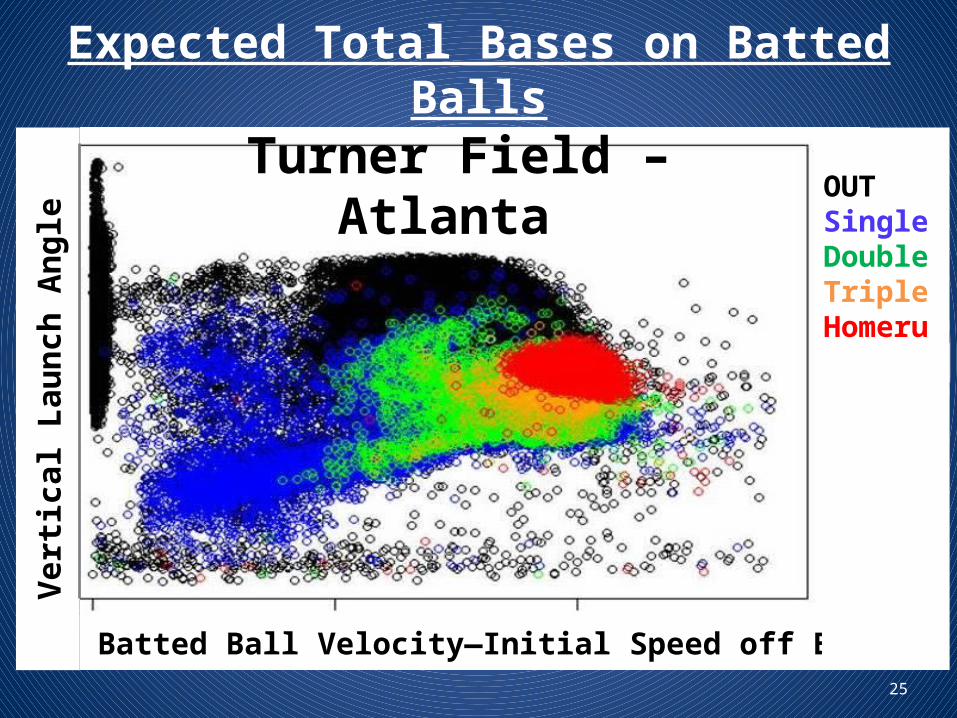
Expected Total Bases on Batted Balls
21
Batted Ball Velocity—Initial Speed off Bat
Verti
cal L
aunc
h An
gle
OUTSingleDoubleTripleHomerun
Turner Field – Atlanta

22
Ballpark© Greg Rybarczyk

23
Ballpark© Greg Rybarczyk

24
Ballpark© Greg Rybarczyk
Expected Total Bases on Batted Balls
25
Batted Ball Velocity—Initial Speed off Bat
Verti
cal L
aunc
h An
gle
OUTSingleDoubleTripleHomerun
Turner Field – Atlanta
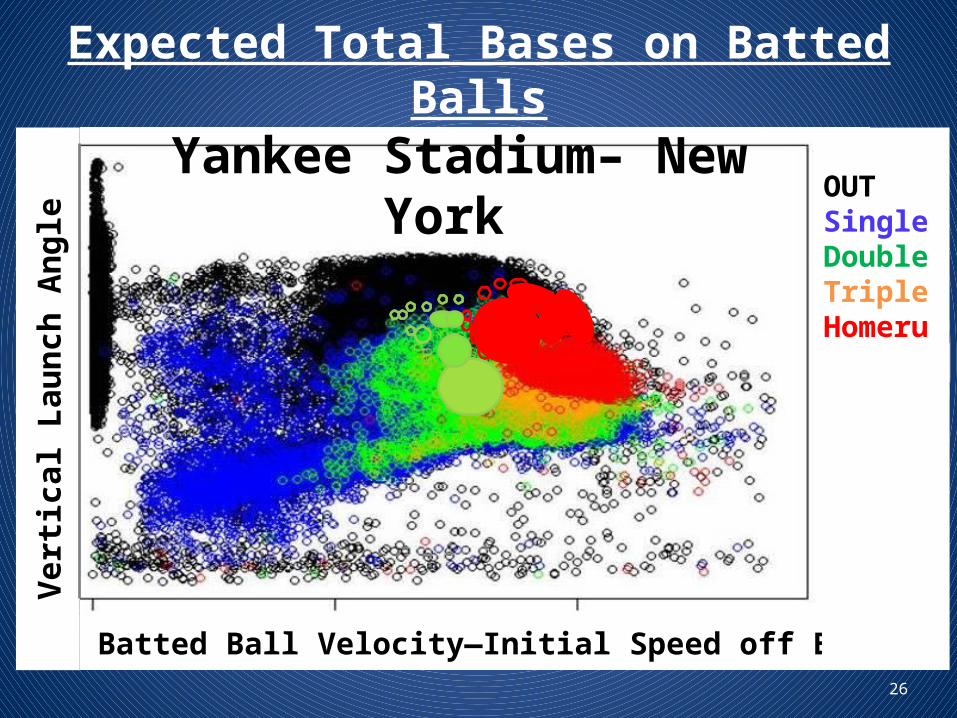
Expected Total Bases on Batted Balls
26
Batted Ball Velocity—Initial Speed off Bat
Verti
cal L
aunc
h An
gle
OUTSingleDoubleTripleHomerun
Yankee Stadium– New York

27
Framework—Batter vs. Pitcher
Pitching Style
Pitcher Quality
Hitting Style
Hitter QualityBallpark
5 Factors

28
Clustering Pitchers
Objective:• Identify pitcher similarities to form clusters of
“like” pitchers
• Predict hitter performance by pitcher cluster vs. individual batter/pitcher matchups

29
Clustering Pitchers Hitters’ Questions Model Data
What does he throw? • Top 2 Pitches• Pitch Repertoire/Variety• Horizontal Pitch Location• Vertical Pitch Location
How hard does he throw? • Fastball Velocity
What kind of movement? • Horizontal Movement• Vertical Movement
Where do his pitches come from? • Release Point
How does he like to pitch? • Swinging Strike %• Zone % and Edge %• Top 2-pitch Sequence

30
RH Pitcher vs. LH Batter Clusters

31
RH Pitcher vs. LH Batter Clusters

32
Yankees RF vs. Colorado Rockies?
Facing Right-Handed Pitcher Juan Nicasio
Ichiro Suzuki Brennan Boesch

33
Yankees RF vs. Colorado Rockies?
Facing Right-Handed Pitcher Juan Nicasio
Ichiro Suzuki Brennan Boesch
Both are 0-0 vs. Nicasio

34
Yankees Hitters—Rockies Pitchers
Jorge De La Rosa
Juan Nicasio
Jeff Francis
Tyler Chatwood
Ichiro Suzuki 3-6 4-6 1-3
Brennan Boesch 1-9 2-3

35
RHP vs. LHB Clusters

36
RHP vs. LHB Cluster “4”High Velocity FB
Low Pitch VarietyUpper Half of Zone

37
RHP vs. LHB Cluster “4”
Ichiro Suzuki
0 - 65 - 26
2 - 5
2 - 111 - 3
2 - 3
0 - 6

38
RHP vs. LHB Cluster “4”
Ichiro Suzuki—30th %
0 - 65 - 26
2 - 5
2 - 111 - 3
2 - 3
0 - 6

39
RHP vs. LHB Cluster “4”
Brennan Boesch
6 -11
1 - 66 -23
0 - 11
3-132 - 3
2-7

40
RHP vs. LHB Cluster “4”
Brennan Boesch—60th %
6 -11
1 - 66 -23
0 - 11
3-132 - 3
2-7

41
Yankees Hitters—Rockies Pitchers
Jorge De La Rosa
Juan Nicasio
Jeff Francis
Tyler Chatwood
Ichiro Suzuki 33 30 78 70
Brennan Boesch 53 60 73 72
42
Framework—Batter vs. Pitcher
Pitching Style
Pitcher Quality
Hitting Style
Hitter QualityBallpark
5 Factors

43
Hitting Style

44
Batter—Pitcher Match up Data Issues
Issue Old Process New ProcessToo Literal One-on-one Multiple “like”
pitchers
Sample Sizes Often too small More adequate
No prior experience
No data Data vs. other pitchers in cluster
Timeframe Could span 15+ yrs
Limited to more recent PAs
Performance metric
Outcomes (hit, out, etc.)
Includes batted ball diagnostics

45
The ROI of Favorable Match Ups
Use of Information/ Decisions Impacted
Runs Created or Saved
Optimizing Starting Lineup
19 Runs
Most Favorable Pinch-Hitting Match Ups
9 Runs
Most Favorable Relief Pitcher Match Ups
5 Runs
33 Runs
* For a “contending” team

46
The ROI of Favorable Match Ups
Use of Information/ Decisions Impacted
Runs Created or Saved
Optimizing Starting Lineup
19 Runs
Most Favorable Pinch-Hitting Match Ups
9 Runs
Most Favorable Relief Pitcher Match Ups
5 Runs
33 Runs
33 Runs = 3 wins
$ value of a win $5 million*
Potential Value$15 million in Revenue
* For a “contending” team

47
Framework—Batter vs. Pitcher
Pitching Style
Pitcher Quality
Hitting Style
Hitter QualityBallpark
5 Factors

48
Framework—Batter vs. Pitcher
• Refining a predictive model of batter/pitcher outcomes—optimal combination of 5 factors
• Validating model against actual outcomes
• Compare predictive accuracy to historical “one-to-one” expectations
• Continue to fine-tune model, incorporating new data daily

49
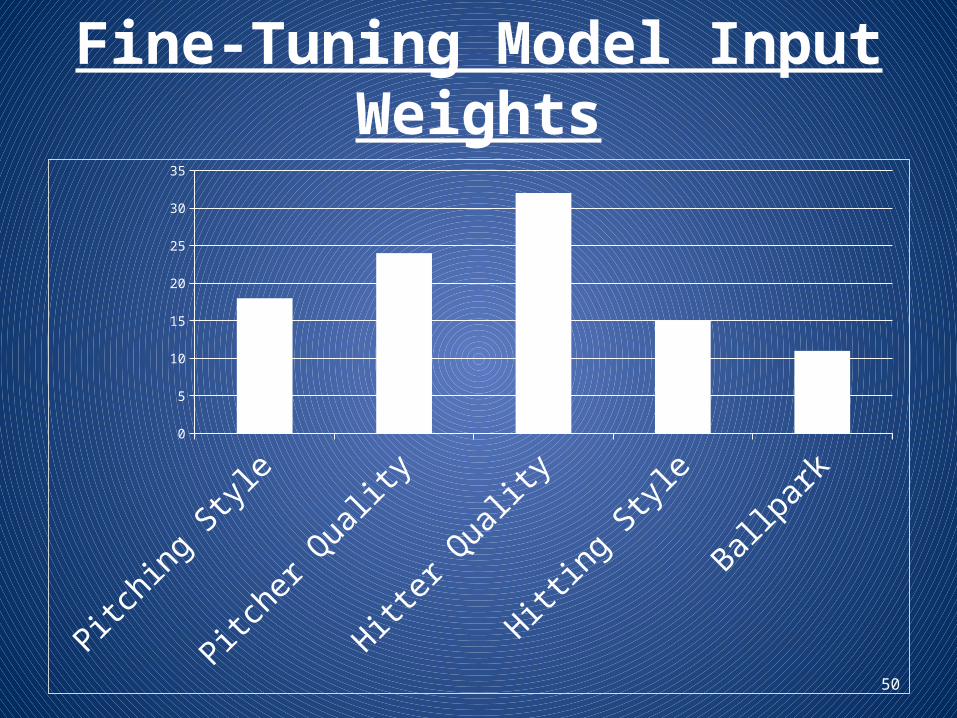
Fine-Tuning Model Input Weights
Pitching S
tyle
Pitcher Q
uality
Hitter Quali
ty
Hitting S
tyle
Ballpark
0
5
10
15
20
25
30
35
50
Fine-Tuning Model Input Weights
Pitching S
tyle
Pitcher Q
uality
Hitter Quali
ty
Hitting S
tyle
Ballpark
0
5
10
15
20
25
30
35

51
END